2021 Q2 RESIDENTIAL MARKET SURVEY
2
2021 Q2 RESIDENTIAL MARKET SURVEY HOUSING BUILT SINCE 2000 Property Address Property Name Year Built Occupancy AVG Asking Rent ($/SF) Total Units Studios 1 BR 2 BR 3 BR 4 BR 250-300 W Ocean Blvd Camden Harbor View 2003 99.0 $2.93 546 0 205 341 0 0 404 Pine Ave Griffis Pine Avenue 2004 97.5 $3.08 221 15 124 82 0 0 745 W 3rd St Puerto Del Sol (Affordable Housing) 2007 99.5 $0.78 64 0 0 37 16 11 225 Long Beach Blvd 210 Third 2008 99.5 $2.84 104 0 88 16 0 0 421 W Broadway IMT Gallery 421 2010 96.6 $2.77 291 0 164 127 0 0 431 E 6th St Bella Mare 6th Street Lofts 2015 80.0 $2.83 30 9 15 6 0 0 137 W 6th St Tech Coast Lofts 2016 96.7 - 11 0 1 9 0 0 707 E Ocean Blvd The Current 2016 96.4 $3.34 223 30 149 44 0 0 100 Long Beach Blvd The Edison 2016 94.7 $3.19 156 48 56 52 0 0 475 W 5th St Beachwood Apartments (Affordable Housing) 2018 96.0 $2.99 45 0 33 12 0 0 442 W Ocean Blvd 442 Residences 2019 95.8 $3.51 95 47 18 30 0 0 434 E 4th St The Linden 2019 96.1 $3.10 49 0 28 21 0 0 245 W Broadway AMLI Park Broadway 2019 94.7 $3.57 222 29 143 50 0 0 207 Seaside Way The Crest 2019 95.8 $3.57 115 56 33 26 0 0 150 W Ocean Blvd The Oceanaire 2019 79.5 $3.06 216 34 94 80 8 0 101 Alamitos The Alamitos 2020 79.8 $3.40 136 - - - - - 230 W 3rd St The Pacific 2020 86.9 $3.15 181 34 80 67 - - 495 The Promenade N 5N at The Streets 2020 88.1* - 20 - - - - - 635 Pine Ave Volta on Pine 2021 19% $3.35 271 93 94 66 18 0 Number of Avg Age Avg Rent /Unit Avg $/SF Occupancy CLASS A 6 $2,713 $3.18 83.2% CLASS B 59 $2,308 $2.70 98.5% CLASS C 85 $1,258 $2.11 96.3% Overall 49 $2,093 $2.66 92.7% Average $/SF Occupancy $2 $3 $3.25 $2.25 $2.50 $2.75 $1.75 95% 100% 90% 85% 70% 80% 75% OCCUPANCY VS AVG RENT/SF: ALL DOWNTOWN RESIDENTIAL PROPERTIES Source: CoStar 2021 B C A *pre-leasing For a full map of Downtown Projects please follow this link to the City of Long Beach Development Map
Transcript of 2021 Q2 RESIDENTIAL MARKET SURVEY
2021 Q2 RESIDENTIAL MARKET SURVEY
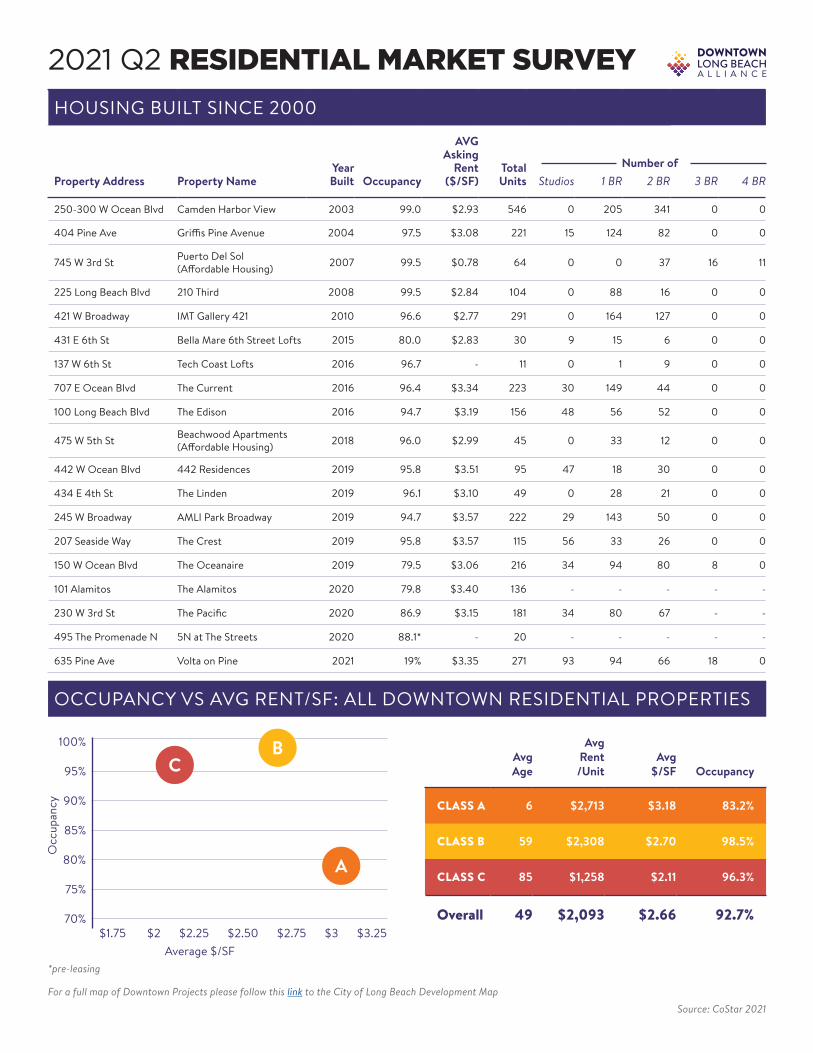
HOUSING BUILT SINCE 2000
Property Address Property NameYear Built Occupancy
AVGAsking
Rent ($/SF)
Total Units Studios 1 BR 2 BR 3 BR 4 BR
250-300 W Ocean Blvd Camden Harbor View 2003 99.0 $2.93 546 0 205 341 0 0
404 Pine Ave Griffis Pine Avenue 2004 97.5 $3.08 221 15 124 82 0 0
745 W 3rd St Puerto Del Sol (Affordable Housing) 2007 99.5 $0.78 64 0 0 37 16 11
225 Long Beach Blvd 210 Third 2008 99.5 $2.84 104 0 88 16 0 0
421 W Broadway IMT Gallery 421 2010 96.6 $2.77 291 0 164 127 0 0
431 E 6th St Bella Mare 6th Street Lofts 2015 80.0 $2.83 30 9 15 6 0 0
137 W 6th St Tech Coast Lofts 2016 96.7 - 11 0 1 9 0 0
707 E Ocean Blvd The Current 2016 96.4 $3.34 223 30 149 44 0 0
100 Long Beach Blvd The Edison 2016 94.7 $3.19 156 48 56 52 0 0
475 W 5th St Beachwood Apartments (Affordable Housing) 2018 96.0 $2.99 45 0 33 12 0 0
442 W Ocean Blvd 442 Residences 2019 95.8 $3.51 95 47 18 30 0 0
434 E 4th St The Linden 2019 96.1 $3.10 49 0 28 21 0 0
245 W Broadway AMLI Park Broadway 2019 94.7 $3.57 222 29 143 50 0 0
207 Seaside Way The Crest 2019 95.8 $3.57 115 56 33 26 0 0
150 W Ocean Blvd The Oceanaire 2019 79.5 $3.06 216 34 94 80 8 0
101 Alamitos The Alamitos 2020 79.8 $3.40 136 - - - - -
230 W 3rd St The Pacific 2020 86.9 $3.15 181 34 80 67 - -
495 The Promenade N 5N at The Streets 2020 88.1* - 20 - - - - -
635 Pine Ave Volta on Pine 2021 19% $3.35 271 93 94 66 18 0
Number of
AvgAge
AvgRent/Unit
Avg$/SF Occupancy
CLASS A 6 $2,713 $3.18 83.2%
CLASS B 59 $2,308 $2.70 98.5%
CLASS C 85 $1,258 $2.11 96.3%
Overall 49 $2,093 $2.66 92.7%
Average $/SF
Occ
upan
cy
$2 $3 $3.25$2.25 $2.50 $2.75$1.75
95%
100%
90%
85%
70%
80%
75%
OCCUPANCY VS AVG RENT/SF: ALL DOWNTOWN RESIDENTIAL PROPERTIES
Source: CoStar 2021
BC
A
*pre-leasing
For a full map of Downtown Projects please follow this link to the City of Long Beach Development Map

2021 Q2 RESIDENTIAL LISTINGS
SOFI AT 3RD - 225 W 3RD ST CUSHMAN & WAKEFIELD
- Located in bustling Downtown Core
- 160 Total Units averaging 700 SF at $2.95/SF
- Onsite fitness center and corporate suites
- Rooftop pool and patio
VOLTA ON PINE - 635 PINE AVE COLDWELL BANKER COMMERCIAL
- Newest completed multi family project in DTLB
- 271 Units averaging 857 SF at $3.25/SF
- Car Charging Station, Fitness Center, and
Roof Terrace
- Located in quiet North Pine neighborhood