2021 First Quarter Business Review - US Ecology
26
2021 First Quarter Business Review April 30, 2021
Transcript of 2021 First Quarter Business Review - US Ecology

2021
First Quarter
Business ReviewApril 30, 2021

2
Today’s Hosts
• Jeff Feeler
Chairman, President & Chief Executive Officer
• Eric Gerratt
Executive Vice President & Chief Financial Officer
• Simon Bell
Executive Vice President & Chief Operating Officer
• Steve Welling
Executive Vice President, Sales and Marketing

3
Safe Harbor and Non-GAAP Financial Measures
Forward looking statementsThese slides (and the accompanying oral discussion) contain “forward-looking statements” within the meaning of the federal securities laws. Statements that are not historicalfacts, including statements about the beliefs and expectations of US Ecology, Inc. (the “Company,” “US Ecology,” “we” or “us), are forward looking statements. Forward lookingstatements include statements preceded by, followed by or that include the words “may,” “could,” “would,” “should,” “believe,” “expect,” “anticipate,” “plan,” “estimate,”“target,” “project,” “intend” and similar expressions. These statements include, among others, statements regarding our financial and operating results, strategic objectives andmeans to achieve those objectives, the amount and timing of capital expenditures, repurchases of its stock under approved stock repurchase plans, the amount and timing ofinterest expense, the likelihood of our success in expanding our business, financing plans, budgets, working capital needs and sources of liquidity.
Forward looking statements are only predictions and are not guarantees of performance. These statements are based on management’s beliefs and assumptions, which in turnare based on currently available information. Important assumptions include, among others, those regarding demand for the Company’s services, expansion of service offeringsgeographically or through new or expanded service lines, the timing and cost of planned capital expenditures, competitive conditions and general economic conditions. Theseassumptions could prove inaccurate. Forward looking statements also involve known and unknown risks and uncertainties, which could cause actual results to differ materiallyfrom those contained in any forward-looking statement. Many of these factors are beyond our ability to control or predict. Such factors may include developments related to theCOVID-19 pandemic, including, but not limited to, the duration and severity of additional measures taken by government authorities and the private sector to limit the spread ofCOVID-19, the integration of the operations of NRC Group Holdings Corp. (“NRC”), the loss or failure to renew significant contracts, competition in our markets, adverse economicconditions, our compliance with applicable laws and regulations, potential liability in connection with providing oil spill response services and waste disposal services, the effect ofexisting or future laws and regulations related to greenhouse gases and climate change, the effect of our failure to comply with U.S. or foreign anti-bribery laws, the effect ofcompliance with laws and regulations, an accident at one of our facilities, incidents arising out of the handling of dangerous substances, our failure to maintain an acceptablesafety record, our ability to perform under required contracts, limitations on our available cash flow as a result of our indebtedness, liabilities arising from our participation in multi-employer pension plans, the effect of changes in the method of determining the London Interbank Offered Rate (“LIBOR”) or the replacement thereto, risks associated with ourinternational operations, the impact of changes to U.S. tariff and import and export regulations, fluctuations in commodity markets related to our business, a change in NRC’sclassification as an Oil Spill Removal Organization, cyber security threats, unanticipated changes in tax rules and regulations, the loss of key personnel, a deterioration in our laborrelations or labor disputes, our reliance on third-party contractors to provide emergency response services, our access to insurance, surety bonds and other financial assurances,our litigation risk not covered by insurance, the replacement of non-recurring event projects, our ability to permit and contract for timely construction of new or expanded disposalspace, renewals of our operating permits or lease agreements with regulatory bodies, our access to cost-effective transportation services, lawsuits, our implementation of newtechnologies, fluctuations in foreign currency markets and foreign affairs, our integration of acquired businesses, our ability to pay dividends or repurchase stock, anti-takeoverregulations, stock market volatility, the failure of the warrants to be in the money or their expiration worthless and risks related to our compliance with maritime regulations(including the Jones Act).
Except as required by applicable law, including the securities laws of the United States and the rules and regulations of the Securities and Exchange Commission (the “SEC”), weare under no obligation to publicly update or revise any forward-looking statements, whether as a result of new information, future events or otherwise. You should not placeundue reliance on our forward-looking statements. Although we believe that the expectations reflected in forward looking statements are reasonable, we cannot guaranteefuture results or performance. .

4
Today’s Agenda
Highlights
Financial Review
2021 Business Outlook
Questions & Comments
Appendix: Financial Results & Reconciliations

5
Q1-21 Highlights
Results slightly ahead of expectations, despite continued challenges
Revenue decreased 5% compare to a strong pre-pandemic Q1-20
Field Services (“FS”) led the way with 4% revenue growth– Driven by emergency response, small quantity generation and total waste management
service lines– COVID-19 decontamination projects generated $12.5 million of revenue on ~2700 events
Waste Solutions (“WS”) segment revenue contracted 5% – Base Business down 3% from Q1-20; down 1% sequentially from Q4-20
▪ Improving monthly trends with March 2021 returning to year-over-year growth– Event Business down 9% from Q1-20; up 2% sequentially from Q4-20
▪ Positive trends heading into the summer construction season
Energy Waste (“EW”) segment return to positive EBITDA contribution on increased rig
count and other business activity
Total Company adjusted EBITDA was $33.2 million
Strong free cash flow generation of $13.7 million
1See definition and reconciliation of non-GAAP measures in slides 17-26

6
Environment, Social and Governance (“ESG”) Progress
Governance: – Continued increase in Board diversity
Environmental:– Green house gas impact assessment substantially complete
▪ As expected, initial findings show low carbon footprint as our landfills have minimal greenhouse gas emissions as compared to solid waste landfills
– Advancing capital investments in beneficial reuse technology
Social:– Investing in our people with industry-leading total rewards programs
– Introducing new recruiting and retention tools
– Training and mentoring programs promote our focus on diversity
– Everything we do is centered around our culture of inclusion and respect

Financial Review

8
Q1-21 Financial Review TOTAL COMPANY
$228.6M-5% vs. prior year
Revenue• Waste Solutions (“WS”) down 5% to $104.1m• Field Services (“FS”) up 4% to $118.2m• Energy Waste (“EW”) down 64% to $6.2m
23.1%vs. 25.9% prior year
Gross Margin• WS Treatment and Disposal (“T&D”) margin 37% in Q1-21 compared
with 42% in Q1-20• FS gross margin of 15% in Q1-21 compared with 16% in Q1-20
$51.4Mvs. $52.4m prior year SG&A
• Total business development & integration expenses of $1.2m in Q1-21 compared with $2.9m in Q1-20
• Total SG&A as a percent of revenue was 22% for both the first quarter of 2021 and the first quarter of 2020
$(0.07)vs. $0.12 prior year
Adj. EPS(1)• Intangible asset amortization of approximately $0.21 per share in Q1-21
and Q1-20• Cash EPS of $0.14 in Q1-21 compared with $0.33 in Q1-20
$33.2Mvs. $43.2m prior year
Adj. EBITDA(1)• WS segment contributed $40.1m in Q1-21 vs. $42.9m in Q1-20• FS segment contributed $17.1m in Q1-21 vs. $17.5m in Q1-20• EW segment contributed $1.3m in Q1-21 vs. $5.2m in Q1-20
1See definition and reconciliation of
non-GAAP measures in slides 17-26
9
US Ecology’s Capital Structure and Liquidity are Strong
Strong capital structure
• Cash balance of $82.4 million as of March 31, 2021
• Available capacity on Revolving Credit Facility (“RCF”) of $142.9 million
• Term Loan B of $444.4 million matures in 2026; amortizing 1% per year
• Average cash interest rate of approximately 3%
• Bank covenant total leverage of 4.5x on TTM EBITDA
Solid cash flow
generation
• Operating cash flow of $19.5 million in Q1-21
• Working capital (excl. cash) of $120.2 million as of March 31, 2021 vs. $119.4
million as of December 31, 2020
• Adjusted Free Cash Flow(1) of $13.7 million in Q1-21
Capital allocation• Capital expenditures of $9.6 million in Q1-21
1See definition and reconciliation of non-GAAP measures in slides 17-26

10
2021 Business Outlook Reaffirmed
Revenue expected to range between $940 million to $990 million
Adjusted EBITDA(1) expected to range from $175 million to $185 million
Adjusted Free Cash Flow (1) expected to range from $60 million to $77 million
Adjusted earnings per diluted share(1) expected to range from $0.65 to $0.88 per
share
Cash earnings per diluted share(1) to range from $1.46 to $1.69
Capital expenditures expected to range from $85 to $90 million
1See definition and reconciliation of non-GAAP measures in slides 17-26
Questions and Comments

Appendix

13
Q1-21 Financial ReviewFinancial Position & Cash Flow Metrics
(in t housands) March 31, 2021 December 31, 2020
Assets
Current Assets:
Cash and cash equivalents 82,354$ 73,848$
Other current assets 285,569 288,636
Total current assets 367,923 362,484
Long-term assets 1,455,229 1,468,799
Total assets 1,823,152$ 1,831,283$
Liabilities and Stockholders’ Equity
Current Liabilit ies:
Short-term borrowings and current port ion of long-
term debt 3,635 3,359
Other current liabilit ies 161,725 165,858
Total current liabilities 165,360 169,217
Long-term debt 781,644 782,484
Other long-term liabilit ies 263,445 277,651
Total liabilities 1,210,449 1,229,352
Stockholders’ Equity 612,703 601,931
Total liabilities and stockholders' equity 1,823,152$ 1,831,283$
Working Capital 202,563$ 193,267$
Working Capital (excl. Cash) 120,209$ 119,419$
Selected Cash Flow Items: 2021 2020
Net cash provided by operating activit ies 19,463$ 29,346$
Adjusted free cash flow 1
13,688$ 15,915$
Three Months Ended March 31,
1See definition and reconciliation of
non-GAAP measures in slides 17-26

14
Debt Covenant Compliance
Our Credit Agreement has two financial covenants:
– Consolidated Total Net Leverage Ratio1
– Consolidated Interest Coverage Ratio2
Proactively amended the net leverage ratio effective June 26, 2020 as follows:
No modification of the consolidated interest coverage ratio as a result of the second
quarter amendment. Currently in compliance with substantial cushion as of March
31, 2021.
1Defined as the ratio of Consolidated Net Funded Indebtedness (Debt plus Capital Leases less Unrestricted Cash) to Consolidated Trailing Twelve-Month EBITDA2Defined as the ratio of Consolidated Trailing Twelve Month EBITDA to Consolidated Trailing Twelve-Month Interest Expense
(X.XX to 1:00) Q2 '20 Q3 '20 Q4 '20 Q1 '21 Q2 '21 Q3 '21 Q4 '21
Q1 '22
and Thereafter
Permitted 5.00 5.25 5.25 5.50 5.00 4.75 4.50 4.00
Actual 3.83 4.03 4.26 4.54
15
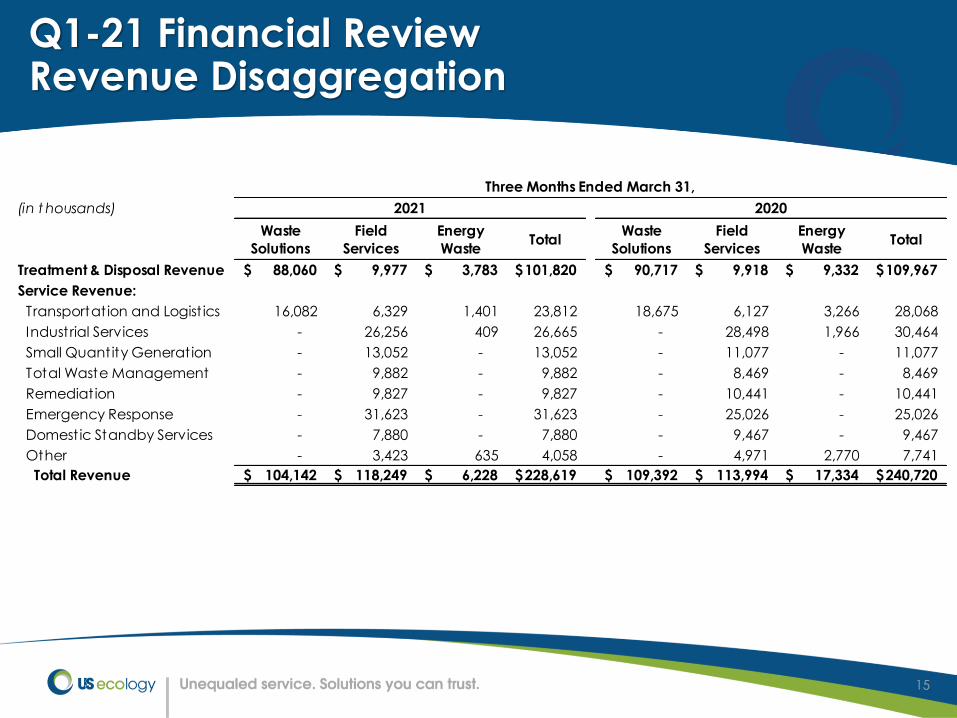
Q1-21 Financial Review Revenue Disaggregation
(in t housands)
Waste
Solutions
Field
Services
Energy
WasteTotal
Waste
Solutions
Field
Services
Energy
WasteTotal
Treatment & Disposal Revenue 88,060$ 9,977$ 3,783$ 101,820$ 90,717$ 9,918$ 9,332$ 109,967$
Service Revenue:
Transportat ion and Logist ics 16,082 6,329 1,401 23,812 18,675 6,127 3,266 28,068
Industrial Services - 26,256 409 26,665 - 28,498 1,966 30,464
Small Quantity Generation - 13,052 - 13,052 - 11,077 - 11,077
Total Waste Management - 9,882 - 9,882 - 8,469 - 8,469
Remediation - 9,827 - 9,827 - 10,441 - 10,441
Emergency Response - 31,623 - 31,623 - 25,026 - 25,026
Domest ic Standby Services - 7,880 - 7,880 - 9,467 - 9,467
Other - 3,423 635 4,058 - 4,971 2,770 7,741
Total Revenue 104,142$ 118,249$ 6,228$ 228,619$ 109,392$ 113,994$ 17,334$ 240,720$
Three Months Ended March 31,
2021 2020

16
Q1-21 Financial Review Waste Solutions - T&D Revenue by Industry
Percent Change
Q1 '21 Q1 '20 Q1 '21 vs. Q1 '20 "Base" "Event"
Chemical Manufacturing 19% 20% -12% 0% -24%
Metal Manufacturing 18% 16% 5% -6% 63%
Broker / TSDF 12% 13% -11% -11% n/m
General Manufacturing 11% 12% -12% -8% -60%
Government 7% 7% -4% -18% 2%
Refining 6% 6% -11% -7% -90%
Utilities 4% 3% 34% -21% 133%
Waste Management & Remediation 4% 3% 24% 51% 7%
Transportation 3% 6% -53% -16% -93%
Mining and E&P 3% 2% 79% 79% n/m
Other 13% 12% 7% 6% 23%
Percent of Total
% Change - Q1 '21
vs. Q1 '20

17
Non-GAAP Financial Measures
US Ecology reports adjusted EBITDA, adjusted earnings per diluted share, cash earnings per dilutedshare and adjusted free cash flow results, which are non-GAAP financial measures, as acomplement to results provided in accordance with generally accepted accounting principles inthe United States (“GAAP”) and believes that such information provides analysts, stockholders,and other users information to better understand the Company’s operating performance.Because adjusted EBITDA, adjusted earnings per diluted share, cash earnings per diluted shareand adjusted free cash flow are not measurements determined in accordance with GAAP andare thus susceptible to varying calculations they may not be comparable to similar measures usedby other companies. Items excluded from adjusted EBITDA, adjusted earnings per diluted share,cash earnings per diluted share and adjusted free cash flow are significant components inunderstanding and assessing financial performance.
Adjusted EBITDA, adjusted earnings per diluted share, cash earnings per diluted share andadjusted free cash flow should not be considered in isolation or as an alternative to, or substitutefor, net income, cash flows generated by operations, investing or financing activities, or otherfinancial statement data presented in the consolidated financial statements as indicators offinancial performance or liquidity. Adjusted EBITDA, adjusted earnings per diluted share, cashearnings per diluted share and adjusted free cash flow have limitations as analytical tools andshould not be considered in isolation or a substitute for analyzing our results as reported underGAAP.

18
Non-GAAP Financial Measures - Definitions
Adjusted Earnings Loss Per Diluted Share
The Company defines adjusted loss per diluted share as net loss adjusted for the after-tax impact of the gain on a minorityinterest investment, the after-tax impact of business development and integration costs, the after-tax impact of non-cashgoodwill impairment charges, and non-cash foreign currency translation gains or losses, divided by the number of dilutedshares used in the loss per diluted share calculation.
The gain on a minority interest investment excluded from the loss per diluted share calculation represents an increase in thefair value of our investment based on a recent observable transaction in the equity of the entity. Impairment chargesexcluded from the loss per diluted share calculation are related to the Company’s assessment of goodwill associated with itsEnergy Waste and international businesses in the first quarter of 2020. Business development and integration costs excludedfrom the loss per diluted share calculation relate to expenses incurred to evaluate businesses for potential acquisition or costsrelated to closing and integrating successfully acquired businesses and transaction expenses. The foreign currency translationgains or losses excluded from the loss per diluted share calculation are related to intercompany loans between ourCanadian subsidiaries and the U.S. parent which have been established as part of our tax and treasury managementstrategy. These intercompany loans are payable in Canadian dollars (“CAD”) requiring us to revalue the outstanding loanbalance through our consolidated income statement based on the CAD/United States currency movements from period toperiod.
We believe excluding the gain on minority interest investment, business development and integration costs, non-cashimpairment charges, and non-cash foreign currency translation gains or losses provides meaningful information to investorsregarding the operational and financial performance of the Company.

19
Non-GAAP Financial Measures – DefinitionsContinued
Cash Earnings Per Diluted Share
The Company defines cash earnings per diluted share as adjusted earnings per diluted share (see definition above) plus
amortization of intangible assets, net of tax.
Adjusted EBITDA
The Company defines adjusted EBITDA as net income before interest expense, interest income, income tax
expense/benefit, depreciation, amortization, share-based compensation, accretion of closure and post-closure
liabilities, foreign currency gain/loss, non-cash impairment charges, business development and integration expenses
and other income/expense.
Adjusted Free Cash Flow
The Company defines adjusted free cash flow as net cash provided by operating activities less purchases of property
plant and equipment, plus business development and integration expenses, plus payments of deferred/contingent
purchase consideration, plus purchases of property and equipment for the Grand View, Idaho facility rebuild, plus
proceeds from sale of property and equipment.

20
Consolidated Financial Results: Q1-21 vs. Q1-20
1Includes $1,220 and $2,907 of business development and integration expenses for the three months ended March 31, 2021 and 2020, respectively.
(in t housands, except per share dat a) 2021 2020 $ Change % Change
Revenue $ 228,619 $ 240,720 $ (12,101) -5.0%
Gross profit 52,873 62,441 (9,568) -15.3%
SG&A1
51,368 52,377 (1,009) -1.9%
Goodwill impairment charges - 300,300 (300,300) n/m
Operating income (loss)1 1,505 (290,236) 291,741 -100.5%
Interest expense, net (7,084) (9,221) 2,137 -23.2%
Foreign currency (loss) gain (371) 937 (1,308) -139.6%
Other income 3,710 171 3,539 2069.6%
Loss before income taxes (2,240) (298,349) 296,109 -99.2%
Income tax benefit (1,444) (263) (1,181) 449.0%
Net loss $ (796) $ (298,086) $ 297,290 -99.7%
Loss per share:
Basic $ (0.03) $ (9.52) $ 9.49 -99.7%
Diluted $ (0.03) $ (9.52) $ 9.49 -99.7%
Shares used in loss per share calculation:
Basic 31,104 31,305
Diluted 31,104 31,305
Three Months Ended March 31,

21
Consolidated Financial Results: Q1-21 vs. Q1-20
(in t housands) 2021 2020 $ Change % Change
Adjusted EBITDA Reconciliation
Net loss (796)$ (298,086)$
Income tax benefit (1,444) (263)
Interest expense, net 7,084 9,221
Foreign currency loss (gain) 371 (937)
Other income (3,710) (171)
Goodwill impairment charges - 300,300
Depreciat ion and amort izat ion of plant and equipment 18,234 17,978
Amort izat ion of intangible assets 9,135 9,441
Share-based compensation 1,928 1,564
Accret ion and non-cash adjustments of closure & post-
closure obligations 1,182 1,266
Business development and integration expenses 1,220 2,907
Adjusted EBITDA 33,204$ 43,220$ (10,016)$ -23.2%
Adjusted EBITDA by Operating Segment:
Waste Solut ions 40,136$ 42,922$ (2,786) -6.5%
Field Services 17,137 17,465 (328) -1.9%
Energy Waste 1,258 5,205 (3,947) -75.8%
Corporate (25,327) (22,372) (2,955) 13.2%
Total 33,204$ 43,220$ (10,016)$ -23.2%
Three Months Ended March 31,

22
Consolidated Financial Results: Q1-21 vs. Q1-20
(in t housands, except per share dat a)
Adjusted Earnings Per Share Reconciliation
(Loss) income
before income
taxes
Income
tax
benefit
(expense)
Net (loss)
income
per
share
(Loss) income
before income
taxes
Income
tax
benefit
(expense)
Net (loss)
income
per
share
As reported (2,240)$ 1,444$ (796)$ (0.03)$ (298,349)$ 263$ (298,086)$ (9.52)$
Adjustments:
Less: Gain on minority interest investment (3,509) 965 (2,544) (0.08) - - - -
Plus: Business development and integration
expenses 1,220 (335) 885 0.03 2,907 (799) 2,108 0.07
Plus: Goodwill impairment charges - - - - 300,300 - 300,300 9.59
Foreign currency loss (gain) 371 (102) 269 0.01 (937) 258 (679) (0.02)
As adjusted (4,158)$ 1,972$ (2,186)$ $ (0.07) 3,921$ (278)$ 3,643$ $ 0.12
Plus: Amort izat ion of intangible assets 9,135 (2,512) 6,623 0.21 9,441 (2,600) 6,841 0.21
Cash earnings per diluted share 4,977$ (540)$ 4,437$ $ 0.14 13,362$ (2,878)$ 10,484$ $ 0.33
Shares used in (loss) earnings per diluted share
calculat ion 31,104 31,305
Three Months Ended March 31,
2021 2020

23
Consolidated Financial Results: Q1-21 vs. Q1-20
(in t housands) 2021 2020
Adjusted Free Cash Flow Reconciliation
Net cash provided by operating activities 19,463$ 29,346$
Less: Purchases of property and equipment (9,614) (19,131)
Plus: Business development and integration expenses, net of tax 885 2,108
Plus: Purchases of property and equipment for the Idaho facility rebuild 1,331 1,811
Plus: Payment of deferred/contingent purchase consideration - 1,000
Plus: Proceeds from sale of property and equipment 1,623 781
Adjusted Free Cash Flow 13,688$ 15,915$
Three Months Ended March 31,

24
Projected Adjusted EBITDA
(in thousands) Low High
Projected Net Income 21,558$ 28,919$
Income tax expense 7,952 10,656
Interest expense, net 27,312 27,312
Foreign currency loss (ga in) 371 371
Other income (3,710) (3,710)
Depreciation and amortization of plant and equipment 72,362 72,362
Amortization of intangible assets 34,580 34,580
Accretion and non-cash adjustments of closure & post-closure
obl igations 5,354 5,354
Bus iness Development & Integration Expense 1,220 1,155
Share-based compensation 8,001 8,001
Projected Adjusted EBITDA 175,000$ 185,000$
For the Year Ending December 31, 2021

25
Projected Earnings Per Diluted Share
Low High
Projected earnings per diluted share 0.69$ 0.92$
Adjustments :
Plus : Bus iness development and integration expenses 0.03 0.03
Less : Gain on minori ty interest investment (0.08) (0.08)
Foreign currency loss (ga in) 0.01 0.01
Projected adjusted earnings per diluted share 0.65$ 0.88$
Plus : projected amortization of Intangible assets 0.81 0.81
Projected cash earnings per diluted share 1.46$ 1.69$
Shares used in earnings per di luted share ca lculation (in
thousands) 31,376 31,376
For the Year Ending December 31, 2021

26
Projected Adjusted Free Cash Flow
(in thousands) Low High
Projected net cash provided by operating activities 143,000$ 155,000$
Less : Purchases of property and equipment (90,000) (85,000)
Plus : Bus iness development and integration expenses , net of tax 1,000 1,000
Plus : Purchases of property and equipment for the Idaho faci l i ty rebui ld 4,000 4,000
Plus : Payment of deferred/contingent purchase cons ideration 2,000 2,000
Projected Adjusted Free Cash Flow 60,000$ 77,000$
Year Ended December 31, 2021