2020/21 - Energy
142
Transcript of 2020/21 - Energy


2020/21
A N N U A L P E R F O R M A N C E P L A N 2 0 2 0 / 2 1 1
CONTENTSList of Figures 3Abbreviations 3Executive Authority’s Statement 5Accounting Officer Statement 7Official Sign-Off 12
Part A: The Strategic Mandate 141 Updates to the relevant legislative and policy mandates 15
1.1 Legislative mandate 151.2 Policy mandate 15
2 Updates to institutional policies and strategies 162.1 The Integrated Resource Plan (IRP) 162.2 Integrated Energy Plan (IEP) 172.3 IntegratedNationalElectrificationProgramme 172.4 The Renewable Energy Independent Power Producer Procurement
Programme (REIPPPP) 182.5 Gas Utilisation Master Plan 192.6 Mining Charter 192.7 Mineralbeneficiation 192.8 Shale gas research project 202.9 Nuclear 20
3 Updates to relevant court rulings 21
Part B: Strategic Focus 224 Updated situational analysis 23
4.1 External environmental analysis 234.1.1 Global context 234.1.2 African context 24
4.1.3 South Africa 254.2 Mining industry analysis 27
4.2.1 Global context 274.2.2 African context 29
4.2.2.1 Exploration in Africa 294.2.3 South African context 30
4.3 Energy industry analysis 344.3.1 Global context 344.3.2 African Context 394.3.3 South Africa 41
4.4 External environmental analysis 414.4.1 Global context 414.4.2 African context 424.4.3 South Africa 42
4.5 Internal environment analysis 434.5.1 Organisational structure 43
4.5.1.1 DMRE performance overview 444.6 Corporate Support 48
Part C: Measuring Performance 505 Institutional programme performance information 52
5.1 Programme 1: Administration 525.1.1 Outcomes, outputs, performance indicators and targets 535.1.2 Output indicators: Annual and quarterly targets 555.1.3 Explanation of planned performance over the medium-term
period 575.1.4 Programme resource consideration 58

D E P A R T M E N T O F M I N E R A L R E S O U R C E S A N D E N E R G Y2
CONTENTS5.2 Programme 2: Minerals and Petroleum Regulation (MPR) 61
5.2.1 Outcomes, outputs, performance indicators and targets 625.2.2 Output indicators: annual and quarterly targets 645.2.3 Explanation of planned performance over the medium-term
period 655.2.4 Programme resource considerations 67
5.3 Programme 3: Mining, Minerals and Energy Policy Development (MMEPD) 705.3.1 Outcomes, outputs, performance indicators and targets 715.3.2 Output indicators: Annual and quarterly targets 785.3.3 Explanation of planned performance over the medium-term period 815.3.4 Programme resource considerations 82
5.4 Programme 4: Mine Health and Safety Inspectorate (MHSI) 865.4.1 Outcomes, outputs, performance indicators and targets 865.4.2 Output indicators: Annual and quarterly targets 875.4.3 Explanation of planned performance over the medium-term
period 875.4.4 Programme resource considerations 88
5.5 Programme 5: Programmes and Projects 905.5.1 Outcomes, outputs, performance indicators and targets 915.2.2 Output indicators: Annual and quarterly targets 945.5.3 Explanation of planned performance over the medium-term
period 965.5.4 Programme resource considerations 97
5.6 Programme 6: Nuclear 1015.6.1 Outcomes, outputs, performance indicators and targets 1025.6.2 Output indicators: Annual and quarterly targets 1045.6.3 Explanation of planned performance over the medium-term
period 1055.6.4 Programme resource considerations 106
6 Institutional resource allocation for branches 1086.1 Expenditure analysis 112
7 Updated key risks and mitigation strategies 1148 Public Entities 1199 Infrastructure Projects 133
9.1 Expenditure on long-term infrastructure and other capital plans 1339.1.1 Extending access to electricity 1339.1.2 Enhancingenergyefficiency 133
10 Public-Private Partnerships (PPPs) 135
Annexures to the Annual Performance Plan 136Annexure A: Amendments to the Strategic Plan 137Annexure B: Conditional grants 137Annexure C: Consolidated indicators 137Annexure D: District development model 138Annexure E: Technical indicator descriptions (TIDs) 138

A N N U A L P E R F O R M A N C E P L A N 2 0 2 0 / 2 1 3
Figure 1: Global growth projections 23Figure 2: World trade, industrial production and the manufacturing PMI 24Figure 3: Manufacturing PMIs for select countries/region 24Figure 4: Real GDP growth in Africa, 2020 24Figure 5: Contributors to negative growth in GDP in Q3 25Figure 6: South Africa’s annualised GDP growth in 2019 25Figure 7: Lower output recorded by most manufacturing sub-sectors 26Figure 8: Mining output 26Figure 9: Summary of SA’s economic overview 27Figure 10: World exploration trends 2018 28Figure 11: 2019 Annual exploration budgets by region (US$M) 29Figure 12: Annual budget trends 29Figure 13: Contribution of mining to the South African economy 31Figure 14: South Africa’s share of African exploration budgets 2000–2017 32Figure 15: Junior miner licenses’ in South Africa (2017) 33Figure 16: Mining industry health and safety performance 33Figure 17: Global power capacity by source in the Stated Policies Scenario 36Figure 18: Renewable energy – total primary energy demand by category and region 38Figure 19: Nuclear energy production across the globe 38Figure 20: Final consumption by fuel, sector SSA (excl. SA) 39Figure 21: Change in energy demand and average annual GDP growth rate by
region in the Stated Policies Scenario, 2018–2040 40Figure 22: Natural gas resource discoveries, demand and production in selected
countries in Africa 40Figure 23: South African primary energy mix 41Figure 24: DMRE organisational structure 43Figure 25: DMRE balanced scorecard 51
4IR Fourth Industrial RevolutionAHTR Advanced High-Temperature Reactor AEMFC African Exploration Mining and Finance Corporation AFD Agence Française de DéveloppementAIDC Automotive Industry Development Centre APP Annual Performance PlanB-BBEE Broad-Based Black Economic EmpowermentBSTEP Black Science, Technology and Engineering Professionals BW Bid WindowCGS Council for GeoSciencesCEF Central Energy Fund DIIR Disabling Incident Injury RateDoHE Department of Higher Education and Training DoL Department of Labour DST Department of Science and Technology DMRE Department of Mineral Resources and EnergyETDP SETA Education, Training and Development Practices SETA EPP Electricity Pricing PolicyEAF Energy Availability Factor EDP Enterprise development programme EMP Environmental Management PlanEY Ernst & YoungFNRBA Forum for Nuclear Regulatory Bodies in Africa GDP Gross Domestic ProductGTP Geoscience Technical ProgrammeHDIs Historically Disadvantaged IndividualsHDSA Historically Disadvantaged South AfricansIAEA International Atomic Energy AgencyIDC Industrial Development Corporation
List of Figures Abbreviations

D E P A R T M E N T O F M I N E R A L R E S O U R C E S A N D E N E R G Y4
IDP Integrated Development Plan IDZ Industrial Development ZoneIEA International Energy AgencyIEP Integrated Energy PlanIMF International Monetary Fund INEP IntegratedNationalElectrificationProgrammeIPCC International Panel on Climate ChangeIRP Integrated Resource Plan MES Minimum Emission Standards MMP Multidisciplinary geoscience mapping programme MTSAO Medium Term Strategic Adequacy OutlookMHSI Mine Health and Safety Inspectorate MPRDA Mineral and Petroleum Resources Development Act MQA MiningQualificationsAuthorityMTSF Medium Term Strategic FrameworkMW MegawattMYPD Multi-Year Price DeterminationNDP National Development PlanNEDLAC National Economic Development and Labour CouncilNERSA National Energy Regulator of South AfricaNEMA National Environmental Management ActNICD National Institute for Communicable Diseases NMOG National Macro Organisation of GovernmentNRWDI National Radioactive Waste Disposal InstituteNDC Nationally Determined Contribution NNRA Nigerian Nuclear Regulatory AuthorityOHS Occupational Health and SafetyPASA Petroleum Agency of South Africa PBMR Pebble Bed Modular Reactor
PMI Purchasing Managers’ IndexPPI Policy Perception IndexPWC Price Waterhouse CoopersRAS Regulatory Accounting SystemREEEP RenewableEnergyandEnergyEfficiencyPartnershipRRs Research Reactors S&P Standard & PoorSADC Southern African Development CommunitySARB South African Reserve BankSARS South African Revenue ServiceSET Science-Engineering-TechnologySFF Strategic Fuel FundSMR Small Modular ReactorsSMME Small, medium, and micro enterprisesSOE State Owned EnterpriseSSA Sub Saharan AfricaPV Solar photovoltaicsSADPMR South African Diamond and Precious Metals RegulatoriGAS South African Gas Development Company SANEDI South African National Energy Development InstituteNNR South African Nuclear RegulatorSDT State Diamond Trader TIA Technology Innovation Agency TID Technical indicator descriptionTWh Terawatt-hours WiE Women in EnergyWSP Workplace Skills Plan WEF World Economic ForumWEC World Energy Council
Abbreviations

A N N U A L P E R F O R M A N C E P L A N 2 0 2 0 / 2 1 5
The reconfiguration and merger of the Department of Mineral Resources and theDepartment of Energy into a new Department of Mineral Resources and Energy (DMRE), was pronounced by the President in June 2019 to better capacitate and respond to the strategic objectives espoused in the National Development Plan (NDP) with regard to the regulation and transformation of the mining and energy sectors.
There is no doubt that the minerals and energy industry complex is a catalyst for economic growth and development. Reliable supply of energy drives economic activity and growth and as such, it should meet industrial, commercial and household needs. Challenges faced in the sector require all stakeholders to collaborate and work together for the sector to continue being sustainable, competitive and ultimately to improve the lives of all South Africans.
To address energy shortages, the DMRE will initiate the procurement of emergency power, ease requirements and processes for self-generation and the issuing of Section 34Determinations in linewiththeIRP2019andenablingmunicipalities ingoodfinancialstanding to buy their own power.
Nuclear Energy
TheNuclearEnergyPolicyof2008providesthegovernmentvisiontobecomeself-sufficientin all aspects of the nuclear value chain for peaceful use. Amongst the government policy objectives is the promotion of nuclear energy as an important electricity supply option through the establishment of a national industrial capability for the design, manufacture and construction of nuclear energy systems.
South Africa is the only country in Africa with nuclear energy through operating Koeberg Nuclear Power Station. The extension of life of Koeberg Power Station is critical for continued energy security in the period beyond 2024, when it reaches the end of its 40-year life. In accordance with IRP2019, the Koeberg Power Plant design life must be
extended by another 20 years to ensure that the necessary technical and regulatory work can be completed. To this end, the DMRE will commence with preparations for a nuclear build programme towards an additional 2 500 MW at a scale and pace that the country can afford, to ensure security of energy supply.
The DMRE in conjunction with the Ministerial Task Team will further focus on the development of the implementation framework for the replacement of the SAFARI-1 Research Reactor with a new Multi-Purpose Reactor within the next ten years to ensure that South Africa remains at the forefront of nuclear research and development and maintains its global leadership in the production of radioisotopes.
Natural Gas
With the increasing availability of gas in Southern Africa, the DMRE generation using gas. There is enormous potential and opportunity through the Brulpadda gas resource discovery in the Outeniqua Basin of South Africa and piped natural gas from Mozambique (Rovuma Basin). Indigenous gas, like coal-bed methane and shale gas, form a central part of our strategy for regional economic integration within SADC.
Co-operation with neighbouring countries is being explored and partnerships are developed forjointexploitationandbeneficiationofnaturalgaswithintheSADCregion.TheSADCGas Master Plan will identify the short- and long-term infrastructure requirements to enable the uptake of a natural gas market.
South Africa continues to run diesel plants at Ankerlig (Saldanha Bay), Gourikwa (Mossel Bay), Avon (Outside Durban) and Dedisa (Coega IDZ), because of the unavailability of natural gas, which is cheaper than diesel. The gas to power nexus has not yet been exploited, to the extent that gas plants at Avon and Dedisa could be converted to combined cycle plants, provided that natural gas, either pipeline or LNG infrastructure, is developed.
Executive Authority’s Statement

D E P A R T M E N T O F M I N E R A L R E S O U R C E S A N D E N E R G Y6
Hydroelectricity
South Africa has entered a Treaty for the development of the Grand Inga Project in the Democratic Republic of Congo (DRC), with some of the power intended for transmission to South Africa across DRC, Zambia, Zimbabwe and Botswana. The regional development drivers are compelling, since currently there is very little energy trade between these countries, due to the lack of infrastructure. The potential for intra-SADC trade is huge as it could open economic trade.
The DMRE will ensure that the country has a secured supply of energy that is cost effective and meets all demands. The high costs and unreliable supply of energy has had a negative impact on mining and many other industries. In this regard, we believe that lowering the cost of energy should be a major area of focus to enable the growth of the extractive sector like ours and other sectors in South Africa’s economy.
Petroleum Products
South Africa remains a net importer of refined petroleum products like petrol anddiesel,andpetrochemicals.Aplantoinvestinanewcrudeoilrefineryandanassociatedpetrochemical plantwill remain necessary to reduce the amount of refined petroleumproducts imported.
Through a Non-Disclosure Agreement and a Memorandum of Cooperation between the Central Energy Fund (CEF) and Saudi Aramco, the national oil company of Saudi Arabia, we willensurethatSouthAfricaisahubforcrudeoilrefiningintheregion.OpportunitieshavebeenidentifiedwithSaudiAramcoasaninvestorintherefineryatRichardsBay.
Mining
The introduction of a new mining regime by the democratic government has created a conducive and predictable regulatory framework which has revitalised the mining industry in the country and contributed positively to the socio-economic development of the peopleoftheSouthAfrica.PolicyinstrumentssuchasthefinalisedMiningCharteranditsimplementation guidelines have further ensured policy certainty in the sector.
Mining remains a sunrise sector that can still sustainably develop our country. It is for this reasonthattheDMREwillmovewithspeedtofinalisetheUpstreamPetroleumBill.TheBill is intended to provide regulatory certainty to the upstream petroleum industry and to stimulate growth and development of this sector. The development of a separate oil and gas policy will correct some of the uncertainties that have plagued the sector because of its regulation together with minerals under the Mineral and Petroleum Resources Development Act (MPRDA) and further realise a delicate balance between the need to attractinvestmentandensurethepotentialoftheupstreamindustrybenefitsforallSouthAfricans.
Equally important to the sustainability of the sector, is the need to ensure the health and safety of mineworkers. We will work harder with stakeholders in the sector to further ensure that the downward trend in fatalities is maintained and improved. As we go about doing our business in the sector, we should always be mindful that mineworkers are breadwinners whose loss of life has devastating effects to their families and communities. As a Regulator of the sector, the implementation and the enforcement measures contained in the Mine Health and Safety Act, particularly section 54, remains a key priority. Collectively with our social partners, we will work harder to achieve the goal of a fatality-free mining industry.
In conclusion, I wish to thank the Chairperson and Members of the Portfolio Committee on Mineral Resources and Energy and entities reporting to the DMRE.
I wish to thank the Director-General and Team Mineral Resources and Energy for their supportinadvancingthestrategytoensurethatdeliveryinallareasiseffectiveandefficientfor a better South Africa.
_____________________________________Executive Authority of the Department of Mineral Resources and Energy

A N N U A L P E R F O R M A N C E P L A N 2 0 2 0 / 2 1 7
The period 2020/21 marks the inaugural planning cycle of the sixth administration following the election, and the merger of the Department of Energy and the Department of Mineral Resources into the Department of Mineral Resources and Energy in June 2019. The merger intends to equip and capacitate the DMRE to respond to the strategic objectives derived from the National Development Plan (NDP), as they relate to the regulation and transformation of the energy and mining sectors in the following manner:
• Provisioning of secure, sustainable and affordable energy• The promotion and regulation of minerals and mining
The objective is aligned to develop a mineral resources and energy sector that promotes economic growth and development, social equity and environmental sustainability.
The following table summarises the six DMRE programmes as articulated in the start-up structure:
Programme Programme PurposeAdministration Provide strategic support and management services
to the Ministry and the DMREMinerals and Petroleum Regulation Regulate the mining, minerals and petroleum industryMining, Minerals and Energy Policy Development
Formulate and maintain an integrated minerals and energy policy to promote and encourage investment into the mining and energy industry
Mine Health and Safety Inspectorate
Ensure healthy and safety of employees in the mines
Programmes and Projects Manage, coordinate and monitor programmes and projects focused on access to mineral and energy resources
Nuclear Energy Manage nuclear industry
In support of the Executive Authority’s Statement, an overview of the programme priorities ispresentedbelow.Itisimportanttoreflectoncommitmentsmadeinthepastfive-yeartermofthefifthadministrationtoaligntheAnnualPerformancePlantargetswiththe2019-2024 Medium Term Strategic Framework.
Integrated Resource Plan (IRP2019)
Strategically, IRP2019 is the leading policy framework for addressing the short- to long-term challenges that the country faces with regards to its energy needs. IRP2019 formulatesspecificinterventionstoaddresselectricityinfrastructuredevelopmentbasedon least-cost electricity supply and demand balance, considering security of supply and the environment (minimising negative emissions and water usage).
IRP2019identifiesthepreferredgenerationtechnologyrequiredtomeetexpecteddemandgrowth up to 2030. The available options are summarised in the paragraphs below.
Coal:BeyondMedupiandKusile,coalwillcontinuetoplayasignificantroleinelectricitygeneration in South Africa in the foreseeable future as it is the largest base of installed generation capacity and makes up the largest share of energy generated. Due to the design lifeoftheexistingcoalfleetandtheabundanceofcoalresources,newinvestmentsmustbemade intomore efficient coal technologies (High-Efficiency, Low-Emissions (HELE))technology, including supercritical and ultra-supercritical power plants with Carbon Capture, Utilisation and Storage (CCUS) to comply with climate and environmental requirements. The stance adopted by the Organization for Economic Cooperation and Development andfinancialinstitutionsregardingfinancingcoalpowerplants,istoconsiderthesupportof HELE technology. This ensures that South African coal still plays an integral part in the energymix. Given the significant investments required for carbon capture and storage(CCS) and CCUS technology, South Africa could benefit from establishing strategicpartnerships with international organisations and countries that have made advancements in the development of CCS, CCUS and other HELE technologies.
Accounting Officer Statement

D E P A R T M E N T O F M I N E R A L R E S O U R C E S A N D E N E R G Y8
Nuclear: Koeberg Power Station will reach its end of design life in 2024. To avoid the demise of nuclear power in the energy mix, South Africa has granted an extension on the design life and the expansion of the nuclear power programme into the future. In line with power system requirements, additional capacity from any technology deployed shouldbedoneatascaleandpacethatflexiblyrespondstotheeconomyandassociatedelectricity demand, in a manner that avoids tariff shocks in particular; it is the user of electricity that ultimately pays. To this end, as is the case with coal, small nuclear units willbeamanageableinvestmentwhencomparedtoafleetapproach.Thedevelopmentof such plants globally is therefore particularly interesting for South Africa, and upfront planning with regard to additional nuclear capacity is a requisite, given the less than 10-year lead time, for timely decision making and implementation.
Natural Gas: Gas-to-power technologies in the form of CCGT, CCGE or ICE provide the flexibility required to complement renewable energy.While in the short term theopportunity is to pursue gas import options, local and regional gas resources will allow for scaling up within manageable risk levels. Exploration to assess the magnitude of local recoverable shale and coastal gas are being pursued and must be accelerated. There is enormous potential and opportunity in this respect and the Brulpadda gas resource discovery in the Outeniqua Basin of South Africa, piped natural gas from Mozambique (Rovuma Basin), and indigenous gas like coal-bed methane and ultimately shale gas, could form a central part of the strategy for regional economic integration within SADC. Co-operation with neighbouring countries is being pursued and partnerships are being developedforjointexploitationandbeneficiationofnaturalgaswithintheSADCregion.SADC is developing a Gas Master Plan, to identify the short- and long-term infrastructure requirements to enable the uptake of a natural gas market. Availability of gas provides an opportunity to convert to CCGT and run open-cycle gas turbine plants at Ankerlig (Saldanha Bay), Gourikwa (Mossel Bay), Avon (Outside Durban) and Dedisa (Coega IDZ) on gas.
Renewable Energy: Solar photovoltaic (PV), wind and concentrated solar power (CSP) with storage present an opportunity to diversify the electricity mix, to produce distributed generation and to provide off-grid electricity. Renewable technologies also present ample
potential for the creation of new industries, job creation and localisation across the value chain.TheWindAtlasdevelopedforSouthAfricaprovidesabasisforthequantificationof the potential that wind holds for power generation elsewhere in the country, over and above the prevalence of wind resources around the coastal areas. Most wind projects have been developed in the Western Cape and Eastern Cape thus far. The generation of electricity and heat (to be supplied for industrial processes), through biomass and biogas holds huge potential in South Africa, recognising that such projects range from small (kW) to larger (MW) scale and could be distributed across the industrial centres. Biomass from the waste, paper and pulp, and sugar industries can be utilised in co-generation plants and deliver electricity at a price-competitive level with minimal transmission and distribution infrastructure requirements. When deployed together, the nexus between the biomass and a government-backed biofuels programmes could improve the economics of the initiatives and create job opportunities in rural and urban centers.
Energy Storage: There is a harmonising relationship between Smart Grid systems, energy storage, and non-dispatchable renewable energy technologies based on wind and solar PV. This is highlighted in Policy Position 5 where the requirement is that the current annual build limits on renewables (wind and photovoltaic) be retained, pending the report on a just transition. The traditional power delivery model is being disrupted by technological developments related to energy storage, and more renewable energy can be harnessed despite the reality that the timing of its production might be during low-demand periods. Storage technologies includingbatterysystems,compressedairenergystorage,flywheelenergy storage, hydrogen fuel cells etc. are developments which can address this issue, especially in the South African context where over 6 GW of renewable energy has been introduced,yetthepowersystemdoesnothavetherequisitestoragecapacityorflexibility.
Energy efficiency strategy
Energy efficiency has tremendous potential to boost economic growth and avoidgreenhouse gas emissions, but the global rate of progress is slowing – a trend that has majorimplicationsforconsumers,businessesandtheenvironment.EnergyEfficiency2019examines the reasons for this recent deceleration in efficiency progress and includes aspecialfocusonhowdigitalisationistransformingenergyefficiencyandincreasingitsvalue.

A N N U A L P E R F O R M A N C E P L A N 2 0 2 0 / 2 1 9
The mission of the DMRE is to develop measures to promote energy saving, reduce the negative impact of energy use on the environment, reduce energy costs to the economy, contribute towards sustainable development, and to achieve a national energy policy. The visionistooptimiseenergysectordevelopmentthroughefficientutilisation,productionandconsumptionofenergyresources.TheNationalEnergyEfficiencyStrategyofSouthAfrica,was approved by Cabinet in March 2005 and reviewed in October 2008 and sets the target forimprovedenergyefficiencyinSouthAfricaat12%by2015.
Electricity has contributed to South Africa's economic growth and service delivery to thepoor.Whenautilityorlocalauthoritywhichsupplieselectricityinfluencesthewayit is used by customers, this activity is known as Demand Side Management (DSM). The strategy includes Eskom’s DSM. Municipalities are also implementing their own energy efficiencystrategies.
Procurement of emergency power
The DMRE released a Request for Information (RFI) on power projects that can deliver power to the grid in the shortest possible time on a least-cost and a least-regret approach. The RFI helps to assess availability of immediate implementable generation options and the commercial terms expected by these projects. Four hundred and eighty-one (481) responses were received, which include energy supply options and Demand Side Management options for gas, liquid fuels, coal, renewables, storage and nuclear. Preliminary analysis shows that some proposals can bring power to the grid in less than twenty-four months. It also suggests that longer-term contracting is required to ensure prices do not negatively affect the current tariffs.
Generation for own use
Licensing of generation for own use of above one megawatt (1 MW), which is mainly to supplement power supply to commercial and industrial customers including the mines, has been eased. IRP2019 provides for distributed generation for own use above 1 MW, removing the requirement for Ministerial approval for deviation from the IRP, before
NERSA processes a generation licence application. NERSA has committed to urgently process the licensing of duly admitted applications.
Enabling municipalities to procure their own power from IPPs
The DMRE is developing regulations to ensure regulatory certainty, which are aligned with the Electricity Regulation Act, for municipalities to procure or develop their own power generation. The regulations will require that a municipality should align with IRP2019 and all other applicable laws. For long-term sustainability, a municipality must demonstrate diversity in its customer base and that electricity revenue collection meets its electricity operations and energy buying costs. This is especially critical to ensure that paying customers – especially commercial - are not burdened with high electricity tariffs as compensation for non-paying users.
Sovereign wealth fund and specialised units on crime
The DMRE has included in the Draft Upstream Petroleum Resource Development Bill, released for public comments in 2019, a proposal on a sovereign wealth fund to be created through royalties from South Africa’s mineral resources. Regarding specialised units for organised crime, the Minister of Police and key role players in the mining industry will be engaged to tackle illegal mining, which contributes to gender-based violence and social instability in mining communities and is negative to the economy.
Carbon capture, utilisation and storage
To mitigate health impacts, industry compliance with air quality legislation has to be ensured, including the implementation of cleaner coal technologies, such as carbon capture,utilisationandstorage(CCUS).Suchplantretrofitswillbeimplementedcost-effectively and in consideration of both economically available alternatives and envisioned social consequences. In 2009, the South African National Development Energy Institute (SANEDI) created the South African Centre for Carbon Capture and Storage, which is funded by the South African government, the World Bank, the European Union, Eskom

D E P A R T M E N T O F M I N E R A L R E S O U R C E S A N D E N E R G Y10
and private sector companies such as Anglo American. The centre is mandated to explore carbon capture and storage (CCS) in the country and has made good strides in research into CCS and its potential use through the collaboration. Efforts in this area are being stepped up to include SANEDI’s recent membership of the Global CCS Institute and the DMRE’s continuing participation in the carbon capture, utilisation and storage work of the International Energy Agency (IEA).
Exploration (Mining and Petroleum)
Focusing on the concentration of petroleum and minerals, it will be necessary to encourage partnerships between emerging junior miners, and conduct a legislation review with regards to the petroleum bill to encourage inclusive, equitable and competitive exploration. The requirement for an optimal legislative framework for petroleum will be addressed by expediting the legislative processing framework.
Transformation will be addressed by imposing compliance with relevant legislation. This responsewillbeevident in theminerals andpetroleumsectors reflecting thecountry’sdemographics. The DMRE commits to ensuring regulatory and legislative certainty through several channels, including the development of comprehensive legal guidelines aligned with the objects of the Mineral and Petroleum Resources Development Act, 2002 (Act No. 28 of 2002) (MPRDA) (e.g. optimal exploration, substantial and meaningful participation by Historically Disadvantaged South Africans) 2003 (Act No. 60 of 2003).
Access to land for exploration, together with monitoring of compliance, will be achieved by engaging with respective landowners (including trusts, chiefs, and municipalities), as well as establishing a framework for engagements, exploration and monitoring.
To reduce licensing turnaround times, relevant legislation will be reviewed and strengthened. Capacity in terms of human resources will be strengthened, and the licensing process will be reviewed. Technology will enable the tracking and unblocking of bottlenecks, and improvement of communication. Co-operation between the DMRE, DWS and DEA towards implementing one environmental system will be encouraged.
The strategic responses to the mining sector challenges will be enhanced by commitments from supporting SOEs and are summarised below.
Licensing turnaround times will be addressed by reviewing and strengthening relevant legislation, strengthening capacity through human resources and reviewing the licensing process through technology to track and unblock delays. The DMRE, DWS and DEA will cooperate around one environmental system. These responses vary between high and low priority, ultimately resulting in an expedient licensing regime. The Mineral and Petroleum Branch is responsible for these interventions.
Infrastructure development including energy, rail, water and other examples is regarded as a high priority. The appropriate response includes engaging with all the relevant departments to co-ordinate efforts. This is a short- to long-term strategy, aimed at increasing the availability of support infrastructure for mining. The Policy Branch is best positioned to manage this process.
To address concerns around the cost of energy to mining houses, the sector will be encouraged to generate its own energy, and will explore if another entity can be established to assist in energy generation. More meaningful state participation in Eskom’s coal supply will also improve energy costs for heavy users. This will contribute to delivering sustainable and affordable energy for mining.
Mining research is lagging due to a lack of support capacity. The expansion of the mandates of the respective entities is proposed to support research in mining and enhance their capacity. This should result in improved support for mining research and increase the competitiveness of the South African mining industry.
The legislative framework to prevent illegal mining will be revised. Small-scale mining must be encouraged. Supporting artisanal miners will encourage legitimate mining, particularly if backed by a framework on how to support the artisanal miners - this framework must still be developed.

A N N U A L P E R F O R M A N C E P L A N 2 0 2 0 / 2 1 11
Asignificantnumberofminesremainundercaremaintenance,requiringaframeworktodealwiththesemines.Specifically,suchminesshouldnotbedecommissionedwithoutinvestigating their viability more vigorously. This will encourage the optimal utilisation of South Africa’s mineral resources.
Mineral beneficiation
To create access tominerals for beneficiation, necessary licensing conditions need tobe created. Section 50 of the MPRDA must be revisited to help increase domestic beneficiation.
The cost for beneficiation needs to improve to deliver cost-effective beneficiation.Addressing import parity pricing will help deliver this outcome, as well as addressing the costofenergy.Accesstointernationalmarketsforbeneficiatingproductscanbeimproved.This can be done by using bilateral and multilateral agreements to facilitate preferential access, which can increase exports of manufactured products.
Toaddresstheimpactofalackofinnovationonminingbeneficiation,investmentinresearchand development will be increased. There will also be a focus on upskilling and increasing capacity, to diversify products and improve the country’s manufacturing capability.
Mine health and safety
A review of legislation, and DMRE-led facilitation between the mines and communities, will reduce negative impacts of mining on communities. Compliance with legislative frameworks will be enforced to address fatalities, injuries and diseases. Research will be conducted to improve health and safety, including the development of technologies for fall-of-ground accidents. The investigative skills and capacity of the inspectorate will be improved, particularly to reduce reliance on external parties. The inspectorate’s capacity will be enhanced with more human resources.
A review of the legislation on health and safety relating to upstream petroleum and hydraulic fracturing will ensure zero harm to mine workers. The security and safety of women in mining with regards to gender-based violence is a high priority. The implementation of guidelines and directives will create a conducive working environment for women in mining. To address illegal mining, stakeholder forums will be formalised between mines, the DMRE and law enforcement agencies.
In conclusion, I wish to thank the Minister for his leadership and commitment, the entities reportingtotheDMRE,andthesector. IamconfidentthattheDMREwillfinaliseall itspendinglegislationandimproveoperationalefficiencytodrivesocio-economicgrowthanddevelopment.
I commit Team Mineral Resources and Energy to continue to display high levels of excellence and dedication in the service of the people of South Africa.
________________________________Accounting Officer of the Department of Mineral Resources and Energy

D E P A R T M E N T O F M I N E R A L R E S O U R C E S A N D E N E R G Y12
ItisherebycertifiedthatthisAnnualPerformancePlan:
• Was developed by the Management of the Department of Mineral Resources and Energy under the guidance of Minister Gwede Mantashe
• Takes into account all the relevant policies, legislation and other mandates for which the Department of Mineral Resources and Energy is responsible
• Accuratelyreflectstheimpact,outcomesandoutputswhichtheDepartmentofMineral Resources and Energy will endeavour to achieve over the period of the 2020/21financialyear.
Official Sign-Off
Signature: ______________________Branch: Corporate Services
Signature: ______________________Branch: Corporate Services
Signature: ______________________Branch: Mine, Health and Safety Inspectorate
Signature: ______________________Branch: Minerals and Petroleum Regulation
Signature: ______________________Branch: Minerals and Petroleum Regulation
Signature: ______________________Branch: Mining, Minerals and Policy Development
Signature: _____________________Branch: Programmes and Projects

A N N U A L P E R F O R M A N C E P L A N 2 0 2 0 / 2 1 13
Signature:______________________Branch: Nuclear
Signature: ______________________ChiefFinancialOfficer
Signature:______________________OfficialResponsibleforPlanning
Signature: _______________________AccountingOfficer
Signature: _______________________OfficialResponsibleforPlanning
Approved by:
Signature: _______________________Executive AuthorityMr SG Mantashe, MP

2020/21Part A
The Strategic Mandate
14

A N N U A L P E R F O R M A N C E P L A N 2 0 2 0 / 2 1 15
1 Updates to the relevant legislative and policy mandates
The Department of Mineral Resources and Energy derives its mandate from Section 24 of the Constitution of South Africa, 1996 (Act No. 108 of 1996).
1.1 Legislative mandate
The DMRE derives its founding mandate from the Minerals and Mining Policy for South Africa(WhitePaper,1998),whichensuresthetransparentandefficientregulationofthedevelopment of South Africa’s mineral resources and mineral industry to meet national objectivesandbringoptimumbenefittothecountry.
The mining arm of the DMRE is primarily regulated through the Mineral and Petroleum Development Act, 2002 (Act No. 28 of 2002) and the Mine Health and Safety Act, 1996 (Act No. 29 of 1996). The two Acts provide the regulatory framework for the promotion regulation and health and safety of workers in the mining, minerals and petroleum industry. They provide a regulatory framework for ensuring equitable access to and sustainable development of the nation’s mineral resources and related matters.
1.2 Policy mandate
The White Paper on Energy Policy (1998), supplemented by the White Paper on Renewable Energy of 2003, sets out government’s overarching position on the supply and consumption of energy. Applicable policies include:• The National Development Plan• The Integrated Energy Plan (IEP)• The Integrated Resource Plan (IRP)• The Electricity Pricing Policy (EPP)• The Nuclear Energy Policy of 2008• The Paris Agreement (2016) on Climate Change• The National Energy Act, 2008 (Act No. 34 of 2008)
• A range of legislation regulating Nuclear Energy1• National Environmental Management Air Quality Act (Act No. 39 of 2004)
The Principal Acts that drive the work of the DMRE are: • National Energy Act, 2008 (Act No. 34 of 2008)• Electricity Regulation Act, 2006 (Act No. 4 of 2006), as amended• Petroleum Products Act, 1977 (Act No. 120 of 1977), as amended• Central Energy Fund Act, 1977 (Act No. 38 of 1977), as amended• Nuclear Energy Act, 1999 (Act No. 46 of 1999)• National Nuclear Regulatory Act, 1999 (Act No. 47 of 1999)• National Radioactive Waste Disposal Institute Act, 2008 (Act No. 53 of 2008)• Petroleum Pipelines Act, 2003 (Act No. 60 of 2003)• Petroleum Pipelines Levies Act, 2004 (Act No. 28 of 2004)• Gas Act, 2001 (Act No. 48 of 2001)• Gas Regulator Levies Act, 2002 (Act No. 75 of 2002)• National Energy Regulator Act, 2004 (Act No. 40 of 2004)• Abolition of the National Energy Council Act, 1991 (Act 95 of 1991)
In addition to the Acts, the following laws impact the energy sector:• The National Environmental Management Act, 1999 (Act No. 107 of 1999), has a
direct impact on legislative and other measures to reduce carbon emissions, energy efficiencyandmitigationoftheimpactofthegeneration/refinementanduseofenergyon the environment
• The Mineral and Petroleum Resources Development Act, 2002 (Act No. 28 of 2002)• The National Environmental Management Act, 1999 (Act No. 107 of 1999)• The Mineral and Petroleum Resources Development Act, 2002 (Act No. 28 of 2002)• The Disaster Management Act, 2002 (Act No. 57 of 2002)• The Hazardous Substances Act, 1973 (Act No. 16 of 1973)• The National Ports Act, 2005 (Act No. 12 of 2005)• Mine Health and Safety Act (Act No. 29 of 1996)• Mineral and Petroleum Resources Development Act (Act No. 28 of 2002)• The National Energy Act, 2008 (Act No. 34 of 2008) • The Petroleum Products Act, 1977 (Act No. 120 of 1977), as amended• The Electricity Regulation Act, 2006 (Act No. 4 of 2006), as amended

D E P A R T M E N T O F M I N E R A L R E S O U R C E S A N D E N E R G Y16
2 Updates to institutional policies and strategies
2.1 The Integrated Resource Plan (IRP)
The Integrated Resource Plan (IRP) is a legal instrument for South Africa’s energy generation planning. Considered under the Electricity Regulation Act, the IRP is designed to help meet forecast annual peak and energy demand, as well as some established reserve margin. This will be achieved through a combination of supply-side and demand-
side resources over a specified future period and driven by a set of predeterminedobjectives:• To ensure the security of South Africa’s energy supply• To reduce the cost of South Africa’s energy supply• To minimise water usage related to energy supply• To reduce CO2 emissions from power generation
The IRP has been updated through a multi-stage process, which included public and sector consultations.
ASSUMPTIONS AND PRELIMINARY BASECASE POLICY ADJUSTMENT IRPDRAFT IRP2018
Assumptions
• Demand• Existing plant performance• Technology costs• Technology parameters• New commissioned plants• Decommissioned plants• Other considerations
Test Cases
• Draft IRP2018 recommended plan
• Eskom compliance with MES• Eskom non-compliance with
MES• Eskom granted extension to
comply• Koeberg 2024 end of Life• Limited Gas to Power by 2030
Scenarios Tested
• Medium growth (reference case)
• Low growth• High growth• No RE annual build limit• Carbon budget• Market linked gas price• Carbon budget plus market
linked gas price
PUBLIC COMMENTSOct 2018 and Nov 2018
andNEDLAC CONSULTATIONS
Main Changes
• Demand assumptions• Battery storage costs• Pumped storage costs• Hydro costs• Eskom plant performance• Eskom plant
decommissioning
PUBLIC CONSULTATIONS(Dec 2016 to Mar 2017)
Main Changes
• Demand• Renewable energy costs• Exchange rate
Power System
Modelling, Simulation
and Analysis
Power System
Modelling, Simulation,
Analysis and Policy Choices
Power System
Modelling, Simulation
and Analysis
Assumptions and Preliminary Basecase
Draft IRP2018 ReportPolicy Adjusted IRP2019
Report

A N N U A L P E R F O R M A N C E P L A N 2 0 2 0 / 2 1 17
Cabinet approved the Draft IRP2018, which was published in August 2018. Between October and November 2018, public comments were invited and there were consultations with the National Economic Development and Labour Council (NEDLAC), while the Portfolio Committee on Energy conducted public input sessions. Overall, 5 929 comments were received, of which 242 were substantive.
The consultation and comment process delivered numerous changes to the 2018 draft. The CSIR HLI forecast with the calendar year 2018 actuals (peak demand and annual energy) was rebased, and the Medium-Term Strategic Adequacy Outlook (MTSAO) 2018 was used. It inspired the low demand Average Annual Growth rate.
Eskom’snewsubmissionswereaddedtoreflectthelowerEnergyAvailabilityFactor(EAF)andtoreflectearlyshutdownsamongtheexistingEskomfleet.TherevisionoftheMinimumEmissionStandard(MES)applicationwas included,andthedraftwaschangedtoreflectKoeberg Nuclear Power Plant’s end of life.
Hydro options from Mozambique were included, storage costs for batteries were updated, and the draft incorporated revelations based on a study commissioned from Lazard, the financialadvisoryandassetmanagementfirm.
Through a process of power system modelling, simulation, analysis and policy choices, the Policy-Adjusted IRP2019 Report was compiled.
2.2 Integrated Energy Plan (IEP)
The development of a National Integrated Energy Plan (IEP) was envisaged in the White Paper on the Energy Policy of the Republic of South Africa of 1998 and, in terms of the National Energy Act, 2008 (Act No. 34 of 2008), the Minister is mandated to develop and publish the IEP in the Government Gazette. The IEP provides a roadmap of the future energy landscape for South Africa which guides future energy infrastructure investments and
policy development. The IEP examines current energy consumption trends within different sectors of the economy (i.e. agriculture, commerce, industry, residential and transport) and uses this to project future energy requirements, based on different scenarios.
While the IEP focuses on demand for all energy forms across all the economic sectors at ahigh level,moredetailed analysisofdifferentdemandgrowthprofiles and supply-sideoptions for the two main energy sub-sectors, namely: electricity generation and liquid fuels supply, will be detailed in supporting sector plans. For the gas sub-sector, a draft framework which explores future possible options for the development of a gas market in South Africa is being developed. This has been undertaken to analyse the differences in each of the sectors considering the complexities and level of maturity of each sub-sector.
The DMRE has published a draft report on the IEP and IRP Assumptions and the Base Case for comments. Supporting annexures, including a report on the detailed scenarios for liquid fuel supply are available on the DMRE’s website for comment. Comments received willbeconsideredinpreparingadraftfinalIRPUpdatewhichwillbesubmittedtoCabinetfor approval.
2.3 Integrated National Electrification Programme
The DMRE is responsible for the formulation of policies and regulations for the energy sector. Through the Integrated National Electrification Programme, the DMRE isresponsibleforassistingmunicipalitieswithfundingforimplementationofelectrificationprojects so that universal access to electricity is reached by 2025.
Beyondreachinguniversalaccesstoenergy forallandaddressingelectrificationbacklog,itisvitalthatpolicyguidelinesareadheredtowhenimplementingelectrificationprojectsthrough the Integrated National Electrification Programme (INEP).The electrificationpolicies are summarised below.

D E P A R T M E N T O F M I N E R A L R E S O U R C E S A N D E N E R G Y18
Suite of Supply Policy
The Suite of Supply Policy covers all project categories such as bulk infrastructure and household connections, which includes electrification of domestic households, informalsettlements, farm dweller houses, Communal Property Association (CPA) and Communal Rental Units (CRU).
Farm Dweller Houses Policy
Other polices such as farm dweller and un-proclaimed areas are linked to the suite of supply policy and bulk infrastructure. All policies provide guidance in terms of how electrificationprojectsshouldbefundedbytheDMRE through its implementing agencies such as Eskom and municipalities.
Un-proclaimed Areas Policy
While the focus is on addressing traditional backlog, the DMRE must ensure that funding for electrificationofnewhouseholdsismadeavailable.Duetoseveralfactors,therearemanyun-proclaimed and informal settlements which municipalities wish to electrify as part of the programme. The un-proclaimed areas policy looks at such areas and sets out guidelines and criteria to be followed in providing funding for them.
Non-grid Electrification Policy
Theelectrificationprogrammeisunabletoensuregridelectrificationofallremoteruralareasintheshortormedium-term,thereforenon-gridelectrificationwasidentifiedasaninterimsolution.Thenon-gridelectrificationprogramme isdesigned to temporarily givedeep rural communities access to limited electricity until such time that grid connections are possible. Solar Home Systems (SHS) are given to households as part of the non-grid electrificationprogramme.
Bulk Infrastructure Policy
Before an electrification project is implemented, it is crucial to check if there is bulkinfrastructure to supply the area with electricity. Bulk infrastructure is outlined in the Suite of Supply Policy whereby all bulk infrastructure projects such as building of new substations, new High and Medium Voltage lines and upgrading and refurbishment of the electrical networks are outlined, hence a reliable electrical infrastructure is critical when implementingelectrificationprojects.
Mixed Developments Policy
Mixed developments refer to developments where an area is developed and has a component of fully subsidised RDP houses, social housing, and partially and fully bonded houses (Low Cost, GAP, BNG). Such developments are done by developers in partnership with government. Since these developments are increasing in numbers, this policy addresses their requirements.
2.4 The Renewable Energy Independent Power Producer Procurement Programme (REIPPPP)
The Renewable Energy Independent Power Producer Procurement Programme (REIPPPP) was established by the Department of Mineral Resources and Energy (DMRE) in conjunction with the National Treasury and the Development Bank of Southern Africa (DBSA) at the end of 2010. The REIPPPP is one of government’s urgent interventions to enhance the country’s power generation capacity. Its main objective is to secure private sector investment for the development of new electricity generation capacity, thereby giving effect to the policy decision to diversify South Africa’s energy mix which was articulated in the 1998 White Paper on Energy Policy of South Africa. The REIPPPP has been designed to contribute to broader national developmental objectives such as job creation, social upliftment and economic transformation, primarily through broadening of economic ownership.TheIPPOfficewasestablishedwithamandatetoimplementthisprogrammeand achieve its broader objectives.

A N N U A L P E R F O R M A N C E P L A N 2 0 2 0 / 2 1 19
2.5 Gas Utilisation Master Plan
The Gas Utilisation Master Plan (GUMP), scopes the development of gas pipeline infrastructure for the country’s needs and to connect South Africa with African countries endowed with vast natural gas resources.
The GUMP is a roadmap which analyses the potential and opportunity for the development of South Africa’s gas economy and sets out a plan of how this could be achieved. A key objective of the GUMP is to enable the development of indigenous gas resources and stimulate the introduction of a portfolio of gas supply options. The Gas to Power Programme will provide a market for a potential supply of gas. It also provides long-term gas demand sinks for future indigenous gas supplies.
2.6 Mining Charter
Against the backdrop of concerns around the pace of transformation in the mining and minerals industry, government published the third iteration of the Broad-Based Black Socio-Economic Empowerment Charter for the South African Mining and Minerals Industry, known as the Mining Charter, aimed at strengthening its effectiveness, while considering the realities facing the industry.
TheMiningCharterwasfirstdeveloped in2002andamended in2010. Itservedasaninstrument through which the Minerals and Petroleum Resources Development Act (MPRDA) could advance transformation in the industry. Following another assessment on the effectiveness of the Charter, the most recent review was gazetted in draft on 26 September 2018 (the “2018 Charter”). This 2018 Mining Charter, alongside the MPRDA and SLP amendments, offers an opportunity to improve regulatory and policy certainty, and subsequently investor perception.
The 2018 Charter introduced new targets and measurement criteria aimed at accelerating the country’s transformation agenda within the industry, and a degree of alignment with certain compliance measures and criteria used in the dti Broad-Based Black Economic
Empowerment Codes of Good Practice (B-BBEE Codes). The revised Charter will drive value beyond compliance within the South African mining ecosystems while continuing a journey of redressing historic inequalities.
• A new concept and scorecard: The 2018 Mining Charter introduced a new concept by declaring Ownership, Mine Community Development and Housing and LivingConditionsas,whatistermed,aring-fencedelement,whichrequires100%compliance. Only the procurement, Employment Equity and Human Resource Development of the old scorecard remain weighted elements in the proposed new scorecard.
• The Mining Charter scorecard has formally been aligned with the dti’s Codes of Good Practice. Compliance is now in accordance with the recognition levels (1-8).
2.7 Mineral beneficiation
Governmenthascommittedtothepromotionoflocalbeneficiationthroughlegislation.The Mineral and Petroleum Resources Development Act, 2002 (Act No. 26 of 2002) includes provisions that will ensure that:
1. TheMinister of Mineral Resources and Energy promotes the beneficiation ofminerals in the country.
2. If the Minister, acting on the advice of the Board and after consultation with the MinisterofTradeandIndustry,findsthataparticularmineralcanbebeneficiatedeconomicallyinSouthAfrica,theMinistermaypromotesuchbeneficiationsubjectto terms and conditions as the Minister determines.
3. Any person who intends to beneficiate any mineral mined in the country oroutside the country may only do so after written notice and in consultation with the Minister.
TheSouthAfricanMiningCharterof2004specificallystipulatesthatminingcompaniescanoffsetthevalueofthe levelofbeneficiationachievedbythecompanyagainst itsHDSAownership commitments.

D E P A R T M E N T O F M I N E R A L R E S O U R C E S A N D E N E R G Y20
The Diamonds Amendment Act, 2005 (Act No. 29 of 2005 and Act No. 30 of 2005) and the Diamonds Second Amendment Act, 2005 (Act No. 30 of 2005): The rationale for the amendment of the Diamonds Act, 1986 (Act No. 56 of 1986) was to: increase access to rough diamonds for jewellery manufacturing in South Africa; maintain security of supply of roughdiamonds;promotethebeneficiationindustryinSouthAfricathuscreatingjobs;andincrease broad-based participation throughout the diamond value chain.
The Precious Metals Act, 2005 (Act No. 37 of 2005): This Act provides for acquisition, possession, smelting, refining,beneficiation,useanddisposalofpreciousmetals.Preciousmetals include gold and the platinum group metals (PGMs).
2.8 Shale gas research project
The Council for Geoscience (CGS) and Petroleum Oil and Gas Corporation of South Africa (PetroSA) are undertaking shale gas research that unlocks the unknowns and assumptionsaboutshalegasoccurrenceinthecountry.Theprojectwillbuildscientificskills in shale gas exploration and exploitation as this resource has not been exploited in the country.
The programme is funded by the DMRE and will assist government in making well informed decisions about the future of shale gas in South Africa.
The programme aims to collect and review new geological information to define anenvironmental baseline, to assess the amount of recoverable gas mainly from the Whitehill and Prince Albert Formations, to cover various geo-environmental impacts like ground water dynamics with possible contamination, and monitor potential seismic interferences.
The Shale Gas Project will serve as a baseline study for future shale gas research work and play a vital role in review of petroleum exploration and exploitation regulations. NEMA regulations will create a framework to identify shortfalls of the environmental impacts of the shale gas.
2.9 Nuclear
South Africa is a member state to the International Atomic Energy Agency (IAEA). The peaceful use of nuclear in South Africa will contribute to the country’s national programme of socio-economic development and growth and is guided by national legislation and policies in line with the country’s international obligations. To ensure peaceful applications of nuclear energy, nuclear authorisations or denials are issued for nuclear material, related equipment and nuclear technology required by various industries thatsignificantlycontributetotheeconomy.Regulationsonphysicalprotectivemeasuresfor nuclear material will be promulgated to strengthen nuclear security measures for the nuclear industry and related institutions.
TheNuclearEnergyPolicyof2008providesthegovernmentvisiontobecomeself-sufficientin all the aspect of the nuclear value chain for peaceful use. Amongst government’s policy objectives is the promotion of nuclear energy as an important electricity supply option through the establishment of a national industrial capability for the design, manufacture and construction of nuclear energy systems.
South Africa is the only country in Africa generating nuclear power, through its Koeberg Nuclear Power Station. The extension of design life of the Koeberg Power Station is critical for continued energy security in the period beyond 2024, when it reaches the end of its 40-year design life. In accordance with IRP2019 Decision 2: Koeberg Power Plant’s design life must be extended by another 20 years by undertaking the necessary technical and regulatory work. Similarly in accordance with IRP2019, Decision 8: The DMRE will commence preparations for a nuclear build programme to the extent of 2 500 MW at a pace and scale that the country can afford because it is a no-regret option in the long term.

A N N U A L P E R F O R M A N C E P L A N 2 0 2 0 / 2 1 21
3 Updates to relevant court rulings
• The majority of judgements relate to Minerals and Petroleum licensing matters, given the volume of applications processed annually in these sectors in terms of the Mineral and Petroleum Resources Development Act, 2002 (Act No. 28 of 2002) and the Petroleum Products Act, 1977 (Act No.20 of 1977).
• The Sabie and Resilient judgements, related to bulk electricity disconnections by Eskom for non-payment by the Thaba Chweu and Emalahleni municipalities respectively, is subject to an application for leave to appeal. This matter is not opposed by the Minister or the DMRE.
• The Coal Transporters Forum matter is subject to an application for leave to appeal to the Supreme Court of Appeal (SCA) by the Forum. The matter is opposed by 33 respondent parties, including NERSA, Eskom and the IPPs.
• The Chamber of Mines matter in which a declaratory order was handed down by the High Court in relation to the enforceability of the Mining Charter and the interpretation of the ownership element, has resulted in further ongoing litigation to establish legal certainty on government’s regulatory authority to achieve transformation in the minerals and mining sector.
• The Baleni judgement, which is currently on appeal to the SCA, deals with the question of whether the consent of traditional communities is required where mining rights to the land occupied by them have been granted by the Minister.
• In the Treasure the Karoo and another matter, the regulations for petroleum exploration and production were declared invalid and set aside by the SCA. Authorisation of shale gas exploration which involves hydraulic fracturing will only be possible once new regulations have been promulgated under NEMA.

2020/21
22
Part BStrategic Focus

A N N U A L P E R F O R M A N C E P L A N 2 0 2 0 / 2 1 23
4 Updated situational analysis
The situational analysis highlights key developments in the global, African and South African context, to provide a holistic picture of the external economic and environmental factors that impact the DMRE. The analysis includes an external overview considering keyelementsofthePESTLEframework,aswellasinternalanalysisthatreflectsonpastorganisational performance. A more detailed situational analysis is included in the DMRE Strategic Plan.
4.1 External environmental analysis
4.1.1 Global context
The global economy is in a synchronised slowdown, with economies generally experiencing a moderation in their growth performances1 (Figure 1).
The US Federal Reserve lowered its policy rate by 25 basis points each at its August, September and October meetings3. The European Central Bank, in turn, has limited room to utilise interest rates in support of growth and therefore announced the resumption of its quantitativeeasingprogrammeforanindefiniteperiod.
Economic activity and business sentiment are weakening in the face of uncertainty; as a result growth in global industrial production is stagnating, with contractions recorded in Europe. The situation has led to the sharp decline of sentiment levels among manufacturers in advanced economies as seen in Figures 2 and 3.
4
3
2
1
02019 2020 2021
Figure 1: Global growth projections2
2.9
3.3 3.4
Global growth is projected to rise from an estimated 2.9% in 2019 to 3.3% in 2020 and 3.4% for 2021– a downward revision of 0.1% for 2019 and 2020 and 0.2% for 2021 compared to those in the October World Economic Outlook (WEO). The downward revision primarily reflects negative surprises to economic activity in a few emerging market economies, notably India, which led to a reassessment of growth prospects over the next two years. In a few cases, this reassessment reflects the impact of increased social unrest.
Several key economic variables are reflecting the deteriorating economic, trading, investment and risk environments. Relatively subdued inflationary pressures and moderating growth are underscoring the accommodative monetary policy stances being maintained by central banks around the globe.
1 IDC-Economic Overview 2019
2 World Economic Outlook 2020 (International Monetary Fund)
3 https://www.imf.org/en/Publications/WEO/Issues/2019/07/18/WEOupdateJuly2019

D E P A R T M E N T O F M I N E R A L R E S O U R C E S A N D E N E R G Y24
Figure 2: World trade, industrial production and the manufacturing PMI
Trade Industrial production Manufacturing PMISource: IDC, compiled using CPB and Bloomberg data Last data point is August 2019
Perc
enta
ge/In
dex
poin
t
2013 2014 2015 2016 2017 2018 2019
6.0
5.0
4.0
3.0
2.0
1.0
0.0
-1.0
-2.0
Notes: Trade and industrial production: 3-month moving average % change (y-o-y)
Manufacturing PMI: Index point deviation from 50-point mark
Figure 3: Manufacturing PMIs for select countries/region
USA UK Eurozone ChinaSource: IDC, compiled using Bloomberg data Last data point is October 2019
PMI:
devi
atio
n fo
rm 5
0-po
int m
ark
2013 2014 2015 2016 2017 2018 2019
12.0
10.0
8.0
6.0
4.0
2.0
0.0
-2.0
-4.0
-6.0
Notes: A reading above 0 indicates expansion in manufacturing output
A reading below 0 indicates a contraction in output
4.1.2 African context
Last year’s African Economic Outlook from the African Development Bank showed that the continent’s general economic performance continues to improve. Gross domestic product reached an estimated 3.5% in 2018, about the same as in 2017 and up from2.1%in2016.Africa’sGDPgrowthisprojectedtoaccelerateto4.0%in2019and4.1%in2020(Figure4).Thisgrowthisnotenoughtoaddresspersistentfiscalandcurrentaccountdeficitsandunsustainabledebt.Dependencyonafewexportcommoditiestospurgrowthand vulnerability to volatility in commodity prices have impeded most African economies from sustaining high growth. Countries must move to a higher growth path and increase the efficiencyofgrowthingeneratingdecentjobs.
Figure 4: Real GDP growth in Africa, 2020
10
8
6
4
2
0
-2
(projected) (projected)2013-14 2015 2016 2017 2018 2019 2020
(projected)
Africa
China
Emerging and developing countries including Africa
India
Source: African Development Bank statistics and International Monetary Fund.
Perc
ent
The 2019 Outlook shows that macroeconomic and employment outcomes are better when industry leads growth4. Key challenges faced by the African economy include:
• Unemployment and underemployment• Underinvestment in infrastructure• Fiscal crises• Political change• Climate change
4 African Development Bank – 2019 African Economic Outlook

A N N U A L P E R F O R M A N C E P L A N 2 0 2 0 / 2 1 25
4.1.3 South Africa
TheSouthAfricaneconomyfindsitselfunderrenewedpressure.Growthisestimatedtohave moderated in Q3 2019, based on preliminary data for several key economic variables. The output of the manufacturing and mining sectors has fallen, while retail trade sales are exhibiting modest growth. South African households remain under considerable strain, affected by high levels of indebtedness, an uncertain economic environment and poor employmentprospects.Consumer confidence fell sharply to -7points inQ32019, thelowest in nearly two years (Figures 5 and 6).
Figure 5: Contributors to negative growth in GDP in Q35
17/1 17/2 17/3 17/4 18/1 18/2 18/3 18/4 19/1 19/2 19/3
6
3
0
-3
-6
-0.3
-2.7-2.7
3.0
-0.5 -0.6
2.8 2.63.23.4
1.4
5 Statistics South Africa
6 IDC Economic Outlook 2019
Thedropinconsumersentimentwasmirroredbyasteepfallinconfidenceamongretailers,to the weakest level in 20 years. Ratings agencies have become increasingly concerned withSouthAfrica’sworseningfiscalmetricsandpoorgrowthperformance,aswellaswithenormous risks posed by Eskom. Although Moody’s kept the sovereign rating unchanged at Baa3 on 1 November 2019, it altered the outlook from “stable” to “negative”. The agency requiresmoreclarityonhowgovernmentplans toaddress thewideningbudgetdeficitand the steep rise in debt. S&P Global had already placed the sovereign rating two notches into sub-investment territory in November 2017 and issued a stark warning of a possible further downgrade at its ratings review meeting on 22 November 2019.6
Figure 6: South Africa’s annualised GDP growth in 2019
Jan 2017 Jul 2017 Jan 2018 Jul 2018 Jan 2019 Jul 2019
2
1.5
1
0.5
0
0.9
1.1
1.6 1.6
1.4
0.7
1.1
00.1 0.1
1.3
0.9
Source: www.tradingeconomics.com, Statistics South Africa

D E P A R T M E N T O F M I N E R A L R E S O U R C E S A N D E N E R G Y26
Figure 7: Lower output recorded by most manufacturing sub-sectors
Total manufactu
ring
Food and beverages
Textile
s and cl
othing
Wood, paper a
nd printin
g
Chemicals,
rubber a
nd plastics
Non-metallic
mineral p
roducts
Metals and m
achinery
Electrica
l mach
inery
TVs and ra
dios
Transport
equipment
Furnitu
re and other in
dustries
4
3
2
1
0
-1
-2
-3
-4
-5
-6
Growth in manufacturing output by sub-sector: Jan–Sep 2019%
Cha
nge
(y-o
-y)
Source: IDC, compiled using Stats SA data
Lower output from mining and manufacturing indicates the difficult operating and trading conditions facing these two sectors of the economy. Weak demand conditions domestically and increasingly challenging global markets, accompanied by higher costs of doing business (particularly due to electricity tariffs, among others) and, policy-related concerns, have been affecting their production activity.
Manufacturing output dropped by 3.8% in Q3 2019 (saar), implying a contraction of 0.2% (year-on-year) for the period January to September 2019. Figure 8: Mining output
Mining total
Other m
etallic m
inerals
Copper
Management
Nickel
PGMCoal
Other n
on-metallic
minerals
Building m
aterials
Iron ore
Chrome
Gold
40
30
20
10
0
-10
-20
Growth in mining output by sub-sector in 2019 (Jan–Sep)
% C
hang
e (y
-o-y
)
Source: IDC, compiled using Statistics South Africa data
Mining production fell by 1.7% (year-on-year) over the period January to September 2019, mainly due to sharply lower output in sub-sectors such as gold and iron ore mining. Excluding gold, the mining sector’s performance was slightly better at +0.5%. The poor performance of the mining sector has considerable implications for many supply and support industries across South Africa’s economy.

A N N U A L P E R F O R M A N C E P L A N 2 0 2 0 / 2 1 27
Operational challenges and financial constraints at Eskom, higher electricity tariffs anddeclining demand in a low-growth environment have affected the performance of the electricity sector. Key challenges facing the South African economy include:
• Insufficientemploymentcreation• Fiscal metrics worsened substantially• Eskom remains the single-largest risk factor• Sovereign ratings under considerable threat
The economic pressure on South Africa impairs the unemployment challenge as the economy is struggling to create enough employment. An estimated 519 000 people entering the labour market in the 12 months to Q3 2019, and 5 000 jobs having been lost onayear-on-yearbasis,theunemploymentraterosetoanewrecordhighof29.1%,with6.7millionpeopleunabletofindwork.
SouthAfrica’semploymentratecontinuestodrop,withStatsSA’slatestfiguresshowingtheemploymentrateat42.4%.Theofficialemploymentratehasbeenonasteadydeclineinthelastthreeyears.Theeconomy’slabourabsorptioncapacityisinsufficienttoaccommodateall new entrants into the labour market.
The structural challenges and subdued demand conditions domestically, along with a slowing global economy, are expected to weigh on South Africa’s economic performance in the shorttomediumterm.TheRealGDPisexpectedtoincreasebyonly0.6%in2019.TheIDC view is that the pace of growth is likely to remain modest over the next three years. SouthAfrica’sworseningfiscalmetricsandpoorgrowthperformanceareofmajorconcerngoingforward.TheenormousrisksposedbyEskomandwideningbudgetdeficitandthesteep rise in debt has increased the risk for further downgrade from ratings agencies.
Rising state borrowing costs have the potential to impact key infrastructure investment and negatively impact both domestic primary and secondary economic sector output. However, improvement inbusiness and investor confidence is emerging asevidenced
by the commitments made by local and foreign entities at the second South Africa Investment Conference hosted by President Cyril Ramaphosa on 6 November 2019. Investment pledges of R371 billion were made, with potential to create 412 000 direct employmentopportunitiesover thenextfiveyears invariouseconomic sectors.ThePresident reiterated government’s commitment to address key structural impediments to growth, and to create a more investor- and business-friendly economic environment. AsummaryofperformanceisreflectedinFigure9.
Figure 9: Summary of South Africa’s economic overview 7
SA economic growth:
+ 0.6% in 2019+ 1.3 in 2020
(IDC forecasts)
Investment pledges at South African Investment
Conference 2019:
R371 billion
Fiscal metrics (% of
GDP by 2022/23):
Budget deficit: 5.9%Gross loan debt of
government: 71.3%
(National Treasury)
4.2 Mining industry analysis
Themining andmetals industry is recovering from one of itsmost difficult periods indecades. Market volatility and a downturn in commodity prices have created a new norm wherecostcuts,automationandoperationalefficienciesarevitallyimportant.Theanalysisexamines the Global, African, Sub-Saharan/SADC and South African contexts, to provide a holistic picture of the challenges that are linked to the mining industry.
4.2.1 Global context
The World Economic Forum states that the mining industry has been facing a number of sector-specificissuesrelatedtoregulation,geopoliticalrisk,legallimitsonnaturalresource
7 Source: IDC Economic Overview, November 2019

D E P A R T M E N T O F M I N E R A L R E S O U R C E S A N D E N E R G Y28
use, shareholder activism and public scrutiny which has created additional challenges8. There are several trends that will determine which types of mining companies will prevail in the future. The World Economic Forum highlighted the following trends which would shape the mining and metals sector in future:
1. Transition from a high to a low-carbon economy – Countries must decarbonise their energy systems by the middle of this century. The transition from a fossil fuel-based energy system to low emission energy provides a great opportunity for the mining sector.
2. Access to new resources – Automation and digitalisation will result in more targetedandefficientmining,whichcouldfurtherbeenhancedthroughtechnologicalbreakthroughs in areas such as in-situ teaching. Mining jurisdictions with higher perceived risks may see increasing levels of interest from investors.
3. New ways to finance mining – As mining companies try to limit risk, novel financingandproductionmodelswillbecomemorecommon.Alternativefinancingsolutions were developed such as royalty and metal stream agreements that reduce the burden on mining companies’ balance sheets. To spread the risk of new capital-intensiveprojects,thesefinancingsolutionsarelikelytocontinuetogrow.
4. A social contract for mining–Creatingrealbenefitsforcommunitiesnearminesites will be key for successful new projects. Obtaining the ‘license to operate’ from local communities has recently become challenging.
5. Big data and mining – Data transparency will aid the mining industry’s relations with stakeholders. Collecting and processing massive amounts of data will be essential for mining companies as they digitalise and automate their operations.
6. The geopolitics of mining – Mining companies must navigate rising geopolitical risk and economic protectionism. Popular resistance to globalisation and free trade is growing and altering politics, and directly affecting the mining and metals sector. Policymakers in mining jurisdictions are increasingly trying to enact local content laws and regulations which require minerals to be processed before they are exported.
7. Global exploration budget – The global exploration budget for nonferrous metalsrosetoanestimatedUS$10.1billionin2018,representing19%growthyear-on-yearcompared with US$8.5 billion in 2017 (Figure 10). While data shows that global drilling has increased, budgets are still off levels at the peak of the super cycle and are not evenly spread across regions or minerals. S&P Global expects some volatility to persist in the exploration in 2019 as uncertainty remains over the sustainability of economic growth between the U.S. and China (Figure 11). The industry, however, remains short of critical new discoveries and metalssuchascopperwillseewideningdeficitswithoutadditionalinvestmentinexplorationfor the mines of the future. As mentioned, transition to a low-carbon economy provides opportunities, for example, the solar industry will increase demand for aluminium, copper, lithium and cobalt multiple times in the next two decades due to the need for increased battery storage capability and capacity. Therefore, exploration activity and budgets will have to respond to this shift to enable supply to meet demand.
Non
ferr
ous
expl
orat
ion
budg
et (U
S$B)
Inde
xed
met
als
pric
e (1
996
= 1)
Figure 10: World exploration trends 2018 9
Global non-ferrous exploration budget Annual indexed metals price
24
21
18
15
12
9
6
3
0
4
3
2
1
0
19962002
20081998
20042010
20002006
20122015
20172018
19972003
20091999
20052011
20142001
20072013
2016
7 Source: IDC Economic Overview, November 2019
8 https://www.weforum.org/agenda/2019/03/seven-trends-shaping-the-future-of-the-mining-and-metals-sector/
9 S&P Global Market Intelligence

A N N U A L P E R F O R M A N C E P L A N 2 0 2 0 / 2 1 29
Figure 11: 2019 Annual exploration budgets by region (US$M)
Latin America
Australia
Rest of World
Canada
Africa
United States
Pacific/South East Asia
01200
2400400
16002800
8002000
2001400
2600600
18001000
2200
Data as at Oct. 9, 2019. Source: S&P Global Market Intelligence
9 S&P Global Market Intelligence
10 https://www.projectsiq.co.za/mining-in-africa.htm
11 2020 by S&P Global Market Intelligence, a division of S&P Global Inc.
4.2.2 African context
As mining companies revamp their employee base, they will need to maintain open dialogue. Constantly evolving technologies and business models will require mining employees to develop new skills and competencies. The sector will have to increasingly compete with the IT sector to attract top talent from universities who will need to drive its digitalisation and automation processes10.
4.2.2.1 Exploration in Africa
Figure 12: Annual budget trends
Data as at Oct. 9, 2019. Source: S&P Global Market Intelligence
According to the 2020 S&P Global Market Intelligence, “Africa posted the second-largest exploration budget decrease among the regions in 2019, as budget was cut by US$156 million year over year. The bulk of the budget reduction is in the allocations for late-stage and feasibility exploration, largely due to the progress of some major projects toward production”11 .
4K
3.5K
3K
2.5K
2K
1.5K
1K
0.5K
02010 2011 2012 2013 2014 2015 2016 2017 2018 2019
Expl
orat
ion
budg
et (U
S$M
)

D E P A R T M E N T O F M I N E R A L R E S O U R C E S A N D E N E R G Y30
4.2.3 South African context
South Africa has long been considered a regional and global mining powerhouse, with more than 90% of the platinum group metals (see below).South Africa has been engulfed by a series of political shocks and economic underperformance thathavetakenasignificanttollonitspositionasSouthern Africa’s leader in the extractives industry. Amid a backdrop of recession and allegations of corruption, South Africa faces the challenges associated with an aging mining sector. Some concerns exist around the pace of transformation in the mining and minerals industry. Government has published a new Mining Charter aimed at strengthening its effectiveness, while considering the realities facing the industry12. However, the South African mining industry remains critical to the economy of the country as demonstrated by statistics from the Minerals Council South Africa in the table and Figure 13.
12 Deloitte: 2018 Draft Mining Charter

A N N U A L P E R F O R M A N C E P L A N 2 0 2 0 / 2 1 31
South Africa’s contribution to world mineral resources: 2017–2018 Mining matters to South Africa
Commodity South Africa reserves
World reserves %Unit
Antimony (metal) 27 1 500 000 1.8kt
Chromium 200 000 500 000 40.0Mt
Gold(metal) 6 000 57 000 10.5t
Iron Ore 770 82 000 0.9Mt
Manganese (metal) 200 000 690 000 28.9kt
Nickel 3 700 78 000 4.7Mt
Platinum Group Metals 63 000 67 000 94.0t
Uranium (metal, up to $US80/kg U)
279 100 – 5.2t
Zirconium minerals (metals)
14 000 75 000 18.6kt
Source: Department of Mineral Resources and Energy, US Geological Survey
Direct contributionof mining to
GDP
Direct employment
created by mining
R350.8bn(7%)
456 000people
employed
Direct contribution
to fixedinvestment
Indirect employment
created by mining
R91.1bn(15% of total private sector investment)
For every job in mining at least
2 more jobs are created up
and downstream
Total primarymineral sales
Economic dependency
R498.7bn(66% exported
sales, 27% of SA’s total
exports)
Each mining employee supports 5-10
dependants
Royaltiespaid
Remune-ration to mining
employeesR7.6bn R134bn
Taxes paid
PAYE paid by employeesR22.0bn R21.0bn
Figure 13: Contribution of mining to the South African economy

D E P A R T M E N T O F M I N E R A L R E S O U R C E S A N D E N E R G Y32
Theminingsectorfellby1.7%(year-on-year)overtheperiod.Loweroutputinsub-sectorssuch as gold and iron ore mining were the main contributors. The mining sector’s poor performance has adverse implications along supply chains according to the IDC. Q4 2019 mining sector output is expected to remain negative due to load shedding and impact of iron and steel low capacity utilisation in Q4.
Mining companies do however accept that there is certain risk involved in the South African exploration and mining industry and accommodate this risk in their business decisions. According to the Mineral Council of South Africa, in 2017 South Africa accountedfor1%oftotalglobalexplorationexpenditurewith14%forCanada,14%forAustraliaand13%fortherestofAfrica(Figure11).
Without a stable framework within which exploration and mining companies can obtain prospecting and mining rights and the related environmental authorisations, and exercise those rightswithin an environment (which gives a senseof security that the significantinvestments required will be protected and will, for the duration of the right be certain) investors are extremely cautious when making investment decisions. The various challenges being faced by the South African exploration and mining industry are generally summarised into eight key challenges, namely13:
• Theglobalfinancialcrisisandtradetensionsandtheirimpactonglobaldemand• Infrastructure, ports, rails, water, roads and electricity• Labour uncertainty• Health and safety• Environmental compliance requirements• Illegal mining operations• Community activism
Figure 14: South Africa’s share of African exploration budgets 2000–2017
40
35
30
25
20
15
10
5
02000 2017
20.3%
8.3%
13 https://www.miningreview.com/industry-insight/challenges-faced-by-the-south-african-exploration-and-mining-industry/
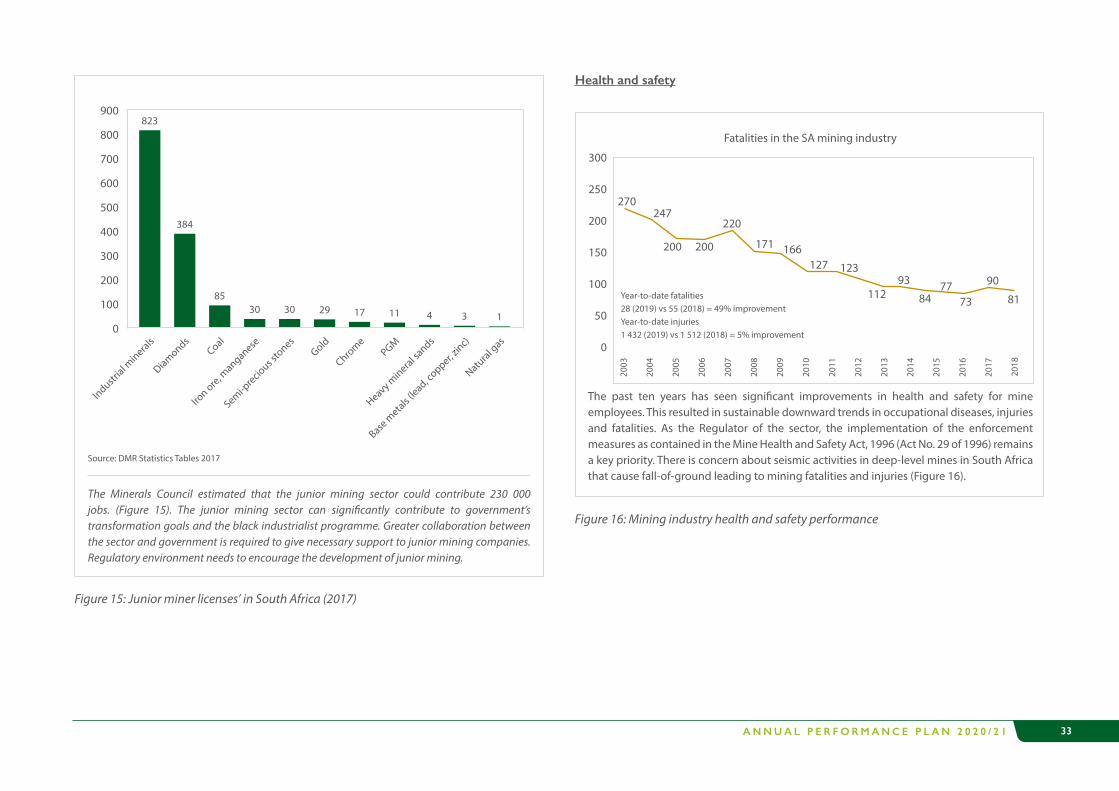
A N N U A L P E R F O R M A N C E P L A N 2 0 2 0 / 2 1 33
Health and safety
Figure 15: Junior miner licenses’ in South Africa (2017)
Industrial m
inerals
DiamondsCoal
Iron ore, m
anganese
Semi-precio
us sto
nesGold
Chrome
PGM
Heavy mineral sa
nds
Base m
etals (lead, c
opper, zinc)
Natural g
as
900
800
700
600
500
400
300
200
100
0
Source: DMR Statistics Tables 2017
The Minerals Council estimated that the junior mining sector could contribute 230 000 jobs. (Figure 15). The junior mining sector can significantly contribute to government’s transformation goals and the black industrialist programme. Greater collaboration between the sector and government is required to give necessary support to junior mining companies. Regulatory environment needs to encourage the development of junior mining.
823
384
8530 30 29 17 11 4 3 1
300
250
200
150
100
50
0
Year-to-date fatalities28 (2019) vs 55 (2018) = 49% improvementYear-to-date injuries1 432 (2019) vs 1 512 (2018) = 5% improvement
270247
200 200
220
171 166127 123
11293
8477
73
90
81
Figure 16: Mining industry health and safety performance
Fatalities in the SA mining industry
2003
2004
2005
2006
2007
2008
2009
2010
2011
2012
2013
2014
2015
2016
2017
2018
The past ten years has seen significant improvements in health and safety for mine employees. This resulted in sustainable downward trends in occupational diseases, injuries and fatalities. As the Regulator of the sector, the implementation of the enforcement measures as contained in the Mine Health and Safety Act, 1996 (Act No. 29 of 1996) remains a key priority. There is concern about seismic activities in deep-level mines in South Africa that cause fall-of-ground leading to mining fatalities and injuries (Figure 16).

D E P A R T M E N T O F M I N E R A L R E S O U R C E S A N D E N E R G Y34
4.3 Energy industry analysis
Issuesrelatingtoenergyareamongthemostimportantanddifficultchallengesconfrontingthe world today. Providing enough energy to meet the requirements of a growing world population with rising living standards will require major advances in energy supply and efficiency14. Doing this while mitigating the risks of climate disruption will be an even more challenging undertaking. It requires a significant shift in the historic patternof fossil-fueluse and a major transformation of the global energy system15. In developing countries, the choice of technology, policy, and economic levers that will be used to transform and expand their energy systems will have profound implications for their growth, international competitiveness, and economic security and prosperity16.
4.3.1 Global context
According to the World Energy Outlook (2019), there is a gap between expectations of fast, renewables-driven energy transitions and the reality of today’s energy systems in which reliance on fossil fuels remains stubbornly high. There is a gap between the calm in well supplied oil markets and the lingering unease over geopolitical tensions and uncertainties17.Thefivecategoriesofchallenges,asoutlinedbytheWorldEnergyCouncil(2019) are as follows: 1. Macroeconomic risks2. Geopolitics3. Business environment4. Energy vision5. Technology
14 Muhanji, S., Muzhikyan, A. and Farid, A.M., 2019. Long-term challenges for future electricity markets with distributed energy resources. In Smart Grid Control (pp. 59-81). Springer, Cham.
15 http://blogs.worldbank.org/developmenttalk/the-global-energy-challenge
16 Kuzemko, C., Lawrence, A. and Watson, M., 2019. New directions in the international political economy of energy. Review of International Political Economy, 26(1), pp.1-24.
17 World Energy Outlook-2019

A N N U A L P E R F O R M A N C E P L A N 2 0 2 0 / 2 1 35
Global energy sector trends
World electricity generation by fuel, technology and scenario (TWh)
Stated policies Sustainable development Change 2018–2040
2000 2018 2030 2040 2030 2040 STEPS SDS
Coal 5 995 10 123 10 408 10 431 5 504 2 428 307 -7 695Oil 1 207 808 622 490 355 197 -319 -611Natural gas 2 760 6 118 7 529 8 899 7 043 5 584 2 781 -534Nuclear 2 591 2 718 3 073 3 475 3 435 4 409 757 1 691Hydro 2 613 4 203 5 255 6 098 5 685 6 934 1 895 2 731Wind and solar PV 32 1 857 5 879 9 931 7 965 15 503 8 073 13 645Other renewables 217 739 1 344 2 020 1 785 3 628 1 281 2 889Total generation 15 436 26 603 34 140 41 373 31 800 38 713 14 770 12 100
Electricity demand 13 152 23 031 29 939 36 453 28 090 34 562 13 422 11 531
• Global electricity generation grows by around 55% (14 800 terawatt-hours [TWh]) between 2018 and 2040 in the Stated Policies Scenario.
• Growth is led by Asia: China alone constitutes 33% of growth followed by India at 20% and other developing countries in Asia at 13%.
• Wind and solar photovoltaics (PV) provide over half of additional power generation to 2040 in the Stated Policies Scenario; coal provides just 2% although this varies widely by region.
• The Sustainable Development Scenario sees an even more dramatic transformation. Low carbon technologies provide almost 85% of generation in 2040; 40% of generation comes from wind and solar PV.

D E P A R T M E N T O F M I N E R A L R E S O U R C E S A N D E N E R G Y36
Global Trends: Power Generation
• Electricitydemandgrowsby2.1%peryear,resultinginover13000terawatt-hours(TWh) more demand in 2040 than today (Figure 24).
• Falling costs and increasing competitiveness of solar PV push its installed capacity beyond all other technologies (IEA outlook to 2014).
• Developing economies account for almost 90% of demand growth; about 530million people gain access to electricity around the world by 2040, mainly in Africa and developing Asia.
• Nuclear power share decreases, but its output nevertheless rises in absolute terms, with growth in China and more than twenty other countries.
• Theshareoffossilfuelsinelectricitysupplyfallsbelow50%in2040.Coalremainsthe largest source of electricity, though its share of overall generation declines from 38%to25%.
• Gas-fired generation grows steadily, maintaining roughly its current share ofgeneration.
Global Trends: Oil and Gas
• In the Stated Policies Scenario, China soon overtakes the European Union and cements its position as the world’s largest net oil importer.
• India’s net oil import requirements more than double between 2018 and 2040 and itslevelofimportdependencyreachesroughly90%,oneoftheworld’shighest.
• The United States becomes a net oil exporter soon after 2020, thanks to the shale boom. However, the United States remains a major importer of oil given the configurationofitsrefineries.
• China overtook Japan to become largest gas-importing country in 2018. In the Stated Policies Scenario, its imports reach the level of those of the European Union by 2040.
• China’s net imports of coal peak in the next few years and decline substantially towards 2040. China is overtaken by India as the world’s largest coal importer in the mid-2020s (see following Table).
Figure 17: Global power capacity by source in the Stated Policies Scenario
3 500
3 000
2 500
2 000
1 500
1 000
500
0OilBattery storageOther renewables
Hydro
Nuclear
WindCoal
Natural gas
Solar PV
2000 2010 2020 2030 2040
South Africa’s share of African exploration budgets 2000-2017 (%)
GW
Historical Projections

A N N U A L P E R F O R M A N C E P L A N 2 0 2 0 / 2 1 37
Net import (Shaded) and export shares by fuel, Region and Scenario (%).
Oil Natural gas Coal Total
2018
2040
2018
2040
2018
2040
2018
2040
STEPS SDS STEPS SDS STEPS SDS STEPS SDS
North America 1 30 43 3 10 12 15 13 31 4 15 11 United States 20 17 39 2 13 14 14 10 17 3 10 7C & S America 11 30 11 5 10 11 44 20 51 21 24 18 Brazil 16 42 27 29 23 17 90 89 99 18 30 26Europe 76 76 70 55 67 61 49 61 72 42 40 34 European Union 87 91 89 76 90 85 49 66 72 50 47 39Africa 49 8 15 33 37 47 29 27 25 45 33 50
Middle East 77 70 73 20 21 23 74 88 76 61 51 47
Eurasia 71 64 55 34 40 39 45 53 42 49 47 34
Asia Pacific 78 86 87 26 43 42 1 5 2 17 27 30 China 70 83 85 43 57 57 6 3 0 18 27 34 India 83 92 92 49 59 74 29 27 38 18 35 38 Japan 100 99 99 74 98 97 99 100 100 87 67 55World 45 44 45 20 24 26 21 20 20 25 24 21

D E P A R T M E N T O F M I N E R A L R E S O U R C E S A N D E N E R G Y38
Global energy trends: Renewables
By 2018, most countries globally had some form of renewable energy targets in place, with more than 150 countries setting renewable energy targets. In addition, 45 countries had policies in place to support the use of biofuels. China’s National Energy Administration raised the country’s renewable portfolio standard (RPS) in 2019 to 35% of electricityconsumption by 2030. The European Union’s revised Renewables Energy Directive (2018/2001)establishedanewbinding2030renewableenergytargetofatleast32%.Forthe United States, the increase in renewable capacity in 2018 is as a result of onshore wind expansion. Elsewhere, renewable capacity expansion accelerated in countries in the Middle East,NorthAfricaandpartsofAsia, reflectingdecliningwindandsolarPVcosts, strongpolicy support and commitments made under the Paris Agreement (IEA, 2019c).
Global energy trends: Nuclear
• Nuclear reactors generated a total of 2 563 TWh of electricity in 2018, up from 2 502 TWh in 2017. This is the sixth consecutive year that nuclear generation has risen.
• In 2018 the peak total net capacity of nuclear power in operation reached 402 GWe, up from 394 GWe in 2017. The end of year capacity for 2018 was 397 GWe, up from 393 GWe in 2017.
• Improved operational performance saw the USA’s nuclear sector supply a record 808 TWh of clean, low-carbon electricity in 2018.
WorldUnited States
European UnionChinaIndia
WorldUnited States
European UnionChinaIndia
WorldUnited States
European UnionChinaIndia
10% 20% 30% 40% 50% 60% 70%
Tran
spor
tH
eat
prod
uctio
nEl
ectr
icity
gene
ratio
n
2018 Additional market share in 2040
Figure 18: Renewable energy – total primary energy demand by category and region
3 0002 5002 0001 5001 000
5000
West and Central Europe South America North America
East Europe and Russia Asia Africa
1970
1972
1974
1976
1978
1980
1982
1984
1986
1988
1990
1992
1994
1996
1998
2000
2002
2004
2006
2008
2010
2012
2014
2016
2018
Figure 19: Nuclear energy production across the globe
Source: World Nuclear Association and IAEA Power Reactor Information Service (PRIS)
TWh

A N N U A L P E R F O R M A N C E P L A N 2 0 2 0 / 2 1 39
4.3.2 African Context
TheAfrican continent becomes increasingly influential in shaping global energy trends,due to the growing urban populations, and energy demand (Figure 4). According to Africa Energy Outlook (2019) there is a rapid growth in energy demand for industrial production, cooling and mobility18. Energy demand in Africa grows twice as fast as the global average. Withthegrowingappetiteformodernandefficientenergysources,Africaemergesasamajor force in global oil and gas markets19. A critical task for policy makers is to address the persistent lack of access to electricity, and unreliability of electricity supply.
Thesechallengesnegativelyimpactthecontinent’sdevelopment.Anestimated80%ofsub-Saharan African companies suffered frequent electricity disruptions leading to economic losses. Rising electricity needs, especially in sub-Saharan Africa, require a major expansion of the power system. Africa has the richest solar resources in the world but has installed only5gigawatts(GW)ofsolarPV,lessthan1%oftheglobalinstalledcapacity20. Key energy challenges in Africa are:
• Governance and policy frameworks• Infrastructure and investment• Demographics and urbanisation• Economic growth and industrialisation• Affordability of energy prices and fossil fuel subsidies
Energy sector trends
• +127%growthinAfricanenergyconsumption• 6%Shareofglobalenergyconsumptionin2040• +54%growthinAfricanenergyproduction• 7%shareofglobalenergyproductionin2040
• TheshareofrenewablesintheAfricanfuelmixgrowsfrom1%todayto16%by2040
• Electricity demand increases with renewables becoming the largest source of power generation by 2040
• Africanenergyproductionasashareofconsumptiondeclinesfrom176%in2017to119%by2040(seeFigure20).
Developing countries, led by Asia, are the main engines of global growth, with India where demand doubles, being the single largest source of demand growth. China remains the world’s largest energy consumer. In this scenario energy demand rises rapidly in the Middle East, where per capita consumption is already high currently, spurred in part by increased demand for cooling and desalination (Figure 21). Rising incomes and population growth underpin strong growth in Africa.
400
300
200
100
0
Figure 20: Final consumption by fuel, sector SSA (excl. SA)
2018 2040 2040 2018 2040 2040 2018 2040 2040
Fossil fuels Electricity Bioenergy
STEPS AC STEPS AC STEPS AC
Residential Transport Productive uses
Higher GDP and access Efficiency gains Access and efficiency
Mto
e
Final consumption
Demand changes
18 Africa Energy Outlook 2019
19 https://www.iea.org/reports/africa-energy-outlook-2019 20 https://www.iea.org/reports/africa-energy-outlook-2019

D E P A R T M E N T O F M I N E R A L R E S O U R C E S A N D E N E R G Y40
African oil and gas trends
Faster economic growth in developing economies is accompanied almost everywhere by rising demand for all fuels and technologies.
1000
500
0
-500
Figure 21: Change in energy demand and average annual GDP growth rate by region in the Stated Policies Scenario, 2018-2040
Mto
e
China IndiaIndia Africa MiddleEast
SoutheastAsia
Japan UnitedStates
EuropeanUnion
Coal Oil Gas Low-carbon source GDP CAAGR (right axis)
70
60
50
40
30
20
10
0
0 2 4 6 8 10 12 14
Natural gas production
Nat
ural
gas
dem
and
2018
(bcm
)
Resource discovery 2011–19 (tcm)
Algeria Egypt50 bcm
Senegal andMauritania
Cộted’Ivoire Tanzania
South Africa
Ghana
Nigeria
Figure 22: Natural gas resource discoveries, demand and production in selected countries in Africa
Mozambique
t
With the exception of Egypt, recent gas discoveries in Africa have been in countries with very small gas markets. Following their recent major gas discoveries, Mozambique and Tanzania are at the forefront of this group, but it also includes Senegal and Mauritania (Figure 22). For these countries the first task is to turn discoveries into viable and successful commercial projects.

A N N U A L P E R F O R M A N C E P L A N 2 0 2 0 / 2 1 41
4.3.3 South Africa
CoalisSouthAfrica’skeyenergysource,representingover90%ofelectricitygeneration.A portion of coal goes to the Coal to Liquid (CTL) industry to supply liquid fuels. The country’sliquidfuelneedsaremetbyimportsofcrudeoilforlocalrefiningcapacityandimports of oil-based fuels. Natural gas is very limited in the energy mix with PetroSA’s gas deposit used to produce liquid fuels for the country via its Gas to Liquid (GTL) plant. The other gas source is imports from Mozambique and LNG imports. The Independent Power Producer Programme (IPPP) is responsible for the country’s renewable energy source, with nuclear energy coming from Koeberg in the Western Cape (Figure 23).
4.4 External environmental analysis
Environmental change is fundamentally driven by both population dynamics and economic development, and associated human activities such as agriculture, energy consumption and mining amongst others exert pressure on the Earth21. It is important to understand the relationship between the drivers and pressures that impact the environment. Environmental changes bring complex challenges that threaten multiple sectors of the economy, human livelihood and the integrity of natural capital. It is important to be aware of the problems associated with these changes such as the scale and frequency of natural disasters, warming and cooling periods, different types of weather patterns, etc.22. All stakeholders must be aware of the types of environmental problems the planet faces, the implications for the economy and potential mitigation measures. The analysis examines the Global, African, sub-Saharan/SADC and South African contexts, to provide a holistic view of challenges linked to the natural environment.
4.4.1 Global context
Globally, environmental risks continue to dominate, according to the annual Global Risks Perception Survey (GRPS) undertaken by the World Economic Forum. Currently (2020) theserisksaccountforthreeofthetopfiverisksbylikelihoodandfourbyimpact.Globally,people are much more concerned about “extreme weather” as a risk. Survey respondents are largely concerned with environmental policy failure. The ability to minimise our carbon footprint is becoming a major concern especially because of the number of extreme weather incidences such as severe draughts and flooding.The top three environmentalrisks are listed below23:
1. Climate Change/Global warming – Global warming leads to rising temperatures of the oceans and the Earth’s surface causing melting of polar ice caps, rising sea
Figure 23: South African primary energy mix
Coal Oil Natural gas Nuclear Renewables
21 Scoville-Simonds, M., Jamali, H. and Hufty, M., 2020. The Hazards of Mainstreaming: Climate change adaptation politics in three dimensions. World Development, 125, p.104683.
22 Lo, A.Y., Liu, S., Cheung, L.T. and Chan, F.K., 2020. Contested Transformations: Sustainable Economic Development and Capacity for Adapting to Climate Change. Annals of the American Association of Geographers,
110(1), pp.223-241.
23 World Economic Forum- Global Risks Report 2020

D E P A R T M E N T O F M I N E R A L R E S O U R C E S A N D E N E R G Y42
levelsandunnaturalpatternsofprecipitationsuchasflashfloods,excessivesnowordesertification.
2. Pollution – Air, water and soil pollution require millions of years to recuperate. Industry and motor vehicle exhaust fumes are the main pollutants. Heavy metals, nitrates and plastic are toxins responsible for pollution.
3. Biodiversity loss – Climate change is intensifying biodiversity loss and the causality goes both ways where many oceans and forests are important for absorbing carbon emissions. Increasingly, fragile ecosystems create risks to societal and economic stability. For example, 200 million people depend on coastal mangrove ecosystems to protect their livelihoods and food security, these are vulnerable because of storm surges and rising sea levels.
The above-listed challenges are amongst the leading environmental challenges that are linked to the mining and energy sectors globally and locally. The world is very far from the emissionsreductionsnecessarytoachievethegoalsoftheParisAgreement.Efficiencygainsand deployment of cleaner energy sources have not kept pace with rising energy demand according to the IEA Global Energy Report.
4.4.2 African context The African continent has a growing population, rich natural capital and weak institutions. As a result the continent suffers from some serious environmental challenges, including climate change, deforestation,water pollution, coalmining, nuclearwaste, overfishingand industrial agriculture etc.24 Africafacessignificantchallengeswithregardstoaccessto electricity and clean cooking for all, leading to unsustainable harvesting of fuelwood. A transitionawayfromtheinefficientcombustionofbiomassforcookingonthecontinentneeds to be achieved. In 2015, the Heads of State and Governments of the African Union adopted Agenda 2063. It sets out a vision for “an integrated, prosperous and peaceful Africa, driven by its own citizens and representing a dynamic force in the international arena” and is closely linked to the United Nations Sustainable Development Goals.
African governments face several challenges in implementing environmental protection mechanisms. Africa’s development challenges are rooted in past policies and strategies. Heavy dependence on natural resources led to resource depletion and environmental degradation and worsened the exposure of weaker economies to external shocks, thereby increasing poverty and reversing social development25. It has to be stated though, that Africa has been a minor contributor to global greenhouse gas emissions, and this remains the case to date. According to the IEA energy-related carbon dioxide (CO2) emissions inAfricarepresentedaround2%ofcumulativeglobalemissions.ButAfricaisinthefrontline when it comes to the effects of a changing climate. Africa’s ecosystems already suffer disproportionately from climate change and the associated risks to food, health and economic security. All African countries agreed to the Paris Agreement and, through their Nationally Determined Contributions (NDCs), they committed to contribute to the global effort to mitigate GHG emissions (IPCC, 2019).
4.4.3 South Africa
The South African economy depends greatly on the growth and development of its extractivemining sector.Asmentioned, currently anestimated93%ofSouthAfrica’selectricity comes from coal. South Africa is a water scarce country, yet every step in the chain of using coal to produce electricity pollutes and consumes vast amounts of water. Together with coal mining, burning coal for electricity generation has several serious implications for both water quantity and quality. The over-reliance on coal contributes enormously towards greenhouse emissions. The mining industry plays a vital role in South Africa’s growth and development. But if mining is not strategically planned and carefully implemented, ithassignificantnegativeimpactonbiodiversityandecosystems,onthecatchments, rivers and wetlands that deliver water-related services to people.
24 Nalule, V.R., 2020. Mining and the Law in Africa: Exploring the social and environmental impacts. Springer Nature.
25 Simon,C.A.,2020.Alternativeenergy:political,economic,andsocialfeasibility.Rowman&LittlefieldPublishers.

A N N U A L P E R F O R M A N C E P L A N 2 0 2 0 / 2 1 43
4.5 Internal environment analysis
4.5.1 Organisational structure
The Department of Mineral Resources and Energy (DMRE) was established in May 2019 when the Department of Mineral Resources and the Department of Energy merged. The intention was to better equip and capacitate the DMRE to respond to the strategic objectives derived from the NDP, as they relate to the regulation and transformation of the energy and mining sectors in the following regard:
• Provisioning of secure, sustainable and affordable energy• The promotion and regulation of minerals and mining
These objectives are aligned to develop a mineral resources and energy sector that promotes economic growth and development, social equity and environmental sustainability.
Furthermore, the intention was to align the integrated mandate of the DMRE with the strategicprioritiesidentifiedintheMTSF.ThestructureisdepictedinFigure24.
Branch:Minerals and
Petroleum Regulation
Branch:Mining, Minerals
and Energy Policy Development
Branch:Mine Health and
Safety Inspectorate
Chief Directorate: Audit Services
Chief Directorate: Office of the Director-General
Chief Directorate: Financial Management Services
Branch:Programmes and
Projects
Branch:Nuclear
Directorate:Risk and Integrity Management
Chief Directorate:Strategy, Monitoring and Evaluation
Office of the Director-General
Branch:Corporate Services
Figure 24: DMRE organisational structure

D E P A R T M E N T O F M I N E R A L R E S O U R C E S A N D E N E R G Y44
The purpose of the realigned structure of the DMRE is to ensure the optimal utilisation and safe exploitation of mineral and energy resources through the execution of the following functions:
• Regulate the petroleum, mining and minerals industry• Formulate, maintain and implement integrated Minerals and Energy policies to
promote and encourage investment into the mining and energy industry• Ensure the health and safety of employees in the mines• Manage, co-ordinate and monitor programmes and projects focused on access to
minerals and energy resources• Manage and regulate the nuclear industry to promote nuclear energy as an
important electricity supply option through the establishment of a national industrial capability for the design, manufacture and construction of nuclear energy systems
• Ensure the Corporate Services function is performed• Provide internal audit services• Ensure the implementation of risk and integrity management strategies and
compliance with Acts and policies• Co-ordinate the development of strategic management, monitoring and evaluation
services• Ensuresoundfinancialmanagement
The realignment of the structure has, among others, ensured that previous challenges relating to reporting and lines of accountability are suitably addressed. The approved organisational structure was implemented in a phased approach due to financialconstraints within the DMRE’s MTEF allocations. As a result, the DMRE has continued to exploreandembarkonvariousinterventionstoimprovetheefficiencyandeffectivenessof the organisation within the baseline allocations and has creatively and innovatively implemented key aspects of an approved Integrated Human Resources Plan which will improve its human resources (HR) capacity and capabilities.
The following table summarises the six depar tmental programmes and overall structure of the organisation, respectively.
Programme Programme purposeAdministration Provide strategic support and management
services to the Ministry and the DMRE Minerals and Petroleum Regulation Regulate the mining, minerals and petroleum
industryMining, Mineral and Energy Policy Development
Provide policy and legislative frameworks for mining, minerals and energy sectors
Mine Health and Safety Inspectorate Ensure health and safety of employees in the mines
Programme and Projects Management Manage, coordinate and monitor programmes and projects focused on access to mineral and energy resources
Nuclear Energy Manage the South African nuclear energy in-dustry and control nuclear material in terms of international obligations, nuclear legislation and policies to ensure the peaceful use of nuclear energy
4.5.1.1 DMRE performance overview
4.5.1.1.1 Minerals and Petroleum Regulation Branch
The DMRE, through the Minerals and Petroleum Regulation Branch, will continue to improve service delivery in the adjudication of licences and permits, in line with the Mineral and Petroleum Resources Development Act (MPRDA) and Petroleum Products Amendment Act (PPA).
Most targets relating to the branch were achieved, except for the number of jobs created through mining. This is due to the mining sector’s performance. The target of adherence to

A N N U A L P E R F O R M A N C E P L A N 2 0 2 0 / 2 1 45
prescribed turnaround times was not met. This resulted from misalignments between the MPRDAandNEMA,intermsofnumberofdaysdefinedinbothpiecesoflegislation.
Sixty percent of the petroleum annual targets were achieved. During the year, the branch implemented or completed several projects, including the Social and Labour Plan (SLP) development projects across the country. The DMRE’s regulatory activities saw the implementation of an additional 108 SLP development projects.
Engagements with communities continue in the branch’s endeavours to create stability within themining industry.Theconflictsbetweencommunities living inminingareasaresymptomatic of communication limitations that exist between all concerned.
The DMRE has since established the directorate Mine Communities and Stakeholder Engagement to enhance and improve collaborations between mines, communities and othergovernmentinstitutions.Inaddition,thebranchfinalisedastakeholderengagementframework to assist companies in managing their stakeholder relations, especially in communities where they are mining.
The planned target for fuel samples (1 080) was fully achieved. The branch conducted a total of 1 590 compliance inspections on retail sites, which exceeded the target by 90 compliance inspections.
There were delays in the completion of sector codes and a petroleum sector retail audit, duetoinsufficientdata.Ofthelicencesissuedtoentities,89.18%containedatleast50%ownership and control by historically disadvantaged South Africans (HDSA).
Enforcement and Compliance: The Illegal mining and illicit petroleum trades continue tobechallenges,deprivingSouthAfricansoftheirbenefitsandimpactingnegativelyonthegrowth of the country. The branch continues to work closely with the relevant stakeholders, including law enforcement agencies, to stem these trades. This process will raise compliance levels in all aspects of regulation.
Special presidential package: The branch will continue with the revitalisation of mining towns and labour-sending areas, including a government programme aimed at reviving mining towns. A revised plan for improving mining towns requires partnerships between government and mining companies, which must focus on the delivery of human settlements, and better alignment of SLPs with the Integrated Development Plans (IDP) of municipalities. Collaborative efforts with mining companies and municipalities can improve the lives of communities.
4.5.1.1.2 Mining, Minerals and Energy Policy Development Branch
The President’s investment drive, with a target of R1,2 trillion, is beginning to bear fruit, however, there has been a lack of investment in infrastructure and exploration activities, in boththeminingandpetroleumsectors.Toalleviatepressureonthefiscusandstimulateeconomic growth and development, government needs to utilise the private sector for infrastructure development.
TheminingandenergyregulatoryoutlookhasimprovedfollowingthefinalisationoftheMining Charter and the withdrawal of the MPRD Bill from Parliament. This has provided much-needed policy certainty to the mining industry. The promulgation of the Integrated Resource Plan (IRP) has been well received by stakeholders. The regulatory framework for the DMRE continues to be strengthened with current work on amending both the energy and mineral legislative instruments.
Transformationandmineralbeneficiationarenotatthedesirednorexpectedlevels.SouthAfricacontinuestoexportmineralsandbeneficiationremainsataminimum.Thereexistsanopportunitytodevelopinternalvaluechainsforbettereconomicbenefits.Thiscanhelpmitigate a serious challenge where the economy has been shedding jobs. Unemployment must be curbed as it is intensifying the unacceptable practice of illegal mining.
The energy availability factor is a clear and present challenge. Eskom remains the sole provider of electricity and prices are relatively high in terms of affordability. Load shedding presents a challenge with regards to reliability and security of supply. These factors are

D E P A R T M E N T O F M I N E R A L R E S O U R C E S A N D E N E R G Y46
crippling the economy. Unmaintained distribution assets, the operation and maintenance ofEskom,andthereliabilityofpowerstationsareanotherconcern,but theclarificationand review of the Electricity Pricing Policy (EPP) will provide direction for Eskom and the National Energy Regulator of South Africa (NERSA).
The energy industry’s transition from coal to low carbon energy technologies will negatively affect the coal industry soon. That is, unless technology is developed to mine coal in an environmentally friendly manner, offsetting the negative emission from its production. Renewable energy provides both opportunities and threats to the mining industry. Other than its threat to the coal industry, the emergence of electric vehicles will reduce demand for platinum, which is used for catalytic convertors in combustion engines.
The demand for battery minerals such as lithium, cobalt, platinum, vanadium and copper are opportunities. The manufactured batteries will power greener economies and transportation, presenting unparalleled opportunities for both local and international investors in the platinum and battery mineral commodities. These opportunities must be managed to ensure the sustainability of the mining industry. It is key to move from a raw export economy to a processing economy.
Gas is another source of available energy, but there are no readily available gas resources or infrastructure. A review of the Gas Act is needed for inclusion of new technology and new modes for transportation. Furthermore, there is a need to strengthen bilateral engagements with SADC countries that are endowed with gas, such as Mozambique and Tanzania.
4.5.1.1.3 Mine Health and Safety Inspectorate (MHSI)
Mining disasters have decreased over the past decade. A mining disaster is an incident wherefiveormorepeoplehavedied.Adownwardtrendisalsoreflectedinthetotalnumber of occupational diseases and the overall fatality frequency rate, though platinum-related fatalities are up from a low in 2016.
South Africa has improved its safety level when compared to its international peers, includingCanadaandtheUSA.SouthAfrica’sfatalityratesimprovedby75%,whileAustralia
improved by 67% and the USA by 50%. Canada achieved 100%.These markets haveconsiderably less-complicated mining sectors than South Africa, which has some of the world’s deepest mines.
SouthAfrica’s coal fatality rate improvedby78%, andminingdisasters reportedby thesectorhavedroppedfrom2018.Thoughplatinumrecordeda67%jumpinfatalities(from12 to20), gold (-55%), coal (-22%)andotherminingactivities (-37%)all reduced theirfatalities. There is great concern over the safety of women in the industry as more women have entered mining. Injuries - which include security issues - are up sharply to 187 in 2018 from 58 in 2010.
The inspectorate has been looking at practices in markets such as Australia and the United States since it aims to achieve a zero-harm goal.
4.5.1.1.4 Programmes and Projects Branch
Integrated National Electrification Programme (INEP): The DMRE, through the Integrated National Electrification Programme (INEP), continues to fund theelectrification of previously disadvantaged and farm dweller households. StatsSA hasidentified2.2millionSouthAfricanhouseholdsasbeingwithoutelectricity.ThemajorityoftheseareinKwaZulu-NatalandtheEasternCape.Mosthouseholdstobeelectrifiedare in deep rural areas within 44 priority districts. There is a need to build more bulk infrastructure in these areas to effect household connections. Where households are far from the national grid, these households will continue to be connected using solar home system technologies.
Theelectrificationprogramme is playing an important role in threeof the seven keypriority areas of government, which include infrastructure development; speeding up economic growth; and transforming the economy to create decent work and sustainable livelihoods.
The INEP in partnership with implementing agencies (municipalities and Eskom), has made remarkable progress in increasing access to electricity in South Africa. Access to electricity

A N N U A L P E R F O R M A N C E P L A N 2 0 2 0 / 2 1 47
in1994was less than35%.Since1994, INEPhasmade itpossible toelectrifyover7.6million households through grid technology and over 170 000 installations of solar home systems (non-grid technology) as at the end of March 2019.
In the last Medium-Term Strategic Framework (2014–2019) the programme achieved 1 285 178 grid connections and over 85 993 non-grid connections against a target of 1 250 000 and 105 000 respectively. In the coming MTSF the DMRE has a target of 1000000householdstobeelectrifiedwithgridand75000householdsusingsolarhomesystem technology.
Lack of skills and resources in municipalities’ technical departments to plan and manage largeelectrificationprojectsremainsachallengethatINEPisfacing.Intheyear2020/21the DMRE will continue to work closely with the Municipal Infrastructure Support Agent (MISA) to make sure that municipalities are capacitated and able to roll out electrificationprojects.IntegratedplanningwiththeDepartmentofHumanSettlementswill also improve collaborative planning as part of the District Model Approach (DMA) announced by the President.
4.5.1.1.5 Nuclear Branch
Nuclear in Africa: According to data from the International Atomic Energy Agency (IAEA), global energy produced by nuclear stands at 396 GW, but only 2 GW is produced in Africa, all of it in South Africa. Egypt is developing 5 GW capacity and there are projects of unreported sizes in Kenya, Ghana and Nigeria. By 2050, global supply from nuclear could be as high as 750 GW, of which Africa could contribute 15 GW.
Nuclear and Greenhouse gasses: Nuclear is rated as a clean energy and part of reducing greenhouse emissions. The International Panel on Climate Change (IPCC) reports that in terms of grams of CO2 per kWh, nuclear only produces 12 - lower than coal (820), natural gas (490), solar (27) or hydropower (24).
Nuclear can help meet COP 21 (Paris Agreement on Climate Change) requirements. France is operating 58 Nuclear Power Plants (NPPs) and is already in compliance with
the Paris Agreement. An increased share of nuclear in the energy mix will reduce carbon emissionssignificantly.
Small Modular Reactors: There is a move towards developing Small Modular Reactors (SMRs). Unlike traditional nuclear plants of 1 000 MW+, SMRs are less than 300 MW and can be shop-manufactured for site assembly. They can be combined in one plant (>6 units) to give higher power in a modular manner and offer a lower plant capital investmentcostperunit.SMRsareflexible,bothindeploymentandloadfollowing,whichis suited for remote deployment in Africa. They also have lower grid requirements, which are better suited for African countries with small grids.
Currently there are more than 50 SMR designs under development, yet only three are being realised.Argentina’s25MWCAREM,an integral lightwaterreactor, is70%constructed.China’s 210 MW HTR-PM, a high temperature gas cooled reactor, is in the commissioning stage, andRussia’s 70MWKLT40s, a floating reactor, is being tested and towed. SouthAfrica was once a world leader in SMR - namely the Pebble Bed Modular Reactor (PBMR) or Advanced High-Temperature Reactor (AHTR). Best case delivery of SMRs (Vendor Promise) is 2025. Expected delivery for commercial availability of SMRs is post-2030.
Research Reactors: Research Reactors (RRs) are used for science, engineering, medicine, palaeontology, and numerous other applications. South Africa has the SAFARI-1 Research Reactor, placing it among the largest producers of radioisotopes in the world, including the Netherlands, Belgium, Poland, and Australia.
SouthAfricahasastrategiccapabilityinthefieldofResearchReactorIsotopeProductionand Nuclear Medicine (Steve Biko Academic Hospital). At least ten other countries are consideringnewRRs;bothZambiaandNigeriaalreadyhavefirmplansfornewRRs.
The demand for radioisotopes and other applications is increasing. Demand currently outstrips supply, which RRs can respond to. RRs are essential building blocks for a nuclearsector,includingtraininganddevelopment,andscientificresearch.Therefore,areplacement for the SAFARI-1 Research Reactor, which has been in operation for more than 50 years, will be built.

D E P A R T M E N T O F M I N E R A L R E S O U R C E S A N D E N E R G Y48
A Ministerial Task Team has been established for the development of a Multipurpose Reactor for replacement of the SAFARI-1 Research Reactor.
Nuclear Decommissioning: Currently there is a policy gap in the national framework regarding decommissioning of nuclear facilities. One of the International Atomic Energy Agency’s Integrated Regulatory Review Service (IRRS) Mission recommendations is the need for government to develop and approve a national policy for decommissioning of nuclear facilities. The development of the national nuclear decommissioning policy will strengthen the legislative framework and will clarify the policy requirements to be implemented when nuclear facilities in South Africa are decommissioned. The DMRE has initiated work on the development of the Nuclear Decommissioning Policy.
Nuclear Waste: It is very important for South Africa to demonstrate sustainable nuclear waste management. Solutions for management of spent nuclear fuel vary. South Africa’s approach is currently to use onsite wet storage, as well as a Transient Interim Storage Facility. The National Radioactive Waste Disposal Institute has been designated to establish a Central Interim Storage Facility. Development work has commenced and is expected to be operational in 2025 while a Deep Geological Repository is planned for 2065.
4.6 Corporate Support
Corporate Services currently reflects a branch in transition as the DMRE changes.Its start-up organisational structure needs further unpacking as functions might have changed.
Employees have not been placed in the new structure, since there is no clarity yet on the resources and budget that will be available to plan around this area. Nonetheless, the branch’s strategic planning process will provide a basis for further planning.
The National Macro Organisation of Government (NMOG) process must be concluded before normal recruitment resumes, and a skills audit of the DMRE is required. National Legislation and prescripts are in place to guide policy and processes, but data analysis can only be done once all employees have been placed.
The opportunity is, in the absence of the strategic planning process being concluded, to plan for the effective establishment of theDMRE. Interventions include the fillingof vacancies, training and development, multi-skilling of human resources and change management.
The DMRE will embark on a review of the structure in partnership with the DPSA and do an in-depth analysis of the structure to ensure re-alignment thereof with the mandate and strategic priorities of the DMRE. It is envisaged that this priority process will form the foundationofHRprocessestofollowduringthenextfiveyears.

A N N U A L P E R F O R M A N C E P L A N 2 0 2 0 / 2 1 49

2020/21
50
Part CMeasuring
Performance

Access to new markets and investment
promotion
Economic transformation and job creation Transformed, diversified and sustainable minerals and energy sector contributing to economic growth
Econ
omic
Descent jobs created & sustained
Infrastructure and energy supply
Financial capital and governance
Industry
Human capital and transformation
Policy, research, technology and innovation
Integrated service deliveryRegulatory, operational, service delivery and health and safety processes
Trade and investment
Information capital
Significant energy security and sustained economic
benefits
Security of supply and diversify liquid fuels
Mobilise funding for strategic programmes and ensure
financial sustainability of DMRE SOEs
Increased investment in mineral and petroleum sector,
onshore and offshore
Provide the full portfolio of IT applications required in support of the DMRE value
chain
Accelerated inclusive growth A just transition to a low
carbon economy
Increased infrastructure investment by both public and private sectors
Unlock South Africa’s high potential mineral and energy resources
Attract , recruit, retain and develop modern DMRE workforce ready to tackle challenges associated with the evolving and
dynamic mining and energy sectors
Increase in South Africa’s share of the Global exploration budget
Industrialisation, localisation and export growth
Improved access to basic services and
affordable energy prices
Diversify energy sources through implementing
IRP2019
Strengthen governance of DMRE service delivery
institutions
Diversify supply of mineral resources in support of both mining and energy sectors
Promote culture of change and employee empowerment
Ensure sufficient and relevant skills in the mining and
energy sector
Facilitate development, strengthen trade and investment links with key economies (BRICS,
SADC, AU, EU)
A stable framework within which exploration and mining companies can obtain prospecting
and mining rights and the related environmental
authorisations
Increase in South Africa’s share of the global minerals
and energy market
Modernise IT infrastructure in support of AI and Big Data in
mining and energy | reliable and accurate mining, energy
and economic data
Stak
ehol
der
Pers
pect
ive
Polic
y, R
egul
ator
y an
d In
tern
al P
roce
sses
Pe
rspe
ctiv
e
Reso
urci
ng a
nd
Gov
erna
nce
Pers
pect
ive
MTSF Priority 1 MTSF Priority 2,4,5,6,7 MTSF Priority 2 MTSF Priority 2
A leader in the transformation of South Africa through economic growth and sustainable development in the mining and energy sectorsVISION
To regulate, transform and promote the minerals and energy sectors, providing sustainable and affordable energy for growth and development, and ensuring that all South Africans derive sustainable benefit from the country’s mineral wealth at 30% of the energy mix by 2025.MISSION
Increased transformation, economic inclusion, and policy
and regulatory certainty
Develop ethical leadership capability and accountability at
all levels
Evidence-based policy making that advances
inclusive economic growth and socio-economic welfare
Inclusive, equitable and competitive exploration
Improved regulatory oversight, collaboration and optimisation synergies and skill sets (Joint projects and
programmes)
Improved and streamlined regulatory, service delivery,
operational, health and safety processes and collaboration
across regulators and relevant role-players
Exploration
Figure 25: DMRE balanced scorecard
A N N U A L P E R F O R M A N C E P L A N 2 0 2 0 / 2 1 51

D E P A R T M E N T O F M I N E R A L R E S O U R C E S A N D E N E R G Y52
The Balanced Scorecard mapped for the DMRE is illustrated in Figure 25 preceding and articulates the strategic priorities of the DMRE in relation to the MTSF. The existence of the DMRE is premised on its vision of becoming a leader in the transformation of South Africa’s economic growth agenda through the sustainable development of the mining and energy sectors. This vision will be operationalised by focusing on regulating, transforming and promoting the mining minerals and energy sectors, providing sustainable and affordable energy for growth and development, and ensuring that all SouthAfricansderivesustainablebenefitfromthecountry’smineralwealth.
5 Institutional programme performance information
The DMRE will focus on the six core programmes on which the APP is premised. These programmes are the enabling functions that will allow the DMRE to meet the outcomes set out in its strategic plan.
5.1 Programme 1: Administration
Purpose: ToprovidesupportservicestotheDMREtofulfilitsmandateandachieveitsstrategic objectives.
Functions:• Render auxiliary support and security services• Render strategic human resources services• Carry out oversight of all the DMRE’s SOEs• Ensure the provision of communications and media related services• Provide professional legal support and advisory services to the Ministry and DMRE• Develop and maintain all DMRE application systems and ensure a sound information
technology service
Link to the Balanced Scorecard Framework
This programme is in support of the Resourcing and Governance Perspective of the Business Score Card as it relates to:• Human Capital • Information Capital • Corporate Governance• Financial Management
MTSF alignment
Programme 1 is well-positioned to support National Priority 1: A Capable, Ethical and Developmental State by focusing on:• Effectiveandefficientstrategiccorporateservices• Anefficient,effectiveanddevelopment-orientedDMRE• Promoting sound corporate governance practices within the DMRE

A N N U A L P E R F O R M A N C E P L A N 2 0 2 0 / 2 1 53
5.1.1 Outcomes, outputs, performance indicators and targets
Outcome OutputsOutput
indicators
Annual targets
Audited/Actual performanceEstimated
performanceMTEF period
2016/17 2017/18 2018/19 2019/20 2020/21 2021/22 2022/23
Functional,efficientand integrated government
Improved governance and accountability
Wasteful and fruitless expenditure eliminated
%eliminationofwasteful and fruitless expenditure
N/A N/A N/A N/A 100%eliminationof wasteful and fruitless expenditure
100%eliminationof wasteful and fruitless expenditure
100%eliminationof wasteful and fruitless expenditure
Reduced irregular expenditure
%reductionofirregularexpenditure
N/A N/A N/A N/A 100%reductionof irregular expenditure
100%reductionof irregular expenditure
100%reductionof irregular expenditure
Unqualifiedaudit opinion in department/s and entities
%reductionofqualifiedaudits
N/A N/A N/A N/A 100%reductionofqualifiedaudits
100%reductionofqualifiedaudit
100%reductionofqualifiedaudit
Consequences for corruption and misconduct enforced
%resolutionofreported incidents of corruption
N/A N/A N/A N/A 95%resolutionof reported incidents of corruption
95%resolutionof reported incidents of corruption
95%resolutionof reported incidents of corruption
Ethics committee established
Establish ethics committees and adhere to terms of reference
N/A N/A N/A N/A Establish ethics committees and adhere to terms of reference
Implement ethics committees and adhere to terms of reference
Ethics committee established

D E P A R T M E N T O F M I N E R A L R E S O U R C E S A N D E N E R G Y54
Outcome OutputsOutput
indicators
Annual targets
Audited/Actual performanceEstimated
performanceMTEF period
2016/17 2017/18 2018/19 2019/20 2020/21 2021/22 2022/23Functional,efficientand integrated government
Improved governance and accountability
Oversee the development of departmental Strategic and Annual Performance Plans and monitor the implementation thereof
Approval of Annual Performance Plans
N/A N/A N/A N/A Approved Annual Performance Plan
Approved Annual Performance Plan
Approved Annual Performance Plan
Number of Quarterly Performance Reports and Annual Report
N/A N/A N/A N/A 4 Quarterly Reports and Annual Report approved
4 Quarterly Reports and Annual Report approved
4 Quarterly Reports and Annual Report approved
Functional,efficientand integrated government
Enter into shareholder compact with schedule 2A SOEs
Approval of SOEs Annual Performance Plans
Approved shareholder compacts
Approved Annual Performance Plan
N/A N/A N/A N/A Approved shareholder compacts
Approved Annual Performance Plan tabled in Parliament
Approved shareholder compacts
Approved Annual Performance Plan tabled in Parliament
Approved shareholder compacts
Approved Annual Performance Plan tabled in Parliament
Functional,efficientand integrated department
Integrated programme performance report on the implementation of the 2019–2024 MTSF Priorities
Number quarterly reports which detail the implementation of the 2019–2024 MTSF Priorities
N/A N/A N/A N/A 4 Quarterly Reports which detail the implementation of the 2019–2024 MTSF Priorities
4 Quarterly Reports which detail the implementation of the 2019–2024 MTSF Priorities
4 Quarterly Reports which detail the implementation of the 2019–2024 MTSF Priorities

A N N U A L P E R F O R M A N C E P L A N 2 0 2 0 / 2 1 55
Outcome OutputsOutput
indicators
Annual targets
Audited/Actual performanceEstimated
performanceMTEF period
2016/17 2017/18 2018/19 2019/20 2020/21 2021/22 2022/23To ensure effective andsoundfinancialresourcemanagement
Invoices from service providers paidwithin 30 days of receipt
Percentage of approved invoices from service providers paid within 30 days of receipt
100%approved invoices paid within 30 days of receipt
100%approvedinvoices paidwithin 30 days of receipt
100%approvedinvoices from service providers paidwithin 30 days of receipt
100%approvedinvoices from service providers paidwithin 30 days of receipt
100%approvedinvoices from service providers paidwithin 30 days of receipt
100%approvedinvoices from service providers paidwithin 30 days of receipt
100%approvedinvoices from service providers paidwithin 30 days of receipt
5.1.2 Output indicators: Annual and quarterly targets
Output indicators Annual targets Q1 Q2 Q3 Q4%eliminationofwastefulandfruitless expenditure in public sector institutions
100%eliminationofwasteful and fruitless expenditure
No incidents of wasteful and fruitless expenditure, ongoing consequence management in cases
No incidents of wasteful and fruitless expenditure, ongoing consequence management in cases
No incidents of wasteful and fruitless expenditure, ongoing consequence management in cases
100%eliminationofwastefuland fruitless expenditure
%reductionofirregularexpenditure
100%reductionofirregularexpenditure
No incidents of irregular expenditure, and consequence management
No incidents of irregular expenditure, and consequence management
No incidents of irregular expenditure, and consequence management
100%reductionofirregularexpenditure
%reductionofqualifiedaudits
100%reductionofqualifiedaudits
N/A N/A N/A 100%reductionofqualifiedaudits
%resolutionofreportedincidents of corruption
95%resolutionofreportedincidents of corruption
Develop the DMRE investigative policy/procedure and capacity for investigations
Present the investigation policy to Exco/Risk and Audit Committee for approval
Implement the integrated Anti-fraud and Corruption Strategy
100%resolutionofreportedincidents of corruption

D E P A R T M E N T O F M I N E R A L R E S O U R C E S A N D E N E R G Y56
Output indicators Annual targets Q1 Q2 Q3 Q4Implemented ethics structures
Establish ethics committees and adhere to terms of reference
Develop the DMRE Ethics Framework/Policy and ensure adequate capacity for implementation
Present the ethics policy at Exco/Risk and Audit Committee for approval and adoption
Implementation of the integrated ethics committee framework
Ethics committees establishedand adhere to terms ofreference
Approved shareholdercompacts
Approvedshareholdercompacts
N/A N/A Schedule 3A SOE’s 1st draft APPs reviewed and submitted to the Minister
Shareholder compact and Corporate Plans of Schedule 2 SOEs
4th Quarter Report 1st Quarter Report
Annual Reports of SOEs tabled in Parliament
2nd Quarter Report 3rd Quarter Report
Annual Performance Plan tabled in Parliament
Annual Performance Plan approved
N/A N/A 1st Draft submitted to DPME
APP tabled in Parliament
Number of Quarterly Performance reports produced
4 Quarterly Performance Reports produced
1 Quarter Report 1 Quarter Report 1 Quarter Report 1 Quarter Report
Annual Performance Report produced
Annual Report tabled in parliament
N/A Annual Report tabled inParliament
N/A N/A
Annual Report which detail the implementation of the 2019–2024 MTSF Priorities
1 Annual Report which detail the implementation of the 2019–2024 MTSF Priorities
1 Quarterly Report which details the implementation of the 2019–2024 MTSF Priorities
1 Quarterly Report which details the implementation of the 2019–2024 MTSF Priorities
1 Quarterly Report which details the implementation of the 2019–2024 MTSF Priorities
1 Annual Report which details the implementation of the 2019–2024 MTSF Priorities
Percentage of approved invoices from service providers paid within 30 days of receipt
100%approvedinvoicesfrom service providers paid within 30 days of receipt
100%approvedinvoicesfrom service providers paid within 30 days of receipt
100%approvedinvoicesfrom service providers paid within 30 days of receipt
100%approvedinvoicesfrom service providers paid within 30 days of receipt
100%approvedinvoicesfrom service providers paid within 30 days of receipt

A N N U A L P E R F O R M A N C E P L A N 2 0 2 0 / 2 1 57
5.1.3 Explanation of planned performance over the medium-term period
Programme 1: Administrationwillcreateaneffectiveandefficientstrategicsupportserviceto the line function and ensure the implementation of the National Skills Development (NSD)strategyandmaintainavacancyratelevelbeloworequalto10%.TheDMRE’sfive-yearcommunicationstrategywillbefinalisedandre-brandingofallDMREentitieswillbe considered. The programme will support the development of policies and standard operating procedures for all its functions, as well as develop new web platforms, both for intranetandwebsiteusers.Anefficient,effectiveanddevelopment-orienteddepartmentaligns with MTSF Priority 1and emphasis will be placed on reviewing and implementing a service delivery improvement plan, ICT strategies and enterprise architecture that are aligned with the DMRE’s strategic objectives. ICT infrastructure will be upgraded and refreshed, including the development and implementation of an enterprise software solution. This will promote access to information for decision-making and facilitating investment. A Corporate Governance of ICT Framework will be implemented.
Significantemphasiswill beplacedoneradicating fraud and corruption.TheDMREwilldevelop an Investigative policy/procedure and provide anti-fraud and corruption capacity to conduct investigations on reported/alleged cases of maladministration, irregularities, fraud and corruption during the restructuring of the departmental organisation. The ethics structures, frameworkandpolicywillbedeveloped in thefirstquarterof2020/21andimplementationwillcommenceinQ3ofthe2020/21financialyear.
To promote sound corporate governance practices within the DMRE, the programme will manage appeals, litigation, legal drafting (such as opinions, agreements and legislation), Promotion of Access to Information Act (PAIA) requests, and MHI inquiries and investigations. An integrated stakeholder management framework will be developed. InitiativesaroundadditionalfundingwillbedrivenbyProgramme1throughthefinancialmanagement services, in consultation with various programme managers. Different funding mechanisms should be explored, including funds set aside, donor funding, engagement with National Treasury (NT), the redirection of resources, collaboration, sponsorships,
and funding for communication activities. This programme will pursue different funding mechanisms (set aside, donor funding, engagement with NT, redirection of resources, collaboration, sponsorships, funding for communication activities) to realise the outputs and improvements in related performance indicators that are anticipated over the MTSF period.
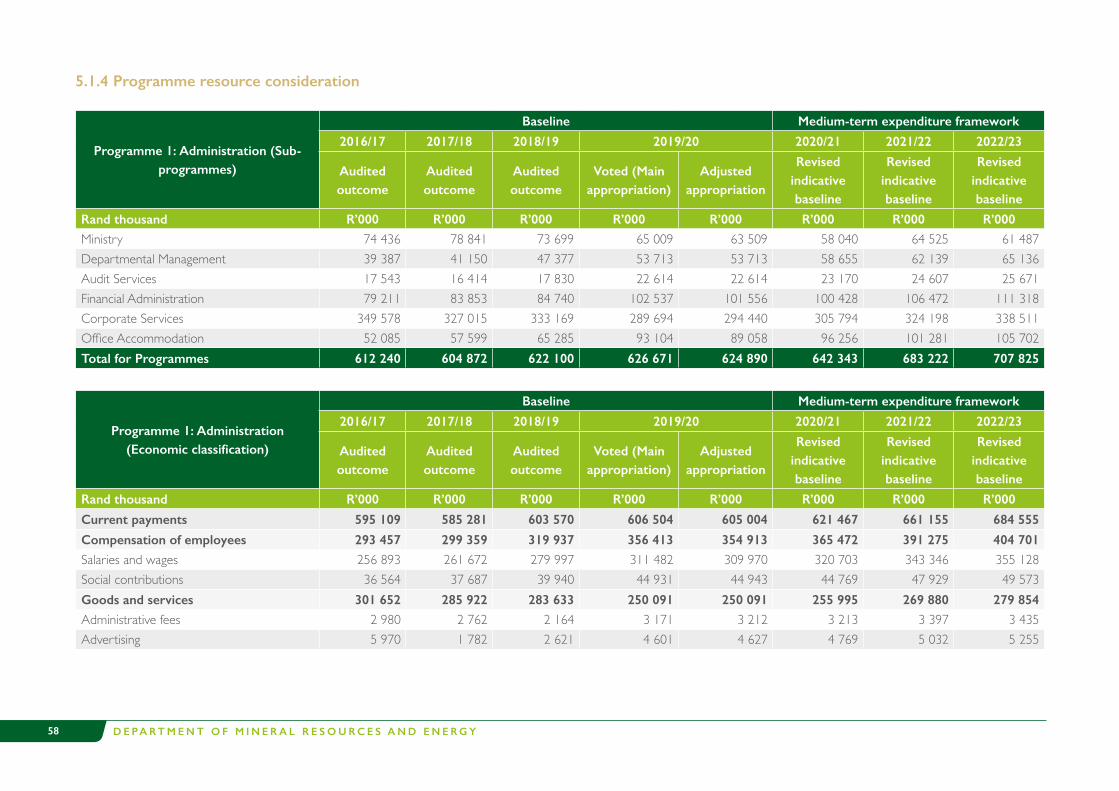
D E P A R T M E N T O F M I N E R A L R E S O U R C E S A N D E N E R G Y58
5.1.4 Programme resource consideration
Programme 1: Administration (Sub-programmes)
Baseline Medium-term expenditure framework
2016/17 2017/18 2018/19 2019/20 2020/21 2021/22 2022/23
Audited outcome
Audited outcome
Audited outcome
Voted (Main appropriation)
Adjusted appropriation
Revised indicative baseline
Revised indicative baseline
Revised indicative baseline
Rand thousand R’000 R’000 R’000 R’000 R’000 R’000 R’000 R’000Ministry 74 436 78 841 73 699 65 009 63 509 58 040 64 525 61 487 Departmental Management 39 387 41 150 47 377 53 713 53 713 58 655 62 139 65 136 Audit Services 17 543 16 414 17 830 22 614 22 614 23 170 24 607 25 671 Financial Administration 79 211 83 853 84 740 102 537 101 556 100 428 106 472 111 318 Corporate Services 349 578 327 015 333 169 289 694 294 440 305 794 324 198 338 511 OfficeAccommodation 52 085 57 599 65 285 93 104 89 058 96 256 101 281 105 702 Total for Programmes 612 240 604 872 622 100 626 671 624 890 642 343 683 222 707 825
Programme 1: Administration (Economic classification)
Baseline Medium-term expenditure framework
2016/17 2017/18 2018/19 2019/20 2020/21 2021/22 2022/23
Audited outcome
Audited outcome
Audited outcome
Voted (Main appropriation)
Adjusted appropriation
Revised indicative baseline
Revised indicative baseline
Revised indicative baseline
Rand thousand R’000 R’000 R’000 R’000 R’000 R’000 R’000 R’000
Current payments 595 109 585 281 603 570 606 504 605 004 621 467 661 155 684 555
Compensation of employees 293 457 299 359 319 937 356 413 354 913 365 472 391 275 404 701 Salaries and wages 256 893 261 672 279 997 311 482 309 970 320 703 343 346 355 128 Social contributions 36 564 37 687 39 940 44 931 44 943 44 769 47 929 49 573 Goods and services 301 652 285 922 283 633 250 091 250 091 255 995 269 880 279 854 Administrative fees 2 980 2 762 2 164 3 171 3 212 3 213 3 397 3 435 Advertising 5 970 1 782 2 621 4 601 4 627 4 769 5 032 5 255

A N N U A L P E R F O R M A N C E P L A N 2 0 2 0 / 2 1 59
Programme 1: Administration (Economic classification)
Baseline Medium-term expenditure framework
2016/17 2017/18 2018/19 2019/20 2020/21 2021/22 2022/23
Audited outcome
Audited outcome
Audited outcome
Voted (Main appropriation)
Adjusted appropriation
Revised indicative baseline
Revised indicative baseline
Revised indicative baseline
Rand thousand R’000 R’000 R’000 R’000 R’000 R’000 R’000 R’000Minor assets 1 767 1 719 534 3 979 3 260 4 267 4 503 4 664 Audit costs: External 10 052 11 555 11 334 9 229 9 229 9 778 10 316 10 750 Bursaries: Employees 1 789 1 864 2 482 2 914 2 914 3 042 3 202 3 332 Catering: Departmental activities 719 982 1 013 1 727 1 791 1 628 1 720 1 771 Communication (G&S) 14 475 14 872 8 226 6 369 6 548 6 731 7 101 7 317 Computer services 34 986 34 823 31 102 30 141 31 156 31 723 33 468 34 839 Consultants: Business and advisory services 6 729 6 024 5 069 7 888 6 429 7 798 8 243 8 597 Legal services (G&S) 6 016 3 152 3 552 1 062 1 062 1 120 1 181 1 232 Contractors 2 372 995 1 327 2 893 2 542 3 075 3 244 3 363 Agency and support/outsourced services (4) 189 297 833 440 879 927 971 Entertainment 8 18 - 275 226 279 294 287 Fleet services (including government motor transport) 7 202 7 133 8 122 5 500 5 783 5 676 5 985 6 187 Inventory: Clothing material and accessories 53 - - - - - - - Inventory: Food and food supplies 19 - - - - - - - Inventory: Materials and supplies 213 - - - - - - - Inventory: Medical supplies 2 - - - - - - - Consumable supplies 1 602 1 767 1 507 3 810 4 131 3 988 4 205 4 338Consumables:Stationery,printingandofficesupplies 5 764 4 545 4 652 7 158 7 462 7 189 7 587 7 898 Operating leases 126 799 122 444 129 762 87 185 83 855 92 027 97 083 101 256 Rental and hiring 203 213 87 180 290 27 29 30 Property payments 15 085 13 514 14 355 15 652 18 175 15 628 16 224 16 890

D E P A R T M E N T O F M I N E R A L R E S O U R C E S A N D E N E R G Y60
Programme 1: Administration (Economic classification)
Baseline Medium-term expenditure framework
2016/17 2017/18 2018/19 2019/20 2020/21 2021/22 2022/23
Audited outcome
Audited outcome
Audited outcome
Voted (Main appropriation)
Adjusted appropriation
Revised indicative baseline
Revised indicative baseline
Revised indicative baseline
Rand thousand R’000 R’000 R’000 R’000 R’000 R’000 R’000 R’000Travel and subsistence 42 485 41 171 42 500 35 614 37 182 33 758 35 664 36 191 Training and development 7 471 7 462 6 626 7 917 7 917 8 177 8 618 8 990 Operating payments 4 215 3 324 2 954 7 058 7 648 7 470 7 888 8 174 Venues and facilities 2 680 3 612 3 347 4 935 4 212 3 753 3 969 4 087 Interest and rent on land - - 1 - - - - - Interest (Incl. interest on unitary payments (PPP)) - - 1 - - - - - Rent on land - - - - - - - - Transfers and subsidies 4 978 7 409 4 024 3 346 3 346 3 505 3 698 3 857 Departmental agencies and accounts 985 1 048 1 108 1 170 1 170 1 209 1 276 1 324 Foreign governments and international organisations - - - - - - - -Households 3 993 6 361 2 916 2 176 2 176 2 296 2 422 2 533 Payments for capital assets 12 031 12 182 14 418 16 821 16 540 17 371 18 369 19 413 Buildings - 263 636 2 056 2 056 2 126 2 286 2 416 Otherfixedstructures 153 - - - - - - - Transport equipment 3 262 2 565 1 972 - - - - - Machinery and equipment 8 616 8 562 11 810 14 765 14 484 15 245 16 083 16 997 Software and other intangible assets - 792 - - - - - - Payments for financial assets 122 - 87 - - - - -
Total economic classification 612 240 604 872 622 100 626 671 624 890 642 343 683 222 707 825
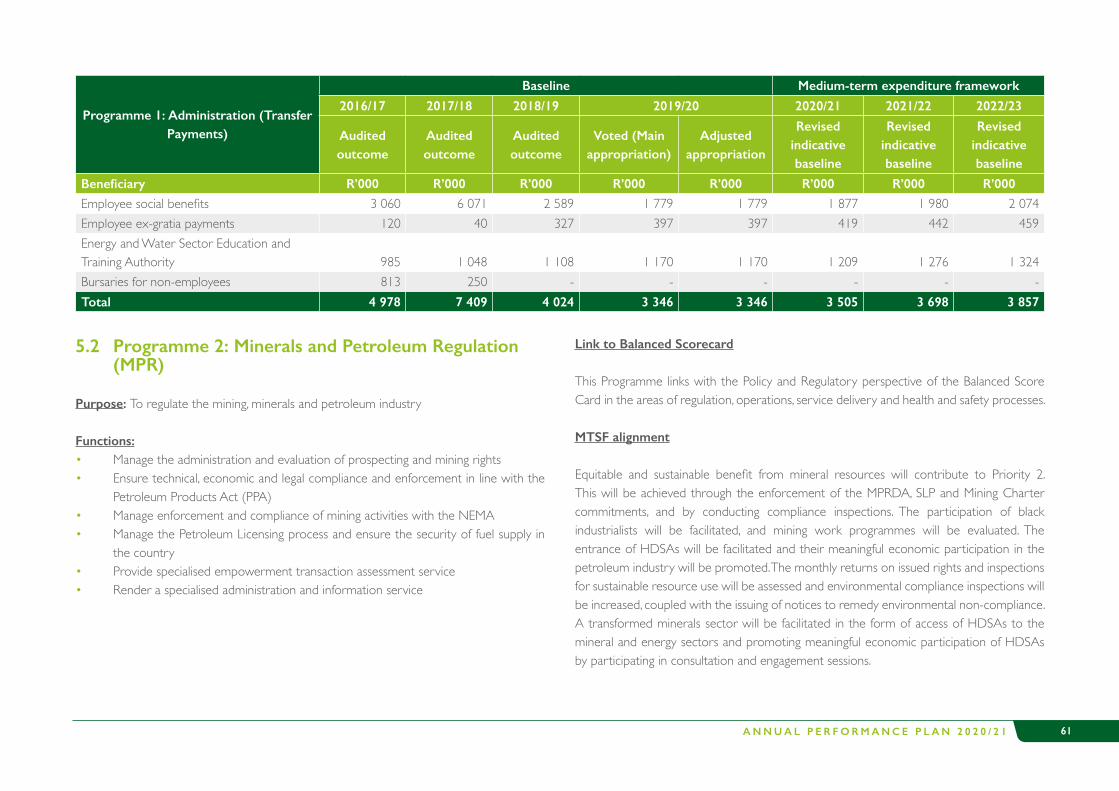
A N N U A L P E R F O R M A N C E P L A N 2 0 2 0 / 2 1 61
Programme 1: Administration (Transfer Payments)
Baseline Medium-term expenditure framework
2016/17 2017/18 2018/19 2019/20 2020/21 2021/22 2022/23
Audited outcome
Audited outcome
Audited outcome
Voted (Main appropriation)
Adjusted appropriation
Revised indicative baseline
Revised indicative baseline
Revised indicative baseline
Beneficiary R’000 R’000 R’000 R’000 R’000 R’000 R’000 R’000Employeesocialbenefits 3 060 6 071 2 589 1 779 1 779 1 877 1 980 2 074 Employee ex-gratia payments 120 40 327 397 397 419 442 459 Energy and Water Sector Education and Training Authority 985 1 048 1 108 1 170 1 170 1 209 1 276 1 324 Bursaries for non-employees 813 250 - - - - - -Total 4 978 7 409 4 024 3 346 3 346 3 505 3 698 3 857
5.2 Programme 2: Minerals and Petroleum Regulation (MPR)
Purpose: To regulate the mining, minerals and petroleum industry
Functions:• Manage the administration and evaluation of prospecting and mining rights• Ensure technical, economic and legal compliance and enforcement in line with the
Petroleum Products Act (PPA)• Manage enforcement and compliance of mining activities with the NEMA• Manage the Petroleum Licensing process and ensure the security of fuel supply in
the country• Provide specialised empowerment transaction assessment service• Render a specialised administration and information service
Link to Balanced Scorecard
This Programme links with the Policy and Regulatory perspective of the Balanced Score Card in the areas of regulation, operations, service delivery and health and safety processes.
MTSF alignment
Equitable and sustainable benefit from mineral resources will contribute to Priority 2.This will be achieved through the enforcement of the MPRDA, SLP and Mining Charter commitments, and by conducting compliance inspections. The participation of black industrialists will be facilitated, and mining work programmes will be evaluated. The entrance of HDSAs will be facilitated and their meaningful economic participation in the petroleum industry will be promoted. The monthly returns on issued rights and inspections for sustainable resource use will be assessed and environmental compliance inspections will be increased, coupled with the issuing of notices to remedy environmental non-compliance. A transformed minerals sector will be facilitated in the form of access of HDSAs to the mineral and energy sectors and promoting meaningful economic participation of HDSAs by participating in consultation and engagement sessions.

D E P A R T M E N T O F M I N E R A L R E S O U R C E S A N D E N E R G Y62
Economic transformation and job creation will stem from an efficient, effective anddevelopment-oriented DMRE. The branch will commission an independent B-BBEE audit, to evaluate and monitor progress on transformation in the petroleum and liquid fuels industry. It will conduct compliance inspections and reports, including SLPs, and issue statutory notices or orders for non-compliance. These include mine economics verification,environmental,andrandomfuelsampleinspections.Petroleum,prospectingandminingapplicationswillbeadjudicated in linewith legislated timeframes(90% forpetroleumapplicationsand70%formineralapplications).Thesuitabilityofthefinancialprovision will be reviewed.
With regards to Spatial Integration, Human Settlements and Local Government (Priority 5), this branch will implement the Housing and Living Conditions Standards for the Mining Sector and inspect special reference to housing aspects. It will pursue the integration of IDPs and SLPs. Priority1, A Capable, Ethical and Developmental State, will be supported by improved enforcement of all mineral-related legislation in partnership with law enforcement agencies (SAPS, NPA, SARS and SARB).
5.2.1 Outcomes, outputs, performance indicators and targets
Outcome Outputs Outputindicators
Annual targets
Audited/Actual performance Estimated performance
MTEF period
2016/17 2017/18 2018/19 2019/20 2020/21 2021/22 2022/23Investing in accelerated inclusive growth
Jobs created Number of direct jobs created per investment
N/A N/A N/A 8 500 8 500 8 500 8 500
Number of SLP development projects completed
120 120 120 120 120 120 120
Number of black industrialists created through procurement
10 10 10 10 10 10 10
Participation in District Planning Forums (joined up plans)
%ofparticipationinDistrict PlanningForums (joined upplans)
N/A N/A N/A N/A 100%Participation in District Planning Forums (joined-up plans)
100%Participation in District Planning Forums (joined-up plans)
100%Participation in District Planning Forums (joined-up plans)
Security of supply anddiversifiedliquid fuels
Strategy and plan on liquid fuels reviewed
Strategy and plan on liquid fuels reviewed and updated
N/A N/A N/A Integrated Energy Plan (IEP)
Strategy and plan for liquid fuels updated by 2022
Strategy and plan for liquid fuels updated
N/A

A N N U A L P E R F O R M A N C E P L A N 2 0 2 0 / 2 1 63
Outcome Outputs Outputindicators
Annual targets
Audited/Actual performance Estimated performance
MTEF period
2016/17 2017/18 2018/19 2019/20 2020/21 2021/22 2022/23
Security of supply anddiversifiedliquid fuels
Feasibility study completed
Feasibility study on new oilrefinerycompletedandfinalinvestmentdecision made
N/A N/A N/A Draft feasibility study
Feasibility study on new oilrefinerycompleted and finalinvestmentdecision made
Initiate and complete Front-End Engineering and Design
Final Investment Decision and Design
Investing in accelerated inclusive growth
Monitor and enforce compliance
Number of SLP inspections conducted
212 212 212 212 212 212 212
Number of retail sitecompliance inspections conducted per year
1 500 1 500 1 500 1 500 1 500 1 500 1 500
Fuel samples tested Number of fuel samplestested
1 080 1 080 1 080 1 080 1080 1 080 1 080
Number of legal compliance inspections (mineral laws-MLA) conducted
150 150 150 150 150 150 150
Transformed sector Number of mining economics (MWP/PWP) inspections conducted
500 500 500 500 500 500 500
Number of environmental inspections conducted
1 275 1 275 1 275 1 275 1 275 1 275 1 275
%ofpetroleumlicenceapplications approved withaminimumof50%HDSA ownership
50% 50% 50% 50% 50% 50% 50%

D E P A R T M E N T O F M I N E R A L R E S O U R C E S A N D E N E R G Y64
Outcome Outputs Outputindicators
Annual targets
Audited/Actual performance Estimated performance
MTEF period
2016/17 2017/18 2018/19 2019/20 2020/21 2021/22 2022/23Investing in accelerated inclusive growth
Transformed sector Compliance monitoring audit of the B-BBEE Act in the petroleum sector to be done every 2nd year (charter sector code)
N/A N/A N/A N/A 100% N/A 100%
Number of rights and permits granted and/ or issued to HDSA controlled entities
120 120 120 120 120 120 120
5.2.2 Output indicators: annual and quarterly targets
Output indicators Annual targets Q1 Q2 Q3 Q4Number of direct jobs created per investment 8 500 N/A 3 000 5 000 8 500 Strategy and plan on liquid fuels reviewed and updated
Strategy and plan for liquid fuels approved by Cabinet
Drafting and Consultation
Submit IEP to Minister for approval
Submit to Cluster/Cabinet approval system
Strategy and plan for liquid fuels approved by Cabinet
Feasibility study completed Feasibility study on new oilrefinerycompletedby31March2021andfinalinvestment decision made
Submit the Prefeasibility Study Report to Cabinet
Initiate the Feasibility Study
Milestone Report on progress on Feasibility Study
Feasibility Study on new oilrefinerycompletedby 31 March 2021
Number of petroleum retail site inspections conducted per year
1 500 350 750 1 000 1 500
Number of fuel samples tested 1 080 270 540 810 1 080Number of legal compliance inspections (mineral laws-MLA) conducted
150 37 74 112 150

A N N U A L P E R F O R M A N C E P L A N 2 0 2 0 / 2 1 65
Output indicators Annual targets Q1 Q2 Q3 Q4Number of mining economics (MWP/PWP) inspections conducted
125 125 125 125 125
Number of environmental inspections conducted
1 275 319 638 957 1 275
%oflicenceapplicationsapprovedwhereHDSAownershipisatleast50%
50% 50% 50% 50% 50%
Number of Social Labour Plans (SLP) development projects completed
120 30 60 90 120
Number of black industrialists created through procurement
10 2 5 7 10
%oncompliancemonitoringauditoftheB-BBEE Act in the petroleum sector to be done every 2nd year (charter)
100% 100% 100% 100% 100%
Number of rights and permits granted and/or issued to HDSA controlled entities
120 30 60 90 120
Number of SLP inspections conducted 212 53 106 159 212
5.2.3 Explanation of planned performance over the medium-term period
Thisprogrammehas identified interventions toensure that theDMREoutcomesareachieved through the delivery of the outcomes and related indicator targets. Improvement in turnaround time of licensing will be achieved by strengthening capacity and review of the process using technology to track and unblock bottlenecks. Enhanced co-operation between the DMRE, Department of Water and Sanitation (DWS) and Department of Environmental Affairs (DEA) aims to implement one environmental system for improved integration. The outcome will be an expedient licensing regime.
Optimal utilisation ofmineral resourceswill be achieved by addressing the significantnumber of mines that are under care-maintenance, business rescue and liquidation.
A framework on dealing with those mines will be developed and the Ten Point Plan reviewed. The availability of geological data will improve the current concentration of petroleum and minerals. The DMRE will encourage partnerships between emerging junior miners, and review legislation with regards to the Petroleum Bill. Inputs obtained from stakeholders will drive inclusive, equitable and competitive exploration. Lack of transformation inminerals and petroleum sectors that are reflectiveof the country’sdemographics, will be addressed. Compliance with the relevant legislative frameworks will be enforced and additional funding mechanisms for exploration, mining and petroleum will be investigated.
Accessibility to, and availability of land for exploration, monitoring of compliance, and mining is necessary. The DMRE will engage respective landowners (trusts, chiefs, municipalities etc.) and consider legislative amendments around petroleum activities.

D E P A R T M E N T O F M I N E R A L R E S O U R C E S A N D E N E R G Y66
Infrastructure development (energy, rail, and water) will improve the availability and accessibility of supporting infrastructure for mining and petroleum. The DMRE will engage other departments (Department of Agriculture, Forestry and Fisheries (DAFF), Department of Public Enterprises (DPE), Department of Water and Sanitation (DWS) to facilitate access to essential facilities such as import/export facilities, storage, and pipelines.
The cost of energy for the mining sector is a great concern. Own energy generation will be encouraged and supported to reduce the cost. The DMRE will pursue meaningful state participation in Eskom’s coal supply, along with sustainable and affordable energy for mining. Efforts will be made to eradicate illegal mining and illicit petroleum trading by reviewing the legislative framework to prevent illegal mining (such as the Municipal Public-Private Partnership Pilot Programme (MPPP). In addition, a framework on how to support artisan miners will be developed and implemented. Collaboration with SARS and other law enforcement agencies will aid in eradicating illegal mining.
Job losses in the mining and petroleum sectors will be minimised by developing guidelines for business rescue processes, and actively participating in liquidation processes. The DMRE will develop guidelines on how to manage, care and maintain the section 52 process, and strengthen the Ten Point Plan. Sustainable implementation of social labour plans will be achieved by strengthening the framework and facilitating intergovernmental forums led by the DMRE. This will address the lack of formalised community structures.
Electricity blackouts caused by inadequate household energy supply will be met through the rollout of liquid petroleum gas (LPG) as an alternative, conducting LPG Safety Awareness campaigns and encouraging more investments in the LPG sector. This will reduce reliance on electricity usage. South Africa’s reliance on international crude oil will bereducedthroughtheelectrificationof thetransportationsector,andan integratedapproach to transport sector transition.Oil field exploration will be pursued, and atargetedsourcediversificationstrategywillbedevelopedfocusingonAfrica,whileboththe Biofuels Framework and Strategic Stock Policy will be implemented.

A N N U A L P E R F O R M A N C E P L A N 2 0 2 0 / 2 1 67
5.2.4 Programme resource considerations
Programme 2: Minerals and Petroleum Regulation (Sub-programmes)
Baseline Medium-term expenditure framework
2016/17 2017/18 2018/19 2019/20 2020/21 2021/22 2022/23
Audited outcome
Audited outcome
Audited outcome
Voted (Main appropriation)
Adjusted appropriation
Revised indicative baseline
Revised indicative baseline
Revised indicative baseline
Rand thousand R’000 R’000 R’000 R’000 R’000 R’000 R’000 R’000Minerals and Petroleum Management 16 775 16 708 23 486 32 196 32 196 33 207 35 019 36 408 Mineral Regulation and Administration 238 705 345 398 355 036 399 226 399 226 425 774 451 179 468 143 Environmental Enforcement and Compliance 6 739 12 395 15 051 15 992 15 992 17 339 18 444 19 143 Petroleum Compliance Monitoring, Enforcement and Fuel Pricing 21 556 18 781 19 262 26 117 25 660 26 524 28 028 29 367 Petroleum Licensing and Fuel Supply 57 435 55 859 57 781 65 152 64 695 71 869 76 024 79 667 Total for Programmes 341 210 449 141 470 616 538 683 537 769 574 713 608 694 632 728
Programme 2: Minerals and Petroleum Regulation (Economic Classification)
Baseline Medium-term expenditure framework
2016/17 2017/18 2018/19 2019/20 2020/21 2021/22 2022/23
Audited outcome
Audited outcome
Audited outcome
Voted (Main appropriation)
Adjusted appropriation
Revised indicative baseline
Revised indicative baseline
Revised indicative baseline
Rand thousand R’000 R’000 R’000 R’000 R’000 R’000 R’000 R’000
Current payments 287 061 293 932 312 799 346 612 345 698 373 301 396 224 412 358
Compensation of employees 234 605 244 993 253 276 278 477 277 563 302 679 321 666 335 058 Salaries and wages 202 535 210 949 217 499 243 653 242 711 265 602 282 264 294 015 Social contributions 32 070 34 044 35 777 34 824 34 852 37 077 39 402 41 043 Goods and services 52 456 48 939 59 523 68 135 68 135 70 622 74 558 77 300 Administrative fees 883 889 678 991 999 1 063 1 121 1 167 Advertising 892 208 242 1 486 974 1 559 1 645 1 720

D E P A R T M E N T O F M I N E R A L R E S O U R C E S A N D E N E R G Y68
Programme 2: Minerals and Petroleum Regulation (Economic Classification)
Baseline Medium-term expenditure framework
2016/17 2017/18 2018/19 2019/20 2020/21 2021/22 2022/23
Audited outcome
Audited outcome
Audited outcome
Voted (Main appropriation)
Adjusted appropriation
Revised indicative baseline
Revised indicative baseline
Revised indicative baseline
Rand thousand R’000 R’000 R’000 R’000 R’000 R’000 R’000 R’000Minor assets 16 17 13 127 127 137 145 150 Catering: Departmental activities 221 319 1 188 855 843 889 940 976 Communication (G&S) 4 225 3 941 3 653 4 209 4 189 4 563 4 816 5 004 Computer services 469 759 4 329 7 167 7 167 7 543 7 911 8 204 Consultants: Business and advisory services 10 597 8 919 10 201 13 308 13 081 13 154 13 917 14 556 Legal services (G&S) 5 351 5 680 6 577 1 137 1 485 1 234 1 302 1 351 Contractors 18 21 70 25 70 26 27 28 Fleet services (including government motor transport) 3 475 3 870 5 100 4 208 4 308 4 580 4 832 5 012 Inventory: Materials and supplies 5 - - - - - - - Consumable supplies 649 641 667 1 140 1 187 1 228 1 296 1 345 Consumables:Stationery,printingandofficesupplies 1 328 1 031 963 2 574 2 553 2 794 2 944 3 055 Operating leases 20 229 757 150 577 163 172 178 Rental and hiring - - 463 20 20 22 23 24 Property payments 1 1 - 5 5 5 6 6 Travel and subsistence 20 336 19 911 22 520 24 172 24 485 25 353 26 793 27 585 Training and development 980 188 57 731 731 775 819 849 Operating payments 1 407 847 761 1 327 1 040 1 426 1 504 1 568 Venues and facilities 1 583 1 468 1 284 4 503 4 294 4 108 4 345 4 522 Transfers and subsidies 53 329 154 077 157 563 192 028 192 028 201 367 212 423 220 320 Departmental agencies and accounts 53 205 65 865 59 105 61 544 61 544 63 630 67 131 69 626

A N N U A L P E R F O R M A N C E P L A N 2 0 2 0 / 2 1 69
Programme 2: Minerals and Petroleum Regulation (Economic Classification)
Baseline Medium-term expenditure framework
2016/17 2017/18 2018/19 2019/20 2020/21 2021/22 2022/23
Audited outcome
Audited outcome
Audited outcome
Voted (Main appropriation)
Adjusted appropriation
Revised indicative baseline
Revised indicative baseline
Revised indicative baseline
Rand thousand R’000 R’000 R’000 R’000 R’000 R’000 R’000 R’000Foreign governments and international organisations - 1 074 - 3 038 3 038 3 205 3 381 3 507 Private enterprises - 87 138 98 439 127 446 127 446 134 532 141 911 147 187 Households 124 - 19 - - - - - Payments for capital assets 604 1 132 179 43 43 45 47 50 Transport equipment - - - - - - - - Other machinery and equipment 604 1 132 179 43 43 45 47 50 Software and other intangible assets - - - - - - - - Payments for financial assets 216 - 75 - - - - -
Total economic classification 341 210 449 141 470 616 538 683 537 769 574 713 608 694 632 728
Programme 2: Minerals and Petroleum Regulation (Transfer Payments)
Baseline Medium-term expenditure framework
2016/17 2017/18 2018/19 2019/20 2020/21 2021/22 2022/23
Audited outcome
Audited outcome
Audited outcome
Voted (Main appropriation)
Adjusted appropriation
Revised indicative baseline
Revised indicative baseline
Revised indicative baseline
Beneficiary R’000 R’000 R’000 R’000 R’000 R’000 R’000 R’000Employeesocialbenefits 124 - 19 - - - - - African Petroleum Producers’ Association - 1 074 - 3 038 3 038 3 205 3 381 3 507 South African Diamond and Precious Metals Regulator 53 205 65 865 59 105 61 544 61 544 63 630 67 131 69 626 Petroleum Agency South Africa - 87 138 98 439 127 446 127 446 134 532 141 911 147 187 TOTAL 53 329 154 077 157 563 192 028 192 028 201 367 212 423 220 320

D E P A R T M E N T O F M I N E R A L R E S O U R C E S A N D E N E R G Y70
5.3 Programme 3: Mining, Minerals and Energy Policy Development (MMEPD)
Purpose: Formulate, and maintain Integrated Minerals and Energy Policies to promote and encourage investments into the mining and energy industry
Functions:• Provide administrative support and manage the dissemination of information and
publications• Provide a policy and legislation framework for mining, minerals and petroleum
sectors• Promote minerals development and advise on trends in the mining industry to
attract investment• Promote economic growth and attract investments • Ensure the security of mineral resources and energy supply through planning • Develop and review policies as required by international agreements and governance
of the nuclear sector in South Africa
Link to Balanced Scorecard
This programme links to the following different Balanced Scorecard perspectives:• Policy and Regulatory Perspective relating to regulatory, operations, service delivery
and health and safety processes • Stakeholder perspective relating to industry and trade and Investment • Economic perspective as it relates to economic transformation and job creation and
transformed,diversifiedandsustainablemineralsandenergysectors
MTSF alignment
The Mining, Minerals and Energy Policy Branch supports and promotes MTSF priorities in the following areas:• Economic transformation and job creation will be achieved through a transformed
mineral,upstreampetroleumanddownstreamsector,aswellasdiversifiedsourcesofenergy supply. This aligns with the initiative to develop and review legislation, policies and strategies, as they relate to the mining, mineral, upstream and downstream petroleum, and energy sectors. Reliable statistical data on the minerals and energy sectors will support this priority. Areas to support investment will include a focus on local domestic investment, such as reviewing legislation to reduce barriers for new entrants and small-scale miners while sustainable resource use will be promoted.
• The implementation of IRP2019 will support the MTSF priority focused on promotingenergyaccess,efficiency,anddiversifiedsources.
• The Mine Health and Safety Act and Petroleum Health and Safety Act will be amended to meet the needs of education, skills and health in the mining and energy sectors.
• Spatial Integration,Human Settlements and LocalGovernmentwill benefit fromquality data and analysis - quality economic analysis on the mining and energy sectors, including household energy access data, will be provided.
• A Capable, ethical and developmental State, Priority 1, will support improved turnaround times and will develop and review internal processes to advance the continuous development of improved systems for monitoring and evaluation.
• Existing bi-lateral and multilateral agreements will be implemented, and new agreements concluded and implemented to support Priority 7, A better Africa and better World.

A N N U A L P E R F O R M A N C E P L A N 2 0 2 0 / 2 1 71
5.3.1 Outcomes, outputs, performance indicators and targets
Outcome Outputs Outputindicators
Annual targets
Audited/Actual performance Estimated performance
MTEF period
2016/17 2017/18 2018/19 2019/20 2020/21 2021/22 2022/23
Investing in accelerated inclusive growth
Framework for a just transition to a low carbon economyfinalised
Framework for a just transition to a low carbon economy developed
Number of legislative instruments developed/reviewed or amended
N/A N/A N/A N/A
Draft IEP
Submit LFRM, GIDP for Cabinet approval
Engagement framework for affected communities developed and implemented
Submit the IEP for Cabinet approval
Review/Update Sector Plans (IRP, LFRM, GID)
GHG reporting and assessment framework developed, approved and implementation monitored
N/A N/A N/A N/A GHG Reporting and assessment framework for energy and mining developed and submitted for Ministerial approval
1 Transition Plan developed, monitored, quantifiedandreport for high carbon emitting sectors
1 Transition Plan developed, monitored, quantifiedandreport for high carbon emitting sectors
Number of approved and listed carbon offset projects
N/A N/A N/A N/A 4 4 4

D E P A R T M E N T O F M I N E R A L R E S O U R C E S A N D E N E R G Y72
Outcome Outputs Outputindicators
Annual targets
Audited/Actual performance Estimated performance
MTEF period
2016/17 2017/18 2018/19 2019/20 2020/21 2021/22 2022/23
Investing in accelerated inclusive growth
Improved energy-related climate change response measures and environmental compliance
Number of energy related climate change response measures monitored, quantifiedandreported
N/A N/A N/A N/A 1 1 1
Finalised CDM projects
Number of finalisedCDMprojects
N/A N/A N/A N/A 2 projects finalised
2 projects finalised
2 projects finalised
Attract investments into the minerals and energy industrial complex
Number of investment promotion events held
N/A N/A N/A N/A 10 investment promotion events in the minerals and energy industrial complex held
10 investment promotion events in the minerals and energy industrial complex held
10 investment promotion events in the minerals and energy industrial complex held
Increased investment in the mineral and energy sectors
Promotional activities to increase investment in the minerals and energy sectors
Number of publications and economic reports supporting investment and sustainable resource use
25 25 25 25 25 25 25

A N N U A L P E R F O R M A N C E P L A N 2 0 2 0 / 2 1 73
Outcome Outputs Outputindicators
Annual targets
Audited/Actual performance Estimated performance
MTEF period
2016/17 2017/18 2018/19 2019/20 2020/21 2021/22 2022/23
Increased investment in the mineral and energy sectors
Analysis of the minerals and energy sectors and provide advisory services to inform on topical issues
Chrome BeneficiationPromotion Strategy
N/A N/A N/A N/A Chrome BeneficiationStrategy submitted to Cabinet for approval
N/A N/A
Enhanced relations with Africa and the World
Bilateral Agreements implemented and new agreements concluded
Number of existing agreements implemented
N/A N/A N/A N/A 20 20 20
New agreements concluded
N/A N/A N/A N/A 1 1 1
Number of multilateral strategic partnerships implemented
N/A N/A N/A N/A 10 10 10
Roadmap for the growth and sustainability of the minerals sector
Mining Masterplan finalised
Mining Masterplan developed
N/A N/A N/A N/A Draft Mining Masterplan submitted to economic cluster
Draft Mining Masterplan submitted to Cabinet for approval
N/A

D E P A R T M E N T O F M I N E R A L R E S O U R C E S A N D E N E R G Y74
Outcome Outputs Outputindicators
Annual targets
Audited/Actual performance Estimated performance
MTEF period
2016/17 2017/18 2018/19 2019/20 2020/21 2021/22 2022/23
Transformed minerals and upstream petroleum sector
Legislation, policies developed/reviewed or amended
Number of legislative instruments developed/reviewed or amended
N/A N/A N/A N/A Artisanal and Small-Scale Mining Policy approved by Cabinet
Coal Policy approved by Cabinet
Maximum RefineryGate Price Regulations gazetted for implementation
N/A N/A N/A N/A Geoscience Act Regulations gazetted for implementation
Liquid Petroleum Gas Strategy approved
Artisanal and Small-Scale Mining Bill submitted for tabling in Parliament

A N N U A L P E R F O R M A N C E P L A N 2 0 2 0 / 2 1 75
Outcome Outputs Outputindicators
Annual targets
Audited/Actual performance Estimated performance
MTEF period
2016/17 2017/18 2018/19 2019/20 2020/21 2021/22 2022/23
Supply of electricity secured
Improved nuclear policy and regulatory framework
National Nuclear Regulator Amendment Bill
N/A N/A N/A N/A National Nuclear Regulator Amendment Bill submitted to Cabinet for public consultation
Submission of the NNR Bill for tabling in Parliament
Nuclear Regulator Amendment Bill promulgated into an Act of Parliament
Improved nuclear policy and regulatory framework
Radioactive Waste Management Fund Bill
N/A N/A N/A N/A Radioactive Waste Management Fund Bill submitted to the economic cluster
Radioactive Waste Management Fund Bill submitted to Cabinet for public consultations and tabling in Parliament
Radioactive Waste Management Fund Bill promulgated into an Act of Parliament
Regulations on the long-term operation of nuclear installations
N/A N/A N/A N/A Draft Regulations on the long-term operation of nuclear installations published for public comments
Regulations on the long-term operation of nuclear installations gazetted for implementation
N/A

D E P A R T M E N T O F M I N E R A L R E S O U R C E S A N D E N E R G Y76
Outcome Outputs Outputindicators
Annual targets
Audited/Actual performance Estimated performance
MTEF period
2016/17 2017/18 2018/19 2019/20 2020/21 2021/22 2022/23
Supply of electricity secured
Legislation to improve the electricity policy and regulatory framework
National Energy Regulator Amendment Bill
Electricity Pricing Policy reviewed
N/A N/A N/A N/A National Energy Regulator Amendment Bill submitted to Cabinet for public consultation
Electricity Pricing Policy reviewed and submitted to Cabinet
Proposal on the National Energy Regulator Bill submitted for tabling in Parliament
National Energy Regulator Bill promulgated into an Act of Parliament
Legislation to improve the gas policy and regulatory framework
Amended Gas Act N/A N/A N/A N/A Gas Amendment Bill submitted to Cabinet for tabling in Parliament
Gas Amendment Bill promulgated into an Act of Parliament
Implementation of the Act
Gas Infrastructure Master Plan
N/A N/A N/A N/A Draft Gas Master Infrastructure Plan submitted to Cabinet for public comments
Gas Master Plan approved by Cabinet
N/A
Integrated Energy Plan
N/A N/A N/A N/A Draft Integrated Energy Plan submitted to Cabinet for public consultations
Integrated Energy Plan approved by Cabinet
N/A

A N N U A L P E R F O R M A N C E P L A N 2 0 2 0 / 2 1 77
Outcome Outputs Outputindicators
Annual targets
Audited/Actual performance Estimated performance
MTEF period
2016/17 2017/18 2018/19 2019/20 2020/21 2021/22 2022/23
Supply of electricity secured
Adam Framework finalised
Framework for municipal infrastructure asset management
N/A N/A N/A N/A Adam Framework submitted to Cabinet for approval
N/A N/A

D E P A R T M E N T O F M I N E R A L R E S O U R C E S A N D E N E R G Y78
5.3.2 Output indicators: Annual and quarterly targets
Output indicators Annual targets Q1 Q2 Q3 Q4Framework for a just transition to a low carbon economy developed
Submit LFRM, GIDP for Cabinet approval
Develop conceptual framework for a just transition
Engage government stakeholders
Broader stakeholder engagements and consultation
Framework for a just transition to a low carbon economy developed
Submit LFRM, GIDP for Cabinet approval
GHG reporting and assessment framework developed, approved and implementation monitored
GHG reporting and assessment framework for the energy and mining sectors developed and submitted for Ministerial approval
Stakeholder consultation and scoping of the projectfinalised
Data collection and development of inception report
Draft framework and consolidated stakeholder consultation report
Final GHG reporting framework developed and submitted for Ministerial approval
Number of approved and listed carbon offset projects
4 approved and listed carbon offset projects
Carbon offset administration system developed and launched to receive applications
1 carbon offset project application processed and approved
1 carbon offset project application processed and approved
2 carbon offsets projects application processed and approved
Number of reports on energy-related climate change response measuresmonitored,quantifiedand reported
1 report on energy-related climate change response measures monitored,quantifiedandreported
N/A N/A N/A Report on the assessment of policy gaps and misalignment with NDCs
NumberoffinalisedCDMprojects
2finalisedCDMprojects CDM project(s) applications reviewed, finalisedandprocessedwithin designated timeframes
1 CDM project(s) applications reviewed, finalisedandprocessed within designated timeframes
CDM project(s) applications reviewed, finalisedandprocessedwithin designated timeframes
1 CDM project(s) applications reviewed,finalisedandprocessed within designated timeframes
Number of investment promotion events held
10 investment promotion events held
2 investment promotion events hosted or attended
5 investment promotion events hosted or attended
7 investment promotion events hosted or attended
10 investment promotion events hosted or attended

A N N U A L P E R F O R M A N C E P L A N 2 0 2 0 / 2 1 79
Output indicators Annual targets Q1 Q2 Q3 Q4Number of publications and economic reports supporting investment and sustainable resource use
25 publications and economic reports supporting investment and sustainable resource use
5 12 17 25
ChromeBeneficiationPromotion Strategy
ChromeBeneficiationStrategysubmitted to Cabinet for approval
N/A N/A N/A ChromeBeneficiationStrategysubmitted to Cabinet for approval
Bilateral agreements concluded and implemented
20 existing agreements implemented
5 existing agreements implemented
5 existing agreements implemented
5 existing agreements implemented
5 existing agreements implemented
1 new bilateral agreement concluded and implemented
N/A N/A N/A 1 new agreement concluded
Number of multilateral strategic partnerships implemented
10 multilateral strategic partnerships implemented
2 multilateral strategic partnerships implemented
3 multilateral strategic partnerships implemented
2 multilateral strategic partnerships implemented
3 multilateral strategic partnerships implemented
Mining Masterplan developed Mining Masterplans developed Drafting of the Masterplan
Drafting of the Masterplan
Stakeholder consultation on the Draft Masterplan
Mining Masterplan submitted to Cabinet for approval
Number of legislative instruments developed/reviewed or amended
2 legislative instruments developed/reviewed or amended
N/A N/A N/A Artisanal and Small-Scale Mining Policy approved by CabinetGeoscience Act Regulations gazetted for implementation
Legislation to improve the nuclear policy and regulatory framework
National Nuclear Regulator Amendment Bill submitted to Cabinet for public consultation
N/A Submit the National Nuclear Regulator Amendment Bill to FOSAD
Consolidate inputs from FOSAD into Nuclear Regulator Amendment Bill
National Nuclear Regulator Amendment Bill Submitted to Cabinet for public consultation
Radioactive Waste Management Fund Bill submitted to Cabinet
Address comments from DPME on SEIAS 1
Compile SEIAS 2 report
Evaluate and address DPME comments
Submit Radioactive Waste Management Fund Bill to Cabinet

D E P A R T M E N T O F M I N E R A L R E S O U R C E S A N D E N E R G Y80
Output indicators Annual targets Q1 Q2 Q3 Q4Regulations on the long-term operation of nuclear installations
Draft Regulations on the long-term operation of nuclear installations published for public comments
N/A N/A N/A Draft Regulations on the long-term operation of nuclear installations published for public comments
Legislation to improve the electricity policy and regulatory framework
National Energy Regulator AmendmentBillcertifiedbyStateLaw Advisor
Proposal on the National Energy Regulator Bill considering comments by Cabinet
N/A National Energy Regulator Bill submitted to State Law Advisor
National Energy Regulator AmendmentBillcertifiedbyState Law Advisor
Electricity Pricing Policy reviewed
Electricity Pricing Policy reviewed and submitted to Cabinet
N/A N/A N/A Electricity Pricing Policy reviewed and submitted to Cabinet
Legislation to improve the gas policy and regulatory framework
Gas Amendment Bill submitted to Cabinet for onward transmission to Parliament
N/A Submit the Gas Amendment Bill to FOSAD
Submit the Gas Amendment Bill to DPME
Gas Amendment Bill submitted to Cabinet for onward transmission to Parliament
Gas Infrastructure Master Plan Draft Gas Master Infrastructure Plan submitted to Cabinet for public comments
N/A N/A N/A Draft Gas Master Infrastructure Plan submitted to Cabinet for public comments
Integrated Energy Plan Draft Integrated Energy Plan submitted to Cabinet for public comments
N/A N/A N/A Draft Integrated Energy Plan submitted to Cabinet for public comments
Framework for municipal infrastructure asset management
Adam Framework submitted to Cabinet for approval
Benchmarking, develop norms and standards for municipal electricity asset management
Finalised Framework Engagement with municipalities to develop implementation protocol
Targetspecificmunicipalitiesforintervention and sign SLAs with those affectedAdam Framework submitted to Cabinet for approval

A N N U A L P E R F O R M A N C E P L A N 2 0 2 0 / 2 1 81
5.3.3 Explanation of planned performance over the medium-term period
This branch will continue to focus on developing and reviewing mining, mineral, upstream and downstream petroleum, together with energy legislation, policies and strategies to encourage investment, growth and transformation in the mining and energy sectors. Key policy development and amendment areas include:
Toenableenergysupplyandencouragethediversificationofenergyresources,thefollowinglegislative instruments will receive focus over the MTSF period:
• National Nuclear Regulator Amendment Bill, Radioactive Waste Management Fund Bill, Gas Amendment Bill, National Energy Regulator Amendment Bill
• Develop an Integrated Energy Plan
Anincreaseinmininginvestmentswillbeencouragedbythedevelopmentandfinalisationof a Mining Masterplan that should result in national priority sectors growing their contributiontoGDPgrowthfromthecurrent3%andexportsincreasingby4%annually.Growth will further be encouraged by improving accessibility through improved response and turnaround times for mining rights applications and the processing of permits. In addition, transitionplanswill befinalised for theenergy sector to improve the stateofgeological infrastructure. These interventions will be augmented by promotional efforts to attract investment to the sector.
Energy security will be encouraged by the establishment of an independent transmission company under Eskom Holdings. A Cabinet Proposal on the National Energy Regulator Bill to amend the NERSA governance structure will be completed in the short term and a Cabinet Proposal of the “end-state” electricity sector is anticipated in the second year of the MTF.
To address environmental outputs and targets, and to comply with environmental and climate obligations and aspirations, and economic growth and poverty alleviation imperatives,
the implementation of IRP2019 is critical. Within the scope of this programme, the National Environmental ManagementAct (NEMA) and Specific Environmental ManagementAct(SEMA) will be amended to support the targeted performance improvements.
Aframework fora just transitiontoa lowcarboneconomywillbefinalised inthefirstyear of the MTSF followed by the development of an engagement framework for affected communities in year two. These milestones will inform the review, update and submission ofarevisedIEPinthefifthyearoftheMTSF.Toenableinjectionofcarbonandreduceemissions, climate change challenges prompt the just transition to a low-carbon economy for which the IRP2019 and the Socio-Economic Impact Assessment System (SEIAS) are crucial. The achievement of this outcome will be further enhanced by the implementation of strengthened stakeholder segmentation, a stakeholder targeting strategy, and a diplomacy framework that will be developed and implemented.
To mitigate competing land use, such as the Spatial Planning and Land Use Management Act (SPLUMA), agriculture, the Square Kilometre Array (SKA), and private land, an intergovernmental relations framework and policy position will be crafted and implemented with assistance from the Council for Geoscience (CGS).
Compliance with statistical and data commitments with national and international bodies and the quality of economic reports and data will be augmented by the development of enabling information technology infrastructure and by partnering with other departmental resources, mine economics, SSM and the South African Revenue Service (SARS). These should assist with resolving issues around the quality and availability of data and statistics.
Furthermore, synergies and alignment will be encouraged to foster greater cohesion to ensure the DMRE is in a better position to meet outputs in support of the department’s outcomes. New partnerships will be implemented or developed and existing ones will be strengthened with SOEs, government organisations and social partners to grow investment potential in the mining and energy sectors.

D E P A R T M E N T O F M I N E R A L R E S O U R C E S A N D E N E R G Y82
5.3.4 Programme resource considerations
Programme 3: Mining, Minerals and Energy Policy Development (Sub-
programmes)
Baseline Medium-term expenditure framework
2016/17 2017/18 2018/19 2019/20 2020/21 2021/22 2022/23
Audited outcome
Audited outcome
Audited outcome
Voted (Main appropriation)
Adjusted appropriation
Revised indicative baseline
Revised indicative baseline
Revised indicative baseline
Rand thousand R’000 R’000 R’000 R’000 R’000 R’000 R’000 R’000Mining, Minerals and Energy Policy Development Management 31 153 28 146 22 432 28 239 28 239 28 178 29 814 31 125 Minerals and Petroleum Policy 37 966 28 680 34 608 34 754 30 447 33 102 35 135 37 486 Nuclear, Electricity and Gas Policy 11 447 11 129 14 066 18 570 18 554 20 998 22 227 23 417 Economic Analysis and Statistics 6 075 5 124 5 895 9 207 8 490 8 575 9 136 10 267 Economic Growth, Promotion and Global Relations 793 544 786 349 888 578 910 171 910 171 876 347 768 823 821 074 Minerals and Energy Planning 18 822 20 453 17 251 25 137 22 977 25 904 27 436 28 797 Total for Programmes 899 007 879 881 982 830 1 026 078 1 018 878 993 104 892 571 952 166
Programme 3: Mining, Minerals and Energy Policy Development
Management (Economic Classification)
Baseline Medium-term expenditure framework
2016/17 2017/18 2018/19 2019/20 2020/21 2021/22 2022/23
Audited outcome
Audited outcome
Audited outcome
Voted (Main appropriation)
Adjusted appropriation
Revised indicative baseline
Revised indicative baseline
Revised indicative baseline
Rand thousand R’000 R’000 R’000 R’000 R’000 R’000 R’000 R’000
Current payments 160 206 144 087 155 828 177 750 170 550 181 342 192 366 203 304
Compensation of employees 99 126 103 281 108 441 120 172 114 472 126 815 134 744 143 488 Salaries and wages 87 442 91 103 95 633 105 103 99 391 111 280 118 239 125 912 Social contributions 11 684 12 178 12 808 15 069 15 081 15 535 16 505 17 576 Goods and services 61 080 40 806 47 387 57 578 56 078 54 527 57 622 59 816 Administrative fees 2 149 975 778 4 270 4 096 3 503 3 754 3 944

A N N U A L P E R F O R M A N C E P L A N 2 0 2 0 / 2 1 83
Programme 3: Mining, Minerals and Energy Policy Development
Management (Economic Classification)
Baseline Medium-term expenditure framework
2016/17 2017/18 2018/19 2019/20 2020/21 2021/22 2022/23
Audited outcome
Audited outcome
Audited outcome
Voted (Main appropriation)
Adjusted appropriation
Revised indicative baseline
Revised indicative baseline
Revised indicative baseline
Rand thousand R’000 R’000 R’000 R’000 R’000 R’000 R’000 R’000Advertising 3 328 5 691 931 4 327 4 368 3 347 3 379 3 326 Minor assets 1 4 - 109 109 115 121 126 Audit costs: External - - 70 - - - - - Catering: Departmental activities 614 407 1 170 1 102 1 092 1 147 1 208 1 251 Communication (G&S) 2 648 890 2 091 1 326 1 089 1 398 1 474 1 534 Computer services 2 061 8 - 54 84 57 60 62 Consultants: Business and advisory services 5 754 3 019 354 9 486 8 248 9 641 10 184 10 581 Legal services (G&S) 296 8 134 10 699 300 483 305 322 334 Contractors 7 1 404 5 531 2 562 2 557 2 665 2 813 2 919 Agency and support/outsourced services - - 585 - - - - -Fleet services (including government motor transport) 301 251 280 - 2 - - -Consumable supplies 111 54 71 229 255 238 253 261 Consumables:Stationery,printingandofficesupplies 1 038 298 637 1 856 1 553 1 847 1 953 2 035 Operating leases 585 431 18 - 10 - - - Rental and hiring 29 924 472 2 310 2 310 2 353 2 483 2 576 Transport provided: Departmental activity 180 - - - - - - - Travel and subsistence 16 398 11 417 13 001 16 829 16 892 15 509 16 476 17 197 Training and development 244 269 282 939 939 888 942 979 Operating payments 20 704 7 334 3 616 7 816 7 837 7 446 7 897 8 216 Venues and facilities 4 632 (704) 6 801 4 063 4 154 4 068 4 303 4 475 Transfers and subsidies 738 248 735 087 826 926 848 234 848 234 811 663 700 101 748 751
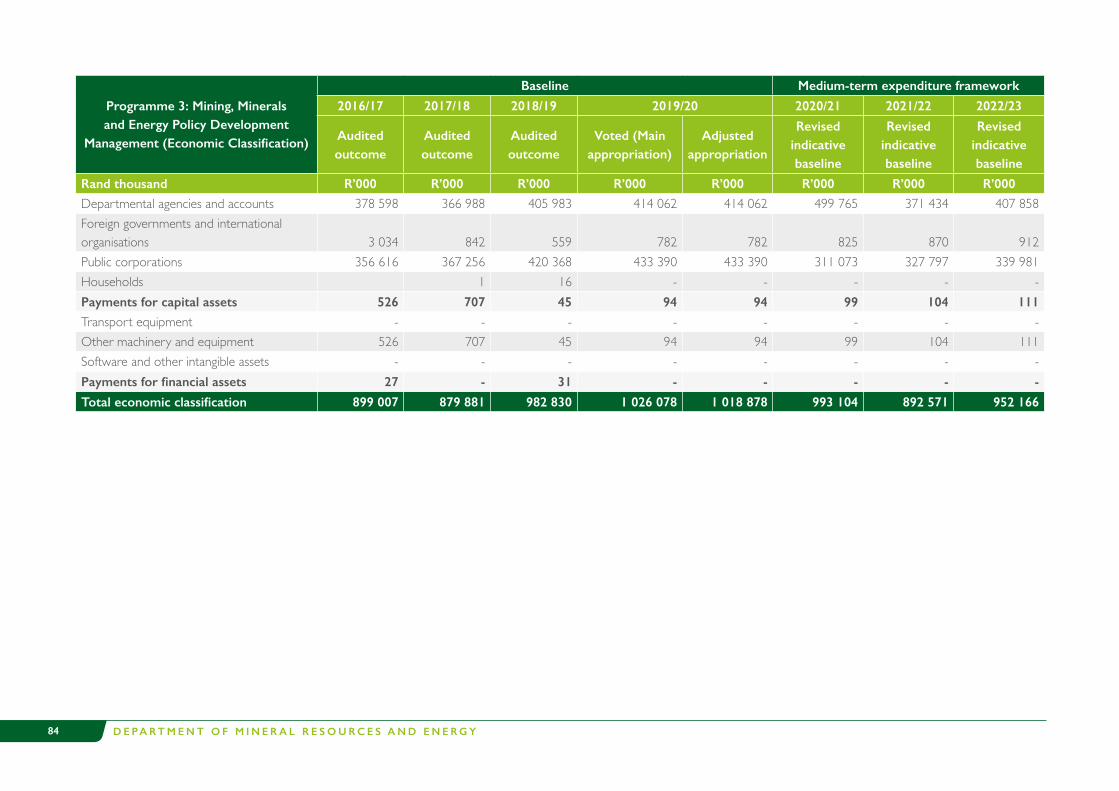
D E P A R T M E N T O F M I N E R A L R E S O U R C E S A N D E N E R G Y84
Programme 3: Mining, Minerals and Energy Policy Development
Management (Economic Classification)
Baseline Medium-term expenditure framework
2016/17 2017/18 2018/19 2019/20 2020/21 2021/22 2022/23
Audited outcome
Audited outcome
Audited outcome
Voted (Main appropriation)
Adjusted appropriation
Revised indicative baseline
Revised indicative baseline
Revised indicative baseline
Rand thousand R’000 R’000 R’000 R’000 R’000 R’000 R’000 R’000Departmental agencies and accounts 378 598 366 988 405 983 414 062 414 062 499 765 371 434 407 858 Foreign governments and international organisations 3 034 842 559 782 782 825 870 912 Public corporations 356 616 367 256 420 368 433 390 433 390 311 073 327 797 339 981 Households 1 16 - - - - - Payments for capital assets 526 707 45 94 94 99 104 111 Transport equipment - - - - - - - - Other machinery and equipment 526 707 45 94 94 99 104 111 Software and other intangible assets - - - - - - - - Payments for financial assets 27 - 31 - - - - -
Total economic classification 899 007 879 881 982 830 1 026 078 1 018 878 993 104 892 571 952 166

A N N U A L P E R F O R M A N C E P L A N 2 0 2 0 / 2 1 85
Programme 3: Mining, Minerals and Energy Policy Development
Management (Transfer Payments)
Baseline Medium-term expenditure framework
2016/17 2017/18 2018/19 2019/20 2020/21 2021/22 2022/23
Audited outcome
Audited outcome
Audited outcome
Voted (Main appropriation)
Adjusted appropriation
Revised indicative baseline
Revised indicative baseline
Revised indicative baseline
Beneficiary R’000 R’000 R’000 R’000 R’000 R’000 R’000 R’000Employeesocialbenefits - 1 16 - - - - - International Energy Forum 3 034 275 - - - - - - Generation IV International Forum - 567 559 782 782 825 870 912 MINTEK 315 152 310 705 319 213 370 208 370 208 276 768 291 605 302 443 MINTEK 41 264 56 551 31 155 63 182 63 182 34 305 36 192 37 538 Council for Geoscience 341 708 330 574 311 613 410 553 410 553 496 063 367 528 407 858 Council for Geoscience 36 890 35 414 3 323 3 509 3 509 3 702 3 906 - MINTEK: Expanded Public Works Programme - - - - - - - - State Diamond Trader 200 - - - - - - - Council for Geoscience: Economic competitiveness and support package - - 90 000 - - - - - MINTEK: Economic competitiveness and support package - - 70 000 - - - - - Council for Geoscience: Expanded Public Works Programme - 1 000 1 047 - - - - - Total 738 248 735 087 826 926 848 234 848 234 811 663 700 101 748 751

D E P A R T M E N T O F M I N E R A L R E S O U R C E S A N D E N E R G Y86
5.4 Programme 4: Mine Health and Safety Inspectorate (MHSI)
Purpose: Ensure health and safety of employees in the mines
Functions:• Promote health and safety• Contribute to skills development and transformation• Implement Service Level Agreements (SLAs)• Develop and review internal processes• Improve turnaround times• Promote corporate governance
The MHSI strives towards a safe and healthy mining industry. This is to be achieved by reducing mining related deaths, injuries and ill health through the formulation of national
policy and legislation, the provision of advice, and the application of systems that monitor and enforce compliance with the law in the mining sector.
Link to the Balanced Scorecard Framework
This programme supports the Policy and Regulatory Perspective of the BSC as it relates to:• Regulatory processes• Industry – safety of women • Trade and investment
MTSF alignment
The MHSI is dedicated to matching the 7 National Priorities where it is capable. The decent employment through inclusive growth outcome of the Programme supports MTSF Priorities 1, 2, and 4.
5.4.1 Outcomes, outputs, performance indicators and targets
Outcome Outputs Outputindicators
Annual targets
Audited/Actual performance Estimated performance
MTEF period
2016/17 2017/18 2018/19 2019/20 2020/21 2021/22 2022/23
Improved and streamlined regulatory, service delivery, operational, health and safety processes and collaboration across regulators and relevant role players
%improvement in mine health and safety parameters
%reductioninoccupationalfatalities 10% 10% 10% 10% 10% 10% 10%%reductioninoccupationalinjuries 5% 5% 5% 5% 5% 5% 5%%reductioninoccupationaldiseases(IncludingTB) 10% 10% 10% 10% 10% 10% 10%%ofinvestigationscompleted(InitiatedvsCompleted) 80% 80% 80% 80% 80% 80% 80%
%ofinquiriescompleted(Initiatedvscompleted) 80% 80% 80% 80% 80% 80% 80%Number of qualitative inspections conducted (cumulative) 8 000 8 000 8 000 8 000 8 000 8 000 8 000

A N N U A L P E R F O R M A N C E P L A N 2 0 2 0 / 2 1 87
5.4.2 Output indicators: Annual and quarterly targets
Output indicatorsAnnual targets
Q1 Q2 Q3 Q4
%reductioninoccupationalfatalities 10% 10% 10% 10% 10%%reductioninoccupationalinjuries 5% 5% 5% 5% 5%%reductioninoccupationaldiseases(IncludingTB) 10% 10% 10% 10% 10%%ofinvestigationscompleted(InitiatedvsCompleted) 80% 80% 80% 80% 80%%ofinquiriescompleted(InitiatedvsCompleted) 80% 80% 80% 80% 80%Number of qualitative inspections conducted (cumulative) 8 000 2 000 2 000 2 000 2 000
5.4.3 Explanation of planned performance over the medium-term period
The outputs of this programme will be achieved by promoting health and safety and contributingtoskillsdevelopmentandtransformation.Pursuinganefficient,effectiveanddevelopment oriented public service, and empowering, fair and inclusive citizenship, will assist with establishing improved and streamlined regulatory, service delivery, operational, health and safety processes and collaboration across regulators and relevant role players. This will be achieved by promoting corporate governance and improving turnaround times. MHSI’s economic transformation and job creation focus promotes health and safety through the
implementation of the OHS Improvement Strategy. The inspectorate engages continuously with mine management and executives and analyses the outcomes of inspection and audits. In addition, it conducts OHS imbizos and campaigns as required.
Other initiatives include the promotion and implementation of the OHS small-scale guidelines, dissemination of OHS information, and the implementation of the Enforcement Manual for Inspectors and Legal Framework. The review inspections and audit tools will be improved, and major accidents will be analysed to improve investigations. Further initiatives include the development of annual regional inspection plans, conducting qualitative inspections, and planning and conducting workshops.

D E P A R T M E N T O F M I N E R A L R E S O U R C E S A N D E N E R G Y88
5.4.4 Programme resource considerations
Programme 4: Mine Health and Safety Inspectorate (Sub-programmes)
Baseline Medium-term expenditure framework
2016/17 2017/18 2018/19 2019/20 2020/21 2021/22 2022/23
Audited outcome
Audited outcome
Audited outcome
Voted (Main appropriation)
Adjusted appropriation
Revised indicative baseline
Revised indicative baseline
Revised indicative baseline
Rand thousand R’000 R’000 R’000 R’000 R’000 R’000 R’000 R’000Mine Health and Safety Management 35 869 40 934 40 535 56 593 59 793 55 960 63 994 66 425 Mine Health and Safety Regions 143 127 152 482 156 595 148 711 148 711 159 469 169 601 175 956 Occupational Health 12 277 11 959 13 200 15 262 16 262 17 265 18 403 19 093 Total for Programmes 191 273 205 375 210 330 220 566 224 766 232 694 251 998 261 474
Programme 4: Mine Health and Safety Inspectorate (Economic Classification)
Baseline Medium-term expenditure framework
2016/17 2017/18 2018/19 2019/20 2020/21 2021/22 2022/23
Audited outcome
Audited outcome
Audited outcome
Voted (Main appropriation)
Adjusted appropriation
Revised indicative baseline
Revised indicative baseline
Revised indicative baseline
Rand thousand R’000 R’000 R’000 R’000 R’000 R’000 R’000 R’000
Current payments 188 377 196 108 203 119 213 414 217 614 229 434 244 124 253 271
Compensation of employees 158 029 165 879 171 111 178 335 182 535 192 426 205 083 212 770 Salaries and wages 139 666 146 398 150 612 156 628 160 828 168 855 179 962 186 706 Social contributions 18 363 19 481 20 499 21 707 21 707 23 571 25 121 26 064 Goods and services 30 348 30 229 32 008 35 079 35 079 37 008 39 041 40 501 Administrative fees 207 220 261 480 480 505 534 557 Advertising 69 - - 243 243 256 270 280 Minor assets 13 22 10 80 80 84 89 92 Catering: Departmental activities 42 238 27 186 186 197 207 215 Communication (G&S) 2 874 532 1 083 1 247 1 247 1 321 1 393 1 445 Computer services - - 40 950 950 995 1 049 1 088

A N N U A L P E R F O R M A N C E P L A N 2 0 2 0 / 2 1 89
Programme 4: Mine Health and Safety Inspectorate (Economic Classification)
Baseline Medium-term expenditure framework
2016/17 2017/18 2018/19 2019/20 2020/21 2021/22 2022/23
Audited outcome
Audited outcome
Audited outcome
Voted (Main appropriation)
Adjusted appropriation
Revised indicative baseline
Revised indicative baseline
Revised indicative baseline
Rand thousand R’000 R’000 R’000 R’000 R’000 R’000 R’000 R’000Consultants: Business and advisory services 1 375 469 263 2 159 2 159 2 260 2 385 2 474 Legal services (G&S) 506 749 676 900 900 949 1 002 1 039 Contractors 207 174 141 277 277 293 308 319 Entertainment - - - 5 5 5 5 5 Fleet services (including government motor transport) 269 318 377 3 196 3 196 3 378 3 563 3 696 Inventory: Food and food supplies - - - 2 2 2 2 2 Consumable supplies 434 454 452 596 596 627 661 686 Consumables:Stationery,printingandofficesupplies 879 650 786 2 332 2 332 2 459 2 594 2 691 Operating leases 37 44 35 30 30 32 33 34 Rental and hiring - - - 6 6 6 7 7 Travel and subsistence 22 700 25 813 27 027 20 292 20 292 21 432 22 610 23 455 Training and development 230 176 407 825 825 869 918 952 Operating payments 337 254 375 523 523 548 578 600 Venues and facilities 169 116 48 750 750 790 833 864 Transfers and subsidies 1 716 7 880 6 656 6 382 6 382 2 448 7 017 7 297 Departmental agencies and accounts 1 716 7 880 6 656 6 382 6 382 2 448 7 017 7 297 Payments for capital assets 280 1 387 93 770 770 812 857 906 Transport equipment - - - - - - - - Other machinery and equipment 280 1 387 93 770 770 812 857 906 Software and other intangible assets - - - - - - - - Payments for financial assets 900 - 462 - - - - -
Total economic classification 191 273 205 375 210 330 220 566 224 766 232 694 251 998 261 474

D E P A R T M E N T O F M I N E R A L R E S O U R C E S A N D E N E R G Y90
Programme 4: Mine Health and Safety Inspectorate (Transfer Payments)
Baseline Medium-term expenditure framework
2016/17 2017/18 2018/19 2019/20 2020/21 2021/22 2022/23
Audited outcome
Audited outcome
Audited outcome
Voted (Main appropriation)
Adjusted appropriation
Revised indicative baseline
Revised indicative baseline
Revised indicative baseline
Beneficiary R’000 R’000 R’000 R’000 R’000 R’000 R’000 R’000Mine Health and Safety Council - 6 162 4 803 4 386 4 386 344 4 777 4 973 MiningQualificationsAuthority 1 716 1 718 1 853 1 996 1 996 2 104 2 240 2 324 Total 1 716 7 880 6 656 6 382 6 382 2 448 7 017 7 297
5.5 Programme 5: Programmes and Projects
Purpose: To manage, coordinate and monitor Energy and Minerals Programmes and Projects
Functions:• OverseetheNationalElectrificationProgramme• Ensure management of programmes and projects function• Oversee programme and projects focused on the development, improvement,
transformation of electricity generation, transmission and distribution• Provide strategic guidance on environmental management and climate change• Advanceenergyefficiencyacrossallsectors• Ensure integration of renewable energy initiatives into mainstream energy supply in
South Africa
Link to Balanced Scorecard
The Programme and Projects Programme links to different perspectives of the BSC:• Governance and Financial Perspective with regards to secure funding for strategic
projects
• Policy and Regulatory Perspective relating to service delivery• Stakeholder Perspective as it relates to infrastructure and energy availability• Economic Perspective linking to economic transformation and job creation and
transformed,diversifiedandsustainablemineralsandenergysectors
MTSF alignment
The Programmes and Projects Branch responds to the MTSF Priorities through several interventions. The deliverables of this branch will enhance access to affordable energy, increased investment in energy infrastructure through electrification, energy efficiencyand demand side management initiatives and small-scale renewable energy initiatives. Industrialisation through the development of the Regional Energy Masterplan, Renewable Energy Sector Master Plan, and economic growth and job creation through energy projects and small-scale mining. This applies to Integrated Energy Centres (IeCs), and women and youth empowerment programmes in the energy and mining sectors.

A N N U A L P E R F O R M A N C E P L A N 2 0 2 0 / 2 1 91
5.5.1 Outcomes, outputs, performance indicators and targets
Outcome Outputs Outputindicators
Annual targets
Audited/Actual performance Estimated performance
MTEF period
2016/17 2017/18 2018/19 2019/20 2020/21 2021/22 2022/23Supply of electricity secured
Increased energy security
Additional megawatts commissioned
Increased electricity reserve margin
Increased share of alternative energy sources
N/A N/A N/A N/A Emergency power contracting (Power Purchase Agreements in place)
Emergency power brought online based on available capacity and affordability
2 600 MW from renewable energy and 513 MW of storage brought online in line with IRP2019
Improved energy efficiencyacross all sectors
Energy savings verifiedandquantified
Number of energy savings realisedandverifiedfromEEDSM projects
Verifiedenergy savings from EEDSM initiatives
0.5 TWh of energysavings realised and verifiedfromEEDSMprojects
Provide oversight on the achievement of 0.5 TWh and the funding of this target
0.5 TWh of energysavings realised andverifiedfromEEDSMprojects
0.5 TWh savings realised and verifiedfromEEDSM projects
0.5 TWh savings realised and verifiedfromEEDSM projects
0.5 TWh savings realised and verifiedfromEEDSM projects
N/A N/A N/A N/A Energy consumption baselines from 15 new additional municipalities
Energy consumption baselines from 15 new additional municipalities
Energy consumption baselines from 15 new additional municipalities
NationalEnergyEfficiencyStrategy for economy- wide developed
N/A N/A N/A N/A Reviewed post-2015 National EnergyEfficiencyStrategy
Analysis report of energy consumption of 4 (of 8) sectors developed
Energy savings potentials and measures of 4 (of 8) sectors developed

D E P A R T M E N T O F M I N E R A L R E S O U R C E S A N D E N E R G Y92
Outcome Outputs Outputindicators
Annual targets
Audited/Actual performance Estimated performance
MTEF period
2016/17 2017/18 2018/19 2019/20 2020/21 2021/22 2022/23Renewable energy deployment integrated into energy supply
Improved access to hot water for poor households
No. of SWHs installed quarterlyinbeneficiaryhouseholds in participating municipalities
Completed SolarWater HeatingImplementation Plan
Procure about 50 000 baseline systems with a local content exceeding 70%
Increase the number of procured baseline systems in line with budget allocation; target youth trained under accredited programmes to install the systems at target municipalities
Report on roll-out of 87 000 procured SWH baseline systems in 19 municipalities
4 Quarterly Reports on installation of 87 000 procured SWH baseline systems in 18 municipalities
4 Quarterly Reports on the roll out of SWH in approved municipalities (i.e. based allocated budget)
4 Quarterly Reports on roll-out of SWH in approved municipalities(i.e. based allocated budget)
Effective deployment of renewable energy
Renewable Energy (RE) Sector Master Plan developed
N/A N/A N/A N/A Renewable Energy (RE) Sector Master Planfinalised
1 Report on the implementation on RE Sector Master Plan
1 Report on the implementation on RE Sector Master Plan
Number of quarterly reportsonVerifiedWindAtlas 3 for South Africa (WASA)
N/A N/A N/A N/A 1 WASA 3 Results Report developed
1 Synthesis report on the implementation SAWEP (Phase 1, 2, and 3)
N/A

A N N U A L P E R F O R M A N C E P L A N 2 0 2 0 / 2 1 93
Outcome Outputs Outputindicators
Annual targets
Audited/Actual performance Estimated performance
MTEF period
2016/17 2017/18 2018/19 2019/20 2020/21 2021/22 2022/23State of Geological Infrastructure Improved
AMD mitigated
Number of strategies developed for AMD Mitigation
N/A N/A N/A 1 strategy developed
1 strategy implemented
1 strategy implemented
1 strategy implemented
Number of mine water/wastewater management plans implemented
N/A N/A N/A 1 1 1 0
Outcome Outputs Outputindicators
Annual targets
Audited/Actual performance Estimated performance
MTEF period
2016/17 2017/18 2018/19 2019/20 2020/21 2021/22 2022/23Improve capacity to deliver basic services
Households electrifiedthrough grid connection
Number of Quarterly Reports on the allocation of funding and the monitoring of implementation of grid electrificationofadditionalhouseholds by Eskom and municipalities
235 000 235 000 200 000 4 Quarterly Reports on the allocation of funding and the monitoring of implementation of grid electrificationof additional households by Eskom and municipalities
4 Quarterly Reports on the allocation of funding and the monitoring of implementation of gridelectrificationof additional households by Eskom and municipalities
4 Quarterly Reports on the allocation of funding and the monitoring of implementation of gridelectrificationof additional households by Eskom and municipalities
4 Quarterly Reports on the allocation of funding and the monitoring of implementation of gridelectrificationof additional households by Eskom and municipalities
No. of households electrifiedthroughnon-grid connection
20 000 20 000 15 000 20 000 additional households electrifiedthrough non-grid electricity
15 000 additional households electrifiedthrough non-grid electricity
15 000 additional households electrifiedthrough non-grid electricity
15 000 additional households electrifiedthrough non-grid electricity
State of geological infrastructure improved
Improve capacity to deliver basic services
AMD mitigated
Number of strategies developed for AMD mitigation
N/A N/A N/A 1 strategy developed
1 strategy developed
1 strategy developed
1 strategy developed
Number of mine water/wastewater management plans implemented
N/A N/A N/A N/A 1 1 1

D E P A R T M E N T O F M I N E R A L R E S O U R C E S A N D E N E R G Y94
5.2.2 Output indicators: Annual and quarterly targets
Output indicators Annual targets Q1 Q2 Q3 Q4Additional megawatts commissioned
Increased electricity reserve margin
Increased share of alternative energy sources
Emergency Power Contracting (Power Purchase Agreements in place)
Finalise and release Request for Procurement of new generation capacity in line with Section 34 Determination for Emergency Power
N/A Finalise and release Request for Procurement of new generation capacity in line with Section 34 Determination for long-term power
Emergency Power Contracting (Power Purchase Agreements in place)
Number of strategies developed for AMD Mitigation
1 strategy implemented - - - 1 strategy developed
Number of mine water/wastewater management plans implemented
1 - - - 1
Number of Quarterly Reports on the allocation of funding and the monitoring of implementation of grid electrificationofadditionalhouseholds by Eskom and municipalities
4 Quarterly Reports on the allocation of funding and the monitoring of implementation of grid electrificationofadditionalhouseholds by Eskom and municipalities
1 Quarterly Reports on the allocation of funding and the monitoring of implementation of grid electrificationofadditionalhouseholds by Eskom and municipalities
1 Quarterly Reports on the allocation of funding and the monitoring of implementation of grid electrificationofadditionalhouseholds by Eskom and municipalities
1 Quarterly Reports on the allocation of funding and the monitoring of implementation of grid electrificationofadditionalhouseholds by Eskom and municipalities
1 Quarterly Reports on the allocation of funding and the monitoring of implementation of grid electrificationofadditionalhouseholds by Eskom and municipalities
No.ofhouseholdselectrifiedthrough non-grid connection
15 000 additional householdselectrifiedthrough non-grid electricity
Conclude allocations and contracting with service providers in line with allocations and budget
2 000 additional households electrifiedthroughnon-gridelectricity
5 000 additional households electrifiedthroughnon-gridelectricity
8 000 additional households electrifiedthroughnon-gridelectricity

A N N U A L P E R F O R M A N C E P L A N 2 0 2 0 / 2 1 95
Output indicators Annual targets Q1 Q2 Q3 Q4Number TWh savings realisedandverifiedfromEEDSM projects
0.5 TWh savings realised andverifiedfromEEDSMprojects
Report on the number of EEDSMprojectsidentified
Report on the energy savings (TWh) to be achievedfromtheidentifiedEEDSM projects
Progress report on the implementation of the identifiedEEDSMprojectsand achieved savings
Quantificationofenergysavings achieved from municipal EEDSM projects
0.5 TWh savings realised andverifiedfromEEDSMprojects
Number of quarterly reports on energy consumption baselines from 15 additional municipalities developed
4 Quarterly Reports on Energy consumption baselines from 15 additional municipalities developed
Report on the consultation withidentified15additionalmunicipalities
Report on the number of energy consumption baselines
Report on the number of energy consumption baselines
Report on the development of energy consumption baselines from 15 additional municipalities
NationalEnergyEfficiencyStrategy for economy-wide sector developed
Final Draft 2015 NEES submitted for Cabinet consideration
Submission of 2015 NationalEnergyEfficiencyStrategy draft document
N/A N/A Final Draft 2015 NEES submitted for Cabinet consideration
Number of reports on installedSWHsinbeneficiaryhouseholds in participating municipalities
4 Quarterly Reports on installation of 87 000 procured SWH baseline systems in 18 municipalities
1 Quarterly Report on installation of 87 000 procured SWH baseline systems in 18 municipalities
1 Quarterly Report on installation of 87 000 procured SWH baseline systems in 18 municipalities
1 Quarterly Report on installation of 87 000 procured SWH baseline systems in 18 municipalities
1 Quarterly Report on installation of 87 000 procured SWH baseline systems in 18 municipalities
Renewable Energy (RE) Sector Masterplan developed
Renewable Energy (RE) Sector Masterplan developed
Terms of Reference (ToRs) for the RE Sector Masterplanfinalised
N/A N/A Renewable Energy (RE) Sector Masterplan Report developed
1 WASA 3 Results Report developed
Report on measurement parameters for respective (4) measurements stations
Report on measurement parameters for respective (4) WASA measurements stations
Report on measurement parameters for respective (4) measurements stations
1 WASA 3 Results Report developed

D E P A R T M E N T O F M I N E R A L R E S O U R C E S A N D E N E R G Y96
5.5.3 Explanation of planned performance over the medium-term period
The Programmes and Projects Branch will pursue effective implementation, in line with the project management framework. The effective tools to enable project implementation, monitoring and evaluation, such as the information management system, will be pursued to ensure that theProjectManagementOffice is capacitated andoperational in year2 of the MTSF period. This functionality is a critical dependency in ensuring that the IRP2019 technologies are scoped and project managed to achieve the outputs translating to increased investment, increased energy availability factor, increased electricity reserve margin, additional MW commissioned and access to alternative energy sources.
The various energy interventions incorporated in the IRP2019 will lead to improved energy infrastructure and increased access to more affordable energy. Affordable energy will be enabled by a streamlined regulatory environment. To this extent, and to further improve energy security, the Programmes and Projects Branch will direct efforts in thefirstyearof theMTSFat interventions in the formofexpeditingPowerPurchaseAgreements.
The Programmes and Projects Branch will oversee the implementation of the Energy Efficiency and Demand Side Management Programme (EEDSM) that supportsmunicipalities with the primary objective of reducing electricity consumption in municipal infrastructure.
TheEEDSMinitiativeisefficiencytechnology-basedandrangesfromlighting(retrofittingofstreet,trafficandbuildinglightingandenhancingefficiency)inwasteandwastewaterpumpingsystemstocouplingbothrenewableandenergyefficiencythroughtheBudgetSupport Programme. The reduction of electricity consumption by municipalities is not only critical in light of the amount of electricity the municipalities utilise in providing basic services but also provides opportunities to create jobs and reduce emissions.
In addition, the roll-out on the Solar Water Heater Programme in various municipalities remains one of the national programmes overseen by the branch which also has the potential to create jobs, build skills capacity and strengthen solar manufacturing capacity in the country.
The Programmes and Projects Branch will focus on the development of supporting strategies to improve the state of geological infrastructure. These include the development of a strategy for acid mining drainage (AMD) mitigation and the implementation of mine water/wastewater management plans.
The ProjectManagementOfficewill be key for integrating functions, resources, jointworking frameworks, procurement, etc., to create synergies across the department, its entities and external parties, through participation in joined-up plans to optimise the use of resources and to direct and mobilise funding in the priority energy and mining investment areas.

A N N U A L P E R F O R M A N C E P L A N 2 0 2 0 / 2 1 97
5.5.4 Programme resource considerations
Programme 5: Mineral and Energy Resources Programmes and Projects (Sub-programmes)
Baseline Medium-term expenditure framework
2016/17 2017/18 2018/19 2019/20 2020/21 2021/22 2022/23
Audited outcome
Audited outcome
Audited outcome
Voted (Main appropriation)
Adjusted appropriation
Revised indicative baseline
Revised indicative baseline
Revised indicative baseline
Rand thousand R’000 R’000 R’000 R’000 R’000 R’000 R’000 R’000Programmes and Projects Management 2 410 1 864 2 287 5 058 5 058 3 656 3 871 4 088 IntegratedNationalElectrificationProgramme 5 630 619 6 111 174 5 320 997 5 484 630 5 234 630 5 116 465 5 258 378 6 075 947 ProgrammesandProjectsManagementOffice 38 434 29 911 33 348 53 852 50 852 66 641 70 365 71 563 RegionalProgrammesandProjectsManagementOffice 19 650 18 271 20 174 20 947 20 947 22 103 23 424 26 172 Electricity Infrastructure and Industry Transformation 5 573 8 413 6 060 6 906 6 906 9 134 9 676 10 227 EnergyEfficiencyProjects 527 139 537 514 344 775 318 911 318 911 326 143 344 038 360 707 Renewable Energy Projects 25 240 64 204 75 824 80 070 80 070 85 736 90 483 94 892 Environmental Management Projects 9 438 16 795 11 015 23 564 23 564 168 237 177 450 186 089 Total for Programmes 6 258 503 6 788 146 5 814 480 5 993 938 5 740 938 5 798 115 5 977 685 6 829 685
Programme 5: Mineral and Energy Resources Programmes and Projects (Economic
Classification)
Baseline Medium-term expenditure framework
2016/17 2017/18 2018/19 2019/20 2020/21 2021/22 2022/23
Audited outcome
Audited outcome
Audited outcome
Voted (Main appropriation)
Adjusted appropriation
Revised indicative baseline
Revised indicative baseline
Revised indicative baseline
Rand thousand R’000 R’000 R’000 R’000 R’000 R’000 R’000 R’000
Current payments 119 172 196 291 226 362 205 899 205 899 240 686 244 732 256 368
Compensation of employees 75 606 76 704 83 482 91 729 91 729 103 947 109 788 116 947 Salaries and wages 66 612 67 483 73 415 80 936 80 895 91 216 96 339 102 620 Social contributions 8 994 9 221 10 067 10 793 10 834 12 731 13 449 14 327 Goods and services 43 566 119 587 142 880 114 170 114 170 136 739 134 944 139 421 Administrative fees 1 557 1 124 732 1 342 1 154 1 473 1 548 1 609

D E P A R T M E N T O F M I N E R A L R E S O U R C E S A N D E N E R G Y98
Programme 5: Mineral and Energy Resources Programmes and Projects (Economic
Classification)
Baseline Medium-term expenditure framework
2016/17 2017/18 2018/19 2019/20 2020/21 2021/22 2022/23
Audited outcome
Audited outcome
Audited outcome
Voted (Main appropriation)
Adjusted appropriation
Revised indicative baseline
Revised indicative baseline
Revised indicative baseline
Rand thousand R’000 R’000 R’000 R’000 R’000 R’000 R’000 R’000Advertising 3 457 145 179 1 015 275 1 099 1 160 1 207 Minor assets - - 14 19 19 20 22 23 Bursaries: Employees - - - - 324 - - - Catering: Departmental activities 1 783 1 159 1 307 1 058 1 327 1 072 1 132 1 181 Communication (G&S) 1 230 722 790 992 862 1 080 1 141 1 187 Computer services - - - - - 3 199 3 253 1 233 Consultants: Business and advisory services 7 819 742 7 274 80 054 69 605 93 629 89 571 92 012 Legal services (G&S) 359 - - - - - - - Contractors 656 2 987 4 386 25 10 164 3 132 3 304 3 432 Agency and support/outsourced services 1 100 - - 10 063 - 10 616 11 200 11 614 Fleet services (including government motor transport) 546 416 240 30 47 32 34 36 Inventory: Clothing material and accessories - - - - 1 - - - Consumable supplies 279 72 270 270 335 292 309 324 Consumables:Stationery,printingandofficesupplies 385 189 161 587 405 805 848 887 Operating leases 839 686 253 - 29 - - - Rental and hiring - 46 14 - 56 150 158 164 Property payments 24 - - - - - - - Transport provided: Departmental activity 114 73 41 - 92 - - - Travel and subsistence 16 231 12 385 14 624 14 955 14 054 15 296 16 146 19 157 Training and development 8 63 86 100 100 134 141 148 Operating payments 1 057 89 324 110 378 359 12 672 382 404 423 Venues and facilities 6 122 9 454 2 131 3 301 2 649 4 328 4 573 4 784 Transfers and subsidies 6 139 135 6 591 660 5 588 106 5 787 961 5 534 961 5 557 347 5 732 866 6 573 224

A N N U A L P E R F O R M A N C E P L A N 2 0 2 0 / 2 1 99
Programme 5: Mineral and Energy Resources Programmes and Projects (Economic
Classification)
Baseline Medium-term expenditure framework
2016/17 2017/18 2018/19 2019/20 2020/21 2021/22 2022/23
Audited outcome
Audited outcome
Audited outcome
Voted (Main appropriation)
Adjusted appropriation
Revised indicative baseline
Revised indicative baseline
Revised indicative baseline
Rand thousand R’000 R’000 R’000 R’000 R’000 R’000 R’000 R’000Municipalities 2 131 871 2 290 284 2 119 501 2 090 393 2 090 393 2 076 746 2 233 140 2 361 959 Departmental agencies and accounts 20 625 59 774 70 241 74 151 74 151 99 375 104 841 109 628 Foreign governments and international organisations 2 216 1 015 1 527 2 902 2 902 3 062 3 231 3 354 Public corporations 3 846 648 4 081 626 3 262 031 3 401 368 3 148 368 3 151 471 3 152 494 3 852 634 Private enterprises 137 733 158 960 134 555 219 147 219 147 226 693 239 160 245 649 Households 42 1 251 - - - - - Payments for capital assets 147 195 12 78 78 82 87 93 Transport equipment - - - - - - - - Machinery and equipment 147 195 12 78 78 82 87 93 Software and other intangible assets - - - - - - - - Payments for financial assets 49 - - - - - - -
Total economic classification 6 258 503 6 788 146 5 814 480 5 993 938 5 740 938 5 798 115 5 977 685 6 829 685

D E P A R T M E N T O F M I N E R A L R E S O U R C E S A N D E N E R G Y100
Programme 5: Mineral and Energy Resources Programmes and Projects (Transfer Payments)
Baseline Medium-term expenditure framework
2016/17 2017/18 2018/19 2019/20 2020/21 2021/22 2022/23
Audited outcome
Audited outcome
Audited outcome
Voted (Main appropriation)
Adjusted appropriation
Revised indicative baseline
Revised indicative baseline
Revised indicative baseline
Beneficiary R’000 R’000 R’000 R’000 R’000 R’000 R’000 R’000INEP-Non-gridElectrificationProjects 137 733 158 960 134 555 212 941 212 941 220 160 232 269 238 502 INEP Eskom Grant 3 526 334 3 846 154 3 262 031 3 374 053 3 124 053 3 001 483 2 994 257 3 688 162 INEP Municipal Grant 1 946 246 2 087 048 1 904 477 1 863 328 1 863 328 1 858 752 2 003 157 2 118 668 Employeesocialbenefits 42 1 251 - - - - - South African National Energy Development Institute 20 625 59 774 70 241 74 151 74 151 78 215 82 517 86 478 Various institutions: Solar Water Heater Project 320 314 235 472 - - - - - -International Renewable Energy Agency 2 216 1 015 1 177 1 201 1 201 1 267 1 337 1 401 International Energy Forum - - 350 356 356 376 397 416 InternationalPartnershipforEnergyEfficiencyCooperation - - - 1 345 1 345 1 419 1 497 1 537 Energyefficiencyanddemandsidemanagementgrant 185 625 203 236 215 024 227 065 227 065 217 994 229 983 243 291 Industrial Development Corporation - - - 24 683 21 683 25 924 27 350 28 720 Various institutions: Water management solutions subsidies for marginal mines - - - 6 206 6 206 6 533 6 891 7 147 Council for Geoscience 21 160 22 324 23 150 MINTEK: Expanded public works programme - - - 2 632 2 632 2 775 2 927 3 036 MINTEK 121 289 127 960 132 716 Total 6 139 135 6 591 660 5 588 106 5 787 961 5 534 961 5 557 347 5 732 866 6 573 224

A N N U A L P E R F O R M A N C E P L A N 2 0 2 0 / 2 1 101
5.6 Programme 6: Nuclear
Purpose: To manage the South African nuclear energy industry and control nuclear material in terms of international obligations, nuclear legislation and policies to ensure the peaceful use of nuclear energy
Functions:• Manage and implement all matters relating to nuclear safety and technology, as
required by legislation and international agreements • Manage and implement all matters related to nuclear non-proliferation and radiation
security as required by legislation and international agreements
Link to Balanced Scorecard
This Programme links to the Policy and Regulatory Perspective in respect of Policy, Research, Technology, and Innovation; and Regulatory in terms of operational service delivery and nuclear health and safety processes. The link to the Stakeholder Perspective relates to infrastructure investment and development.
MTSF alignment
The Nuclear Programme aims to address the challenge of inadequate security of supply of electricityhighlighted intheMTSF.Self-sufficiency intheutilisationofnucleartechnologyin the entire nuclear value chain, improved security of energy supply, utilisation of nuclear technology and improved nuclear security will respond to the requirement to secure the supply of energy. In addition, the Nuclear Branch aims to promote nuclear energy as an important electricity supply option through the establishment of a national industrial capability for the design, manufacture and construction of nuclear energy systems.
The Nuclear Energy Policy will establish the necessary governance structures for a nuclear new build programme; create a framework for safe and secure utilisation of nuclear energy with minimal environmental impact; contribute to the country’s national programme of social and economic transformation, growth and development; guide in the actions to develop, promote, support, enhance, sustain and monitor the nuclear energy sector in South Africa; exercise control over unprocessed uranium ore for exportpurposesforthebenefitoftheSouthAfricaneconomy;establishmechanismstoensure the availability of land (nuclear sites) for future nuclear power generation; allow for the participation of public entities in the uranium value chain; improve the quality of human life; support the advancement of science and technology; reduce greenhouse gas emissions; and play an active role in the skills development related to nuclear energy.

D E P A R T M E N T O F M I N E R A L R E S O U R C E S A N D E N E R G Y102
5.6.1 Outcomes, outputs, performance indicators and targets
Outcome Outputs Outputindicators
Annual targets
Audited/Actual performance Estimated performance
MTEF period
2016/17 2017/18 2018/19 2019/20 2020/21 2021/22 2022/23Supply of electricity secured
Continuous supply of electricity for grid stability
Additional 2 500 MW nuclear energy procured by 2024
N/A N/A N/A N/A Roadmap for implementation of the 2 500 MW nuclear programme developed
Roadmap for 2 500 MW Nuclear New Build Programme developed and implemented
Procurement framework for the 2 500 MW nuclear programme developed
Policy guideline and support for the Plant Life Extension Programme developed
Number of quarterlyreports on KoebergNuclear Power Plant lifeextension
N/A N/A N/A N/A Quarterly Monitoring Report of Koeberg’s Plant Life Extension Plan through established Technical Oversight Committee meetings
Quarterly Monitoring Reports of Koeberg’s Plant Life Extension Plan through established Technical Oversight Committee meetings
Quarterly Monitoring Reports of Koeberg’s Plant Life Extension Plan through established Technical Oversight Committee meetings
Policy oversight and direction for the establishment of the CISF Project
Pre-feasibility Reportsubmitted to Cabinet forapproval to establish the CISF
N/A N/A N/A N/A Pre-feasibility Report submitted to Cabinet for approval to establish the CISF
Exercise oversight on completion of the Pre-feasibility Report and submission to Cabinet
Exercise oversight on securing of funding for CISF by NRWDI, and commencement of the EIA and siting processes
New Multi-Purpose Reactor procured by 2024
New Multi-Purpose Reactor procured by 2024
N/A N/A N/A N/A Pre-feasibility study submitted to approval authority
Coordinate and exercise oversight on the procurement of Multi-Purpose Reactor
Exercise oversight on implementation of the Multi-Purpose Reactor procurement

A N N U A L P E R F O R M A N C E P L A N 2 0 2 0 / 2 1 103
Outcome Outputs Outputindicators
Annual targets
Audited/Actual performance Estimated performance
MTEF period
2016/17 2017/18 2018/19 2019/20 2020/21 2021/22 2022/23Supply of electricity secured
Issued authorisations or denials
70%ofauthorisation applications processed within the 8-week time period.
74.11% 72% 78% 70%ofauthorisation applications processed within the 8-week time period
70%ofauthorisation applications processed within the 8-week time period
70%ofauthorisation applications processed within the 8-week time period
70%ofauthorisation applications processed within the 8-week time period
Promulgated regulation on Physical Protective Measures for Nuclear Material
Developed Regulation on Physical Protective Measures for Nuclear Material.
N/A N/A N/A N/A Submission of the draft regulation on Physical Protective Measures for Nuclear Material to the Minister for public consultation
Promulgation of regulation on Physical Protective Measures for Nuclear Material

D E P A R T M E N T O F M I N E R A L R E S O U R C E S A N D E N E R G Y104
5.6.2 Output indicators: Annual and quarterly targets
Output indicators Annual targets Q1 Q2 Q3 Q4Additional 2 500 MW nuclear energy procured
Roadmap for implementation of the 2500 MW nuclear programme developed
1st DraftFramework for implementation of the 2 500 MW nuclear programme developed
Final Draft Governance Framework for the 2 500 MW nuclear programme developed
Implementation Strategy for the 2 500 MW nuclear programme developed
Draft Roadmap for implementation of the 2 500 MW nuclear programme developed
Number of quarterly reports on Koeberg Nuclear Power Plant life extension
4 Quarterly Reports on the monitoring of Koeberg’s Plant Life Extension Plan through established Technical Oversight Committee meetings
Quarterly Report on the monitoring of Koeberg’s Plant Life Extension Plan through established Technical Oversight Committee meetings
Quarterly Report on the monitoring of Koeberg’s Plant Life Extension Plan through established Technical Oversight Committee meetings
Quarterly Report on the monitoring of Koeberg’s Plant Life Extension Plan through established Technical Oversight Committee meetings
Quarterly Report on the monitoring of Koeberg’s Plant Life Extension Plan through established Technical Oversight Committee meetings
Pre-feasibility Report on the procured Centralised Interim Storage Facility (CISF)
Pre-feasibility Report submitted to Cabinet for approval to establish the CISF
Draft Pre-feasibility Report on CISF
Pre-feasibility Report reviewed by the Steering Committee on CISF
Pre-feasibility Report on CISFfinalised
Pre-feasibility Report submitted to Cabinet for approval to establish the CISF
New Multi-Purpose Reactor procured
Pre-feasibility study on Multi-Purpose Reactor submitted for approval
Pre-feasibility study report drafted
Pre-feasibility study report reviewed
Pre-feasibility study report revised
Pre-feasibility study report submitted for approval
%ofauthorisationapplications processed within the 8-week time period
70%ofauthorisationapplications processed within the 8-week time period
70%ofauthorisationapplications processed within the 8-week time period
70%ofauthorisationapplications processed within the 8-week time period
70%ofauthorisationapplications processed within the 8-week time period
70%ofauthorisationapplications processed within the 8-week time period
Draft Regulations on Physical Protective Measures for Nuclear Material
Submission of the draft regulations on Physical Protective Measures for Nuclear Material to the Minister for Public consultation
Draft regulation in place Consultation with relevant stakeholders on the draft regulations
Consultation with DPME for SEIAS process
Submission of the draft regulations on Physical Protective Measures for Nuclear Material to the Minister for public consultation
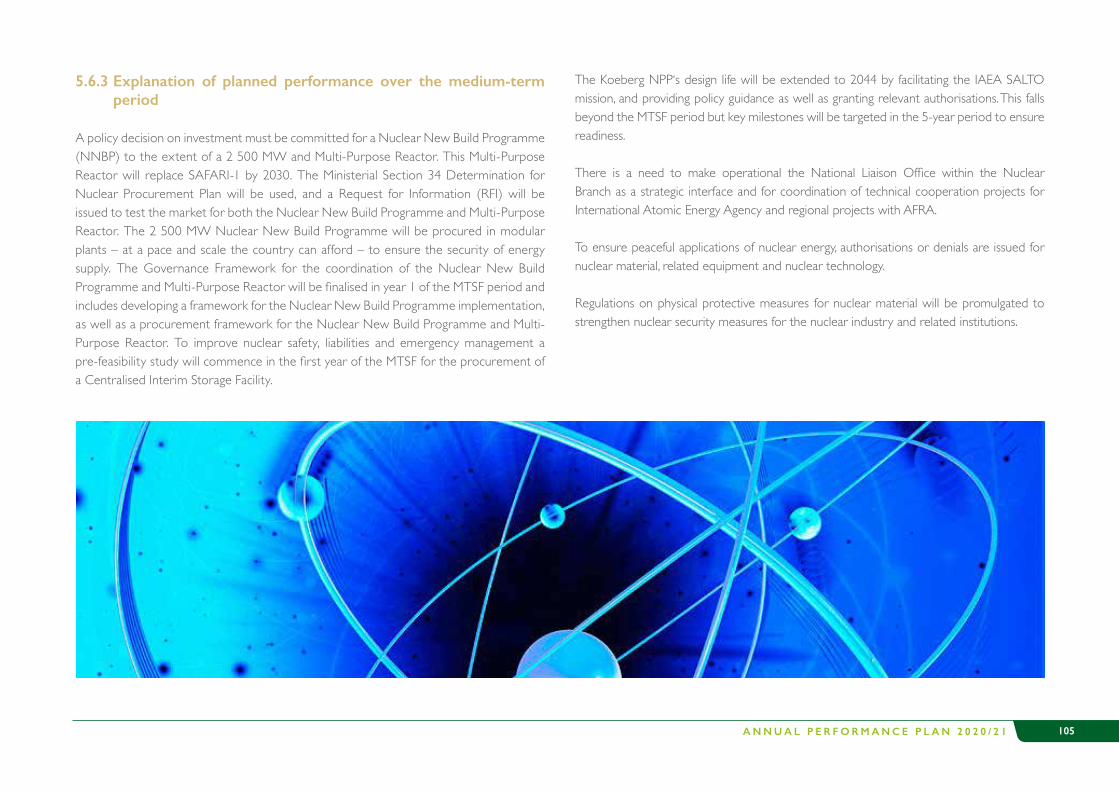
A N N U A L P E R F O R M A N C E P L A N 2 0 2 0 / 2 1 105
5.6.3 Explanation of planned performance over the medium-term period
A policy decision on investment must be committed for a Nuclear New Build Programme (NNBP) to the extent of a 2 500 MW and Multi-Purpose Reactor. This Multi-Purpose Reactor will replace SAFARI-1 by 2030. The Ministerial Section 34 Determination for Nuclear Procurement Plan will be used, and a Request for Information (RFI) will be issued to test the market for both the Nuclear New Build Programme and Multi-Purpose Reactor. The 2 500 MW Nuclear New Build Programme will be procured in modular plants – at a pace and scale the country can afford – to ensure the security of energy supply. The Governance Framework for the coordination of the Nuclear New Build ProgrammeandMulti-PurposeReactorwillbefinalisedinyear1oftheMTSFperiodandincludes developing a framework for the Nuclear New Build Programme implementation, as well as a procurement framework for the Nuclear New Build Programme and Multi-Purpose Reactor. To improve nuclear safety, liabilities and emergency management a pre-feasibilitystudywillcommenceinthefirstyearoftheMTSFfortheprocurementofa Centralised Interim Storage Facility.
The Koeberg NPP‘s design life will be extended to 2044 by facilitating the IAEA SALTO mission, and providing policy guidance as well as granting relevant authorisations. This falls beyond the MTSF period but key milestones will be targeted in the 5-year period to ensure readiness.
There is a need to make operational the National Liaison Office within the NuclearBranch as a strategic interface and for coordination of technical cooperation projects for International Atomic Energy Agency and regional projects with AFRA.
To ensure peaceful applications of nuclear energy, authorisations or denials are issued for nuclear material, related equipment and nuclear technology.
Regulations on physical protective measures for nuclear material will be promulgated to strengthen nuclear security measures for the nuclear industry and related institutions.

D E P A R T M E N T O F M I N E R A L R E S O U R C E S A N D E N E R G Y106
5.6.4 Programme resource considerations
Programme 6: Nuclear Energy Regulation and Management (Sub-programmes)
Baseline Medium-term expenditure framework
2016/17 2017/18 2018/19 2019/20 2020/21 2021/22 2022/23
Audited outcome
Audited outcome
Audited outcome
Voted (Main appropriation)
Adjusted appropriation
Revised indicative baseline
Revised indicative baseline
Revised indicative baseline
Rand thousand R’000 R’000 R’000 R’000 R’000 R’000 R’000 R’000Nuclear Energy Management 4 404 4 684 3 263 3 592 3 592 3 784 4 006 4 230 Nuclear Safety and Technology 859 003 780 819 857 728 1 026 198 1 025 429 1 081 511 1 140 401 1 183 202 Nuclear Non-Proliferation and Radiation Security 8 303 8 414 9 015 9 515 9 515 10 764 11 408 12 061 Total for Programmes 871 710 793 917 870 006 1 039 305 1 038 536 1 096 059 1 155 815 1 199 493
Programme 6: Nuclear Energy Regulation and Management (Economic Classification)
Baseline Medium-term expenditure framework
2016/17 2017/18 2018/19 2019/20 2020/21 2021/22 2022/23
Audited outcome
Audited outcome
Audited outcome
Voted (Main appropriation)
Adjusted appropriation
Revised indicative baseline
Revised indicative baseline
Revised indicative baseline
Rand thousand R’000 R’000 R’000 R’000 R’000 R’000 R’000 R’000
Current payments 103 305 38 482 54 485 35 523 34 754 37 769 39 868 41 036
Compensation of employees 19 442 20 324 21 625 24 330 24 330 26 765 28 225 29 600 Salaries and wages 17 478 18 214 19 394 21 376 21 370 23 487 24 768 25 974 Social contributions 1 964 2 110 2 231 2 954 2 960 3 278 3 457 3 626 Goods and services 83 863 18 158 32 860 11 193 10 424 11 004 11 643 11 436 Administrative fees 122 167 67 115 154 120 126 127 Advertising 99 3 184 329 186 347 366 379 Minor assets 4 - - - - - - - Catering: Departmental activities 118 75 55 110 100 116 122 125 Communication (G&S) 346 769 428 307 306 324 342 350 Computer services 14 - - - - - - -

A N N U A L P E R F O R M A N C E P L A N 2 0 2 0 / 2 1 107
Programme 6: Nuclear Energy Regulation and Management (Economic Classification)
Baseline Medium-term expenditure framework
2016/17 2017/18 2018/19 2019/20 2020/21 2021/22 2022/23
Audited outcome
Audited outcome
Audited outcome
Voted (Main appropriation)
Adjusted appropriation
Revised indicative baseline
Revised indicative baseline
Revised indicative baseline
Rand thousand R’000 R’000 R’000 R’000 R’000 R’000 R’000 R’000Consultants: Business and advisory services 78 465 13 340 29 884 8 338 7 509 8 065 8 541 8 215 Legal services (G&S) 1 136 830 156 - 34 - - - Contractors 3 - - - - - - - Fleet services (including government motor transport) - 2 6 - 1 - - - Consumable supplies 20 6 10 2 8 2 2 2 Consumables:Stationery,printingandofficesupplies 1 - 1 80 51 84 88 92 Operating leases - 8 22 - - - - - Rental and hiring - 4 18 - - - - - Travel and subsistence 2 252 2 180 1 878 1 638 1 683 1 657 1 751 1 834 Training and development - - - - - - - - Operating payments 8 12 - - - - - - Venues and facilities 1 275 762 151 274 392 289 305 312 Transfers and subsidies 670 027 755 435 769 082 1 003 782 1 003 782 1 058 290 1 115 947 1 158 457 Departmental agencies and accounts 50 936 68 573 62 042 90 595 90 595 94 864 99 532 103 792 Foreign governments and international organisations 19 753 22 691 24 326 22 756 22 756 24 007 25 327 26 260 Public corporations 599 338 664 171 682 714 890 431 890 431 939 419 991 088 1 028 405 Payments for capital assets 98 378 - 46 439 - - - - - Transport equipment - - - - - - - - Other machinery and equipment 11 031 - - - - - - - Software and other intangible assets 87 347 - 46 439 - - - - - Payments for financial assets - - - - - - - -
Total economic classification 871 710 793 917 870 006 1 039 305 1 038 536 1 096 059 1 155 815 1 199 493

D E P A R T M E N T O F M I N E R A L R E S O U R C E S A N D E N E R G Y108
Programme 6: Nuclear Energy Regulation and Management (Transfer Payments)
Baseline Medium-term expenditure framework
2016/17 2017/18 2018/19 2019/20 2020/21 2021/22 2022/23
Audited outcome
Audited outcome
Audited outcome
Voted (Main appropriation)
Adjusted appropriation
Revised indicative baseline
Revised indicative baseline
Revised indicative baseline
Beneficiary R’000 R’000 R’000 R’000 R’000 R’000 R’000 R’000South African Nuclear Energy Corporation 599 338 664 171 682 714 890 431 890 431 939 419 991 088 1 028 405 National Nuclear Regulator 40 936 38 573 16 510 43 096 43 096 45 467 47 968 49 753 International Atomic Energy Agency 19 753 22 691 24 326 19 224 19 224 20 281 21 396 22 184 National Radioactive Waste Disposal Institute 10 000 30 000 45 532 47 499 47 499 49 397 51 564 54 039 International Atomic Energy Agency - - - 3 532 3 532 3 726 3 931 4 076 Total 670 027 755 435 769 082 1 003 782 1 003 782 1 058 290 1 115 947 1 158 457
6 Institutional resource allocation for branches
Branches
Baseline Medium-term expenditure framework
2016/17 2017/18 2018/19 2019/20 2020/21 2021/22 2022/23
Audited outcome
Audited outcome
Audited outcome
Voted (Main appropriation)
Adjusted appropriation
Revised indicative baseline
Revised indicative baseline
Revised indicative baseline
Rand thousand R’000 R’000 R’000 R’000 R’000 R’000 R’000 R’000Administration 612 240 604 872 622 100 626 671 624 890 642 343 683 222 707 825 Minerals and Petroleum Regulation 341 210 449 141 470 616 538 683 537 769 574 713 608 694 632 728 Mining, Minerals and Energy Policy Development 899 007 879 881 982 830 1 026 078 1 018 878 993 104 892 571 952 166 Mine Health and Safety Inspectorate 191 273 205 375 210 330 220 566 224 766 232 694 251 998 261 474 Mineral and Energy Resources Programmes and Projects 6 258 503 6 788 146 5 814 480 5 993 938 5 740 938 5 798 115 5 977 685 6 829 685 Nuclear Energy Regulation and Management 871 710 793 917 870 006 1 039 305 1 038 536 1 096 059 1 155 815 1 199 493 Total for Branches 9 173 943 9 721 332 8 970 362 9 445 241 9 185 777 9 337 028 9 569 985 10 583 371

A N N U A L P E R F O R M A N C E P L A N 2 0 2 0 / 2 1 109
Economic Classification
Baseline Medium-term expenditure framework
2016/17 2017/18 2018/19 2019/20 2020/21 2021/22 2022/23
Audited outcome
Audited outcome
Audited outcome
Voted (Main appropriation)
Adjusted appropriation
Revised indicative baseline
Revised indicative baseline
Revised indicative baseline
Rand thousand R’000 R’000 R’000 R’000 R’000 R’000 R’000 R’000
Current payments 1 453 230 1 454 181 1 556 163 1 585 702 1 579 519 1 683 999 1 778 469 1 850 892
Compensation of employees 880 265 910 540 957 872 1 049 456 1 045 542 1 118 104 1 190 781 1 242 564 Salaries and wages 770 626 795 819 836 550 919 178 915 165 981 143 1 044 918 1 090 355 Social contributions 109 639 114 721 121 322 130 278 130 377 136 961 145 863 152 209 Goods and services 572 965 543 641 598 291 536 246 533 977 565 895 587 688 608 328 Administrative fees 7 898 6 137 4 680 10 369 10 095 9 877 10 480 10 839 Advertising 13 815 7 829 4 157 12 001 10 673 11 377 11 852 12 167 Minor assets 1 801 1 762 571 4 314 3 595 4 623 4 880 5 055 Audit costs: External 10 052 11 555 11 404 9 229 9 229 9 778 10 316 10 750 Bursaries: Employees 1 789 1 864 2 482 2 914 3 238 3 042 3 202 3 332 Catering: Departmental activities 3 497 3 180 4 760 5 038 5 339 5 049 5 329 5 519 Communication (G&S) 25 798 21 726 16 271 14 450 14 241 15 417 16 267 16 837 Computer services 37 530 35 590 35 471 38 312 39 357 43 517 45 741 45 426 Consultants: Business and advisory services 110 739 32 513 53 045 121 233 107 031 134 547 132 841 136 435 Legal services (G&S) 13 664 18 545 21 660 3 399 3 964 3 608 3 807 3 956 Contractors 3 263 5 581 11 455 5 782 15 610 9 191 9 696 10 061 Agency and support/outsourced services 1 096 189 882 10 896 440 11 495 12 127 12 585 Entertainment 8 18 - 280 231 284 299 292 Fleet services (including government motor transport) 11 793 11 990 14 125 12 934 13 337 13 666 14 414 14 931 Inventory: Clothing material and accessories 53 - - - 1 - - - Inventory: Food and food supplies 19 - - 2 2 2 2 2 Inventory: Materials and supplies 218 - - - - - - - Inventory: Medical supplies 2 - - - - - - -

D E P A R T M E N T O F M I N E R A L R E S O U R C E S A N D E N E R G Y110
Economic Classification
Baseline Medium-term expenditure framework
2016/17 2017/18 2018/19 2019/20 2020/21 2021/22 2022/23
Audited outcome
Audited outcome
Audited outcome
Voted (Main appropriation)
Adjusted appropriation
Revised indicative baseline
Revised indicative baseline
Revised indicative baseline
Rand thousand R’000 R’000 R’000 R’000 R’000 R’000 R’000 R’000Consumable supplies 3 095 2 994 2 977 6 047 6 512 6 375 6 726 6 956Consumables:Stationery,printingandofficesupplies 9 395 6 713 7 200 14 587 14 356 15 178 16 014 16 658 Operating leases 128 280 123 842 130 847 87 365 84 501 92 222 97 288 101 468 Rental and hiring 232 1 187 1 054 2 516 2 682 2 558 2 700 2 801 Property payments 15 110 13 515 14 355 15 657 18 180 15 633 16 230 16 896 Transport provided: Departmental activity 294 73 41 - 92 - - - Travel and subsistence 120 402 112 877 121 550 113 500 114 588 113 005 119 440 125 419 Training and development 8 933 8 158 7 458 10 512 10 512 10 843 11 438 11 918 Operating payments 27 728 101 095 118 084 17 083 29 720 17 272 18 271 18 981 Venues and facilities 16 461 14 708 13 762 17 826 16 451 17 336 18 328 19 044 Interest and rent on land - - 1 - - - - - Interest (Incl. interest on unitary payments (PPP)) - - 1 - - - - - Rent on land - - - - - - - - Transfers and subsidies 7 607 433 8 251 548 7 352 357 7 841 733 7 588 733 7 634 620 7 772 052 8 711 906 Municipalities 2 131 871 2 290 284 2 119 501 2 090 393 2 090 393 2 076 746 2 233 140 2 361 959 Departmental agencies and accounts 506 065 570 128 605 135 647 904 647 904 761 291 651 231 699 525 Foreign governments and international organisations 25 003 25 622 26 412 29 478 29 478 31 099 32 809 34 033 Public corporations 4 802 602 5 113 053 4 365 113 4 725 189 4 472 189 4 401 963 4 471 379 5 221 020 Private enterprises 137 733 246 098 232 994 346 593 346 593 361 225 381 071 392 836 Households 4 159 6 363 3 202 2 176 2 176 2 296 2 422 2 533 Payments for capital assets 111 966 15 603 61 186 17 806 17 525 18 409 19 464 20 573 Buildingsandotherfixedstructures 153 263 636 2 056 2 056 2 126 2 286 2 416 Transport equipment 3 262 2 565 1 972 - - - - -

A N N U A L P E R F O R M A N C E P L A N 2 0 2 0 / 2 1 111
Economic Classification
Baseline Medium-term expenditure framework
2016/17 2017/18 2018/19 2019/20 2020/21 2021/22 2022/23
Audited outcome
Audited outcome
Audited outcome
Voted (Main appropriation)
Adjusted appropriation
Revised indicative baseline
Revised indicative baseline
Revised indicative baseline
Rand thousand R’000 R’000 R’000 R’000 R’000 R’000 R’000 R’000Other machinery and equipment 21 204 11 983 12 139 15 750 15 469 16 283 17 178 18 157 Software and other intangible assets 87 347 792 46 439 - - - - - Payments for financial assets 1 314 - 655 - - - - -
Total economic classification 9 173 943 9 721 332 8 970 362 9 445 241 9 185 777 9 337 028 9 569 985 10 583 371
Division of Revenue
Baseline Medium-term expenditure framework
2016/17 2017/18 2018/19 2019/20 2020/21 2021/22 2022/23
Audited outcome
Audited outcome
Audited outcome
Voted (Main appropriation)
Adjusted appropriation
Revised indicative baseline
Revised indicative baseline
Revised indicative baseline
Rand thousand R’000 R’000 R’000 R’000 R’000 R’000 R’000 R’000National 7 042 072 7 431 048 6 850 861 7 354 848 7 095 384 7 260 282 7 336 845 8 221 412 Local government conditional grants (Direct) 2 131 871 2 290 284 2 119 501 2 090 393 2 090 393 2 076 746 2 233 140 2 361 959 Total 9 173 943 9 721 332 8 970 362 9 445 241 9 185 777 9 337 028 9 569 985 10 583 371

D E P A R T M E N T O F M I N E R A L R E S O U R C E S A N D E N E R G Y112
6.1 Expenditure analysis
The National Development Plan envisages that by 2030, South Africa will have an adequate supply of electricity and liquid fuels to maintain economic activity and prevent economic disruptions, and a mining sector that prioritises the welfare of its human resources and the environment. To give effect to this vision, over the medium term, the DMRE will focus on transforming mining and energy resources, rehabilitating mines and the environment, extendingaccesstoelectricity,enhancingenergyefficiency,andmanagingnuclearenergyin accordance with international commitments. These focus areas contribute to priority 1 (economic transformation and job creation) and priority 5 (social cohesion and safe communities) of government’s 2019–2024 medium-term strategic framework.
Transfers and subsidies to public entities and municipalities of R31.6 billion over the MTEF period account for an estimated 81.8% of the planned spending.Total expenditure isexpectedto increaseatanaverageannualrateof4.8%, fromR9.2billion in2019/20toR10.6 billion in 2022/23.
Due to the labour intensive nature of the DMRE’s work, where inspections must be conducted to ensure that mining companies comply with legislative requirements, expenditure on compensation of employees amounts to an estimated R3.6 billion over themedium term,11.9%of total expenditure.To remainwithin theexpenditure ceilingfor compensation of employees, staff numbers are expected to decrease from 1 731 in 2019/20 to 1 687 in 2022/23. This decrease will not impact service delivery since these posts are predominantly administrative. Staff numbers will decrease further as a result of duplication of functions following the merger of the Department of Mineral Resources with the Department of Energy through the national macro organisation of government in 2019/20.
Transforming mining and energy resourcesAs the DMRE works towards growing the economy and creating jobs, transformation will be accelerated within the mining and energy sectors by monitoring and enforcing compliance
with the newly approved Mining Charter, and monitoring adherence to social labour plans. The exploration of onshore and offshore oil and gas resources will be advanced, together with their optimal development and investments in the mineral and upstream petroleum sectors. Activities related to these initiatives are expected to increase in expenditure, from R399.2millionin2019/20toR468.1millionin2022/23atanaverageannualrateof5.5%inthe Mineral Regulation and Administration sub-programme in the Minerals and Petroleum Regulation Branch.
Rehabilitating mines and the environment The DMRE plans to intensify its efforts to rehabilitate dangerous, derelict and ownerless mining sites which will promote the health and safety of mine employees and people in surrounding communities. Over the medium term, it aims to rehabilitate 129 mines, conduct 3 825 environmental inspections, and conduct 24 000 health inspections. As a result, allocations in the Mine Health and Safety Inspectorate Branch are expected to increase from R224.8 million in 2019/20 to R261.5 million in 2022/23 at an average annual rateof5.2%.
Extending access to electricityIn support of government’s policy to extend access to electricity for all South Africans, an additional 560 000 households are expected to be connected to the electricity grid over the medium term. To enable this, six new substations are set to be built and nine substations upgraded. A further 15 000 households per year are expected to be provided with non-grid,mainlysolar,electrification.DespitereductionsovertheMTEFperiodofR1.2billionin indirect grants to Eskom and R380.5 million in municipal grants, in 2020/21 and 2021/22, spendingintheIntegratedNationalElectrificationProgrammesub-programmeisexpectedtoincreaseatanaverageannualrateof5.1%,fromR5.2billionin2019/20toR6.1billionin2022/23. Transfers to Eskom are set to increase from R3.1 billion in 2019/20 to R3.7 billion in2022/23atanaverageannualrateof5.7%,andtransferstomunicipalitiesaresettoincrease from R1.9 billion in 2019/20 to R2.1 billion in 2022/23 at an average annual rate of4.4%.Transfersfornon-gridconnectionsareexpectedtoincreasefromR212.9millionin2019/20toR240.9millionin2022/23atanaverageannualrateof4.2%.

A N N U A L P E R F O R M A N C E P L A N 2 0 2 0 / 2 1 113
The DMRE’s Electrification Masterplan, which will inform the rollout of electricityconnectionsforuniversalaccess,isexpectedtobefinalisedin2020/21.Theplanprovidesa model for allocating resources based on data informed by backlogs, and is allocated R17.2 million over a two-year period, ending in 2021/22.
Enhancing energy efficiencyTo realise a target of 1.5 terawatt hours of energy savings over the medium term, allocations to the energy efficiency anddemand-sidemanagement grant are expected to increasefrom R227.1 million in 2019/20 to R243.3 million in 2022/23. Municipalities will be able to undertakeinitiativestoupgrademunicipalinfrastructurethatisnotenergyefficient,suchasreplacingstreetandtrafficlightswithgreentechnology.
Managing nuclear energyThe Nuclear Energy Regulation and Management Branch accounts for an estimated 11.6%oftheDMRE’stotalexpenditureoverthemediumterm,comprisingtransferstoentities. The South African Nuclear Energy Corporation is allocated R3 billion over the MTEF period, of which R2.3 billion is for operational costs and R603.3 million for the decontamination and decommissioning of old nuclear facilities. The National Radioactive WasteDisposalInstitutewillreceiveR154.4millionforitsoperationswhileitfinalisesitsapplication for a radioactive waste disposal licence from the National Nuclear Regulator.

D E P A R T M E N T O F M I N E R A L R E S O U R C E S A N D E N E R G Y114
7 Updated key risks and mitigation strategies
Outcome Key risk MitigationIncrease South Africa’s share of the global exploration budget
Inability to grow the country’s share of the global exploration budget
Source and secure exploration fundingFast-track the implementation of the Geoscience Technical Programme
Inclusive, equitable and competitive exploration
Not meeting transformation and growth targets Promote transformation of the energy and mining sectorsPursue regulatory and structural reforms e.g. legislation review of the Petroleum Bill
SLP: disputes arising from communities, municipalities, departments and holders of rights as a result of underdevelopment of socio-economic issues, disruption of mining activities – non-alignment of SLP with developmental plans of various stakeholders
Workshops and meetings on Social Labour PlanParticipate in consultation/engagement sessions with municipalities and other relevant stakeholders on alignment of SLP with developmental plans
A stable framework within which exploration and mining companies can obtain prospecting and mining rights and the related environmental authorisations
Bottlenecks in the licensing processes Non-compliance with environmental protection regulation and policy
Institute of inter-governmental forums Reduce compliance cost for new entrants, and reduce regulatory barriers
Improved and streamlined regulatory processes and collaboration across regulators and relevant role players
Delays in regulatory decisions Review regulatory frameworks to be more responsive to stakeholder needsInstitute inter-governmental forums led by DMRE
Improved access to basic services and Affordable energy prices
Inability to reduce energy costs for the citizens of the country and dependent industries
Implementation of IRP2019Diversificationofenergysources–gasandliquidfuels,wind,solar,etc.
Energy pricing Amend the National Energy Regulator ActAmend the Electricity Regulation Act
Energy security (supply and demand dynamics) IRP, IEP, Demand Side ManagementEvidence-based policy making that advances economic growth, socioeconomic welfare and prepares the economy for external shock (4IR, demand and supply dynamics)
Re-activenesstosignificantindustry,regulatoryandtechnology developmentsMissed opportunities to advance the DMRE mandate
Prioritise and fund relevant research areas
Increase in South Africa’s share of the global minerals and energy market
Inability to capture a larger share of the global minerals and energy market
Bilateral agreementsReview regulatory frameworks to promote industrialisation

A N N U A L P E R F O R M A N C E P L A N 2 0 2 0 / 2 1 115
Outcome Key risk MitigationIncreased transformation, economic inclusion, and policy certainty
Non-compliance with the Draft Mining Charter Women in Energy (WiE) Business DirectoryLegislative framework to accommodate small-scale mining
Transformation: Non-compliance with Mining Charter resulting in economic and political instability, failure to transform sustainably
Workshops on the Mining Charter 2018Referral of cases of fronting to CPIC/B-BBEE CommissionNotices, directives, orders and instructions issued in terms of the MPRDA
Artisanal mining • Standalone legislation on ASSMOversaturation of the marketUnutilised trading infrastructureRetrenchment of employeesUnwarranted pressure on social security systemFailure to meet licensing objectives targets
• Developscientificanalysistool• Finalise SOPs• International benchmark• Alignment with macro-spatial framework (national, regional, etc.
Spatial Development Framework)• Possible litigations• Unlawful operators• Increased non-compliance
• Make recommendations to the Policy and Planning Branch to amend the legislative frameworks
• Approval of SOPsDiversify supply of mineral resources in support of both mining and energy sectors
Lack of research and to respond to industry dynamics thereby not capitalising on opportunities presented in the mining and energy value chains
Source funding to increase resource capacity and capability
Enable injection of carbon, reduce emissions Conflictbetweenenvironmentalandclimateobligationsandaspirations, and economic growth and poverty alleviation imperatives
IRP2019Amendment of NEMA, SEMAs
Climate change Just transition to low carbon economy IRP, SEIAsImplementation of strengthened stakeholder segmentation and targeting strategy, and diplomacy framework

D E P A R T M E N T O F M I N E R A L R E S O U R C E S A N D E N E R G Y116
Outcome Key risk MitigationEnable injection of carbon, reduce emissions Non-compliance with environmental legislation
Not meeting emissions targetsInvestment in cleaner technologies
Inability to respond to national climate change response measures
• Develop energy sector climate change strategy• Develop mitigation and adaptation plans for the energy sector• Allocation of additional funding
Limited CDM project uptake and uncertainty of the form of the KYOTO Protocol 2nd commitments
• Lobby for bilateral trading with Japan and other EU members
SouthAfricanotgainingmaximumbenefitfromtheKYOTOProtocol
• Lobby for bilateral trading with Japan and other EU members
Environment: Non-compliance with the legislation (MPRDA, NEMA and Waste Act) by holders of rights and permits resulting in EA/EMP: degradation and pollution of the environment, state liability, health hazards
• Workshops and meetings on NEMA, Mine Environmental Management Forum in place
• Notices and directives issued in terms of NEMA• Notices, directives, orders and instructions issued in terms of
provision of section 6 and 29 of MPRDADiversify energy sources by implementing IRP2019
Insufficientenergysupplytoservicethecountry’sdemand • Alternative supply sources• Accelerateenergyefficiencyrollouts• Pursue alternative sources of energy• Secure investments for infrastructure renewal, expansion and
maintenance• Implementation of IRP2019
Poor IEP – Inability to plan for future energy supply • Develop SOPs for data collection and management processes• Develop a standard template for the collection of data• Liaison with local energy stakeholders to provide accurate and
correct energy data• Establishment of energy data task teams for interpretation, analyses
andclassificationofenergydataacrossvariousenergycommodities• Automation and streamlining of energy data• Increase capacity by employing permanent members• Increase capacity by employing permanent staff members or interns
until the full functioning of the programme

A N N U A L P E R F O R M A N C E P L A N 2 0 2 0 / 2 1 117
Outcome Key risk MitigationInfrastructure investment by both public and private sectors
Lack of foreign direct investment Strengthen governance frameworks and structuresPursue regulatory and structural reforms
Improve regulatory oversight Silo working, duplicate functions and investment funding not optimally deployed
Develop an integrated service delivery modelDevelop long-term sustainable funding model
Inconsistent implementation of agreements due to poor support from partners and line function
Ensure synergy and alignment of minerals and energy projects to foster greater cohesionEngage partners and work closer with line function
Delay in the legislative process caused by external consultation
Mobilise and strengthen stakeholder consultation during drafting stage of legislative process
Uncoordinated legislation and policy development within government
Improve coordination and consultation throughout all levels of government
Mobilise funding for strategic programmes andensurefinancialsustainabilityofDMRESOEs
Lack of funding for strategic programmes Develop long-term sustainable funding modelExpand mandates of DMRE entities
Strengthen governance of DMRE service delivery institutions
Financial sustainability of DMRE entities Develop an integrated service delivery modelDiversify sources of revenue
Modernise IT infrastructure in support of AI and Big Data in Mining and Energy to ensure availability of reliable and accurate mining, energy and economic data
Lack of reliable economic data for decision-making Investment in supporting technologies
Provide the full portfolio of IT applications required in support of the DMRE value chain
Lack of technology infrastructure and IT enabling platforms Implementation of one environmental system Unreliable IT and fragmented databases in terms of system databases
Provision of reliable ITOpportunity to improve compliance and quality of economic reports through use of other departmental resources (mine economics, SSM), SARSIntegrate IT databases

D E P A R T M E N T O F M I N E R A L R E S O U R C E S A N D E N E R G Y118
Outcome Key risk MitigationInability to verify statistics and data Opportunity to improve compliance and quality of economic reports
through use of other departmental resources (mine economics, SSM), SARSCapacitate the Statistics UnitConductdataverificationinspectionsandrandomsampling
Promote culture of change and employee empowerment
Low employee morale and productivityReduced capacity to execute mandates
Finalise organisational structuresCulture programmes
Develop leadership capability and accountability at all levels
CorruptionDelays in executive approvals of strategic decisions
Strengthen governance frameworks and structuresFill critical executive vacancies
Attract, recruit, retain and develop modern DMRE workforce
Insufficientskillstoexecutemandates Finalise organisational structuresExpanded Public Works Programme

A N N U A L P E R F O R M A N C E P L A N 2 0 2 0 / 2 1 119
8 Public Entities
Name of public entity
Mandate Outcomes/Resolutions
National Energy Regulator of South Africa (NERSA)
The mandate of NERSA, as contained in relevant legislation, is summarised as follows:• Issuing of licences and setting pertinent conditions • Setting and/or approving tariffs and prices • Monitoring and enforcing compliance with licence conditions • Dispute resolution including mediation, arbitration and the
handling of complaints • Gathering, storing and disseminating industry information • Setting of rules, guidelines and codes for the regulation of the
three industries • Determination of conditions of supply and applicable standards • Registration of import and production activities
• Accessible and affordable electricity for all citizens• Energy supply that is certain and secure for current and future user needs through
the orderly development and operation on the electricity supply infrastructure• A regulatory environment that facilitates investment in electricity infrastructure• Regulatory certainty within the electricity industryPiped Gas Industry Regulation• Access to competitive gas prices and gas services• Efficient,sustainableandorderlydevelopmentofthepiped-gasindustryaimedat
security of supply• A regulatory environment that facilitates investment in piped-gas infrastructure• A competitive piped-gas industry• Regulatory certainty within the piped-gas industryPetroleum Pipelines Industry• Access to petroleum infrastructure• Efficient,sustainableandorderlydevelopmentofatransformedpetroleum
pipelines industry aimed at security of supply• A regulatory environment that provides regulatory certainty and facilitates
investment in petroleum pipeline infrastructure• A competitive petroleum pipelines industryTransversal Regulatory and Organisational• Anenablingenvironmentforthebenefitofinternalandexternalstakeholders
with a skilled workforce that is empowered to work in a complex and ambiguous environment

D E P A R T M E N T O F M I N E R A L R E S O U R C E S A N D E N E R G Y120
Name of public entity
Mandate Outcomes/Resolutions
Central Energy Fund The Mandate of the CEF is derived from the CEF Act, 1977 (Act No. 38 of 1977) and the Ministerial directives issued thereafter. The mandate is to contribute to the security of energy supply for the country.
• Increase import volumes and add more trading skills• Leverage the Strategic Fuel Fund (SFF) balance sheet and infrastructure for (heavy)
condensate optimal sourcing• Leverage strategic partnerships to extend gas production from known PetroSA
discoveries – source gas from the Brulpadda discovery and consider acquiring an equity interest in the block
• SourceLiquefiedNaturalGas(LNG)fromtheCoegaHubProjectandG-Gsupplyoptions
• Complete a feasibility study for infrastructure requirements and commercial viability for the LNG supply to the gas-to-liquids (GTL) by December 2020
African Exploration Mining and Finance Corporation (SOC) Ltd (AEMFC)
African Exploration Mining and Finance Corporation (SOC) Ltd (AEMFC) is the State Owned Mining Company established to secure South Africa’s energy supply primarily through the mining and supply of coal for the generation of electricity, as well as securing other resources that will provide energy for the future, including key mineralsforbeneficiationintheenergyandsteelvaluechain.
• Own and shareholder equity funding through strategic partnerships from other DMRE subsidiaries, FDI’s and BRICS
• Additional mining rights and acquisitions and ensure sustained ESKOM uptake and diversifying clients
• Identify minerals that are in demand for both clean energy (to support IRP2019) andotherdiversifiedmineralsingeneral
• Apply for mineral rights and identify key off-takers in collaboration with CGS, MINTEK and DMRE support
• Develop a regional and continental strategy to identify opportunities and offtake agreements for various minerals
• Closer collaboration with CGS regarding maps• Conclude – in collaboration with the DMRE – the AEMFC Bill of 2016

A N N U A L P E R F O R M A N C E P L A N 2 0 2 0 / 2 1 121
Name of public entity
Mandate Outcomes/Resolutions
PetroSA PetroSA operates as a commercial entity and creates value for the shareholder (Pay tax and dividends). It advances national objectives in the petroleum industry by contributing to the security of energy supply, and complementing and promoting government policy and strategic thrust (Energy Security Masterplan and NDP).
Petro SA’s strategic initiatives are:• Leverage strategic partnerships to extend gas production from known PetroSA
discoveries• Source LNG: - Coega Hub Project - G-G supply options• Source gas from the Brulpadda discover and consider acquiring equity interest in
the block• Leverage SFF balance sheet and infrastructure for (heavy) condensate optimal
sourcing • Develop a funding strategy for the decommissioning liability• Based on a clear turn-around plan and capacity to fund the liability in the long term,
consider procuring a guarantee from CEF, NT or insurance• Increase commercial customers• Leverage SFF infrastructure for product supply.• Improve cash conversion cycle (reduce debtors’ book and inventory)• Optimise product slate • Increase plant reliability• Dispose of non-core assets• Comprehensively review the cost structure

D E P A R T M E N T O F M I N E R A L R E S O U R C E S A N D E N E R G Y122
Name of public entity
Mandate Outcomes/Resolutions
iGas Per the Ministerial Directive of 2 October 2000, “iGas will act as the official State agency for the development of the hydrocarbon gasindustry in Southern Africa. iGas is required to support the growth of the Southern African economy through active investments in Southern Africa for the provision of gas molecules and gas infrastructure.”
• Engage Mozambique on bi-lateral engagement on additional gas • Increase production from Coega LNG and focus on Eskom’s repowering• Establish a greater indigenous gas supply• Pursue improved service delivery and migrate more services to iGas • Encourage internal engagement between CEF subsidiaries to reduce internal
competition and workshop with Transnet for closer collaboration, as well as increase support with the DMRE
• Engage around policy and regulations• Acquire and merge Transnet pipelines • Revise governance frameworks and delegation of authority, as well as develop iGas
specificpolicies• Commencerecruitmentforseniorpositionsandproject-specificroles
Strategic Stock Fund (SSF)
s17(1) – The Minister may, in a prescribed manner, for the purposes of ensuring security of supply, direct any state-owned entity to acquire, maintain, monitor and manage national strategic energy feedstocks and carriers. SSF is mandated to provide the country with security of supply of hydrocarbons and related infrastructure in case of emergency.
• To promote Nile/Orange Project brand with the South Sudanese citizens• Thorough risk assessment and mitigation before going into the states• Completion of the exploration programme • Provide infrastructure for strategic fuel supply to DOD and Eskom• Ministerial directive to SFF to participate in strategic storage white product• Obtain approval of Strategic Stock Policy • Implement the Ministerial directive (DOT s79 determination) to TNPA to allocate
capacity

A N N U A L P E R F O R M A N C E P L A N 2 0 2 0 / 2 1 123
Name of public entity
Mandate Outcomes/Resolutions
Petroleum Agency of South Africa (PASA)
The mandate of the Petroleum Agency is to promote exploration for onshore and offshore oil and gas resources and their optimal development on behalf of government. The agency regulates exploration and production activities, and acts as the custodian of the national petroleum exploration and production database.
• Increase licensing and exploration fees, promote revenue sharing agreements, offer sign-on bonuses, and secure funding for ECSCP via special MTEF allocation. Focus onitsfinancialefficienciesandrevenuegenerationcapability,aswellastranslateresources to economic value
• Establish effective use of resources, improve workforce productivity• Introduce a performance management system, rework practices to align with
BSC methodology and ensure that performance is impact- and not output-based. Identify projects aligned with the NDP imperatives, and review fees structure
• Increase exploration and production activities in South Africa, as well as regulate the exploration and production environment
• Acquire, archive and enhance all petroleum exploration and production data, ensure a viable and sustainable agency, and deliver national projects
• Ensureaneffectiveandefficientoperatingmodelthatisalignedwithpolicyimperatives while realising the mandate
• ResolveinefficienciesinSOEsandestablishPASAasanindependententitytoregulate, promote and facilitate (this includes the storage of relevant data) the oil and gas industry
• Intensify focus on oil and gas development• Closer collaboration with all stakeholders including CGS, SANEDI and NERSA in
terms of the shale gas project; carbon capture project and streamlining the oil and gas regulatory value chain
• Establish strategic relationships regulated by memorandums of understanding• Ensure regulatory and legislative certainty through several channels, including
finalisationoftheUpstreamOilandGasBillanddevelopmentofcomprehensivelegal guidelines aligned with the objects of the MPRDA (e.g. optimal exploration, substantial and meaningful participation by Historically Disadvantaged South Africans)
• Partition both onshore and offshore acreage to reasonably sized blocks informed by a benchmarking exercise to be undertaken
• Develop and implement an acreage maturation chart• Increase investment into South Africa

D E P A R T M E N T O F M I N E R A L R E S O U R C E S A N D E N E R G Y124
Name of public entity
Mandate Outcomes/Resolutions
South African National Energy Development Institute (SANEDI)
The National Energy Act outlines SANEDI’s direct mandate, driven by the DMRE, which requires SANEDI to direct, monitor, conduct and promoteenergy researchandpromoteenergyefficiencymeasuresthroughout the economy.
• Expanding donor reach – apply for Green/Climate Funds (GEF, EU) and explore funding from the Electricity Tariff (1/2 cent Eskom, R&D funding), via the research component of the Multi-Year Price Determination (MYPD) – include discussions with NERSA and the DMRE
• Address the unfunded mandate through an organisational review to focus, align and optimise resources
• Engage with other state entities, including the CSIR, MINTEK, CEF, TIA, NCPC, CGS, PASA, and PetroSA
• Encourage DMRE to give priority to national projects and respond timeously• Implement a Skills Development and Talent Retention Policy • Assist the DMRE on legislative and regulation development regarding the IPR
Act Listing, revision of the SANEDI Chapter, and regulations for clean technology interventions
MINTEK The objects of MINTEK are, through research, development and technology transfer, to promote mineral technology, and to foster the establishmentandexpansionofindustriesinthefieldofmineralsandproducts derived therefrom.
• Workonastrategicrealignmentthatcoversalltheidentifiedareas:fromthealignment of the entire organisation to the mandate as articulated in the Mineral Technology Act to engagements with customers and industry in particular
• Align research and technology development operations to meet industry needs• Finalise the medium- to long-term MINTEK Strategy, launch the strategy, and
embark on a stakeholder engagement campaign to socialise them with the new strategic direction of the organisation
• Conclude the operating model, as well as the macro organisational structure – in preparation for this develop a series of position papers focusing on reviving and stimulatingspecificsectorswithinthemineralsandminingspace,whichwillmakeameaningful contribution to the economy
• Monitor the implementation of and reporting on the SET Human Development Programme aimed primarily at developing skills, capacity and capabilities in science, engineering and technology, from junior level through to senior researcher levels
A N N U A L P E R F O R M A N C E P L A N 2 0 2 0 / 2 1 125
Name of public entity
Mandate Outcomes/Resolutions
The Council for Geoscience (CGS)
The Council for Geoscience (CGS) is one of the National Science Councils of South Africa and is the legal successor of the Geological Survey of South Africa, which was formed in 1912 by the amalgamation of 3 former Surveys, the oldest of which – the Geological Commission of the Cape of Good Hope – was founded in 1895. The Geoscience Act, 1993 (Act No. 100 of 1993), as amended, established the CGS in its present form. • Serve as the national custodian ofALL geoscientific information
and prospecting information relating to the earth, the marine environment and geomagnetic space
• The systematic onshore and offshore geoscientific mapping ofSouth Africa
• Basic geoscience research into the nature and origin of rocks • Collect and curate all geoscience data and act as a National
Geoscience Repository • The compilation and development of comprehensive and
integrated geoscience knowledge and information, such as geology, geophysics, geochemistry, engineering geology, economic geology, geochronology, palaeontology, geohydrological aquifer systems, geotechnical investigations, marine geology, geomagnetism, seismology, geohazards, environmental geology and other related disciplines
• Develop a long-term sustainable funding model that balances its mandate with commercial business
• Establish continuous engagement with National Treasury to advance the value proposition of investment in geosciences, as well as develop an aggressive commercial business development strategy in South Africa and abroad
• Fast-track the implementation of the Geoscience Technical Programme (GTP) to catalyse investment in exploration – the goal is to ensure the long-term sustainable funding model that sustains the impact of the geosciences in South Africa
• Full implementation of an Enterprise Resource Plan that integrates all business activities within the CGS – this includes developing an integrated operating model and implementing data policy guidelines together with the installation of suited technological infrastructure, in line with the ICT governance framework and data architecture
• Full implementation of the Integrated and Multidisciplinary Geoscience Mapping Programme (IMMP), annual recapitalisation plan, and job evaluation and exploration of a sustainable funding model
• Become a streamlined government business – conduct a detailed analysis of functional duplication of geosciences within the DMRE entities and streamline such activities to an entity with a legislated mandated for geosciences
• Pursue the full implementation of legislation provisions: Technical amendment of the GeoscienceAct,finalisationoftheGeoscienceActRegulationsandimplementationof the Geoscience Data-Sharing Model for PR and MR holders
• Other resolutions include the full installation of governance structures, the appointment of the CGS Board, maintenance of a fully capacitated EXCO and implementation of a Leadership Talent Management Programme

D E P A R T M E N T O F M I N E R A L R E S O U R C E S A N D E N E R G Y126
Name of public entity
Mandate Outcomes/Resolutions
The Council for Geoscience (CGS)
• Promote the search for, and exploitation of, any minerals in the country
• Bring to the notice of the Minister any information in relation to the prospecting for and mining of mineral resources, which is likely to be ofuseorbenefittoSouthAfrica
• Promote the search for and the exploitation of any minerals in South Africa
• Study (i) the distribution and nature of mineral resources and (ii) geo-environmental aspects of past, current and future mineral exploitation
• Study the use of the surface and the subsurface of the land and the seabed, and from a geoscientific viewpoint advise governmentinstitutions and the general public on the judicious and safe use thereof with a view to facilitate sustainable development
• DevelopandmaintaintheNationalGeoscientificLibrary,theNationalGeoscientific Information Centre, the National Borehole CoreDepository, the National Geophysical and Geochemical Test Sites, the National Geoscience Museum, the National Seismological Network and the National Geoscience Analytical Facility
• Conduct investigations and render prescribed specialised services to public and private institutions
• Render geoscience knowledge services and advice to the State

A N N U A L P E R F O R M A N C E P L A N 2 0 2 0 / 2 1 127
Name of public entity
Mandate Outcomes/Resolutions
MHSC • Advise the Minister on all occupational health and safety issues in the mining industry including legislation, research and promotion.
• Review and develop legislation for recommendation to the Minister (Focus on Regulations).
• Oversee research in relation to health and safety in the mining industry.
• Liaise with other bodies concerned with health and safety issues (MQA, State departments and various stakeholders).
• Promote health and safety culture in the mining industry.
• Focus on revenue diversification by developing and implementing the revenuegeneration strategy, outlining diverse revenue streams
• Develop a 4IR implementation strategy• Build a capacity scope that will include the employees of the MHSC, members of
Council and its Advisory Committees• Implement the promotion and dissemination strategy for target audiences, and build
internal capacity within the MHSC to improve turn-around times on MHSC processes and research outcomes that incorporate changes in technology and development, and enhancement of safety tools
• Awareness that will result in reducing health and safety-related incidents, and enhanced skills and internal capacity within the MHSC
• Appoint the Social and Ethics Committee to focus on Procurement and Contract Managementimprovements;appointadedicatedComplianceOfficer,andimprovecontinuous review and monitoring efforts

D E P A R T M E N T O F M I N E R A L R E S O U R C E S A N D E N E R G Y128
Name of public entity
Mandate Outcomes/Resolutions
South African Nuclear Energy Corporation (Necsa)
Necsa is established in terms of Section 3(1) of the Nuclear Energy Act, 1999 (Act No. 46 of 1999). The Act provides for the commercialisation of nuclear and related products and services, anddelegatesspecificresponsibilitiestothecorporation,includingthe implementation and execution of national safeguards and other international obligations. The South African Nuclear Energy Policy of 2008 directs Necsa to (i) investigate the entire nuclear fuel cycle with the aim of re-establishing viable fuel cycle facilities and (ii) serve as the anchor for nuclear energy research, development and innovation in South Africa.
Necsa is mandated to undertake and promote research and developmentinthefieldofnuclearenergyandradiationsciencesand technology. It processes and enriches source material, special nuclear material and restricted material. Apart from protecting the South African environment from nuclear threats, it supplies the commercial application of nuclear and associated technology and fulfilstheState’snuclearobligations.ItispartoftheResearchandRegulation Cluster in this report.
RefertotheNecsa’s2020/21APPfordetailsregardingthespecificoutputsplannedbyNecsa for the period

A N N U A L P E R F O R M A N C E P L A N 2 0 2 0 / 2 1 129
Name of public entity
Mandate Outcomes/Resolutions
National Radioactive Waste Disposal Institute (NRWDI)
A South African State-Owned Entity dedicated to professional nuclear waste management and disposal services in terms of the National Radioactive Waste Disposal Institute Act, 2008 (Act No. 53 of 2008).
• Manage radioactive waste disposal on a national basis.• Operate the national low-level waste repository at Vaalputs.• Design and implement disposal solutions for all categories of
radioactive waste.• Develop criteria for accepting and disposing of radioactive waste
in compliance with applicable regulatory safety requirements and any other technical and operational requirements.
• Assess and inspect the acceptability of radioactive waste for disposalandissueradioactivewastedisposalcertificates.
• Manage, operate and monitor operational radioactive waste disposal facilities including related predisposal management of radioactive waste on disposal sites.
• Investigate the need for any new radioactive waste disposal facilities and to site, design and construct new facilities as required.
• Defineandconductresearchanddevelopmentaimedatfindingsolutions for long-term radioactive waste management.
• Maintain a national radioactive waste database and publish a report on the inventory and location of all radioactive waste in the Republic at a frequency determined by the Board.
• Manage ownerless radioactive waste on behalf of the government, including the development of radioactive waste management plans for such waste.
• Assist generators of small quantities of radioactive waste in all technical aspects related to the management of such waste.
• Implement institutional control over closed repositories, including radiological monitoring and maintenance as appropriate.
• Aneffective,efficientandresponsiveNRWDI• Safe, secure and environmentally sustainable waste disposal operations • Centralised storage of spent nuclear fuel • Compliance with applicable statutory requirements

D E P A R T M E N T O F M I N E R A L R E S O U R C E S A N D E N E R G Y130
Name of public entity
Mandate Outcomes/Resolutions
National Radioactive Waste Disposal Institute (NRWDI)
• Implement any assignments or directives from the Minister regarding radioactive waste management
• Provide information on all aspects of radioactive waste management to the public living around radioactive waste disposal facilities and to the public in general
• Advise nationally on radioactive waste management• Co-operate with any person or institution in matters falling
within these functions• Any other function necessary to achieve the objectives of the
InstituteNational Nuclear Regulator (NNR)
The National Nuclear Regulator (NNR) is a public entity which is established and governed in terms of Section 3 of the National Nuclear Regulatory Act, (Act No. 47 of 1999) to provide for the protection of persons, property and the environment against nuclear damage through the establishment of safety standards and regulatory practices.
It is responsible for granting nuclear authorisations and exercising regulatory control related to safety over the siting, design, construction, operation, manufacture of component parts, and the decontamination, decommissioning and closure of nuclear installations; and vessels propelled by nuclear power or having radioactive material on board which is capable of causing nuclear damage.
• Explore rendering services to other regulators and international organisations to fund regulatory research and development
• Request approval by the Minister for additional funding avenue from Centre for Nuclear Safety and Security (CNSS) activities, as provided for in the NNR Act
• Identify an integrated regulatory approach between the NNR and the DMRE to aid intervention at unregulated legacy sites
• AddressfundingofNNRscientificwork–identifysitesandprovidedatatoDMREfor regulatory decisions
• Address the overlap of radioactive medical sources with SAHPRA by managing the regulation of all radioactive sources to centralise management of radioactive sources by the NNR
• Fast track the process of promulgating the Amendment of the NNR Act, the promulgation of regulations (including Control of Developments around the Koeberg Nuclear Power Plant), and other regulations which will impact the effective regulation of nuclear activities and nuclear installations in the country. AdvancethepaceofengagementsbetweentheNNRandtheDMREtofinaliseamendments

A N N U A L P E R F O R M A N C E P L A N 2 0 2 0 / 2 1 131
Name of public entity
Mandate Outcomes/Resolutions
Pelchem SOC Ltd PelchemisthesoleproducerandsupplieroffluorochemicalsintheSouthernHemisphereincludinghydrofluoricacid,fluorinegasmixturesanda rangeof specialtyperfluorocarbonsandfluoromonomers toSouth African and international customers.
• Necsa Board to reverse its decision regarding debt-to-equity conversion• Electricity increases to be capped at CPI• Fund projects through partnerships and make provisions around the set-aside ARV
agreement• Developaframeworktoregulateincreasestospecificindustries,chasethe
designationoffluorsparasastrategicmineral,aswellasgainapprovalofprojectswith partnerships and business cases
• Leverage strategic partnerships with key customers to develop the grade of product needed by the market and collaborate with AEFC to develop mothballed fluorsparmines
• Simplify partnership approval frameworks and governance structures NTP Radioisotopes SOC Ltd (NTP)
NTP is a state-owned public company and is a subsidiary of the South African Nuclear Energy Corporation (Necsa). Originally conceived in the early 1970s to supply the local South African market with commercial radiopharmaceuticals, NTP is now among the world’s top producers and distributors of key medical radioisotope molybdenum-99 (Mo-99), and radioisotope-based diagnostic imaging and therapy products including iodine-131 and lutetium-177.
• Implement the Radiopharmaceutical Strategy for Growth for South Africa and Africa to the Middle East.
• Leverage active pharmaceutical ingredient supply to Brazil, India and China, and pursue bilateral relationships with BRICs (via the Department of Trade and Industry and Department of International Relations and Cooperation) and National Cancer Management (via the Department of Health).
• Explore more pipelines by engaging in the Africa Free Trade Agreement beyond the 12 countries South Africa already trades with.
• Partner with the Department of Health to deliver the National Cancer Management Programme in support of NHI.
• Make strategic investments towards managing the key Necsa facilities, ensuring the continued sustainability in complying with regulations as well as funds for operations.
• Address overlapping mandates by identifying synergies in the global market, approached as SA Inc for medical isotopes.

D E P A R T M E N T O F M I N E R A L R E S O U R C E S A N D E N E R G Y132
Name of public entity
Mandate Outcomes/Resolutions
NTP Radioisotopes SOC Ltd (NTP)
NTP currently supplies up to a third of global demand for Mo-99, which is the most widely used medical isotope. The daughter or decay product of Mo-99, technetium-99m (Tc-99m), is used in more than 40-million medical diagnostic imaging studies every year.
• Seek to enhance co-operation for opportunity collaboration – engage with key licence authorities, pursue bilateral engagements with key trading countries and enhance communication and engagement between Necsa, NTP, NNR and DMRE.
The South African Diamond and Precious Metals Regulator (SADPMR)
SADPMR fulfils its mandate through the Diamonds Act, 1986 asamended, the Precious Metals Act, 2005, Diamond Export Levy (Administration) Act, 2007, and the Diamond Export Levy Act, 2007
• Gain support from the DMRE in retaining the surplus for 2018/2019. • Reviewfinancemodel• Compile proposed amendments to empowering legislation• Pursue constant engagements through forums with SARS and SAPS• Draft proposed amendments for the DMRE’s consideration to address alignment
issues with legislation and local imperatives• Intense implementation of the Marketing and Communication Strategy, phased in a
five-yearperiodState Diamond Trader (SDT)
SDT is a State-owned entity established in 2007 in terms of Section 14 of the Diamond Act, 1986 (Act No. 56 of 1986) to operate in the diamond industry to:• Supportandfacilitategrowthinlocaldiamondbeneficiation• Buyandsellroughdiamondsforlocalbeneficiation• Promoteequitable access to andbeneficiationof the country’s
diamond resources • Grow South Africa’s diamond cutting and polishing industry by
increasingHDSAforbeneficiation• Address distortion created by excluding previously disadvantaged
groups from economic participation (transform diamond industry) • Purchase up to 10% of the run of mine from South African
producers • Sell to registered customers through an application and approved
process
• Review the business model to create a better revenue picture through: - Diversification of operations, such as the trade on polished diamonds and
identifyotheralternativefundingstreams,andafocustoselltobothbeneficiationparties and dealers
- Facilitate the above changes through relevant legislation by exploring the possibility of the Minister reviewing regulations, particularly around the SDT’s capability to buy and sell in the market
• Addressoverlapstoensureproperlycoordinatedfunctions,andclarifiedrolesandresponsibilities through round-tables with involved parties
• Expedite the Board appointment process • Review organisational structures, including a new memorandum of understanding
with the South African Diamond and Precious Metals Regulator (SADPMR)• Explore shared services with other entities• TheSDTwillbenefitfromanamendedactallowingnewtradingconditions

A N N U A L P E R F O R M A N C E P L A N 2 0 2 0 / 2 1 133
9 Infrastructure Projects
The Department of Mineral Resources and Energy (DMRE) leads three Strategic Integrated Projects (SIPs), namely Integrated Municipal Infrastructure Projects; Green Energy in support of the South African Economy; and Electricity Transmission and Distribution for All. In addition, the DMRE is required to directly or indirectly participate in other SIP initiatives for coordination and reporting purposes.
9.1 Expenditure on long-term infrastructure and other capital plans
9.1.1 Extending access to electricity
In support of government’s policy to extend access to electricity to all South Africans, an additional 560 000 households are expected to be connected to the electricity grid over the medium term. To enable this, 6 new substations are set to be built and 9 substations upgraded. A further 15 000 households per year are expected to be provided with non-grid,mainlysolar,electrification.DespitereductionsovertheMTEFperiodofR1.2billionin indirect grants to Eskom and R380.5 million in municipal grants, mainly in 2020/21 and 2021/22, spending in the IntegratedNationalElectrificationProgrammesub-programme
isexpectedtoincreaseatanaverageannualrateof5.1%.,fromR5.2billionin2019/20toR6.1 billion in 2022/23. Transfers to Eskom are set to increase from R3.1 billion in 2019/20 toR3.7billionin2022/23atanaverageannualrateof5.7%.,andtransferstomunicipalitiesare set to increase from R1.9 billion in 2019/20 to R2.1 billion in 2022/23 at an average annual rate of 4.4%..Transfers for non-grid connections are expected to increase fromR212.9millionin2019/20toR238.5millionin2022/23atanaverageannualrateof4.2%.
The DMRE’s Electrification Masterplan, which is intended to inform the rollout ofelectrificationconnectionsforuniversalaccess,isexpectedtobefinalisedin2020/21.Theplan will provide a model for allocating resources based on data informed by factors such as backlogs, and is allocated R17.2 million over a two-year period, ending in 2021/22.
9.1.2 Enhancing energy efficiency
To realise a target of 1.5 terawatt hours of energy savings over the medium term, allocations to the energy efficiency anddemand-sidemanagement grant are expected to increasefrom R227.1 million in 2019/20 to R243.3 million in 2022/23. This will enable municipalities toundertakeinitiativestoupgrademunicipalinfrastructurethatisnotenergyefficient,suchasreplacingstreetandtrafficlightswithgreenertechnology.

D E P A R T M E N T O F M I N E R A L R E S O U R C E S A N D E N E R G Y134
Project Name
Programme OutputsOutcome
appropriationMain
appropriationAdjusted
appropriationRevised estimate
Medium-term estimate
2016/17 2017/18 2018/19 2019/20 2020/21 2021/22 2022/23
New assets (R thousand) R’000 R’000 R’000 R’000 R’000 R’000 R’000 R’000 R’000
INEP: Eskom
Electrificationand Energy Programme and Project Management
Provision of capital subsidies to Eskom to addresselectrificationbacklogs for permanently occupied residential dwellings, install bulk infrastructure and rehabilitate electrificationinfrastructure
3 526 334 3 846 154 3 262 031 3 374 053 3 124 053 3 124 053 3 001 483 2 994 257 3 688 162
INEP: Municipalities
Electrificationand Energy Programme and Project Management
Provision of capital subsidies to municipalities to addresselectrificationbacklogs for permanently occupied residential dwellings, install bulk infrastructure and rehabilitate electrificationinfrastructure
1 946 246 2 087 048 1 904 477 1 863 328 1 863 328 1 863 328 1 858 752 2 003 157 2 118 668

A N N U A L P E R F O R M A N C E P L A N 2 0 2 0 / 2 1 135
Project Name
Programme OutputsOutcome
appropriationMain
appropriationAdjusted
appropriationRevised estimate
Medium-term estimate
2016/17 2017/18 2018/19 2019/20 2020/21 2021/22 2022/23
New assets (R thousand) R’000 R’000 R’000 R’000 R’000 R’000 R’000 R’000 R’000
INEP: Non- grid electrificationtechnology
Electrificationand Energy Programme and Project Management
Provision of capital subsidies to non-gridelectrificationservice providers to addresselectrificationbacklogs
137 733 158 960 134 555 212 941 212 941 63 882 220 160 232 269 238 502
Total 5,610,313 6,092,162 5 315 657 5 450 322 -250 000 5 200 322 5 080 395 5 229 683 6 045 332
10 Public-Private Partnerships (PPPs)
N/A

2020/21
136
Annexures to the Annual Performance
Plan

A N N U A L P E R F O R M A N C E P L A N 2 0 2 0 / 2 1 137
Annexure A: Amendments to the Strategic Plan
N/A at this stage
Annexure B: Conditional grants
TheDMREadministers conditional grantswith regard to theNational ElectrificationProgrammeandEnergyEfficiency andDemand-SideManagement (EEDSM)Programme.Theseconditional grants are summarised as follows (details provided in the Division of Revenue Act, 2014 [Act No.10 of 2014]):
Name of grant Purpose Outputs Current annual budget (thousands)
R’000
Period of grant
EnergyEfficiencyandDemandSideManagement (EEDSM) Grant
Toprovidesubsidiestomunicipalitiestoimplementenergyefficiencyand demand side management (EEDSM) initiatives within municipal infrastructure in order to reduce electricity consumption and improve energyefficiency
Amount of energy saved in Terawatt hour (TWh)
217 994 000 July 2020–June 2021
ElectrificationandEnergyProgrammeand Project Management
Integratednationalelectrificationprogramme:Eskom Electrificationhouseholds
3 001 483 April 2020–March 2021
ElectrificationandEnergyProgrammeand Project Management
Integratednationalelectrificationprogramme:Municipalities Electrificationhouseholds
1 858 752 April 2020–March 2021
Annexure C: Consolidated indicators
Institution Output indicator Annual target Data sourceDepartment of Mineral Resources and Energy 76 75 MTSF and 2020–25 Strategic Plan, IRP, MPRDA, PPA

D E P A R T M E N T O F M I N E R A L R E S O U R C E S A N D E N E R G Y138
Annexure D: District development model
District Model Planning is led by the Department of Cooperative Governance and Traditional Affairs (COGTA). Annual Performance Plan service delivery projects, where applicable and when required by COGTA will be integrated into the District Model.
Annexure E: Technical indicator descriptions (TIDs)
TIDs will be provided in a separate document.

K-15760-1 [www.kashan.co.za]

RP156/2020ISBN: 978-0-621-48351-2