20201013 MICA Presentation by Len Steiner, Final, Final
73
Presented by: Len Steiner Steiner Consulting Group, 800.526.4612 supporting and promoting imported meat 2020 Annual General Meeting & Conference Virtual Meetings October 13 - 19, 2020
Transcript of 20201013 MICA Presentation by Len Steiner, Final, Final

Presented by: Len Steiner Steiner Consulting Group, 800.526.4612 supporting and promoting imported meat
2020 Annual General Meeting & ConferenceVirtual Meetings
October 13 - 19, 2020

2021 Meat Market Outlook Presented by: Steiner Consulting Group | (800) 526-4612
Main Discussion Points Today
#1: Economic Situation in US and World #2: Currency Markets #3: Feed Input Costs #4: Cattle Supplies in USA, Canada and Mexico #5: Demand /Supplies in Other Markets #7: China Protein Demand Discussion #8: Demand in US Domestic Market #9: Alternative Protein Supplies #10:US Lamb Business #11: Price Forecasts
- 1 -
2021 Meat Market Outlook Presented by: Steiner Consulting Group | (800) 526-4612
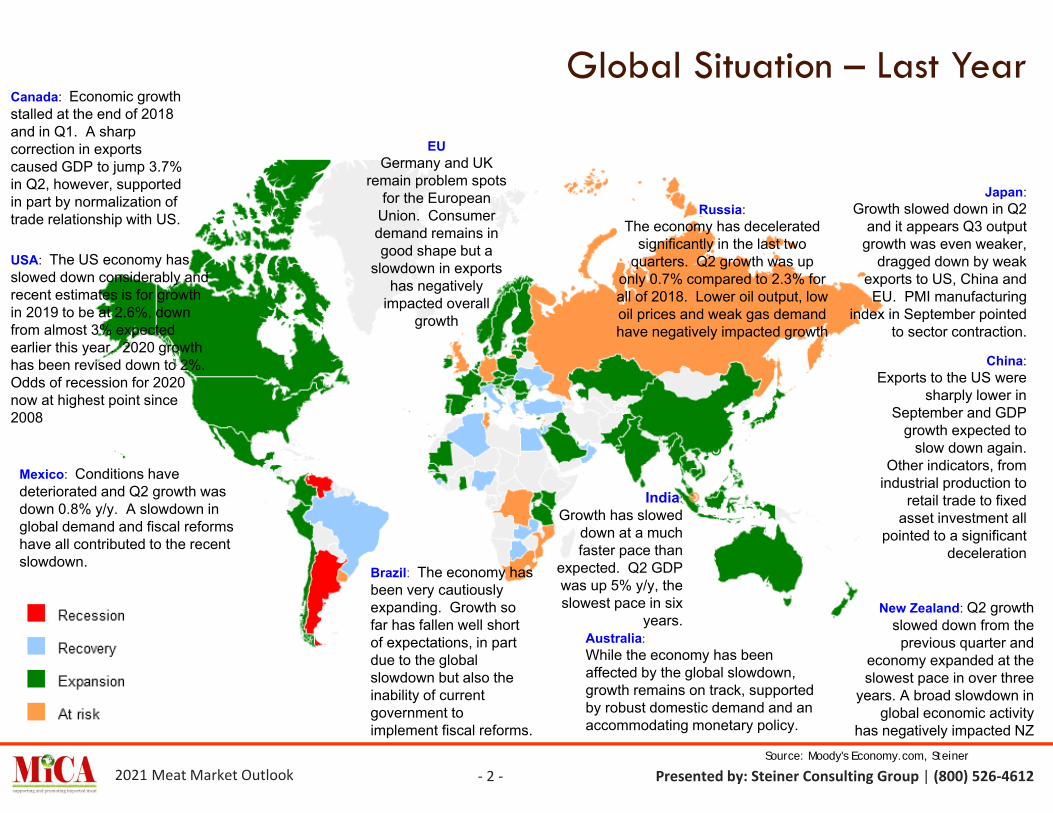
Global Situation – Last Year
- 2 -Source: Moody's Economy.com, Steiner
Canada: Economic growth stalled at the end of 2018 and in Q1. A sharp correction in exports caused GDP to jump 3.7% in Q2, however, supported in part by normalization of trade relationship with US.
USA: The US economy has slowed down considerably and recent estimates is for growth in 2019 to be at 2.6%, down from almost 3% expected earlier this year. 2020 growth has been revised down to 2%. Odds of recession for 2020 now at highest point since 2008
Brazil: The economy has been very cautiously expanding. Growth so far has fallen well short of expectations, in part due to the global slowdown but also the inability of current government to implement fiscal reforms.
EUGermany and UK
remain problem spots for the European
Union. Consumer demand remains in good shape but a
slowdown in exports has negatively
impacted overall growth
Russia:The economy has decelerated
significantly in the last two quarters. Q2 growth was up
only 0.7% compared to 2.3% for all of 2018. Lower oil output, low oil prices and weak gas demand have negatively impacted growth
Japan:Growth slowed down in Q2
and it appears Q3 output growth was even weaker,
dragged down by weak exports to US, China and EU. PMI manufacturing
index in September pointed to sector contraction.
China:Exports to the US were
sharply lower in September and GDP
growth expected to slow down again.
Other indicators, from industrial production to
retail trade to fixed asset investment all
pointed to a significant deceleration
India:Growth has slowed
down at a much faster pace than
expected. Q2 GDP was up 5% y/y, the slowest pace in six
years.
Mexico: Conditions have deteriorated and Q2 growth was down 0.8% y/y. A slowdown in global demand and fiscal reforms have all contributed to the recent slowdown.
Australia:While the economy has been affected by the global slowdown, growth remains on track, supported by robust domestic demand and an accommodating monetary policy.
New Zealand: Q2 growth slowed down from the
previous quarter and economy expanded at the slowest pace in over three
years. A broad slowdown in global economic activity
has negatively impacted NZ

2021 Meat Market Outlook Presented by: Steiner Consulting Group | (800) 526-4612
Global Situation – Current
- 3 -Source: Moody's Economy.com, Steiner
Canada: Economy is coming out of a sharp contraction and it is growing again. Unemployment is expected to remain at 9% through end of the year. COVID over the winter months remains a wild card.
USA: Economy contracted at an annualized rate of 32% in Q2 but it is expected to rebound in second half of the year. Retail and housing sectors have recovered but spending on services and international trade remains depressed. Lack of additional stimulus could result in a high rate of layoffs into the winter.
Brazil: The economy contracted by an annualized 11.4% in Q2. Industrial production has rebounded but unemployment remains high. Expectations are for the economy to expand in second half of the year.
EUSouthern Europe, especially Spain and Italy, remain mired
in recession due to COVID impact on tourism. German
economy contracted in Q2 but by less than expected and government support has
helped the recovery.
Russia:Weak oil prices due to collapse in
demand during spring have significantly impacted growth. Consumer spending
has rebounded but there’s a lot of uncertainty about this winter.
Japan:COVID hammered the
economy and in the June quarter the economy
contracted at an annualized 28%. Exports
remain a key area of uncertainty going forward.
China:The economy has
recovered faster than in other countries, in part
because of the success to contain COVID
spread. Exports were sharply higher in
September thanks to strong global demand for PPE and medical
equipment.
India:Virus continues to
spread in India adding to market
uncertainty in near term. Q2 GDP was
down 23.9%.
Mexico: Economy posted a sharp annual contraction of 18.7% in Q2. Industrial activity declined by 25.7% due to lockdowns and collapse in demand from US. The economy is expected to rebound in Q3 but it will still be in negative territory for the year.
Australia:Social distancing rules resulted in a sharp contraction in Q2 but economy is expected to rebound just as quickly in Q3. But GDP will remain under pre-pandemic levels until late 2021.
New Zealand: COVID impact in April and May
was significant but leading indicators suggest a strong
rebound in economic activity across the board. Higher dairy/beef prices also seen as supportive.
Argentina: The economy contracted by 13.2% y/y in the first five months of 2020. Impact of lockdowns has eased recently but for all of 2020 the economy is expected to contract by 10% following a 2.2% decline in 2019.

2021 Meat Market Outlook Presented by: Steiner Consulting Group | (800) 526-4612
#1 Economic Situation in US and WorldSlowdown across all regions
- 4 -
Source: Moody's Economy.com
World N. Am. S. Am. Euro Asia Oceania2018 3.0 2.9 0.0 1.9 4.5 2.82019 2.4 2.0 -0.2 1.3 4.1 1.92020 Fcst Jul -5.1 -6.4 -9.2 -8.8 -1.4 -3.2
Sep -4.6 -4.9 -8.9 -7.7 -1.6 -4.42021 Fcst Jul 4.3 1.7 3.7 3.6 7.0 3.9
Sep 5.0 3.4 4.4 3.9 7.2 2.8
Last update: September 8, 2020
-12.0
-10.0
-8.0
-6.0
-4.0
-2.0
0.0
2.0
4.0
6.0
8.0
10.0
World N. Am. S. Am. Euro Asia Oceania
REAL GDPGROWTH % GLOBAL GROWTH OUTLOOK
2018 2019 2020 Fcst 2021 Fcst

2021 Meat Market Outlook Presented by: Steiner Consulting Group | (800) 526-4612
#1 Economic Situation in US and WorldEconomy expected to rebound in Q3 but will not be back to pre-COVID levels until late 2021
Positives- Stimulus helped prevent a
collapse in demand- Some sectors, like housing, are
back to normal and growing- Election uncertainty will come
to an end soon- Low interest rates
Negatives- Unknown path of the pandemic,
with vaccines still unproven- Widening wealth gap and
heightened political tension- Service economy remains in
shambles- Weak global demand
- 5 -
* Forecast: Moody’s-40.0
-30.0
-20.0
-10.0
0.0
10.0
20.0
30.0
'00 '01 '02 '03 '04 2005 '06 '07 '08 '09 2010 '11 '12 '13 '14 '15 '16 '17 '18 '19 '20 '21
% Ch.ANNUAL GROWTH RATE OF GDP
Annualized Quarterly Growth RateFcst
2021 Meat Market Outlook Presented by: Steiner Consulting Group | (800) 526-4612
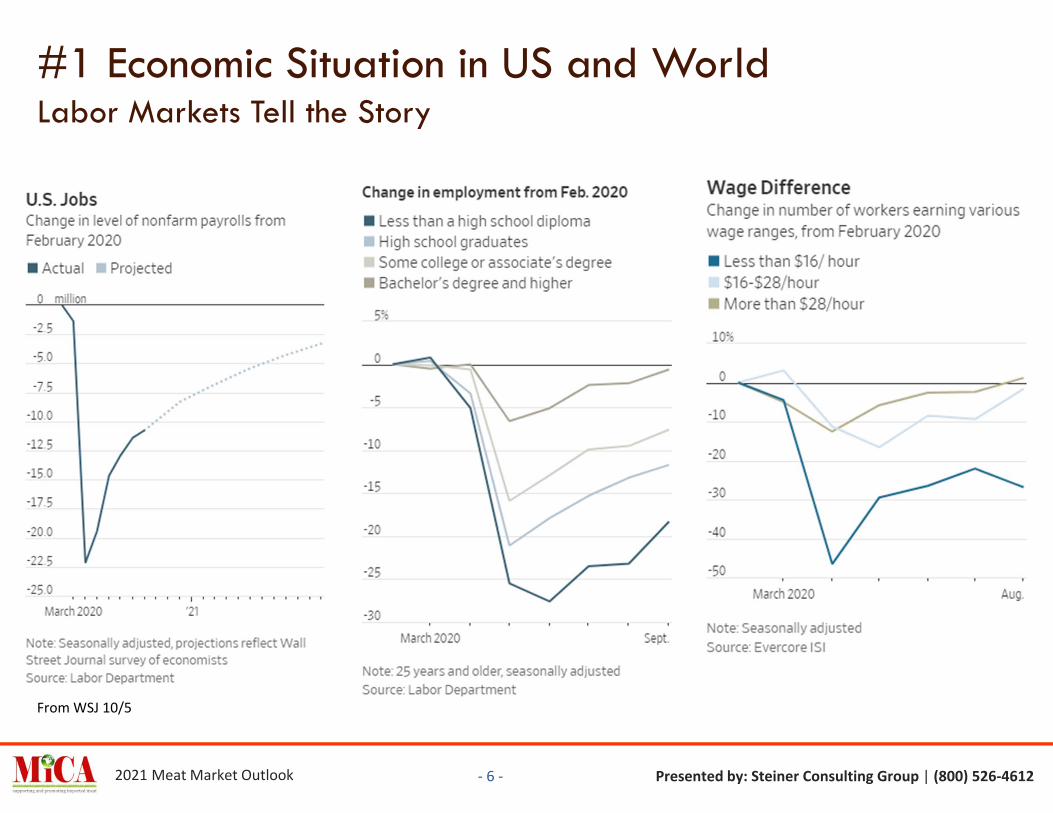
#1 Economic Situation in US and WorldLabor Markets Tell the Story
- 6 -
From WSJ 10/5

2021 Meat Market Outlook Presented by: Steiner Consulting Group | (800) 526-4612
#1 Economic Situation in US and WorldFoodservice hit hard by Covid-19 but grocery store get a boost
- 7 -
Source: Advance Monthly Sales for Retail & Foodservice, US Census Bureau
Dollar Sales at Retail and Foodservice. Million Dollars Total Dollar Sales at Retail and Foodservice. Million DollarsSource: US Census Bureau. Analysis by Steiner Consulting. Updated through June 2020 Source: US Census Bureau. Analysis by Steiner Consulting. Updated through June 2020
30,032
54,644
73,714
62,905
25,000
30,000
35,000
40,000
45,000
50,000
55,000
60,000
65,000
70,000
75,000
'17 '18 '19 '20
Foodservice $
Grocery $
123,049
93,901
117,549
90,000
95,000
100,000
105,000
110,000
115,000
120,000
125,000
'17 '18 '19 '20
2021 Meat Market Outlook Presented by: Steiner Consulting Group | (800) 526-4612
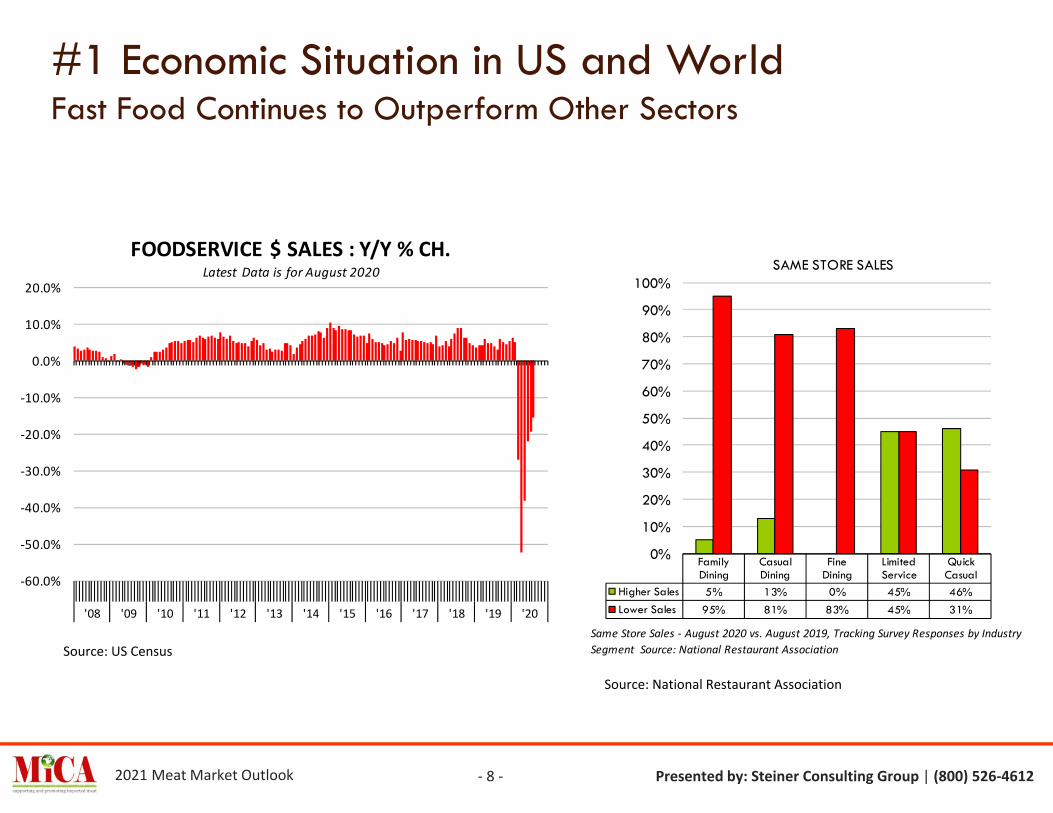
#1 Economic Situation in US and WorldFast Food Continues to Outperform Other Sectors
- 8 -
-60.0%
-50.0%
-40.0%
-30.0%
-20.0%
-10.0%
0.0%
10.0%
20.0%
'08 '09 '10 '11 '12 '13 '14 '15 '16 '17 '18 '19 '20
FOODSERVICE $ SALES : Y/Y % CH.Latest Data is for August 2020
Same Store Sales - August 2020 vs. August 2019, Tracking Survey Responses by Industry Segment Source: National Restaurant Association
FamilyDining
CasualDining
FineDining
LimitedService
QuickCasual
Higher Sales 5% 13% 0% 45% 46%Lower Sales 95% 81% 83% 45% 31%
0%
10%
20%
30%
40%
50%
60%
70%
80%
90%
100%SAME STORE SALES
Source: US Census
Source: National Restaurant Association

2021 Meat Market Outlook Presented by: Steiner Consulting Group | (800) 526-4612
#1 Economic Situation in US and WorldFoodservice inflation reflects higher labor/operational costs
- 9 -
Data updated through: August 2020
Food CPI Comparisons. Jan 2008 = 100Source: BLS. Analysis by Steiner Consulting
95.0
105.0
115.0
125.0
135.0
145.0
155.0
2008 2009 2010 2011 2012 2013 2014 2015 2016 2017 2018 2019 2020
Food at Limited Service Restaurants
Food away from home
Food at Home

2021 Meat Market Outlook Presented by: Steiner Consulting Group | (800) 526-4612
# 2 Currency MarketsPerformance of US$ vs. Imported Beef Currencies in last 12 months
- 10 -
Positive for US importsNegative for US exports
Negative for US importsPositive for US exports
US Dollar vs. Currencies of Top Meat Trading Partners & Compe tors% change in the last 12 months (Sep. 19 - Sep. 20)
80%
90%
100%
110%
120%
130%
140%
150%
160%
Sep '19 Oct '19 Nov '19 Dec '19 Jan '20 Feb '20 Mar '20 Apr '20 May '20 Jun '20 Jul '20 Aug '20 Sep '20
BRL/1USD
EUR/1USD
ARS/1USD
NZD/1USDAUD/1USD
CAD/1USD
UYU/1USD

2021 Meat Market Outlook Presented by: Steiner Consulting Group | (800) 526-4612
# 2 Currency MarketsPerformance of US$ vs. Imported Beef Currencies in last 12 months
- 11 -
Brazilian Real per 1 US Dollar Argen ne Peso per 1 US DollarPrevious 12 months (Sep. 19 - Sep. 20) Previous 12 months (Sep. 19 - Sep. 20)
50
55
60
65
70
75
80
Sep '19 Oct '19 Nov '19 Dec '19 Jan '20 Feb '20 Mar '20 Apr '20 May '20 Jun '20 Jul '20 Aug '20 Sep '20
3
3.5
4
4.5
5
5.5
6
6.5
Sep '19 Oct '19 Nov '19 Dec '19 Jan '20 Feb '20 Mar '20 Apr '20 May '20 Jun '20 Jul '20 Aug '20 Sep '20

2021 Meat Market Outlook Presented by: Steiner Consulting Group | (800) 526-4612
# 2 Currency MarketsPerformance of US$ vs. Imported Beef Currencies in last 12 months
- 12 -
Uruguayan Peso vs. 1 US Dollar Canadian Dollar per 1 US DollarPrevious 12 months (Sep. 19 - Sep. 20) Previous 12 months (Sep. 19 - Sep. 20)
1.2000
1.2500
1.3000
1.3500
1.4000
1.4500
1.5000
Sep '19 Oct '19 Nov '19 Dec '19 Jan '20 Feb '20 Mar '20 Apr '20 May '20 Jun '20 Jul '20 Aug '20 Sep '20
30
35
40
45
50
Sep '19 Oct '19 Nov '19 Dec '19 Jan '20 Feb '20 Mar '20 Apr '20 May '20 Jun '20 Jul '20 Aug '20 Sep '20

2021 Meat Market Outlook Presented by: Steiner Consulting Group | (800) 526-4612
# 2 Currency MarketsPerformance of US$ vs. Imported Beef Currencies in last 12 months
- 13 -
New Zealand Dollar per 1 US Dollar Australian Dollar per 1 US DollarPrevious 12 months (Sep. 19 - Sep. 20) Previous 12 months (Sep. 19 - Sep. 20)
1.3000
1.3500
1.4000
1.4500
1.5000
1.5500
1.6000
1.6500
1.7000
1.7500
1.8000
Sep '19 Oct '19 Nov '19 Dec '19 Jan '20 Feb '20 Mar '20 Apr '20 May '20 Jun '20 Jul '20 Aug '20 Sep '20
1.4000
1.4500
1.5000
1.5500
1.6000
1.6500
1.7000
1.7500
1.8000
Sep '19 Oct '19 Nov '19 Dec '19 Jan '20 Feb '20 Mar '20 Apr '20 May '20 Jun '20 Jul '20 Aug '20 Sep '20

2021 Meat Market Outlook Presented by: Steiner Consulting Group | (800) 526-4612
# 2 Currency MarketsPrice of Imported 90CL Beef in US$ Trending Higher
- 14 -
US $222/cwt9/30/2020
100
150
200
250
300
350
2007 2008 2009 2010 2011 2012 2013 2014 2015 2016 2017 2018 2019 2020
Price of 90CL Imported Beef in US Market (CIF) Prices in US$/cwt
USD/cwt
Price inUSD

2021 Meat Market Outlook Presented by: Steiner Consulting Group | (800) 526-4612
# 2 Currency MarketsPrice of Imported 90CL Beef in US$ Terms & AUD Terms
- 15 -
Price of 90CL Imported Beef in US Market (FOB East Coast) Prices in US$/cwt and AUD/cwt. Price data: Urner Barry. Exchange rate data: Federal Reserve. Analysis by Steiner Consul ng
$310/cwt
464.91
$222/cwt
311.00
100
150
200
250
300
350
400
450
500
2007 2008 2009 2010 2011 2012 2013 2014 2015 2016 2017 2018 2019 2020
USD/cwt
Price inUSD and AUD
AUD/cwt

2021 Meat Market Outlook Presented by: Steiner Consulting Group | (800) 526-4612
#3 Feed Input CostsLess corn supply than earlier expected. Now focus shifts to demand
- 16 -
Higher Yield
Sharply Higher exports
Lower S/U but still comfortable carryout
2018/19 2019/20
USDA USDA
EstUSDA Sep Est
USDA Oct Est
vs. 2018/19
vs. 2019/20
.
Planted 88.9 89.7 92.0 91.0 2.4% 1.4%Harvested 81.3 81.3 83.5 82.5 1.5% 1.5%
Yield per harvested acre 176.4 167.5 178.5 178.4 1.1% 6.5%
Beginning stocks 2,140 2,221 2,253 1,995 -6.8% -10.2%Production 14,340 13,620 14,900 14,722 2.7% 8.1%Imports 28 42 25 25 -10.7% -40.5%
Supply, total 16,509 15,883 17,178 16,742 1.4% 5.4%
Feed and residual 5,429 5,827 5,825 5,775 6.4% -0.9%Ethanol for fuel 5,378 4,852 5,100 5,050 -6.1% 4.1%Food, seed and residual 1,415 1,430 1,425 1,425 0.7% -0.3%
Domestic use, total 12,222 12,109 12,350 12,250 0.2% 1.2%
Exports 2,066 1,778 2,325 2,325 12.5% 30.8%
Use, total 14,288 13,887 14,675 14,575 2.0% 5.0%
Ending stocks 2,221 1,995 2,503 2,167 -2.4% 8.6%
Avg. farm price ($/bu) 3.61 3.56 3.50 3.60 -0.3% 1.1%
Ending Stocks/Use 15.5% 14.4% 17.1% 14.9%Source: USDA Monthly WASDE Report.
** Corn crop marketing year starts September 1.
% Change2020/21
U.S. Corn Supply and Use
2021 Meat Market Outlook Presented by: Steiner Consulting Group | (800) 526-4612
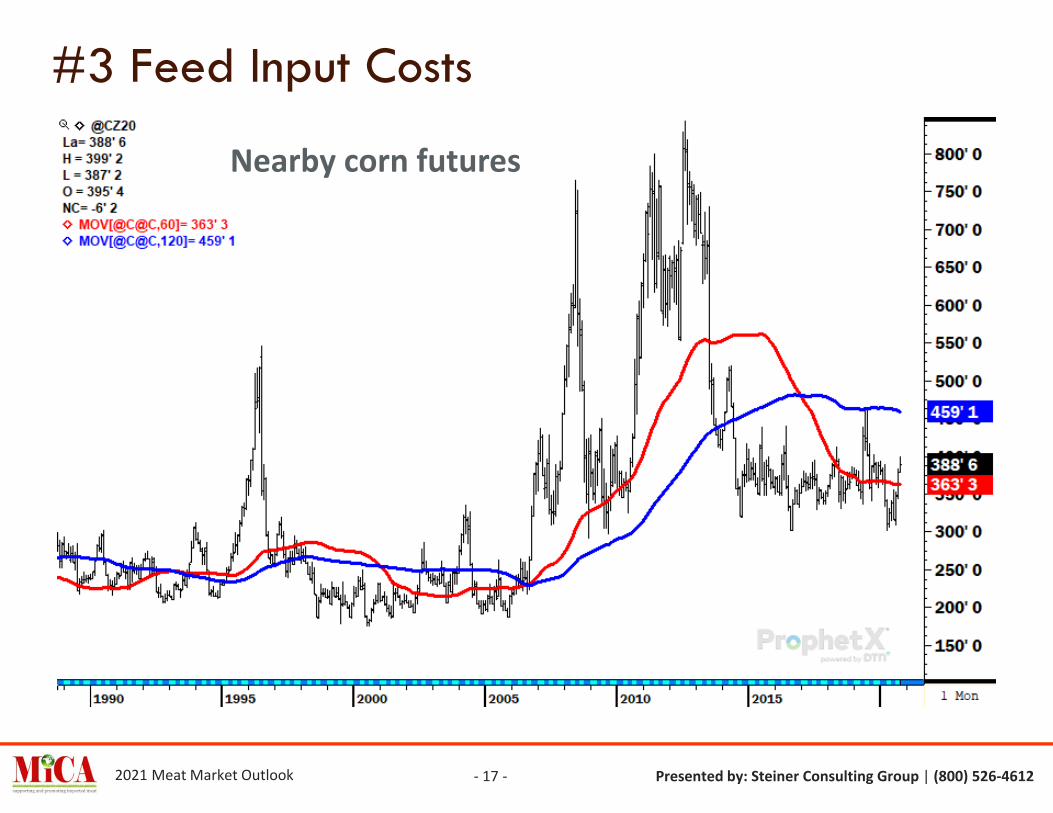
#3 Feed Input Costs
- 17 -
Nearby corn futures

2021 Meat Market Outlook Presented by: Steiner Consulting Group | (800) 526-4612
#4 Meat Production Has Been on a Growth Path but growth will stall in 2021 and 2022
- 18 -
Combined USA Beef, Pork, Broiler and Turkey ProductionMillion Pounds. Carcass Wt. Basis. USDA Actual + Steiner Forecasts
90,929
105,517 106,266
40,000
50,000
60,000
70,000
80,000
90,000
100,000
110,000 +16.1%

2021 Meat Market Outlook Presented by: Steiner Consulting Group | (800) 526-4612
#4 Minimal Growth in Output Expected for the next Two Years
- 19 -
2018 2019 % CH. 2020 % CH. 2021 % CH. 2022 % CH.
BEEF 26,872 27,155 1.1% 27,261 0.4% 26,845 -1.5% 26,411 -1.6%
PORK 26,315 27,572 4.8% 28,294 2.6% 28,416 0.4% 28,499 0.3%
BROILERS 42,147 43,453 3.1% 44,291 1.9% 44,601 0.7% 45,443 1.9%
TURKEYS 5,802 5,742 -1.0% 5,670 -1.2% 5,822 2.7% 5,913 1.6%
LAMB 153 149 -3.1% 147 -1.2% 149 1.3% 152 2.5%
VEAL 76 75 -1.6% 68 -8.3% 66 -3.8% 68 3.0%
TOTAL 101,365 104,144 2.7% 105,732 1.5% 105,899 0.2% 106,486 0.6%

2021 Meat Market Outlook Presented by: Steiner Consulting Group | (800) 526-4612
#5 USA Cattle/Beef SuppliesCattle Inventory Near Its Cyclical Peak
- 20 -
INVENTORY (000 OMITTED) 2010 2011 2012 2013 2014 2015 2016 2017 2018 2019 2020% Ch. vs.
20192021
Estimate% Ch. vs.
2020
ALL CATTLE AND CALVES 94,081 92,887 91,160 90,095 88,243 89,173 91,888 93,625 94,298 94,805 94,413 -0.4% 94,292 -0.1%
COW AND HEIFERS THAT HAVE CALVED 40,526 40,068 39,517 38,853 38,165 38,644 39,476 40,539 40,898 41,044 40,651 -1.0% 40,438 -0.5%
BEEF COWS 31,440 30,913 30,282 29,631 28,956 29,332 30,164 31,171 31,466 31,691 31,317 -1.2% 31,066 -0.8%
DAIRY COWS 9,087 9,156 9,236 9,221 9,209 9,312 9,312 9,369 9,432 9,353 9,335 -0.2% 9,372 0.4%
HEIFERS 500LBS. AND OVER 19,778 19,650 19,445 19,256 18,919 19,266 19,902 20,112 20,218 20,210 20,114 -0.5% 20,166 0.3%
BEEF COW REPLACEMENT 5,443 5,135 5,281 5,429 5,556 6,086 6,335 6,363 6,108 5,885 5,772 -1.9% 5,743 -0.5%
DAIRY COW REPALCEMENT 4,551 4,577 4,618 4,546 4,539 4,710 4,814 4,754 4,768 4,702 4,637 -1.4% 4,650 0.3%
OTHER HEIFERS 9,784 9,938 9,546 9,281 8,824 8,469 8,753 8,995 9,341 9,624 9,706 0.9% 9,773 0.7%
STEERS 500 LBS. AND OVER 16,568 16,394 15,957 15,931 15,623 15,630 16,305 16,374 16,528 16,758 16,671 -0.5% 16,821 0.9%
BULLS 500 LBS. AND OVER 2,190 2,165 2,100 2,074 2,038 2,109 2,137 2,244 2,252 2,253 2,237 -0.7% 2,231 -0.3%
HFRS, STRS AND BULLS UNDER 500 LBS 15,019 14,610 14,141 13,983 13,498 13,524 14,067 14,356 14,401 14,540 14,739 1.4% 14,636 -0.7%
ANNUAL CALF CROP 35,740 35,357 34,469 33,630 33,522 34,087 35,063 35,758 36,313 36,060 35,700 -1.0%
Note: Shaded numbers represent Steiner estimates
JANUARY 1st U. S. CATTLE INVENTORY

2021 Meat Market Outlook Presented by: Steiner Consulting Group | (800) 526-4612
#5 USA Cattle/Beef SuppliesNext Year Will Be The 7th Year of Current Cycle
- 21 -
Comparing US Cattle Cycles of the Last +50 YearsY/Y Change in Cattle Inventories.
-6.0%
-4.0%
-2.0%
0.0%
2.0%
4.0%
6.0%
0 +1 +2 +3 +4 +5 +6 +7 +8 +9 +10 +11 +12 +13 +14
1958 - 1967 (9 yrs)
1967 - 1979 (12 yrs)
1979 - 1990 (11 yrs)
1990 - 2004 (14 yrs)
2004 - 2014 (10 yrs)
2014 - Current (6 yrs)
# of years from the start of the cycle

2021 Meat Market Outlook Presented by: Steiner Consulting Group | (800) 526-4612
#5 Cattle/Beef SuppliesUS Cattle Inventories were -0.4% in Jan 2020 and Forecast -0.1% in Jan 2021
- 22 -
1958 = 91,176
1975 = 132,028
1990 = 95,816
1996 = 103,548
2004 = 94,403
2007 = 96,573
40,000
50,000
60,000
70,000
80,000
90,000
100,000
110,000
120,000
130,000
140,000
TOTA
L IN
VEN
TORI
ES, 0
00 O
MIT
TED
CATTLE INVENTORIES, 000 HEAD, 1920 - 2020 + 2021 Forecast
Jan 1, 202194.2 mil head

2021 Meat Market Outlook Presented by: Steiner Consulting Group | (800) 526-4612
#5 Cow/Bull Slaughter in 2020
- 23 -
WEEKLY COW & BULL SLAUGHTER. '000 HEADSource: USDA-AMS
90
100
110
120
130
140
150
Jan Feb Mar Apr May Jun Jul Aug Sep Oct Nov Dec
5-Yr Avg. 2018 2019 2020
Limited dairy cow slaughter has reduced overall kill this year, especially in second half of the year.

2021 Meat Market Outlook Presented by: Steiner Consulting Group | (800) 526-4612
#5 Cattle/Beef SuppliesSteer weights are now back to trend line, in part due to backup this summer
- 24 -
650
680
710
740
770
800
830
860
DRES
SED
WEI
GHTS
, POU
NDS
FI CATTLE AVERAGE DRESSED WEIGHTS: 1990 - 2020Dressed Carcass Weights. Weekly. USDA
2021 Meat Market Outlook Presented by: Steiner Consulting Group | (800) 526-4612
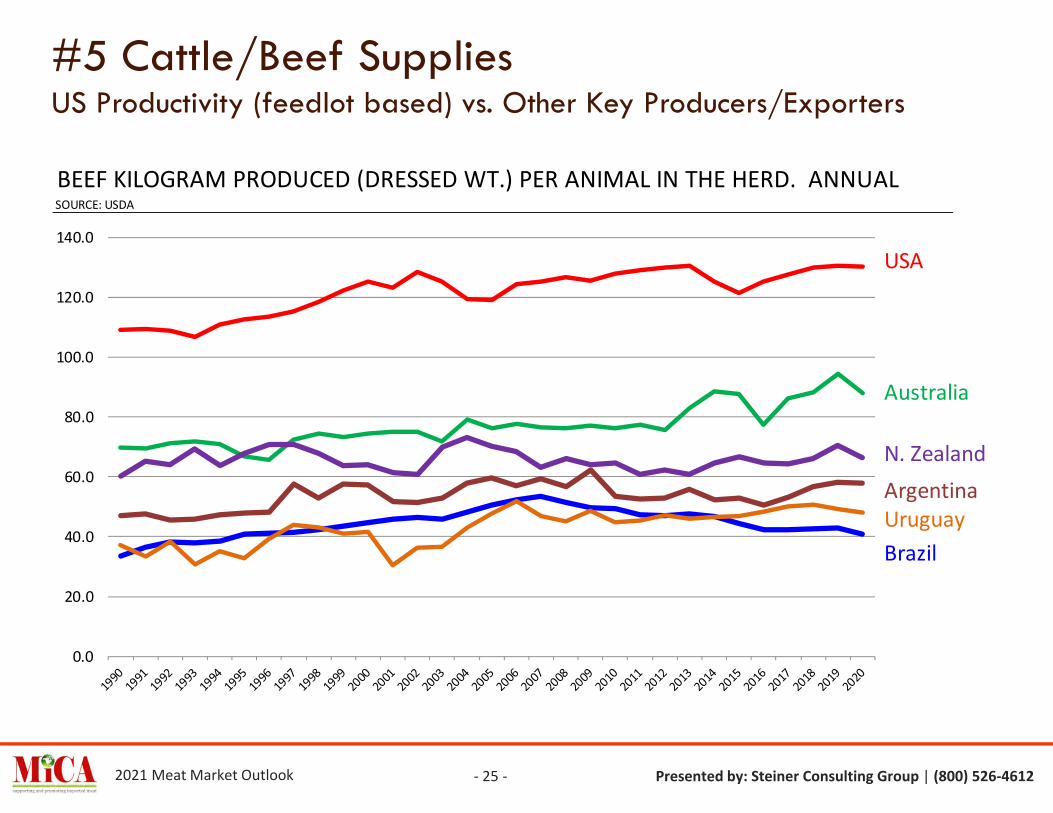
#5 Cattle/Beef SuppliesUS Productivity (feedlot based) vs. Other Key Producers/Exporters
- 25 -
BEEF KILOGRAM PRODUCED (DRESSED WT.) PER ANIMAL IN THE HERD. ANNUALSOURCE: USDA
0.0
20.0
40.0
60.0
80.0
100.0
120.0
140.0USA
Australia
Brazil
N. Zealand
UruguayArgentina
2021 Meat Market Outlook Presented by: Steiner Consulting Group | (800) 526-4612
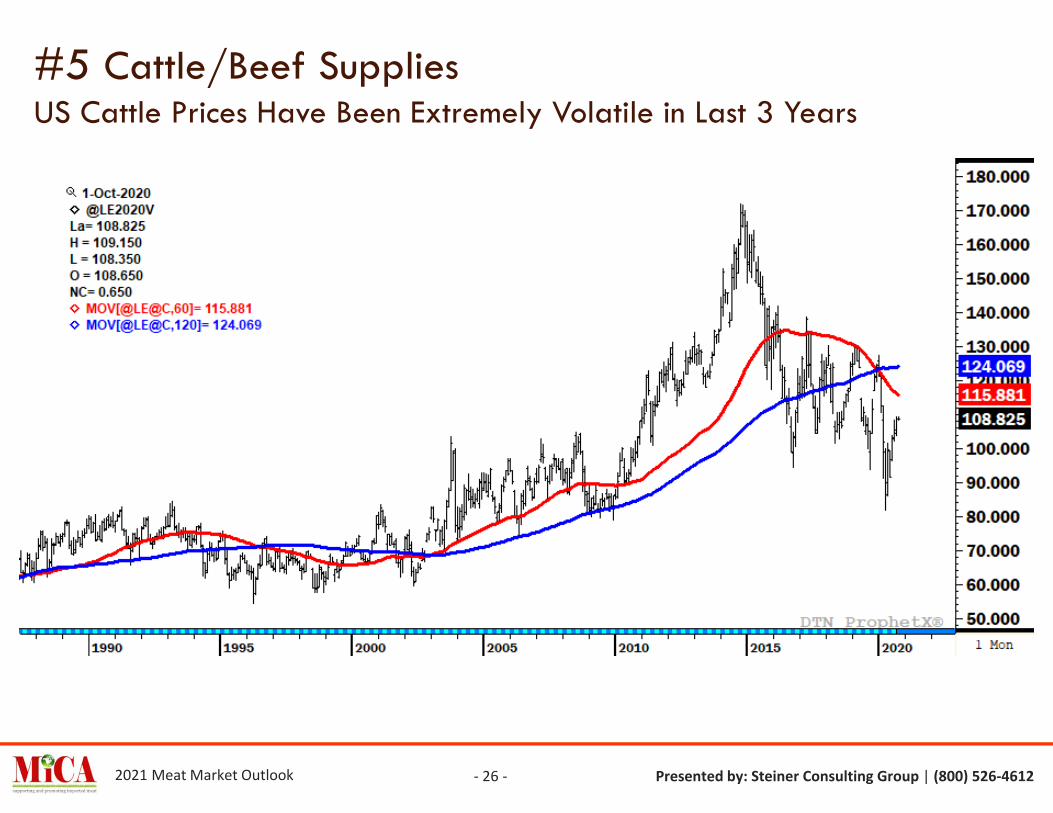
#5 Cattle/Beef SuppliesUS Cattle Prices Have Been Extremely Volatile in Last 3 Years
- 26 -

2021 Meat Market Outlook Presented by: Steiner Consulting Group | (800) 526-4612
#5 Cattle/Beef SuppliesSlaughter disruptions caused wholesale price spike in Apr/May
Meat prices are normally inelastic. This means that a one percent increase/decrease in per capita consumption results in a larger than one percent change in price the other direction. For instance, the choice beef cutout doubled in price when COVID-19 outbreaks at packing plants caused beef production in the US to decline by 29% for three weeks in late April and early May. The average cutout in May 2019 was $223/cwt and it was $230/cwt in March 2020. By May 12, 2020 the cutout hit $475/cwt, more than double what it was in March or the previous year.
- 27 -
Weekly US Beef Production. Million Pounds. Carcass Wt. BasisSource: USDA-NASS and USDA-AMS. Analysis by Steiner Consulting
320.0
370.0
420.0
470.0
520.0
570.0
620.0
Jan Feb Mar Apr May Jun Jul Ag Sep Oct Nov Dec
2020 5-Yr Avg (2015-19) 2019
Apr 5 - May 30-824M (-20%)
Weekly Choice Beef Cutout Value. $/cwt.Data source: USDA-AMS. Analysis by Steiner Consulting
150
190
230
270
310
350
390
430
470
Jan Feb Mar Apr May Jun Jul Aug Sep Oct Nov Dec
5-Yr Avg. 2019 2020

2021 Meat Market Outlook Presented by: Steiner Consulting Group | (800) 526-4612
#5 Cattle/Beef SuppliesLack of profitability resulted in some liquidation in last two years. Will things improve in 2021?
-200
-100
0
100
200
300
400
500
600
ESTIMATED AVERAGE COW-CALF RETURNSReturns over cash costs (includes pasture rent), Annual, US$/cow
forecast
Source: LMIC
- 28 -

2021 Meat Market Outlook Presented by: Steiner Consulting Group | (800) 526-4612
#5 Cattle/Beef SuppliesFemale Slaughter Ratio Still Suggests Liquidation, But at a Slower Pace
- 29 -
Liqu
idat
ion
Reb
uild
ing
0.47

2021 Meat Market Outlook Presented by: Steiner Consulting Group | (800) 526-4612
#5 Cattle/Beef SuppliesCow Slaughter Outlook for rest of 2020 & in 2021
- 30 -
2020 cow slaughter for Jan – Aug = 4.163MM head, -1.1% higher than a year ago
Forecast for cow slaughter in 2020 = -0.9%
Forecast for cow slaughter in 2021 = -2.6%

2021 Meat Market Outlook Presented by: Steiner Consulting Group | (800) 526-4612- 31 -
BEEFQUARTERLY SLAUGHTER, PRODUCTION, IMPORTS, EXPORTS AND DISAPPEARANCE
=A x BA B C D E F G =C+D-E+F+G
Year & QuarterCommercial
Slaughter
Percent Change From
Year Ago
Average Carcass
Weights
Percent Change From
Year Ago
Commercial Meat
Production
Percent Change From
Year Ago Imports
Percent Change From
Year Ago Exports
Percent Change From
Year AgoFarm
Production
Adjustments to Ending Stocks to Balance
Total Disappearance
Percent Change From
Year Ago(1,000 Head) Lbs. (Million Lbs.) (Million Lbs.) (Million Lbs.) (Million Lbs.) (Million Lbs.) (Million Lbs.)
20161st Qtr. 7,184 3.1% 826 1.7% 5,938 4.8% 792 -9.7% 535 2.2% 25 41 6,261 4.5%2nd Qtr. 7,631 5.6% 811 0.1% 6,187 5.7% 831 -16.0% 621 2.4% 8 24 6,429 2.8%3rd Qtr. 7,845 7.6% 825 -0.9% 6,472 6.6% 751 -15.6% 660 21.9% 8 -73 6,497 1.7%4th Qtr. 7,919 9.0% 837 -0.5% 6,625 8.4% 638 4.1% 740 24.3% 25 -66 6,482 5.7%Year 30,578 6.4% 825 0.1% 25,221 6.4% 3,012 -10.6% 2,557 12.8% 67 74 25,817 3.5%
20171st Qtr. 7,714 7.4% 817 -1.1% 6,303 6.2% 700 -11.7% 653 21.9% 26 141 6,516 4.1%2nd Qtr. 8,076 5.8% 793 -2.2% 6,407 3.5% 812 -2.3% 680 9.5% 9 63 6,610 2.8%3rd Qtr. 8,254 5.2% 816 -1.1% 6,736 4.1% 814 8.4% 746 12.9% 9 -107 6,705 3.2%4th Qtr. 8,145 2.9% 828 -1.1% 6,742 1.8% 668 4.7% 781 5.5% 26 11 6,665 2.8%Year 32,189 5.3% 814 -1.4% 26,187 3.8% 2,993 -0.6% 2,859 11.8% 68 -108 26,281 1.8%
20181st Qtr. 7,878 2.1% 821 0.5% 6,466 2.6% 721 3.1% 731 12.0% 26 32 6,515 0.0%2nd Qtr. 8,426 4.3% 798 0.6% 6,726 5.0% 805 -0.9% 801 17.8% 9 22 6,761 2.3%3rd Qtr. 8,361 1.3% 816 -0.1% 6,819 1.2% 807 -0.8% 828 11.0% 9 -85 6,722 0.3%4th Qtr. 8,341 2.4% 823 -0.6% 6,862 1.8% 664 -0.5% 800 2.5% 26 -110 6,641 -0.4%Year 33,005 2.5% 814 0.1% 26,872 2.6% 2,998 0.2% 3,161 10.5% 70 141 26,921 2.4%
20191st Qtr. 7,935 0.7% 808 -1.5% 6,414 -0.8% 738 2.4% 696 -4.8% 27 58 6,541 0.4%2nd Qtr. 8,576 1.8% 795 -0.4% 6,817 1.4% 836 3.9% 790 -1.4% 9 64 6,936 2.6%3rd Qtr. 8,542 2.2% 810 -0.6% 6,923 1.5% 771 -4.5% 788 -4.8% 9 -85 6,830 1.6%4th Qtr. 8,503 2.0% 823 0.1% 7,001 2.0% 711 7.1% 748 -6.5% 27 -17 6,974 5.0%Year 33,555 1.7% 809 -0.6% 27,155 1.1% 3,057 2.0% 3,022 -4.4% 71 -20 27,241 1.2%
20201st Qtr. 8,399 5.9% 825 2.1% 6,929 8.0% 774 4.8% 769 10.5% 27 -28 6,932 6.0%2nd Qtr. 7,393 -13.8% 819 3.0% 6,054 -11.2% 848 1.4% 607 -23.2% 9 99 6,404 -7.7%
* 3rd Qtr. 8,670 1.5% 827 2.0% 7,170 3.6% 820 6.4% 765 -2.9% 9 -104 7,130 4.4%* 4th Qtr. 8,554 0.6% 831 0.9% 7,108 1.5% 745 4.7% 800 6.9% 27 -50 7,030 0.8%* Year 33,016 -1.6% 825 2.0% 27,261 0.4% 3,187 4.2% 2,941 -2.7% 71 83 27,661 1.5%
2021* 1st Qtr. 8,144 -3.0% 829 0.5% 6,751 -2.6% 795 2.7% 755 -1.9% 27 125 6,943 0.2%* 2nd Qtr. 7,984 8.0% 811 -1.0% 6,475 7.0% 860 1.4% 795 31.0% 9 50 6,599 3.1%* 3rd Qtr. 8,262 -4.7% 822 -0.6% 6,792 -5.3% 815 -0.6% 800 4.6% 9 -65 6,751 -5.3%* 4th Qtr. 8,176 -4.4% 835 0.5% 6,827 -4.0% 750 0.7% 825 3.1% 27 15 6,794 -3.4%* Year 32,566 -1.4% 824 -0.1% 26,845 -1.5% 3,220 1.0% 3,175 7.9% 71 -125 26,836 -3.0%
2022* 1st Qtr. 8,025 -1.5% 832 0.4% 6,677 -1.1% 780 -1.9% 750 -0.7% 27 35 6,768 -2.5%* 2nd Qtr. 7,777 -2.6% 814 0.4% 6,330 -2.2% 820 -4.7% 800 0.6% 9 40 6,399 -3.0%* 3rd Qtr. 8,072 -2.3% 826 0.5% 6,668 -1.8% 790 -3.1% 790 -1.3% 9 10 6,687 -0.9%* 4th Qtr. 8,029 -1.8% 839 0.5% 6,736 -1.3% 695 -7.3% 820 -0.6% 27 15 6,653 -2.1%* Year 31,903 -2.0% 828 0.4% 26,411 -1.6% 3,085 -4.2% 3,160 -0.5% 71 -100 26,307 -2.0%
* Estimates
2021 Meat Market Outlook Presented by: Steiner Consulting Group | (800) 526-4612
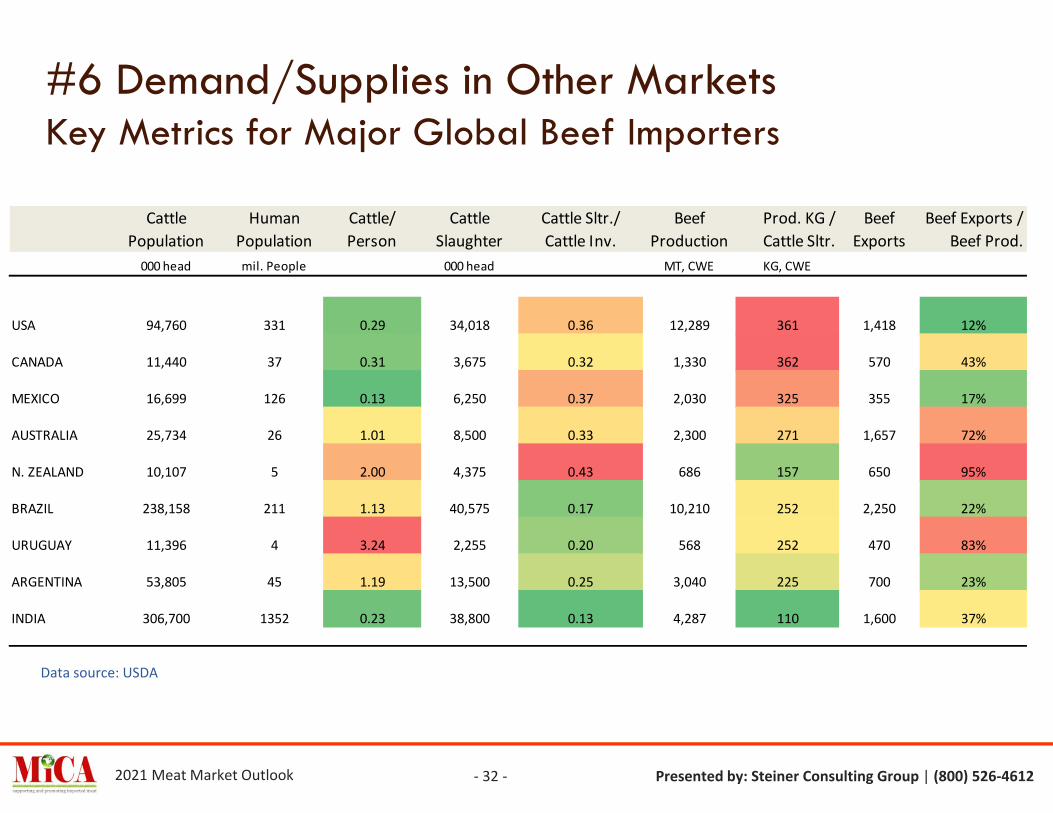
#6 Demand/Supplies in Other MarketsKey Metrics for Major Global Beef Importers
Cattle Population
Human Population
Cattle/ Person
Cattle Slaughter
Cattle Sltr./ Cattle Inv.
Beef Production
Prod. KG / Cattle Sltr.
Beef Exports
Beef Exports / Beef Prod.
000 head mil. People 000 head MT, CWE KG, CWE
USA 94,760 331 0.29 34,018 0.36 12,289 361 1,418 12%
CANADA 11,440 37 0.31 3,675 0.32 1,330 362 570 43%
MEXICO 16,699 126 0.13 6,250 0.37 2,030 325 355 17%
AUSTRALIA 25,734 26 1.01 8,500 0.33 2,300 271 1,657 72%
N. ZEALAND 10,107 5 2.00 4,375 0.43 686 157 650 95%
BRAZIL 238,158 211 1.13 40,575 0.17 10,210 252 2,250 22%
URUGUAY 11,396 4 3.24 2,255 0.20 568 252 470 83%
ARGENTINA 53,805 45 1.19 13,500 0.25 3,040 225 700 23%
INDIA 306,700 1352 0.23 38,800 0.13 4,287 110 1,600 37%
Data source: USDA
- 32 -

2021 Meat Market Outlook Presented by: Steiner Consulting Group | (800) 526-4612
#6 Demand/Supplies in Other MarketsJanuary Inventory trends in Australia, New Zealand, Uruguay & Brazil
- 33 -
10,183
10,368
10,033
10,152 10,14610,107
10,15110,116
10,140
9,600
9,700
9,800
9,900
10,000
10,100
10,200
10,300
10,400
10,500
2010 2011 2012 2013 2014 2015 2016 2017 2018 2019 2020F 2021F 2022F
NEW ZEALAND CATTLE INVENTORIES: JANUARY 1 STOCKSSource: USDA Foreign Agricultural Service. Analysis by Steiner Consulting000 head
-3.2%
0.4%-0.3%
1.2% -0.1%-0.4%
0.2%
29,291 29,102
27,413
24,971
26,17625,734
23,69023,165 22,965
20,000
21,000
22,000
23,000
24,000
25,000
26,000
27,000
28,000
29,000
30,000
2010 2011 2012 2013 2014 2015 2016 2017 2018 2019 2020F 2021F 2022F
AUSTRALIA CATTLE INVENTORIES: JANUARY 1 STOCKSSource: USDA Foreign Agricultural Service. Analysis by Steiner Consulting000 head
-5.8%
-8.9%
4.8%-1.7%
-7.9%
-2.2% -0.9%
11,903
12,053 12,016
11,864
11,744
11,39611,477
12,15712,257
10,600
10,800
11,000
11,200
11,400
11,600
11,800
12,000
12,200
12,400
2010 2011 2012 2013 2014 2015 2016 2017 2018 2019 2020F 2021F 2022F
URUGUAY CATTLE INVENTORIES: JANUARY 1 STOCKSSource: USDA Foreign Agricultural Service. Analysis by Steiner Consulting000 head
-0.3%
-1.3%
-1.0%
-3.0%0.7%
5.9%
0.8%
219,180226,045
232,350238,158
244,144
252,289
260,419
150,000
170,000
190,000
210,000
230,000
250,000
270,000
2010 2011 2012 2013 2014 2015 2016 2017 2018 2019 2020F 2021F 2022F
BRAZIL CATTLE INVENTORIES: JANUARY 1 STOCKSSource: USDA Foreign Agricultural Service. Analysis by Steiner Consulting000 head
3.1%2.8%
2.5%
2.5%
3.2%
3.1%
2.9%
53,118
54,16354,793 55,008
54,46154,000 54,000
45,000
46,000
47,000
48,000
49,000
50,000
51,000
52,000
53,000
54,000
55,000
56,000
2010 2011 2012 2013 2014 2015 2016 2017 2018 2019 2020F 2021F 2022F
ARGENTINA CATTLE INVENTORIES: JANUARY 1 STOCKSSource: USDA Foreign Agricultural Service. Analysis by Steiner Consulting000 head
1.8%
2.0%
0.4%-1.0%
1.2%
-0.8% 0.0%
16,615 16,490 16,584 16,699 16,900 17,050 17,190
14,000
15,000
16,000
17,000
18,000
19,000
20,000
21,000
22,000
23,000
2010 2011 2012 2013 2014 2015 2016 2017 2018 2019 2020F 2021F 2022F
MEXICO CATTLE INVENTORIES: JANUARY 1 STOCKSSource: USDA Foreign Agricultural Service. Analysis by Steiner Consulting000 head
-2.9% 0.6% 0.7%1.2% 0.9%
-0.8%
0.8%

2021 Meat Market Outlook Presented by: Steiner Consulting Group | (800) 526-4612
#6 Demand/Supplies in Other MarketsChina not a factor in Australian market this year.
- 34 -
Key Markets for Australian Beef: 2012 - 2020Metric Ton. Shipped Weight Basis
0
5,000
10,000
15,000
20,000
25,000
30,000
35,000
40,000
45,000
50,000
Jan
Mar
May Ju
lSe
pNo
vJa
nM
arM
ay Jul
Sep
Nov
Jan
Mar
May Ju
lSe
pNo
vJa
nM
arM
ay Jul
Sep
Nov
Jan
Mar
May Ju
lSe
pNo
vJa
nM
arM
ay Jul
Sep
Nov
Jan
Mar
May Ju
lSe
pNo
vJa
nM
arM
ay Jul
Sep
Nov
Jan
Mar
May Ju
lSe
pNo
v
2012 2013 2014 2015 2016 2017 2018 2019 2020
China
USA
ROW
Japan
S. Korea

2021 Meat Market Outlook Presented by: Steiner Consulting Group | (800) 526-4612
#6 Demand/Supplies in Other MarketsNZ exports to China have declined…for now
- 35 -
Share of New Zealand Beef Exports to USA and China Share of New Zealand Beef Exports During Jan-Aug2020Data Source: Stats NZ. Analysis by Steiner Consulting
0%
10%
20%
30%
40%
50%
60%
70%
2007 2008 2009 2010 2011 2012 2013 2014 2015 2016 2017 2018 2019 2020
USA39%
China33%
Japan5%
S. Korea4%
Canada4%
ROW15%
339,733 metric ton s.w.
China
USA

2021 Meat Market Outlook Presented by: Steiner Consulting Group | (800) 526-4612
#7 China Protein Demand OutlookHog Supplies Slowly Recovering in China but Still Below Pre-ASF Levels
- 36 -
China Sow Inventory M/M % ChangeSource: Ministry of Agriculture of China
-9.1%
-2.8%
0.6%
4.0%
2.2%2.8%
5.0%4.3%
3.5%
-10.00%
-8.00%
-6.00%
-4.00%
-2.00%
0.00%
2.00%
4.00%
6.00%
2017 2018 2019 2020
China Live Hog Inventory M/M % ChangeSource: Ministry of Agriculture of China
-9.4%-9.8%
-3.0%
2.0%2.8%
4.5% 4.8% 4.7%
-12.00%
-10.00%
-8.00%
-6.00%
-4.00%
-2.00%
0.00%
2.00%
4.00%
6.00%
2017 2018 2019 2020
Sow Inventories:Jul 2018 (pre-ASF): 40.7MSep 2019: 24.6M (-40%)Jan 2020: 26.6MAug 2020: 34.1M (+39% vs. Jan) but
(-16% vs. pre-ASF)
Hog Inventories:Jul 2018 (pre-ASF): 418MSep 2019: 264M (-37%)Jan 2020: 283MAug 2020: 375M (+33% vs. Jan) but
(-10% vs. pre-ASF)

2021 Meat Market Outlook Presented by: Steiner Consulting Group | (800) 526-4612
#7 China Protein Demand OutlookChina Prices Skyrocket
- 37 -
Piglet: +174% Hog: +136% Retail Pork: +112%
Y/Y Price Changeas of Oct 23, 2019
China Price of Baby Pigs, Live Hogs and Retail Pork, Yuan per KG.Source: China Ministry of Agriculture. Analysis by: Steiner Consulting
5.0010.0015.0020.0025.0030.0035.0040.0045.0050.0055.0060.0065.0070.0075.0080.0085.0090.0095.00
100.00105.00110.00115.00
Piglet PriceLive Hog PricePork Price

2021 Meat Market Outlook Presented by: Steiner Consulting Group | (800) 526-4612
#7 China Protein Demand OutlookChina Beef Imports, Metric Ton, Carcass wt. basis
- 38 -
China this year accounts for:
- +75% of Argentina exports- +55% of Uruguay exports- +60% of Brazil exports (incl.
HK)- +45% of New Zealand
exports- +20% of Australia exports
China Annual Beef Imports: 2000 - 2020Source: USDA-FAS, Actual + Estimates
1,369
2,177
2,600
0
500
1,000
1,500
2,000
2,500
3,000 '000 MT

2021 Meat Market Outlook Presented by: Steiner Consulting Group | (800) 526-4612
#7 China Protein Demand OutlookChina Pork Imports, ‘000 Metric Ton, Carcass wt. basis
- 39 -
China Annual Pork Imports: 2000 - 2020Source: USDA-FAS, Actual + Estimates
1,457
2,451
4,400
0
500
1,000
1,500
2,000
2,500
3,000
3,500
4,000
4,500
5,000 '000 MT

2021 Meat Market Outlook Presented by: Steiner Consulting Group | (800) 526-4612
#7 China Protein Demand OutlookChina Chicken Imports, ‘000 Metric Ton, Carcass wt. basis
- 40 -
China Annual Chicken Imports: 2000 - 2020Source: USDA-FAS, Actual + Estimates
342
580
925
0
100
200
300
400
500
600
700
800
900
1,000 '000 MT

2021 Meat Market Outlook Presented by: Steiner Consulting Group | (800) 526-4612
#8 Demand in US Domestic MarketStrong equity and housing markets suggest continued strong consumer food demand
All-Transactions House Price IndexIndex 1980: Q1 = 100. Quarterly. Not Seasonally Adjusted
270
290
310
330
350
370
390
410
430
450
470
2008 2009 2010 2011 2012 2013 2014 2015 2016 2017 2018 2019 2020
- 41 -
S&P 500 IndexData updated through: October 2,2020
0
500
1,000
1,500
2,000
2,500
3,000
3,500
4,000
2008 2009 2010 2011 2012 2013 2014 2015 2016 2017 2018 2019 2020

2021 Meat Market Outlook Presented by: Steiner Consulting Group | (800) 526-4612
#8 Demand in US Domestic MarketHow quickly will job market recover?
Current 7.9% (Sep 2020)
Dec 2020: 8.1%Jun 2021: 7.1%Dec 2021: 6.3%Jun 2022: 5.7%Dec 2022: 5.2%
42
USA Unemployment Rate: % of Labor ForceSource: Bureau of Labor Statistics. Forecasts are Median of Economist Survey from WSJ
Sept 2020= 7.908.1
7.1
6.35.7
5.2
0.00
2.00
4.00
6.00
8.00
10.00
12.00
14.00
16.00

2021 Meat Market Outlook Presented by: Steiner Consulting Group | (800) 526-4612
#8 Demand in US Domestic MarketLower participation rate is part of the reason for the recent decline in unemployment rate
43
66.8
63.6
60.0
61.4
57.0
59.0
61.0
63.0
65.0
67.0
69.0
% o
f 16
and
over
look
ing f
or w
ork
USA Civilian Participation Rate in Labor ForcePercent, Monthly, Seasonally Adjusted. Latest update: December 2018
The labor force participation rate is the percentage of the civilian non-institutional population 16 years and older that is working or actively looking for work.

2021 Meat Market Outlook Presented by: Steiner Consulting Group | (800) 526-4612
#8 Demand in US Domestic MarketDemand Drivers: Income
- 44 -
46,925
30,000
35,000
40,000
45,000
50,000
55,000
2000 '01 '02 '03 '04 2005 '06 '07 '08 '09 2010 '11 '12 '13 '14 2015 '16 '17 '18 '19 '20
Real Per Capita Disposable Income, US$Latest data is for: August 2020
recession

2021 Meat Market Outlook Presented by: Steiner Consulting Group | (800) 526-4612
#8 Demand in US Domestic MarketUSA Per Capita Meat Protein Consumption
- 45 -
276.5
200
210
220
230
240
250
260
270
280
290
1971
1973
1975
1977
1979
1981
1983
1985
1987
1989
1991
1993
1995
1997
1999
2001
2003
2005
2007
2009
2011
2013
2015
2017
2019
POUN
DS
PER
PERS
ON
PER
YEA
R
TOTAL BEEF, PORK, POULTRY PER CAPITA DISAPPERANCE(Carcass Wt. Basis)
Record: Year 2004276.7 lbs.
2020
2021
Forecast
276.6273.0

2021 Meat Market Outlook Presented by: Steiner Consulting Group | (800) 526-4612
#8 Demand in US Domestic MarketUSA Per Capita Beef Consumption
- 46 -
60
70
80
90
100
110
120
130
1971
1973
1975
1977
1979
1981
1983
1985
1987
1989
1991
1993
1995
1997
1999
2001
2003
2005
2007
2009
2011
2013
2015
2017
2019
POU
NDS
PER
PER
SON
PER
YEA
R
BEEF PER CAPITA DISAPPERANCE (Carcass wt. Basis)
2020
2021
Forecast
83.780.7
2021 Meat Market Outlook Presented by: Steiner Consulting Group | (800) 526-4612
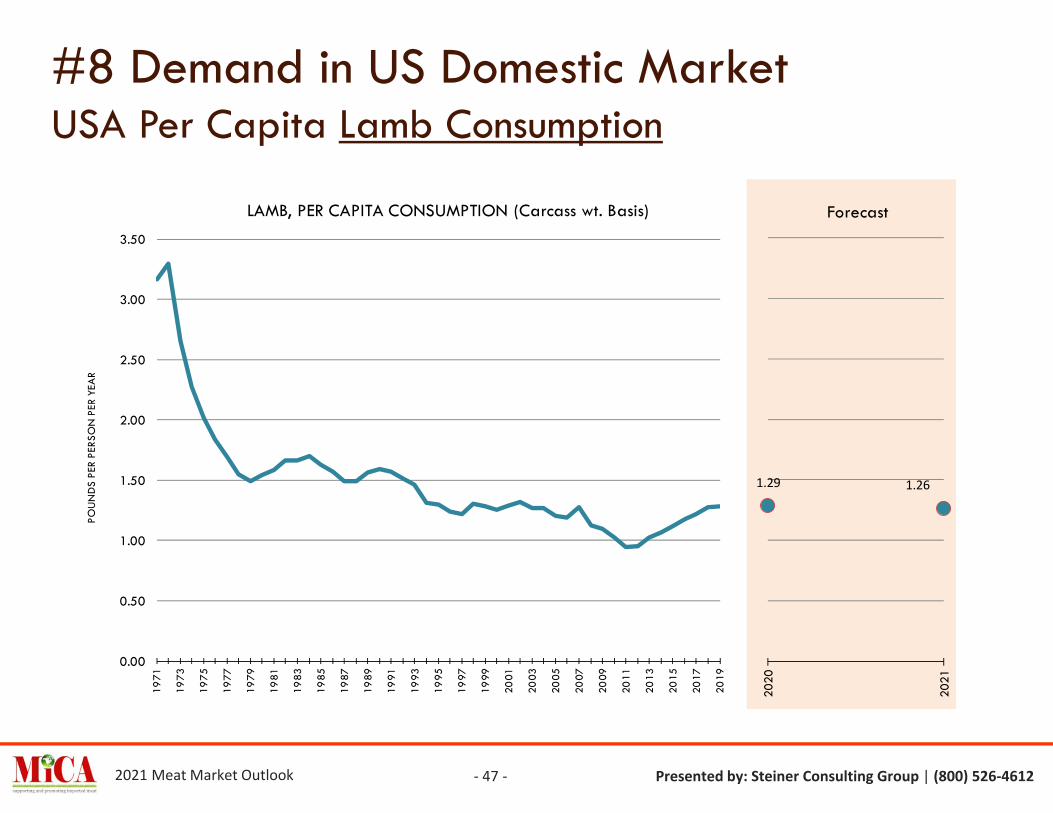
#8 Demand in US Domestic MarketUSA Per Capita Lamb Consumption
- 47 -
0.00
0.50
1.00
1.50
2.00
2.50
3.00
3.50
1971
1973
1975
1977
1979
1981
1983
1985
1987
1989
1991
1993
1995
1997
1999
2001
2003
2005
2007
2009
2011
2013
2015
2017
2019
POU
ND
S PE
R PE
RSO
N P
ER Y
EAR
LAMB, PER CAPITA CONSUMPTION (Carcass wt. Basis)
1.29 1.26
2020
2021
Forecast
2021 Meat Market Outlook Presented by: Steiner Consulting Group | (800) 526-4612
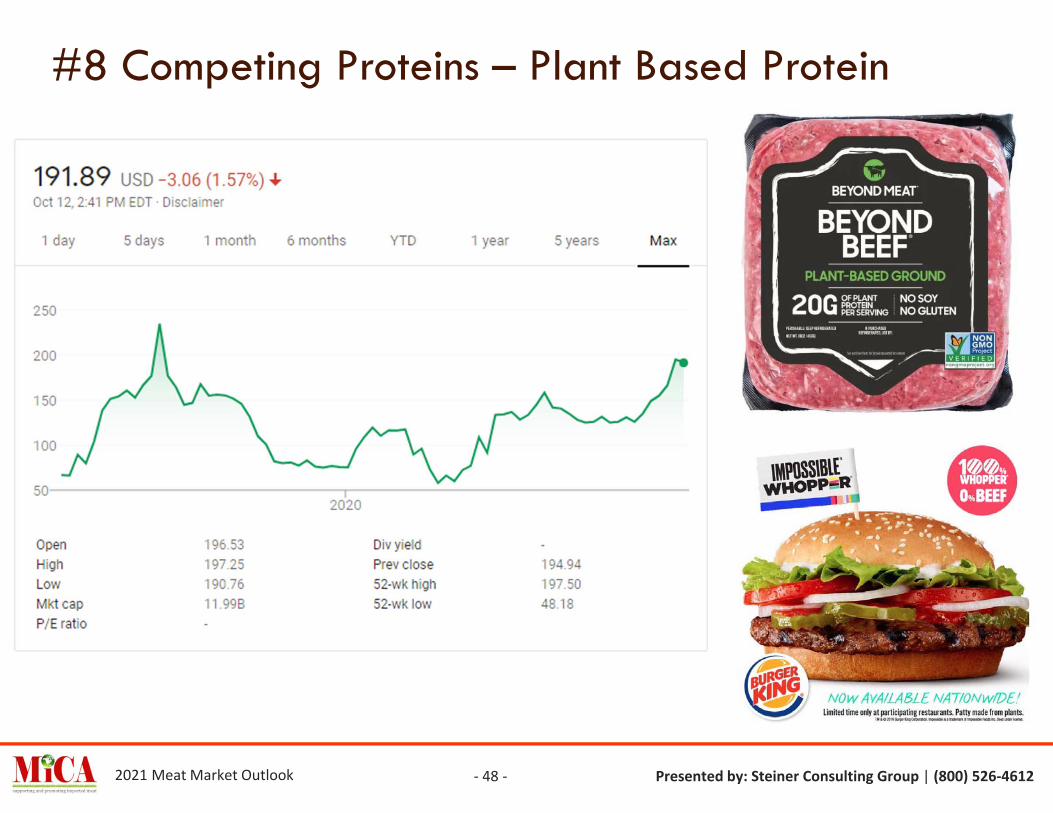
#8 Competing Proteins – Plant Based Protein
- 48 -

2021 Meat Market Outlook Presented by: Steiner Consulting Group | (800) 526-4612- 49 -
#8 Competing ProteinsPork Situation and Outlook
Supplies ( Y/Y % change)
Production: +2.6% in 2020
+0.4% in 2021
+0.3% in 2022
Exports: +18.1% in 2020
+2.0% in 2021
+2.0% in 2022
Per Capita: -2.7% in 2020
-1.0% in 2021
-1.2% in 2022
22,843
26,315
27,572
28,294 28,416 28,499
15,000
17,000
19,000
21,000
23,000
25,000
27,000
29,000
31,000
PORK PRODUCTION: MILLION POUNDS
2021 Meat Market Outlook Presented by: Steiner Consulting Group | (800) 526-4612- 50 -
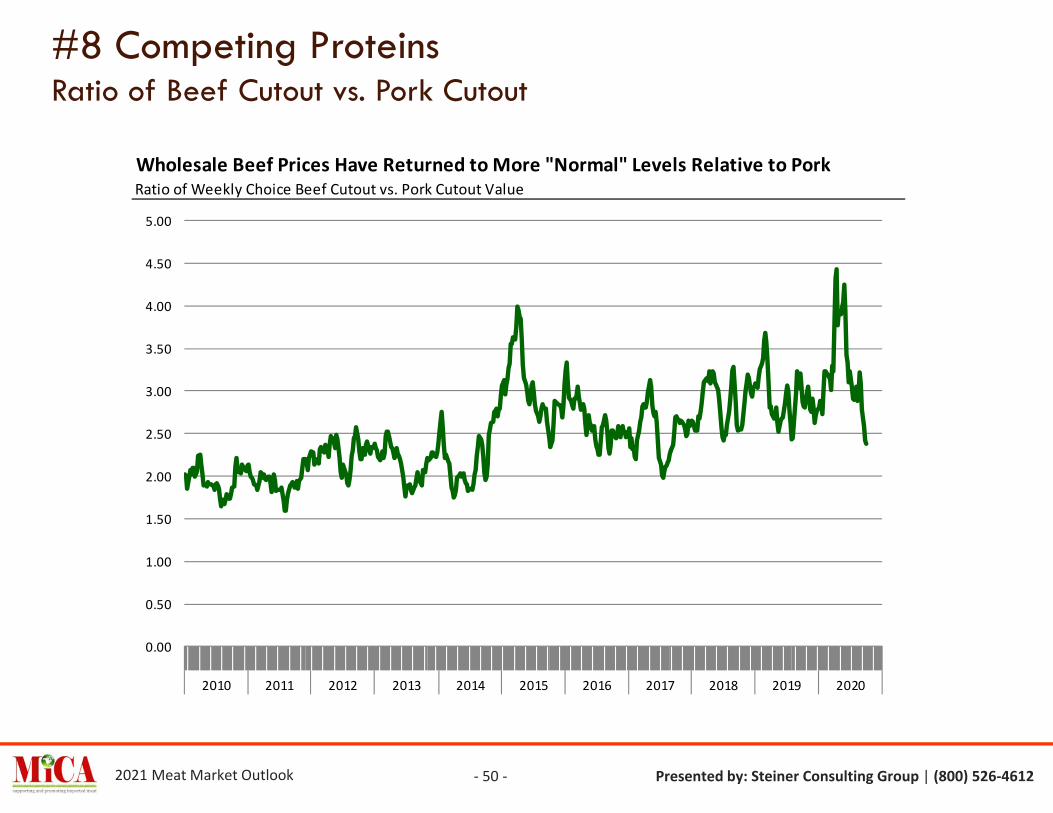
#8 Competing ProteinsRatio of Beef Cutout vs. Pork Cutout
Wholesale Beef Prices Have Returned to More "Normal" Levels Relative to PorkRatio of Weekly Choice Beef Cutout vs. Pork Cutout Value
0.00
0.50
1.00
1.50
2.00
2.50
3.00
3.50
4.00
4.50
5.00
2010 2011 2012 2013 2014 2015 2016 2017 2018 2019 2020
2021 Meat Market Outlook Presented by: Steiner Consulting Group | (800) 526-4612
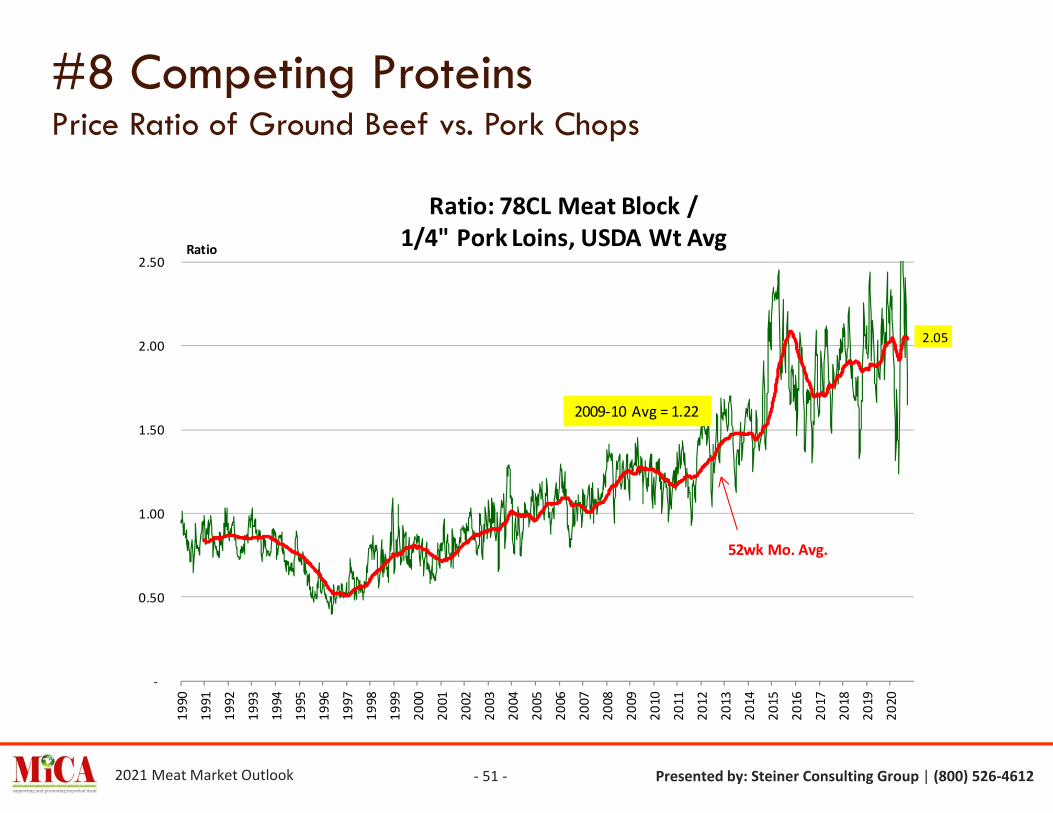
#8 Competing ProteinsPrice Ratio of Ground Beef vs. Pork Chops
- 51 -
2.05
-
0.50
1.00
1.50
2.00
2.50
1990
1991
1992
1993
1994
1995
1996
1997
1998
1999
2000
2001
2002
2003
2004
2005
2006
2007
2008
2009
2010
2011
2012
2013
2014
2015
2016
2017
2018
2019
2020
Ratio
Ratio: 78CL Meat Block /1/4" Pork Loins, USDA Wt Avg
52wk Mo. Avg.
2009-10 Avg = 1.22

2021 Meat Market Outlook Presented by: Steiner Consulting Group | (800) 526-4612
#8 Competing ProteinsLong Run Price of B/S Chicken Breasts
- 52 -
60
110
160
210
260
310
1990 1991 1992 1993 1994 1995 1996 1997 1998 1999 2000 2001 2002 2003 2004 2005 2006 2007 2008 2009 2010 2011 2012 2013 2014 2015 2016 2017 2018 2019 2020
LONG TERM PRICE CHART: 1990 -2019$/cwt
Price History and Forecast for B/S Chicken Breast Price. USDA-AMS. $/cwt

2021 Meat Market Outlook Presented by: Steiner Consulting Group | (800) 526-4612
#8 Competing ProteinsBroiler Situation and Outlook
38,154
42,147
43,45344,29144,601
45,443
30,000
32,000
34,000
36,000
38,000
40,000
42,000
44,000
46,000
48,000
MILL
ION
PO
UN
DS
BROILER PRODUCTION: MILLION POUNDS
- 53 -
Forecast Source: Steiner Consulting Group
Supplies ( Y/Y % change)
Production: +1.9% in 2020
+0.7% in 2021
+1.9% in 2022
Exports: +4.4% in 2020
+6.0% in 2021
+4.6% in 2022
Per Capita: +1.1% in 2020
-0.9% in 2021
+0.4% in 2022

2021 Meat Market Outlook Presented by: Steiner Consulting Group | (800) 526-4612
#8 Competing ProteinsGround Beef vs. Chicken Breasts
- 54 -
Forecast Source: Steiner Consulting Group78CL Meat Block = 70% 90CL Boneless Beef, Central, Fresh, USDA, Wt. Avg. + 30% 50CL Beef Trim, Fresh, National, USDA, Wt. Avg.Chicken Breast = USDA N.E. Broiler Breast Boneless, Skinless, Wt. Avg.
1.86
-
0.50
1.00
1.50
2.00
2.5019
9019
9119
9219
9319
9419
9519
9619
9719
9819
9920
0020
0120
0220
0320
0420
0520
0620
0720
0820
0920
1020
1120
1220
1320
1420
1520
1620
1720
1820
1920
20
Ratio
Ratio: 78CL Meat Block (Using Dom 90LC and 50CL) /Bnls Skinless Chicken Breast
52wk Mo. Avg.

2021 Meat Market Outlook Presented by: Steiner Consulting Group | (800) 526-4612
#8 Competing ProteinsBroiler Supplies
- 55 -
60,821
50,000
52,000
54,000
56,000
58,000
60,000
62,000
64,000
Jan Feb Mar Apr May Jun Jul Aug Sep Oct Nov Dec
LAYERS ON 1ST OF MONTH: BROILER TYPE HATCHING'000
2018
2019
2017
5-Yr. Avg.
Source: USDA/NASS Chicken and Eggs Monthly Report
2020
US WEEKLY BROILER EGG SETS Source: USDA Broiler Hatchery Report
185,000
195,000
205,000
215,000
225,000
235,000
245,000
Jan Feb Mar Apr May Jun Jul Aug Sep Oct Nov Dec
5 Yr. Avg (2012-16) 2019 2020
1000 eggs
2021 Meat Market Outlook Presented by: Steiner Consulting Group | (800) 526-4612
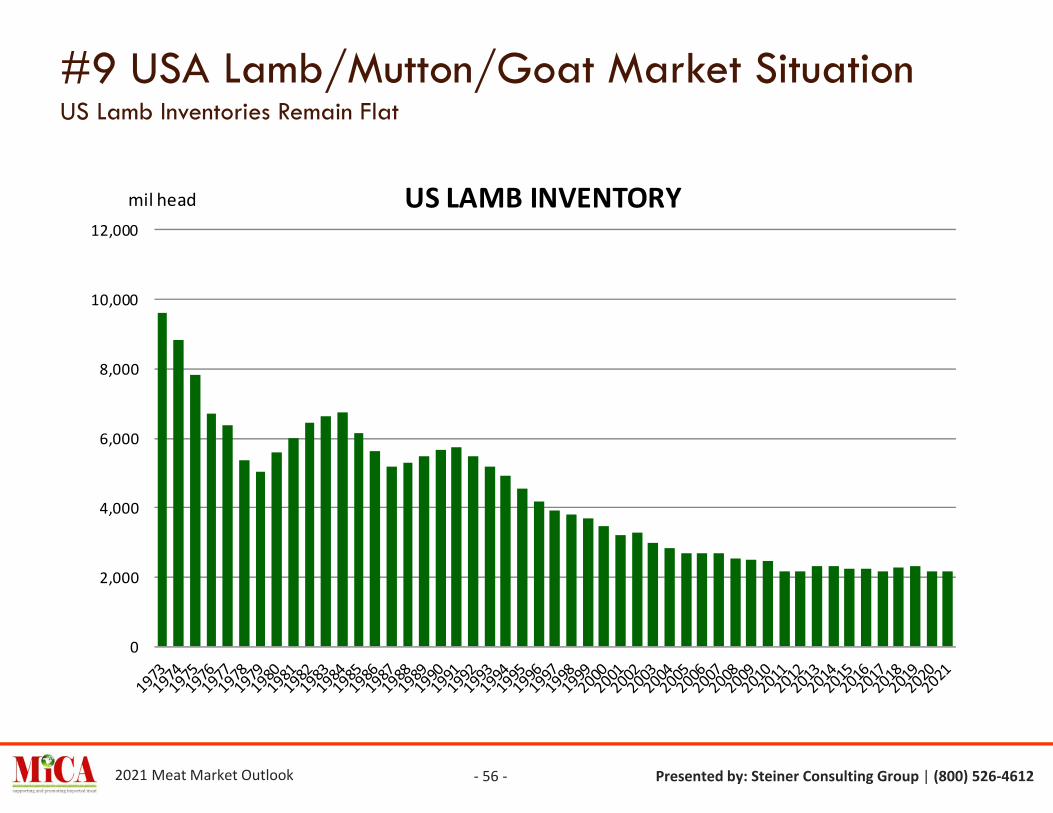
#9 USA Lamb/Mutton/Goat Market SituationUS Lamb Inventories Remain Flat
- 56 -
0
2,000
4,000
6,000
8,000
10,000
12,000
US LAMB INVENTORYmil head

2021 Meat Market Outlook Presented by: Steiner Consulting Group | (800) 526-4612- 57 -
#9 USA Lamb/Mutton/Goat Market SituationDomestic Lamb Prices Above Year Ago This Fall
Slaughter Lamb Price, Sioux Falls, SD BasisMonthly Average Prices, 100-150 lb. Wooled and Shorn, Choice & Prime 2-3 . $ per 100 lb.
100
110
120
130
140
150
160
170
180
Jan Feb Mar Apr May Jun Jul Aug Sep Oct Nov Dec
5-Yr. Avg. 2019 2020

2021 Meat Market Outlook Presented by: Steiner Consulting Group | (800) 526-4612
#9 USA Lamb/Mutton/Goat Market SituationImported Racks Now Below 2017 Price Levels
- 58 -
Australian Lamb Racks, Fresh, Cap-off, 28 oz/up. 4-WK Moving Avg.Weekly Prices. Source: USDA
700
800
900
1,000
1,100
1,200
1,300
Jan Feb Mar Apr May Jun Jul Aug Sep Oct Nov Dec
2017 2018 2019 2020

2021 Meat Market Outlook Presented by: Steiner Consulting Group | (800) 526-4612
#9 USA Lamb/Mutton/Goat Market SituationLamb Imports Share Continues to Expand. 2020 Share @63.3%
- 59 -
0
50
100
150
200
250
300
350
400
450
500
Domestic Lamb Production + Importsmil lb.
US domestic production
Imports
2021 Meat Market Outlook Presented by: Steiner Consulting Group | (800) 526-4612
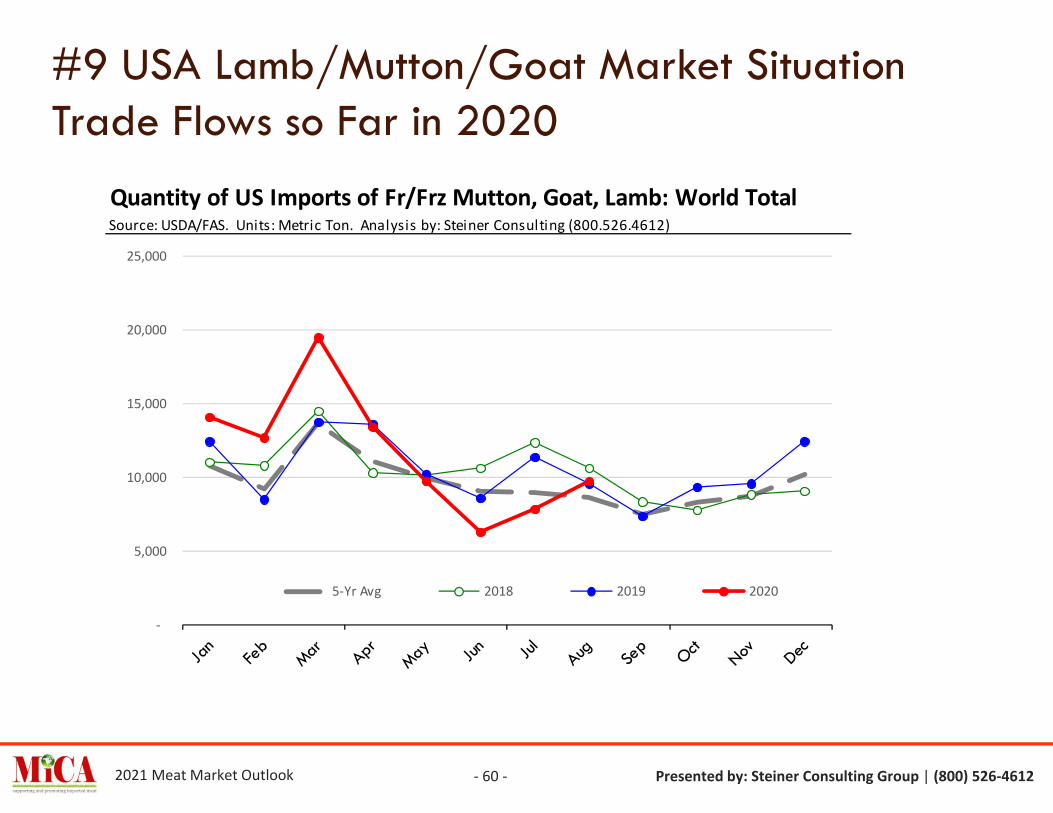
#9 USA Lamb/Mutton/Goat Market SituationTrade Flows so Far in 2020
- 60 -
Quantity of US Imports of Fr/Frz Mutton, Goat, Lamb: World TotalSource: USDA/FAS. Units: Metric Ton. Analysis by: Steiner Consulting (800.526.4612)
-
5,000
10,000
15,000
20,000
25,000
5-Yr Avg 2018 2019 2020

2021 Meat Market Outlook Presented by: Steiner Consulting Group | (800) 526-4612- 61 -
CURRENT FORECAST

2021 Meat Market Outlook Presented by: Steiner Consulting Group | (800) 526-4612
Price Forecasts: 2020 and 2021
- 62 -
Close on Oct 9, 2020 Q1 Q2 Q3 Q4 Annual
LIVE STEERS
FIVE AREA DIRECT AVERAGE LIVE STEER5-YR AVERAGE 2015-19 133.84 131.05 118.01 115.49 124.602019 HISTORY 125.33 119.99 108.26 114.23 116.952020 HISTORY 107.42 118.62 107.62 101.102020 FORECAST 111.33 109.67% CHANGE FROM 2017 -5.4% -10.3% -6.6% -2.5% -6.2%% CHANGE FROM 5-Yr Avg. -11.4% -17.9% -14.3% -3.6% -12.0%2021 FORECAST 115.33 115.33 109.67 114.00 113.58% CHANGE FROM 2018 -2.8% 7.2% 8.5% 2.4% 3.6%% CHANGE FROM 5-Yr Avg. -13.8% -12.0% -7.1% -1.3% -8.8%
90% BONELESS BEEF, CENTRAL, FRESH, WT. AVG., USDA5-YR AVERAGE 2015-19 227.97 235.55 231.08 208.91 225.882019 HISTORY 209.65 221.77 223.06 232.99 221.872020 HISTORY 198.55 233.76 269.65 227.962020 FORECAST 206.67 234.51% CHANGE FROM 2019 11.5% 21.6% 2.2% -11.3% 5.7%% CHANGE FROM 5-Yr Avg. 2.5% 14.5% -1.3% -1.1% 3.8%2021 FORECAST 223.33 233.33 226.33 220.00 225.75% CHANGE FROM 2020 -4.5% -13.5% -0.7% 6.5% -3.7%% CHANGE FROM 5-Yr Avg. -2.0% -0.9% -2.1% 5.3% -0.1%

2021 Meat Market Outlook Presented by: Steiner Consulting Group | (800) 526-4612
Price Forecasts: 2020 and 2021Close on Oct 9, 2020 Q1 Q2 Q3 Q4 Annual
50CL BEEF TRIM, FRESH, OMAHA BASIS, WT.AVE, USDA5-YR AVERAGE 2015-19 80.04 94.94 68.29 54.24 74.382019 HISTORY 68.14 88.29 82.53 66.27 76.312020 HISTORY 50.09 59.36 115.26 49.212020 FORECAST 53.00 69.21% CHANGE FROM 2019 -12.9% 30.5% -40.4% -20.0% -9.3%% CHANGE FROM 5-Yr Avg. -25.8% 21.4% -27.9% -2.3% -7.0%2021 FORECAST 75.33 91.00 69.67 59.00 73.75% CHANGE FROM 2020 26.9% -21.0% 41.6% 11.3% 6.6%% CHANGE FROM 5-Yr Avg. -5.9% -4.2% 2.0% 8.8% -0.8%
7:45, E. COAST 90CL AUSTRALIAN BLENDED COW, TOP, YELLOW SHEET5-YR AVERAGE 2015-19 217.84 221.14 221.10 216.78 219.222019 HISTORY 213.02 226.93 228.89 268.65 234.372020 HISTORY 220.00 229.93 238.28 228.902020 FORECAST 226.33 230.86% CHANGE FROM 2019 7.9% 5.0% 0.0% -15.8% -1.5%% CHANGE FROM 5-Yr Avg. 5.6% 7.8% 3.5% 4.4% 5.3%2021 FORECAST 233.67 232.67 233.00 233.00 233.08% CHANGE FROM 2020 1.6% -2.4% 1.8% 2.9% 1.0%% CHANGE FROM 5-Yr Avg. 7.3% 5.2% 5.4% 7.5% 6.3%
- 63 -
2021 Meat Market Outlook Presented by: Steiner Consulting Group | (800) 526-4612
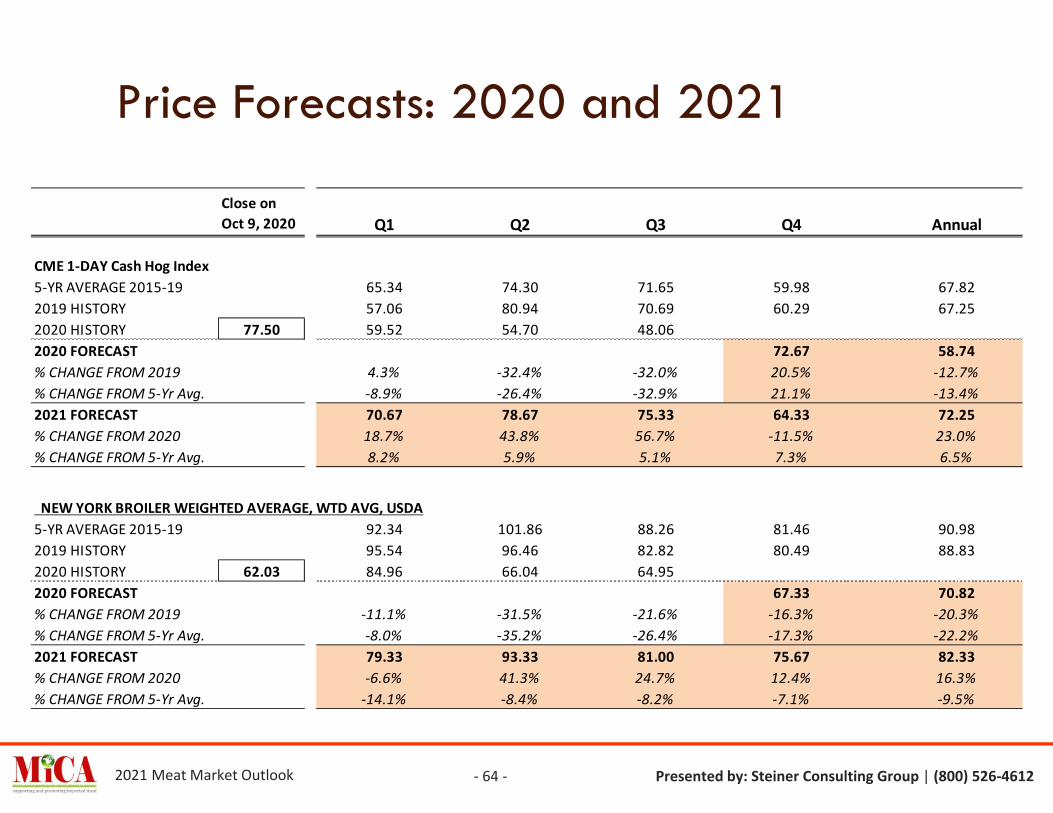
Price Forecasts: 2020 and 2021
- 64 -
Close on Oct 9, 2020 Q1 Q2 Q3 Q4 Annual
CME 1-DAY Cash Hog Index5-YR AVERAGE 2015-19 65.34 74.30 71.65 59.98 67.822019 HISTORY 57.06 80.94 70.69 60.29 67.252020 HISTORY 77.50 59.52 54.70 48.062020 FORECAST 72.67 58.74% CHANGE FROM 2019 4.3% -32.4% -32.0% 20.5% -12.7%% CHANGE FROM 5-Yr Avg. -8.9% -26.4% -32.9% 21.1% -13.4%2021 FORECAST 70.67 78.67 75.33 64.33 72.25% CHANGE FROM 2020 18.7% 43.8% 56.7% -11.5% 23.0%% CHANGE FROM 5-Yr Avg. 8.2% 5.9% 5.1% 7.3% 6.5%
NEW YORK BROILER WEIGHTED AVERAGE, WTD AVG, USDA5-YR AVERAGE 2015-19 92.34 101.86 88.26 81.46 90.982019 HISTORY 95.54 96.46 82.82 80.49 88.832020 HISTORY 62.03 84.96 66.04 64.952020 FORECAST 67.33 70.82% CHANGE FROM 2019 -11.1% -31.5% -21.6% -16.3% -20.3%% CHANGE FROM 5-Yr Avg. -8.0% -35.2% -26.4% -17.3% -22.2%2021 FORECAST 79.33 93.33 81.00 75.67 82.33% CHANGE FROM 2020 -6.6% 41.3% 24.7% 12.4% 16.3%% CHANGE FROM 5-Yr Avg. -14.1% -8.4% -8.2% -7.1% -9.5%

2021 Meat Market Outlook Presented by: Steiner Consulting Group | (800) 526-4612
Price Forecasts: 2020 and 2021
- 65 -
Close on Oct 9, 2020 Q1 Q2 Q3 Q4 Annual
USDA, Carcass Pork Cutout, FOB Plant5-YR AVERAGE 2015-19 75.40 81.12 81.96 76.78 78.812019 HISTORY 67.98 83.30 77.34 79.68 77.082020 HISTORY 94.58 70.63 80.01 74.942020 FORECAST 92.33 79.48% CHANGE FROM 5-Yr Avg. 3.9% -3.9% -3.1% 15.9% 3.1%2021 FORECAST -6.3% -1.4% -8.6% 20.3% 0.8%% CHANGE FROM 2020 84.00 88.67 89.00 84.00 86.42% CHANGE FROM 5-Yr Avg. 18.9% 10.8% 18.8% -9.0% 8.7%2022 FORECAST 11.4% 9.3% 8.6% 9.4% 9.6%
CME 1-DAY Cash Hog Index5-YR AVERAGE 2015-19 65.34 74.30 71.65 59.98 67.822019 HISTORY 57.06 80.94 70.69 60.29 67.252020 HISTORY 77.50 59.52 54.70 48.062020 FORECAST 72.67 58.74% CHANGE FROM 2017 4.3% -32.4% -32.0% 20.5% -12.7%% CHANGE FROM 5-Yr Avg. -8.9% -26.4% -32.9% 21.1% -13.4%2021 FORECAST 70.67 78.67 75.33 64.33 72.25% CHANGE FROM 2018 18.7% 43.8% 56.7% -11.5% 23.0%% CHANGE FROM 5-Yr Avg. 8.2% 5.9% 5.1% 7.3% 6.5%

2021 Meat Market Outlook Presented by: Steiner Consulting Group | (800) 526-4612
Price Forecasts: 2020 and 2021
- 66 -
Close on Oct 9, 2020 Q1 Q2 Q3 Q4 Annual
USDA HEN TURKEYS, EAST, FROZEN 8-16LBS, WTD. AVG.5-YR AVERAGE 2015-19 95.67 99.14 104.51 102.40 100.432019 HISTORY 83.23 86.12 91.52 97.25 89.532020 HISTORY 113.00 97.62 104.69 111.622020 FORECAST 115.67 107.40% CHANGE FROM 2019 17.3% 21.6% 22.0% 18.9% 20.0%% CHANGE FROM 5-Yr Avg. 2.0% 5.6% 6.8% 13.0% 6.9%2021 FORECAST 102.00 103.00 104.67 109.33 104.75% CHANGE FROM 2020 4.5% -1.6% -6.2% -5.5% -2.5%% CHANGE FROM 5-Yr Avg. 6.6% 3.9% 0.2% 6.8% 4.3%
USDA TOM TURKEYS, EAST, FROZEN 16-24LBS, WTD. AVG. 5-YR AVERAGE 2015-19 96.09 99.72 103.67 102.35 100.462019 HISTORY 82.63 84.55 90.49 97.69 88.842020 HISTORY 114.84 97.33 103.59 110.602020 FORECAST 115.33 106.71% CHANGE FROM 2019 17.8% 22.5% 22.2% 18.1% 20.1%% CHANGE FROM 5-Yr Avg. 1.3% 3.9% 6.7% 12.7% 6.2%2021 FORECAST 101.00 102.00 104.33 108.33 103.92% CHANGE FROM 2020 3.8% -1.5% -5.7% -6.1% -2.6%% CHANGE FROM 5-Yr Avg. 5.1% 2.3% 0.6% 5.8% 3.4%
2021 Meat Market Outlook Presented by: Steiner Consulting Group | (800) 526-4612
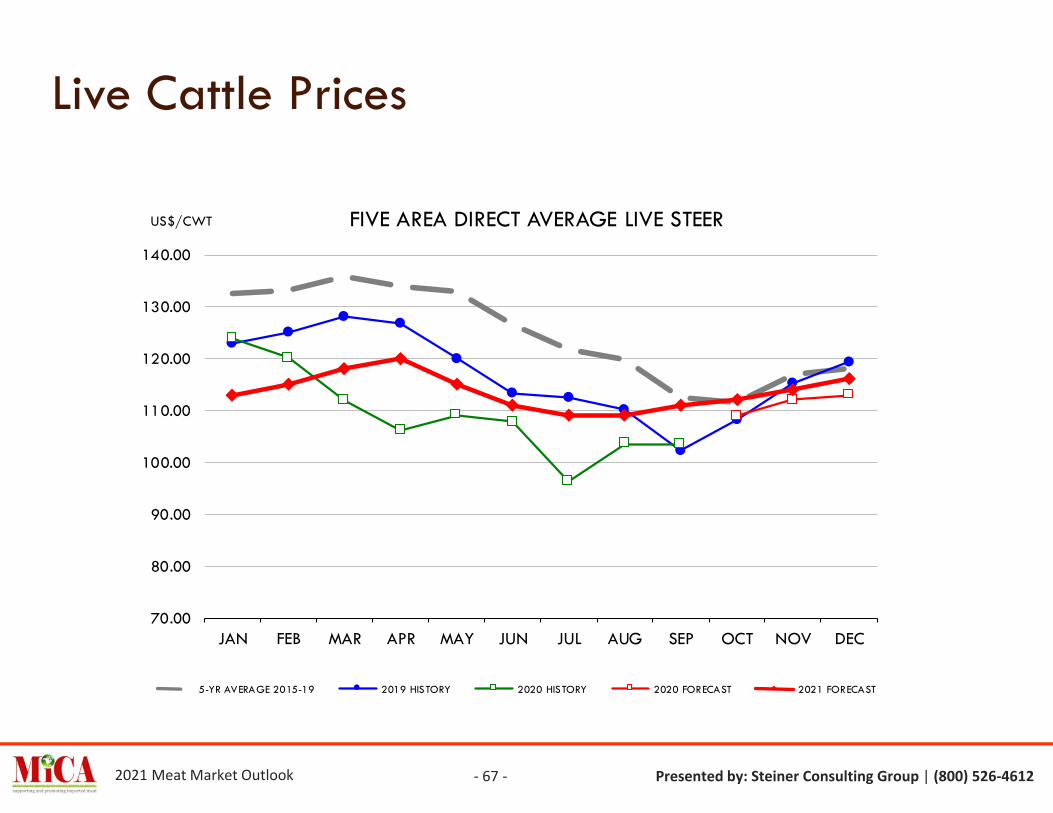
Live Cattle Prices
70.00
80.00
90.00
100.00
110.00
120.00
130.00
140.00
JAN FEB MAR APR MAY JUN JUL AUG SEP OCT NOV DEC
FIVE AREA DIRECT AVERAGE LIVE STEER
5-YR AVERAGE 2015-19 2019 HISTORY 2020 HISTORY 2020 FORECAST 2021 FORECAST
US$/CWT
- 67 -

2021 Meat Market Outlook Presented by: Steiner Consulting Group | (800) 526-4612
US Domestic 90CL Boneless Beef Prices
170.00
190.00
210.00
230.00
250.00
270.00
290.00
310.00
JAN FEB MAR APR MAY JUN JUL AUG SEP OCT NOV DEC
90% BONELESS BEEF, CENTRAL, FRESH, WT. AVG., USDA
5-YR AVERAGE 2015-19 2019 HISTORY 2020 HISTORY 2020 FORECAST 2021 FORECAST
US$/CWT
- 68 -

2021 Meat Market Outlook Presented by: Steiner Consulting Group | (800) 526-4612
US Domestic 50CL Beef Trim
0.00
50.00
100.00
150.00
200.00
250.00
JAN FEB MAR APR MAY JUN JUL AUG SEP OCT NOV DEC
50CL BEEF TRIM, FRESH, OMAHA BASIS, WT.AVE, USDA
5-YR AVERAGE 2015-19 2019 HISTORY 2020 HISTORY 2020 FORECAST 2021 FORECAST
US$/CWT
- 69 -

2021 Meat Market Outlook Presented by: Steiner Consulting Group | (800) 526-4612
Imported 90CL Australian Beef
160.00
180.00
200.00
220.00
240.00
260.00
280.00
300.00
JAN FEB MAR APR MAY JUN JUL AUG SEP OCT NOV DEC
7:45, E. COAST 90CL AUSTRALIAN BLENDED COW, TOP, YELLOW SHEET
5-YR AVERAGE 2015-19 2019 HISTORY 2020 HISTORY 2020 FORECAST 2021 FORECAST
US$/CWT
- 70 -

2021 Meat Market Outlook Presented by: Steiner Consulting Group | (800) 526-4612
Spread, Domestic - Imported
-50.00
-40.00
-30.00
-20.00
-10.00
0.00
10.00
20.00
30.00
40.00
50.00
JAN FEB MAR APR MAY JUN JUL AUG SEP OCT NOV DEC
DOMESTIC 90CL FRESH, FOB CENTRAL US MINUS 90CL IMPORTED, FROZEN, FOB US EAST COAST
5-YR AVERAGE 2015-19 2019 HISTORY 2020 HISTORY 2020 FORECAST 2021 FORECAST
US$/CWT
- 71 -

2021 Meat Market Outlook Presented by: Steiner Consulting Group | (800) 526-4612
Whole Broiler Prices
50.00
60.00
70.00
80.00
90.00
100.00
110.00
JAN FEB MAR APR MAY JUN JUL AUG SEP OCT NOV DEC
N.E. BROILER BREAST BONELESS-SKINLESS, WT.AVG., USDA
5-YR AVERAGE 2015-19 2019 HISTORY 2020 HISTORY 2020 FORECAST 2021 FORECAST
US$/CWT
- 72 -