2020 WHITTIER FERRY TERMINAL MODIFICATION
40
2020 WHITTIER FERRY TERMINAL MODIFICATION Marine Mammal Monitoring and Mitigation Program Draft Report for National Marine Fisheries Service Prepared for Harris Sand & Gravel, Inc. PO Box 6 Valdez, AK 99686 Prepared by Fairweather Science 301 Calista Court Anchorage, AK 99518 June 2020
Transcript of 2020 WHITTIER FERRY TERMINAL MODIFICATION

2020 WHITTIER FERRY TERMINAL MODIFICATION
Marine Mammal Monitoring and Mitigation Program Draft Report for
National Marine Fisheries Service
Prepared for
Harris Sand & Gravel, Inc. PO Box 6
Valdez, AK 99686
Prepared by
Fairweather Science
301 Calista Court Anchorage, AK 99518
June 2020

Leonard, K. and S. Wisdom. 2020. 2020 Whittier Ferry Terminal Modification Marine Mammal Monitoring and Mitigation Report. Prepared for National Marine Fisheries Service, Alaska Region, Protected Resources Division, 222 W. 7th Avenue, #43 Anchorage, AK 99513; National Marine Fisheries Service, Permits and Conservation Division, Office of Protected Resources, 1315 East-West Highway, Silver Spring, MD, 20910. Prepared by Fairweather Science, LLC, 301 Calista Court, Anchorage, AK 99518. June 2020.
2020 WHITTIER FERRY TERMINAL MODIFICATION PROJECT NMFS MARINE MAMMAL MONITORING AND MITIGATION REPORT II JUNE 2020
TABLE OF CONTENTS
1.0 INTRODUCTION ......................................................................................................................... 3
1.1 Description of Activities ..................................................................................................... 5
2.0 MARINE MAMMAL MONITORING AND MITIGATION PROGRAM ............................. 6
2.1 Visual Observations ............................................................................................................ 6
2.1.1 Data Collection ............................................................................................................. 7
2.2 Mitigation Measures ........................................................................................................... 8
3.0 MARINE MAMMAL MITIGATION AND MONITORING ANALYSIS METHODS ......... 9
3.1 Monitoring Effort and Environmental Conditions .............................................................. 9
3.2 Methods for Calculating Effort Hours ................................................................................ 9
3.3 Methods for Calculating Sightings and Sighting Rates ...................................................... 9
3.4 Marine Mammal Behavior .................................................................................................. 9
3.5 Number of Exposures ....................................................................................................... 10
3.5.1 Implemented Mitigation Measures ............................................................................. 10
4.0 RESULTS ..................................................................................................................................... 11
4.1 Effort and Environmental Conditions ............................................................................... 11
4.1.1 Total Monitoring Effort .............................................................................................. 11
4.1.2 Monitoring Effort by Environmental Conditions ....................................................... 11
4.2 Marine Mammal Visual Observations .............................................................................. 13
4.2.1 Marine Mammal Sightings ......................................................................................... 13
4.2.2 Marine Mammal Sighting Rates ................................................................................. 16
4.3 Marine Mammal Exposures .............................................................................................. 18
4.4 Summary of Mitigation Measures .................................................................................... 18
5.0 REFERENCES ............................................................................................................................. 19

2020 WHITTIER FERRY TERMINAL MODIFICATION PROJECT NMFS MARINE MAMMAL MONITORING AND MITIGATION REPORT III JUNE 2020
LIST OF FIGURES
Figure 1. Whittier Ferry Terminal and Mooring Structures. ......................................................................... 4
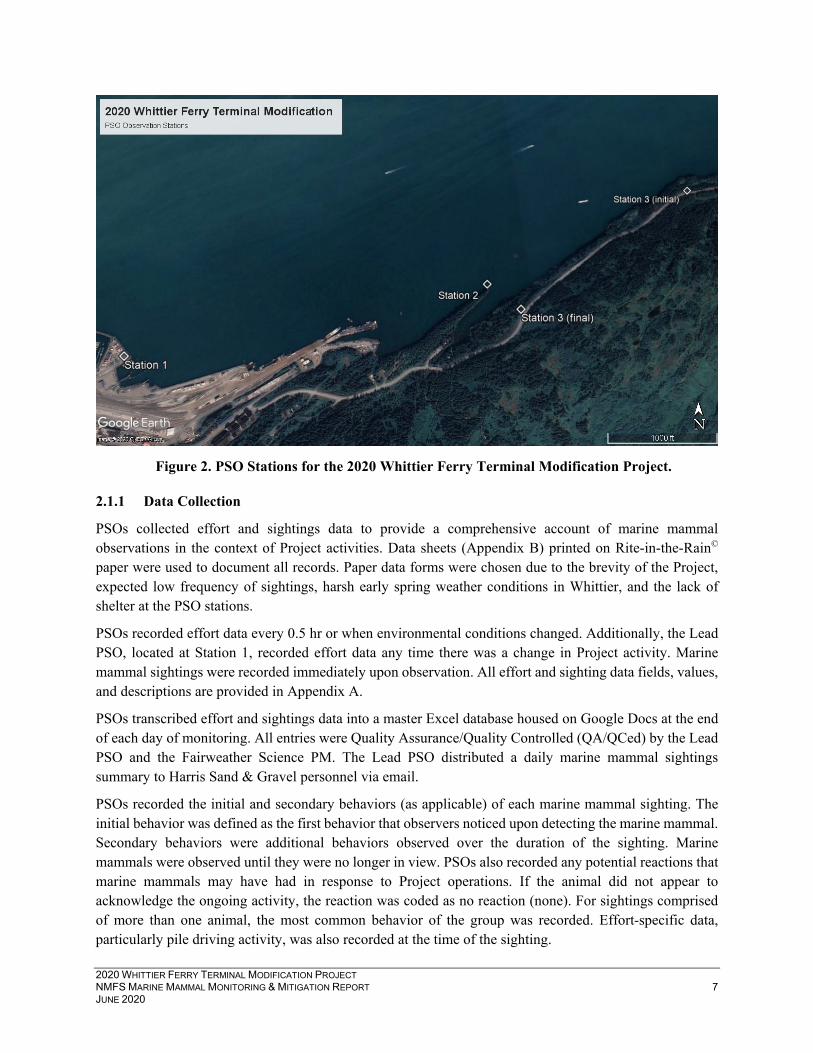
Figure 2. PSO Stations for the 2020 Whittier Ferry Terminal Modification Project. ................................... 7
Figure 3. Relative Frequencies of Beaufort Sea State During the Project. ................................................. 12
Figure 4. Relative Frequencies of Visibility Recorded During the Project. ............................................... 12
Figure 5. Relative Frequencies of Precipitation Types During the Project. ................................................ 12
Figure 6. Marine Mammal Sightings .......................................................................................................... 13
LIST OF TABLES
Table 1. Marine Mammal Sightings, Shutdowns, Level A and B Exposures during the Whittier Ferry Terminal Modification Project. ..................................................................................................................... 2
Table 2. Level A and Level B Harassment Zones. ....................................................................................... 8
Table 3. Definitions of Data Collection and Analysis Terminology............................................................. 9
Table 4. Total PSO Observation Hours Relative to Pile Driving Activities. .............................................. 11
Table 5. Marine Mammal Sightings and Initial Behaviors Recorded During the Project. ......................... 13
Table 6. Total Marine Mammal Sightings and Estimated Individual Counts per PSO Station. ................. 14
Table 7. Pinniped Sighting Initial Behaviors. ............................................................................................. 15
Table 8. Marine Mammal Sighting Rates. .................................................................................................. 16
Table 9. Marine Mammal Sighting Rates During No Work and Work Effort. ........................................... 17
Table 10. Daily Individual Sighting Rates for Marine Mammals Observed in the Level B Zone. ............. 17
Table 11. Mitigation Measures Implemented for Marine Mammal Sightings. ........................................... 18
LIST OF APPENDICES
Appendix A. Effort and Sightings Data Fields
Appendix B. Effort and Marine Mammal Sighting Forms
Appendix C. Marine Mammal Sightings Data
Appendix D. Example Marine Mammal Stranding Form

2020 WHITTIER FERRY TERMINAL MODIFICATION PROJECT NMFS MARINE MAMMAL MONITORING AND MITIGATION REPORT IV JUNE 2020
ACRONYMS AND ABBREVIATIONS
4MP Marine Mammal Monitoring and Mitigation Plan ACF Alaska Class Ferry AMHS Alaska Marine Highway System DPS Distinct Population Segment DOT&PF Alaska Department of Transportation and Public Facilities ESA Endangered Species Act FHWA Federal Highway Administration hr hour IHA Incidental Harassment Authorization km kilometers Lpk peak level LOC Letter of Concurrence m meter min minute MMPA Marine Mammal Protection Act NMFS National Marine Fisheries Service NOAA National Oceanic and Atmospheric Administration PM Project manager POC Point of Contact PSO Protected Species Observer PTS Permanent Threshold Shift QA/QC Quality analysis and quality control SEL Sound Exposure Level SOP Standard Operating Procedures SPL sound pressure level

2020 WHITTIER FERRY TERMINAL MODIFICATION PROJECT NMFS MARINE MAMMAL MONITORING & MITIGATION REPORT 1 JUNE 2020
EXECUTIVE SUMMARY
Harris Sand & Gravel contracted Fairweather Science, LLC (Fairweather Science) to implement the Marine Mammal Monitoring and Mitigation Program during the 2020 Whittier Ferry Terminal Modification Project (Project) for pile installation and removal operations at the Whittier ferry terminal in Whittier, Alaska.
Marine mammal monitoring occurred during activities specified in the Incidental Harassment Authorization (IHA) and Letter of Concurrence (LOC) issued by the National Oceanic and Atmospheric Administration (NOAA) National Marine Fisheries Service (NMFS) on December 23 and October 29, 2019, respectively. The pile driving activities associated with the Project commenced on April 3, 2020 and concluded on April 14, 2020.
Pile driving activities, including impact and vibratory operations, occurred on April 3, 7-10, and 14, 2020. Three Protected Species Observers (PSOs) monitored continuously for at least 30 minutes (min) prior to initiation of pile driving activities, and 30 min after activities ceased. One PSO was stationed at the ferry terminal to monitor the Level A zone, and the other two PSOs monitored the larger Level B zone from locations along the shoreline.
The total on-effort PSO monitoring time was 86.1 hours (hr); PSOs recorded 71.7 hr of observation time when No Work was occurring and 14.4 hr of observation time when Work was occurring. A total of 20 sightings (i.e., groups) of approximately 46 individual animals were observed by PSOs from April 3 to April 14, 2020 (Table 1). Steller sea lions were the most frequently observed species, followed by harbor seals.
Mitigation measures identified in the IHA and LOC were incorporated into PSO field protocol for implementation during the Project. Prior to the start of pile driving operations, PSOs observed the Level A and Level B harassment zones (Section 2.2) for 30 min in order to request delays to pile driving if a marine mammal was present in a shutdown zone. During the Project, two marine mammal sightings were observed during the pre-construction watch period, neither of which resulted in a shutdown or work delay. Six marine mammal sightings were observed while operations were ongoing, none of which required mitigation, and there were no marine mammals observed post-activity.
As required by NMFS, this report is being submitted within 90 days of the Project completion date (April 14, 2020) and presents a summary of information requested in the IHA and LOC including, completed operations, cumulative numbers of marine mammal sightings, and number and type of mitigation measures implemented.

2020 WHITTIER FERRY TERMINAL MODIFICATION PROJECT NMFS MARINE MAMMAL MONITORING & MITIGATION REPORT 2 JUNE 2020
Marine Mammal Species
No. of Sightings1
Estimated No. of Individuals
No. of Shutdowns/
Delays
No. of Project Level A Exposures
No. of Allowable Project Level A
Exposures
No. of Project Level B
Exposures2
No. of Allowable Project Level B
Exposures Humpback whale 0 0 0 0 0 0 6
Killer whale Resident & Transient 0 0 0 0 0 0 20
Dall’s porpoise 1 6 0 0 0 0 5 Steller sea lion 9 27 0 0 0 10 15
Harbor seal 10 13 0 0 0 7 60 Total 20 46 0 0 0 17 106
1One sighting equals one group. 2The number of Level B exposures has been extrapolated (20% of the Level B zone was not visible by the PSOs) and rounded up to the nearest whole number.
Table 1. Marine Mammal Sightings, Shutdowns, Level A and B Exposures during the Whittier Ferry Terminal Modification Project.

2020 WHITTIER FERRY TERMINAL MODIFICATION PROJECT NMFS MARINE MAMMAL MONITORING & MITIGATION REPORT 3 JUNE 2020
1.0 INTRODUCTION The Alaska Department of Transportation and Public Facilities (DOT&PF) requested on behalf of the Federal Highway Administration (FHWA) a joint IHA and endangered species consultation with concurrence that the proposed action may affect, but is not likely to adversely affect, the western distinct population segment (DPS) of Steller sea lions (Eumetopias jubatus) and the Mexico and Western North Pacific DPSs of humpback whale (Megaptera novaeangliae).
NMFS issued an IHA to the DOT&PF on December 23, 2019, under the authority of Section 101(a)(5)(D) of the Marine Mammal Protection Act (MMPA; 16 U.S.C. 1371 (a)(5)(D)) for work proposed to occur during 2020 in Whittier, Alaska. This authorization allowed the DOT&PF to harass small numbers of marine mammals, by Level B acoustic harassment, incidental to the Project that commenced on April 3 and concluded on April 14, 2020. The IHA authorized a small number of takes for the following species: humpback whale, killer whale (Orcinus orca), Dall’s porpoise (Phocoenoides dalli), Steller sea lion, and harbor seal (Phoca vitulina). NMFS completed informal consultation under section 7(a)(2) of the Endangered Species Act (ESA) on October 29, 2019 and concurred with the DOT&PF determination that Project activities were unlikely to adversely affect listed species occurring in the area.
The Project was located in Whittier, Alaska (Figure 1). Relocation of the S3 mooring structure of the ferry terminal required use of both impact and vibratory pile driving hammers. Pile installation and removal operations occurred on April 3, 7-10, and 14, 2020, with a total time of 6.6 hr of active hammering. Marine mammal monitoring occurred during pile driving activities, as specified in the IHA and LOC.
The specific objectives of the monitoring and mitigation program include:
• real-time mitigation • estimate the number of “takes” of marine mammals by harassment • collect data on the occurrence, distribution, and behaviors of marine mammals in the area of activity • evaluate the distances, distributions, behaviors, and movements of marine mammals relative to the
permitted activities
This report presents information on operations, marine mammal sightings, and mitigation measures implemented during the Project. Data fields and values are listed in Appendix A and example effort and marine mammal sighting forms are in Appendix B. A condensed version of the marine mammal sighting database is provided in Appendix C. Our complete master effort and sightings dataset is available in Excel form, upon request. Appendix D contains an example marine mammal stranding report form; however, no strandings were observed.

2020 WHITTIER FERRY TERMINAL MODIFICATION PROJECT NMFS MARINE MAMMAL MONITORING & MITIGATION REPORT 4 JUNE 2020
Figure 1. Whittier Ferry Terminal and Mooring Structures.

2020 WHITTIER FERRY TERMINAL MODIFICATION PROJECT NMFS MARINE MAMMAL MONITORING & MITIGATION REPORT 5 JUNE 2020
1.1 DESCRIPTION OF ACTIVITIES
The DOT&PF contracted Harris Sand & Gravel to modify the Whittier ferry terminal in Whittier, Alaska to accommodate the new Alaska Class Ferry (ACF). The ACF is a stern/bow roll on-roll off design with more efficient loading and unloading capabilities and greater capacity. Several ferry terminals along the Alaska Marine Highway System (AMHS), including the Whittier ferry terminal, need to be modified to accommodate the roll on-roll off design and to provide safe and efficient berthing. At the Whittier terminal, three actions were required:
1. Relocate mooring structure S3.
2. Modify existing catwalk and landing.
3. Modify shoreward floor beam – girder bridge connection.
Relocation of the S3 mooring structure at the Whittier ferry terminal required use of both impact and vibratory pile driving hammers. The vibratory hammer was used to extract the four 30-inch steel piles that form the S3 mooring structure and to reinstall the piles approximately 1.2 meters (m) southeast of their existing location. The impact hammer was used to proof the piles to a final depth of 19.8 m into the sea floor. Pile driving operations produced underwater noise in excess of harassment “take” thresholds established by NMFS and marine mammal monitoring was conducted during this activity in order to quantify authorized take and avoid unauthorized take. The additional construction activities, including modifications to the existing catwalk and landing, and bridge girder connection, occurred above water and did not produce underwater sound levels of concern. Monitoring was not required during these activities.
Prior to the Project start, a pre-construction teleconference was held on March 27, 2020 that was attended by representatives from DOT&PF, Harris Sand & Gravel, and Fairweather Science. On March 31, the Fairweather Science Project Manager (PM) and Lead PSO had a conference call with the Harris Sand & Gravel Construction Point of Contact (POC) to review communication protocols and mitigation procedures. PSO training occurred on April 2, and included marine mammal identification, data collection protocols, IHA and LOC permit review, mitigation measures, and Project operations.
Pile driving operations for the Project occurred on April 3, 7-10, and 14, 2020. Pile installation required use of both impact and vibratory hammers, and pile removal required use of the vibratory hammer. Over the six days that pile driving operations were conducted, active hammering occurred for a total time of 6.6 hr; the impact hammer was used for 0.2 hr and the vibratory hammer was used for 6.4 hr. One PSO was stationed at the ferry terminal to monitor the Level A zone, and two PSOs monitored the larger Level B zone from locations along the shoreline during pile driving operations.
2020 WHITTIER FERRY TERMINAL MODIFICATION PROJECT NMFS MARINE MAMMAL MONITORING & MITIGATION REPORT 6 JUNE 2020
2.0 MARINE MAMMAL MONITORING AND MITIGATION PROGRAM The IHA authorized small numbers of takes (Table 1), by Level B harassment, for five NMFS-managed marine mammal species. Other species of marine mammals were recorded, if observed.
The Project utilized three land-based PSOs for marine mammal monitoring and mitigation during pile installation and removal activities. The PSO team had two primary objectives:
1. Monitoring: Record species, group size, behaviors, and proximity to the activity for marine mammal sightings during monitoring. Document potential animal reactions (when observed), and environmental variables that may affect the ability to detect marine mammals.
2. Mitigation: Initiate mitigation measures, including work shut down or delay activity, for marine mammals within, or about to enter, the applicable zones.
2.1 VISUAL OBSERVATIONS
Five potential observation stations were scouted and considered before the Project started; however, only three were used (Figure 2). The Level A harassment zone was monitored from Station 1. Initially, Station 1 was to be located at the end of the ferry terminal catwalk. Construction operations prohibited safe access to this location and a nearby alternate location, with a clear view of the Level A zones, was used instead. Station 2 was located 1.48 kilometers (km) away from Station 1 along the shoreline off of Shotgun Cove Road. Station 3 was originally located 2.57 km away from Station 1 along the shoreline off of Shotgun Cove Trail. Trail conditions made access difficult and unsafe, and Station 3 was relocated on April 8 to a location 1.58 km away from Station 1 off of Shotgun Cove Trail Road. Station 4, located farther down Shotgun Cove Trail, was only accessible by snow machine and no attempts were made to access this location. The Level A zone was monitored at all times from Station 1 and 80% of the Level B zone was visible from Stations 2 and 3 (final).
All three PSOs were equipped with 7x50 Fujinon reticle binoculars, a Bushnell rangefinder, a Canon Powershot camera, a Garmin GPS, and a clipboard with rite-in-the-rain datasheets. PSOs remained in contact with each other at all times via marine radios and cell phones. The Lead PSO communicated regularly with the Construction POC via marine radio on a designated working channel.
PSOs observed the Project area with the naked eye and binoculars, scanning the area in a systematic manner, including both far and near fields of view. PSOs were on watch during daylight hours and monitored from at least 30 min prior to planned pile driving operations until 30 min post-activity. When continuous observations extended beyond 4 hr, Station 3 was abandoned and the three PSOs rotated between Stations 1 and 2 to prevent observer fatigue while ensuring adequate coverage of the Level A zones.
2020 WHITTIER FERRY TERMINAL MODIFICATION PROJECT NMFS MARINE MAMMAL MONITORING & MITIGATION REPORT 7 JUNE 2020
2.1.1 Data Collection
PSOs collected effort and sightings data to provide a comprehensive account of marine mammal observations in the context of Project activities. Data sheets (Appendix B) printed on Rite-in-the-Rain© paper were used to document all records. Paper data forms were chosen due to the brevity of the Project, expected low frequency of sightings, harsh early spring weather conditions in Whittier, and the lack of shelter at the PSO stations.
PSOs recorded effort data every 0.5 hr or when environmental conditions changed. Additionally, the Lead PSO, located at Station 1, recorded effort data any time there was a change in Project activity. Marine mammal sightings were recorded immediately upon observation. All effort and sighting data fields, values, and descriptions are provided in Appendix A.
PSOs transcribed effort and sightings data into a master Excel database housed on Google Docs at the end of each day of monitoring. All entries were Quality Assurance/Quality Controlled (QA/QCed) by the Lead PSO and the Fairweather Science PM. The Lead PSO distributed a daily marine mammal sightings summary to Harris Sand & Gravel personnel via email.
PSOs recorded the initial and secondary behaviors (as applicable) of each marine mammal sighting. The initial behavior was defined as the first behavior that observers noticed upon detecting the marine mammal. Secondary behaviors were additional behaviors observed over the duration of the sighting. Marine mammals were observed until they were no longer in view. PSOs also recorded any potential reactions that marine mammals may have had in response to Project operations. If the animal did not appear to acknowledge the ongoing activity, the reaction was coded as no reaction (none). For sightings comprised of more than one animal, the most common behavior of the group was recorded. Effort-specific data, particularly pile driving activity, was also recorded at the time of the sighting.
Figure 2. PSO Stations for the 2020 Whittier Ferry Terminal Modification Project.
2020 WHITTIER FERRY TERMINAL MODIFICATION PROJECT NMFS MARINE MAMMAL MONITORING & MITIGATION REPORT 8 JUNE 2020
The PSOs and Fairweather Science management team were trained to follow protocol for reporting dead or injured marine mammals as outlined in the IHA (stipulation 6[c]). An example Level A Stranding Report form is provided in Appendix D.
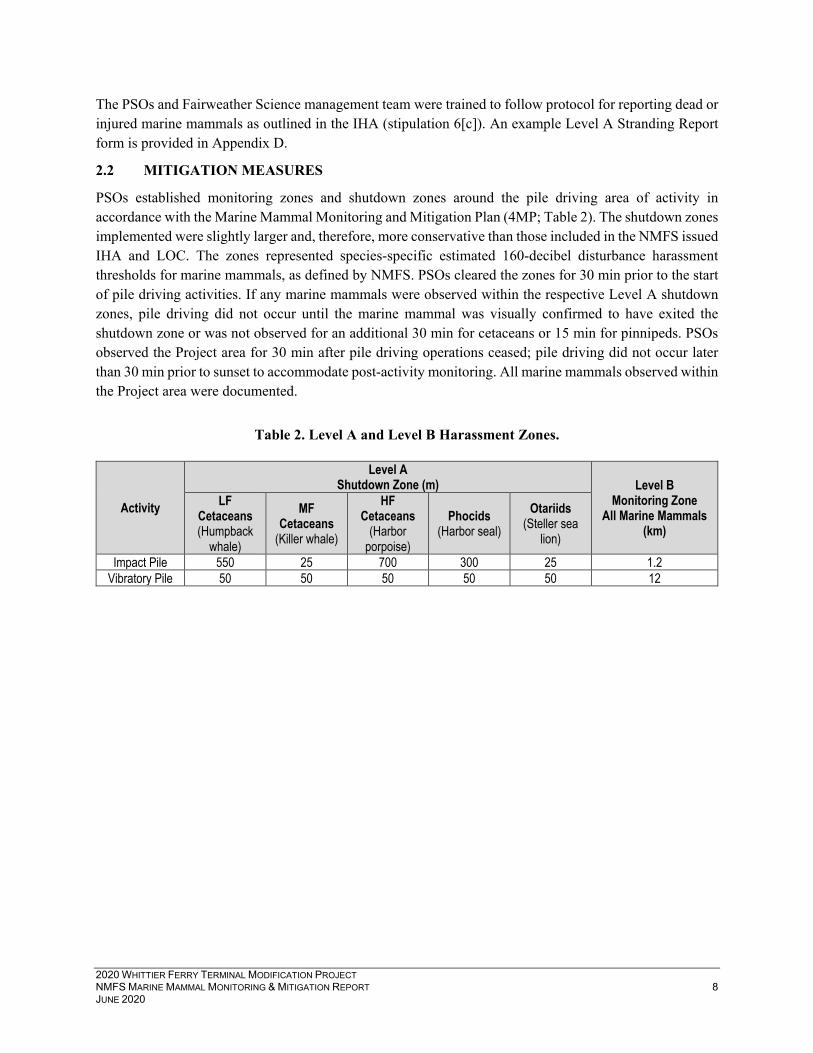
2.2 MITIGATION MEASURES
PSOs established monitoring zones and shutdown zones around the pile driving area of activity in accordance with the Marine Mammal Monitoring and Mitigation Plan (4MP; Table 2). The shutdown zones implemented were slightly larger and, therefore, more conservative than those included in the NMFS issued IHA and LOC. The zones represented species-specific estimated 160-decibel disturbance harassment thresholds for marine mammals, as defined by NMFS. PSOs cleared the zones for 30 min prior to the start of pile driving activities. If any marine mammals were observed within the respective Level A shutdown zones, pile driving did not occur until the marine mammal was visually confirmed to have exited the shutdown zone or was not observed for an additional 30 min for cetaceans or 15 min for pinnipeds. PSOs observed the Project area for 30 min after pile driving operations ceased; pile driving did not occur later than 30 min prior to sunset to accommodate post-activity monitoring. All marine mammals observed within the Project area were documented.
Activity
Level A Shutdown Zone (m) Level B
Monitoring Zone All Marine Mammals
(km)
LF Cetaceans (Humpback
whale)
MF Cetaceans
(Killer whale)
HF Cetaceans
(Harbor porpoise)
Phocids (Harbor seal)
Otariids (Steller sea
lion) Impact Pile 550 25 700 300 25 1.2
Vibratory Pile 50 50 50 50 50 12
Table 2. Level A and Level B Harassment Zones.
2020 WHITTIER FERRY TERMINAL MODIFICATION PROJECT NMFS MARINE MAMMAL MONITORING & MITIGATION REPORT 9 JUNE 2020
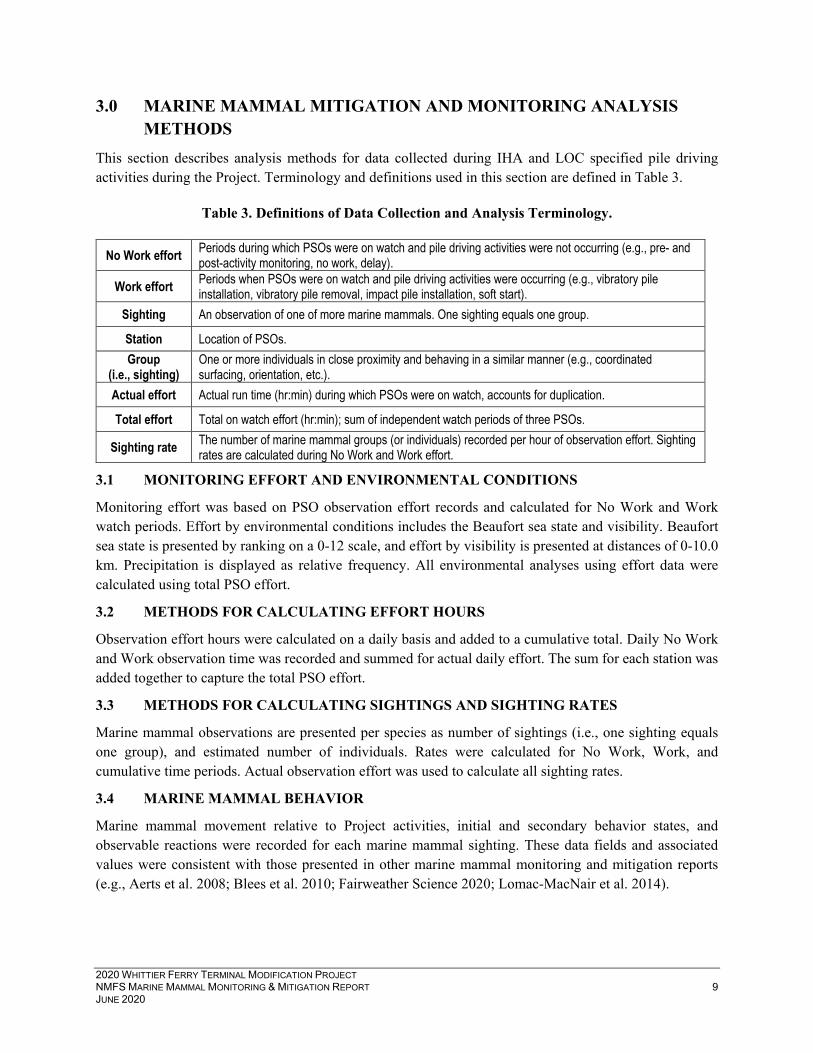
3.0 MARINE MAMMAL MITIGATION AND MONITORING ANALYSIS METHODS
This section describes analysis methods for data collected during IHA and LOC specified pile driving activities during the Project. Terminology and definitions used in this section are defined in Table 3.
No Work effort Periods during which PSOs were on watch and pile driving activities were not occurring (e.g., pre- and post-activity monitoring, no work, delay).
Work effort Periods when PSOs were on watch and pile driving activities were occurring (e.g., vibratory pile installation, vibratory pile removal, impact pile installation, soft start).
Sighting An observation of one of more marine mammals. One sighting equals one group.
Station Location of PSOs. Group
(i.e., sighting) One or more individuals in close proximity and behaving in a similar manner (e.g., coordinated surfacing, orientation, etc.).
Actual effort Actual run time (hr:min) during which PSOs were on watch, accounts for duplication.
Total effort Total on watch effort (hr:min); sum of independent watch periods of three PSOs.
Sighting rate The number of marine mammal groups (or individuals) recorded per hour of observation effort. Sighting rates are calculated during No Work and Work effort.
3.1 MONITORING EFFORT AND ENVIRONMENTAL CONDITIONS
Monitoring effort was based on PSO observation effort records and calculated for No Work and Work watch periods. Effort by environmental conditions includes the Beaufort sea state and visibility. Beaufort sea state is presented by ranking on a 0-12 scale, and effort by visibility is presented at distances of 0-10.0 km. Precipitation is displayed as relative frequency. All environmental analyses using effort data were calculated using total PSO effort.
3.2 METHODS FOR CALCULATING EFFORT HOURS
Observation effort hours were calculated on a daily basis and added to a cumulative total. Daily No Work and Work observation time was recorded and summed for actual daily effort. The sum for each station was added together to capture the total PSO effort.
3.3 METHODS FOR CALCULATING SIGHTINGS AND SIGHTING RATES
Marine mammal observations are presented per species as number of sightings (i.e., one sighting equals one group), and estimated number of individuals. Rates were calculated for No Work, Work, and cumulative time periods. Actual observation effort was used to calculate all sighting rates.
3.4 MARINE MAMMAL BEHAVIOR
Marine mammal movement relative to Project activities, initial and secondary behavior states, and observable reactions were recorded for each marine mammal sighting. These data fields and associated values were consistent with those presented in other marine mammal monitoring and mitigation reports (e.g., Aerts et al. 2008; Blees et al. 2010; Fairweather Science 2020; Lomac-MacNair et al. 2014).
Table 3. Definitions of Data Collection and Analysis Terminology.

2020 WHITTIER FERRY TERMINAL MODIFICATION PROJECT NMFS MARINE MAMMAL MONITORING & MITIGATION REPORT 10 JUNE 2020
3.5 NUMBER OF EXPOSURES
Under the MMPA, NMFS defined levels of harassment for marine mammals. Level A harassment is defined as “…any act of pursuit, torment, or annoyance which has the potential to injure a marine mammal or marine mammal stock in the wild.” Level B harassment is defined as “…any act of pursuit, torment, or annoyance which has the potential to disturb a marine mammal or marine mammal stock in the wild by causing disruption of behavioral patterns, including, but not limited to, migration, breathing, nursing, breeding, feeding, or sheltering.”
For Level A, the NOAA Technical Memorandum NMFS-Office of Protected Resources provides guidelines for assessing the onset of permanent threshold shifts (PTS) from anthropogenic sound. Under this guideline, marine mammals were separated into five functional hearing groups. Source types are separated into impulsive and non-impulsive, and require analyses of the distance to the peak received sound pressure level (SPL, Lpk) and 24-hr cumulative sound exposure level (SEL24h). Monitoring and shutdown zones (Table 2) were established based on marine mammal hearing thresholds and Project sound sources.
3.5.1 Implemented Mitigation Measures
The PSO team developed a Standard Operating Procedures (SOP) document prior to the commencement of the Project. The purpose of the SOP was to provide a brief summary of IHA and LOC requirements, marine mammal monitoring and shutdown zones, mitigation protocols, and communication processes. The document was distributed to relevant construction personnel so that all parties maintained a clear understanding of marine mammal-related monitoring and mitigation procedures throughout the duration of the Project.

2020 WHITTIER FERRY TERMINAL MODIFICATION PROJECT NMFS MARINE MAMMAL MONITORING & MITIGATION REPORT 11 JUNE 2020
4.0 RESULTS The results below provide a summary of data collected while PSOs were on watch, during pile driving operations that occurred from April 3 to April 14, 2020.
4.1 EFFORT AND ENVIRONMENTAL CONDITIONS
4.1.1 Total Monitoring Effort
The total PSO monitoring effort associated with the Project was 86.1 hr, which included 23.7 hr of No Work effort and 14.4 hr of Work (pile driving operations; Table 4).
Category Activity Actual Effort (HH:MM:SS) Total Effort (HH:MM:SS)
No Work
Pre-activity 08:26:00 22:14:00
Delay1 02:46:00 08:08:00
No Work 15:22:00 34:22:00
Post-activity 02:56:00 06:56:00
Total 29:30:00 71:40:00
Work
Soft Start 00:03:00 00:07:00 Vibratory Hammer
(Installation) 03:50:00 08:45:00
Vibratory Hammer (Removal) 02:32:00 05:15:00
Impact Hammer 00:09:00 00:18:00
Total 06:34:00 14:25:00
TOTAL 36:04:00 86:05:00 1Operations were delayed on April 7 due to sea otters observed within the Level B zone.
4.1.2 Monitoring Effort by Environmental Conditions
The environmental conditions in the Project area were favorable for effective monitoring efforts. Beaufort sea states ranged from 0 to 5, and were documented as 4 or less for 97% of the total monitoring effort (Figure 3). Sightability ranged from “Poor” to “Excellent”, and “Good” or “Excellent” was recorded for 75% of the total monitoring effort. Visibility ranged from 2 to 10 km, and a visibility of 3 km or more was recorded approximately 98% of the time (Figure 4). Precipitation occurred during 14% of effort hours (Figure 5) and included primarily snow (12% effort). Light rain and light fog were documented in four effort records.
Table 4. Total PSO Observation Hours Relative to Pile Driving Activities.

2020 WHITTIER FERRY TERMINAL MODIFICATION PROJECT NMFS MARINE MAMMAL MONITORING & MITIGATION REPORT 12 JUNE 2020
n=43n=79
n=63 n=52
n=11 n=70%
20%
40%
60%
80%
100%
0 1 2 3 4 5
Rela
tive
Freq
uenc
y
Beaufort Sea State
n=0 n=0 n=5 n=11 n=0 n=0 n=1 n=9 n=12 n=0
n=217
0%
20%
40%
60%
80%
100%
0 1 2 3 4 5 6 7 8 9 10
Rela
tive
Freq
uenc
y
Visibility (km)
n=220
n=1 n=3n=31
0%
20%
40%
60%
80%
100%
None Light Fog Light Rain Snow
Rela
tive
Freq
uenc
y
Precipitation
Figure 3. Relative Frequencies of Beaufort Sea State During the Project.
Figure 4. Relative Frequencies of Visibility Recorded During the Project.
Figure 5. Relative Frequencies of Precipitation Types During the Project.
n=effort entry
n=effort entry
n=effort entry

2020 WHITTIER FERRY TERMINAL MODIFICATION PROJECT NMFS MARINE MAMMAL MONITORING & MITIGATION REPORT 13 JUNE 2020
4.2 MARINE MAMMAL VISUAL OBSERVATIONS
4.2.1 Marine Mammal Sightings
During the Project, PSOs recorded a total of 20 independent marine mammal sightings comprised of 46 individuals (Table 5; Figure 6). The two sightings recorded at Station 3 (final), one sighting of Dall’s porpoise and one of a Steller sea lion, are mapped on land. The likely cause is an incorrect bearing value, either due to faulty equipment or PSO error.
Marine Mammal Species No. of Sightings1 Estimated No. of Individuals2 Initial Behaviors
Humpback whale 0 0 - Killer whale 0 0 -
Dall’s porpoise 1 6 Swim
Steller sea lion 9 27 Look, Surface active, Swim, Travel
Harbor seal 10 13 Look, Sink Total 20 46 -
1One sighting equals one group. 2Totals do not include re-sightings.
Table 6 presents the total marine mammal sightings recorded per station. Twenty percent (20%; n=4) of marine mammal sightings were recorded from Station 1, 70% (n = 14) from Station 2, and 10% (n=2) from Station 3 (final). There were no marine mammal sightings from the Station 3 (initial) location, when monitoring was conducted there on April 3 and 7.
Table 5. Marine Mammal Sightings and Initial Behaviors Recorded During the Project.
Figure 6. Marine Mammal Sightings
Dall’s porpoise Steller sea lion
Harbor seal

2020 WHITTIER FERRY TERMINAL MODIFICATION PROJECT NMFS MARINE MAMMAL MONITORING & MITIGATION REPORT 14 JUNE 2020
Station 1 Station 2 Station 3 (final)1 Total
Species No. of Sightings2
Estimated No. of
Individuals3
No. of Sightings2
Estimated No. of
Individuals3
No. of Sightings2
Estimated No. of
Individuals3 No. of
Sightings2 No. of
Individuals3
Humpback whale 0 0 0 0 0 0 0 0 Killer whale 0 0 0 0 0 0 0 0
Dall’s porpoise 0 0 0 0 1 6 1 6 Steller sea lion 3 12 5 14 1 1 9 27
Harbor seal 1 1 9 12 0 0 10 13 Total 4 13 14 26 2 7 20 46
1 There were no sightings at the Station 3 (initial) location. 2 One sighting equals one group. 3 Totals do not include individuals from re-sightings.
Table 6. Total Marine Mammal Sightings and Estimated Individual Counts per PSO Station.

2020 WHITTIER FERRY TERMINAL MODIFICATION PROJECT NMFS MARINE MAMMAL MONITORING & MITIGATION REPORT 15 JUNE 2020
Cetaceans
One sighting of six Dall’s porpoise was observed during the Project. The Dall’s porpoise were observed for over an hour during a period of No Work, approximately 1.3 km from the Station 3 (final) location. The animals were observed swimming and diving at a slow pace.
Pinnipeds
Collectively, pinniped species were sighted between 25 m and 600 m from the PSO stations, with an average sighting distance of approximately 205 m. Pinnipeds were observed in groups of one to seven individuals, but sightings were solitary 53% (n=10) of the time.
4.2.1.2.1 Behavior
Pinniped initial behaviors recorded during the Project included, look, sink, surface active, swim, and travel (Table 7), and look was the most commonly recorded initial behavior. Secondary behaviors observed included, dive, sink, swim, and travel.
Pinniped Initial Behavior Percent of Sightings1 (%) No. of Sightings
Look 58 11
Sink 5 1
Surface Active 11 2
Swim 21 4
Travel 5 1
Total 100 19 1One sighting equals one group.
Steller Sea Lion
Steller sea lions were detected by the presence of a head (67%; n=6) or body (33%; n=3), and swim was the most commonly recorded initial behavior (44%). Behaviors were performed at slow, moderate, and vigorous paces. Group sizes ranged from one to seven animals. Seventy-eight percent (78%) of Steller sea lion sightings were observed during periods when No Work was occurring, and 22% of sightings were observed when the vibratory hammer was in use for pile installation or removal. Two reactions were recorded for Steller sea lions. One group of five animals was observed swimming at a moderate pace 1.8 km from the noise source during pile installation with the vibratory hammer. The animals were swimming west in a tight group before stopping in front of Station 2 and changing direction to swim east. A single Steller sea lion was observed swimming at a vigorous pace 375 m from Station 3 (final) immediately after pile driving with the impact hammer ceased. The observer recorded a potential reaction of “avoid”. Distance to the noise source could not be determined due to an inaccurate bearing recorded for the sighting; however, Station 3 (final) was 1.5 km away from the noise source. No mitigation measures were required or implemented.
Table 7. Pinniped Sighting Initial Behaviors.
2020 WHITTIER FERRY TERMINAL MODIFICATION PROJECT NMFS MARINE MAMMAL MONITORING & MITIGATION REPORT 16 JUNE 2020
Harbor Seal
Harbor seal sightings were detected by the presence of a head (100%; n=10), and look was the most commonly recorded initial behavior (90%). All behaviors occurred at a slow pace (100%).
Most (80%) of the sightings were solitary animals. Sixty percent (60%) of sightings were observed during periods when No Work was occurring, and 40% of sightings were observed when the vibratory hammer was in use for pile installation or removal. No reactions were recorded for harbor seals. No mitigation measures were required or implemented.
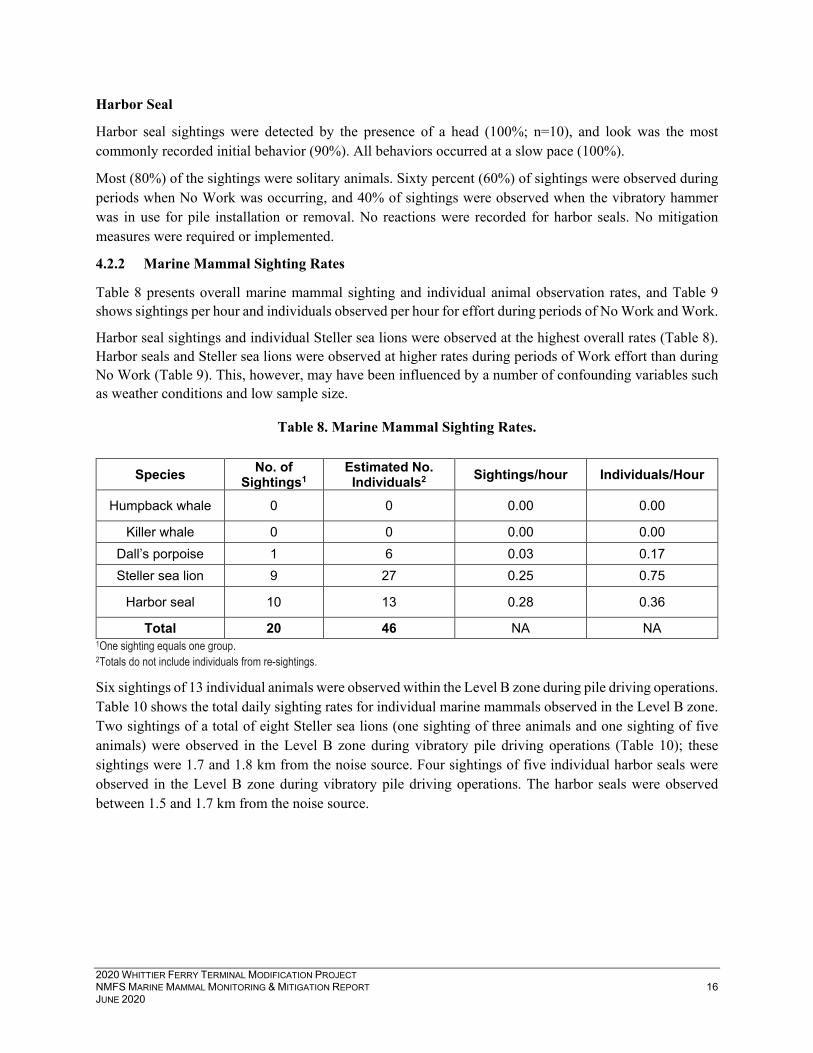
4.2.2 Marine Mammal Sighting Rates
Table 8 presents overall marine mammal sighting and individual animal observation rates, and Table 9 shows sightings per hour and individuals observed per hour for effort during periods of No Work and Work.
Harbor seal sightings and individual Steller sea lions were observed at the highest overall rates (Table 8). Harbor seals and Steller sea lions were observed at higher rates during periods of Work effort than during No Work (Table 9). This, however, may have been influenced by a number of confounding variables such as weather conditions and low sample size.
1One sighting equals one group. 2Totals do not include individuals from re-sightings.
Six sightings of 13 individual animals were observed within the Level B zone during pile driving operations. Table 10 shows the total daily sighting rates for individual marine mammals observed in the Level B zone. Two sightings of a total of eight Steller sea lions (one sighting of three animals and one sighting of five animals) were observed in the Level B zone during vibratory pile driving operations (Table 10); these sightings were 1.7 and 1.8 km from the noise source. Four sightings of five individual harbor seals were observed in the Level B zone during vibratory pile driving operations. The harbor seals were observed between 1.5 and 1.7 km from the noise source.
Table 8. Marine Mammal Sighting Rates.
Species No. of Sightings1
Estimated No. Individuals2 Sightings/hour Individuals/Hour
Humpback whale 0 0 0.00 0.00
Killer whale 0 0 0.00 0.00 Dall’s porpoise 1 6 0.03 0.17 Steller sea lion 9 27 0.25 0.75
Harbor seal 10 13 0.28 0.36
Total 20 46 NA NA

2020 WHITTIER FERRY TERMINAL MODIFICATION PROJECT NMFS MARINE MAMMAL MONITORING & MITIGATION REPORT 17 JUNE 2020
No Work Work
Species1 No. of Sightings2
Estimated No. Individuals3
No. of Sightings/hour
No. of Individuals/Hour
No. of Sightings2
Estimated No. Individuals3
No. of Sightings/Hour
No. of Individuals/Hour
Dall’s Porpoise 1 6 0.03 0.20 0 0 0.00 0.00
Steller sea lion 7 19 0.24 0.64 2 8 0.30 1.22
Harbor seal 6 8 0.20 0.27 4 5 0.61 0.76
Total 14 33 - - 6 13 - - 1Includes observed species only. See Table 8 for a complete list of species and overall rates. 2One sighting equals one group. 3Totals do not include individuals from re-sightings.
1Includes observed species only. See Table 8 for a complete list of species and overall rates.
Table 9. Marine Mammal Sighting Rates During No Work and Work Effort.
Table 10. Daily Individual Sighting Rates for Marine Mammals Observed in the Level B Zone.
Individuals1 in the Level B zone Level B Zone Individuals/Day
Steller sea lion 8 1.33
Harbor seal 5 0.83

2020 WHITTIER FERRY TERMINAL MODIFICATION PROJECT NMFS MARINE MAMMAL MONITORING & MITIGATION REPORT 18 JUNE 2020
4.3 MARINE MAMMAL EXPOSURES
Six sightings were recorded within the Level B zone while vibratory pile installation and removal activities were occurring. Four harbor seal sightings of a total of five individuals (three sightings of a single animal and one sighting of two animals) and two Steller sea lion sightings of a total of eight individuals (one sighting of three animals and one sighting of eight animals) were observed during Work. All were observed from and in proximity to Station 2, with distances to the activity ranging from 1.5 km to 1.8 km. The PSOs were able to monitor 80% of the Level B zone, and the total number of marine mammal exposures was extrapolated. Therefore, 6.25 or seven harbor seals were exposed to Level B harassment; the number of allowable Project Level B exposures was 60. Ten Steller sea lions were exposed to Level B harassment; the number of allowable exposures was 15.
4.4 SUMMARY OF MITIGATION MEASURES
No shutdowns were implemented during the Project, and cetacean and pinniped sightings did not result in delays to operations (Table 11). All marine mammals observed prior to initiation of pile driving activities were visually confirmed beyond species-specific shutdown zones. Only three sightings of Steller sea lions occurred in proximity (25 m and 50 m) to the Level A shutdown zone; however, the sightings were observed during periods of No Work. All other sightings were well beyond their species-specific shutdown zones during both periods of No Work and Work.
Species Mitigation Measure1
Shut down Delay2 None Total Humpback
whale 0 0 0 0
Killer whale 0 0 0 0
Dall’s porpoise 0 0 1 1
Steller sea lion 0 0 9 9
Harbor seal 0 0 10 10
Total 0 0 20 20 1Count refers to sightings, not individuals. 2Sightings that result in a delay of operations. The only delay occurred on April 7 and was due to a sea otter sighting.
Table 11. Mitigation Measures Implemented for Marine Mammal Sightings.

2020 WHITTIER FERRY TERMINAL MODIFICATION PROJECT NMFS MARINE MAMMAL MONITORING & MITIGATION REPORT 19 JUNE 2020
5.0 REFERENCES Aerts, L., M. Blees, S. Blackwell, C. Greene, K. Kim, D. Hannay and M. Austin. 2008. Marine mammal
monitoring and mitigation during BPXA Liberty OBC seismic survey in Foggy Island Bay, Beaufort Sea, July-August 2008: 90- day report. LGL Rep. P1011-1. Prepared by LGL Alaska Research Associates Inc., LGL Ltd., Greeneridge Sciences Inc., and JASCO Research Ltd. for BP Exploration Alaska, Anchorage, AK.
Blees, M.K., K.G. Hartin, D.S. Ireland, and D. Hannay. 2010. Marine mammal monitoring and mitigation during open water seismic exploration by Statoil USA E&P Inc. in the Chukchi Sea, August-October 2010: 90-day Report. LGL Report P1119. Prepared by LGL Alaska Research Associates Inc., LGL Ltd., and JASCO Research Ltd. for by Statoil USA E&P Inc., National Marine Fisheries Service, and U.S. Fish and Wildlife Service. 102 pp., plus appendices.
Fairweather Science, LLC. 2020. 2019 Hilcorp Alaska Lower Cook Inlet Seismic Survey Marine Mammal Monitoring and Mitigation Report. Prepared for Hilcorp Alaska, LLC, 3800 Centerpoint Drive, Suite 1400, Anchorage, Alaska 99503 Submitted to National Oceanic and Atmospheric Administration, National Marine Fisheries Service, Office of Protected Resources, 1315 East West Highway, Silver Spring, MD 20910, and; United States Fish and Wildlife Service, 1011 East Tudor Road, #200, Anchorage, Alaska 99503. Prepared by Fairweather Science, 301 Calista Court, Anchorage, AK 99518. January 2020.
Lomac-MacNair, K., M.A. Smultea and G. Campbell. 2014. Draft NMFS 90-Day Report for Marine Mammal Monitoring and Mitigation during Apache’s Cook Inlet 2014 Seismic Survey, 2 April – 27 June 2014. Prepared for Apache Alaska Corporation, 510 L Street #310, Anchorage AK 99501. Prepared by Smultea Environmental Sciences (SES), P.O. Box 256, Preston, WA 98050.

APPENDIX A. EFFORT AND SIGHTINGS DATA FIELDS

EFFORT Field Code Definition
Location
A1 Alternate Station 1 – located at the ferry terminal (the catwalk station was inaccessible)
S2 Station 2 – located along Shot Gun Cove Road, ~1.5 km from pile driving
S3I Station 3 Initial – located along Shot Gun Cove Trail, ~2.5 km from pile driving (Observations collected here April 3 and 7)
S3F Station 3 Final – located along Shot Gun Cove Road, ~1.6 km from pile driving (Observations collected here April 8-10 and 14)
PSO XX Initials of the PSO recording the data Latitude DD.DDDD Location of observation station. Decimal degrees
Longitude -DDD.DDDD Location of observation station. Decimal degrees
Effort ID XX-001 Individual ID for each Effort entry. Initials of the location followed by the number of the entry (e.g. S1001)
Date DD-MM-YYYY Date of entry Time HH:MM:SS Time of entry using 24-hr clock
Watch
Start Observations begin for the day or after a break in monitoring. Indicates the start of a continuous monitoring period.
Watch Continuous watch, entered between "Start" and "End".
End Observations end for the day or there is a break in monitoring due to weather or other circumstances. PSOs are off watch.
Activity
PRE Pre-construction watch begins 30 minutes prior to the start of operations POST Post-construction watch continues for 30 minutes after operations have ceased
SS Soft-start procedures will be implemented immediately prior to pile driving activities VIB Vibratory pile installation
VIBR Vibratory pile removal IMP Impact pile installation
IMPR Impact pile removal STAB Stabbing DRILL Drilling
DELAY Operations are delayed because a marine mammal has entered the EZ while the PSO was clearing the area.
No Work Continuous monitoring is occurring but no operations are underway.
WX Down Operations are ceased due to weather - shut down zones are not visible or the Beaufort sea state is above a 4.
SHUT Operations have been shut down for a marine mammal sighting. Other Activity not otherwise captured by the above categories. Please describe in the Notes.
Strike Counts # Number of strikes. Please communicate with the construction POC as necessary.
Sea State (Beaufort)
0 Sea surface is calm and smooth like a mirror 1 Scaly ripples, no foam crests 2 Small wavelets, glassy crests, no breaking waves, cats paw 3 Large wavelets, crests begin to break, scattered whitecaps 4 Small waves 1-4 ft becoming longer, numerous whitecaps 5 Moderate waves 4-8 ft taking longer form, many whitecaps, chance of spray 6 Larger waves 8-13 ft, white foam crests everywhere, probably spray
7 Sea heaps up, waves 13-19 ft, white foam streaks off breakers. Sightings are rare in a Bf ≥7 and monitoring is typically suspended.

EFFORT Field Code Definition
Visibility (km) # Number of kilometers visible to the horizon. Maximum value is 10 km. Use decimals
when visibility is less than 1 km (500 m = 0.5 km). % Glare 0-100 Percent of monitoring area covered by glare Cloud Cover # Percent range of cloud cover: 0-10, 10-50, 50-90, 90-100%.
Precip
NO None - No precipitation present DR Drizzle - Very fine drops of misty rain falling intermittently
LTRN Light Rain - Small drops of rain falling steadily and possibly obscuring visibility HYRN Heavy Rain - Larger drops of rain falling steadily and likely obscuring visibility LFOG Light Fog - Patchy, intermittent, gauzy fog HFOG Heavy Fog - Dense fog obscuring visibility HAIL Small balls or lumps of ice and compact snow
SNOW Ice crystals falling in flakes
MULT Multiple - Enter when more than one type of precipitation is occurring and describe in the "Notes". For example, light rain and light fog are present.
Sightability
- Sightability is an overall assessment of how the environmental conditions as a whole impact your ability to detect a marine mammal.
EXCEL Excellent - Ideal conditions for detecting a marine mammal (e.g. low sea state, 10 km visibility, daylight, no glare, no precipitation).
Good Favorable conditions for detecting a marine mammal (e.g. sea state 1-3, 7-10 km visibility, daylight, minimal glare, no/limited precipitation).
Fair Marginal conditions for detecting a marine mammal (e.g. sea state 3-4, visibility ≤ 5km, daylight/twilight, moderate glare, precipitation present).
Poor Conditions make it unlikely to detect a marine mammal (e.g. sea state ≥ 5, visibility ≤ 3km, twilight/dark, severe glare, heavy precipitation).
Notes Additional notes or descriptions not otherwise captured by the above fields.

Sightings Field Code Definition
Location
A1 Alternate Station 1 – located at the ferry terminal (the catwalk station was inaccessible due to operations)
S2 Station 2 – located along Shot Gun Cove Road, ~1.5 km from pile driving
S3I Station 3 Initial – located along Shot Gun Cove Trail, ~2.5 km from pile driving (Observations collected here April 3 and 7)
S3F Station 3 Final – located along Shot Gun Cove Road, ~1.6 km from pile driving. The initial Station 3 was difficult to access and PSOs felt unsafe at the site. (Observations collected here April 8-10 and 14)
Latitude DD.DDDD Location of observation station. Decimal degrees. Longitude -DDD.DDDD Location of observation station. Decimal degrees.
PSO XX Initials of the PSO recording the data.
Sighting ID XX-001 Individual ID for each Sighting. Initials of the location followed by the number of the entry. (e.g. S1001)
Date MM-DD-YYYY Date of entry Sighting Time HH:MM:SS Time when animal first observed
End Time HH:MM:SS Time of sighting end
Species
HS Harbor Seal SSL Steller Sea Lion HP Harbor Porpoise DP Dall's Porpoise
PWD Pacific White Sided Dolphin KW Killer Whale GW Gray Whale HW Humpback Whale FW Fin Whale MW Minke Whale SO Sea Otter
Other Marine mammal species not listed in drop-down. Describe in Notes.
UPIN Unidentified Pinniped - Pinniped species that could not be identified. Describe in Notes.
UDP Unidentified Dolphin/Porpoise - Smaller cetacean species that could not be identified. Describe in Notes.
UMW Unidentified Mysticete Whale - Large baleen whale that could not be identified. Describe in Notes.
UTW Unidentified Toothed Whale - Larger cetacean species that could not be identified. Describe in Notes.
UW Unidentified Whale - Whale species but no further identifying characteristics visible. Describe in Notes.
UMM Unidentified Marine Mammal - Certain a marine mammal but no other characteristics visible for further identification. Describe in Notes.
Confidence % Confidence level in species identification - 100, 75, or 50%
Total # of Animals #
Total number of individuals observed in the group, including juveniles and calves/pups. If animals are more than FIVE body lengths apart, enter as a separate sighting.
Juveniles # Number of juveniles observed. Distance (m) # Distance in meters from the observer to the marine mammal.

Sightings Field Code Definition
MM Bearing # Compass degrees (0-359) of where the animal is in relation to the observer MM Heading XX Cardinal direction animal is heading (North, NE, East, SE, South, SW, West, NW).
Sighting Cue
Initial visual cue that the PSO saw and resulted in a marine mammal sighting.
Birds Group of birds on water surface or hovering over a particular area, possibly feeding.
Body Part of the body visible. Blow Exhalation visible.
Dorsal Dorsal fin visible above the water surface. Fluke Fluke visible above the water surface.
Footprint Wake on water surface from animal swimming. Head Part of the head visible. Other Describe in Notes. Splash Splash from marine mammal movement visible.
Behaviors
Blow Visible exhalation from a cetacean species. Breach Cetacean jumping out of the water. Dead Carcass is found. Describe condition in Notes. Complete stranding report.
Dive Animal dives below the water surface and is not seen again for an extended period of time.
Enter Water Pinniped enters the water from a haul-out for no obvious reason.
Feed Animal is feeding or prey is observed in combination with characteristic feeding movement/behavior.
Flipper Slap Cetacean slapped the water surface with the pectoral fin and produced a splash. Fluke Cetacean raises tail before completing a forward dive.
Haulout Pinniped(s) resting on land or ice. Lobtail Cetacean slapped the water surface with fluke vigorously and produced a splash.
Logging Animal resting at the water surface. Drifting and not otherwise moving. Look Animal looked in any direction above the water surface. Mill Animals are slowly moving about while remaining in the same general area.
Other Behavior not otherwise captured by the options listed in the drop-down. Describe in the Notes.
Porpoising Rapid travel at the water surface. Low, arching leaps above the water surface. Rafting Group of animals motionless at the surface. Typical for sea otters.
Rest Animal is motionless at the water surface or on land/ice. Rush Rapid movement into the water from the land/ice. Sink Pinniped sinks below the water surface in an upright/vertical position. Slap Vigorously slapping the water surface with body, flippers, tail, etc.
Splash Animal moves quickly/vigorously and creates a splash. Spyhop Cetacean raises head in a vertical position with eyes above the water surface.
Startle Rapidly changing behavior, dispersement, or travel that suggests a response to an external event.
Surface active Several behaviors observed at the surface, including splashing, breaching, lobtailing, etc.
Swim Animal swimming at the water surface. May include several short shallow dives.
Tail wave Vertical body position with tail held out of the water. Tail may be moving slowly but slapping/splashing does not occur.

Sightings Field Code Definition
Travel Steady swimming in one direction. Unknown Unable to determine behavior. Enter this in second behavior, if none is observed.
Pace
ST Stationary - Animal is not moving. Also use for carcasses. SL Slow - Animal is moving slowly. Behaviors look relaxed. MO Moderate - Animal is moving at a medium pace. VI Vigorous - Animal is moving at a rapid pace that suggests it is agitated. UN Unknown - Cannot determine the pace of movement/behavior.
Reaction
None No reaction observed. The animal continues to behave in same way and at the same pace as when first encountered.
Avoid Animal maneuvers away from project activities. Approach Animal approaches project area.
Increase Speed Animal was traveling at a certain speed and then increased speed, likely in response to project activities.
Decrease Speed Animal was traveling at a certain speed and then reduced speed, likely in response to project activities.
Change Direction
Animal was traveling in one direction and then changed course, likely in response to project activities.
Look Pinniped appears to look at the project activity.
Rush Rapid movement into the water from the land/ice, likely in response to project activities.
Splash Animal moves vigorously and creates a splash, likely in response to project activities.
Startle Animal exhibits a sudden shock or alarmed behavior, likely in response to project activities.
Dive Animal dives below the water surface and is not seen again for an extended period of time, likely in response to project activities.
Interact with gear Animal is interacting with project equipment in the water.
Unknown Unknown if behavior is a reaction to project activities.
Activity
PRE Pre-construction watch begins 30 minutes prior to the start of operations POST Post-construction watch continues for 30 minutes after operations have ceased
SS Soft-start procedures will be implemented immediately prior to pile driving activities
VIB Vibratory pile installation VIBR Vibratory pile removal IMP Impact pile installation
IMPR Impact pile removal STAB Stabbing DRILL Drilling
DELAY Operations are delayed because a marine mammal has entered the EZ while the PSO was clearing the area.
No Work Continuous monitoring is occurring but no operations are underway.
WX Down Operations are ceased due to weather - shut down zones are not visible or the Beaufort sea state is above a 4.
SHUT Operations have been shut down for a marine mammal sighting.

Sightings Field Code Definition
Other Activity not otherwise captured by the above categories. Please describe in the Notes.
Mitigation
None No mitigation action implemented because an animal has been observed outside the Shutdown Zone, or after blasting.
Delay Operations are delayed because a marine mammal has entered the EZ while the PSO was clearing the area.
Shut down Operations have been shut down for a marine mammal sighting within or approaching the EZ.
Mit Time Call HH:MM:SS Time mitigation was requested.
Mit Time Implemented HH:MM:SS Time mitigation was implemented.
Notes Additional notes or descriptions pertaining to the sighting.

APPENDIX B. EFFORT AND MARINE MAMMAL SIGHTING FORMS


APPENDIX C. MARINE MAMMAL SIGHTINGS DATA

Date Time Station Latitude Longitude Species Total No.
Animals
Observer Distance
(m)
Activity Distance
(m)
MM Bearing Behavior Reaction Activity Mitigation
4/3/20 15:38 S2 60.7801 -148.6574 HS 1 250 - 47 Look None No Work None
4/7/20 8:43 S2 60.7801 -148.6574 HS 3 200 - 30 Look None PRE Delay None
4/7/20 10:00 S2 60.7801 -148.6574 SSL 2 100 - 10 Look None Delay None
4/7/20 10:42 A1 60.7771 -148.6839 SSL 2 50 - 20 Travel None Delay None
4/7/20 12:05 A1 60.7771 -148.6839 HS 1 100 - 20 Sink None PRE None
4/7/20 13:27 A1 60.7771 -148.6839 SSL 7 25 - 350 SA None No Work None
4/7/20 13:47 A1 60.7771 -148.6839 SSL 3 50 - 310 SA None No Work None
4/7/20 16:12 S2 60.7801 -148.6574 HS 1 100 1550 60 Look None VIBR No Work None
4/8/20 7:38 S2 60.7801 -148.6574 SSL 3 600 - 35 Swim None No Work None
4/8/20 7:54 S2 60.7801 -148.6574 SSL 3 400 1697 15 Swim None VIBR None

Date Time Station Latitude Longitude Species Total No.
Animals
Observer Distance
(m)
Activity Distance
(m)
MM Bearing Behavior Reaction Activity Mitigation
4/8/20 8:19 S2 60.7801 -148.6574 HS 1 50 - 13 Look None No Work None
4/9/20 15:09 S2 60.7801 -148.6574 SSL 5 400 1783 35 Swim Ch Dir VIB No Work None
4/10/20 7:00 S2 60.7801 -148.6574 HS 2 150 1592 50 Look None No Work
VIBR VIB
None
4/10/20 10:14 S3F 60.7788 -148.6552 SSL 1 375 - 90 Swim Avoid No Work None
4/10/20 10:36 S3F 60.7788 -148.6552 DP 6 1300 - 90 Swim None No Work None
4/10/20 12:18 S2 60.7801 -148.6574 HS 1 200 - 45 Look None No Work None
4/14/20 12:29 S2 60.7801 -148.6574 HS 1 400 - 326 Look None No Work None
4/14/20 13:08 S2 60.7801 -148.6574 HS 1 300 1732 50 Look None No Work VIBR None
4/14/20 16:03 S2 60.7801 -148.6574 HS 1 100 1530 33 Look None No Work VIBR None
4/14/20 16:21 S2 60.7801 -148.6574 SSL 1 50 - 240 Look None No Work None

APPENDIX D. EXAMPLE MARINE MAMMAL STRANDING FORM