2020 Schools Survey: Survey Methodology, Respondent ...
19
Survey Methodology, Respondent Demographics, and Glossary For additional information, please contact: Jeanette Janota, Surveys and Analysis American Speech-Language-Hearing Association 2200 Research Boulevard Rockville, MD 20850-3289 800-498-2071, ext. 8738 [email protected]
Transcript of 2020 Schools Survey: Survey Methodology, Respondent ...
Survey Methodology, Respondent Demographics,
and Glossary
For additional information, please contact:
Jeanette Janota, Surveys and Analysis
American Speech-Language-Hearing Association
2200 Research Boulevard
Rockville, MD 20850-3289
800-498-2071, ext. 8738
ASHA 2020 Schools Survey: Methodology, Demographics, and Glossary
i
Contents
Executive Summary .........................................................................................................................1
Survey Methodology ........................................................................................................................2
Sample Design .....................................................................................................................2
Response Rate ......................................................................................................................2
Demographics ..................................................................................................................................4
Respondents Versus Population ...........................................................................................4
Employment Situation .........................................................................................................5
Primary Employment Facility ..............................................................................................5
Excluded Facilities ...............................................................................................................5
Primary Employment Function ............................................................................................6
Employment Status ..............................................................................................................6
Salary Basis ..........................................................................................................................6
Highest Degree.....................................................................................................................6
Sex........................................................................................................................................6
Age .......................................................................................................................................6
Years of Experience .............................................................................................................7
Population Density ...............................................................................................................7
Geographic Distribution.......................................................................................................8
Reports .............................................................................................................................................9
Suggested Citation ...........................................................................................................................9
Resources .........................................................................................................................................9
Thank You! ......................................................................................................................................9
Additional Information ....................................................................................................................9
Glossary .........................................................................................................................................10
Types of Facilities ..............................................................................................................10
Random Sample .................................................................................................................10
Response Rate ....................................................................................................................10
Measures of Central Tendency ..........................................................................................11
Statistical Significance .......................................................................................................11
Figures
Figure 1: Facility, by CCC ...................................................................................................5
Figure 2: Function, by CCC .................................................................................................6
Figure 3: Population Density, by CCC ................................................................................7
Figure 4: Region of the Country, by CCC ...........................................................................8
ASHA 2020 Schools Survey: Methodology, Demographics, and Glossary
ii
Table
Table 1: Calculation of Response Rate ................................................................................2
Appendices
Appendix A: First Cover Letter to Audiologists................................................................12
Appendix B: States by Regions and Divisions ..................................................................15
ASHA 2020 Schools Survey: Methodology, Demographics, and Glossary
1
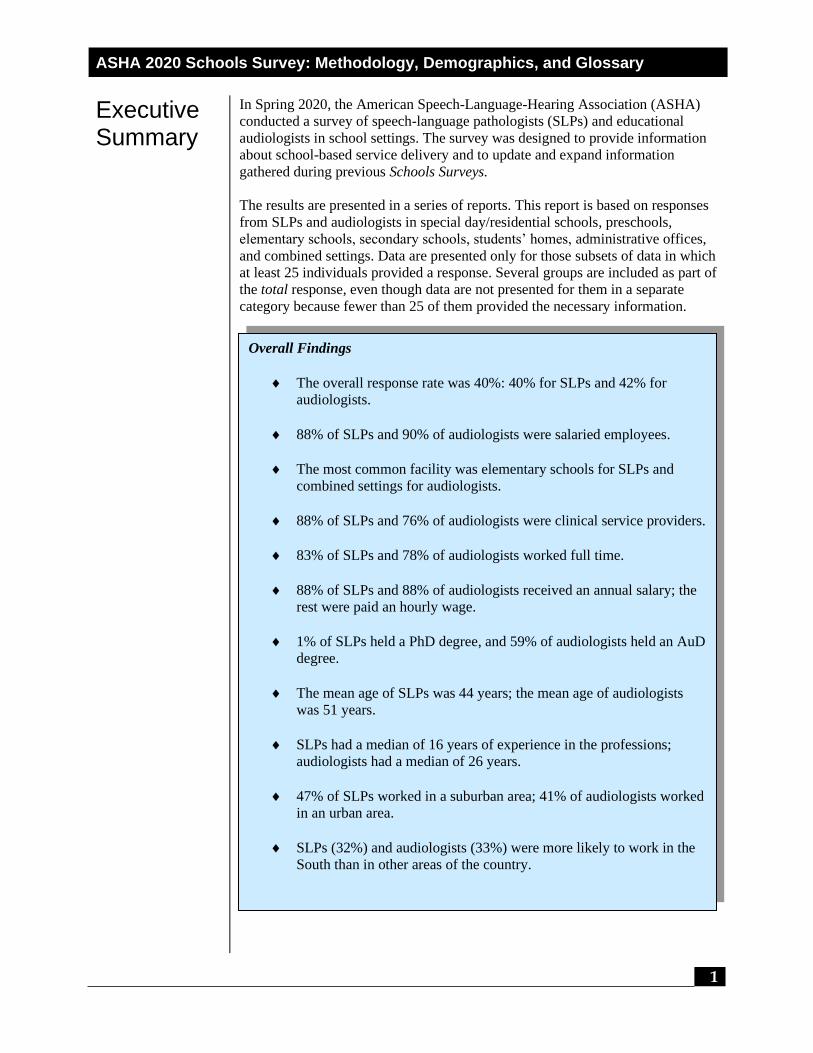
Executive Summary
In Spring 2020, the American Speech-Language-Hearing Association (ASHA)
conducted a survey of speech-language pathologists (SLPs) and educational
audiologists in school settings. The survey was designed to provide information
about school-based service delivery and to update and expand information
gathered during previous Schools Surveys.
The results are presented in a series of reports. This report is based on responses
from SLPs and audiologists in special day/residential schools, preschools,
elementary schools, secondary schools, students’ homes, administrative offices,
and combined settings. Data are presented only for those subsets of data in which
at least 25 individuals provided a response. Several groups are included as part of
the total response, even though data are not presented for them in a separate
category because fewer than 25 of them provided the necessary information.
Overall Findings
The overall response rate was 40%: 40% for SLPs and 42% for
audiologists.
88% of SLPs and 90% of audiologists were salaried employees.
The most common facility was elementary schools for SLPs and
combined settings for audiologists.
88% of SLPs and 76% of audiologists were clinical service providers.
83% of SLPs and 78% of audiologists worked full time.
88% of SLPs and 88% of audiologists received an annual salary; the
rest were paid an hourly wage.
1% of SLPs held a PhD degree, and 59% of audiologists held an AuD
degree.
The mean age of SLPs was 44 years; the mean age of audiologists
was 51 years.
SLPs had a median of 16 years of experience in the professions;
audiologists had a median of 26 years.
47% of SLPs worked in a suburban area; 41% of audiologists worked
in an urban area.
SLPs (32%) and audiologists (33%) were more likely to work in the
South than in other areas of the country.
ASHA 2020 Schools Survey: Methodology, Demographics, and Glossary
2
Survey Method-ology
Sample Design
Response Rate
The survey was mailed on February 10, 2020, to a random sample of 4,500
ASHA-certified SLPs and 500 ASHA-certified audiologists who were employed
in school settings in the United States. Individuals who returned their surveys
were removed from the second (March 11) mailing. Each mailing consisted of a
personalized cover letter, a numbered survey, and a #10 postage-paid business
return envelope inserted into a #11 window envelope with an ASHA return
address. Metered postage was at the full, first-class rate. In addition, a be-on-the-
lookout email was sent to all sample members on February 12.
Under normal circumstances, the survey would have been fielded a third time to
nonrespondents. However, the date of the planned third mailing coincided with the
COVID-19 pandemic, and the staff made the decision to not burden members with
a survey request when they were facing enormous personal and professional
challenges.
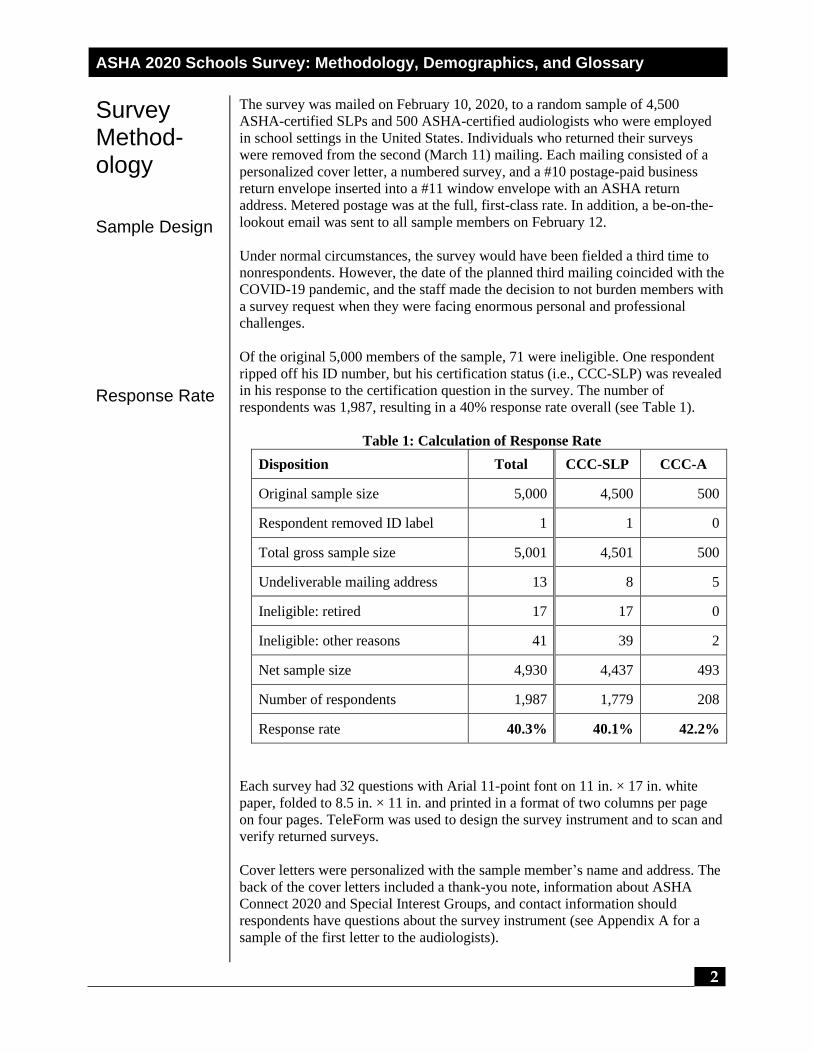
Of the original 5,000 members of the sample, 71 were ineligible. One respondent
ripped off his ID number, but his certification status (i.e., CCC-SLP) was revealed
in his response to the certification question in the survey. The number of
respondents was 1,987, resulting in a 40% response rate overall (see Table 1).
Table 1: Calculation of Response Rate
Disposition Total CCC-SLP CCC-A
Original sample size 5,000 4,500 500
Respondent removed ID label 1 1 0
Total gross sample size 5,001 4,501 500
Undeliverable mailing address 13 8 5
Ineligible: retired 17 17 0
Ineligible: other reasons 41 39 2
Net sample size 4,930 4,437 493
Number of respondents 1,987 1,779 208
Response rate 40.3% 40.1% 42.2%
Each survey had 32 questions with Arial 11-point font on 11 in. × 17 in. white
paper, folded to 8.5 in. × 11 in. and printed in a format of two columns per page
on four pages. TeleForm was used to design the survey instrument and to scan and
verify returned surveys.
Cover letters were personalized with the sample member’s name and address. The
back of the cover letters included a thank-you note, information about ASHA
Connect 2020 and Special Interest Groups, and contact information should
respondents have questions about the survey instrument (see Appendix A for a
sample of the first letter to the audiologists).
ASHA 2020 Schools Survey: Methodology, Demographics, and Glossary
3
Not only is it typically the case that some individuals who receive a survey do not
complete it (unit nonresponse), but it is likewise true that some who return their
surveys do not answer every question (item nonresponse) and thus do not qualify
for inclusion in portions of a report. They may be excluded from analyses because
they did not answer a question at all or because their answer disqualified them
(such as stating that they were employed part time when a particular analysis was
limited to full-time employees). For example, among the 1,779 SLPs who
responded, only 1,717 were included in reporting on their primary employment
facility (see Figure 1) because they
indicated that they had ASHA certification (i.e., the Certificate of Clinical
Competence) in Speech-Language Pathology (CCC-SLP);
indicated that they were employed full time or part time; and
identified the type of employment facility where they were employed.
ASHA 2020 Schools Survey: Methodology, Demographics, and Glossary
4
Demo-graphics
Respondents Versus Population
The closer the match between survey respondents and the population of ASHA
school-based constituents from which they were drawn, the more validity there is
in generalizing from the sample to the population—that is, the more truth there is
in saying that the people who answered the survey questions represent the
broader group from which they were selected. Demographic variables that appear
in both the membership database and the survey include primary employment
facility and function, highest earned degree, sex, age, and region of the country.
Comparisons between the respondents and the population can be made for several
characteristics, the first being the type of school in which they worked.
• In the population, 46% of SLPs and 4% of audiologists who worked in the
schools were employed in elementary schools, compared with 59% and
23%, respectively, of the survey respondents.
A second area of comparison is their primary function.
• 75% of SLPs and 83% of audiologists in the population were clinical
service providers, compared with 88% of SLPs and 76% of audiologists
among the survey respondents.
Another characteristic to be compared is the highest earned degree.
• 1% of SLPs and 37% of audiologists in the population reported having
earned a doctoral degree, compared with 2% of SLPs and 60% of
audiologists among the survey respondents.
A fourth characteristic to be compared is sex.
• 3% of SLPs and 5% of audiologists in the population were male,
compared with 2% of SLPs and 4% of audiologists among the survey
respondents.
Age is another characteristic that can be compared.
• The median age of SLPs who were employed full- or part time was 43
years in both the population and among the survey respondents. The
median age for audiologists was 51 years in the population and 52 years
among the survey respondents.
The survey sample was stratified by state; that is, states with small numbers of
ASHA constituents were oversampled, and those with large numbers were
undersampled. Despite the stratification, SLPs and audiologists who responded to
the survey almost perfectly mirrored those in the population of professionals who
work in the schools on region of the country where they were employed.
• 27% of SLPs and 17% of audiologists in the population—compared with
26% of SLPs and 17% of audiologists who replied to the survey—worked
in the Northeast.
• 24% of SLPs and 25% of audiologists in the population—compared with
24% of SLPs and 26% of audiologists who replied to the survey—worked
in the Midwest.
• 31% of SLPs and 33% of audiologists in the population—compared with
32% of SLPs and 33% of audiologists who replied to the survey—worked
in the South.
• 18% of SLPs and 25% of audiologists in the population—compared with
18% of SLPs and 25% of audiologists who replied to the survey—worked
in the West.
ASHA 2020 Schools Survey: Methodology, Demographics, and Glossary
5
Employment Situation
Primary Employment Facility
Excluded Facilities
Both SLPs (88%) and audiologists (90%) were more likely to be salaried
employees than contract employees or self employed.
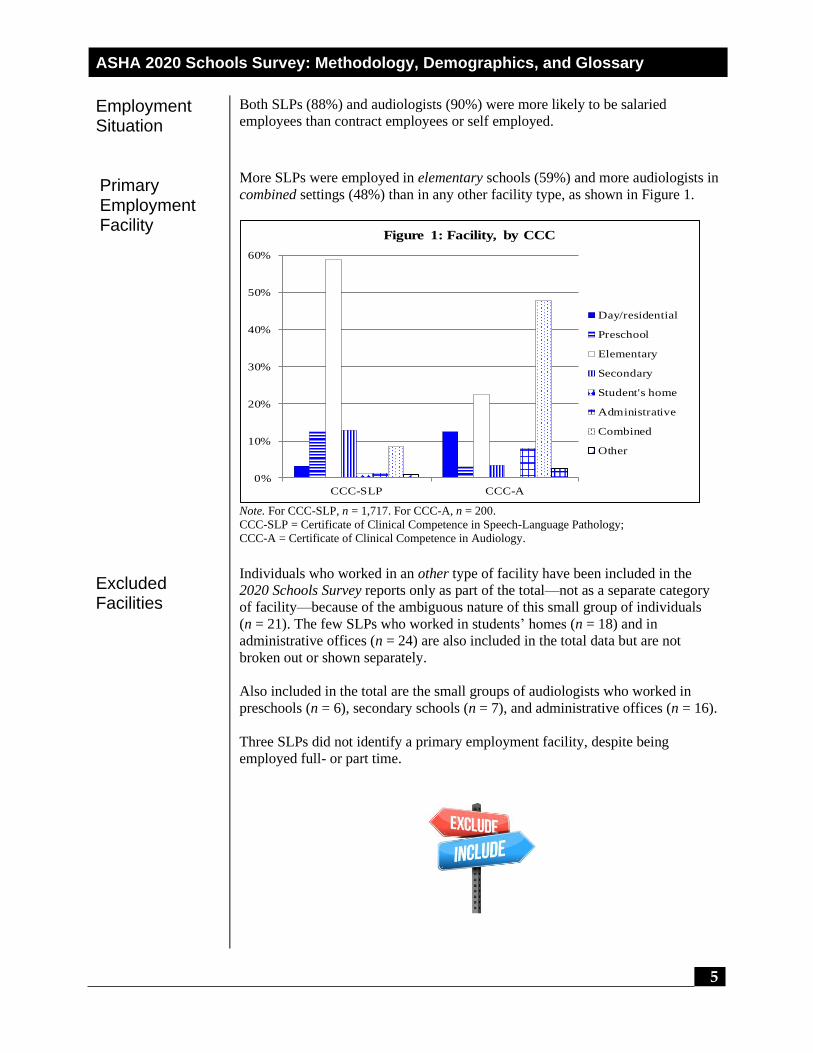
More SLPs were employed in elementary schools (59%) and more audiologists in
combined settings (48%) than in any other facility type, as shown in Figure 1.
0%
10%
20%
30%
40%
50%
60%
CCC-SLP CCC-A
Figure 1: Facility, by CCC
Day/residential
Preschool
Elementary
Secondary
Student's home
Administrative
Combined
Other
Note. For CCC-SLP, n = 1,717. For CCC-A, n = 200.
CCC-SLP = Certificate of Clinical Competence in Speech-Language Pathology;
CCC-A = Certificate of Clinical Competence in Audiology. Individuals who worked in an other type of facility have been included in the
2020 Schools Survey reports only as part of the total—not as a separate category
of facility—because of the ambiguous nature of this small group of individuals
(n = 21). The few SLPs who worked in students’ homes (n = 18) and in
administrative offices (n = 24) are also included in the total data but are not
broken out or shown separately.
Also included in the total are the small groups of audiologists who worked in
preschools (n = 6), secondary schools (n = 7), and administrative offices (n = 16).
Three SLPs did not identify a primary employment facility, despite being
employed full- or part time.
ASHA 2020 Schools Survey: Methodology, Demographics, and Glossary
6
Primary Employment Function
Employment Status
Salary Basis
Highest Degree
Sex
Age
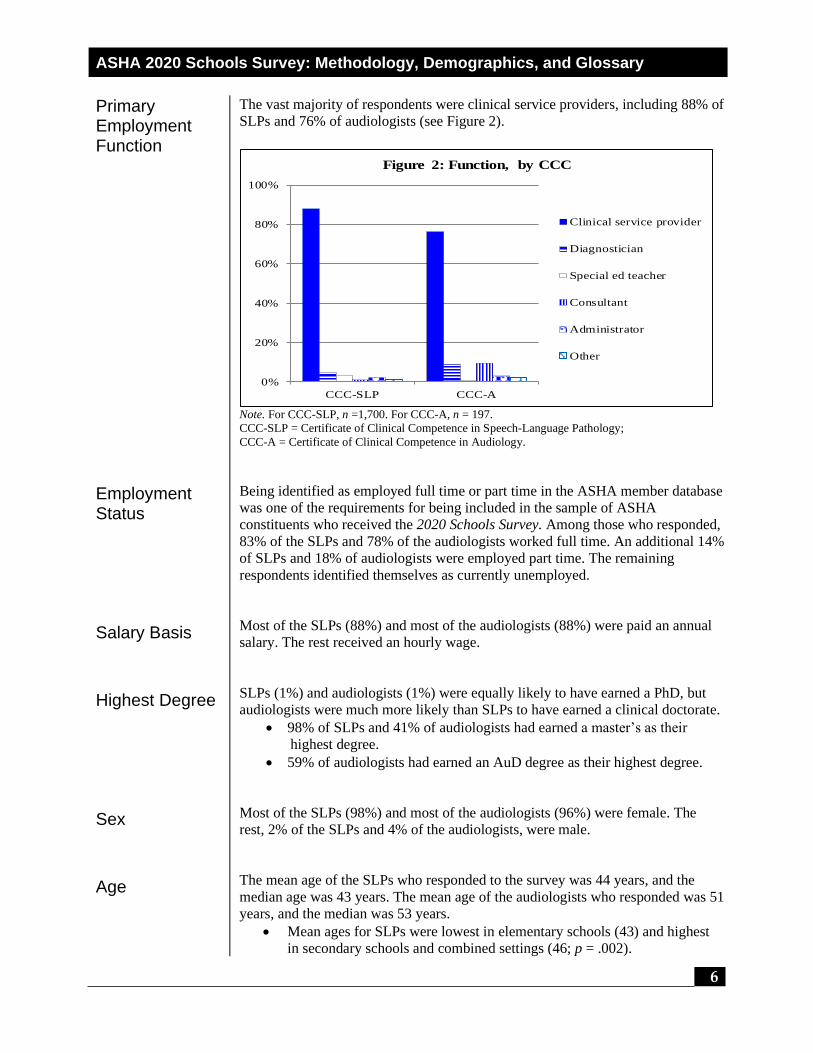
The vast majority of respondents were clinical service providers, including 88% of
SLPs and 76% of audiologists (see Figure 2).
0%
20%
40%
60%
80%
100%
CCC-SLP CCC-A
Figure 2: Function, by CCC
Clinical service provider
Diagnostician
Special ed teacher
Consultant
Administrator
Other
Note. For CCC-SLP, n =1,700. For CCC-A, n = 197.
CCC-SLP = Certificate of Clinical Competence in Speech-Language Pathology;
CCC-A = Certificate of Clinical Competence in Audiology.
Being identified as employed full time or part time in the ASHA member database
was one of the requirements for being included in the sample of ASHA
constituents who received the 2020 Schools Survey. Among those who responded,
83% of the SLPs and 78% of the audiologists worked full time. An additional 14%
of SLPs and 18% of audiologists were employed part time. The remaining
respondents identified themselves as currently unemployed.
Most of the SLPs (88%) and most of the audiologists (88%) were paid an annual
salary. The rest received an hourly wage.
SLPs (1%) and audiologists (1%) were equally likely to have earned a PhD, but
audiologists were much more likely than SLPs to have earned a clinical doctorate.
• 98% of SLPs and 41% of audiologists had earned a master’s as their
highest degree.
• 59% of audiologists had earned an AuD degree as their highest degree.
Most of the SLPs (98%) and most of the audiologists (96%) were female. The
rest, 2% of the SLPs and 4% of the audiologists, were male.
The mean age of the SLPs who responded to the survey was 44 years, and the
median age was 43 years. The mean age of the audiologists who responded was 51
years, and the median was 53 years.
• Mean ages for SLPs were lowest in elementary schools (43) and highest
in secondary schools and combined settings (46; p = .002).
ASHA 2020 Schools Survey: Methodology, Demographics, and Glossary
7
Years of Experience
Population Density
SLPs averaged 17 (mean) or 16 (median) years of experience in the professions
and 15 (mean) or 13 (median) years of experience in the schools.
Audiologists averaged more years of experience than did the SLPs. The mean
number of years of experience that audiologists had in the professions was 25, and
the median was 26 years. Audiologists averaged 17 years of experience in the
schools. The median was also 17 years.
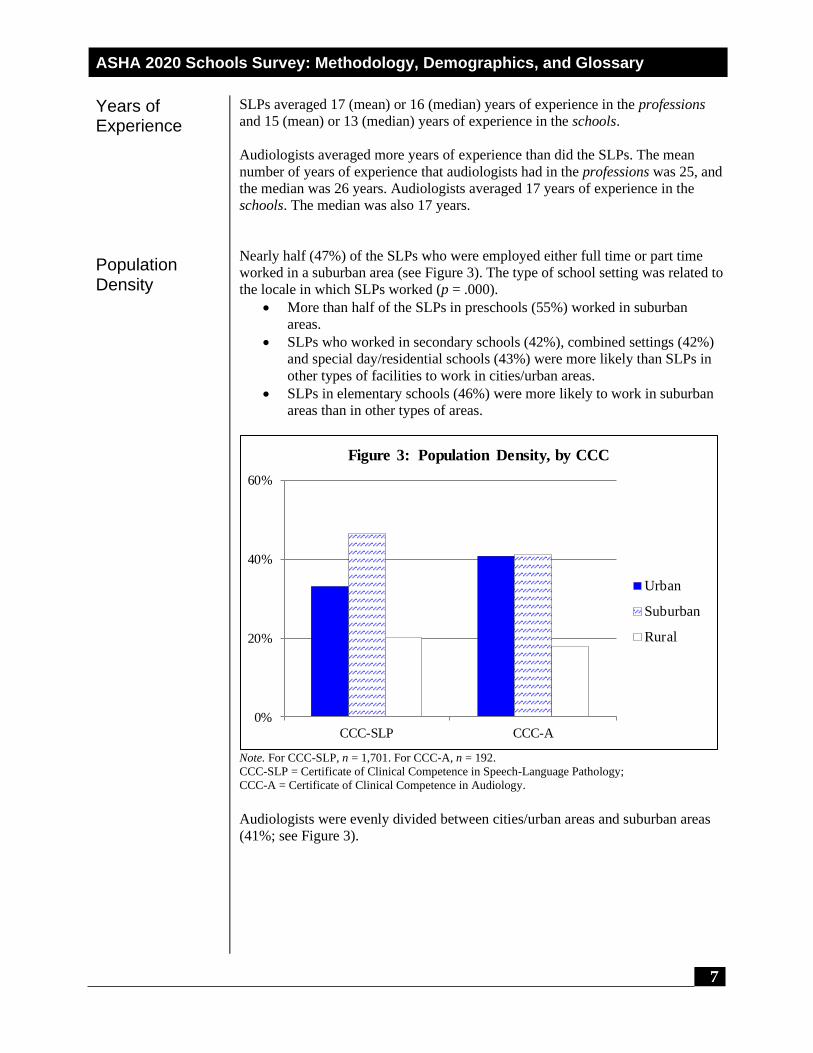
Nearly half (47%) of the SLPs who were employed either full time or part time
worked in a suburban area (see Figure 3). The type of school setting was related to
the locale in which SLPs worked (p = .000).
• More than half of the SLPs in preschools (55%) worked in suburban
areas.
• SLPs who worked in secondary schools (42%), combined settings (42%)
and special day/residential schools (43%) were more likely than SLPs in
other types of facilities to work in cities/urban areas.
• SLPs in elementary schools (46%) were more likely to work in suburban
areas than in other types of areas.
0%
20%
40%
60%
CCC-SLP CCC-A
Figure 3: Population Density, by CCC
Urban
Suburban
Rural
Note. For CCC-SLP, n = 1,701. For CCC-A, n = 192.
CCC-SLP = Certificate of Clinical Competence in Speech-Language Pathology;
CCC-A = Certificate of Clinical Competence in Audiology. Audiologists were evenly divided between cities/urban areas and suburban areas
(41%; see Figure 3).
ASHA 2020 Schools Survey: Methodology, Demographics, and Glossary
8
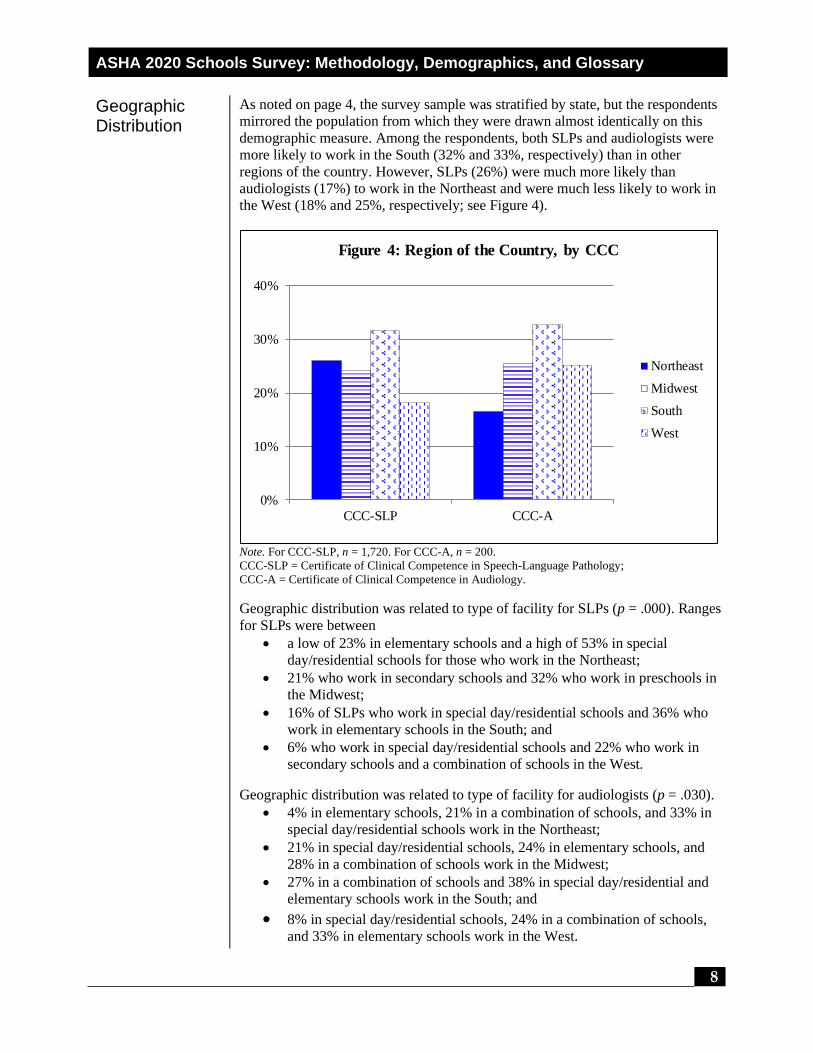
Geographic Distribution
As noted on page 4, the survey sample was stratified by state, but the respondents
mirrored the population from which they were drawn almost identically on this
demographic measure. Among the respondents, both SLPs and audiologists were
more likely to work in the South (32% and 33%, respectively) than in other
regions of the country. However, SLPs (26%) were much more likely than
audiologists (17%) to work in the Northeast and were much less likely to work in
the West (18% and 25%, respectively; see Figure 4).
0%
10%
20%
30%
40%
CCC-SLP CCC-A
Figure 4: Region of the Country, by CCC
Northeast
Midwest
South
West
Note. For CCC-SLP, n = 1,720. For CCC-A, n = 200.
CCC-SLP = Certificate of Clinical Competence in Speech-Language Pathology;
CCC-A = Certificate of Clinical Competence in Audiology.
Geographic distribution was related to type of facility for SLPs (p = .000). Ranges
for SLPs were between
• a low of 23% in elementary schools and a high of 53% in special
day/residential schools for those who work in the Northeast;
• 21% who work in secondary schools and 32% who work in preschools in
the Midwest;
• 16% of SLPs who work in special day/residential schools and 36% who
work in elementary schools in the South; and
• 6% who work in special day/residential schools and 22% who work in
secondary schools and a combination of schools in the West.
Geographic distribution was related to type of facility for audiologists (p = .030).
• 4% in elementary schools, 21% in a combination of schools, and 33% in
special day/residential schools work in the Northeast;
• 21% in special day/residential schools, 24% in elementary schools, and
28% in a combination of schools work in the Midwest;
• 27% in a combination of schools and 38% in special day/residential and
elementary schools work in the South; and
• 8% in special day/residential schools, 24% in a combination of schools,
and 33% in elementary schools work in the West.
ASHA 2020 Schools Survey: Methodology, Demographics, and Glossary
9
Reports
SuggestedCitation
Resources
Thank You!
Additional Information
Results from the 2020 Schools Survey are presented in a series of reports for
SLPs:
• SLP Caseload and Workload Characteristics
• SLP Workforce and Work Conditions
• SLP Annual Salaries and Hourly Wages
• Survey Summary Report: Numbers and Types of Responses, SLPs
• Survey Methodology, Respondent Demographics, and Glossary
Results from the educational audiologists are presented in a separate report:
Survey Summary Report: Numbers and Types of Responses, Educational
Audiologists.
American Speech-Language-Hearing Association. (2020). 2020 Schools Survey
report: Survey methodology, respondent demographics, and glossary.
www.asha.org/research/memberdata/schools-survey/
Agresti, A., & Finlay, B. (1986). Statistical methods for the social sciences (2nd
ed.). Dellen.
Dillman, D. A. (2000). Mail and Internet surveys: The tailored design method
(2nd ed.). Wiley.
ASHA would like to thank the SLPs and audiologists who completed the 2020
Schools Survey. Reports like this one are possible only because people like you
participate.
Is this information valuable to you? If so, please accept invitations to participate
in other ASHA-sponsored surveys and focus groups. You are the experts, and we
rely on you to provide data to share with your fellow members. ASHA surveys
benefit you.
If you would like to speak with a member of the ASHA School Services Team
about the survey, please send a message to [email protected] or call ASHA’s
Action Center (800-498-2071) and ask to be connected to a School Services staff
member. To learn more about how the Association is working on behalf of school-
based ASHA Certified Members, visit the ASHA Schools webpages at
www.asha.org/slp/schools/.
ASHA 2020 Schools Survey: Methodology, Demographics, and Glossary
10
Glossary
Types of Facilities
Random Sample
Response Rate
The following is a glossary of terms used in the 2020 Schools Survey reports.
School: Special day/residential
Pre-elementary (preschool)
Elementary
Secondary school (middle school, junior high, senior high)
Student’s home
Administrative office
Combination from the above list
Other
Respondents self-identified their primary employment facility as one of the
following types of schools: special day/residential; pre-elementary (preschool);
elementary; secondary (middle school, junior high, senior high); student’s home;
administrative office; combination from the above list; or other. Individuals from
the other category are included when total responses are discussed, but they are
not presented as a separate type of facility because their numbers were fairly small
(16 SLPs and five audiologists) and because of the uncertain nature of the
category.
A stratified sample of 4,500 ASHA-certified SLPs and 500 ASHA-certified
audiologists was randomly selected to participate in this survey. A random sample
is a probabilistic sample in which each person has an equal chance of being
selected. A sample is stratified when the population is divided into separate groups
(i.e., strata), and a random sample is drawn from each stratum. In this survey,
there were 51 strata: the 50 U.S. states plus the District of Columbia.
The response rate was calculated using the following equation:
RR = (C + P)
(S + ID) – (Ret + I)
where RR = Response rate
C = Number of completed surveys
P = Number of partial surveys
S = Sample size
ID = Ripped off identification number
Ret = Ineligible because of retirement
I = Ineligible for other reasons (e.g., does not work in a
school, is no longer in the discipline)
RR = 1,987 = 40.3%
(5,000 + 1) – (17 + 54)
ASHA 2020 Schools Survey: Methodology, Demographics, and Glossary
11
Measures of Central Tendency
Statistical Significance
Mean: To find the mean, add the total of all the values, and divide by n
(the number of items).
Median: To find the median, arrange the values in order, from lowest to
highest. Then, select the value in the middle position.
Mode: The mode is the value that occurs more often than any other.
Example: Sample data set
1, 1, 7, 34, 88
Mean: (1 + 1 + 7 + 34 + 88) / 5 = 26.2
Median: 7
Mode: 1
The statistic that is reported most often in the 2020 Schools Survey is the median
(middle) statistic unless otherwise noted. Median statistics are presented because
they are more stable and less sensitive to extreme values than are mean values.
p value refers to probability. It is found in expressions such as p = .04, meaning
“There is a 4% chance of observing a difference as large as the one that you
observed even if the two population means are identical (the null hypothesis is
true).” The smaller the number, the less likely that the result was due to chance.
A z-score (also known as a standard score) indicates how many standard
deviations a score is from the mean.

ASHA 2020 Schools Survey: Methodology, Demographics, and Glossary
12
Appendix A
First Cover Letter to Audiologists
ASHA 2020 Schools Survey: Methodology, Demographics, and Glossary
13
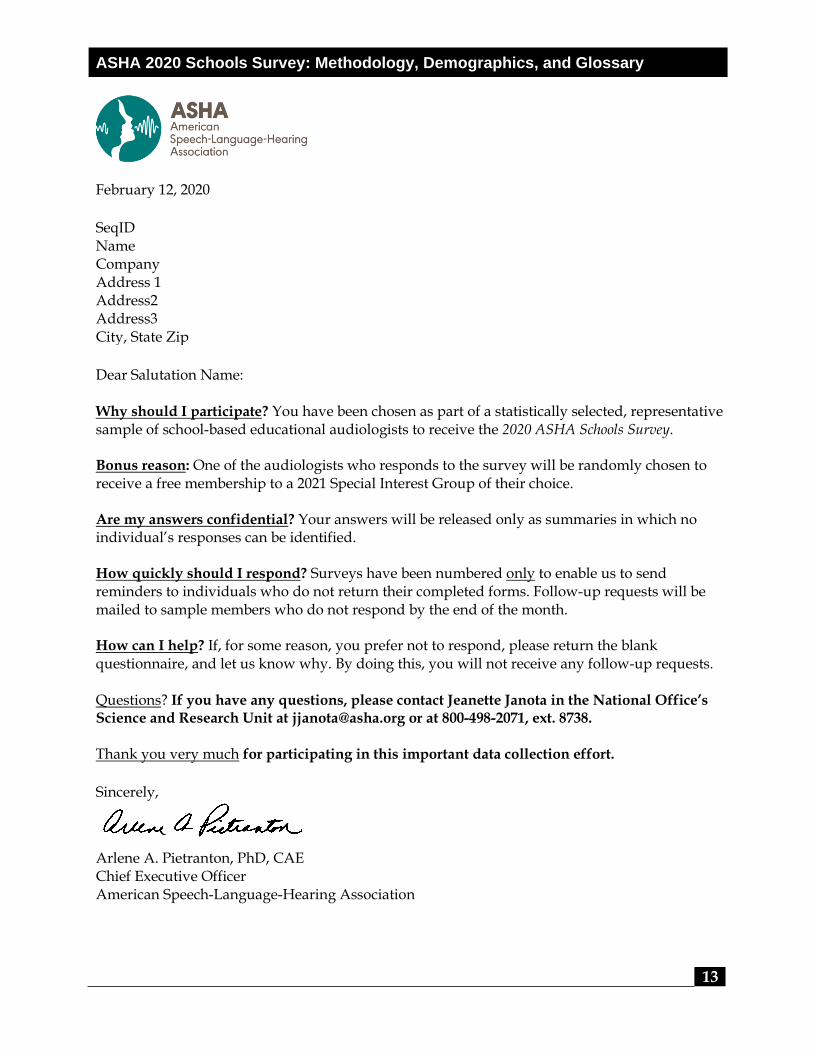
February 12, 2020
SeqID Name Company Address 1 Address2 Address3 City, State Zip
Dear Salutation Name: Why should I participate? You have been chosen as part of a statistically selected, representative sample of school-based educational audiologists to receive the 2020 ASHA Schools Survey. Bonus reason: One of the audiologists who responds to the survey will be randomly chosen to receive a free membership to a 2021 Special Interest Group of their choice. Are my answers confidential? Your answers will be released only as summaries in which no individual’s responses can be identified. How quickly should I respond? Surveys have been numbered only to enable us to send reminders to individuals who do not return their completed forms. Follow-up requests will be mailed to sample members who do not respond by the end of the month. How can I help? If, for some reason, you prefer not to respond, please return the blank questionnaire, and let us know why. By doing this, you will not receive any follow-up requests. Questions? If you have any questions, please contact Jeanette Janota in the National Office’s Science and Research Unit at [email protected] or at 800-498-2071, ext. 8738. Thank you very much for participating in this important data collection effort.
Sincerely,
Arlene A. Pietranton, PhD, CAE Chief Executive Officer American Speech-Language-Hearing Association
ASHA 2020 Schools Survey: Methodology, Demographics, and Glossary
14
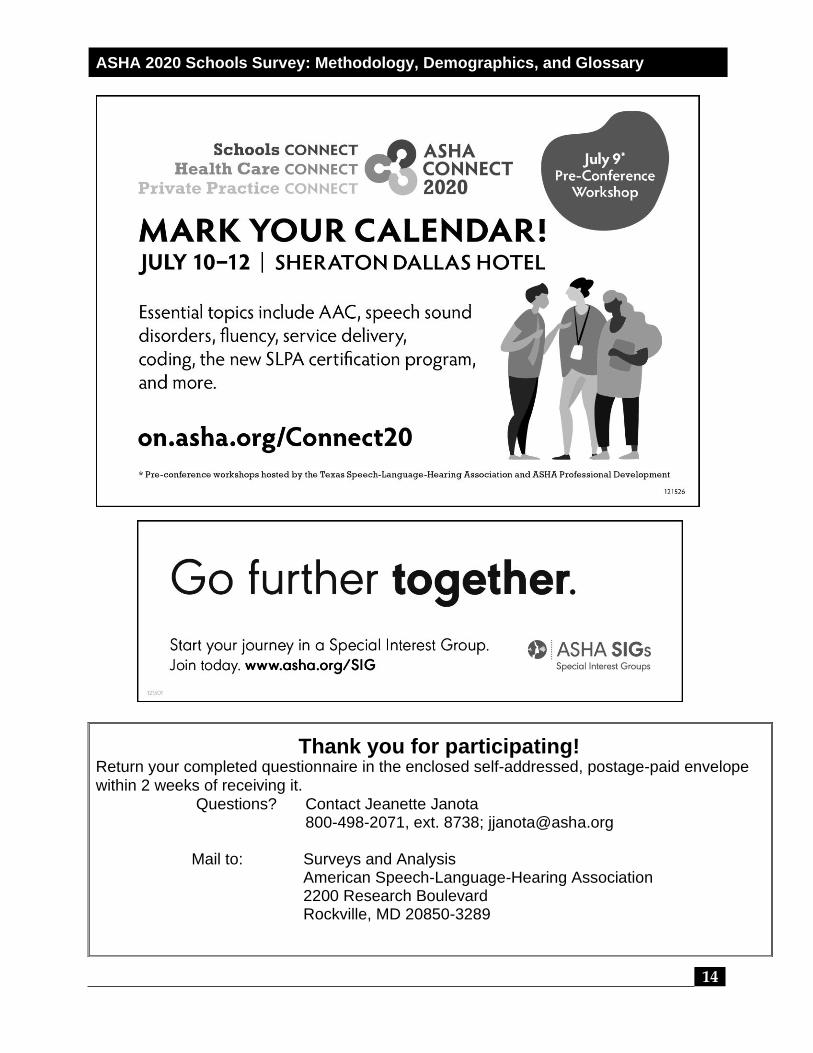
Thank you for participating! Return your completed questionnaire in the enclosed self-addressed, postage-paid envelope within 2 weeks of receiving it.
Questions? Contact Jeanette Janota 800-498-2071, ext. 8738; [email protected]
Mail to: Surveys and Analysis American Speech-Language-Hearing Association 2200 Research Boulevard Rockville, MD 20850-3289
ASHA 2020 Schools Survey: Methodology, Demographics, and Glossary
15
Appendix B
States by Regions and Divisions
ASHA 2020 Schools Survey: Methodology, Demographics, and Glossary
9/2/20 16
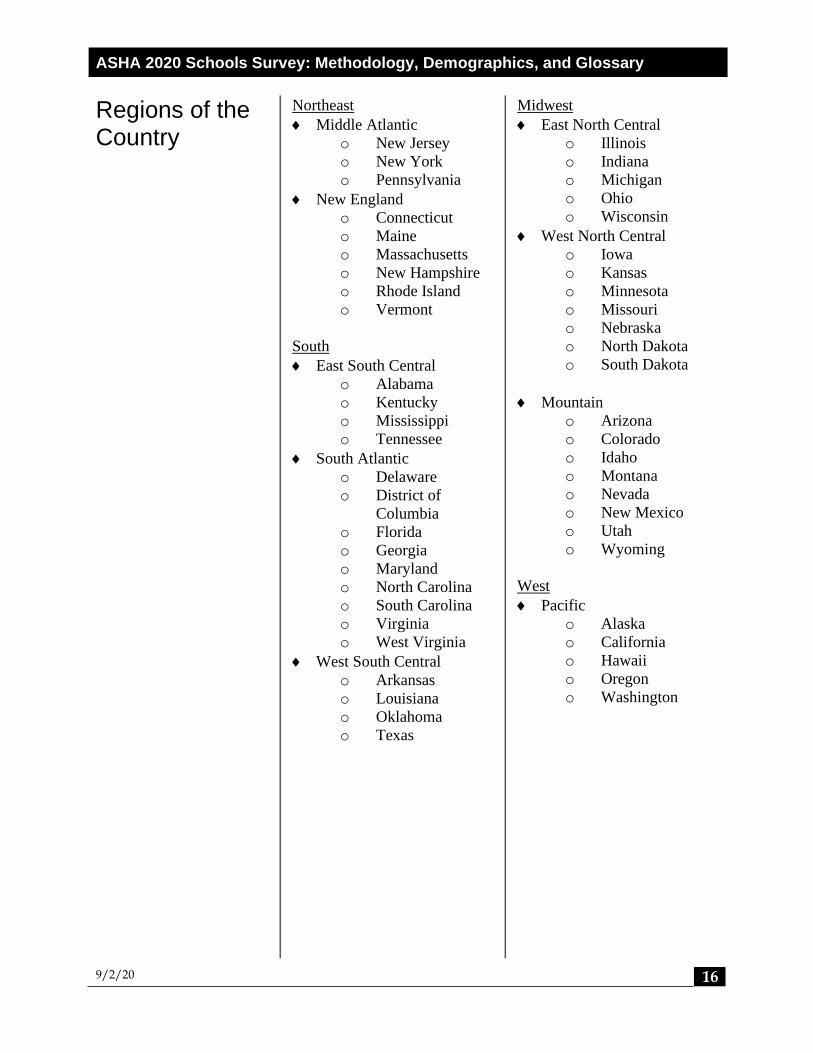
Regions of the Country
Northeast
Middle Atlantic
o New Jersey
o New York
o Pennsylvania
New England
o Connecticut
o Maine
o Massachusetts
o New Hampshire
o Rhode Island
o Vermont
South
East South Central
o Alabama
o Kentucky
o Mississippi
o Tennessee
South Atlantic
o Delaware
o District of
Columbia
o Florida
o Georgia
o Maryland
o North Carolina
o South Carolina
o Virginia
o West Virginia
West South Central
o Arkansas
o Louisiana
o Oklahoma
o Texas
Midwest
East North Central
o Illinois
o Indiana
o Michigan
o Ohio
o Wisconsin
West North Central
o Iowa
o Kansas
o Minnesota
o Missouri
o Nebraska
o North Dakota
o South Dakota
Mountain
o Arizona
o Colorado
o Idaho
o Montana
o Nevada
o New Mexico
o Utah
o Wyoming
West
Pacific
o Alaska
o California
o Hawaii
o Oregon
o Washington