2020 Preventive Services Report Addendum
77
2020 Preventive Services Report Addendum Managed Care Quality and Monitoring Division California Department of Health Care Services February 2021 Property of the California Department of Health Care Services
Transcript of 2020 Preventive Services Report Addendum

2020 Preventive Services Report Addendum
Managed Care Quality and Monitoring Division California Department of Health Care Services
February 2021
Property of the California Department of Health Care Services

2020 Preventive Services Report Addendum
2020 Preventive Services Report Addendum Page i Property of the California Department of Health Care Services Health Services Advisory Group, Inc.
Table of Contents
Commonly Used Abbreviations and Acronyms............................................................... iii 1. Preventive Services Report Addendum .......................................................................1
Overview ............................................................................................................................1 Blood Lead Screening Analysis ....................................................................................1 Overall Findings and Conclusions.................................................................................2
Blood Lead Screening Statewide Results ........................................................................5 Blood Lead Screening—12 Months of Age ..................................................................5 Blood Lead Screening—24 Months of Age ..................................................................9 Blood Lead Screening—Two Tests by 24 Months of Age .........................................13 Blood Lead Screening—Catch-Up Test by 6 Years of Age.......................................17 Lead Screening in Children .........................................................................................22 County Quintiles ...........................................................................................................26
Blood Lead Screening MCP Reporting Unit Results .....................................................30 Blood Lead Screening—12 Months of Age ................................................................30 Blood Lead Screening—24 Months of Age ................................................................33 Blood Lead Screening—Two Tests by 24 Months of Age .........................................36 Blood Lead Screening—Catch-Up Test by 6 Years of Age.......................................39 Lead Screening in Children .........................................................................................42
HSAG-Calculated Indicators MCP Reporting Unit Results ...........................................44 Well-Child Visits in the First 30 Months of Life—Well-Child Visits in the First 15 Months—Six or More Well-Child Visits .......................................................................44 Well-Child Visits in the First 30 Months of Life—Well-Child Visits for Age 15 to 30 Months—Two or More Well-Child Visits .....................................................................48 Child and Adolescent Well-Care Visits .......................................................................51 Alcohol Use Screening ................................................................................................63 Dental Fluoride Varnish ...............................................................................................66 Tobacco Use Screening ..............................................................................................69
Caveats and Limitations ..................................................................................................72 Blood Lead Screening Indicator Calculation ..............................................................72 Data Run Out ...............................................................................................................72
Regional County Determination Legend for Reference.................................................73

TABLE OF CONTENTS
2020 Preventive Services Report Addendum Page ii Property of the California Department of Health Care Services Health Services Advisory Group, Inc.
Table of Tables Table 1.1—Blood Lead Screening—12 Months of Age (BLS–1)—
Statewide Results .................................................................................................5 Table 1.2—Blood Lead Screening—24 Months of Age (BLS–2)—
Statewide Results .................................................................................................9 Table 1.3—Blood Lead Screening—Two Tests by 24 Months of Age (BLS–1 and 2)—
Statewide Results ...............................................................................................13 Table 1.4—Blood Lead Screening—Catch-Up Test by 6 Years of Age (BLS–316)—
Statewide Results ...............................................................................................18 Table 1.5—Lead Screening in Children (LSC)—Statewide Results ...................................22 Table 1.6—Statewide Performance Quintile Thresholds ....................................................26 Table 1.7—Blood Lead Screening—Statewide Performance Quintile Comparisons ........27 Table 1.8—Blood Lead Screening—12 Months of Age (BLS–1)—
MCP Reporting Unit-Level Results ....................................................................30 Table 1.9—Blood Lead Screening—24 Months of Age (BLS–2)—
MCP Reporting Unit-Level Results...................................................................33 Table 1.10—Blood Lead Screening—Two Tests by 24 Months of Age (BLS–1 and 2)—
MCP Reporting Unit-Level Results ....................................................................36 Table 1.11—Blood Lead Screening—Catch-Up Test by 6 Years of Age (BLS–316)—
MCP Reporting Unit-Level Results ....................................................................39 Table 1.12—Lead Screening in Children (LSC)—
MCP Reporting Unit-Level Results ....................................................................42 Table 1.13—Well-Child Visits in the First 30 Months of Life—Well-Child Visits in the First
15 Months—Six or More Well-Child Visits (W30–6)—MCP Reporting Unit-Level Results ......................................................................................................45
Table 1.14—Well-Child Visits in the First 30 Months of Life—Well-Child Visits for Age 15 to 30 Months—Two or More Well-Child Visits (W30–2)—MCP Reporting Unit-Level Results ......................................................................................................48
Table 1.15—Child and Adolescent Well-Care Visits—3 to 6 Years (WCV–36)— MCP Reporting-Unit Level Results ....................................................................51
Table 1.16—Child and Adolescent Well-Care Visits—7 to 11 Years (WCV–711)— MCP Reporting-Unit Level Results ....................................................................54
Table 1.17—Child and Adolescent Well-Care Visits—12 to 21 Years (WCV–1221)— MCP Reporting-Unit Level Results ....................................................................57
Table 1.18—Child and Adolescent Well-Care Visits—Total (WCV–Tot)— MCP Reporting Unit-Level Results ....................................................................60
Table 1.19—Alcohol Use Screening (AUS)—MCP Reporting Unit-Level Results.............63 Table 1.20—Dental Fluoride Varnish (DFV)—MCP Reporting Unit-Level Results............66 Table 1.21—Tobacco Use Screening (TUS)—MCP Reporting Unit-Level Results...........69

TABLE OF CONTENTS
2020 Preventive Services Report Addendum Page iii Property of the California Department of Health Care Services Health Services Advisory Group, Inc.
Commonly Used Abbreviations and Acronyms Following is a list of abbreviations and acronyms used throughout this report.
♦ AUS—Alcohol Use Screening ♦ BLS—Blood Lead Screening ♦ CDPH—California Department of Public Health ♦ CDT—Code on Dental Procedures and Nomenclature ♦ CPT—Current Procedural Terminology ♦ DFV—Dental Fluoride Varnish ♦ DHCS—California Department of Health Care Services ♦ EHR—electronic health record ♦ EQR—external quality review ♦ FFS—fee-for-service ♦ HEDIS®—Healthcare Effectiveness Data and Information Set1 ♦ HIPAA—Health Insurance Portability and Accountability Act of 1996 ♦ HSAG—Health Services Advisory Group, Inc. ♦ LSC—Lead Screening in Children ♦ MCAS—Managed Care Accountability Set ♦ MCP—managed care health plan ♦ MRR—medical record review ♦ NA—small denominator or suppressed rate ♦ NCQA—National Committee for Quality Assurance ♦ OB/GYN—obstetrician/gynecologist ♦ PCP—primary care provider ♦ RASSCLE—Response and Surveillance System for Childhood Lead Exposures ♦ S—suppressed rate (i.e., small numerator) ♦ TUS—Tobacco Use Screening ♦ WCV—Child and Adolescent Well-Care Visits ♦ W30—Well-Child Visits in the First 30 Months of Life
1 HEDIS® is a registered trademark of the National Committee for Quality Assurance (NCQA).
2020 Preventive Services Report Addendum
2020 Preventive Services Report Addendum Page 1 Property of the California Department of Health Care Services Health Services Advisory Group, Inc.
1. Preventive Services Report Addendum
Overview The California Department of Health Care Services (DHCS) contracted with Health Services Advisory Group, Inc. (HSAG), to develop this Addendum to the 2020 Preventive Services Report published in December 2020. This Addendum presents the DHCS-calculated Blood Lead Screening (BLS) rates, which were calculated in accordance with California Title 17 requirements2 as well as following the national Medicaid Healthcare Effectiveness Data and Information Set (HEDIS) technical specifications. Please note, DHCS performed all BLS analyses presented in this Addendum.
This Addendum also presents the managed care health plan (MCP) reporting unit-level results for the six HSAG-calculated indicators (Well-Child Visits in the First 30 Months of Life—Well-Child Visits in the First 15 Months—Six or More Well-Child Visits, Well-Child Visits in the First 30 Months of Life—Well-Child Visits for Age 15 to 30 Months—Two or More Well-Child Visits, Child and Adolescent Well-Care Visits—Total, Alcohol Use Screening, Dental Fluoride Varnish, and Tobacco Use Screening) included in the 2020 Preventive Services Report. MCP reporting unit-level rates for Medi-Cal Managed Care Accountability Set (MCAS) measures that the MCPs are responsible for reporting annually, such as Chlamydia Screening in Women—16 to 20 Years, Developmental Screening in the First Three Years of Life—Total, and Screening for Depression and Follow-Up Plan will be available in the 2019–20 External Quality Review (EQR) Technical Report released in April 2021.
Blood Lead Screening Analysis
This Addendum reports rates for five BLS indicators for reporting year 2020/measurement year 2019. The indicators measure the percentage of children who have had one or more blood tests for lead poisoning, for children who turned 12 months, 24 months, or 6 years old during the measurement year. Statewide and Medi-Cal MCP reporting unit rates are reported. Statewide rates are reported by racial/ethnic, primary language, gender, delivery type model, population density, and county-level stratifications. Continuous enrollment criteria for statewide rates are based on Medi-Cal enrollment. Continuous enrollment criteria for MCP reporting unit rates are based on plan-specific enrollment.
♦ California Title 17 Indicators ■ Blood Lead Screening—Test at 12 Months of Age (BLS–1)—Individuals who turned 1
year old during the measurement year, who had a screening within six months (before and after) their first birthday. Individuals must be continuously enrolled for 12 months (six months before and six months after first birthday) with no more than one gap in enrollment during the 12-month period where the gap is no longer than one month.
2 Title 17, California Code of Regulations Section 37100 (b)(2)
PREVENTIVE SERVICES REPORT ADDENDUM
2020 Preventive Services Report Addendum Page 2 Property of the California Department of Health Care Services Health Services Advisory Group, Inc.
■ Blood Lead Screening—Test at 24 Months of Age (BLS–2)—Individuals who turned 2 years old during the measurement year, who had a screening within six months (before and after) their second birthday. Individuals must be continuously enrolled for 12 months (six months before and six months after the second birthday) with no more than one gap in enrollment during the 12-month period where the gap is no longer than one month.
■ Blood Lead Screening—Two Tests by 24 Months of Age (BLS–1 and 2)—Individuals who turned 2 years old during the measurement year, who had a screening within six months (before and after) their second birthday and also had a screening within six months (before and after) their first birthday. Individuals must be continuously enrolled for 24 months (18 months before and six months after the second birthday) with no more than one gap in enrollment during the 24-month period where the gap is no longer than one month.
■ Blood Lead Screening—Catch-Up Test by 6 Years of Age (BLS–316)—Individuals who turned 6 years old during the measurement year who were not screened at 1 or 2 years of age, to determine if they were screened between 31 months old and their sixth birthday. Individuals must be continuously enrolled for 12 months prior to their sixth birthday with no more than one gap in enrollment during the 12-month period where the gap is no longer than one month. Exclusion of individuals who had at least one lead blood test prior to 31 months of age. (Note: For this measure, DHCS assessed claims for Current Procedural Terminology [CPT] codes 83655 [lead blood test] and Z0334 [counseling and blood draw]; Z0334 was retired May 1, 2018).
♦ HEDIS ■ Lead Screening in Children (LSC)—Individuals who turned 2 years old during the
measurement year who had a screening by their second birthday. Individuals must be enrolled on their second birthday and continuously enrolled for 12 months prior to their second birthday (with no more than one gap in enrollment during the 12-month period where the gap is no longer than one month). The LSC indicator aligns with DHCS’ value-based payment program specifications, which are based on the specifications for the HEDIS Lead Screening in Children measure. The LSC indicator does not meet California regulatory requirements; for those specifications, see the California Title 17 indicators listed above.
Overall Findings and Conclusions
♦ The majority of children in Medi-Cal managed care get blood lead screenings by their second birthday. ■ Statewide performance of children in Medi-Cal managed care, based on the HEDIS
Lead Screening in Children (LSC) indicator, found that approximately 60.8 percent of children who turned 2 years of age during calendar year 2019 received a blood lead screening before their second birthday. ○ Although the majority of children receive a lead screening, California has an
opportunity to improve. The national Medicaid benchmark for the HEDIS LSC indicator is 73.1 percent and represents the 50th percentile. California’s statewide

PREVENTIVE SERVICES REPORT ADDENDUM
2020 Preventive Services Report Addendum Page 3 Property of the California Department of Health Care Services Health Services Advisory Group, Inc.
aggregate rate of 60.8 percent is below the national benchmark, with varying rates of performance across counties and regions throughout the State.
○ Seven counties (Imperial, Monterey, Madera, Marin, Humboldt, Santa Cruz, and San Francisco) performed above the HEDIS benchmark, and all other counties were below the national benchmark.
■ Statewide performance of children in Medi-Cal managed care using Title 17 age-stratified indicators varies and reflects opportunity for improvement: ○ 53.3 percent of children who turned 1 year of age during calendar year 2019 were
screened within six months of their first birthday. ○ 43.4 percent of children who turned 2 years of age during calendar year 2019 were
screened within six months of their second birthday. ○ 30.5 percent of children who turned 2 years of age during calendar year 2019 had
been screened within six months of their first and second birthdays (received two screenings).
○ 37.0 percent of children who turned 6 years of age during calendar year 2019, and had not been screened before 31 months of age, had been screened between 31 months of age and their sixth birthday (catch-up screening).
♦ Statewide performance varies based on race/ethnicity and primary language. ■ Asian and Hispanic/Latino racial/ethnic groups had the highest screening rates, which
were consistently higher than statewide aggregate rates by more than a 10 percent relative difference.
■ Screening rates for Black/African Americans, American Indian/Alaska Native, Native Hawaiian/Other Pacific Islander, and White groups were consistently below statewide aggregate rates by more than a 10 percent relative difference, with Black/African Americans having the lowest screening rates.
■ Chinese, Spanish, and Arabic primary language groups had the highest screening rates, which were consistently higher than statewide aggregate rates, by more than a 10 percent relative difference. Hmong, Vietnamese, Farsi, Cambodian, Tagalog, and Other primary language groups’ screening rates were generally higher than the statewide aggregate rates.
■ Rates for Korean, English, and Russian primary language groups were consistently below statewide aggregate rates by more than a 10 percent relative difference. ○ Armenian, Korean, and English primary language group rates for children who
turned 6 years of age during calendar year 2019, and had not been screened before 31 months of age, were below the statewide aggregate rates by more than a 10 percent relative difference.
♦ No performance differences were noted between males and females. ♦ Statewide performance for rural versus urban regions varied by indicator.
■ Rates for rural regions were higher than rates for urban regions for the 12 months, 24 months, and two by 24 months indicators (by a 3.0, 5.4, and 8.8 percent relative difference, respectively).

PREVENTIVE SERVICES REPORT ADDENDUM
2020 Preventive Services Report Addendum Page 4 Property of the California Department of Health Care Services Health Services Advisory Group, Inc.
■ Rates for rural regions for children who turned 6 years of age during calendar year 2019, and had not been screened before 31 months of age, were below rates for urban regions by a 23 percent relative difference and were below the statewide aggregate rate by more than a 10 percent relative difference.
♦ Blood lead screening performance is regional. ■ The highest performance was seen in Imperial, Marin, Humboldt, and San Francisco
counties, with the highest rates across all indicators. ■ The lowest performance was seen in the Far North and Sierra Range/Foothills regions,
with 11 counties (Nevada, Placer, El Dorado, Mariposa, Alpine, Shasta, Siskiyou, Plumas, Inyo, Sierra, and Mono) in the lowest performance quintile across most/all indicators.
■ Rates for children residing in 26 of 58 counties (45 percent) were above the statewide aggregate rate for the LSC indicator, and consistently above the statewide aggregate rate (60.81 percent) by more than a 10 percent relative difference across most/all BLS indicators. These counties were in regions spread across the State: Bay Area, Central Coast, Central Valley, North Coast, Sacramento Valley, and Southern California.
■ Rates for children residing in 15 of 58 (26 percent) Far North and Sierra Range/Foothills counties were consistently below the statewide aggregate rate by more than a 10 percent relative difference across most/all BLS indicators.
■ Screening rates for children who turned 6 years of age during calendar year 2019, and had not been screened before 31 months of age, were below the statewide aggregate rate by more than a 10 percent relative difference in 40 of the 58 (69 percent) California counties.

PREVENTIVE SERVICES REPORT ADDENDUM
2020 Preventive Services Report Addendum Page 5 Property of the California Department of Health Care Services Health Services Advisory Group, Inc.
Blood Lead Screening Statewide Results
Blood Lead Screening—12 Months of Age
Individuals who turned 1 year old during the measurement year, who had a screening within six months (before and after) their first birthday. Individuals must be continuously enrolled for 12 months (six months before and six months after first birthday) with no more than one gap in enrollment during the 12-month period where the gap is no longer than one month.
Table 1.1—Blood Lead Screening—12 Months of Age (BLS–1)—Statewide Results NA indicates the rate had a small denominator (i.e., less than 30). S indicates fewer than 11 cases exist in the numerator; therefore, HSAG suppresses displaying the rate in this report to satisfy the Health Insurance Portability and Accountability Act of 1996 (HIPAA) Privacy Rule’s de-identification standard.
Stratification Rate
Statewide Aggregate
Statewide Aggregate 53.25% Race/Ethnicity American Indian or Alaska Native 40.31%
Asian 60.36% Black or African American 35.12%
Hispanic or Latino 58.84% Native Hawaiian or Other Pacific Islander 43.22% White 43.72%
Other 50.19% Unknown/Missing 47.69% Primary Language
Arabic 69.51% Armenian 54.21%
Cambodian 59.72% Chinese 76.16% English 47.83%
Farsi 60.65% Hmong 62.92%

PREVENTIVE SERVICES REPORT ADDENDUM
2020 Preventive Services Report Addendum Page 6 Property of the California Department of Health Care Services Health Services Advisory Group, Inc.
Stratification Rate
Korean 52.32%
Russian 44.96% Spanish 68.24%
Tagalog 59.42% Vietnamese 61.97% Other 59.38%
Unknown/Missing 46.88% Gender Female 53.32%
Male 53.19% Delivery Type Model
County Organized Health Systems 58.86% Geographic Managed Care 51.20% Two-Plan (Local Initiative or Commercial Plan) 51.98%
Regional 43.86% Population Density Rural 54.69%
Urban 53.08% County
Alameda 50.82% Alpine NA Amador 45.74%
Butte 50.88% Calaveras 43.03% Colusa 57.87%
Contra Costa 44.30% Del Norte 44.63%
El Dorado 24.29% Fresno 52.55%

PREVENTIVE SERVICES REPORT ADDENDUM
2020 Preventive Services Report Addendum Page 7 Property of the California Department of Health Care Services Health Services Advisory Group, Inc.
Stratification Rate
Glenn 71.25%
Humboldt 72.07% Imperial 76.27%
Inyo 13.13% Kern 59.23% Kings 64.65%
Lake 24.42% Lassen 44.52% Los Angeles 54.06%
Madera 71.37% Marin 73.97%
Mariposa 25.29% Mendocino 65.52% Merced 49.17%
Modoc 38.18% Mono S Monterey 78.74%
Napa 51.00% Nevada 38.37%
Orange 61.72% Placer 30.73% Plumas 12.77%
Riverside 45.37% Sacramento 36.48% San Benito 62.17%
San Bernardino 46.73% San Diego 62.16%
San Francisco 69.41% San Joaquin 43.31%

PREVENTIVE SERVICES REPORT ADDENDUM
2020 Preventive Services Report Addendum Page 8 Property of the California Department of Health Care Services Health Services Advisory Group, Inc.
Stratification Rate
San Luis Obispo 46.65%
San Mateo 67.00% Santa Barbara 61.73%
Santa Clara 54.82% Santa Cruz 73.28% Shasta 15.95%
Sierra NA Siskiyou 18.84% Solano 47.33%
Sonoma 35.40% Stanislaus 36.74%
Sutter 48.20% Tehama 70.06% Trinity 48.05%
Tulare 64.75% Tuolumne 59.12% Ventura 62.79%
Yolo 60.79% Yuba 40.07%
Compared to the statewide aggregate rate of 53.25 percent for the Test at 12 Months of Age (BLS–1) indicator:
♦ The rates for the following racial/ethnic groups were below the statewide aggregate rate by more than a 10 percent relative difference: ■ American Indian or Alaska Native (40.31 percent) ■ Black or African American (35.12 percent) ■ Native Hawaiian or Other Pacific Islander (43.22 percent) ■ White (43.72 percent)
♦ The rates for the following primary language groups were below the statewide aggregate rate by more than a 10 percent relative difference: ■ English (47.83 percent) ■ Russian (44.96 percent)

PREVENTIVE SERVICES REPORT ADDENDUM
2020 Preventive Services Report Addendum Page 9 Property of the California Department of Health Care Services Health Services Advisory Group, Inc.
♦ The rates for males and females were similar. ♦ The rate for the Regional delivery type model (43.86 percent) was below the statewide
aggregate rate by more than a 10 percent relative difference. ♦ The rate for the rural regions was above the rate for the urban regions by a 3.0 percent
relative difference. ♦ The top five performing counties were Monterey, Imperial, Marin, Santa Cruz, and
Humboldt. ♦ The bottom five performing counties were El Dorado, Siskiyou, Shasta, Inyo, and Plumas.
Blood Lead Screening—24 Months of Age
Individuals who turned 2 years old during the measurement year, who had a screening within six months (before and after) their second birthday. Individuals must be continuously enrolled for 12 months (six months before and six months after the second birthday) with no more than one gap in enrollment during the 12-month period where the gap is no longer than one month.
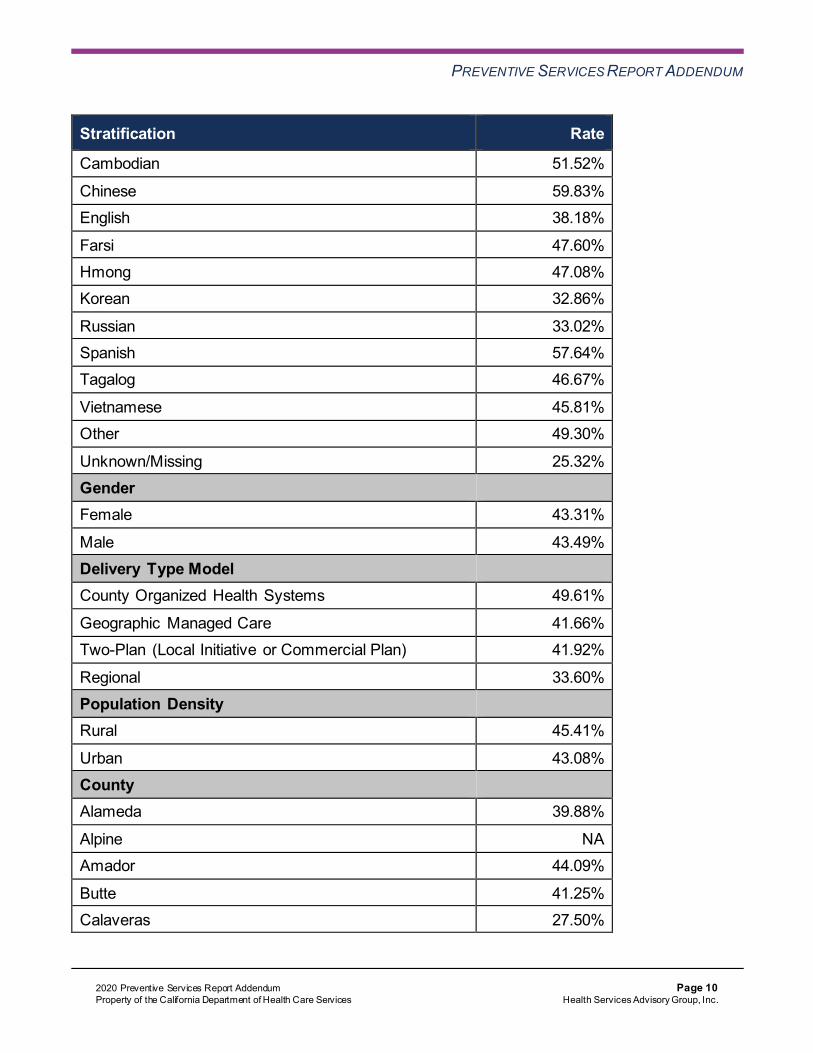
Table 1.2—Blood Lead Screening—24 Months of Age (BLS–2)—Statewide Results NA indicates the rate had a small denominator (i.e., less than 30). S indicates fewer than 11 cases exist in the numerator; therefore, HSAG suppresses displaying the rate in this report to satisfy the Health Insurance Portability and Accountability Act of 1996 (HIPAA) Privacy Rule’s de-identification standard.
Stratification Rate
Statewide Aggregate
Statewide Aggregate 43.40% Race/Ethnicity American Indian or Alaska Native 33.40%
Asian 46.43% Black or African American 29.23%
Hispanic or Latino 48.79% Native Hawaiian or Other Pacific Islander 28.27% White 33.61%
Other 39.91% Unknown/Missing 38.13% Primary Language
Arabic 52.73% Armenian 39.16%
PREVENTIVE SERVICES REPORT ADDENDUM
2020 Preventive Services Report Addendum Page 10 Property of the California Department of Health Care Services Health Services Advisory Group, Inc.
Stratification Rate
Cambodian 51.52%
Chinese 59.83% English 38.18%
Farsi 47.60% Hmong 47.08% Korean 32.86%
Russian 33.02% Spanish 57.64% Tagalog 46.67%
Vietnamese 45.81% Other 49.30%
Unknown/Missing 25.32% Gender Female 43.31%
Male 43.49% Delivery Type Model County Organized Health Systems 49.61%
Geographic Managed Care 41.66% Two-Plan (Local Initiative or Commercial Plan) 41.92%
Regional 33.60% Population Density Rural 45.41%
Urban 43.08% County Alameda 39.88%
Alpine NA Amador 44.09%
Butte 41.25% Calaveras 27.50%

PREVENTIVE SERVICES REPORT ADDENDUM
2020 Preventive Services Report Addendum Page 11 Property of the California Department of Health Care Services Health Services Advisory Group, Inc.
Stratification Rate
Colusa 52.63%
Contra Costa 27.69% Del Norte 29.03%
El Dorado 15.77% Fresno 47.75% Glenn 56.33%
Humboldt 57.82% Imperial 67.99% Inyo 12.82%
Kern 46.41% Kings 48.29%
Lake 24.25% Lassen 17.61% Los Angeles 43.41%
Madera 66.11% Marin 64.01% Mariposa 20.99%
Mendocino 59.57% Merced 41.32%
Modoc 22.03% Mono S Monterey 66.55%
Napa 44.53% Nevada 32.48% Orange 54.57%
Placer 21.50% Plumas 10.81%
Riverside 35.76% Sacramento 28.76%

PREVENTIVE SERVICES REPORT ADDENDUM
2020 Preventive Services Report Addendum Page 12 Property of the California Department of Health Care Services Health Services Advisory Group, Inc.
Stratification Rate
San Benito 47.09%
San Bernardino 37.84% San Diego 51.03%
San Francisco 55.84% San Joaquin 34.80% San Luis Obispo 38.49%
San Mateo 56.07% Santa Barbara 51.44% Santa Clara 43.25%
Santa Cruz 67.24% Shasta 13.58%
Sierra NA Siskiyou 12.06% Solano 32.32%
Sonoma 27.31% Stanislaus 30.18% Sutter 37.06%
Tehama 52.83% Trinity 34.78%
Tulare 53.94% Tuolumne 41.06% Ventura 51.68%
Yolo 48.31% Yuba 31.32%
Compared to the statewide aggregate rate of 43.40 percent for the Test at 24 Months of Age (BLS–2) indicator:
♦ The rates for the following racial/ethnic groups were below the statewide aggregate rate by more than a 10 percent relative difference: ■ American Indian or Alaska Native (33.40 percent) ■ Black or African American (29.23 percent)

PREVENTIVE SERVICES REPORT ADDENDUM
2020 Preventive Services Report Addendum Page 13 Property of the California Department of Health Care Services Health Services Advisory Group, Inc.
■ Native Hawaiian or Other Pacific Islander (28.27 percent) ■ White (33.61 percent)
♦ The rates for the following primary language groups were below the statewide aggregate rate by more than a 10 percent relative difference: ■ English (38.18 percent) ■ Korean (32.86 percent) ■ Russian (33.02 percent)
♦ The rates for males and females were similar. ♦ The rate for the Regional delivery type model (33.60 percent) was below the statewide
aggregate rate by more than a 10 percent relative difference. ♦ The rate for the rural regions was above the rate for the urban regions by a 5.4 percent
relative difference. ♦ The top five performing counties were Imperial, Santa Cruz, Monterey, Madera, and Marin. ♦ The bottom five performing counties were Shasta, Inyo, El Dorado, Siskiyou, and Plumas.
Blood Lead Screening—Two Tests by 24 Months of Age
Individuals who turned 2 years old during the measurement year, who had a screening within six months (before and after) their second birthday and also had a screening within six months (before and after) their first birthday. Individuals must be continuously enrolled for 24 months (18 months before and six months after the second birthday) with no more than one gap in enrollment during the 24-month period where the gap is no longer than one month.
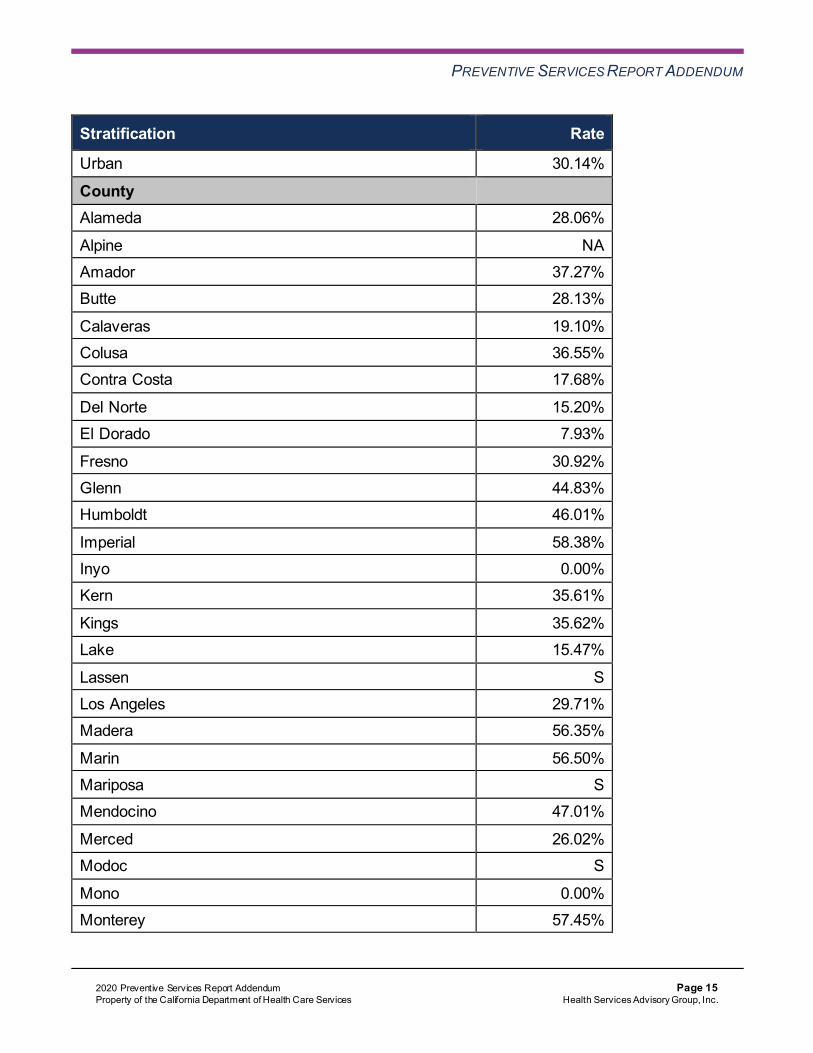
Table 1.3—Blood Lead Screening—Two Tests by 24 Months of Age (BLS–1 and 2)—Statewide Results NA indicates the rate had a small denominator (i.e., less than 30). S indicates fewer than 11 cases exist in the numerator; therefore, HSAG suppresses displaying the rate in this report to satisfy the Health Insurance Portability and Accountability Act of 1996 (HIPAA) Privacy Rule’s de-identification standard.
Stratification Rate
Statewide Aggregate Statewide Aggregate 30.51%
Race/Ethnicity American Indian or Alaska Native 20.50% Asian 34.98%
Black or African American 15.26% Hispanic or Latino 35.53%

PREVENTIVE SERVICES REPORT ADDENDUM
2020 Preventive Services Report Addendum Page 14 Property of the California Department of Health Care Services Health Services Advisory Group, Inc.
Stratification Rate
Native Hawaiian or Other Pacific Islander 15.81%
White 21.31% Other 27.28%
Unknown/Missing 25.41% Primary Language Arabic 40.09%
Armenian 28.57% Cambodian 32.76% Chinese 51.16%
English 24.72% Farsi 30.72%
Hmong 32.34% Korean 24.37% Russian 19.41%
Spanish 45.74% Tagalog 38.67% Vietnamese 35.44%
Other 33.44% Unknown/Missing 14.17%
Gender Female 30.52% Male 30.50%
Delivery Type Model County Organized Health Systems 38.82% Geographic Managed Care 28.05%
Two-Plan (Local Initiative or Commercial Plan) 28.45% Regional 20.66%
Population Density Rural 32.78%
PREVENTIVE SERVICES REPORT ADDENDUM
2020 Preventive Services Report Addendum Page 15 Property of the California Department of Health Care Services Health Services Advisory Group, Inc.
Stratification Rate
Urban 30.14%
County Alameda 28.06%
Alpine NA Amador 37.27% Butte 28.13%
Calaveras 19.10% Colusa 36.55% Contra Costa 17.68%
Del Norte 15.20% El Dorado 7.93%
Fresno 30.92% Glenn 44.83% Humboldt 46.01%
Imperial 58.38% Inyo 0.00% Kern 35.61%
Kings 35.62% Lake 15.47%
Lassen S Los Angeles 29.71% Madera 56.35%
Marin 56.50% Mariposa S Mendocino 47.01%
Merced 26.02% Modoc S
Mono 0.00% Monterey 57.45%

PREVENTIVE SERVICES REPORT ADDENDUM
2020 Preventive Services Report Addendum Page 16 Property of the California Department of Health Care Services Health Services Advisory Group, Inc.
Stratification Rate
Napa 21.50%
Nevada 10.06% Orange 44.69%
Placer 9.28% Plumas S Riverside 21.79%
Sacramento 14.47% San Benito 35.47% San Bernardino 23.32%
San Diego 38.12% San Francisco 47.40%
San Joaquin 21.07% San Luis Obispo 27.90% San Mateo 48.11%
Santa Barbara 38.88% Santa Clara 29.68% Santa Cruz 61.81%
Shasta 4.13% Sierra NA
Siskiyou S Solano 17.78% Sonoma 15.88%
Stanislaus 17.47% Sutter 20.95% Tehama 41.61%
Trinity 23.73% Tulare 40.27%
Tuolumne 21.16% Ventura 41.61%
PREVENTIVE SERVICES REPORT ADDENDUM
2020 Preventive Services Report Addendum Page 17 Property of the California Department of Health Care Services Health Services Advisory Group, Inc.
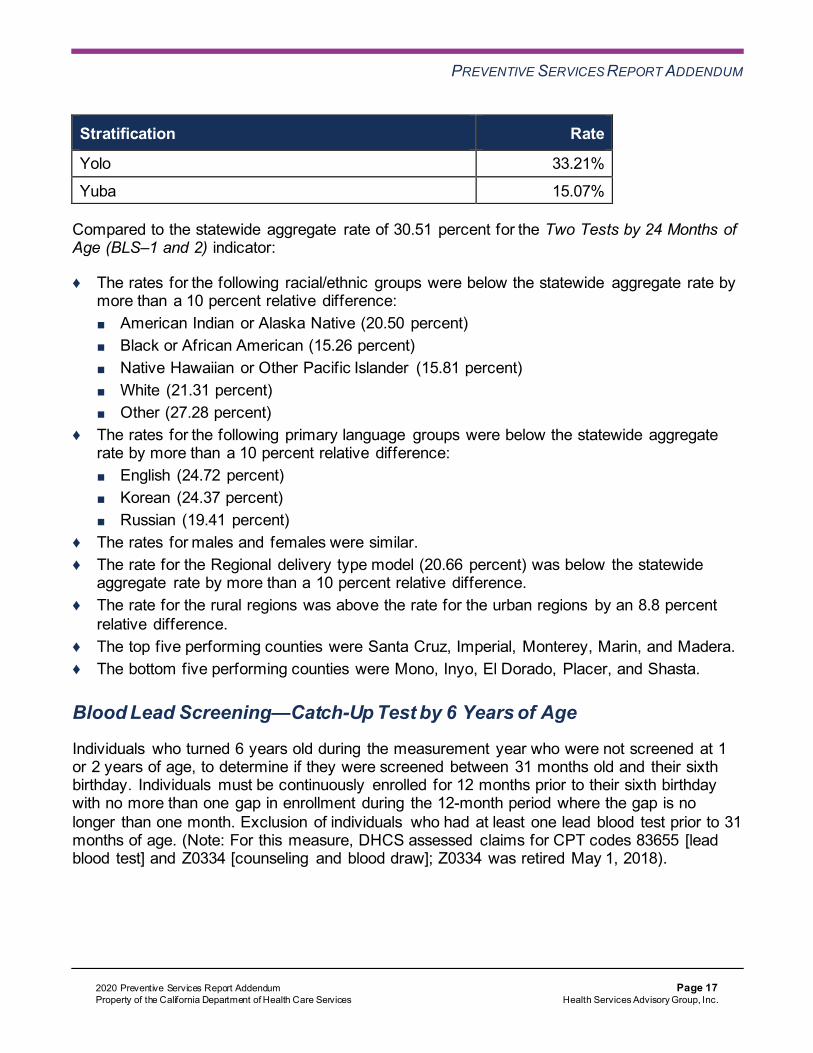
Stratification Rate
Yolo 33.21%
Yuba 15.07%
Compared to the statewide aggregate rate of 30.51 percent for the Two Tests by 24 Months of Age (BLS–1 and 2) indicator:
♦ The rates for the following racial/ethnic groups were below the statewide aggregate rate by more than a 10 percent relative difference: ■ American Indian or Alaska Native (20.50 percent) ■ Black or African American (15.26 percent) ■ Native Hawaiian or Other Pacific Islander (15.81 percent) ■ White (21.31 percent) ■ Other (27.28 percent)
♦ The rates for the following primary language groups were below the statewide aggregate rate by more than a 10 percent relative difference: ■ English (24.72 percent) ■ Korean (24.37 percent) ■ Russian (19.41 percent)
♦ The rates for males and females were similar. ♦ The rate for the Regional delivery type model (20.66 percent) was below the statewide
aggregate rate by more than a 10 percent relative difference. ♦ The rate for the rural regions was above the rate for the urban regions by an 8.8 percent
relative difference. ♦ The top five performing counties were Santa Cruz, Imperial, Monterey, Marin, and Madera. ♦ The bottom five performing counties were Mono, Inyo, El Dorado, Placer, and Shasta.
Blood Lead Screening—Catch-Up Test by 6 Years of Age
Individuals who turned 6 years old during the measurement year who were not screened at 1 or 2 years of age, to determine if they were screened between 31 months old and their sixth birthday. Individuals must be continuously enrolled for 12 months prior to their sixth birthday with no more than one gap in enrollment during the 12-month period where the gap is no longer than one month. Exclusion of individuals who had at least one lead blood test prior to 31 months of age. (Note: For this measure, DHCS assessed claims for CPT codes 83655 [lead blood test] and Z0334 [counseling and blood draw]; Z0334 was retired May 1, 2018).

PREVENTIVE SERVICES REPORT ADDENDUM
2020 Preventive Services Report Addendum Page 18 Property of the California Department of Health Care Services Health Services Advisory Group, Inc.
Table 1.4—Blood Lead Screening—Catch-Up Test by 6 Years of Age (BLS–316)—Statewide Results NA indicates the rate had a small denominator (i.e., less than 30). S indicates fewer than 11 cases exist in the numerator; therefore, HSAG suppresses displaying the rate in this report to satisfy the Health Insurance Portability and Accountability Act of 1996 (HIPAA) Privacy Rule’s de-identification standard.
Stratification Rate
Statewide Aggregate Statewide Aggregate 36.99%
Race/Ethnicity American Indian or Alaska Native 31.12% Asian 44.58%
Black or African American 35.20% Hispanic or Latino 41.86%
Native Hawaiian or Other Pacific Islander 28.85% White 24.64% Other 38.48%
Unknown/Missing 32.43% Primary Language Arabic 67.70%
Armenian 30.94% Cambodian 48.78%
Chinese 57.23% English 33.16% Farsi 69.30%
Hmong 49.56% Korean 25.00% Russian 36.80%
Spanish 47.92% Tagalog 52.00%
Vietnamese 63.13% Other 65.81%

PREVENTIVE SERVICES REPORT ADDENDUM
2020 Preventive Services Report Addendum Page 19 Property of the California Department of Health Care Services Health Services Advisory Group, Inc.
Stratification Rate
Unknown/Missing 15.07%
Gender Female 37.02%
Male 36.95% Delivery Type Model County Organized Health Systems 28.67%
Geographic Managed Care 41.28% Two-Plan (Local Initiative or Commercial Plan) 39.84% Regional 18.80%
Population Density Rural 29.46%
Urban 38.54% County Alameda 33.23%
Alpine NA Amador 19.64% Butte 14.86%
Calaveras 11.20% Colusa 22.92%
Contra Costa 25.71% Del Norte 20.69% El Dorado 15.22%
Fresno 37.37% Glenn 36.56% Humboldt 38.74%
Imperial 47.27% Inyo 17.39%
Kern 50.30% Kings 45.37%

PREVENTIVE SERVICES REPORT ADDENDUM
2020 Preventive Services Report Addendum Page 20 Property of the California Department of Health Care Services Health Services Advisory Group, Inc.
Stratification Rate
Lake 32.60%
Lassen 30.91% Los Angeles 40.96%
Madera 31.54% Marin 41.82% Mariposa S
Mendocino 31.31% Merced 30.90% Modoc NA
Mono S Monterey 24.34%
Napa 27.36% Nevada 11.18% Orange 30.60%
Placer 14.31% Plumas 22.97% Riverside 44.54%
Sacramento 36.83% San Benito 27.16%
San Bernardino 40.85% San Diego 45.37% San Francisco 38.86%
San Joaquin 36.86% San Luis Obispo 11.89% San Mateo 27.71%
Santa Barbara 26.06% Santa Clara 40.02%
Santa Cruz 23.47% Shasta 15.51%

PREVENTIVE SERVICES REPORT ADDENDUM
2020 Preventive Services Report Addendum Page 21 Property of the California Department of Health Care Services Health Services Advisory Group, Inc.
Stratification Rate
Sierra NA
Siskiyou 10.16% Solano 31.67%
Sonoma 31.37% Stanislaus 34.52% Sutter 30.77%
Tehama 34.97% Trinity S Tulare 27.70%
Tuolumne 18.58% Ventura 34.64%
Yolo 33.06% Yuba 23.27%
Compared to the statewide aggregate rate of 36.99 percent for the Catch-Up Test by 6 Years of Age (BLS–316) indicator:
♦ The rates for the following racial/ethnic groups were below the statewide aggregate rate by more than a 10 percent relative difference: ■ American Indian or Alaska Native (31.12 percent) ■ Native Hawaiian or Other Pacific Islander (28.85 percent) ■ White (24.64 percent)
♦ The rates for the following primary language groups were below the statewide aggregate rate by more than a 10 percent relative difference: ■ Armenian (30.94 percent) ■ English (33.16 percent) ■ Korean (25.00 percent)
♦ The rates for males and females were similar. ♦ The rates for the following delivery type models were below the statewide aggregate rate
by more than a 10 percent relative difference: ■ County Organized Health Systems (28.67 percent) ■ Regional (18.80 percent)
♦ The rate for the rural regions was below the rate for the urban regions by a 23.6 percent relative difference and was below the statewide aggregate rate by more than a 10 percent relative difference.
PREVENTIVE SERVICES REPORT ADDENDUM
2020 Preventive Services Report Addendum Page 22 Property of the California Department of Health Care Services Health Services Advisory Group, Inc.
♦ The top five performing counties were Kern, Imperial, San Diego, Kings, and Riverside. ♦ The bottom five performing counties were Placer, San Luis Obispo, Calaveras, Nevada,
and Siskiyou.
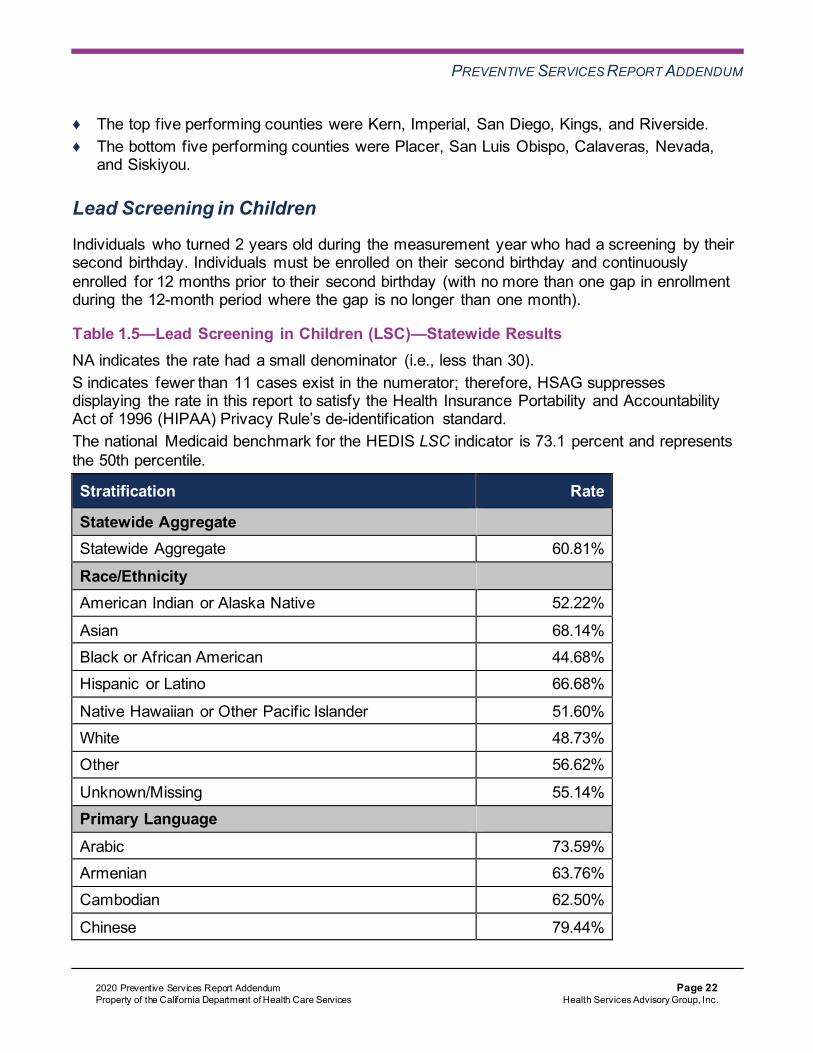
Lead Screening in Children
Individuals who turned 2 years old during the measurement year who had a screening by their second birthday. Individuals must be enrolled on their second birthday and continuously enrolled for 12 months prior to their second birthday (with no more than one gap in enrollment during the 12-month period where the gap is no longer than one month).
Table 1.5—Lead Screening in Children (LSC)—Statewide Results NA indicates the rate had a small denominator (i.e., less than 30). S indicates fewer than 11 cases exist in the numerator; therefore, HSAG suppresses displaying the rate in this report to satisfy the Health Insurance Portability and Accountability Act of 1996 (HIPAA) Privacy Rule’s de-identification standard. The national Medicaid benchmark for the HEDIS LSC indicator is 73.1 percent and represents the 50th percentile.
Stratification Rate
Statewide Aggregate Statewide Aggregate 60.81%
Race/Ethnicity American Indian or Alaska Native 52.22%
Asian 68.14% Black or African American 44.68% Hispanic or Latino 66.68%
Native Hawaiian or Other Pacific Islander 51.60% White 48.73% Other 56.62%
Unknown/Missing 55.14% Primary Language
Arabic 73.59% Armenian 63.76% Cambodian 62.50%
Chinese 79.44%
PREVENTIVE SERVICES REPORT ADDENDUM
2020 Preventive Services Report Addendum Page 23 Property of the California Department of Health Care Services Health Services Advisory Group, Inc.
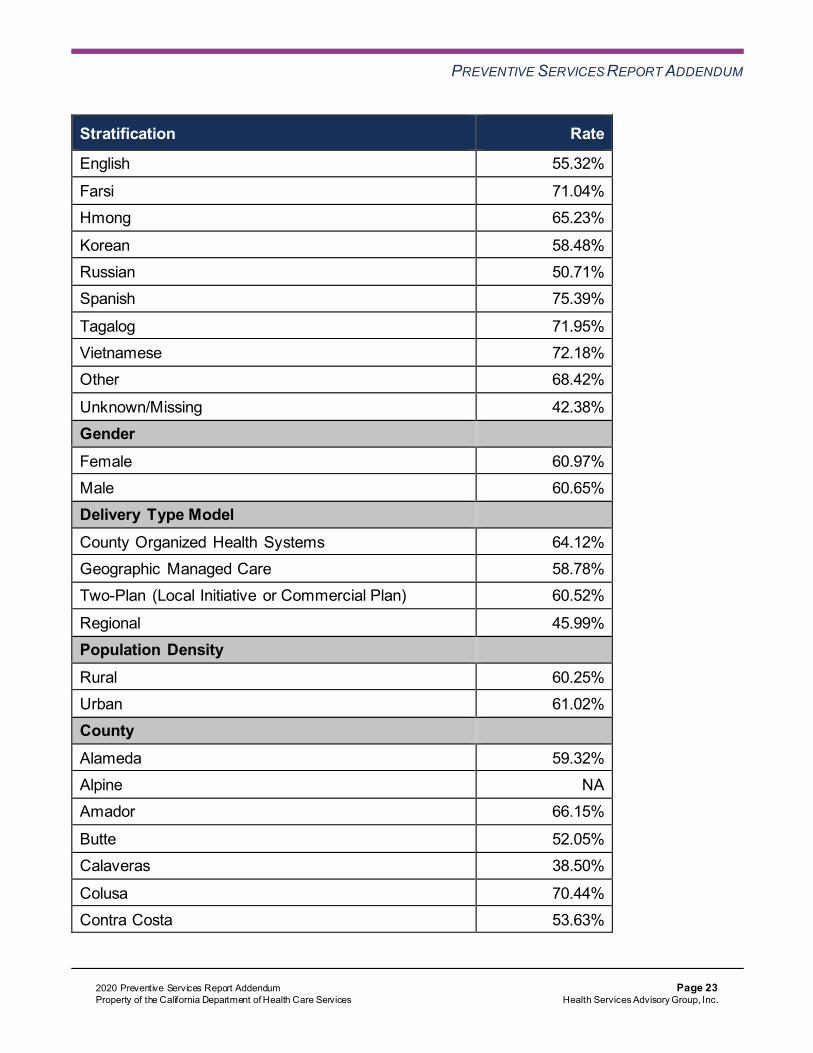
Stratification Rate
English 55.32%
Farsi 71.04% Hmong 65.23%
Korean 58.48% Russian 50.71% Spanish 75.39%
Tagalog 71.95% Vietnamese 72.18% Other 68.42%
Unknown/Missing 42.38% Gender Female 60.97% Male 60.65% Delivery Type Model
County Organized Health Systems 64.12% Geographic Managed Care 58.78% Two-Plan (Local Initiative or Commercial Plan) 60.52%
Regional 45.99% Population Density
Rural 60.25% Urban 61.02% County
Alameda 59.32% Alpine NA Amador 66.15%
Butte 52.05% Calaveras 38.50%
Colusa 70.44% Contra Costa 53.63%

PREVENTIVE SERVICES REPORT ADDENDUM
2020 Preventive Services Report Addendum Page 24 Property of the California Department of Health Care Services Health Services Advisory Group, Inc.
Stratification Rate
Del Norte 53.19%
El Dorado 28.11% Fresno 60.88%
Glenn 72.24% Humboldt 76.32% Imperial 81.55%
Inyo S Kern 69.64% Kings 71.26%
Lake 40.93% Lassen 37.23%
Los Angeles 62.59% Madera 77.19% Marin 76.56%
Mariposa 26.25% Mendocino 69.52% Merced 53.99%
Modoc 36.36% Mono 0.00%
Monterey 79.76% Napa 54.51% Nevada 31.70%
Orange 70.50% Placer 29.14% Plumas 14.29%
Riverside 52.56% Sacramento 43.94%
San Benito 71.81% San Bernardino 55.23%
PREVENTIVE SERVICES REPORT ADDENDUM
2020 Preventive Services Report Addendum Page 25 Property of the California Department of Health Care Services Health Services Advisory Group, Inc.
Stratification Rate
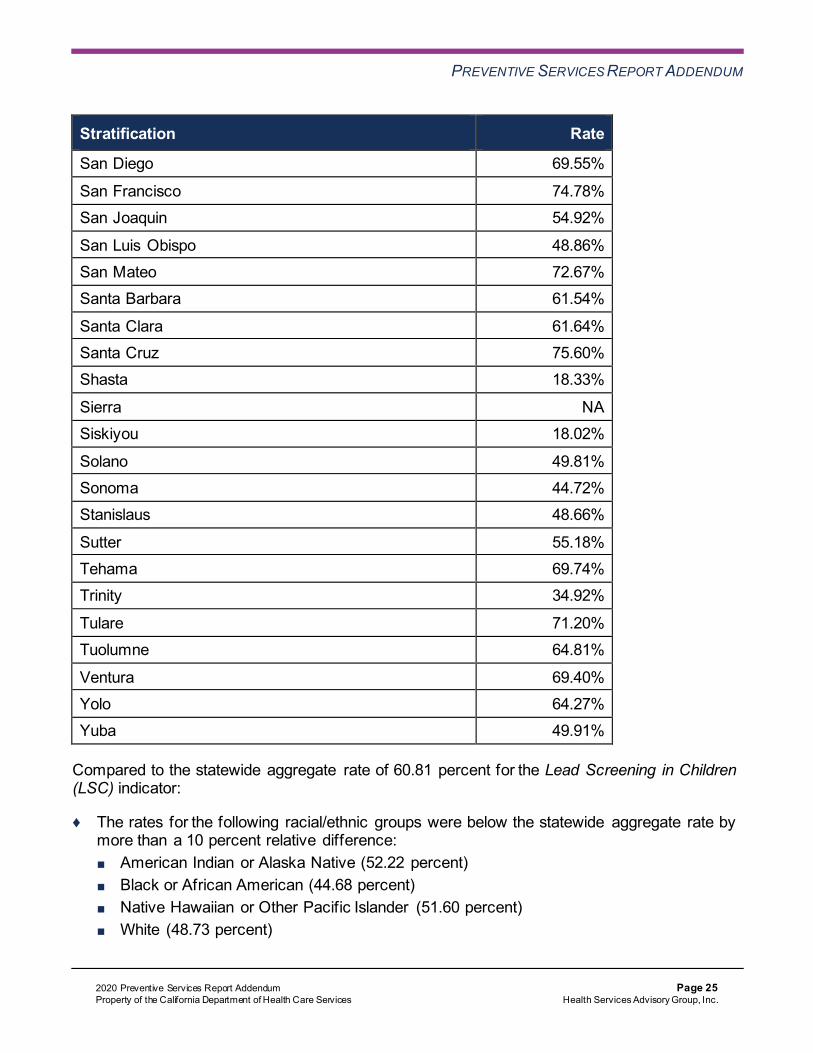
San Diego 69.55%
San Francisco 74.78% San Joaquin 54.92%
San Luis Obispo 48.86% San Mateo 72.67% Santa Barbara 61.54%
Santa Clara 61.64% Santa Cruz 75.60% Shasta 18.33%
Sierra NA Siskiyou 18.02%
Solano 49.81% Sonoma 44.72% Stanislaus 48.66%
Sutter 55.18% Tehama 69.74% Trinity 34.92%
Tulare 71.20% Tuolumne 64.81%
Ventura 69.40% Yolo 64.27% Yuba 49.91%
Compared to the statewide aggregate rate of 60.81 percent for the Lead Screening in Children (LSC) indicator:
♦ The rates for the following racial/ethnic groups were below the statewide aggregate rate by more than a 10 percent relative difference: ■ American Indian or Alaska Native (52.22 percent) ■ Black or African American (44.68 percent) ■ Native Hawaiian or Other Pacific Islander (51.60 percent) ■ White (48.73 percent)

PREVENTIVE SERVICES REPORT ADDENDUM
2020 Preventive Services Report Addendum Page 26 Property of the California Department of Health Care Services Health Services Advisory Group, Inc.
♦ The rate for the Russian primary language group (50.71 percent) was below the statewide aggregate rate by more than a 10 percent relative difference.
♦ The rates for males and females were similar. ♦ The rate for the Regional delivery type model (45.99 percent) was below the statewide
aggregate rate by more than a 10 percent relative difference. ♦ The rates for rural and urban regions were similar. ♦ The top five performing counties were Imperial, Monterey, Madera, Marin, and Humboldt. ♦ The bottom five performing counties were Plumas, Siskiyou, Shasta, Mariposa, and Mono.
County Quintiles
For each Blood Lead Screening indicator, DHCS calculated performance quintiles based on county performance (i.e., 20th percentile, 40th percentile, 60th percentile, and 80th percentile). DHCS then determined into which quintile each county fell (e.g., below the 20th percentile, between the 20th and 40th percentiles) as shown in Table 1.6.
Table 1.6—Statewide Performance Quintile Thresholds
Statewide Performance Quintile Performance Thresholds
Quintile 1 (least favorable rates) Below the 20th percentile
Quintile 2 At or above the 20th percentile but below the 40th percentile
Quintile 3 At or above the 40th percentile but below the 60th percentile
Quintile 4 At or above the 60th percentile but below the 80th percentile
Quintile 5 (most favorable rates) At or above the 80th percentile
PREVENTIVE SERVICES REPORT ADDENDUM
2020 Preventive Services Report Addendum Page 27 Property of the California Department of Health Care Services Health Services Advisory Group, Inc.
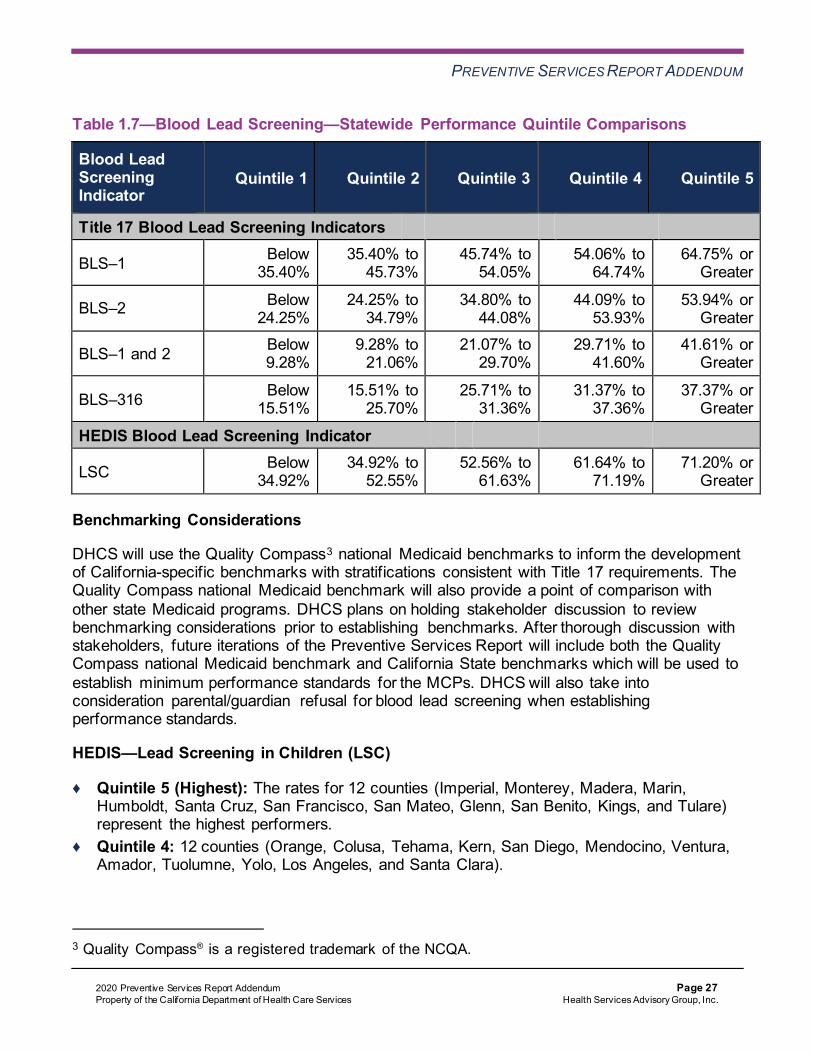
Table 1.7—Blood Lead Screening—Statewide Performance Quintile Comparisons
Blood Lead Screening Indicator
Quintile 1 Quintile 2 Quintile 3 Quintile 4 Quintile 5
Title 17 Blood Lead Screening Indicators
BLS–1 Below 35.40%
35.40% to 45.73%
45.74% to 54.05%
54.06% to 64.74%
64.75% or Greater
BLS–2 Below 24.25%
24.25% to 34.79%
34.80% to 44.08%
44.09% to 53.93%
53.94% or Greater
BLS–1 and 2 Below 9.28%
9.28% to 21.06%
21.07% to 29.70%
29.71% to 41.60%
41.61% or Greater
BLS–316 Below 15.51%
15.51% to 25.70%
25.71% to 31.36%
31.37% to 37.36%
37.37% or Greater
HEDIS Blood Lead Screening Indicator
LSC Below 34.92%
34.92% to 52.55%
52.56% to 61.63%
61.64% to 71.19%
71.20% or Greater
Benchmarking Considerations
DHCS will use the Quality Compass3 national Medicaid benchmarks to inform the development of California-specific benchmarks with stratifications consistent with Title 17 requirements. The Quality Compass national Medicaid benchmark will also provide a point of comparison with other state Medicaid programs. DHCS plans on holding stakeholder discussion to review benchmarking considerations prior to establishing benchmarks. After thorough discussion with stakeholders, future iterations of the Preventive Services Report will include both the Quality Compass national Medicaid benchmark and California State benchmarks which will be used to establish minimum performance standards for the MCPs. DHCS will also take into consideration parental/guardian refusal for blood lead screening when establishing performance standards.
HEDIS—Lead Screening in Children (LSC)
♦ Quintile 5 (Highest): The rates for 12 counties (Imperial, Monterey, Madera, Marin, Humboldt, Santa Cruz, San Francisco, San Mateo, Glenn, San Benito, Kings, and Tulare) represent the highest performers.
♦ Quintile 4: 12 counties (Orange, Colusa, Tehama, Kern, San Diego, Mendocino, Ventura, Amador, Tuolumne, Yolo, Los Angeles, and Santa Clara).
3 Quality Compass® is a registered trademark of the NCQA.
PREVENTIVE SERVICES REPORT ADDENDUM
2020 Preventive Services Report Addendum Page 28 Property of the California Department of Health Care Services Health Services Advisory Group, Inc.
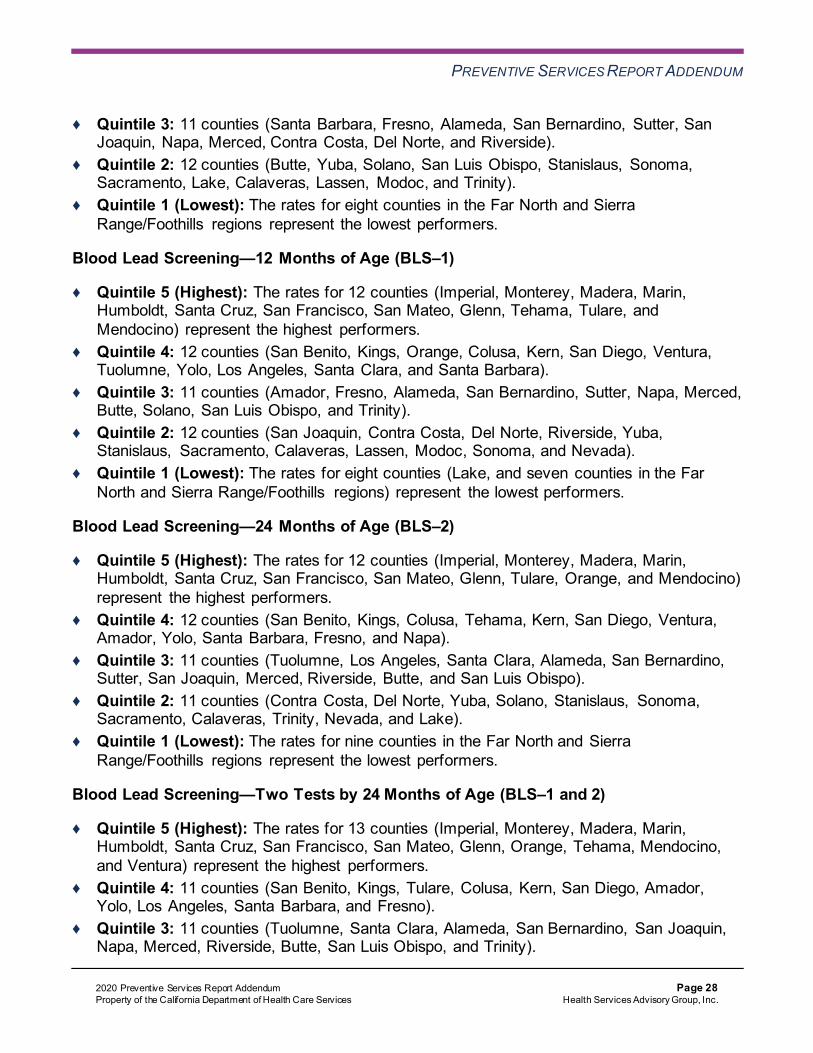
♦ Quintile 3: 11 counties (Santa Barbara, Fresno, Alameda, San Bernardino, Sutter, San Joaquin, Napa, Merced, Contra Costa, Del Norte, and Riverside).
♦ Quintile 2: 12 counties (Butte, Yuba, Solano, San Luis Obispo, Stanislaus, Sonoma, Sacramento, Lake, Calaveras, Lassen, Modoc, and Trinity).
♦ Quintile 1 (Lowest): The rates for eight counties in the Far North and Sierra Range/Foothills regions represent the lowest performers.
Blood Lead Screening—12 Months of Age (BLS–1)
♦ Quintile 5 (Highest): The rates for 12 counties (Imperial, Monterey, Madera, Marin, Humboldt, Santa Cruz, San Francisco, San Mateo, Glenn, Tehama, Tulare, and Mendocino) represent the highest performers.
♦ Quintile 4: 12 counties (San Benito, Kings, Orange, Colusa, Kern, San Diego, Ventura, Tuolumne, Yolo, Los Angeles, Santa Clara, and Santa Barbara).
♦ Quintile 3: 11 counties (Amador, Fresno, Alameda, San Bernardino, Sutter, Napa, Merced, Butte, Solano, San Luis Obispo, and Trinity).
♦ Quintile 2: 12 counties (San Joaquin, Contra Costa, Del Norte, Riverside, Yuba, Stanislaus, Sacramento, Calaveras, Lassen, Modoc, Sonoma, and Nevada).
♦ Quintile 1 (Lowest): The rates for eight counties (Lake, and seven counties in the Far North and Sierra Range/Foothills regions) represent the lowest performers.
Blood Lead Screening—24 Months of Age (BLS–2)
♦ Quintile 5 (Highest): The rates for 12 counties (Imperial, Monterey, Madera, Marin, Humboldt, Santa Cruz, San Francisco, San Mateo, Glenn, Tulare, Orange, and Mendocino) represent the highest performers.
♦ Quintile 4: 12 counties (San Benito, Kings, Colusa, Tehama, Kern, San Diego, Ventura, Amador, Yolo, Santa Barbara, Fresno, and Napa).
♦ Quintile 3: 11 counties (Tuolumne, Los Angeles, Santa Clara, Alameda, San Bernardino, Sutter, San Joaquin, Merced, Riverside, Butte, and San Luis Obispo).
♦ Quintile 2: 11 counties (Contra Costa, Del Norte, Yuba, Solano, Stanislaus, Sonoma, Sacramento, Calaveras, Trinity, Nevada, and Lake).
♦ Quintile 1 (Lowest): The rates for nine counties in the Far North and Sierra Range/Foothills regions represent the lowest performers.
Blood Lead Screening—Two Tests by 24 Months of Age (BLS–1 and 2)
♦ Quintile 5 (Highest): The rates for 13 counties (Imperial, Monterey, Madera, Marin, Humboldt, Santa Cruz, San Francisco, San Mateo, Glenn, Orange, Tehama, Mendocino, and Ventura) represent the highest performers.
♦ Quintile 4: 11 counties (San Benito, Kings, Tulare, Colusa, Kern, San Diego, Amador, Yolo, Los Angeles, Santa Barbara, and Fresno).
♦ Quintile 3: 11 counties (Tuolumne, Santa Clara, Alameda, San Bernardino, San Joaquin, Napa, Merced, Riverside, Butte, San Luis Obispo, and Trinity).

PREVENTIVE SERVICES REPORT ADDENDUM
2020 Preventive Services Report Addendum Page 29 Property of the California Department of Health Care Services Health Services Advisory Group, Inc.
♦ Quintile 2: 12 counties (Sutter, Contra Costa, Del Norte, Yuba, Solano, Stanislaus, Sonoma, Sacramento, Lake, Calaveras, Nevada, and Placer).
♦ Quintile 1 (Lowest): The rates for four counties in the Far North and Sierra Range/Foothills regions represent the lowest performers.
Blood Lead Screening—Catch-Up Test by 6 Years of Age (BLS–316)
♦ Quintile 5 (Highest): The rates for 12 counties (Imperial, Marin, Humboldt, San Francisco, Kings, Kern, San Diego, Los Angeles, Santa Clara, Fresno, San Bernardino, and Riverside) represent the highest performers.
♦ Quintile 4: 12 counties (Madera, Glenn, Tehama, Ventura, Yolo, Alameda, San Joaquin, Solano, Stanislaus, Sonoma, Lake, and Sacramento).
♦ Quintile 3: 11 counties (San Mateo, San Benito, Tulare, Orange, Mendocino, Santa Barbara, Sutter, Napa, Merced, Contra Costa, and Lassen).
♦ Quintile 2: 10 counties (Monterey, Santa Cruz, Colusa, Amador, Tuolumne, Del Norte, Yuba, Shasta, Plumas, and Inyo).
♦ Quintile 1 (Lowest): The rates for seven counties (Butte, San Luis Obispo, and five counties in the Far North and Sierra Range/Foothills) represent the lowest performers.
PREVENTIVE SERVICES REPORT ADDENDUM
2020 Preventive Services Report Addendum Page 30 Property of the California Department of Health Care Services Health Services Advisory Group, Inc.
Blood Lead Screening MCP Reporting Unit Results
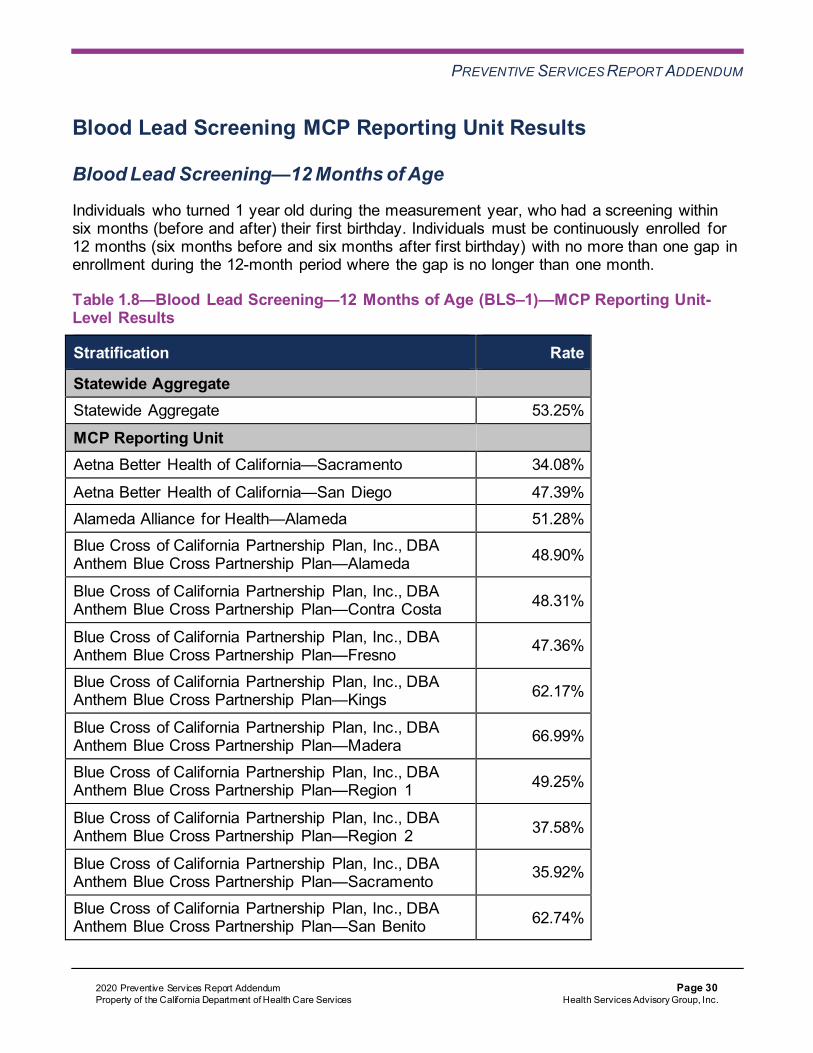
Blood Lead Screening—12 Months of Age
Individuals who turned 1 year old during the measurement year, who had a screening within six months (before and after) their first birthday. Individuals must be continuously enrolled for 12 months (six months before and six months after first birthday) with no more than one gap in enrollment during the 12-month period where the gap is no longer than one month.
Table 1.8—Blood Lead Screening—12 Months of Age (BLS–1)—MCP Reporting Unit-Level Results
Stratification Rate
Statewide Aggregate Statewide Aggregate 53.25%
MCP Reporting Unit Aetna Better Health of California—Sacramento 34.08%
Aetna Better Health of California—San Diego 47.39% Alameda Alliance for Health—Alameda 51.28% Blue Cross of California Partnership Plan, Inc., DBA Anthem Blue Cross Partnership Plan—Alameda 48.90%
Blue Cross of California Partnership Plan, Inc., DBA Anthem Blue Cross Partnership Plan—Contra Costa 48.31%
Blue Cross of California Partnership Plan, Inc., DBA Anthem Blue Cross Partnership Plan—Fresno 47.36%
Blue Cross of California Partnership Plan, Inc., DBA Anthem Blue Cross Partnership Plan—Kings 62.17%
Blue Cross of California Partnership Plan, Inc., DBA Anthem Blue Cross Partnership Plan—Madera 66.99%
Blue Cross of California Partnership Plan, Inc., DBA Anthem Blue Cross Partnership Plan—Region 1 49.25%
Blue Cross of California Partnership Plan, Inc., DBA Anthem Blue Cross Partnership Plan—Region 2 37.58%
Blue Cross of California Partnership Plan, Inc., DBA Anthem Blue Cross Partnership Plan—Sacramento 35.92%
Blue Cross of California Partnership Plan, Inc., DBA Anthem Blue Cross Partnership Plan—San Benito 62.74%

PREVENTIVE SERVICES REPORT ADDENDUM
2020 Preventive Services Report Addendum Page 31 Property of the California Department of Health Care Services Health Services Advisory Group, Inc.
Stratification Rate
Blue Cross of California Partnership Plan, Inc., DBA Anthem Blue Cross Partnership Plan—San Francisco 59.15%
Blue Cross of California Partnership Plan, Inc., DBA Anthem Blue Cross Partnership Plan—Santa Clara 52.74%
Blue Cross of California Partnership Plan, Inc., DBA Anthem Blue Cross Partnership Plan—Tulare 63.99%
Blue Shield of California Promise Health Plan— San Diego 62.96%
California Health & Wellness Plan—Imperial 76.97% California Health & Wellness Plan—Region 1 57.30%
California Health & Wellness Plan—Region 2 31.19% CalOptima—Orange 61.53% CalViva Health—Fresno 54.13%
CalViva Health—Kings 66.22% CalViva Health—Madera 73.76%
CenCal Health—San Luis Obispo 46.45% CenCal Health—Santa Barbara 61.65% Central California Alliance for Health—Merced 49.18%
Central California Alliance for Health— Monterey/Santa Cruz 77.48%
Community Health Group Partnership Plan—San Diego 65.85%
Contra Costa Health Plan—Contra Costa 43.80% Gold Coast Health Plan—Ventura 62.63% Health Net Community Solutions, Inc.—Kern 55.61%
Health Net Community Solutions, Inc.—Los Angeles 52.86% Health Net Community Solutions, Inc.—Sacramento 39.65%
Health Net Community Solutions, Inc.—San Diego 53.79% Health Net Community Solutions, Inc.—San Joaquin 34.46% Health Net Community Solutions, Inc.—Stanislaus 34.50%
Health Net Community Solutions, Inc.—Tulare 65.44% Health Plan of San Joaquin—San Joaquin 44.00%

PREVENTIVE SERVICES REPORT ADDENDUM
2020 Preventive Services Report Addendum Page 32 Property of the California Department of Health Care Services Health Services Advisory Group, Inc.
Stratification Rate
Health Plan of San Joaquin—Stanislaus 37.42%
Health Plan of San Mateo—San Mateo 66.99% Inland Empire Health Plan—Riverside/San Bernardino 46.54%
Kaiser NorCal (KP Cal, LLC)—KP North 34.70% Kaiser SoCal (KP Cal, LLC)—San Diego 53.81% Kern Health Systems, DBA Kern Family Health Care—Kern 59.84%
L.A. Care Health Plan—Los Angeles 54.56% Molina Healthcare of California—Imperial 71.78%
Molina Healthcare of California— Riverside/San Bernardino 40.43%
Molina Healthcare of California—Sacramento 33.97%
Molina Healthcare of California—San Diego 63.70% Partnership HealthPlan of California—Northeast 21.48% Partnership HealthPlan of California—Northwest 67.57%
Partnership HealthPlan of California—Southeast 51.03% Partnership HealthPlan of California—Southwest 45.83%
San Francisco Health Plan—San Francisco 70.41% Santa Clara Family Health Plan—Santa Clara 55.29% UnitedHealthcare Community Plan—San Diego 49.85%

PREVENTIVE SERVICES REPORT ADDENDUM
2020 Preventive Services Report Addendum Page 33 Property of the California Department of Health Care Services Health Services Advisory Group, Inc.
Blood Lead Screening—24 Months of Age
Individuals who turned 2 years old during the measurement year, who had a screening within six months (before and after) their second birthday. Individuals must be continuously enrolled for 12 months (six months before and six months after the second birthday) with no more than one gap in enrollment during the 12-month period where the gap is no longer than one month.
Table 1.9—Blood Lead Screening—24 Months of Age (BLS–2)—MCP Reporting Unit-Level Results
Stratification Rate
Statewide Aggregate Statewide Aggregate 43.40% MCP Reporting Unit Aetna Better Health of California—Sacramento 35.76% Aetna Better Health of California—San Diego 30.81% Alameda Alliance for Health—Alameda 39.95%
Blue Cross of California Partnership Plan, Inc., DBA Anthem Blue Cross Partnership Plan—Alameda 39.27%
Blue Cross of California Partnership Plan, Inc., DBA Anthem Blue Cross Partnership Plan—Contra Costa 32.73%
Blue Cross of California Partnership Plan, Inc., DBA Anthem Blue Cross Partnership Plan—Fresno 46.06%
Blue Cross of California Partnership Plan, Inc., DBA Anthem Blue Cross Partnership Plan—Kings 47.97%
Blue Cross of California Partnership Plan, Inc., DBA Anthem Blue Cross Partnership Plan—Madera 60.54%
Blue Cross of California Partnership Plan, Inc., DBA Anthem Blue Cross Partnership Plan—Region 1 38.24%
Blue Cross of California Partnership Plan, Inc., DBA Anthem Blue Cross Partnership Plan—Region 2 27.62%
Blue Cross of California Partnership Plan, Inc., DBA Anthem Blue Cross Partnership Plan—Sacramento 28.51%
Blue Cross of California Partnership Plan, Inc., DBA Anthem Blue Cross Partnership Plan—San Benito 45.83%
Blue Cross of California Partnership Plan, Inc., DBA Anthem Blue Cross Partnership Plan—San Francisco 44.71%

PREVENTIVE SERVICES REPORT ADDENDUM
2020 Preventive Services Report Addendum Page 34 Property of the California Department of Health Care Services Health Services Advisory Group, Inc.
Stratification Rate
Blue Cross of California Partnership Plan, Inc., DBA Anthem Blue Cross Partnership Plan—Santa Clara 43.87%
Blue Cross of California Partnership Plan, Inc., DBA Anthem Blue Cross Partnership Plan—Tulare 53.83%
Blue Shield of California Promise Health Plan— San Diego 52.91%
California Health & Wellness Plan—Imperial 69.04%
California Health & Wellness Plan—Region 1 46.41% California Health & Wellness Plan—Region 2 23.62% CalOptima—Orange 54.36%
CalViva Health—Fresno 48.33% CalViva Health—Kings 48.76%
CalViva Health—Madera 68.71% CenCal Health—San Luis Obispo 38.62% CenCal Health—Santa Barbara 51.37%
Central California Alliance for Health—Merced 41.17% Central California Alliance for Health— Monterey/Santa Cruz 66.67%
Community Health Group Partnership Plan—San Diego 54.39% Contra Costa Health Plan—Contra Costa 26.90% Gold Coast Health Plan—Ventura 51.55%
Health Net Community Solutions, Inc.—Kern 44.07% Health Net Community Solutions, Inc.—Los Angeles 41.92%
Health Net Community Solutions, Inc.—Sacramento 31.89% Health Net Community Solutions, Inc.—San Diego 42.16% Health Net Community Solutions, Inc.—San Joaquin 29.24%
Health Net Community Solutions, Inc.—Stanislaus 28.56% Health Net Community Solutions, Inc.—Tulare 53.98% Health Plan of San Joaquin—San Joaquin 35.28%
Health Plan of San Joaquin—Stanislaus 30.74% Health Plan of San Mateo—San Mateo 56.07%

PREVENTIVE SERVICES REPORT ADDENDUM
2020 Preventive Services Report Addendum Page 35 Property of the California Department of Health Care Services Health Services Advisory Group, Inc.
Stratification Rate
Inland Empire Health Plan—Riverside/San Bernardino 37.11%
Kaiser NorCal (KP Cal, LLC)—KP North 24.65% Kaiser SoCal (KP Cal, LLC)—San Diego 40.91%
Kern Health Systems, DBA Kern Family Health Care—Kern 46.81%
L.A. Care Health Plan—Los Angeles 44.09%
Molina Healthcare of California—Imperial 61.89% Molina Healthcare of California— Riverside/San Bernardino 33.10%
Molina Healthcare of California—Sacramento 29.70% Molina Healthcare of California—San Diego 52.37% Partnership HealthPlan of California—Northeast 15.07%
Partnership HealthPlan of California—Northwest 52.52% Partnership HealthPlan of California—Southeast 38.18% Partnership HealthPlan of California—Southwest 39.25%
San Francisco Health Plan—San Francisco 56.99% Santa Clara Family Health Plan—Santa Clara 43.03%
UnitedHealthcare Community Plan—San Diego 47.15%
PREVENTIVE SERVICES REPORT ADDENDUM
2020 Preventive Services Report Addendum Page 36 Property of the California Department of Health Care Services Health Services Advisory Group, Inc.
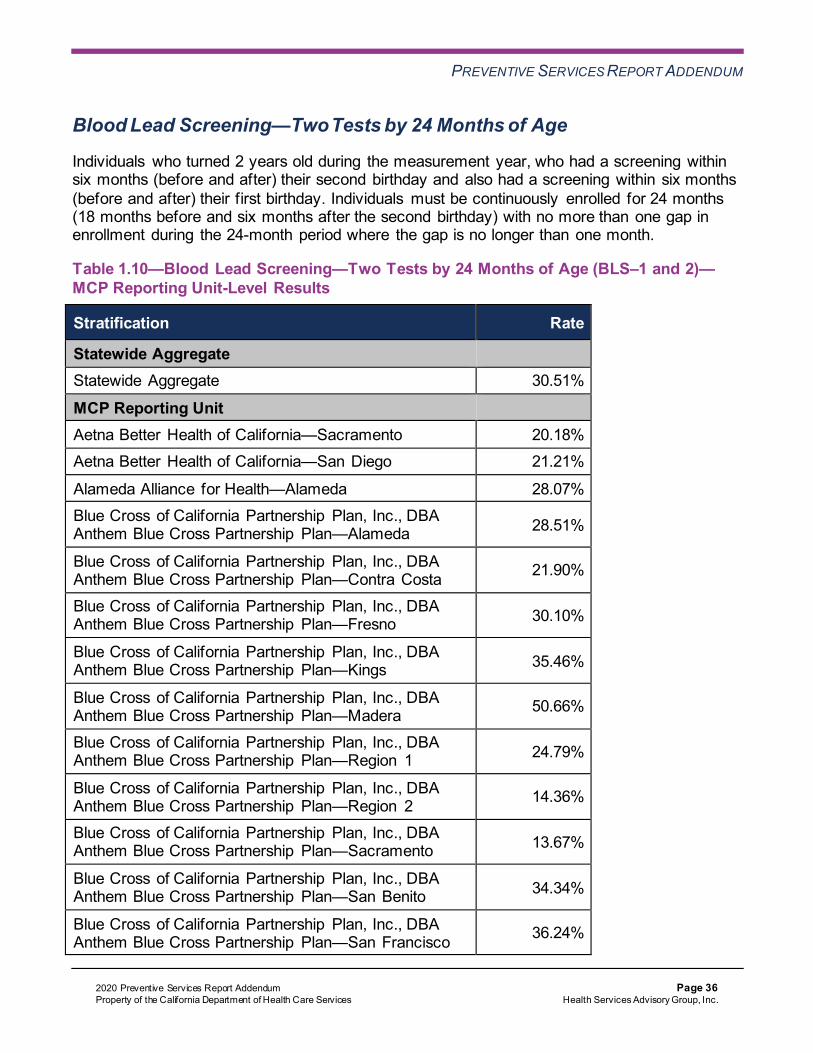
Blood Lead Screening—Two Tests by 24 Months of Age
Individuals who turned 2 years old during the measurement year, who had a screening within six months (before and after) their second birthday and also had a screening within six months (before and after) their first birthday. Individuals must be continuously enrolled for 24 months (18 months before and six months after the second birthday) with no more than one gap in enrollment during the 24-month period where the gap is no longer than one month.
Table 1.10—Blood Lead Screening—Two Tests by 24 Months of Age (BLS–1 and 2)—MCP Reporting Unit-Level Results
Stratification Rate
Statewide Aggregate Statewide Aggregate 30.51%
MCP Reporting Unit Aetna Better Health of California—Sacramento 20.18% Aetna Better Health of California—San Diego 21.21%
Alameda Alliance for Health—Alameda 28.07% Blue Cross of California Partnership Plan, Inc., DBA Anthem Blue Cross Partnership Plan—Alameda 28.51%
Blue Cross of California Partnership Plan, Inc., DBA Anthem Blue Cross Partnership Plan—Contra Costa 21.90%
Blue Cross of California Partnership Plan, Inc., DBA Anthem Blue Cross Partnership Plan—Fresno 30.10%
Blue Cross of California Partnership Plan, Inc., DBA Anthem Blue Cross Partnership Plan—Kings 35.46%
Blue Cross of California Partnership Plan, Inc., DBA Anthem Blue Cross Partnership Plan—Madera 50.66%
Blue Cross of California Partnership Plan, Inc., DBA Anthem Blue Cross Partnership Plan—Region 1 24.79%
Blue Cross of California Partnership Plan, Inc., DBA Anthem Blue Cross Partnership Plan—Region 2 14.36%
Blue Cross of California Partnership Plan, Inc., DBA Anthem Blue Cross Partnership Plan—Sacramento 13.67%
Blue Cross of California Partnership Plan, Inc., DBA Anthem Blue Cross Partnership Plan—San Benito 34.34%
Blue Cross of California Partnership Plan, Inc., DBA Anthem Blue Cross Partnership Plan—San Francisco 36.24%

PREVENTIVE SERVICES REPORT ADDENDUM
2020 Preventive Services Report Addendum Page 37 Property of the California Department of Health Care Services Health Services Advisory Group, Inc.
Stratification Rate
Blue Cross of California Partnership Plan, Inc., DBA Anthem Blue Cross Partnership Plan—Santa Clara 30.09%
Blue Cross of California Partnership Plan, Inc., DBA Anthem Blue Cross Partnership Plan—Tulare 39.37%
Blue Shield of California Promise Health Plan— San Diego 42.47%
California Health & Wellness Plan—Imperial 59.03%
California Health & Wellness Plan—Region 1 33.57% California Health & Wellness Plan—Region 2 10.52% CalOptima—Orange 44.42%
CalViva Health—Fresno 31.17% CalViva Health—Kings 35.91%
CalViva Health—Madera 58.82% CenCal Health—San Luis Obispo 27.98% CenCal Health—Santa Barbara 38.85%
Central California Alliance for Health—Merced 25.88% Central California Alliance for Health— Monterey/Santa Cruz 58.48%
Community Health Group Partnership Plan—San Diego 41.49% Contra Costa Health Plan—Contra Costa 17.23% Gold Coast Health Plan—Ventura 41.55%
Health Net Community Solutions, Inc.—Kern 34.79% Health Net Community Solutions, Inc.—Los Angeles 28.68%
Health Net Community Solutions, Inc.—Sacramento 16.95% Health Net Community Solutions, Inc.—San Diego 28.87% Health Net Community Solutions, Inc.—San Joaquin 12.03%
Health Net Community Solutions, Inc.—Stanislaus 18.10% Health Net Community Solutions, Inc.—Tulare 40.93% Health Plan of San Joaquin—San Joaquin 21.68%
Health Plan of San Joaquin—Stanislaus 17.30% Health Plan of San Mateo—San Mateo 48.17%

PREVENTIVE SERVICES REPORT ADDENDUM
2020 Preventive Services Report Addendum Page 38 Property of the California Department of Health Care Services Health Services Advisory Group, Inc.
Stratification Rate
Inland Empire Health Plan—Riverside/San Bernardino 22.61%
Kaiser NorCal (KP Cal, LLC)—KP North 11.06% Kaiser SoCal (KP Cal, LLC)—San Diego 24.48%
Kern Health Systems, DBA Kern Family Health Care—Kern 35.73%
L.A. Care Health Plan—Los Angeles 30.21%
Molina Healthcare of California—Imperial 54.47% Molina Healthcare of California— Riverside/San Bernardino 21.26%
Molina Healthcare of California—Sacramento 18.72% Molina Healthcare of California—San Diego 39.19% Partnership HealthPlan of California—Northeast 5.05%
Partnership HealthPlan of California—Northwest 40.64% Partnership HealthPlan of California—Southeast 22.11% Partnership HealthPlan of California—Southwest 28.87%
San Francisco Health Plan—San Francisco 48.53% Santa Clara Family Health Plan—Santa Clara 29.50%
UnitedHealthcare Community Plan—San Diego 34.45%

PREVENTIVE SERVICES REPORT ADDENDUM
2020 Preventive Services Report Addendum Page 39 Property of the California Department of Health Care Services Health Services Advisory Group, Inc.
Blood Lead Screening—Catch-Up Test by 6 Years of Age
Individuals who turned 6 years old during the measurement year who were not screened at 1 or 2 years of age, to determine if they were screened between 31 months old and their sixth birthday. Individuals must be continuously enrolled for 12 months prior to their sixth birthday with no more than one gap in enrollment during the 12-month period where the gap is no longer than one month. Exclusion of individuals who had at least one lead blood test prior to 31 months of age. (Note: For this measure, DHCS assessed claims for CPT codes 83655 [lead blood test] and Z0334 [counseling and blood draw]; Z0334 was retired May 1, 2018).
Table 1.11—Blood Lead Screening—Catch-Up Test by 6 Years of Age (BLS–316)—MCP Reporting Unit-Level Results
Stratification Rate
Statewide Aggregate
Statewide Aggregate 36.99% MCP Reporting Unit Aetna Better Health of California—Sacramento 41.18%
Aetna Better Health of California—San Diego 33.75% Alameda Alliance for Health—Alameda 33.78%
Blue Cross of California Partnership Plan, Inc., DBA Anthem Blue Cross Partnership Plan—Alameda 31.80%
Blue Cross of California Partnership Plan, Inc., DBA Anthem Blue Cross Partnership Plan—Contra Costa 21.38%
Blue Cross of California Partnership Plan, Inc., DBA Anthem Blue Cross Partnership Plan—Fresno 35.14%
Blue Cross of California Partnership Plan, Inc., DBA Anthem Blue Cross Partnership Plan—Kings 41.59%
Blue Cross of California Partnership Plan, Inc., DBA Anthem Blue Cross Partnership Plan—Madera 31.40%
Blue Cross of California Partnership Plan, Inc., DBA Anthem Blue Cross Partnership Plan—Region 1 25.49%
Blue Cross of California Partnership Plan, Inc., DBA Anthem Blue Cross Partnership Plan—Region 2 16.70%
Blue Cross of California Partnership Plan, Inc., DBA Anthem Blue Cross Partnership Plan—Sacramento 36.88%
Blue Cross of California Partnership Plan, Inc., DBA Anthem Blue Cross Partnership Plan—San Benito 27.27%

PREVENTIVE SERVICES REPORT ADDENDUM
2020 Preventive Services Report Addendum Page 40 Property of the California Department of Health Care Services Health Services Advisory Group, Inc.
Stratification Rate
Blue Cross of California Partnership Plan, Inc., DBA Anthem Blue Cross Partnership Plan—San Francisco 23.81%
Blue Cross of California Partnership Plan, Inc., DBA Anthem Blue Cross Partnership Plan—Santa Clara 44.81%
Blue Cross of California Partnership Plan, Inc., DBA Anthem Blue Cross Partnership Plan—Tulare 25.86%
Blue Shield of California Promise Health Plan— San Diego 46.26%
California Health & Wellness Plan—Imperial 46.12% California Health & Wellness Plan—Region 1 23.41%
California Health & Wellness Plan—Region 2 16.55% CalOptima—Orange 30.68% CalViva Health—Fresno 38.30%
CalViva Health—Kings 47.41% CalViva Health—Madera 31.61%
CenCal Health—San Luis Obispo 12.24% CenCal Health—Santa Barbara 26.26% Central California Alliance for Health—Merced 30.61%
Central California Alliance for Health— Monterey/Santa Cruz 23.98%
Community Health Group Partnership Plan—San Diego 48.09%
Contra Costa Health Plan—Contra Costa 26.27% Gold Coast Health Plan—Ventura 34.53% Health Net Community Solutions, Inc.—Kern 47.83%
Health Net Community Solutions, Inc.—Los Angeles 40.51% Health Net Community Solutions, Inc.—Sacramento 39.91%
Health Net Community Solutions, Inc.—San Diego 34.99% Health Net Community Solutions, Inc.—San Joaquin 32.54% Health Net Community Solutions, Inc.—Stanislaus 30.27%
Health Net Community Solutions, Inc.—Tulare 29.31% Health Plan of San Joaquin—San Joaquin 37.44%

PREVENTIVE SERVICES REPORT ADDENDUM
2020 Preventive Services Report Addendum Page 41 Property of the California Department of Health Care Services Health Services Advisory Group, Inc.
Stratification Rate
Health Plan of San Joaquin—Stanislaus 36.17%
Health Plan of San Mateo—San Mateo 27.91% Inland Empire Health Plan—Riverside/San Bernardino 42.98%
Kaiser NorCal (KP Cal, LLC)—KP North 24.23% Kaiser SoCal (KP Cal, LLC)—San Diego 36.28% Kern Health Systems, DBA Kern Family Health Care—Kern 51.01%
L.A. Care Health Plan—Los Angeles 41.29% Molina Healthcare of California—Imperial 51.16%
Molina Healthcare of California— Riverside/San Bernardino 40.60%
Molina Healthcare of California—Sacramento 50.58%
Molina Healthcare of California—San Diego 49.42% Partnership HealthPlan of California—Northeast 16.00% Partnership HealthPlan of California—Northwest 33.04%
Partnership HealthPlan of California—Southeast 31.24% Partnership HealthPlan of California—Southwest 32.77%
San Francisco Health Plan—San Francisco 40.77% Santa Clara Family Health Plan—Santa Clara 38.79% UnitedHealthcare Community Plan—San Diego 44.12%

PREVENTIVE SERVICES REPORT ADDENDUM
2020 Preventive Services Report Addendum Page 42 Property of the California Department of Health Care Services Health Services Advisory Group, Inc.
Lead Screening in Children
Individuals who turned 2 years old during the measurement year who had a screening by their second birthday. Individuals must be enrolled on their second birthday and continuously enrolled for 12 months prior to their second birthday (with no more than one gap in enrollment during the 12-month period where the gap is no longer than one month).
Table 1.12—Lead Screening in Children (LSC)—MCP Reporting Unit-Level Results
Stratification Rate
Statewide Aggregate
Statewide Aggregate 60.81% MCP Reporting Unit Aetna Better Health of California—Sacramento 50.00%
Aetna Better Health of California—San Diego 52.98% Alameda Alliance for Health—Alameda 59.48%
Blue Cross of California Partnership Plan, Inc., DBA Anthem Blue Cross Partnership Plan—Alameda 59.03%
Blue Cross of California Partnership Plan, Inc., DBA Anthem Blue Cross Partnership Plan—Contra Costa 53.99%
Blue Cross of California Partnership Plan, Inc., DBA Anthem Blue Cross Partnership Plan—Fresno 57.95%
Blue Cross of California Partnership Plan, Inc., DBA Anthem Blue Cross Partnership Plan—Kings 67.69%
Blue Cross of California Partnership Plan, Inc., DBA Anthem Blue Cross Partnership Plan—Madera 71.07%
Blue Cross of California Partnership Plan, Inc., DBA Anthem Blue Cross Partnership Plan—Region 1 55.28%
Blue Cross of California Partnership Plan, Inc., DBA Anthem Blue Cross Partnership Plan—Region 2 38.90%
Blue Cross of California Partnership Plan, Inc., DBA Anthem Blue Cross Partnership Plan—Sacramento 40.70%
Blue Cross of California Partnership Plan, Inc., DBA Anthem Blue Cross Partnership Plan—San Benito 70.72%
Blue Cross of California Partnership Plan, Inc., DBA Anthem Blue Cross Partnership Plan—San Francisco 65.32%

PREVENTIVE SERVICES REPORT ADDENDUM
2020 Preventive Services Report Addendum Page 43 Property of the California Department of Health Care Services Health Services Advisory Group, Inc.
Stratification Rate
Blue Cross of California Partnership Plan, Inc., DBA Anthem Blue Cross Partnership Plan—Santa Clara 58.08%
Blue Cross of California Partnership Plan, Inc., DBA Anthem Blue Cross Partnership Plan—Tulare 69.62%
Blue Shield of California Promise Health Plan— San Diego 72.26%
California Health & Wellness Plan—Imperial 82.19%
California Health & Wellness Plan—Region 1 58.10% California Health & Wellness Plan—Region 2 33.06% CalOptima—Orange 70.30%
CalViva Health—Fresno 61.79% CalViva Health—Kings 73.66%
CalViva Health—Madera 79.96% CenCal Health—San Luis Obispo 49.26% CenCal Health—Santa Barbara 61.43%
Central California Alliance for Health—Merced 54.02% Central California Alliance for Health— Monterey/Santa Cruz 78.71%
Community Health Group Partnership Plan—San Diego 72.66% Contra Costa Health Plan—Contra Costa 53.76% Gold Coast Health Plan—Ventura 69.38%
Health Net Community Solutions, Inc.—Kern 66.36% Health Net Community Solutions, Inc.—Los Angeles 60.94%
Health Net Community Solutions, Inc.—Sacramento 45.69% Health Net Community Solutions, Inc.—San Diego 55.16% Health Net Community Solutions, Inc.—San Joaquin 46.29%
Health Net Community Solutions, Inc.—Stanislaus 48.74% Health Net Community Solutions, Inc.—Tulare 72.47% Health Plan of San Joaquin—San Joaquin 55.50%
Health Plan of San Joaquin—Stanislaus 48.62% Health Plan of San Mateo—San Mateo 72.79%

PREVENTIVE SERVICES REPORT ADDENDUM
2020 Preventive Services Report Addendum Page 44 Property of the California Department of Health Care Services Health Services Advisory Group, Inc.
Stratification Rate
Inland Empire Health Plan—Riverside/San Bernardino 54.22%
Kaiser NorCal (KP Cal, LLC)—KP North 43.67% Kaiser SoCal (KP Cal, LLC)—San Diego 64.82%
Kern Health Systems, DBA Kern Family Health Care—Kern 70.21%
L.A. Care Health Plan—Los Angeles 63.33%
Molina Healthcare of California—Imperial 78.36% Molina Healthcare of California— Riverside/San Bernardino 50.23%
Molina Healthcare of California—Sacramento 51.47% Molina Healthcare of California—San Diego 70.87% Partnership HealthPlan of California—Northeast 21.41%
Partnership HealthPlan of California—Northwest 72.39% Partnership HealthPlan of California—Southeast 54.02% Partnership HealthPlan of California—Southwest 54.24%
San Francisco Health Plan—San Francisco 75.66% Santa Clara Family Health Plan—Santa Clara 62.36%
UnitedHealthcare Community Plan—San Diego 57.30%
HSAG-Calculated Indicators MCP Reporting Unit Results This section presents the MCP reporting unit-level results by indicator for reporting year 2020 (i.e., measurement year 2019 data). HSAG only included a member in an MCP reporting unit’s rate calculation if the member met the indicator’s continuous enrollment criteria with the MCP reporting unit. Table 1.13 through Table 1.21 display the statewide aggregate and 56 MCP reporting unit-level results for the six HSAG-calculated indicators.
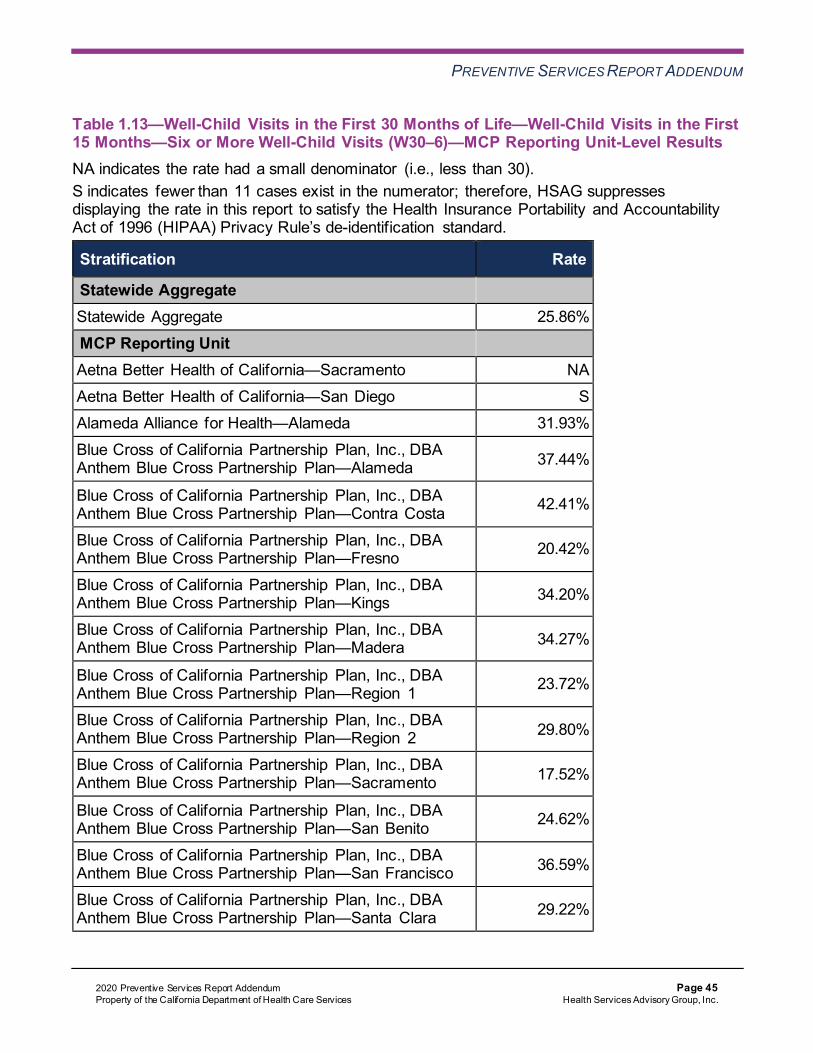
Well-Child Visits in the First 30 Months of Life—Well-Child Visits in the First 15 Months—Six or More Well-Child Visits
The Well-Child Visits in the First 30 Months of Life—Well-Child Visits in the First 15 Months—Six or More Well-Child Visits (W30–6) indicator measures the percentage of children who turned 15 months old during the measurement year who received six or more well-child visits with a primary care provider (PCP).
PREVENTIVE SERVICES REPORT ADDENDUM
2020 Preventive Services Report Addendum Page 45 Property of the California Department of Health Care Services Health Services Advisory Group, Inc.
Table 1.13—Well-Child Visits in the First 30 Months of Life—Well-Child Visits in the First 15 Months—Six or More Well-Child Visits (W30–6)—MCP Reporting Unit-Level Results NA indicates the rate had a small denominator (i.e., less than 30). S indicates fewer than 11 cases exist in the numerator; therefore, HSAG suppresses displaying the rate in this report to satisfy the Health Insurance Portability and Accountability Act of 1996 (HIPAA) Privacy Rule’s de-identification standard.
Stratification Rate
Statewide Aggregate Statewide Aggregate 25.86% MCP Reporting Unit Aetna Better Health of California—Sacramento NA Aetna Better Health of California—San Diego S Alameda Alliance for Health—Alameda 31.93% Blue Cross of California Partnership Plan, Inc., DBA Anthem Blue Cross Partnership Plan—Alameda 37.44%
Blue Cross of California Partnership Plan, Inc., DBA Anthem Blue Cross Partnership Plan—Contra Costa 42.41%
Blue Cross of California Partnership Plan, Inc., DBA Anthem Blue Cross Partnership Plan—Fresno 20.42%
Blue Cross of California Partnership Plan, Inc., DBA Anthem Blue Cross Partnership Plan—Kings 34.20%
Blue Cross of California Partnership Plan, Inc., DBA Anthem Blue Cross Partnership Plan—Madera 34.27%
Blue Cross of California Partnership Plan, Inc., DBA Anthem Blue Cross Partnership Plan—Region 1 23.72%
Blue Cross of California Partnership Plan, Inc., DBA Anthem Blue Cross Partnership Plan—Region 2 29.80%
Blue Cross of California Partnership Plan, Inc., DBA Anthem Blue Cross Partnership Plan—Sacramento 17.52%
Blue Cross of California Partnership Plan, Inc., DBA Anthem Blue Cross Partnership Plan—San Benito 24.62%
Blue Cross of California Partnership Plan, Inc., DBA Anthem Blue Cross Partnership Plan—San Francisco 36.59%
Blue Cross of California Partnership Plan, Inc., DBA Anthem Blue Cross Partnership Plan—Santa Clara 29.22%

PREVENTIVE SERVICES REPORT ADDENDUM
2020 Preventive Services Report Addendum Page 46 Property of the California Department of Health Care Services Health Services Advisory Group, Inc.
Stratification Rate
Blue Cross of California Partnership Plan, Inc., DBA Anthem Blue Cross Partnership Plan—Tulare 36.52%
Blue Shield of California Promise Health Plan (prior to January 1, 2019, known as Care1st Health Plan)— San Diego
41.98%
CalOptima—Orange 21.39% CalViva Health—Fresno 29.31% CalViva Health—Kings 46.78% CalViva Health—Madera 44.76% California Health & Wellness Plan—Imperial 38.09%
California Health & Wellness Plan—Region 1 24.92% California Health & Wellness Plan—Region 2 42.17% CenCal Health—San Luis Obispo 41.76% CenCal Health—Santa Barbara 45.13% Central California Alliance for Health—Merced 21.53% Central California Alliance for Health— Monterey/Santa Cruz 26.90%
Community Health Group Partnership Plan—San Diego 38.43% Contra Costa Health Plan—Contra Costa 45.95% Gold Coast Health Plan—Ventura 48.98% Health Net Community Solutions, Inc.—Kern 17.63% Health Net Community Solutions, Inc.—Los Angeles 24.78% Health Net Community Solutions, Inc.—Sacramento 19.98%
Health Net Community Solutions, Inc.—San Diego 24.18% Health Net Community Solutions, Inc.—San Joaquin 27.34% Health Net Community Solutions, Inc.—Stanislaus 34.19% Health Net Community Solutions, Inc.—Tulare 43.49% Health Plan of San Joaquin—San Joaquin 25.15% Health Plan of San Joaquin—Stanislaus 31.83% Health Plan of San Mateo—San Mateo 42.79% Inland Empire Health Plan—Riverside/San Bernardino 10.74%

PREVENTIVE SERVICES REPORT ADDENDUM
2020 Preventive Services Report Addendum Page 47 Property of the California Department of Health Care Services Health Services Advisory Group, Inc.
Stratification Rate
Kaiser NorCal (KP Cal, LLC)—KP North 3.51% Kaiser SoCal (KP Cal, LLC)—San Diego 27.99% Kern Health Systems, DBA Kern Family Health Care— Kern 17.62%
L.A. Care Health Plan—Los Angeles 26.43% Molina Healthcare of California—Imperial 36.08% Molina Healthcare of California— Riverside/San Bernardino 10.54%
Molina Healthcare of California—Sacramento 12.10% Molina Healthcare of California—San Diego 30.61% Partnership HealthPlan of California—Northeast 9.09% Partnership HealthPlan of California—Northwest 9.64% Partnership HealthPlan of California—Southeast 20.22%
Partnership HealthPlan of California—Southwest 33.39% San Francisco Health Plan—San Francisco 51.79% Santa Clara Family Health Plan—Santa Clara 26.25% UnitedHealthcare Community Plan—San Diego 42.00%

PREVENTIVE SERVICES REPORT ADDENDUM
2020 Preventive Services Report Addendum Page 48 Property of the California Department of Health Care Services Health Services Advisory Group, Inc.
Well-Child Visits in the First 30 Months of Life—Well-Child Visits for Age 15 to 30 Months—Two or More Well-Child Visits
The Well-Child Visits in the First 30 Months of Life—Well-Child Visits for Age 15 to 30 Months—Two or More Well-Child Visits (W30–2) measures the percentage of children who turned 30 months old during the measurement year who received two or more well-child visits with a PCP.
Table 1.14—Well-Child Visits in the First 30 Months of Life—Well-Child Visits for Age 15 to 30 Months—Two or More Well-Child Visits (W30–2)—MCP Reporting Unit-Level Results NA indicates the rate had a small denominator (i.e., less than 30).
Stratification Rate
Statewide Aggregate Statewide Aggregate 63.13% MCP Reporting Unit Aetna Better Health of California—Sacramento NA Aetna Better Health of California—San Diego 43.59% Alameda Alliance for Health—Alameda 70.29% Blue Cross of California Partnership Plan, Inc., DBA Anthem Blue Cross Partnership Plan—Alameda 64.63%
Blue Cross of California Partnership Plan, Inc., DBA Anthem Blue Cross Partnership Plan—Contra Costa 74.19%
Blue Cross of California Partnership Plan, Inc., DBA Anthem Blue Cross Partnership Plan—Fresno 61.91%
Blue Cross of California Partnership Plan, Inc., DBA Anthem Blue Cross Partnership Plan—Kings 64.58%
Blue Cross of California Partnership Plan, Inc., DBA Anthem Blue Cross Partnership Plan—Madera 77.68%
Blue Cross of California Partnership Plan, Inc., DBA Anthem Blue Cross Partnership Plan—Region 1 66.32%
Blue Cross of California Partnership Plan, Inc., DBA Anthem Blue Cross Partnership Plan—Region 2 65.56%
Blue Cross of California Partnership Plan, Inc., DBA Anthem Blue Cross Partnership Plan—Sacramento 65.95%
Blue Cross of California Partnership Plan, Inc., DBA Anthem Blue Cross Partnership Plan—San Benito 60.39%

PREVENTIVE SERVICES REPORT ADDENDUM
2020 Preventive Services Report Addendum Page 49 Property of the California Department of Health Care Services Health Services Advisory Group, Inc.
Stratification Rate
Blue Cross of California Partnership Plan, Inc., DBA Anthem Blue Cross Partnership Plan—San Francisco 73.76%
Blue Cross of California Partnership Plan, Inc., DBA Anthem Blue Cross Partnership Plan—Santa Clara 70.79%
Blue Cross of California Partnership Plan, Inc., DBA Anthem Blue Cross Partnership Plan—Tulare 69.12%
Blue Shield of California Promise Health Plan (prior to January 1, 2019, known as Care1st Health Plan)— San Diego
58.56%
CalOptima—Orange 54.20% CalViva Health—Fresno 62.23% CalViva Health—Kings 60.65% CalViva Health—Madera 78.79% California Health & Wellness Plan—Imperial 74.17% California Health & Wellness Plan—Region 1 69.24% California Health & Wellness Plan—Region 2 63.32% CenCal Health—San Luis Obispo 75.33% CenCal Health—Santa Barbara 82.24% Central California Alliance for Health—Merced 60.55% Central California Alliance for Health— Monterey/Santa Cruz 81.82%
Community Health Group Partnership Plan—San Diego 69.76% Contra Costa Health Plan—Contra Costa 68.98% Gold Coast Health Plan—Ventura 70.84% Health Net Community Solutions, Inc.—Kern 52.12% Health Net Community Solutions, Inc.—Los Angeles 59.93% Health Net Community Solutions, Inc.—Sacramento 63.92% Health Net Community Solutions, Inc.—San Diego 63.52% Health Net Community Solutions, Inc.—San Joaquin 59.92% Health Net Community Solutions, Inc.—Stanislaus 55.55% Health Net Community Solutions, Inc.—Tulare 70.61% Health Plan of San Joaquin—San Joaquin 66.14%

PREVENTIVE SERVICES REPORT ADDENDUM
2020 Preventive Services Report Addendum Page 50 Property of the California Department of Health Care Services Health Services Advisory Group, Inc.
Stratification Rate
Health Plan of San Joaquin—Stanislaus 63.49% Health Plan of San Mateo—San Mateo 75.28% Inland Empire Health Plan—Riverside/San Bernardino 52.87%
Kaiser NorCal (KP Cal, LLC)—KP North 67.22% Kaiser SoCal (KP Cal, LLC)—San Diego 66.23% Kern Health Systems, DBA Kern Family Health Care— Kern 60.22%
L.A. Care Health Plan—Los Angeles 62.82% Molina Healthcare of California—Imperial 64.22% Molina Healthcare of California— Riverside/San Bernardino 48.31%
Molina Healthcare of California—Sacramento 53.94% Molina Healthcare of California—San Diego 67.76%
Partnership HealthPlan of California—Northeast 60.22% Partnership HealthPlan of California—Northwest 51.72% Partnership HealthPlan of California—Southeast 62.23% Partnership HealthPlan of California—Southwest 70.18% San Francisco Health Plan—San Francisco 84.54% Santa Clara Family Health Plan—Santa Clara 75.96% UnitedHealthcare Community Plan—San Diego 48.65%

PREVENTIVE SERVICES REPORT ADDENDUM
2020 Preventive Services Report Addendum Page 51 Property of the California Department of Health Care Services Health Services Advisory Group, Inc.
Child and Adolescent Well-Care Visits
The Child and Adolescent Well-Care Visits (WCV) indicator measures the percentage of children ages 3 to 21 years who had at least one comprehensive well-care visit with a PCP or an obstetrician/gynecologist (OB/GYN) practitioner during the measurement year. Table 1.15 through Table 1.18 display the MCP reporting-unit level results for the 3 to 6 Years, 7 to 11 Years, 12 to 21 Years, and Total indicators.
Table 1.15—Child and Adolescent Well-Care Visits—3 to 6 Years (WCV–36)—MCP Reporting-Unit Level Results
Stratification Rate
Statewide Aggregate Statewide Aggregate 68.12% MCP Reporting Unit Aetna Better Health of California—Sacramento 55.79% Aetna Better Health of California—San Diego 50.53% Alameda Alliance for Health—Alameda 73.63% Blue Cross of California Partnership Plan, Inc., DBA Anthem Blue Cross Partnership Plan—Alameda 64.43%
Blue Cross of California Partnership Plan, Inc., DBA Anthem Blue Cross Partnership Plan—Contra Costa 68.04%
Blue Cross of California Partnership Plan, Inc., DBA Anthem Blue Cross Partnership Plan—Fresno 62.84%
Blue Cross of California Partnership Plan, Inc., DBA Anthem Blue Cross Partnership Plan—Kings 63.58%
Blue Cross of California Partnership Plan, Inc., DBA Anthem Blue Cross Partnership Plan—Madera 74.97%
Blue Cross of California Partnership Plan, Inc., DBA Anthem Blue Cross Partnership Plan—Region 1 67.38%
Blue Cross of California Partnership Plan, Inc., DBA Anthem Blue Cross Partnership Plan—Region 2 63.63%
Blue Cross of California Partnership Plan, Inc., DBA Anthem Blue Cross Partnership Plan—Sacramento 68.03%
Blue Cross of California Partnership Plan, Inc., DBA Anthem Blue Cross Partnership Plan—San Benito 62.32%
Blue Cross of California Partnership Plan, Inc., DBA Anthem Blue Cross Partnership Plan—San Francisco 67.54%

PREVENTIVE SERVICES REPORT ADDENDUM
2020 Preventive Services Report Addendum Page 52 Property of the California Department of Health Care Services Health Services Advisory Group, Inc.
Stratification Rate
Blue Cross of California Partnership Plan, Inc., DBA Anthem Blue Cross Partnership Plan—Santa Clara 67.77%
Blue Cross of California Partnership Plan, Inc., DBA Anthem Blue Cross Partnership Plan—Tulare 68.64%
Blue Shield of California Promise Health Plan (prior to January 1, 2019, known as Care1st Health Plan)— San Diego
62.26%
CalOptima—Orange 69.36% CalViva Health—Fresno 66.25% CalViva Health—Kings 66.49% CalViva Health—Madera 81.69% California Health & Wellness Plan—Imperial 73.12% California Health & Wellness Plan—Region 1 67.26% California Health & Wellness Plan—Region 2 61.88% CenCal Health—San Luis Obispo 74.93% CenCal Health—Santa Barbara 79.55% Central California Alliance for Health—Merced 68.43% Central California Alliance for Health— Monterey/Santa Cruz 76.37%
Community Health Group Partnership Plan—San Diego 74.88%
Contra Costa Health Plan—Contra Costa 72.06% Gold Coast Health Plan—Ventura 70.83% Health Net Community Solutions, Inc.—Kern 60.75% Health Net Community Solutions, Inc.—Los Angeles 63.05% Health Net Community Solutions, Inc.—Sacramento 70.50% Health Net Community Solutions, Inc.—San Diego 65.76% Health Net Community Solutions, Inc.—San Joaquin 61.26% Health Net Community Solutions, Inc.—Stanislaus 62.70% Health Net Community Solutions, Inc.—Tulare 72.37% Health Plan of San Joaquin—San Joaquin 68.65% Health Plan of San Joaquin—Stanislaus 66.21%
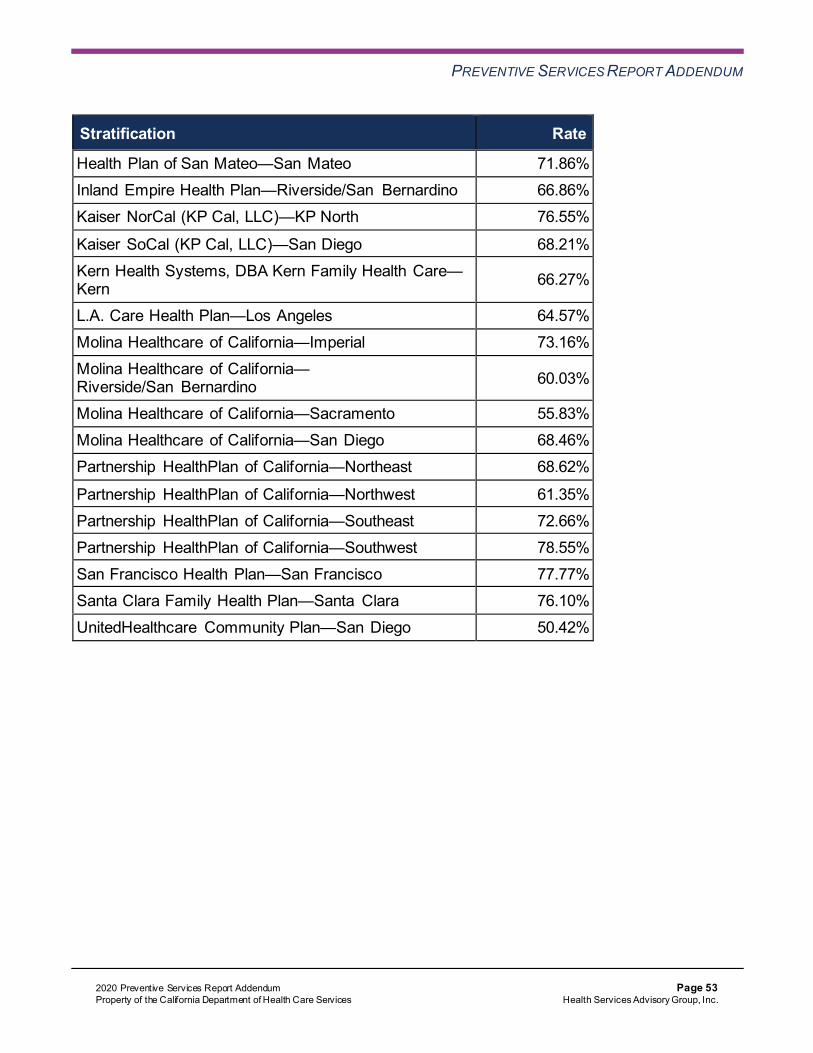
PREVENTIVE SERVICES REPORT ADDENDUM
2020 Preventive Services Report Addendum Page 53 Property of the California Department of Health Care Services Health Services Advisory Group, Inc.
Stratification Rate
Health Plan of San Mateo—San Mateo 71.86% Inland Empire Health Plan—Riverside/San Bernardino 66.86% Kaiser NorCal (KP Cal, LLC)—KP North 76.55%
Kaiser SoCal (KP Cal, LLC)—San Diego 68.21% Kern Health Systems, DBA Kern Family Health Care— Kern 66.27%
L.A. Care Health Plan—Los Angeles 64.57% Molina Healthcare of California—Imperial 73.16% Molina Healthcare of California— Riverside/San Bernardino 60.03%
Molina Healthcare of California—Sacramento 55.83% Molina Healthcare of California—San Diego 68.46% Partnership HealthPlan of California—Northeast 68.62%
Partnership HealthPlan of California—Northwest 61.35% Partnership HealthPlan of California—Southeast 72.66% Partnership HealthPlan of California—Southwest 78.55% San Francisco Health Plan—San Francisco 77.77% Santa Clara Family Health Plan—Santa Clara 76.10% UnitedHealthcare Community Plan—San Diego 50.42%
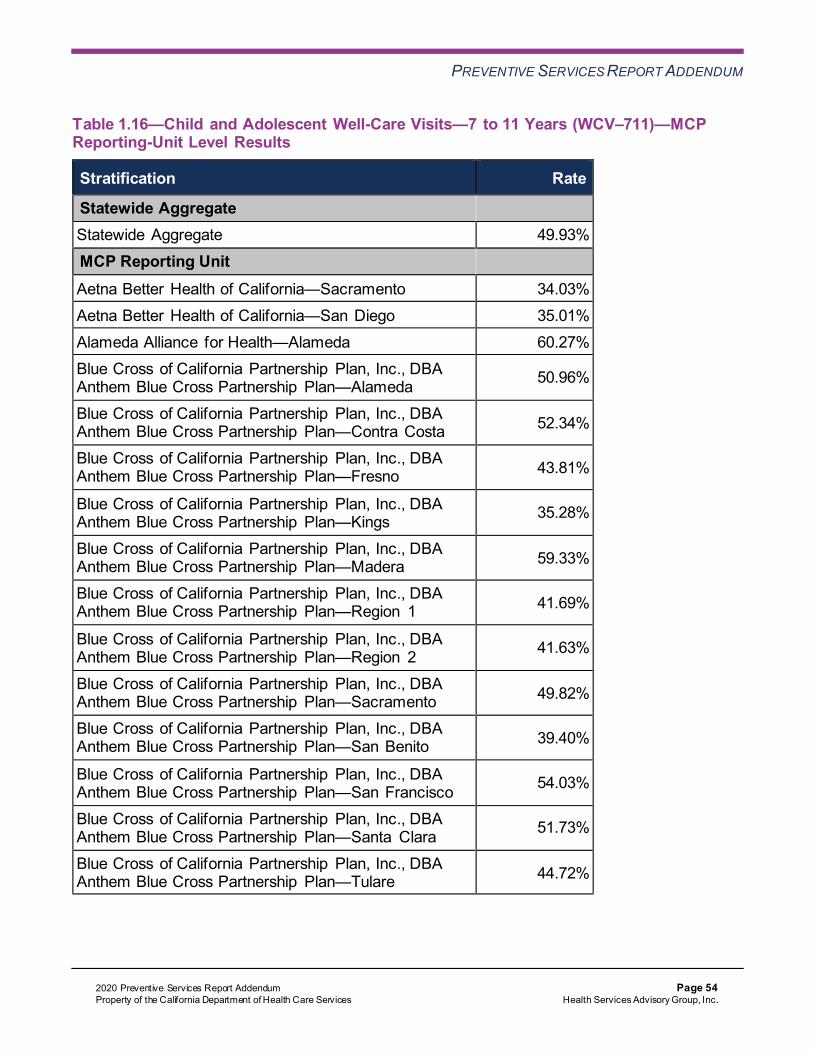
PREVENTIVE SERVICES REPORT ADDENDUM
2020 Preventive Services Report Addendum Page 54 Property of the California Department of Health Care Services Health Services Advisory Group, Inc.
Table 1.16—Child and Adolescent Well-Care Visits—7 to 11 Years (WCV–711)—MCP Reporting-Unit Level Results
Stratification Rate
Statewide Aggregate Statewide Aggregate 49.93% MCP Reporting Unit Aetna Better Health of California—Sacramento 34.03% Aetna Better Health of California—San Diego 35.01% Alameda Alliance for Health—Alameda 60.27% Blue Cross of California Partnership Plan, Inc., DBA Anthem Blue Cross Partnership Plan—Alameda 50.96%
Blue Cross of California Partnership Plan, Inc., DBA Anthem Blue Cross Partnership Plan—Contra Costa 52.34%
Blue Cross of California Partnership Plan, Inc., DBA Anthem Blue Cross Partnership Plan—Fresno 43.81%
Blue Cross of California Partnership Plan, Inc., DBA Anthem Blue Cross Partnership Plan—Kings 35.28%
Blue Cross of California Partnership Plan, Inc., DBA Anthem Blue Cross Partnership Plan—Madera 59.33%
Blue Cross of California Partnership Plan, Inc., DBA Anthem Blue Cross Partnership Plan—Region 1 41.69%
Blue Cross of California Partnership Plan, Inc., DBA Anthem Blue Cross Partnership Plan—Region 2 41.63%
Blue Cross of California Partnership Plan, Inc., DBA Anthem Blue Cross Partnership Plan—Sacramento 49.82%
Blue Cross of California Partnership Plan, Inc., DBA Anthem Blue Cross Partnership Plan—San Benito 39.40%
Blue Cross of California Partnership Plan, Inc., DBA Anthem Blue Cross Partnership Plan—San Francisco 54.03%
Blue Cross of California Partnership Plan, Inc., DBA Anthem Blue Cross Partnership Plan—Santa Clara 51.73%
Blue Cross of California Partnership Plan, Inc., DBA Anthem Blue Cross Partnership Plan—Tulare 44.72%

PREVENTIVE SERVICES REPORT ADDENDUM
2020 Preventive Services Report Addendum Page 55 Property of the California Department of Health Care Services Health Services Advisory Group, Inc.
Stratification Rate
Blue Shield of California Promise Health Plan (prior to January 1, 2019, known as Care1st Health Plan)— San Diego
45.03%
CalOptima—Orange 55.78% CalViva Health—Fresno 47.69% CalViva Health—Kings 36.89% CalViva Health—Madera 63.63% California Health & Wellness Plan—Imperial 41.35% California Health & Wellness Plan—Region 1 41.10% California Health & Wellness Plan—Region 2 37.58% CenCal Health—San Luis Obispo 60.46% CenCal Health—Santa Barbara 67.34% Central California Alliance for Health—Merced 46.79%
Central California Alliance for Health— Monterey/Santa Cruz 65.07%
Community Health Group Partnership Plan—San Diego 55.04% Contra Costa Health Plan—Contra Costa 52.89% Gold Coast Health Plan—Ventura 48.80% Health Net Community Solutions, Inc.—Kern 36.96% Health Net Community Solutions, Inc.—Los Angeles 49.09% Health Net Community Solutions, Inc.—Sacramento 51.82% Health Net Community Solutions, Inc.—San Diego 51.11% Health Net Community Solutions, Inc.—San Joaquin 36.48% Health Net Community Solutions, Inc.—Stanislaus 39.36% Health Net Community Solutions, Inc.—Tulare 46.34% Health Plan of San Joaquin—San Joaquin 48.19%
Health Plan of San Joaquin—Stanislaus 44.00% Health Plan of San Mateo—San Mateo 60.00% Inland Empire Health Plan—Riverside/San Bernardino 44.28% Kaiser NorCal (KP Cal, LLC)—KP North 58.70% Kaiser SoCal (KP Cal, LLC)—San Diego 45.03%

PREVENTIVE SERVICES REPORT ADDENDUM
2020 Preventive Services Report Addendum Page 56 Property of the California Department of Health Care Services Health Services Advisory Group, Inc.
Stratification Rate
Kern Health Systems, DBA Kern Family Health Care— Kern 40.88%
L.A. Care Health Plan—Los Angeles 50.10% Molina Healthcare of California—Imperial 37.58% Molina Healthcare of California— Riverside/San Bernardino 41.56%
Molina Healthcare of California—Sacramento 42.53% Molina Healthcare of California—San Diego 51.86% Partnership HealthPlan of California—Northeast 33.89% Partnership HealthPlan of California—Northwest 37.96% Partnership HealthPlan of California—Southeast 52.30% Partnership HealthPlan of California—Southwest 53.50% San Francisco Health Plan—San Francisco 63.04%
Santa Clara Family Health Plan—Santa Clara 60.49% UnitedHealthcare Community Plan—San Diego 35.20%

PREVENTIVE SERVICES REPORT ADDENDUM
2020 Preventive Services Report Addendum Page 57 Property of the California Department of Health Care Services Health Services Advisory Group, Inc.
Table 1.17—Child and Adolescent Well-Care Visits—12 to 21 Years (WCV–1221)—MCP Reporting-Unit Level Results
Stratification Rate
Statewide Aggregate Statewide Aggregate 43.39% MCP Reporting Unit Aetna Better Health of California—Sacramento 26.17% Aetna Better Health of California—San Diego 29.03% Alameda Alliance for Health—Alameda 50.49% Blue Cross of California Partnership Plan, Inc., DBA Anthem Blue Cross Partnership Plan—Alameda 40.95%
Blue Cross of California Partnership Plan, Inc., DBA Anthem Blue Cross Partnership Plan—Contra Costa 41.63%
Blue Cross of California Partnership Plan, Inc., DBA Anthem Blue Cross Partnership Plan—Fresno 33.36%
Blue Cross of California Partnership Plan, Inc., DBA Anthem Blue Cross Partnership Plan—Kings 30.97%
Blue Cross of California Partnership Plan, Inc., DBA Anthem Blue Cross Partnership Plan—Madera 52.56%
Blue Cross of California Partnership Plan, Inc., DBA Anthem Blue Cross Partnership Plan—Region 1 34.63%
Blue Cross of California Partnership Plan, Inc., DBA Anthem Blue Cross Partnership Plan—Region 2 36.31%
Blue Cross of California Partnership Plan, Inc., DBA Anthem Blue Cross Partnership Plan—Sacramento 43.38%
Blue Cross of California Partnership Plan, Inc., DBA Anthem Blue Cross Partnership Plan—San Benito 33.66%
Blue Cross of California Partnership Plan, Inc., DBA Anthem Blue Cross Partnership Plan—San Francisco 44.52%
Blue Cross of California Partnership Plan, Inc., DBA Anthem Blue Cross Partnership Plan—Santa Clara 41.02%
Blue Cross of California Partnership Plan, Inc., DBA Anthem Blue Cross Partnership Plan—Tulare 38.55%

PREVENTIVE SERVICES REPORT ADDENDUM
2020 Preventive Services Report Addendum Page 58 Property of the California Department of Health Care Services Health Services Advisory Group, Inc.
Stratification Rate
Blue Shield of California Promise Health Plan (prior to January 1, 2019, known as Care1st Health Plan)— San Diego
36.19%
CalOptima—Orange 49.26% CalViva Health—Fresno 40.19% CalViva Health—Kings 33.24% CalViva Health—Madera 51.61% California Health & Wellness Plan—Imperial 34.62% California Health & Wellness Plan—Region 1 32.18% California Health & Wellness Plan—Region 2 33.51% CenCal Health—San Luis Obispo 53.32% CenCal Health—Santa Barbara 51.96% Central California Alliance for Health—Merced 44.29%
Central California Alliance for Health— Monterey/Santa Cruz 54.07%
Community Health Group Partnership Plan—San Diego 54.89% Contra Costa Health Plan—Contra Costa 42.70% Gold Coast Health Plan—Ventura 41.56% Health Net Community Solutions, Inc.—Kern 32.30% Health Net Community Solutions, Inc.—Los Angeles 41.52% Health Net Community Solutions, Inc.—Sacramento 45.37% Health Net Community Solutions, Inc.—San Diego 43.05% Health Net Community Solutions, Inc.—San Joaquin 31.59% Health Net Community Solutions, Inc.—Stanislaus 35.04% Health Net Community Solutions, Inc.—Tulare 40.29% Health Plan of San Joaquin—San Joaquin 42.33%
Health Plan of San Joaquin—Stanislaus 37.65% Health Plan of San Mateo—San Mateo 49.11% Inland Empire Health Plan—Riverside/San Bernardino 41.33% Kaiser NorCal (KP Cal, LLC)—KP North 51.02% Kaiser SoCal (KP Cal, LLC)—San Diego 43.47%

PREVENTIVE SERVICES REPORT ADDENDUM
2020 Preventive Services Report Addendum Page 59 Property of the California Department of Health Care Services Health Services Advisory Group, Inc.
Stratification Rate
Kern Health Systems, DBA Kern Family Health Care— Kern 37.45%
L.A. Care Health Plan—Los Angeles 42.88% Molina Healthcare of California—Imperial 38.13% Molina Healthcare of California— Riverside/San Bernardino 36.91%
Molina Healthcare of California—Sacramento 35.41% Molina Healthcare of California—San Diego 44.90% Partnership HealthPlan of California—Northeast 29.76% Partnership HealthPlan of California—Northwest 33.49% Partnership HealthPlan of California—Southeast 44.75% Partnership HealthPlan of California—Southwest 45.33% San Francisco Health Plan—San Francisco 56.43%
Santa Clara Family Health Plan—Santa Clara 50.25% UnitedHealthcare Community Plan—San Diego 33.99%

PREVENTIVE SERVICES REPORT ADDENDUM
2020 Preventive Services Report Addendum Page 60 Property of the California Department of Health Care Services Health Services Advisory Group, Inc.
Table 1.18—Child and Adolescent Well-Care Visits—Total (WCV–Tot)—MCP Reporting Unit-Level Results
Stratification Rate
Statewide Aggregate Statewide Aggregate 50.61% MCP Reporting Unit Aetna Better Health of California—Sacramento 35.64% Aetna Better Health of California—San Diego 36.12% Alameda Alliance for Health—Alameda 58.28% Blue Cross of California Partnership Plan, Inc., DBA Anthem Blue Cross Partnership Plan—Alameda 48.85%
Blue Cross of California Partnership Plan, Inc., DBA Anthem Blue Cross Partnership Plan—Contra Costa 50.39%
Blue Cross of California Partnership Plan, Inc., DBA Anthem Blue Cross Partnership Plan—Fresno 42.62%
Blue Cross of California Partnership Plan, Inc., DBA Anthem Blue Cross Partnership Plan—Kings 39.40%
Blue Cross of California Partnership Plan, Inc., DBA Anthem Blue Cross Partnership Plan—Madera 59.56%
Blue Cross of California Partnership Plan, Inc., DBA Anthem Blue Cross Partnership Plan—Region 1 43.71%
Blue Cross of California Partnership Plan, Inc., DBA Anthem Blue Cross Partnership Plan—Region 2 44.13%
Blue Cross of California Partnership Plan, Inc., DBA Anthem Blue Cross Partnership Plan—Sacramento 51.34%
Blue Cross of California Partnership Plan, Inc., DBA Anthem Blue Cross Partnership Plan—San Benito 42.16%
Blue Cross of California Partnership Plan, Inc., DBA Anthem Blue Cross Partnership Plan—San Francisco 51.45%
Blue Cross of California Partnership Plan, Inc., DBA Anthem Blue Cross Partnership Plan—Santa Clara 49.22%
Blue Cross of California Partnership Plan, Inc., DBA Anthem Blue Cross Partnership Plan—Tulare 46.27%

PREVENTIVE SERVICES REPORT ADDENDUM
2020 Preventive Services Report Addendum Page 61 Property of the California Department of Health Care Services Health Services Advisory Group, Inc.
Stratification Rate
Blue Shield of California Promise Health Plan (prior to January 1, 2019, known as Care1st Health Plan)— San Diego
44.63%
CalOptima—Orange 55.08% CalViva Health—Fresno 48.68% CalViva Health—Kings 41.78% CalViva Health—Madera 62.34% California Health & Wellness Plan—Imperial 45.21% California Health & Wellness Plan—Region 1 43.15% California Health & Wellness Plan—Region 2 41.02% CenCal Health—San Luis Obispo 60.22% CenCal Health—Santa Barbara 62.96% Central California Alliance for Health—Merced 50.40%
Central California Alliance for Health— Monterey/Santa Cruz 62.44%
Community Health Group Partnership Plan—San Diego 59.02% Contra Costa Health Plan—Contra Costa 51.96% Gold Coast Health Plan—Ventura 49.95% Health Net Community Solutions, Inc.—Kern 39.74% Health Net Community Solutions, Inc.—Los Angeles 47.89% Health Net Community Solutions, Inc.—Sacramento 53.01% Health Net Community Solutions, Inc.—San Diego 50.31% Health Net Community Solutions, Inc.—San Joaquin 39.68% Health Net Community Solutions, Inc.—Stanislaus 41.53% Health Net Community Solutions, Inc.—Tulare 49.60% Health Plan of San Joaquin—San Joaquin 50.00%
Health Plan of San Joaquin—Stanislaus 46.36% Health Plan of San Mateo—San Mateo 57.00% Inland Empire Health Plan—Riverside/San Bernardino 47.87% Kaiser NorCal (KP Cal, LLC)—KP North 59.16% Kaiser SoCal (KP Cal, LLC)—San Diego 49.33%

PREVENTIVE SERVICES REPORT ADDENDUM
2020 Preventive Services Report Addendum Page 62 Property of the California Department of Health Care Services Health Services Advisory Group, Inc.
Stratification Rate
Kern Health Systems, DBA Kern Family Health Care— Kern 45.32%
L.A. Care Health Plan—Los Angeles 49.42% Molina Healthcare of California—Imperial 45.75% Molina Healthcare of California— Riverside/San Bernardino 42.24%
Molina Healthcare of California—Sacramento 41.84% Molina Healthcare of California—San Diego 52.32% Partnership HealthPlan of California—Northeast 40.31% Partnership HealthPlan of California—Northwest 41.47% Partnership HealthPlan of California—Southeast 53.17% Partnership HealthPlan of California—Southwest 54.91% San Francisco Health Plan—San Francisco 63.16%
Santa Clara Family Health Plan—Santa Clara 58.36% UnitedHealthcare Community Plan—San Diego 38.05%

PREVENTIVE SERVICES REPORT ADDENDUM
2020 Preventive Services Report Addendum Page 63 Property of the California Department of Health Care Services Health Services Advisory Group, Inc.
Alcohol Use Screening
The Alcohol Use Screening (AUS) indicator measures the percentage of children ages 18 to 21 years who had one or more screenings for alcohol use during the measurement year. Due to a lack of reporting within administrative data sources (i.e., medical record review [MRR] or electronic health record [EHR] data could be necessary to capture this information), exercise caution when evaluating results as they may be more indicative of data completeness rather than performance.
Table 1.19—Alcohol Use Screening (AUS)—MCP Reporting Unit-Level Results S indicates fewer than 11 cases exist in the numerator; therefore, HSAG suppresses displaying the rate in this report to satisfy the Health Insurance Portability and Accountability Act of 1996 (HIPAA) Privacy Rule’s de-identification standard.
Stratification Rate
Statewide Aggregate Statewide Aggregate 1.80% MCP Reporting Unit Aetna Better Health of California—Sacramento S Aetna Better Health of California—San Diego S
Alameda Alliance for Health—Alameda 1.99% Blue Cross of California Partnership Plan, Inc., DBA Anthem Blue Cross Partnership Plan—Alameda 3.80%
Blue Cross of California Partnership Plan, Inc., DBA Anthem Blue Cross Partnership Plan—Contra Costa 6.70%
Blue Cross of California Partnership Plan, Inc., DBA Anthem Blue Cross Partnership Plan—Fresno S
Blue Cross of California Partnership Plan, Inc., DBA Anthem Blue Cross Partnership Plan—Kings 0.00%
Blue Cross of California Partnership Plan, Inc., DBA Anthem Blue Cross Partnership Plan—Madera 0.00%
Blue Cross of California Partnership Plan, Inc., DBA Anthem Blue Cross Partnership Plan—Region 1 S
Blue Cross of California Partnership Plan, Inc., DBA Anthem Blue Cross Partnership Plan—Region 2 1.92%
Blue Cross of California Partnership Plan, Inc., DBA Anthem Blue Cross Partnership Plan—Sacramento 1.07%

PREVENTIVE SERVICES REPORT ADDENDUM
2020 Preventive Services Report Addendum Page 64 Property of the California Department of Health Care Services Health Services Advisory Group, Inc.
Stratification Rate
Blue Cross of California Partnership Plan, Inc., DBA Anthem Blue Cross Partnership Plan—San Benito 0.00%
Blue Cross of California Partnership Plan, Inc., DBA Anthem Blue Cross Partnership Plan—San Francisco S
Blue Cross of California Partnership Plan, Inc., DBA Anthem Blue Cross Partnership Plan—Santa Clara S
Blue Cross of California Partnership Plan, Inc., DBA Anthem Blue Cross Partnership Plan—Tulare 0.00%
Blue Shield of California Promise Health Plan (prior to January 1, 2019, known as Care1st Health Plan)— San Diego
5.22%
CalOptima—Orange 4.69% CalViva Health—Fresno 0.12% CalViva Health—Kings S CalViva Health—Madera 0.00% California Health & Wellness Plan—Imperial 0.00% California Health & Wellness Plan—Region 1 S
California Health & Wellness Plan—Region 2 0.80% CenCal Health—San Luis Obispo 0.94% CenCal Health—Santa Barbara 2.55% Central California Alliance for Health—Merced 1.58% Central California Alliance for Health— Monterey/Santa Cruz 9.64%
Community Health Group Partnership Plan—San Diego 4.26% Contra Costa Health Plan—Contra Costa 2.32% Gold Coast Health Plan—Ventura 0.52% Health Net Community Solutions, Inc.—Kern S Health Net Community Solutions, Inc.—Los Angeles 0.78% Health Net Community Solutions, Inc.—Sacramento 2.49% Health Net Community Solutions, Inc.—San Diego 1.84%
Health Net Community Solutions, Inc.—San Joaquin 0.00% Health Net Community Solutions, Inc.—Stanislaus 1.56%

PREVENTIVE SERVICES REPORT ADDENDUM
2020 Preventive Services Report Addendum Page 65 Property of the California Department of Health Care Services Health Services Advisory Group, Inc.
Stratification Rate
Health Net Community Solutions, Inc.—Tulare S Health Plan of San Joaquin—San Joaquin S Health Plan of San Joaquin—Stanislaus 1.37%
Health Plan of San Mateo—San Mateo 1.75% Inland Empire Health Plan—Riverside/San Bernardino 2.37% Kaiser NorCal (KP Cal, LLC)—KP North 0.00% Kaiser SoCal (KP Cal, LLC)—San Diego 0.00% Kern Health Systems, DBA Kern Family Health Care— Kern 0.25%
L.A. Care Health Plan—Los Angeles 0.80% Molina Healthcare of California—Imperial 0.00% Molina Healthcare of California— Riverside/San Bernardino 2.73%
Molina Healthcare of California—Sacramento 0.63% Molina Healthcare of California—San Diego 3.93% Partnership HealthPlan of California—Northeast 1.20% Partnership HealthPlan of California—Northwest 4.23% Partnership HealthPlan of California—Southeast 1.71% Partnership HealthPlan of California—Southwest 4.08% San Francisco Health Plan—San Francisco S Santa Clara Family Health Plan—Santa Clara S UnitedHealthcare Community Plan—San Diego S

PREVENTIVE SERVICES REPORT ADDENDUM
2020 Preventive Services Report Addendum Page 66 Property of the California Department of Health Care Services Health Services Advisory Group, Inc.
Dental Fluoride Varnish
The Dental Fluoride Varnish (DFV) indicator measures the percentage of children 6 months of age as of January 1 of the measurement year to 5 years of age as of December 31 of the measurement year who had one or more applications of dental fluoride varnish administered by a medical provider during the measurement year. This indicator relied on using both CPT and Code on Dental Procedures and Nomenclature (CDT) codes and included dental data.
Table 1.20—Dental Fluoride Varnish (DFV)—MCP Reporting Unit-Level Results
Stratification Rate
Statewide Aggregate Statewide Aggregate 23.00% MCP Reporting Unit Aetna Better Health of California—Sacramento 23.66% Aetna Better Health of California—San Diego 5.51% Alameda Alliance for Health—Alameda 14.56% Blue Cross of California Partnership Plan, Inc., DBA Anthem Blue Cross Partnership Plan—Alameda 12.95%
Blue Cross of California Partnership Plan, Inc., DBA Anthem Blue Cross Partnership Plan—Contra Costa 17.91%
Blue Cross of California Partnership Plan, Inc., DBA Anthem Blue Cross Partnership Plan—Fresno 31.59%
Blue Cross of California Partnership Plan, Inc., DBA Anthem Blue Cross Partnership Plan—Kings 9.43%
Blue Cross of California Partnership Plan, Inc., DBA Anthem Blue Cross Partnership Plan—Madera 39.36%
Blue Cross of California Partnership Plan, Inc., DBA Anthem Blue Cross Partnership Plan—Region 1 15.49%
Blue Cross of California Partnership Plan, Inc., DBA Anthem Blue Cross Partnership Plan—Region 2 19.57%
Blue Cross of California Partnership Plan, Inc., DBA Anthem Blue Cross Partnership Plan—Sacramento 26.93%
Blue Cross of California Partnership Plan, Inc., DBA Anthem Blue Cross Partnership Plan—San Benito 10.75%
Blue Cross of California Partnership Plan, Inc., DBA Anthem Blue Cross Partnership Plan—San Francisco 20.49%
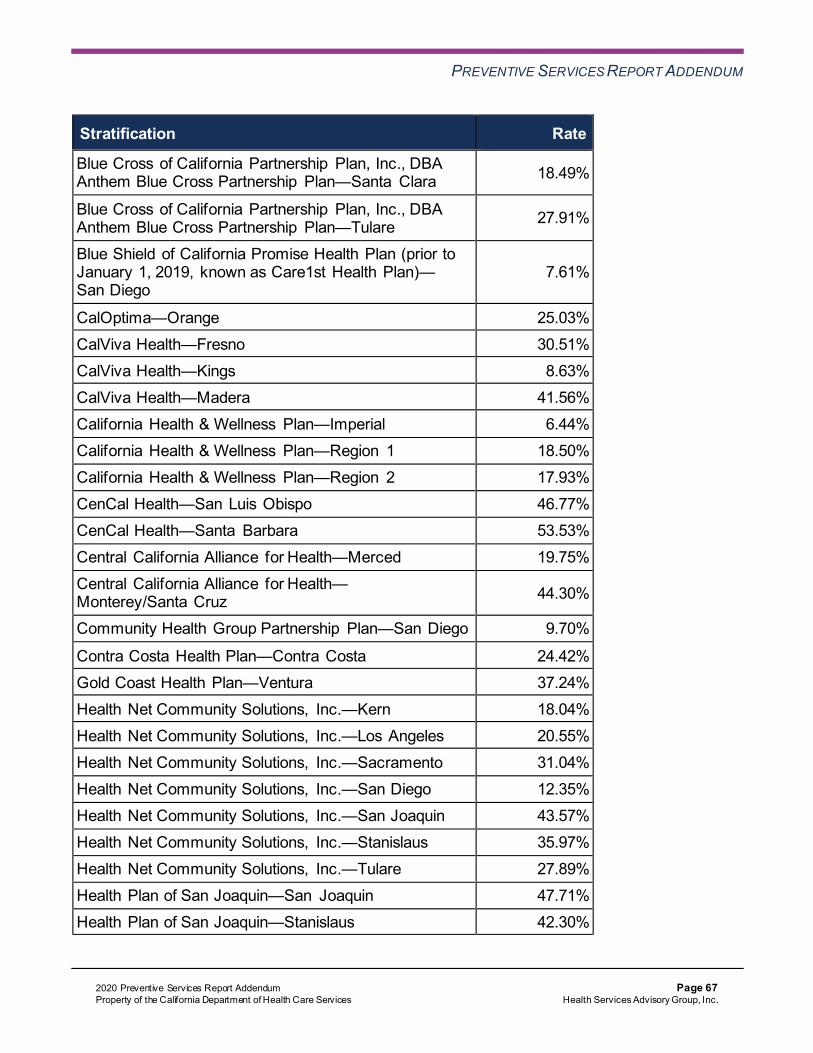
PREVENTIVE SERVICES REPORT ADDENDUM
2020 Preventive Services Report Addendum Page 67 Property of the California Department of Health Care Services Health Services Advisory Group, Inc.
Stratification Rate
Blue Cross of California Partnership Plan, Inc., DBA Anthem Blue Cross Partnership Plan—Santa Clara 18.49%
Blue Cross of California Partnership Plan, Inc., DBA Anthem Blue Cross Partnership Plan—Tulare 27.91%
Blue Shield of California Promise Health Plan (prior to January 1, 2019, known as Care1st Health Plan)— San Diego
7.61%
CalOptima—Orange 25.03% CalViva Health—Fresno 30.51% CalViva Health—Kings 8.63% CalViva Health—Madera 41.56% California Health & Wellness Plan—Imperial 6.44% California Health & Wellness Plan—Region 1 18.50% California Health & Wellness Plan—Region 2 17.93% CenCal Health—San Luis Obispo 46.77% CenCal Health—Santa Barbara 53.53% Central California Alliance for Health—Merced 19.75% Central California Alliance for Health— Monterey/Santa Cruz 44.30%
Community Health Group Partnership Plan—San Diego 9.70%
Contra Costa Health Plan—Contra Costa 24.42% Gold Coast Health Plan—Ventura 37.24% Health Net Community Solutions, Inc.—Kern 18.04% Health Net Community Solutions, Inc.—Los Angeles 20.55% Health Net Community Solutions, Inc.—Sacramento 31.04% Health Net Community Solutions, Inc.—San Diego 12.35% Health Net Community Solutions, Inc.—San Joaquin 43.57% Health Net Community Solutions, Inc.—Stanislaus 35.97% Health Net Community Solutions, Inc.—Tulare 27.89% Health Plan of San Joaquin—San Joaquin 47.71% Health Plan of San Joaquin—Stanislaus 42.30%

PREVENTIVE SERVICES REPORT ADDENDUM
2020 Preventive Services Report Addendum Page 68 Property of the California Department of Health Care Services Health Services Advisory Group, Inc.
Stratification Rate
Health Plan of San Mateo—San Mateo 24.39% Inland Empire Health Plan—Riverside/San Bernardino 18.91% Kaiser NorCal (KP Cal, LLC)—KP North 28.60%
Kaiser SoCal (KP Cal, LLC)—San Diego 18.03% Kern Health Systems, DBA Kern Family Health Care— Kern 16.93%
L.A. Care Health Plan—Los Angeles 20.84% Molina Healthcare of California—Imperial 7.25% Molina Healthcare of California— Riverside/San Bernardino 12.44%
Molina Healthcare of California—Sacramento 27.35% Molina Healthcare of California—San Diego 9.65% Partnership HealthPlan of California—Northeast 9.11%
Partnership HealthPlan of California—Northwest 3.90% Partnership HealthPlan of California—Southeast 8.39% Partnership HealthPlan of California—Southwest 13.97% San Francisco Health Plan—San Francisco 29.84% Santa Clara Family Health Plan—Santa Clara 21.08% UnitedHealthcare Community Plan—San Diego 7.33%
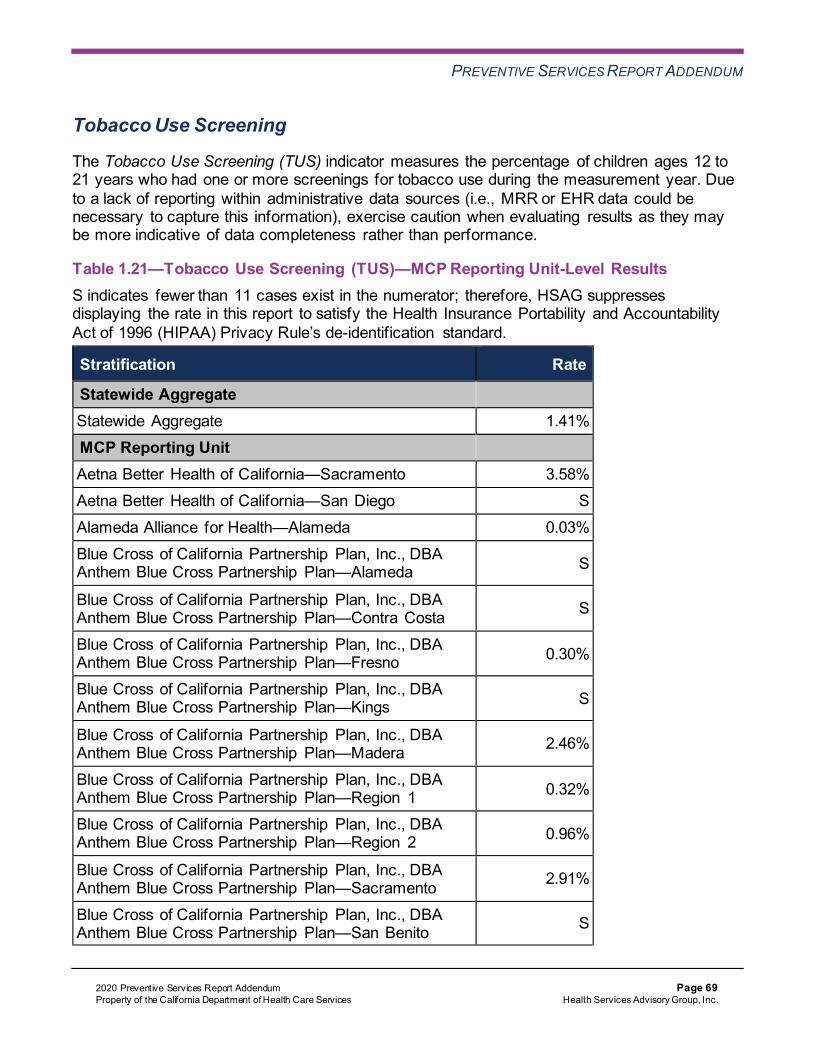
PREVENTIVE SERVICES REPORT ADDENDUM
2020 Preventive Services Report Addendum Page 69 Property of the California Department of Health Care Services Health Services Advisory Group, Inc.
Tobacco Use Screening
The Tobacco Use Screening (TUS) indicator measures the percentage of children ages 12 to 21 years who had one or more screenings for tobacco use during the measurement year. Due to a lack of reporting within administrative data sources (i.e., MRR or EHR data could be necessary to capture this information), exercise caution when evaluating results as they may be more indicative of data completeness rather than performance.
Table 1.21—Tobacco Use Screening (TUS)—MCP Reporting Unit-Level Results S indicates fewer than 11 cases exist in the numerator; therefore, HSAG suppresses displaying the rate in this report to satisfy the Health Insurance Portability and Accountability Act of 1996 (HIPAA) Privacy Rule’s de-identification standard.
Stratification Rate
Statewide Aggregate Statewide Aggregate 1.41% MCP Reporting Unit Aetna Better Health of California—Sacramento 3.58% Aetna Better Health of California—San Diego S Alameda Alliance for Health—Alameda 0.03% Blue Cross of California Partnership Plan, Inc., DBA Anthem Blue Cross Partnership Plan—Alameda S
Blue Cross of California Partnership Plan, Inc., DBA Anthem Blue Cross Partnership Plan—Contra Costa S
Blue Cross of California Partnership Plan, Inc., DBA Anthem Blue Cross Partnership Plan—Fresno 0.30%
Blue Cross of California Partnership Plan, Inc., DBA Anthem Blue Cross Partnership Plan—Kings S
Blue Cross of California Partnership Plan, Inc., DBA Anthem Blue Cross Partnership Plan—Madera 2.46%
Blue Cross of California Partnership Plan, Inc., DBA Anthem Blue Cross Partnership Plan—Region 1 0.32%
Blue Cross of California Partnership Plan, Inc., DBA Anthem Blue Cross Partnership Plan—Region 2 0.96%
Blue Cross of California Partnership Plan, Inc., DBA Anthem Blue Cross Partnership Plan—Sacramento 2.91%
Blue Cross of California Partnership Plan, Inc., DBA Anthem Blue Cross Partnership Plan—San Benito S

PREVENTIVE SERVICES REPORT ADDENDUM
2020 Preventive Services Report Addendum Page 70 Property of the California Department of Health Care Services Health Services Advisory Group, Inc.
Stratification Rate
Blue Cross of California Partnership Plan, Inc., DBA Anthem Blue Cross Partnership Plan—San Francisco 0.00%
Blue Cross of California Partnership Plan, Inc., DBA Anthem Blue Cross Partnership Plan—Santa Clara 0.00%
Blue Cross of California Partnership Plan, Inc., DBA Anthem Blue Cross Partnership Plan—Tulare 0.09%
Blue Shield of California Promise Health Plan (prior to January 1, 2019, known as Care1st Health Plan)— San Diego
1.96%
CalOptima—Orange 3.49% CalViva Health—Fresno 0.41% CalViva Health—Kings S CalViva Health—Madera 2.45% California Health & Wellness Plan—Imperial S California Health & Wellness Plan—Region 1 0.44% California Health & Wellness Plan—Region 2 0.72% CenCal Health—San Luis Obispo S CenCal Health—Santa Barbara 0.00% Central California Alliance for Health—Merced 0.07% Central California Alliance for Health— Monterey/Santa Cruz S
Community Health Group Partnership Plan—San Diego 0.99% Contra Costa Health Plan—Contra Costa 1.50% Gold Coast Health Plan—Ventura 0.22% Health Net Community Solutions, Inc.—Kern 0.19% Health Net Community Solutions, Inc.—Los Angeles 1.39% Health Net Community Solutions, Inc.—Sacramento 2.34% Health Net Community Solutions, Inc.—San Diego 10.41% Health Net Community Solutions, Inc.—San Joaquin 0.00% Health Net Community Solutions, Inc.—Stanislaus 0.08% Health Net Community Solutions, Inc.—Tulare 0.15% Health Plan of San Joaquin—San Joaquin S

PREVENTIVE SERVICES REPORT ADDENDUM
2020 Preventive Services Report Addendum Page 71 Property of the California Department of Health Care Services Health Services Advisory Group, Inc.
Stratification Rate
Health Plan of San Joaquin—Stanislaus 0.11% Health Plan of San Mateo—San Mateo 0.07% Inland Empire Health Plan—Riverside/San Bernardino 2.53%
Kaiser NorCal (KP Cal, LLC)—KP North S Kaiser SoCal (KP Cal, LLC)—San Diego S Kern Health Systems, DBA Kern Family Health Care— Kern 1.05%
L.A. Care Health Plan—Los Angeles 1.18% Molina Healthcare of California—Imperial S Molina Healthcare of California— Riverside/San Bernardino 3.05%
Molina Healthcare of California—Sacramento 4.53% Molina Healthcare of California—San Diego 6.22%
Partnership HealthPlan of California—Northeast S Partnership HealthPlan of California—Northwest S Partnership HealthPlan of California—Southeast 0.08% Partnership HealthPlan of California—Southwest 0.07% San Francisco Health Plan—San Francisco 0.09% Santa Clara Family Health Plan—Santa Clara S UnitedHealthcare Community Plan—San Diego S
PREVENTIVE SERVICES REPORT ADDENDUM
2020 Preventive Services Report Addendum Page 72 Property of the California Department of Health Care Services Health Services Advisory Group, Inc.
Caveats and Limitations
Blood Lead Screening Indicator Calculation
All blood lead tests drawn in California are to be reported to the California Department of Public Health (CDPH)4 and are recorded in the CDPH Response and Surveillance System for Childhood Lead Exposures (RASSCLE) system. California children who are beneficiaries of Medi-Cal, California’s Medicaid program, are to be screened for lead poisoning with a blood test at ages 12 and 24 months and up to age 6 years if not previously tested.5 Medi-Cal beneficiaries receive their health care services either through Medi-Cal fee-for-service (FFS) or through a Medi-Cal managed care plan. FFS Medi-Cal providers are required to submit their claims to DHCS for services paid for by Medi-Cal. MCPs are required to submit their encounter data to DHCS for services provided to Medi-Cal beneficiaries. Public reporting of children receiving blood lead tests (BLS) in California has been based on data reported to CDPH or claims and encounter data reported to DHCS. In 2020, the CDPH Childhood Lead Poisoning Prevention Branch and DHCS partnered to combine data from the two systems and identify Medi-Cal beneficiaries found in both data sets in order to obtain a more accurate estimate of BLS rates among children under the age of 6 receiving Medi-Cal services.
To identify children appearing in both data repositories, a deterministic match was performed using several variables or combinations of variables since no unique identifier is shared between all children in both data repositories. Matching variables included Social Security number, Medi-Cal number (although a small proportion of the blood lead records contained these data elements); a combination of first name, last name, date of birth, and ZIP Code; or a combination of first name, last name, and phone number.
Children were counted as having received a BLS if there was at least one Medi-Cal claim (FFS) or encounter (managed care) for a blood lead test (CPT code 83655) or a report of a blood lead test in the CDPH RASSCLE data system. After examining the data from CDPH, an additional 145,889 children (6.2 percent more than were screened based on DHCS claims data) were found to have been tested for lead and were included in the rates reported for measurement year 2019.
Data Run Out
DHCS calculated the 2019 BLS rates using DHCS claims data pulled in December 2020, matched to CDPH blood screening registry data from June 4, 2020. Claims data for a given month are generally considered complete for statistical reporting 12 months after the month’s end.
4 California Health and Safety Code Section 124130 5 Title 17, California Code of Regulations Section 37100 (b)(2)

PREVENTIVE SERVICES REPORT ADDENDUM
2020 Preventive Services Report Addendum Page 73 Property of the California Department of Health Care Services Health Services Advisory Group, Inc.
Regional County Determination Legend for Reference DHCS classified counties into the following regions:
♦ Bay Area Counties: Marin, San Francisco, San Mateo, Santa Clara, Alameda, Napa, Contra Costa, Solano, and Sonoma
♦ Central Coast Counties: Monterey, Santa Cruz, San Benito, Ventura, Santa Barbara, and San Luis Obispo
♦ Central Valley Counties: Madera, Kings, Tulare, Kern, Fresno, San Joaquin, Merced, and Stanislaus
♦ Far North Counties: Modoc, Trinity, Shasta, and Siskiyou ♦ Los Angeles County: Los Angeles ♦ North Coast Counties: Humboldt, Mendocino, Del Norte, and Lake ♦ Sacramento Valley Counties: Glenn, Colusa, Tehama, Yolo, Sutter, Butte, Yuba, and
Sacramento ♦ Sierra Range/Foothills Counties: Amador, Tuolumne, Calaveras, Lassen, Nevada, Placer,
El Dorado, Mariposa, Alpine, Plumas, Inyo, Sierra, and Mono ♦ Southern California Counties: Imperial, Orange, San Diego, San Bernardino, and Riverside