2020 Non-Financial Data - Klépierre
46
2020 Non-Financial Data
Transcript of 2020 Non-Financial Data - Klépierre

2020 Non-Financial
Data

Foreword 3Methodological note 3
1 1 Materiality matrix 5
2 2 Environmental performance indicators 6
2.1 Energy 62.2 Greenhouse gas emissions 132.3 Water 182.4 Waste 202.5 Mobility 252.6 Certifications 26
3 3 Social performance indicators 36
3.1 Health and safety 363.2 Employee diversity 373.3 Training and development 373.4 New hires and turnover 38
4 4 Local value creation and development programs indicators 40
4.1 Local value creation 404.2 Development programs 42
5 5 Client satisfaction and well‑being indicators 43
6 6 Governance indicators 456.1 Governance Bodies 456.2 Nomination 456.3 Conflicts of interest 466.4 Business ethics practices 46
CONTENTS
2 K L É P I E R R E 2 0 2 0 — NON-FINANCIAL DATA

FOREWORD
Chapter 5 of Klépierre’s 2020 Universal Registration Document describes the Group’s environmental and social activities in accordance with the five leading industry and/or international frameworks: the Global Reporting Initiative (GRI) standards, European Public Real Estate Association (EPRA) Sustainability Best Practices Recommendations (sBPRs), the French Council of Shopping Centers (CNCC) CSR industry reporting guide, United Nations (UN) Sustainable Development Goals (SDGs) and the Task Force on Climate-related Financial Disclosures (TCFD). While Chapter 5 sets out the Group’s progress towards achieving its Act for Good® Corporate Social Responsibility (CSR) strategy, focusing on its most significant key performance indicators, the Group has decided to create this supplement containing all of its non-financial data. This allows for a more comprehensive quantitative overview of Klépierre’s CSR performance and is in line with the expectations of the leading non-financial agencies, Environmental Social and Governance (ESG) investors and other stakeholders.
METHODOLOGICAL NOTE
The majority of the indicators included in this report are those prescribed by the aforementioned EPRA sBPRs, which is the benchmark Code for Real Estate companies in Europe. Additional indicators are included which do not fall under the EPRA sBPRs but are considered significant to the Group.
Reporting periodFor all energy, climate change, waste, water and transportation indicators, the reporting period corresponds to a rolling 12 months from October 1 of the prior year, to September 30 of the current year (i.e., October 1, 2019 to September 30, 2020 for the 2020 reporting period). Social impact indicators, such as Net Promoter Score data, suppliers and initiatives carried out by shopping centers, are also provided over the same period. All other indicators (including building certifications, human resources data, etc.) are calculated based on the calendar year, i.e., from January 1, 2020 to December 31, 2020 for the 2020 reporting period.
Reporting scopes
Reported scope
The reported scope is used to assess the CSR impact of the property portfolio over a 12-months period of time. It reflects the impacts of management, renovation and arbitrage (acquisitions and disposals) policies. In 2020, it includes:
• All shopping centers owned and managed by Klépierre (124 assets);
• Shopping centers not owned by Klépierre but managed by the Group on behalf of third parties, for which operating data are available (8 assets, all in France);
• Shopping centers owned by Klépierre but not managed by a third party, for which operating data are available (8 assets: 2 in France, 3 in Greece, 2 in Italy and 1 in Turkey).
Shopping centers acquired and managed by the Group are included in the scope as from the first full year following acquisition. Real estate development projects are not included in the reporting scope during development or construction, but as from the first full year following completion. For this reason, certain centers such as Hoog Catharijne (Utrecht, Netherlands) are excluded from some KPIs of this year’s calculation due to the fact that work is still ongoing and their inclusion would distort results accordingly.
This configuration may vary slightly for assets managed on behalf of third parties. Depending on the situation, Klépierre may have full management of electricity, for example, but be charged by a third party (hypermarket, etc.) for fuel usage. Waste may also be collected by a third party (such as a local authority) on a flat rate basis, for example. Some of these configurations may hinder the collection of reliable quantitative data and lead the Group to exclude the corresponding shopping centers from the reported scope for certain indicators. Typically, only centers that Klépierre manages outright and has full control over energy, water and waste consumption data are included in the reported scope, which explains the difference in coverage rates between the various indicators.
Coverage rates are expressed in terms of the total value of centers owned and managed (since values for centers not owned but managed only are unavailable); those rates are available for each table, in chart legends.
Like‑for‑like scope
The like-for-like scope is used to assess changes in performance across an identical scope on a comparable basis, and reflects the Group’s ability to manage and optimize its asset portfolio. It excludes the impact of acquisitions and disposals and includes all shopping centers owned and managed for at least 24 months. However, it excludes shopping centers acquired or completed during the year as well as those not managed for the entire period. The 2020 like-for-like scope represents 92.2% of the Group’s portfolio as of December 31, 2020.
Lastly, where assets are excluded from the scope of a given indicator, they are indicated in the footnotes to the tables and charts in this chapter.
K L É P I E R R E 2 0 2 0 — NON-FINANCIAL DATA 3

Units of measurement• Portfolio coverage rates are mostly expressed as percentages of
the value of the underlying assets (as opposed to the number of assets, for example) in order to better reflect their contribution to the Group’s overall portfolio;
• Energy, carbon and water data are presented both in gross terms (kWh, tCO
2 e, cu.m.) for the purposes of assessing volumes, and
as ratios (gross value divided by floor area or footfall) in order to discern the performance of assets on each of the given topics.
Additional clarifications on topics• Energy efficiency and greenhouse gas emissions of serviced
areas and shared equipment: consumption intensity and energy performance indicators expressed in kWh or kWh/sq.m. reflect the heating and air conditioning consumption of serviced areas which include the common areas of the shopping centers and private spaces (shops, storage rooms, etc.) that are connected to shared equipment without sub-metering systems;
• Greenhouse gas emissions are presented using “location-based” and “market-based” methods. For location-based data, emissions factors used in the calculations are sourced from the French Environment and Energy Management Agency’s (ADEME) Bilans GES database (average national factors). For market-based data, emissions factors are sourced directly from each energy supplier;
• For energy and water consumption, the Group uses meter reading data (as opposed to invoices) to ensure shorter data collection and greater relevance;
• Where Klépierre neither owns nor manages head office buildings it occupies, the related consumption data are not included in this report;
• Water consumption corresponds to drinking water consumption for the entire building in question (both common and private areas), and is determined exclusive of water used for heat pumps;
• Development projects including in the 2020 reporting scope correspond to projects delivered during the course of the year, except for carbon data, for which emissions relating to project construction are spread over the years of the corresponding work;
• All key indicators are calculated based on actual and exhaustive data.
This information was verified by EY & Associés as part of the work described in the independent verifier’s report on the consolidated non-financial statement presented in the management report, included in Chapter 5 of Klépierre’s 2020 Universal Registration Document.
4 K L É P I E R R E 2 0 2 0 — NON-FINANCIAL DATA

1Materiality matrix
The Group’s broader goal of maximizing its value creation requires it to ensure that its actions are as targeted as possible. This ambition to achieve value is the driving force leading Klépierre to identify all environmental, societal and social issues and to focus on the most important ones; it is also the purpose of bringing its actions into line with the recommendations of French law, the G4 guidelines of the Global Reporting Initiative (GRI), and the EPRA sBPRs.
In 2013, Klépierre conducted an initial “materiality analysis” – a commonly used tool to identify and rank non-financial issues within an organization – which brought to light the 20 environmental, societal and social issues that have a material impact on the Group’s performance. Four years later, evolving issues, the speed of societal change as well as the Group’s growing ambition led Klépierre to repeat the exercise. Accordingly, in 2017, the Group worked on updating its materiality analysis. For the first time, this process was done collaboratively through a panel of internal and external stakeholders, which assembled the materiality matrix presented below. The 20-member panel comprised representatives of Klépierre’s main stakeholders: retailers,
investors, human resources and CSR experts, scientists, NGOs, local authorities, etc. It also included Group representatives: members of the Executive Board, the Chief Operating Officer, two operational staff, and the team in charge of CSR.
Methodology: the internal and external stakeholders in the panel were given a questionnaire covering 38 pre-identified issues to assess the materiality of these issues. The methodology used comprises two components: the importance of the issue and its classification as a risk or opportunity for the Company; these two components are combined to produce the final rating for each issue. To this end, participants rated the importance of the issues as follows: “very important”, “important”, “moderately important”, or “not very important” (this accounted for 75% of the rating), and they ranked the top ten issues in terms of risks or opportunities for Klépierre (representing 25% of the rating). The main risks and opportunities are represented in the materiality matrix below. This allows Klépierre to rank its issues and to think in terms of priorities.
0 Internal importance 10
Exte
rnal
impo
rtan
ce
1
GovernanceBusiness ethics
Stakeholder dialogue
Transparent and fair taxation
Outsourcing and responsiblepurchasing
Respect for human rights
Energy e�iciency and GHG emissions for a 2 degree Renewable energy
Circular economy
Biodiversity
Certification and labelling
Water consumption
Waste reduction and management
Resilience to climate change
Open Design & Innovation
Sustainable mobility
Client health and wellness
Customer Relationships
Tenant relationships
Protection of personal data
Responsible consumption models
Responsible products and services
Accessibility of shopping centres
Financial accessibility of products
Customer health and safety
Partnerships with retailers
Quality of life at work
Employees' health and safety
Compensationand benefits
Development andcareer path
Organisation & management practices
Diversity
Local economic development
Sustainable Territories
Landscape Integration
Responsible design
Volunteering
Local quality of life
RESULTS: THE STAKEHOLDERS PANEL IDENTIFIED THE FOLLOWING AS CSR PRIORITIES FOR KLÉPIERRE:
Issues comprising major risks Issues offering the greatest opportunities• Business ethics• Respect for human rights• Customer health and safety• Outsourcing and responsible purchasing• Governance
• Partnerships with retailers• Local economic development• Dialogue with stakeholders• Renewable energy• Circular economy
The Group’s commitments are presented in Chapter 5 of Klépierre’s 2020 Universal Registration Document and performance KPIs are detailed throughout this supplement.
K L É P I E R R E 2 0 2 0 — NON-FINANCIAL DATA 5
MATE R IALIT y MATRIx 1

2Environmental
performance indicators
2.1 ENERGy
This section includes the Group’s total electricity, fuel, urban heating and cooling consumptions for the common and serviced areas of the shopping centers included within the 2020 reporting scopes. It outlines the energy intensity per site, the consumption and cost, in addition to details of the Group’s renewable energy sources and the proportion consumed and/or produced across the portfolio. Each indicator includes a comparison with 2019 data and a breakdown by territory. The data provided is not weather-adjusted and does not include tenant sub-metered consumption.
2.1.1 Electricity
TOTAL ELECTRICITy CONSUMPTION IN COMMON AND SERVICED AREAS (Reported scope)
Indicator Territory 2020 2019 2018Change
2020/2019
Total electricity consumption(in MWh)
France-Belgium 70,549 84,167 88,562 –16%
Italy 61,208 70,077 87,809 –13%
Scandinavia 45,157 51,269 60,314 –12%
Iberia 23,345 33,420 37,725 –30%
Central Europe & Other 25,150 26,575 41,914 –5%
Netherlands 3,724 4,372 4,716 –15%
Germany 9,354 11,343 11,869 –18%
GROUP TOTAL 238,488 281,222 332,910 –15%
Share from renewable sources(in %)
France-Belgium 97% 98% 72% –1%
Italy 83% 81% 76% +2%
Scandinavia 100% 100% 87% 0%
Iberia 100% 100% 92% 0%
Central Europe & Other 87% 84% 28% +4%
Netherlands 100% 100% 100% 0%
Germany 100% 100% 78% 0%
GROUP TOTAL 93% 93% 73% 0%
EPRA indicator: Elec-Abs.Scope (136/140): 123/124 owned and managed shopping centers (excluding Utrecht, Hoog Catharijne) + 8/8 managed only shopping centers + 5/8 owned only shopping centers (excluding Greece).Coverage rate: 95.8% of total shopping center portfolio value.
6 K L É P I E R R E 2 0 2 0 — NON-FINANCIAL DATA
ENVIRONMENTA L P ERFORMA N CE I N DI CATOR SEnergy2

TOTAL ELECTRICITy CONSUMPTION IN COMMON AND SERVICED AREAS (Like-for-like scope)
Indicator Territory 2020 2019Change
2020/2019
Total electricity consumption(in MWh)
France-Belgium 66,505 83,970 –21%Italy 55,127 70,217 –21%Scandinavia 45,157 52,641 –14%Iberia 23,345 31,397 –26%Central Europe & Other 20,556 26,594 –23%Netherlands 3,724 4,372 –15%Germany 9,354 11,343 –18%GROUP TOTAL 223,768 280,534 –20%
Share from renewable sources(in %)
France-Belgium 98% 98% 0%Italy 88% 81% +8%Scandinavia 100% 100% 0%Iberia 100% 100% 0%Central Europe & Other 84% 84% 0%Netherlands 100% 100% 0%Germany 100% 100% 0%GROUP TOTAL 95% 93% +2%
EPRA indicator: Elec-LfL.Scope (130/140): 122/124 owned and managed shopping centers (excluding Utrecht, Hoog Catharijne and Paris Saint-Lazare) + 8/8 managed only shopping centers + 0/8 owned only shopping centers.Coverage rate: 92.2% of total shopping center portfolio value.
Due to the health crisis in 2020, business restrictions decided by European governments affected the Group’s 2020 energy data. These impacts are described in depth in section 1.1.4 “Energy Intensity”.
Electricity consumption decreased by 15% in 2020. This performance is mainly due to the technical teams’ ongoing efforts to reduce electricity consumption, such as real-time monitoring of buildings and the deployment of BOOST programs (particularly in France), etc.
In addition, the sale of Gran Turia (Valencia) in Spain further accentuated the decline in the total amount of electricity consumed in that region. Similarly, the renewal of the energy supply contract for the Duisburg centers significantly improved performance in Germany.
Lastly, the inclusion of Akmerkez (Istanbul) in Turkey in the 2020 non-financial reporting data mechanically increased electricity consumption in Central Europe for reported scope data.
Regarding the proportion of electricity from renewable sources, there was a significant increase in Central Europe and Italy, where energy supply contract renegotiations led to changes in the type of electricity consumed.
At Group level, the performance remained flat in 2020 due to the inclusion this year of assets owned but not managed by Klépierre, which are not yet covered by the framework contracts in force across Group sites that are owned and managed by Klépierre (particularly in France), which is scheduled for 2021.
2.1.2 Fuel
TOTAL FUEL* CONSUMPTION IN COMMON AND SERVICED AREAS (Reported scope)
Indicator Territory 2020 2019 2018Change
2020/2019
Total fuel consumption(in MWh)
France-Belgium 13,997 17,667 18,347 –21%Italy 16,235 20,595 26,428 –21%Scandinavia 242 532 837 –55%Iberia 1,882 1,950 3,090 –4%Central Europe & Other 3,892 4,324 9,719 –10%Netherlands 0 0 0 0%Germany 0 0 0 0%GROUP TOTAL 36,248 45,068 58,420 –20%
Share from renewable sources(in %)
France-Belgium 72% 62% N/A +16%Italy 0% 2% N/A –100%Scandinavia 14% 56% N/A –75%Iberia 0% 0% N/A 0%Central Europe & Other 0% 0% N/A 0%Netherlands 0% 0% N/A 0%Germany 0% 0% N/A 0%GROUP TOTAL 28% 26% N/A +7%
* Fuels included: gas, diesel and heating oil.EPRA indicator: Fuel-Abs.Scope (136/140): 123/124 owned and managed shopping centers (excluding Utrecht, Hoog Catharijne) + 8/8 managed only shopping centers + 5/8 owned only shopping centers (excluding Greece).Coverage rate: 95.8% of total shopping center portfolio value.
K L É P I E R R E 2 0 2 0 — NON-FINANCIAL DATA 7
E NVIR O NME NTAL PE R FO R MANCE IND ICATOR SEnergy 2

TOTAL FUEL* CONSUMPTION IN COMMON AND SERVICED AREAS (Like-for-like scope)
Indicator Territory 2020 2019Change
2020/2019
Total fuel consumption(in MWh)
France-Belgium 12,885 16,998 –24%Italy 15,893 20,595 –23%Scandinavia 242 589 –59%Iberia 1,882 2,383 –21%Central Europe & Other 3,166 4,324 –27%Netherlands 0 0 0%Germany 0 0 0%
GROUP TOTAL 34,068 44,888 –24%
Share from renewable sources(in %)
France-Belgium 78% 55% +43%Italy 0% 0% 0%Scandinavia 14% 51% –72%Iberia 0% 0% 0%Central Europe & Other 0% 0% 0%Netherlands 0% 0% 0%Germany 0% 0% 0%GROUP TOTAL 30% 22% +39%
* Fuels included: gas, diesel and heating oil.EPRA indicator: Fuel-LfL.Scope (130/140): 122/124 owned and managed shopping centers (excluding Utrecht, Hoog Catharijne and Paris Saint-Lazare) + 8/8 managed only shopping centers + 0/8 owned only shopping centers.Coverage rate: 92.2% of total shopping center portfolio value.
Due to the health crisis in 2020, business restrictions decided by European governments affected the Group’s 2020 energy data. These impacts are described in depth in section 1.1.4 “Energy Intensity”.
Fuel consumption decreased by 20% in 2020. This performance is mainly due to the technical teams’ ongoing efforts to reduce fuel consumption, including the real-time monitoring of buildings and the deployment of BOOST programs, etc.
The particularly significant decrease in Scandinavia is explained by:
• A BOOST intervention on the Norwegian site of Amanda (Haugesund), which resulted in an immediate drop in consumption of more than 10%; and
• A significant decrease in heating oil consumption at the other Norwegian site of Vinterbro (As) due to the combined effect of improved energy management and a particularly mild winter.
2.1.3 District heating and cooling
TOTAL DISTRICT HEATING AND COOLING CONSUMPTION IN COMMON AND SERVICED AREAS (Reported scope)
Indicator Territory 2020 2019 2018Change
2020/2019
Total heating and cooling consumption(in MWh)
France-Belgium 17,001 20,999 N/A –19%
Italy 0 0 N/A 0%
Scandinavia 13,788 18,507 N/A –26%
Iberia 0 0 N/A 0%
Central Europe & Other 4,228 5,661 N/A –25%
Netherlands 1,772 2,268 N/A –22%
Germany 11,684 12,771 N/A –9%
GROUP TOTAL 48,472 60,206 72,219 –19%
Share from renewable sources(in %)
France-Belgium 51% 42% N/A +22%
Italy 0% 0% N/A 0%
Scandinavia 90% 88% N/A +3%
Iberia 0% 0% N/A 0%
Central Europe & Other 8% 11% N/A –27%
Netherlands 100% 100% N/A 0%
Germany 9% 9% N/A 0%
GROUP TOTAL 50% 48% 46% +5%
EPRA indicator: DH&C-Abs.Scope (136/140): 123/124 owned and managed shopping centers (excluding Utrecht, Hoog Catharijne) + 8/8 managed only shopping centers + 5/8 owned only shopping centers (excluding Greece).Coverage rate: 95.8% of total shopping center portfolio value.
8 K L É P I E R R E 2 0 2 0 — NON-FINANCIAL DATA
ENVIRONMENTA L P ERFORMA N CE I N DI CATOR SEnergy2

TOTAL DISTRICT HEATING AND COOLING CONSUMPTION IN COMMON AND SERVICED AREAS (Like-for-like scope)
Indicator Territory 2020 2019Change
2020/2019
Total heating and cooling consumption(in MWh)
France-Belgium 17,001 21,082 –19%Italy 0 0 0%Scandinavia 13,788 18,573 –26%Iberia 0 0 0%Central Europe & Other 4,228 5,734 –26%Netherlands 1,772 2,268 –22%Germany 11,684 12,768 –8%
GROUP TOTAL 48,472 60,425 –20%
Share from renewable sources(in %)
France-Belgium 51% 41% +24%Italy 0% 0% 0%Scandinavia 90% 88% +2%Iberia 0% 0% 0%Central Europe & Other 8% 11% –25%Netherlands 100% 100% 0%Germany 9% 9% –4%GROUP TOTAL 50% 48% +4%
EPRA indicator:DH&C-LfL.Scope (130/140): 122/124 owned and managed shopping centers (excluding Utrecht, Hoog Catharijne and Paris Saint-Lazare) + 8/8 managed only shopping centers + 0/8 owned only shopping centers.Coverage rate: 92.2% of total shopping center portfolio value.
Due to the health crisis in 2020, business restrictions decided by European governments affected the Group’s 2020 energy data. These impacts are described in depth in section 1.1.4 “Energy Intensity”.
The 19% decrease in consumption is in line with what was observed in 2020 for other energy sources.
The significant increase in the share of district heating and cooling from renewable sources in France is mainly due to two centers:
• Créteil Soleil (Créteil), now powered by a network sourced from waste combustion whose extension was delivered in 2020, mechanically increasing the consumption of renewable district heating/cooling in France;
• Grand Place (Grenoble): the local supplier substantially improved the renewable mix of its network during the year.
2.1.4 Energy intensity
TOTAL BUILDING ENERGy INTENSITy (in kWh/sq.m./year) (Reported scope)
Territory 2020 2019 2018 2013Change
2020/2019Change
2020/2013France-Belgium 73.9 96.2 111 146 –23% –49%
Italy 107.2 134.1 156 171 –20% –37%
Scandinavia 82.2 97.5 116 121 –16% –32%
Iberia 74.4 106.6 123 149 –30% –50%
Central Europe & Other 71.6 83.8 103 154 –14% –53%
Netherlands 61.3 68.9 77 N/A –11% N/A
Germany 75.6 86.6 88 N/A –13% N/A
GROUP TOTAL 81.0 101.3 118 143 –20% –43%
EPRA indicator: Energy-Int.Scope (136/140): 123/124 owned and managed shopping centers (excluding Utrecht, Hoog Catharijne) + 8/8 managed only shopping centers + 5/8 owned only shopping centers (excluding Greece).Coverage rate: 95.8% of total shopping center portfolio value.
K L É P I E R R E 2 0 2 0 — NON-FINANCIAL DATA 9
E NVIR O NME NTAL PE R FO R MANCE IND ICATOR SEnergy 2

TOTAL BUILDING ENERGy INTENSITy (in kWh/sq.m./year) (Like-for-like scope)
Territory 2020 2019Change
2020/2019France-Belgium 72.9 95.9 –24%
Italy 106.7 134.3 –21%
Scandinavia 82.2 99.6 –17%
Iberia 74.4 109.2 –32%
Central Europe & Other 63.7 84.0 –24%
Netherlands 61.3 68.9 –11%
Germany 75.6 86.6 –13%
GROUP TOTAL 79.5 101.8 –22%
EPRA indicator: Energy-Int.Scope (130/140): 122/124 owned and managed shopping centers (excluding Utrecht, Hoog Catharijne and Paris Saint-Lazare) + 8/8 managed only shopping centers + 0/8 owned only shopping centers.Coverage rate: 92.2% of total shopping center portfolio value.
(1) BMS = Building Management System.* Methodology: the full-year calculation was run again excluding the March, April and May 2020 energy consumption (months most affected by government-decided shopping center
closures).
In a year marked by an unprecedented health crisis, many sites had to close down totally or partially, with significant discrepancies in the various countries where Klépierre operates. These government restrictions obviously had an impact on the Group's 2020 energy results.
In order to distinguish the “Covid impact” from the Group’s intrinsic performance, a specific analysis* was conducted, allowing us to conclude that around 5% of the decrease in energy consumption was directly due to the impacts of the health crisis.
This means that the Group's energy efficiency performance can be read as follows for 2020:
• Decrease of 5% directly attributable to the "Covid effect" at Group level, with significant local disparities:
• Iberia was the most affected region, as Spain and Portugal were among the countries that closed their malls for the longest period of time,
• Conversely, Scandinavia and the Netherlands had the lowest Covid impact on their results due to local restrictions that caused very few (if any) shopping center closures.
• Decrease of 15% achieved through the performance of teams and assets. These very good results can be explained by several factors:
• Lockdown periods enabled the teams to review all of the BMS(1) operating protocols and analyze overnight consumption more closely, thus recalibrating day-to-day asset management,
• BOOST interventions, consisting in a two-day on-site high-impact intervention. The entire day and night operation is analyzed and a tangible action plan is immediately drawn up to significantly reduce the center’s energy footprint.
2.1.5 Energy consumption and costs
TOTAL ENERGy CONSUMPTION IN COMMON AND SERVICED AREAS (in MWh) (Reported scope)
Territory 2020 2019 2018 2017Change
2020/2019France-Belgium 102,030 122,914 131,676 123,616 –17%
Italy 77,845 91,022 114,594 118,791 –14%
Scandinavia 59,226 70,356 86,061 81,537 –16%
Iberia 25,234 35,376 40,824 44,432 –29%
Central Europe & Other 33,270 36,560 60,073 87,465 –9%
Netherlands 5,496 6,640 7,426 11,981 –17%
Germany 21,037 24,114 24,540 24,423 –13%
GROUP TOTAL 324,139 386,982 465,224 492,245 –16%
Scope (136/140): 123/124 owned and managed shopping centers (excluding Utrecht, Hoog Catharijne) + 8/8 managed only shopping centers + 5/8 owned only shopping centers (excluding Greece).Coverage rate: 95.8% of total shopping center portfolio value.
10 K L É P I E R R E 2 0 2 0 — NON-FINANCIAL DATA
ENVIRONMENTA L P ERFORMA N CE I N DI CATOR SEnergy2

TOTAL ENERGy CONSUMPTION IN COMMON AND SERVICED AREAS (in MWh) (Like-for-like scope)
Territory 2020 2019Change
2020/2019France-Belgium 96,790 122,132 –21%
Italy 71,421 91,163 –22%
Scandinavia 59,226 71,851 –18%
Iberia 25,234 33,789 –25%
Central Europe & Other 27,950 36,651 –24%
Netherlands 5,496 6,640 –17%
Germany 21,037 24,111 –13%
GROUP TOTAL 307,155 386,337 –20%
Scope (130/140): 122/124 owned and managed shopping centers (excluding Utrecht, Hoog Catharijne and Paris Saint-Lazare) + 8/8 managed only shopping centers + 0/8 owned only shopping centers.Coverage rate: 92.2% of total shopping center portfolio value.
TOTAL ENERGy COSTS FOR COMMON AND SERVICED AREAS (in € thousand) (Reported scope)
Territory 2020 2019Change
2020/2019France-Belgium 10,364 11,529 –10%
Italy 10,503 12,164 –14%
Scandinavia 6,231 7,483 –17%
Iberia 2,811 3,904 –28%
Central Europe & Other 3,491 3,287 +6%
Netherlands 552 584 –6%
Germany 1,523 1,977 –23%
GROUP TOTAL 35,474 40,929 –13%
Scope (136/140): 123/124 owned and managed shopping centers (excluding Utrecht, Hoog Catharijne) + 8/8 managed only shopping centers + 5/8 owned only shopping centers (excluding Greece).Coverage rate: 95.8% of total shopping center portfolio value.
TOTAL ENERGy COSTS FOR COMMON AND SERVICED AREAS (in € thousand) (Like-for-like scope)
Territory 2020 2019Change
2020/2019France-Belgium 9,881 11,522 –14%
Italy 9,432 12,167 –22%
Scandinavia 6,231 7,531 –17%
Iberia 2,811 3,707 –24%
Central Europe & Other 3,001 3,289 –9%
Netherlands 552 584 –6%
Germany 1,523 2,441 –38%
GROUP TOTAL 33,430 41,240 –19%
Scope (130/140): 122/124 owned and managed shopping centers (excluding Utrecht, Hoog Catharijne and Paris Saint-Lazare) + 8/8 managed only shopping centers + 0/8 owned only shopping centers.Coverage rate: 92.2% of total shopping center portfolio value.
Explanations of the change in consumption for all sources of energy are detailed in each sub-section above.
With regard to costs, the 13% decrease in 2020 is largely explained by the reduction in energy consumption across the entire portfolio, slightly offset by customary annual energy cost inflation.
K L É P I E R R E 2 0 2 0 — NON-FINANCIAL DATA 11
E NVIR O NME NTAL PE R FO R MANCE IND ICATOR SEnergy 2
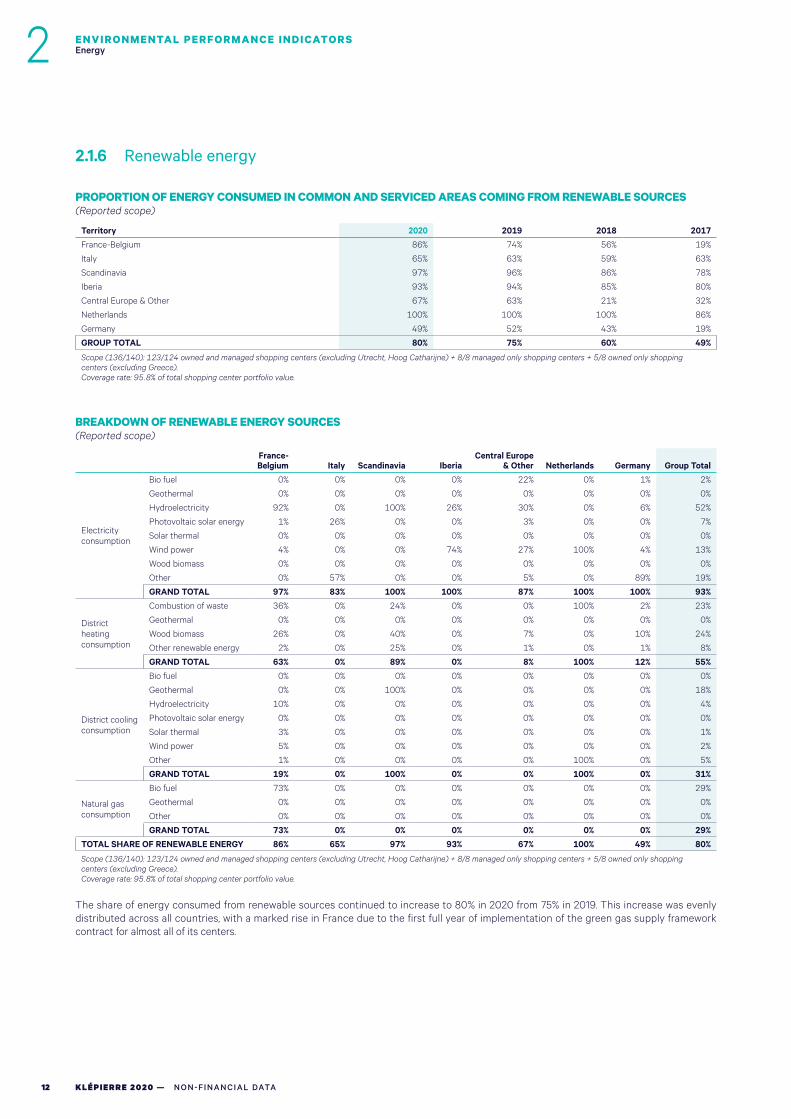
2.1.6 Renewable energy
PROPORTION OF ENERGy CONSUMED IN COMMON AND SERVICED AREAS COMING FROM RENEWABLE SOURCES (Reported scope)
Territory 2020 2019 2018 2017France-Belgium 86% 74% 56% 19%
Italy 65% 63% 59% 63%
Scandinavia 97% 96% 86% 78%
Iberia 93% 94% 85% 80%
Central Europe & Other 67% 63% 21% 32%
Netherlands 100% 100% 100% 86%
Germany 49% 52% 43% 19%
GROUP TOTAL 80% 75% 60% 49%
Scope (136/140): 123/124 owned and managed shopping centers (excluding Utrecht, Hoog Catharijne) + 8/8 managed only shopping centers + 5/8 owned only shopping centers (excluding Greece).Coverage rate: 95.8% of total shopping center portfolio value.
BREAKDOWN OF RENEWABLE ENERGy SOURCES (Reported scope)
France-Belgium Italy Scandinavia Iberia
Central Europe & Other Netherlands Germany Group Total
Electricity consumption
Bio fuel 0% 0% 0% 0% 22% 0% 1% 2%
Geothermal 0% 0% 0% 0% 0% 0% 0% 0%
Hydroelectricity 92% 0% 100% 26% 30% 0% 6% 52%
Photovoltaic solar energy 1% 26% 0% 0% 3% 0% 0% 7%
Solar thermal 0% 0% 0% 0% 0% 0% 0% 0%
Wind power 4% 0% 0% 74% 27% 100% 4% 13%
Wood biomass 0% 0% 0% 0% 0% 0% 0% 0%
Other 0% 57% 0% 0% 5% 0% 89% 19%
GRAND TOTAL 97% 83% 100% 100% 87% 100% 100% 93%
District heating consumption
Combustion of waste 36% 0% 24% 0% 0% 100% 2% 23%
Geothermal 0% 0% 0% 0% 0% 0% 0% 0%
Wood biomass 26% 0% 40% 0% 7% 0% 10% 24%
Other renewable energy 2% 0% 25% 0% 1% 0% 1% 8%
GRAND TOTAL 63% 0% 89% 0% 8% 100% 12% 55%
District cooling consumption
Bio fuel 0% 0% 0% 0% 0% 0% 0% 0%
Geothermal 0% 0% 100% 0% 0% 0% 0% 18%
Hydroelectricity 10% 0% 0% 0% 0% 0% 0% 4%
Photovoltaic solar energy 0% 0% 0% 0% 0% 0% 0% 0%
Solar thermal 3% 0% 0% 0% 0% 0% 0% 1%
Wind power 5% 0% 0% 0% 0% 0% 0% 2%
Other 1% 0% 0% 0% 0% 100% 0% 5%
GRAND TOTAL 19% 0% 100% 0% 0% 100% 0% 31%
Natural gas consumption
Bio fuel 73% 0% 0% 0% 0% 0% 0% 29%
Geothermal 0% 0% 0% 0% 0% 0% 0% 0%
Other 0% 0% 0% 0% 0% 0% 0% 0%
GRAND TOTAL 73% 0% 0% 0% 0% 0% 0% 29%TOTAL SHARE OF RENEWABLE ENERGY 86% 65% 97% 93% 67% 100% 49% 80%
Scope (136/140): 123/124 owned and managed shopping centers (excluding Utrecht, Hoog Catharijne) + 8/8 managed only shopping centers + 5/8 owned only shopping centers (excluding Greece).Coverage rate: 95.8% of total shopping center portfolio value.
The share of energy consumed from renewable sources continued to increase to 80% in 2020 from 75% in 2019. This increase was evenly distributed across all countries, with a marked rise in France due to the first full year of implementation of the green gas supply framework contract for almost all of its centers.
12 K L É P I E R R E 2 0 2 0 — NON-FINANCIAL DATA
ENVIRONMENTA L P ERFORMA N CE I N DI CATOR SEnergy2

2.2 GREENHOUSE GAS EMISSIONS
This section sets out the Group’s total greenhouse gas (GHG) emissions production. Klépierre’s carbon data is reported in accordance with the GHG Protocol and is calculated in association with the Bilan Carbone® method developed by ADEME, the French Environment and Energy Management Agency. Emission factors are updated annually based on this method. The operational scope of Klépierre’s emissions is divided into three, as follows:
• Scope 1: All direct GHG emissions. Within the Klépierre portfolio, this includes all gas, heating oil/diesel, company cars and refrigerant gas consumption by the center’s common installations;
• Scope 2: Indirect GHG emissions from the consumption of purchased electricity, district heating and urban cooling at our centers;
• Scope 3: Other emissions that are produced outside of the Group’s specific control. This is divided into direct and indirect leverage. Indirect leverage is responsible for the majority of Scope 3 emissions, coming predominantly from visitor transportation in addition to downstream leasing. In contrast, direct leverage includes purchased goods and services, energy consumption not covered in Scope 2, waste disposal, investments, commuting, business trips and non-property fixed assets.
Each indicator includes a comparison with 2019 data and a breakdown by territory. The data provided is not weather-adjusted.
2.2.1 Location-based direct greenhouse gas emissions and intensity (scopes 1 and 2)
LOCATION-BASED – TOTAL DIRECT GHG EMISSIONS (Reported scope)
Indicators Territory 2020 2019 2018Change
2020/2019
Total Scope 1 emissions(in tCO2 )
France-Belgium 3,089 3,937 3,398 –22%
Italy 5,026 5,966 4,983 –16%
Scandinavia 661 526 197 26%
Iberia 1,380 1,096 572 26%
Central Europe & Other 832 1,018 1,798 –18%
Netherlands 0 5 0 –100%
Germany 354 642 0 –45%
GROUP TOTAL 11,341 13,190 10,947 –14%
Total Scope 2 emissions(in tCO2 )
France-Belgium 4,115 4,981 5,907 –17%
Italy 20,933 23,966 30,031 –13%
Scandinavia 2,120 2,772 3,640 –24%
Iberia 7,168 10,215 11,541 –30%
Central Europe & Other 15,515 17,309 22,004 –10%
Netherlands 1,869 2,199 2,372 –15%
Germany 4,696 5,712 6,039 –18%
GROUP TOTAL 56,417 67,155 81,534 –16%
Total Scopes 1 & 2 emissions (in tCO2 )
France-Belgium 7,204 8,918 9,305 –19%
Italy 25,959 29,933 35,014 –13%
Scandinavia 2,780 3,299 3,837 –16%
Iberia 8,548 11,310 12,113 –24%
Central Europe & Other 16,347 18,328 23,802 –11%
Netherlands 1,869 2,204 2,372 –15%
Germany 5,050 6,354 6,039 –21%
GROUP TOTAL 67,758 80,345 92,481 –16%
EPRA indicator: GHG-Dir-Abs; GHG-Indir-Abs.Scope (136/140): 123/124 owned and managed shopping centers (excluding Utrecht, Hoog Catharijne) + 8/8 managed only shopping centers + 5/8 owned only shopping centers (excluding Greece).Coverage rate: 95.8% of total shopping center portfolio value.
K L É P I E R R E 2 0 2 0 — NON-FINANCIAL DATA 13
E NVIR O NME NTAL PE R FO R MANCE IND ICATOR SGreenhouse gas emissions 2

LOCATION-BASED – GHG EMISSIONS INTENSITy FROM BUILDING ENERGy CONSUMPTION (Reported scope)
Indicator Territory 2020 2019 2018Change
2020/2019
Scopes 1 & 2 intensity(in kgCO2
/sq.m.)
France-Belgium 5.2 7 8 –25%
Italy 35.8 44 48 –19%
Scandinavia 3.9 5 5 –23%
Iberia 25.2 34 37 –26%
Central Europe & Other 35.2 42 41 –16%
Netherlands 20.8 23 25 –9%
Germany 18.1 23 22 –21%
GROUP TOTAL 16.9 21 24 –19%
EPRA indicator: GHG-Int-Abs.Scope (136/140): 123/124 owned and managed shopping centers (excluding Utrecht, Hoog Catharijne) + 8/8 managed only shopping centers + 5/8 owned only shopping centers (excluding Greece).Coverage rate: 95.8% of total shopping center portfolio value.
LOCATION-BASED – TOTAL DIRECT GHG EMISSIONS (Like-for-like scope)
Indicator Territory 2020 2019Change
2020/2019
Total Scope 1 emissions(in tCO2 )
France-Belgium 2,664 2,142 24%Italy 5,007 5,834 –14%Scandinavia 661 1,048 –37%Iberia 1,380 1,160 19%Central Europe & Other 698 986 –29%Netherlands 0 0 0%Germany 354 2,575 –86%
GROUP TOTAL 10,763 13,745 –22%
Total Scope 2 emissions(in tCO2
)
France-Belgium 3,840 4,983 –23%Italy 18,854 24,014 –21%Scandinavia 2,120 2,790 –24%Iberia 7,168 9,622 –26%Central Europe & Other 13,489 17,367 –22%Netherlands 1,869 2,199 –15%Germany 4,696 5,712 –18%
GROUP TOTAL 52,036 66,687 –22%
Total Scopes 1 & 2 emissions(in tCO2
)
France-Belgium 6,504 7,125 –9%Italy 23,860 29,848 –20%Scandinavia 2,780 3,839 –28%Iberia 8,548 10,782 –21%Central Europe & Other 14,187 18,353 –23%Netherlands 1,869 2,199 –15%Germany 5,050 8,287 –39%GROUP TOTAL 62,799 80,431 –22%
EPRA indicator: GHG-Dir-LfL; GHG-Indir-LfL.Scope (125/140): 122/124 owned and managed shopping centers (excluding Utrecht, Hoog Catharijne and Paris Saint-Lazare) + 3/8 managed only shopping centers (excluding Aulnoy-les-Valenciennes; Gonfreville; Nîmes, Étoile; Grand Quétigny; Mulhouse Ilzach) + 0/8 owned only shopping centers.Coverage rate: 92.2% of total shopping center portfolio value.
14 K L É P I E R R E 2 0 2 0 — NON-FINANCIAL DATA
ENVIRONMENTA L P ERFORMA N CE I N DI CATOR SGreenhouse gas emissions2

LOCATION-BASED – GHG EMISSIONS INTENSITy FROM BUILDING ENERGy CONSUMPTION (Like-for-like scope)
Indicator Territory 2020 2019Change
2020/2019
Scopes 1 & 2 intensity(in kgCO2
/m2)
France-Belgium 5.1 7.2 –29%Italy 35.6 44.1 –19%Scandinavia 3.9 5.3 –27%Iberia 25.2 34.9 –28%Central Europe & Other 32.4 42.1 –23%Netherlands 20.8 22.8 –9%Germany 18.1 29.8 –39%
GROUP TOTAL 16.5 22.0 –25%
EPRA indicator: GHG-Int-LfL.Scope (125/140): 122/124 owned and managed shopping centers (excluding Utrecht, Hoog Catharijne and Paris Saint-Lazare) + 3/8 managed only shopping centers (excluding Aulnoy-les-Valenciennes; Gonfreville; Nîmes, Étoile; Grand Quétigny; Mulhouse Ilzach) + 0/8 owned only shopping centers.Coverage rate: 92.2% of total shopping center portfolio value.
Using the Location-Based method, the Group's GHG emissions show a decrease of 22% in 2020 for scopes 1 and 2. This result is fully in line with the reduction in total energy consumption (of same magnitude) over the year.
2.2.2 Market-based direct GHG emissions and intensity (scopes 1 and 2)
MARKET BASED – TOTAL DIRECT GHG EMISSIONS (Reported scope)
Indicator Territory 2020 2019 2018Change
2020/2019
Total Scope 1 emissions(in tCO2 )
France-Belgium 1,416 3,937 3,398 –64%
Italy 5,026 5,966 4,983 –16%
Scandinavia 661 526 197 26%
Iberia 1,380 1,096 572 26%
Central Europe & Other 832 1,018 1,798 –18%
Netherlands 0 5 0 –100%
Germany 354 642 0 –45%
GROUP TOTAL 9,668 13,190 10,947 –27%
Total Scope 2 emissions(in tCO2 )
France-Belgium 1,189 1,201 2,609 –1%
Italy 5,064 7,020 12,274 –28%
Scandinavia 558 1,811 3,602 –69%
Iberia 0 0 3,481
Central Europe & Other 3,868 10,853 21,280 –64%
Netherlands 48 61 66 –21%
Germany 487 608 1,888 –20%
GROUP TOTAL 11,215 21,553 45,200 –48%
Total Scopes 1 & 2 emissions(in tCO2 )
France-Belgium 2,606 5,137 6,007 –49%
Italy 10,090 12,986 17,257 –22%
Scandinavia 1,219 2,337 3,799 –48%
Iberia 1,380 1,096 4,053 26%
Central Europe & Other 4,700 11,871 23,078 –60%
Netherlands 48 66 66 –27%
Germany 841 1,249 1,888 –33%
GROUP TOTAL 20,883 34,743 56,147 –40%
EPRA indicator: GHG-Dir-Abs; GHG-Indir-Abs.Scope (136/140): 123/124 owned and managed shopping centers (excluding Utrecht, Hoog Catharijne) + 8/8 managed only shopping centers + 5/8 owned only shopping centers (excluding Greece).Coverage rate: 95.8% of total shopping center portfolio value.
K L É P I E R R E 2 0 2 0 — NON-FINANCIAL DATA 15
E NVIR O NME NTAL PE R FO R MANCE IND ICATOR SGreenhouse gas emissions 2

MARKET BASED – GHG EMISSIONS INTENSITy FROM BUILDING ENERGy CONSUMPTION (Reported scope)
Indicator Territory 2020 2019 2018Change
2020/2019
Scopes 1 & 2 intensity(in kgCO2 /sq.m.)
France-Belgium 1.9 4.4 5 –57%
Italy 13.9 19.3 24 –28%
Scandinavia 1.7 3.2 5 –47%
Iberia 4.1 3.3 12 23%
Central Europe & Other 10.1 27.2 39 –63%
Netherlands 0.5 0.7 1 –21%
Germany 3.0 4.5 7 –33%
GROUP TOTAL 5.2 9.4 14 –44%
EPRA indicator: GHG-Int-Abs.Scope (136/140): 123/124 owned and managed shopping centers (excluding Utrecht, Hoog Catharijne) + 8/8 managed only shopping centers + 5/8 owned only shopping centers (excluding Greece).Coverage rate: 95.8% of total shopping center portfolio value.
MARKET BASED – TOTAL DIRECT GHG EMISSIONS (Like-for-like scope)
Indicator Territory 2020 2019Change
2020/2019
Total Scope 1 emissions(in tCO2
)
France-Belgium 1,065 2,142 –50%Italy 5,007 5,834 –14%Scandinavia 661 1,048 –37%Iberia 1,380 1,160 19%Central Europe & Other 698 986 –29%Netherlands 0 0 0%Germany 354 2,575 –86%
GROUP TOTAL 9,164 13,745 –33%
Total Scope 2 emissions(in tCO2 )
France-Belgium 1,183 1,575 –25%Italy 3,360 4,941 –32%Scandinavia 558 973 –43%Iberia 0 0 0%Central Europe & Other 3,868 4,755 –19%Netherlands 48 61 –21%Germany 487 608 –20%
GROUP TOTAL 9,505 12,912 –26%
Total Scopes 1 & 2 emissions(in tCO2 )
France-Belgium 2,248 3,717 –40%Italy 8,367 10,774 –22%Scandinavia 1,219 2,021 –40%Iberia 1,380 1,160 19%Central Europe & Other 4,566 5,741 –20%Netherlands 48 61 –21%Germany 841 3,183 –74%GROUP TOTAL 18,669 26,657 –30%
EPRA indicator: GHG-Dir-LfL; GHG-Indir-LfL.Scope (125/140): 122/124 owned and managed shopping centers (excluding Utrecht, Hoog Catharijne and Paris Saint-Lazare) + 3/8 managed only shopping centers (excluding Aulnoy-les-Valenciennes; Gonfreville; Nîmes, Étoile; Grand Quétigny; Mulhouse Ilzach) + 0/8 owned only shopping centers.Coverage rate: 92.2% of total shopping center portfolio value.
MARKET BASED – GHG EMISSIONS INTENSITy FROM BUILDING ENERGy CONSUMPTION (Like-for-like scope)
Indicator Territory 2020 2019Change
2020/2019
Scopes 1 & 2 intensity(in kgCO2 /sq.m.)
France-Belgium 1.8 3.0 –42%Italy 12.5 15.9 –21%Scandinavia 1.7 2.8 –40%Iberia 4.1 3.8 9%Central Europe & Other 10.4 13.2 –21%Netherlands 0.5 0.6 –15%Germany 3.0 11.4 –74%GROUP TOTAL 4.9 7.1 –31%
EPRA indicator: GHG-Int-LfL.Scope (125/140): 122/124 owned and managed shopping centers (excluding Utrecht, Hoog Catharijne and Paris Saint-Lazare) + 3/8 managed only shopping centers (excluding Aulnoy-les-Valenciennes; Gonfreville; Nîmes, Étoile; Grand Quétigny; Mulhouse Ilzach) + 0/8 owned only shopping centers.Coverage rate: 92.2% of total shopping center portfolio value.
16 K L É P I E R R E 2 0 2 0 — NON-FINANCIAL DATA
ENVIRONMENTA L P ERFORMA N CE I N DI CATOR SGreenhouse gas emissions2

Using the Market-Based method, the Group's GHG emissions show a 40% decrease in 2020 for scopes 1 and 2. This significant drop can be explained as follows:
• Around 20% of this decrease is directly linked to the reduction in total energy consumption (of same magnitude) over the year;
• The remaining 20% is attributable to the update of the Group’s GHG calculation tool. In 2020, the whole tool was reviewed based on the advice of the independent verifier, resulting in the following modifications: update to emissions factors, the inclusion of green gas emission factor, the expansion of the scope of reported data (for example the European scope is now covered for employee commutes instead of just France in recent years).
2.2.3 Location-based indirect greenhouse gas emissions (scope 3)
LOCATION BASED – TOTAL INDIRECT GHG EMISSIONS (Reported scope)
Indicator Territory 2020 2019 2018Change
2020/2019
Scope 3 direct leverage (in tCO2 )
France-Belgium 32,260 10,954 N/A 195%Italy 8,229 12,655 N/A –35%Scandinavia 7,915 2,636 N/A 200%Iberia 6,517 5,309 N/A 23%Central Europe & Other 8,677 6,144 N/A 41%Netherlands 1,810 1,085 N/A 67%Germany 3,493 1,379 N/A 153%GROUP TOTAL 68,902 99,616 98,166 –31%
Scope 3 indirect leverage (in tCO2 )
France-Belgium 415,692 428,542 428,817 –3%Italy 318,728 486,665 558,842 –35%Scandinavia 93,975 126,429 161,587 –26%Iberia 108,934 193,775 218,786 –44%Central Europe & Other 100,096 143,692 185,341 –30%Netherlands 55,258 24,081 24,025 129%Germany 23,577 55,774 72,612 –58%GROUP TOTAL 1,116,260 1,458,957 1,650,009 –23%
Total Scope 3 emissions (in tCO2 )
France-Belgium 447,952 439,495 N/A 2%Italy 326,957 499,321 N/A –35%Scandinavia 101,891 129,065 N/A –21%Iberia 115,452 199,084 N/A –42%Central Europe & Other 108,773 149,835 N/A –27%Netherlands 57,067 25,166 N/A 127%Germany 27,070 57,153 N/A –53%GROUP TOTAL 1,185,162 1,558,573 1,748,175 –24%
EPRA indicator: GHG-InDir-Abs.Scope (136/140): 123/124 owned and managed shopping centers (excluding Utrecht, Hoog Catharijne) + 8/8 managed only shopping centers + 5/8 owned only shopping centers (excluding Greece).Coverage rate: 95.8% of total shopping center portfolio value.
The overall 24% decrease in total indirect GHG emissions (Scope 3) for 2020 is due to three main factors:
• Lower energy consumption and waste production in 2020 versus 2019 (please see details in the sections concerned);
• A decrease in “purchases of goods and services” related emissions both due to a refinement of the GHG emissions calculation tool and to more prudent spending;
• A reduction in “investments” emissions, mainly postponed due to the health situation in Europe.
A more in-depth analysis of the two components of the Group’s Scope 3 shows the following:
• Scope 3 with direct leverage:
• Following the review of the GHG emissions calculation tool, the “purchases of goods and services” and “non-property fixed assets” sources were reallocated to the level of each of the assets, mechanically leading to a significant increase at the regional level (in 2019, these emissions were added directly to the "Group Total" line, since there was no territorial breakdown).
• In the interest of greater transparency, the Group has enlarged the reporting of the “employee commuting” source to all countries (France only in 2019), which is also broken down at the regional level.
• With the exception of Italy, whose emissions are lower this year, in 2019 Scope 3 included GHG emissions linked to the Gran Reno (Bologna) extension project delivered during the past year. These emissions are therefore no longer included in 2020.
• Scope 3 with indirect leverage:
• Since footfall has decreased significantly as a result of the health crisis, emissions related to the “transportation of visitors” source have decreased accordingly (except for France, where the scope of reporting for 2020 has been expanded compared to 2019; on a like-for-like basis, these emissions are also lower, as for other regions).
• In the same way as can be observed for common areas, energy consumption in private areas has also decreased this year, significantly reducing the "downstream leasing" source (except for the Netherlands, where the increase is linked to a change in the methodology used to calculate of surface areas for the Markthal shopping center in Rotterdam).
K L É P I E R R E 2 0 2 0 — NON-FINANCIAL DATA 17
E NVIR O NME NTAL PE R FO R MANCE IND ICATOR SGreenhouse gas emissions 2

LOCATION BASED – TOTAL INDIRECT GHG EMISSIONS (Like-for-like scope)
Indicator Territory 2020 2019Change
2020/2019
Scope 3 direct leverage (in tCO2)
France-Belgium 30,992 27,791 12%Italy 7,438 9,396 –21%Scandinavia 7,915 9,554 –17%Iberia 6,517 8,546 –24%Central Europe & Other 7,663 9,397 –18%Netherlands 1,810 2,045 –11%
Germany 3,493 4,043 –14%
GROUP TOTAL 65,828 70,772 –7%
Scope 3 indirect leverage (in tCO2)
France-Belgium 337,922 419,825 –20%Italy 294,121 382,279 –23%Scandinavia 93,975 103,488 –9%Iberia 108,934 151,469 –28%Central Europe & Other 94,329 127,220 –26%Netherlands 55,258 60,360 –8%Germany 23,577 29,879 –21%
GROUP TOTAL 1,008,116 1,274,521 –21%
Total Scope 3 emissions (in tCO2)
France-Belgium 368,914 447,617 –18%Italy 301,559 391,675 –23%Scandinavia 101,891 113,043 –10%Iberia 115,452 160,015 –28%Central Europe & Other 101,992 136,618 –25%Netherlands 57,067 62,405 –9%Germany 27,070 33,922 –20%GROUP TOTAL 1,073,945 1,345,293 –20%
EPRA indicator: GHG-InDir-Lfl.Scope (125/140): 122/124 owned and managed shopping centers (excluding Utrecht, Hoog Catharijne and Paris Saint-Lazare) + 3/8 managed only shopping centers (excluding Aulnoy les Valenciennes; Gonfreville; Nîmes, Etoile; Grand Quetigny; Mulhouse Ilzach) + 0/8 owned only shopping centers.Coverage rate: 92.2% of total shopping center portfolio value.
On a comparable basis (like-for-like scope), there was a 20% decrease in total Group Scope 3 emissions in 2020 versus 2019. However, there are no impact attributable to the reporting scope or to the GHG calculation tool (the 2019 comparative was recalculated with the updated tool).
This performance is fully aligned with the overall 2020 energy trends, i.e., a broadly better performance plus a slight “Covid effect”.
The 12% increase in Scope 3 direct leverage for France is linked to GHG emissions from the Creteil Soleil (Créteil) extension project delivered on 2020.
2.3 WATER
This section takes into account the total water consumed at the shopping center, including common areas, facilities, tenanted spaces, green spaces, cooling towers and headquarters consumption, to the extent that they are located within the center itself. It also includes the volumes of consumed pumped water and re-used water (including rainwater, greywater and boreholes).
2.3.1 Total water consumption
TOTAL WATER CONSUMPTION (in cu.m.) (Reported scope)
Territory 2020 2019 2018 2017Change
2020/2019France-Belgium 867,598 1,134,810 1,043,833 949,813 –24%
Italy 975,006 1,139,894 1,329,028 1,101,426 –14%
Scandinavia 273,887 336,343 372,966 358,163 –19%
Iberia 251,977 384,115 401,117 337,018 –34%
Central Europe & Other 381,444 454,716 595,898 665,408 –16%
Netherlands 43,287 23,799 23,708 26,345 82%
Germany 90,606 120,911 128,198 118,636 –25%
GROUP TOTAL 2,883,805 3,594,588 3,894,748 3,556,809 –20%
Scope (135/140): 123/124 owned and managed shopping centers (excluding Vittuone Il Destriero) + 8/8 managed only shopping centers + 4/8 owned only (excluding Riom Menetrol & Greece).Coverage rate: 99.4% of shopping centers owned and managed or owned only.
18 K L É P I E R R E 2 0 2 0 — NON-FINANCIAL DATA
ENVIRONMENTA L P ERFORMA N CE I N DI CATOR SWater2

TOTAL WATER CONSUMPTION (in cu.m.) (Like-for-like scope)
Territory 2020 2019Change
2020/2019France-Belgium 851,669 1,127,406 –24%
Italy 902,223 1,139,894 –21%
Scandinavia 273,887 336,785 –19%
Iberia 251,977 362,519 –30%
Central Europe & Other 331,689 454,716 –27%
Netherlands 18,842 23,799 –21%
Germany 90,606 119,334 –24%
GROUP TOTAL 2,720,893 3,564,454 –24%
Scope (129/140): 121/124 owned and managed shopping centers (excluding: Utrecht, Hoog Catharijne; Vittuone, Il Destriero; Paris Saint-Lazare) + 8/8 managed only shopping centers + 0/8 owned only.
The Group’s water consumption fell by 20% in 2020. This is mainly attributable to lower footfall across the entire portfolio due to the health situation. As the vast majority of water consumption is for sanitary facilities and restaurants, it is directly linked to the number of visitors at the centers.
The significant increase (reported scope) for the Netherlands is the result of the inclusion of the water consumption of Hoog Catharijne (Utrecht) after several years outside the scope due to major construction works.
2.3.2 Total water intensity
TOTAL BUILDING WATER INTENSITy (in liters/visit) (Reported scope)
Territory 2020 2019 2018 2017Change
2020/2019France-Belgium 3.4 4 4 4 –8%
Italy 8.3 8 8 8 3%
Scandinavia 3.7 4 4 6 –8%
Iberia 3.5 4 4 4 –3%
Central Europe & Other 6.3 6 5 7 11%
Netherlands 1.2 1 1 2 –16%
Germany 3.5 4 4 5 –7%
GROUP TOTAL 4.5 5 5 4 –4%
Scope (133/140): 122/124 owned and managed shopping centers (excluding Paris Saint-Lazare & Vittuone Il Destriero) + 7/8 managed only shopping centers (excluding Nîmes, Étoile) + 4/8 owned only (excluding Riom Menetrol & Greece shopping centers).Coverage rate: 98.3% of total shopping center portfolio value.
TOTAL BUILDING WATER INTENSITy (in liters/visit) (Like-for-like scope)
Territory 2020 2019Change
2020/2019France-Belgium 3.3 3.6 –7%
Italy 8.3 7.9 4%
Scandinavia 3.7 4.0 –8%
Iberia 3.5 3.5 –1%
Central Europe & Other 5.9 5.8 2%
Netherlands 1.6 1.5 5%
Germany 3.5 3.7 –5%
GROUP TOTAL 4.5 4.6 –3%
Scope (128/140): 121/124 owned and managed shopping centers (excluding: Utrecht, Hoog Catharijne; Vittuone, Il Destriero; Paris Saint-Lazare) + 7/8 managed only shopping centers (excluding Nîmes, Étoile) + 0/8 owned only.Coverage rate: 91.8% of shopping centers owned and managed or owned only.
Water intensity at Group level once again decreased during the year, to 4.5 liters per visit, illustrating the continuously improving performance of the teams despite the complex context in 2020. The regional changes are explained by scope adjustments, notably the inclusion of Akmerkez (Istanbul) and Hoog Catharijne (Utrecht) in Central Europe & Other and the Netherlands, respectively.
K L É P I E R R E 2 0 2 0 — NON-FINANCIAL DATA 19
E NVIR O NME NTAL PE R FO R MANCE IND ICATOR SWater 2

2.4 WASTE
Since the end of 2017, the Group has set key performance indicators over the period to 2022, to reduce the amount of waste sent to landfill and increase the volume sorted, recovered and recycled as a result. Waste measured at Klépierre includes all activity waste from both tenants and common areas. Waste enhanced by material recovery includes all activity waste of tenants and common areas used for one
of the following purposes: “recycled”, “reused”, “composted” or “other material recovery”. Waste enhanced by energy recovery is waste used for “incineration with energy recovery”, “anaerobic digestion”, or “other form of energy recovery”. Non-recovered waste includes all activity waste of tenants and common areas which have one of the following uses: “incineration without energy recovery” or “sent to landfill”.
2.4.1 Waste destination
TOTAL WEIGHT OF WASTE By DISPOSAL ROUTE (Reported scope)
Indicator Territory 2020 2019 2018
Total waste by disposal route(in tons)
France-Belgium 19,833 23,111 23,299
Italy 9,132 10,715 12,086
Scandinavia 8,983 10,342 9,874
Iberia 7,910 11,061 10,335
Central Europe & Other 4,497 5,680 7,458
Netherlands 2,624 3,343 3,619
Germany 773 959 974
GROUP TOTAL 53,751 65,211 67,645
Recycled (in %)
France-Belgium 32% 31% 30%
Italy 46% 44% 39%
Scandinavia 43% 42% 42%
Iberia 35% 28% 33%
Central Europe & Other 38% 39% 32%
Netherlands 25% 25% 52%
Germany 34% 33% 32%
GROUP TOTAL 37% 35% 35%
Reused (in %)
France-Belgium 0% 0% 0%
Italy 0% 0% 10%
Scandinavia 0% 0% 1%
Iberia 0% 0% 0%
Central Europe & Other 1% 0% 4%
Netherlands 0% 0% 0%
Germany 0% 0% 0%
GROUP TOTAL 0% 0% 2%
Other form of material recovery (in %)
France-Belgium 0% 0% 10%
Italy 5% 6% 13%
Scandinavia 1% 1% 1%
Iberia 2% 7% 5%
Central Europe & Other 3% 1% 8%
Netherlands 0% 0% 0%
Germany 11% 9% 8%
GROUP TOTAL 2% 3% 8%
Composted (in %)
France-Belgium 0% 0% 0%
Italy 10% 9% 10%
Scandinavia 5% 5% 8%
Iberia 6% 2% 13%
Central Europe & Other 2% 2% 1%
Netherlands 2% 1% 2%
Germany 7% 9% 9%
GROUP TOTAL 4% 3% 5%
20 K L É P I E R R E 2 0 2 0 — NON-FINANCIAL DATA
ENVIRONMENTA L P ERFORMA N CE I N DI CATOR SWaste2

Indicator Territory 2020 2019 2018
Anaerobic digestion (in %)
France-Belgium 4% 4% 1%
Italy 0% 0% 0%
Scandinavia 8% 9% 5%
Iberia 6% 4% 0%
Central Europe & Other 0% 0% 0%
Netherlands 0% 0% 0%
Germany 1% 2% 4%
GROUP TOTAL 4% 3% 1%
Incinerated with energy recovery (in %)
France-Belgium 60% 61% 53%
Italy 12% 12% 5%
Scandinavia 42% 43% 43%
Iberia 18% 17% 35%
Central Europe & Other 16% 15% 18%
Netherlands 72% 73% 44%
Germany 47% 47% 47%
GROUP TOTAL 39% 39% 36%
Other form of energy recovery (in %)
France-Belgium 2% 2% 1%
Italy 14% 17% 3%
Scandinavia 0% 0% 1%
Iberia 11% 11% 0%
Central Europe & Other 2% 3% 0%
Netherlands 2% 1% 0%
Germany 0% 0% 0%
GROUP TOTAL 5% 6% 1%
Incinerated without energy recovery (in %)
France-Belgium 0% 0% 0%
Italy 0% 0% 0%
Scandinavia 0% 0% 0%
Iberia 0% 0% 0%
Central Europe & Other 0% 0% 4%
Netherlands 0% 0% 2%
Germany 0% 0% 0%
GROUP TOTAL 0% 0% 1%
Landfill (in %)
France-Belgium 1% 2% 4%
Italy 12% 12% 20%
Scandinavia 0% 0% 0%
Iberia 22% 31% 14%
Central Europe & Other 38% 39% 38%
Netherlands 0% 0% 2%
Germany 0% 0% 0%
GROUP TOTAL 9% 11% 12%
EPRA indicator: Waste-Abs.Scope (125/140): 113/124 owned and managed shopping centers (excluding Duisburg, Konigsgalerie; Angoulême, Champ de Mars; Bordeaux, Saint-Christoly; Valence, Victor Hugo; Chartres, la Madeleine; Paris Saint-Lazare; Bergamo, Seriate Alle Valli; Bologna, Shopville Gran Reno; Lecce, Cavallino; Modena, Grand Emilia; Varese, Belforte; Metz, Saint Jacques; Toulon, Mayol; Citta S. Angelo, Pescara Nord; Pavia Montebello d.B. Montebello; Pesaro, Rossini Center; Savignano s.R. Romagna Center; Venice, Nave de Vero; Kristianstad, Galleria Boulevard; Adapazari, Adacenter; Bursa, Anatolium; Denizli, Teras Park; Tarsus, Tarsu; Tekirdag, Tekira) + 7/8 managed-only shopping centers (excluding Nîmes, Étoile) + 5/8 owned only (excluding Greece).Coverage rate: 95.6%.
K L É P I E R R E 2 0 2 0 — NON-FINANCIAL DATA 21
E NVIR O NME NTAL PE R FO R MANCE IND ICATOR SWaste 2

TOTAL WEIGHT OF WASTE By DISPOSAL ROUTE (Like-for-like scope)
Indicator Territory 2020 2019
Total waste by disposal route (in tons)
France-Belgium 19,607 23,122
Italy 8,066 10,809
Scandinavia 8,983 10,342
Iberia 7,910 11,102
Central Europe & Other 4,253 5,695
Netherlands 2,624 3,352
Germany 773 958
GROUP TOTAL 52,215 65,382
Recycled (in %)
France-Belgium 32% 32%
Italy 48% 44%
Scandinavia 43% 42%
Iberia 35% 32%
Central Europe & Other 38% 39%
Netherlands 25% 25%
Germany 34% 33%
GROUP TOTAL 37% 36%
Reused (in %)
France-Belgium 0% 0%
Italy 0% 0%
Scandinavia 0% 0%
Iberia 0% 0%
Central Europe & Other 1% 0%
Netherlands 0% 0%
Germany 0% 0%
GROUP TOTAL 0% 0%
Other form of material recovery (in %)
France-Belgium 0% 0%
Italy 5% 6%
Scandinavia 1% 1%
Iberia 2% 2%
Central Europe & Other 3% 1%
Netherlands 0% 0%
Germany 11% 9%
GROUP TOTAL 2% 2%
Composted (in %)
France-Belgium 0% 0%
Italy 9% 9%
Scandinavia 5% 5%
Iberia 6% 7%
Central Europe & Other 2% 2%
Netherlands 2% 1%
Germany 7% 9%
GROUP TOTAL 4% 4%
Anaerobic digestion (in %)
France-Belgium 4% 3%
Italy 0% 0%
Scandinavia 8% 9%
Iberia 6% 4%
Central Europe & Other 0% 0%
Netherlands 0% 0%
Germany 1% 2%
GROUP TOTAL 4% 3%
Incinerated with energy recovery (in %)
France-Belgium 59% 59%
Italy 14% 16%
Scandinavia 42% 43%
Iberia 18% 17%
Central Europe & Other 17% 15%
Netherlands 72% 72%
Germany 47% 47%
GROUP TOTAL 40% 39%
22 K L É P I E R R E 2 0 2 0 — NON-FINANCIAL DATA
ENVIRONMENTA L P ERFORMA N CE I N DI CATOR SWaste2

Indicator Territory 2020 2019
Other form of energy recovery (in %)
France-Belgium 2% 2%
Italy 16% 16%
Scandinavia 0% 0%
Iberia 11% 7%
Central Europe & Other 2% 3%
Netherlands 2% 1%
Germany 0% 0%
GROUP TOTAL 5% 5%
Incinerated without energy recovery (in %)
France-Belgium 0% 0%
Italy 0% 0%
Scandinavia 0% 0%
Iberia 0% 0%
Central Europe & Other 0% 0%
Netherlands 0% 0%
Germany 0% 0%
GROUP TOTAL 0% 0%
Landfill (in %)
France-Belgium 1% 2%
Italy 7% 9%
Scandinavia 0% 0%
Iberia 22% 30%
Central Europe & Other 37% 39%
Netherlands 0% 0%
Germany 0% 0%
GROUP TOTAL 8% 11%
EPRA indicator: Waste-LfL.Scope (120/140): 113/124 owned and managed shopping centers (excluding Duisburg, Konigsgalerie; Angoulême, Champ de Mars; Bordeaux, Saint-Christoly; Valence, Victor Hugo; Chartres, La Madeleine; Paris Saint-Lazare; Bergamo, Seriate Alle Valli; Bologna, Shopville Gran Reno; Lecce, Cavallino; Modena, Grand Emilia; Varese, Belforte) + 7/8 managed-only shopping centers (excluding Nîmes, Étoile) + 0/8 owned only (excluding Greece).Coverage rate: 93.2%.
There has been an overall decrease in the tonnages of all types of waste due to the health situation involving the closure of centers and the resulting drop in footfall.
Nevertheless, there has also been a slight increase in the proportion of waste recycled, mainly driven by the Iberia region where waste BOOST interventions have been conducted in most assets and communication with tenants has been strengthened.
SHARE OF RECOVERED WASTE (Reported scope)
Territory 2020 2019 2018France-Belgium 99% 98% 96%
Italy 88% 88% 80%
Scandinavia 100% 100% 100%
Iberia 90% 78% 91%
Central Europe & Other 94% 92% 67%
Netherlands 100% 100% 90%
Germany 100% 100% 100%
GROUP TOTAL 96% 93% 90%
Scope (104/140): 93/124 owned and managed shopping centers (excluding Bratislava, Danubia; Duisburg, Konigsgalerie; Angoulême, Champ de Mars; Bordeaux, Saint-Christoly; Valence, Victor Hugo; Chartres, la Madeleine; Paris Saint-Lazare; Bergamo, Seriate Alle Valli; Bologna, Shopville Gran Reno; Lecce, Cavallino; Modena, Grand Emilia; Varese, Belforte; Metz, Saint Jacques; Toulon, Mayol; Citta S. Angelo, Pescara Nord; Pavia Montebello d.B. Montebello; Pesaro, Rossini Center; Savignano s.R. Romagna Center; Venice, Nave de Vero; Kristianstad, Galleria Boulevard; Adapazari, Adacenter; Bursa, Anatolium; Denizli, Teras Park; Tarsus, Tarsu; Tekirdag, Tekira; Madrid, Principe Pio; Oviedo, Los Prados; Santa Cruz de Tenerife, Meridiano; Vallecas, La Gavia; Madrid, Plenilunio; Orebro, Marieberg) + 7/8 managed-only shopping centers (excluding Nîmes, Étoile) + 4/8 owned only (excluding Greece & Istanbul, Akmerkez).Coverage rate: 84.3%.
K L É P I E R R E 2 0 2 0 — NON-FINANCIAL DATA 23
E NVIR O NME NTAL PE R FO R MANCE IND ICATOR SWaste 2

SHARE OF RECOVERED WASTE (Like-for-like scope)
Territory 2020 2019France-Belgium 99% 99%
Italy 93% 91%
Scandinavia 100% 100%
Iberia 90% 76%
Central Europe & Other 94% 92%
Netherlands 100% 100%
Germany 100% 100%
GROUP TOTAL 97% 95%
Scope (99/140): 92/124 owned and managed shopping centers (excluding Bratislava, Danubia; Duisburg, Konigsgalerie; Angoulême, Champ de Mars; Bordeaux, Saint-Christoly; Valence, Victor Hugo; Chartres, La Madeleine; Paris Saint-Lazare; Bergamo, Seriate Alle Valli; Bologna, Shopville Gran Reno; Lecce, Cavallino; Modena, Grand Emilia; Varese, Belforte; Utrecht, Hoog Catharijne; Metz, Saint Jacques; Toulon, Mayol; Citta S. Angelo, Pescara Nord; Pavia Montebello d.B. Montebello; Pesaro, Rossini Center; Savignano s.R. Romagna Center; Venice, Nave de Vero; Kristianstad, Galleria Boulevard; Adapazari, Adacenter; Bursa, Anatolium; Denizli, Teras Park; Tarsus, Tarsu; Tekirdag, Tekira; Madrid, Principe Pio; Oviedo, Los Prados; Santa Cruz de Tenerife, Meridiano; Vallecas, La Gavia; Madrid, Plenilunio; Orebro, Marieberg) + 7/8 managed-only shopping centers (excluding Nîmes, Étoile) + 0/8 owned only.Coverage rate: 82.6%.
The proportion of waste recovered increased by 3 points in 2020. This is the result of continuous improvement with waste providers on the final destination of waste collected and sorted in the centers. It is also due to a scope effect, as centers where Klépierre has no leverage on the final destination of waste have been removed from the Group calculation (for instance, where local municipalities impose methods of sorting and final destinations of waste).
2.4.2 Waste types (Reported scope)
Share of recovered waste Share of sorted waste
89%
45%
92%96%
51% 50%
2018 20202019
45.1%Cardboard
10.8%Paper
13.7%Foodwaste
1.6%Pallets
3.8%Plastic
2.9%Glass
1.8%Wood
0.9%Metal
0.2%Hangers
0.2%WEEE
18.9%Other sorted waste
24 K L É P I E R R E 2 0 2 0 — NON-FINANCIAL DATA
ENVIRONMENTA L P ERFORMA N CE I N DI CATOR SWaste2

BREAKDOWN OF SORTED WASTE By TyPE OF WASTE (in tonnage) (Reported scope)
Waste Type 2020 share 2019Cardboard 45.1% 43.9%
Paper 10.8% 10.6%
Foodwaste 13.7% 12.5%
Pallets 1.6% 1.5%
Plastic 3.8% 3.8%
Glass 2.9% 2.7%
Wood 1.8% 1.6%
Metal 0.9% 1.0%
Hangers 0.2% 0.1%
WEEE 0.2% 0.3%
Other sorted waste 18.9% 22.2%
GROUP TOTAL 100% 100%
Scope (125/140): 113/124 owned and managed shopping centers (excluding Duisburg, Konigsgalerie; Angoulême, Champ de Mars; Bordeaux, Saint-Christoly; Valence, Victor Hugo; Chartres, la Madeleine; Paris Saint-Lazare; Bergamo, Seriate Alle Valli; Bologna, Shopville Gran Reno; Lecce, Cavallino; Modena, Grand Emilia; Varese, Belforte; Metz, Saint Jacques; Toulon, Mayol; Citta S. Angelo, Pescara Nord; Pavia Montebello d.B. Montebello; Pesaro, Rossini Center; Savignano s.R. Romagna Center; Venice, Nave de Vero; Kristianstad, Galleria Boulevard; Adapazari, Adacenter; Bursa, Anatolium; Denizli, Teras Park; Tarsus, Tarsu; Tekirdag, Tekira) + 7/8 managed-only shopping centers (excluding Nîmes, Étoile) + 5/8 owned only (excluding Greece).Coverage rate: 95.6%.
At Group level, cardboard, paper and food waste remain the three categories with the biggest tonnage sorted on site, representing more than two-thirds of total waste produced.
2.5 MOBILITy
Klépierre regularly monitors mobility patterns at its centers, focusing in particular on the percentage of centers accessible via public transports, and the percentage equipped with charging stations for electric vehicles. The Group also keeps track of bike accessibility and any year-on-year trends in the modes of transport used by visitors to its centers.
2.5.1 Visitors travel mode
VISITORS TRAVEL MODE (2020) (Reported scope)
Territory By carBy public transport
By soft mobility
France-Belgium 63% 20% 17%
Italy 91% 5% 4%
Scandinavia 58% 24% 18%
Iberia 63% 20% 17%
Central Europe & Other 44% 28% 28%
Netherlands 39% 32% 29%
Germany 37% 37% 26%
GROUP TOTAL 65% 19% 16%
Scope (136/140): 123/124 owned and managed shopping centers (excluding Paris Saint-Lazare) + 8/8 managed-only shopping centers + 5/8 owned only shopping center (excluding Greece).Coverage rate: 98.8% of total shopping center portfolio value.
In 2020, there was a year-on-year decrease in the proportion of visitors coming to centers by public transports (down 6 percentage points) in favor of private cars (up 7 percentage points), most likely due to concerns over using public transports in the context of Covid-19.
K L É P I E R R E 2 0 2 0 — NON-FINANCIAL DATA 25
E NVIR O NME NTAL PE R FO R MANCE IND ICATOR SMobility 2

2.5.2 Specific mobility services
PROPORTION OF PORTFOLIO WITH SPECIFIC MOBILITy SERVICES IN PLACE (2020) (Reported scope)
TerritoryPublic transport
accessibilitySpace reserved
for cyclistsElectric car
charging stationFrance-Belgium 100% 100% 57%
Italy 91% 100% 58%
Scandinavia 100% 100% 98%
Iberia 100% 100% 73%
Central Europe & Other 100% 87% 78%
Netherlands 100% 100% 97%
Germany 100% 100% 38%
GROUP TOTAL 98% 99% 68%
Scope (137/140): 124/124 owned and managed shopping centers + 8/8 managed-only shopping centers + 5/8 owned only shopping center (excluding Greece).Coverage rate: 99.9% of total shopping center portfolio value.
The proportion of centers accessible by public transport and equipped with cycling equipment remained stable in 2020. However, those with charging stations for electric vehicles rose by 8 percentage points in 2020, mainly in France, Italy, Germany and Central Europe.
2.6 CERTIFICATIONS
This section details all of the possible certifications that the Group strives towards, above all to help achieve its key performance indicator of 100% of centers with sustainable development certification by 2022. For a description of this specific performance measure, please see section 5.2.3 of Klépierre’s 2020 Universal Registration Document.
In order to improve the implementation of certification on each asset Europe-wide, Klépierre signed a new contract in 2018 to put in place a portfolio approach to BREEAM In-Use coverage. The new approach has resulted in 100% of assets being certified BREEAM In-Use Part 1, as well as 66% centers certified BREEAM In-Use Part 2.
In addition to this certification, ISO 14001, ISO 50001 or energy performance certification is present across the portfolio, with coverage detailed in the following tables.
For a broader narrative on Klépierre’s performance in achieving its other sustainable certification objectives in line with its development projects, please refer to section 5.2.3.2 of the Klépierre’s 2020 Universal Registration Document.
2.6.1 Total sustainable certification
PROPORTION OF CENTERS WITH A SUSTAINABLE CERTIFICATION* (2020) (Reported scope)
Territory Number of assets Share in total valueFrance-Belgium 53 100%
Italy 31 100%
Scandinavia 18 100%
Iberia 10 100%
Central Europe & Other 14 100%
Netherlands 4 100%
Germany 5 100%
GROUP TOTAL 135 100%
* Sustainable certification: BREEAM In-Use, ISO14001 and/or ISO 50001.EPRA indicator: Cert-Tot.Scope (135/140): 122/124 owned and managed shopping centers (excluding Paris Saint-Lazare; Bratislava, Danubia) + 8/8 managed-only shopping centers + 5/8 owned-only shopping centers.Coverage rate: 98.8% of total shopping center portfolio value.
26 K L É P I E R R E 2 0 2 0 — NON-FINANCIAL DATA
ENVIRONMENTA L P ERFORMA N CE I N DI CATOR SCertifications2

PROPORTION OF CENTERS WITH A SUSTAINABLE CERTIFICATION (2020)* (Like-for-like scope)
Indicator Territory 2020 2019Change
2020/2019
Proportion by value
France-Belgium 100% 100% 0%
Italy 100% 100% 0%
Scandinavia 100% 100% 0%
Iberia 100% 100% 0%
Central Europe & Other 100% 100% 0%
Netherlands 100% 100% 0%
Germany 100% 100% 0%
GROUP TOTAL 100% 100% 0%
Proportion by number of centers
France-Belgium 100% 100% 0%
Italy 100% 100% 0%
Scandinavia 100% 100% 0%
Iberia 100% 100% 0%
Central Europe & Other 100% 100% 0%
Netherlands 100% 100% 0%
Germany 100% 100% 0%
GROUP TOTAL 100% 100% 0%
Proportion by floor area
France-Belgium 100% 100% 0%
Italy 100% 100% 0%
Scandinavia 100% 100% 0%
Iberia 100% 100% 0%
Central Europe & Other 100% 100% 0%
Netherlands 100% 100% 0%
Germany 100% 100% 0%
GROUP TOTAL 100% 100% 0%
* Sustainable certification: BREEAM In-Use, ISO14001 and/or ISO 50001.EPRA indicator: Cert-Tot.Scope (132/140): 120/124 owned and managed shopping centers (excluding Paris Saint-Lazare; Clermont-Ferrand Jaude; Clermont-Ferrand Carré Jaude; Bratislava, Danubia) + 8/8 managed-only shopping centers + 4/8 owned-only shopping centers (excluding Greece; Istanbul Akmerkez).Coverage rate: 96.4% of total shopping center portfolio value.
All assets within the Klépierre portfolio have had sustainable certification since 2019. To achieve this outcome, the Group signed an innovative contract with the BRE two years ago to put in place a portfolio approach to BREEAM In-Use coverage, which resulted in 100% of assets being certified BREEAM In-Use Part 1, and 66% of centers certified BREEAM In-Use Part 2.
K L É P I E R R E 2 0 2 0 — NON-FINANCIAL DATA 27
E NVIR O NME NTAL PE R FO R MANCE IND ICATOR SCertifications 2

2.6.2 BREEAM In-Use Certification: Part 1
BREAKDOWN OF BREEAM IN-USE PART 1 CERTIFICATION By VALUE (Reported scope)
Indicator Territory 2020 2019 2018
Certified "Pass"
France-Belgium 0% 0% 0%
Italy 0% 0% 0%
Scandinavia 0% 0% 0%
Iberia 0% 0% 0%
Central Europe & Other 0% 0% 0%
Netherlands 0% 0% 0%
Germany 0% 0% 0%
GROUP TOTAL 0% 0% 0%
Certified "Good"
France-Belgium 4% 5% 2%
Italy 1% 2% 9%
Scandinavia 0% 0% 0%
Iberia 0% 0% 4%
Central Europe & Other 0% 0% 0%
Netherlands 0% 0% 0%
Germany 68% 67% 0%
GROUP TOTAL 5% 5% 3%
Certified "Very Good"
France-Belgium 81% 79% 40%
Italy 99% 98% 19%
Scandinavia 73% 73% 0%
Iberia 100% 100% 91%
Central Europe & Other 6% 7% 14%
Netherlands 100% 100% 0%
Germany 32% 33% 33%
GROUP TOTAL 80% 79% 30%
Certified "Excellent"
France-Belgium 14% 15% 12%
Italy 0% 0% 0%
Scandinavia 27% 27% 0%
Iberia 0% 0% 0%
Central Europe & Other 94% 93% 41%
Netherlands 0% 0% 0%
Germany 0% 0% 0%
GROUP TOTAL 15% 15% 7%
EPRA indicator: Cert-Tot.Scope (135/140): 122/124 owned and managed shopping centers (excluding Paris Saint-Lazare; Bratislava, Danubia) + 8/8 managed-only shopping centers + 5/8 owned-only shopping centers.Coverage rate: 98.8%.
28 K L É P I E R R E 2 0 2 0 — NON-FINANCIAL DATA
ENVIRONMENTA L P ERFORMA N CE I N DI CATOR SCertifications2

BREAKDOWN OF BREEAM IN-USE PART 1 CERTIFICATION By NUMBER OF CENTERS (Reported scope)
Indicator Territory 2020 2019 2018
Certified "Pass"
France-Belgium 2% 2% 0%
Italy 0% 0% 0%
Scandinavia 0% 0% 0%
Iberia 0% 0% 0%
Central Europe & Other 0% 0% 0%
Netherlands 0% 0% 0%
Germany 0% 0% 0%
GROUP TOTAL 1% 1% 0%
Certified "Good"
France-Belgium 19% 20% 4%
Italy 3% 3% 7%
Scandinavia 0% 0% 0%
Iberia 10% 9% 9%
Central Europe & Other 0% 0% 0%
Netherlands 0% 0% 0%
Germany 80% 80% 0%
GROUP TOTAL 12% 13% 4%
Certified "Very Good"
France-Belgium 74% 72% 33%
Italy 97% 97% 7%
Scandinavia 78% 78% 0%
Iberia 90% 91% 64%
Central Europe & Other 21% 23% 11%
Netherlands 100% 100% 0%
Germany 20% 20% 20%
GROUP TOTAL 74% 74% 21%
Certified "Excellent"
France-Belgium 6% 6% 2%
Italy 0% 0% 0%
Scandinavia 22% 22% 0%
Iberia 0% 0% 0%
Central Europe & Other 79% 77% 6%
Netherlands 0% 0% 0%
Germany 0% 0% 0%
GROUP TOTAL 13% 13% 2%
EPRA indicator: Cert-Tot.Scope (135/140): 122/124 owned and managed shopping centers (excluding Paris Saint-Lazare; Bratislava, Danubia) + 8/8 managed-only shopping centers + 5/8 owned-only shopping centers.Coverage rate: 98.8%.
K L É P I E R R E 2 0 2 0 — NON-FINANCIAL DATA 29
E NVIR O NME NTAL PE R FO R MANCE IND ICATOR SCertifications 2

BREAKDOWN OF BREEAM IN-USE PART 1 CERTIFICATION By FLOOR AREA (Reported scope)
Indicator Territory 2020 2019 2018
Certified "Pass"
France-Belgium 0% 0% 0%
Italy 0% 0% 0%
Scandinavia 0% 0% 0%
Iberia 0% 0% 0%
Central Europe & Other 0% 0% 0%
Netherlands 0% 0% 0%
Germany 0% 0% 0%
GROUP TOTAL 0% 0% 0%
Certified "Good"
France-Belgium 15% 14% 4%
Italy 4% 3% 8%
Scandinavia 0% 0% 0%
Iberia 7% 8% 6%
Central Europe & Other 0% 0% 0%
Netherlands 0% 0% 0%
Germany 69% 69% 0%
GROUP TOTAL 11% 10% 3%
Certified "Very Good"
France-Belgium 80% 77% 33%
Italy 96% 97% 17%
Scandinavia 73% 74% 0%
Iberia 93% 92% 74%
Central Europe & Other 17% 20% 11%
Netherlands 100% 100% 0%
Germany 31% 31% 31%
GROUP TOTAL 73% 75% 25%
Certified "Excellent"
France-Belgium 5% 8% 5%
Italy 0% 0% 0%
Scandinavia 27% 26% 0%
Iberia 0% 0% 0%
Central Europe & Other 83% 80% 9%
Netherlands 0% 0% 0%
Germany 0% 0% 0%
GROUP TOTAL 16% 15% 3%
EPRA indicator: Cert-Tot.Scope (135/140): 122/124 owned and managed shopping centers (excluding Paris Saint-Lazare; Bratislava, Danubia) + 8/8 managed-only shopping centers + 5/8 owned-only shopping centers.Coverage rate: 98.8%.
BREEAM In-Use certification is divided into two sub-certifications: Part 1 and Part 2. Part 1 represents an assessment of the environmental performance of the asset's built form, construction, fixtures, fittings and installed services. 100% of Klépierre’s assets have been certified against this standard for two years now, highlighting the excellence in sustainability of the assets within the Group’s portfolio.
30 K L É P I E R R E 2 0 2 0 — NON-FINANCIAL DATA
ENVIRONMENTA L P ERFORMA N CE I N DI CATOR SCertifications2

2.6.3 BREEAM In-Use Certification: Part 2
BREAKDOWN OF BREEAM IN-USE PART 2 CERTIFICATION By VALUE (Reported scope)
Indicator Territory 2020 2019 2018
Certified "Pass"
France-Belgium 0% 0% 2%
Italy 0% 0% 0%
Scandinavia 0% 0% 0%
Iberia 0% 0% 11%
Central Europe & Other 0% 0% 0%
Netherlands 0% 0% 0%
Germany 31% 30% 0%
GROUP TOTAL 1% 1% 2%
Certified "Good"
France-Belgium 16% 9% 3%
Italy 5% 5% 0%
Scandinavia 0% 0% 0%
Iberia 4% 4% 0%
Central Europe & Other 0% 0% 0%
Netherlands 100% 100% 0%
Germany 32% 33% 33%
GROUP TOTAL 15% 11% 3%
Certified "Very Good"
France-Belgium 58% 63% 22%
Italy 0% 0% 22%
Scandinavia 5% 0% 0%
Iberia 12% 12% 84%
Central Europe & Other 0% 0% 0%
Netherlands 0% 0% 0%
Germany 0% 0% 0%
GROUP TOTAL 26% 26% 20%
Certified "Excellent"
France-Belgium 22% 24% 27%
Italy 6% 0% 6%
Scandinavia 14% 0% 0%
Iberia 84% 84% 0%
Central Europe & Other 44% 47% 55%
Netherlands 0% 0% 0%
Germany 0% 0% 0%
GROUP TOTAL 23% 20% 15%
Certified "Outstanding"
France-Belgium 0% 0% 0%
Italy 0% 0% 0%
Scandinavia 0% 0% 0%
Iberia 0% 0% 0%
Central Europe & Other 13% 0% 0%
Netherlands 0% 0% 0%
Germany 0% 0% 0%
GROUP TOTAL 1% 0% 0%
EPRA indicator: Cert-Tot.Scope (135/140): 122/124 owned and managed shopping centers (excluding Paris Saint-Lazare; Bratislava, Danubia) + 8/8 managed-only shopping centers + 5/8 owned-only shopping centers.Coverage rate: 98.8%.
K L É P I E R R E 2 0 2 0 — NON-FINANCIAL DATA 31
E NVIR O NME NTAL PE R FO R MANCE IND ICATOR SCertifications 2

BREAKDOWN OF BREEAM IN-USE PART 2 CERTIFICATION By NUMBER OF CENTERS (Reported scope)
Indicator Territory 2020 2019 2018
Certified "Pass"
France-Belgium 2% 0% 2%
Italy 0% 0% 0%
Scandinavia 0% 0% 0%
Iberia 0% 0% 18%
Central Europe & Other 0% 0% 0%
Netherlands 0% 0% 0%
Germany 20% 20% 0%
GROUP TOTAL 1% 1% 2%
Certified "Good"
France-Belgium 19% 17% 7%
Italy 3% 3% 0%
Scandinavia 0% 0% 0%
Iberia 10% 9% 0%
Central Europe & Other 0% 0% 0%
Netherlands 100% 100% 0%
Germany 20% 20% 20%
GROUP TOTAL 13% 12% 3%
Certified "Very Good"
France-Belgium 55% 52% 17%
Italy 0% 0% 10%
Scandinavia 6% 0% 0%
Iberia 20% 18% 55%
Central Europe & Other 0% 0% 0%
Netherlands 0% 0% 0%
Germany 0% 0% 0%
GROUP TOTAL 24% 22% 13%
Certified "Excellent"
France-Belgium 8% 7% 13%
Italy 3% 0% 3%
Scandinavia 6% 0% 0%
Iberia 60% 55% 0%
Central Europe & Other 7% 8% 17%
Netherlands 0% 0% 0%
Germany 0% 0% 0%
GROUP TOTAL 10% 4% 8%
Certified "Outstanding"
France-Belgium 0% 0% 0%
Italy 0% 0% 0%
Scandinavia 0% 0% 0%
Iberia 0% 0% 0%
Central Europe & Other 7% 0% 0%
Netherlands 0% 0% 0%
Germany 0% 0% 0%
GROUP TOTAL 1% 0% 0%
EPRA indicator: Cert-Tot.Scope (135/140): 122/124 owned and managed shopping centers (excluding Paris Saint-Lazare; Bratislava, Danubia) + 8/8 managed-only shopping centers + 5/8 owned-only shopping centers.Coverage rate: 98.8%.
32 K L É P I E R R E 2 0 2 0 — NON-FINANCIAL DATA
ENVIRONMENTA L P ERFORMA N CE I N DI CATOR SCertifications2

BREAKDOWN OF BREEAM IN-USE PART 2 CERTIFICATION By FLOOR AREA (Reported scope)
Indicator Territory 2020 2019 2018
Certified "Pass"
France-Belgium 0% 0% 2%
Italy 0% 0% 0%
Scandinavia 0% 0% 0%
Iberia 0% 0% 18%
Central Europe & Other 0% 0% 0%
Netherlands 0% 0% 0%
Germany 26% 26% 0%
GROUP TOTAL 2% 1% 3%
Certified "Good"
France-Belgium 21% 17% 4%
Italy 2% 3% 0%
Scandinavia 0% 0% 0%
Iberia 11% 6% 0%
Central Europe & Other 0% 0% 0%
Netherlands 100% 100% 0%
Germany 31% 31% 31%
GROUP TOTAL 14% 15% 3%
Certified "Very Good"
France-Belgium 56% 54% 18%
Italy 0% 0% 19%
Scandinavia 7% 0% 0%
Iberia 20% 19% 63%
Central Europe & Other 0% 0% 0%
Netherlands 0% 0% 0%
Germany 0% 0% 0%
GROUP TOTAL 22% 21% 16%
Certified "Excellent"
France-Belgium 11% 13% 18%
Italy 6% 0% 6%
Scandinavia 12% 0% 0%
Iberia 62% 58% 0%
Central Europe & Other 12% 12% 20%
Netherlands 0% 0% 0%
Germany 0% 0% 0%
GROUP TOTAL 14% 6% 10%
Certified "Outstanding"
France-Belgium 0% 0% 0%
Italy 0% 0% 0%
Scandinavia 0% 0% 0%
Iberia 0% 0% 0%
Central Europe & Other 6% 0% 0%
Netherlands 0% 0% 0%
Germany 0% 0% 0%
GROUP TOTAL 1% 0% 0%
EPRA indicator: Cert-Tot.Scope (135/140): 122/124 owned and managed shopping centers (excluding Paris Saint-Lazare; Bratislava, Danubia) + 8/8 managed-only shopping centers + 5/8 owned-only shopping centers.Coverage rate: 98.8%.
BREEAM in Use certification is divided into two sub-certifications: Part 1 and Part 2. Part 2 represents an assessment of the management and operation of the building. 66% of Klépierre’s assets are certified against this additional standard for two years now, proving the high quality of processes and operational teams’ daily management of the Group’s assets.
K L É P I E R R E 2 0 2 0 — NON-FINANCIAL DATA 33
E NVIR O NME NTAL PE R FO R MANCE IND ICATOR SCertifications 2

2.6.4 Other sustainable certification
PROPORTION OF PORTFOLIO WITH AN ISO 14001 AND/OR ISO 50001 CERTIFICATION (Reported scope)
Indicator Territory 2020 2019
Proportion by value
France-Belgium 0% 0%Italy 69% 36%Scandinavia 100% 100%Iberia 100% 100%Central Europe & Other 12% 17%Netherlands 100% 100%Germany 0% 0%
GROUP TOTAL 44% 40%
Proportion by number of centers
France-Belgium 0% 0%Italy 42% 24%Scandinavia 100% 100%Iberia 100% 100%Central Europe & Other 36% 36%Netherlands 100% 100%Germany 0% 0%
GROUP TOTAL 37% 34%
Proportion by floor area
France-Belgium 0% 0%Italy 64% 36%Scandinavia 100% 100%Iberia 100% 100%Central Europe & Other 41% 49%Netherlands 100% 100%Germany 0% 0%
GROUP TOTAL 45% 44%
EPRA indicator: Cert-Tot.Scope (136/140): 123/124 owned and managed shopping centers (excluding Bratislava, Danubia) + 8/8 managed-only shopping centers + 5/8 owned-only shopping centers.Coverage rate: 99.9%.
The proportion of assets with ISO 14001 (environment) or ISO 50001 (energy) certification rose from 40% in 2019 to 44% in 2020. This increase is mainly due to the six new ISO 14001 certifications obtained in Italy during the year.
PROPORTION OF PORTFOLIO WITH AN ENERGy PERFORMANCE CERTIFICATION (Reported scope)
Indicator Territory 2020 2019 2018
Proportion by value
France-Belgium 92% 52% 46%Italy 100% 93% 96%Scandinavia 100% 98% 98%Iberia 100% 100% 100%Central Europe & Other 61% 63% 6%Netherlands 97% 92% 92%Germany 100% 0% 66%
GROUP TOTAL 94% 73% 70%
Proportion by number of centers
France-Belgium 91% 58% 59%Italy 100% 83% 90%Scandinavia 100% 94% 94%Iberia 100% 100% 100%Central Europe & Other 53% 36% 11%Netherlands 75% 50% 50%Germany 100% 0% 60%
GROUP TOTAL 91% 67% 67%
Proportion by floor area
France-Belgium 96% 51% 48%Italy 100% 86% 95%Scandinavia 100% 97% 97%Iberia 100% 100% 100%Central Europe & Other 60% 51% 14%Netherlands 24% 67% 53%Germany 100% 0% 64%
GROUP TOTAL 92% 68% 66%
EPRA indicator: Cert-Tot.Scope (137/140): 124/124 owned and managed shopping centers + 8/8 managed-only shopping centers + 5/8 owned-only shopping centers.Coverage rate: 99.9%.
34 K L É P I E R R E 2 0 2 0 — NON-FINANCIAL DATA
ENVIRONMENTA L P ERFORMA N CE I N DI CATOR SCertifications2

PROPORTION OF PORTFOLIO WITH AN ENERGy PERFORMANCE CERTIFICATION (Like-for-like scope)
Indicator By Territory 2020 2019Change
2020/2019
Proportion by value
France-Belgium 95% 46% 107%
Italy 100% 94% 7%
Scandinavia 100% 98% 2%
Iberia 100% 100% 0%
Central Europe & Other 70% 63% 12%
Netherlands 97% 93% 5%
Germany 100% 0% 0%
GROUP TOTAL 96% 70% 38%
Proportion by number of centers
France-Belgium 94% 59% 60%
Italy 100% 83% 21%
Scandinavia 100% 94% 6%
Iberia 100% 100% 0%
Central Europe & Other 57% 31% 86%
Netherlands 75% 50% 50%
Germany 100% 0% 0%
GROUP TOTAL 92% 67% 38%
Proportion by floor area
France-Belgium 97% 55% 76%
Italy 100% 84% 19%
Scandinavia 100% 97% 3%
Iberia 100% 100% 0%
Central Europe & Other 64% 46% 37%
Netherlands 24% 28% –15%
Germany 100% 0% 0%
GROUP TOTAL 93% 66% 40%
EPRA indicator: Cert-Tot.Scope (131/140): 123/124 owned and managed shopping centers (excluding Paris Saint-Lazare) + 8/8 managed-only shopping centers + 0/8 owned-only shopping centers.Coverage rate: 96.3%.
In 2020, two factors led to a strong increase in the proportion of assets having received an energy performance certificate, from 73% in 2019 to 94%:
• The improvement in performance and the realization of new audits;
• The clarification of reporting process to local teams.
K L É P I E R R E 2 0 2 0 — NON-FINANCIAL DATA 35
E NVIR O NME NTAL PE R FO R MANCE IND ICATOR SCertifications 2

3Social performance
indicators
3.1 HEALTH AND SAFETy
EMPLOyEE HEALTH AND SAFETy
Indicator Territory 2020 2019
Injury rate(per 100,000 hours worked)
France-Belgium 0.002% 0.003%
Italy 0.001% 0%
Scandinavia 0% 0%
Iberia 0.002% 0%
Central Europe & Other 0% 0%
Netherlands 0% 0%
Germany 0% 0.001%
GROUP TOTAL 0.005% 0.004%
Lost day rate(per 100,000 hours worked)
France-Belgium 0.071% 0.026%
Italy 0.031% 0%
Scandinavia 0% 0%
Iberia 0.071% 0%
Central Europe & Other 0% 0%
Netherlands 0% 0%
Germany 0% 0.051%
GROUP TOTAL 0.173% 0.077%
Absentee rate(average percentage in number of days per employee)
France-Belgium 3.3% 2.8%
Italy 1.4% 1.7%
Scandinavia 3.5% 3.7%
Iberia 2.0% 2.2%
Central Europe & Other 1.1% 1.3%
Netherlands 1.4% 2.1%
Germany 3.5% 6.0%
GROUP TOTAL 2.6% 2.6%
Fatalities(total number)
France-Belgium 0 0
Italy 0 0
Scandinavia 0 0
Iberia 0 0
Central Europe & Other 0 0
Netherlands 0 0
Germany 0 0
GROUP TOTAL 0 0
EPRA indicator: H&S-Emp.For a narrative on our performance, please see section 5.4.3.3.1 of Klépierre’s 2020 Universal Registration Document.For a narrative on our asset health and safety impacts (EPRA indicator: H&S-Asset) and compliance (EPRA indicator: H&S-Comp), please see sections 5.4.2.1 and 5.4.2.2 of Klépierre’s 2020 Universal Registration Document. H&S checks are annual and apply to 100% of owned and managed shopping centers. No sanctions or fines were issued in 2020 as a result of any non-compliance during these checks.
A stable year-on-year performance reflects Klépierre’s consistent care for employee security, safety and well-being.
36 K L É P I E R R E 2 0 2 0 — NON-FINANCIAL DATA

3.2 EMPLOyEE DIVERSITy
EMPLOyEE DIVERSITy (GENDER)*
Indicator 2020 2019Executive Management** 27% 27%Managers 40% 39%Non-Managers 74% 73%All employees 60% 59%
* Percentage of female employees.** Executive Board and Corporate Management Team.EPRA indicator: Diversity-Emp.
In 2020, women made up 60% of the Group’s total workforce but remain under-represented at management level. At the end of 2020, Klépierre adopted a new gender equality policy which includes quantative objectives to increase the share of women in the top management (see section of Klépierre's 2020 Universal Registration Document for more details).
GENDER PAy RATIO*
Indicator 2020 2019Executive Management** 0.88 0.84Managers 0.85 0.79Non-managers 0.81 0.83
* Ratio of female to male salaries.** Corporate Management Team and Group Management Team.EPRA indicator: Diversity-Pay.For a narrative on our performance, please see section 5.4.3.2 of Klépierre’s 2020 Universal Registration Document.
The gender pay gap suggested by the gender pay ratio shown in this table does not imply that Klépierre violates the “equal pay for equal job” principle. It rather reflects that higher-paid jobs are mostly occupied by male staff which should gradually change thanks to the gender equality policy newly adopted by Klépierre.
3.3 TRAINING AND DEVELOPMENT
EMPLOyEE TRAINING AND DEVELOPMENT (HOURS/EMPLOyEE)
Indicator Territory 2020 2019Women TOTAL 11 21Men TOTAL 11 27
All employees
France-Belgium 12 23
Italy 10 18
Scandinavia 7 15
Iberia 11 39
Central Europe & Other 17 33
Netherlands 3 13
Germany 13 26
GROUP TOTAL 11 23
EPRA indicator: Emp-Training.For a narrative on our performance, please see section 5.4.3.1.3 of Klépierre’s 2020 Universal Registration Document.
A 100% training access rate was achieved by accelerating in training digitalization. The quick and early adaptation of Klépierre University transforming classroom sessions onto virtual ones combined with the creation of several e-modules supporting business and dealing with the remote working situation enabled all staff to attend at least one training event. Nevertheless, the total number of training hours decreased year on year as the duration of classroom training sessions far exceeds that of e-learning or virtual classrooms.
K L É P I E R R E 2 0 2 0 — NON-FINANCIAL DATA 37
SO CIAL PE R FO R MANCE IND ICATOR STraining and development 3

PROPORTION OF EMPLOyEES WHO HAVE COMPLETED THEIR PERFORMANCE APPRAISAL
Indicator 2020* 2019ALL EMPLOYEES 88% 94%
* Achievement rate of the 2020 appraisal campaign interviews, compared with the 2019 performance.EPRA indicator: Emp-Dev.For a narrative on our performance, please see section 5.4.3.1.4 of Klépierre’s 2020 Universal Registration Document.
Performance appraisal is mandatory for each employee and takes place between November and January. The decresase in the completion rate is explained by the Covid situation which impeded some managers busy with the management crisis from conducting appraisal interviews.
3.4 NEW HIRES AND TURNOVER
NEW HIRES
Indicator Territory 2020 2019
Total number of new employees
France-Belgium 47 62
Italy 9 22
Scandinavia 24 41
Iberia 8 18
Central Europe & Other 27 29
Netherlands 10 21
Germany 14 14
GROUP TOTAL 139 207
Proportion of new employees*
France-Belgium 10.6% 13.4%
Italy 5% 11.8%
Scandinavia 17.3% 28.7%
Iberia 7% 15.9%
Central Europe & Other 24.1% 25.2%
Netherlands 17.5% 36.2%
Germany 28% 26.9%
GROUP TOTAL 12.7% 18.3%
*Ratio of new hire on total headcountEPRA indicator: Emp-Turnover.For a narrative on our performance, please see section 5.4.3.1 of Klépierre’s 2020 Universal Registration Document.
Due to the pandemic consequences, a number of recruitments were delayed. Klépierre nonetheless continued to hire new staff in all countries to ensure business continuity.
DEPARTURES/TURNOVER
Indicator Territory 2020 2019
Total number of departed employees
France-Belgium 41 56
Italy 10 17
Scandinavia 18 26
Iberia 6 13
Central Europe & Other 10 10
Netherlands 4 3
Germany 7 6
GROUP TOTAL 96 131
Proportion of departed employees
France-Belgium 9.3% 12.2%
Italy 5.8% 9.4%
Scandinavia 13.7% 19.0%
Iberia 5.3% 11.5%
Central Europe & Other 9.8% 9.3%
Netherlands 8.0% 6.1%
Germany 15.6% 12.8%
GROUP TOTAL 9.1% 12.0%
EPRA indicator: Emp-Turnover.For a narrative on our performance, please see section 5.4.3.1 of Klépierre’s 2020 Universal Registration Document.
In Scandinavia and Italy, the number of departed employees has decreased respectively by 5.3 points and 3.6 points. This can be explained by the work done to stabilize teams with a focus put on leadership, employee engagement and new ways of working.
38 K L É P I E R R E 2 0 2 0 — NON-FINANCIAL DATA
SO CIAL PERFORMA N CE I N DI CATOR SNew hires and turnover3

TOTAL HEADCOUNT
Territory 2020 2019France-Belgium 444 463
Italy 180 187
Scandinavia 139 143
Iberia 114 113
Central Europe & Other 112 115
Netherlands 57 58
Germany 50 52
GROUP TOTAL 1,096 1,131
For a narrative on our performance, please see section 5.4.3.1 of Klépierre’s 2020 Universal Registration Document.
Scandinavia, Central Europe and France recorded the highest number of new hires to compensate staff turnover. A clear and updated recruitment decision process was implemented. Klépierre was thereby able to focus its 2020 recruitment priorities on key positions to ensure business continuity.
HEADCOUNT AT yEAR-END, By TyPE OF EMPLOyEMENT
2020 2019Permanent 1,057 96% 1,094 97%
Temporary 39 4% 37 3%
GROUP TOTAL 1,096 100% 1,131 100%
For a narrative on our performance, please see section 5.4.3.1 of Klépierre’s 2020 Universal Registration Document.
Data for 2020 remained similar to 2019 and reflect Klépierre’s policy to offer mostly permanent contracts.
HEADCOUNT AT yEAR-END, By AGE
2020 2019<30 years old 12% 13%
30-39 years old 31% 33%
40-49 years old 34% 33%
≥ 50 years old 23% 21%
For a narrative on our performance, please see section 5.4.3.1 of Klépierre’s 2020 Universal Registration Document.
In 2020, the split by age remained broadly stable compared to 2019.
INTERNAL MOVEMENT
% of open positions filled by internal mobility 2020 2019GROUP TOTAL 17% 21%
For a narrative on our performance, please see section 5.4.3.1.5 of Klépierre’s 2020 Universal Registration Document.
K L É P I E R R E 2 0 2 0 — NON-FINANCIAL DATA 39
SO CIAL PE R FO R MANCE IND ICATOR SNew hires and turnover 3

4Local value creation and
development programs indicatorsKlépierre actively capitalizes on the importance of the Group’s local footprint and its impact on the communities surrounding its centers. This is reinforced through its Act for Territories and Act for People pillars, and is best explained through the following tables. Broader narratives on these topics, initiatives and related projects can be found in section 5.3 of Klépierre’s 2020 Universal Registration Document. All percentages are expressed in terms of the total value of the portfolio.
4.1 LOCAL VALUE CREATION
PERCENTAGE OF LOCAL SERVICE PROVIDERS IN OPERATIONAL MANAGEMENT OF CENTERS* (Reported scope)
Territory 2020 2019France-Belgium 93% 85%
Italy 72% 54%
Scandinavia 100% 100%
Iberia 100% 100%
Central Europe & Other 67% 43%
Netherlands 100% 100%
Germany 100% 93%
GROUP TOTAL 87% 78%
* Displayed as the percentage of security, facility management and cleaning suppliers which service our centers meeting Klépierre’s definition of local: regional and/or within a 300 km radius of the shopping center.
EPRA indicator: Comty-Eng.Scope (137/140): 124/124 owned and managed shopping centers + 8/8 managed only shopping center + 5/8 owned only (excluding Greece).Coverage rate: 99.9% of total shopping center portfolio value.
PERCENTAGE OF CENTERS THAT HAVE CONTRIBUTED TO LOCAL EMPLOyMENT (Reported scope)
Territory 2020 2019France-Belgium 100% 88%
Italy 74% 64%
Scandinavia 100% 100%
Iberia 100% 100%
Central Europe & Other 100% 79%
Netherlands 100% 100%
Germany 100% 38%
GROUP TOTAL 95% 85%
EPRA indicator: Comty-Eng.Scope (132/140): 124/124 owned and managed shopping centers + 7/8 managed-only shopping centers (excluding Nîmes Étoile) + 1/8 owned only shopping center (excluding Greece, Riom Menetrol, Roques-sur-Garonne, Milan Globo I II III, Senigallia Il Maestrale).Coverage rate: 99% of total shopping center portfolio value.
40 K L É P I E R R E 2 0 2 0 — NON-FINANCIAL DATA

Despite the pandemic, Klépierre centers continued to support local employment in all countries where the Group operates:
• 87% of service providers involved in the daily operation of assets were local companies in 2020, up 9 percentage points compared with 2019 thanks to contract renegotiations in Italy, France and Central Europe;
• 95% of centers organized an initiative in 2020 to promote local employment among visitors, up 10 percentage points compared with 2019. Thanks to better collaboration with tenants and local partners, Klépierre teams organized a host of job forums. Updating the centers' websites (at Group level) also provided an opportunity to add a brand-new section dedicated to sharing job offers available in centers and/or nearby.
PERCENTAGE OF CENTERS THAT HAVE MADE SPACE AVAILABLE FOR A LOCAL INITIATIVE* (Reported scope)
Territory 2020 2019France-Belgium 100% 99%
Italy 92% 93%
Scandinavia 100% 100%
Iberia 100% 100%
Central Europe & Other 100% 90%
Netherlands 100% 97%
Germany 100% 100%
GROUP TOTAL 98% 97%
* Local initiatives including local entrepreneurs, community organizations, artists, etc.EPRA indicator: Comty-Eng.Scope (132/140): 124/124 owned and managed shopping centers + 7/8 managed-only shopping centers (excluding Nîmes Étoile) + 1/8 owned only shopping center (excluding Greece, Riom Menetrol, Roques-sur-Garonne, Milan Globo I II III, Senigallia Il Maestrale).Coverage rate: 99% of total shopping center portfolio value.
PERCENTAGE OF CENTERS THAT HAVE ORGANIZED A DRIVE FOR THE BENEFIT OF A LOCAL CHARITy* (Reported scope)
Territory 2020 2019France-Belgium 92% 87%
Italy 95% 76%
Scandinavia 100% 100%
Iberia 100% 100%
Central Europe & Other 99% 95%
Netherlands 100% 28%
Germany 100% 56%
GROUP TOTAL 96% 84%
* Drives include clothes, toys, furniture, etc.EPRA indicator: Comty-Eng.Scope (132/140): 124/124 owned and managed shopping centers + 7/8 managed-only shopping centers (excluding Nîmes Étoile) + 1/8 owned only shopping center (excluding Greece, Riom Menetrol, Roques-sur-Garonne, Milan Globo I II III, Senigallia Il Maestrale).Coverage rate: 99% of total shopping center portfolio value.
PERCENTAGE OF CENTERS THAT HAVE SUPPORTED A CITIZEN’S INITIATIVE ORGANIZED By A RETAILER IN THE CENTER (Reported scope)
Territory 2020 2019France-Belgium 99% 65%
Italy 88% 71%
Scandinavia 100% 100%
Iberia 100% 96%
Central Europe & Other 99% 86%
Netherlands 100% 97%
Germany 100% 96%
GROUP TOTAL 98% 79%
EPRA indicator: Comty-Eng.Scope (132/140): 124/124 owned and managed shopping centers + 7/8 managed-only shopping centers (excluding Nîmes Étoile) + 1/8 owned only shopping center (excluding Greece, Riom Menetrol, Roques-sur-Garonne, Milan Globo I II III, Senigallia Il Maestrale).Coverage rate: 99% of total shopping center portfolio value.
This year the centers and their teams have worked harder than ever to support local communities. Built on longstanding trust, the very good relations with the local community have made it possible to mobilize teams, offer spaces and dedicate time to local charities to help the most vulnerable.
As proof, 98% of centers offered space to promote local initiatives, 96% of centers organized a collection of products for the benefit of an NGO (up 12 percentage points) and 98% of centers supported the citizens’ initiatives of the brands they host (up 9 percentage points).
K L É P I E R R E 2 0 2 0 — NON-FINANCIAL DATA 41
LO CA L VALUE CR E ATIO N AND D E VE LO PME NT PR O GR AMS IND ICATOR SLocal value creation 4

4.2 DEVELOPMENT PROGRAMS
INVOLVE LOCAL STAKEHOLDERS IN DESIGNING NEW DEVELOPMENTS (Reported scope)
2020 2019Percentage of development projects that have included local cooperation as part of the early planning process 100%* NA**
Percentage of development projects certifying that suppliers sign a Sustainable Charter governing construction site supply and management. 100%* NA**
Percentage of development projects that have implemented a biodiversity action plan 100%* NA**
* In 2020, one development project was completed at Créteil Soleil.** No development project was delivered in 2019.
One development project was delivered in 2020: the Créteil Soleil (Créteil) extension in France. This project fulfilled all Act for Territories® targets set for new developments:
• Organization of local cooperation as part of the early planning process;
• Working with suppliers under a “Sustainable Charter” governing construction site supply and management;
• Setting up a biodiversity action plan.
42 K L É P I E R R E 2 0 2 0 — NON-FINANCIAL DATA
LO CAL VALUE CREATI ON A N D DEV ELOP MEN T PR O GR AMS IND ICATO R SDevelopment programs4

5Client satisfaction and well‑being indicators
INCREASE IN NET PROMOTER SCORE (NPS) (Like-for-like scope)
2020 2019Performance versus 2017 +8 pts +10 pts
Scope: 39/126 shopping centers managed by the corporate marketing team. Coverage rate: 53% of total shopping center portfolio value.
Since 2017, the Group NPS has progressed by 8 points and can be explained by two major general axes:
• Raising awareness of the culture and customer care for teams in contact with our visitors;
• Optimization of the customer journey (for example through the deployment of new free access children's areas, new olfactory, and sound atmospheres in the centers...).
The slight decrease in comparison to 2019 is mainly due to the sanitary context that has raised new pain points in the customer experience (directly such as crowd anxiety or indirectly such as the non-compliance of the opening hours of shops compared to the given information, the non-availability of toilets or rest areas closed to the public...).
PERCENTAGE OF CUSTOMERS’ SOCIAL MEDIA QUESTIONS ANSWERED (Reported scope)
% of shopping center portfolio value 2020 2019% of customers’ social media questions answered 92% 68%
Scope: 91/126 shopping centers managed by the marketing corporate team.Coverage rate: 92% of total shopping center portfolio value.
The Group’s long-term target is to respond to 100% of customer questions on social networks. To achieve this, Klépierre has developed a customer care tool, #JustAsk promises to answer all questions through Facebook Messenger during opening hours. In 2020, the roll-out of the tool has been intensified pushing the number of centers using #JustAsk at 91.
PERCENTAGE OF CENTERS THAT HAVE OFFERED DEDICATED SERVICES TO RETAILERS’ EMPLOyEES (Reported scope)
% of shopping center portfolio value 2020 2019France-Belgium 96% 84%
Italy 75% 72%
Scandinavia 100% 100%
Iberia 100% 100%
Central Europe & Other 99% 83%
Netherlands 100% 97%
Germany 100% 100%
GROUP TOTAL 94% 87%
Scope (132/140): 124/124 owned and managed shopping centers + 7/8 managed-only shopping centers (excluding Nîmes Étoile) + 1/8 owned only shopping center (excluding Greece, Riom Menetrol, Roques-sur-Garonne, Milan Globo I II III, Senigallia Il Maestrale).Coverage rate: 99% of total shopping center portfolio value.
As part of the ambition to care about people working day-in day-out at Klépierre’s assets, the Group has set up dedicated services for retailers’ staff in 94% of its centers (versus 87% in 2019). These initiatives range from rest areas and private sports sessions to special events, and will be developed in all assets by 2022.
K L É P I E R R E 2 0 2 0 — NON-FINANCIAL DATA 43
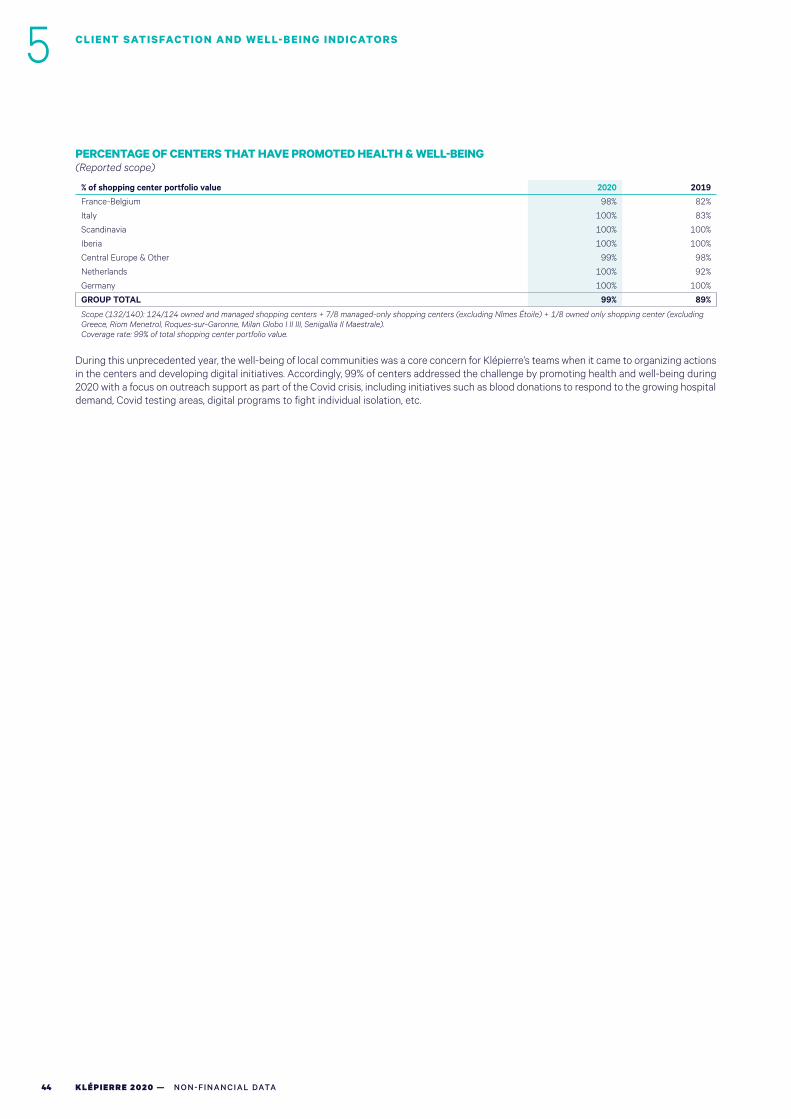
PERCENTAGE OF CENTERS THAT HAVE PROMOTED HEALTH & WELL-BEING (Reported scope)
% of shopping center portfolio value 2020 2019France-Belgium 98% 82%
Italy 100% 83%
Scandinavia 100% 100%
Iberia 100% 100%
Central Europe & Other 99% 98%
Netherlands 100% 92%
Germany 100% 100%
GROUP TOTAL 99% 89%
Scope (132/140): 124/124 owned and managed shopping centers + 7/8 managed-only shopping centers (excluding Nîmes Étoile) + 1/8 owned only shopping center (excluding Greece, Riom Menetrol, Roques-sur-Garonne, Milan Globo I II III, Senigallia Il Maestrale).Coverage rate: 99% of total shopping center portfolio value.
During this unprecedented year, the well-being of local communities was a core concern for Klépierre’s teams when it came to organizing actions in the centers and developing digital initiatives. Accordingly, 99% of centers addressed the challenge by promoting health and well-being during 2020 with a focus on outreach support as part of the Covid crisis, including initiatives such as blood donations to respond to the growing hospital demand, Covid testing areas, digital programs to fight individual isolation, etc.
44 K L É P I E R R E 2 0 2 0 — NON-FINANCIAL DATA
CLIENT SATISFACTI ON A N D WEL L-BEI N G I N DICATO R S5

6Governance indicators
6.1 GOVERNANCE BODIES
COMPOSITION OF THE HIGHEST GOVERNANCE BODIES
2020 2019Supervisory Board 9 non-executive members 9 non-executive members
Executive Board 3 members 2 members
EPRA indicator: Gov-Board.
6.2 NOMINATION
The process for appointing members of the Supervisory and Executive boards is described below. The bylaws remained unchanged between 2019 and 2020.
PROCESS FOR APPOINTING MEMBERS
2020
Supervisory Board
The permanent supervision of the Company’s management by the Executive Board shall be exercised by a Supervisory Board formed of three members at least and twelve members at most appointed by the Ordinary Shareholders’ Meeting.
A legal entity may be appointed as member of the Supervisory Board, but it must, when it is appointed, appoint an individual to be its permanent representative within the Supervisory Board. The term of office of the permanent representative within the Supervisory Board appointed by a legal entity shall be given for the term of office of the legal entity. When the legal entity dismisses its representative, it must promptly notify to the Company, by registered letter, such dismissal as well as the identity of its new permanent representative. The same applies in case of death or resignation of the permanent representative.
The term of office as member of the Board shall be three years.
Executive Board
The Company shall be managed by an Executive Board. The Supervisory Board shall appoint the members of the Executive Board. It shall set the number thereof within the limits set by law.
Members of the Executive Board must be individuals but need not be shareholders.
Members of the Supervisory Board may not be members of the Executive Board.
Members of the Executive Board may not accept an appointment as Executive Board member or sole Managing Director of another company unless authorized by the Supervisory Board.
The Executive Board is appointed for a term of three years. Its members may always stand for re-election, subject to the provisions of the following paragraph. They may be dismissed either by the Supervisory Board voting with a two-thirds majority or by ordinary resolution of the shareholders.
The age limit for members of the Executive Board is sixty-five. However, the Supervisory Board may extend the term of office of an Executive Board member who reaches that age on one or more occasions not exceeding a total of three years.
If a seat on the Executive Board becomes vacant, the Supervisory Board shall decide whether it is appropriate to fill it; the replacement member, if any, shall be appointed for the remainder of the Executive Board's three-year term.
EPRA indicator: Gov-Selec.
K L É P I E R R E 2 0 2 0 — NON-FINANCIAL DATA 45
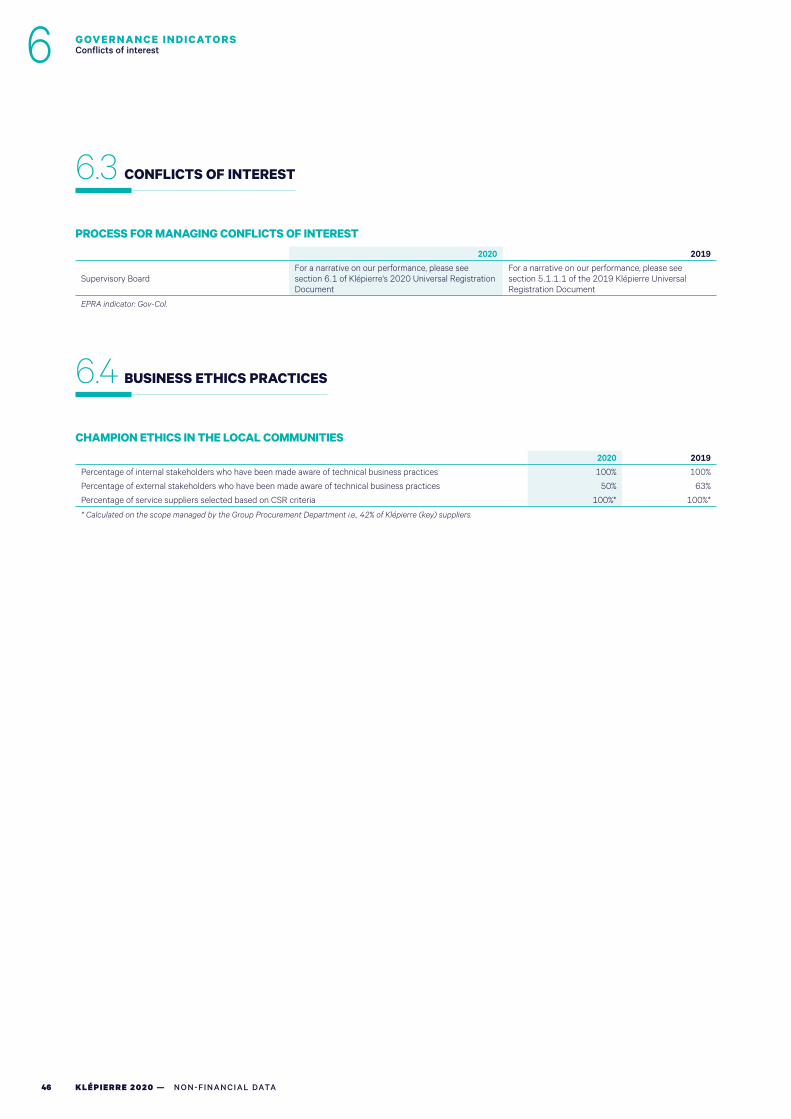
6.3 CONFLICTS OF INTEREST
PROCESS FOR MANAGING CONFLICTS OF INTEREST
2020 2019
Supervisory BoardFor a narrative on our performance, please see section 6.1 of Klépierre's 2020 Universal Registration Document
For a narrative on our performance, please see section 5.1.1.1 of the 2019 Klépierre Universal Registration Document
EPRA indicator: Gov-Col.
6.4 BUSINESS ETHICS PRACTICES
CHAMPION ETHICS IN THE LOCAL COMMUNITIES
2020 2019Percentage of internal stakeholders who have been made aware of technical business practices 100% 100%
Percentage of external stakeholders who have been made aware of technical business practices 50% 63%
Percentage of service suppliers selected based on CSR criteria 100%* 100%*
* Calculated on the scope managed by the Group Procurement Department i.e., 42% of Klépierre (key) suppliers.
46 K L É P I E R R E 2 0 2 0 — NON-FINANCIAL DATA
G OVERNANCE INDI CATOR SConflicts of interest6