2020 MSRS Pre-Retirement Seminar
92
2020 MSRS Pre-Retirement Seminar
Transcript of 2020 MSRS Pre-Retirement Seminar

2020 MSRS Pre-Retirement Seminar
State Employee Pension Plans
Health Care Savings Plan
(HCSP)
Deferred Compensation Plan
(MNDCP)
Minnesota State Retirement System
Who we are

Seminar topics
Readiness
Pension
Social Security
Income Gap
MNDCP
HCSP
YOURRETIREMENT


Click to edit Master title style What do you imagine
for your retirement?
•Travel
•Hobbies
•Enjoying time with friends & family
•Volunteering
•Starting your own business
Sky’s the limit

Stages of RetirementEach stage has its own characteristics and costs
EARLY YEARS MIDDLE YEARS LATER YEARS

Click to edit Master title style Consider the realitiesBe Prepared
•High cost of health care

High cost of health care
For a 50% chance of covering
For a 90% chance of covering
$79,000 $144,000
$104,000 $163,000
$183,000 $301,000
Amount needed to cover health care costs in retirement
Source: Employee Benefit Research Institute Issue Brief, May 16, 2019 Excludes long-term care*For a couple with median prescription drug expenses
FOR ILLUSTRATIVE PURPOSES ONLY
65-year-old couple*
65-year-old woman
65-year-old man

Click to edit Master title style Consider the realitiesBe Prepared
•High cost of health care
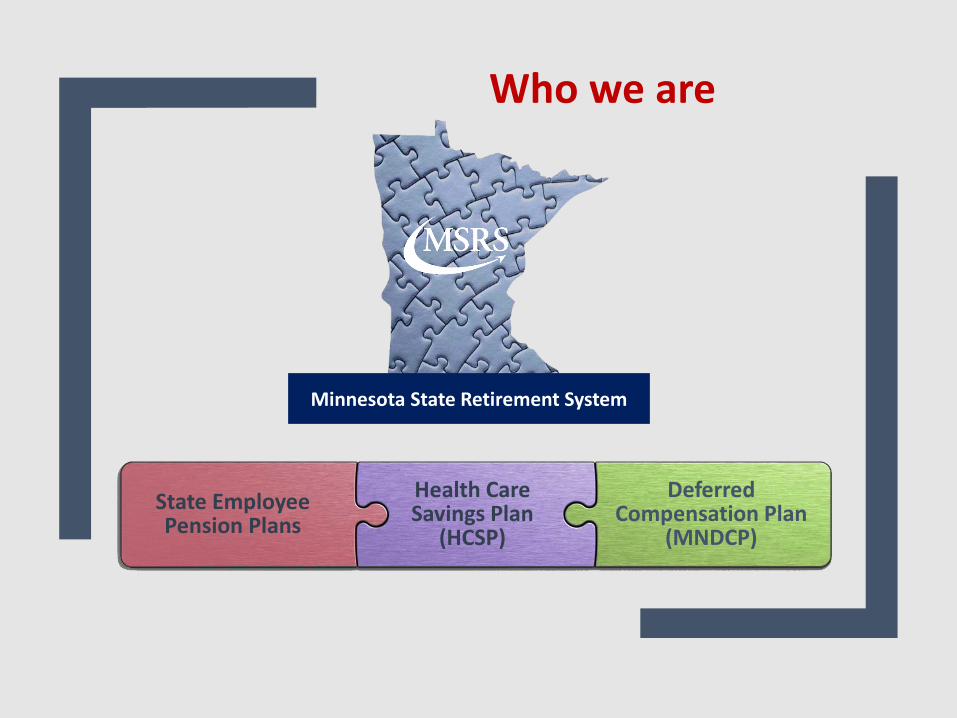
•We’re living longer
Life expectancy – we’re living longer
Source: Society of Actuaries RP-2014 Mortality Table projected with Mortality Improvement Scale MP-2014 as of 2015*At least one surviving individual.
FOR ILLUSTRATIVE PURPOSES ONLY
50% Chance Age 87 Age 90 Age 94
25% Chance Age 93 Age 96 Age 98
65-year-old couple*65-year-old woman65-year-old man

Click to edit Master title style Consider the realities
•High cost of health care
•We’re living longer
•Inflation
Be Prepared

Inflation – what money will buy
$2.53
$3.21
$1.84
$3.80
$0.09
$0.14
27%increase
106%increase55%
increase
The effect of inflation over 20 years
Source: U.S. Bureau of Labor Statistics, Consumer Price Index, Average Price Data (9/1997 – 9/2017)
1997 2017
Milk(per gallon)
1997 2017
Electricity(per KWH)
1997 2017
Lean ground beef(per lb)
FOR ILLUSTRATIVE PURPOSES ONLY

Click to edit Master title style Consider the realities
•High cost of health care
•We’re living longer
• Inflation
•Market volatility
Be Prepared

600.00
900.00
1200.00
1500.00
1800.00
2100.00
2400.00
2700.00
1998
1999
2000
2001
2002
2003
2004
2005
2006
2007
2008
2009
2010
2011
2012
2013
2014
2015
2016
2017
2018
Expect stock market volatility
FOR ILLUSTRATIVE PURPOSES ONLY Past performance is not a guarantee or prediction of future results. You cannot invest directly in a benchmark index. The S&P 500 ® Index measures the performance of the domestic large-cap equity market and is used as a proxy of the stock market in general. The S&P 500 ® is a registered trademark of Standard & Poor’s Financial Services LLC.Source: CBOE ®, Chicago Board Options Exchange ® Data from 1/1/1998 – 1/1/2018 www.cboe.com/products/stock-index-options-spx-rut-msci-ftse/s-p-500-index-options/s-p-500-index/spx-historical-data
Market volatility over the past 20 yearsS&P 500® Index –monthly returns
Mortgage meltdownDot-com
bubble collapse

Keep perspectiveIt has paid to stay invested in U.S. stocks during troubled times
May 1932 July 1982 March 2009Great Severe Mortgage
Depression recession meltdown
Subsequent 5-year return
FOR ILLUSTRATIVE PURPOSES ONLY Past performance is not a guarantee or prediction of future results. You cannot invest directly in a benchmark index. U.S. stock market returns represented by total return of S&P 500®, which is an index used as a proxy for the stock market in general.Source: Fidelity Investments. https://institutional.fidelity.com/app/item/RD_13569_23965.html With data provided by Ibbotson, Factset, FMR Co., Fidelity Asset Allocation Research Team (AART) as of 3/31/2015.

Prepare your retirement budget
Review your financial situation to determine:
• all your sources of retirement income
• how your expenses will differ in retirement
How much will you need to maintain your standard of living?
Be Prepared

Take into account all of your assets, including:
• Projected Social Security benefit
• Projected Pension benefit
• Money saved in retirement plan accounts MNDCP 457(b) plan, 403(b) plan, 401(k) plan, IRAs
• Money saved in Health Savings Plans HCSP, HRA, HSA, VEBA
• Spouse’s retirement plan accounts
At Different
Ages
Consider your income

Consider your expenses
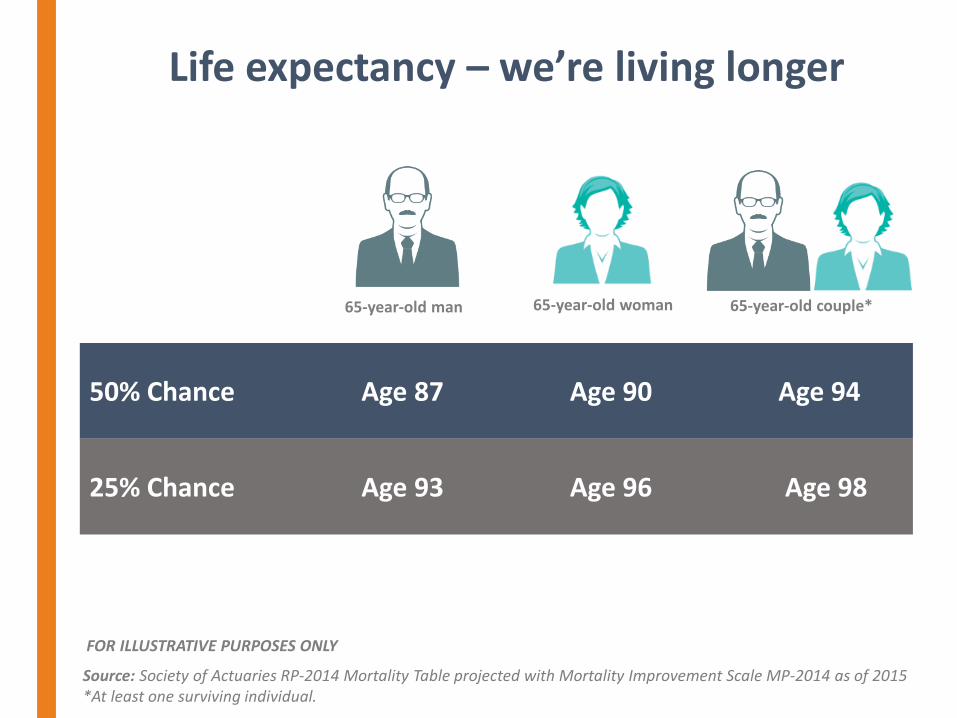
Retirement expenses may decrease• Housing • Payroll taxes (e.g., FICA)• Transportation• Retirement plan contributions
Retirement expenses may increase
• Health Care
• Travel
1 Includes cash contributions, alcohol, tobacco, personal care products and services, reading, education, life and personal insurance, and miscellaneous expensesSource: U.S. Bureau of Labor Statistics, Consumer Expenditures in 2015 Report 1066, April 2017
Median consumer expenses
Housing33.3%
Food12.6%
Health Care11.6%
Clothing2.7%
Ages 65-74
Other1
10.9%
Transportation16.2%

•Higher health care costs
•Increasing life expectancies
•Inflation
•Stock market volatility
Take action
Prepare a retirement budget
Consider how the following factors could affect your retirement savings


Service Credit
Benefit Multiplier
High-5Salary
Possible Reduction
Pension benefit factors

• Every month that deductions from pay are taken
Part-time (<50%) is pro-rated
• Workers’ Compensation leave of absence
• Leaves of absence, if purchased
• Repaid refunds
Service Credit
• Vesting requirements3 years of total service –hired < 7-1-20105 years of total service –hired > 7-1-2010
What do you receive credit for?
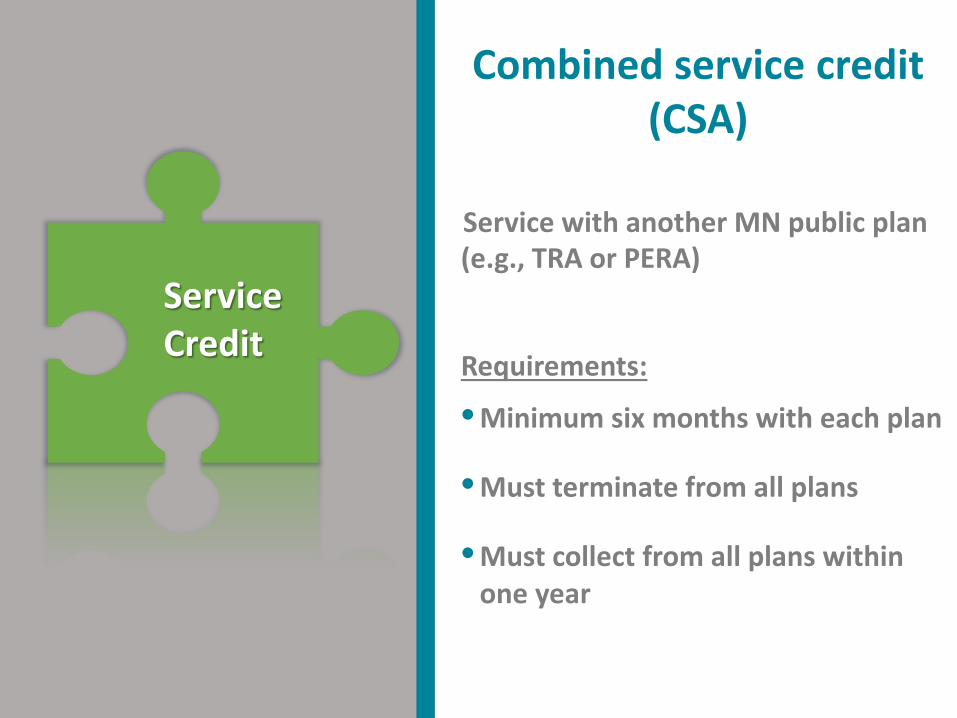
Service with another MN public plan (e.g., TRA or PERA)
Requirements:
• Minimum six months with each plan
• Must terminate from all plans
• Must collect from all plans within one year
Service Credit
Combined service credit(CSA)

High-5 Salary
Average monthly salary
• Highest five successive years’ wages(High-5)
• Includes gross salary
• Excludes unused vacation & sick leave payouts
• NOT reduced by contributions to your 457(b) or 403(b) or HCSP account

The formula dictated by Minnesota law used to calculate your benefit
1.7%
Benefit Multiplier
A set multiplier

PossibleReduction
Depends on age
Full Retirement Ageif hired prior to 7-1-1989
• Age 65, or• Rule of 90
Full Retirement Ageif hired after 7-1-1989
• Age 66
Apply reduction if you collect pension benefit before your FULL
RETIREMENT AGE

Meet Anita & Sarah
Anita Plans to retire at age 66 With 30 years at DNR
Sarah Plans to retire at age 62 With 26 years at DOT
Each began employment at the same timeEach earn the same salary

MONTHLY BENEFIT
Anita retires age 66
Sarah retires age 62
Benefit example
x x
x x x
=
=
x
FOR ILLUSTRATIVE PURPOSES ONLY Your actual results will vary based on your retirement date.
SERVICE CREDIT
BENEFIT MULTIPLIER
HIGH-5SALARY
POSSIBLE REDUCTION
=
30 years $5,000 1.7% N/A $2,550
26 years $4,619 1.7% 0.7445 $1,520

MONTHLY BENEFIT
Sarah retires age 62 BUT DEFERS TO AGE 66
Benefit example
x x
x x x
=
=
x
SERVICE CREDIT
BENEFIT MULTIPLIER
HIGH-5SALARY
POSSIBLE REDUCTION
=
26 years $4,619 1.7% N/A $2,042
Sarah retires age 62
26 years $4,619 1.7% 0.7445 $1,520
FOR ILLUSTRATIVE PURPOSES ONLY Your actual results will vary based on your retirement date.

Benefit Type Your Benefit
Survivor Benefit
Bounce Back
Single Life $2,550 N/A N/A
Joint & Survivor (retiree & survivor are age 66)
100% Option $2,238 $2,238 $2,55075% Option $2,308 $1,731 $2,55050% Option $2,384 $1,192 $2,550
Life Income 15-Year Certain
$2,385 $2,385 N/A
Joint & Survivor benefit options
• Irrevocable election
FOR ILLUSTRATIVE PURPOSES ONLY Your actual results will vary.
• Survivor(s) doesn’t have to be a spouse
• Younger age survivor(s) = smaller benefit
• Non-spouse survivor(s) more than 19 years younger may only select 50% option
• Non-spouse survivor(s) between 10 and 19 years younger may select 75% or 50% option
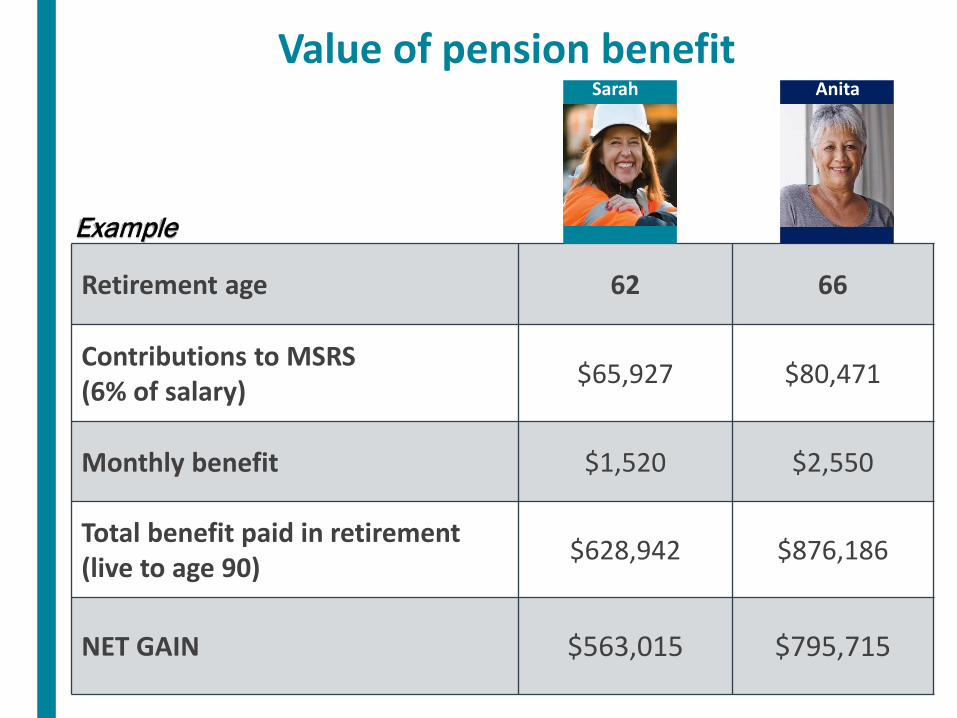
Retirement age 62 66
Contributions to MSRS (6% of salary) $65,927 $80,471
Monthly benefit $1,520 $2,550
Total benefit paid in retirement (live to age 90) $628,942 $876,186
NET GAIN $563,015 $795,715
Value of pension benefit
Example
Sarah Anita

Your pension benefit is taxable
• Withhold federal & state tax (for MN only)
• Adjust tax withholding at any time
• Receive tax form 1099-R each January
Remember to plan for taxes

Post retirement benefit increase
Retirees receive an annual pension benefit increase each January
• First increase pro-rated

If you return to MSRS eligible position ONLY:
• Notify MSRS of re-employment
• 30 day break in service is required
• No retirement deductions taken
• When under Social Security’s full-retirement age, pension benefit suspends at earnings limit ($18,240 - 2020)
• Restarts at end of employment or January 1st of next year
• May affect eligibility to access your MNDCP & HCSP assets
Working after retirement

Death prior to retirement
Surviving Spouse Benefit
• 100% Joint & Survivor lifetime monthly benefit, or
• Monthly payment for 10, 15 or 20 years, or
• Lump-sum payment of employee contributions only plus 3% interest
Non Spouse Benefit
• Lump-sum payment of employee contributions only plus 3% interest
• If no surviving spouse, minor child benefit

1. Application for Retirement Benefit
2. Direct Deposit form
3. Birth records
4. Copy of Marriage Certificate(if applicable)
5. Certified copy of Divorce Decree orDomestic Relations Order (if applicable)
Forms neededPension benefitApplication process
Contact your pension plan provider when applying for
your pension benefit

•Annual statement
•Online account
•Schedule an appointment with an MSRS Representative
Further you are from your full retirement age, greater
the benefit reduction
Take action
Understand the impact of retiring before your full retirement age
Review your estimated pension benefit
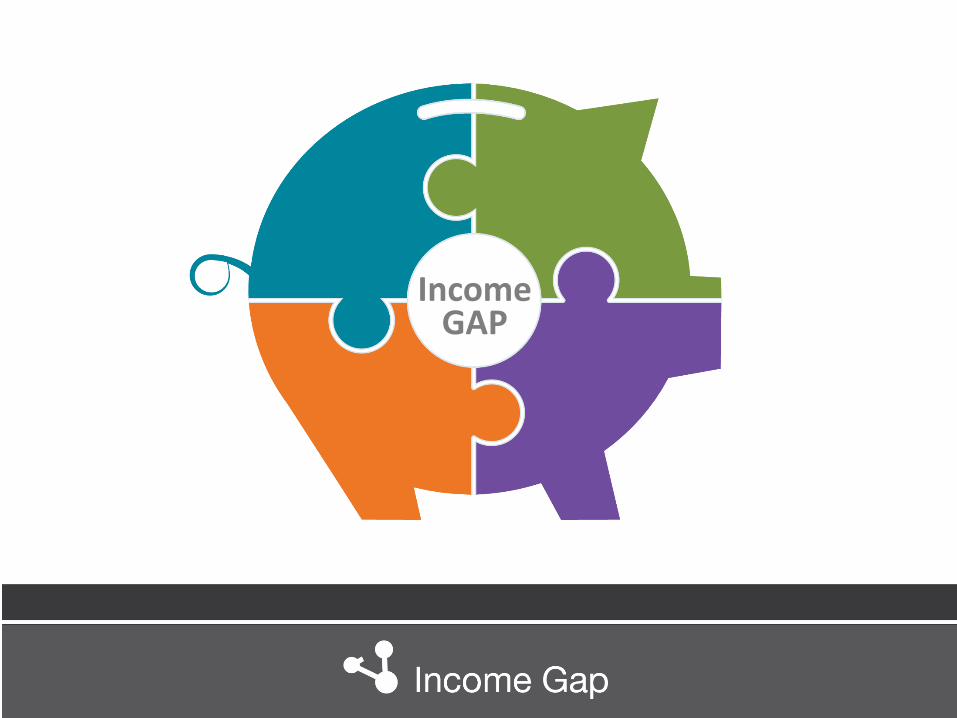
IncomeGAP

What is an income gap?
You might have an income gap if:
your savings does not meet your retirement income needs
you retire early and need more retirement savings
or you fear you will outlive your savings
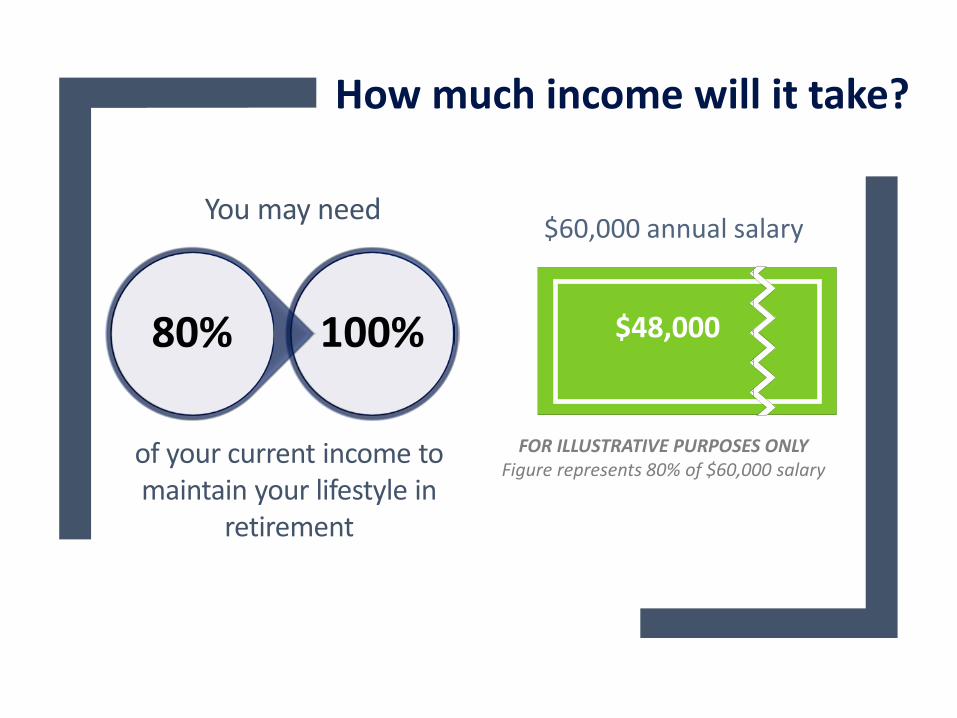
100%80%
You may need
of your current income to maintain your lifestyle in
retirement
How much income will it take?
$48,000
$60,000 annual salary
FOR ILLUSTRATIVE PURPOSES ONLY Figure represents 80% of $60,000 salary
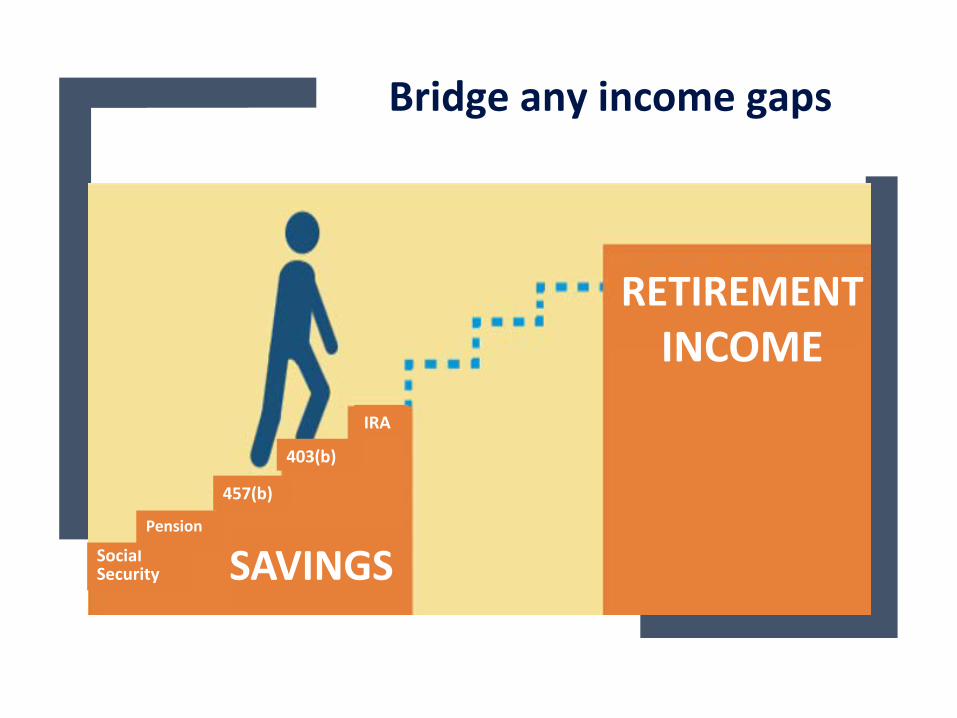
Bridge any income gaps
SocialSecurity
403(b)
457(b)
IRA
Pension
RETIREMENTINCOME
SAVINGS

Income your MN public pension replaces:1
• 10 years service = 17%
• 20 years service = 34%
• 30 years service = 51%
Income your Social Security replaces:2
• Average MN public employee recipient = 31%
Pension & Social Security may not be enough
1 Based on the years of service of MSRS pension recipients. Assumes full retirement age of 66. A TRA recipient replacement percentage would be higher.
2 Based on the collecting an unreduced social security benefit at age 66 and a final average salary of 2016 retirees from MSRS, PERA, TRA public pension plans. Does not assume future earnings. Salary Source: MSRS, PERA and TRA 2016 Comprehensive Annual Financial Report. Social Security Source: SSA Benefit Calculator.
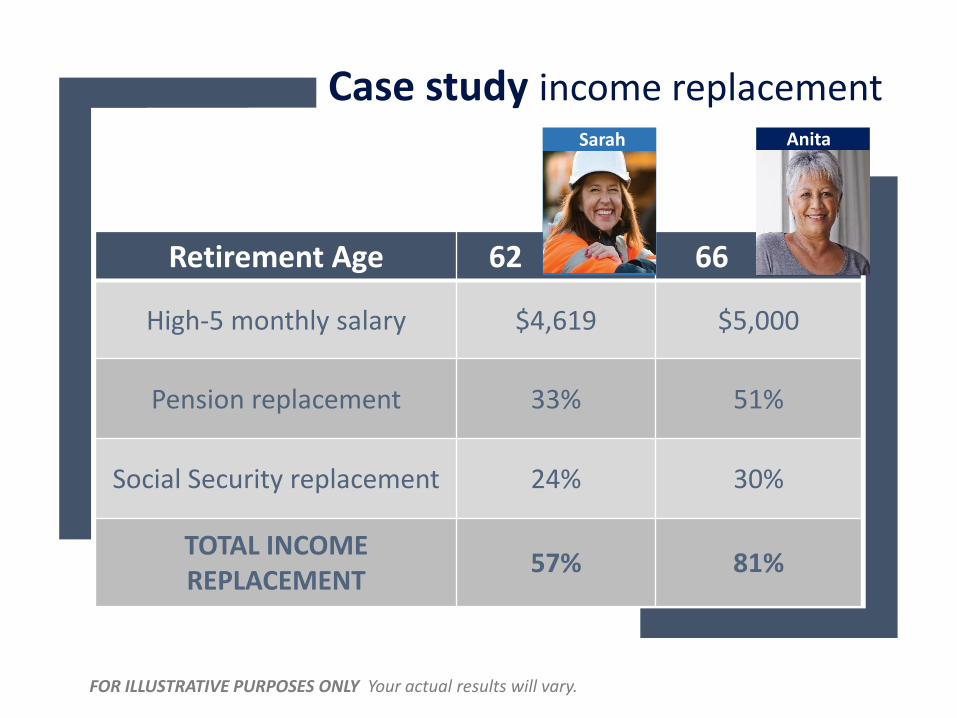
Retirement Age 62 66
High-5 monthly salary $4,619 $5,000
Pension replacement 33% 51%
Social Security replacement 24% 30%
TOTAL INCOME REPLACEMENT 57% 81%
Case study income replacement
FOR ILLUSTRATIVE PURPOSES ONLY Your actual results will vary.
Sarah Anita
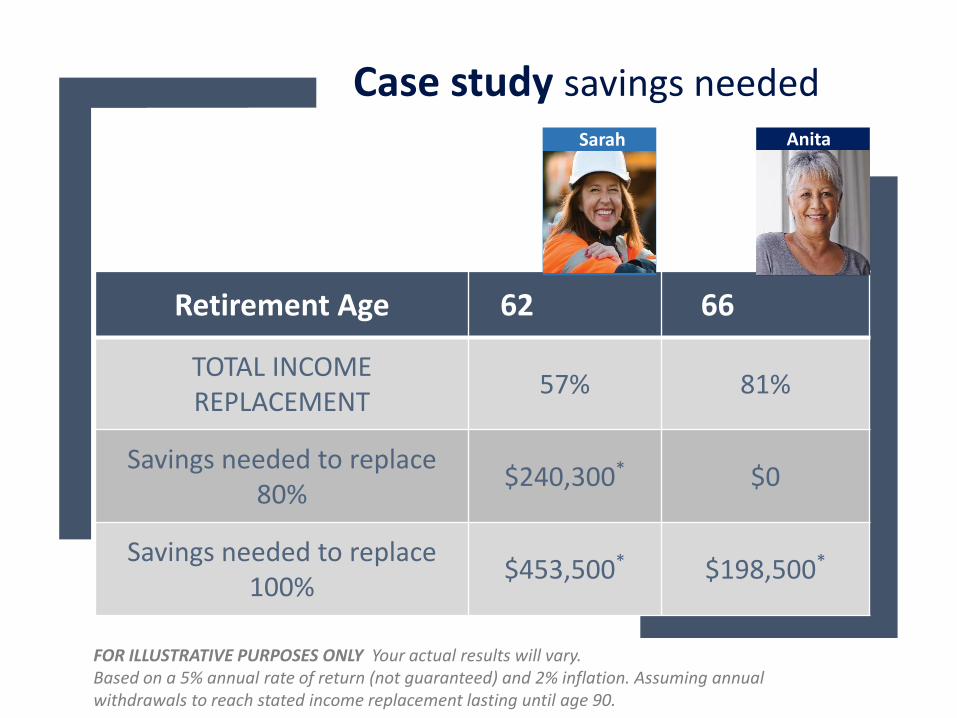
Retirement Age 62 66
TOTAL INCOME REPLACEMENT 57% 81%
Savings needed to replace 80% $240,300* $0
Savings needed to replace 100% $453,500* $198,500*
Case study savings needed
FOR ILLUSTRATIVE PURPOSES ONLY Your actual results will vary.Based on a 5% annual rate of return (not guaranteed) and 2% inflation. Assuming annual withdrawals to reach stated income replacement lasting until age 90.
Sarah Anita

Calculate how much retirement income you will need
www.msrs.state.mn.us/toolbox#mndcpDo your own calculation

Take action Ways to bridge the income gap
MNDCP 457(b) & 403(b) account assetsIncrease your annual contribution if possible
HCSP account assetsLearn how to use your HCSP account assets
Pension & Social SecurityDefer, if possible, the date of your retirement


Available to all MN public employees
A voluntary savings plan to supplement
your pension & Social Security income
State sponsored 457(b) Plan
What is the MNDCP?

Minimize stock market volatility
Save more each paycheck
Maximize your contributions1
2
3
Take advantage of lower fees4
Make the most of the MNDCP

Bridge the income gap
Age 50 & over
$26,000 Within 3 years of
normal retirement age
Maximize your contribution
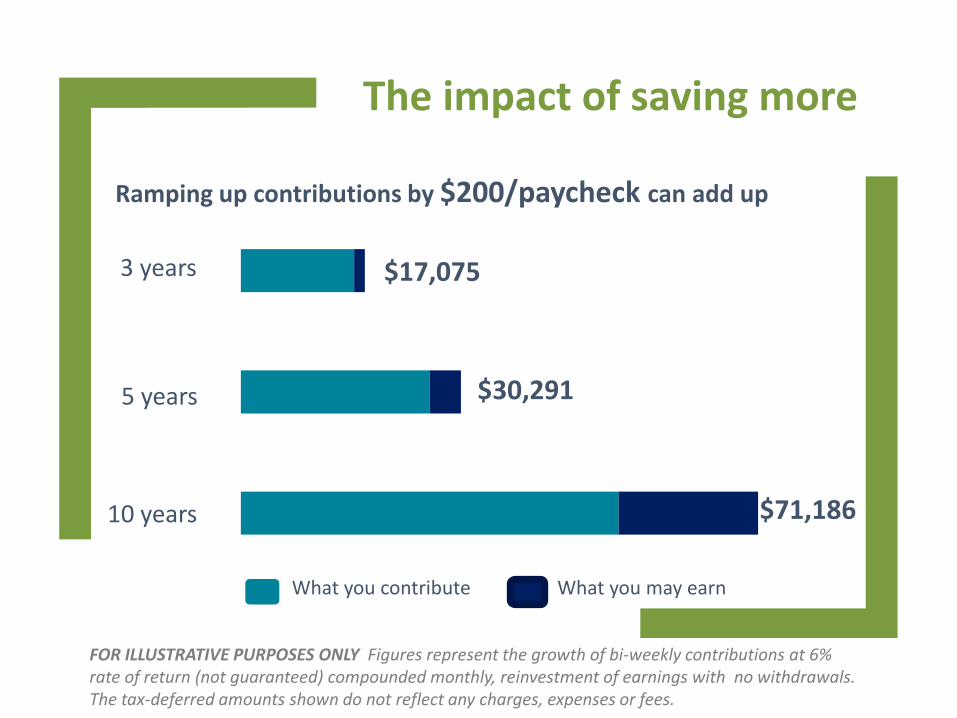
Ramping up contributions by $200/paycheck can add up
$17,075
10 years $71,186
5 years
3 years
$30,291
What you contribute What you may earn
FOR ILLUSTRATIVE PURPOSES ONLY Figures represent the growth of bi-weekly contributions at 6% rate of return (not guaranteed) compounded monthly, reinvestment of earnings with no withdrawals. The tax-deferred amounts shown do not reflect any charges, expenses or fees.
The impact of saving more

Multiple
More Diverse
One
Less Diverse
Investment diversification: Spreading your investments over multiple asset classes
FOR ILLUSTRATIVE PURPOSES ONLY Diversification does not ensure a profit or protect against loss in declining markets.
Minimize market fluctuation impactBridge the income gap

How diversification works
Sample asset allocation of an investment portfolio
Diversification within the stock allocation
FOR ILLUSTRATIVE PURPOSES ONLY Diversification does not ensure a profit or protect against loss in declining markets.
BONDS
CMDTY
CASH
STOCKS
U.S. Large-cap
U.S. Mid-cap
U.S. Small-cap
Inter-national
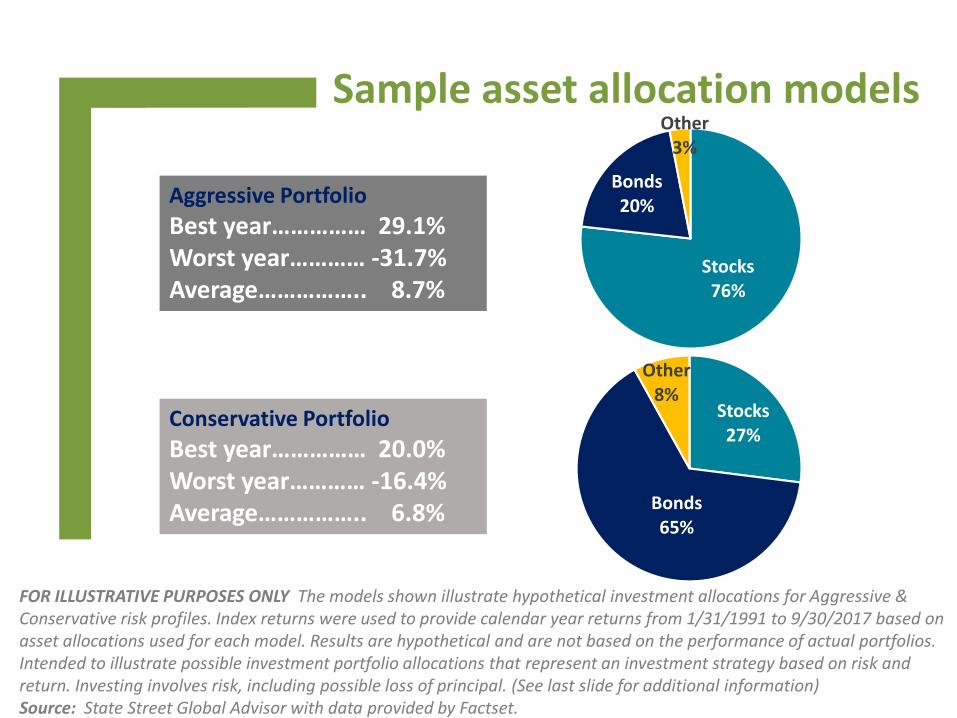
Aggressive PortfolioBest year…………… 29.1%Worst year………… -31.7%Average…………….. 8.7%
Conservative PortfolioBest year…………… 20.0%Worst year………… -16.4%Average…………….. 6.8%
Sample asset allocation models
FOR ILLUSTRATIVE PURPOSES ONLY The models shown illustrate hypothetical investment allocations for Aggressive & Conservative risk profiles. Index returns were used to provide calendar year returns from 1/31/1991 to 9/30/2017 based on asset allocations used for each model. Results are hypothetical and are not based on the performance of actual portfolios. Intended to illustrate possible investment portfolio allocations that represent an investment strategy based on risk and return. Investing involves risk, including possible loss of principal. (See last slide for additional information)Source: State Street Global Advisor with data provided by Factset.
Stocks 76%
Bonds 20%
Other 3%
Stocks27%
Bonds 65%
Other8%
Please consider the investment objectives, fees and expenses carefully before investing. The prospectus and/or disclosure documents contain this and other important information about the investments offered through your plan. To obtain a prospectus or disclosure document, or to learn more about the investment options, visit www.msrs.state.mn.us or call 800-657-5757. Read such materials carefully before investing.
Investment Disclosure
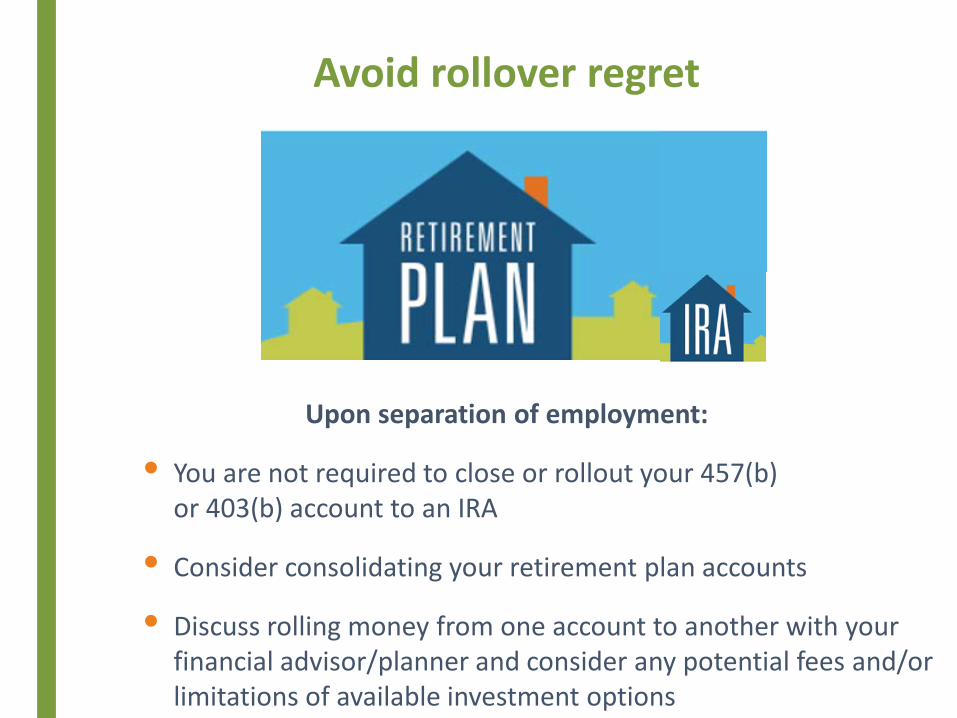
Avoid rollover regret
Upon separation of employment:
• You are not required to close or rollout your 457(b) or 403(b) account to an IRA
• Consider consolidating your retirement plan accounts
• Discuss rolling money from one account to another with your financial advisor/planner and consider any potential fees and/or limitations of available investment options
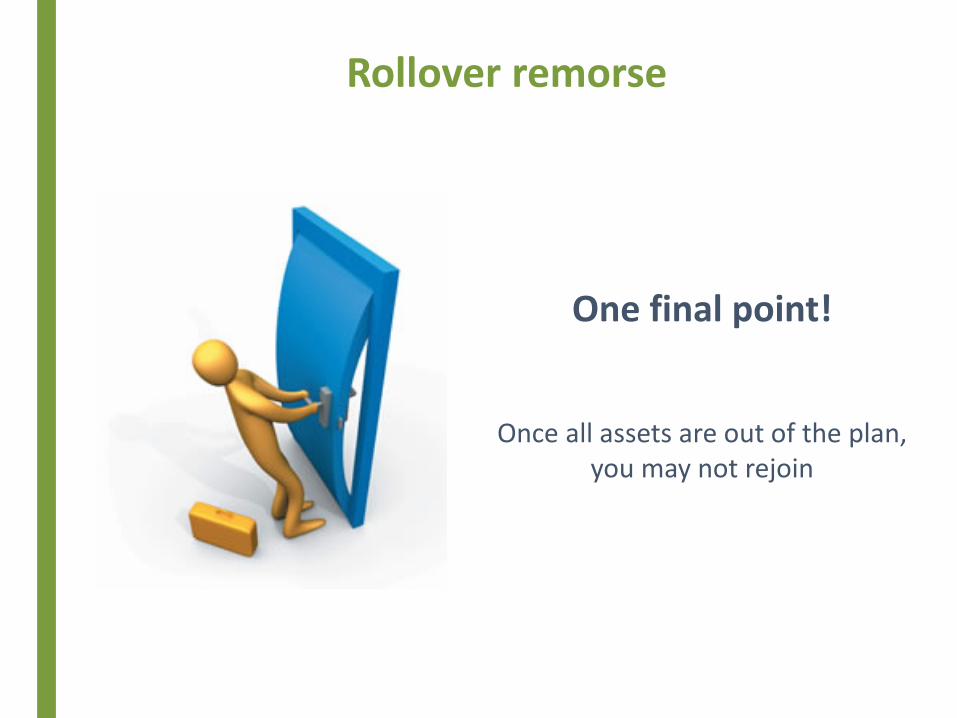
Rollover remorse
One final point!
Once all assets are out of the plan, you may not rejoin

Click to edit Master title style Fees can erode your gains
1 Source: 2017 Advisory HQ study; Average Financial Advisor Fees based on assets under management for a $100,000 account
2 MNDCP administrative fee as of 1/1/2020 capped at $125/year
For illustrative purposes only This hypothetical illustration is not intended as a projection of future investment results, nor is it intended as financial planning or investment advice. Rates of any return may vary. The illustration does not reflect other associated charges, expenses of fees. The tax-deferred accumulation shown would be reduced if these fees had been deducted.
Assumptions
• Starting balance: $65,000
• No contributions
• 5% annual rate of return• Annual 4% withdrawal
of account balance
• After 25 years
$77,460$79,330
$60,670
Account balance with a 1.12% Advisor fee1
MNDCP account with a 0.10% Administrative fee2
No Account Fee

Withdrawal considerations Goals
• Number of years savings should last• Leave savings to heirs• Philanthropic wishes
Realities
• Meet fixed expenses• Allow for discretionary expenses• Cover emergency expenses
Other
• Coordinate withdrawals with the use of other assets
• Tax efficient withdrawals

How to generate income from your retirement plan
Lump-sum withdrawal
Automatic/periodic withdrawal schedule
Partial withdrawals
when needed
Flexible Withdrawal Options

Savings Balance$50,000 $100,000 $150,000
11 yrs 4 mos
4 yrs 9 mos
3 yrs
> 50 yrs
11 yrs 4 mos
6 yrs 8 mos
> 50 yrs
22 yrs 3 mos
11 yrs 4 mos
Gross Withdrawal
$500/month
$1,000/month
$1,500/month
FOR ILLUSTRATIVE PURPOSES ONLY Your actual results will vary. This hypothetical example assumes a 6% annual rate of return. Rate of return not guaranteed.
How long will your savings last?
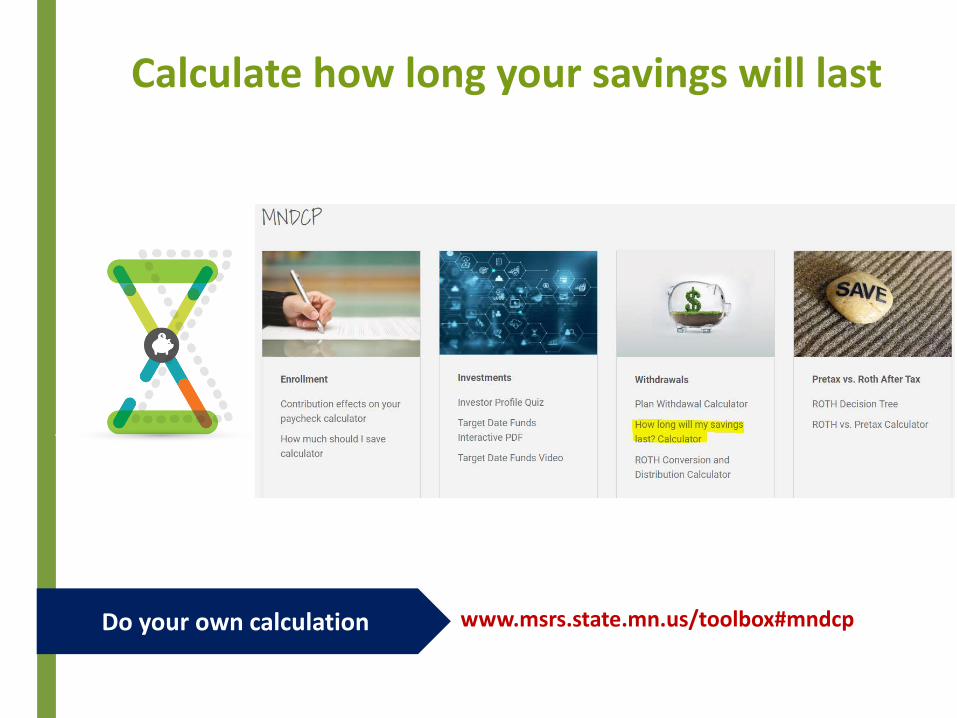
Calculate how long your savings will last
Do your own calculation www.msrs.state.mn.us/toolbox#mndcp

Withdrawals are taxable
20% mandatory federal withholding, except• Withdrawal schedules lasting 10 or more years • RMD payments
Withdrawals are tax-free if:• Withdrawal made after age 59 ½
(death or disability)AND
• Roth account established at least five tax years
Pre-tax savings
Roth after-tax savings
Understand the tax landscape
Withdrawals made prior to age 59 ½ that are attributable to rollovers from another type of plan may incur a 10% early withdrawal IRS penalty

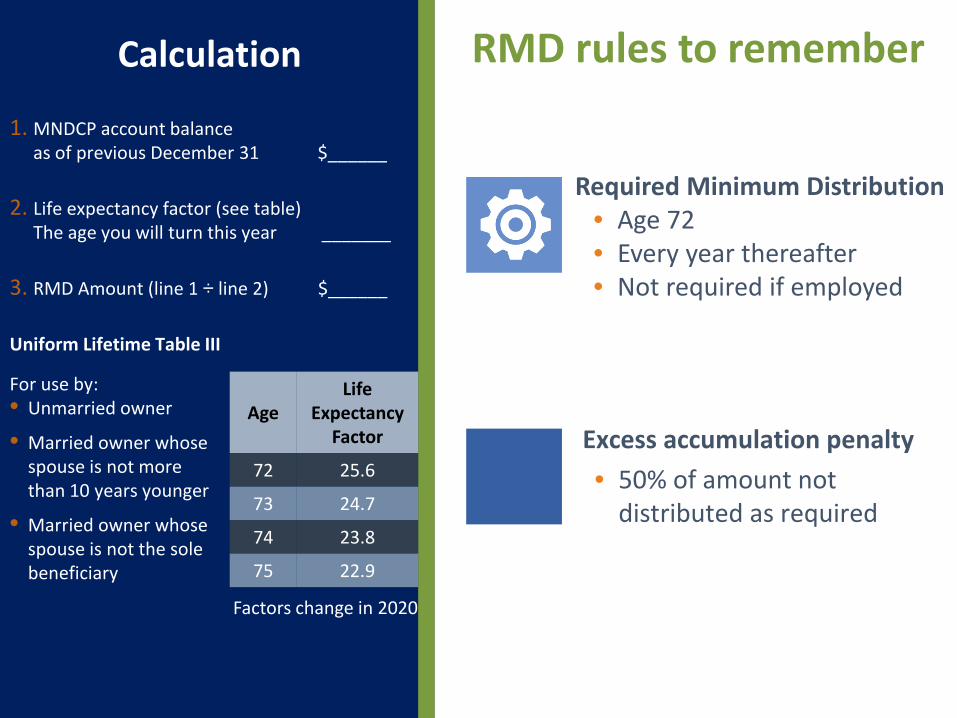
Click to edit Master title style Fulfill your RMD
RMDs are mandated by the IRS once you reach age 72 or retire, whichever is later
Required MinimumDistributions
(RMDs)
Click to edit Master title style
1. MNDCP account balance as of previous December 31 $______
2. Life expectancy factor (see table) The age you will turn this year _______
3. RMD Amount (line 1 ÷ line 2) $______
Uniform Lifetime Table III
For use by: • Unmarried owner
• Married owner whose spouse is not more than 10 years younger
• Married owner whose spouse is not the sole beneficiary
Calculation
AgeLife
Expectancy Factor
72 25.6
73 24.7
74 23.8
75 22.9
Excess accumulation penalty• 50% of amount not
distributed as required
RMD rules to remember
Required Minimum Distribution• Age 72• Every year thereafter• Not required if employed
Factors change in 2020

Keep beneficiarydesignations up to date
A beneficiary will inherit
your money
What happens if something happens to
you?
Plan aheadAVOID
PROBATE

Take action
Maximizeyour contributions
Keep in mindyou are not required to roll out or close your 457(b) or 403(b) retirement accountMinimize
account fluctuations with a diversified investment strategy
Considera withdrawal plan that is right for you


Sample health care costs
Retiree only Retiree & Spouse
$144,000 $288,000
$175,236 $374,196
Amount needed to cover retiree health insurance1 to age 90
SOURCE: MSRS 20201Based on SEGIP health insurance cost of $701/month retiree; $2.061 retiree & spouse from age 62 to age 65 and$355 SEGIP supplemental insurance and $145 Medicare Part B / month for retiree & spouse from age 65 to age 90
FOR ILLUSTRATIVE PURPOSES ONLY
Anita retires age 66
Sarah retires age 62
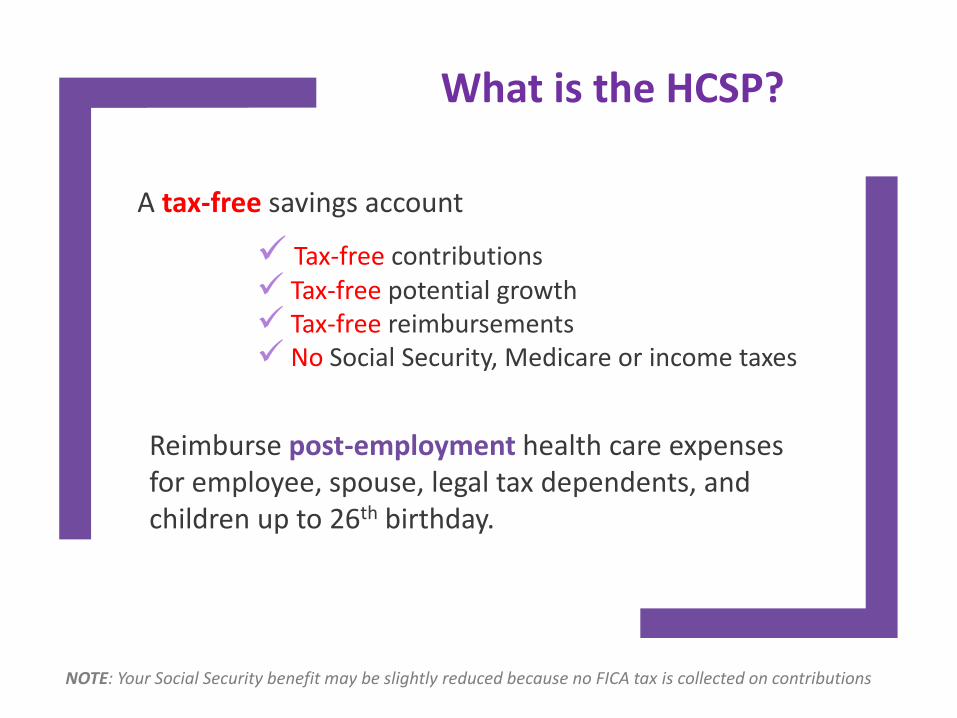
A tax-free savings account
Tax-free contributions Tax-free potential growth Tax-free reimbursements No Social Security, Medicare or income taxes
Reimburse post-employment health care expenses for employee, spouse, legal tax dependents, and children up to 26th birthday.
NOTE: Your Social Security benefit may be slightly reduced because no FICA tax is collected on contributions
What is the HCSP?

Severance payment $10,000Federal Income Tax 2,200 State Income Tax 680 FICA Tax 765
Net cash payment $6,355
This hypothetical example assumes a 22% federal withholding rate + 6.80% state withholding rate + 7.65% FICA (Social Security and Medicare) tax rate. Individual tax rates will vary based on total taxable income and filing status for the year.
Tax-Free HCSP Payout
Tax-free matters
FOR ILLUSTRATIVE PURPOSES ONLY
Taxable Cash Payout
Severance payment $10,000Federal Income Tax 0 State Income Tax 0 FICA Tax 0
Net cash payment $10,000
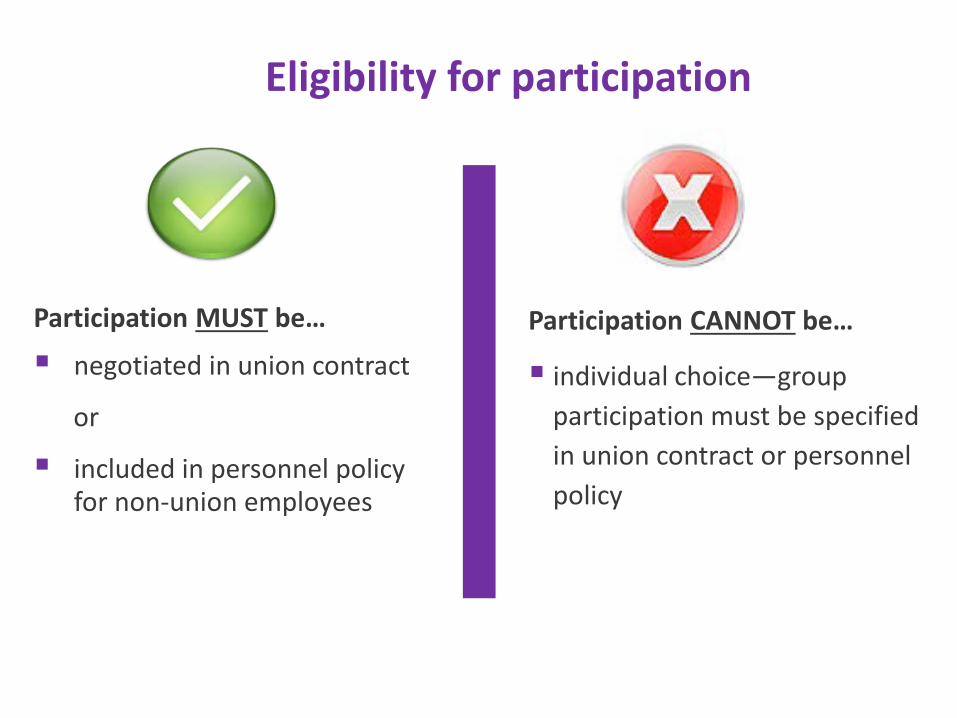
Eligibility for participation
Participation CANNOT be…
individual choice—group participation must be specified in union contract or personnel policy
Participation MUST be…
negotiated in union contract
or
included in personnel policy for non-union employees
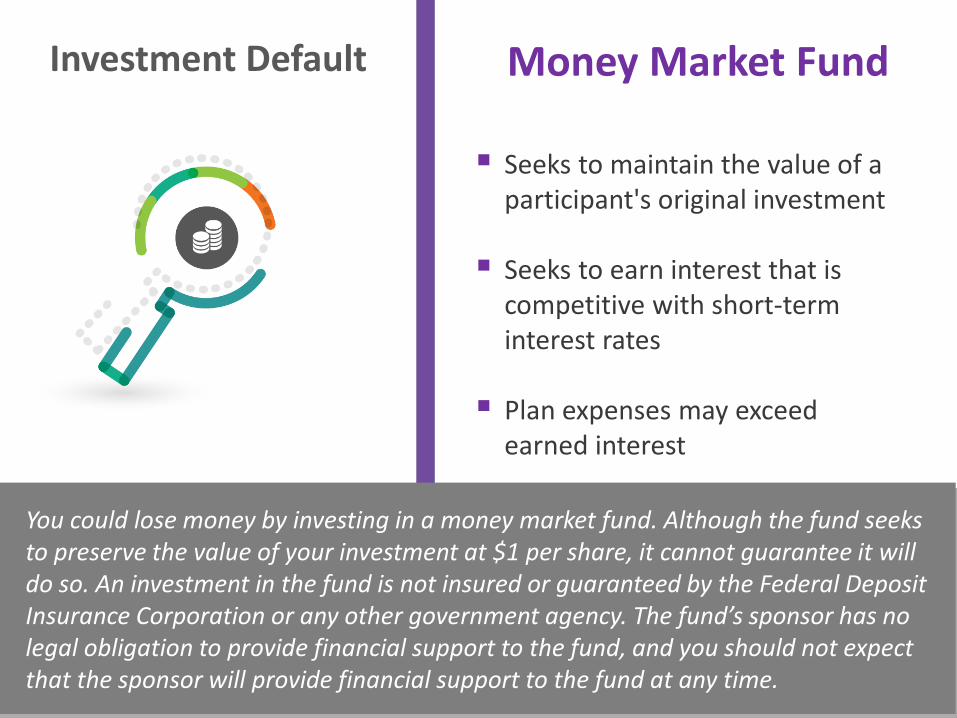
Investment Default Money Market Fund
You could lose money by investing in a money market fund. Although the fund seeks to preserve the value of your investment at $1 per share, it cannot guarantee it will do so. An investment in the fund is not insured or guaranteed by the Federal Deposit Insurance Corporation or any other government agency. The fund’s sponsor has no legal obligation to provide financial support to the fund, and you should not expect that the sponsor will provide financial support to the fund at any time.
Seeks to maintain the value of a participant's original investment
Seeks to earn interest that is competitive with short-term interest rates
Plan expenses may exceed earned interest

Click to edit Master title style
T. Rowe Price Small Cap Stock Fund
Vanguard Total International Stock Index Fund
Vanguard Mid Cap Index Fund
Vanguard Total Stock Market Index FundVanguard Dividend Growth Fund
Vanguard Balanced Index Fund
Dodge & Cox Income FundVanguard Total Bond Market Index Fund
Stable Value Fund
Higher Risk Potential Reward
Lower RiskPotential Reward
Investment options
FOR ILLUSTRATIVE PURPOSES ONLY The chart reflects the expected relative risk/return potential over the long-term. Past
performance is not a guarantee of future results.

Investment DisclosurePlease consider the investment objectives, fees and expenses carefully before investing. The prospectus and/or disclosure documents contain this and other important information about the investments offered through your plan. To obtain a prospectus or disclosure document, or to learn more about the investment options, visit www.msrs.state.mn.usor call 800-657-5757. Read such materials carefully before investing.
No investment is 100% risk free. You can incur loss of principal by investing. There is no assurance that investing will ensure a profit or protect against loss.
Foreign investments involve special risks, including currency fluctuation, taxation differences and political developments. Equity securities of small and mid-sized companies may be more volatile than securities of larger, more established companies. Asset allocation and balanced investment options and models are subject to the risks of the underlying funds, which can be a mix of stocks/stock funds and bond/bond funds. A bond fund’s yield, share price and total return change daily and are based on changes in interest rates, market conditions, economic and political news, and the quality and maturity of its investments. In general, bond prices fall when interest rates rise and vice versa.

• Upon termination of employment… at any age
• Once retired
• If collecting a disability benefit from a MN public pension plan
Returning to work?You may have limited or no access
When can yourequest reimbursements?
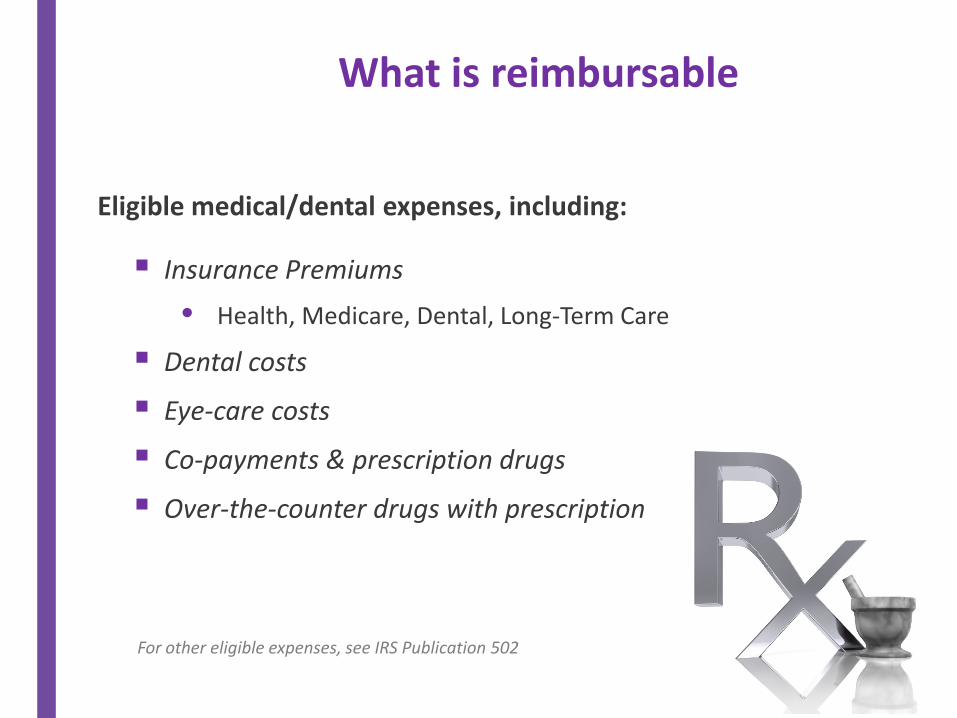
Eligible medical/dental expenses, including:
Insurance Premiums• Health, Medicare, Dental, Long-Term Care
Dental costs
Eye-care costs
Co-payments & prescription drugs
Over-the-counter drugs with prescription
What is reimbursable
For other eligible expenses, see IRS Publication 502
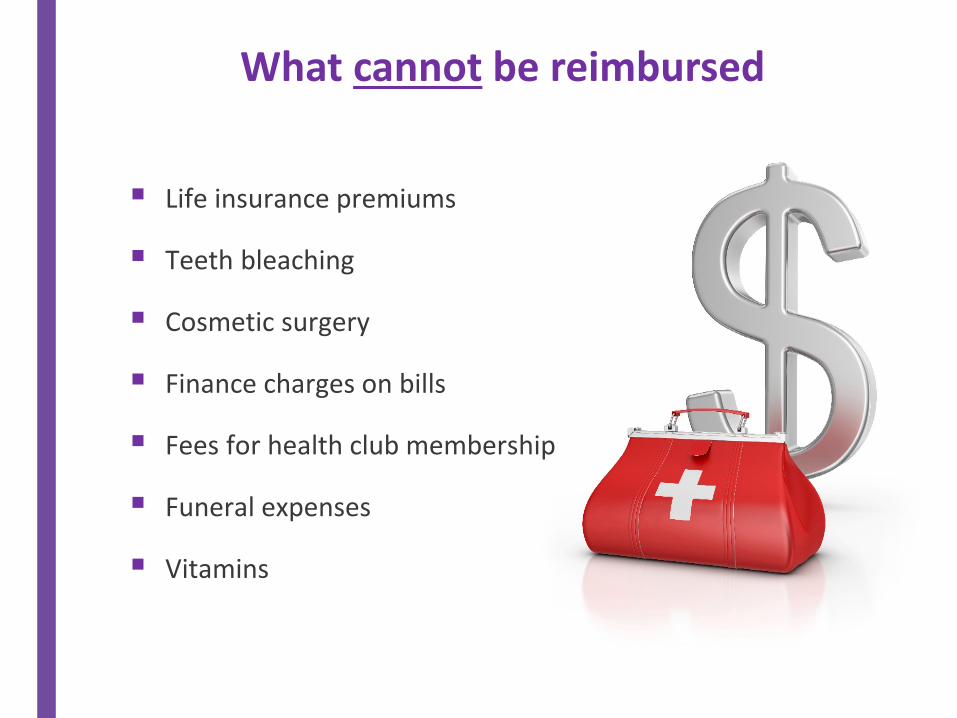
Life insurance premiums
Teeth bleaching
Cosmetic surgery
Finance charges on bills
Fees for health club membership
Funeral expenses
Vitamins
What cannot be reimbursed
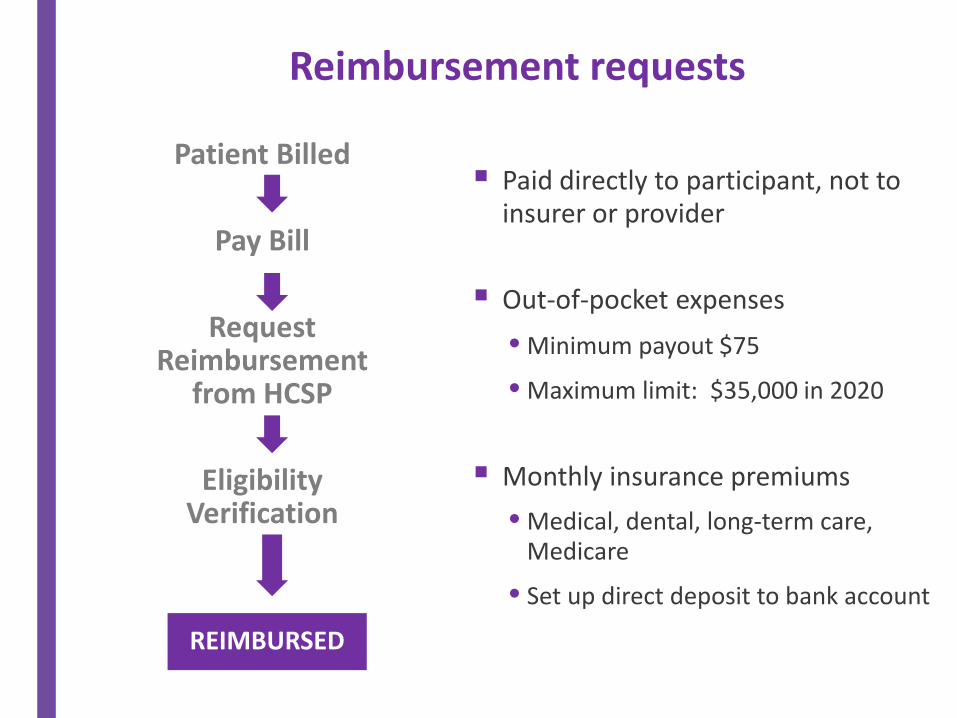
Reimbursement requests
Paid directly to participant, not to insurer or provider
Out-of-pocket expenses• Minimum payout $75
• Maximum limit: $35,000 in 2020
Monthly insurance premiums• Medical, dental, long-term care,
Medicare
• Set up direct deposit to bank account
REIMBURSED
Patient Billed
Pay Bill
Request Reimbursement
from HCSP
EligibilityVerification
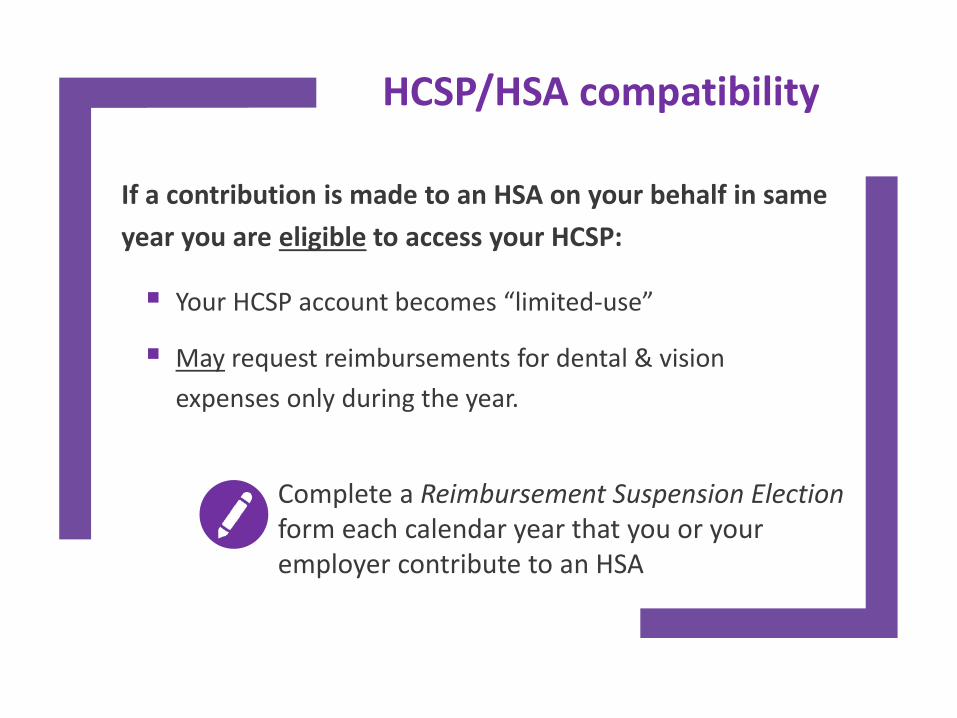
If a contribution is made to an HSA on your behalf in same year you are eligible to access your HCSP:
Your HCSP account becomes “limited-use”
May request reimbursements for dental & vision expenses only during the year.
HCSP/HSA compatibility
Complete a Reimbursement Suspension Electionform each calendar year that you or your employer contribute to an HSA
Account balance transfers to HCSP account for spouse
OR, if no spouse
Account balance transfers to HCSP account for dependent(s)Spouse or legal dependent reimbursements remain tax-free
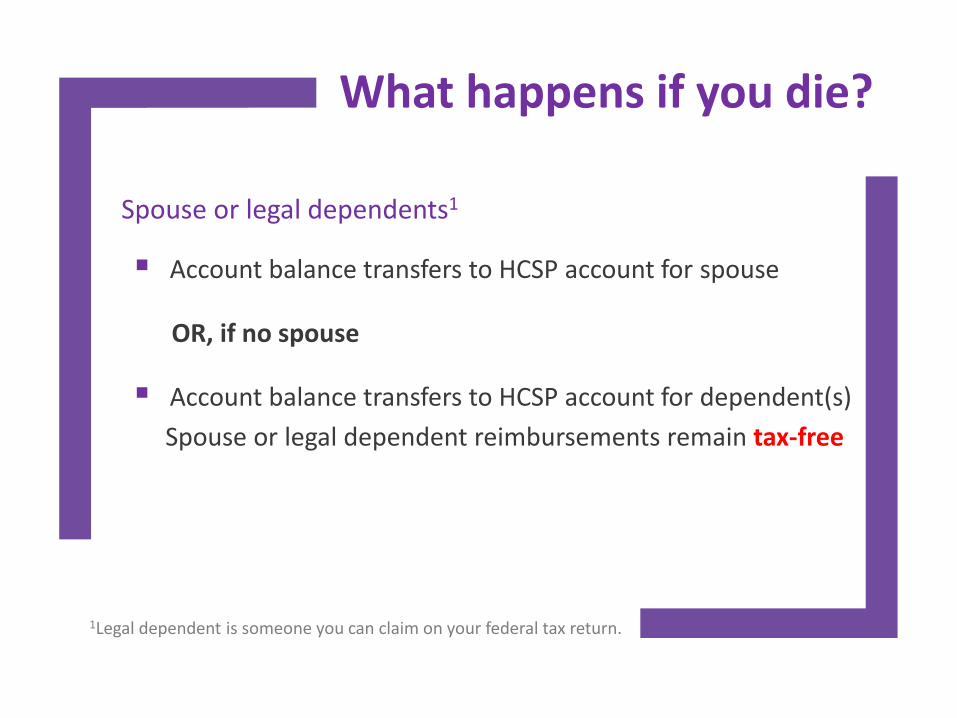
What happens if you die?
1Legal dependent is someone you can claim on your federal tax return.
Spouse or legal dependents1

Account balance transfers to HCSP account for your designated beneficiaries
Reimbursements taxed as ordinary income (MSRS will issue IRS Form 1099-MISC)
What happens if you die?
If NO spouse or legal dependents1
1Legal dependent is someone you can claim on your federal tax return.

Receive an HCSP Welcome Packet
after your first contribution is received
after your termination date is entered or your employer remits severance payment
in approximately 4 weeks:

Review your investments
The Money Market Fund is the investment default
Rememberpost-employment account for health expenses only
Do not reportreimbursements fromyour account on your federal/state tax return since the HCSP is a tax-free plan
Take Action

Time Table
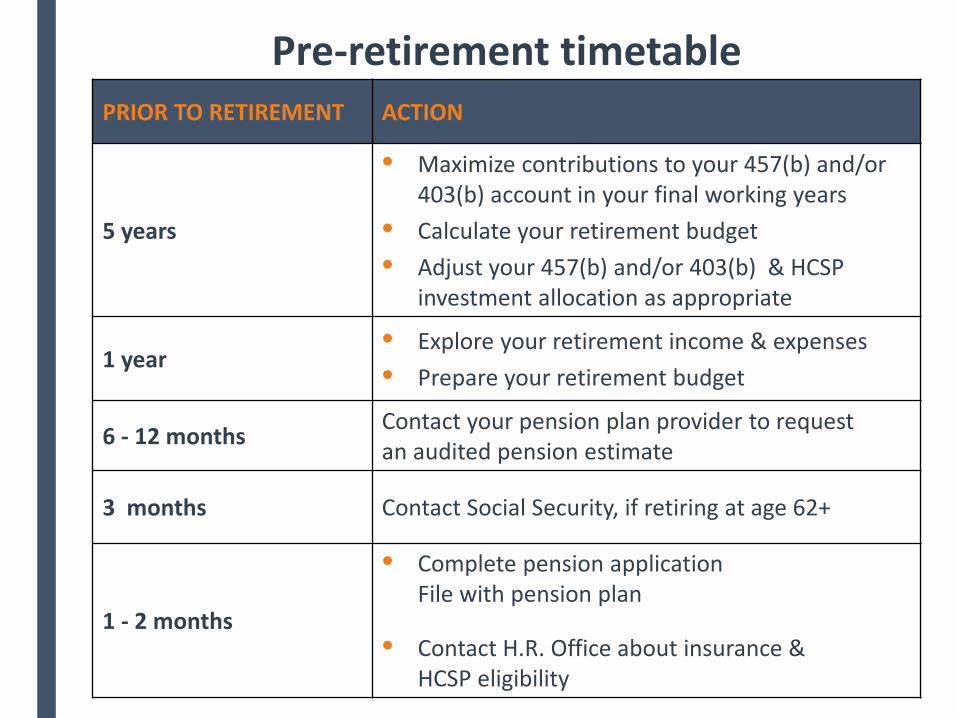
PRIOR TO RETIREMENT ACTION
5 years
• Maximize contributions to your 457(b) and/or 403(b) account in your final working years
• Calculate your retirement budget• Adjust your 457(b) and/or 403(b) & HCSP
investment allocation as appropriate
1 year• Explore your retirement income & expenses• Prepare your retirement budget
6 - 12 months Contact your pension plan provider to request an audited pension estimate
3 months Contact Social Security, if retiring at age 62+
1 - 2 months
• Complete pension application File with pension plan
• Contact H.R. Office about insurance & HCSP eligibility
Pre-retirement timetable

AFTER RETIREMENT ACTION
Immediately Enjoy Enjoy Enjoy Enjoy Enjoy
Up to 6 weeks Receive pension authorization letter & first payment
30 days after receipt of pension authorization letter
Your joint & survivor benefit option becomes irrevocable
1st week of the next month Receive monthly pension payment
December Receive notification of post-retirement increase
January Receive tax Form 1099-R for pension & MNDCP payments
Post-retirement timetable

Get more information
NOTE: These Web sites are for general education & information only and are provided as a benefit to the users of the site.
Pension PlanMSRSTRAPERA
www.msrs.state.mn.us www.minnesotatra.org www.mnpera.org
1-800-657-57571-800-657-36691-800-652-9026
Retiree insurance(health, dental, life) Contact your designated retiree insurance dept, or:
State employees 651-355-0100University of MN employees 612-624-8647Met Council employees 651-602-1601
Social Security www.ssa.gov 1-800-772-1213
Medicare www.medicare.gov
Administration for Community Living
www.acl.gov

www.msrs.state.mn.us
1.800.657.5757 or 651.296.2761
Contact Us!
Receive more details about the information you just saworMake an appointment to speak to one of our retirement counselors
St. Paul - 60 Empire Drive · Suite 300
St. Cloud - 4150 Second Street S · Suite 330
Mankato - 11 Civic Center Plaza · Suite 150
Detroit Lakes - 714 Lake Ave · Suite 102
Duluth - 625 East Central Entrance
Locations:

Important Notes
Core securities, when offered, are offered through GWFS Equities Inc. and/or other broker dealers.
GWFS Equities Inc., Member FINRA/SIPC, is a wholly owned subsidiary of Great-West Life & Annuity Insurance Company.
GWL&A and/or its subsidiaries are not responsible for, have not reviewed and do not endorse the content contained on msrs.state.mn.us.
Today’s workshop was designed to: Provide you with fundamental information
on your MSRS retirement plans Objectively highlight your
investment options Outline other sources of information
for your decisions
Please read all investment-related information prior to investing
This presentation is for general education purposes only and does not, nor is intended to constitute legal, tax, investment or financial advice of any kind.
• Please consult your own advisors for such advice
AM553491-07.18
The hypothetical illustrations are for informational and educational purposes only. They are not intended to be a recommendation of a specific investment or investment strategy. In applying a particular asset allocation model to your individual situation, you should consider other assets, income, and investments in addition to the account you are considering for investment, to the extent the model does not consider these additional assets.
Index returns shown are not those of an actual fund or portfolio, and are used to provide calendar year returns back to 1995 based on hypothetical asset allocations used for a Conservative and Aggressive model, respectively. They are not backtested returns and do not reflect the changes to glide paths over time. A benchmark index is not actively managed, does not have a defined investment objective, and does not incur fees or expenses. You cannot invest directly in a benchmark index.
For calendar year return calculations, the following index data from 9/30/2017 to 1/31/1991 was used, reflective of the underlying indices used for the asset allocations. US Large Cap Equities: S&P 500 Index; Global REIT: FTSE EPRA/NAREIT Developed Index; Commodities: Bloomberg Roll Select Commodity Index; US Core Bonds: Bloomberg Barclays US Aggregate; and International Equity: MSCI ACWI ex USA IMI Index.
For returns back to 1991 for indices with insufficient track records, used current indices for existing track records and replaced with equivalent indices with longer track records for the periods prior to index inception. Small/Mid Cap US Equities: Russell Small Cap Completeness Index from 4/1/1999-9/30/2017 and the MSCI Small/Mid Cap Index from 3/31/1999 to 1/31/1991; US Intermediate TIPS: Bloomberg Barclays US Treasury Inflation Protected Notes (1-10 Y) from 7/1/2001-9/30/2017 and the Bloomberg Barclays US Aggregate Index from 6/30/2001 to 1/31/1991 (TIPS returns were not available prior to 2001); US Short Term Government/Credit: Bloomberg Barclays Capital 1-3 Yr Government Credit Index from 5/1/2004-9/30/2017 and the Bloomberg Barclays US Aggregate Government & Credit (1-3 Y) from 4/30/2004 to 1/31/1991; US High Yield Bonds: Bloomberg Barclays High Yield Very Liquid from 2/1/1994-9/30/2017 and the Bloomberg Barclays US Corporate High Yield Index from 1/31/1994 to 1/31/1991; and Long Government Bonds: Bloomberg Barclays Long Government Bond Index from 1/1/1997-9/30/2017 and the Bloomberg Barclays Long Treasury Index from 12/31/1996 to 1/31/1991.
Asset Allocation Model Disclosurefrom slide 50


![MSRS Silk Road.ppt [ ۮe Ҧ ])](https://static.fdocuments.in/doc/165x107/62080a07c66d7513ad212043/msrs-silk-roadppt-e-.jpg)