2020 - moe.gov.lk
154
2020 Final Report -2020 Ministry of Education Annual School Census of Sri Lanka
Transcript of 2020 - moe.gov.lk

2020
Final Report -2020 Ministry of Education
Annual School Census of Sri Lanka


Annual School Census of Sri Lanka
Final Report - 2020
Ministry of Education
Prepared by Statistics Branch of Ministry of Education of Sri Lanka


i
PREFACE
Accurate information, undoubtedly, is an essential tool to be used in the processes of policy-decision making. Moreover, information is widely used in
monitoring and evaluation of the performance of education systems. The Statistics Branch of the Ministry of Education has conducted school censuses
on an annual basis, during past five decades and those have become the major source of statistical information in the general education sector in Sri
Lanka. Information gathered in the school census have extensively been used by the educational planners, development partners, policy analysts and
researchers in diagnosing trends, strengths, weaknesses, gaps and needs of the education system and in formulation of educational policies and plans,
desiging developmemt-partner assisted projects and sector-wide programmes which have contributed largely to the improvement of the quality of
the education system.
The Department of Census and Statistics (DCS) is extending its valued collaboration to the Ministry of Education in carrying out annual school censuses.
Also, the officers of the Ministry of Education, national level departments and institutions, provincial departments of education, zonal education offices,
divisional education offices and the schools are actively contributing to this exercise. On behalf of the Ministry of Education, I would like to express
our gratitude to the DCS, Provincial Directors of Education and senior officials, Deputy and Assistant Directors of Education of nine provincial
departments, 99 education zones, 312 education divisions, principals and staff of all government, private and special schools and heads of Pirivens for
their coorporation which was much more helpful in conducting this exicise successfully.
This publication is organized and prepared by the Statistics Branch, a part of the DCS, operating under the Policy, Planning and Review Division of this
Ministry. I am thankful to the Senior Statistician and the staff for their hard work in gathering, organizing and analyzing data and for bringing out this
publication. We have also taken steps to publish this on the official website of the Ministry of Education (www.moe.gov.lk) and on the official website
of the Department of Census and Statistics (www.statistics.gov.lk)
I sincerely hope that this publication “Annual School Census of Sri Lanka Final Report 2020” would be of immense use to policy makers, planners in
education and the researchers in educational pursuits. We also welcome the users’ suggestions and views with regard to the coverage of data, analyses
and the publication as we honestly consider that those will definitely be helpfful for further improvements of the related processes.
Dr. (Mrs.) M.M. Wehella Additional Secretary (Policy Planning & Review) Ministry of Education “Isurupaya” Battaramulla.

ii
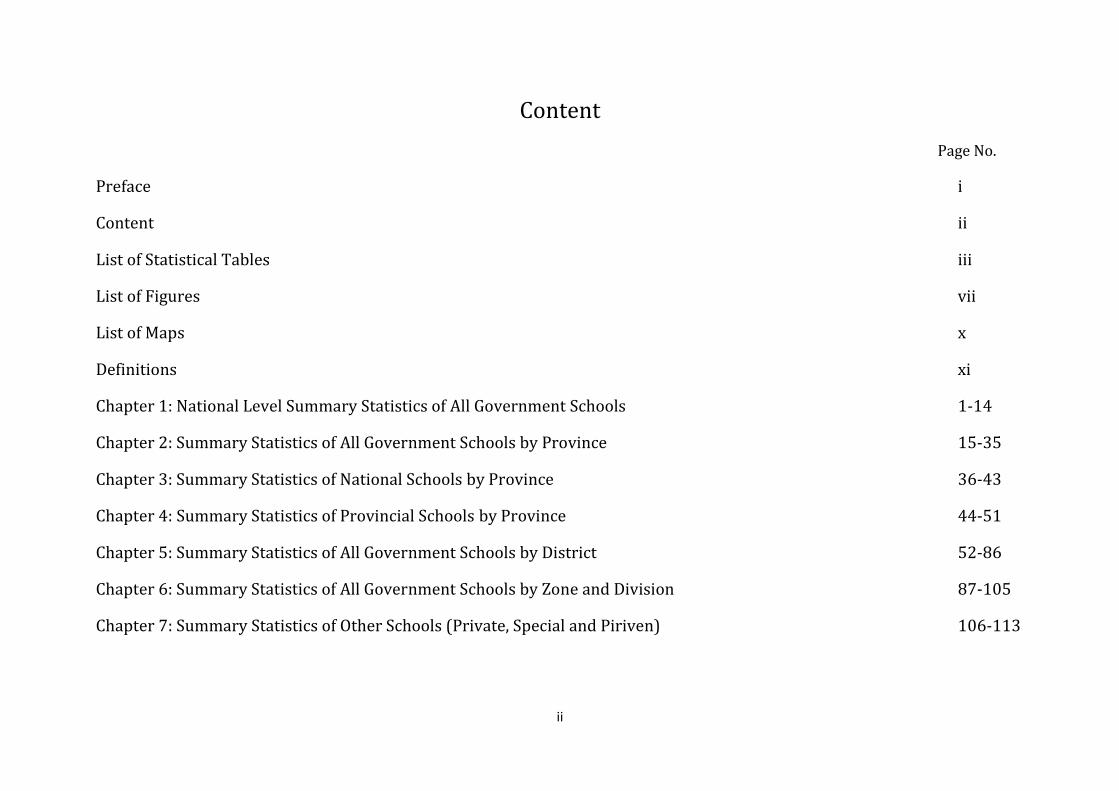
Content
Page No.
Preface i
Content ii
List of Statistical Tables iii
List of Figures vii
List of Maps x
Definitions xi
Chapter 1: National Level Summary Statistics of All Government Schools 1-14
Chapter 2: Summary Statistics of All Government Schools by Province 15-35
Chapter 3: Summary Statistics of National Schools by Province 36-43
Chapter 4: Summary Statistics of Provincial Schools by Province 44-51
Chapter 5: Summary Statistics of All Government Schools by District 52-86
Chapter 6: Summary Statistics of All Government Schools by Zone and Division 87-105
Chapter 7: Summary Statistics of Other Schools (Private, Special and Piriven) 106-113


List of Statistical Tables
Chapter 1: National Level Summary Statistics of All Government Schools
Table Page
1. At a Glance - Basic Statistics of Government Schools – 2020
1
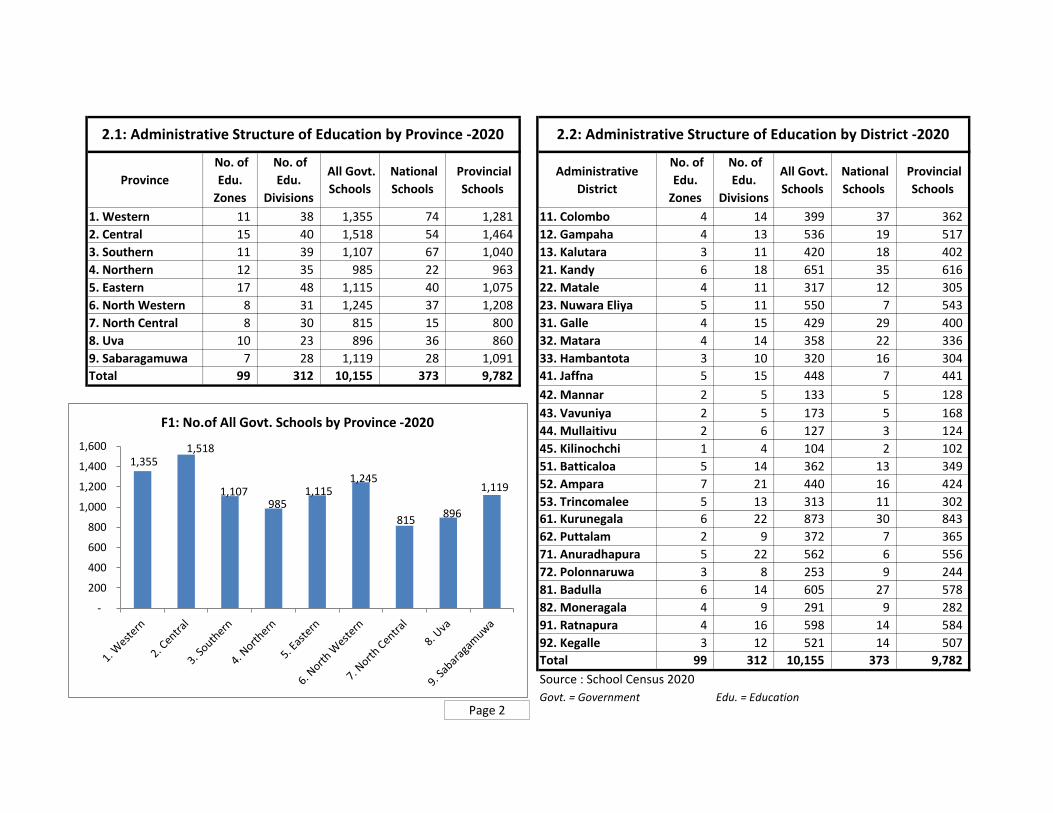
2.1 Administrative Structure of Education by Province – 2020
2
2.2 Administrative Structure of Education by District - 2020 2
3. Summary Statistics of Government Schools – 2020 3
4. Summary Statistics of Government Schools by Students – 2020
5
5. Summary Statistics of Government Schools by Teachers – 2020
6
6. Comparison of Basic Statistics of National and Provincial Schools -2020
7
7. Grade 1 Admission Related Statistics of Government Schools -2020
8
8. Government Schools by Size of Student Population -2020 9
9. Government Schools by Size of Teacher Population -2020 10
10. Grade-wise Students of Government Schools by Sex and Medium of Study -2020
11
11. Teachers of Government Schools by Appointment Category -2020
13
12. Student Teacher Ratios (STRs) of Government Schools -2020
14
Chapter 2: Summary Statistics of All Government Schools by Province
Table Page
13. Basic Statistics of Government Schools by Province -2020
15
14. Basic Statistics of National and Provincial Schools by Province – 2020
16
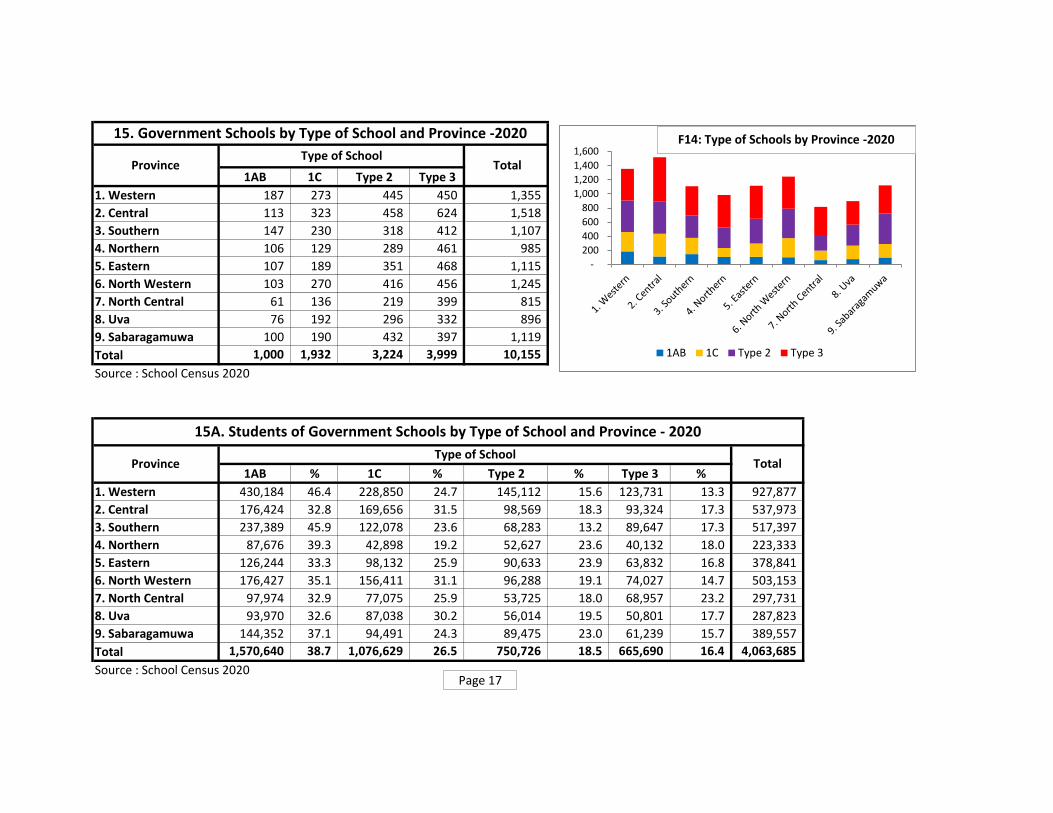
15. Government Schools by Type of School and Province -2020
17
15A. Students of Government Schools by Type of School and Province – 2020
17
15B. Teachers of Government Schools by Type of School and Province- 2020
18
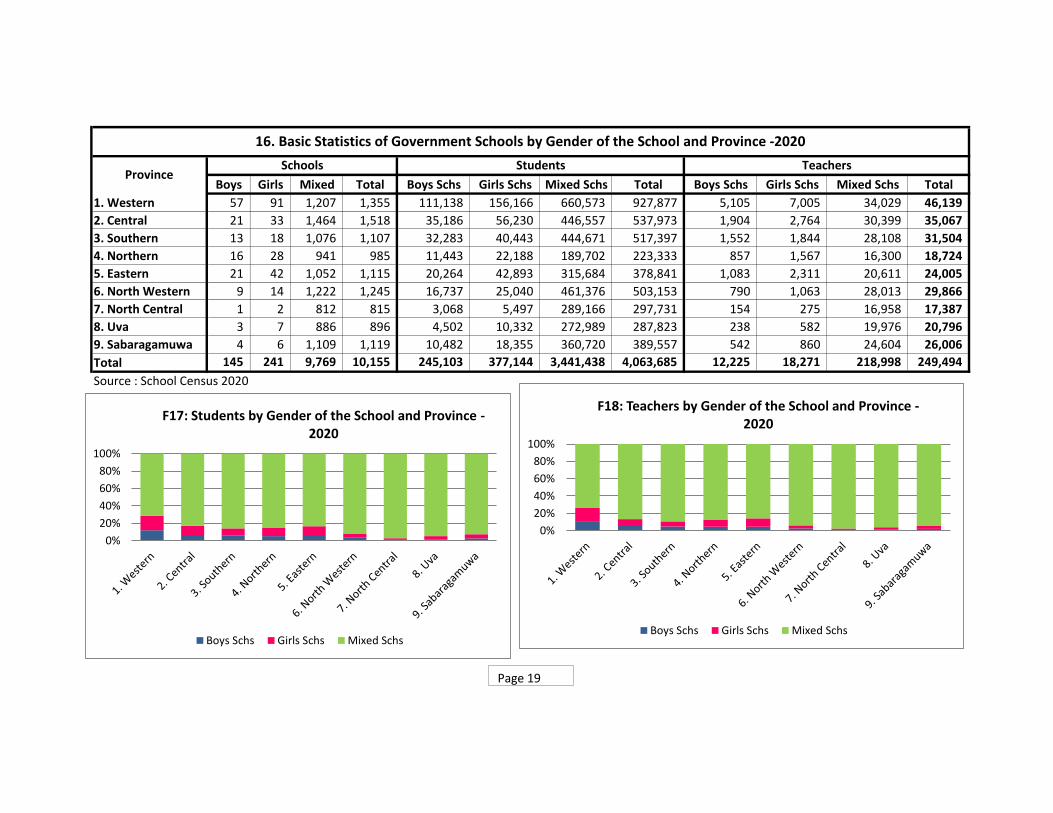
16. Basic Statistics of Government Schools by Gender of the School and Province -2020
19
17. Government Schools by Language Medium of Instruction and Province -2020
20
18. Government Schools by Grade Span of the School and Province -2020
21
18A. Students of Government Schools by Grade Span of the School and Province -2020
22
18B. Teachers of Government Schools by Grade Span of the School and Province -2020
22
19. Government Schools by Size of Student Population and
Province -2020
23
20. Government Schools by Size of Teacher Population and
Province -2020
24
iii

Table Page
21. Students of Government Schools by Sex and Province -2020
25
22. Students of Government Schools by Language Medium of Study and Province- 2020
26
23. Students of Government Schools by Grade Cycle of Study and Province -2020
27
24. Students of Government Schools by Grade of study and Province -2020
28
25. A/L Students of Government Schools by Subject Stream and Province -2020
29
26. Teachers of Government Schools by Sex and Province-2020
30
27. Teachers of Government Schools by Medium of
Appointment and Province -2020
31
28. Teachers of Government Schools by Category of
Appointment and Province - 2020
32
29. Government Schools by Administrative Level (National/
Provincial), Type of School and Province -2020
33
29A. Students of Government Schools by Administrative
Level (National/ Provincial), Type of School and Province -
2020
33
29B. Teachers of Government Schools by Administrative
Level (National/ Provincial), Type of School and Province -
2020
34
29C. Average Students per School by Administrative Level
(National/ Provincial), Type of School and Province -2020
34
Table Page
30. Grade 1 Admission of Government Schools by Language
Medium, Sex and Province -2020
35
Chapter 3: Summary Statistics of National Schools by Province
31. Basic Statistics of National Schools by Province -2020 36
32. National Schools by Size of Student Population and Province -2020
37
33. Students of National Schools by Sex and Province -2020 38
34. Students of National Schools by Language Medium of Study and Province- 2020
39
35. Students of National Schools by Grade Cycle of Study and Province -2020
40
36. Teachers of National Schools by Sex and Province -2020 41
37. Teachers of National Schools by Medium of Teaching of Major Subject and Province -2020
42
38. Teachers of National Schools by Category of Appointment and Province - 2020
43
Chapter 4: Summary Statistics of Provincial Schools by Province
39. Basic Statistics of Provincial Schools by Province -2020 44
40. Provincial Schools by Size of Student Population and Province -2020
45
41. Students of Provincial Schools by Sex and Province -2020
46
iv

Table Page
42. Students of Provincial Schools by Language Medium of Study and Province- 2020
47
43. Students of Provincial Schools by Grade Cycle of Study and Province -2020
48
44. Teachers of Provincial Schools by Sex and Province -2020
49
45. Teachers of Provincial Schools by Medium of Teaching of Major Subject and Province -2020
50
46. Teachers of Provincial Schools by Category of Appointment and Province - 2020
51
Chapter 5: Summary Statistics of All Government Schools by District
47. Basic Statistics of Government Schools by District -2020 52
48. Basic Statistics of National and Provincial Schools by District - 2020
53
49. Government Schools by Type of School and District -2020
55
49A. Students of Government Schools by Type of School and District – 2020
56
49B. Teachers of Government Schools by Type of School and District- 2020
57
50. Basic Statistics of Government Schools by Gender of the School and District -2020
59
51. Government Schools by Language Medium of Instruction and District -2020
60
52. Government Schools by Grade Span of the School and District -2020
61
Table Page
53. Government Schools by Size of Student Population and District -2020
62
54. Government Schools by Size of Teacher Population and District -2020
64
55. Students of Government Schools by Sex and District -2020
66
56. Students of Government Schools by Language Medium of Study and District - 2020
67
57. Students of Government Schools by Grade Cycle of Study and District -2020
68
58. Students of Government Schools by Grade of study and District -2020
69
59. A/L Students of Government Schools by Subject Stream and District -2020
71
60. Teachers of Government Schools by Sex and District -2020
72
61. Teachers of Government Schools by Medium of Teaching of Major Subject and District -2020
73
62. Teachers of Government Schools by Category of Appointment by District - 2020
74
63. Basic Statistics of National Schools by District - 2020 75
64. Basic Statistics of Students of National Schools by District – 2020
77
65. Basic Statistics of Provincial Schools by District – 2020 79
66. Basic Statistics of Students of Provincial Schools by District – 2020
81
v
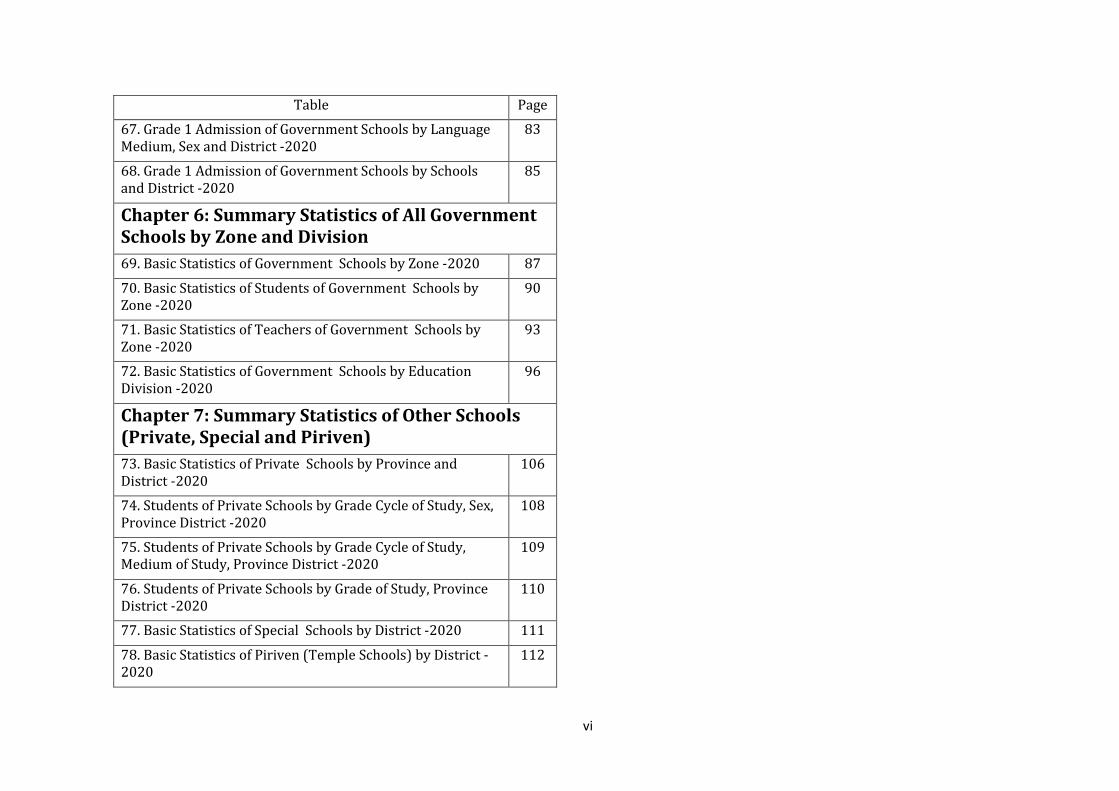
Table Page
67. Grade 1 Admission of Government Schools by Language Medium, Sex and District -2020
83
68. Grade 1 Admission of Government Schools by Schools and District -2020
85
Chapter 6: Summary Statistics of All Government Schools by Zone and Division
69. Basic Statistics of Government Schools by Zone -2020 87
70. Basic Statistics of Students of Government Schools by Zone -2020
90
71. Basic Statistics of Teachers of Government Schools by Zone -2020
93
72. Basic Statistics of Government Schools by Education Division -2020
96
Chapter 7: Summary Statistics of Other Schools (Private, Special and Piriven)
73. Basic Statistics of Private Schools by Province and District -2020
106
74. Students of Private Schools by Grade Cycle of Study, Sex, Province District -2020
108
75. Students of Private Schools by Grade Cycle of Study, Medium of Study, Province District -2020
109
76. Students of Private Schools by Grade of Study, Province District -2020
110
77. Basic Statistics of Special Schools by District -2020 111
78. Basic Statistics of Piriven (Temple Schools) by District -2020
112
vi

List of Figures
Chapter 1: National Level Summary Statistics of All Government Schools
Figure Page
F1: No.of All Govt. Schools by Province-2020 2
F2: Government Schools by Size of Student Population-2020 9
F3: Schools by Type of School and No. of Teachers- 2020 10
F4: Schools by Grade Span of the School and No.of Teachers- 2020
10
F5: Students of Government Schools by Grade and Sex -2020 12
F6: Students of Government Schools by Grade and Medium -2020
12
F7: Teachers of Government Schools by Appointment Category
and Type of School -2020
13
F8: Teachers of Government Schools by Appointment Category
and Grade Span of the School -2020
13
F9: Comparison of STR of Govt. Schools by Size of Student
Population -2020
14
Chapter 2: Summary Statistics of All Government Schools by Province
F10: Students of Government Schools by Province -2020 15
F11: Teachers of Government Schools by Province -2020 15
F12: Students of National & Provincial Schools by Province - 2020
16
F13: Percentage of Teachers of National & Provincial Schools by Province - 2020
16
F14: Type of School by Province -2020 17
Figure Page
F15: Students by Type of School and Province -2020 18
F16: Teachers by Type of School and Province- 2020 18
F17: Students by Gender of the School and Province -2020 19
F18: Teachers by Gender of the School and Province -2020 19
F19: Schools by Language Medium of Instruction and Province -2020
20
F20: Government Schools by Grade Span of the School and Province -2020
21
F21: Distribution of the Smallest Schools (Studen Population 50 or Less) by Province -2020
23
F22: Distribution of the Largest Schools (Studen Population Above 1,000) by Province -2020
23
F23: Schools by Size of Teacher Population and Province -2020 24
F24: Distribution of Students of Government Schools by Province -2020
25
F25: Students by Sex and Province -2020 25
F26: No. of Students by Medium and Province- 2020 26
F27: Percentage of Students by Medium and Province- 2020 26
F28: Students by Grade Cycle of Study and Province -2020 27
F29: A/L Students of by Subject Stream and Province -2020 29
F30: Percentage of A/L Students of by Subject Stream and Province -2020
29
F31: Percentage of Teachers by Province-2020 30
F32: Percentage of Teachers by Sex and Province-2020 30
F33: Teachers by Sex and Province-2020 30
vii
Figure Page
F34: Sinhala Medium of Teachers by Province -2020 31
F35: Tamil Medium of Teachers by Province -2020 31
F36: Teachers by Category of Appointment and Province - 2020
32
F37: Percentage of Teachers by Category of Appointment and Province - 2020
32
F38: Grade 1 Admission by Language Medium and Province -2020
35
F39: Grade 1 Admission by Sex and Province -2020 35 Chapter 3: Summary Statistics of National Schools by Province
F40: Percentage Distribution of National Schools by Province -2020
36
F41: Percentage Distribution of Students in National Schools by Province -2020
36
F42: Distribution of the Largest National Schools (Student Population above 1,000) by Province -2020
37
F43: Students of National Schools by Sex and Province -2020 38
F44: Male Students of National Schools by Province -2020 38
F45: Female Students of National Schools by Province -2020 38
F46: Students of National Schools by Medium and Province- 2020
39
F47: Percentage of Students of National Schools by Medium and Province- 2020
39
F48: Students of National Schools by Grade Cycle of Study and Province -2020
40
Figure Page
F49: Percentage of Teachers of National Schools by Province -2020
41
F50: Percentage of Teachers of National Schools by Sex and Province -2020
41
F51: Teachers of National Schools by Sex and Province -2020 41
F52: Sinhala Medium Teachers of National Schools by Province -2020
42
F53: Tamil Medium Teachers of National Schools by Province -2020
42
F54: Teachers of National Schools by Category of Appointment and Province - 2020
43
F55: Percentage of Teachers of National Schools by Category of Appointment and Province - 2020
43
Chapter 4: Summary Statistics of Provincial Schools by Province
F56: Percentage of Distribution of Provincial Schools by Province -2020
44
F57: Percentage of Distribution of Students in Provincial Schools by Province -2020
44
F58: Distribution of the Largest Provincial Schools (Student Population Above 1,000) by Province -2020
45
F59: Students of Provincial Schools by Sex and Province -2020 46
F60: Male Students of Provincial Schools by Province -2020 46
F61: Female Students of Provincial Schools by Province -2020 46
F62: Students of Provincial Schools by Medium and Province- 2020
47
F63: Percentage of Students of Provincial Schools by Medium and Province- 2020
47
viii

Figure Page
F64: Students of Provincial Schools by Grade Cycle of Study and Province -2020
48
F65: Percentage of Teachers of Provincial Schools by Province -2020
49
F66: Percentage of Teachers of Provincial Schools by Sex and Province -2020
49
F67: Teachers of Provincial Schools by Sex and Province -2020 49
F68: Teachers of Provincial Schools by Medium of Teaching of Major Subject and Province -2020
50
F69: Tamil Medium Teachers of Provincial Schools by Province -2020
50
F70: Teachers of Provincial Schools by Category of Appointment and Province - 2020
51
F71: Percentage of Teachers of Provincial Schools by Category of Appointment and Province - 2020
51
Chapter 5: Summary Statistics of All Government Schools by District
F72: Government Schools by Size of Student Population and District -2020
63
F73: Government Schools by Size of Teacher Population and District -2020
65
F74: Students of National Schools by District -2020 76
F75: STR (Student Teacher Ratio) of National Schools by District -2020
76
F76: Average Students per National School by District - 2020 76
F77: Average Teachers per National School by District - 2020 76
F78: Students of National Schools by Sex and District -2020 78
Figure Page
F79: Students of National Schools by Medium and District -2020
78
F80: Students of National Schools by Cycle of Study and District - 2020
78
F81: Tamil Medium Students of National Schools by District - 2020
78
F82: Students of Provincial Schools by District -2020 80
F83: STR (Student Teacher Ratio) of Provincial Schools by District -2020
80
F84: Average Students per Provincial Schools by District - 2020
80
F85: Average Teachers per Provincial Schools by District - 2020
80
F86: Students of Provincial Schools by Sex and District -2020 82
F87: Students of Provincial Schools by Medium and District -2020
82
F88: Students of Provincial Schools by Cycle of Study and District - 2020
82
F89: Tamil Medium Students of Provincial Schools by District - 2020
82
F90: Grade 1 Admission by Level of School and District- 2020 86
F91: Grade 1 Admission by Type of School and District- 2020 86
F92: Grade 1 Admission by Size of Students Population and District- 2020
86
ix


x
List of Maps
Chapter 5: Summary Statistics of All Government Schools by District
Map Page
M1: National and Provincial Schools by District -2020 54
M2: Students of National and Provincial Schools by District -2020
54
M3: Government Schools by Type of School and District -2020 55
M4: Students of Government Schools by Type of School and District -2020
58
M5: Teachers of Government Schools by Type of School and District -2020
58
M6: Government Schools by Size of Students Population and
District-2020
63
M7: Government Schools by Size of Teacher Population and
District -2020
65
M8: Students of Government Schools by Sex and District -2020 66
M9: Students of Government Schools by Language Medium of
Study and District -2020
67
M10: Students of Government Schools by Grade Cycle of Study
and District -2020
68
M11: A/L Students of Government Schools by Subject Stream and District -2020
71
Map Page
M12: Teachers of Government Schools by Sex and District -2020
72
M13: Teachers of Government Schools by Medium of Teaching of Major Subject and District -2020
73
M14: Teachers Government Schools by Category of Appointment and District -2020
74
M15: Grade 1 Admission by Sex and District -2020 84
M16: Grade 1 Admission by Medium and District -2020 84
Chapter 7: Summary Statistics of Other Schools (Private, Special and Piriven)
M17: Students of Private Schools by Sex and District -2020 107
M18: Students of Private Schools by Medium of Study and
District -2020
107
M19:Students of Special Schools by Sex and District -2020 111
M20: Piriven (Temple Schools) by Type of Piriven and District
-2020
113
M21: Piriven Students by Type of Students and District -2020 113


Definitions
School Census 2020 held on December 1, 2020 due to prevailing covid pandemic in the country. Last School census (2019) held first time, September 1, 2019 (beginning of third school term); prior to that, all previous censuses held on June 1 on annual basis.
Definitions for Level of School;
National Schools – Schools have been administrated under the Central government
Provincial Schools – Schools have been administrated under the provincial councils
Classifications of Schools/ Definitions for Type of School;
1AB - Schools having Advanced Level Science (Bio Science and/ or Physical Science) stream classes
1C - Schools having Advanced Level classes other than Science (Arts and/or Commerce and/or Technology streams and/ or Vocational)
Stream at least one Stream having schools are classified as 1C Schools
Type 2 - Schools having classes only up to grade 11 (Grade 1-11 or grade 6-11)
Type 3 - Schools having classes from grade 1-5 or grade 1-8
Definition of Major Category of Appointment of the Teachers;
Graduate teachers – Basic degree, Postgraduate diploma, postgraduate degree holders
Trained teachers – Teachers qualified with a teacher-training certificate from a Training college/National Diploma holder of a National
College of Education /teachers having 2-year diploma in Science/Mathematics
Untrained – Untrained teachers and 2-3 years other diploma holders and has absorbed in Sri Lanka Teacher Service (SLTS)
Trainee – Teachers not absorbed in the Sri Lanka Teacher Service
Other – Teachers paid by other government institutes and teachers paid by non-government institutes/organizations.
Student Teacher Ratio (STR); STR = No. of Students/ No. of Teachers
Xi

Medium of Study
Sinhala Medium – All Subjects are study in Sinhala medium
Tamil Medium – All Subjects are study in Tamil medium
Bilingual Medium – Some Selected Subjects are study in English medium and rest of subjects are study in one mother tongue
(Sinhala/ Tamil medium)
English Medium – All Subjects are study in English medium
Teaching in English Medium – Teachers are conduct their lessons in English medium other than English Language/ General
English considered as English Medium subjects
Section Classification by Grade of Study of Students
Primary
Grade 1-5
Junior Secondary
Grade 6-9
Senior Secondary
O/L Grades
Grade 10-11
Senior Secondary
A/L Grades
Grade 12-13
Xii
School Census - 2020 National Level Summary Statistics of
All Government Schools
1


All Government Schools 10,155 Schools by Student Population
National Schools 373 Sinhala Medium Only 6,357 1-50 Students 1,439
Provincial Schools 9,782 Tamil Medium Only 3,042 51-100 Students 1,523
Type of School Sinhala and Tamil Mediums 42 101-200 Students 2,169
1AB Schools 1,000 Sinhala and Bilingual(S/E) Mediums 524 201-500 Students 2,690
1C Schools 1,932 Tamil and Bilingual(T/E) Mediums 157 501-1,000 Students 1,404
Type 2 Schools 3,224 Trilingual (Sinhala, Tamil and Bilingual
(S/E &/or T/E)) Mediums33 1,001-1,500 Students 398
Type 3 Schools 3,999 School by Fuctional Grade Span 1,501-2,000 Students 215
Grade 1-5 3,884 2,001-3,000 Students 212
Boys Schools 145 Grade 1-8 115 3,001-4,000 Students 73
Girls Schools 241 Grade 1-11 3,204 More than 4,000 Students 32
Mixed Schools 9,769 Grade 1-13 1,949
Grade 6-11 20
Grade 6-13 983 All Teachers 249,494
Male Teachers 61,747
All Students 4,063,685 Female Teachers 187,747
Male Students 2,018,151 Sinhala Medium 2,978,133 Graduate Teachers 121,569
Female Students 2,045,534 Tamil Medium 986,156 Trained Teachers 121,796
National Schools 796,812 Bilingual (S/E and T/E) Medium 99,396 Trainee Teachers 4,525
Provincial Schools 3,266,873 Untrained Teachers 1,472
Students by Grade Cycle of Studying Other Teachers 132
1AB Schools 1,570,640 Primary Cycle (Grd 1-5) 1,640,647 Teachers by Type of School
1C Schools 1,076,629 Junior Secondary Cycle (Grd 6-9) 1,357,437 1AB Schools 82,244
Type 2 Schools 750,726 Senior Secondary O/L Cycle (Grd 10-11) 636,985 1C Schools 67,837
Type 3 Schools 665,690 Senior Secondary A/L Cycle (Grd 12-13) 421,114 Type 2 Schools 61,728 Special Education Units 7,502 Type 3 Schools 37,685
Grade 1 Admissions 319,405 Grade 1 Admissions by Type of School
Male Students 161,853 Sinhala Medium 239,236 1AB Schools 46,539
Female Students 157,552 Tamil Medium 80,169 1C Schools 72,732
National Schools 25,672 Type 2 Schools 70,125
Provincial Schools 293,733 Type 3 Schools 130,009
Grade 1 Admissions
Schools by Language medium/s of Instruction
School by Gender of the School
1. At a Glance - Basic Statistics of Government Schools -2020
Teachers
Students by Language medium/s study
Students
Schools
Students by Type of School
Page 1
Province
No. of
Edu.
Zones
No. of
Edu.
Divisions
All Govt.
Schools
National
Schools
Provincial
Schools
Administrative
District
No. of
Edu.
Zones
No. of
Edu.
Divisions
All Govt.
Schools
National
Schools
Provincial
Schools
1. Western 11 38 1,355 74 1,281 11. Colombo 4 14 399 37 362
2. Central 15 40 1,518 54 1,464 12. Gampaha 4 13 536 19 517
3. Southern 11 39 1,107 67 1,040 13. Kalutara 3 11 420 18 402
4. Northern 12 35 985 22 963 21. Kandy 6 18 651 35 616
5. Eastern 17 48 1,115 40 1,075 22. Matale 4 11 317 12 305
6. North Western 8 31 1,245 37 1,208 23. Nuwara Eliya 5 11 550 7 543
7. North Central 8 30 815 15 800 31. Galle 4 15 429 29 400
8. Uva 10 23 896 36 860 32. Matara 4 14 358 22 336
9. Sabaragamuwa 7 28 1,119 28 1,091 33. Hambantota 3 10 320 16 304
Total 99 312 10,155 373 9,782 41. Jaffna 5 15 448 7 441
42. Mannar 2 5 133 5 128
43. Vavuniya 2 5 173 5 168
44. Mullaitivu 2 6 127 3 124
45. Kilinochchi 1 4 104 2 102
51. Batticaloa 5 14 362 13 349
52. Ampara 7 21 440 16 424
53. Trincomalee 5 13 313 11 302
61. Kurunegala 6 22 873 30 843
62. Puttalam 2 9 372 7 365
71. Anuradhapura 5 22 562 6 556
72. Polonnaruwa 3 8 253 9 244
81. Badulla 6 14 605 27 578
82. Moneragala 4 9 291 9 282
91. Ratnapura 4 16 598 14 584
92. Kegalle 3 12 521 14 507
Total 99 312 10,155 373 9,782
Source : School Census 2020
Govt. = Government Edu. = Education
2.2: Administrative Structure of Education by District -20202.1: Administrative Structure of Education by Province -2020
1,355 1,518
1,107 985
1,115 1,245
815 896
1,119
-
200
400
600
800
1,000
1,200
1,400
1,600
F1: No.of All Govt. Schools by Province -2020
Page 2

Category No. of
Schools %
No. of
Students %
No. of
Teachers % Category
No. of
Schools %
No. of
Students %
No. of
Teachers %
All Government
Schools10,155 4,063,685 249,494
Level of School Boys Schools 145 1.4 245,103 6.0 12,225 4.9
National Schools 373 3.7 796,812 19.6 41,538 16.6 Girls Schools 241 2.4 377,144 9.3 18,271 7.3
Provincial Schools 9,782 96.3 3,266,873 80.4 207,956 83.4 Mixed Schools 9,769 96.2 3,441,438 84.7 218,998 87.8
Type of School
1AB Schools 1,000 9.8 1,570,640 38.7 82,244 33.0 Sinhala Schools 6,915 68.1 3,051,509 75.1 181,830 72.9
1C Schools 1,932 19.0 1,076,629 26.5 67,837 27.2 Tamil Schools 2,301 22.7 583,016 14.3 42,391 17.0
Type 2 Schools 3,224 31.7 750,726 18.5 61,728 24.7 Muslim Schools 939 9.2 429,160 10.6 25,273 10.1
Type 3 Schools 3,999 39.4 665,690 16.4 37,685 15.1
Sinhala Medium 6,357 62.6
Grade 1-5 3,884 38.2 649,719 16.0 36,432 14.6 Tamil Medium 3,042 30.0
Grade 1-8 115 1.1 15,971 0.4 1,253 0.5 Sinhala and Tamil
Mediums42 0.4
Grade 1-11 3,204 31.6 748,139 18.4 61,462 24.6 Sinhala and Bilingual(S/E)
Mediums524 5.2
Grade 1-13 1,949 19.2 1,705,640 42.0 95,322 38.2 Tamil and Bilingual(T/E)
Mediums157 1.5
Grade 6-11 20 0.2 2,587 0.1 266 0.1 Trilingual (Sinhala, Tamil
and Bilingual (S/E and/or
T/E) Mediums)
33 0.3
Grade 6-13 983 9.7 941,629 23.2 54,759 21.9
located outside the
estate66 0.6 44,076 1.1 2,315 0.9
located inside the estate 799 7.9 167,211 4.1 11,397 4.6
3. Summary Statistics of Government Schools -2020
Schools by Language medium/s of Instruction
School by Fuctional Grade Span
School by Gender of the School
Ethnicity of the School
Plantation Estate Schools1AB - Schools having Science Stream classes in Advanced Level1C - Schools having Advanced Level classes Other than Science StreamType 2 - School Having classes only up to Grade 11Type 3 - School Having classes up to Grade 5 or Grade 8
Page 3

Category No. of
Schools %
No. of
Students %
No. of
Teachers % Category
No. of
Schools %
No. of
Students %
No. of
Teachers %
3. Summary Statistics of Government Schools -2020
School by Gender of the School ***
Municial Council 622 6.1 652,963 16.1 34,614 13.9 Bio Science 957 41,795 9.9
Urban Council (UC)
Area412 4.1 385,733 9.5 19,649 7.9 Physical Science 920 47,328 11.2
Pradesiya Sabha (PS)
Area9,121 89.8 3,024,989 74.4 195,231 78.3 Arts 2,910 181,837 43.2
Commerce 1,871 90,243 21.4
Technology 512 46,291 11.0
1-50 Students 1,439 14.1 42,792 1.1 9,021 3.6 Other 346 13,620 3.2
51-100 Students 1,523 15.0 113,125 2.8 15,423 6.2
101-200 Students 2,169 21.3 317,607 7.8 30,533 12.2
201-500 Students 2,690 26.4 863,229 21.2 58,225 23.3
501-1,000 Students 1,404 13.8 972,049 23.9 52,908 21.2
1,001-1,500
Students398 3.9 480,791 11.8 24,243 9.7 Less than 10 Teachers 3,044 30.0 219,811 5.4 19,638 7.9
1,501-2,000
Students215 2.1 368,325 9.1 18,117 7.3 10-25 Teachers 4,218 41.5 976,970 24.0 73,684 29.5
2,001-3,000
Students212 2.1 506,501 12.5 23,458 9.4 26-50 Teachers 1,867 18.4 1,073,315 26.4 65,361 26.2
3,001-4,000
Students73 0.7 248,472 6.1 10,927 4.4 51-100 Teachers 752 7.4 1,005,254 24.7 52,734 21.1
More than 4,000
Students32 0.3 150,794 3.7 6,639 2.7 More than 100 Teachers 274 2.7 788,335 19.4 38,077 15.3
Source : School Census 2020
*** A/L Students
Schools by No. of Teachers
Schools by Student Population
School by Local Government Area Schools by A/L Stream
Page 4

Category Total
Students % Male % Female % Category
Total
Students % Male % Female %
All Government
Schools4,063,685 2,018,151 49.7 2,045,534 50.3 Type of School
1AB Schools 1,570,640 38.7 767,339 48.9 803,301 51.1
Level of School 1C Schools 1,076,629 26.5 524,388 48.7 552,241 51.3
National Schools 796,812 19.6 412,783 51.8 384,029 48.2 Type 2 Schools 750,726 18.5 383,708 51.1 367,018 48.9
Provincial Schools 3,266,873 80.4 1,605,368 49.1 1,661,505 50.9 Type 3 Schools 665,690 16.4 342,716 51.5 322,974 48.5
Primary Cycle (Grade
1-5)1,640,647 40.4 830,358 50.6 810,289 49.4
Junior Secondary
Cycle (Grade 6-9)1,357,437 33.4 680,349 50.1 677,088 49.9
Sinhala Medium
Only2,978,133 73.3 1,485,384 49.9 1,492,749 50.1
Senior Secondary O/L
Cycle (Grade 10-11)*636,985 15.7 315,081 49.5 321,904 50.5
Tamil Medium
Only986,156 24.3 489,380 49.6 496,776 50.4
Senior Secondary A/L
Cycle (Grade 12-13)421,114 10.4 187,804 44.6 233,310 55.4
Bilingual Medium
** 99,396 2.4 43,387 43.7 56,009 56.3
Special Edu. Units 7,502 0.2 4,559 60.8 2,943 39.2
Sinhala Schools 3,051,509 75.1 1,518,424 49.8 1,533,085 50.2 Bio Science 41,795 9.9 11,888 28.4 29,907 71.6
Tamil Schools 583,016 14.3 291,271 50.0 291,745 50.0 Physical Science 47,328 11.2 28,996 61.3 18,332 38.7
Muslim Schools 429,160 10.6 208,456 48.6 220,704 51.4 Arts 181,837 43.2 61,976 34.1 119,861 65.9
Commerce 90,243 21.4 43,481 48.2 46,762 51.8
Located outside the
estate44,076 1.1 22,334 50.7 21,742 49.3 Technology 46,291 11.0 33,036 71.4 13,255 28.6
Located inside the
estate167,211 4.1 83,439 49.9 83,772 50.1 Other 13,620 3.2 8,427 61.9 5,193 38.1
Source : School Census 2020
4. Summary Statistics of Government Schools by Students - 2020
Remarks: * - Grade 11 Repeaters are included. / **-Included both Sinhala-English &
Tamil-English
Students by Grade of Studying
Ethnicity of the School Established
Students by Language medium/s study
Students by A/L Stream
Plantation Estate Schools
Page 5
Category Total
Teachers
% of
Total Male
Male
% Female
Female
% Category
Total
Teachers
% of
Total Male
Male
% Female
Female
%
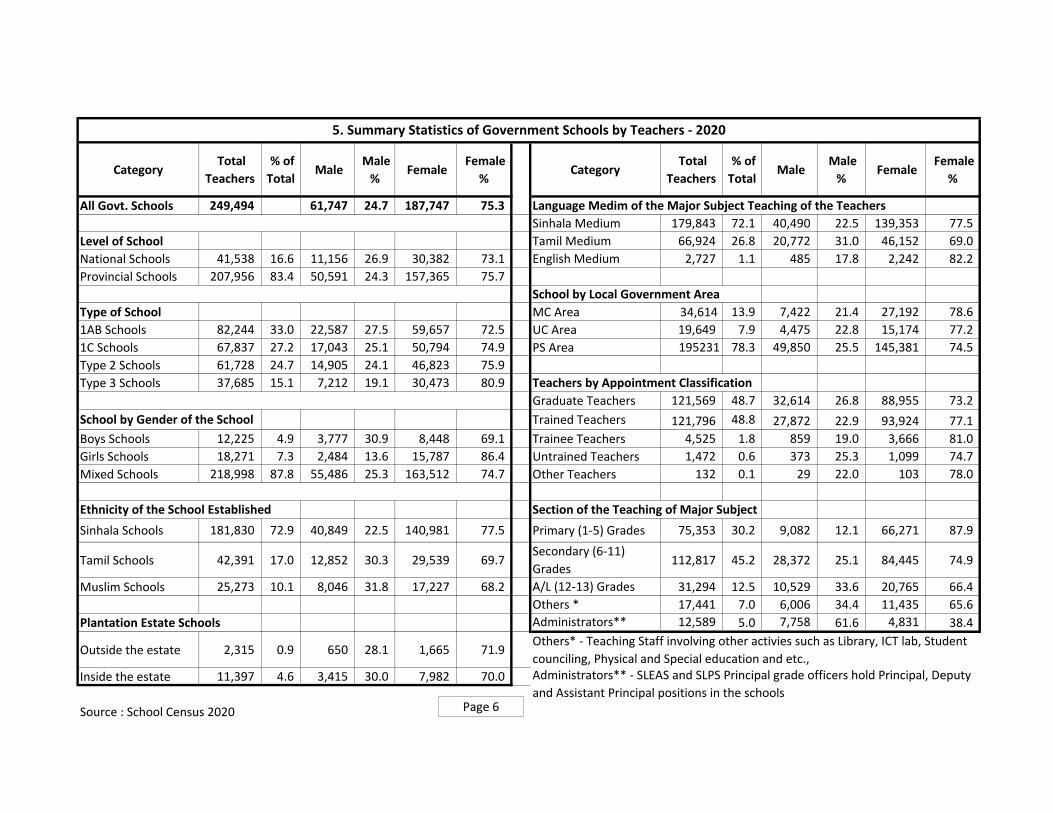
All Govt. Schools 249,494 61,747 24.7 187,747 75.3 Language Medim of the Major Subject Teaching of the Teachers
Sinhala Medium 179,843 72.1 40,490 22.5 139,353 77.5
Level of School Tamil Medium 66,924 26.8 20,772 31.0 46,152 69.0
National Schools 41,538 16.6 11,156 26.9 30,382 73.1 English Medium 2,727 1.1 485 17.8 2,242 82.2
Provincial Schools 207,956 83.4 50,591 24.3 157,365 75.7
School by Local Government Area
Type of School MC Area 34,614 13.9 7,422 21.4 27,192 78.6
1AB Schools 82,244 33.0 22,587 27.5 59,657 72.5 UC Area 19,649 7.9 4,475 22.8 15,174 77.2
1C Schools 67,837 27.2 17,043 25.1 50,794 74.9 PS Area 195231 78.3 49,850 25.5 145,381 74.5
Type 2 Schools 61,728 24.7 14,905 24.1 46,823 75.9
Type 3 Schools 37,685 15.1 7,212 19.1 30,473 80.9 Teachers by Appointment Classification
Graduate Teachers 121,569 48.7 32,614 26.8 88,955 73.2
School by Gender of the School Trained Teachers 121,796 48.8 27,872 22.9 93,924 77.1
Boys Schools 12,225 4.9 3,777 30.9 8,448 69.1 Trainee Teachers 4,525 1.8 859 19.0 3,666 81.0
Girls Schools 18,271 7.3 2,484 13.6 15,787 86.4 Untrained Teachers 1,472 0.6 373 25.3 1,099 74.7
Mixed Schools 218,998 87.8 55,486 25.3 163,512 74.7 Other Teachers 132 0.1 29 22.0 103 78.0
Ethnicity of the School Established Section of the Teaching of Major Subject
Sinhala Schools 181,830 72.9 40,849 22.5 140,981 77.5 Primary (1-5) Grades 75,353 30.2 9,082 12.1 66,271 87.9
Tamil Schools 42,391 17.0 12,852 30.3 29,539 69.7 Secondary (6-11)
Grades112,817 45.2 28,372 25.1 84,445 74.9
Muslim Schools 25,273 10.1 8,046 31.8 17,227 68.2 A/L (12-13) Grades 31,294 12.5 10,529 33.6 20,765 66.4
Others * 17,441 7.0 6,006 34.4 11,435 65.6
Plantation Estate Schools Administrators** 12,589 5.0 7,758 61.6 4,831 38.4
Outside the estate 2,315 0.9 650 28.1 1,665 71.9
Inside the estate 11,397 4.6 3,415 30.0 7,982 70.0
Source : School Census 2020
5. Summary Statistics of Government Schools by Teachers - 2020
Others* - Teaching Staff involving other activies such as Library, ICT lab, Student
counciling, Physical and Special education and etc.,Administrators** - SLEAS and SLPS Principal grade officers hold Principal, Deputy
and Assistant Principal positions in the schoolsPage 6

Total % of
Total
No. of
Males
Male
%
No. of
Females
Female
% Total
% of
Total
No. of
Males
Male
%
No. of
Females
Female
%
No. of Schools 10,155 373 3.7 9,782 96.3
No. of Students 4,063,685 796,812 19.6 412,783 51.8 384,029 48.2 3,266,873 80.4 1,605,368 49.1 1,661,505 50.9
No. of Teachers 249,494 41,538 16.6 11,156 26.9 30,382 73.1 207,956 83.4 50,591 24.3 157,365 75.7
Grade 1 Admissions 319,405 25,672 8.0 13,686 53.3 11,986 46.7 293,733 92.0 148,167 50.4 145,566 49.6
1AB Schools
No. of Schools 1,000 348 34.8 652 65.2
No. of Students 1,570,640 776,994 49.5 402,560 51.8 374,434 48.2 793,646 50.5 364,779 46.0 428,867 54.0
No. of Teachers 82,244 40,110 48.8 10,780 26.9 29,330 73.1 42,134 51.2 11,807 28.0 30,327 72.0
Grade 1 Admissions 46,539 24,878 53.5 13,326 53.6 11,552 46.4 21,661 46.5 9,561 44.1 12,100 55.9
1C Schools
No. of Schools 1,932 24 1.2 1,908
No. of Students 1,076,629 19,789 1.8 10,194 51.5 9,595 48.5 1,056,840 98.2 514,194 48.7 542,646 51.3
No. of Teachers 67,837 1,415 2.1 369 26.1 1,046 73.9 66,422 97.9 16,674 25.1 49,748 74.9
Grade 1 Admissions 72,732 794 1.1 360 45.3 434 54.7 71,938 98.9 35,745 49.7 36,193 50.3
Type 2 Schools
No. of Schools 3,224 1 0.0 3,223
No. of Students 750,726 29 0.0 29 100.0 - - 750,697 100.0 383,679 51.1 367,018 48.9
No. of Teachers 61,728 13 0.0 7 53.8 6 46.2 61,715 100.0 14,898 24.1 46,817 75.9
Grade 1 Admissions 70,125 - - - - - - 70,125 100.0 35,947 51.3 34,178 48.7
Type 3 Schools
No. of Schools 3,999 - - 3,999
No. of Students 665,690 - - - - - - 665,690 100.0 342,716 51.5 322,974 48.5
No. of Teachers 37,685 - - - - - - 37,685 100.0 7,212 19.1 30,473 80.9
Grade 1 Admissions 130,009 - - - - - - 130,009 100.0 66,914 51.5 63,095 48.5
Source : School Census 2020
Schools by Type of School
Subject
6. Comparision of Basic Statistics of National and Provincial Schools -2020
All Government Schools
National Schools Provincial Schools
All Govt.
Schools
Page 7

Subject
Schools
Have
Grade 1
Grd 1
Students
% of
Total
Grd 1 Male
Students Male %
Grd 1
Female
Students
Female
%
NO Grade 1
Applications/
Admissions
All Government Schools 9,148 319,405 161,853 50.7 157,552 49.3 95
Level of School
National Schools 178 25,672 8.0 13,686 53.3 11,986 46.7 0
Provincial Schools 8,970 293,733 92.0 148,167 50.4 145,566 49.6 95
Type of School
1AB Schools 383 46,539 14.6 22,887 49.2 23,652 50.8 0
1C Schools 1,563 72,732 22.8 36,105 49.6 36,627 50.4 1
Type 2 Schools 3,203 70,125 22.0 35,947 51.3 34,178 48.7 27
Type 3 Schools 3,999 130,009 40.7 66,914 51.5 63,095 48.5 67
Sinhala Medium 6,184 239,336 74.9 121,355 50.7 117,981 49.3 61
Tamil Medium 2,964 80,069 25.1 40,498 50.6 39,571 49.4 34
Sinhala Schools 6,171 238,401 74.6 121,012 50.8 117,389 49.2 61
Tamil Schools 2,127 44,404 13.9 22,709 51.1 21,695 48.9 32
Muslim Schools 850 36,600 11.5 18,132 49.5 18,468 50.5 2
MC/UC Area 899 64,305 20.1 32,230 50.1 32,075 49.9 5
PS Area 8,249 255,100 79.9 129,623 50.8 125,477 49.2 90
1-50 Students 1,431 8,374 2.6 4,342 51.9 4,032 48.1 86
51-100 Students 1,505 18,126 5.7 9,422 52.0 8,704 48.0 7
101-200 Students 2,119 40,500 12.7 20,759 51.3 19,741 48.7 2
201-500 Students 2,439 87,585 27.4 45,049 51.4 42,536 48.6
501-1,000 Students 1,068 83,040 26.0 41,704 50.2 41,336 49.8
More than 1,000 Students 586 81,780 25.6 40,577 49.6 41,203 50.4
Source : School Census 2020
7. Grade 1 Admission Related Statistics of Government Schools -2020
Ethnicity of the School Established
Language medium of study
School by Local Government Area
Schools by Student Population
Page 8

National Provincial 1AB 1C Type 2 Type 3
1-50 1 1,438 - 2 120 1,317 1,439 14.2
51-100 - 1,523 - 28 528 967 1,523 15.0
101-200 - 2,169 2 171 1,186 810 2,169 21.3
201-500 8 2,682 105 849 1,174 562 2,690 26.5
501-1,000 57 1,347 264 673 170 297 1,404 13.8
1,001-1,500 57 341 186 146 28 38 398 3.9
1,501-2,000 66 149 150 48 9 8 215 2.1
2,001-3,000 104 108 190 15 7 - 212 2.1
3,001-4,000 51 22 71 - 2 - 73 0.7
Above 4,000 29 3 32 - - - 32 0.3
Grd 1-5 Grd 1-8 Grd 1-11 Grd 1-13 Grd 6-11 Grd 6-13
1-50 1,286 31 114 1 6 1 1,439
51-100 939 28 523 15 5 13 1,523
101-200 773 37 1,181 128 5 45 2,169
201-500 547 15 1,171 708 3 246 2,690
501-1,000 294 3 169 603 1 334 1,404
1,001-1,500 38 - 28 174 - 158 398
1,501-2,000 7 1 9 115 - 83 215
2,001-3,000 - - 7 124 - 81 212
3,001-4,000 - - 2 55 - 16 73
Above 4,000 - - - 26 - 6 32
Source : School Census 2020
%
8. Government Schools by Size of Student Population -2020
TotalGrade SpanStudent
Population
Type of School Total
Student
Population
Level of School
1-50
51-100
101-200201-500
501-1,000
1,001-1,500
1,501-2,000
2,001-3,000
3,001-4,000
Above 4,000
F2: Government Schools by Size of Student Population -2020
Page 9

National Provincial 1AB 1C Type 2 Type 3
Less 10 - 3,044 - 2 92 2,950 3,044
10-25 1 4,217 11 551 2,769 887 4,218
26-50 14 1,853 246 1,133 333 155 1,867
51-100 156 596 477 240 28 7 752
More than 100 202 72 266 6 2 - 274
Grd 1-5 Grd 1-8 Grd 1-11 Grd 1-13 Grd 6-11 Grd 6-13
Less 10 2,904 46 88 - 4 2 3,044
10-25 820 67 2,753 442 16 120 4,218
26-50 154 1 333 955 - 424 1,867
51-100 6 1 28 374 - 343 752
More than 100 - - 2 178 - 94 274
Source : School Census 2020
9. Government Schools by Size of Teacher Population -2020
No of TeachersGrade Span
Total
No of TeachersLevel of School Type of School
Total
Page 10
-
1,000
2,000
3,000
4,000
5,000
Less 10 10-25 26-50 51-100 More than100
F3: Schools by Type of School and No. of Teachers - 2020
Type 3
Type 2
1C
1AB
-
1,000
2,000
3,000
4,000
5,000
Grd 1-5 Grd 1-8 Grd 1-11 Grd 1-13 Grd 6-11 Grd 6-13
F4: Schools by Grade Span of the School and No. of Teachers -2020
Less 10 10-25 26-50 51-100 More than 100

Grade Total
Students
Male
Students %
Female
Students %
Sinhala
Medium %
Tamil
Medium %
Bilingual
Medium %
Grade 1 319,405 161,853 50.7 157,552 49.3 239,236 74.9 80,169 25.1 - -
Grade 2 333,128 168,701 50.6 164,427 49.4 247,248 74.2 85,880 25.8 - -
Grade 3 329,172 166,553 50.6 162,619 49.4 245,318 74.5 83,854 25.5 - -
Grade 4 333,714 168,609 50.5 165,105 49.5 248,264 74.4 85,450 25.6 - -
Grade 5 325,228 164,642 50.6 160,586 49.4 241,191 74.2 84,037 25.8 - -
Primary Cycle
(Grd 1-5)1,640,647 830,358 50.6 810,289 49.4 1,221,257 74.4 419,390 25.6 -
-
Grade 6 331,910 166,564 50.2 165,346 49.8 233,134 70.2 80,187 24.2 18,589 5.6
Grade 7 345,307 173,462 50.2 171,845 49.8 244,052 70.7 83,278 24.1 17,977 5.2
Grade 8 344,391 172,448 50.1 171,943 49.9 243,762 70.8 85,354 24.8 15,275 4.4
Grade 9 335,829 167,875 50.0 167,954 50.0 238,720 71.1 83,243 24.8 13,866 4.1
Junior Secondary Cycle
(Grd 6-9)1,357,437 680,349 50.1 677,088 49.9 959,668 70.7 332,062 24.5 65,707 4.8
Grade 10 321,885 160,118 49.7 161,767 50.3 232,320 72.2 77,101 24.0 12,464 3.9
Grade 11 305,566 150,279 49.2 155,287 50.8 225,547 73.8 68,306 22.4 11,713 3.8
Grade 11 -2nd Attempt 9,534 4,684 49.1 4,850 50.9 3,485 36.6 6,023 63.2 26 0.3
Senior Secondary O/L
Cycle (Grd 10-11)*636,985 315,081 49.5 321,904 50.5 461,352 72.4 151,430 23.8 24,203 3.8
Grade 12 (A/L 2022) 218,191 97,987 44.9 120,204 55.1 171,505 78.6 41,698 19.1 4,988 2.3
Grade 13 (A/L 2021) 202,923 89,817 44.3 113,106 55.7 159,081 78.4 39,344 19.4 4,498 2.2
Senior Secondary A/L
Cycle (Grd 12-13)421,114 187,804 44.6 233,310 55.4 330,586 78.5 81,042 19.2 9,486 2.3
Special Education Unit 7,502 4,559 60.8 2,943 39.2 5,270 70.2 2,232 29.8 - -
All Students 4,063,685 2,018,151 49.7 2,045,534 50.3 2,978,133 73.3 986,156 24.3 99,396 2.4
* - included repeaters
Source : School Census 2020
10. Grade-wise Students of Government Schools by Sex and Medium of Study -2020
Page 11

-
50,000
100,000
150,000
200,000
250,000
300,000
350,000
Grade 1 Grade 2 Grade 3 Grade 4 Grade 5 Grade 6 Grade 7 Grade 8 Grade 9 Grade 10 Grade 11 Grade 11 -2nd
Attempt
Grade 12(A/L 2022)
Grade 13(A/L 2021)
SpecialEducation
Unit
F5: Students of Government Schools by Grade and Sex -2020
Male Students Female Students
0%
10%
20%
30%
40%
50%
60%
70%
80%
90%
100%
Grade 1 Grade 2 Grade 3 Grade 4 Grade 5 Grade 6 Grade 7 Grade 8 Grade 9 Grade 10 Grade 11 Grade 11 -2nd
Attempt
Grade 12(A/L 2022)
Grade 13(A/L 2021)
SpecialEducation
Unit
F6: Students of Government Schools by Grade and Medium -2020
Sinhala Medium Tamil Medium Bilingual
Page 12

Level of School Graduate
teachers
Trained
teachers
Trainee
teachers
Untrained
teachers
Other
teachers
Total
Teachers
National 19,765 21,327 311 114 21 41,538
Provincial 101,804 100,469 4,214 1,358 111 207,956
Total 121,569 121,796 4,525 1,472 132 249,494
Type of School Graduate
teachers
Trained
teachers
Trainee
teachers
Untrained
teachers
Other
teachers
Total
Teachers
1AB 45,467 35,656 820 271 30 82,244
1C 35,226 31,042 1,205 331 33 67,837
Type 2 27,539 32,217 1,450 483 39 61,728
Type 3 13,337 22,881 1,050 387 30 37,685
Total 121,569 121,796 4,525 1,472 132 249,494
Grade Span Graduate
teachers
Trained
teachers
Trainee
teachers
Untrained
teachers
Other
teachers
Total
Teachers
Grd 1-5 12,882 22,195 983 346 26 36,432
Grd 1-8 430 761 27 31 4 1,253
Grd 1-11 27,287 32,229 1,430 477 39 61,462
Grd 1-13 48,713 44,499 1,638 423 49 95,322
Grd 6-11 148 102 16 - - 266
Grd 6-13 32,109 22,010 431 195 14 54,759
Total 121,569 121,796 4,525 1,472 132 249,494
Source : School Census 2020
11. Teachers of Government Schools by Appointment Category -2020
0%
20%
40%
60%
80%
100%
1AB 1C Type 2 Type 3
F7: Teachers of Govt. Schools by Appointment Category and Type of School -2020
Graduate teachers Trained teachers Trainee teachers
Untrained teachers Other teachers
Page 13
0%
20%
40%
60%
80%
100%
Grd 1-5 Grd 1-8 Grd 1-11 Grd 1-13 Grd 6-11 Grd 6-13
F8: Teachers of Govt. Schools by Appointment Category and Grade Span of the School - 2020
1AB - Schools having Science Stream classes in Advanced Level1C - Schools having Advanced Level classes Other than Science StreamType 2 - School Having classes only up to Grade 11Type 3 - School Having classes up to Grade 5 or Grade 8

Category No. of
Schools
No. of
Students
No. of
Teachers STR Category
No. of
Schools
No. of
Students
No. of
Teachers STR
All Government Schools 10,155 4,063,685 249,494 16.3
Level of School 1-50 Students 1,439 42,792 9,021 4.7
National Schools 373 796,812 41,538 19.2 51-100 Students 1,523 113,125 15,423 7.3
Provincial Schools 9,782 3,266,873 207,956 15.7 101-200 Students 2,169 317,607 30,533 10.4
201-500 Students 2,690 863,229 58,225 14.8
Type of School 501-1,000 Students 1,404 972,049 52,908 18.4
1AB Schools 1,000 1,570,640 82,244 19.1 1,001-1,500 Students 398 480,791 24,243 19.8
1C Schools 1,932 1,076,629 67,837 15.9 1,501-2,000 Students 215 368,325 18,117 20.3
Type 2 Schools 3,224 750,726 61,728 12.2 2,001-3,000 Students 212 506,501 23,458 21.6
Type 3 Schools 3,999 665,690 37,685 17.7 3,001-4,000 Students 73 248,472 10,927 22.7
More than 4,000 Students 32 150,794 6,639 22.7
Sinhala Schools 6,915 3,051,509 181,830 16.8
Tamil Schools 2,301 583,016 42,391 13.8
Muslim Schools 939 429,160 25,273 17.0
Located outside the estate 66 44,076 2,315 19.0
Located inside the estate 799 167,211 11,397 14.7
Source : School Census 2020
Schools by Student Population
Plantation Estate Schools
12. Student Teacher Ratios (STRs) of Government Schools -2020
Ethnicity of the School
1AB - Schools having Science Stream classes in Advanced Level1C - Schools having Advanced Level classes Other than Science StreamType 2 - School Having classes only up to Grade 11Type 3 - School Having classes up to Grade 5 or Grade 8
Page 14
4.77.3
10.4
14.8
18.419.8 20.3
21.6 22.7 22.7
0.0
5.0
10.0
15.0
20.0
25.0
F9: Comparision of STR of Govt. Schools by Size of Student Population -2020

2School Census -2020 Summary Statistics of
All Government Schools by Province


Province Total No.
of Schools %
Total No.
of Students %
Total No.
of
Teachers
%
Average
Students per
School
Average
Teachers per
School
1. Western 1,355 13.3 927,877 22.8 46,139 18.5 685 34.1
2. Central 1,518 14.9 537,973 13.2 35,067 14.1 354 23.1
3. Southern 1,107 10.9 517,397 12.7 31,504 12.6 467 28.5
4. Northern 985 9.7 223,333 5.5 18,724 7.5 227 19.0
5. Eastern 1,115 11.0 378,841 9.3 24,005 9.6 340 21.5
6. North Western 1,245 12.3 503,153 12.4 29,866 12.0 404 24.0
7. North Central 815 8.0 297,731 7.3 17,387 7.0 365 21.3
8. Uva 896 8.8 287,823 7.1 20,796 8.3 321 23.2
9. Sabaragamuwa 1,119 11.0 389,557 9.6 26,006 10.4 348 23.2
Total 10,155 100.0 4,063,685 100.0 249,494 100.0 400 24.6
Source : School Census 2020
13. Basic Statistics of Government Schools by Province -2020
22.8%
13.2%
12.7%5.5%
9.3%
12.4%
7.3%
7.1%
9.6%
F10: Students of Government Schools by Province -2020
1. Western
2. Central
3. Southern
4. Northern
5. Eastern
6. North Western
7. North Central
8. Uva
9. Sabaragamuwa
18.5%
14.1%
12.6%
7.5%9.6%
12.0%
7.0%
8.3%
10.4%
F11: Teachers of Government Schools by Province - 2020
Page 15

Total National Provincial Total National
% of
Students in
National
Schools
Provincial Total National
% of
Teachers in
National
Schools
Provincial
1. Western 1,355 74 1,281 927,877 219,592 23.7 708,285 46,139 10,394 22.5 35,745
2. Central 1,518 54 1,464 537,973 89,133 16.6 448,840 35,067 5,128 14.6 29,939
3. Southern 1,107 67 1,040 517,397 156,262 30.2 361,135 31,504 7,336 23.3 24,168
4. Northern 985 22 963 223,333 28,538 12.8 194,795 18,724 1,957 10.5 16,767
5. Eastern 1,115 40 1,075 378,841 66,267 17.5 312,574 24,005 3,851 16.0 20,154
6. North Western 1,245 37 1,208 503,153 81,103 16.1 422,050 29,866 4,362 14.6 25,504
7. North Central 815 15 800 297,731 33,725 11.3 264,006 17,387 1,622 9.3 15,765
8. Uva 896 36 860 287,823 50,994 17.7 236,829 20,796 3,130 15.1 17,666
9. Sabaragamuwa 1,119 28 1,091 389,557 71,198 18.3 318,359 26,006 3,758 14.5 22,248
Total 10,155 373 9,782 4,063,685 796,812 19.6 3,266,873 249,494 41,538 16.6 207,956
Source : School Census 2020
14. Basic Statistics of National and Provincial Schools by Province - 2020
No. of Schools No. of Students No. of Teachers
Province
-
100,000
200,000
300,000
400,000
500,000
600,000
700,000
800,000
900,000
1,000,000
National Provincial
0%
20%
40%
60%
80%
100%
F12: Students of National & Provincial Schools by Province -2020
F13: Percentage of Teachers of National & Provincial Schools by Province -2020
Page 16
1AB 1C Type 2 Type 3
1. Western 187 273 445 450 1,355
2. Central 113 323 458 624 1,518
3. Southern 147 230 318 412 1,107
4. Northern 106 129 289 461 985
5. Eastern 107 189 351 468 1,115
6. North Western 103 270 416 456 1,245
7. North Central 61 136 219 399 815
8. Uva 76 192 296 332 896
9. Sabaragamuwa 100 190 432 397 1,119
Total 1,000 1,932 3,224 3,999 10,155
Source : School Census 2020
1AB % 1C % Type 2 % Type 3 %
1. Western 430,184 46.4 228,850 24.7 145,112 15.6 123,731 13.3 927,877
2. Central 176,424 32.8 169,656 31.5 98,569 18.3 93,324 17.3 537,973
3. Southern 237,389 45.9 122,078 23.6 68,283 13.2 89,647 17.3 517,397
4. Northern 87,676 39.3 42,898 19.2 52,627 23.6 40,132 18.0 223,333
5. Eastern 126,244 33.3 98,132 25.9 90,633 23.9 63,832 16.8 378,841
6. North Western 176,427 35.1 156,411 31.1 96,288 19.1 74,027 14.7 503,153
7. North Central 97,974 32.9 77,075 25.9 53,725 18.0 68,957 23.2 297,731
8. Uva 93,970 32.6 87,038 30.2 56,014 19.5 50,801 17.7 287,823
9. Sabaragamuwa 144,352 37.1 94,491 24.3 89,475 23.0 61,239 15.7 389,557
Total 1,570,640 38.7 1,076,629 26.5 750,726 18.5 665,690 16.4 4,063,685
Source : School Census 2020
15. Government Schools by Type of School and Province -2020
15A. Students of Government Schools by Type of School and Province - 2020
Province TotalType of School
ProvinceType of School
Total
-
200
400
600
800
1,000
1,200
1,400
1,600
1AB 1C Type 2 Type 3
F14: Type of Schools by Province -2020
Page 17

1AB % 1C % Type 2 % Type 3 %
1. Western 19,597 42.5 11,718 25.4 9,378 20.3 5,446 11.8 46,139
2. Central 9,658 27.5 11,151 31.8 8,603 24.5 5,655 16.1 35,067
3. Southern 11,977 38.0 8,224 26.1 6,616 21.0 4,687 14.9 31,504
4. Northern 6,299 33.6 3,825 20.4 5,503 29.4 3,097 16.5 18,724
5. Eastern 7,333 30.5 6,188 25.8 6,640 27.7 3,844 16.0 24,005
6. North Western 9,037 30.3 9,213 30.8 7,387 24.7 4,229 14.2 29,866
7. North Central 4,811 27.7 4,720 27.1 4,081 23.5 3,775 21.7 17,387
8. Uva 5,454 26.2 6,488 31.2 5,547 26.7 3,307 15.9 20,796
9. Sabaragamuwa 8,078 31.1 6,310 24.3 7,973 30.7 3,645 14.0 26,006
Total 82,244 33.0 67,837 27.2 61,728 24.7 37,685 15.1 249,494
Source : School Census 2020
Province Total
15B. Teachers of Government Schools by Type of School and Province - 2020
Type of School
0%
20%
40%
60%
80%
100%
1AB 1C Type 2 Type 3
0%
20%
40%
60%
80%
100%
1AB 1C Type 2 Type 3
F16: Teachers by Type of School and Province -2020F15: Students by Type of School and Province -2020
Page 18
Boys Girls Mixed Total Boys Schs Girls Schs Mixed Schs Total Boys Schs Girls Schs Mixed Schs Total
1. Western 57 91 1,207 1,355 111,138 156,166 660,573 927,877 5,105 7,005 34,029 46,139
2. Central 21 33 1,464 1,518 35,186 56,230 446,557 537,973 1,904 2,764 30,399 35,067
3. Southern 13 18 1,076 1,107 32,283 40,443 444,671 517,397 1,552 1,844 28,108 31,504
4. Northern 16 28 941 985 11,443 22,188 189,702 223,333 857 1,567 16,300 18,724
5. Eastern 21 42 1,052 1,115 20,264 42,893 315,684 378,841 1,083 2,311 20,611 24,005
6. North Western 9 14 1,222 1,245 16,737 25,040 461,376 503,153 790 1,063 28,013 29,866
7. North Central 1 2 812 815 3,068 5,497 289,166 297,731 154 275 16,958 17,387
8. Uva 3 7 886 896 4,502 10,332 272,989 287,823 238 582 19,976 20,796
9. Sabaragamuwa 4 6 1,109 1,119 10,482 18,355 360,720 389,557 542 860 24,604 26,006
Total 145 241 9,769 10,155 245,103 377,144 3,441,438 4,063,685 12,225 18,271 218,998 249,494
Source : School Census 2020
16. Basic Statistics of Government Schools by Gender of the School and Province -2020
ProvinceSchools Students Teachers
0%
20%
40%
60%
80%
100%
F17: Students by Gender of the School and Province -2020
Boys Schs Girls Schs Mixed Schs
0%
20%
40%
60%
80%
100%
F18: Teachers by Gender of the School and Province -2020
Boys Schs Girls Schs Mixed Schs
Page 19

Sinhala
Only
Tamil
Only
Both
Sinhala &
Tamil
Both
Sinhala &
Bilingual
(S/E)
Both
Tamil &
Bilingual
(T/E)
Trilingual
(Sinhala, Tamil
& Bilingual (S/E
and/or T/E)
1. Western 1,072 109 16 132 12 14 1,355 1,181 87.2
2. Central 856 541 11 77 19 14 1,518 1,397 92.0
3. Southern 977 39 5 84 2 1,107 1,016 91.8
4. Northern 28 907 49 1 985 935 94.9
5. Eastern 258 799 1 10 47 1,115 1,057 94.8
6. North Western 990 157 7 80 10 1 1,245 1,147 92.1
7. North Central 692 93 29 1 815 785 96.3
8. Uva 638 200 49 8 1 896 838 93.5
9. Sabaragamuwa 846 197 2 63 9 2 1,119 1,043 93.2
Total 6,357 3,042 42 524 157 33 10,155 9,399 92.6
Source : School Census 2020
17. Government Schools by Language Medium of Instruction and Province - 2020
Province
Language Medium of Instruction
Total
One
Language
Only
%
0%
10%
20%
30%
40%
50%
60%
70%
80%
90%
100%
Trilingual (Sinhala, Tamil & Bilingual(S/E and/or T/E)Both Tamil & Bilingual (T/E)
Both Sinhala & Bilingual (S/E)
Both Sinhala & Tamil
Tamil Only
Sinhala Only
F19: Schools by Language Medium of Instruction and Province -2020
Page 20

Grd 1-5 Grd 1-8 Grd 1-11 Grd 6-11 Grd 1-13 Grd 6-13
1. Western 443 7 436 9 332 128 1,355
2. Central 607 17 457 1 279 157 1,518
3. Southern 409 3 314 4 250 127 1,107
4. Northern 456 5 288 1 152 83 985
5. Eastern 455 13 349 2 189 107 1,115
6. North Western 427 29 416 278 95 1,245
7. North Central 390 9 219 114 83 815
8. Uva 316 16 295 1 179 89 896
9. Sabaragamuwa 381 16 430 2 176 114 1,119
Total 3,884 115 3,204 20 1,949 983 10,155
% 38.2 1.1 31.6 0.2 19.2 9.7 100.0
Source : School Census 2020
18. Government Schools by Grade Span of the School and Province -2020
ProvinceGrade Span
Total
-
200
400
600
800
1,000
1,200
1,400
1,600
Grd 6-13
Grd 1-13
Grd 6-11
Grd 1-11
Grd 1-8
Grd 1-5
F20: Government Schools by Grade Span of the School and Province -2020
Page 21

Grd 1-5 Grd 1-8 Grd 1-11 Grd 6-11 Grd 1-13 Grd 6-13
1. Western 122,139 1,592 143,439 1,673 482,823 176,211 927,877
2. Central 91,528 1,796 98,515 54 220,247 125,833 537,973
3. Southern 89,431 216 67,926 357 228,510 130,957 517,397
4. Northern 39,782 350 52,523 104 77,405 53,169 223,333
5. Eastern 61,875 1,957 90,399 234 141,789 82,587 378,841
6. North Western 69,781 4,246 96,288 233,547 99,291 503,153
7. North Central 65,737 3,220 53,725 78,430 96,619 297,731
8. Uva 49,591 1,210 55,989 25 105,848 75,160 287,823
9. Sabaragamuwa 59,855 1,384 89,335 140 137,041 101,802 389,557
Total 649,719 15,971 748,139 2,587 1,705,640 941,629 4,063,685
% 16.0 0.4 18.4 0.1 42.0 23.2 100.0
Source : School Census 2020
Grd 1-5 Grd 1-8 Grd 1-11 Grd 6-11 Grd 1-13 Grd 6-13
1. Western 5,360 86 9,243 135 22,707 8,608 46,139
2. Central 5,490 165 8,593 10 12,958 7,851 35,067
3. Southern 4,653 34 6,571 45 12,733 7,468 31,504
4. Northern 3,051 46 5,484 19 6,078 4,046 18,724
5. Eastern 3,705 139 6,618 22 8,431 5,090 24,005
6. North Western 3,905 324 7,387 12,750 5,500 29,866
7. North Central 3,619 156 4,081 4,489 5,042 17,387
8. Uva 3,142 165 5,535 12 7,164 4,778 20,796
9. Sabaragamuwa 3,507 138 7,950 23 8,012 6,376 26,006
Total 36,432 1,253 61,462 266 95,322 54,759 249,494
% 14.6 0.5 24.6 0.1 38.2 21.9 100.0
Source : School Census 2020
ProvinceGrade Span
Total
ProvinceGrade Span
Total
18A. Students of Government Schools by Grade Span of the School and Province -2020
18B. Teachers of Government Schools by Grade Span of the School and Province -2020
Page 22

Province 50 or
Less 51-100
101-
200
201-
500
501-
1,000
1,001-
1,500
1,501-
2,000
2,001-
3,000
3,001-
4,000
Above
4,000 Total
Above
1,000
1. Western 76 129 254 345 276 101 56 70 35 13 1,355 275
2. Central 226 259 321 403 203 49 23 24 7 3 1,518 106
3. Southern 116 152 257 296 149 60 28 30 13 6 1,107 137
4. Northern 259 186 199 230 84 13 7 7 985 27
5. Eastern 156 166 233 333 156 35 20 15 1 1,115 71
6. North Western 127 185 296 349 171 51 32 24 7 3 1,245 117
7. North Central 111 138 167 225 122 18 16 11 4 3 815 52
8. Uva 151 137 201 225 132 23 14 9 3 1 896 50
9. Sabaragamuwa 217 171 241 284 111 48 19 22 3 3 1,119 95
Total 1,439 1,523 2,169 2,690 1,404 398 215 212 73 32 10,155 930
% 14.2 15.0 21.4 26.5 13.8 3.9 2.1 2.1 0.7 0.3 100.0
Source : School Census 2020
19. Government Schools by Size of Student Population and Province -2020
1. Western5%
2. Central16%
3. Southern8%
4. Northern18%
5. Eastern11%
6. North Western
9%
7. North Central8%
8. Uva10%
9. Sabaragamuwa
15%
F21: Distribution of the Smallest Schools (Stu Pop 50 or Less) by Province -2020
1. Western29%
2. Central11%
3. Southern15%4. Northern
3%
5. Eastern
8%
6. North Western
13%
7. North Central6%
8. Uva5%
9. Sabaragamuwa
10%
F22: Distribution of the Largest Schools (Stu Pop Above 1,000) by Province -2020
Page 23

ProvinceLess than
10% 10--25 % 26-50 % 51-100 %
More
than 100% Total
1. Western 274 20.2 548 40.4 280 20.7 172 12.7 81 6.0 1,355
2. Central 495 32.6 603 39.7 293 19.3 95 6.3 32 2.1 1,518
3. Southern 264 23.8 460 41.6 233 21.0 109 9.8 41 3.7 1,107
4. Northern 420 42.6 341 34.6 167 17.0 46 4.7 11 1.1 985
5. Eastern 378 33.9 460 41.3 190 17.0 69 6.2 18 1.6 1,115
6. North Western 351 28.2 570 45.8 202 16.2 87 7.0 35 2.8 1,245
7. North Central 314 38.5 288 35.3 151 18.5 50 6.1 12 1.5 815
8. Uva 228 25.4 420 46.9 179 20.0 52 5.8 17 1.9 896
9. Sabaragamuwa 320 28.6 528 47.2 172 15.4 72 6.4 27 2.4 1,119
Total 3,044 30.0 4,218 41.5 1,867 18.4 752 7.4 274 2.7 10,155
Source : School Census 2020
20. Government Schools by Size of Teacher Population and Province -2020
-
200
400
600
800
1,000
1,200
1,400
1,600
More than 100
51-100
26-50
10--25
Less than 10
F23: Schools by Size of Teacher Population and Province -2020
Page 24

Province Total No. of
Students
Male
Students %
Female
Students %
1. Western 927,877 458,802 49.4 469,075 50.6
2. Central 537,973 266,088 49.5 271,885 50.5
3. Southern 517,397 259,050 50.1 258,347 49.9
4. Northern 223,333 111,308 49.8 112,025 50.2
5. Eastern 378,841 189,562 50.0 189,279 50.0
6. North Western 503,153 251,242 49.9 251,911 50.1
7. North Central 297,731 147,639 49.6 150,092 50.4
8. Uva 287,823 141,457 49.1 146,366 50.9
9. Sabaragamuwa 389,557 193,003 49.5 196,554 50.5
Total 4,063,685 2,018,151 49.7 2,045,534 50.3
Source : School Census 2020
21. Students of Government Schools by Sex and Province -2020
-
50,000
100,000
150,000
200,000
250,000
300,000
350,000
400,000
450,000
500,000
Male Students Female Students
1. Western23%
2. Central13%
3. Southern13%4. Northern
6%
5. Eastern9%
6. North Western12%
7. North Central7%
8. Uva7%
9. Sabaragamuwa10%
F24: Distribution of Students of Government Schools by Province -2020
F25: Students by Sex and Province -2020
Page 25

Province Sinhala
Medium %
Tamil
Medium % Bilingual % Total Students
1. Western 817,684 88.1 80,337 8.7 29,856 3.2 927,877
2. Central 344,290 64.0 179,700 33.4 13,983 2.6 537,973
3. Southern 491,809 95.1 14,852 2.9 10,736 2.1 517,397
4. Northern 6,058 2.7 212,970 95.4 4,305 1.9 223,333
5. Eastern 79,905 21.1 293,717 77.5 5,219 1.4 378,841
6. North Western 417,277 82.9 72,424 14.4 13,452 2.7 503,153
7. North Central 264,105 88.7 29,181 9.8 4,445 1.5 297,731
8. Uva 228,618 79.4 52,116 18.1 7,089 2.5 287,823
9. Sabaragamuwa 328,387 84.3 50,859 13.1 10,311 2.6 389,557
Total 2,978,133 73.3 986,156 24.3 99,396 2.4 4,063,685
Source : School Census 2020
22. Students of Government Schools by Language Medium of Study and Province- 2020
0%
20%
40%
60%
80%
100%
Sinhala Medium Tamil Medium Bilingual
F27: Percentage of Students by Medium and Province -2020
-
200,000
400,000
600,000
800,000
1,000,000
Sinhala Medium Tamil Medium Bilingual
F26: No. of Students by Medium and Province -2020
Page 26

Province Primary Cycle
Grd 1-5
Junior
Secondary Cycle
(Grd 6-9)
Senior Secondary
O/L Cycle (Grd 10-
11)
Senior Secondary
A/L Cycle (Grd 12-
13)
Special
Education
Unit
Total
1. Western 356,110 313,485 151,615 105,472 1,195 927,877
2. Central 219,789 177,527 83,866 55,911 880 537,973
3. Southern 207,930 172,297 80,663 55,592 915 517,397
4. Northern 88,834 74,358 37,996 21,340 805 223,333
5. Eastern 155,950 130,955 57,911 33,075 950 378,841
6. North Western 206,964 167,541 77,030 50,598 1,020 503,153
7. North Central 127,176 98,647 43,991 27,355 562 297,731
8. Uva 120,107 94,326 43,756 29,199 435 287,823
9. Sabaragamuwa 157,787 128,301 60,157 42,572 740 389,557
Total 1,640,647 1,357,437 636,985 421,114 7,502 4,063,685
Source : School Census 2020
23. Students of Government Schools by Grade Cycle of Study and Province -2020
0%
10%
20%
30%
40%
50%
60%
70%
80%
90%
100%
Senior Secondary A/L Cycle (Grd 12-13)
Senior Secondary O/L Cycle (Grd 10-11)
Junior Secondary Cycle (Grd 6-9)
Primary Cycle Grd 1-5
F28: Students by Grade Cycle of Study and Province -2020
Page 27

Province Grade 1 Grade 2 Grade 3 Grade 4 Grade 5 Grade 6 Grade 7 Grade 8 Grade 9
1. Western 68,512 71,603 71,457 73,126 71,412 75,830 80,316 79,101 78,238
2. Central 42,807 45,574 44,568 43,843 42,997 43,658 45,125 44,835 43,909
3. Southern 41,020 41,846 42,260 42,269 40,535 41,736 44,065 43,375 43,121
4. Northern 16,374 18,443 17,612 18,226 18,179 17,172 18,175 19,971 19,040
5. Eastern 30,650 31,577 30,200 31,976 31,547 31,684 32,980 33,367 32,924
6. North Western 40,482 41,400 41,767 42,316 40,999 41,778 43,147 42,155 40,461
7. North Central 24,809 25,801 25,430 25,921 25,215 25,342 25,196 24,759 23,350
8. Uva 24,196 24,768 23,966 23,938 23,239 23,317 23,623 24,204 23,182
9. Sabaragamuwa 30,555 32,116 31,912 32,099 31,105 31,393 32,680 32,624 31,604
Total 319,405 333,128 329,172 333,714 325,228 331,910 345,307 344,391 335,829
Province Grade 10 Grade 11 Grade 11
Repeaters
Grade- 12
(A/L 2022)
Grade-13
(A/L 2021)
Special
Education
Unit
Total
1. Western 76,800 74,258 557 54,323 51,149 1,195 927,877
2. Central 42,073 41,142 651 29,080 26,831 880 537,973
3. Southern 40,832 38,930 901 28,725 26,867 915 517,397
4. Northern 18,464 17,251 2,281 10,887 10,453 805 223,333
5. Eastern 30,083 25,149 2,679 17,093 15,982 950 378,841
6. North Western 39,234 36,955 841 26,364 24,234 1,020 503,153
7. North Central 22,293 21,261 437 14,235 13,120 562 297,731
8. Uva 21,907 21,356 493 15,397 13,802 435 287,823
9. Sabaragamuwa 30,199 29,264 694 22,087 20,485 740 389,557
Total 321,885 305,566 9,534 218,191 202,923 7,502 4,063,685
Source : School Census 2020
24. Students of Government Schools by Grade of Study and Province -2020
Page 28

Province Bio Sc Phy Sc
(Maths) Commerce Arts Techology Other All A/Ls
1. Western 9,784 14,253 30,928 37,037 10,274 3,196 105,472
2. Central 5,127 4,778 11,378 25,799 6,377 2,452 55,911
3. Southern 6,003 8,358 10,717 22,504 6,806 1,204 55,592
4. Northern 2,547 2,709 3,319 10,708 1,524 533 21,340
5. Eastern 3,766 2,856 5,023 16,681 3,290 1,459 33,075
6. North Western 4,971 5,120 9,396 24,460 5,607 1,044 50,598
7. North Central 2,610 2,356 5,441 13,113 3,420 415 27,355
8. Uva 2,692 2,747 5,497 13,190 3,662 1,411 29,199
9. Sabaragamuwa 4,295 4,151 8,544 18,345 5,331 1,906 42,572
Total 41,795 47,328 90,243 181,837 46,291 13,620 421,114
Source : School Census 2020
25. A/L Students of Government Schools by Subject Stream and Province -2020
-
20,000
40,000
60,000
80,000
100,000
120,000
Page 29
0%
20%
40%
60%
80%
100%
Other
Techology
Arts
Commerce
Phy Sc (Maths)
Bio Sc
F30: Percentage of A/L Students by Subject Stream and Province -2020F29: A/L Students by Subject Stream and Province -2020

Province Total No. of
Teachers
Male
Teachers %
Female
Teachers %
1. Western 46,139 7,545 16.4 38,594 83.6
2. Central 35,067 8,157 23.3 26,910 76.7
3. Southern 31,504 7,286 23.1 24,218 76.9
4. Northern 18,724 5,556 29.7 13,168 70.3
5. Eastern 24,005 9,048 37.7 14,957 62.3
6. North Western 29,866 7,231 24.2 22,635 75.8
7. North Central 17,387 4,939 28.4 12,448 71.6
8. Uva 20,796 5,971 28.7 14,825 71.3
9. Sabaragamuwa 26,006 6,014 23.1 19,992 76.9
Total 249,494 61,747 24.7 187,747 75.3
Source : School Census 2020
26. Teachers of Government Schools by Sex and Province -2020
0%
20%
40%
60%
80%
100%
Male Teachers Female Teachers
F32: Percentage.of Teachers by Sex and Province -2020
-
5,000
10,000
15,000
20,000
25,000
30,000
35,000
40,000
Male Teachers Female Teachers
1. Western18%
2. Central14%
3. Southern13%
4. Northern8%
5. Eastern
10%
6. North Western
12%
7. North Central
7%
8. Uva8%
9. Sabaragamuwa10%
F31: Percentage of Teachers by Province -2020
F33: Teachers by Sex and Province -2020
Page 30

Sinhala % Tamil % English %
1. Western 40,936 22.8 4,338 6.5 865 31.7 46,139
2. Central 23,397 13.0 11,263 16.8 407 14.9 35,067
3. Southern 30,142 16.8 1,046 1.6 316 11.6 31,504
4. Northern 501 0.3 18,112 27.1 111 4.1 18,724
5. Eastern 5,060 2.8 18,765 28.0 180 6.6 24,005
6. North Western 25,236 14.0 4,280 6.4 350 12.8 29,866
7. North Central 15,257 8.5 2,036 3.0 94 3.4 17,387
8. Uva 16,833 9.4 3,792 5.7 171 6.3 20,796
9. Sabaragamuwa 22,481 12.5 3,292 4.9 233 8.5 26,006
Total 179,843 100.0 66,924 100.0 2,727 100.0 249,494
Source : School Census 2020
Province TotalMedium of Teaching of Major Subject
27. Teachers of Govt. Schools by Medium of Teaching of Major Subject and Province -2020
1. Western22.8%
2. Central13.0%
3. Southern16.8%
4. Northern0.3%
5. Eastern2.8%
6. North Western
14.0%
7. North Central
8.5%
8. Uva9.4%
9. Sabaragamuwa12.5%
F34: Sinhala Medium Teachers by Province -2020
1. Western6.5%
2. Central16.8%
3. Southern1.6%
4. Northern27.1%
5. Eastern28.0%
6. North Western6.4%
7. North Central3.0%
8. Uva5.7%
9. Sabaragamuwa4.9%
F35: Tamil Medium Teachers by Province -2020
Page 31
Remark:In Here , Teachers are teaching in two mediums either Sinhala and English or Tamil and English, considered them as Sinhala medium or Tamil medium teachers as their major work and teaching in English medium considered as Secondary work.Teachers are teaching in English medium only considered as English medium teachers.

Graduate
Teachers
Trained
Teachers
Trainee
Teachers
Untrained
Teachers
Other
Teachers
1. Western 26,523 17,196 2,105 301 14 46,139 57.5 94.8
2. Central 15,318 19,095 257 367 30 35,067 43.7 98.1
3. Southern 16,226 15,132 83 46 17 31,504 51.5 99.5
4. Northern 8,642 9,389 562 115 16 18,724 46.2 96.3
5. Eastern 10,221 12,938 687 150 9 24,005 42.6 96.5
6. North Western 14,917 14,437 380 119 13 29,866 49.9 98.3
7. North Central 8,226 8,869 194 85 13 17,387 47.3 98.3
8. Uva 8,646 11,802 145 188 15 20,796 41.6 98.3
9. Sabaragamuwa 12,850 12,938 112 101 5 26,006 49.4 99.2
Total 121,569 121,796 4,525 1,472 132 249,494 48.7 97.5
Source : School Census 2020
Professionally
Qualified %
28. Teachers of Government Schools by Category of Appointment by Province - 2020
Province
Category of Appointment
TotalGraduate
%
-
5,000
10,000
15,000
20,000
25,000
30,000
35,000
40,000
45,000
50,000
0%
20%
40%
60%
80%
100%
Graduate Teachers Trained Teachers Trainee Teachers
Untrained Teachers Other Teachers
F37: Percentage of Teachers by Category of Appointment and Province -2020
Page 32
F36: Teachers by Category of Appointment and Province -2020
Note: Graduate teachers and trained teachers are consideredas Professionally QualifiedTeachers

1AB 1C Type 2 Total 1AB 1C Type 2 Type 3 Total
1. Western 73 1 74 114 273 444 450 1,281 1,355
2. Central 44 10 54 69 313 458 624 1,464 1,518
3. Southern 65 2 67 82 228 318 412 1,040 1,107
4. Northern 21 1 22 85 128 289 461 963 985
5. Eastern 39 1 40 68 188 351 468 1,075 1,115
6. North Western 34 3 37 69 267 416 456 1,208 1,245
7. North Central 15 15 46 136 219 399 800 815
8. Uva 29 7 36 47 185 296 332 860 896
9. Sabaragamuwa 28 28 72 190 432 397 1,091 1,119
Total 348 24 1 373 652 1,908 3,223 3,999 9,782 10,155
1AB 1C Type 2 Total 1AB 1C Type 2 Type 3 Total
1. Western 219,563 29 219,592 210,621 228,850 145,083 123,731 708,285 927,877
2. Central 80,583 8,550 89,133 95,841 161,106 98,569 93,324 448,840 537,973
3. Southern 153,145 3,117 156,262 84,244 118,961 68,283 89,647 361,135 517,397
4. Northern 27,920 618 28,538 59,756 42,280 52,627 40,132 194,795 223,333
5. Eastern 65,834 433 66,267 60,410 97,699 90,633 63,832 312,574 378,841
6. North Western 77,974 3,129 81,103 98,453 153,282 96,288 74,027 422,050 503,153
7. North Central 33,725 33,725 64,249 77,075 53,725 68,957 264,006 297,731
8. Uva 47,052 3,942 50,994 46,918 83,096 56,014 50,801 236,829 287,823
9. Sabaragamuwa 71,198 71,198 73,154 94,491 89,475 61,239 318,359 389,557
Total 776,994 19,789 29 796,812 793,646 1,056,840 750,697 665,690 3,266,873 4,063,685
Source : School Census 2020
29. Government Schools by Administrative Level (National/ Provincial), Type of School and Province -2020
Province Total Govt.
Schools
Total
National Provincial
National ProvincialProvince
29A. Students of Govt. Schools by Administrative Level (National/ Provincial), Type of School and Province -2020
Page 33

1AB 1C Type 2 Total 1AB 1C Type 2 Type 3 Total
1. Western 10,381 13 10,394 9,216 11,718 9,365 5,446 35,745 46,139
2. Central 4,543 585 5,128 5,115 10,566 8,603 5,655 29,939 35,067
3. Southern 7,190 146 7,336 4,787 8,078 6,616 4,687 24,168 31,504
4. Northern 1,902 55 1,957 4,397 3,770 5,503 3,097 16,767 18,724
5. Eastern 3,809 42 3,851 3,524 6,146 6,640 3,844 20,154 24,005
6. North Western 4,156 206 4,362 4,881 9,007 7,387 4,229 25,504 29,866
7. North Central 1,622 1,622 3,189 4,720 4,081 3,775 15,765 17,387
8. Uva 2,749 381 3,130 2,705 6,107 5,547 3,307 17,666 20,796
9. Sabaragamuwa 3,758 3,758 4,320 6,310 7,973 3,645 22,248 26,006
Total 40,110 1,415 13 41,538 42,134 66,422 61,715 37,685 207,956 249,494
1AB 1C Type 2 Total 1AB 1C Type 2 Type 3 Total
1. Western 3,008 29 2,967 1,848 838 327 275 553 685
2. Central 1,831 855 1,651 1,389 515 215 150 307 354
3. Southern 2,356 1,559 2,332 1,027 522 215 218 347 467
4. Northern 1,330 618 1,297 703 330 182 87 202 227
5. Eastern 1,688 433 1,657 888 520 258 136 291 340
6. North Western 2,293 1,043 2,192 1,427 574 231 162 349 404
7. North Central 2,248 2,248 1,397 567 245 173 330 365
8. Uva 1,622 563 1,417 998 449 189 153 275 321
9. Sabaragamuwa 2,543 2,543 1,016 497 207 154 292 348
Total 2,233 825 29 2,136 1,217 554 233 166 334 400
Source : School Census 2020
29B. Teachers of Govt. Schools by Administrative Level (National/ Provincial), Type of School and Province -2020
29C. Average Students per School by Administrative Level (National/ Provincial), Type of School and Province -2020
National Provincial Total Province
Total National Provincial
Province
Page 34

Male Female Total Male Female Total Male Female Total
1. Western 31,029 30,527 61,556 3,423 3,533 6,956 34,452 34,060 68,512
2. Central 14,081 13,898 27,979 7,542 7,286 14,828 21,623 21,184 42,807
3. Southern 20,307 19,500 39,807 596 617 1,213 20,903 20,117 41,020
4. Northern 333 289 622 8,017 7,735 15,752 8,350 8,024 16,374
5. Eastern 3,323 3,280 6,603 12,202 11,845 24,047 15,525 15,125 30,650
6. North Western 17,365 16,786 34,151 3,176 3,155 6,331 20,541 19,941 40,482
7. North Central 11,305 10,921 22,226 1,306 1,277 2,583 12,611 12,198 24,809
8. Uva 10,046 9,798 19,844 2,174 2,178 4,352 12,220 11,976 24,196
9. Sabaragamuwa 13,572 12,876 26,448 2,056 2,051 4,107 15,628 14,927 30,555
Total 121,361 117,875 239,236 40,492 39,677 80,169 161,853 157,552 319,405
Source : School Census 2020
ProvinceSinhala Medium Tamil Medium All Students
30. Grade 1 Admission of Government Schools by Language Medium, Sex and Province -2020
-
10,000
20,000
30,000
40,000
50,000
60,000
70,000
Sinhala Tamil
-
5,000
10,000
15,000
20,000
25,000
30,000
35,000
Male Female
F39: Grade 1 Admission by Sex and Province -2020
Page 35
F38: Grade 1 Admission by Language Medium and Province -2020

3School Census -2020 Summary Statistics of
National Schools by Province


Province
No. of
National
Schools
% No.of
Students %
No.of
Teachers %
Student
Teacher
Ratio
Average
Students per
School
Average
Teachers per
School
1. Western 74 19.8 219,592 27.6 10,394 25.0 21.1 2,967 140
2. Central 54 14.5 89,133 11.2 5,128 12.3 17.4 1,651 95
3. Southern 67 18.0 156,262 19.6 7,336 17.7 21.3 2,332 109
4. Northern 22 5.9 28,538 3.6 1,957 4.7 14.6 1,297 89
5. Eastern 40 10.7 66,267 8.3 3,851 9.3 17.2 1,657 96
6. North Western 37 9.9 81,103 10.2 4,362 10.5 18.6 2,192 118
7. North Central 15 4.0 33,725 4.2 1,622 3.9 20.8 2,248 108
8. Uva 36 9.7 50,994 6.4 3,130 7.5 16.3 1,417 87
9. Sabaragamuwa 28 7.5 71,198 8.9 3,758 9.0 18.9 2,543 134
Total 373 100.0 796,812 100.0 41,538 100.0 19.2 2,136 111
Source : School Census 2020
31. Basic Statistics of National Schools by Province -2020
1. Western19.8%
2. Central14.5%
3. Southern18.0%
4. Northern5.9%
5. Eastern10.7%
6. North Western
9.9%
7. North Central4.0%
8. Uva9.7%
9. Sabaragamuwa
7.5%
F40: Percentage Distribution of National Schools by Province -2020
1. Western27.6%
2. Central11.2%
3. Southern19.6%4. Northern
3.6%
5. Eastern8.3%
6. North Western10.2%
7. North Central4.2%
8. Uva6.4%
9. Sabaragamuwa8.9%
F41: Percentage Distribution of Students in National Schools by Province -2020
Page 36

Province 50 or
Less 51-100
101-
200
201-
500
501-
1,000
1,001-
1,500
1,501-
2,000
2,001-
3,000
3,001-
4,000
Above
4,000 Total
Above
1,000
1. Western 1 0 0 2 5 8 21 25 12 74 71
2. Central 0 0 0 1 14 15 9 9 3 3 54 39
3. Southern 0 0 0 8 8 12 22 11 6 67 59
4. Northern 0 0 0 2 7 5 4 4 22 13
5. Eastern 0 0 0 1 6 10 10 12 1 40 33
6. North Western 0 0 0 1 3 4 11 11 5 2 37 33
7. North Central 0 0 0 2 2 2 6 1 2 15 13
8. Uva 0 0 0 3 13 5 6 6 2 1 36 20
9. Sabaragamuwa 0 0 0 2 3 4 13 3 3 28 26
Total 1 0 0 8 57 57 66 104 51 29 373 307
% 0.3 - - 2.1 15.3 15.3 17.7 27.9 13.7 7.8 100.0
Source : School Census 2020
32. National Schools by Size of Student Population and Province -2020
1. Western23.1%
2. Central12.7%
3. Southern19.2%4. Northern
4.2%
5. Eastern10.7%
6. North Western
10.7%
7. North Central4.2%
8. Uva6.5%
9. Sabaragamuwa8.5%
F42: Distribution of the Largest National Schools (Student Population Above 1,000) by Province -2020
Page 37

Province Total No.
of Students
Male
Students %
Female
Students %
1. Western 219,592 122,304 55.7 97,288 44.3
2. Central 89,133 43,957 49.3 45,176 50.7
3. Southern 156,262 81,008 51.8 75,254 48.2
4. Northern 28,538 15,374 53.9 13,164 46.1
5. Eastern 66,267 36,350 54.9 29,917 45.1
6. North Western 81,103 43,014 53.0 38,089 47.0
7. North Central 33,725 13,808 40.9 19,917 59.1
8. Uva 50,994 24,358 47.8 26,636 52.2
9. Sabaragamuwa 71,198 32,610 45.8 38,588 54.2
Total 796,812 412,783 51.8 384,029 48.2
Source : School Census 2020
33. Students of National Schools by Sex and Province -2020
-
20,000
40,000
60,000
80,000
100,000
120,000
140,000
Male Female
F43: Students of National Schools by Sex and Province -2020
Page 38
1. Western29.6%
2. Central10.6%
3. Southern19.6%4. Northern
3.7%
5. Eastern8.8%
6. North Western
10.4%
7. North Central3.3%
8. Uva5.9%
9. Sabaragamuwa7.9%
F44: Male Students of National Schools by Province -2020
1. Western25.3%
2. Central11.8%
3. Southern19.6%4. Northern
3.4%
5. Eastern7.8%
6. North Western
9.9%
7. North Central5.2%
8. Uva6.9%
9. Sabaragamuwa
10.0%
F45: Female Students of National Schools by Province -2020

Province Sinhala
Medium %
Tamil
Medium % Bilingual % Total Students
1. Western 186,561 85.0 13,860 6.3 19,171 8.7 219,592
2. Central 62,634 70.3 18,524 20.8 7,975 8.9 89,133
3. Southern 142,632 91.3 4,546 2.9 9,084 5.8 156,262
4. Northern 1,350 4.7 24,372 85.4 2,816 9.9 28,538
5. Eastern 13,042 19.7 49,878 75.3 3,347 5.1 66,267
6. North Western 66,980 82.6 8,180 10.1 5,943 7.3 81,103
7. North Central 29,585 87.7 1,878 5.6 2,262 6.7 33,725
8. Uva 43,840 86.0 2,579 5.1 4,575 9.0 50,994
9. Sabaragamuwa 61,987 87.1 3,639 5.1 5,572 7.8 71,198
Total 608,611 76.4 127,456 16.0 60,745 7.6 796,812
Source : School Census 2020
34. Students of National Schools by Language Medium of Study and Province- 2020
0%
20%
40%
60%
80%
100%
Sinhala Medium Tamil Medium Bilingual
F47: Percentage of Students of National Schools by Medium and Province -2020
-
50,000
100,000
150,000
200,000
250,000
Sinhala Medium Tamil Medium Bilingual
F46: Students of National Schools by Medium and Province -2020
Page 39

Province
Primary
Cycle
(Grd 1-5)
Junior
Secondary Cycle
(Grd 6-9)
Senior
Secondary
O/L Cycle
(Grd 10-11)
Senior
Secondary A/L
Cycle (Grd 12-
13)
Special
Education
Unit
Total
1. Western 44,982 81,095 41,411 51,956 148 219,592
2. Central 14,029 35,994 17,979 21,020 111 89,133
3. Southern 27,093 64,244 31,419 33,250 256 156,262
4. Northern 5,410 11,665 5,682 5,697 84 28,538
5. Eastern 12,390 25,999 14,038 13,689 151 66,267
6. North Western 14,119 31,898 15,575 19,356 155 81,103
7. North Central 2,249 15,433 7,377 8,636 30 33,725
8. Uva 6,396 21,330 10,462 12,663 143 50,994
9. Sabaragamuwa 10,026 27,132 13,617 20,293 130 71,198
Total 136,694 314,790 157,560 186,560 1,208 796,812
Source : School Census 2020
35. Students of National Schools by Grade Cycle of Study and Province -2020
0%
10%
20%
30%
40%
50%
60%
70%
80%
90%
100%
Senior Secondary A/L Cycle (Grd 12-13)
Senior Secondary O/L Cycle (Grd 10-11)
Junior Secondary Cycle (Grd 6-9)
Primary Cycle (Grd 1-5)
F48: Students of National Schools by Grade Cycle of Study and Province -2020
Page 40

Province Total No. of
Teachers
Male
Teachers %
Female
Teachers %
1. Western 10,394 2,019 19.4 8,375 80.6
2. Central 5,128 1,260 24.6 3,868 75.4
3. Southern 7,336 1,964 26.8 5,372 73.2
4. Northern 1,957 659 33.7 1,298 66.3
5. Eastern 3,851 1,600 41.5 2,251 58.5
6. North Western 4,362 1,141 26.2 3,221 73.8
7. North Central 1,622 507 31.3 1,115 68.7
8. Uva 3,130 1,036 33.1 2,094 66.9
9. Sabaragamuwa 3,758 970 25.8 2,788 74.2
Total 41,538 11,156 26.9 30,382 73.1
Source : School Census 2020
36. Teachers of National Schools by Sex and Province -2020
0%
20%
40%
60%
80%
100%
Male Teachers Female Teachers
F50: % of Teachers of National Schools by Sex and Province -2020
-
1,000
2,000
3,000
4,000
5,000
6,000
7,000
8,000
9,000
Male Teachers Female Teachers
1. Western25.0%
2. Central12.3%
3. Southern17.7%
4. Northern4.7%
5. Eastern9.3%
6. North Western
10.5%
7. North Central
3.9%
8. Uva7.5%
9. Sabaragamuwa
9.0%
F49: Percentage of Teachers of National Schools by Province -2020
F51: Teachers of National Schools by Sex and Province -2020
Page 41

Sinhala % Tamil % English %
1. Western 8,942 28.2 783 9.8 669 36.2 10,394
2. Central 3,784 11.9 1,126 14.0 218 11.8 5,128
3. Southern 6,806 21.5 251 3.1 279 15.1 7,336
4. Northern 149 0.5 1,761 22.0 47 2.5 1,957
5. Eastern 650 2.1 3,064 38.2 137 7.4 3,851
6. North Western 3,657 11.5 515 6.4 190 10.3 4,362
7. North Central 1,453 4.6 126 1.6 43 2.3 1,622
8. Uva 2,824 8.9 169 2.1 137 7.4 3,130
9. Sabaragamuwa 3,402 10.7 226 2.8 130 7.0 3,758
Total 31,667 100.0 8,021 100.0 1,850 100.0 41,538
Source : School Census 2020
ProvinceMedium of Teaching of Major Subject
Total
37. Teachers of National Schools by Medium of Teaching of Major Subject and Province -2020
1. Western28.2%
2. Central11.9%
3. Southern21.5%
4. Northern0.5%
5. Eastern2.1%
6. North Western
11.5%
7. North Central4.6%
8. Uva8.9%
9. Sabaragamuwa
10.7%
F52: Sinhala Medium Teachers of National Schools by Province -2020
1. Western9.8%
2. Central14.0%
3. Southern3.1%
4. Northern22.0%
5. Eastern38.2%
6. North Western
6.4%
7. North Central1.6%
8. Uva2.1%
9. Sabaragamuwa2.8%
F53: Tamil Medium Teachers of National Schools by Province -2020
Page 42
Remark:In Here , Teachers are teaching in two mediums either Sinhala and English or Tamil and English, considered them as Sinhala medium or Tamil medium teachers as their major work and teaching in English medium considered as Secondary work.Teachers are teaching in English medium only considered as English medium teachers.

Graduate
Teachers
Trained
Teachers
Trainee
Teachers
Untrained
Teachers
Other
Teachers
1. Western 5,896 4,348 121 26 3 10,394 56.7 98.6
2. Central 2,102 2,977 24 21 4 5,128 41.0 99.0
3. Southern 3,620 3,690 15 6 5 7,336 49.3 99.6
4. Northern 878 1,044 26 7 2 1,957 44.9 98.2
5. Eastern 1,535 2,259 45 11 1 3,851 39.9 98.5
6. North Western 2,011 2,298 42 9 2 4,362 46.1 98.8
7. North Central 740 862 13 6 1 1,622 45.6 98.8
8. Uva 1,228 1,870 14 16 2 3,130 39.2 99.0
9. Sabaragamuwa 1,755 1,979 11 12 1 3,758 46.7 99.4
Total 19,765 21,327 311 114 21 41,538 47.6 98.9
Source : School Census 2020
Professionally
Qualified %
38. Teachers of National Schools by Category of Appointment by Province - 2020
Province
Category of Appointment
TotalGraduate
%
-
2,000
4,000
6,000
8,000
10,000
12,000
0%
20%
40%
60%
80%
100%
Graduate Teachers Trained Teachers Trainee Teachers
Untrained Teachers Other Teachers
F55: % of Teachers of National Schools by Category of Appointment and Province -2020
Page 43
F54: Teachers of National Schools by Category of Appointment and Province -2020
Note: Graduate teachers and trained teachers are considered as Professionally QualifiedTeachers

4School Census -2020 Summary Statistics of
Provincial Schools by Province


Province
No. of
Provincial
Schools
% No.of
Students %
No.of
Teachers %
Student
Teacher
Ratio
Average
Students per
School
Average
Teachers
per School
1. Western 1,281 13.1 708,285 21.7 35,745 17.2 19.8 553 28
2. Central 1,464 15.0 448,840 13.7 29,939 14.4 15.0 307 20
3. Southern 1,040 10.6 361,135 11.1 24,168 11.6 14.9 347 23
4. Northern 963 9.8 194,795 6.0 16,767 8.1 11.6 202 17
5. Eastern 1,075 11.0 312,574 9.6 20,154 9.7 15.5 291 19
6. North Western 1,208 12.3 422,050 12.9 25,504 12.3 16.5 349 21
7. North Central 800 8.2 264,006 8.1 15,765 7.6 16.7 330 20
8. Uva 860 8.8 236,829 7.2 17,666 8.5 13.4 275 21
9. Sabaragamuwa 1,091 11.2 318,359 9.7 22,248 10.7 14.3 292 20
Total 9,782 100.0 3,266,873 100.0 207,956 100.0 15.7 334 21
Source : School Census 2020
39. Basic Statistics of Provincial Schools by Province -2020
1. Western13.1%
2. Central15.0%
3. Southern10.6%
4. Northern9.8%
5. Eastern11.0%
6. North Western
12.3%
7. North Central8.2%
8. Uva8.8%
9. Sabaragamuwa11.2%
F56: Percentage Distribution of Provincial Schools by Province -2020
1. Western21.7%
2. Central13.7%
3. Southern11.1%
4. Northern6.0%
5. Eastern9.6%
6. North Western
12.9%
7. North Central8.1%
8. Uva7.2%
9. Sabaragamuwa9.7%
F57: Percentage Distribution of Students in Provincial Schools by Province -2020
Page 44
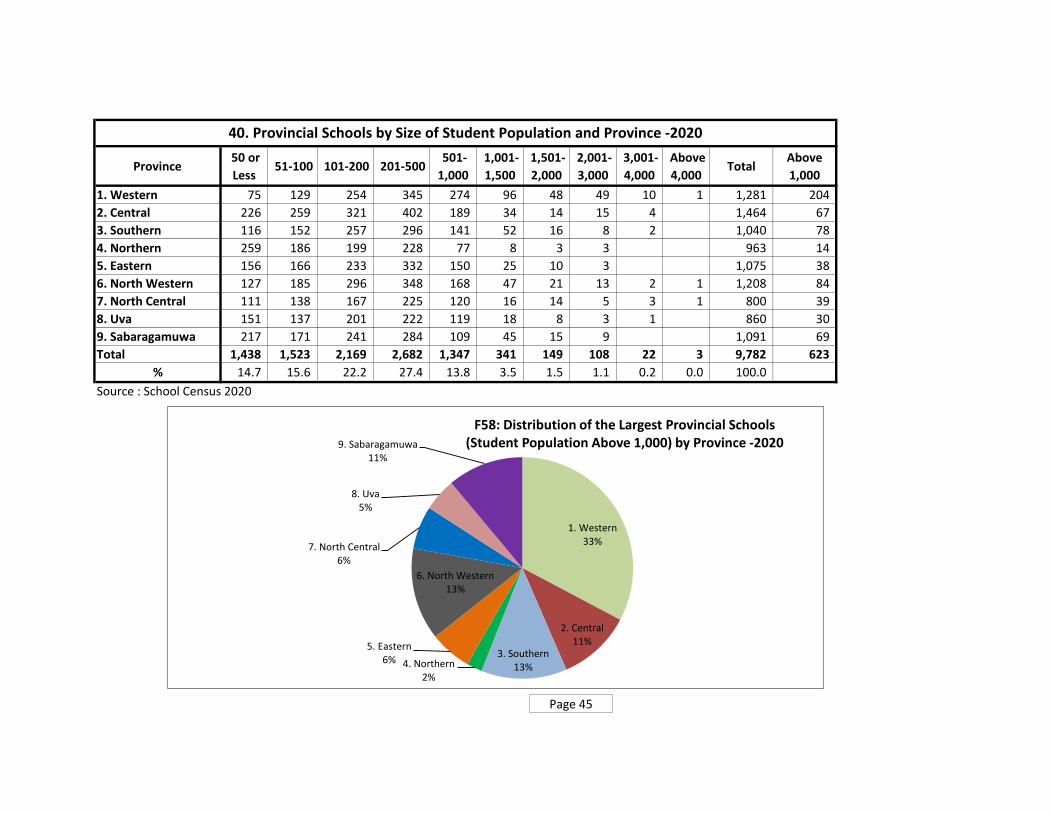
Province 50 or
Less 51-100 101-200 201-500
501-
1,000
1,001-
1,500
1,501-
2,000
2,001-
3,000
3,001-
4,000
Above
4,000 Total
Above
1,000
1. Western 75 129 254 345 274 96 48 49 10 1 1,281 204
2. Central 226 259 321 402 189 34 14 15 4 1,464 67
3. Southern 116 152 257 296 141 52 16 8 2 1,040 78
4. Northern 259 186 199 228 77 8 3 3 963 14
5. Eastern 156 166 233 332 150 25 10 3 1,075 38
6. North Western 127 185 296 348 168 47 21 13 2 1 1,208 84
7. North Central 111 138 167 225 120 16 14 5 3 1 800 39
8. Uva 151 137 201 222 119 18 8 3 1 860 30
9. Sabaragamuwa 217 171 241 284 109 45 15 9 1,091 69
Total 1,438 1,523 2,169 2,682 1,347 341 149 108 22 3 9,782 623
% 14.7 15.6 22.2 27.4 13.8 3.5 1.5 1.1 0.2 0.0 100.0
Source : School Census 2020
40. Provincial Schools by Size of Student Population and Province -2020
1. Western33%
2. Central11%
3. Southern13%4. Northern
2%
5. Eastern6%
6. North Western13%
7. North Central6%
8. Uva5%
9. Sabaragamuwa11%
F58: Distribution of the Largest Provincial Schools (Student Population Above 1,000) by Province -2020
Page 45

Province Total No.
of Students
Male
Students %
Female
Students %
1. Western 708,285 336,498 47.5 371,787 52.5
2. Central 448,840 222,131 49.5 226,709 50.5
3. Southern 361,135 178,042 49.3 183,093 50.7
4. Northern 194,795 95,934 49.2 98,861 50.8
5. Eastern 312,574 153,212 49.0 159,362 51.0
6. North Western 422,050 208,228 49.3 213,822 50.7
7. North Central 264,006 133,831 50.7 130,175 49.3
8. Uva 236,829 117,099 49.4 119,730 50.6
9. Sabaragamuwa 318,359 160,393 50.4 157,966 49.6
Total 3,266,873 1,605,368 49.1 1,661,505 50.9
Source : School Census 2020
41. Students of Provincial Schools by Sex and Province -2020
-
50,000
100,000
150,000
200,000
250,000
300,000
350,000
400,000
Male Students Female Students
F59: Students of Provincial Schools by Sex and Province -2020
Page 46
1. Western21%
2. Central14%
3. Southern11%4. Northern
6%5. Eastern
10%
6. North Western
13%
7. North Central8%
8. Uva7%
9. Sabaragamuwa10%
F60: Male Students of Provincial Schools by Province -2020
1. Western22%
2. Central14%
3. Southern11%
4. Northern6%
5. Eastern10%
6. North Western
13%
7. North Central8%
8. Uva7%
9. Sabaragamuwa9%
F61: Female Students of Provincial Schools by Province -2020

Province Sinhala
Medium %
Tamil
Medium % Bilingual % Total Students
1. Western 631,123 89.1 66,477 9.4 10,685 1.5 708,285
2. Central 281,656 62.8 161,176 35.9 6,008 1.3 448,840
3. Southern 349,177 96.7 10,306 2.9 1,652 0.5 361,135
4. Northern 4,708 2.4 188,598 96.8 1,489 0.8 194,795
5. Eastern 66,863 21.4 243,839 78.0 1,872 0.6 312,574
6. North Western 350,297 83.0 64,244 15.2 7,509 1.8 422,050
7. North Central 234,520 88.8 27,303 10.3 2,183 0.8 264,006
8. Uva 184,778 78.0 49,537 20.9 2,514 1.1 236,829
9. Sabaragamuwa 266,400 83.7 47,220 14.8 4,739 1.5 318,359
Total 2,369,522 72.5 858,700 26.3 38,651 1.2 3,266,873
Source : School Census 2020
42. Students of Provincial Schools by Language Medium of Study and Province- 2020
0%
20%
40%
60%
80%
100%
Sinhala Medium Tamil Medium Bilingual
F63: Percentage of Students of Provincial Schools by Medium and Province -2020
-
100,000
200,000
300,000
400,000
500,000
600,000
700,000
800,000
F62: Students of Provincial Schools by Medium and Province-2020
Page 47

Province Primary Cycle
(Grd 1-5)
Junior
Secondary Cycle
(Grd 6-9)
Senior Secondary
O/L Cycle (Grd 10-
11)
Senior Secondary
A/L Cycle (Grd 12-
13)
Special
Education
Unit
Total
1. Western 311,128 232,390 110,204 53,516 1,047 708,285
2. Central 205,760 141,533 65,887 34,891 769 448,840
3. Southern 180,837 108,053 49,244 22,342 659 361,135
4. Northern 83,424 62,693 32,314 15,643 721 194,795
5. Eastern 143,560 104,956 43,873 19,386 799 312,574
6. North Western 192,845 135,643 61,455 31,242 865 422,050
7. North Central 124,927 83,214 36,614 18,719 532 264,006
8. Uva 113,711 72,996 33,294 16,536 292 236,829
9. Sabaragamuwa 147,761 101,169 46,540 22,279 610 318,359
Total 1,503,953 1,042,647 479,425 234,554 6,294 3,266,873
Source : School Census 2020
43. Students of Provincial Schools by Grade Cycle of Study and Province -2020
0%
10%
20%
30%
40%
50%
60%
70%
80%
90%
100%
Senior Secondary A/L Cycle (Grd 12-13)
Senior Secondary O/L Cycle (Grd 10-11)
Junior Secondary Cycle (Grd 6-9)
Primary Cycle (Grd 1-5)
F64: Students of Provincial Schools by Grade Cycle of Study and Province -
2020
Page 48

Province Total No. of
Teachers
Male
Teachers %
Female
Teachers %
1. Western 35,745 5,526 15.5 30,219 84.5
2. Central 29,939 6,897 23.0 23,042 77.0
3. Southern 24,168 5,322 22.0 18,846 78.0
4. Northern 16,767 4,897 29.2 11,870 70.8
5. Eastern 20,154 7,448 37.0 12,706 63.0
6. North Western 25,504 6,090 23.9 19,414 76.1
7. North Central 15,765 4,432 28.1 11,333 71.9
8. Uva 17,666 4,935 27.9 12,731 72.1
9. Sabaragamuwa 22,248 5,044 22.7 17,204 77.3
Total 207,956 50,591 24.3 157,365 75.7
Source : School Census 2019
44. Teachers of Provincial Schools by Sex and Province -2020
0%
20%
40%
60%
80%
100%
Male Teachers Female Teachers
F66: % of Teachers of Provincial Schools by Sex and Province -2020
-
5,000
10,000
15,000
20,000
25,000
30,000
Male Teachers Female Teachers
1. Western17%
2. Central14%
3. Southern12%
4. Northern8%
5. Eastern10%
6. North Western
12%
7. North Central
8%
8. Uva8%
9. Sabaragamuwa11%
F65: Percentage of Teachers of Provincial Schools by Province -2020
F67: Teachers of Provincial Schools by Sex and Province -2020
Page 49

Sinhala % Tamil % English %
1. Western 31,994 21.6 3,555 6.0 196 22.3 35,745
2. Central 19,613 13.2 10,137 17.2 189 21.6 29,939
3. Southern 23,336 15.7 795 1.3 37 4.2 24,168
4. Northern 352 0.2 16,351 27.8 64 7.3 16,767
5. Eastern 4,410 3.0 15,701 26.7 43 4.9 20,154
6. North Western 21,579 14.6 3,765 6.4 160 18.2 25,504
7. North Central 13,804 9.3 1,910 3.2 51 5.8 15,765
8. Uva 14,009 9.5 3,623 6.2 34 3.9 17,666
9. Sabaragamuwa 19,079 12.9 3,066 5.2 103 11.7 22,248
Total 148,176 100.0 58,903 100.0 877 100.0 207,956
Source : School Census 2020
45. Teachers of Provincial Schools by Medium of Teaching of Major Subject and Province -2020
ProvinceMedium of Teaching of Major Subject
Total
1. Western6.0%
2. Central17.2%
3. Southern1.3%
4. Northern27.8%
5. Eastern26.7%
6. North Western
6.4%
7. North Central
3.2%
8. Uva6.2%
9. Sabaragamuwa
5.2%
F69: Tamil Medium Teachers of Provincial Schools by Province -2020
Page 50
0%
20%
40%
60%
80%
100%
F68: Teachers of Provincial Schools by Medium of Teaching of Major Subject and Province -2020
Sinhala Tamil English
Remark:In Here , Teachers are teaching in two mediums either Sinhala and English or Tamil and English, considered them as Sinhala medium or Tamil medium teachers as their major work and teaching in English medium considered as Secondary work.Teachers are teaching in English medium only considered as English medium teachers.

Graduate
Teachers
Trained
Teachers
Trainee
Teachers
Untrained
Teachers
Other
Teachers
1. Western 20,627 12,848 1,984 275 11 35,745 57.7 93.6
2. Central 13,216 16,118 233 346 26 29,939 44.1 98.0
3. Southern 12,606 11,442 68 40 12 24,168 52.2 99.5
4. Northern 7,764 8,345 536 108 14 16,767 46.3 96.1
5. Eastern 8,686 10,679 642 139 8 20,154 43.1 96.1
6. North Western 12,906 12,139 338 110 11 25,504 50.6 98.2
7. North Central 7,486 8,007 181 79 12 15,765 47.5 98.3
8. Uva 7,418 9,932 131 172 13 17,666 42.0 98.2
9. Sabaragamuwa 11,095 10,959 101 89 4 22,248 49.9 99.1
Total 101,804 100,469 4,214 1,358 111 207,956 49.0 97.3
Source : School Census 2020
Professionally
Qualified %
46. Teachers of Provincial Schools by Category of Appointment by Province - 2020
Province
Category of Appointment
TotalGraduate
%
-
5,000
10,000
15,000
20,000
25,000
30,000
35,000
40,000
0%
20%
40%
60%
80%
100%
Graduate Teachers Trained Teachers Trainee Teachers
Untrained Teachers Other Teachers
F71: Percentage of Teachers of Provincial Schools by Category of Appointment and Province -2020
Page 51
F70: Teachers of Provincial Schools by Category of Appointment and Province -2020
Note: Graduate teachers and trained teachers are considered as Professionally QualifiedTeachers

5School Census -2020 Summary Statistics of
All Government Schools by District


District Total No.
of Schools %
Total No.
of Students %
Total No.
of
Teachers
%
Student
Teacher
Ratio
Average
Students
per School
Average
Teachers
per School
11. Colombo 399 3.9 358,427 8.8 17,888 7.2 20.0 898 45
12. Gampaha 536 5.3 346,669 8.5 16,683 6.7 20.8 647 31
13. Kalutara 420 4.1 222,781 5.5 11,568 4.6 19.3 530 28
21. Kandy 651 6.4 274,937 6.8 17,782 7.1 15.5 422 27
22. Matale 317 3.1 102,983 2.5 6,653 2.7 15.5 325 21
23. Nuwara Eliya 550 5.4 160,053 3.9 10,632 4.3 15.1 291 19
31. Galle 429 4.2 216,139 5.3 12,437 5.0 17.4 504 29
32. Matara 358 3.5 163,111 4.0 10,541 4.2 15.5 456 29
33. Hambantota 320 3.2 138,147 3.4 8,526 3.4 16.2 432 27
41. Jaffna 448 4.4 103,412 2.5 9,397 3.8 11.0 231 21
42. Mannar 133 1.3 26,358 0.6 2,116 0.8 12.5 198 16
43. Vavuniya 173 1.7 36,043 0.9 2,981 1.2 12.1 208 17
44. Mullaitivu 127 1.3 27,220 0.7 2,131 0.9 12.8 214 17
45. Kilinochchi 104 1.0 30,300 0.7 2,099 0.8 14.4 291 20
51. Batticaloa 362 3.6 123,488 3.0 7,647 3.1 16.1 341 21
52. Ampara 440 4.3 159,760 3.9 10,528 4.2 15.2 363 24
53. Trincomalee 313 3.1 95,593 2.4 5,830 2.3 16.4 305 19
61. Kurunegala 873 8.6 337,873 8.3 20,889 8.4 16.2 387 24
62. Puttalam 372 3.7 165,280 4.1 8,977 3.6 18.4 444 24
71. Anuradhapura 562 5.5 206,063 5.1 12,224 4.9 16.9 367 22
72. Polonnaruwa 253 2.5 91,668 2.3 5,163 2.1 17.8 362 20
81. Badulla 605 6.0 179,344 4.4 14,013 5.6 12.8 296 23
82. Moneragala 291 2.9 108,479 2.7 6,783 2.7 16.0 373 23
91. Ratnapura 598 5.9 224,134 5.5 13,803 5.5 16.2 375 23
92. Kegalle 521 5.1 165,423 4.1 12,203 4.9 13.6 318 23
Total 10,155 100.0 4,063,685 100.0 249,494 100.0 16.3 400 25
Source : School Census 2020
47. Basic Statistics of Government Schools by District -2020
Page 52
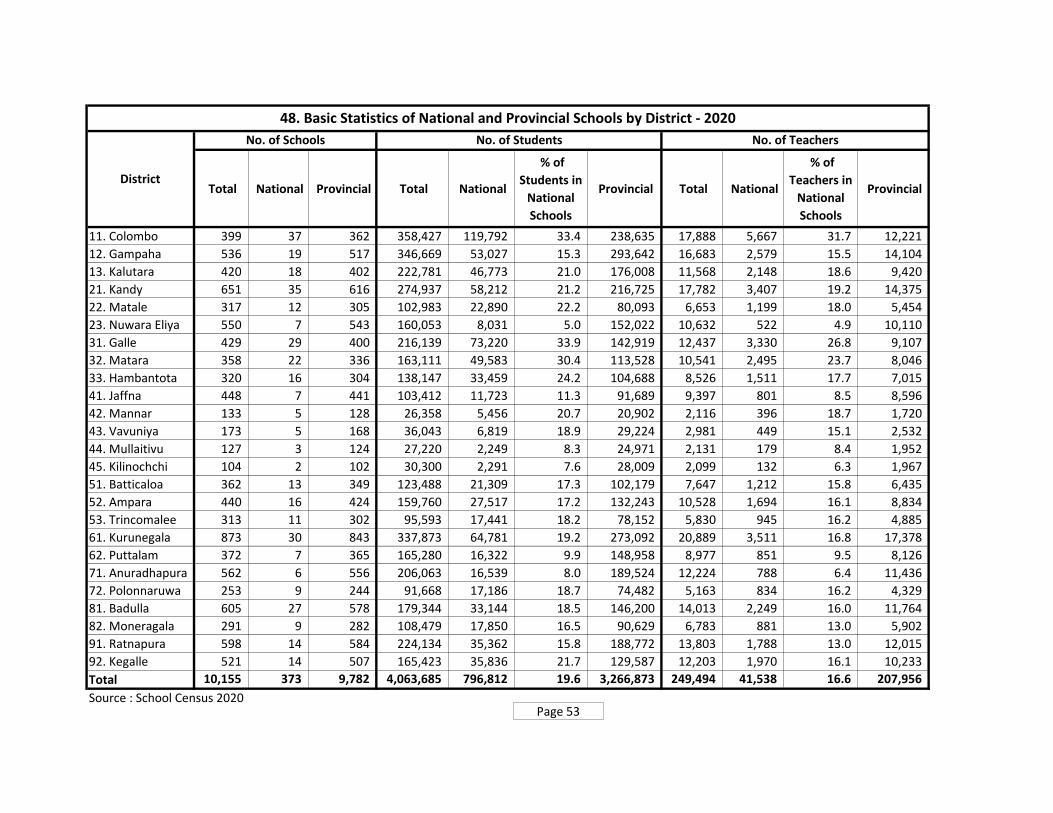
Total National Provincial Total National
% of
Students in
National
Schools
Provincial Total National
% of
Teachers in
National
Schools
Provincial
11. Colombo 399 37 362 358,427 119,792 33.4 238,635 17,888 5,667 31.7 12,221
12. Gampaha 536 19 517 346,669 53,027 15.3 293,642 16,683 2,579 15.5 14,104
13. Kalutara 420 18 402 222,781 46,773 21.0 176,008 11,568 2,148 18.6 9,420
21. Kandy 651 35 616 274,937 58,212 21.2 216,725 17,782 3,407 19.2 14,375
22. Matale 317 12 305 102,983 22,890 22.2 80,093 6,653 1,199 18.0 5,454
23. Nuwara Eliya 550 7 543 160,053 8,031 5.0 152,022 10,632 522 4.9 10,110
31. Galle 429 29 400 216,139 73,220 33.9 142,919 12,437 3,330 26.8 9,107
32. Matara 358 22 336 163,111 49,583 30.4 113,528 10,541 2,495 23.7 8,046
33. Hambantota 320 16 304 138,147 33,459 24.2 104,688 8,526 1,511 17.7 7,015
41. Jaffna 448 7 441 103,412 11,723 11.3 91,689 9,397 801 8.5 8,596
42. Mannar 133 5 128 26,358 5,456 20.7 20,902 2,116 396 18.7 1,720
43. Vavuniya 173 5 168 36,043 6,819 18.9 29,224 2,981 449 15.1 2,532
44. Mullaitivu 127 3 124 27,220 2,249 8.3 24,971 2,131 179 8.4 1,952
45. Kilinochchi 104 2 102 30,300 2,291 7.6 28,009 2,099 132 6.3 1,967
51. Batticaloa 362 13 349 123,488 21,309 17.3 102,179 7,647 1,212 15.8 6,435
52. Ampara 440 16 424 159,760 27,517 17.2 132,243 10,528 1,694 16.1 8,834
53. Trincomalee 313 11 302 95,593 17,441 18.2 78,152 5,830 945 16.2 4,885
61. Kurunegala 873 30 843 337,873 64,781 19.2 273,092 20,889 3,511 16.8 17,378
62. Puttalam 372 7 365 165,280 16,322 9.9 148,958 8,977 851 9.5 8,126
71. Anuradhapura 562 6 556 206,063 16,539 8.0 189,524 12,224 788 6.4 11,436
72. Polonnaruwa 253 9 244 91,668 17,186 18.7 74,482 5,163 834 16.2 4,329
81. Badulla 605 27 578 179,344 33,144 18.5 146,200 14,013 2,249 16.0 11,764
82. Moneragala 291 9 282 108,479 17,850 16.5 90,629 6,783 881 13.0 5,902
91. Ratnapura 598 14 584 224,134 35,362 15.8 188,772 13,803 1,788 13.0 12,015
92. Kegalle 521 14 507 165,423 35,836 21.7 129,587 12,203 1,970 16.1 10,233
Total 10,155 373 9,782 4,063,685 796,812 19.6 3,266,873 249,494 41,538 16.6 207,956
Source : School Census 2020
District
No. of Schools No. of Students No. of Teachers
48. Basic Statistics of National and Provincial Schools by District - 2020
Page 53

Page 54

District 1AB 1C Type 2 Type 3 Total
11. Colombo 75 85 126 113 399
12. Gampaha 65 112 174 185 536
13. Kalutara 47 76 145 152 420
21. Kandy 57 167 209 218 651
22. Matale 20 65 102 130 317
23. Nuwara Eliya 36 91 147 276 550
31. Galle 64 81 95 189 429
32. Matara 45 78 107 128 358
33. Hambantota 38 71 116 95 320
41. Jaffna 50 48 145 205 448
42. Mannar 15 24 33 61 133
43. Vavuniya 15 25 39 94 173
44. Mullaitivu 13 17 36 61 127
45. Kilinochchi 13 15 36 40 104
51. Batticaloa 43 55 101 163 362
52. Ampara 39 66 154 181 440
53. Trincomalee 25 68 96 124 313
61. Kurunegala 76 182 268 347 873
62. Puttalam 27 88 148 109 372
71. Anuradhapura 36 103 162 261 562
72. Polonnaruwa 25 33 57 138 253
81. Badulla 42 140 184 239 605
82. Moneragala 34 52 112 93 291
91. Ratnapura 53 94 254 197 598
92. Kegalle 47 96 178 200 521
Total 1,000 1,932 3,224 3,999 10,155
Source : School Census 2020
49. Government Schools by Type of School and District -2020
Page 55

1AB % 1C % Type 2 % Type 3 %
11. Colombo 201,309 56.2 72,816 20.3 51,526 14.4 32,776 9.1 358,427
12. Gampaha 133,565 38.5 95,992 27.7 56,355 16.3 60,757 17.5 346,669
13. Kalutara 95,310 42.8 60,042 27.0 37,231 16.7 30,198 13.6 222,781
21. Kandy 102,871 37.4 89,147 32.4 41,768 15.2 41,151 15.0 274,937
22. Matale 32,879 31.9 32,473 31.5 18,583 18.0 19,048 18.5 102,983
23. Nuwara Eliya 40,674 25.4 48,036 30.0 38,218 23.9 33,125 20.7 160,053
31. Galle 116,901 54.1 44,319 20.5 20,592 9.5 34,327 15.9 216,139
32. Matara 69,325 42.5 43,521 26.7 22,012 13.5 28,253 17.3 163,111
33. Hambantota 51,163 37.0 34,238 24.8 25,679 18.6 27,067 19.6 138,147
41. Jaffna 42,994 41.6 15,689 15.2 22,906 22.2 21,823 21.1 103,412
42. Mannar 10,235 38.8 7,058 26.8 4,932 18.7 4,133 15.7 26,358
43. Vavuniya 15,203 42.2 8,165 22.7 7,874 21.8 4,801 13.3 36,043
44. Mullaitivu 7,722 28.4 6,713 24.7 8,200 30.1 4,585 16.8 27,220
45. Kilinochchi 11,522 38.0 5,273 17.4 8,715 28.8 4,790 15.8 30,300
51. Batticaloa 46,938 38.0 28,480 23.1 26,822 21.7 21,248 17.2 123,488
52. Ampara 51,306 32.1 37,010 23.2 43,510 27.2 27,934 17.5 159,760
53. Trincomalee 28,000 29.3 32,642 34.1 20,301 21.2 14,650 15.3 95,593
61. Kurunegala 136,916 40.5 95,931 28.4 55,965 16.6 49,061 14.5 337,873
62. Puttalam 39,511 23.9 60,480 36.6 40,323 24.4 24,966 15.1 165,280
71. Anuradhapura 65,393 31.7 58,111 28.2 36,398 17.7 46,161 22.4 206,063
72. Polonnaruwa 32,581 35.5 18,964 20.7 17,327 18.9 22,796 24.9 91,668
81. Badulla 55,228 30.8 62,221 34.7 34,107 19.0 27,788 15.5 179,344
82. Moneragala 38,742 35.7 24,817 22.9 21,907 20.2 23,013 21.2 108,479
91. Ratnapura 77,807 34.7 55,597 24.8 55,619 24.8 35,111 15.7 224,134
92. Kegalle 66,545 40.2 38,894 23.5 33,856 20.5 26,128 15.8 165,423
Total 1,570,640 38.7 1,076,629 26.5 750,726 18.5 665,690 16.4 4,063,685
Source : School Census 2020
49A. Students of Government Schools by Type of School and District - 2020
DistrictType of School
Total
Page 56

1AB % 1C % Type 2 % Type 3 %
11. Colombo 9,254 53.1 4,040 20.2 3,121 17.5 1,473 9.1 17,888
12. Gampaha 6,067 37.7 4,604 25.4 3,542 21.6 2,470 15.2 16,683
13. Kalutara 4,276 40.2 3,074 22.5 2,715 24.2 1,503 13.1 11,568
21. Kandy 5,632 32.0 6,051 32.8 3,888 22.2 2,211 12.9 17,782
22. Matale 1,695 24.6 2,067 30.5 1,774 27.2 1,117 17.7 6,653
23. Nuwara Eliya 2,331 22.2 3,033 28.4 2,941 27.5 2,327 21.9 10,632
31. Galle 5,633 45.3 3,005 22.1 1,936 16.6 1,863 16.0 12,437
32. Matara 3,787 35.2 2,925 26.4 2,262 23.0 1,567 15.3 10,541
33. Hambantota 2,557 30.0 2,294 26.2 2,418 28.7 1,257 15.1 8,526
41. Jaffna 3,280 35.3 1,613 17.2 2,897 30.2 1,607 17.4 9,397
42. Mannar 758 37.8 586 24.6 457 19.9 315 17.6 2,116
43. Vavuniya 1,013 32.2 683 23.4 791 27.8 494 16.5 2,981
44. Mullaitivu 568 28.4 510 20.0 695 34.3 358 17.4 2,131
45. Kilinochchi 680 30.2 433 20.0 663 33.6 323 16.3 2,099
51. Batticaloa 2,734 32.7 1,798 24.4 1,853 25.5 1,262 17.4 7,647
52. Ampara 3,127 29.9 2,469 22.7 3,276 30.6 1,656 16.9 10,528
53. Trincomalee 1,472 25.6 1,921 32.7 1,511 25.4 926 16.4 5,830
61. Kurunegala 7,134 33.4 6,031 28.9 4,737 22.6 2,987 15.1 20,889
62. Puttalam 1,903 25.7 3,182 29.3 2,650 30.5 1,242 14.5 8,977
71. Anuradhapura 3,148 25.6 3,617 28.1 2,940 25.0 2,519 21.3 12,224
72. Polonnaruwa 1,663 31.8 1,103 21.2 1,141 22.1 1,256 24.8 5,163
81. Badulla 3,400 25.8 4,870 33.8 3,569 24.4 2,174 16.0 14,013
82. Moneragala 2,054 30.3 1,618 23.5 1,978 30.0 1,133 16.1 6,783
91. Ratnapura 4,103 31.3 3,306 21.4 4,509 33.0 1,885 14.4 13,803
92. Kegalle 3,975 32.6 3,004 23.8 3,464 28.8 1,760 14.9 12,203
Total 82,244 33.4 67,837 25.8 61,728 25.0 37,685 15.7 249,494
Source : School Census 2020
DistrictType of School
Total
49B. Teachers of Government Schools by Type of School and District- 2020
Page 57

Page 58

Boys Girls Mixed Total Boys Girls Mixed Total Boys Girls Mixed Total
11. Colombo 40 56 303 399 80,044 96,201 182,182 358,427 3,697 4,504 9,687 17,888
12. Gampaha 10 20 506 536 18,921 38,079 289,669 346,669 899 1,586 14,198 16,683
13. Kalutara 7 15 398 420 12,173 21,886 188,722 222,781 509 915 10,144 11,568
21. Kandy 15 24 612 651 27,082 43,803 204,052 274,937 1,464 2,111 14,207 17,782
22. Matale 3 4 310 317 5,738 7,401 89,844 102,983 299 347 6,007 6,653
23. Nuwara Eliya 3 5 542 550 2,366 5,026 152,661 160,053 141 306 10,185 10,632
31. Galle 8 11 410 429 19,456 25,876 170,807 216,139 906 1,117 10,414 12,437
32. Matara 4 4 350 358 11,999 10,428 140,684 163,111 580 502 9,459 10,541
33. Hambantota 1 3 316 320 828 4,139 133,180 138,147 66 225 8,235 8,526
41. Jaffna 14 22 412 448 9,364 15,875 78,173 103,412 723 1,156 7,518 9,397
42. Mannar 2 2 129 133 2,079 1,835 22,444 26,358 134 130 1,852 2,116
43. Vavuniya 2 171 173 3,198 32,845 36,043 200 2,781 2,981
44. Mullaitivu 1 126 127 482 26,738 27,220 29 2,102 2,131
45. Kilinochchi 1 103 104 798 29,502 30,300 52 2,047 2,099
51. Batticaloa 7 17 338 362 9,146 17,783 96,559 123,488 496 944 6,207 7,647
52. Ampara 4 10 426 440 3,762 11,794 144,204 159,760 176 655 9,697 10,528
53. Trincomalee 10 15 288 313 7,356 13,316 74,921 95,593 411 712 4,707 5,830
61. Kurunegala 4 5 864 873 9,425 11,854 316,594 337,873 449 531 19,909 20,889
62. Puttalam 5 9 358 372 7,312 13,186 144,782 165,280 341 532 8,104 8,977
71. Anuradhapura 1 1 560 562 3,068 4,344 198,651 206,063 154 172 11,898 12,224
72. Polonnaruwa 1 252 253 1,153 90,515 91,668 103 5,060 5,163
81. Badulla 3 6 596 605 4,502 9,449 165,393 179,344 238 534 13,241 14,013
82. Moneragala 1 290 291 883 107,596 108,479 48 6,735 6,783
91. Ratnapura 2 4 592 598 4,455 10,165 209,514 224,134 227 492 13,084 13,803
92. Kegalle 2 2 517 521 6,027 8,190 151,206 165,423 315 368 11,520 12,203
Total 145 241 9,769 10,155 245,103 377,144 3,441,438 4,063,685 12,225 18,271 218,998 249,494
Source : School Census 2020
DistrictSchools Students Teachers
50. Basic Statistics of Government Schools by Gender of the School and District -2020
Page 59

Sinhala
Only
Tamil
Only
Both
Sinhala &
Tamil
Both Sinhala &
Bilingual (S/E)
Both Tamil
& Bilingual
(T/E)
Trilingual (Sinhala,
Tamil & Bilingual (S/E
and/or T/E)
11. Colombo 277 36 13 61 5 7 399 313 78.4
12. Gampaha 460 20 1 49 3 3 536 480 89.6
13. Kalutara 335 53 2 22 4 4 420 388 92.4
21. Kandy 397 174 6 50 11 13 651 571 87.7
22. Matale 248 53 1 11 4 317 301 95.0
23. Nuwara Eliya 211 314 4 16 4 1 550 525 95.5
31. Galle 378 12 4 33 2 429 390 90.9
32. Matara 311 17 1 29 358 328 91.6
33. Hambantota 288 10 22 320 298 93.1
41. Jaffna 412 36 448 412 92.0
42. Mannar 129 4 133 129 97.0
43. Vavuniya 19 148 5 1 173 167 96.5
44. Mullaitivu 9 115 3 127 124 97.6
45. Kilinochchi 103 1 104 103 99.0
51. Batticaloa 1 346 15 362 347 95.9
52. Ampara 178 231 9 22 440 409 93.0
53. Trincomalee 79 222 1 1 10 313 301 96.2
61. Kurunegala 722 81 64 6 873 803 92.0
62. Puttalam 268 76 7 16 4 1 372 344 92.5
71. Anuradhapura 472 67 22 1 562 539 95.9
72. Polonnaruwa 220 26 7 253 246 97.2
81. Badulla 391 180 26 7 1 605 571 94.4
82. Moneragala 247 20 23 1 291 267 91.8
91. Ratnapura 458 104 33 1 2 598 562 94.0
92. Kegalle 388 93 2 30 8 521 481 92.3
Total 6,357 3,042 42 524 157 33 10,155 9,399 92.6
Source : School Census 2020
51. Government Schools by Language Medium of Instruction and District -2020
District
Language Medium of Instruction
Total
One
Language
Only
%
Page 60

Grade 1-5 Grade 1-8 Grade 1-11 Grade 6-11 Grade 1-13 Grade 6-13
11. Colombo 112 1 124 2 129 31 399 366 287
12. Gampaha 185 170 4 112 65 536 467 351
13. Kalutara 146 6 142 3 91 32 420 385 274
21. Kandy 206 12 208 1 152 72 651 578 445
22. Matale 129 1 102 53 32 317 285 188
23. Nuwara Eliya 272 4 147 74 53 550 497 278
31. Galle 188 1 95 100 45 429 384 241
32. Matara 127 1 105 2 82 41 358 315 231
33. Hambantota 94 1 114 2 68 41 320 277 226
41. Jaffna 201 4 144 1 56 42 448 405 247
42. Mannar 60 1 33 28 11 133 122 73
43. Vavuniya 94 39 32 8 173 165 79
44. Mullaitivu 61 36 18 12 127 115 66
45. Kilinochchi 40 36 18 10 104 94 64
51. Batticaloa 158 5 100 1 65 33 362 328 204
52. Ampara 178 3 154 59 46 440 394 262
53. Trincomalee 119 5 95 1 65 28 313 284 194
61. Kurunegala 330 17 268 197 61 873 812 543
62. Puttalam 97 12 148 81 34 372 338 275
71. Anuradhapura 255 6 162 82 57 562 505 307
72. Polonnaruwa 135 3 57 32 26 253 227 118
81. Badulla 229 10 183 1 129 53 605 551 376
82. Moneragala 87 6 112 50 36 291 255 204
91. Ratnapura 187 10 254 83 64 598 534 411
92. Kegalle 194 6 176 2 93 50 521 469 327
Total 3,884 115 3,204 20 1,949 983 10,155 9,152 6,271
Source : School Census 2020
Schools with
Secondary
Section
52. Government Schools by Grade Span of the School and District -2020
DistrictGrade Span
Total
Schools with
Primary
Section
Page 61

District 50 or
Less 51-100
101-
200
201-
500
501-
1,000
1,001-
1,500
1,501-
2,000
2,001-
3,000
3,001-
4,000
Above
4,000 Total
Above
1,000
11. Colombo 17 33 52 106 83 33 20 26 19 10 399 108
12. Gampaha 14 41 115 140 123 43 21 28 9 2 536 103
13. Kalutara 45 55 87 99 70 25 15 16 7 1 420 64
21. Kandy 93 90 139 171 95 27 13 13 7 3 651 63
22. Matale 55 54 68 85 36 5 6 8 317 19
23. Nuwara Eliya 78 115 114 147 72 17 4 3 550 24
31. Galle 45 60 100 108 56 23 15 11 8 3 429 60
32. Matara 43 52 75 94 51 17 9 14 1 2 358 43
33. Hambantota 28 40 82 94 42 20 4 5 4 1 320 34
41. Jaffna 96 105 105 95 31 8 4 4 448 16
42. Mannar 41 20 25 38 6 2 1 133 3
43. Vavuniya 70 23 29 30 17 2 2 173 4
44. Mullaitivu 33 22 25 32 13 2 127 2
45. Kilinochchi 19 16 15 35 17 1 1 104 2
51. Batticaloa 63 43 77 97 58 11 8 5 362 24
52. Ampara 49 67 100 131 60 17 9 6 1 440 33
53. Trincomalee 44 56 56 105 38 7 3 4 313 14
61. Kurunegala 109 143 214 223 106 28 24 19 4 3 873 78
62. Puttalam 18 42 82 126 65 23 8 5 3 372 39
71. Anuradhapura 85 89 113 154 87 10 11 7 3 3 562 34
72. Polonnaruwa 26 49 54 71 35 8 5 4 1 253 18
81. Badulla 117 99 145 141 72 13 9 6 2 1 605 31
82. Moneragala 34 38 56 84 60 10 5 3 1 291 19
91. Ratnapura 105 87 126 151 68 34 12 13 2 598 61
92. Kegalle 112 84 115 133 43 14 7 9 3 1 521 34
Total 1,439 1,523 2,169 2,690 1,404 398 215 212 73 32 10,155 930
Source : School Census 2020
53. Government Schools by Size of Student Population and District -2020
Page 62

-
100
200
300
400
500
600
700
800
900
11
. Co
lom
bo
12
. Gam
pah
a
13
. Kal
uta
ra
21
. Kan
dy
22
. Mat
ale
23
. Nu
war
a El
iya
31
. Gal
le
32
. Mat
ara
33
. Ham
ban
tota
41
. Jaf
fna
42
. Man
nar
43
. Vav
un
iya
44
. Mu
llait
ivu
45
. Kili
no
chch
i
51
. Bat
tica
loa
52
. Am
par
a
53
. Tri
nco
mal
ee
61
. Ku
run
ega
la
62
. Pu
ttal
am
71
. An
ura
dh
apu
ra
72
. Po
lon
nar
uw
a
81
. Bad
ulla
82
. Mo
ne
raga
la
91
. Rat
nap
ura
92
. Keg
alle
F72: Government Schools by Size of Students Population and District - 2020
50 or Less 51-100 101-200 201-500 501-1,000
1,001-1,500 1,501-2,000 2,001-3,000 3,001-4,000 Above 4,000
Page 63
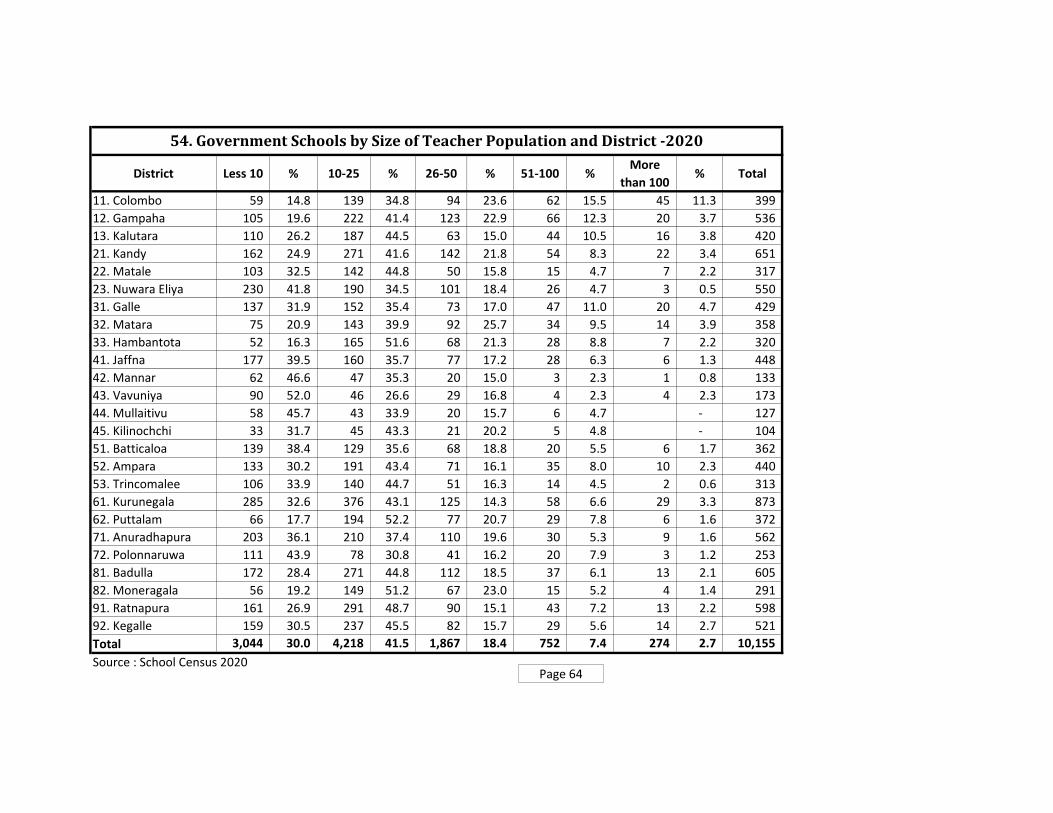
District Less 10 % 10-25 % 26-50 % 51-100 %More
than 100% Total
11. Colombo 59 14.8 139 34.8 94 23.6 62 15.5 45 11.3 399
12. Gampaha 105 19.6 222 41.4 123 22.9 66 12.3 20 3.7 536
13. Kalutara 110 26.2 187 44.5 63 15.0 44 10.5 16 3.8 420
21. Kandy 162 24.9 271 41.6 142 21.8 54 8.3 22 3.4 651
22. Matale 103 32.5 142 44.8 50 15.8 15 4.7 7 2.2 317
23. Nuwara Eliya 230 41.8 190 34.5 101 18.4 26 4.7 3 0.5 550
31. Galle 137 31.9 152 35.4 73 17.0 47 11.0 20 4.7 429
32. Matara 75 20.9 143 39.9 92 25.7 34 9.5 14 3.9 358
33. Hambantota 52 16.3 165 51.6 68 21.3 28 8.8 7 2.2 320
41. Jaffna 177 39.5 160 35.7 77 17.2 28 6.3 6 1.3 448
42. Mannar 62 46.6 47 35.3 20 15.0 3 2.3 1 0.8 133
43. Vavuniya 90 52.0 46 26.6 29 16.8 4 2.3 4 2.3 173
44. Mullaitivu 58 45.7 43 33.9 20 15.7 6 4.7 - 127
45. Kilinochchi 33 31.7 45 43.3 21 20.2 5 4.8 - 104
51. Batticaloa 139 38.4 129 35.6 68 18.8 20 5.5 6 1.7 362
52. Ampara 133 30.2 191 43.4 71 16.1 35 8.0 10 2.3 440
53. Trincomalee 106 33.9 140 44.7 51 16.3 14 4.5 2 0.6 313
61. Kurunegala 285 32.6 376 43.1 125 14.3 58 6.6 29 3.3 873
62. Puttalam 66 17.7 194 52.2 77 20.7 29 7.8 6 1.6 372
71. Anuradhapura 203 36.1 210 37.4 110 19.6 30 5.3 9 1.6 562
72. Polonnaruwa 111 43.9 78 30.8 41 16.2 20 7.9 3 1.2 253
81. Badulla 172 28.4 271 44.8 112 18.5 37 6.1 13 2.1 605
82. Moneragala 56 19.2 149 51.2 67 23.0 15 5.2 4 1.4 291
91. Ratnapura 161 26.9 291 48.7 90 15.1 43 7.2 13 2.2 598
92. Kegalle 159 30.5 237 45.5 82 15.7 29 5.6 14 2.7 521
Total 3,044 30.0 4,218 41.5 1,867 18.4 752 7.4 274 2.7 10,155
Source : School Census 2020
54. Government Schools by Size of Teacher Population and District -2020
Page 64

-
100
200
300
400
500
600
700
800
900
11
. Co
lom
bo
12
. Gam
pah
a
13
. Kal
uta
ra
21
. Kan
dy
22
. Mat
ale
23
. Nu
war
a El
iya
31
. Gal
le
32
. Mat
ara
33
. Ham
ban
tota
41
. Jaf
fna
42
. Man
nar
43
. Vav
un
iya
44
. Mu
llait
ivu
45
. Kili
no
chch
i
51
. Bat
tica
loa
52
. Am
par
a
53
. Tri
nco
mal
ee
61
. Ku
run
ega
la
62
. Pu
ttal
am
71
. An
ura
dh
apu
ra
72
. Po
lon
nar
uw
a
81
. Bad
ulla
82
. Mo
ne
raga
la
91
. Rat
nap
ura
92
. Keg
alle
F73: Government Schools by Size of Teacher Population and District -2020
Less 10 10-25 26-50 51-100 More than 100
Page 65
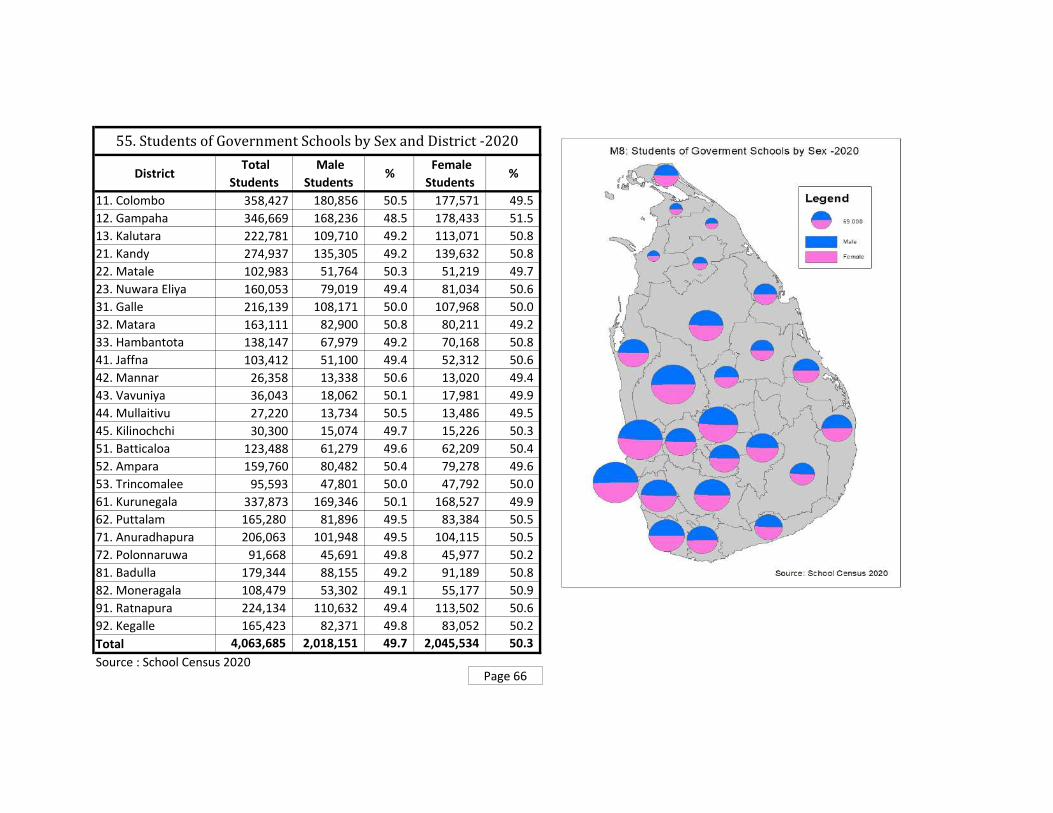
District Total
Students
Male
Students %
Female
Students %
11. Colombo 358,427 180,856 50.5 177,571 49.5
12. Gampaha 346,669 168,236 48.5 178,433 51.5
13. Kalutara 222,781 109,710 49.2 113,071 50.8
21. Kandy 274,937 135,305 49.2 139,632 50.8
22. Matale 102,983 51,764 50.3 51,219 49.7
23. Nuwara Eliya 160,053 79,019 49.4 81,034 50.6
31. Galle 216,139 108,171 50.0 107,968 50.0
32. Matara 163,111 82,900 50.8 80,211 49.2
33. Hambantota 138,147 67,979 49.2 70,168 50.8
41. Jaffna 103,412 51,100 49.4 52,312 50.6
42. Mannar 26,358 13,338 50.6 13,020 49.4
43. Vavuniya 36,043 18,062 50.1 17,981 49.9
44. Mullaitivu 27,220 13,734 50.5 13,486 49.5
45. Kilinochchi 30,300 15,074 49.7 15,226 50.3
51. Batticaloa 123,488 61,279 49.6 62,209 50.4
52. Ampara 159,760 80,482 50.4 79,278 49.6
53. Trincomalee 95,593 47,801 50.0 47,792 50.0
61. Kurunegala 337,873 169,346 50.1 168,527 49.9
62. Puttalam 165,280 81,896 49.5 83,384 50.5
71. Anuradhapura 206,063 101,948 49.5 104,115 50.5
72. Polonnaruwa 91,668 45,691 49.8 45,977 50.2
81. Badulla 179,344 88,155 49.2 91,189 50.8
82. Moneragala 108,479 53,302 49.1 55,177 50.9
91. Ratnapura 224,134 110,632 49.4 113,502 50.6
92. Kegalle 165,423 82,371 49.8 83,052 50.2
Total 4,063,685 2,018,151 49.7 2,045,534 50.3
Source : School Census 2020
55. Students of Government Schools by Sex and District -2020
Page 66

District Sinhala
Medium %
Tamil
Medium % Bilingual %
Total
Students
11. Colombo 306,670 85.6 33,405 9.3 18,352 5.1 358,427
12. Gampaha 321,389 92.7 16,838 4.9 8,442 2.4 346,669
13. Kalutara 189,625 85.1 30,094 13.5 3,062 1.4 222,781
21. Kandy 200,094 72.8 64,232 23.4 10,611 3.9 274,937
22. Matale 82,069 79.7 18,890 18.3 2,024 2.0 102,983
23. Nuwara Eliya 62,127 38.8 96,578 60.3 1,348 0.8 160,053
31. Galle 206,893 95.7 4,782 2.2 4,464 2.1 216,139
32. Matara 152,077 93.2 7,386 4.5 3,648 2.2 163,111
33. Hambantota 132,839 96.2 2,684 1.9 2,624 1.9 138,147
41. Jaffna - - 100,032 96.7 3,380 3.3 103,412
42. Mannar - - 25,951 98.5 407 1.5 26,358
43. Vavuniya 3,949 11.0 31,623 87.7 471 1.3 36,043
44. Mullaitivu 2,109 7.7 25,071 92.1 40 0.1 27,220
45. Kilinochchi - - 30,293 100.0 7 0.0 30,300
51. Batticaloa 483 0.4 122,475 99.2 530 0.4 123,488
52. Ampara 56,359 35.3 99,479 62.3 3,922 2.5 159,760
53. Trincomalee 23,063 24.1 71,763 75.1 767 0.8 95,593
61. Kurunegala 297,290 88.0 29,816 8.8 10,767 3.2 337,873
62. Puttalam 119,987 72.6 42,608 25.8 2,685 1.6 165,280
71. Anuradhapura 182,885 88.8 19,537 9.5 3,641 1.8 206,063
72. Polonnaruwa 81,220 88.6 9,644 10.5 804 0.9 91,668
81. Badulla 128,103 71.4 47,294 26.4 3,947 2.2 179,344
82. Moneragala 100,515 92.7 4,822 4.4 3,142 2.9 108,479
91. Ratnapura 194,118 86.6 25,074 11.2 4,942 2.2 224,134
92. Kegalle 134,269 81.2 25,785 15.6 5,369 3.2 165,423
Total 2,978,133 73.3 986,156 24.3 99,396 2.4 4,063,685
Source : School Census 2020
56. Students of Government Schools by Lang. Medium of Study and District - 2020
Page 67

District
Primary
Cycle (Grade
1-5)
Junior
Secondary
Cycle (Grade
6-9 )
Senior
Secondary
O/L Cycle
(Grade 10-
11)
Senior
Secondary
A/L Cycle
(Grade 12-
13)
Special
Education
Unit
Total
11. Colombo 129,872 123,000 60,241 44,974 340 358,427
12. Gampaha 136,734 116,042 56,044 37,337 512 346,669
13. Kalutara 89,504 74,443 35,330 23,161 343 222,781
21. Kandy 110,154 89,768 43,207 31,366 442 274,937
22. Matale 43,358 33,237 15,699 10,508 181 102,983
23. Nuwara Eliya 66,277 54,522 24,960 14,037 257 160,053
31. Galle 84,831 73,256 34,314 23,409 329 216,139
32. Matara 65,148 54,366 25,443 17,811 343 163,111
33. Hambantota 57,951 44,675 20,906 14,372 243 138,147
41. Jaffna 40,520 33,441 18,509 10,633 309 103,412
42. Mannar 10,811 8,722 4,250 2,507 68 26,358
43. Vavuniya 15,221 11,843 5,664 3,201 114 36,043
44. Mullaitivu 11,102 9,492 4,313 2,209 104 27,220
45. Kilinochchi 11,180 10,860 5,260 2,790 210 30,300
51. Batticaloa 49,916 42,864 19,774 10,767 167 123,488
52. Ampara 65,736 54,571 24,339 14,556 558 159,760
53. Trincomalee 40,298 33,520 13,798 7,752 225 95,593
61. Kurunegala 137,225 110,594 52,601 36,733 720 337,873
62. Puttalam 69,739 56,947 24,429 13,865 300 165,280
71. Anuradhapura 87,853 68,489 30,273 19,082 366 206,063
72. Polonnaruwa 39,323 30,158 13,718 8,273 196 91,668
81. Badulla 73,046 59,032 28,187 18,828 251 179,344
82. Moneragala 47,061 35,294 15,569 10,371 184 108,479
91. Ratnapura 91,373 74,489 34,055 23,823 394 224,134
92. Kegalle 66,414 53,812 26,102 18,749 346 165,423
Total 1,640,647 1,357,437 636,985 421,114 7,502 4,063,685
Source : School Census 2020
57. Students of Govt. Schools by Grade Cycle of Study and District -2020
Page 68
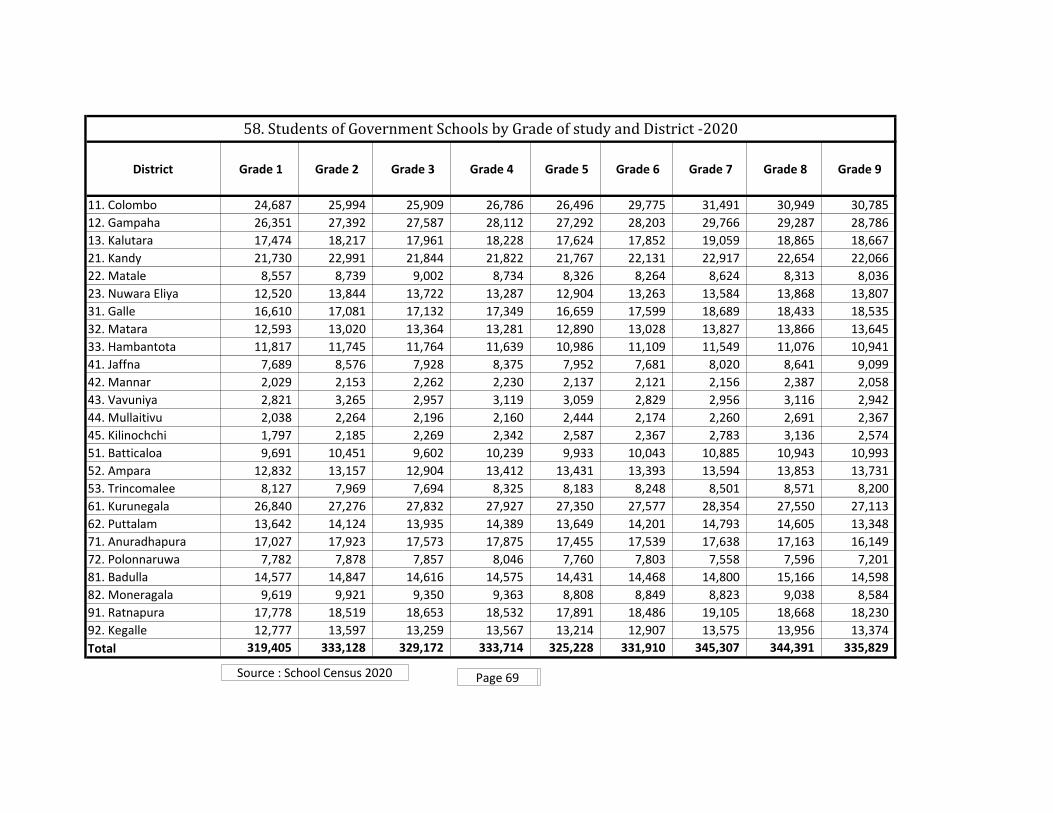
District Grade 1 Grade 2 Grade 3 Grade 4 Grade 5 Grade 6 Grade 7 Grade 8 Grade 9
11. Colombo 24,687 25,994 25,909 26,786 26,496 29,775 31,491 30,949 30,785
12. Gampaha 26,351 27,392 27,587 28,112 27,292 28,203 29,766 29,287 28,786
13. Kalutara 17,474 18,217 17,961 18,228 17,624 17,852 19,059 18,865 18,667
21. Kandy 21,730 22,991 21,844 21,822 21,767 22,131 22,917 22,654 22,066
22. Matale 8,557 8,739 9,002 8,734 8,326 8,264 8,624 8,313 8,036
23. Nuwara Eliya 12,520 13,844 13,722 13,287 12,904 13,263 13,584 13,868 13,807
31. Galle 16,610 17,081 17,132 17,349 16,659 17,599 18,689 18,433 18,535
32. Matara 12,593 13,020 13,364 13,281 12,890 13,028 13,827 13,866 13,645
33. Hambantota 11,817 11,745 11,764 11,639 10,986 11,109 11,549 11,076 10,941
41. Jaffna 7,689 8,576 7,928 8,375 7,952 7,681 8,020 8,641 9,099
42. Mannar 2,029 2,153 2,262 2,230 2,137 2,121 2,156 2,387 2,058
43. Vavuniya 2,821 3,265 2,957 3,119 3,059 2,829 2,956 3,116 2,942
44. Mullaitivu 2,038 2,264 2,196 2,160 2,444 2,174 2,260 2,691 2,367
45. Kilinochchi 1,797 2,185 2,269 2,342 2,587 2,367 2,783 3,136 2,574
51. Batticaloa 9,691 10,451 9,602 10,239 9,933 10,043 10,885 10,943 10,993
52. Ampara 12,832 13,157 12,904 13,412 13,431 13,393 13,594 13,853 13,731
53. Trincomalee 8,127 7,969 7,694 8,325 8,183 8,248 8,501 8,571 8,200
61. Kurunegala 26,840 27,276 27,832 27,927 27,350 27,577 28,354 27,550 27,113
62. Puttalam 13,642 14,124 13,935 14,389 13,649 14,201 14,793 14,605 13,348
71. Anuradhapura 17,027 17,923 17,573 17,875 17,455 17,539 17,638 17,163 16,149
72. Polonnaruwa 7,782 7,878 7,857 8,046 7,760 7,803 7,558 7,596 7,201
81. Badulla 14,577 14,847 14,616 14,575 14,431 14,468 14,800 15,166 14,598
82. Moneragala 9,619 9,921 9,350 9,363 8,808 8,849 8,823 9,038 8,584
91. Ratnapura 17,778 18,519 18,653 18,532 17,891 18,486 19,105 18,668 18,230
92. Kegalle 12,777 13,597 13,259 13,567 13,214 12,907 13,575 13,956 13,374
Total 319,405 333,128 329,172 333,714 325,228 331,910 345,307 344,391 335,829
58. Students of Government Schools by Grade of study and District -2020
Page 69Page 69Source : School Census 2020

District
11. Colombo
12. Gampaha
13. Kalutara
21. Kandy
22. Matale
23. Nuwara Eliya
31. Galle
32. Matara
33. Hambantota
41. Jaffna
42. Mannar
43. Vavuniya
44. Mullaitivu
45. Kilinochchi
51. Batticaloa
52. Ampara
53. Trincomalee
61. Kurunegala
62. Puttalam
71. Anuradhapura
72. Polonnaruwa
81. Badulla
82. Moneragala
91. Ratnapura
92. Kegalle
Total
58. Students of Government Schools by Grade of study and District -2020
Grade 10 Grade 11 Grade 11
Repeaters
Grade- 12
(A/L 2022)
Grade-13
(A/L 2021)
Special
Education
Unit
Total
30,357 29,753 131 23,250 21,724 340 358,427
28,388 27,606 50 19,202 18,135 512 346,669
18,055 16,899 376 11,871 11,290 343 222,781
21,552 21,385 270 16,175 15,191 442 274,937
7,757 7,839 103 5,540 4,968 181 102,983
12,764 11,918 278 7,365 6,672 257 160,053
17,269 16,870 175 12,080 11,329 329 216,139
13,059 12,039 345 9,232 8,579 343 163,111
10,504 10,021 381 7,413 6,959 243 138,147
8,876 8,522 1,111 5,403 5,230 309 103,412
2,078 1,812 360 1,267 1,240 68 26,358
2,827 2,656 181 1,609 1,592 114 36,043
2,162 1,840 311 1,126 1,083 104 27,220
2,521 2,421 318 1,482 1,308 210 30,300
10,400 8,338 1,036 5,520 5,247 167 123,488
12,560 10,718 1,061 7,554 7,002 558 159,760
7,123 6,093 582 4,019 3,733 225 95,593
26,662 25,428 511 19,208 17,525 720 337,873
12,572 11,527 330 7,156 6,709 300 165,280
15,284 14,673 316 9,925 9,157 366 206,063
7,009 6,588 121 4,310 3,963 196 91,668
14,211 13,680 296 9,957 8,871 251 179,344
7,696 7,676 197 5,440 4,931 184 108,479
17,141 16,504 410 12,530 11,293 394 224,134
13,058 12,760 284 9,557 9,192 346 165,423
321,885 305,566 9,534 218,191 202,923 7,502 4,063,685
58. Students of Government Schools by Grade of study and District -2020 (Cont.,)
Page 70Source : School Census 2020
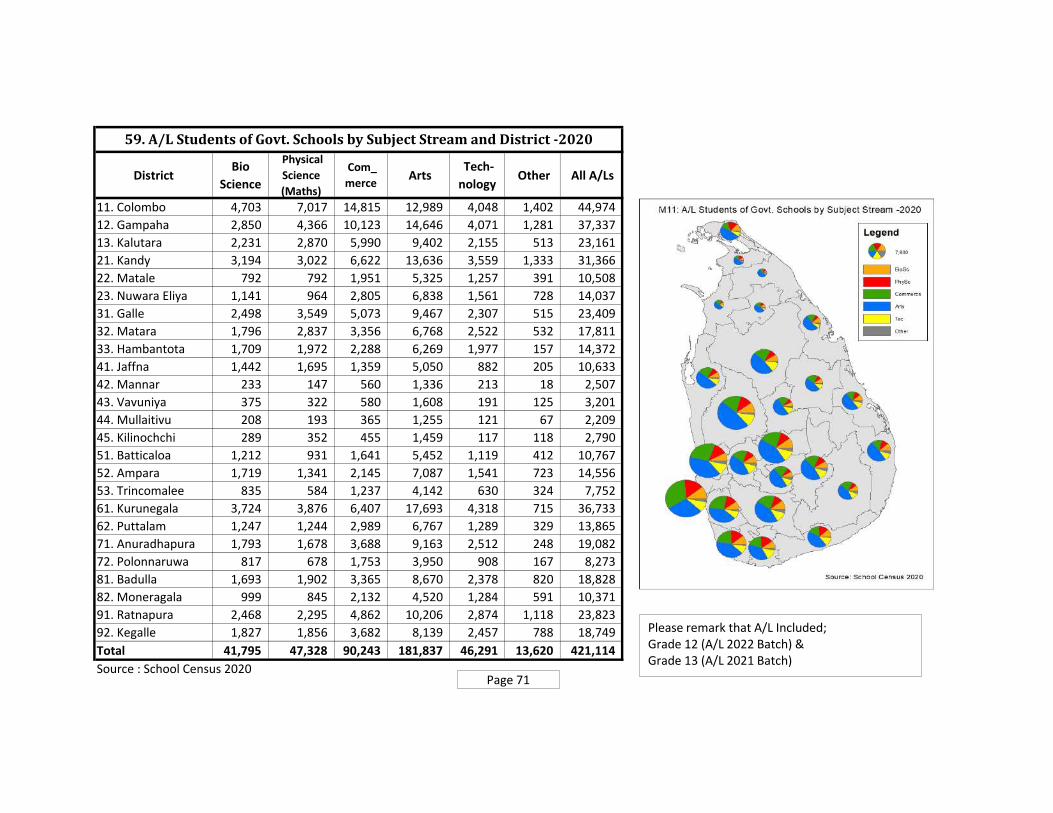
DistrictBio
Science
Physical
Science
(Maths)
Com_
merce Arts
Tech-
nology Other All A/Ls
11. Colombo 4,703 7,017 14,815 12,989 4,048 1,402 44,974
12. Gampaha 2,850 4,366 10,123 14,646 4,071 1,281 37,337
13. Kalutara 2,231 2,870 5,990 9,402 2,155 513 23,161
21. Kandy 3,194 3,022 6,622 13,636 3,559 1,333 31,366
22. Matale 792 792 1,951 5,325 1,257 391 10,508
23. Nuwara Eliya 1,141 964 2,805 6,838 1,561 728 14,037
31. Galle 2,498 3,549 5,073 9,467 2,307 515 23,409
32. Matara 1,796 2,837 3,356 6,768 2,522 532 17,811
33. Hambantota 1,709 1,972 2,288 6,269 1,977 157 14,372
41. Jaffna 1,442 1,695 1,359 5,050 882 205 10,633
42. Mannar 233 147 560 1,336 213 18 2,507
43. Vavuniya 375 322 580 1,608 191 125 3,201
44. Mullaitivu 208 193 365 1,255 121 67 2,209
45. Kilinochchi 289 352 455 1,459 117 118 2,790
51. Batticaloa 1,212 931 1,641 5,452 1,119 412 10,767
52. Ampara 1,719 1,341 2,145 7,087 1,541 723 14,556
53. Trincomalee 835 584 1,237 4,142 630 324 7,752
61. Kurunegala 3,724 3,876 6,407 17,693 4,318 715 36,733
62. Puttalam 1,247 1,244 2,989 6,767 1,289 329 13,865
71. Anuradhapura 1,793 1,678 3,688 9,163 2,512 248 19,082
72. Polonnaruwa 817 678 1,753 3,950 908 167 8,273
81. Badulla 1,693 1,902 3,365 8,670 2,378 820 18,828
82. Moneragala 999 845 2,132 4,520 1,284 591 10,371
91. Ratnapura 2,468 2,295 4,862 10,206 2,874 1,118 23,823
92. Kegalle 1,827 1,856 3,682 8,139 2,457 788 18,749
Total 41,795 47,328 90,243 181,837 46,291 13,620 421,114
Source : School Census 2020
59. A/L Students of Govt. Schools by Subject Stream and District -2020
Page 71
Please remark that A/L Included;Grade 12 (A/L 2022 Batch) &Grade 13 (A/L 2021 Batch)
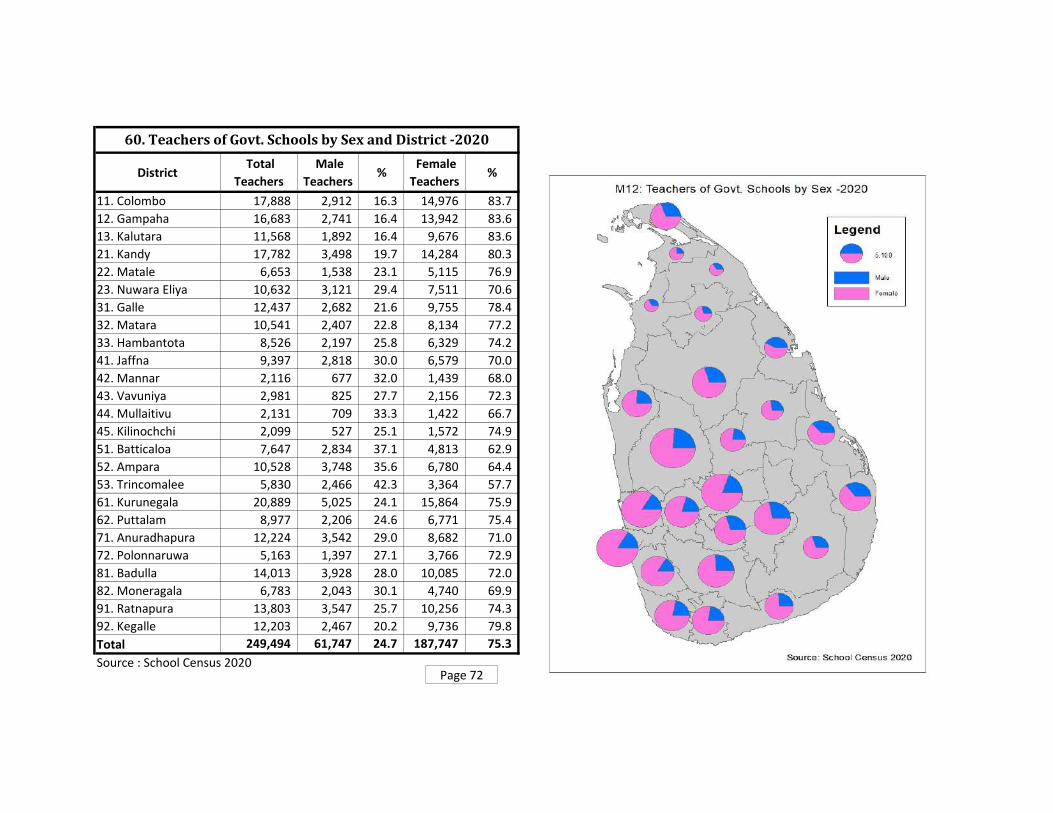
District Total
Teachers
Male
Teachers %
Female
Teachers %
11. Colombo 17,888 2,912 16.3 14,976 83.7
12. Gampaha 16,683 2,741 16.4 13,942 83.6
13. Kalutara 11,568 1,892 16.4 9,676 83.6
21. Kandy 17,782 3,498 19.7 14,284 80.3
22. Matale 6,653 1,538 23.1 5,115 76.9
23. Nuwara Eliya 10,632 3,121 29.4 7,511 70.6
31. Galle 12,437 2,682 21.6 9,755 78.4
32. Matara 10,541 2,407 22.8 8,134 77.2
33. Hambantota 8,526 2,197 25.8 6,329 74.2
41. Jaffna 9,397 2,818 30.0 6,579 70.0
42. Mannar 2,116 677 32.0 1,439 68.0
43. Vavuniya 2,981 825 27.7 2,156 72.3
44. Mullaitivu 2,131 709 33.3 1,422 66.7
45. Kilinochchi 2,099 527 25.1 1,572 74.9
51. Batticaloa 7,647 2,834 37.1 4,813 62.9
52. Ampara 10,528 3,748 35.6 6,780 64.4
53. Trincomalee 5,830 2,466 42.3 3,364 57.7
61. Kurunegala 20,889 5,025 24.1 15,864 75.9
62. Puttalam 8,977 2,206 24.6 6,771 75.4
71. Anuradhapura 12,224 3,542 29.0 8,682 71.0
72. Polonnaruwa 5,163 1,397 27.1 3,766 72.9
81. Badulla 14,013 3,928 28.0 10,085 72.0
82. Moneragala 6,783 2,043 30.1 4,740 69.9
91. Ratnapura 13,803 3,547 25.7 10,256 74.3
92. Kegalle 12,203 2,467 20.2 9,736 79.8
Total 249,494 61,747 24.7 187,747 75.3
Source : School Census 2020
60. Teachers of Govt. Schools by Sex and District -2020
Page 72
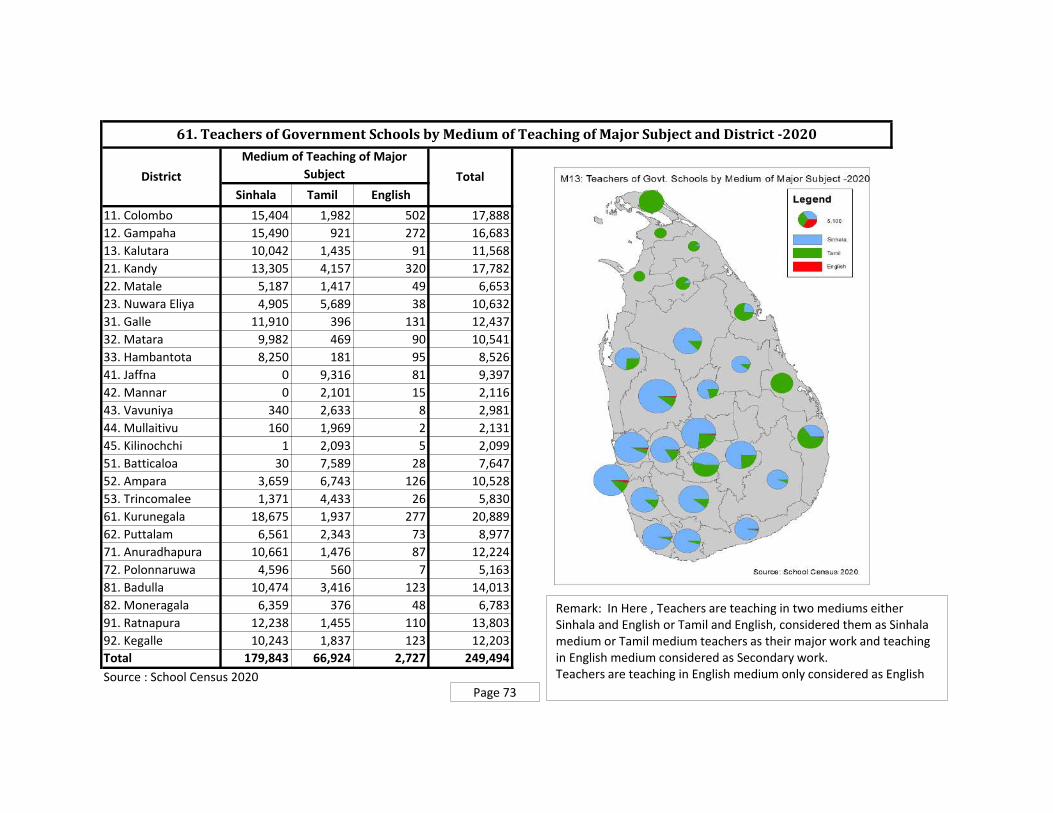
Sinhala Tamil English
11. Colombo 15,404 1,982 502 17,888
12. Gampaha 15,490 921 272 16,683
13. Kalutara 10,042 1,435 91 11,568
21. Kandy 13,305 4,157 320 17,782
22. Matale 5,187 1,417 49 6,653
23. Nuwara Eliya 4,905 5,689 38 10,632
31. Galle 11,910 396 131 12,437
32. Matara 9,982 469 90 10,541
33. Hambantota 8,250 181 95 8,526
41. Jaffna 0 9,316 81 9,397
42. Mannar 0 2,101 15 2,116
43. Vavuniya 340 2,633 8 2,981
44. Mullaitivu 160 1,969 2 2,131
45. Kilinochchi 1 2,093 5 2,099
51. Batticaloa 30 7,589 28 7,647
52. Ampara 3,659 6,743 126 10,528
53. Trincomalee 1,371 4,433 26 5,830
61. Kurunegala 18,675 1,937 277 20,889
62. Puttalam 6,561 2,343 73 8,977
71. Anuradhapura 10,661 1,476 87 12,224
72. Polonnaruwa 4,596 560 7 5,163
81. Badulla 10,474 3,416 123 14,013
82. Moneragala 6,359 376 48 6,783
91. Ratnapura 12,238 1,455 110 13,803
92. Kegalle 10,243 1,837 123 12,203
Total 179,843 66,924 2,727 249,494
Source : School Census 2020
District
Medium of Teaching of Major
Subject Total
61. Teachers of Government Schools by Medium of Teaching of Major Subject and District -2020
Page 73
Remark: In Here , Teachers are teaching in two mediums either Sinhala and English or Tamil and English, considered them as Sinhala medium or Tamil medium teachers as their major work and teaching in English medium considered as Secondary work.Teachers are teaching in English medium only considered as English

Graduate Trained TraineeUntrained
and Other
11. Colombo 10,431 6,578 738 141 17,888 58.3 95.1
12. Gampaha 9,701 6,297 617 68 16,683 58.1 95.9
13. Kalutara 6,391 4,321 750 106 11,568 55.2 92.6
21. Kandy 8,835 8,742 100 105 17,782 49.7 98.8
22. Matale 2,954 3,609 56 34 6,653 44.4 98.6
23. Nuwara Eliya 3,529 6,744 101 258 10,632 33.2 96.6
31. Galle 6,453 5,916 38 30 12,437 51.9 99.5
32. Matara 5,598 4,900 20 23 10,541 53.1 99.6
33. Hambantota 4,175 4,316 25 10 8,526 49.0 99.6
41. Jaffna 5,153 4,019 208 17 9,397 54.8 97.6
42. Mannar 772 1,240 82 22 2,116 36.5 95.1
43. Vavuniya 1,108 1,762 89 22 2,981 37.2 96.3
44. Mullaitivu 764 1,227 99 41 2,131 35.9 93.4
45. Kilinochchi 845 1,141 84 29 2,099 40.3 94.6
51. Batticaloa 3,711 3,796 108 32 7,647 48.5 98.2
52. Ampara 4,325 5,877 268 58 10,528 41.1 96.9
53. Trincomalee 2,185 3,265 311 69 5,830 37.5 93.5
61. Kurunegala 10,682 9,807 328 72 20,889 51.1 98.1
62. Puttalam 4,235 4,630 52 60 8,977 47.2 98.8
71. Anuradhapura 5,711 6,409 38 66 12,224 46.7 99.1
72. Polonnaruwa 2,515 2,460 156 32 5,163 48.7 96.4
81. Badulla 5,555 8,183 109 166 14,013 39.6 98.0
82. Moneragala 3,091 3,619 36 37 6,783 45.6 98.9
91. Ratnapura 6,334 7,353 57 59 13,803 45.9 99.2
92. Kegalle 6,516 5,585 55 47 12,203 53.4 99.2
Total 121,569 121,796 4,525 1,604 249,494 48.7 97.5
Source : School Census 2020
District TotalGrad.
%
Category of Appointment of TeachersProf.
Qualified %
62. Teachers of Govt. Schools by Category of Appointment by District - 2020
Page 74
Note: Grad. - GraduateProf. Qualified - Graduate teachers and trained teachers are consideredas Professionally Qualified Teachers

District
No. of
National
Schools
% No.of
Students %
No.of
Teachers % STR
Average
Students per
School
Average
Teachers
per School
Above 1,000
Students
Schools
Above 100
Teachers
Schools
11. Colombo 37 9.9 119,792 15.0 5,667 13.6 21.1 3,238 153 35 31
12. Gampaha 19 5.1 53,027 6.7 2,579 6.2 20.6 2,791 136 19 15
13. Kalutara 18 4.8 46,773 5.9 2,148 5.2 21.8 2,599 119 17 11
21. Kandy 35 9.4 58,212 7.3 3,407 8.2 17.1 1,663 97 25 11
22. Matale 12 3.2 22,890 2.9 1,199 2.9 19.1 1,908 100 11 7
23. Nuwara Eliya 7 1.9 8,031 1.0 522 1.3 15.4 1,147 75 3 1
31. Galle 29 7.8 73,220 9.2 3,330 8.0 22.0 2,525 115 27 18
32. Matara 22 5.9 49,583 6.2 2,495 6.0 19.9 2,254 113 20 13
33. Hambantota 16 4.3 33,459 4.2 1,511 3.6 22.1 2,091 94 12 6
41. Jaffna 7 1.9 11,723 1.5 801 1.9 14.6 1,675 114 6 4
42. Mannar 5 1.3 5,456 0.7 396 1.0 13.8 1,091 79 3 1
43. Vavuniya 5 1.3 6,819 0.9 449 1.1 15.2 1,364 90 2 2
44. Mullaitivu 3 0.8 2,249 0.3 179 0.4 12.6 750 60 1 0
45. Kilinochchi 2 0.5 2,291 0.3 132 0.3 17.4 1,146 66 1 0
51. Batticaloa 13 3.5 21,309 2.7 1,212 2.9 17.6 1,639 93 12 5
52. Ampara 16 4.3 27,517 3.5 1,694 4.1 16.2 1,720 106 12 8
53. Trincomalee 11 2.9 17,441 2.2 945 2.3 18.5 1,586 86 9 2
61. Kurunegala 30 8.0 64,781 8.1 3,511 8.5 18.5 2,159 117 26 20
62. Puttalam 7 1.9 16,322 2.0 851 2.0 19.2 2,332 122 7 5
71. Anuradhapura 6 1.6 16,539 2.1 788 1.9 21.0 2,757 131 5 5
72. Polonnaruwa 9 2.4 17,186 2.2 834 2.0 20.6 1,910 93 8 3
81. Badulla 27 7.2 33144 4.2 2249 5.4 14.7 1,228 83 11 8
82. Moneragala 9 2.4 17,850 2.2 881 2.1 20.3 1,983 98 9 4
91. Ratnapura 14 3.8 35,362 4.4 1,788 4.3 19.8 2,526 128 13 11
92. Kegalle 14 3.8 35,836 4.5 1,970 4.7 18.2 2,560 141 13 11
Total 373 100.0 796,812 100.0 41,538 100.0 19.2 2,136 111 307 202
Source : School Census 2020
63. Basic Statistics of National Schools by District - 2020
Page 75

-
500
1,000
1,500
2,000
2,500
3,000
3,500
11
. Co
lom
bo
12
. Gam
pah
a
13
. Kal
uta
ra
21
. Kan
dy
22
. Mat
ale
23
. Nu
war
a El
iya
31
. Gal
le
32
. Mat
ara
33
. Ham
ban
tota
41
. Jaf
fna
42
. Man
nar
43
. Vav
un
iya
44
. Mu
llait
ivu
45
. Kili
no
chch
i
51
. Bat
tica
loa
52
. Am
par
a
53
. Tri
nco
mal
ee
61
. Ku
run
egal
a
62
. Pu
ttal
am
71
. An
ura
dh
apu
ra
72
. Po
lon
nar
uw
a
81
. Bad
ulla
82
. Mo
ner
agal
a
91
. Rat
nap
ura
92
. Keg
alle
F76: Average Students per National School by District -2020
-
20
40
60
80
100
120
140
160
11
. Co
lom
bo
12
. Gam
pah
a
13
. Kal
uta
ra
21
. Kan
dy
22
. Mat
ale
23
. Nu
war
a El
iya
31
. Gal
le
32
. Mat
ara
33
. Ham
ban
tota
41
. Jaf
fna
42
. Man
nar
43
. Vav
un
iya
44
. Mu
llait
ivu
45
. Kili
no
chch
i
51
. Bat
tica
loa
52
. Am
par
a
53
. Tri
nco
mal
ee
61
. Ku
run
egal
a
62
. Pu
ttal
am
71
. An
ura
dh
apu
ra
72
. Po
lon
nar
uw
a
81
. Bad
ulla
82
. Mo
ner
agal
a
91
. Rat
nap
ura
92
. Keg
alle
F77: Average Teachers per National School by District -2020
Page 76
-
25,000
50,000
75,000
100,000
125,0001
1. C
olo
mb
o
12
. Gam
pah
a
13
. Kal
uta
ra
21
. Kan
dy
22
. Mat
ale
23
. Nu
war
a El
iya
31
. Gal
le
32
. Mat
ara
33
. Ham
ban
tota
41
. Jaf
fna
42
. Man
nar
43
. Vav
un
iya
44
. Mu
llait
ivu
45
. Kili
no
chch
i
51
. Bat
tica
loa
52
. Am
par
a
53
. Tri
nco
mal
ee
61
. Ku
run
egal
a
62
. Pu
ttal
am
71
. An
ura
dh
apu
ra
72
. Po
lon
nar
uw
a
81
. Bad
ulla
82
. Mo
ner
agal
a
91
. Rat
nap
ura
92
. Keg
alle
F74: Students of National Schools by District -2020
0.0
5.0
10.0
15.0
20.0
25.0
11
. Co
lom
bo
12
. Gam
pah
a
13
. Kal
uta
ra
21
. Kan
dy
22
. Mat
ale
23
. Nu
war
a El
iya
31
. Gal
le
32
. Mat
ara
33
. Ham
ban
tota
41
. Jaf
fna
42
. Man
nar
43
. Vav
un
iya
44
. Mu
llait
ivu
45
. Kili
no
chch
i
51
. Bat
tica
loa
52
. Am
par
a
53
. Tri
nco
mal
ee
61
. Ku
run
egal
a
62
. Pu
ttal
am
71
. An
ura
dh
apu
ra
72
. Po
lon
nar
uw
a
81
. Bad
ulla
82
. Mo
ner
agal
a
91
. Rat
nap
ura
92
. Keg
alle
F75: STR of National Schools by District -2020

District No.of
Students
Male
Students %
Female
Students %
Sinhala
Medium
Tamil
Medium Bilingual Grade 1-5 Grade 6-9 Grade 10-11 Grade 12-13
11. Colombo 119,792 69,408 57.9 50,384 42.1 96,561 10,002 13,229 26,196 43,615 22,700 27,228
12. Gampaha 53,027 28,458 53.7 24,569 46.3 47,722 1,047 4,258 7,401 20,929 10,377 14,288
13. Kalutara 46,773 24,438 52.2 22,335 47.8 42,278 2,811 1,684 11,385 16,551 8,334 10,440
21. Kandy 58,212 28,199 48.4 30,013 51.6 41,750 10,786 5,676 9,157 23,633 11,579 13,785
22. Matale 22,890 11,645 50.9 11,245 49.1 13,920 7,060 1,910 4,872 8,655 4,359 4,968
23. Nuwara Eliya 8,031 4,113 51.2 3,918 48.8 6,964 678 389 - 3,706 2,041 2,267
31. Galle 73,220 39,345 53.7 33,875 46.3 67,822 1,874 3,524 17,160 28,449 13,708 13,801
32. Matara 49,583 26,072 52.6 23,511 47.4 44,469 1,948 3,166 7,605 20,388 10,267 11,212
33. Hambantota 33,459 15,591 46.6 17,868 53.4 30,341 724 2,394 2,328 15,407 7,444 8,237
41. Jaffna 11,723 6,776 57.8 4,947 42.2 - 9,787 1,936 1,200 5,422 2,613 2,474
42. Mannar 5,456 2,778 50.9 2,678 49.1 - 5,049 407 1,667 1,876 1,040 849
43. Vavuniya 6,819 3,585 52.6 3,234 47.4 732 5,651 436 2,294 2,309 1,090 1,105
44. Mullaitivu 2,249 1,071 47.6 1,178 52.4 618 1,594 37 249 967 472 546
45. Kilinochchi 2,291 1,164 50.8 1,127 49.2 - 2,291 - - 1,091 467 723
51. Batticaloa 21,309 12,148 57.0 9,161 43.0 - 21,010 299 4,384 8,251 4,507 4,167
52. Ampara 27,517 15,232 55.4 12,285 44.6 8,782 16,352 2,383 2,611 11,404 6,635 6,793
53. Trincomalee 17,441 8,970 51.4 8,471 48.6 4,260 12,516 665 5,395 6,344 2,896 2,729
61. Kurunegala 64,781 32,157 49.6 32,624 50.4 54,843 5,071 4,867 10,851 25,439 12,544 15,839
62. Puttalam 16,322 10,857 66.5 5,465 33.5 12,137 3,109 1,076 3,268 6,459 3,031 3,517
71. Anuradhapura 16,539 5,825 35.2 10,714 64.8 14,099 811 1,629 1,633 6,965 3,452 4,477
72. Polonnaruwa 17,186 7,983 46.5 9,203 53.5 15,486 1,067 633 616 8,468 3,925 4,159
81. Badulla 33144 15,487 46.7 17657 53.3 28235 2,579 2,330 5,454 12,871 6,541 8,190
82. Moneragala 17,850 8,871 49.7 8,979 50.3 15,605 - 2,245 942 8,459 3,921 4,473
91. Ratnapura 35,362 15,653 44.3 19,709 55.7 31,734 898 2,730 3,774 14,252 7,084 10,209
92. Kegalle 35,836 16,957 47.3 18,879 52.7 30,253 2,741 2,842 6,252 12,880 6,533 10,084
Total 796,812 412,783 51.8 384,029 48.2 608,611 127,456 60,745 136,694 314,790 157,560 186,560
Source : School Census 2020
64. Basic Statistics of Students of National Schools by District - 2020
Page 77

0%
20%
40%
60%
80%
100%
11
. Co
lom
bo
12
. Gam
pah
a
13
. Kal
uta
ra
21
. Kan
dy
22
. Mat
ale
23
. Nu
war
a El
iya
31
. Gal
le
32
. Mat
ara
33
. Ham
ban
tota
41
. Jaf
fna
42
. Man
nar
43
. Vav
un
iya
44
. Mu
llait
ivu
45
. Kili
no
chch
i
51
. Bat
tica
loa
52
. Am
par
a
53
. Tri
nco
mal
ee
61
. Ku
run
ega
la
62
. Pu
ttal
am
71
. An
ura
dh
apu
ra
72
. Po
lon
nar
uw
a
81
. Bad
ulla
82
. Mo
ner
agal
a
91
. Rat
nap
ura
92
. Keg
alle
F80: Students of National School by Cycle of Study & District -2020
Grade 1-5 Grade 6-9 Grade 10-11 Grade 12-13
- 2,500 5,000
7,500 10,000 12,500 15,000
17,500 20,000 22,500
11
. Co
lom
bo
12
. Gam
pah
a
13
. Kal
uta
ra
21
. Kan
dy
22
. Mat
ale
23
. Nu
war
a El
iya
31
. Gal
le
32
. Mat
ara
33
. Ham
ban
tota
41
. Jaf
fna
42
. Man
nar
43
. Vav
un
iya
44
. Mu
llait
ivu
45
. Kili
no
chch
i
51
. Bat
tica
loa
52
. Am
par
a
53
. Tri
nco
mal
ee
61
. Ku
run
egal
a
62
. Pu
ttal
am
71
. An
ura
dh
apu
ra
72
. Po
lon
nar
uw
a
81
. Bad
ulla
82
. Mo
ner
agal
a
91
. Rat
nap
ura
92
. Keg
alle
F81: Tamil Medium Students of National School by District -2020
Page 78
0%10%20%30%40%50%60%70%80%90%
100%
11
. Co
lom
bo
12
. Gam
pah
a
13
. Kal
uta
ra
21
. Kan
dy
22
. Mat
ale
23
. Nu
war
a El
iya
31
. Gal
le
32
. Mat
ara
33
. Ham
ban
tota
41
. Jaf
fna
42
. Man
nar
43
. Vav
un
iya
44
. Mu
llait
ivu
45
. Kili
no
chch
i
51
. Bat
tica
loa
52
. Am
par
a
53
. Tri
nco
mal
ee
61
. Ku
run
egal
a
62
. Pu
ttal
am
71
. An
ura
dh
apu
ra
72
. Po
lon
nar
uw
a
81
. Bad
ulla
82
. Mo
ner
agal
a
91
. Rat
nap
ura
92
. Keg
alle
F78: Students of National Schools by Sex and District -2020
Male Students Female Students
0%
20%
40%
60%
80%
100%
11
. Co
lom
bo
12
. Gam
pah
a
13
. Kal
uta
ra
21
. Kan
dy
22
. Mat
ale
23
. Nu
war
a El
iya
31
. Gal
le
32
. Mat
ara
33
. Ham
ban
tota
41
. Jaf
fna
42
. Man
nar
43
. Vav
un
iya
44
. Mu
llait
ivu
45
. Kili
no
chch
i
51
. Bat
tica
loa
52
. Am
par
a
53
. Tri
nco
mal
ee
61
. Ku
run
egal
a
62
. Pu
ttal
am
71
. An
ura
dh
apu
ra
72
. Po
lon
nar
uw
a
81
. Bad
ulla
82
. Mo
ner
agal
a
91
. Rat
nap
ura
92
. Keg
alle
F79: Students of National Schools by Medium and District -2020
Sinhala Medium Tamil Medium Bilingual

District
No. of
Prov.
Schools
% No.of
Students %
No.of
Teachers % STR
Average
Students per
School
Average
Teachers
per School
Above 1,000
Students
Schools
Above 100
Teachers
Schools
11. Colombo 362 3.7 238,635 7.3 12,221 5.9 19.5 659 34 73 14
12. Gampaha 517 5.3 293,642 9.0 14,104 6.8 20.8 568 27 84 5
13. Kalutara 402 4.1 176,008 5.4 9,420 4.5 18.7 438 23 47 5
21. Kandy 616 6.3 216,725 6.6 14,375 6.9 15.1 352 23 38 11
22. Matale 305 3.1 80,093 2.5 5,454 2.6 14.7 263 18 8 0
23. Nuwara Eliya 543 5.6 152,022 4.7 10,110 4.9 15.0 280 19 21 2
31. Galle 400 4.1 142,919 4.4 9,107 4.4 15.7 357 23 33 2
32. Matara 336 3.4 113,528 3.5 8,046 3.9 14.1 338 24 23 1
33. Hambantota 304 3.1 104,688 3.2 7,015 3.4 14.9 344 23 22 1
41. Jaffna 441 4.5 91,689 2.8 8,596 4.1 10.7 208 19 10 2
42. Mannar 128 1.3 20,902 0.6 1,720 0.8 12.2 163 13 0 0
43. Vavuniya 168 1.7 29,224 0.9 2,532 1.2 11.5 174 15 2 2
44. Mullaitivu 124 1.3 24,971 0.8 1,952 0.9 12.8 201 16 1 0
45. Kilinochchi 102 1.0 28,009 0.9 1,967 0.9 14.2 275 19 1 0
51. Batticaloa 349 3.6 102,179 3.1 6,435 3.1 15.9 293 18 12 1
52. Ampara 424 4.3 132,243 4.0 8,834 4.2 15.0 312 21 21 2
53. Trincomalee 302 3.1 78,152 2.4 4,885 2.3 16.0 259 16 5 0
61. Kurunegala 843 8.6 273,092 8.4 17,378 8.4 15.7 324 21 52 9
62. Puttalam 365 3.7 148,958 4.6 8,126 3.9 18.3 408 22 32 1
71. Anuradhapura 556 5.7 189,524 5.8 11,436 5.5 16.6 341 21 29 4
72. Polonnaruwa 244 2.5 74,482 2.3 4,329 2.1 17.2 305 18 10 0
81. Badulla 578 5.9 146200 4.5 11764 5.7 12.4 253 20 20 5
82. Moneragala 282 2.9 90,629 2.8 5,902 2.8 15.4 321 21 10 0
91. Ratnapura 584 6.0 188,772 5.8 12,015 5.8 15.7 323 21 48 2
92. Kegalle 507 5.2 129,587 4.0 10,233 4.9 12.7 256 20 21 3
Total 9,782 100.0 3,266,873 100.0 207,956 100.0 15.7 334 21 623 72
Source : School Census 2020
65. Basic Statistics of Provincial Schools by District - 2020
Page 79

-
100
200
300
400
500
600
700
11
. Co
lom
bo
12
. Gam
pah
a
13
. Kal
uta
ra
21
. Kan
dy
22
. Mat
ale
23
. Nu
war
a El
iya
31
. Gal
le
32
. Mat
ara
33
. Ham
ban
tota
41
. Jaf
fna
42
. Man
nar
43
. Vav
un
iya
44
. Mu
llait
ivu
45
. Kili
no
chch
i
51
. Bat
tica
loa
52
. Am
par
a
53
. Tri
nco
mal
ee
61
. Ku
run
ega
la
62
. Pu
ttal
am
71
. An
ura
dh
apu
ra
72
. Po
lon
nar
uw
a
81
. Bad
ulla
82
. Mo
ner
agal
a
91
. Rat
nap
ura
92
. Keg
alle
F84: Average Students per Provincial School by District -2020
-
5
10
15
20
25
30
35
11
. Co
lom
bo
12
. Gam
pah
a
13
. Kal
uta
ra
21
. Kan
dy
22
. Mat
ale
23
. Nu
war
a El
iya
31
. Gal
le
32
. Mat
ara
33
. Ham
ban
tota
41
. Jaf
fna
42
. Man
nar
43
. Vav
un
iya
44
. Mu
llait
ivu
45
. Kili
no
chch
i
51
. Bat
tica
loa
52
. Am
par
a
53
. Tri
nco
mal
ee
61
. Ku
run
egal
a
62
. Pu
ttal
am
71
. An
ura
dh
apu
ra
72
. Po
lon
nar
uw
a
81
. Bad
ulla
82
. Mo
ner
agal
a
91
. Rat
nap
ura
92
. Keg
alle
F85: Average Teachers per Provincial School by District -2020
Page 80
-
50,000
100,000
150,000
200,000
250,000
300,0001
1. C
olo
mb
o
12
. Gam
pah
a
13
. Kal
uta
ra
21
. Kan
dy
22
. Mat
ale
23
. Nu
war
a El
iya
31
. Gal
le
32
. Mat
ara
33
. Ham
ban
tota
41
. Jaf
fna
42
. Man
nar
43
. Vav
un
iya
44
. Mu
llait
ivu
45
. Kili
no
chch
i
51
. Bat
tica
loa
52
. Am
par
a
53
. Tri
nco
mal
ee
61
. Ku
run
egal
a
62
. Pu
ttal
am
71
. An
ura
dh
apu
ra
72
. Po
lon
nar
uw
a
81
. Bad
ulla
82
. Mo
ner
agal
a
91
. Rat
nap
ura
92
. Keg
alle
F82: Students of Provincial Schools by District -2020
0.0
5.0
10.0
15.0
20.0
25.0
11
. Co
lom
bo
12
. Gam
pah
a
13
. Kal
uta
ra
21
. Kan
dy
22
. Mat
ale
23
. Nu
war
a El
iya
31
. Gal
le
32
. Mat
ara
33
. Ham
ban
tota
41
. Jaf
fna
42
. Man
nar
43
. Vav
un
iya
44
. Mu
llait
ivu
45
. Kili
no
chch
i
51
. Bat
tica
loa
52
. Am
par
a
53
. Tri
nco
mal
ee
61
. Ku
run
egal
a
62
. Pu
ttal
am
71
. An
ura
dh
apu
ra
72
. Po
lon
nar
uw
a
81
. Bad
ulla
82
. Mo
ner
agal
a
91
. Rat
nap
ura
92
. Keg
alle
F83: STR of Provincial Schools by District -2020
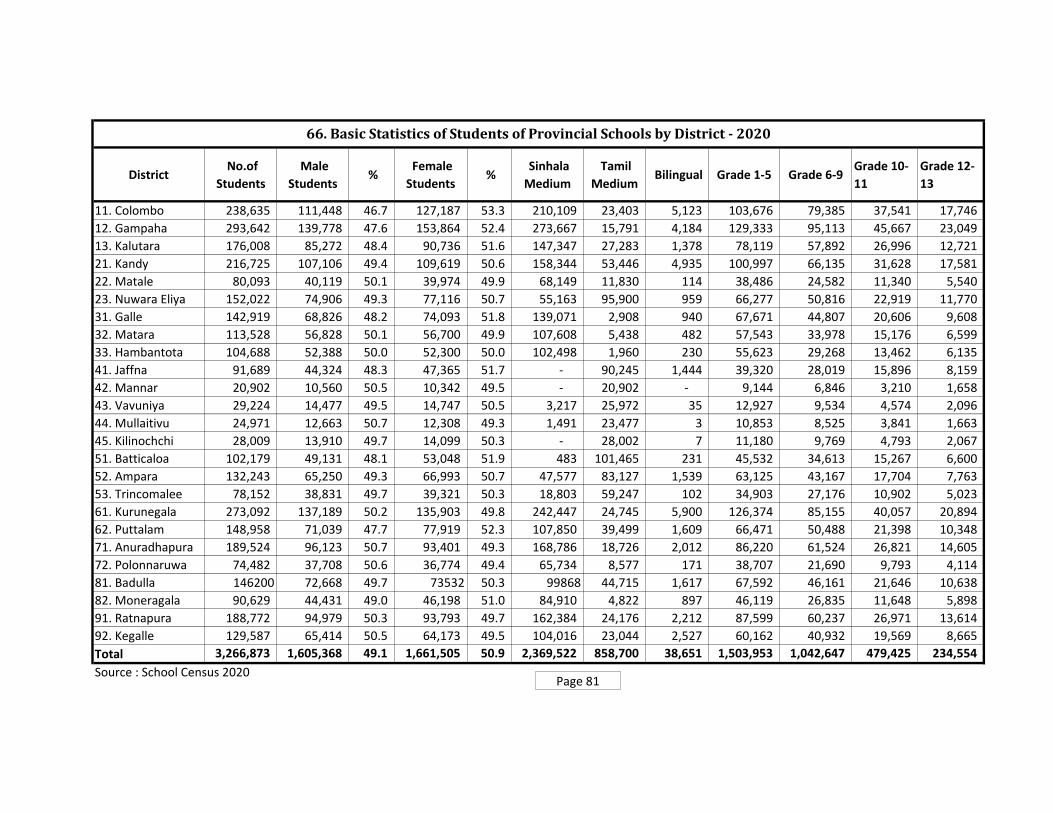
District No.of
Students
Male
Students %
Female
Students %
Sinhala
Medium
Tamil
Medium Bilingual Grade 1-5 Grade 6-9
Grade 10-
11
Grade 12-
13
11. Colombo 238,635 111,448 46.7 127,187 53.3 210,109 23,403 5,123 103,676 79,385 37,541 17,746
12. Gampaha 293,642 139,778 47.6 153,864 52.4 273,667 15,791 4,184 129,333 95,113 45,667 23,049
13. Kalutara 176,008 85,272 48.4 90,736 51.6 147,347 27,283 1,378 78,119 57,892 26,996 12,721
21. Kandy 216,725 107,106 49.4 109,619 50.6 158,344 53,446 4,935 100,997 66,135 31,628 17,581
22. Matale 80,093 40,119 50.1 39,974 49.9 68,149 11,830 114 38,486 24,582 11,340 5,540
23. Nuwara Eliya 152,022 74,906 49.3 77,116 50.7 55,163 95,900 959 66,277 50,816 22,919 11,770
31. Galle 142,919 68,826 48.2 74,093 51.8 139,071 2,908 940 67,671 44,807 20,606 9,608
32. Matara 113,528 56,828 50.1 56,700 49.9 107,608 5,438 482 57,543 33,978 15,176 6,599
33. Hambantota 104,688 52,388 50.0 52,300 50.0 102,498 1,960 230 55,623 29,268 13,462 6,135
41. Jaffna 91,689 44,324 48.3 47,365 51.7 - 90,245 1,444 39,320 28,019 15,896 8,159
42. Mannar 20,902 10,560 50.5 10,342 49.5 - 20,902 - 9,144 6,846 3,210 1,658
43. Vavuniya 29,224 14,477 49.5 14,747 50.5 3,217 25,972 35 12,927 9,534 4,574 2,096
44. Mullaitivu 24,971 12,663 50.7 12,308 49.3 1,491 23,477 3 10,853 8,525 3,841 1,663
45. Kilinochchi 28,009 13,910 49.7 14,099 50.3 - 28,002 7 11,180 9,769 4,793 2,067
51. Batticaloa 102,179 49,131 48.1 53,048 51.9 483 101,465 231 45,532 34,613 15,267 6,600
52. Ampara 132,243 65,250 49.3 66,993 50.7 47,577 83,127 1,539 63,125 43,167 17,704 7,763
53. Trincomalee 78,152 38,831 49.7 39,321 50.3 18,803 59,247 102 34,903 27,176 10,902 5,023
61. Kurunegala 273,092 137,189 50.2 135,903 49.8 242,447 24,745 5,900 126,374 85,155 40,057 20,894
62. Puttalam 148,958 71,039 47.7 77,919 52.3 107,850 39,499 1,609 66,471 50,488 21,398 10,348
71. Anuradhapura 189,524 96,123 50.7 93,401 49.3 168,786 18,726 2,012 86,220 61,524 26,821 14,605
72. Polonnaruwa 74,482 37,708 50.6 36,774 49.4 65,734 8,577 171 38,707 21,690 9,793 4,114
81. Badulla 146200 72,668 49.7 73532 50.3 99868 44,715 1,617 67,592 46,161 21,646 10,638
82. Moneragala 90,629 44,431 49.0 46,198 51.0 84,910 4,822 897 46,119 26,835 11,648 5,898
91. Ratnapura 188,772 94,979 50.3 93,793 49.7 162,384 24,176 2,212 87,599 60,237 26,971 13,614
92. Kegalle 129,587 65,414 50.5 64,173 49.5 104,016 23,044 2,527 60,162 40,932 19,569 8,665
Total 3,266,873 1,605,368 49.1 1,661,505 50.9 2,369,522 858,700 38,651 1,503,953 1,042,647 479,425 234,554
Source : School Census 2020
66. Basic Statistics of Students of Provincial Schools by District - 2020
Page 81

0%
20%
40%
60%
80%
100%
F88: Students of Provincial School by Cycle of Study & District -2020
Grade 1-5 Grade 6-9 Grade 10-11 Grade 12-13
-
20,000
40,000
60,000
80,000
100,000
120,000
11
. Co
lom
bo
12
. Gam
pah
a
13
. Kal
uta
ra
21
. Kan
dy
22
. Mat
ale
23
. Nu
war
a El
iya
31
. Gal
le
32
. Mat
ara
33
. Ham
ban
tota
41
. Jaf
fna
42
. Man
nar
43
. Vav
un
iya
44
. Mu
llait
ivu
45
. Kili
no
chch
i
51
. Bat
tica
loa
52
. Am
par
a
53
. Tri
nco
mal
ee
61
. Ku
run
egal
a
62
. Pu
ttal
am
71
. An
ura
dh
apu
ra
72
. Po
lon
nar
uw
a
81
. Bad
ulla
82
. Mo
ner
agal
a
91
. Rat
nap
ura
92
. Keg
alle
F89: Tamil Medium Students of Provincial School by District -2020
Page 82
0%
25%
50%
75%
100%
11
. Co
lom
bo
12
. Gam
pah
a
13
. Kal
uta
ra
21
. Kan
dy
22
. Mat
ale
23
. Nu
war
a El
iya
31
. Gal
le
32
. Mat
ara
33
. Ham
ban
tota
41
. Jaf
fna
42
. Man
nar
43
. Vav
un
iya
44
. Mu
llait
ivu
45
. Kili
no
chch
i
51
. Bat
tica
loa
52
. Am
par
a
53
. Tri
nco
mal
ee
61
. Ku
run
egal
a
62
. Pu
ttal
am
71
. An
ura
dh
apu
ra
72
. Po
lon
nar
uw
a
81
. Bad
ulla
82
. Mo
ner
agal
a
91
. Rat
nap
ura
92
. Keg
alle
F86: Students of Provincial Schools by Sex and District -2020
Male Students Female Students
0%
25%
50%
75%
100%
11
. Co
lom
bo
12
. Gam
pah
a
13
. Kal
uta
ra
21
. Kan
dy
22
. Mat
ale
23
. Nu
war
a El
iya
31
. Gal
le
32
. Mat
ara
33
. Ham
ban
tota
41
. Jaf
fna
42
. Man
nar
43
. Vav
un
iya
44
. Mu
llait
ivu
45
. Kili
no
chch
i
51
. Bat
tica
loa
52
. Am
par
a
53
. Tri
nco
mal
ee
61
. Ku
run
egal
a
62
. Pu
ttal
am
71
. An
ura
dh
apu
ra
72
. Po
lon
nar
uw
a
81
. Bad
ulla
82
. Mo
ner
agal
a
91
. Rat
nap
ura
92
. Keg
alle
F87: Students of Provincil Schools by Medium and District -2020
Sinhala Medium Tamil Medium Bilingual

Male Female Total Male Female Total Male Female Total
11. Colombo 11,137 10,828 21,965 1,340 1,382 2,722 12,477 12,210 24,687
12. Gampaha 12,398 12,423 24,821 761 769 1,530 13,159 13,192 26,351
13. Kalutara 7,494 7,276 14,770 1,322 1,382 2,704 8,816 8,658 17,474
21. Kandy 8,089 8,110 16,199 2,819 2,712 5,531 10,908 10,822 21,730
22. Matale 3,552 3,343 6,895 858 804 1,662 4,410 4,147 8,557
23. Nuwara Eliya 2,440 2,445 4,885 3,865 3,770 7,635 6,305 6,215 12,520
31. Galle 8,224 8,016 16,240 184 186 370 8,408 8,202 16,610
32. Matara 6,226 5,754 11,980 306 307 613 6,532 6,061 12,593
33. Hambantota 5,857 5,730 11,587 106 124 230 5,963 5,854 11,817
41. Jaffna - - - 3,883 3,806 7,689 3,883 3,806 7,689
42. Mannar - - - 1,064 965 2,029 1,064 965 2,029
43. Vavuniya 220 184 404 1,216 1,201 2,417 1,436 1,385 2,821
44. Mullaitivu 113 105 218 921 899 1,820 1,034 1,004 2,038
45. Kilinochchi - - - 933 864 1,797 933 864 1,797
51. Batticaloa 22 22 44 4,892 4,755 9,647 4,914 4,777 9,691
52. Ampara 2,295 2,300 4,595 4,154 4,083 8,237 6,449 6,383 12,832
53. Trincomalee 1,006 958 1,964 3,156 3,007 6,163 4,162 3,965 8,127
61. Kurunegala 12,508 11,857 24,365 1,238 1,237 2,475 13,746 13,094 26,840
62. Puttalam 4,857 4,929 9,786 1,938 1,918 3,856 6,795 6,847 13,642
71. Anuradhapura 7,775 7,505 15,280 894 853 1,747 8,669 8,358 17,027
72. Polonnaruwa 3,530 3,416 6,946 412 424 836 3,942 3,840 7,782
81. Badulla 5,414 5,306 10,720 1,918 1,939 3,857 7,332 7,245 14,577
82. Moneragala 4,632 4,492 9,124 256 239 495 4,888 4,731 9,619
91. Ratnapura 8,114 7,684 15,798 999 981 1,980 9,113 8,665 17,778
92. Kegalle 5,458 5,192 10,650 1,057 1,070 2,127 6,515 6,262 12,777
Total 121,361 117,875 239,236 40,492 39,677 80,169 161,853 157,552 319,405
Source : School Census 2020
DistrictSinhala Medium Tamil Medium All Students
67. Grade 1 Admission of Government Schools by Language Medium, Sex and District -2020
Page 83

Page 84
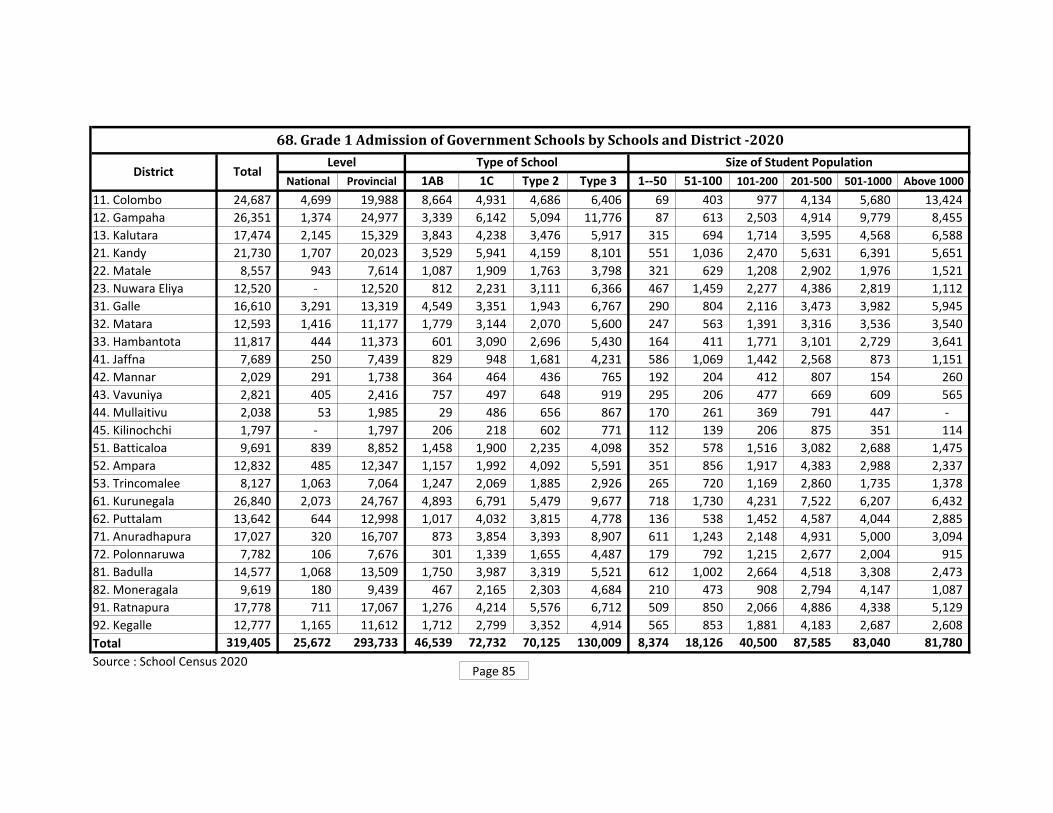
National Provincial 1AB 1C Type 2 Type 3 1--50 51-100 101-200 201-500 501-1000 Above 1000
11. Colombo 24,687 4,699 19,988 8,664 4,931 4,686 6,406 69 403 977 4,134 5,680 13,424
12. Gampaha 26,351 1,374 24,977 3,339 6,142 5,094 11,776 87 613 2,503 4,914 9,779 8,455
13. Kalutara 17,474 2,145 15,329 3,843 4,238 3,476 5,917 315 694 1,714 3,595 4,568 6,588
21. Kandy 21,730 1,707 20,023 3,529 5,941 4,159 8,101 551 1,036 2,470 5,631 6,391 5,651
22. Matale 8,557 943 7,614 1,087 1,909 1,763 3,798 321 629 1,208 2,902 1,976 1,521
23. Nuwara Eliya 12,520 - 12,520 812 2,231 3,111 6,366 467 1,459 2,277 4,386 2,819 1,112
31. Galle 16,610 3,291 13,319 4,549 3,351 1,943 6,767 290 804 2,116 3,473 3,982 5,945
32. Matara 12,593 1,416 11,177 1,779 3,144 2,070 5,600 247 563 1,391 3,316 3,536 3,540
33. Hambantota 11,817 444 11,373 601 3,090 2,696 5,430 164 411 1,771 3,101 2,729 3,641
41. Jaffna 7,689 250 7,439 829 948 1,681 4,231 586 1,069 1,442 2,568 873 1,151
42. Mannar 2,029 291 1,738 364 464 436 765 192 204 412 807 154 260
43. Vavuniya 2,821 405 2,416 757 497 648 919 295 206 477 669 609 565
44. Mullaitivu 2,038 53 1,985 29 486 656 867 170 261 369 791 447 -
45. Kilinochchi 1,797 - 1,797 206 218 602 771 112 139 206 875 351 114
51. Batticaloa 9,691 839 8,852 1,458 1,900 2,235 4,098 352 578 1,516 3,082 2,688 1,475
52. Ampara 12,832 485 12,347 1,157 1,992 4,092 5,591 351 856 1,917 4,383 2,988 2,337
53. Trincomalee 8,127 1,063 7,064 1,247 2,069 1,885 2,926 265 720 1,169 2,860 1,735 1,378
61. Kurunegala 26,840 2,073 24,767 4,893 6,791 5,479 9,677 718 1,730 4,231 7,522 6,207 6,432
62. Puttalam 13,642 644 12,998 1,017 4,032 3,815 4,778 136 538 1,452 4,587 4,044 2,885
71. Anuradhapura 17,027 320 16,707 873 3,854 3,393 8,907 611 1,243 2,148 4,931 5,000 3,094
72. Polonnaruwa 7,782 106 7,676 301 1,339 1,655 4,487 179 792 1,215 2,677 2,004 915
81. Badulla 14,577 1,068 13,509 1,750 3,987 3,319 5,521 612 1,002 2,664 4,518 3,308 2,473
82. Moneragala 9,619 180 9,439 467 2,165 2,303 4,684 210 473 908 2,794 4,147 1,087
91. Ratnapura 17,778 711 17,067 1,276 4,214 5,576 6,712 509 850 2,066 4,886 4,338 5,129
92. Kegalle 12,777 1,165 11,612 1,712 2,799 3,352 4,914 565 853 1,881 4,183 2,687 2,608
Total 319,405 25,672 293,733 46,539 72,732 70,125 130,009 8,374 18,126 40,500 87,585 83,040 81,780
Source : School Census 2020
68. Grade 1 Admission of Government Schools by Schools and District -2020
District TotalLevel Type of School Size of Student Population
Page 85

Page 86
0%
20%
40%
60%
80%
100%
11
. Co
lom
bo
12
. Gam
pah
a
13
. Kal
uta
ra
21
. Kan
dy
22
. Mat
ale
23
. Nu
war
a El
iya
31
. Gal
le
32
. Mat
ara
33
. Ham
ban
tota
41
. Jaf
fna
42
. Man
nar
43
. Vav
un
iya
44
. Mu
llait
ivu
45
. Kili
no
chch
i
51
. Bat
tica
loa
52
. Am
par
a
53
. Tri
nco
mal
ee
61
. Ku
run
egal
a
62
. Pu
ttal
am
71
. An
ura
dh
apu
ra
72
. Po
lon
nar
uw
a
81
. Bad
ulla
82
. Mo
ner
agal
a
91
. Rat
nap
ura
92
. Keg
alle
F90: Grade 1 Admission by Level of School and District -2020
National Provincial
0%
20%
40%
60%
80%
100%
11
. Co
lom
bo
12
. Gam
pah
a
13
. Kal
uta
ra
21
. Kan
dy
22
. Mat
ale
23
. Nu
war
a El
iya
31
. Gal
le
32
. Mat
ara
33
. Ham
ban
tota
41
. Jaf
fna
42
. Man
nar
43
. Vav
un
iya
44
. Mu
llait
ivu
45
. Kili
no
chch
i
51
. Bat
tica
loa
52
. Am
par
a
53
. Tri
nco
mal
ee
61
. Ku
run
egal
a
62
. Pu
ttal
am
71
. An
ura
dh
apu
ra
72
. Po
lon
nar
uw
a
81
. Bad
ulla
82
. Mo
ner
agal
a
91
. Rat
nap
ura
92
. Keg
alle
F91: Grade 1 Admission by Type of School and District -2020
1AB 1C Type 2 Type 3
0%
20%
40%
60%
80%
100%
F92: Grade 1 Admission by Size of Student Population and District -2020
Above 1000
501-1000
201-500
101-200
51-100
1--50


6School Census -2020 Summary Statistics of
All Government Schools by Zone and Division


National Provincial 1AB 1C Type 2 Type 3 1--50 51-100 101-200 201- 500 501-1,000Above
1,000
11. Colombo Colombo 124 21 103 29 42 39 14 - 11 15 26 32 40
Homagama 99 4 95 8 12 37 42 9 7 17 28 20 18
Piliyandala 87 4 83 16 16 25 30 7 8 10 28 12 22
Sri Jayawardanapura 89 8 81 22 15 25 27 1 7 10 24 19 28
12. Gampaha Gampaha 145 6 139 19 27 49 50 6 9 33 37 31 29
Kelaniya 115 6 109 18 28 33 36 - 7 12 27 37 32
Minuwangoda 159 3 156 9 28 54 68 6 20 44 45 26 18
Negombo 117 4 113 19 29 38 31 2 5 26 31 29 24
13. Kalutara Horana 137 5 132 12 29 39 57 16 20 23 37 22 19
Kalutara 152 11 141 27 28 58 39 5 14 28 34 34 37
Matugama 131 2 129 8 19 48 56 24 21 36 28 14 8
21. Kandy Denuwara 87 4 83 8 21 31 27 7 15 22 22 15 6
Gampola 143 6 137 9 29 50 55 23 17 40 33 16 14
Kandy 116 9 107 22 30 39 25 14 17 22 23 18 22
Katugastota 122 10 112 7 39 31 45 20 16 22 35 21 8
Teldeniya 97 3 94 3 20 26 48 24 15 15 27 12 4
Wathegama 86 3 83 8 28 32 18 5 10 18 31 13 9
22. Matale Galewela 109 2 107 5 23 30 51 18 17 20 35 14 5
Matale 121 9 112 13 27 47 34 16 13 34 31 15 12
Naula 39 1 38 1 8 17 13 6 12 9 8 3 1
Wilgamuwa 48 48 1 7 8 32 15 12 5 11 4 1
23. Nuwara Eliya Hanguranketha 69 2 67 6 8 27 28 15 7 15 21 6 5
Hatton 150 150 10 28 43 69 11 32 31 44 24 8
Kotmale 86 3 83 8 17 15 46 12 21 16 27 7 3
Nuwara Eliya 156 1 155 8 23 48 77 16 40 35 38 21 6
Walapane 89 1 88 4 15 14 56 24 15 17 17 14 2
31. Galle Ambalangoda 82 5 77 12 14 19 37 9 6 23 22 11 11
Elpitiya 123 3 120 13 18 32 60 14 18 35 29 18 9
Galle 145 18 127 33 34 25 53 13 21 24 38 14 35
Udugama 79 3 76 6 15 19 39 9 15 18 19 13 5
32. Matara Akuressa 78 2 76 6 20 26 26 16 8 13 24 11 6
Matara 111 13 98 24 25 27 35 6 13 25 30 18 19
69. Basic Statistics of Government Schools by Zone -2020
District Education Zone All Schools by Level Schools by Type Student Population (Size)
Page 87

National Provincial 1AB 1C Type 2 Type 3 1--50 51-100 101-200 201- 500 501-1,000Above
1,000
District Education Zone All Schools by Level Schools by Type Student Population (Size)
Morawaka 78 4 74 6 17 24 31 9 11 18 19 13 8
Mulatiyana (Hakmana) 91 3 88 9 16 30 36 12 20 19 21 9 10
33. Hambantota Hambantota 122 7 115 14 28 49 31 5 13 28 42 18 16
Tangalle 107 5 102 12 21 41 33 15 17 30 24 11 10
Walasmulla 91 4 87 12 22 26 31 8 10 24 28 13 8
41. Jaffna Islands 64 64 5 6 21 32 15 25 16 7 1 -
Jaffna 100 4 96 14 12 40 34 15 22 20 28 6 9
Thenmarachchi 58 1 57 6 6 19 27 17 12 15 9 4 1
Vadamarachchi 81 1 80 11 10 29 31 11 12 24 26 5 3
Valikamam 145 1 144 14 14 36 81 38 34 30 25 15 3
42. Mannar Madhu 51 51 3 9 11 28 19 10 9 13 - -
Mannar 82 5 77 12 15 22 33 22 10 16 25 6 3
43. Vavuniya Vavuniya South 97 5 92 11 17 22 47 29 12 17 21 14 4
Vavuniya North 76 76 4 8 17 47 41 11 12 9 3 -
44. Mullaitivu Mullaitivu 66 2 64 6 13 23 24 9 13 11 20 11 2
Thunukkai 61 1 60 7 4 13 37 24 9 14 12 2 -
45. Kilinochchi Kilinochchi 104 2 102 13 15 36 40 19 16 15 35 17 2
51. Batticaloa Batticaloa 65 4 61 10 12 21 22 7 10 16 18 6 8
Batticaloa Central 76 6 70 11 10 17 38 5 10 12 17 22 10
Batticaloa West 68 68 5 9 20 34 18 9 19 15 7 -
Kalkudah 83 1 82 9 7 27 40 18 10 20 21 10 4
Paddrippu 69 2 67 8 16 16 29 15 4 10 25 13 2
52. Ampara Akkaraipattu 72 3 69 9 5 21 37 9 13 9 19 16 6
Ampara 101 3 98 5 20 46 30 10 13 26 38 6 8
Dehiattakandiya 47 1 46 2 6 18 21 4 7 15 16 3 2
Kalmunai 65 3 62 10 12 21 22 1 7 15 16 16 10
Mahaoya 40 1 39 2 5 15 18 10 4 9 11 5 1
Sammanthurai 71 3 68 6 13 23 29 8 14 17 20 8 4
Thirukkovil 45 2 43 5 6 10 24 7 9 9 12 6 2
53. Trincomalee Kantale 43 1 42 5 8 14 16 4 4 6 19 8 2
Kinniya 66 3 63 4 17 16 29 8 13 10 19 12 4
Muttur 89 1 88 3 17 27 42 15 19 18 29 7 1
Trincomalee 81 6 75 11 23 22 25 12 9 13 30 10 7
Trincomalle North 34 34 2 3 17 12 5 11 9 8 1 -
Page 88

National Provincial 1AB 1C Type 2 Type 3 1--50 51-100 101-200 201- 500 501-1,000Above
1,000
District Education Zone All Schools by Level Schools by Type Student Population (Size)
61. Kurunegala Giriulla 137 8 129 13 27 39 58 15 29 33 28 18 14
Ibbagamuwa 109 2 107 10 21 28 50 10 13 29 32 14 11
Kuliyapitiya 166 5 161 11 42 52 61 17 27 45 44 20 13
Kurunegala 119 7 112 24 24 38 33 11 15 22 29 19 23
Maho 188 5 183 9 38 58 83 22 36 45 52 23 10
Nikaweratiya 154 3 151 9 30 53 62 34 23 40 38 12 7
62. Puttalam Chilaw 159 4 155 15 31 70 43 8 17 36 52 26 20
Puttalam 213 3 210 12 57 78 66 10 25 46 74 39 19
71. Anuradhapura Anuradhapura 138 3 135 12 29 46 51 14 22 28 36 25 13
Galenbindunuwewa 95 95 4 19 24 48 26 10 17 25 14 3
Kebithigollewa 127 1 126 6 12 41 68 20 29 28 34 13 3
Kekirawa 130 1 129 8 30 26 66 23 22 24 33 23 5
Thambuttegama 72 1 71 6 13 25 28 2 6 16 26 12 10
72. Polonnaruwa Dimbulagala 104 1 103 8 16 15 65 17 28 23 21 12 3
Hingurakgoda 95 5 90 8 10 26 51 4 18 21 32 12 8
Polonnaruwa 54 3 51 9 7 16 22 5 3 10 18 11 7
81. Badulla Badulla 112 6 106 14 28 30 40 21 20 26 25 12 8
Bandarawela 144 10 134 13 28 40 63 29 29 35 25 16 10
Mahiyanganaya 81 2 79 4 22 26 29 9 9 18 26 13 6
Passara 88 2 86 3 14 27 44 24 17 23 15 7 2
Viyaluwa 70 3 67 1 17 24 28 19 8 17 21 5 -
Welimada 110 4 106 7 31 37 35 15 16 26 29 19 5
82. Moneragala Bibile 82 2 80 10 15 30 27 9 14 18 24 13 4
Moneragala 109 3 106 9 22 42 36 19 15 22 32 15 6
Thanamalwila 43 2 41 8 8 14 13 2 2 5 16 15 3
Wellawaya 57 2 55 7 7 26 17 4 7 11 12 17 6
91. Ratnapura Balangoda 133 2 131 11 17 67 38 23 22 36 29 14 9
Embilipitiya 127 3 124 16 16 54 41 21 14 18 35 20 19
Nivitigala 146 2 144 7 23 57 59 26 25 42 33 12 8
Ratnapura 192 7 185 19 38 76 59 35 26 30 54 22 25
92. Kegalle Dehiowita 222 4 218 15 34 83 90 54 29 60 56 12 11
Kegalle 162 6 156 17 31 48 66 34 34 30 37 15 12
Mawanella 137 4 133 15 31 47 44 24 21 25 40 16 11
Source: School Census 2020
Page 89

National Provincial Male Female Sinhala Tamil Bilingual G1-5 G6-11 G12-13
11. Colombo Colombo 139,267 74,286 64,981 72,996 66,271 98,094 29,194 11,979 45,153 71,882 22,153
Homagama 65,606 10,781 54,825 33,928 31,678 62,301 2,165 1,140 26,804 32,813 5,892
Piliyandala 62,217 12,069 50,148 31,658 30,559 59,325 1,642 1,250 23,963 31,531 6,666
Sri Jayawardanapura 91,337 22,656 68,681 42,274 49,063 86,950 404 3,983 33,952 47,015 10,263
12. Gampaha Gampaha 101,292 17,745 83,547 49,209 52,083 93,182 4,440 3,670 37,013 50,891 13,232
Kelaniya 94,036 17,952 76,084 43,750 50,286 85,693 5,590 2,753 37,102 46,449 10,364
Minuwangoda 73,487 6,555 66,932 37,201 36,286 70,187 2,342 958 31,047 35,496 6,843
Negombo 77,854 10,775 67,079 38,076 39,778 72,327 4,466 1,061 31,572 39,250 6,898
13. Kalutara Horana 69,496 14,718 54,778 34,045 35,451 62,099 6,295 1,102 29,089 33,047 7,238
Kalutara 107,833 24,047 83,786 52,854 54,979 85,591 20,756 1,486 42,679 54,544 10,473
Matugama 45,452 8,008 37,444 22,811 22,641 41,935 3,043 474 17,736 22,182 5,450
21. Kandy Denuwara 30,591 4,123 26,468 15,489 15,102 22,779 7,203 609 13,953 14,234 2,327
Gampola 52,293 9,386 42,907 25,890 26,403 32,116 18,279 1,898 22,530 25,372 4,327
Kandy 83,135 23,817 59,318 39,778 43,357 66,211 11,501 5,423 26,112 41,339 15,580
Katugastota 44,077 13,469 30,608 22,163 21,914 30,255 12,556 1,266 19,091 20,895 4,042
Teldeniya 26,751 3,476 23,275 13,192 13,559 23,359 3,085 307 12,300 12,478 1,918
Wathegama 38,090 3,941 34,149 18,793 19,297 25,374 11,608 1,108 16,168 18,657 3,172
22. Matale Galewela 35,477 3,664 31,813 17,606 17,871 31,980 3,382 115 16,206 16,346 2,836
Matale 50,169 17,549 32,620 25,564 24,605 33,610 14,703 1,856 19,261 24,540 6,302
Naula 8,207 1,677 6,530 4,188 4,019 7,349 805 53 3,547 3,910 733
Wilgamuwa 9,130 9,130 4,406 4,724 9,130 - - 4,344 4,140 637
23. Nuwara Eliya Hanguranketha 22,460 3,406 19,054 11,025 11,435 19,876 2,378 206 8,708 11,230 2,501
Hatton 49,093 49,093 24,376 24,717 10,176 38,429 488 20,481 24,116 4,362
Kotmale 21,692 2,182 19,510 10,820 10,872 11,351 10,083 258 9,350 10,523 1,786
Nuwara Eliya 45,350 949 44,401 22,104 23,246 7,697 37,321 332 18,420 23,138 3,741
Walapane 21,458 1,494 19,964 10,694 10,764 13,027 8,367 64 9,318 10,475 1,647
31. Galle Ambalangoda 45,176 14,069 31,107 22,655 22,521 44,782 139 255 17,538 22,614 4,960
Elpitiya 44,657 8,425 36,232 22,602 22,055 43,838 602 217 19,034 21,658 3,905
Galle 100,112 46,090 54,022 49,740 50,372 92,556 3,589 3,967 36,507 50,766 12,692
Udugama 26,194 4,636 21,558 13,174 13,020 25,717 452 25 11,752 12,532 1,852
32. Matara Akuressa 29,770 3,722 26,048 14,982 14,788 27,601 2,010 159 12,573 14,518 2,636
Matara 68,981 31,596 37,385 35,696 33,285 63,385 3,064 2,532 24,615 34,572 9,584
70. Basic Statistics of Students of Government Schools by Zone -2020
District Education Zone All Level Sex Medium Cycle
Page 90

National Provincial Male Female Sinhala Tamil Bilingual G1-5 G6-11 G12-13 District Education Zone All
Level Sex Medium Cycle
Morawaka 32,957 8,806 24,151 16,244 16,713 30,876 1,946 135 14,381 15,896 2,631
Mulatiyana (Hakmana) 31,403 5,459 25,944 15,978 15,425 30,215 366 822 13,579 14,823 2,960
33. Hambantota Hambantota 62,969 15,096 47,873 31,304 31,665 59,492 2,375 1,102 27,824 29,220 5,787
Tangalle 37,223 7,945 29,278 18,061 19,162 36,498 127 598 15,461 17,694 4,021
Walasmulla 37,955 10,418 27,537 18,614 19,341 36,849 182 924 14,666 18,667 4,564
41. Jaffna Islands 7,455 7,455 3,745 3,710 - 7,307 148 3,031 3,801 590
Jaffna 34,231 8,037 26,194 16,344 17,887 - 32,208 2,023 13,145 17,134 3,847
Thenmarachchi 10,998 1,645 9,353 5,420 5,578 - 10,817 181 4,509 5,355 1,106
Vadamarachchi 19,669 1,173 18,496 9,944 9,725 - 19,003 666 7,434 10,075 2,118
Valikamam 31,059 868 30,191 15,647 15,412 - 30,697 362 12,401 15,585 2,972
42. Mannar Madhu 6,030 6,030 3,048 2,982 - 6,030 - 2,515 3,023 481
Mannar 20,328 5,456 14,872 10,290 10,038 - 19,921 407 8,296 9,949 2,026
43. Vavuniya Vavuniya South 28,433 6,819 21,614 14,101 14,332 3,949 24,013 471 11,972 13,728 2,642
Vavuniya North 7,610 7,610 3,961 3,649 - 7,610 - 3,249 3,779 559
44. Mullaitivu Mullaitivu 19,271 1,638 17,633 9,629 9,642 2,109 17,141 21 7,852 9,687 1,659
Thunukkai 7,949 611 7,338 4,105 3,844 - 7,930 19 3,250 4,118 550
45. Kilinochchi Kilinochchi 30,300 2,291 28,009 15,074 15,226 - 30,293 7 11,180 16,120 2,790
51. Batticaloa Batticaloa 26,573 8,061 18,512 13,244 13,329 - 26,258 315 9,810 13,659 3,084
Batticaloa Central 37,019 8,161 28,858 18,497 18,522 - 36,813 206 15,996 18,179 2,786
Batticaloa West 13,401 13,401 6,561 6,840 - 13,401 - 5,421 6,960 1,000
Kalkudah 24,886 1,649 23,237 12,195 12,691 - 24,877 9 10,254 12,791 1,804
Paddrippu 21,126 3,438 17,688 10,539 10,587 - 21,126 - 8,204 10,823 2,067
52. Ampara Akkaraipattu 28,584 4,269 24,315 14,633 13,951 - 27,581 1,003 11,855 14,415 2,222
Ampara 34,833 5,784 29,049 17,192 17,641 34,373 - 460 14,039 17,089 3,641
Dehiattakandiya 13,637 2,609 11,028 6,793 6,844 13,189 - 448 5,654 6,480 1,451
Kalmunai 37,643 7,070 30,573 19,040 18,603 - 36,706 937 15,101 18,659 3,695
Mahaoya 9,280 986 8,294 4,637 4,643 9,280 - - 4,066 4,419 789
Sammanthurai 23,647 4,544 19,103 12,085 11,562 - 23,358 289 10,182 11,668 1,712
Thirukkovil 12,619 2,255 10,364 6,345 6,274 - 11,834 785 5,070 6,406 1,072
53. Trincomalee Kantale 15,410 2,537 12,873 7,621 7,789 12,979 2,375 56 6,481 7,530 1,383
Kinniya 24,595 5,312 19,283 12,333 12,262 - 24,109 486 10,689 12,166 1,663
Muttur 19,734 1,085 18,649 9,977 9,757 72 19,662 - 8,391 9,993 1,290
Trincomalee 30,303 8,507 21,796 15,144 15,159 4,950 25,128 225 12,166 15,064 3,002
Trincomalle North 5,551 5,551 2,726 2,825 5,062 489 - 2,571 2,565 414
Page 91

National Provincial Male Female Sinhala Tamil Bilingual G1-5 G6-11 G12-13 District Education Zone All
Level Sex Medium Cycle
61. Kurunegala Giriulla 55,018 17,642 37,376 27,854 27,164 45,595 8,287 1,136 23,096 25,870 5,915
Ibbagamuwa 42,409 4,476 37,933 21,258 21,151 36,814 4,957 638 17,452 20,628 4,245
Kuliyapitiya 59,267 10,822 48,445 29,448 29,819 53,713 4,541 1,013 23,955 28,973 6,189
Kurunegala 80,586 16,187 64,399 40,063 40,523 67,915 5,943 6,728 28,129 41,021 11,292
Maho 57,467 8,565 48,902 28,873 28,594 54,110 2,700 657 26,081 26,466 4,807
Nikaweratiya 43,126 7,089 36,037 21,850 21,276 39,143 3,388 595 18,512 20,237 4,285
62. Puttalam Chilaw 78,055 12,011 66,044 38,300 39,755 72,092 3,847 2,116 30,562 39,659 7,708
Puttalam 87,225 4,311 82,914 43,596 43,629 47,895 38,761 569 39,177 41,717 6,157
71. Anuradhapura Anuradhapura 67,575 9,284 58,291 33,260 34,315 60,844 4,626 2,105 26,769 32,934 7,745
Galenbindunuwewa 26,479 26,479 13,107 13,372 23,187 3,251 41 11,564 12,777 2,088
Kebithigollewa 31,831 2,003 29,828 15,789 16,042 27,271 4,439 121 14,239 15,199 2,353
Kekirawa 41,654 2,916 38,738 20,638 21,016 33,943 7,221 490 18,084 19,809 3,697
Thambuttegama 38,524 2,336 36,188 19,154 19,370 37,640 - 884 17,197 18,043 3,199
72. Polonnaruwa Dimbulagala 24,861 1,552 23,309 12,279 12,582 22,167 2,582 112 11,296 11,713 1,833
Hingurakgoda 37,821 8,304 29,517 18,767 19,054 37,279 331 211 16,358 18,153 3,195
Polonnaruwa 28,986 7,330 21,656 14,645 14,341 21,774 6,731 481 11,669 14,010 3,245
81. Badulla Badulla 37,675 10,669 27,006 18,403 19,272 24,675 11,754 1,246 14,206 18,660 4,751
Bandarawela 45,486 12,409 33,077 21,921 23,565 28,164 15,436 1,886 16,327 22,892 6,212
Mahiyanganaya 29,432 2,817 26,615 14,556 14,876 28,909 304 219 13,430 13,643 2,332
Passara 17,180 2,081 15,099 8,565 8,615 7,960 9,210 10 7,655 8,399 1,103
Viyaluwa 13,547 1,846 11,701 6,676 6,871 11,925 1,622 - 6,188 6,278 1,063
Welimada 36,024 3,322 32,702 18,034 17,990 26,470 8,968 586 15,240 17,347 3,367
82. Moneragala Bibile 26,334 3,291 23,043 12,837 13,497 23,310 1,934 1,090 11,141 12,337 2,801
Moneragala 34,959 6,889 28,070 17,283 17,676 31,064 2,720 1,175 15,350 16,435 3,132
Thanamalwila 20,205 2,695 17,510 9,814 10,391 20,015 - 190 8,850 9,522 1,780
Wellawaya 26,981 4,975 22,006 13,368 13,613 26,126 168 687 11,720 12,569 2,658
91. Ratnapura Balangoda 40,099 3,519 36,580 19,706 20,393 32,721 6,383 995 16,853 18,945 4,193
Embilipitiya 58,652 8,467 50,185 29,203 29,449 51,993 4,793 1,866 25,064 27,770 5,709
Nivitigala 37,341 3,320 34,021 18,809 18,532 32,545 4,727 69 16,934 17,637 2,701
Ratnapura 88,042 20,056 67,986 42,914 45,128 76,859 9,171 2,012 32,522 44,192 11,220
92. Kegalle Dehiowita 53,744 7,027 46,717 27,020 26,724 40,775 12,362 607 22,582 26,389 4,678
Kegalle 59,848 17,959 41,889 29,172 30,676 54,571 2,840 2,437 22,576 28,635 8,540
Mawanella 51,831 10,850 40,981 26,179 25,652 38,923 10,583 2,325 21,256 24,890 5,531
Source : School Census 2020
Page 92

National Provincial 1AB 1C Type 2 Type 3 Male Female
11. Colombo Colombo 7,137 3,436 3,701 4,138 1,923 866 210 1,302 5,835 19.5
Homagama 3,139 558 2,581 923 651 1,063 502 548 2,591 20.9
Piliyandala 3,144 584 2,560 1,555 683 585 321 446 2,698 19.8
Sri Jayawardanapura 4,468 1,089 3,379 2,638 783 607 440 616 3,852 20.4
12. Gampaha Gampaha 4,911 874 4,037 1,916 1,261 1,048 686 797 4,114 20.6
Kelaniya 4,232 820 3,412 1,745 1,107 725 655 652 3,580 22.2
Minuwangoda 3,719 369 3,350 857 1,137 1,030 695 694 3,025 19.8
Negombo 3,821 516 3,305 1,549 1,099 739 434 598 3,223 20.4
13. Kalutara Horana 3,778 696 3,082 1,248 1,224 666 640 630 3,148 18.4
Kalutara 4,982 1,113 3,869 2,208 1,186 1,157 431 735 4,247 21.6
Matugama 2,808 339 2,469 820 664 892 432 527 2,281 16.2
21. Kandy Denuwara 2,249 316 1,933 614 681 594 360 368 1,881 13.6
Gampola 3,236 544 2,692 787 1,119 899 431 698 2,538 16.2
Kandy 5,064 1,276 3,788 2,806 1,283 702 273 1,022 4,042 16.4
Katugastota 3,001 794 2,207 628 1,265 560 548 540 2,461 14.7
Teldeniya 1,736 248 1,488 230 661 491 354 416 1,320 15.4
Wathegama 2,496 229 2,267 567 1,042 642 245 454 2,042 15.3
22. Matale Galewela 2,032 187 1,845 357 678 536 461 469 1,563 17.5
Matale 3,226 915 2,311 1,170 933 805 318 685 2,541 15.6
Naula 749 97 652 97 242 294 116 176 573 11.0
Wilgamuwa 646 646 71 214 139 222 208 438 14.1
23. Nuwara Eliya Hanguranketha 1,572 187 1,385 456 291 553 272 436 1,136 14.3
Hatton 3,220 3,220 657 1,024 892 647 949 2,271 15.2
Kotmale 1,538 168 1,370 414 488 273 363 421 1,117 14.1
Nuwara Eliya 2,857 82 2,775 558 775 908 616 860 1,997 15.9
Walapane 1,445 85 1,360 246 455 315 429 455 990 14.8
31. Galle Ambalangoda 2,387 610 1,777 1,082 469 455 381 488 1,899 18.9
Elpitiya 2,727 326 2,401 903 632 618 574 595 2,132 16.4
Galle 5,618 2,168 3,450 3,260 1,334 489 535 1,178 4,440 17.8
Udugama 1,705 226 1,479 388 570 374 373 421 1,284 15.4
32. Matara Akuressa 1,840 183 1,657 335 781 497 227 372 1,468 16.2
Matara 4,332 1,596 2,736 2,288 917 595 532 900 3,432 15.9
71. Basic Statistics of Teachers of Government Schools by Zone -2020
District Education Zone All Level Type of School Sex
STR
Page 93

National Provincial 1AB 1C Type 2 Type 3 Male Female District Education Zone All
Level Type of School SexSTR
Morawaka 2,074 397 1,677 469 748 506 351 544 1,530 15.9
Mulatiyana (Hakmana) 2,295 319 1,976 695 479 664 457 591 1,704 13.7
33. Hambantota Hambantota 3,423 641 2,782 986 993 1,031 413 894 2,529 18.4
Tangalle 2,645 422 2,223 772 625 835 413 603 2,042 14.1
Walasmulla 2,458 448 2,010 799 676 552 431 700 1,758 15.4
41. Jaffna Islands 795 795 193 111 324 167 255 540 9.4
Jaffna 2,871 502 2,369 1,145 480 851 395 823 2,048 11.9
Thenmarachchi 1,145 116 1,029 356 184 368 237 326 819 9.6
Vadamarachchi 1,820 97 1,723 634 320 623 243 592 1,228 10.8
Valikamam 2,766 86 2,680 952 518 731 565 822 1,944 11.2
42. Mannar Madhu 555 555 85 192 156 122 194 361 10.9
Mannar 1,561 396 1,165 673 394 301 193 483 1,078 13.0
43. Vavuniya Vavuniya South 2,138 449 1,689 856 516 470 296 547 1,591 13.3
Vavuniya North 843 843 157 167 321 198 278 565 9.0
44. Mullaitivu Mullaitivu 1,425 130 1,295 334 429 480 182 453 972 13.5
Thunukkai 706 49 657 234 81 215 176 256 450 11.3
45. Kilinochchi Kilinochchi 2,099 132 1,967 680 433 663 323 527 1,572 14.4
51. Batticaloa Batticaloa 1,953 459 1,494 857 434 430 232 546 1,407 13.6
Batticaloa Central 1,824 464 1,360 687 355 421 361 877 947 20.3
Batticaloa West 910 910 174 248 317 171 384 526 14.7
Kalkudah 1,429 73 1,356 538 206 380 305 447 982 17.4
Paddrippu 1,501 216 1,285 478 525 305 193 576 925 14.1
52. Ampara Akkaraipattu 1,730 317 1,413 654 214 516 346 783 947 16.5
Ampara 2,237 279 1,958 404 742 829 262 595 1,642 15.6
Dehiattakandiya 835 129 706 185 173 307 170 267 568 16.3
Kalmunai 2,435 420 2,015 1,004 510 667 254 869 1,566 15.5
Mahaoya 638 51 587 104 138 249 147 210 428 14.5
Sammanthurai 1,769 327 1,442 441 539 503 286 702 1,067 13.4
Thirukkovil 914 171 743 335 183 205 191 326 588 13.8
53. Trincomalee Kantale 848 97 751 247 190 236 175 264 584 18.2
Kinniya 1,446 308 1,138 339 572 312 223 785 661 17.0
Muttur 1,318 78 1,240 151 458 430 279 709 609 15.0
Trincomalee 1,829 462 1,367 698 629 330 172 567 1,262 16.6
Trincomalle North 389 389 37 72 203 77 141 248 14.3
Page 94

National Provincial 1AB 1C Type 2 Type 3 Male Female District Education Zone All
Level Type of School SexSTR
61. Kurunegala Giriulla 3,479 1,043 2,436 1,376 862 759 482 759 2,720 15.8
Ibbagamuwa 2,414 239 2,175 799 696 475 444 568 1,846 17.6
Kuliyapitiya 3,558 542 3,016 896 1,312 876 474 847 2,711 16.7
Kurunegala 4,658 826 3,832 2,522 1,031 733 372 1,024 3,634 17.3
Maho 3,745 483 3,262 732 1,267 996 750 1,046 2,699 15.3
Nikaweratiya 3,035 378 2,657 809 863 898 465 781 2,254 14.2
62. Puttalam Chilaw 4,073 600 3,473 1,292 1,065 1,268 448 884 3,189 19.2
Puttalam 4,904 251 4,653 611 2,117 1,382 794 1,322 3,582 17.8
71. Anuradhapura Anuradhapura 3,949 423 3,526 1,357 1,110 863 619 1,068 2,881 17.1
Galenbindunuwewa 1,773 1,773 290 651 427 405 531 1,242 14.9
Kebithigollewa 1,975 117 1,858 415 352 675 533 663 1,312 16.1
Kekirawa 2,601 124 2,477 536 999 483 583 720 1,881 16.0
Thambuttegama 1,926 124 1,802 550 505 492 379 560 1,366 20.0
72. Polonnaruwa Dimbulagala 1,558 72 1,486 350 460 279 469 438 1,120 16.0
Hingurakgoda 2,061 443 1,618 671 403 478 509 523 1,538 18.4
Polonnaruwa 1,544 319 1,225 642 240 384 278 436 1,108 18.8
81. Badulla Badulla 3,192 670 2,522 1,171 1,053 595 373 812 2,380 11.8
Bandarawela 3,613 852 2,761 1,207 1,118 769 519 946 2,667 12.6
Mahiyanganaya 1,783 162 1,621 267 713 484 319 575 1,208 16.5
Passara 1,462 134 1,328 183 429 503 347 432 1,030 11.8
Viyaluwa 1,268 151 1,117 62 510 441 255 382 886 10.7
Welimada 2,695 280 2,415 510 1,047 777 361 781 1,914 13.4
82. Moneragala Bibile 1,769 158 1,611 533 433 504 299 543 1,226 14.9
Moneragala 2,433 343 2,090 601 706 745 381 776 1,657 14.4
Thanamalwila 1,057 144 913 381 236 246 194 293 764 19.1
Wellawaya 1,524 236 1,288 539 243 483 259 431 1,093 17.7
91. Ratnapura Balangoda 2,888 212 2,676 730 637 1,101 420 796 2,092 13.9
Embilipitiya 3,293 383 2,910 1,071 634 1,155 433 938 2,355 17.8
Nivitigala 2,413 196 2,217 519 556 852 486 654 1,759 15.5
Ratnapura 5,209 997 4,212 1,783 1,479 1,401 546 1,159 4,050 16.9
92. Kegalle Dehiowita 4,218 414 3,804 981 973 1,555 709 910 3,308 12.7
Kegalle 4,339 965 3,374 1,755 1,014 934 636 839 3,500 13.8
Mawanella 3,646 591 3,055 1,239 1,017 975 415 718 2928 14.2
Source : School Census 2020
Page 95

District Education Zone Education Division Total
Schools
National
Schools
Provincial
Schools
Total
Students
Male
Students
Female
Students
Total
Teachers STR
11.Colombo Colombo Borella 24 7 17 50,599 36,371 14,228 2,343 21.6
Colombo Central 41 3 38 30,623 12,938 17,685 1,607 19.1
Colombo North 29 29 13,872 6,542 7,330 805 17.2
Colombo South 30 11 19 44,173 17,145 27,028 2,382 18.5
Homagama Hanwella 37 2 35 21,944 11,075 10,869 1,125 19.5
Homagama 39 2 37 32,692 17,147 15,545 1,503 21.8
Padukka 23 23 10,970 5,706 5,264 511 21.5
Piliyandala Dehiwala 33 1 32 22,857 10,925 11,932 1,206 19.0
Kesbewa 26 1 25 20,717 10,484 10,233 1,015 20.4
Moratuwa 28 2 26 18,643 10,249 8,394 923 20.2
Sri Jayawardenapura Kaduwela 32 2 30 26,667 13,729 12,938 1,375 19.4
Kolonnawa 18 2 16 12,901 6,027 6,874 652 19.8
Maharagama 22 1 21 27,795 14,010 13,785 1,283 21.7
Nugegoda 17 3 14 23,974 8,508 15,466 1,158 20.7
12.Gampaha Gampaha Attanagalla 50 2 48 34,233 16,878 17,355 1,660 20.6
Dompe (Weke) 47 1 46 25,271 12,095 13,176 1,223 20.7
Gampaha 48 3 45 41,788 20,236 21,552 2,028 20.6
Kelaniya Biyagama 27 1 26 22,931 9,885 13,046 1,000 22.9
Kelaniya 25 3 22 26,702 11,909 14,793 1,213 22.0
Mahara 40 1 39 25,791 13,033 12,758 1,179 21.9
Wattala 23 1 22 18,612 8,923 9,689 840 22.2
Minuwangoda Divulapitiya 53 53 22,341 11,351 10,990 1,061 21.1
Meerigama 52 1 51 22,300 11,385 10,915 1,175 19.0
Minuwangoda 54 2 52 28,846 14,465 14,381 1,483 19.5
Negombo Ja-Ela 40 1 39 26,458 12,851 13,607 1,308 20.2
Katana 45 1 44 21,661 10,849 10,812 1,132 19.1
Negombo 32 2 30 29,735 14,376 15,359 1,381 21.5
13.Kalutara Horana Bandaragama 41 1 40 20,100 10,110 9,990 1,109 18.1
Bulathsinhala 43 1 42 13,312 6,632 6,680 809 16.5
Horana 53 3 50 36,084 17,303 18,781 1,860 19.4
72. Basic Statistics of Government Schools by Education Division -2020
Page 96

District Education Zone Education Division Total
Schools
National
Schools
Provincial
Schools
Total
Students
Male
Students
Female
Students
Total
Teachers STR
Kalutara Beruwala 51 4 47 32,638 15,908 16,730 1,462 22.3
Dodangoda 25 1 24 9,276 4,600 4,676 568 16.3
Kalutara 34 3 31 28,719 14,223 14,496 1,321 21.7
Panadura 42 3 39 37,200 18,123 19,077 1,631 22.8
Matugama Agalawatta 31 31 8,066 4,020 4,046 579 13.9
Matugama 41 2 39 22,877 11,518 11,359 1,252 18.3
Palindanuwara 28 28 6,600 3,337 3,263 432 15.3
Walallawita 31 31 7,909 3,936 3,973 545 14.5
21.Kandy Denuwara Udunuwara 47 2 45 13,933 6,917 7,016 1,110 12.6
Yatinuwara 40 2 38 16,658 8,572 8,086 1,139 14.6
Gampola Ganga Ihala Korale 32 1 31 7,890 4,093 3,797 574 13.7
Pasbage Korale 36 1 35 11,771 5,850 5,921 742 15.9
Udapalatha 75 4 71 32,632 15,947 16,685 1,920 17.0
Kandy Gangawata Korale 58 7 51 66,879 31,533 35,346 3,869 17.3
Pathahewaheta 58 2 56 16,256 8,245 8,011 1,195 13.6
Katugastota Akurana 27 3 24 12,672 6,251 6,421 721 17.6
Galagedara 18 2 16 6,008 2,894 3,114 445 13.5
Harispattuwa 26 1 25 11,452 5,967 5,485 755 15.2
Hatharaliyadda 18 1 17 4,281 2,177 2,104 358 12.0
Poojapitiya 33 3 30 9,664 4,874 4,790 722 13.4
Teldeniya Medadumbara 45 2 43 11,540 5,749 5,791 860 13.4
Minipe 26 1 25 10,663 5,229 5,434 514 20.7
Udadumbara 26 26 4,548 2,214 2,334 362 12.6
Wathegama Kundasale 36 2 34 16,672 8,251 8,421 1,195 14.0
Panvila 23 23 5,133 2,614 2,519 371 13.8
Pathadumbara 27 1 26 16,285 7,928 8,357 930 17.5
22.Matale Galewela Dambulla 42 1 41 14,736 7,293 7,443 778 18.9
Galewela 42 42 14,390 7,129 7,261 830 17.3
Pallepola 25 1 24 6,351 3,184 3,167 424 15.0
Matale Matale 30 8 22 27,214 13,528 13,686 1,504 18.1
Rattota 39 39 8,783 4,499 4,284 648 13.6
Ukuwela 34 1 33 9,429 5,122 4,307 709 13.3
Page 97

District Education Zone Education Division Total
Schools
National
Schools
Provincial
Schools
Total
Students
Male
Students
Female
Students
Total
Teachers STR
Yatawatta 18 18 4,743 2,415 2,328 365 13.0
Naula Ambanganga Korale 16 16 2,158 1,093 1,065 237 9.1
Naula 23 1 22 6,049 3,095 2,954 512 11.8
Wilgamuwa Laggala 19 19 2,612 1,308 1,304 241 10.8
Wilgamuwa 29 29 6,518 3,098 3,420 405 16.1
23.Nuwara Eliya Hanguranketha Udahewaheta 69 2 67 22,460 11,025 11,435 1,572 14.3
Hatton Ambagamuwa 37 37 11,387 5,073 6,314 924 12.3
Hatton Tamil - I 42 42 15,168 8,122 7,046 1,039 14.6
Hatton Tamil - II 36 36 11,527 5,773 5,754 680 17.0
Hatton Tamil - III 35 35 11,011 5,408 5,603 577 19.1
Kotmale Kotmale 86 3 83 21,692 10,820 10,872 1,538 14.1
Nuwara Eliya Nuwara Eliya 32 1 31 8,174 3,528 4,646 697 11.7
Nuwara Eliya Tamil-1 41 41 12,366 6,186 6,180 719 17.2
Nuwara Eliya Tamil-2 42 42 14,971 7,438 7,533 883 17.0
Nuwara Eliya Tamil-3 41 41 9,839 4,952 4,887 558 17.6
Walapane Walapane 89 1 88 21,458 10,694 10,764 1,445 14.8
31.Galle Ambalangoda Ambalangoda 23 2 21 22,624 10,855 11,769 990 22.9
Balapitiya 20 1 19 9,238 4,734 4,504 575 16.1
Hikkaduwa 39 2 37 13,314 7,066 6,248 822 16.2
Elpitiya Bentota 21 1 20 9,114 4,667 4,447 574 15.9
Divitura-Welivitiya 15 15 4,872 2,475 2,397 352 13.8
Elpitiya 35 1 34 14,258 7,122 7,136 795 17.9
Karandeniya 32 1 31 11,672 5,938 5,734 637 18.3
Pitigala 20 20 4,741 2,400 2,341 369 12.8
Galle Akmeemana 38 3 35 21,908 10,596 11,312 1,401 15.6
Baddegama 27 3 24 14,391 7,043 7,348 894 16.1
Galle 30 9 21 43,716 21,816 21,900 2,178 20.1
Habaraduwa 50 3 47 20,097 10,285 9,812 1,145 17.6
Udugama Mapalagama 24 1 23 8,663 4,428 4,235 575 15.1
Thawalama 34 2 32 10,659 5,254 5,405 662 16.1
Udugama 21 21 6,872 3,492 3,380 468 14.7
Page 98

District Education Zone Education Division Total
Schools
National
Schools
Provincial
Schools
Total
Students
Male
Students
Female
Students
Total
Teachers STR
32.Matara Akuressa Akuressa 44 1 43 15,554 7,760 7,794 924 16.8
Malimboda 14 1 13 7,996 3,959 4,037 478 16.7
Welipitiya 20 20 6,220 3,263 2,957 438 14.2
Matara Devinuwara 16 1 15 5,358 2,668 2,690 433 12.4
Dikwella 25 2 23 10,565 5,472 5,093 776 13.6
Matara 44 7 37 40,774 21,390 19,384 2,338 17.4
Weligama 26 3 23 12,284 6,166 6,118 785 15.6
Morawaka Kotapola 25 3 22 13,979 6,982 6,997 783 17.9
Morawaka 23 23 8,504 4,194 4,310 537 15.8
Pasgoda 30 1 29 10,474 5,068 5,406 754 13.9
Mulatiyana (Hakmana) Hakmana 25 25 6,180 3,215 2,965 541 11.4
Kamburupitiya 26 1 25 10,446 5,242 5,204 716 14.6
Mulatiyana 25 1 24 9,854 5,019 4,835 640 15.4
Thihagoda 15 1 14 4,923 2,502 2,421 398 12.4
33.Hambantota Hambantota Ambalantota 29 2 27 17,811 8,811 9,000 934 19.1
Hambantota 26 3 23 12,074 6,084 5,990 673 17.9
Lunugamvehera 23 23 5,220 2,602 2,618 371 14.1
Sooriyawewa 17 1 16 10,759 5,358 5,401 576 18.7
Thissamaharama 27 1 26 17,105 8,449 8,656 869 19.7
Tangalle Angunakolapelessa 25 1 24 9,334 4,716 4,618 618 15.1
Beliatta 43 2 41 12,586 6,392 6,194 993 12.7
Tangalle 39 2 37 15,303 6,953 8,350 1,034 14.8
Walasmulla Katuwana 42 1 41 15,318 7,612 7,706 1,052 14.6
Walasmulla 49 3 46 22,637 11,002 11,635 1,406 16.1
41.Jaffna Islands Delft 8 8 609 312 297 88 6.9
Karainagar 13 13 1,728 878 850 164 10.5
Kayts 17 17 1,780 878 902 197 9.0
Velanai 26 26 3,338 1,677 1,661 346 9.6
Jaffna Jaffna 21 3 18 10,520 4,102 6,418 924 11.4
Kopay 40 40 9,375 4,647 4,728 861 10.9
Nallur 39 1 38 14,336 7,595 6,741 1,086 13.2
Thennamarachchi Chavakachcheri 58 1 57 10,998 5,420 5,578 1,145 9.6
Page 99

District Education Zone Education Division Total
Schools
National
Schools
Provincial
Schools
Total
Students
Male
Students
Female
Students
Total
Teachers STR
Vadamarachchi Karaveddy 30 1 29 7,453 3,929 3,524 684 10.9
Maruthankerny 18 18 2,880 1,481 1,399 317 9.1
Point Pedro 33 33 9,336 4,534 4,802 819 11.4
Valikamam Chankanai 33 33 7,061 3,571 3,490 582 12.1
Sandilipay 40 1 39 9,477 4,684 4,793 829 11.4
Tellipalai 41 41 8,636 4,542 4,094 757 11.4
Uduvil 31 31 5,885 2,850 3,035 598 9.8
42.Mannar Madhu Madhu 20 20 1,918 999 919 177 10.8
Manthai West 31 31 4,112 2,049 2,063 378 10.9
Mannar Mannar 32 4 28 12,203 6,167 6,036 896 13.6
Musali 24 1 23 3,967 2,003 1,964 309 12.8
Nanattan 26 26 4,158 2,120 2,038 356 11.7
43.Vavuniya Vavuniya South Vavuniya South_Tamil 43 3 40 19,072 9,429 9,643 1,342 14.2
Vavuniya South-Sinhala 20 2 18 4,088 2,079 2,009 340 12.0
Vengalacheddikulam 34 34 5,273 2,593 2,680 456 11.6
Vavuniya North Omanthai 40 40 4,647 2,436 2,211 519 9.0
Vavuniya North 36 36 2,963 1,525 1,438 324 9.1
44.Mullaitivu Mullaitivu Maritimepattu 33 1 32 8,126 4,008 4,118 662 12.3
Puthukkudiyiruppu 25 25 9,122 4,620 4,502 606 15.1
Welioya 8 1 7 2,023 1,001 1,022 157 12.9
Thunukkai Manthai East 16 16 1,619 848 771 156 10.4
Oddusudan 26 26 3,739 1,952 1,787 335 11.2
Thunukkai 19 1 18 2,591 1,305 1,286 215 12.1
45.Kilinochchi Kilinochchi Kandawalai 24 24 4,959 2,477 2,482 365 13.6
Karachchi 42 1 41 17,249 8,524 8,725 1,082 15.9
Pallai 14 14 2,373 1,163 1,210 230 10.3
Poonakary 24 1 23 5,719 2,910 2,809 422 13.6
51.Batticaloa Batticaloa EravurPattu1_Chenkdy 10 10 3,232 1,608 1,624 251 12.9
Manmunai North (Bat) 39 4 35 19,333 9,624 9,709 1,388 13.9
Manmunai Pattu 16 16 4,008 2,012 1,996 314 12.8
Batticaloa Central Eravur Town 18 2 16 9,392 4,670 4,722 498 18.9
Kaththankudy 32 2 30 14,878 7,300 7,578 686 21.7
Page 100

District Education Zone Education Division Total
Schools
National
Schools
Provincial
Schools
Total
Students
Male
Students
Female
Students
Total
Teachers STR
Koralai Pattu West 26 2 24 12,749 6,527 6,222 640 19.9
Batticaloa West Eravur Pattu - III 17 17 2,392 1,144 1,248 156 15.3
Manmunai South West 21 21 5,143 2,516 2,627 374 13.8
Manmunai West 30 30 5,866 2,901 2,965 380 15.4
Kalkudah Eravur Pattu - II 23 23 8,926 4,357 4,569 480 18.6
Koralai Pattu 40 1 39 11,306 5,564 5,742 681 16.6
Koralai Pattu North 20 20 4,654 2,274 2,380 268 17.4
Paddrippu Manmunai South & Eruvil 37 2 35 13,485 6,733 6,752 959 14.1
Porativu Pattu 32 32 7,641 3,806 3,835 542 14.1
52.Ampara Akkaraipattu Addalachchenai 27 1 26 10,528 5,390 5,138 672 15.7
Akkaraipattu 24 1 23 11,098 5,670 5,428 677 16.4
Pottuvil - I 21 1 20 6,958 3,573 3,385 381 18.3
Ampara Ampara 21 2 19 14,572 7,027 7,545 745 19.6
Damana 34 34 6,811 3,420 3,391 521 13.1
Lahugala 7 7 1,884 947 937 126 15.0
Uhana 39 1 38 11,566 5,798 5,768 845 13.7
Dehiattakandiya Dehiattakandiya 47 1 46 13,637 6,793 6,844 835 16.3
Kalmunai Kalmunai 17 17 13,350 5,516 7,834 849 15.7
Kalmunai Tamil 14 1 13 7,081 3,548 3,533 520 13.6
Karaithivu 10 10 3,404 1,788 1,616 240 14.2
Ninthavur 15 1 14 6,689 3,393 3,296 446 15.0
Sainthamaruthu 9 1 8 7,119 4,795 2,324 380 18.7
Mahaoya Mahaoya 20 20 4,818 2,454 2,364 344 14.0
Padiyatalawa 20 1 19 4,462 2,183 2,279 294 15.2
Sammanthurai Irakkamam 12 1 11 3,800 1,996 1,804 283 13.4
Navithanveli 22 22 4,301 2,194 2,107 403 10.7
Sammanthurai 37 2 35 15,546 7,895 7,651 1,083 14.4
Thirukkovil Alayadivembu 15 1 14 5,338 2,695 2,643 386 13.8
Pottuvil- II (Tamil) 12 12 2,067 1,034 1,033 163 12.7
Thirukkovil 18 1 17 5,214 2,616 2,598 365 14.3
53.Trincomalee Kantale Kantale 34 1 33 13,466 6,686 6,780 717 18.8
Seruvila 9 9 1,944 935 1,009 131 14.8
Page 101
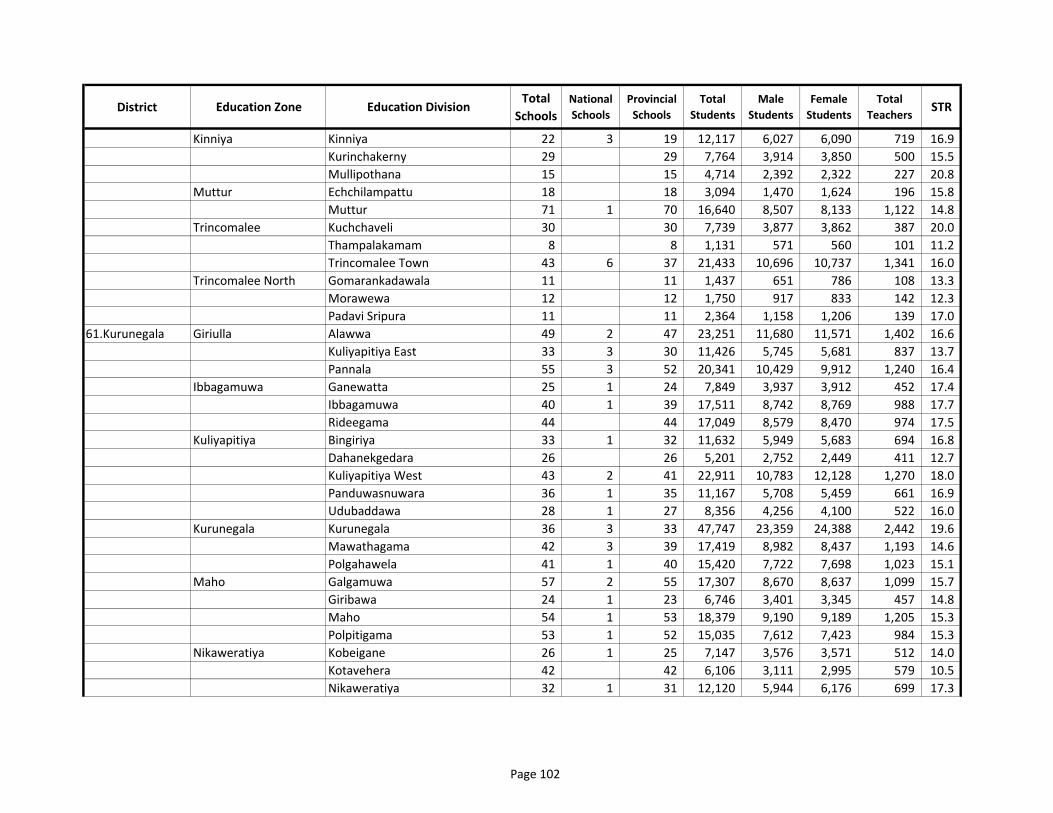
District Education Zone Education Division Total
Schools
National
Schools
Provincial
Schools
Total
Students
Male
Students
Female
Students
Total
Teachers STR
Kinniya Kinniya 22 3 19 12,117 6,027 6,090 719 16.9
Kurinchakerny 29 29 7,764 3,914 3,850 500 15.5
Mullipothana 15 15 4,714 2,392 2,322 227 20.8
Muttur Echchilampattu 18 18 3,094 1,470 1,624 196 15.8
Muttur 71 1 70 16,640 8,507 8,133 1,122 14.8
Trincomalee Kuchchaveli 30 30 7,739 3,877 3,862 387 20.0
Thampalakamam 8 8 1,131 571 560 101 11.2
Trincomalee Town 43 6 37 21,433 10,696 10,737 1,341 16.0
Trincomalee North Gomarankadawala 11 11 1,437 651 786 108 13.3
Morawewa 12 12 1,750 917 833 142 12.3
Padavi Sripura 11 11 2,364 1,158 1,206 139 17.0
61.Kurunegala Giriulla Alawwa 49 2 47 23,251 11,680 11,571 1,402 16.6
Kuliyapitiya East 33 3 30 11,426 5,745 5,681 837 13.7
Pannala 55 3 52 20,341 10,429 9,912 1,240 16.4
Ibbagamuwa Ganewatta 25 1 24 7,849 3,937 3,912 452 17.4
Ibbagamuwa 40 1 39 17,511 8,742 8,769 988 17.7
Rideegama 44 44 17,049 8,579 8,470 974 17.5
Kuliyapitiya Bingiriya 33 1 32 11,632 5,949 5,683 694 16.8
Dahanekgedara 26 26 5,201 2,752 2,449 411 12.7
Kuliyapitiya West 43 2 41 22,911 10,783 12,128 1,270 18.0
Panduwasnuwara 36 1 35 11,167 5,708 5,459 661 16.9
Udubaddawa 28 1 27 8,356 4,256 4,100 522 16.0
Kurunegala Kurunegala 36 3 33 47,747 23,359 24,388 2,442 19.6
Mawathagama 42 3 39 17,419 8,982 8,437 1,193 14.6
Polgahawela 41 1 40 15,420 7,722 7,698 1,023 15.1
Maho Galgamuwa 57 2 55 17,307 8,670 8,637 1,099 15.7
Giribawa 24 1 23 6,746 3,401 3,345 457 14.8
Maho 54 1 53 18,379 9,190 9,189 1,205 15.3
Polpitigama 53 1 52 15,035 7,612 7,423 984 15.3
Nikaweratiya Kobeigane 26 1 25 7,147 3,576 3,571 512 14.0
Kotavehera 42 42 6,106 3,111 2,995 579 10.5
Nikaweratiya 32 1 31 12,120 5,944 6,176 699 17.3
Page 102
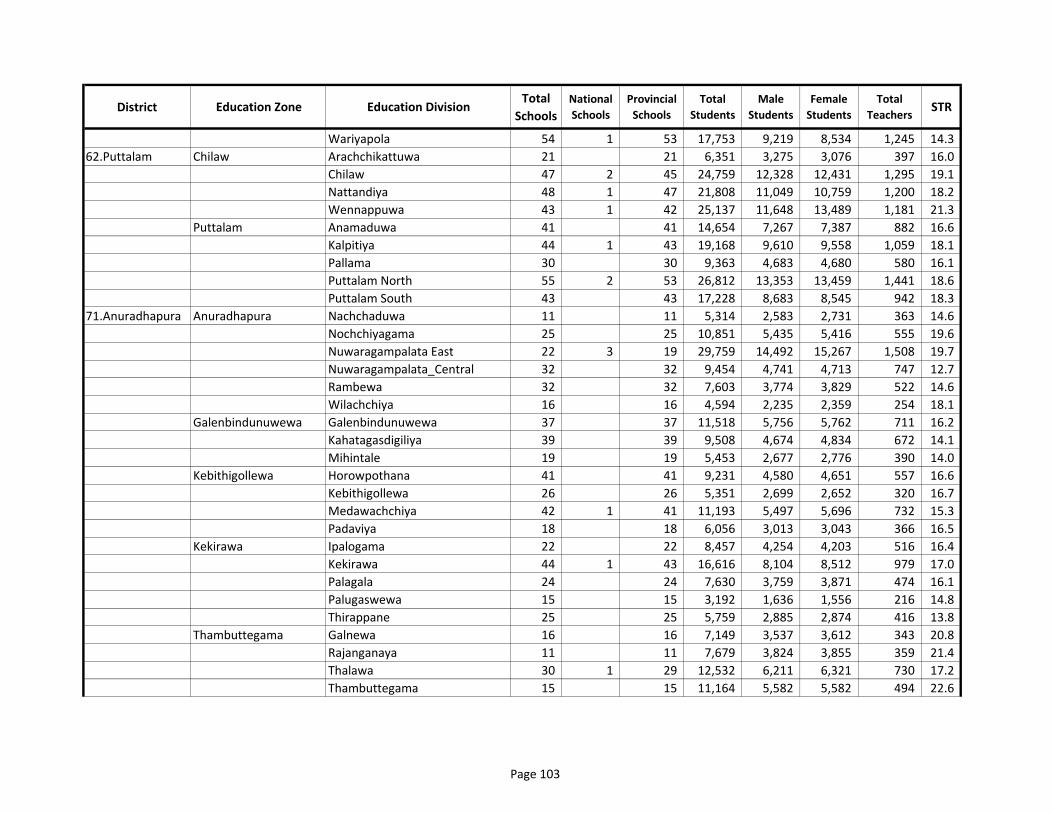
District Education Zone Education Division Total
Schools
National
Schools
Provincial
Schools
Total
Students
Male
Students
Female
Students
Total
Teachers STR
Wariyapola 54 1 53 17,753 9,219 8,534 1,245 14.3
62.Puttalam Chilaw Arachchikattuwa 21 21 6,351 3,275 3,076 397 16.0
Chilaw 47 2 45 24,759 12,328 12,431 1,295 19.1
Nattandiya 48 1 47 21,808 11,049 10,759 1,200 18.2
Wennappuwa 43 1 42 25,137 11,648 13,489 1,181 21.3
Puttalam Anamaduwa 41 41 14,654 7,267 7,387 882 16.6
Kalpitiya 44 1 43 19,168 9,610 9,558 1,059 18.1
Pallama 30 30 9,363 4,683 4,680 580 16.1
Puttalam North 55 2 53 26,812 13,353 13,459 1,441 18.6
Puttalam South 43 43 17,228 8,683 8,545 942 18.3
71.Anuradhapura Anuradhapura Nachchaduwa 11 11 5,314 2,583 2,731 363 14.6
Nochchiyagama 25 25 10,851 5,435 5,416 555 19.6
Nuwaragampalata East 22 3 19 29,759 14,492 15,267 1,508 19.7
Nuwaragampalata_Central 32 32 9,454 4,741 4,713 747 12.7
Rambewa 32 32 7,603 3,774 3,829 522 14.6
Wilachchiya 16 16 4,594 2,235 2,359 254 18.1
Galenbindunuwewa Galenbindunuwewa 37 37 11,518 5,756 5,762 711 16.2
Kahatagasdigiliya 39 39 9,508 4,674 4,834 672 14.1
Mihintale 19 19 5,453 2,677 2,776 390 14.0
Kebithigollewa Horowpothana 41 41 9,231 4,580 4,651 557 16.6
Kebithigollewa 26 26 5,351 2,699 2,652 320 16.7
Medawachchiya 42 1 41 11,193 5,497 5,696 732 15.3
Padaviya 18 18 6,056 3,013 3,043 366 16.5
Kekirawa Ipalogama 22 22 8,457 4,254 4,203 516 16.4
Kekirawa 44 1 43 16,616 8,104 8,512 979 17.0
Palagala 24 24 7,630 3,759 3,871 474 16.1
Palugaswewa 15 15 3,192 1,636 1,556 216 14.8
Thirappane 25 25 5,759 2,885 2,874 416 13.8
Thambuttegama Galnewa 16 16 7,149 3,537 3,612 343 20.8
Rajanganaya 11 11 7,679 3,824 3,855 359 21.4
Thalawa 30 1 29 12,532 6,211 6,321 730 17.2
Thambuttegama 15 15 11,164 5,582 5,582 494 22.6
Page 103

District Education Zone Education Division Total
Schools
National
Schools
Provincial
Schools
Total
Students
Male
Students
Female
Students
Total
Teachers STR
72.Polonnaruwa Dimbulagala Aralaganwila 31 1 30 8,954 4,410 4,544 506 17.7
Dimbulagala 32 32 8,297 4,133 4,164 512 16.2
Welikanda 41 41 7,610 3,736 3,874 540 14.1
Hingurakgoda Elahera 28 1 27 9,411 4,656 4,755 463 20.3
Hingurakgoda 33 2 31 13,263 6,459 6,804 818 16.2
Medirigiriya 34 2 32 15,147 7,652 7,495 780 19.4
Polonnaruwa Lankapura 21 21 7,713 3,941 3,772 450 17.1
Thamankaduwa 33 3 30 21,273 10,704 10,569 1,094 19.4
81.Badulla Badulla Badulla 43 4 39 23,051 11,036 12,015 1,634 14.1
Hali-Ela 69 2 67 14,624 7,367 7,257 1,558 9.4
Bandarawela Bandarawela 34 4 30 21,808 9,840 11,968 1,448 15.1
Ella 29 2 27 7,406 3,785 3,621 702 10.5
Haldummulla 50 2 48 7,523 3,729 3,794 675 11.1
Haputale 31 2 29 8,749 4,567 4,182 788 11.1
Mahiyanganaya Mahiyanganaya 43 1 42 17,047 8,447 8,600 978 17.4
Rideemaliyedda 38 1 37 12,385 6,109 6,276 805 15.4
Passara Passara 88 2 86 17,180 8,565 8,615 1,462 11.8
Viyaluwa Kandaketiya 24 1 23 5,413 2,622 2,791 449 12.1
Meegahakivula 22 1 21 4,729 2,392 2,337 375 12.6
Soranatota 24 1 23 3,405 1,662 1,743 444 7.7
Welimada Uva Paranagama 49 1 48 13,827 6,956 6,871 1,071 12.9
Welimada 61 3 58 22,197 11,078 11,119 1,624 13.7
82.Moneragala Bibile Bibile 27 1 26 10,284 4,863 5,421 639 16.1
Madulla 26 26 6,916 3,442 3,474 544 12.7
Medagama 29 1 28 9,134 4,532 4,602 586 15.6
Moneragala Badalkumbura 39 1 38 9,106 4,456 4,650 778 11.7
Moneragala 33 2 31 13,282 6,667 6,615 922 14.4
Siyambalanduwa 37 37 12,571 6,160 6,411 733 17.2
Thanamalvila Thanamalwila 43 2 41 20,205 9,814 10,391 1,057 19.1
Wellawaya Buttala 26 1 25 12,600 6,228 6,372 726 17.4
Wellawaya 31 1 30 14,381 7,140 7,241 798 18.0
91.Ratnapura Balangoda Balangoda 52 2 50 21,159 10,049 11,110 1,390 15.2
Page 104
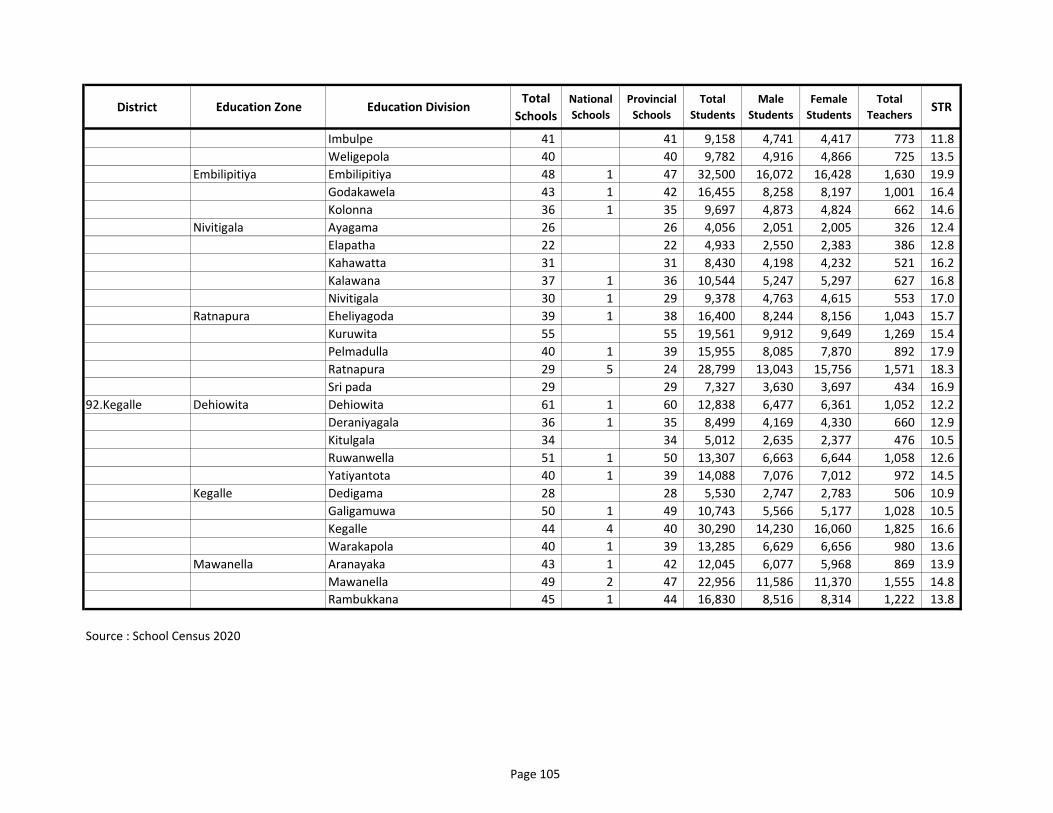
District Education Zone Education Division Total
Schools
National
Schools
Provincial
Schools
Total
Students
Male
Students
Female
Students
Total
Teachers STR
Imbulpe 41 41 9,158 4,741 4,417 773 11.8
Weligepola 40 40 9,782 4,916 4,866 725 13.5
Embilipitiya Embilipitiya 48 1 47 32,500 16,072 16,428 1,630 19.9
Godakawela 43 1 42 16,455 8,258 8,197 1,001 16.4
Kolonna 36 1 35 9,697 4,873 4,824 662 14.6
Nivitigala Ayagama 26 26 4,056 2,051 2,005 326 12.4
Elapatha 22 22 4,933 2,550 2,383 386 12.8
Kahawatta 31 31 8,430 4,198 4,232 521 16.2
Kalawana 37 1 36 10,544 5,247 5,297 627 16.8
Nivitigala 30 1 29 9,378 4,763 4,615 553 17.0
Ratnapura Eheliyagoda 39 1 38 16,400 8,244 8,156 1,043 15.7
Kuruwita 55 55 19,561 9,912 9,649 1,269 15.4
Pelmadulla 40 1 39 15,955 8,085 7,870 892 17.9
Ratnapura 29 5 24 28,799 13,043 15,756 1,571 18.3
Sri pada 29 29 7,327 3,630 3,697 434 16.9
92.Kegalle Dehiowita Dehiowita 61 1 60 12,838 6,477 6,361 1,052 12.2
Deraniyagala 36 1 35 8,499 4,169 4,330 660 12.9
Kitulgala 34 34 5,012 2,635 2,377 476 10.5
Ruwanwella 51 1 50 13,307 6,663 6,644 1,058 12.6
Yatiyantota 40 1 39 14,088 7,076 7,012 972 14.5
Kegalle Dedigama 28 28 5,530 2,747 2,783 506 10.9
Galigamuwa 50 1 49 10,743 5,566 5,177 1,028 10.5
Kegalle 44 4 40 30,290 14,230 16,060 1,825 16.6
Warakapola 40 1 39 13,285 6,629 6,656 980 13.6
Mawanella Aranayaka 43 1 42 12,045 6,077 5,968 869 13.9
Mawanella 49 2 47 22,956 11,586 11,370 1,555 14.8
Rambukkana 45 1 44 16,830 8,516 8,314 1,222 13.8
Source : School Census 2020
Page 105


School Census - 2019 Summary Statistics of Other Schools
(Private, Special and Pirivena)
7


1AB 1C Type 2 Male Female TotalSinhala
Medium
Tamil
Medium
English
MediumMale Female Total
1. Western 38 11 9 58 52,838 48,847 101,685 66,696 6,365 28,624 1,075 4,962 6,037
11. Colombo 20 6 4 30 30,390 28,749 59,139 33,416 6,365 19,358 605 3,191 3,796
12. Gampaha 14 2 4 20 18,729 14,601 33,330 26,481 - 6,849 404 1,348 1,752
13. Kalutara 4 3 1 8 3,719 5,497 9,216 6,799 - 2,417 66 423 489
2. Central 6 4 3 13 8,226 7,349 15,575 10,513 2,650 2,412 175 734 909
21. Kandy 6 1 2 9 6,325 4,781 11,106 7,859 835 2,412 155 601 756
22. Matale 2 2 512 1,493 2,005 1,633 372 - 8 80 88
23. Nuwara Eliya 1 1 2 1,389 1,075 2,464 1,021 1,443 - 12 53 65
3. Southern 2 5 1 8 1,341 4,595 5,936 5,781 - 155 43 295 338
31. Galle 1 1 55 136 191 191 - - 10 15 25
32. Matara 2 3 1 6 1,184 4,339 5,523 5,368 - 155 28 252 280
33. Hambantota 1 1 102 120 222 222 - - 5 28 33
4. Northern 5 5 4,348 3,116 7,464 - 6,535 929 172 222 394
41. Jaffna 5 5 4,348 3,116 7,464 - 6,535 929 172 222 394
6. North Western 1 1 425 715 1,140 951 - 189 1 56 57
61. Kurunegala 1 1 425 715 1,140 951 - 189 1 56 57
7. North Central 1 1 534 495 1,029 645 - 384 12 51 63
71. Anuradhapura 1 1 534 495 1,029 645 - 384 12 51 63
8. Uva 1 2 3 2,195 30 2,225 1,427 390 408 65 110 175
81. Badulla 1 2 3 2,195 30 2,225 1,427 390 408 65 110 175
9. Sabaragamuwa 1 1 584 592 1,176 767 - 409 10 36 46
91. Ratnapura 1 1 584 592 1,176 767 - 409 10 36 46
Total 55 20 15 90 70,491 65,739 136,230 86,780 15,940 33,510 1,553 6,466 8,019
Source : School Census 2020
73. Basic Statistics of Private Schools by Province and District -2020
Type of School
Total
Schools
TeachersStudents
Province/ District
Page 106

Page 107

Male Female Total Male Female Total Male Female Total
1. Western 20,558 19,204 39,762 39.1 25,390 22,707 48,097 47.3 6,890 6,936 13,826 13.6 101,685
11. Colombo 10,937 10,814 21,751 36.8 15,226 13,871 29,097 49.2 4,227 4,064 8,291 14.0 59,139
12. Gampaha 7,891 5,919 13,810 41.4 8,456 6,275 14,731 44.2 2,382 2,407 4,789 14.4 33,330
13. Kalutara 1,730 2,471 4,201 45.6 1,708 2,561 4,269 46.3 281 465 746 8.1 9,216
2. Central 3,375 3,063 6,438 41.3 4,052 3,504 7,556 48.5 799 782 1,581 10.2 15,575
21. Kandy 2,275 1,974 4,249 38.3 3,287 2,230 5,517 49.7 763 577 1,340 12.1 11,106
22. Matale 357 505 862 43.0 133 802 935 46.6 22 186 208 10.4 2,005
23. Nuwara Eliya 743 584 1,327 53.9 632 472 1,104 44.8 14 19 33 1.3 2,464
3. Southern 779 1,802 2,581 43.5 515 2,094 2,609 44.0 47 699 746 12.6 5,936
31. Galle 50 73 123 64.4 5 58 63 33.0 - 5 5 2.6 191
32. Matara 699 1,697 2,396 43.4 455 1,986 2,441 44.2 30 656 686 12.4 5,523
33. Hambantota 30 32 62 27.9 55 50 105 47.3 17 38 55 24.8 222
4. Northern 1,448 1,062 2,510 33.6 2,262 1,605 3,867 51.8 638 449 1,087 14.6 7,464
41. Jaffna 1,448 1,062 2,510 33.6 2,262 1,605 3,867 51.8 638 449 1,087 14.6 7,464
6. North Western 344 298 642 56.3 81 339 420 36.8 - 78 78 6.8 1,140
61. Kurunegala 344 298 642 56.3 81 339 420 36.8 - 78 78 6.8 1,140
7. North Central 354 286 640 62.2 176 204 380 36.9 4 5 9 0.9 1,029
71. Anuradhapura 354 286 640 62.2 176 204 380 36.9 4 5 9 0.9 1,029
8. Uva 738 29 767 34.5 1,269 1 1,270 57.1 188 - 188 8.4 2,225
81. Badulla 738 29 767 34.5 1,269 1 1,270 57.1 188 - 188 8.4 2,225
9. Sabaragamuwa 367 369 736 62.6 202 207 409 34.8 15 16 31 2.6 1,176
91. Ratnapura 367 369 736 62.6 202 207 409 34.8 15 16 31 2.6 1,176
Total 27,963 26,113 54,076 39.7 33,947 30,661 64,608 47.4 8,581 8,965 17,546 12.9 136,230
Source : School Census 2020
%Total
Students
74. Students of Private Schools by Grade Cycle of Study, Sex, Province and District -2020
Province/ District
Primary Cycle Grade 1-5 Secondary Cycle Grade 6-11Senior Secondary Upper
Cycle Grade 12-13 (A/Ls)% %
Page 108

Sinhala TamilBilingual/
EnglishSinhala Tamil
Bilingual/
EnglishSinhala Tamil
Bilingual/
English
1. Western 29,387 2,521 7,854 19.8 28,397 3,092 16,608 34.5 8,912 752 4,162 30.1
11. Colombo 14,100 2,521 5,130 23.6 15,014 3,092 10,991 37.8 4,302 752 3,237 39.0
12. Gampaha 12,247 - 1,563 11.3 10,351 - 4,380 29.7 3,883 - 906 18.9
13. Kalutara 3,040 - 1,161 27.6 3,032 - 1,237 29.0 727 - 19 2.5
2. Central 5,011 1,260 167 2.6 4,492 1,232 1,832 24.2 1,010 158 413 26.1
21. Kandy 3,702 380 167 3.9 3,323 362 1,832 33.2 834 93 413 30.8
22. Matale 720 142 - - 737 198 - - 176 32 - -
23. Nuwara Eliya 589 738 - - 432 672 - - - 33 - -
3. Southern 2,581 - - - 2,454 - 155 5.9 746 - - -
31. Galle 123 - - - 63 - - - 5 - - -
32. Matara 2,396 - - - 2,286 - 155 6.3 686 - - -
33. Hambantota 62 - - - 105 - - - 55 - - -
4. Northern - 2,510 - - - 3,064 803 20.8 - 961 126 11.6
41. Jaffna - 2,510 - - - 3,064 803 20.8 - 961 126 11.6
6. North Western 642 - - - 240 - 180 42.9 69 - 9 11.5
61. Kurunegala 642 - - - 240 - 180 42.9 69 - 9 11.5
7. North Central 640 - - - - - 380 100.0 5 - 4 44.4
71. Anuradhapura 640 - - - - - 380 100.0 5 - 4 44.4
8. Uva 591 176 - - 691 171 408 32.1 145 43 - -
81. Badulla 591 176 - - 691 171 408 32.1 145 43 - -
9. Sabaragamuwa 736 - - - - - 409 100.0 31 - - -
91. Ratnapura 736 - - - - - 409 100.0 31 - - -
Total 39,588 6,467 8,021 14.8 36,274 7,559 20,775 32.2 10,918 1,914 4,714 26.9
Source : School Census 2020
Bilingual/
English
%
75. Students of Private Schools by Grade Cycle of Study, Medium of Study, Province and District -2020
Province/ District
Primary Cycle (Grade 1-5) Secondary Cycle (Grade 6-11)Senior Secondary A/L Cycle
(Grade 12-13)Bilingual/
English
%
Bilingual/
English
%
Page 109
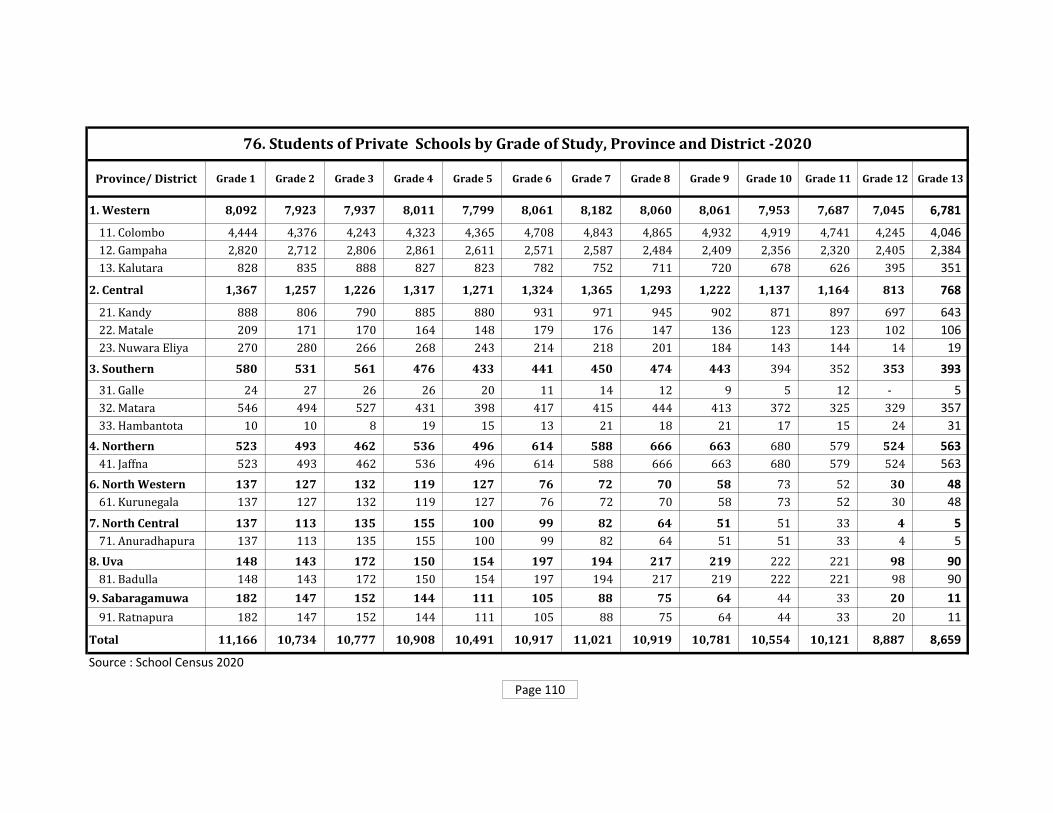
Province/ District Grade 1 Grade 2 Grade 3 Grade 4 Grade 5 Grade 6 Grade 7 Grade 8 Grade 9 Grade 10 Grade 11 Grade 12 Grade 13
1. Western 8,092 7,923 7,937 8,011 7,799 8,061 8,182 8,060 8,061 7,953 7,687 7,045 6,781
11. Colombo 4,444 4,376 4,243 4,323 4,365 4,708 4,843 4,865 4,932 4,919 4,741 4,245 4,046
12. Gampaha 2,820 2,712 2,806 2,861 2,611 2,571 2,587 2,484 2,409 2,356 2,320 2,405 2,384
13. Kalutara 828 835 888 827 823 782 752 711 720 678 626 395 351
2. Central 1,367 1,257 1,226 1,317 1,271 1,324 1,365 1,293 1,222 1,137 1,164 813 768
21. Kandy 888 806 790 885 880 931 971 945 902 871 897 697 643
22. Matale 209 171 170 164 148 179 176 147 136 123 123 102 106
23. Nuwara Eliya 270 280 266 268 243 214 218 201 184 143 144 14 19
3. Southern 580 531 561 476 433 441 450 474 443 394 352 353 393
31. Galle 24 27 26 26 20 11 14 12 9 5 12 - 5
32. Matara 546 494 527 431 398 417 415 444 413 372 325 329 357
33. Hambantota 10 10 8 19 15 13 21 18 21 17 15 24 31
4. Northern 523 493 462 536 496 614 588 666 663 680 579 524 563
41. Jaffna 523 493 462 536 496 614 588 666 663 680 579 524 563
6. North Western 137 127 132 119 127 76 72 70 58 73 52 30 48
61. Kurunegala 137 127 132 119 127 76 72 70 58 73 52 30 48
7. North Central 137 113 135 155 100 99 82 64 51 51 33 4 5
71. Anuradhapura 137 113 135 155 100 99 82 64 51 51 33 4 5
8. Uva 148 143 172 150 154 197 194 217 219 222 221 98 90
81. Badulla 148 143 172 150 154 197 194 217 219 222 221 98 90
9. Sabaragamuwa 182 147 152 144 111 105 88 75 64 44 33 20 11
91. Ratnapura 182 147 152 144 111 105 88 75 64 44 33 20 11
Total 11,166 10,734 10,777 10,908 10,491 10,917 11,021 10,919 10,781 10,554 10,121 8,887 8,659
Source : School Census 2020
76. Students of Private Schools by Grade of Study, Province and District -2020
Page 110

Male Female Total Male Female Total
1.Western 12 702 399 1,101 21 223 244
11.Colombo 5 311 175 486 13 103 116
12.Gampaha 4 281 145 426 8 87 95
13.Kalutara 3 110 79 189 - 33 33
2.Central 4 102 67 169 9 34 43
21.Kandy 2 70 42 112 5 23 28
22.Matale 2 32 25 57 4 11 15
3.Southern 4 219 146 365 15 73 88
31.Galle 2 85 41 126 7 20 27
32.Matara 1 65 49 114 1 21 22
33.Hambantota 1 69 56 125 7 32 39
4.Northern 1 58 56 114 8 20 28
41.Jaffna 1 58 56 114 8 20 28
5.Eastern 1 33 7 40 1 8 9
51.Batticaloa 1 33 7 40 1 8 9
6.North Western 2 145 103 248 9 32 41
61.Kurunegala 1 80 66 146 5 19 24
62.Puttalam 1 65 37 102 4 13 17
7.North Central 1 46 38 84 6 4 10
71.Anuradhapura 1 46 38 84 6 4 10
8.Uva 2 104 89 193 17 28 45
81.Badulla 1 67 55 122 9 20 29
82.Monaragala 1 37 34 71 8 8 16
9.Sabaragamuwa 3 88 94 182 7 30 37
91.Ratnapura 1 28 23 51 2 11 13
92.Kegalle 2 60 71 131 5 19 24
Total 30 1,497 999 2,496 93 452 545
Source : School Census 2020
Province/District SchoolsStudents Teachers
77. Basic Statistics of Special Schools by Province and District -2020
Page 111

Mulika MahaVidya-
yathanaTotal Clergy Laity Total Clergy Laity Total Clergy Laity Total
11. Colombo 35 11 3 49 2,423 1,015 3,438 242 164 406 11 3 14 420
12. Gampaha 41 21 4 66 2,965 3,020 5,985 318 303 621 8 7 15 636
13. Kalutara 33 10 8 51 2,344 3,668 6,012 228 287 515 6 4 10 525
21. Kandy 48 26 8 82 4,556 3,709 8,265 395 359 754 12 3 15 769
22. Matale 12 10 1 23 1,166 719 1,885 103 84 187 5 4 9 196
23. Nuwara Eliya 6 4 1 11 670 404 1,074 49 52 101 3 1 4 105
31. Galle 52 17 4 73 2,864 2,200 5,064 291 284 575 13 6 19 594
32. Matara 47 13 7 67 2,670 2,725 5,395 206 377 583 16 9 25 608
33. Hambantota 28 10 1 39 1,343 722 2,065 120 189 309 3 5 8 317
43. Vavuniya 1 1 2 66 577 643 7 28 35 1 1 36
44. Mullaitivu 1 1 16 14 30 2 3 5 1 1 6
52. Ampara 17 4 21 813 277 1,090 65 75 140 5 3 8 148
53. Trincomalee 5 1 1 7 245 449 694 24 31 55 1 1 2 57
61. Kurunegala 43 37 6 86 4,033 3,997 8,030 351 451 802 11 7 18 820
62. Puttalam 8 6 14 634 259 893 50 48 98 5 1 6 104
71. Anuradhapura 27 16 3 46 2,022 1,917 3,939 188 213 401 4 3 7 408
72. Polonnaruwa 8 7 15 839 577 1,416 63 62 125 1 1 126
81. Badulla 28 11 3 42 1,772 1,338 3,110 151 188 339 11 7 18 357
82. Moneragala 20 5 2 27 1,053 1,153 2,206 75 162 237 1 2 3 240
91. Ratnapura 38 8 5 51 1,785 2,475 4,260 186 244 430 7 2 9 439
92. Kegalle 17 19 7 43 2,218 2,166 4,384 185 233 418 5 2 7 425
Total 515 236 65 816 36,497 33,381 69,878 3,299 3,837 7,136 129 71 200 7,336
Source : School Census 2020
78. Basic Statistics of Piriven (Temple Schools) by District -2020
DISTRICT
No. of Pirivena No. of Students Approved Teachers Unapproved Teachers All
Teachers
Page 112
Note: 11 Seelamatha Education Institutes wereincluded under Mulika Pirivena Category

Page 113

114
Worked Team
Statistics Branch – Ministry of Education A team head and overall guidance of Mr. G.T.K.S. Perera, Senior Statistician and the Head of the Statistics Branch has been Organized and prepared this
publication “ Annual School Census of Sri Lanka, Final Report -2020”
Preparation of the online data entry program
Online data entry program prepared by ICT Division of the Department of Census & Statistics, special appreciation to leadership by Mr W.H.P.W.Weerasiri
Director (ICT) and Mr.P.M.R. Fernando Director (ICT), special appreciation to technical guidance by Mr. P.D.D. Peiris Deputy Director (ICT) and Mr.E.M.D.
Ekanayake Assistant Director (ICT), very special appreciation for all the hard work and commitment by Mrs. J.K.Dahanayaka Assistant Director (ICT) for
develop the web base online computer program.
All the coordination and leadership
Very Special appriation to Director (Reseach and Special Studies, Training and Printing) Mrs. U.V. Jayakody for her role of coordinating the Head of the
department, ICT division and our branch for develop this new web base program within short period of time.
Data Cleaning, Verification, Consistency Checking of Government Schools
Province Overall Supervision, Teacher Database Cleaning,
Verification, Consistency checking
Coordinating with Provincial, Zonal and Divisional offices, manual
checking of coverage and Students Data files Cleaning
Western Mrs. G.K.D. Nilmini, Statistician Colombo District – Ms. H.A.D. Ruchira (ICTA), Gampaha District – Ms.
M.A.L.Swarnahanshi (ICTA), Kalutara District – Ms. A.M.L.K.
Abeykoon (ICTA)
Central Kandy & Nuwara Eliya Districts -Mrs. J.K.A.S. Malsri,
Statistician, Matale District)- Mrs. G.K.D. Nilmini,
Statistician
Kandy & Nuwara Eliya Districts - Mrs.M.K.S Deepani (ICTA)
Matale District - Ms. M.A.L.Swarnahanshi (ICTA)
Southern Mrs. D.M.P Thalagala, Statistical Officer Mrs.E.A Chatika (ICTA)
North Western Mrs. D.M.P Thalagala, Statistical Officer Mrs. N Hettiarachchi (DO)
North Central Mrs. J.K.A.S. Malsri, Statistician Mrs.W.I.T Pieris (ICTA)

115
Province Overall Supervision, Teacher Database Cleaning,
Verification, Consistency checking
Coordinating with Provincial, Zonal and Divisional offices, manual
checking of coverage and Students Data files Cleaning
Northern Jaffna District – Mr. R. Skandharajah, Statistician
Mannar, Kilinochch Districts - Mrs. J.K.A.S. Malsri,
Statistician, Vavuniya & Mullaitivu Districts – Mrs. G.K.D.
Nilmini, Statistician
Mannar District – Mrs.W.I.T Pieris (ICTA), Kilinochchi District – Mr.
J.P.S.S. Jayasuriya (ICTA), Jaffna, Vavuniya & Mullaitivu Districts –
Ms. H.A.D. Ruchira (ICTA)
Eastern Ampara District – Mrs. G.K.D. Nilmini, Statistician
Batticaloa & Trincomalee Districts - Mr. R. Skandharajah,
Statistician
Ampara and Trincomalee Districts – Ms. A.M.L.K. Abeykoon (ICTA)
Batticaloa District - Ms. M.A.L.Swarnahanshi (ICTA)
Uva Mrs. J.K.A.S. Malsri, Statistician Mr. J.P.S.S. Jayasuriya (ICTA)
Sabaragamuwa Ratnapura District – Mrs. G.K.D. Nilmini, Statistician
Kegalle District - Mrs. D.M.P Thalagala, Statistical Officer
Mr.K.A.D.S.S Kodikara (Coding Clerk)
Government Schools - Teacher Database final cleaning & tabulations - Mrs. J.K.A.S. Malsri, Statistician
Private Schools - Mrs. J.K.A.S. Malsri, Statistician
Pirivenas - Mrs. G.K.D. Nilmini, Statistician
Special Schools - Mrs. D.M.P Thalagala, Statistical Officer
Support Officers
Mrs.N.D Yapa (Public Management Officer), Mrs.D.A Padigama (Document Assistant) & Mr. N.M.P.C. Thennakoon (KKS)
This Publication Prepared by:
Statistics Branch of Ministry of Education,
3rd Floor, “Isurupaya”, Pelawatta,
Battaramulla.
Telephone/ Fax : 011-2785566 Email: [email protected]/ [email protected]
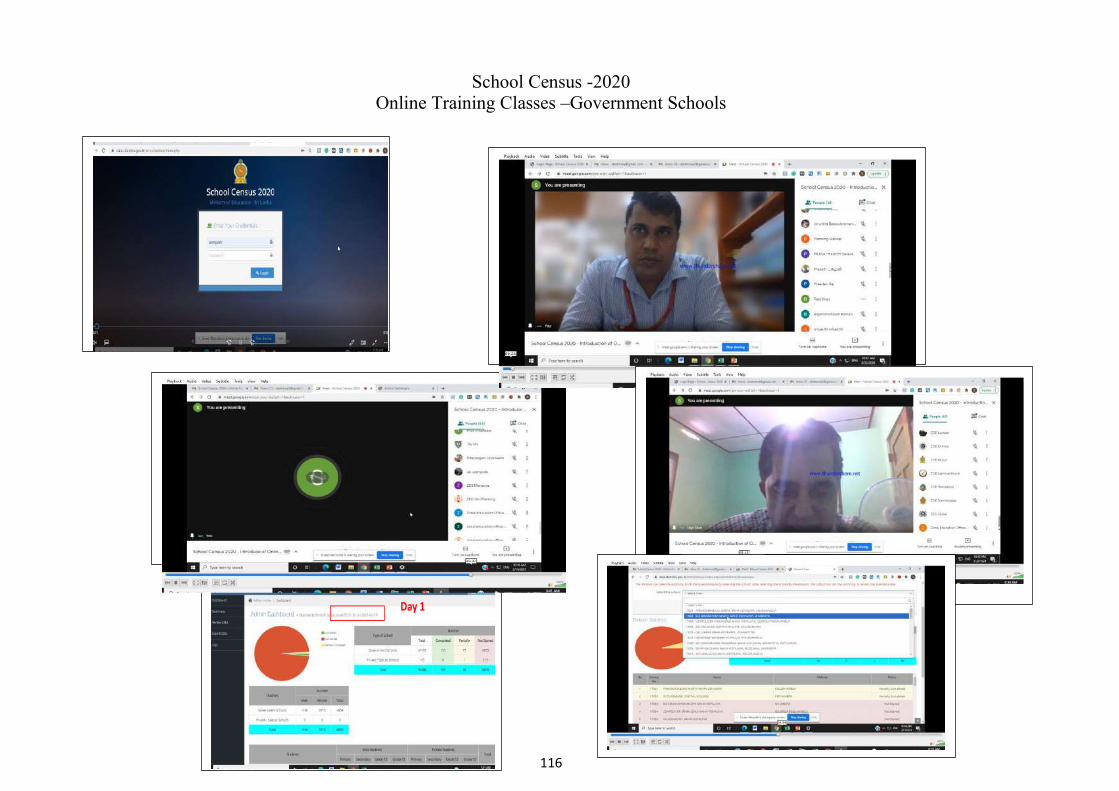
116
School Census -2020 Online Training Classes –Government Schools
Day 1