
2020 GLF Fraud Report - interactive.itwglf.com
56
October 2020 Powered by GLF Fraud Report TACKLING FRAUD: A COLLECTIVE INDUSTRY EFFORT 2020
Transcript of 2020 GLF Fraud Report - interactive.itwglf.com

October 2020
Powered by
GLF Fraud ReportTACKLING FRAUD: A COLLECTIVE INDUSTRY EFFORT
2020

2
This report has been commissioned by:
The ITW Global Leaders’ Forum (GLF) is a network of the leaders from the world’s largest international carriers, who convene to discuss strategic issues and to agree collaborative activities with the aim of driving the next phase of growth for the industry.
For more information please contact Jussi Makela at:
The report has been compiled and written by:
Delta Partners is a leading advisory and investment integrated platform globally. We are a unique hub for people, capital and knowledge to address challenges and opportunities in a transforming TMT industry. Our unique business model enables us to serve our TMT clients through our three business lines, Management Consulting, Corporate Finance and Private Equity.
For more information please contact Sam Evans at:

3
When the GLF first published its annual Fraud Report in 2018, the intention was to set a benchmark of where carriers were in terms of their priority and activities in fighting fraud. Repeating our survey each year allows us to consistently track our progress and enables focus on the key issues that are still to be addressed. We have then used the GLF Code of Conduct against fraud to signal commitment from the carriers to adhering to best practice. In discussions with GLF members on publication of the 2019 report it was evident that there is a keenness to move beyond signalling commitment to demonstrating that action is being taken to ensure compliance with the Code of Conduct. As such in 2020, beyond the annual survey, for the first time we have undertaken a process to assess whether carriers are adhering to the six principles set out in the Code of Conduct. Over the past two years, this report has seen the industry realise and raise the importance of fraudulent traffic at a senior executive level, increase the engagement in initiative to fight fraud and, now in 2020, understand the collective responsibility we all have to remove fraud from the industry.
From the data presented in this report it is clear that there is a lot of good work taking place across a wide range of carriers to reduce fraud. The engagement from fraud management teams across the industry this year has been extremely high with carriers keen to share the progress they are making. With regards to the Code of Conduct it is observed that while most carriers have a high level of compliance across the majority of the principles there is still room for improvement as there is a lack of consistently strong compliance across all carriers for all principles. As an industry, this is what we must strive for.
If from reading this year’s report you take away one message, I hope it is this: for the industry to remove fraud, we need to work consistently and collectively. Fraudulent actors continue to gain sophistication and if we leave loop-holes or ‘open doors’ through there being only a small number of carriers that, for example, are not proactively blocking number ranges identified as fraudulent or stopping all payment flows where fraudulent traffic is identified, we continue to allow incentives for fraud. To stop the fraud, we must stop the route to cash.
As the leadership body of the international carrier industry, I seek this consistent commitment from each one of my colleagues around the GLF table to proactively fight fraud and ensure that we set the example for other organisations to follow. I am grateful for their support up to now, and I believe through sharing back our current state of the industry through the 2020 report and Code of Conduct attestation survey results it will re-enforce the criticality of our work on fighting fraud.
I would like to take this opportunity to thank my colleagues in the GLF, all organisations that have contributed to this report including the CFCA and i3 Forum, the GLF management team, and Delta Partners for putting together this report. The GLF annual report has moved beyond being just a benchmark of carriers’ activities to become a benchmark for the industry that demonstrates our on-going commitment to work towards a fraud-free future. It is a possible future, and one that will enhance the value created by the global telecoms industry, but only realisable if we all work together.
Christian Michaud Tata Communications
Chair of the GLF Anti-Fraud Working Group
INTRODUCTIONfrom the Chair of the GLF Anti-Fraud Working Group
4
MOZAMBIQUE
Organisations that responded to the survey or had interviews
The GLF’s Working Group against Fraud was one of the original Working Groups set up by GLF members in 2017. Members recognised the severity of impact that fraudulent traffic was having and saw the need for further collaborative action at a senior executive level. Seeing the increasing prioritisation of the fraud topic amongst our membership is symptomatic of the further work that needs to be done.
At the GLF, we will continue to work closely with our membership to identify the optimal course of action to work on reducing fraudulent traffic as well as collaborate with partner organisations. Three organisations to mention in particular are CFCA, i3 Forum and Mobile Ecosystem Forum. The Communications Fraud Control Association (CFCA) are a not-for-profit international association working to reduce fraud in the telecoms industry through education, information sharing and collaboration. Their bi-annual fraud loss survey complements the findings in the GLF report to provide a comprehensive view of the ‘state of the industry’. i3 Forum continues to work to define the best practice policies and approaches for carriers to consistently fight fraud. GLF has previously endorsed much of their work on Fraud through its Code of Conduct. The Mobile Ecosystem Forum (MEF) has a dedicated Fraud Management Workstream within which one focus in A2P – an area of emerging focus in this year’s GLF report. The GLF looks forward to continuing working closely with all these organisations.
We continue to welcome all carriers to commit to the GLF Code of Conduct against fraud, or seek to be attested against its six principles. Following inclusion of the Code of Conduct self-attestation survey results in this year’s report we welcome any carrier who wishes to undergo the attestation process so that they might measure and benchmark their level of compliance. Over time, we hope that being able to demonstrate, or have demonstrated to them by their suppliers and customers, adherence to the six principles of the Code of Conduct will become a pre-requisite for carriers when seeking to do business with their partners.
I would like to thank the 34 organisations that have contributed to the 2020 Fraud Report. Your willingness to provide data and participate in extended discussions is the key enabler of GLF’s ability to provide such a detailed report on an annual basis.
Jussi MakelaGLF, Director
Contributors
Introduction from the GLF Director

5
Executive summaryList of exhibits
Part 1: Evolution of fraudulent traffic – 2020 in review1.1 The need to sustain focus on fraud1.2 The battle continues – an on-going fight against fraud
Deep Dive: International Revenue Share FraudDeep Dive: PBX hackingDeep Dive: Missed call campaigns / Wangiri
1.3 Going beyond voiceDeep Dive: A2P Fraud
1.4 The impact of COVID-19
Part 2: Tackling fraud – resources, investment, and consistency2.1 Raising awareness of the criticality of fraud management2.2 Technology investment – a key pillar in the fight against fraud2.3 A concern on consistent compliance
Part 3: Taking action, together3.1 Evolving industry efforts3.2 Setting the industry priorities
Action 1: Structured information sharing mechanismsAction 2: Revamp the industry policy and process for withholding paymentsAction 3: Facilitate easier engagement with law enforcement agenciesAction 4: GLF members showing consistent leadership
Part 4: Demonstrating commitment to action – adhering to the GLF Code of Conduct4.1 Lots of activity, but more work to be done4.2 Focus on the Principles
Principle 1: ReportingPrinciple 2: ProcessesPrinciple 3: DestinationsPrinciple 4: Payment flowsPrinciple 5: Information sharingPrinciple 6: Contracts
68
91114171819212224
25273133
36383939393940
414345454648505053
CONTENTS
5

6
EXECUTIVE SUMMARY
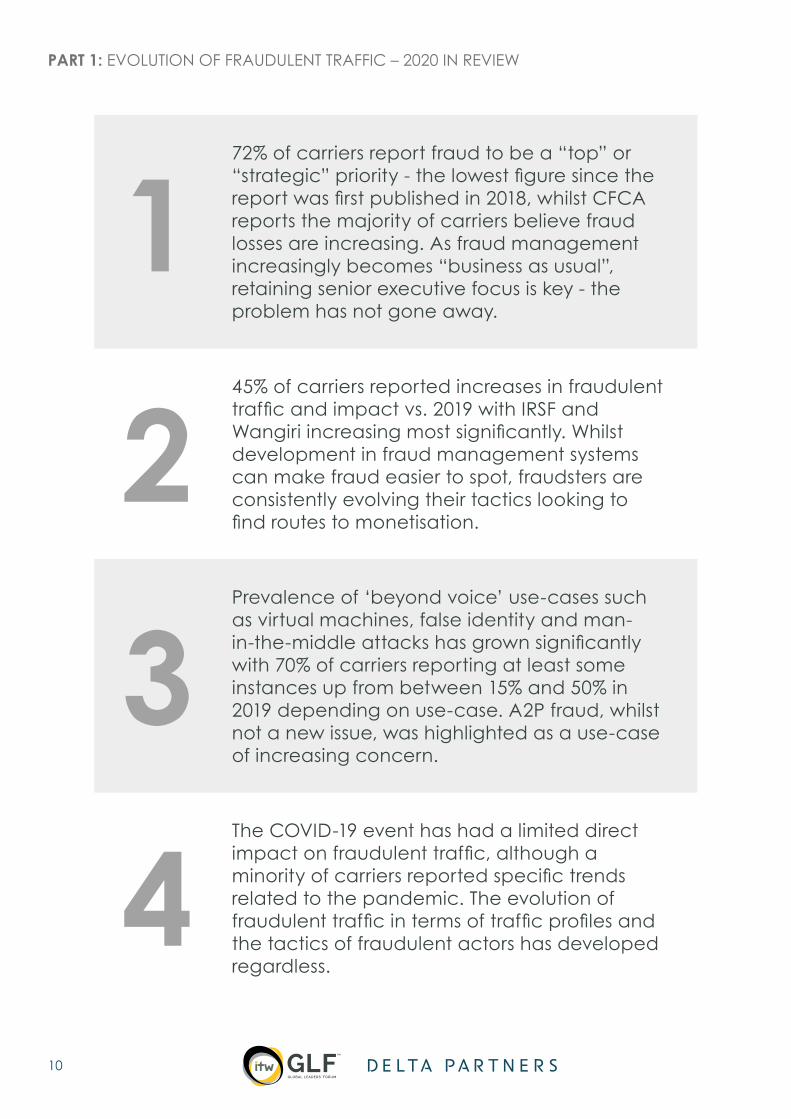
1. 72% of carriers report fraud to be a “top” or “strategic” priority – the lowest figure since the report was first published in 2018, whilst CFCA reports the majority of carriers believe fraud losses are increasing. As fraud management increasingly becomes “business as usual”, retaining senior executive focus is key – the problem has not gone away.
2. 45% of carriers reported increases in fraudulent traffic and impact vs. 2019 with IRSF and Wangiri increasing most significantly. Whilst development in fraud management systems can make fraud easier to spot, fraudsters are consistently evolving their tactics looking to find routes to monetisation.
3. Prevalence of ‘beyond voice’ use-cases such as virtual machines, false identity and man-in-the-middle attacks has grown significantly with 70% of carriers reporting at least some instances up from between 15% and 50% in 2019 depending on use-case. A2P fraud, whilst not a new issue, was highlighted as a use-case of increasing concern.
4. The COVID-19 event has had a limited direct impact on fraudulent traffic, although a minority of carriers reported specific trends related to the pandemic. The evolution of fraudulent traffic in terms of traffic profiles and the tactics of fraudulent actors has developed regardless.
5. 39% of carriers have increased the size of their fraud teams in the past 12 months, with focus on adding new skillsets to compete with the technical sophistication of fraudsters; the location of fraud management teams is diversifying from Finance – 65% of fraud teams sit in other functions.
6. Almost 60% of carriers expect to invest more in fraud monitoring / prevention infrastructure in the next 12 months – given the increasing sophistication of fraudsters, technology investment is key as it can enable greater accuracy in prediction and identification of fraudulent traffic as well as the automation of business processes enabling fraud teams to refocus their resources.
7. Tackling fraudulent traffic requires consistent action from all carriers; concerns were shared that not all carriers are proactively blocking fraudulent traffic and withholding payments, or creating onerous processes that disincentivise raising of disputes. Such activity enables the incentive for fraudulent actors to remain and undermines the activities of individual carriers.
8. Carriers see the need to enhance collaboration at an industry level on information sharing, management of payment withholding and simplification of regulation across geographies – for industry action to be effective there has to be a consistent effort across carriers with commitment to self-regulate their actions.

7
9. Four areas of potential action for GLF: develop a structured cross-carrier information sharing mechanism; revamp the industry policy and process for withholding payments; facilitate easier engagement for carriers with respective law enforcement agencies in local markets; ensure their members show consistent leadership and action.
10. Code of Conduct attestation highlights significant individual carrier compliance but more work to be done to ensure that all carriers are consistently compliant across all six principles – it is the consistency of compliance which is the critical factor to stop fraud.
11. Ensuring the presence of real-time processes to block fraudulent traffic once identified, and ensure that all contracts have i3 Forum anti-fraud clauses are two areas requiring greatest development. Whilst most carriers have processes in place to stop payment flows, some conditions, such as requirement to provide local police reports, make them difficult for customers to implement.

8
EXHIBIT 1: EXHIBIT 2:EXHIBIT 3: EXHIBIT 4: EXHIBIT 5:EXHIBIT 6:EXHIBIT 7:EXHIBIT 8:EXHIBIT 9:
EXHIBIT 10:EXHIBIT 11:EXHIBIT 12:EXHIBIT 13:EXHIBIT 14:EXHIBIT 15:EXHIBIT 16:EXHIBIT 17:EXHIBIT 18:EXHIBIT 19:EXHIBIT 20:EXHIBIT 21:EXHIBIT 22:EXHIBIT 23:EXHIBIT 24:EXHIBIT 25:EXHIBIT 26:EXHIBIT 27:EXHIBIT 28:EXHIBIT 29:EXHIBIT 30:EXHIBIT 31:EXHIBIT 32:EXHIBIT 33:EXHIBIT 34:EXHIBIT 35:EXHIBIT 36:EXHIBIT 37:
LIST OF EXHIBITS
Comparing the importance of fraudulent traffic in carriersCFCA survey assessment of fraud loss impact and trendRelationship between bad debt and fraudAssessing the change in volume and impact of fraudulent trafficAnnual change in volume and impact of fraud use-casesAssessing the volume of fraud use-casesAssessing the financial impact of fraud use-casesMapping the volume and financial impact of fraud use-casesOverview of IRSF value flowOverview of PBX hacking value flowOverview of missed call campaign value flowPrevalence of fraudulent traffic use-cases beyond voiceOverview of A2P fraud typesDistribution of carriers’ FTEs allocated to manage fraudEvolving the resource allocated to manage fraudMapping changes in resource allocation and fraud priority in carriersDiversity of fraud department locations across locationsDistance between fraud teams and top managementInvestment outlook in fraudUsage of automated tools across areasPerception of peer commitment to fighting fraudComparison between own commitment and perception of others’GLF Code of Conduct six principlesCode of Conduct attestation survey resultsTable of carriers’ compliance at different thresholdsDistribution of carrier compliance to Principle 1: TargetsFrequency of fraudulent traffic report distributionDistribution of carrier compliance to Principle 2: ProcessesPresence and speed of fraud processesDistribution of carrier compliance to Principle 3: DestinationsConsistency of blocking fraudulent number rangesDistribution of carrier compliance to Principle 4: Payment flowsDistribution of carrier compliance to Principle 5: ReportingPrevalence of information sharing between peersParticipation in industry forumsDistribution of carrier compliance to Principle 6: ContractsConsistency of fraud clause contract adoption
11121314151616171819202122272828293031323334434444454647484849505152525354
9
PART 1EVOLUTION OF FRAUDULENT TRAFFIC – 2020 IN REVIEW
TACKLING FRAUD: A COLLECTIVE INDUSTRY EFFORT
10
PART 1: EVOLUTION OF FRAUDULENT TRAFFIC – 2020 IN REVIEW
2
4
1
3
45% of carriers reported increases in fraudulent traffic and impact vs. 2019 with IRSF and Wangiri increasing most significantly. Whilst development in fraud management systems can make fraud easier to spot, fraudsters are consistently evolving their tactics looking to find routes to monetisation.
The COVID-19 event has had a limited direct impact on fraudulent traffic, although a minority of carriers reported specific trends related to the pandemic. The evolution of fraudulent traffic in terms of traffic profiles and the tactics of fraudulent actors has developed regardless.
72% of carriers report fraud to be a “top” or “strategic” priority - the lowest figure since the report was first published in 2018, whilst CFCA reports the majority of carriers believe fraud losses are increasing. As fraud management increasingly becomes “business as usual”, retaining senior executive focus is key - the problem has not gone away.
Prevalence of ‘beyond voice’ use-cases such as virtual machines, false identity and man-in-the-middle attacks has grown significantly with 70% of carriers reporting at least some instances up from between 15% and 50% in 2019 depending on use-case. A2P fraud, whilst not a new issue, was highlighted as a use-case of increasing concern.

11
For some time within the telecoms industry, fraudulent traffic has been perceived as a cost of doing business with a limited, although varying depending on carrier, financial impact. As such, efforts to contain, reduce or remove fraudulent traffic have been historically relatively unstructured and unsynchronised with carriers working independently with a selection of their peers or across a range of industry forums to address specific commercial, regulatory, and technical issues. However, the industry mindset and approach are changing – increasingly fraudulent traffic is being recognised to be a strategic issue that beyond the financial effects can create a detrimental brand impact. As explained by one carrier “the impact on the brand on being associated with [fraud] outweighs the benefit of turning a blind eye”. Given the nature of fraudulent traffic, to identify and remove it from the network not only requires increased prioritisation within carriers, but also structurally within the telecoms industry.
2020 marks the third annual GLF Fraud Report and in preparing this edition through discussions with members of carrier fraud teams, there is an observed increase in determination from many of the organisations contributing that “now is the time” the industry works together to tackle fraud. However, as seen in Exhibit 1, 2020 shows the lowest share of carriers citing fraud as a “top” or “strategic” priority since the report began – 72% in 2020, compared with 80% in 2019 and 85% in 2018. Where there has been an increase in “Same as Business as Usual” versus fraudulent traffic as a “strategic priority” it was explained by several carriers that previous years of increased focus and investment had now led to an elevated status of fighting fraud within the organisation and as such it now operated at a “business as usual” status. As stated by one carrier, “we have mature systems that have driven fraud levels to record lows, and the team now has over three years of experience”. Another added that their senior executive “does not need to check every month as fraud is now under control and not causing any ‘pain points’ – it has become business as usual”.
EXHIBIT 1: COMPARING IMPORTANCE OF FRAUDULENT TRAFFIC IN CARRIERS
Where should you rank the importance of fraudulent traffic as a topic in your organisation(% responses)
How has the importance of fraudulent traffic management in your organisation changed over the past 12 months?(% responses)
5% 2% 6%11% 18%
22%
53% 51%44%
32% 29% 28%
n=20 n=45 n=32
2018 2019 2020
Low priority Same as Business as Usual Strategic priority Top priority
Strategic or top priority
0%2% 0%7%
0%
26%
34%38%
37%
20% 35%
37% 36%26%
n=20 n=44 n=34
2018 2019 2020
No response Significantly reducing Slightly reducing
Staying the same Marginally increasing Significantly increasing
Marginally or significantly
increasing
Notes: Respondents without a response more not counted; Source GLF Survey 2020, Delta Partners Analysis
PART 1: EVOLUTION OF FRAUDULENT TRAFFIC – 2020 IN REVIEW
1. THE NEED TO SUSTAIN FOCUS ON FRAUD

12
The trend of a “higher-level of business as usual” for addressing fraud is supported by the three-year trend of the level of importance that fraudulent traffic has in the organisation, where 2020 has the lowest score on “significantly increasing”. As such, it appears that there is an improved maturity of carriers focus on fraud since when this report was first produced in 2018. That is not to say that the focus on fraud is new - when comparing the time series of data over the past three years there are 8 carriers that have consistently reported since 2018 that fraudulent traffic management is a “top” or “strategic” priority. It is also not to say that the fight against fraud has been won – there is still much work to do.
It is critical that fraud remains as a top priority within telecoms organisations as the financial impact of fraud continues, and in many cases is being perceived to increase, with the impact on respective carriers influenced by the geographical spread of their networks and the maturity of their fraud management systems.
In their 2019 survey, the Communications Control Fraud Association (“CFCA”) identified that at an industry level, 73% of respondents believed the value loss due to fraud has either increased or stayed the same since 2017, whilst in their own organisations 56% said that fraud had trended up compared to 40% in 2017. As explained by one carrier: “we must ensure that our senior management does not think the problem has gone away”.
EXHIBIT 2: CFCA SURVEY ASSESSMENT OF FRAUD LOSS IMPACT AND TREND
71%
56%64%
51%
23%
33%7%
22%
7% 11%
29% 27%
2013 2015 2017 2019
% To
tal R
espo
nses
Trended Up Stayed the SAME Trended Down
Over the past 12 months, do you think Global fraud losses have trended up, trended down, or stayed the same?
Over the past 12 months, has fraud IN YOUR COMPANY trended up, trended down, or stayed the same?
53% 50%40%
56%
39%
24%
28%
10%
8%
26% 33% 34%
2013 2015 2017 2019
% To
tal R
espo
nses
Trended Up Stayed the SAME Trended Down
Source: CFCA Fraud Loss survey 2019
Fraudulent traffic does have a measurable financial impact. As shown in Exhibit 3 below, CFCA’s bi-annual survey highlights that the share of respondents for which fraud is accounting for over 10% of bad debt in their company has increased from 22% in 2015 to 28% in 2019. Whilst the share of respondents that scored over 20% of bad debt being related to fraud
is declining, which is good news for the industry, the CFCA survey demonstrates that the financial impact of fraud is sustaining. It was shared by some carriers that over the next 12-18 months they hope to see increased focus on reducing the financial impact of fraud.
PART 1: EVOLUTION OF FRAUDULENT TRAFFIC – 2020 IN REVIEW

13
EXHIBIT 3: RELATIONSHIP BETWEEN BAD DEBT AND FRAUD
What percentage of bad debt is a result of fraud in YOUR COMPANY?
77.8% 78.1%
72.1%
5.6%9.8%
18.6%13.9%
7.3% 7.0%2.8% 2.4%
0.0%2.4% 2.3%
2015 2017 2019
<10% 10-20% 21-30% 31-40% 41-50% >50%
Source: CFCA Fraud Loss survey 2019, Delta Partners Analysis
PART 1: EVOLUTION OF FRAUDULENT TRAFFIC – 2020 IN REVIEW

14
The 2020 Fraud Survey results suggest that 2020 has seen an increased level of growth in the volume and impact of fraudulent traffic versus 2019 with 45% of respondents noting that fraudulent traffic had ‘marginally’ or ‘significantly’ increased. This growth was reflected in many of the interviews with carriers where it was noted that “the number of attacks is increasing” as it is “still easy to launch fraudulent traffic attacks” with that caveat that investment in fraud management systems has meant that they are more equipped to detect and stop fraud. Therefore, it is not clear if on absolute terms and at a global level fraudulent traffic is increasing, or
if this growth is based on the increased amount of fraudulent traffic being detected. However, it was a commonly held view that the move towards IP connectivity is leading to an increase in fraudulent traffic, and in some regions specific spikes in growth were recorded. For example, in one Asian country a carrier reported that the total volume of fraud has been twice as high as last year.
Exhibit 4 shows that in 2020 only 30% of respondents reported a reduction in fraudulent traffic, compared with 47% in 2019 and 50% in 2018. With the volume of identified fraudulent traffic increasing year-on-year it justifies why it must remain an industry priority.
EXHIBIT 4: ASSESSING THE CHANGE IN VOLUME AND IMPACT OF FRAUDULENT TRAFFIC
How has the VOLUME AND IMPACT of fraudulent traffic hitting your organisation CHANGED in the past 12 months?(% responses)
2018
2019
2020
Significantly increasing
Marginally increasing
Staying the same
Slightly reducing
Significantly reducing
25% 20% 5% 30% 20%
13% 20% 20% 34% 13%
24% 21% 24% 9% 21%
Notes: 1 n=33, respondents without a response were not counted; Source: GLF Survey 2018-2019-2020, Delta Partners Analysis
Breaking down the change in volume and impact of fraudulent traffic by use-case, as seen in Exhibit 5, there were two use-cases that showed the greatest share of respondents identifying as ‘significantly increasing’: missed call campaigns / Wangiri and international revenue share fraud (“IRSF”). These two use-cases appear be a sustained challenge for carriers – in the 2019 report IRSF was reported as having ‘very high’ or ‘somewhat high’ volume
impact by 77% of carriers and value impact by 61%. Given this year only 21% of carriers are reporting a reduction in IRSF and 15% in missed call campaigns, there is concern that the incentive for this traffic to be originated is still present. Carriers have not yet been successful in blocking it from their networks and stopping the payment flows, and therefore the incentive for the fraudulent actors remains.
2. THE BATTLE CONTINUES – AN ON-GOING FIGHT AGAINST FRAUD
PART 1: EVOLUTION OF FRAUDULENT TRAFFIC – 2020 IN REVIEW

15
EXHIBIT 5: ANNUAL CHANGE IN VOLUME AND IMPACT OF FRAUD USE-CASES
33% 18% 33% 9% 6%
26% 15% 38% 12% 9%
12% 32% 35% 12% 9%
9% 18% 47% 6% 21%
3% 45% 24% 14% 14%
3% 12% 56% 21% 9%
With respect to different fraudulent voice traffic use-cases how has their volume and impact changed over the past 12 months?(% responses)
Call hijacking4
False Answer Supervision6
Hacking of acustomer
telephone system5
International revenue
share fraud2
Calls to manipulated
B-numbers3
Missed call campaigns1
Significantly increasing
Marginally increasing
Staying the same
Slightly reducing
Significantly reducing
Notes: 1 n=33, 2 n=34, 3 n=34, 4 n=34, 5 n=29, 6 n=34; Source: GLF Survey 2020, Delta Partners Analysis
Exhibit 6 assesses the volume of fraud cases observed in the network. As with the findings from the assessment of year-on-year growth, it is IRSF and missed call campaigns that are seeing the highest volumes, with 73% and 63% respectively of carriers reporting ‘moderate’ or higher instances. However, this does suggest for IRSF that carriers are having some impact in reducing the volume growth as in 2018 87% of carriers reported ‘moderate’ and above instances.
Given carriers ongoing development in fraud management systems, several explained to us that they are measuring instances of fraud at two stages – ‘pre-matured’ and ‘matured’. Pre-matured fraud is the identified traffic that is blocked before it can impact the network, whilst matured fraud is actual fraud that has commercial cost against it. It is hoped that through measuring the two metrics, carriers will see the potential value of pre-matured fraud significantly outweigh the value of matured fraud, and over-time the instances of pre-matured fraud reducing.
There was concern from carriers that the continued high-level of fraudulent traffic demonstrates that “fraudsters are getting more mature” as they find ways to circumvent the protections put in place. At the same time, it was shared that “fraud is becoming more complex” and “harder to spot” with the on-going battle between carrier and fraudster a “cat and mouse game”. One carrier commented that “fraudsters seem to know the thresholds in the networks to get fraudulent traffic through” and a new trend identified this year is artificially generated traffic moving from higher value to lower value destinations. Carriers explained that when they first saw these instances it seemed to defy logic as it was not the traditional method for fraudsters, until they realised that effective blocking of fraudulent traffic on more expensive routes had led the fraudsters to seek to deliver higher volumes on lower value routes to bypass the fraud shields. Once identified, fraud management systems had to be updated to predict and identify traffic that fit this profile whilst minimising the risk of mis-identifying genuine traffic.
PART 1: EVOLUTION OF FRAUDULENT TRAFFIC – 2020 IN REVIEW

16
EXHIBIT 6: ASSESSING THE VOLUME OF FRAUD USE-CASES
35% 26% 12% 9% 18%
21% 18% 24% 9% 29%
15% 15% 9% 29% 32%
9% 15% 21% 18% 38%
9% 6% 15% 32% 38%
6% 24% 24% 15% 32%
By use-case, what level of VOLUME are you experiencing? (from 1-5, with one being lowest and 5 being highest)(% responses)
Call hijacking
False Answer Supervision
Hacking of acustomer
telephone system
Very high Somewhat High Moderate Somewhat Low Very Low
Calls to manipulated
B-numbers
Missed call campaigns
International revenue
share fraud
Notes: n=34; Source: GLF Survey 2020, Delta Partners Analysis
When looking at the financial impact of fraud cases, it is IRSF and PBX hacking which survey respondents indicated were the highest with 50% and 42% respectively scoring as ‘very high’ or ‘somewhat high’. These results do demonstrate improvement from 2019 where IRSF was scored ‘very high’ or ‘somewhat high’ by 61% and PBX hacking by 47%.
The financial impact of missed call campaigns / Wangiri has also dropped significantly between 2019 and 2020 moving from 19% to 9% of ‘very high’ or ‘somewhat high’ instances suggesting that carriers are increasingly able to identify it in the ‘pre-mature’ stage.
EXHIBIT 7: ASSESSING THE FINANCIAL IMPACT OF FRAUD USE-CASES
32% 18% 15% 21% 15%
18% 24% 12% 18% 29%
12% 12% 12% 21% 44%
6% 9% 24% 62%
3% 12% 12% 41% 32%
3% 6% 21% 38% 32%
By fraud use-case, what level of FINANCIAL IMPACT are you experiencing?(% responses)
Call hijacking
Hacking of acustomer
telephone system
Very high Somewhat High Moderate Somewhat Low Very Low
International revenue
share fraud
Calls to manipulated
B-numbers
Missed call campaigns
False Answer Supervision
Notes: n=34; Source: GLF Survey 2020, Delta Partners Analysis
PART 1: EVOLUTION OF FRAUDULENT TRAFFIC – 2020 IN REVIEW
17
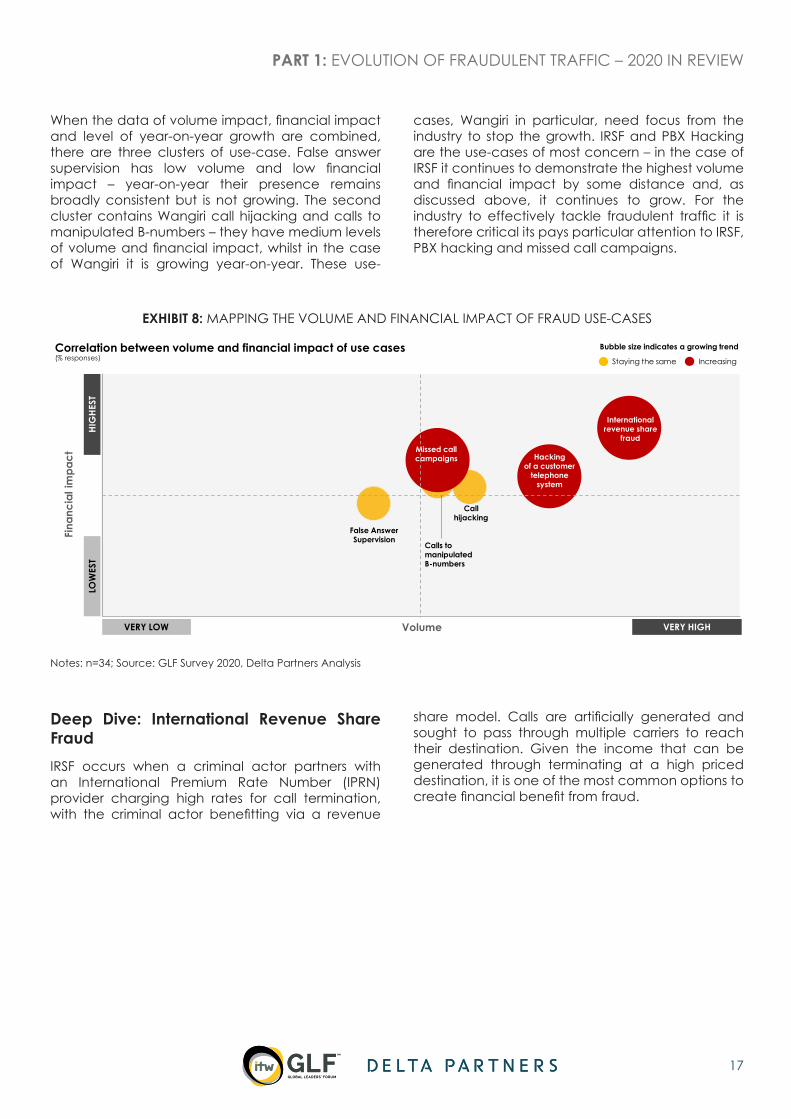
When the data of volume impact, financial impact and level of year-on-year growth are combined, there are three clusters of use-case. False answer supervision has low volume and low financial impact – year-on-year their presence remains broadly consistent but is not growing. The second cluster contains Wangiri call hijacking and calls to manipulated B-numbers – they have medium levels of volume and financial impact, whilst in the case of Wangiri it is growing year-on-year. These use-
cases, Wangiri in particular, need focus from the industry to stop the growth. IRSF and PBX Hacking are the use-cases of most concern – in the case of IRSF it continues to demonstrate the highest volume and financial impact by some distance and, as discussed above, it continues to grow. For the industry to effectively tackle fraudulent traffic it is therefore critical its pays particular attention to IRSF, PBX hacking and missed call campaigns.
EXHIBIT 8: MAPPING THE VOLUME AND FINANCIAL IMPACT OF FRAUD USE-CASES
LOW
EST
HIG
HEST
VERY LOW
Fina
ncia
l im
pact
Volume VERY HIGH
Bubble size indicates a growing trend
LOW
EST
HIG
HEST
VERY LOW VERY HIGH
Call hijacking
False Answer Supervision
Calls to manipulated B-numbers
Missed call campaigns
International revenue share
fraud
Hackingof a customer
telephonesystem
Staying the same IncreasingCorrelation between volume and financial impact of use cases(% responses)
Notes: n=34; Source: GLF Survey 2020, Delta Partners Analysis
Deep Dive: International Revenue Share FraudIRSF occurs when a criminal actor partners with an International Premium Rate Number (IPRN) provider charging high rates for call termination, with the criminal actor benefitting via a revenue
share model. Calls are artificially generated and sought to pass through multiple carriers to reach their destination. Given the income that can be generated through terminating at a high priced destination, it is one of the most common options to create financial benefit from fraud.
PART 1: EVOLUTION OF FRAUDULENT TRAFFIC – 2020 IN REVIEW

18
EXHIBIT 9: OVERVIEW OF IRSF VALUE FLOW
1
The criminals acquire numbers from International
Premium Rate Number (IPRN) providers
2
The criminals generate a high volume of international calls to those numbers, for
instance, using botnets, servers running stolen SIM cards or the wangiri scam
3
The fraudulent calls may pass through 6 or 7
operators to get to their termination point
4
Eventually, the telecom operators will block the calls
to the premium rate numbers
5
The IPRN providers share the revenue with the criminals
Acquire number
Generate traffic
Calls pass through
Operators block calls
Revenue is shared
HOW DOES IT WORK?
Source: Europole, Delta Partners analysis
With regards to the evolution of IRSF over the past year, the feedback from carriers was that the level of artificially generated traffic continues to be high, and that whilst many carriers are consistently blocking this traffic once identified, the continued ability for the traffic to terminate given non-complete compliance in the industry sustains the incentive for the fraudsters. As is discussed in Part 2.3 of this report, the incentive for non-compliance to allow IRSF traffic through your network, i.e. “turning a blind eye” increases when the voice market is flat or stagnating and carriers benefit from revenues generated by fraudulent traffic to reach their targets. Concern was raised by several carriers by their direct awareness or belief that “there are still carriers supporting fraud and establishing revenue share” and that to stop IRSF, carriers would need to stop allowing this traffic through their network. It was noted that if all carriers consistently adhere to the GLF Code of Conduct or the recommendations of the i3 Forum then the flow of funds to fraudulent actors can be stopped. Additionally, it was emphasised that each individual carrier must look at the traffic passing through its network and work with their customers to identify fraudulent traffic to stop both it and the related payments.
A further challenge in the past year in identifying and blocking artificial IRSF traffic has been fraudsters’ diversification from higher value termination rates to lower value termination rates, providing an on-
going challenge for effective blocking of fraudulent traffic, given the need to avoid blocking non-fraudulent traffic. There is understandable pressure from retail customers to ensure that genuine traffic is not blocked, and therefore a challenge for wholesale carriers is to meet their obligations with retail customers whilst seeking to remove all fraudulent traffic. As a result, several carriers advocated for closer wholesale-retail collaboration, with one carrier proposing “unless we start working collaboratively with other retail player we are going to be kept in a cycle where we resolve one issue and another arises”.
Deep Dive: PBX hackingPBX hacking incidents can occur when business premises are unattended, PBX use is not monitored and/or the PBX is accessible externally allowing attackers to infiltrate the retail customer telephone systems by accessing admin passwords. Once access is gained the fraudulent party establishes call-forwarding or dial-through to a high priced destination. Calls are placed and routed via the PBX and, in most cases, the business owners are unaware of the event. In the most extreme cases a single case of PBX hacking fraud can cost several thousand dollars.
PART 1: EVOLUTION OF FRAUDULENT TRAFFIC – 2020 IN REVIEW

19
EXHIBIT 10: OVERVIEW OF PBX HACKING VALUE FLOW
PBX hack flow diagram
Terminatingoperator
Premium rate service
FraudCo High cost int'l destination
Enterprise PBX system
Wholesale carrier
Fraudster hacks PBX of an enterprise
1
Fraudster forwards calls through PBX
2
Call forwarded from hacked PBX
3
4
5 6 7Originatingoperator
Call flow
Money flow
Missed call LegitimateFraudulent
Source: Delta Partners analysis
There are four primary methods of PBX hack, depending on the entry point to the system: brute force attacks, gaining access through systems still using default passwords, ability to gain access credentials through employees or vendors, social engineering, or access through open service ports. Once the hacker has access to the PBX, they are able to generate revenue through directing traffic to premium-rate phone numbers targeting termination in overseas destinations where the likelihood of prosecution is low.
Given the tactics of the hackers, whilst the stopping of other fraudulent traffic use-cases requires the identification and blocking of fraudulent traffic across a network, in the case of PBX hacking significant steps can be taken through ensuring comprehensive security around the PBX system. Many of the ‘entry points’ described above can
be closed through ensuring that employees and vendors are trained, and contractually obliged, to follow defined policies to ensure PBX security. Where carriers have seen a reduction in PBX hacking it has been down to improvements made in security around accessing PBX.
Deep Dive: Missed call campaigns / WangiriMissed call campaign, also known as Wangiri fraud is the receipt of missed calls from international numbers that prompts the recipient to call back to a high price rated line. Fraudsters acquire lists of phone numbers to subsequently call and immediately disconnect.
PART 1: EVOLUTION OF FRAUDULENT TRAFFIC – 2020 IN REVIEW

20
EXHIBIT 11: OVERVIEW OF MISSED CALL CAMPAIGN VALUE FLOW
Missed Call Campaign
1
Subscriber returns phone call
4
2
Terminatingoperator
Wholesale carrier
Call routed internationally or domestically or to mobile line but with
spoofed caller IDFraudster places call
$
FraudCo
$
``Called
subscribers
Fraudster ends call after one ring
3
Premium rate service
6
Originatingoperator
$
$$$$$$$$$$$$
Subscriber unknowingly calls a
premium-rate number and is held on the phone for as
long as possible
5 Call routed to premium-rate number
Call flow
Money flow
Missed call LegitimateFraudulent
Source: i3 Forum fraud definitions
Since the first edition of the GLF Fraud Report in 2018, Wangiri has been identified as a consistently high volume, although relatively low financial impact, use-case. As explained by one carrier, “we identify Wangiri fraud as an increasing type, and hackers are constantly trying to detect our approach and develop new tactics to be more effective”. The fact that in 2020 it has been identified as one of the most growing use-cases suggests the industry has not yet identified an effective approach to block it from networks. However, from speaking with carriers this year it is evident that significant work is going into this. It was echoed by a second who stated that “Wangiri is an active concern, even though it has been there for a while and is business as usual, the level of aggressiveness is worrying”. It was shared that a significant amount of Wangiri is being machine driven, for example from IoT-based SIM cards being used to generate traffic.
Fraud Management Systems (FMS) can be effective in stopping Wangiri traffic when they collect and aggregate the blocked CDRs. Building a more comprehensive profile of the patterns of Wangiri traffic can help it be identified and blocked on the network. Some carriers reported their effectiveness in Wangiri fraud control, even to the extent that there are plans to monetise it through making the solution commercially available to other carriers. This raises as interesting debate for the industry – whilst fighting fraud needs a collective effort, some carriers see the effectiveness of fighting fraud as a competitive differentiator. Where carriers seek to
differentiate through their fraud management tools it is a signal to customers that they take the issue seriously and can highlight where, perhaps, other carriers are doing so less. They recognise that it is not a positive area of differentiation for the industry as it demonstrates fraud is still an issue and one that looking forward can hopefully be removed. Whilst some carriers seek to use fraud management as an area of differentiation it is critical that this does not create a disincentive to share information and collaborate with peers.
Carriers also shared their frustration in tracing back missed call campaigns to identify the source. Tracing the call back through the chain to the origination source is made challenging through NDAs protecting against sharing data on spam or spoofed calls, and some carriers requiring provision of police reports to act.
It was explained by one carrier that an evolution to the traditional Wangiri model is being seen. This carrier noted that they had recently discovered that whilst analysing their international traffic there were many multi-national corporations with call centres making outbound calls to customers all over the world. Those companies had online forms to attract sales leads and customer information. This carrier identified that fraudsters were filling in online forms for these companies asking for an outbound call. The fraudsters were hiring people on their behalf to fill out forms to propose calls and therefore stimulate the artificial generation of traffic.
PART 1: EVOLUTION OF FRAUDULENT TRAFFIC – 2020 IN REVIEW

21
PART 1: EVOLUTION OF FRAUDULENT TRAFFIC – 2020 IN REVIEW
In the 2019 report, for the first time the focus extended beyond purely use-cases related to voice. It was reported that 26% of survey respondents had experienced false identity (bot) attacks, 13% man-in-the-middle, and 49% virtual machine / emulators. Based on that data, in 2020 carriers were asked about the prevalence of non-voice use cases.
A virtual machine / emulator is used to simulate traffic and can be used by a fraudster to be used as a virtually no-cost disposable device of which multiple copies can be used to generate as much traffic as possible. 38% carriers reported ‘medium’ or ‘high’ number of instances of virtual machine / emulator presence, with only 31% respondents saying that they had no cases, down from 51% in 2019.
Bots are simple programmes that can probe network entry points looking for weak login credentials or alternative opportunities to gain access. Once an
entry point is found, identities can be stolen and used to access a wide-range of services, as well as enable other types of fraud such as IRSF. 53% of carriers reported ‘medium’ or ‘high’ volume of false identity (bots) on their networks, compared to in 2019 where only 26% of respondents cited any experiences. The number of carrier respondents having no case of false identity on their network has fallen from 74% in 2019 to 26% in 2020.
A man-in-the-middle attack occurs when the route and protocols utilised to transmit information are compromised allowing a middleman to monitor and manipulate the traffic. In telecoms networks this can be in the form of cell-site simulators that mimic a tower to ‘roam’ onto. Whereas only 13% of carrier respondents in 2019 reported having experienced man-in-the-middle attacks, this increased to 69% in 2020, with 38% reporting ‘high’ or ‘medium’ instances.
EXHIBIT 12: PREVELANCE OF FRAUDULENT TRAFFIC USE-CASES BEYOND VOICE
31% 13% 16% 41%
25% 13% 31% 31%
24% 29% 21% 26%
22% 16% 31% 31%
Beyond voice, what use-cases of fraud are you experiencing on your network and to what volume? (score vs. voice instances: none, low, medium, high)(% responses)
False identity (bots)2
‘Man in the middle’ attacks (e.g. IoT device
commandeering)1
Virtual machines / emulators1
Other1
High Medium Low None
Notes: 1 n=32, 2 n=34 ; Source: GLF Survey 2020, Delta Partners Analysis
3. GOING BEYOND VOICE

22
PART 1: EVOLUTION OF FRAUDULENT TRAFFIC – 2020 IN REVIEW
Where carriers scored ‘other’, their feedback was primarily around various forms of SMS frauds, A2P traffic simulation, SIM swapping and identity fraud.
Deep Dive: A2P FraudAn additional use-case that emerged frequently in survey responses and interview discussions in 2020 compared to previous years was A2P SMS fraud. As articulated by one carrier: “We are starting to see A2P fraud – everyone knows the scam for malicious links on SMS, but we are starting to see now artificial traffic for revenue share on SMS. Because the fraud
on voice is well controlled, they are moving now to monetising SMS”. Fraud in A2P is already at significant financial scale – it was previously estimated by the Mobile Ecosystem Forum that fraud costs the A2P market around $2bn per year. Whilst SMS/A2P fraud is not a new phenomenon for the telecoms industry, this year marked the first that carriers were proactively raising it as part of the GLF Fraud Report.
Exhibit 13 provides an overview of the multitude of fraudulent use-cases that are prevalent on SMS, and emerging in OTT messaging, exploiting in particular the growth of A2P as a communications channel.
EXHIBIT 13: OVERVIEW OF A2P FRAUD TYPES
A2P Fraud types
ENTERPRISE
MARKET
CONSUMER
NETWORK
MESSAGINGECOSYSTEM
SMS phishing
SMS originator spoofing
SCCP Global Title Faking
SIM Farms
MAP Global Title Faking
Artificial Inflation of Traffic (AIT)
Grey routes due to absence of AA19 / AA60 agreement
SMSC Compromise Fraud
SMS Malware(SMS Hacking)
SPAM
Access hacking
Source: Mobile Messaging Program (MEF)

23
PART 1: EVOLUTION OF FRAUDULENT TRAFFIC – 2020 IN REVIEW
Through discussions contributing to this year’s report, four use-cases were highlighted in particular – Access hacking, artificially generated traffic, SIM farms and SIM originator spoofing. The Mobile Ecosystem Forum provides clear definitions of each type, specifically:
• Access hacking – the credentials of a legitimate third party are hijacked, or the sending party sends messages by hacking a website which has the ability to send SMS, by providing fake company information, by using a stolen credit card or other payment method and/or by buying messages with no intention of paying for them.
• Artificially generated traffic – rogue third party uses mobile originated interconnect revenue share as a way of generating profit by sending messages to itself, commonly via a SIM Farm
• SIM Farms – using a bank of consumer, Machine to Machine (M2M) or Enterprise SIM cards for the delivery of A2P messages. The practice allows messages to be sent inexpensively by taking advantage of specific consumer SIM retail offers which are sold without sufficient contractual protections to prevent M2M and Enterprise SIMs from being used for A2P messaging.
• SMS originator spoofing – sending party’s true identity is deliberately hidden in order to trick a consumer into thinking that a message is from someone familiar to them, for example, by using the originator ‘Apple’ to pretend to be “Apple”, or “HMRC” (UK Tax Office)
Based on the feedback from carriers in this years’ report, it is anticipated that there will be greater focus on the ‘beyond voice’ use-cases including A2P, bots, man-in-the-middle and virtual machines in the 2021 report.

24
PART 1: EVOLUTION OF FRAUDULENT TRAFFIC – 2020 IN REVIEW
One trend that was not anticipated when developing the 2019 GLF Fraud Report was the emergence of a global pandemic in 2020 that would have a far reaching impact on the lives of all individuals and enterprises. As part of this report, carriers were asked how the COVID-19 event has impacted fraudulent traffic. Feedback from the majority of carriers was that whilst there was not a direct impact, certain traffic flows, such as international voice, have increased and therefore fraudulent traffic patterns have adapted with them. In the words of one carrier: “the higher the traffic, the higher the fraud”. Overall, the general consensus was that fraudulent traffic in terms of traffic profiles and the tactics of fraudulent actors has developed regardless of the global pandemic context.
There was a subset of carriers, however, that reported a more direct impact from the COVID-19 event on fraud citing particular occurrences:
1. Increase in specific use-cases such as stolen SIM driven roaming. Additionally, the growth of online conferencing services such as Microsoft Teams enabled growth in call hijacking and robo-calls. Fraudsters are anticipating a greater likelihood from end-users to return calls to an unknown number.
2. Increase in IRSF and Wangiri fraud seeking to capitalise on work-from-home environments where people may be more susceptible to return a missed call to an unknown international number
3. A short period where the increase in fraudulent traffic increased significantly but was relatively easy to identify and block
4. Acceleration of online shopping caused by COVID created increased focus, for retail telco provider, on protecting customers from authentication fraud or attempts to steal identification credentials
Overall, it appears as if fraud management teams may be one of the few parts of any organisation during the COVID-19 event that have not been significantly impacted by the pandemic – as such, it is critical that they can retain their focus whilst the industry seeks to come through the wider impact of COVID-19.
4. THE IMPACT OF COVID-19

25
PART 2TACKLING FRAUD – RESOURCES, INVESTMENT, AND CONSISTENCY
TACKLING FRAUD: A COLLECTIVE INDUSTRY EFFORT

26
PART 2 : TACKLING FRAUD – RESOURCES, INVESTMENT, AND CONSISTENCY
2
1
3
Almost 60% of carriers expect to invest more in fraud monitoring / prevention infrastructure in the next 12 months – given the increasing sophistication of fraudsters, technology investment is key as it can enable greater accuracy in prediction and identification of fraudulent traffic as well as the automation of business processes enabling fraud teams to refocus their resources.
39% of carriers have increased the size of their fraud teams in the past 12 months, with focus on adding new skillsets to compete with the technical sophistication of fraudsters; the location of fraud management teams is diversifying from Finance – 65% of fraud teams sit in other functions.
Tackling fraudulent traffic requires consistent action from all carriers; concerns were shared that not all carriers are proactively blocking fraudulent traffic and withholding payments, or creating onerous processes that disincentivise raising of disputes. Such activity enables the incentive for fraudulent actors to remain and undermines the activities of individual carriers.

27
PART 2 : TACKLING FRAUD – RESOURCES, INVESTMENT, AND CONSISTENCY
In Part 1 of this report, it was identified that 72% of carriers view fraud as a ‘strategic’ or ‘top priority’. Whilst it is important to state the importance of fraud to the organisation, it is of greater criticality that carriers are resourcing their fraud management
teams effectively. This year’s survey identified that, shown in Exhibit 14 below, 40% of organisations have five or more FTE allocated to managing fraud, which was marginally higher that in 2019.
EXHIBIT 14: DISTRIBUTION OF CARRIERS’ FTE ALLOCATED TO MANAGE FRAUD
How many cumulative FTE are allocated internally to managing fraud? (% responses)
60%
15%
25%
0-5 5-10 More than 10
Notes: n=27; Source: GLF Survey 2020, Delta Partners Analysis
When asked if the cumulative FTE allocated to managing fraud has increased over the past 12 months, 39% reported higher and only 3% lower, compared with 33% and 17% respectively in 2019. When asked in 2019 regarding the predicted change in the following 12 months, 40% of respondents indicated a likely increase in resources, consistent with the actual increase this year. Looking forward, 38% of carriers reported that that they expect to increase resources in the next year. Carriers reported that fraud management was no longer being viewed in their organisations as a “sunk cost” but rather a “growing cost if not fought effectively” and therefore warranting increased resourcing and investment. With regards to resourcing of
fraud teams this year, two trends had emerged or accelerated over the past year:
1. Increased involvement from senior management – ability to automate fraudulent traffic reports and extract data from systems has given greater visibility to management, therefore raising awareness, and increasing dialogue with fraud teams.
2. Recognition of fraudulent traffic impact on company financials – the ongoing challenge for carriers to fight against evolving fraud tactics has driven the need for fraud management teams to invest in specialised resources with greater ability to predict sources of attacks.
1. RAISING AWARENESS OF THE CRITICALITY OF FRAUD MANAGEMENT

28
EXHIBIT 15: EVOLVING THE RESOURCE ALLOCATED TO MANAGE FRAUD
How many cumulative FTE are allocated internally to managing fraud, compared to 12 months ago?1(% responses)
Do you foresee it changing in the next 12 months?2(% responses)
39%
58%
3%
Higher Same Lower
3%
38%
59%
Decrease Increase No change
Notes: 1 n=33, 2 n=32; Source: GLF Survey 2020, Delta Partners Analysis
To assess whether carriers are matching their prioritisation of fraud with their resourcing, their answers to both questions were mapped against each other. Exhibit 16 shows that there is an overall
correlation with carriers reporting fraudulent traffic as a ‘strategic’ or ‘high’ priority most likely to have increased the FTEs allocated to fraudulent traffic over the past 12 months.
EXHIBIT 16: MAPPING CHANGES IN RESOURCE ALLOCATION AND FRAUD PRIORITY IN A CARRIER
Correlation between ranked importance by carrier and increase in FTEs (% responses)
LOW
ERSA
ME
HIG
HER
Low priority Same BAU Strategic priority Top priority
FTES
com
pare
d to
12
mon
ths a
go
Importance of fraudulent traffic in your organisation
3% 3% 23% 13%
16% 23% 16%
3%
Notes: n=31, it excludes “non answered”; Source: GLF Survey 2020, Delta Partners Analysis
PART 2 : TACKLING FRAUD – RESOURCES, INVESTMENT, AND CONSISTENCY

29
Beyond the size of fraud team, its location in the organisation matters. Historically, many fraud teams were in Finance departments since fraud was flagged as a cost centre. Over time, and with the greater technological focus in the fight against fraud there has been a decentralisation away from finance into other segments of the business. Fraudulent traffic management is no longer the primary domain of Finance, but can be in Security, Operations, Risk Management, IT and even customer care, demonstrating that the role of fraud management teams goes beyond cost and revenue assurance. This diversity is shown in Exhibit 17, where CFCA asked its members to report on the location of their fraud departments. Only 36% reported this to be in the Finance function.
Carriers explained that fraudulent traffic management teams are “increasingly seen as a centre of excellence” and taking a technology driven approach. One explained that every
three weeks the fraud team meets with a team of technology developers to understand what further innovations can be made, as well as having a collaboration with university researchers. Whilst some fraud teams are increasingly taking operational and commercial roles, the importance of instilling the right focus was raised as a priority. As explained by one carrier: “we are careful not to have KPIs [in the fraud management team] as it can drive the wrong behaviour”, with instead the focus on ensuring that learnings are shared with all fraud events over a EUR 5,000 threshold requiring a post-mortem assessment.
The diversity of location is symptomatic of the new skillsets that fraudulent traffic management teams require. Research for this report identified that teams are increasingly seeking out specialist resources that have not historically been considered for fraud, such as online digital security, payment fraud specialists, data scientists and AI/ML specialists.
EXHIBIT 17: DIVERSITY OF FRAUD DEPARTMENT LOCATIONS ACROSS ORGANISATIONS
Where is the fraud department located in your company?
1.64%
6.56%
11.48%
13.11%
19.67%
27.87%
36.07%
Customer Care
IT
Risk Management
Operations
Other (please specify)
Security
Finance
Source: CFCA Fraud Loss survey 2019
In the GLF Code of Conduct against fraud, the first principle addresses the internal reporting of KPIs on fraudulent traffic. It is critical this reporting is exposed to senior management and there is full awareness on the extent of fraudulent traffic attacks and the work that is being delivered to minimise its impact. At
a senior level it is critical that executives understand the sources of fraudulent traffic onto their network so that they can engage with their peers in other carriers as required to ensure consistent mitigating action.
PART 2 : TACKLING FRAUD – RESOURCES, INVESTMENT, AND CONSISTENCY
30
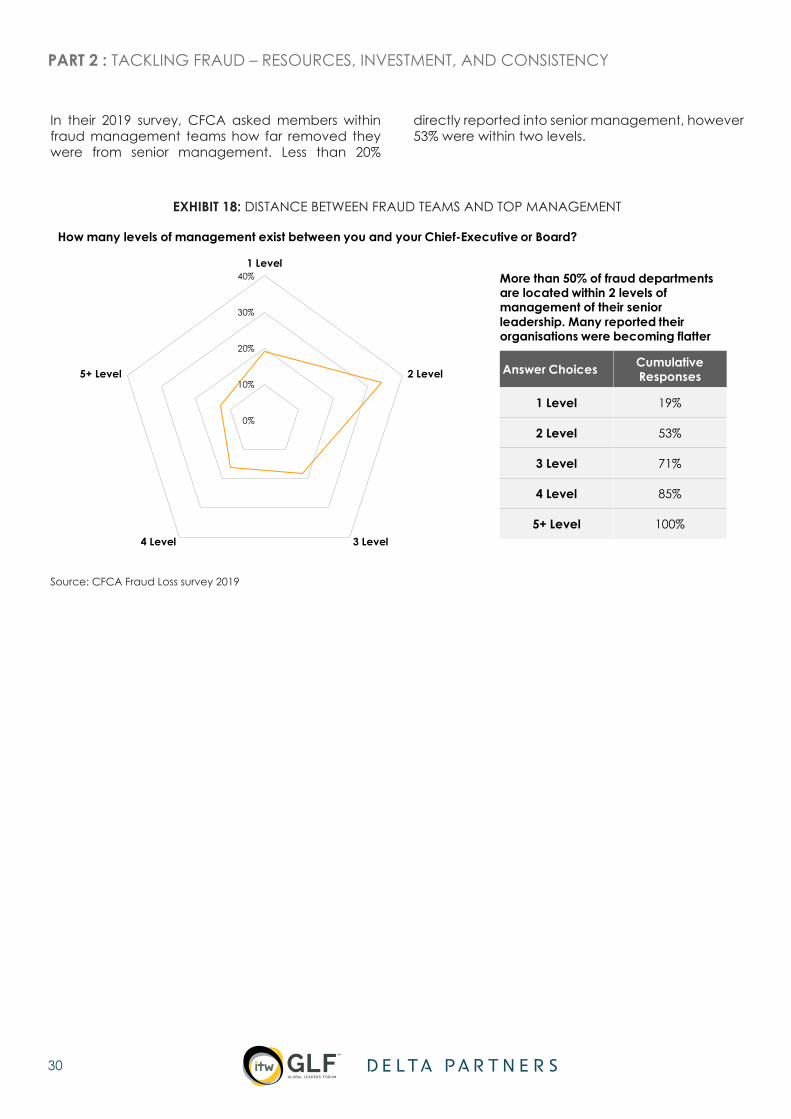
In their 2019 survey, CFCA asked members within fraud management teams how far removed they were from senior management. Less than 20%
directly reported into senior management, however 53% were within two levels.
EXHIBIT 18: DISTANCE BETWEEN FRAUD TEAMS AND TOP MANAGEMENT
How many levels of management exist between you and your Chief-Executive or Board?
0%
10%
20%
30%
40%1 Level
2 Level
3 Level4 Level
5+ Level
More than 50% of fraud departments are located within 2 levels of management of their senior leadership. Many reported their organisations were becoming flatter
Answer Choices Cumulative Responses
1 Level 19%
2 Level 53%
3 Level 71%
4 Level 85%
5+ Level 100%
Source: CFCA Fraud Loss survey 2019
PART 2 : TACKLING FRAUD – RESOURCES, INVESTMENT, AND CONSISTENCY

31
A consistent theme raised through discussions with carriers this year was the importance of technology in the fight against fraud. As fraudsters evolve their tactics to circumvent carriers’ fraud management system thresholds, advanced AI / ML algorithms are required to predict and identify fraudulent traffic creating real-time alerts. Almost 60% of carriers surveyed indicated that they expect to further invest in fraud monitoring and prevention infrastructure in the next 12 months, with technology investment at the core of this.
EXHIBIT 19: INVESTMENT OUTLOOK IN FRAUD
57%
43%
2020
Yes No
Do you foresee investing more in fraud monitoring / prevention infrastructure in the next 12 months?(% responses)
Notes: n=28; Source: GLF Survey 2020, Delta Partners Analysis
This years’ interviews with carriers identified two primary ways that technology is supporting fraud management teams:
1. Enabling greater accuracy in prediction and detection – the on-going increase in sophistication of fraudster tactics is making fraud harder to detect, with algorithms to identify traffic patterns needing to be constantly updated. As explained by one carrier from their experience with machine learning: “we are using systems that learn from the trends and patterns of fraud. Given the spread in A-number and B-number ranges, it is tough for individuals in the team to spot the fraud”. Where carriers have been able to invest in evolving their fraud management systems, they reported a positive impact to their organisation regarding the cost of fraud despite overall instances of fraud increasing.
2. Automating business processes – increasingly carriers are automating the processes with regards to fraud detection and alerts. This is allowing carriers to re-focus resources in the fraud management teams away from the data analysis and processing into what was referred to as “problem solving” to better anticipate future methods of hackers or alternative approaches that could be taken to block fraudulent traffic.
In their 2019 survey, CFCA asked how organisations were using automated tools in their fraud management teams. As seen in Exhibit 20, the majority reported that this is for rules based FMS, with only a subset so far deploying machine learning or artificial intelligence. Within the carriers surveys for this report, interviews indicated that within GLF carriers may have higher than the 6% adoption identified in the CFCA survey, but it is evident there is still some way to go – from the benefits described by the carriers already adopting AI and ML there is encouragement for the future capability development of anti-fraud teams.
PART 2 : TACKLING FRAUD – RESOURCES, INVESTMENT, AND CONSISTENCY
2. TECHNOLOGY INVESTMENT – A KEY PILLAR IN THE FIGHT AGAINST FRAUD

32
EXHIBIT 20: USAGE OF AUTOMATED TOOLS ACROSS AREAS
Does your department use automation tools in any of the following areas?
6%
70%
9% 15%0%
Machine Learning/ ArtificialIntelligence Based FMS
Rules Based FMS Decision Engines Manual Processes Other
Rules based systems dominate the types of tools utilised, but ML/AI tools are starting to be utilised. But as reported on thetypes of positions organisations are looking to recruit, we may see more BI tools and digital online tools in the future
Source: CFCA Fraud Loss survey 2019
When discussing technological innovation, carriers shared their belief that both they themselves as well as the technology vendors were driving innovation in fraud management systems. The carriers explained that they were clear in the nature of solutions that they required but at the same time were open to purchasing from vendors if relevant. One aspect that was identified as important to carriers was their ability to own their fraud data. At the same time that both carriers and vendors are pushing innovation, there was some concern raised by specific carriers that the industry could get caught up with hype-cycles of new technology such as blockchain and not focus on what can be implemented.
PART 2 : TACKLING FRAUD – RESOURCES, INVESTMENT, AND CONSISTENCY

33
PART 2 : TACKLING FRAUD – RESOURCES, INVESTMENT, AND CONSISTENCY
One of the consistent themes arising in the interviews conducted for the 2020 Fraud Report was the belief that other carriers in the industry were not showing high commitment to the fight against fraudulent
traffic. This is demonstrated in Exhibit 21, which shows that 49% of carriers shared the belief that their peers are showing ‘high commitment’ whilst 14% believed they were showing ‘low commitment’.
EXHIBIT 21: PERCEPTION OF PEER COMMITMENT TO FIGHTING FRAUD
What level of commitment do you believe your peers have to addressing fraudulent traffic?(% responses)
41%45%
14%
0%
High commitment Same as any ‘business as usual’ activity Low commitment No commitment
Notes: n=29; Source: GLF Survey 2020, Delta Partners Analysis
When carriers’ own commitment is compared against their perception of the level of commitment from their peers, there is a clear mismatch with 72% of carriers stating it is a ‘strategic’ or ‘top’ priority for themselves but in less than 50% of cases believe that there is a high commitment from their peers. As Exhibit 22 shows, of the carriers that believe fraud is a top priority, 44% believe that other carriers do not
share this commitment; in the group that say it is a strategic priority that increases to 71%.
If effectively fighting fraud requires a consistent industry-wide effort, more needs to be done by carriers to demonstrate to their peers the priority they are giving internally so there can be an alignment of commitment.
3. A CONCERN ON CONSISTENT COMPLIANCE

34
EXHIBIT 22: COMPARISON BETWEEN OWN COMMITMENT AND PERCEPTION OF OTHERS’
56%
29% 29%
33%
57%71%
50%
11% 14%
50%
Top priority Strategic priority Same as Business as Usual Low priority
High commitment Same as any ‘business as usual’ activity Low commitment
% of fraud ranked
importance28% 22% 6%44%
What level of commitment do you believe your peers have to addressing fraudulent traffic?
Same to low
com
mitm
ent
Same to low
comm
itment
Notes: n=32; Source: GLF Survey 2020, Delta Partners Analysis
What is causing this mis-match in perception between own and others’ commitment to fighting fraud, and particular the concern from 14% of carriers that ‘low commitment’ is being shown by their peers? Through interviews, several carriers provided anecdotal examples of the actions of other carriers through which they believe fraudulent traffic is enabled to sustain – as articulated by one carrier sharing the view of others: “there are some players in the industry who are quite happy to wave [fraudulent traffic] through”. Whilst this sentiment was repeated across multiple carriers it is not clear whether they were all referring to the same specific carriers making this an isolated issue, or pointing towards a more wide-spread challenge. Within discussions, the carriers which raised the examples suggested two approaches some of their peers were following that enables fraud to continue:
1. Increasing the level of proof to stop payment flows – it was explained that to accept a dispute regarding fraudulent traffic, some carriers are insisting on police reports from the local market in which the fraud was identified. Producing such reports can be a complex and time-consuming process and in effect create a barrier to reclaiming payments made for fraudulent traffic.
2. Seeking forgiveness when identified – it was explained that there are some carriers who -
when fraud is identified - are “very nice to deal with, and will be responsive as they know that not all fraudulent traffic has been spotted”. It is a concern of the carriers that raised this type of example that some carriers may be seeking to be collaborative because they know that other fraudulent traffic has got “through the net”.
Both of these approaches are examples where carriers could demonstrate that they have processes in place to fight fraud but, in reality, their actions are counter-productive. Having a process to block or refund payments from identified fraudulent traffic is critical, but the presence of a process is not sufficient in itself. The process must be designed to be actionable and facilitate the purpose for which it was set up.
The presence of only a few carriers that take the decision to not actively block fraudulent traffic or related payment flows can have a disproportionate impact on the industry’s fight against fraud. There was significant frustration shared by carriers through their interviews where it was shared that “we have invested a lot in [fighting] fraud, but we are not being helped by bad actors”. Where fraudsters can identify potential routes that can be exploited for fraudulent traffic, they will proceed to exploit it. A common message from many of the carriers interviewed for this study was “to stop fraud you have to stop the cash” and that if there is a potential
PART 2 : TACKLING FRAUD – RESOURCES, INVESTMENT, AND CONSISTENCY

35
PART 2 : TACKLING FRAUD – RESOURCES, INVESTMENT, AND CONSISTENCY
for originators of fraudulent traffic to find cash they will continue their activities. As such, all carriers must work together to “stop the cash”.
Where carriers may have historically created financial value from not stopping fraudulent traffic on their networks, starting to consistently block all fraud can have a commercial impact. In the current telecoms industry dynamic where there are challenges to deliver top-line performance, and furthermore for carrier teams to continue to deliver growth or minimise the decline from voice, there can be an incentive to ‘turn a blind eye’ to fraudulent traffic. This was a topic raised in several of the interviews for this report, and articulated by one carrier that: “artificially generated traffic can help you generate financial performance”, and that “some carriers need fraudulent traffic to make their voice numbers”. Another carrier explained “if you are comfortable to have a certain amount of computer generated traffic in your network, turn up the dial and get some extra revenue. Say to the CFO ‘give me a number’, until you exhaust your capacity”.
Taking the decision to block all fraudulent traffic can be a “painful journey to explain that it will cut out huge swathes of revenue” and necessitates a change in objectives. Carriers raised concerns that some of their peers who they believe are financially benefitting from fraud on their networks do not want to go through the “painful journey” of removing the revenues associated from fraudulent traffic on their networks. Where carriers have made the decision to block all fraudulent traffic once identified, they shared their view that “the impact on the brand of being associated with [fraudulent traffic] outweighs the benefit of turning a blind eye” and the subsequent benefits of their decision.
Carriers agreed that it is important to raise this issue to the senior executive level – it has to be explained to senior executives so that they are in a position where they cannot say that they are unaware of fraudulent traffic on their network. There cannot be the excuse of ignorance at a senior executive level. As such, education of senior executives regarding types of fraudulent traffic, their occurrence on the network, its implication both to their business and the wider industry, and even its link to funding organised crime or terrorism is critical.

36
PART 3TAKING ACTION, TOGETHER
TACKLING FRAUD: A COLLECTIVE INDUSTRY EFFORT

37
PART 3 : TAKING ACTION, TOGETHER
2
1
Four areas of potential action for GLF: develop a structured cross-carrier information sharing mechanism; revisit the industry policy and process for withholding payments; facilitate easier engagement for carriers with respective law enforcement agencies in local markets; ensure their members show consistent leadership and action.
Carriers see the need to enhance collaboration at an industry level on information sharing, management of payment withholding and simplification of regulation across geographies - for industry action to be effective, there has to be a consistent effort across carriers with commitment to self-regulate their actions.

38
PART 3 : TAKING ACTION, TOGETHER
Due to some of the experiences and carriers’ perceptions of mis-aligned commitment shared in Part 2.3 taking collaborative action on fraudulent traffic can be a sensitive topic. However, there was a view shared by many carriers that more could be, and must be done, collaboratively. Given the complexity of telecoms fraud ensuring mutual collaboration recognising that it is an industry level requirement, and not just for the benefit of a single organisation, and the principle of self-regulation are critical. Within discussions with carriers three areas of collaboration were predominantly discussed where collaboration can be enhanced:
1. Information sharing
a. Current model: peer-to-peer information sharing based on personal relationships between fraud management specialists. No consolidated database of fraudulent traffic reports.
b. Impact: carriers can take action based on the information that is shared with them, but it is an incomplete industry picture.
c. Carriers’ proposed potential evolution: develop a single industry platform for sharing information and consolidating data regarding fraudulent traffic including identification of carriers generating fraudulent traffic, and ranges of fraudulent A-number and B-number ranges. It was a repeated view that given the collective industry responsibility to stop fraudulent traffic, there needs to be a single trusted repository of information. At the same time, carriers also noted that the idea of an industry platform is not a new concept and one that is challenging to implement due to legal restrictions around publicly sharing information that could accuse another carrier of fraud without sufficient proof.
2. Management of payment withholding
a. Current model: carriers follow their own policies and processes with regards to blocking fraudulent traffic and withholding payments. There is no common process followed meaning that carriers need to work
with suppliers and customers on a case-by-case basis with different requirements based on who they deal with.
b. Impact: payment withholding is being applied inconsistently, and there are instances where the process in place to withhold payment is overly onerous to be effective.
c. Carriers’ proposed potential evolution: carriers commit to a consistent approach to withholding payments and process to manage fraudulent traffic dispute.
3. Simplification of regulation
a. Current model: fragmented regulation and enforcement across countries with lack of a unified commission that can serve as a decision maker and enforcement body.
b. Impact: hinders effective cross-border fraud prevention as fraudsters can target locations where the chance of prosecution is lowest; complex for international carriers to ensure they comply with requirements in the multiple geographies.
c. Carriers’ proposed potential evolution: explore how there can be alignment between regulatory bodies, or even the creation of a multi-national commission to unify the approach for blocking fraud across markets and serve as an enforcement body. This was recognised to be a “long-shot” but carriers were keen to see how they can move beyond the current complexity of working across multiple international jurisdictions with differing regulations.
To be successful, the evolution of these forms of collaboration will require consistent support across the industry. Carriers will need to self-regulate their behaviour, be transparent with their peers to demonstrate that they are being proactive to stop all fraudulent traffic and payment flows on their networks, and commit to solving fraud at an industry level.
1. EVOLVING INDUSTRY EFFORTS

39
PART 3 : TAKING ACTION, TOGETHER
From the information shared and conversations had with carriers across geographies, there were four areas of actions that were proposed most commonly where it was believed collaborative action is needed and the GLF can play a role:
ACTION 1
Structured information sharing mechanisms
As observed in Part 3 and Part 4 of this report, carriers are sharing information with each other on identification of fraudulent traffic. However, this is in an unstructured and often ad-hoc manner between peers who have existing trusted relationships. There is no consolidated single dataset where carriers can validate if, for example, number ranges are fraudulent, or be alerted to proactively block destinations and payments. As explained by one carrier: “Having consolidated spreadsheets of all international numbers that are valid and then block the invalid one, would help a lot towards fraud reduction.” A second carrier commented that GLF should “Build the right blacklist information for the industry with the support of an organisation to move numbers in and out of the blacklist”. Whilst the desire is clear, execution is significantly more complex. It is difficult to scientifically prove that traffic is fraudulent – carriers identify fraudulent traffic today through sophisticated algorithms which monitor traffic patterns creating alerts when patterns fall outside determined parameters. As such, were traffic to be mistakenly identified as fraudulent, a false positive, then the carriers financially impacted by such determination could potentially take legal action, especially if it were communicated, incorrectly, at an industry level that they were
generating or allowing passage to fraudulent traffic. Such constraints make the development of a ‘single source of truth’ and an industry enforcement mechanism, outside of established law enforcement agencies, challenging.
To fill the gap, there would be benefit in having an industry-wide structured communication mechanism in which carriers can share information bi-laterally or multi-laterally between fraud teams not constrained to their existing personal networks. The GLF’s Network Security Communications Platform is a relevant case study and precedent – such a model could be extended to fraud teams. Creating a mechanism that could enable close to real-time communication with peers, requests for information, and anonymous sharing of information with the wider community would create structure to how information is managed. However, for such a platform to be effective, carriers have to proactively share information. As explained by one carrier: “we will have less incentive to share when we see very little from the others. The mandate should be that at least once a month you share information”. To be successful the platform would need commitment from participants to actively contribute on a regular basis.
ACTION 2
Revamp the industry policy and process for withholding payments
Given carriers’ frustration on the varying approach and process they believe their peers are taking to withholding payments for fraudulent traffic, the industry should seek to enhance the industry proposed policy and process. It is critical that carriers commit to a consistent policy of withholding payments and the process put in place facilitates efficient dispute resolution between carriers, removing the ability to protect payment flows by hiding behind overly onerous processes. Such a revamp of the approach could be led by i3 Forum with GLF providing endorsement and then tracking commitment and compliance across its membership.
2. SETTING THE INDUSTRY PRIORITIES
1. Development of structured information sharing mechanisms.
2. Revamp the industry policy and process for withholding payments.
3. Facilitate easier engagement with law enforcement agencies.
4. Ensure GLF member organisations demonstrate consistent leadership.
40
ACTION 3
Facilitate easier engagement with law enforcement agencies
Given the increasing requirement that recognition of a dispute regarding fraudulent traffic requires a police report and the complexity of managing such a process, it was proposed by several carriers that there would be benefits from facilitating easier engagement with law enforcement agencies. It was not proposed that the international carrier industry should seek formal collaboration given the resource this would consume. Rather, the proposal was to ensure that carriers were provided with the information and guidance required to make it easier for them to effectively engage the right law enforcement agencies when required. It was believed that by making it easier for carriers to leverage law enforcement agencies to fight fraud, not only would carriers’ actions be more impactful but also it would send a clear warning signal to actors enabling fraudulent traffic that there was a higher likelihood that they would be caught and held to account.
ACTION 4
GLF members showing consistent leadership
It was a consistently shared view that leadership on fraud needs to start from consistent action driven top-down by the executive management of leading international carriers, especially the GLF members. Demonstrating leadership was seen to require more than affirming commitment, such as the signing the Code of Conduct, or even attesting that they are compliant with it. Rather, leadership from GLF members is seen as three points:
1. Ensure that they are personally briefed on the status of fraudulent traffic and their company’s activities to block fraudulent traffic.
2. Ensure that their organisations are taking all actions required to block fraudulent traffic and fraudulent actors’ route to cash.
3. Hold each other to account to consistently follow industry best practice, as set out in the Code of Conduct principles.
If the international carrier industry follows the intentions shared in this year’s discussions for the Fraud Report that: “we are determined to work together” and “carriers have to be honest with themselves and each other” to fight fraud it is critical now that there is movement beyond words into tangible action. Unless there is a conscious collective effort to fight fraud the presence of only a small number of non-acting carriers will be sufficient for the incentive for fraudsters to remain, and the issues highlighted in this year’s report will repeat themselves in 2021.
PART 3 : TAKING ACTION, TOGETHER

41
PART 4DEMONSTRATING COMMITMENT TO ACTION – ADHERING TO THE GLF CODE OF CONDUCT
TACKLING FRAUD: A COLLECTIVE INDUSTRY EFFORT

42
2
1
Ensuring the presence of real-time processes to block fraudulent traffic once identified, and ensure that all contracts have i3 Forum anti-fraud clauses are two areas requiring greatest development. Whilst most carriers have processes in place to stop payment flows some conditions, such as requirement to provide local police reports, make them difficult for customers to implement.
Code of Conduct attestation highlights significant individual carrier compliance but more work to be done to ensure that all carriers are consistently compliant across all six principles - it is the consistency of compliance which is the critical factor to stop fraud.
PART 4 : COMMITMENT TO ACTION – ADHERING TO THE GLF CODE OF CONDUCT

43
PART 4 : COMMITMENT TO ACTION – ADHERING TO THE GLF CODE OF CONDUCT
1. LOTS OF ACTIVITY, BUT MORE WORK TO BE DONE
In collaboration with i3 Forum, GLF invited all carriers that have signed the Code of Conduct to self-attest
their compliance against each of the six principles through answering a survey.
EXHIBIT 23: GLF CODE OF CONDUCT SIX PRINCIPLES
Principles1 Targets for prevention of fraudulent traffic to be included within management reporting
2 Carriers to adhere to i3 Forum recommended processes to detect and avoid fraud
3 Identified fraudulent number ranges and destinations to be blocked
4 All reasonable action to be taken to avoid payment flows to the instigators of fraudulent traffic
5 Commitment to share information regarding fraudulent traffic flows with carrier peers
6 Adoption of standard contracting terms addressing fraudulent traffic management
Source: GLF 2018
Once the survey was returned there were follow-up interviews to discuss the responses as well as to review provided ‘evidence’ of compliance. The evidence could be, for example, sharing an internal report for the executive team on fraudulent traffic, or the internal process document for dealing with fraudulent traffic destinations or stopping payment flows. Given the requirement to protect data confidentiality, responses have been anonymised before being included in the report. All participating carriers will receive communication of their individual performance and be able to benchmark it versus the wider industry.
This process demonstrated that across many carriers, there is a relatively high-level of adherence to the principles of the Code of Conduct, however, there is not consistently high adherence across all principles. It provided evidence for the theme discussed earlier in the report regarding the ‘concern
for consistent compliance’. Unless there is consistent compliance in anti-fraud measures – particularly blocking fraudulent number ranges and stopping payment flows - fraudsters will be able to identify routes that provide them a “way through the net” and the incentive to leverage fraudulent telecoms traffic to create illegal proceeds, will continue.
Exhibit 25 below displays the overall results of the survey with the percentage scores being the percentage score of answers within the set of questions for each Principle that was determined as required for ‘full compliance’. Within the survey, there were a total of 20 points. Looking at the total score ranking, there are 17 carriers that scored over 15 points representing an average of 75% compliance, 14 that scored 16 points or over representing 80% compliance and three carriers having over 90% compliance. No carrier scored 100% compliance.

44
PART 4 : COMMITMENT TO ACTION – ADHERING TO THE GLF CODE OF CONDUCT
EXHIBIT 24: CODE OF CONDUCT ATTESTATION SURVEY RESULTS
Total Contribution by Principle (%) > > Heatmap from left to right
# Company name
Total score x Principle 1 Principle 2 Principle 3 Principle 4 Principle 5 Principle 6
1 Carrier 1 18.3 100% 97% 100% 100% 83% 100%2 Carrier 2 18.2 100% 97% 100% 100% 96% 75%3 Carrier 3 18.1 100% 97% 100% 100% 83% 88%4 Carrier 4 17.8 100% 92% 100% 100% 83% 88%5 Carrier 5 17.8 100% 89% 83% 100% 83% 88%6 Carrier 6 17.8 100% 100% 92% 100% 83% 75%7 Carrier 7 17.4 81% 100% 83% 100% 83% 88%8 Carrier 8 17.4 88% 90% 100% 100% 88% 88%9 Carrier 9 17.0 100% 88% 92% 100% 83% 88%10 Carrier 10 16.9 100% 97% 100% 50% 85% 75%11 Carrier 11 16.7 100% 88% 67% 100% 83% 88%12 Carrier 12 16.4 100% 100% 67% 100% 79% 50%13 Carrier 13 16.0 100% 88% 92% 100% 94% 0%14 Carrier 14 16.0 100% 93% 100% 50% 85% 38%15 Carrier 15 15.8 81% 92% 50% 100% 90% 88%16 Carrier 16 15.6 100% 100% 67% 50% 88% 50%17 Carrier 17 15.2 94% 88% 83% 100% 83% 0%18 Carrier 18 14.8 100% 92% 100% 0% 50% 88%19 Carrier 19 14.5 94% 95% 58% 50% 83% 38%20 Carrier 20 13.1 25% 77% 100% 100% 50% 88%21 Carrier 21 11.1 25% 77% 67% 100% 50% 38%22 Carrier 22 10.8 63% 60% 92% 0% 83% 0%23 Carrier 23 9.8 50% 65% 67% 0% 50% 50%
Reporting Processes Destinations Payment flows Info sharing Contracting
Notes: n = 23 Source: Code of conduct survey 2020, Delta Partners Analysis
If compliance were to be defined in being ‘compliant’ across each principle, then the number of carriers that could be noted as ‘compliant’ with the Code of Conduct would depend on the threshold level for compliance, i.e. the percentage score above which it is deemed to be compliant.
Based on the results of the survey, the table in Exhibit 25 shows what would be observed from the 23 carriers in terms of the number that would be compliant across the number of principles at a varying threshold level.
EXHIBIT 25: TABLE OF CARRIERS’ COMPLIANCE AT DIFFERENT THRESHOLDS
Number of compliant PrinciplesThreshold 6 5 4 3 2 1
100% 0% 0% 4% 26% 74% 87%90% 0% 9% 26% 52% 87% 96%80% 30% 57% 70% 87% 91% 96%70% 39% 61% 78% 87% 96% 96%60% 43% 65% 87% 96% 100% 100%50% 61% 91% 100% 100% 100% 100%
Notes: n = 23 Source: Code of conduct survey 2020, Delta Partners Analysis

45
PART 4 : COMMITMENT TO ACTION – ADHERING TO THE GLF CODE OF CONDUCT
2. FOCUS ON THE PRINCIPLESWhen looking at the individual principles, it appears that Principle 3 – Destinations, and Principle 6 – Contracting have the greatest potential for improvement. However, to truly understand how carriers are acting it is necessary to take a principle-by-principle assessment of the Code of Conduct attestation survey results.
Principle 1: ReportingTargets for prevention of fraudulent traffic to be included within management reporting
Over 61% of carriers were 100% compliant with Principle 1, which meant they were providing
reports on at least a monthly basis to management and senior executives via specific communications mechanisms. Where carriers received low scores on this Principle it was due to the lack of provision of frequent reporting – in some cases carriers responded to the survey that they did not provide reports regarding fraud alerts, blocked traffic, or disputes.
Less than a third of carriers reported sharing reports on a weekly basis, with each type of report being shared by only 80% of carriers. To effectively fight fraud, organisations need up-to-date data with which to make decisions. As such, the more frequent the reporting of traffic, the more effective the actions that can be taken.
EXHIBIT 26: DISTRIBUTION OF CARRIER COMPLIANCE TO PRINCIPLE 1: REPORTING
13%
0%
4%
0%
13%
9%
61%
Less than 50% 51% to 60% 61% to 70% 71% to 80% 81% to 90% 91% to 99% 100%
Source: Code of conduct survey 2020, Delta Partners Analysis
Speaking with GLF members it is evident that there is an aspiration for the industry to reach full compliance, which if defined as being compliant on all six principles at a high threshold of compliance demonstrates two messages:
1. The regulatory specificities within certain jurisdictions can make full compliance as per the definitions of the Code of Conduct
principles impossible. As such, assuming a 100% threshold for ‘compliance’ does not reflect the complex reality of the industry.
2. Despite a lot of high scores within categories and carriers achieving high levels of compliance in four or five, there is work to be done to ensure carriers comply consistently across all six categories.

46
PART 4 : COMMITMENT TO ACTION – ADHERING TO THE GLF CODE OF CONDUCT
EXHIBIT 27: FREQUENCY OF FRAUDULENT TRAFFIC REPORT DISTRIBUTION
30% 30%
17%
39% 39% 65%
4% 4%
0%
0%
10%
20%
30%
40%
50%
60%
70%
80%
90%
100%
Number of fraud triggered alerts Blocked fraud traffic reports Fraud related disputes / volumes / amounts
Weekly Monthly Quarterly
Source: Code of conduct survey 2020, Delta Partners Analysis
GLF members believe it is critical that reports on fraudulent traffic reach senior management teams as it is this information that can empower executives to take investment and resource decisions on fraud management.
Principle 2: ProcessesCarriers adhere to i3 Forum recommended processes to detect and avoid fraud
Overall, carriers reported high compliance with regards to having processes to detect and avoid fraud with 56% scoring over 90%. All carriers reported having a near real-time fraud prevention system that detects fraudulent traffic and create reports. The majority of these systems were noted as being internal for carriers, with a minority of carriers having an external system only and some carriers stating they have both internal and external systems. 90% of companies also attested to having an end-to-end process, from detection to reporting, regarding fraudulent activity. 54% of carriers stated these processes were in real-time.
Recommendation: all international carrier senior executives to receive a monthly briefing focused on the status of fraudulent traffic management. Performance of fraudulent traffic management to be included in the management reporting monthly dashboards.

47
PART 4 : COMMITMENT TO ACTION – ADHERING TO THE GLF CODE OF CONDUCT
EXHIBIT 28: DISTRIBUTION OF CARRIER COMPLIANCE TO PRINCIPLE 2: PROCESSES
0%4% 4%
9%
26%
39%
17%
Less than 50% 51% to 60% 61% to 70% 71% to 80% 81% to 90% 91% to 99% 100%
Source: Code of conduct survey 2020, Delta Partners Analysis
When looking at the individual processes that occur once fraudulent traffic has been detected, 61% of carriers reported that they block the suspected number range in real-time, whilst 48% notify the customer and 38% notify the supplier. The lowest category of process was to report the traffic to police. However, as has been explained in this report, given the increasing requirement for carriers to provide a police report to their supplier in order to block the fraudulent traffic and stop payments, it would be expected that the percentage of carriers that have a process to report to law enforcement will increase. However, if carriers can work with each other and facilitate the blocking of fraudulent traffic and stopping payment flows between themselves the need to involve law enforcement will reduce. The industry should strive towards removing the need for a police report to settle fraud disputes
The on-going challenge with fraudulent traffic management processes is to act in as close to real-time once fraudulent traffic has been identified.
Whilst it is encouraging to see the majority of carriers notifying suppliers, customers and internal account managers, as well as blocking the suspected number range within 24 hours of detection, the 20-30% of carriers that act between 12 and 24 hours after detection still creates a window in which fraudsters can exploit their activities for a further period once it is known to be fraud. As articulated by one carrier: ‘real-time monitoring is not available for most operators, and this is the key to spot fraud – without it, it can make [carriers] quite weak to identify and spot fraud. Once this is in place, they can work to develop their reporting”. However, it was also noted by some carriers that they have customers, more likely enterprise, or OTT rather than other carriers, that specify in their contracts that traffic cannot be blocked until authorised. Such customer requests can make real-time blocking challenging to implement and there can be value working with customers so they understand the implications this has with regards to fighting against fraudulent traffic.

48
PART 4 : COMMITMENT TO ACTION – ADHERING TO THE GLF CODE OF CONDUCT
EXHIBIT 29: PRESENCE AND SPEED OF FRAUD PROCESSES
35%48% 48%
61%
17%
13% 17%
9%26%
30%
26%
17%17%
0%
10%
20%
30%
40%
50%
60%
70%
80%
90%
100%
Notify supplier Notify customer Report to police/lawenforcement
Notify internal accountmanager(s)
Block the suspected numberrange
Immediately upon detection Immediately upon detection Within 12 hours Within 24 hours
Source: Code of conduct survey 2020, Delta Partners Analysis
Recommendation: all international carriers should seek to have processes that in as close to real-time as possible once the fraud has been detected notify the supplier, customer, internal account managers and block the suspected number range. GLF should work with the i3 Forum to review the recommended processes to ensure they support the efficient and effective blocking of fraudulent traffic and related payment flows.
Principle 3: DestinationsIdentified fraudulent number ranges and destinations to be blocked
Within the attestation survey, carriers were asked how frequently they block A-number and B-number ranges and destinations once they had been identified as fraudulent, and if there was a standard, written process to identify fraudulent number ranges. A carrier was deemed fully compliant if they always blocked both A-number and B-number ranges and had such a policy in place. 39% of carriers were scored as fully compliant, whilst 30% scored less than 70%.
EXHIBIT 30: DISTRIBUTION OF CARRIER COMPLIANCE TO PRINCIPLE 3: DESTINATIONS
4% 4%
22%
0%
13%17%
39%
Less than 50% 51% to 60% 61% to 70% 71% to 80% 81% to 90% 91% to 99% 100%
Source: Code of conduct survey 2020, Delta Partners Analysis

49
PART 4 : COMMITMENT TO ACTION – ADHERING TO THE GLF CODE OF CONDUCT
Within the survey, 74% of carriers attested to always blocking B-number ranges and destinations, whilst 65% attested to always blocking A-number ranges and destinations. 22% and 35% respectively attested to sometimes blocking.
Where carriers were not blocking all A-number and B-number ranges and destinations after they had been identified as fraudulent there were several reasons provided. For example, it was explained by carriers that:
• Technical limitations – “Certain of our operating companies are able to block an A-number. We are currently building A-number blocking capabilities at Group wholesale level”
• Focus on changing supplier, not blocking the number range – “[Blocking the number is] not always effective, changing the supplier and ensuring that the supplier we use doesn’t terminate to invalid ranges is more effective
• Retail customer pressure – “We need the authorisation of the originating company that this is fraud. Many customers (specifically retail), do not want to have “false positives”, and
accordingly we define the operational method for blocking as per their request. If it is automatic blocking once the alarm appears, if this is to confirm (alarm goes to the customer and the customer has to confirm if they want it blocked)”
• Requirement to confirm fraud – “If the A Number is already known / confirmed as fraudulent then we block the specific number / range. For other A-numbers where there is a suspected fraudulent profile, we take action against the A number only after consultation/review with the source and a clear understanding of the impact. e.g. a series of calls from an un-recognised A number to a country that presents a high-fraud risk - might be a government generated call as part of a diplomatic initiative or some other unusual, but completely valid call”
The challenge with carriers not blocking all fraudulent number ranges and destinations once they have been identified, including when there can be valid reasons as explained above, is that it creates “holes in the net” for fraudulent actors to seek to get traffic through. As long as fraudulent calls can be terminated, and financial gain generated, there is an incentive for fraudsters to continue their activity.
EXHIBIT 31: CONSISTENCY OF BLOCKING FRAUDULENT NUMBER RANGES
74%65%
22% 35%
4%
Block fraudulent B-number ranges and destinations Block fraudulent A-number ranges and destinations
Yes-Always Yes-Sometimes No
Source: Code of conduct survey 2020, Delta Partners Analysis

50
PART 4 : COMMITMENT TO ACTION – ADHERING TO THE GLF CODE OF CONDUCT
With regards to the “standard written process” to identify fraudulent number ranges – there were 27% of responses which attested to not having one in place. If all A-numbers and B-numbers are being blocked once identified as fraudulent this is less of an issue, however in the cases where carriers are not able to block all number ranges on identified fraudulent traffic, having a process in place is critical to ensure consistent course of action.
Recommendation: ensure that a standard written process is in place to block A-number and B-number ranges once they have been identified as fraudulent and seek to block all once identified as fraudulent, subject to customer agreement.
Principle 4: Payment flowsAll reasonable action to be taken to avoid payment flows to the instigators of fraudulent traffic
Carriers were asked to attest whether they have a process to handle payment withholding in a case of fraud and whether that process was aligned to i3 Forum guidelines. 70% of carriers attested that they had both of these, whilst 30% of carriers either had a process that did not align to i3 Forum guidelines or not have a process at all.
As discussed earlier in this report, the challenge for carriers in their collective fight against fraud is not having a process per se, but ensuring that the process can be effectively followed. Several carriers reported incidents where the process put to them by their supplier, such as generating a police report from the local law enforcement agency in the country that originated the fraud, is overly onerous. As explained by one carrier: “carriers behave differently when they act as a customer or supplier”. Carriers explained, and attested in Principle 2, that they are willing to get law enforcement involved given the criminal nature of fraudulent traffic, but that can be a time-consuming and resource-intensive process where the rules can vary by market – for example, when fraudulent traffic terminates into the UK there are legal protections in place to stop payments.
Carriers repeated multiple times in interviews for this report: “to stop fraud, you have to stop the money” – as such, it is critical that there are processes put in place that allow carriers, once fraudulent traffic has been identified, to as quickly as possible stop the payment flows. If not, as with the window created by not blocking all fraudulent traffic identified routes, there is the incentive for fraudulent actors to sustain their activity. As long as there is a possible “route to the money” fraudulent traffic will be generated.
EXHIBIT 32: DISTRIBUTION OF CARRIER COMPLIANCE TO PRINCIPLE 4: PAYMENT FLOWS
30%
0% 0% 0% 0% 0%
70%
Less than 50% 51% to 60% 61% to 70% 71% to 80% 81% to 90% 91% to 99% 100%
Source: Code of conduct survey 2020, Delta Partners Analysis
Recommendation: carriers should review their processes and policies for stopping payment flows once fraudulent traffic is identified to ensure that they facilitate the stopping of payments without being too onerous on the customer or supplier.

51
PART 4 : COMMITMENT TO ACTION – ADHERING TO THE GLF CODE OF CONDUCT
Principle 5: Information sharingCommitment to share information regarding fraudulent traffic flows with carrier peers
With regards to reporting, carriers were asked to attest the type of information they share with their peers and on what frequency. They were also asked to attest whether they were a member of industry-level fraud working groups or associations. To be fully compliant, carriers are expected to share at least one type of report on a monthly basis with their peers as well as be part of an industry association forum. The rationale for this is that while the industry lacks a single structured inter-carrier communication mechanism for fraud teams to communicate with each other, it is important that carriers are sharing information both bi-laterally and as part of larger forums subject to legal restriction. There was strong demand from carriers taking part in this report to
encourage all carriers to share information, stating that “if everyone shared their fraudulent traffic information, we would know at an industry level”.
Many carriers also believe that by instigating a culture of information sharing “those who do not want to openly share by implication are black sheep”. The concept of identifying and communicating the “black sheep” was a common point of contention in this year’s discussions with carriers recognising the legal challenges of doing so. As such, creating the mechanisms for carriers to share information and promote themselves as “white sheep” would by extension identify carriers that did not want, our could not, due to their actions, participate.
Based on the attestation results, no carrier is fully compliant, however 83% of carriers scored over 70% demonstrating that carriers are sharing, but there is more work to be done to do this consistently at a bi-lateral and industry level.
EXHIBIT 33: DISTRIBUTION OF CARRIER COMPLIANCE TO PRINCIPLE 5: INFORMATION SHARING
17%
0% 0%
13%
61%
9%
0%
Less than 50% 51% to 60% 61% to 70% 71% to 80% 81% to 90% 91% to 99% 100%
Source: Code of conduct survey 2020, Delta Partners Analysis
The most commonly shared information was on identified fraud schemes with 65% of respondents attesting to sharing these on an ad hoc basis, compared with 52% for suspected fraudulent B-number ranges and 35% for new identified fraud types. However, when the same sharing is assessed on an ‘at least monthly’ basis, this drops to 4%, 9% and 13% respectively. In discussing with carriers, two primary reasons were proposed for this. Firstly, the
structured mechanisms for regular sharing do not exist today – for example, the format and taxonomy in which the data is shared or the channels by which it can be shared. Secondly, with a lack of consistent sharing across the industry, there is not a clear incentive for carriers to share on a regular basis for the benefit of the industry. As such, information is most commonly shared within their trusted peer groups and when there is a benefit to them. It was

52
PART 4 : COMMITMENT TO ACTION – ADHERING TO THE GLF CODE OF CONDUCT
suggested by one carrier that: “there should be a mandate that once a month you share information.
If everyone is mandated to share once a month, that will make hackers lives more miserable”.
EXHIBIT 34: PREVELANCE OF INFORMATION SHARING BETWEEN PEERS
52%35%
65%
9%
13%
4%4%
17%
13%
0%17%
17%
0%
10%
20%
30%
40%
50%
60%
70%
80%
90%
100%
Suspected fraudulent B-number ranges New identified fraud types Identified fraud schemes
Ad hoc At least monthly At least quarterly At least yearly
Source: Code of conduct survey 2020, Delta Partners Analysis
83% of carriers attested to be being a member of a fraud working group or industry association, excluding the GLF Anti-Fraud Working Group – the most common were i3 Forum and the GSMA Fraud and Security Working Group. Whilst the presence of these groups is valued by carriers with complementarity between the technical focus of GSMA with the more commercial focus of i3 Forum, many spoke of the need for them to take action “beyond paper” stating, for example, that they “look to the GSMA to play a more active role” given their
relationships with retail providers. Additionally, some carriers shared a view that these bodies, whilst they are strong in making “general recommendations”, lacked the ability to enforce.
Concern was raised by some carriers that organisations are choosing to participate in these groups just for “marketing benefit” to signal that they are taking seriously the fight against fraud whilst in reality their actions suggest they are not acting to stop fraudulent traffic or payments to its originators.
EXHIBIT 35: PARTICIPATION IN INDUSTRY FORUMS
65%
13%
26%
0%
52%
9%
0%
10%
20%
30%
40%
50%
60%
70%
80%
90%
100%
i3 Forum CFCA Risk & Assurance Group ITSPA GSMA (Fraud andSecurity Working Group)
Other…
Source: Code of conduct survey 2020, Delta Partners Analysis

53
PART 4 : COMMITMENT TO ACTION – ADHERING TO THE GLF CODE OF CONDUCT
Within forums, for there to be significant progress there has to be sharing of information and demonstration of action at a coordinated industry level. Without this, the industry’s challenge of stating fraudulent traffic reduction as a priority but making limited progress at an overall industry level will sustain with un-synchronised activities and a lack of consistent compliance.
Recommendation: GLF should explore how it can orchestrate an industry communication and information sharing network for carrier fraud teams for regular sharing of fraudulent traffic data.
Principle 6: ContractsAdoption of standard contracting terms addressing fraudulent traffic management
Carriers were asked to attest whether they required the inclusion of anti-fraud clauses in contracts with customers, and if they have a plan to roll-out i3 Forum defined contract clauses in standard contracts. The responses to this showed one of the greatest variances of ‘compliance’ across all the six Principles with only 4% carriers being fully compliant, i.e. including in all contracts, whilst many carriers explained that they only include fraud clauses in “some” contracts and that a plan to include i3 Forum defined clauses in “new contracts only”.
EXHIBIT 36: DISTRIBUTION OF CARRIER COMPLIANCE TO PRINCIPLE 6: CONTRACTS
39%
0% 0%
13%
43%
0%
4%
Less than 50% 51% to 60% 61% to 70% 71% to 80% 81% to 90% 91% to 99% 100%
Source: Code of conduct survey 2020, Delta Partners Analysis
Where carriers attested that they were not including anti-fraud clauses in all contracts, several reasons were provided, including:
• Contract responsibility – “if it is our contract, we have them incorporated. If we are signing the other party’s contracts, we request that they are incorporated by unfortunately it cannot be a deal breaker if they are not”. Multiple carriers shared the challenge of having specific customers agree to include anti-fraud clauses within their contracts. There was frustration
shared regarding cases where it was perceived customers were “hiding behind their legal teams” or “proposing diluted clauses which made them unenforceable” to avoid signing proposed anti-fraud terms.
• Capture through penalties – “we capture the fraudulent traffic management and related penalties/levies/treatment in our agreements. These can certainly be assessed and use best practice from the industry to make them water-tight”
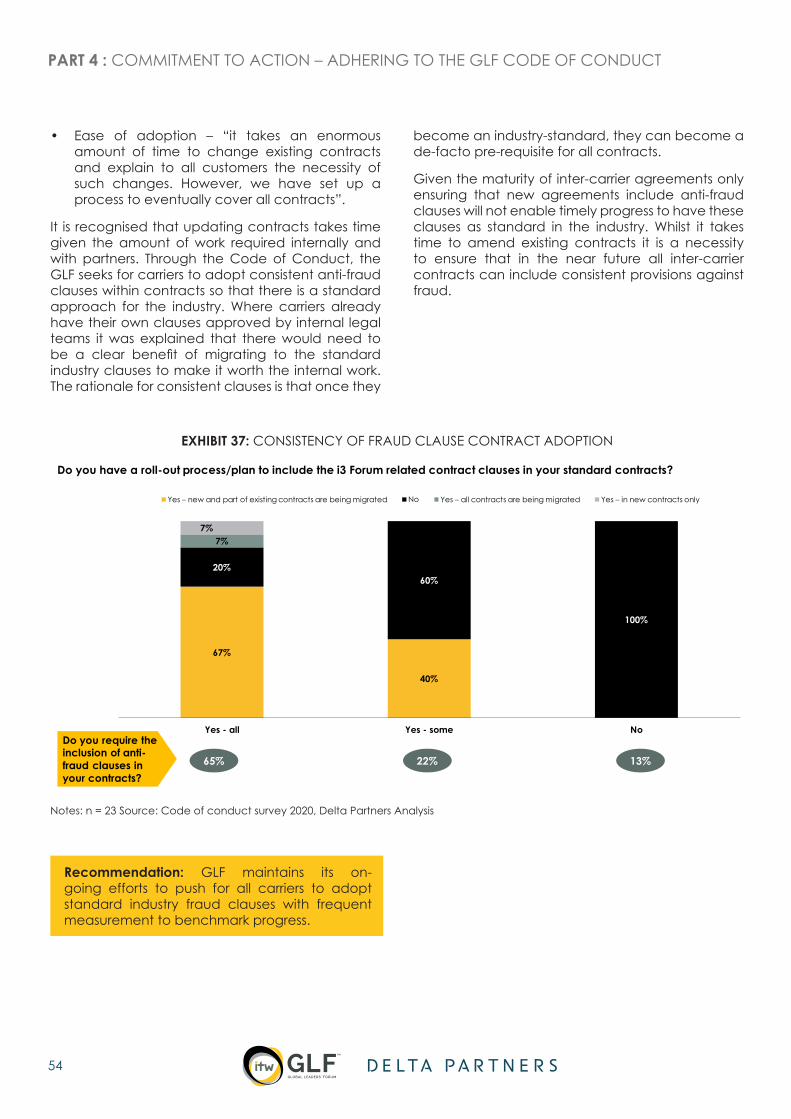
54
PART 4 : COMMITMENT TO ACTION – ADHERING TO THE GLF CODE OF CONDUCT
• Ease of adoption – “it takes an enormous amount of time to change existing contracts and explain to all customers the necessity of such changes. However, we have set up a process to eventually cover all contracts”.
It is recognised that updating contracts takes time given the amount of work required internally and with partners. Through the Code of Conduct, the GLF seeks for carriers to adopt consistent anti-fraud clauses within contracts so that there is a standard approach for the industry. Where carriers already have their own clauses approved by internal legal teams it was explained that there would need to be a clear benefit of migrating to the standard industry clauses to make it worth the internal work. The rationale for consistent clauses is that once they
become an industry-standard, they can become a de-facto pre-requisite for all contracts.
Given the maturity of inter-carrier agreements only ensuring that new agreements include anti-fraud clauses will not enable timely progress to have these clauses as standard in the industry. Whilst it takes time to amend existing contracts it is a necessity to ensure that in the near future all inter-carrier contracts can include consistent provisions against fraud.
EXHIBIT 37: CONSISTENCY OF FRAUD CLAUSE CONTRACT ADOPTION
67%
40%
20%60%
100%
7%7%
Yes - all Yes - some No
Yes – new and part of existing contracts are being migrated No Yes – all contracts are being migrated Yes – in new contracts only
Do you require the inclusion of anti-fraud clauses in your contracts?
65% 22% 13%
Do you have a roll-out process/plan to include the i3 Forum related contract clauses in your standard contracts?
Notes: n = 23 Source: Code of conduct survey 2020, Delta Partners Analysis
Recommendation: GLF maintains its on-going efforts to push for all carriers to adopt standard industry fraud clauses with frequent measurement to benchmark progress.