2020 General Practice Workforce Survey - Home | RNZCGP
27
2020 General Practice Workforce Survey Summary report – Final 20 December 2020
Transcript of 2020 General Practice Workforce Survey - Home | RNZCGP

2020 General Practice
Workforce Survey Summary report – Final
20 December 2020
ii
ACKNOWLEDGEMENTS
We would like, first and foremost, to thank the members of the Royal New Zealand College of
General Practitioners and the Division of Rural Hospital Medicine who gave freely of their time to
participate in this survey. We would also like to thank the College staff, in particular Donna Jones
and Susan Knox, who contributed significantly to the development and successful completion of
the survey. We also acknowledge Dr John Marwick for his valuable clinical and professional
insights, and the College’s Advisory Group members (Dr Jennifer Keys, Dr Jo Scott-Jones, Dr Rachel
Mackie, Dr Bryan Betty and Emmanuel Jo) for their guidance on emerging topics of interest.
REVIEW
We thank Emmanuel Jo and Keri McArthur (Health workforce Directorate, Ministry of Health) for
providing external peer review of this report.
Document status: Final Allen + Clarke has been independently certified as
compliant with ISO9001:2015 Quality Management Systems
Version and date: 07/02/2020
Author(s): Danny Tu
Filing Location: W:\RNZCGP\2020 Workforce Survey\04 Deliverables\Reports\Report drafting\Report 4
Peer / technical review:
John Marwick
Verification that QA changes made:
Wa Anwar
Proof read: Greg Martin
Formatting: Danny Tu
Final QA check and approved for release:
Kirsten Lovelock
2020 General Practice Workforce Survey – Time Series report iii
INSIGHTS
• The year 2020 has been a particularly difficult year – reflected in high burn-out scores and
retirement intentions, and the importance GPs gave to having a less stressful working
environment.
• The GP workforce continues to face an issue of ageing, but the pace of ageing is slower
than that in earlier years (2014 to 2016). The gender distribution of the workforce has
been changing in the past six years, with the older, male-dominated cohort moving toward
retirement, while the younger, female cohort is now constituting the majority of the
workforce.
• Equity continues to be an issue: we found a disproportionately lower number of Māori and
Pacific GPs, female GPs were paid less on average, with the gender pay gap being much
larger for employees/contractors than for owners/partners, and many GPs noted that
patient access to telehealth services was a problem.
• A younger female cohort of GPs is coming through who may need to be supported in
different ways to improve wellbeing.
• The survey year 2020 is the first time that the number of ‘part-time’ GPs exceeded ‘full-
time’ GPs. As time goes by, male GPs tend to work longer hours than female GPs, but since
2015, the gender difference in average working hours has narrowed.
• There is an older cohort who were working longer hours and had more after-hours
commitments.
• The average GP income reported in 2020 has remained relatively stable since 2016.
• More GPs chose to be long-term employees or contractors and fewer GPs became practice
owners or partners over the past six years.
• Telehealth technology use and confidence in using technology among GPs is high, with
respondents also rating the usefulness of telehealth very positively.
• There is an impending GP workforce shortage: almost one third intend to retire within the
next five years and almost half intend to retire within the next 10 years.
• Succession planning for rural hospital medical staff is needed: more than one-quarter
state they intend to retire in the next five years and a further 18 percent intend to retire
in 6-10 years’ time.
iv
CONTENTS
ACKNOWLEDGEMENTS II
REVIEW II
INSIGHTS III
1. INTRODUCTION 1
1.1. Context 1 1.2. Objective 2 1.3. Limitations 2
2. METHODOLOGY 3
3. GENERAL PRACTICE WORKFORCE - DEMOGRAPHICS 6
3.1. Age 6 3.2. Gender 6 3.3. Ethnicity 7 3.4. International medical graduates (IMGs) 7 3.5. Rural or urban practice location 8
4. TRAINING AND TEACHING IN GENERAL PRACTICE 8
4.1. GPs currently in training 8 4.2. GPs providing training 9
5. HOURS WORKED AND AFTER-HOURS COMMITMENTS IN GENERAL PRACTICE 9
5.1. Hours in general practice per week 9 5.2. After-hours practice commitments 10
6. GP INCOMES 10
6.1. Personal annual income 10 6.2. Gender pay gap 11 6.3. Multiple regression analysis of GPs’ income 11
7. FACTORS THAT MIGHT ENABLE PART-TIME GPS TO INCREASE WORKING HOURS 11
8. EMPLOYMENT TYPE AND PRACTICE OWNERSHIP 12
8.1. GP employment status 13 8.2. Practice ownership models 13
9. RETIREMENT INTENTIONS IN GENERAL PRACTICE 13
9.1. Retirement intentions in general practice 14
10. BURN-OUT AND GENERAL PRACTICE AS A CAREER 14
10.1. Burn-out 14 10.2. Recommending general practice as a career 15
11. WAYS OF WORKING IN GENERAL PRACTICE 15
12. RURAL HOSPITAL MEDICINE WORKFORCE 16
12.1. Rural Hospital Medicine workforce – Demographics 16 12.2. Working in Rural Hospital Medicine 17 12.3. Retirement intentions in rural hospital medicine 17 12.4. Burn-out and options about a career in rural hospital medicine 17

2020 General Practice Workforce Survey – Time Series report v
13. RECOMMENDATIONS 18
14. APPENDIX ONE 20

2020 General Practice Workforce Survey – Summary report 1
1. INTRODUCTION
This is the fourth in a series of reports from The Royal New Zealand College of General
Practitioners’ (the College’s) 2020 Workforce Survey. This summary report presents the main
results from the 2020 workforce survey. Where relevant, results are compared to those from
earlier surveys. Its purpose is to provide a summary of the survey findings, rather than a detailed
discussion of the results. It is recommended to read the key findings from this report together
with the series of specialised reports – 2020 GP Workforce Survey Overview, Time Series and
Equity report.
This is the sixth in a series of workforce surveys that the College has undertaken since 2014. In
2020, the survey results have been collated and analysed by Allen + Clarke with support from
College staff. Over 5,000 Fellows, Members and Associates of the College and the Division of Rural
Hospital Medicine were surveyed (almost all doctors working in New Zealand general practice
and rural hospital medicine), with a response rate of 60 percent.
1.1. Context
New Zealand requires appropriate general practice (GP) Workforce levels to ensure adequate
service provision, and to enable safe, high quality primary health care.
The Royal New Zealand College of General Practitioners (the College) works to improve the health
of all New Zealanders through high quality general practice care. The College is a professional
membership organisation that works to strengthen the professionalism and practice of its
members. The College provides education, assessment, quality and support services for general
practitioners and rural hospital medicine; and represents its members by providing advice and
expertise to government and within the wider health sector.
The College works to achieve its strategic aims of:
• Growing the GP workforce
• Setting quality standards for practices
• Representing its members
• Contributing to equitable health care for all New Zealanders
• Becoming a contemporary and sustainable organisation.
The College is the largest professional medical college in New Zealand and provides ongoing
professional development to approximately 5,700 GPs and Rural Hospital Medicine practitioners.

2
The General Practice Workforce Survey is a cross-sectional survey conducted by the College
among its members, first carried out in 2014. Prior to 2018, the survey was undertaken annually.
In 2020, the College decided to change its frequency to a biennial survey. The survey aims to
provide the College (and the wider health sector) with a strong evidence base that will help inform
future decisions about general practice in New Zealand, track trends over time, and respond in a
timely manner to emerging issues.
Allen + Clarke was commissioned by the College to co-design and conduct the 2020 General
Practice Workforce Survey. In addition to core questions that have been included in previous
workforce surveys, it was decided to add content to the 2020 Survey relating to ‘new ways of
working’. This included timely reporting on changes to service delivery models related to COVID-
19 lockdown restrictions. New Zealand went into COVID-19 Alert Level 4 lockdown in March
2020; this may have influenced some of the findings of this report.
1.2. Objective
The aim of this work is to add to the College’s evidence base to inform quality standards, and
programmes to improve general practice workplace and clinical systems in general practice for
the benefit of practices and patients.
1.3. Limitations
Due to the lack of access to the full historical workforce survey datasets. Allen + Clarke has adopted
a ‘Single Source of Truth’ approach and extracted the previous surveys’ results from the 2014 to
2018 GP Workforce reports.
2020 General Practice Workforce Survey – Summary report 3
2. METHODOLOGY
This section summarises the methodology used for the General Practice Workforce Survey in
2020. The survey has been designed to be highly consistent with the structure and methodology
of the previous 2018 survey. The key question themes of each survey from 2014 to 2020 are
presented in Appendix One. Related reports and questionnaires can be accessed through the
College’s website.
The 2020 Workforce Survey was conducted from 3 August to 6 September 2020. The main
questionnaire of the survey has been adapted from the core set of questions in the 2018 workforce
survey, allowing comparison to past responses and trend analysis, and additional modules of
questions have also been added in 2020. For example, this year’s theme is “Ways of Working”. The
College is interested in understanding how work has changed because of the COVID-19 lockdown,
including how GPs engage with their patients. The rural hospital medicine module is on its second
survey cycle after being introduced in the 2018 workforce survey.
The questionnaire was pre-tested to ensure that the questions were appropriate, effective and
easy to understand. After this process, some modifications were made to the questionnaire. Prior
to the main phase of the data collection, a pilot study was carried out among 20 GPs. The pilot
study confirmed that the questionnaire flowed well, and the estimated duration of survey was
approximately 15 minutes.
The workforce survey’s target population was all doctors currently working (three months prior
to the survey) in either general practice or rural hospital medicine in New Zealand. We used a
“census” approach (complete enumeration survey method) wherein every registered member of
the College is selected for the study. The College’s database, which includes most doctors working
in New Zealand general practice, was used as the survey’s sampling frame to identify and contact
survey participants.
In New Zealand, doctors are legally able to work in general practice without the additional training
required for vocational (specialist) registration, and these non-vocationally registered doctors
may not be included in the College’s database, i.e., they were not covered by the participant list
(out of coverage), as a result, they were not reached by the survey. In addition, survey recipients
also included doctors who are retired, currently out of the workforce, working in other careers,
working overseas or have not been involved in clinical work in the previous three months. We
have excluded those GPs (out of scope) in our analysis and reporting.
In total, 5193 Fellows, Members and Associates of the College and the Division of Rural Hospital
Medicine received the email invitation with a link to a personal copy of the online survey. A
4
reminder email was sent to those who had not responded approximately one week later. To
further boost the final participation rate, two more follow-up emails were sent in subsequent
weeks.
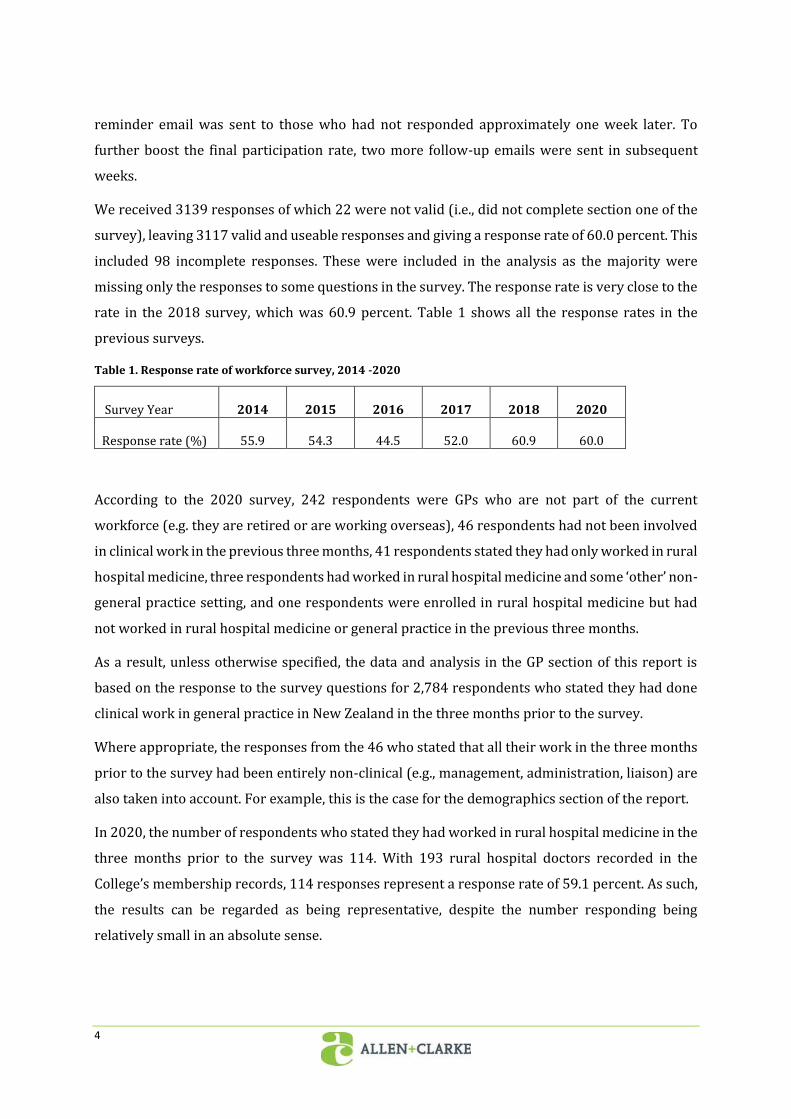
We received 3139 responses of which 22 were not valid (i.e., did not complete section one of the
survey), leaving 3117 valid and useable responses and giving a response rate of 60.0 percent. This
included 98 incomplete responses. These were included in the analysis as the majority were
missing only the responses to some questions in the survey. The response rate is very close to the
rate in the 2018 survey, which was 60.9 percent. Table 1 shows all the response rates in the
previous surveys.
Table 1. Response rate of workforce survey, 2014 -2020
Survey Year 2014 2015 2016 2017 2018 2020
Response rate (%) 55.9 54.3 44.5 52.0 60.9 60.0
According to the 2020 survey, 242 respondents were GPs who are not part of the current
workforce (e.g. they are retired or are working overseas), 46 respondents had not been involved
in clinical work in the previous three months, 41 respondents stated they had only worked in rural
hospital medicine, three respondents had worked in rural hospital medicine and some ‘other’ non-
general practice setting, and one respondents were enrolled in rural hospital medicine but had
not worked in rural hospital medicine or general practice in the previous three months.
As a result, unless otherwise specified, the data and analysis in the GP section of this report is
based on the response to the survey questions for 2,784 respondents who stated they had done
clinical work in general practice in New Zealand in the three months prior to the survey.
Where appropriate, the responses from the 46 who stated that all their work in the three months
prior to the survey had been entirely non-clinical (e.g., management, administration, liaison) are
also taken into account. For example, this is the case for the demographics section of the report.
In 2020, the number of respondents who stated they had worked in rural hospital medicine in the
three months prior to the survey was 114. With 193 rural hospital doctors recorded in the
College’s membership records, 114 responses represent a response rate of 59.1 percent. As such,
the results can be regarded as being representative, despite the number responding being
relatively small in an absolute sense.

2020 General Practice Workforce Survey – Summary report 5
Another 21 respondents identified themselves as registrars training towards Fellowship of the
Division of Rural Hospital Medicine (FDRHMNZ). While these respondents had not worked in
rural hospital medicine in the preceding three months, they were asked relevant questions and
were therefore included in the RHM section of this report. This increased the total possible
number of responses to relevant questions to 135.
As not all questions were compulsory, the survey was designed in such a way that questions that
were not relevant to respondents due to the way they had answered preceding questions did not
appear. Therefore, the total number of respondents on which tabulations and figures (in the
Overview, Time Series and Equity report) are based differs according to the number of GPs or
rural hospital doctors who were eligible to answer each question in the survey.
6
3. GENERAL PRACTICE WORKFORCE - DEMOGRAPHICS
This section of the report provides demographic profiles, such as age, gender and ethnic group, of
all participants from each workforce survey from 2014 to 2020. The analysis is based on survey
respondents who indicated they were working or had worked in general practice in the three
months prior to each survey. It includes respondents who stated that all their work in the three
months prior to the survey had been entirely non-clinical (e.g., management, administration,
liaison).
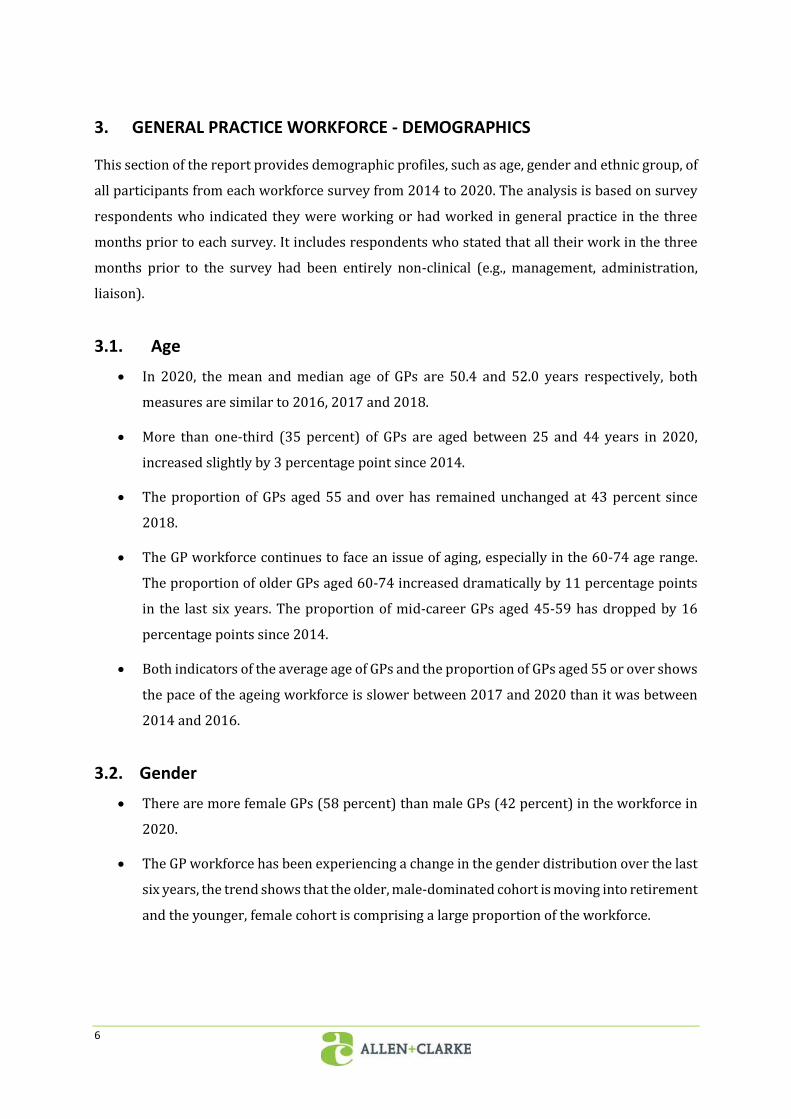
3.1. Age
• In 2020, the mean and median age of GPs are 50.4 and 52.0 years respectively, both
measures are similar to 2016, 2017 and 2018.
• More than one-third (35 percent) of GPs are aged between 25 and 44 years in 2020,
increased slightly by 3 percentage point since 2014.
• The proportion of GPs aged 55 and over has remained unchanged at 43 percent since
2018.
• The GP workforce continues to face an issue of aging, especially in the 60-74 age range.
The proportion of older GPs aged 60-74 increased dramatically by 11 percentage points
in the last six years. The proportion of mid-career GPs aged 45-59 has dropped by 16
percentage points since 2014.
• Both indicators of the average age of GPs and the proportion of GPs aged 55 or over shows
the pace of the ageing workforce is slower between 2017 and 2020 than it was between
2014 and 2016.
3.2. Gender
• There are more female GPs (58 percent) than male GPs (42 percent) in the workforce in
2020.
• The GP workforce has been experiencing a change in the gender distribution over the last
six years, the trend shows that the older, male-dominated cohort is moving into retirement
and the younger, female cohort is comprising a large proportion of the workforce.
2020 General Practice Workforce Survey – Summary report 7
• A large female cohort entered the GP workforce between 2014 and 2016 at the ages of 25-
29 and 30-34, which is contributing to the high proportion of female GPs in the current
30-34- and 35-39-year-old cohort.
• The proportion of female GPs entering the workforce has been steadily reducing since
2016, which will influence the gender balance of the GP workforce in coming years.
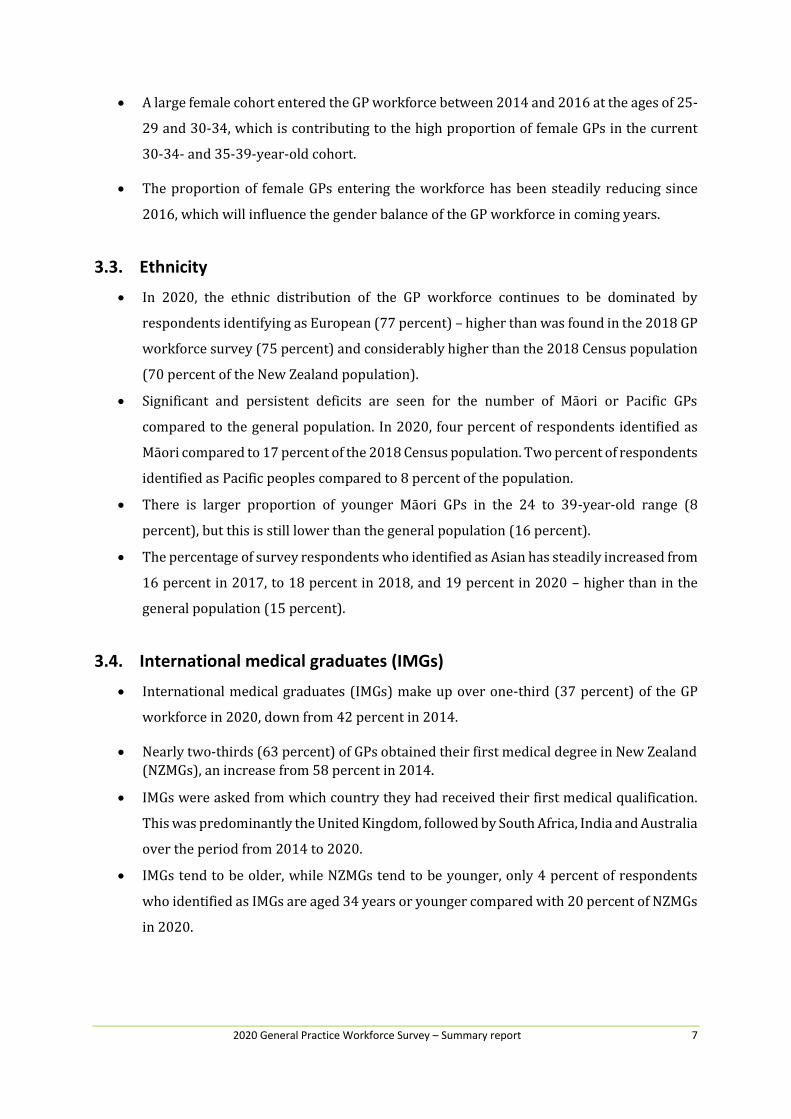
3.3. Ethnicity
• In 2020, the ethnic distribution of the GP workforce continues to be dominated by
respondents identifying as European (77 percent) – higher than was found in the 2018 GP
workforce survey (75 percent) and considerably higher than the 2018 Census population
(70 percent of the New Zealand population).
• Significant and persistent deficits are seen for the number of Māori or Pacific GPs
compared to the general population. In 2020, four percent of respondents identified as
Māori compared to 17 percent of the 2018 Census population. Two percent of respondents
identified as Pacific peoples compared to 8 percent of the population.
• There is larger proportion of younger Māori GPs in the 24 to 39-year-old range (8
percent), but this is still lower than the general population (16 percent).
• The percentage of survey respondents who identified as Asian has steadily increased from
16 percent in 2017, to 18 percent in 2018, and 19 percent in 2020 – higher than in the
general population (15 percent).
3.4. International medical graduates (IMGs)
• International medical graduates (IMGs) make up over one-third (37 percent) of the GP
workforce in 2020, down from 42 percent in 2014.
• Nearly two-thirds (63 percent) of GPs obtained their first medical degree in New Zealand
(NZMGs), an increase from 58 percent in 2014.
• IMGs were asked from which country they had received their first medical qualification.
This was predominantly the United Kingdom, followed by South Africa, India and Australia
over the period from 2014 to 2020.
• IMGs tend to be older, while NZMGs tend to be younger, only 4 percent of respondents
who identified as IMGs are aged 34 years or younger compared with 20 percent of NZMGs
in 2020.
8
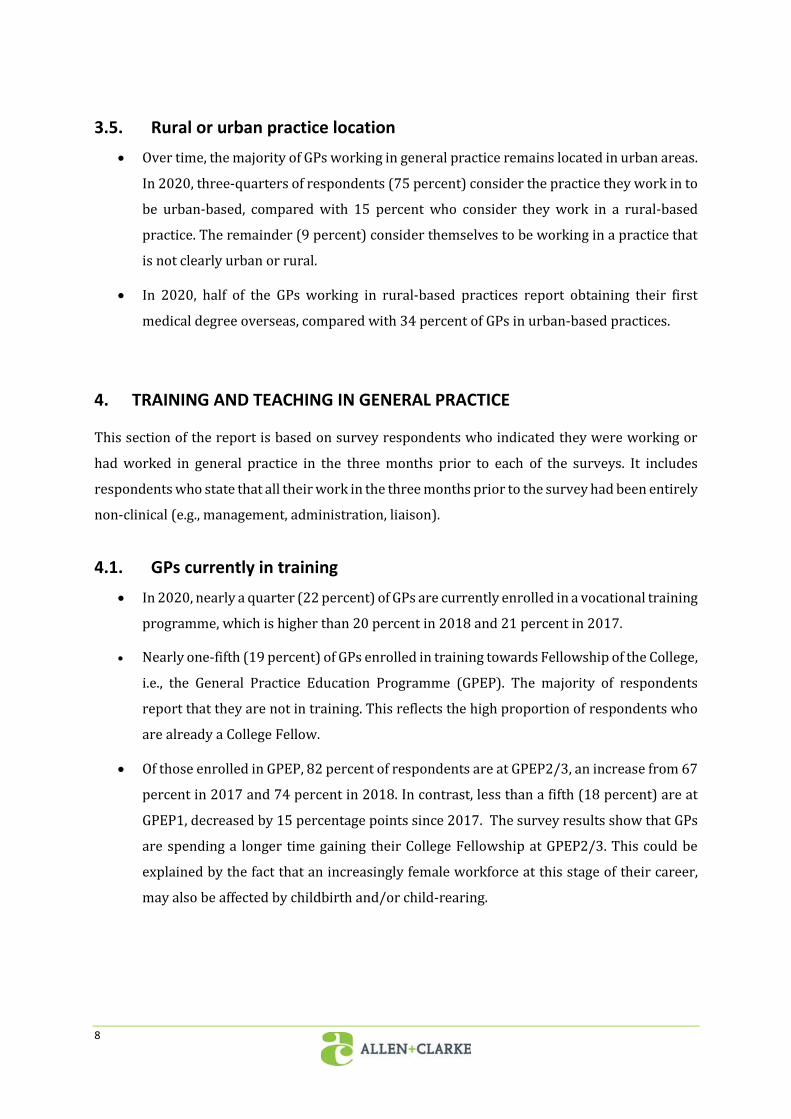
3.5. Rural or urban practice location
• Over time, the majority of GPs working in general practice remains located in urban areas.
In 2020, three-quarters of respondents (75 percent) consider the practice they work in to
be urban-based, compared with 15 percent who consider they work in a rural-based
practice. The remainder (9 percent) consider themselves to be working in a practice that
is not clearly urban or rural.
• In 2020, half of the GPs working in rural-based practices report obtaining their first
medical degree overseas, compared with 34 percent of GPs in urban-based practices.
4. TRAINING AND TEACHING IN GENERAL PRACTICE
This section of the report is based on survey respondents who indicated they were working or
had worked in general practice in the three months prior to each of the surveys. It includes
respondents who state that all their work in the three months prior to the survey had been entirely
non-clinical (e.g., management, administration, liaison).
4.1. GPs currently in training
• In 2020, nearly a quarter (22 percent) of GPs are currently enrolled in a vocational training
programme, which is higher than 20 percent in 2018 and 21 percent in 2017.
• Nearly one-fifth (19 percent) of GPs enrolled in training towards Fellowship of the College,
i.e., the General Practice Education Programme (GPEP). The majority of respondents
report that they are not in training. This reflects the high proportion of respondents who
are already a College Fellow.
• Of those enrolled in GPEP, 82 percent of respondents are at GPEP2/3, an increase from 67
percent in 2017 and 74 percent in 2018. In contrast, less than a fifth (18 percent) are at
GPEP1, decreased by 15 percentage points since 2017. The survey results show that GPs
are spending a longer time gaining their College Fellowship at GPEP2/3. This could be
explained by the fact that an increasingly female workforce at this stage of their career,
may also be affected by childbirth and/or child-rearing.
2020 General Practice Workforce Survey – Summary report 9
4.2. GPs providing training
• In 2020, nearly half (49 percent) of GPs report that they currently provide training to
medical students or doctors, with 18 percent provide at least 2 types of training to medical
students or doctors.
• Over half (55 percent) of GPs provide training to medical students are female and are more
likely to be 35 years or older.
• Reflecting the smaller workforce and the push for training in rural hospitals, 64 percent
of respondents in rural-based practices are providing training compared to 45 percent of
those in urban-based practices.
5. HOURS WORKED AND AFTER-HOURS COMMITMENTS IN GENERAL
PRACTICE
This section of the report is based on survey respondents who indicated they were working or
had worked in general practice in the three months prior to the survey.
NOTE: This section excludes those respondents who stated that all their work in the three months
prior to the survey had been entirely non-clinical (e.g., management, administration, liaison).
5.1. Hours in general practice per week
• In 2020, the average number of hours worked in general practice is 34.8 hours per week.
The average hours per week have fluctuated between 34.2 hours and 35.3 hours in the
last six years.
• Less than half (45 percent) of respondents have been classified as working ‘full-time1’ in
2020, which is the lowest percentage since the College’s workforce survey began in 2014.
• The proportion of GPs that worked less than 36 hours (part-time) steadily increased from
46 percent in 2014 to 54 percent in 2020. It is notable that for the first time the number
of GPs working ‘part-time’ exceeds the number of GPs working ‘full-time’ in 2020.
1 For the purposes of this survey, ‘full-time’ is defined as working 36 hours per week or more in general practice.
10
• Male GPs tended to work longer hours than female GPs over the last five years. However,
the gender difference in average hours worked narrowed from 8.6 hours in 2015 to 7.0
hours in 2020.
• GPs working in rural-based practices are more likely to be working full-time (54 percent)
compared to GPs in urban-based practices (44 percent) in 2020.
5.2. After-hours practice commitments
• In 2020, more than half (58 percent) of respondents state they have after-hours general
practice commitments, which is the lowest percentage since this measure was introduced
in 2016 (66 percent), the result has dropped by 8 percentage points in the last four years.
• GPs working in rural-based practices are more likely to experience after-hours practice
related commitments (74 percent) compared to GPs working in urban-based practices (54
percent).
• Those working ‘full-time’ and male GPs report more frequent after-hours practice related
commitments.
6. GP INCOMES
This section of the report is based on survey respondents who indicated they were working or
had worked in general practice in the three months prior to the survey.
NOTE: This section excludes those respondents who stated that all their work in the three months
prior to the survey had been entirely non-clinical (e.g., management, administration, liaison).
6.1. Personal annual income
• In 2020, GPs’ average and median personal annual before-tax income are $157,594 and
$140,000 respectively, which indicates a right-skewed income distribution.
• GPs’ average income ($157,594) in 2020 slightly increase from $156,250 in 2018, but it is
less than the expected inflationary increase.
2020 General Practice Workforce Survey – Summary report 11
6.2. Gender pay gap
• In 2020, among GPs working full-time (at least 36 hours per week), the median incomes
for male and female GPs are $200,000 and $160,000 respectively.
• Male GPs are paid 14.6 percent more than female GPs, the gender pay gap2 for female GPs
is higher than the population average (9.3 percent) according to the 2018 Household
Economic Survey, roughly the same as that of community and personal service workers
(14.4 percent), but lower than that of professionals (16.7 percent) and technicians/trades
workers (16.2 percent).
• The gender pay gap varies over age, it is lowest (10 percent) for the 24-39 age group and
highest for those aged between 40 and 54 years (18 percent).
• The gender pay gap is larger for College Fellows (15 percent) than for those not fellows
(11 percent), and larger for practice employees/contractors (12 percent) than for practice
owners/partners (4 percent).
6.3. Multiple regression analysis of GPs’ income
• The income gap between male and female GPs is approximately $25,000 after controlling
for the significant variables of employment status, weekly working hours, Fellowship
status and years since gaining MCNZ registration. Importantly, ethnicity is not statistically
significant in contributing to gender income difference.
7. FACTORS THAT MIGHT ENABLE PART-TIME GPS TO INCREASE WORKING
HOURS
This section of the report is only based on survey respondents who indicated they were working
or had worked in general practice in part-time (work less than 36 hours per week) in the three
months prior to the survey.
NOTE: This section excludes those respondents who stated that all their work in the three months
prior to the survey had been entirely non-clinical (e.g., management, administration, liaison).
2 The gender pay gap is calculated as the median hourly pay rate of males minus the median hourly pay rate of females, divided by the median hourly pay rate of males.

12
• Among part-time GPs, a less stressful working environment is the most commonly
identified factor (38 percent) in encouraging increased working hours, followed by higher
remuneration (29 percent) and greater workplace flexibility (28 percent).
• Of those part-time GPs provide at least one factor, a less stressful working environment is
considered the most important factor (28 percent) in encouraging increased working
hours, followed by higher remuneration (18 percent), and increasing age of children (17
percent).
• A less stressful working environment is the most important factor for both male and
female GPs. The next most common factor is different across gender, with males rating
higher remuneration (23 percent) and females reporting that their children getting older
(20 percent) as most important.
• Respondents under 55 years of age also state a less stressful working environment as
being the most important (albeit lower at 26 percent) and the increasing age of their
children (23 percent) as the second most important factor. Respondents over 55 state a
less stressful working environment is most important (31 percent) and higher
remuneration next (21 percent).
• Higher remuneration is highest rated by long-term employees/contractors (19 percent),
with short-term employees/contractors lower at 16 percent, and 15 percent of practice
owners/partners.
• A fifth of short-term employees (20 percent) reported that flexibility in working hours was
the most important factor in encouraging them to increase their hours compared to long-
term (14 percent) and practice owners/partners (9 percent).
• Almost a quarter of GPs earning less than $75,001 reported that their children growing
older (23 percent) was the most important factor, while those earning over $75,000 rate
a less stressful working environment highest (between 29 and 32 percent).
8. EMPLOYMENT TYPE AND PRACTICE OWNERSHIP
This section of the report is based on survey respondents who indicated they were working or
had worked in general practice in the three months prior to the survey.
NOTE: This section excludes those respondents who stated that all their work in the three months
prior to the survey had been entirely non-clinical (e.g., management, administration, liaison).
2020 General Practice Workforce Survey – Summary report 13
8.1. GP employment status
• In 2020, long-term employees and contractors continue to make up the largest proportion
of the GP workforce, over half (52 percent) of GPs state they are either a long-term
employee or a long-term contractor regarding the general practice they work in or mostly
work in, increased from 46 percent in 2014.
• Over one-third of respondents (34 percent) state they hold an ownership stake in the
practice in which they work in 2020; this has dropped from 39 percent in 2014. Short-
term employees and contractors’ percentage increased from 9 percent in 2014 to 15
percent in 2017, then dropped to 11 percent in 2020.
• In 2020, 44 percent of male GPs report being a practice owner or partner compared to 26
percent of female, reflecting a consistent gap for female GPs over the last six years.
However, both percentages have declined since 2016. It is notable that the percentage of
male practice owners or partners is falling faster than that for females. There are
indications of the younger cohort of female GPs becoming owners or partners as the GP
workforce ages.
8.2. Practice ownership models
• In 2020, the vast majority of respondents worked in a practice owned by one or more GPs
who also worked in that practice, but the result has declined from 73 percent in 2015 to
69 percent in 2020.
• The next most common ownership model was full or partial corporate ownership, its
percentage has increased from 7 percent in 2015 to 10 percent in 2020.
• The percentage of respondents working in community, trust or charity owned practices
has increased from 3 percent in 2015 to 7 percent in 2020.
9. RETIREMENT INTENTIONS IN GENERAL PRACTICE
This section of the report is based on survey respondents who indicated they were working or
had worked in general practice in the three months prior to the survey. It includes respondents
who stated that all their work in the three months prior to the survey had been entirely non-
clinical (e.g., management, administration, liaison).

14
9.1. Retirement intentions in general practice
• The proportion of GPs intending to retire within the next two years has increased steadily
every year, rising dramatically from 4 percent in 2014 to 14 percent in 2020.
• Over the next five years, 31 percent of GPs intend to retire, which is double the proportion
in 2014. Over the next ten years, nearly half (49 percent) intend to retire, increased from
36 percent in 2014.
• In 2020, if we exclude registrars, these percentages rise to 16 percent intending to retire
in the next two years, 36 percent in the next five years and 58 percent in the next ten years.
• There is little difference in retirement intentions between GPs working in rural- and
urban-based practices.
10. BURN-OUT AND GENERAL PRACTICE AS A CAREER
This section of the report is based on survey respondents who indicated they were or had worked
in general practice in the three months prior to the survey. It includes those respondents who
stated that all their work in the three months prior to the survey had been entirely non-clinical
(e.g., management, administration, liaison).
10.1. Burn-out
• In 2020, nearly one-third (31 percent) of respondents rated themselves ‘high’ on the burn-
out scale3. This percentage has been steadily increasing over the past four years. In 2016,
22 percent of respondents rated themselves as ‘high’ on the burn-out scale.
• Respondents reporting high burn-out are more likely to be aged between 40 and 64 years,
a practice owner or partner, and working full-time.
3 Using an 11-point scale, which ran from ‘not at all burnt out’ (0) through to ‘extremely burnt out’ (10), all
survey respondents were asked to rate the extent to which they felt burnt out with the following question:
“How would you currently rate yourself on a 0 to 10 scale, where 0 = ‘not at all burnt out’ and 10 = ‘extremely
burnt out’?” This question was asked from 2016 onwards.

2020 General Practice Workforce Survey – Summary report 15
10.2. Recommending general practice as a career
• In 2020, over half of GPs (54 percent) rate themselves as likely to recommend a career in
general practice, a decrease from 63 percent in 2018.
• 14 percent rate themselves as unlikely to recommend a career in general practice.
11. WAYS OF WORKING IN GENERAL PRACTICE
For the 2020 survey, in response to the impact of COVID-19 on GPs work, we added questions
looking at the use of remote technologies, patient engagement and a new set of questions based
on College insights into the challenges faced by GPs in 2020. In the report, ‘pre COVID-19
lockdown’ refers to the period prior to the Level 4 COVID-19 lockdown, and ‘post-COVID-19'
refers to the period after the Level 4 lockdown. This distinction was made explicit in the
questionnaire.
• Between pre- and post-COVID-19 Level-4 lockdown, we observed an increase in use of all
the technologies enquired about, with the largest changes seen in video conferencing (11
percent vs 54 percent). This is followed by the use of phone messaging, which also
increased during the period (13 percent vs 22 percent).
• Nearly half (49 percent) of participants report being confident or very confident in using
Video conferencing – a dramatic increase from 2016 (12 percent).
• The vast majority (over 95 percent) of respondents feel that the use of telehealth was
positive at least sometimes.
• Almost one-fifth respondents (19 percent) report that their patients face barriers to using
these technologies often or always.
• Over a quarter (26 percent) of respondents report that their practice was a Health Care
Home practice pre-lockdown, increasing to 29 percent post-lockdown.
• Almost a third (32 percent) report having a nurse practitioner at the practice, which did
not change over the lockdown period, with 45 percent reporting having a healthcare
assistant pre-lockdown rising slightly to 47 percent post-lockdown.

16
12. RURAL HOSPITAL MEDICINE WORKFORCE
The 2018 workforce survey was the first time that the College collected information on doctors
working in rural hospital medicine. Most of the questions have been repeated in the 2020 survey.
This section of the report presents the responses of the doctors who indicated they were working
in rural hospital medicine in the three months prior to the survey. It also includes the doctors who
were training towards registration in the vocational scope of rural hospital medicine (DRHM
registrars) but who were not working in rural hospital medicine at the time of the surveys. All
responses are included in the analysis, except where the question was only appropriate for those
respondents who were currently working in rural hospital medicine.
12.1. Rural Hospital Medicine workforce – Demographics
• In 2020, the median age of rural hospital doctors4 is 49.0 years, a slight increase compared
to 48.1 years in 2018. Nearly a quarter (22 percent) are aged 60 years or older. Meanwhile,
one-tenth of the respondents (10 percent) are in the age range of 25 to 29 years old.
• The proportion of female rural hospital doctors increased from 41 percent in 2018 to 44
percent in 2020.
• The majority of rural hospital doctors identify as European (84 percent), compared to 80
percent in 2018.
• Less than half (46 percent) of rural hospital doctors report that they obtained their first
medical degree overseas, up from 37 percent in 2018. The most common country in which
respondents indicated that they had obtained their first medical degree overseas was the
United Kingdom (42 percent). In contrast, 54 percent gained their degree in New Zealand.
• Just one-third (31 percent) of rural hospital doctors first gained medical registration in
New Zealand in the past 10 years.
• More than three-quarters of respondents (76 percent) who work in rural hospital
medicine or who are rural hospital medicine registrars state they were registered in a
vocational scope, most frequently in general practice (54 percent) and/or rural hospital
medicine (42 percent).
4 Rural hospital doctors included respondents who are either working in rural hospital medicine or are registrars training towards FDRHMNZ.
2020 General Practice Workforce Survey – Summary report 17
• Just under one-third of respondents working or training in rural hospital medicine (30
percent) state they were enrolled in a vocational training programme. Of these, 95 percent
are training towards FDRHMNZ and 64 percent towards FRNZCGP. 62 percent are training
towards both FDRHMNZ and FRNZCGP.
12.2. Working in Rural Hospital Medicine
• In 2020, more than two-thirds (68 percent) of respondents who work in rural hospital
medicine work in a Level 3 rural hospital, similar to the result in 2018. While 16 percent
of respondents work in a Level 2 rural hospital and very few in a Level 1 rural hospital (4
percent), both the percentage of level 1 and level 2 decreased in 2020.
• The average number of hours worked in rural hospital medicine is 28.4 hours per week,
which is lower than 29.7 hours in 2018. More than half (55 percent) of rural hospital
doctors work less than 36 hours (part-time) per week.
• Between pre- and post-lockdown, we observed a noticeable increase for the use of video
call (38 percent to 47 percent) or SMS messaging (43 percent to 52 percent) or phone
messaging app (27 percent to 34 percent). Conversely, the use of email went down over
the period (56 percent to 54 percent).
12.3. Retirement intentions in rural hospital medicine
• Fifteen percent of respondents working in rural hospital medicine or enrolled in the rural
hospital medicine vocational training programme intend to retire in the next one to two
years, decreased from 18 percent in 2018.
• More than one-quarter (29 percent) state they intend to retire in the next five years.
Looking only at those FDRHMNZ, the percentage decreases to 23 percent intending to
retire in the next five years.
• A further 18 percent intend to retire in 6-10 years, meaning that in total nearly half (46
percent) intend to retire in the next 10 years.
12.4. Burn-out and options about a career in rural hospital medicine
• More than one-fifth (21 percent) of rural hospital doctors rate themselves as being burnt
out to some degree, compared to 29 percent in 2018.
18
• Eighty percent of rural hospital doctors state they were likely to recommend a career in
rural hospital medicine. Only 5 percent state they were unlikely to do so.
13. RECOMMENDATIONS
We have 9 key recommendations:
1. Use the survey findings to advocate to Government, DHBs, PHOs, practices, universities, and
the public about the urgent need to address the challenges in the GP workforce.
2. Use the findings of this and previous surveys to target support and resources to practices
and individual members about ways to support the workforce, recognise burnout, minimise
structural and functional stressors in the workplace, and help build organisational and
personal resilience.
3. Advocate for Government, DHBs, PHOs, and practices to recognise the changing needs of the
GP population and GP Practices, especially in relation to:
• Providing additional childcare support and flexible work hours to GPs with young
families.
• Identifying practical pathways to practice ownership and/or becoming a partner for
those who wish to do so.
• Providing a support service within the College to support older GPs in implementing
succession planning for their practice.
4. Recognise, publicise, and seek to address the impending workforce crisis of retiring GPs,
through pro-active recruitment of medical graduates into GP education programmes, and
novel ways to incentivise graduates to enter general practice.
5. Encourage Māori and Pasifika to study medicine and choose a career in general practice. For
example by:
• increasing scholarship opportunities for Māori and Pasifika medical students.
• visibly and substantively supporting existing STEM initiatives in High Schools (e.g.,
Puhoro).
6. Use the findings of the 2020 survey to measure progress towards these targets in the.2017
RNZCGP Māori Strategy (He Rautaki Māori):
2020 General Practice Workforce Survey – Summary report 19
• 22 percent of the total annual GPEP1 training intake is Māori by 2021.
• Increase the number of Māori GPs practising in three agreed regions by 2021.
• Increase the number of Māori GP Fellows by 50 percent by 2021.
7. Further investigate patient access to and acceptance of telehealth services.
8. Promote visibility of pay equity for female GPs and practice ownership/partnership
pathways.
9. Undertake the analysis of the after-hours work commitments of the older GP cohort with
reference to
• The kinds of commitments.
• What support or advice could be provided.
20
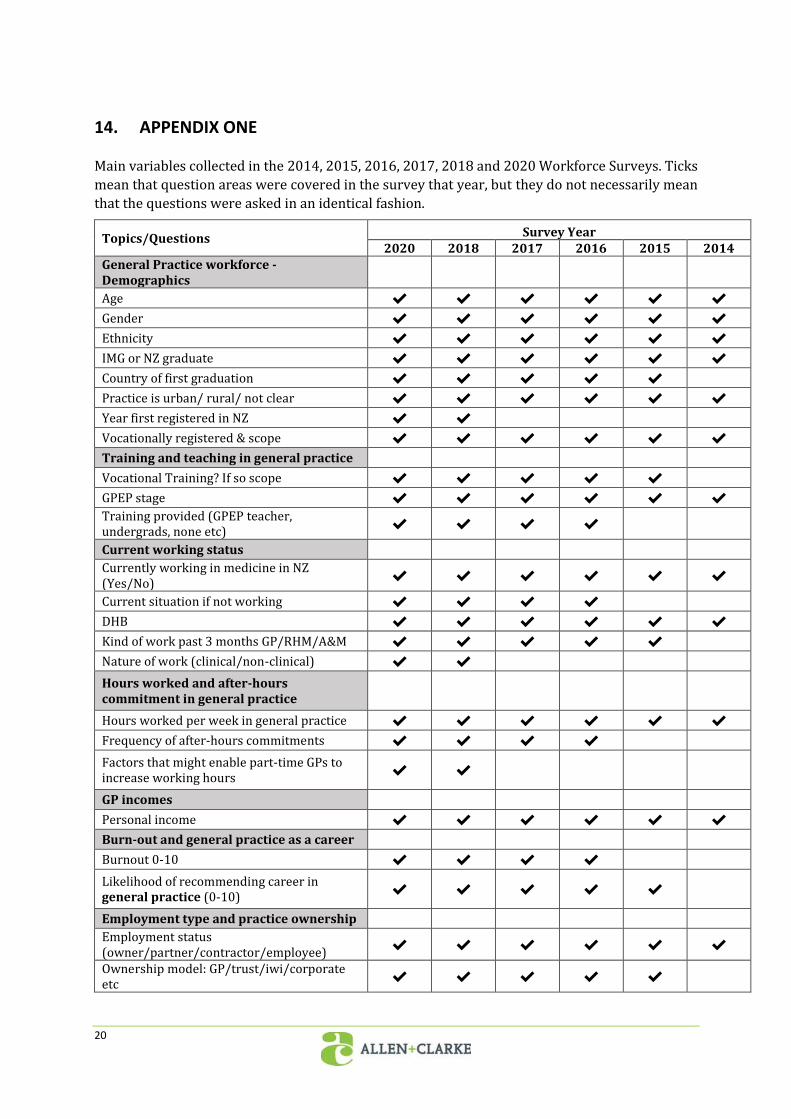
14. APPENDIX ONE
Main variables collected in the 2014, 2015, 2016, 2017, 2018 and 2020 Workforce Surveys. Ticks
mean that question areas were covered in the survey that year, but they do not necessarily mean
that the questions were asked in an identical fashion.
Topics/Questions Survey Year 2020 2018 2017 2016 2015 2014
General Practice workforce - Demographics
Age ✔ ✔ ✔ ✔ ✔ ✔
Gender ✔ ✔ ✔ ✔ ✔ ✔
Ethnicity ✔ ✔ ✔ ✔ ✔ ✔
IMG or NZ graduate ✔ ✔ ✔ ✔ ✔ ✔
Country of first graduation ✔ ✔ ✔ ✔ ✔
Practice is urban/ rural/ not clear ✔ ✔ ✔ ✔ ✔ ✔
Year first registered in NZ ✔ ✔
Vocationally registered & scope ✔ ✔ ✔ ✔ ✔ ✔
Training and teaching in general practice
Vocational Training? If so scope ✔ ✔ ✔ ✔ ✔
GPEP stage ✔ ✔ ✔ ✔ ✔ ✔
Training provided (GPEP teacher, undergrads, none etc)
✔ ✔ ✔ ✔
Current working status Currently working in medicine in NZ (Yes/No)
✔ ✔ ✔ ✔ ✔ ✔
Current situation if not working ✔ ✔ ✔ ✔
DHB ✔ ✔ ✔ ✔ ✔ ✔
Kind of work past 3 months GP/RHM/A&M ✔ ✔ ✔ ✔ ✔
Nature of work (clinical/non-clinical) ✔ ✔
Hours worked and after-hours commitment in general practice
Hours worked per week in general practice ✔ ✔ ✔ ✔ ✔ ✔
Frequency of after-hours commitments ✔ ✔ ✔ ✔
Factors that might enable part-time GPs to increase working hours
✔ ✔
GP incomes
Personal income ✔ ✔ ✔ ✔ ✔ ✔
Burn-out and general practice as a career
Burnout 0-10 ✔ ✔ ✔ ✔
Likelihood of recommending career in general practice (0-10)
✔ ✔ ✔ ✔ ✔
Employment type and practice ownership Employment status (owner/partner/contractor/employee)
✔ ✔ ✔ ✔ ✔ ✔
Ownership model: GP/trust/iwi/corporate etc
✔ ✔ ✔ ✔ ✔

2020 General Practice Workforce Survey – Summary report 21
Topics/Questions Survey Year 2020 2018 2017 2016 2015 2014
Number of weeks of unpaid leave ✔ ✔ ✔ ✔
Retirement intentions in general practice
When intend to retire from general practice ✔ ✔ ✔ ✔ ✔ ✔
About the general practice you work in Number enrolled patients ✔ ✔ ✔ ✔ ✔ ✔
PHO ✔ ✔ ✔ ✔ ✔ ✔
Number of FTE GPs in current practice ✔ ✔ ✔ ✔ ✔ ✔
Rural Hospital Medicine workforce
Age ✔ ✔
Gender ✔ ✔
Ethnicity ✔ ✔
IMG or NZ grad ✔ ✔
Training and teaching ✔ ✔
Level of rural hospital ✔ ✔
Hours worked per week in rural hospital ✔ ✔
When intend to retire from rural hospital ✔ ✔ Likelihood of recommending career in rural hospital (0-10)
✔ ✔
Burnout 0-10 (RHM) ✔ ✔