2020 Annual Wastewater Report - Greater Sudbury
48
2020 Annual Wastewater Report March 8, 2021 Version 1.0
Transcript of 2020 Annual Wastewater Report - Greater Sudbury

2020 Annual Wastewater
Report
March 8, 2021 Version 1.0

i
2020 Annual Wastewater Report
Version 1.0
Reviewed by: 8-Mar-2021
Richard Piazza
Acting Manager of Wastewater Treatment Date
Approved by: 8-Mar-2021
Michael Loken, P. Eng.
Acting Director, Water/Wastewater
Treatment & Compliance
Date

ii
Introduction to the Annual Wastewater Report
Under Environmental Compliance Approval (ECA) agreements issued by the Ministry of Environment,
Conservation & Parks (MECP), the City is required to report annually on the values/parameters indicated
in the ECA and must make this report publicly available within 90 days of January 1st for the year preceding
the current year. Specifically the annual report is to include:
a) a summary and interpretation of all monitoring data and a comparison to the effluent limits outlined in conditions described in the Approval, including an overview of the success and adequacy of the Works;
b) a description of any operating problems encountered and corrective actions taken;
c) a summary of all maintenance carried out on any major structure, equipment, apparatus, mechanism or thing forming part of the Works;
d) a summary of any effluent quality assurance or control measures undertaken in the reporting period;
e) a summary of the calibration and maintenance carried out on all effluent monitoring equipment;
f) a description of efforts made and results achieved in meeting the Effluent Objectives of the Approval;
g) a tabulation of the volume of sludge generated in the reporting period, an outline of anticipated volumes to be generated in the next reporting period and a summary of the locations to where the sludge was disposed;
h) a summary of any complaints received during the reporting period and any steps taken to address the complaints;
i) a summary of all by-pass, plant overflow, overflow, spill or abnormal discharge events;
j) any other information the Water Supervisor requires from time to time; and
k) a copy of all Notices of Modification submitted to the Water Supervisor.
To address these requirements, this report contains the following sections;
1. Operating Issues & Corrective Actions; Measured values resulting in a non-compliance with respect to a parameter listed within an ECA and the corrective actions taken to resolve the issue.
2. Maintenance & Capital Improvements; All major maintenance, modifications and capital works completed at the facility within the reporting period.
3. Calibrations & Maintenance: Details on the calibration and maintenance carried out on all effluent monitoring equipment.
4. Sludge Disposal; The volume of sludge received and treated at the Sudbury Biosolids facility from the Sudbury WWTP, other wastewater treatment facilities and licensed septage haulers.
5. Customer Complaints (ACR); Any complaints received regarding Wastewater Treatment facilities through the City of greater Sudbury 311 (ACR) system during the reporting period and any steps taken to address the complaints.
6. Plant Bypasses and Overflows; A listing of all bypasses, spills and overflows at the facility during the reporting period.
7. Effluent Quality & Control Measures; A summary and interpretation of all monitoring data collected and a comparison to the parameters and limits given in the ECA for each facility.
8. Individual Plant Annual Data Reports; Tables showing all required reporting values and parameters for each wastewater treatment plant of which the City of Greater Sudbury is the owner, including a graphical representation of flows through the plant.

iii
Definitions
- Alkalinity: a measurement of the ability of water to neutralize acid by absorbing hydrogen ions;
- Average Concentration: the mean of all Single Sample Results of the concentration of a contaminant in a given stream (influent/effluent) measured during a specified time period;
- Average Flow: the cumulative total influent or effluent flow measured during a defined time period (annual, monthly, etc.) divided by the number of days during that specified period;
- Average Loading: the value obtained by multiplying the Average Concentration of a contaminant in a given stream (influent/effluent) by the Average Flow for that stream;
- BOD5: the five day biochemical oxygen demand measured in an unfiltered sample and includes carbonaceous and nitrogenous oxygen demands;
- Bypass: the diversion of sewage around one or more treatment processes, excluding Preliminary Treatment System, with the diverted sewage flows being returned to the Sewage Treatment Plant treatment train upstream of the Final Effluent sampling point(s) and discharged via the approved effluent disposal facilities;
- CBOD5: the five day carbonaceous biochemical oxygen demand of biological organisms in the material, without the impact of oxygen depletion by nitrogenous bacteria;
- E. coli: coliform bacteria that possess the enzyme beta-glucuronidase and are capable of cleaving a fluorogenic or chromogenic substrate with the corresponding release of a fluorogen or chromogen, that produces fluorescence under long wavelength (366 nm) UV light, or color development, respectively. Data are reported as colony forming units (CFU) per 100 mL;
- Event: an action or occurrence, at a given location within the Works that causes a Bypass or Overflow. An Event ends when there is no recurrence of Bypass or Overflow in the 12-hour period following the start of the event;
- Final Effluent: effluent that is discharged to the environment through the approved effluent disposal facilities, including all Bypasses, that are required to meet the compliance limits stipulated in the Approval for the Sewage Treatment Plant at the Final Effluent sampling point(s);
- Influent: flows to the Sewage Treatment Plant from the collection system. Flows can fluctuate according to weather conditions and high flows are commonly due to Inflow and Infiltration, a condition that allows rain and/or snow melt to enter the sanitary sewer.;
- Monthly Geometric Mean Density: the mean of all Single Sample Results of E. coli measurement in the samples taken during a calendar month, calculated and reported as per the methodology specified by the MECP;
- Nitrite: the amount of nitrogen present in the effluent as the NO2- anion;
- Nitrate: the amount of nitrogen present in the effluent as the NO3- anion;
- Overflow: a discharge to the environment at location(s) other than the approved effluent discharge;
- pH: the potential of hydrogen measured on a 14 point scale where 0 represents highly acidic material, 14 represents highly acidic material and 7 represents neutral material (such as water);
- Rated Capacity: the Annual Average Daily Influent Flow for which the facility is designed to process;
- T Amm: the total ammonia measured in the final effluent;
- TKN: Total Kjeldahl Nitrogen; the total concentration of organic nitrogen & ammonia in the effluent;
- TP: Total Phosphorous; the total amount of phosphorous measured in the final effluent;
- TSS: Total Suspended Solids; the total amount of residual solid matter in the final effluent;
- Un-ionized Amm: the calculated amount of un-ionized ammonia in the final effluent;
- Sludge: the residual material produced through the wastewater treatment process.
- WSER: Wastewater Systems Effluent Regulations, as defined in the Fisheries Act

iv
Contents Introduction to the Annual Wastewater Report ............................................................................................. ii
Definitions...................................................................................................................................................... iii
1. Operating Issues & Corrective Actions ................................................................................................. 1
2. Maintenance & Capital Improvements .................................................................................................. 2
3. Calibrations & Maintenance .................................................................................................................. 3
4. Sludge Disposal .................................................................................................................................... 3
5. Customer Complaints (ACR) ................................................................................................................. 3
6. Plant Bypasses and Overflows ............................................................................................................. 5
7. Effluent Quality & Control Measures ..................................................................................................... 7
Azilda Wastewater Treatment Plant .......................................................................................................... 7
Capreol Lagoon ......................................................................................................................................... 8
Chelmsford Water Pollution Control Plant ................................................................................................. 9
Coniston Wastewater Treatment Plant .................................................................................................... 11
Dowling Wastewater Treatment Plant ..................................................................................................... 12
Falconbridge Wastewater Treatment Plant ............................................................................................. 13
Levack Wastewater Treatment Plant ...................................................................................................... 14
Lively Wastewater Treatment Plant ......................................................................................................... 15
Sudbury Wastewater Treatment Plant .................................................................................................... 16
Valley East Wastewater Treatment Plant ................................................................................................ 17
Wahnapitae Lagoons ............................................................................................................................... 18
Walden Wastewater Treatment Plant ...................................................................................................... 19
8. Individual Plant Annual Data Reports ................................................................................................. 20
Revision History Date Description Revision Author
8-Mar-2021 Initial issue 1.0 Michael Loken
1
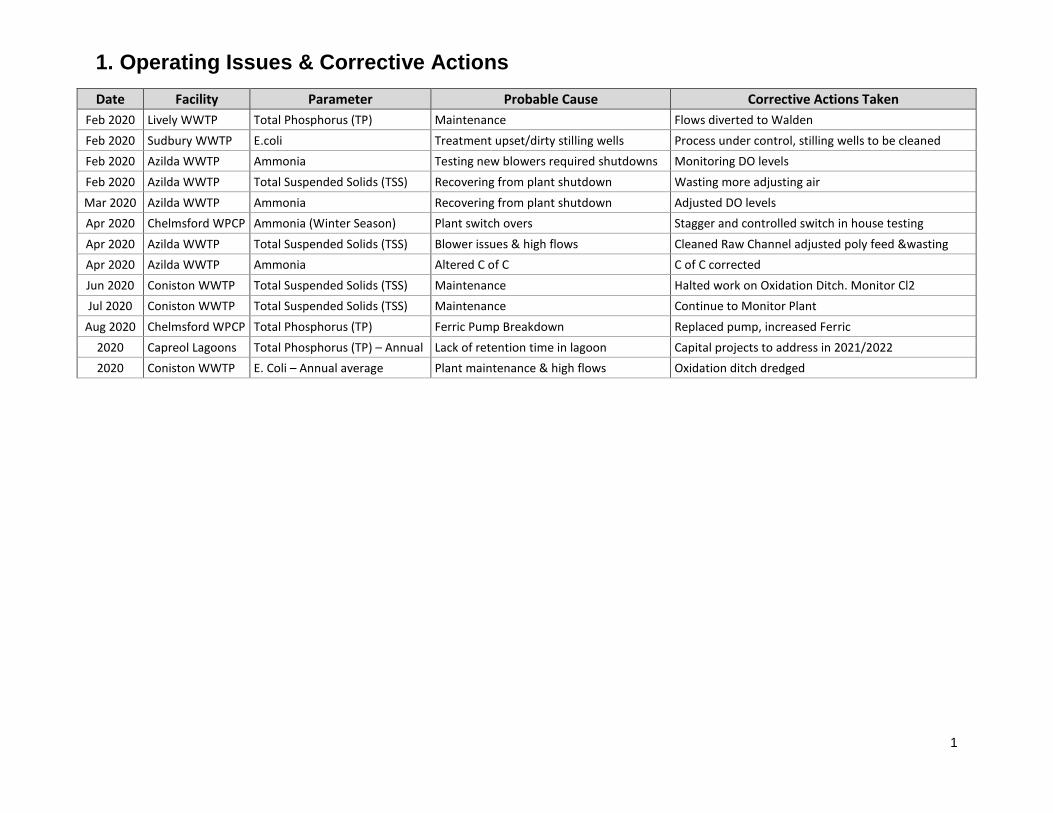
1. Operating Issues & Corrective Actions
Date Facility Parameter Probable Cause Corrective Actions Taken
Feb 2020 Lively WWTP Total Phosphorus (TP) Maintenance Flows diverted to Walden
Feb 2020 Sudbury WWTP E.coli Treatment upset/dirty stilling wells Process under control, stilling wells to be cleaned
Feb 2020 Azilda WWTP Ammonia Testing new blowers required shutdowns Monitoring DO levels
Feb 2020 Azilda WWTP Total Suspended Solids (TSS) Recovering from plant shutdown Wasting more adjusting air
Mar 2020 Azilda WWTP Ammonia Recovering from plant shutdown Adjusted DO levels
Apr 2020 Chelmsford WPCP Ammonia (Winter Season) Plant switch overs Stagger and controlled switch in house testing
Apr 2020 Azilda WWTP Total Suspended Solids (TSS) Blower issues & high flows Cleaned Raw Channel adjusted poly feed &wasting
Apr 2020 Azilda WWTP Ammonia Altered C of C C of C corrected
Jun 2020 Coniston WWTP Total Suspended Solids (TSS) Maintenance Halted work on Oxidation Ditch. Monitor Cl2
Jul 2020 Coniston WWTP Total Suspended Solids (TSS) Maintenance Continue to Monitor Plant
Aug 2020 Chelmsford WPCP Total Phosphorus (TP) Ferric Pump Breakdown Replaced pump, increased Ferric
2020 Capreol Lagoons Total Phosphorus (TP) – Annual Lack of retention time in lagoon Capital projects to address in 2021/2022
2020 Coniston WWTP E. Coli – Annual average Plant maintenance & high flows Oxidation ditch dredged

2
2. Maintenance & Capital Improvements
Facility Maintenance Completed Capital Improvements Completed
Azilda WWTP - No major maintenance required - Effluent dechlorination system installed- Two new (refurbished) aeration blowers installed
Chelmsford WPCP - Ferric Chloride addition lines repaired and storage tank
cleaned out - UV disinfection system commissioned
Capreol Lagoons - Sampling well repaired - No major capital work completed
Coniston WWTP - Oxidation ditch cleaned (dredged)- Leak in chlorine system repaired - Potable water system repaired
- Effluent dechlorination system installed
Dowling WWTP - Aeration tanks cleaned- Potable water system repaired
- Effluent dechlorination system installed
Falconbridge WWTP - Diversion chambers cleaned out (spring & fall) - No major capital work completed
Levack WWTP - Aeration tanks cleaned - Effluent dechlorination system installed
Lively WWTP - Clarifier weir repaired - Effluent dechlorination system installed
Sudbury WWTP
- #1, #3 and #6 Clarifiers repaired - Septage receiving station cleaning brushes repaired &
replaced - 202 diverter valve cleaned out - Aeration line in #1 tank repaired - Polymer system cleaned
- Variable frequency drives installed on 2A and 2B inlet pumps
Valley East WWTP - Raw wastewater pump repaired- Concrete repairs completed on clarifiers
- No major capital work completed
Wahnapitae Lagoons
- No major maintenance required - No major capital work completed
Walden WWTP - Broken aeration line repaired - Aeration tank discharge baffles installed - Influent chamber cleaned out
- Effluent dechlorination system installed

3
3. Calibrations & Maintenance
All analyzers at all plants are calibrated as per manufacturer’s recommendations, a minimum of once per year.
Calibration Certificates are submitted and retained electronically for each unit.
All major plant equipment is maintained as per manufacturer’s recommendations, with regular preventive
maintenance checks completed as per established schedules.
4. Sludge Disposal
Sludge produced and removed from all Wastewater Treatment Plants in the City of Greater Sudbury, along with
hauled liquid waste from other sources, is processed at the Sudbury Biosolids facility. Hauled liquid waste is any
domestic sewage collected & transported by licensed haulers that is suitable for treatment, including:
Waste removed from cesspools, septic tanks, privy pits, chemical toilets, portable toilets or sewage holding tanks and grey water from residential activities;
Sewage from on-board holding tanks (e.g. RVs, tour buses, boats, etc.), and;
Sludge from wastewater treatment facilities in neighbouring municipalities (for example, Espanola).
This Biosolids facility, operated under a Public Private Partnership by Walker Industries and located on the grounds
of the Sudbury Wastewater Treatment Plant, produces a soil amendment by mixing dewatered septage & sludge
with cement kiln dust and/or quicklime, to attain pathogen pasteurization. The product is a granular material, which
is applied to agricultural soils for nutrient and pH enhancement.
In 2020, the Sudbury Biosolids facility treated a total of 120,413 m3 of material, containing approximately 3,619
tonnes of solids. Of this total, approximately 16,392 m3 was from septic tanks, 42,708 m3 was sludge from other
CGS facilities and 4,351 m3 was sludge received from the Espanola Wastewater Treatment Plant.
5. Customer Complaints (ACR)
Date Case ID Location Issue Resolution
01/16/20 957113 Walford Lift Station
Safety concern Safety concern immediately addressed by contractor.
01/19/20 957495 Dufferin Lift Station
Snow removal Snow removed to address concern.
01/31/20 961537 Azilda WWTP Snow removal Snow removed to address concern.
03/30/20 976082 Helene Lift Station
Possible vandalism Door on generator secured and locked.
04/21/20 985657 Nickel Lift Station Concern about lift station Repairs completed to address concern.
04/27/20 988460 First Ave., Lively Sewer Odour Operator added additional chemicals to address concern and Vactor scheduled to clean out built up material.
05/25/20 1000861 Jacob Lift Station Lift station not secured Gates closed and secured by operator.
4
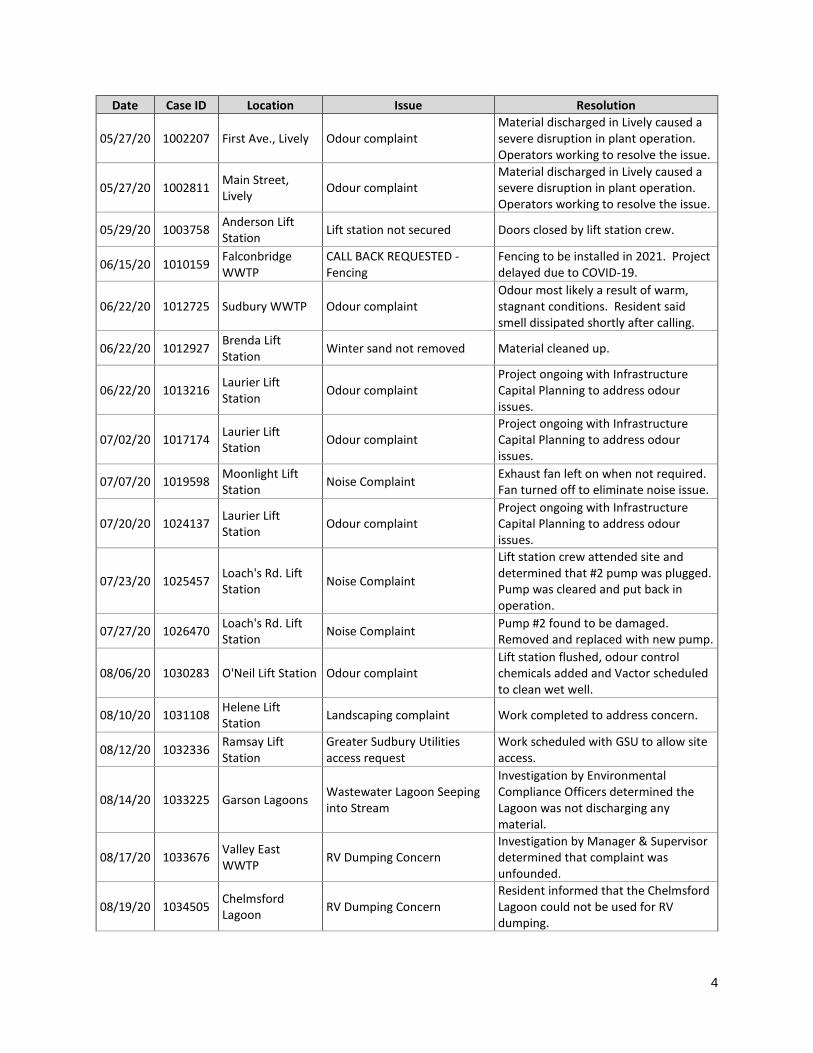
Date Case ID Location Issue Resolution
05/27/20 1002207 First Ave., Lively Odour complaint Material discharged in Lively caused a severe disruption in plant operation. Operators working to resolve the issue.
05/27/20 1002811 Main Street, Lively
Odour complaint Material discharged in Lively caused a severe disruption in plant operation. Operators working to resolve the issue.
05/29/20 1003758 Anderson Lift Station
Lift station not secured Doors closed by lift station crew.
06/15/20 1010159 Falconbridge WWTP
CALL BACK REQUESTED - Fencing
Fencing to be installed in 2021. Project delayed due to COVID-19.
06/22/20 1012725 Sudbury WWTP Odour complaint Odour most likely a result of warm, stagnant conditions. Resident said smell dissipated shortly after calling.
06/22/20 1012927 Brenda Lift Station
Winter sand not removed Material cleaned up.
06/22/20 1013216 Laurier Lift Station
Odour complaint Project ongoing with Infrastructure Capital Planning to address odour issues.
07/02/20 1017174 Laurier Lift Station
Odour complaint Project ongoing with Infrastructure Capital Planning to address odour issues.
07/07/20 1019598 Moonlight Lift Station
Noise Complaint Exhaust fan left on when not required. Fan turned off to eliminate noise issue.
07/20/20 1024137 Laurier Lift Station
Odour complaint Project ongoing with Infrastructure Capital Planning to address odour issues.
07/23/20 1025457 Loach's Rd. Lift Station
Noise Complaint
Lift station crew attended site and determined that #2 pump was plugged. Pump was cleared and put back in operation.
07/27/20 1026470 Loach's Rd. Lift Station
Noise Complaint Pump #2 found to be damaged. Removed and replaced with new pump.
08/06/20 1030283 O'Neil Lift Station Odour complaint Lift station flushed, odour control chemicals added and Vactor scheduled to clean wet well.
08/10/20 1031108 Helene Lift Station
Landscaping complaint Work completed to address concern.
08/12/20 1032336 Ramsay Lift Station
Greater Sudbury Utilities access request
Work scheduled with GSU to allow site access.
08/14/20 1033225 Garson Lagoons Wastewater Lagoon Seeping into Stream
Investigation by Environmental Compliance Officers determined the Lagoon was not discharging any material.
08/17/20 1033676 Valley East WWTP
RV Dumping Concern Investigation by Manager & Supervisor determined that complaint was unfounded.
08/19/20 1034505 Chelmsford Lagoon
RV Dumping Concern Resident informed that the Chelmsford Lagoon could not be used for RV dumping.
5
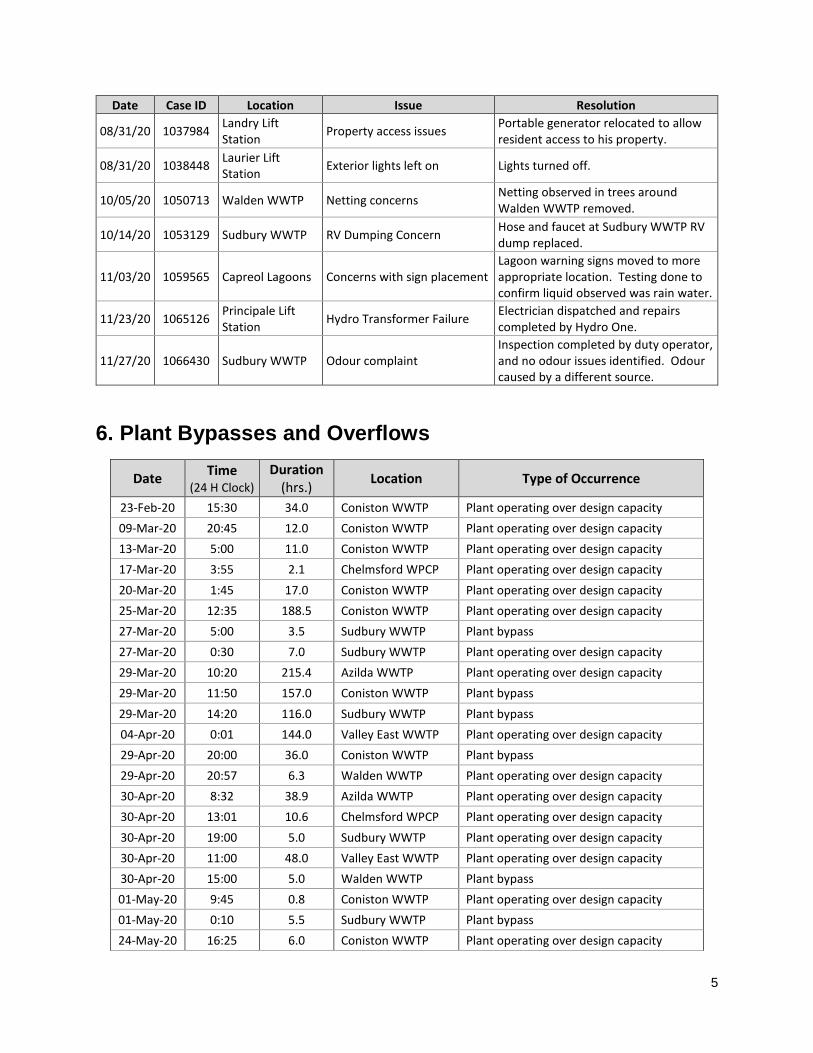
Date Case ID Location Issue Resolution
08/31/20 1037984 Landry Lift Station
Property access issues Portable generator relocated to allow resident access to his property.
08/31/20 1038448 Laurier Lift Station
Exterior lights left on Lights turned off.
10/05/20 1050713 Walden WWTP Netting concerns Netting observed in trees around Walden WWTP removed.
10/14/20 1053129 Sudbury WWTP RV Dumping Concern Hose and faucet at Sudbury WWTP RV dump replaced.
11/03/20 1059565 Capreol Lagoons Concerns with sign placementLagoon warning signs moved to more appropriate location. Testing done to confirm liquid observed was rain water.
11/23/20 1065126 Principale Lift Station
Hydro Transformer Failure Electrician dispatched and repairs completed by Hydro One.
11/27/20 1066430 Sudbury WWTP Odour complaint Inspection completed by duty operator, and no odour issues identified. Odour caused by a different source.
6. Plant Bypasses and Overflows
Date Time
(24 H Clock)
Duration (hrs.)
Location Type of Occurrence
23-Feb-20 15:30 34.0 Coniston WWTP Plant operating over design capacity
09-Mar-20 20:45 12.0 Coniston WWTP Plant operating over design capacity
13-Mar-20 5:00 11.0 Coniston WWTP Plant operating over design capacity
17-Mar-20 3:55 2.1 Chelmsford WPCP Plant operating over design capacity
20-Mar-20 1:45 17.0 Coniston WWTP Plant operating over design capacity
25-Mar-20 12:35 188.5 Coniston WWTP Plant operating over design capacity
27-Mar-20 5:00 3.5 Sudbury WWTP Plant bypass
27-Mar-20 0:30 7.0 Sudbury WWTP Plant operating over design capacity
29-Mar-20 10:20 215.4 Azilda WWTP Plant operating over design capacity
29-Mar-20 11:50 157.0 Coniston WWTP Plant bypass
29-Mar-20 14:20 116.0 Sudbury WWTP Plant bypass
04-Apr-20 0:01 144.0 Valley East WWTP Plant operating over design capacity
29-Apr-20 20:00 36.0 Coniston WWTP Plant bypass
29-Apr-20 20:57 6.3 Walden WWTP Plant operating over design capacity
30-Apr-20 8:32 38.9 Azilda WWTP Plant operating over design capacity
30-Apr-20 13:01 10.6 Chelmsford WPCP Plant operating over design capacity
30-Apr-20 19:00 5.0 Sudbury WWTP Plant operating over design capacity
30-Apr-20 11:00 48.0 Valley East WWTP Plant operating over design capacity
30-Apr-20 15:00 5.0 Walden WWTP Plant bypass
01-May-20 9:45 0.8 Coniston WWTP Plant operating over design capacity
01-May-20 0:10 5.5 Sudbury WWTP Plant bypass
24-May-20 16:25 6.0 Coniston WWTP Plant operating over design capacity

6
Date Time
(24 H Clock)Duration Location Type of Occurrence
02-Jun-20 13:00 384.0 Coniston WWTP Plant operating over design capacity
24-Jun-20 10:00 26.5 Coniston WWTP Plant operating over design capacity
07-Jul-20 10:30 0.5 Moonlight Beach LS Lift station overflow
07-Jul-20 18:30 4.0 Vermillion River LS Lift station overflow
19-Jul-20 16:00 0.3 Sudbury WWTP Sludge overflow, contained on site
02-Aug-20 15:39 2.0 Lively WWTP Plant operating over design capacity
02-Aug-20 16:25 2.0 Walden WWTP Plant operating over design capacity
29-Aug-20 5:40 10.0 Coniston WWTP Plant operating over design capacity
07-Sep-20 1:43 18.5 Coniston WWTP Plant operating over design capacity
07-Sep-20 2:16 4.0 Walden WWTP Plant operating over design capacity
10-Sep-20 5:25 16.5 Coniston WWTP Plant operating over design capacity
15-Sep-20 14:27 30.3 Azilda WWTP Plant operating over design capacity
15-Sep-20 12:15 0.3 Vermillion River LS Lift station overflow
21-Sep-20 10:45 72.1 Chelmsford WPCP Plant bypass
23-Oct-20 3:28 46.3 Azilda WWTP Plant operating over design capacity
23-Oct-20 3:04 66.5 Chelmsford WPCP Plant operating over design capacity
23-Oct-20 4:15 28.3 Coniston WWTP Plant bypass
23-Oct-20 1:16 4.5 Levack WWTP Plant operating over design capacity
23-Oct-20 3:15 10.0 Lively WWTP Plant bypass
23-Oct-20 5:49 28.0 Sudbury WWTP Plant bypass
23-Oct-20 2:30 5.5 Walden WWTP Plant operating over design capacity
24-Oct-20 12:00 29.0 Coniston WWTP Plant operating over design capacity
01-Nov-20 8:24 14.0 Coniston WWTP Plant operating over design capacity
15-Nov-20 16:52 6.5 Azilda WWTP Plant operating over design capacity
15-Nov-20 16:10 15.0 Coniston WWTP Plant bypass
15-Nov-20 11:53 20.2 Coniston WWTP Plant operating over design capacity
15-Nov-20 20:18 2.3 Lively WWTP Plant bypass
16-Nov-20 0:10 5.0 Sudbury WWTP Plant operating over design capacity
16-Nov-20 10:15 218.0 Wahnapitae Lagoon Overflow from cell #1
24-Dec-20 9:20 4.3 Coniston WWTP Plant operating over design capacity
24-Dec-20 4:45 2.0 Levack WWTP Plant operating over design capacity
7
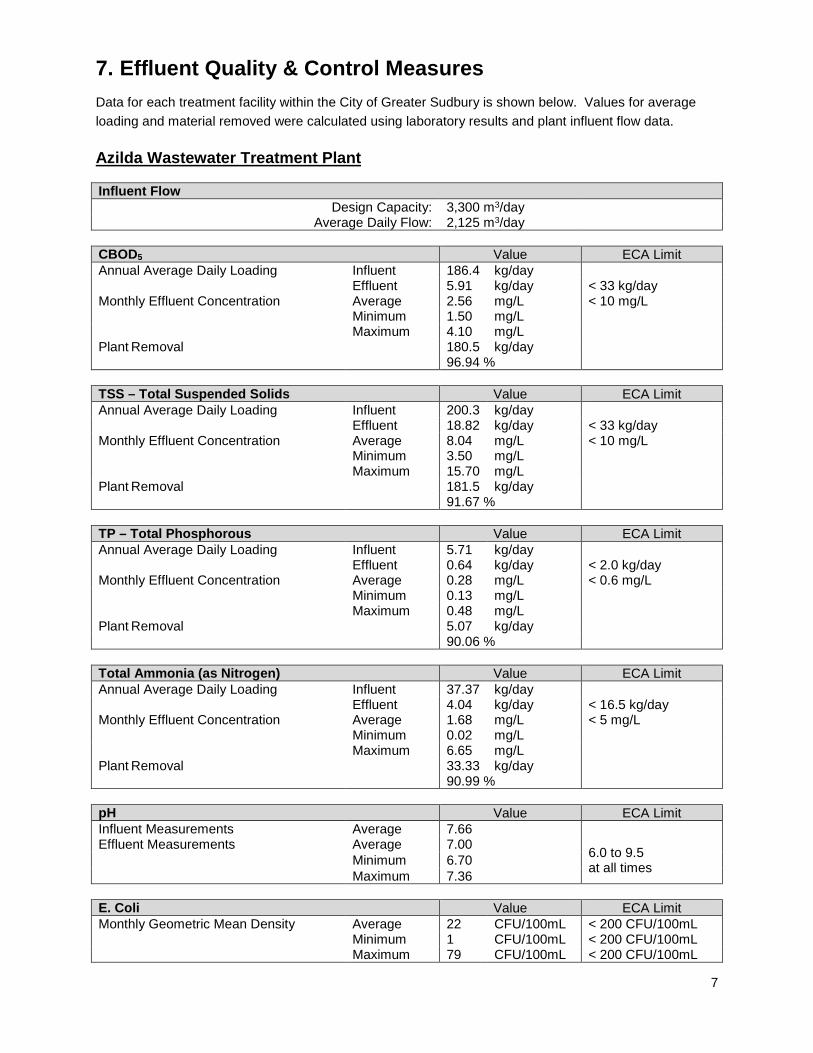
7. Effluent Quality & Control Measures
Data for each treatment facility within the City of Greater Sudbury is shown below. Values for average
loading and material removed were calculated using laboratory results and plant influent flow data.
Azilda Wastewater Treatment Plant
Influent Flow Design Capacity: 3,300 m3/day
Average Daily Flow: 2,125 m3/day
CBOD5 Value ECA Limit Annual Average Daily Loading Influent 186.4 kg/day
Effluent 5.91 kg/day < 33 kg/day Monthly Effluent Concentration Average 2.56 mg/L < 10 mg/L
Minimum 1.50 mg/L Maximum 4.10 mg/L
Plant Removal 180.5 kg/day 96.94 %
TSS – Total Suspended Solids Value ECA Limit Annual Average Daily Loading Influent 200.3 kg/day
Effluent 18.82 kg/day < 33 kg/day Monthly Effluent Concentration Average 8.04 mg/L < 10 mg/L
Minimum 3.50 mg/L Maximum 15.70 mg/L
Plant Removal 181.5 kg/day 91.67 %
TP – Total Phosphorous Value ECA Limit Annual Average Daily Loading Influent 5.71 kg/day
Effluent 0.64 kg/day < 2.0 kg/day Monthly Effluent Concentration Average 0.28 mg/L < 0.6 mg/L
Minimum 0.13 mg/L Maximum 0.48 mg/L
Plant Removal 5.07 kg/day 90.06 %
Total Ammonia (as Nitrogen) Value ECA Limit Annual Average Daily Loading Influent 37.37 kg/day
Effluent 4.04 kg/day < 16.5 kg/day Monthly Effluent Concentration Average 1.68 mg/L < 5 mg/L
Minimum 0.02 mg/L Maximum 6.65 mg/L
Plant Removal 33.33 kg/day 90.99 %
pH Value ECA Limit Influent Measurements Average 7.66 Effluent Measurements Average 7.00
6.0 to 9.5 at all times
Minimum 6.70 Maximum 7.36
E. Coli Value ECA Limit Monthly Geometric Mean Density Average 22 CFU/100mL < 200 CFU/100mL
Minimum 1 CFU/100mL < 200 CFU/100mL Maximum 79 CFU/100mL < 200 CFU/100mL
8
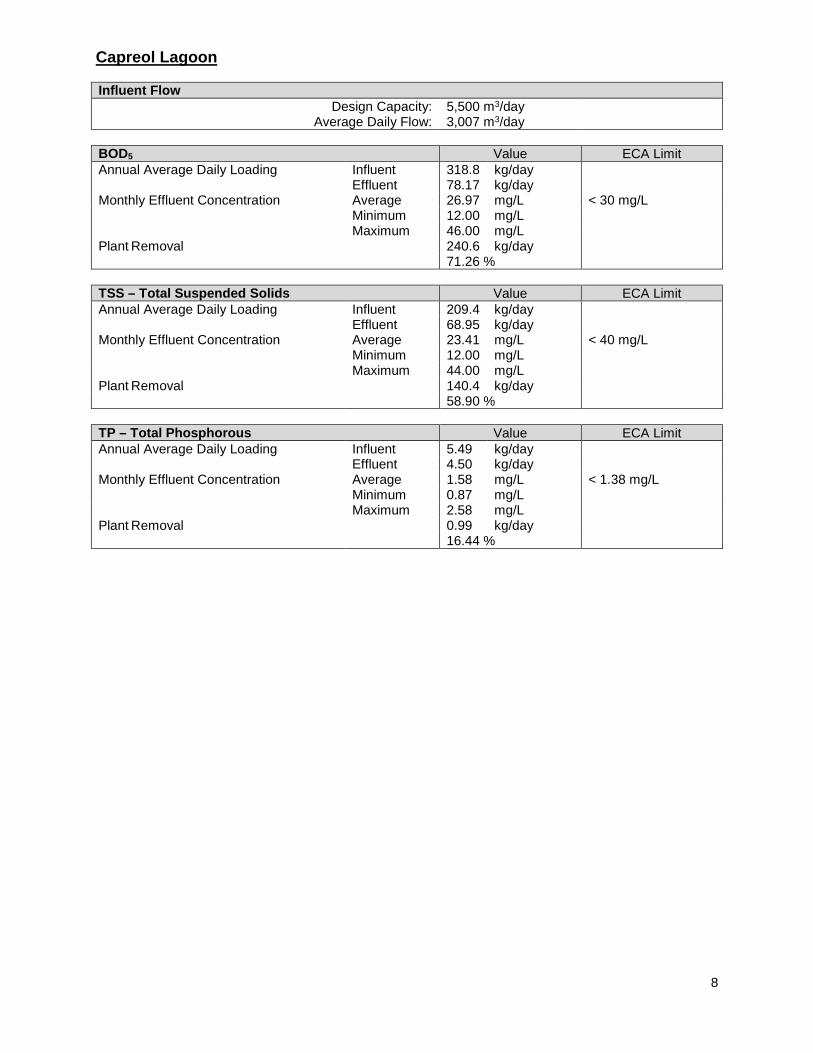
Capreol Lagoon
Influent Flow Design Capacity: 5,500 m3/day
Average Daily Flow: 3,007 m3/day
BOD5 Value ECA Limit Annual Average Daily Loading Influent 318.8 kg/day
Effluent 78.17 kg/day Monthly Effluent Concentration Average 26.97 mg/L < 30 mg/L
Minimum 12.00 mg/L Maximum 46.00 mg/L
Plant Removal 240.6 kg/day 71.26 %
TSS – Total Suspended Solids Value ECA Limit Annual Average Daily Loading Influent 209.4 kg/day
Effluent 68.95 kg/day Monthly Effluent Concentration Average 23.41 mg/L < 40 mg/L
Minimum 12.00 mg/L Maximum 44.00 mg/L
Plant Removal 140.4 kg/day 58.90 %
TP – Total Phosphorous Value ECA Limit Annual Average Daily Loading Influent 5.49 kg/day
Effluent 4.50 kg/day Monthly Effluent Concentration Average 1.58 mg/L < 1.38 mg/L
Minimum 0.87 mg/L Maximum 2.58 mg/L
Plant Removal 0.99 kg/day 16.44 %
9
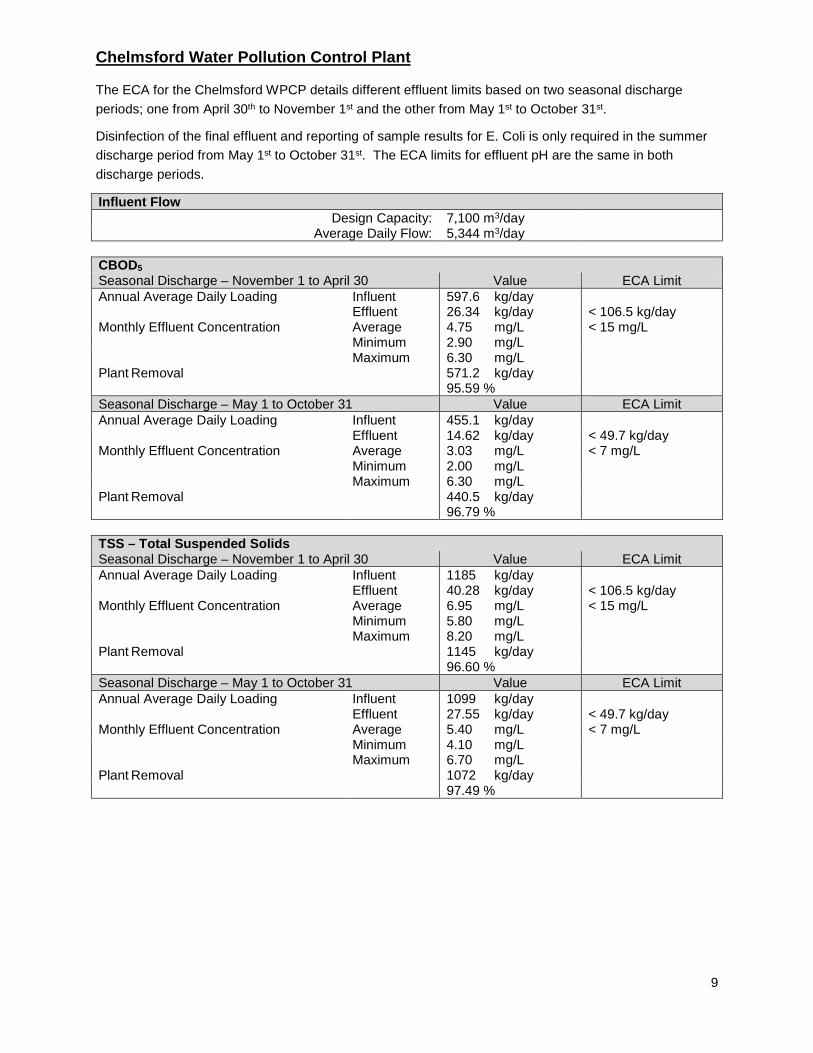
Chelmsford Water Pollution Control Plant
The ECA for the Chelmsford WPCP details different effluent limits based on two seasonal discharge
periods; one from April 30th to November 1st and the other from May 1st to October 31st.
Disinfection of the final effluent and reporting of sample results for E. Coli is only required in the summer
discharge period from May 1st to October 31st. The ECA limits for effluent pH are the same in both
discharge periods.
Influent Flow Design Capacity: 7,100 m3/day
Average Daily Flow: 5,344 m3/day
CBOD5
Seasonal Discharge – November 1 to April 30 Value ECA Limit Annual Average Daily Loading Influent 597.6 kg/day
Effluent 26.34 kg/day < 106.5 kg/day Monthly Effluent Concentration Average 4.75 mg/L < 15 mg/L
Minimum 2.90 mg/L Maximum 6.30 mg/L
Plant Removal 571.2 kg/day 95.59 %
Seasonal Discharge – May 1 to October 31 Value ECA Limit Annual Average Daily Loading Influent 455.1 kg/day
Effluent 14.62 kg/day < 49.7 kg/day Monthly Effluent Concentration Average 3.03 mg/L < 7 mg/L
Minimum 2.00 mg/L Maximum 6.30 mg/L
Plant Removal 440.5 kg/day 96.79 %
TSS – Total Suspended SolidsSeasonal Discharge – November 1 to April 30 Value ECA Limit Annual Average Daily Loading Influent 1185 kg/day
Effluent 40.28 kg/day < 106.5 kg/day Monthly Effluent Concentration Average 6.95 mg/L < 15 mg/L
Minimum 5.80 mg/L Maximum 8.20 mg/L
Plant Removal 1145 kg/day 96.60 %
Seasonal Discharge – May 1 to October 31 Value ECA Limit Annual Average Daily Loading Influent 1099 kg/day
Effluent 27.55 kg/day < 49.7 kg/day Monthly Effluent Concentration Average 5.40 mg/L < 7 mg/L
Minimum 4.10 mg/L Maximum 6.70 mg/L
Plant Removal 1072 kg/day 97.49 %
10
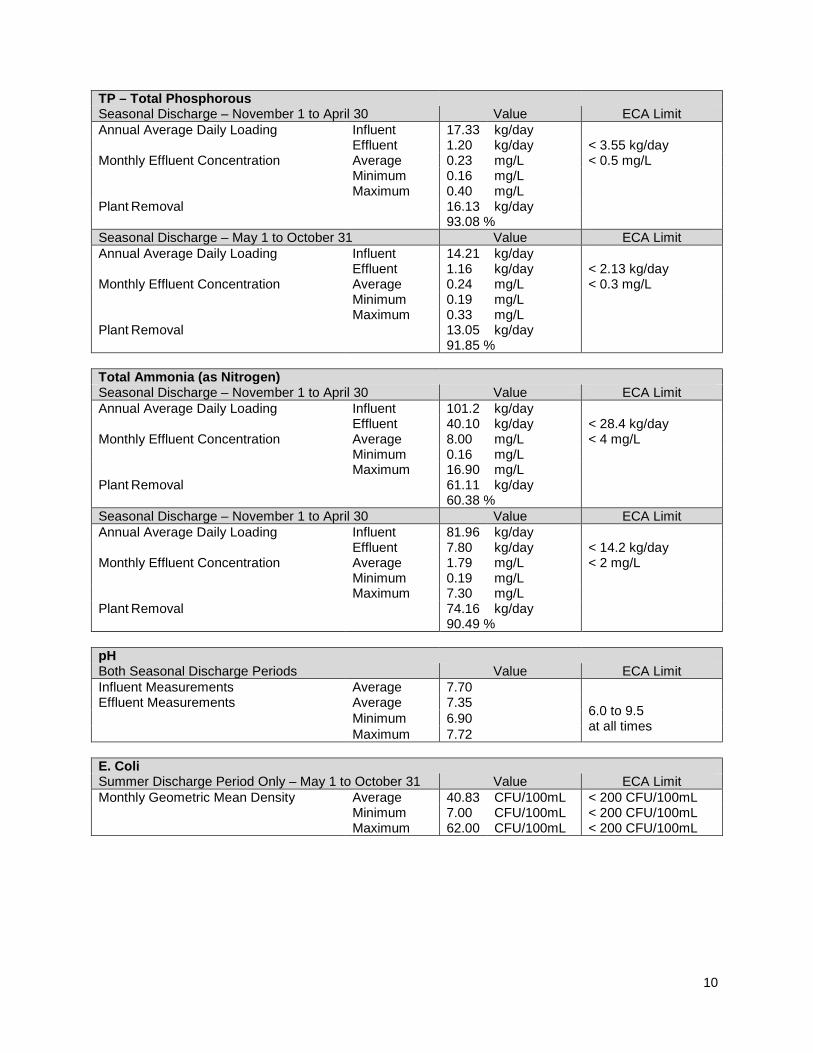
TP – Total Phosphorous Seasonal Discharge – November 1 to April 30 Value ECA Limit Annual Average Daily Loading Influent 17.33 kg/day
Effluent 1.20 kg/day < 3.55 kg/day Monthly Effluent Concentration Average 0.23 mg/L < 0.5 mg/L
Minimum 0.16 mg/L Maximum 0.40 mg/L
Plant Removal 16.13 kg/day 93.08 %
Seasonal Discharge – May 1 to October 31 Value ECA Limit Annual Average Daily Loading Influent 14.21 kg/day
Effluent 1.16 kg/day < 2.13 kg/day Monthly Effluent Concentration Average 0.24 mg/L < 0.3 mg/L
Minimum 0.19 mg/L Maximum 0.33 mg/L
Plant Removal 13.05 kg/day 91.85 %
Total Ammonia (as Nitrogen) Seasonal Discharge – November 1 to April 30 Value ECA Limit Annual Average Daily Loading Influent 101.2 kg/day
Effluent 40.10 kg/day < 28.4 kg/day Monthly Effluent Concentration Average 8.00 mg/L < 4 mg/L
Minimum 0.16 mg/L Maximum 16.90 mg/L
Plant Removal 61.11 kg/day 60.38 %
Seasonal Discharge – November 1 to April 30 Value ECA Limit Annual Average Daily Loading Influent 81.96 kg/day
Effluent 7.80 kg/day < 14.2 kg/day Monthly Effluent Concentration Average 1.79 mg/L < 2 mg/L
Minimum 0.19 mg/L Maximum 7.30 mg/L
Plant Removal 74.16 kg/day 90.49 %
pH Both Seasonal Discharge Periods Value ECA Limit Influent Measurements Average 7.70 Effluent Measurements Average 7.35
6.0 to 9.5 at all times
Minimum 6.90 Maximum 7.72
E. Coli Summer Discharge Period Only – May 1 to October 31 Value ECA Limit Monthly Geometric Mean Density Average 40.83 CFU/100mL < 200 CFU/100mL
Minimum 7.00 CFU/100mL < 200 CFU/100mL Maximum 62.00 CFU/100mL < 200 CFU/100mL
11
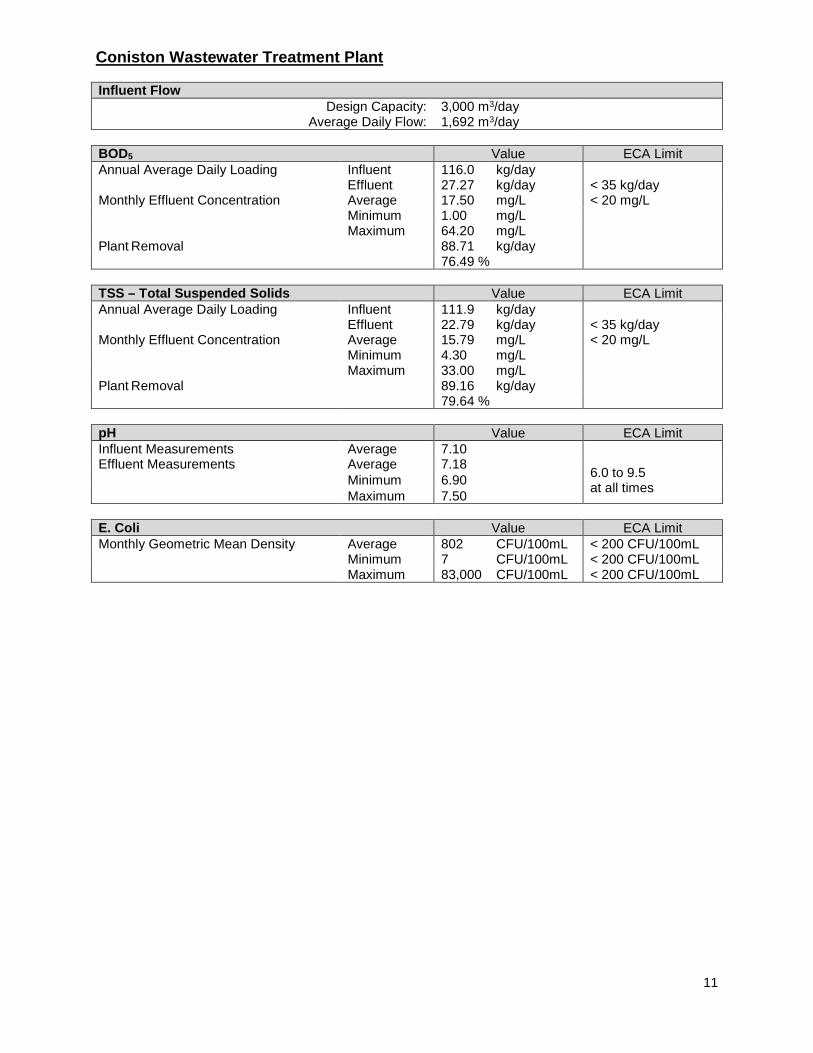
Coniston Wastewater Treatment Plant
Influent Flow Design Capacity: 3,000 m3/day
Average Daily Flow: 1,692 m3/day
BOD5 Value ECA Limit Annual Average Daily Loading Influent 116.0 kg/day
Effluent 27.27 kg/day < 35 kg/day Monthly Effluent Concentration Average 17.50 mg/L < 20 mg/L
Minimum 1.00 mg/L Maximum 64.20 mg/L
Plant Removal 88.71 kg/day 76.49 %
TSS – Total Suspended Solids Value ECA Limit Annual Average Daily Loading Influent 111.9 kg/day
Effluent 22.79 kg/day < 35 kg/day Monthly Effluent Concentration Average 15.79 mg/L < 20 mg/L
Minimum 4.30 mg/L Maximum 33.00 mg/L
Plant Removal 89.16 kg/day 79.64 %
pH Value ECA Limit Influent Measurements Average 7.10 Effluent Measurements Average 7.18
6.0 to 9.5 at all times
Minimum 6.90 Maximum 7.50
E. Coli Value ECA Limit Monthly Geometric Mean Density Average 802 CFU/100mL < 200 CFU/100mL
Minimum 7 CFU/100mL < 200 CFU/100mL Maximum 83,000 CFU/100mL < 200 CFU/100mL

12
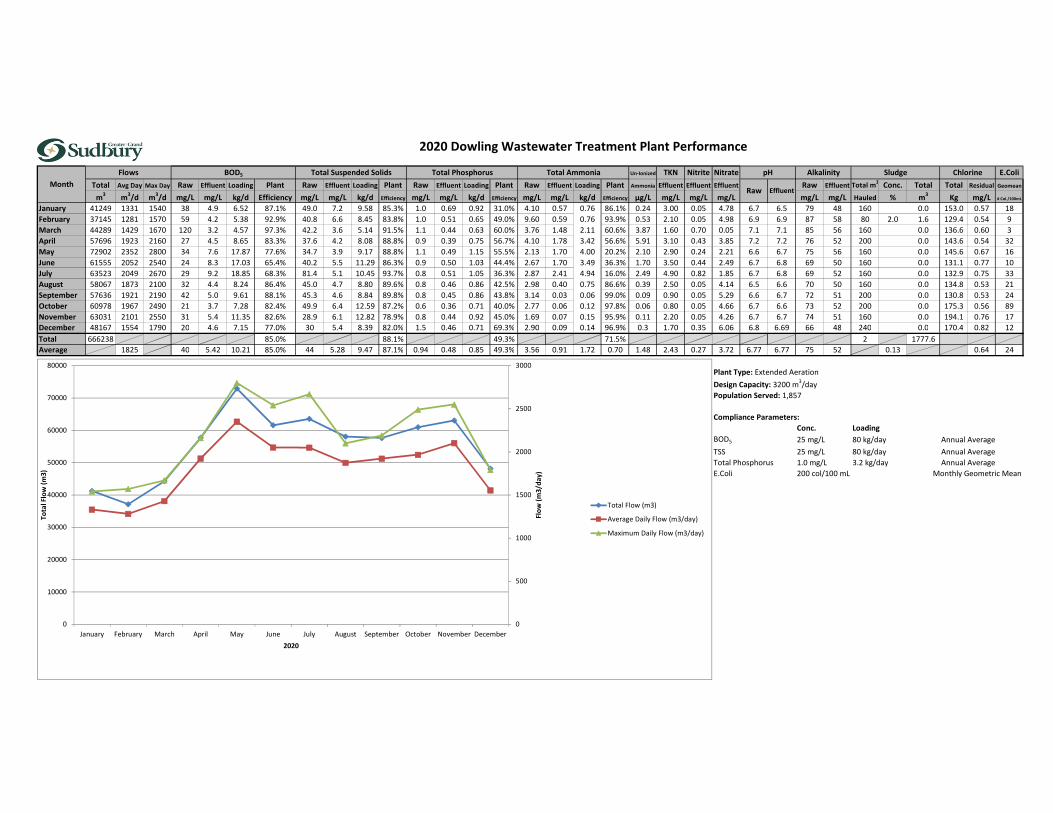
Dowling Wastewater Treatment Plant
Influent Flow Design Capacity: 3,200 m3/day
Average Daily Flow: 1,825 m3/day
CBOD5 Value ECA Limit Annual Average Daily Loading Influent 68.07 kg/day
Effluent 10.21 kg/day < 80 kg/day Monthly Effluent Concentration Average 5.42 mg/L < 25 mg/L
Minimum 3.20 mg/L Maximum 9.20 mg/L
Plant Removal 57.86 kg/day 85.00 %
TSS – Total Suspended Solids Value ECA Limit Annual Average Daily Loading Influent 79.81 kg/day
Effluent 9.47 kg/day < 80 kg/day Monthly Effluent Concentration Average 5.28 mg/L < 25 mg/L
Minimum 3.60 mg/L Maximum 7.20 mg/L
Plant Removal 70.35 kg/day 87.14 %
TP – Total Phosphorous Value ECA Limit Annual Average Daily Loading Influent 1.68 kg/day
Effluent 0.85 kg/day < 3.2 kg/day Monthly Effluent Concentration Average 0.48 mg/L < 1.0 mg/L
Minimum 0.36 mg/L Maximum 0.69 mg/L
Plant Removal 0.83 kg/day 49.31 %
pH Value ECA Limit Influent Measurements Average 6.77 Effluent Measurements Average 6.77
6.0 to 9.5 at all times
Minimum 6.50 Maximum 7.20
E. Coli Value ECA Limit Monthly Geometric Mean Density Average 24 CFU/100mL < 200 CFU/100mL
Minimum 3 CFU/100mL < 200 CFU/100mL Maximum 89 CFU/100mL < 200 CFU/100mL

13
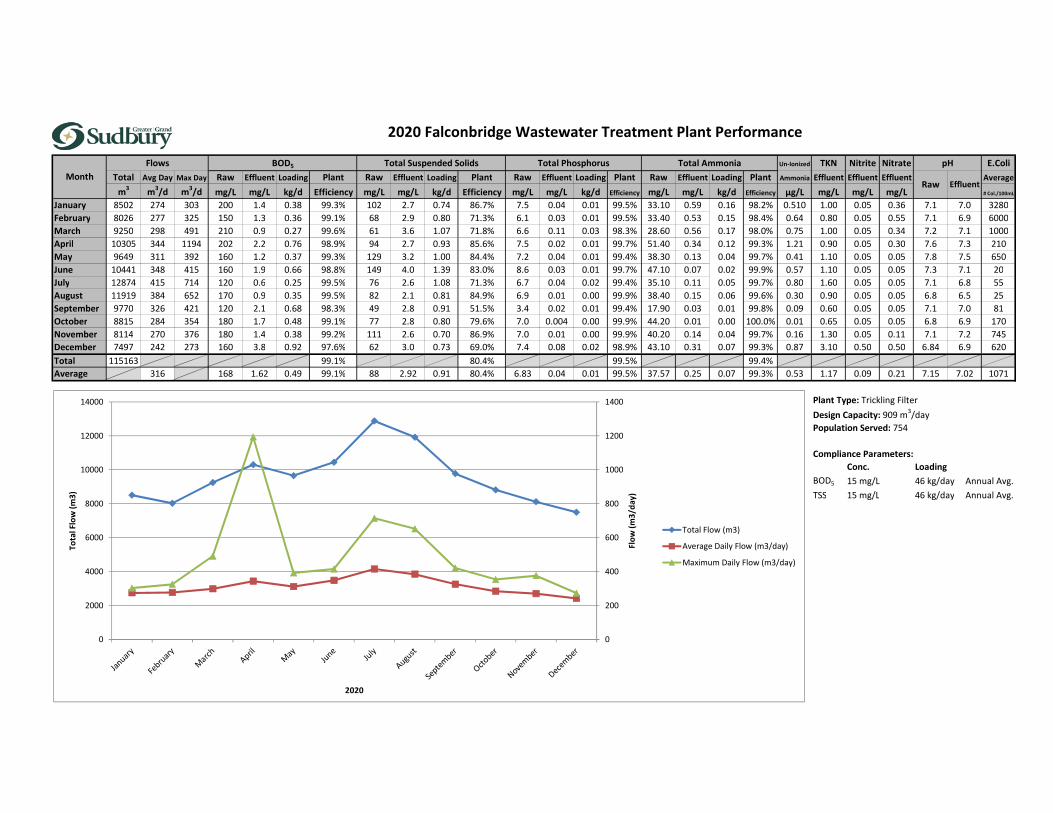
Falconbridge Wastewater Treatment Plant
Influent Flow Design Capacity: 909 m3/day
Average Daily Flow: 316 m3/day
BOD5 Value ECA Limit Annual Average Daily Loading Influent 52.23 kg/day
Effluent 0.49 kg/day < 46 kg/day Monthly Effluent Concentration Average 1.62 mg/L < 15 mg/L
Minimum 0.60 mg/L Maximum 3.80 mg/L
Plant Removal 51.74 kg/day 99.06 %
TSS – Total Suspended Solids Value ECA Limit Annual Average Daily Loading Influent 4.65 kg/day
Effluent 0.91 kg/day < 46 kg/day Monthly Effluent Concentration Average 2.92 mg/L < 15 mg/L
Minimum 2.10 mg/L Maximum 4.00 mg/L
Plant Removal 3.73 kg/day 80.36 %
14
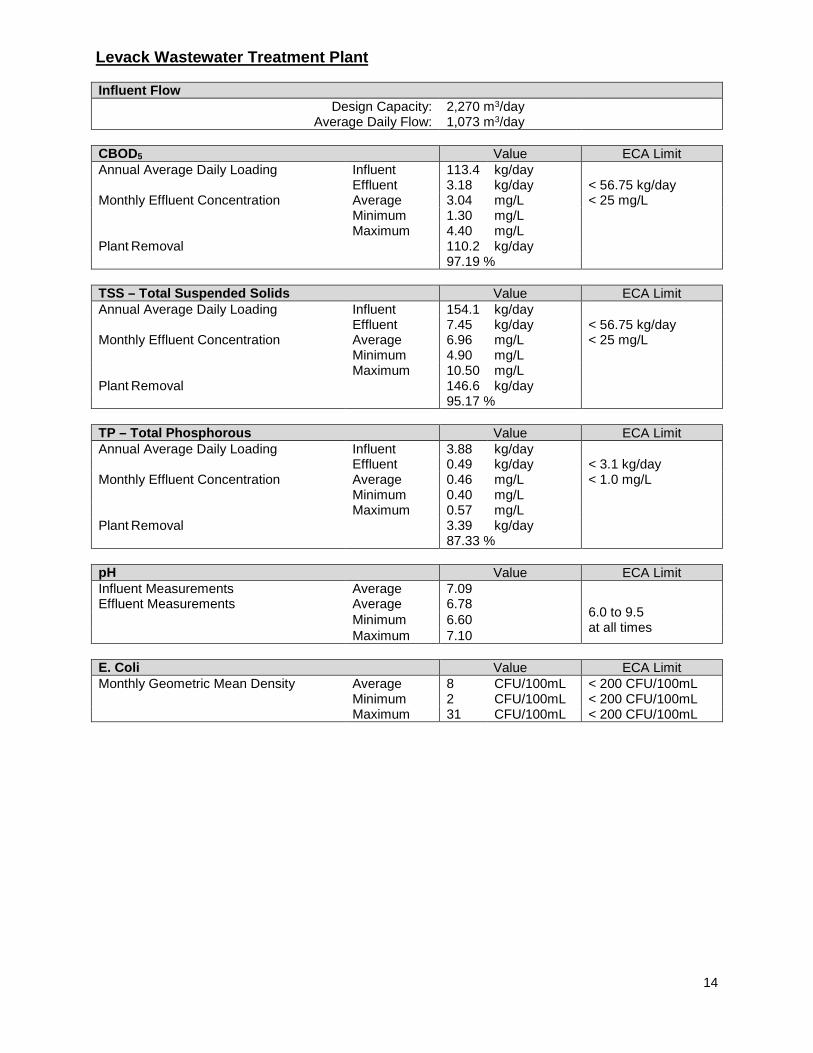
Levack Wastewater Treatment Plant
Influent Flow Design Capacity: 2,270 m3/day
Average Daily Flow: 1,073 m3/day
CBOD5 Value ECA Limit Annual Average Daily Loading Influent 113.4 kg/day
Effluent 3.18 kg/day < 56.75 kg/day Monthly Effluent Concentration Average 3.04 mg/L < 25 mg/L
Minimum 1.30 mg/L Maximum 4.40 mg/L
Plant Removal 110.2 kg/day 97.19 %
TSS – Total Suspended Solids Value ECA Limit Annual Average Daily Loading Influent 154.1 kg/day
Effluent 7.45 kg/day < 56.75 kg/day Monthly Effluent Concentration Average 6.96 mg/L < 25 mg/L
Minimum 4.90 mg/L Maximum 10.50 mg/L
Plant Removal 146.6 kg/day 95.17 %
TP – Total Phosphorous Value ECA Limit Annual Average Daily Loading Influent 3.88 kg/day
Effluent 0.49 kg/day < 3.1 kg/day Monthly Effluent Concentration Average 0.46 mg/L < 1.0 mg/L
Minimum 0.40 mg/L Maximum 0.57 mg/L
Plant Removal 3.39 kg/day 87.33 %
pH Value ECA Limit Influent Measurements Average 7.09 Effluent Measurements Average 6.78
6.0 to 9.5 at all times
Minimum 6.60 Maximum 7.10
E. Coli Value ECA Limit Monthly Geometric Mean Density Average 8 CFU/100mL < 200 CFU/100mL
Minimum 2 CFU/100mL < 200 CFU/100mL Maximum 31 CFU/100mL < 200 CFU/100mL

15
Lively Wastewater Treatment Plant
Influent Flow Design Capacity: 1,600 m3/day
Average Daily Flow: 832 m3/day
CBOD5 Value ECA Limit Annual Average Daily Loading Influent 48.11 kg/day
Effluent 2.73 kg/day < 40 kg/day Monthly Effluent Concentration Average 4.66 mg/L < 25 mg/L
Minimum 0.60 mg/L Maximum 27.00 mg/L
Plant Removal 45.38 kg/day 94.10 %
TSS – Total Suspended Solids Value ECA Limit Annual Average Daily Loading Influent 128.5 kg/day
Effluent 8.07 kg/day < 40 kg/day Monthly Effluent Concentration Average 10.72 mg/L < 25 mg/L
Minimum 2.80 mg/L Maximum 35.64 mg/L
Plant Removal 120.4 kg/day 90.10 %
TP – Total Phosphorous Value ECA Limit Annual Average Daily Loading Influent 5.14 kg/day
Effluent 0.53 kg/day < 1.6 kg/day Monthly Effluent Concentration Average 0.73 mg/L < 1.0 mg/L
Minimum 0.38 mg/L Maximum 2.48 mg/L
Plant Removal 4.62 kg/day 86.22 %
pH Value ECA Limit Influent Measurements Average 7.09 Effluent Measurements Average 7.09
6.0 to 9.5 at all times
Minimum 6.90 Maximum 7.21
E. Coli Value ECA Limit Monthly Geometric Mean Density Average 28 CFU/100mL < 200 CFU/100mL
Minimum 3 CFU/100mL < 200 CFU/100mL Maximum 155 CFU/100mL < 200 CFU/100mL
16
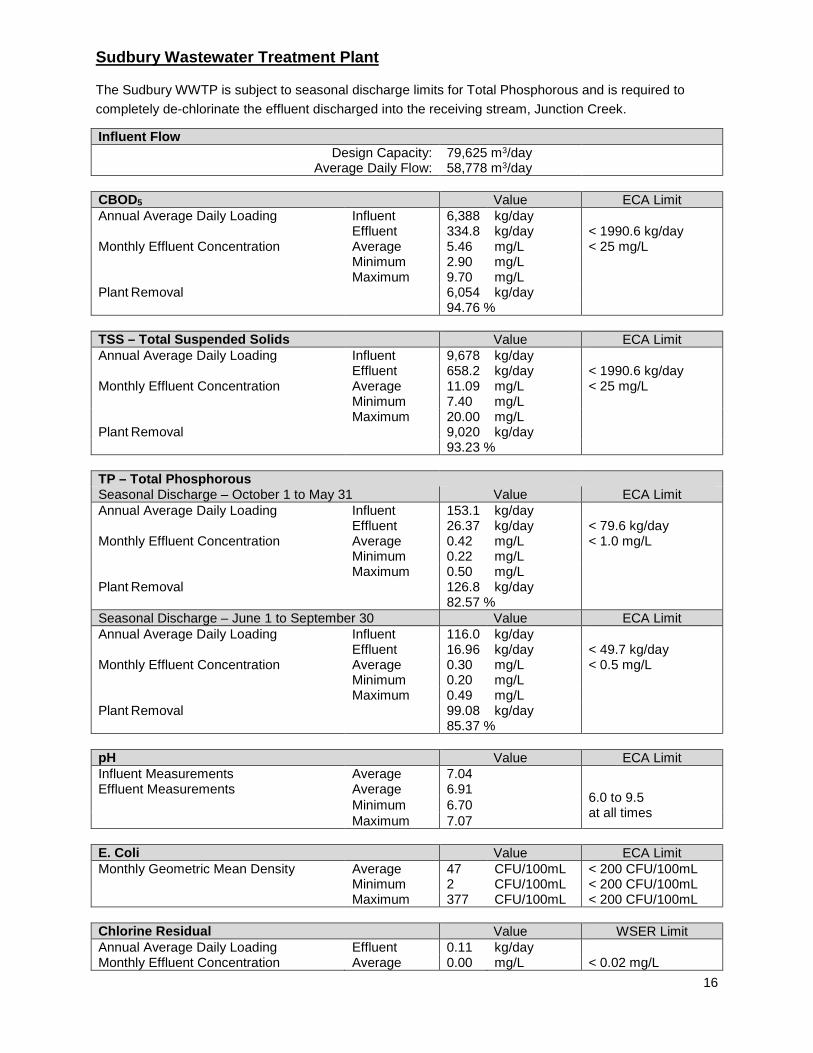
Sudbury Wastewater Treatment Plant
The Sudbury WWTP is subject to seasonal discharge limits for Total Phosphorous and is required to
completely de-chlorinate the effluent discharged into the receiving stream, Junction Creek.
Influent Flow Design Capacity: 79,625 m3/day
Average Daily Flow: 58,778 m3/day
CBOD5 Value ECA Limit Annual Average Daily Loading Influent 6,388 kg/day
Effluent 334.8 kg/day < 1990.6 kg/day Monthly Effluent Concentration Average 5.46 mg/L < 25 mg/L
Minimum 2.90 mg/L Maximum 9.70 mg/L
Plant Removal 6,054 kg/day 94.76 %
TSS – Total Suspended Solids Value ECA Limit Annual Average Daily Loading Influent 9,678 kg/day
Effluent 658.2 kg/day < 1990.6 kg/day Monthly Effluent Concentration Average 11.09 mg/L < 25 mg/L
Minimum 7.40 mg/L Maximum 20.00 mg/L
Plant Removal 9,020 kg/day 93.23 %
TP – Total Phosphorous Seasonal Discharge – October 1 to May 31 Value ECA Limit Annual Average Daily Loading Influent 153.1 kg/day
Effluent 26.37 kg/day < 79.6 kg/day Monthly Effluent Concentration Average 0.42 mg/L < 1.0 mg/L
Minimum 0.22 mg/L Maximum 0.50 mg/L
Plant Removal 126.8 kg/day 82.57 %
Seasonal Discharge – June 1 to September 30 Value ECA Limit Annual Average Daily Loading Influent 116.0 kg/day
Effluent 16.96 kg/day < 49.7 kg/day Monthly Effluent Concentration Average 0.30 mg/L < 0.5 mg/L
Minimum 0.20 mg/L Maximum 0.49 mg/L
Plant Removal 99.08 kg/day 85.37 %
pH Value ECA Limit Influent Measurements Average 7.04 Effluent Measurements Average 6.91
6.0 to 9.5 at all times
Minimum 6.70 Maximum 7.07
E. Coli Value ECA Limit Monthly Geometric Mean Density Average 47 CFU/100mL < 200 CFU/100mL
Minimum 2 CFU/100mL < 200 CFU/100mL Maximum 377 CFU/100mL < 200 CFU/100mL
Chlorine Residual Value WSER Limit Annual Average Daily Loading Effluent 0.11 kg/day Monthly Effluent Concentration Average 0.00 mg/L < 0.02 mg/L
17
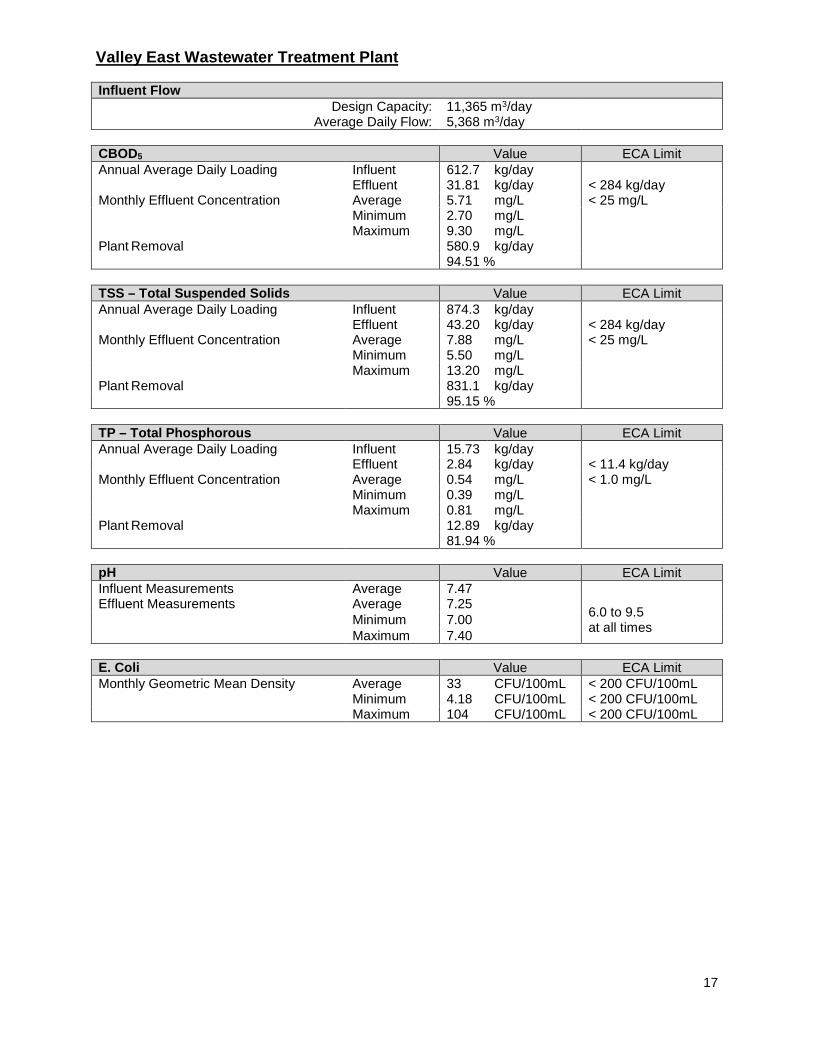
Valley East Wastewater Treatment Plant
Influent Flow Design Capacity: 11,365 m3/day
Average Daily Flow: 5,368 m3/day
CBOD5 Value ECA Limit Annual Average Daily Loading Influent 612.7 kg/day
Effluent 31.81 kg/day < 284 kg/day Monthly Effluent Concentration Average 5.71 mg/L < 25 mg/L
Minimum 2.70 mg/L Maximum 9.30 mg/L
Plant Removal 580.9 kg/day 94.51 %
TSS – Total Suspended Solids Value ECA Limit Annual Average Daily Loading Influent 874.3 kg/day
Effluent 43.20 kg/day < 284 kg/day Monthly Effluent Concentration Average 7.88 mg/L < 25 mg/L
Minimum 5.50 mg/L Maximum 13.20 mg/L
Plant Removal 831.1 kg/day 95.15 %
TP – Total Phosphorous Value ECA Limit Annual Average Daily Loading Influent 15.73 kg/day
Effluent 2.84 kg/day < 11.4 kg/day Monthly Effluent Concentration Average 0.54 mg/L < 1.0 mg/L
Minimum 0.39 mg/L Maximum 0.81 mg/L
Plant Removal 12.89 kg/day 81.94 %
pH Value ECA Limit Influent Measurements Average 7.47 Effluent Measurements Average 7.25
6.0 to 9.5 at all times
Minimum 7.00 Maximum 7.40
E. Coli Value ECA Limit Monthly Geometric Mean Density Average 33 CFU/100mL < 200 CFU/100mL
Minimum 4.18 CFU/100mL < 200 CFU/100mL Maximum 104 CFU/100mL < 200 CFU/100mL

18
Wahnapitae Lagoons
The Wahnapitae Lagoons are subject to seasonal discharge requirements. The Fall discharge period is
defined as any discharge with a minimum duration of 14 days starting not before November 1st and not
after December 15th. The Spring discharge period is defined as any discharge with a minimum duration
of 14 days starting not before March 15th and not after April 30th.
Due to the limited sampling performed at the Wahnapitae Lagoons, plant removal values are calculated
using the previous available raw (influent) sample when one is not present in the same month as an
effluent sample.
Influent FlowDesign Capacity: 1,246 m3/day
Average Daily Flow: 775 m3/day
CBOD5
Seasonal Discharge – Fall Value ECA Limit Annual Average Daily Loading Influent 24.75 kg/day
Effluent 1.20 kg/day Monthly Effluent Concentration Average 1.63 mg/L < 30 mg/L
Minimum 1.10 mg/L Maximum 2.50 mg/L
Plant Removal 23.55 kg/day 92.36 %
Seasonal Discharge – Spring Value ECA Limit Annual Average Daily Loading Influent 27.02 kg/day
Effluent 2.10 kg/day Monthly Effluent Concentration Average 2.95 mg/L < 30 mg/L
Minimum 1.67 mg/L Maximum 3.70 mg/L
Plant Removal 24.92 kg/day 92.45 %
TSS – Total Suspended Solids Seasonal Discharge – Fall Value ECA Limit Annual Average Daily Loading Influent 978.3 kg/day
Effluent 3.04 kg/day Monthly Effluent Concentration Average 4.48 mg/L < 40 mg/L
Minimum 1.20 mg/L Maximum 6.70 mg/L
Plant Removal 975.3 kg/day 97.92 %
Seasonal Discharge – Spring Value ECA Limit Annual Average Daily Loading Influent 305.2 kg/day
Effluent 6.05 kg/day Monthly Effluent Concentration Average 9.93 mg/L < 40 mg/L
Minimum 1.60 mg/L Maximum 33.15 mg/L
Plant Removal 299.1 kg/day 97.60 %
pH Value ECA Limit Effluent Measurements Average 7.25
6.0 to 9.5 at all times
Minimum 6.97 Maximum 7.97

19
Walden Wastewater Treatment Plant
Influent Flow Design Capacity: 4,500 m3/day
Average Daily Flow: 2,621 m3/day
CBOD5 Value ECA Limit Annual Average Daily Loading Influent 204.4 kg/day
Effluent 5.91 kg/day < 112.5 kg/day Monthly Effluent Concentration Average 2.15 mg/L < 25 mg/L
Minimum 0.65 mg/L Maximum 6.80 mg/L
Plant Removal 198.5 kg/day 97.29 %
TSS – Total Suspended Solids Value ECA Limit Annual Average Daily Loading Influent 184.7 kg/day
Effluent 18.83 kg/day < 112.5 kg/day Monthly Effluent Concentration Average 7.31 mg/L < 25 mg/L
Minimum 4.70 mg/L Maximum 11.50 mg/L
Plant Removal 165.9 kg/day 88.62 %
TP – Total Phosphorous Value ECA Limit Annual Average Daily Loading Influent 7.11 kg/day
Effluent 0.90 kg/day < 4.5 kg/day Monthly Effluent Concentration Average 0.34 mg/L < 1.0 mg/L
Minimum 0.23 mg/L Maximum 0.59 mg/L
Plant Removal 6.22 kg/day 87.22 %
pH Value ECA Limit Influent Measurements Average 7.79 Effluent Measurements Average 6.75
6.0 to 9.5 at all times
Minimum 6.40 Maximum 7.00
E. Coli Value ECA Limit Monthly Geometric Mean Density Average 7 CFU/100mL < 200 CFU/100mL
Minimum 0.4 CFU/100mL < 200 CFU/100mL Maximum 48 CFU/100mL < 200 CFU/100mL

20
8. Individual Plant Annual Data Reports
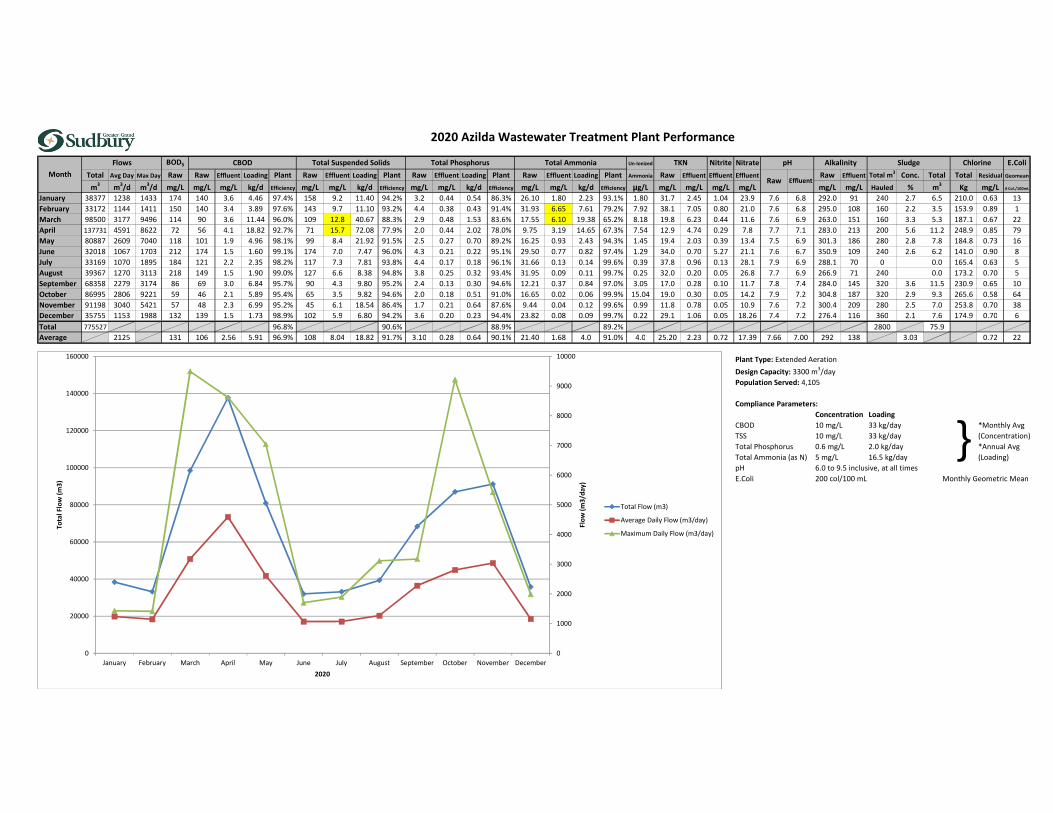
BOD5 Un-Ionized Nitrite Nitrate E.Coli
Total Avg Day Max Day Raw Raw Effluent Loading Plant Raw Effluent Loading Plant Raw Effluent Loading Plant Raw Effluent Loading Plant Ammonia Raw Effluent Effluent Effluent Raw Effluent Total m3 Conc. Total Total Residual Geomean
m3 m3/d m3/d mg/L mg/L mg/L kg/d Efficiency mg/L mg/L kg/d Efficiency mg/L mg/L kg/d Efficiency mg/L mg/L kg/d Efficiency µg/L mg/L mg/L mg/L mg/L mg/L mg/L Hauled % m3 Kg mg/L # Col./100mL
January 38377 1238 1433 174 140 3.6 4.46 97.4% 158 9.2 11.40 94.2% 3.2 0.44 0.54 86.3% 26.10 1.80 2.23 93.1% 1.80 31.7 2.45 1.04 23.9 7.6 6.8 292.0 91 240 2.7 6.5 210.0 0.63 13
February 33172 1144 1411 150 140 3.4 3.89 97.6% 143 9.7 11.10 93.2% 4.4 0.38 0.43 91.4% 31.93 6.65 7.61 79.2% 7.92 38.1 7.05 0.80 21.0 7.6 6.8 295.0 108 160 2.2 3.5 153.9 0.89 1
March 98500 3177 9496 114 90 3.6 11.44 96.0% 109 12.8 40.67 88.3% 2.9 0.48 1.53 83.6% 17.55 6.10 19.38 65.2% 8.18 19.8 6.23 0.44 11.6 7.6 6.9 263.0 151 160 3.3 5.3 187.1 0.67 22
April 137731 4591 8622 72 56 4.1 18.82 92.7% 71 15.7 72.08 77.9% 2.0 0.44 2.02 78.0% 9.75 3.19 14.65 67.3% 7.54 12.9 4.74 0.29 7.8 7.7 7.1 283.0 213 200 5.6 11.2 248.9 0.85 79
May 80887 2609 7040 118 101 1.9 4.96 98.1% 99 8.4 21.92 91.5% 2.5 0.27 0.70 89.2% 16.25 0.93 2.43 94.3% 1.45 19.4 2.03 0.39 13.4 7.5 6.9 301.3 186 280 2.8 7.8 184.8 0.73 16
June 32018 1067 1703 212 174 1.5 1.60 99.1% 174 7.0 7.47 96.0% 4.3 0.21 0.22 95.1% 29.50 0.77 0.82 97.4% 1.29 34.0 0.70 5.27 21.1 7.6 6.7 350.9 109 240 2.6 6.2 141.0 0.90 8
July 33169 1070 1895 184 121 2.2 2.35 98.2% 117 7.3 7.81 93.8% 4.4 0.17 0.18 96.1% 31.66 0.13 0.14 99.6% 0.39 37.8 0.96 0.13 28.1 7.9 6.9 288.1 70 0 0.0 165.4 0.63 5
August 39367 1270 3113 218 149 1.5 1.90 99.0% 127 6.6 8.38 94.8% 3.8 0.25 0.32 93.4% 31.95 0.09 0.11 99.7% 0.25 32.0 0.20 0.05 26.8 7.7 6.9 266.9 71 240 0.0 173.2 0.70 5
September 68358 2279 3174 86 69 3.0 6.84 95.7% 90 4.3 9.80 95.2% 2.4 0.13 0.30 94.6% 12.21 0.37 0.84 97.0% 3.05 17.0 0.28 0.10 11.7 7.8 7.4 284.0 145 320 3.6 11.5 230.9 0.65 10
October 86995 2806 9221 59 46 2.1 5.89 95.4% 65 3.5 9.82 94.6% 2.0 0.18 0.51 91.0% 16.65 0.02 0.06 99.9% 15.04 19.0 0.30 0.05 14.2 7.9 7.2 304.8 187 320 2.9 9.3 265.6 0.58 64
November 91198 3040 5421 57 48 2.3 6.99 95.2% 45 6.1 18.54 86.4% 1.7 0.21 0.64 87.6% 9.44 0.04 0.12 99.6% 0.99 11.8 0.78 0.05 10.9 7.6 7.2 300.4 209 280 2.5 7.0 253.8 0.70 38
December 35755 1153 1988 132 139 1.5 1.73 98.9% 102 5.9 6.80 94.2% 3.6 0.20 0.23 94.4% 23.82 0.08 0.09 99.7% 0.22 29.1 1.06 0.05 18.26 7.4 7.2 276.4 116 360 2.1 7.6 174.9 0.70 6
Total 775527 96.8% 90.6% 88.9% 89.2% 2800 75.9
Average 2125 131 106 2.56 5.91 96.9% 108 8.04 18.82 91.7% 3.10 0.28 0.64 90.1% 21.40 1.68 4.0 91.0% 4.0 25.20 2.23 0.72 17.39 7.66 7.00 292 138 3.03 0.72 22
Plant Type: Extended Aeration
Design Capacity: 3300 m3/day
Population Served: 4,105
Compliance Parameters:
Concentration Loading
CBOD 10 mg/L 33 kg/day *Monthly Avg
TSS 10 mg/L 33 kg/day (Concentration)
Total Phosphorus 0.6 mg/L 2.0 kg/day *Annual Avg
Total Ammonia (as N) 5 mg/L 16.5 kg/day (Loading)
pH 6.0 to 9.5 inclusive, at all times
E.Coli 200 col/100 mL Monthly Geometric Mean
}
Month
Flows Chlorine
Raw Effluent
Sludge
2020 Azilda Wastewater Treatment Plant Performance
TKN pH AlkalinityTotal Suspended Solids Total Phosphorus Total AmmoniaCBOD
0
1000
2000
3000
4000
5000
6000
7000
8000
9000
10000
0
20000
40000
60000
80000
100000
120000
140000
160000
January February March April May June July August September October November December
Flo
w (
m3
/day
)
Tota
l Flo
w (
m3
)
2020
Total Flow (m3)
Average Daily Flow (m3/day)
Maximum Daily Flow (m3/day)
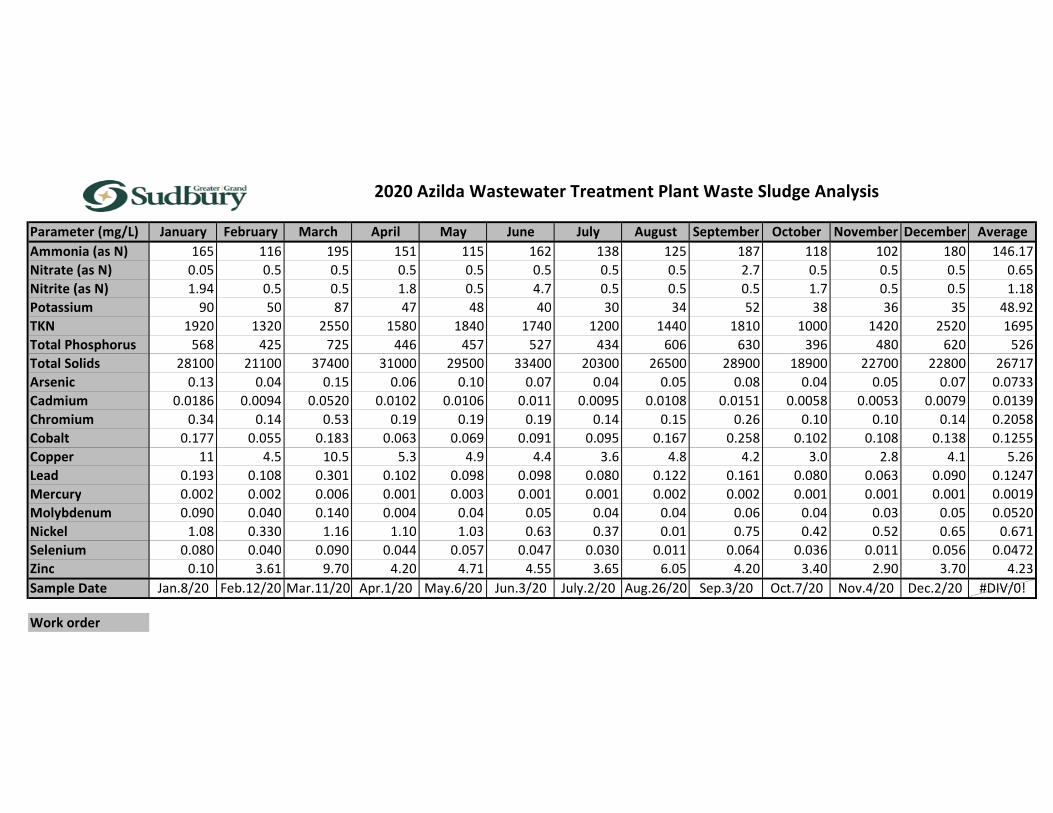
Parameter (mg/L) January February March April May June July August September October November December Average
Ammonia (as N) 165 116 195 151 115 162 138 125 187 118 102 180 146.17
Nitrate (as N) 0.05 0.5 0.5 0.5 0.5 0.5 0.5 0.5 2.7 0.5 0.5 0.5 0.65
Nitrite (as N) 1.94 0.5 0.5 1.8 0.5 4.7 0.5 0.5 0.5 1.7 0.5 0.5 1.18
Potassium 90 50 87 47 48 40 30 34 52 38 36 35 48.92
TKN 1920 1320 2550 1580 1840 1740 1200 1440 1810 1000 1420 2520 1695
Total Phosphorus 568 425 725 446 457 527 434 606 630 396 480 620 526
Total Solids 28100 21100 37400 31000 29500 33400 20300 26500 28900 18900 22700 22800 26717
Arsenic 0.13 0.04 0.15 0.06 0.10 0.07 0.04 0.05 0.08 0.04 0.05 0.07 0.0733
Cadmium 0.0186 0.0094 0.0520 0.0102 0.0106 0.011 0.0095 0.0108 0.0151 0.0058 0.0053 0.0079 0.0139
Chromium 0.34 0.14 0.53 0.19 0.19 0.19 0.14 0.15 0.26 0.10 0.10 0.14 0.2058
Cobalt 0.177 0.055 0.183 0.063 0.069 0.091 0.095 0.167 0.258 0.102 0.108 0.138 0.1255
Copper 11 4.5 10.5 5.3 4.9 4.4 3.6 4.8 4.2 3.0 2.8 4.1 5.26
Lead 0.193 0.108 0.301 0.102 0.098 0.098 0.080 0.122 0.161 0.080 0.063 0.090 0.1247
Mercury 0.002 0.002 0.006 0.001 0.003 0.001 0.001 0.002 0.002 0.001 0.001 0.001 0.0019
Molybdenum 0.090 0.040 0.140 0.004 0.04 0.05 0.04 0.04 0.06 0.04 0.03 0.05 0.0520
Nickel 1.08 0.330 1.16 1.10 1.03 0.63 0.37 0.01 0.75 0.42 0.52 0.65 0.671
Selenium 0.080 0.040 0.090 0.044 0.057 0.047 0.030 0.011 0.064 0.036 0.011 0.056 0.0472
Zinc 0.10 3.61 9.70 4.20 4.71 4.55 3.65 6.05 4.20 3.40 2.90 3.70 4.23
Sample Date Jan.8/20 Feb.12/20 Mar.11/20 Apr.1/20 May.6/20 Jun.3/20 July.2/20 Aug.26/20 Sep.3/20 Oct.7/20 Nov.4/20 Dec.2/20 #DIV/0!
Work order
2020 Azilda Wastewater Treatment Plant Waste Sludge Analysis

Un-ionized
Total Avg Day Raw Effluent Loading Raw Loading Removed Plant Raw Effluent Loading Raw Loading Removed Plant Raw Effluent Loading Raw Loading Removed Plant Raw Effluent Loading Raw Loading Removed Plant Ammonia Raw Effluent
m3 m3/d mg/L mg/L kg/d kg/day kg/day Efficiency mg/L mg/L kg/d kg/day kg/day Efficiency mg/L mg/L kg/d kg/day kg/day Efficiency mg/L mg/L kg/d kg/day kg/day Efficiency µg/L mg/L mg/L
January 61563 1986 87 40.0 79.44 173 93 54.0% 83 22.7 45.08 165 120 92.7% 2.6 2.37 4.71 5.08 0.38 7.4% 15.90 15.80 31.38 31.58 0.20 0.6% 15.69 17.5 14.6
February 53317 1839 96 37.8 69.50 176 107 60.6% 84 24.0 44.12 154 110 71.4% 2.3 2.55 4.69 4.30 -0.39 -9.0% 13.20 16.90 31.07 24.27 -6.80 -28.0% 13.33 16.2 18.2
March 72517 2339 89 40.3 94.27 208 114 54.7% 186 22.7 53.10 435 382 87.8% 3.0 2.58 6.04 7.02 0.98 14.0% 13.20 18.50 43.28 30.88 -12.40 -40.2% 17.92 18.8 18.1
April 121794 4060 83 46.0 186.75 337 150 44.6% 66 19.0 77.14 268 191 71.2% 1.6 2.12 8.61 6.50 -2.11 -32.5% 14.50 8.10 32.88 58.87 25.98 44.1% 5.37 13.5 13.7
May 116407 3755 93 24.0 90.12 349 259 74.2% 43 32.7 122.79 161 39 24.0% 1.5 0.91 3.42 5.63 2.22 39.3% 5.89 2.60 9.76 22.12 12.35 55.9% 5.41 11.4 8.2
June 81944 2731 80 22.0 60.09 219 158 72.5% 62 42.0 114.72 169 55 32.3% 1.7 1.42 3.88 4.64 0.76 16.5% 9.29 2.33 6.36 25.38 19.01 74.9% 10.37 10.5 7.0
July 102948 3321 110 21.5 71.40 365 294 80.5% 154 16.0 53.13 511 458 89.6% 2.6 1.37 4.55 8.63 4.08 47.3% 9.66 4.37 14.51 32.08 17.57 54.8% 27.00 14.1 6.9
August 89226 2878 170 30.0 86.35 489 403 82.4% 48 44.0 126.64 138 12 8.3% 1.9 1.54 4.43 5.53 1.09 19.8% 12.10 2.96 8.52 34.83 26.31 75.5% 9.77 16.5 8.3
September 99927 3331 230 17.0 56.63 766 709 92.6% 28 15.0 47.95 90 42 46.4% 1.2 1.24 3.96 3.84 -0.13 -3.3% 7.50 5.20 16.62 23.98 7.35 30.7% 16.97 9.7 8.3
October 99099 3197 63 15.0 47.95 230 182 79.1% 46 13.3 48.55 168 119 71.1% 1.3 1.01 3.69 4.75 1.06 22.3% 9.16 6.75 24.64 33.44 8.80 26.3% 22.28 12.2 9.5
November 109510 3650 86 12.0 43.80 314 270 86.0% 47 12.0 43.80 172 128 74.5% 1.6 0.87 3.19 5.91 2.73 46.1% 8.36 4.29 15.66 30.52 14.86 48.7% 15.88 12.0 6.7
December 89151 2876 69 18.0 51.77 198 147 73.9% 28 17.5 50.33 81 30 37.5% 1.4 0.99 2.85 4.03 1.18 29.3% 6.98 8.43 24.24 20.07 -4.17 -20.8% 16.41 11.4 8.7
Total 1097403 3825 2887 75.5% 2512 1685 67.1% 66 12 18.0% 368 109 29.6%
Average 3007 105 26.97 78.17 319 241 71.3% 73 23.41 68.95 209 140 58.9% 1.90 1.58 4.50 5.49 0.99 16.4% 10.48 8.02 21.58 30.67 9.09 26.9% 14.70 13.7 10.7
Lagoon Type: Exfiltration
Design Capacity: 5000 m3/day
Population Served: 3,408
Compliance Parameters:
Concentration
BOD5 30 mg/L Annual Avg
TSS 40 mg/L Annual Avg
Total Phosphorus 1.38 mg/L Annual Avg
Note: Effluent = North to South Cell Effluent
Annual Average of T.P. measured at the overflow culvert
located between the north and south cell.
2020 Capreol Wastewater Treatment Lagoon Performance
TKN
Month
Flows Total Suspended SolidsBOD5 Total Phosphorus Total Ammonia
0
500
1000
1500
2000
2500
3000
3500
4000
4500
0
20000
40000
60000
80000
100000
120000
140000
January February March April May June July August September October November DecemberFl
ow
(m
3/d
ay)
Tota
l Flo
w (
m3
)
2020
Total Flow (m3)
Average Daily Flow (m3/day)
Maximum Daily Flow (m3/day)

May/July *Nov May/July *Nov May/July *Nov May/July *Nov May/July *Nov May/July *Nov May/July *Nov
E.Coli (CFU/100 mL)
Alkalinity 77 88 145 161 14 15 81 43 72 125 10 27 19 16 63.7857
Ammonia (as N) 3.65 3.37 15.10 16.50 0.03 0.01 0.61 2.05 0.02 0.95 0.01 0.01 0.01 0.01 3.0236
Nitrate (as N) 0.05 0.05 0.05 0.05 0.05 0.05 4.68 0.09 0.13 0.05 0.05 0.05 0.05 0.05 0.3893
Nitrite (as N) 0.05 0.05 0.05 0.05 0.05 0.05 0.05 0.05 0.05 0.05 0.05 0.05 0.05 0.05 0.0500
BOD5 0.7 1.3 1.6 3.2 0.5 1.1 1.6 5.4 0.5 2.3 0.6 1.2 0.5 1.2 1.5500
D.O.C. 3.6 4.8 5.1 5.2 1.5 1.5 2.5 4.1 3.1 6.4 1.4 2.1 1.0 1.0 3.0929
Hardness (as CaCO3) 61.2 51.0 85.4 80.5 4.0 9.8 169.0 20.0 55.5 99.1 7.2 22.7 4.7 9.3 48.5286
Aluminum 0.001 0.028 0.001 0.0 0.015 0.086 0.004 0.074 0.001 0.015 0.002 0.040 0.002 0.0720 0.0247
Antimony 0.0005 0.0017 0.0005 0.0015 0.0005 0.0005 0.0005 0.0005 0.0005 0.0008 0.0005 0.0005 0.0005 0.0005 0.0007
Arsenic 0.001 0.005 0.001 0.007 0.001 0.001 0.001 0.003 0.001 0.008 0.001 0.001 0.001 0.0010 0.0024
Barium 0.018 0.032 0.048 0.065 0.001 0.006 0.012 0.005 0.017 0.039 0.002 0.009 0.001 0.0040 0.0185
Beryllium 0.0005 0.0005 0.0005 0.0005 0.0005 0.0005 0.0005 0.0005 0.0005 0.0005 0.0005 0.0005 0.0005 0.0005 0.0005
Cadmium 0.0001 0.0001 0.0001 0.0001 0.0001 0.0001 0.0001 0.0001 0.0001 0.0001 0.0001 0.0001 0.0001 0.0001 0.0001
Calcium 16.70 14.50 23.20 22.40 0.98 2.57 0.05 5.57 15.70 29.70 1.81 5.79 1.19 2.47 10.1879
Chromium 0.001 0.002 0.002 0.001 0.001 0.001 0.001 0.001 0.001 0.002 0.001 0.001 0.001 0.0010 0.0012
Cobalt 0.0010 0.0009 0.0059 0.0046 0.0001 0.0001 0.0015 0.0003 0.0003 0.0031 0.0001 0.0001 0.0001 0.0001 0.0013
Copper 0.001 0.003 0.002 0.005 0.002 0.002 0.005 0.008 0.004 0.004 0.001 0.002 0.001 0.001 0.0029
Iron 0.11 4.50 0.09 13.20 0.02 0.07 0.07 0.10 0.02 0.47 0.02 0.04 0.02 0.03 1.3400
Lead 0.0001 0.0002 0.0001 0.0005 0.0001 0.0001 0.0001 0.0001 0.0001 0.0001 0.0001 0.0001 0.0001 0.0001 0.0001
Magnesium 4.470 4.100 6.670 5.970 0.375 0.829 8.600 1.480 3.950 6.050 0.643 1.990 0.422 0.773 3.3087
Manganese 0.184 0.300 0.950 0.850 0.001 0.004 0.096 0.010 0.006 4.29 0.001 0.003 0.001 0.001 0.4784
Mercury 0.0001 0.0001 0.0001 0.0001 0.0001 0.0001 0.0001 0.0001 0.0001 0.0001 0.0001 0.0001 0.0001 0.0001 0.0001
Molybdenum 0.003 0.006 0.002 0.010 0.001 0.001 0.001 0.002 0.001 0.005 0.001 0.001 0.001 0.0010 0.0026
Nickel 0.002 0.002 0.004 0.004 0.001 0.003 0.007 0.003 0.001 0.005 0.001 0.001 0.001 0.0010 0.0026
Potassium 3.6 4.8 5.1 5.8 0.4 0.7 2.2 5.2 3.0 4.4 0.4 1.0 0.5 0.6 2.6929
Selenium 0.0003 0.0002 0.0003 0.0006 0.0002 0.0002 0.0005 0.0003 0.0002 0.0006 0.0002 0.0002 0.0002 0.0002 0.0003
Silver 0.0001 0.0001 0.0001 0.0001 0.0001 0.0001 0.0001 0.0001 0.0001 0.0001 0.0001 0.0001 0.0001 0.0001 0.0001
Sodium 41.0 47.0 49.0 48.0 4.6 6.3 43.0 51.0 42.0 49.0 1.6 3.3 3.2 3.3 28.0214
Tellurium 0.001 0.001 0.001 0.001 0.001 0.001 0.001 0.001 0.001 0.001 0.001 0.001 0.001 0.0010 0.0010
Tin 0.001 0.001 0.001 0.001 0.001 0.001 0.001 0.001 0.001 0.001 0.001 0.001 0.001 0.0010 0.0010
Zinc 0.001 0.001 0.002 0.011 0.001 0.008 3.130 0.001 0.001 0.001 0.001 0.004 0.001 0.0030 0.2261
pH 6.76 7.13 7.05 7.00 7.29 6.66 7.20 3.5064
pH (15 deg. C) 6.62 6.61 6.68 6.29 6.45 6.10 6.71
T.K.N. 4.3 4.1 16.2 14.7 0.8 0.7 1.9 2.9 1.7 1.3 1.1 0.7 0.4 1.4 3.7286
Total Phosphorus 0.480 0.890 0.299 0.241 0.009 0.023 0.110 0.800 0.051 0.215 0.039 0.052 0.018 0.022 0.2321
Work Orders 400693
May.20/20 416965
Nov.12/20
414565
*Oct.20/20
OW #16Parameter (mg/L) Average
2020 Capreol Lagoon Groundwater Monitoring Wells
OW #2 OW #3 OW #5 OW #8 OW #12a OW #15
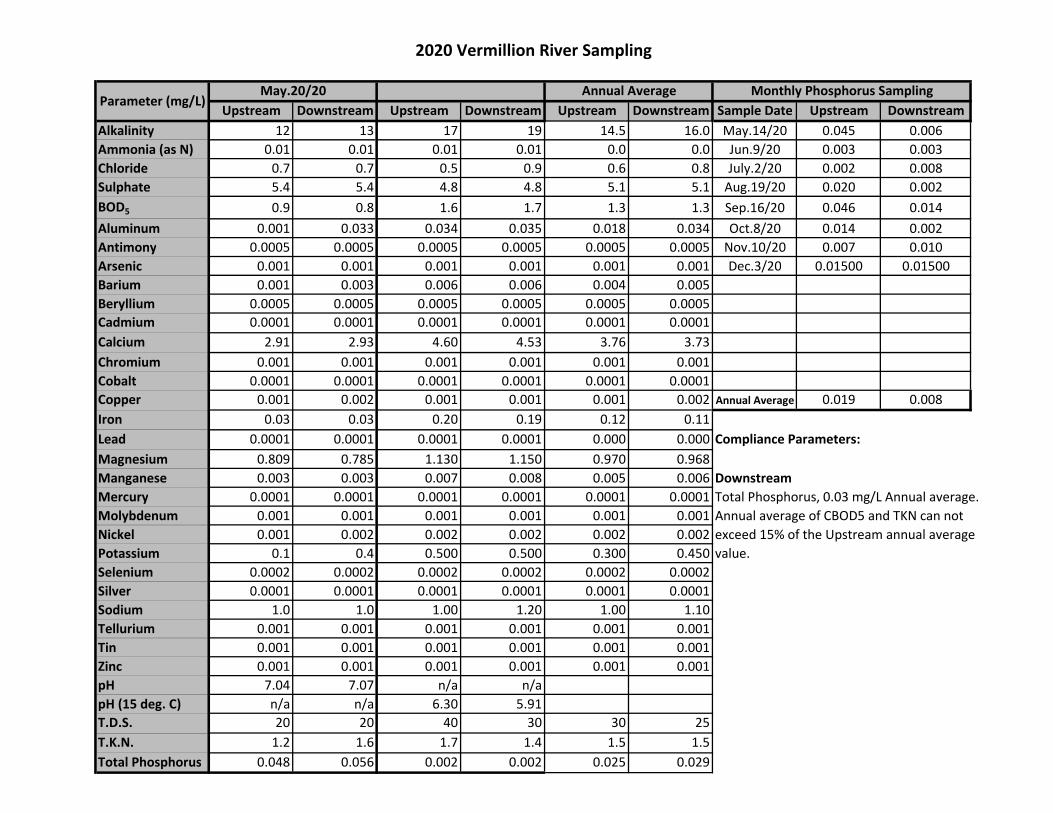
Upstream Downstream Upstream Downstream Upstream Downstream Sample Date Upstream Downstream
Alkalinity 12 13 17 19 14.5 16.0 May.14/20 0.045 0.006
Ammonia (as N) 0.01 0.01 0.01 0.01 0.0 0.0 Jun.9/20 0.003 0.003
Chloride 0.7 0.7 0.5 0.9 0.6 0.8 July.2/20 0.002 0.008
Sulphate 5.4 5.4 4.8 4.8 5.1 5.1 Aug.19/20 0.020 0.002
BOD5 0.9 0.8 1.6 1.7 1.3 1.3 Sep.16/20 0.046 0.014
Aluminum 0.001 0.033 0.034 0.035 0.018 0.034 Oct.8/20 0.014 0.002
Antimony 0.0005 0.0005 0.0005 0.0005 0.0005 0.0005 Nov.10/20 0.007 0.010
Arsenic 0.001 0.001 0.001 0.001 0.001 0.001 Dec.3/20 0.01500 0.01500
Barium 0.001 0.003 0.006 0.006 0.004 0.005
Beryllium 0.0005 0.0005 0.0005 0.0005 0.0005 0.0005
Cadmium 0.0001 0.0001 0.0001 0.0001 0.0001 0.0001
Calcium 2.91 2.93 4.60 4.53 3.76 3.73
Chromium 0.001 0.001 0.001 0.001 0.001 0.001
Cobalt 0.0001 0.0001 0.0001 0.0001 0.0001 0.0001
Copper 0.001 0.002 0.001 0.001 0.001 0.002 Annual Average 0.019 0.008
Iron 0.03 0.03 0.20 0.19 0.12 0.11
Lead 0.0001 0.0001 0.0001 0.0001 0.000 0.000 Compliance Parameters:
Magnesium 0.809 0.785 1.130 1.150 0.970 0.968
Manganese 0.003 0.003 0.007 0.008 0.005 0.006 Downstream
Mercury 0.0001 0.0001 0.0001 0.0001 0.0001 0.0001 Total Phosphorus, 0.03 mg/L Annual average.
Molybdenum 0.001 0.001 0.001 0.001 0.001 0.001 Annual average of CBOD5 and TKN can not
Nickel 0.001 0.002 0.002 0.002 0.002 0.002 exceed 15% of the Upstream annual average
Potassium 0.1 0.4 0.500 0.500 0.300 0.450 value.
Selenium 0.0002 0.0002 0.0002 0.0002 0.0002 0.0002
Silver 0.0001 0.0001 0.0001 0.0001 0.0001 0.0001
Sodium 1.0 1.0 1.00 1.20 1.00 1.10
Tellurium 0.001 0.001 0.001 0.001 0.001 0.001
Tin 0.001 0.001 0.001 0.001 0.001 0.001
Zinc 0.001 0.001 0.001 0.001 0.001 0.001
pH 7.04 7.07 n/a n/a
pH (15 deg. C) n/a n/a 6.30 5.91
T.D.S. 20 20 40 30 30 25
T.K.N. 1.2 1.6 1.7 1.4 1.5 1.5
Total Phosphorus 0.048 0.056 0.002 0.002 0.025 0.029
Parameter (mg/L)May.20/20 Monthly Phosphorus Sampling
2020 Vermillion River Sampling
Annual Average

Well I.D. Water Level (m)* Measure Date Water Level (m)* Measure Date
OW#1 2.8 May.21/20 3.5 Oct.22/20
OW#2 2.6 May.21/20 3.0 Oct.20/20
OW#3 2.3 May.21/20 3.4 Oct.20/20
OW#5 Dry May.21/20 6.5 Oct.20/20
OW#7 Depth beyond tape May.21/20 Dry Oct.22/20
OW#8 4.0 May.21/20 5.0 Oct.20/20
OW#10a 6.3 May.21/20 6.4 Oct.22/20
OW#10b 5.6 May.21/20 6.1 Oct.22/20
OW#11 5.2 May.21/20 5.4 Oct.22/20
OW#12 May.21/20
OW#12a 1.6 May.21/20 Out of Service
OW#13a 4.5 May.21/20 5.3 Oct.22/20
OW#13b 4.7 May.21/20 5.4 Oct.22/20
OW#14 Dry May.21/20 2.2 Oct.22/20
OW#15 8.7 May.21/20 6.9 Oct.20/20
OW#16 7.8 May.21/20 5.8 Oct.20/20
OW#21 Dry May.21/20 3.3 Oct.22/20
OW#22 5.1 May.21/20 Dry Oct.22/20
OW#23 6.7 May.21/20 5.8 Oct.22/20
OW#24 Dry May.21/20 2.9 Oct.22/20
OW#25 Dry May.21/20 4.4 Oct.22/20
OW#26 6.0 May.21/20 5.7 Oct.22/20
OW#28 4.8 May.21/20 2.1 Oct.22/20
OW#30 2.3 May.21/20 2.4 Oct.22/20
River @ Bridge 0.8 Oct.22/20
* Depth in metres from top of casing to water
2020 Capreol Lagoon Ground/Surface Water Levels
BOD5 Un-Ionized Nitrite Nitrate E.Coli
Total Avg Day Max Day Raw Raw Effluent Loading Plant Raw Effluent Loading Plant Raw Effluent Loading Plant Raw Effluent Loading Plant Ammonia Raw Effluent Effluent Effluent Raw Effluent Total m3 Conc. Total Geomean
m3 m3/d m3/d mg/L mg/L mg/L kg/d Efficiency mg/L mg/L kg/d Efficiency mg/L mg/L kg/d Efficiency mg/L mg/L kg/d Efficiency µg/L mg/L mg/L mg/L mg/L mg/L mg/L Hauled % m3# Col./100mL
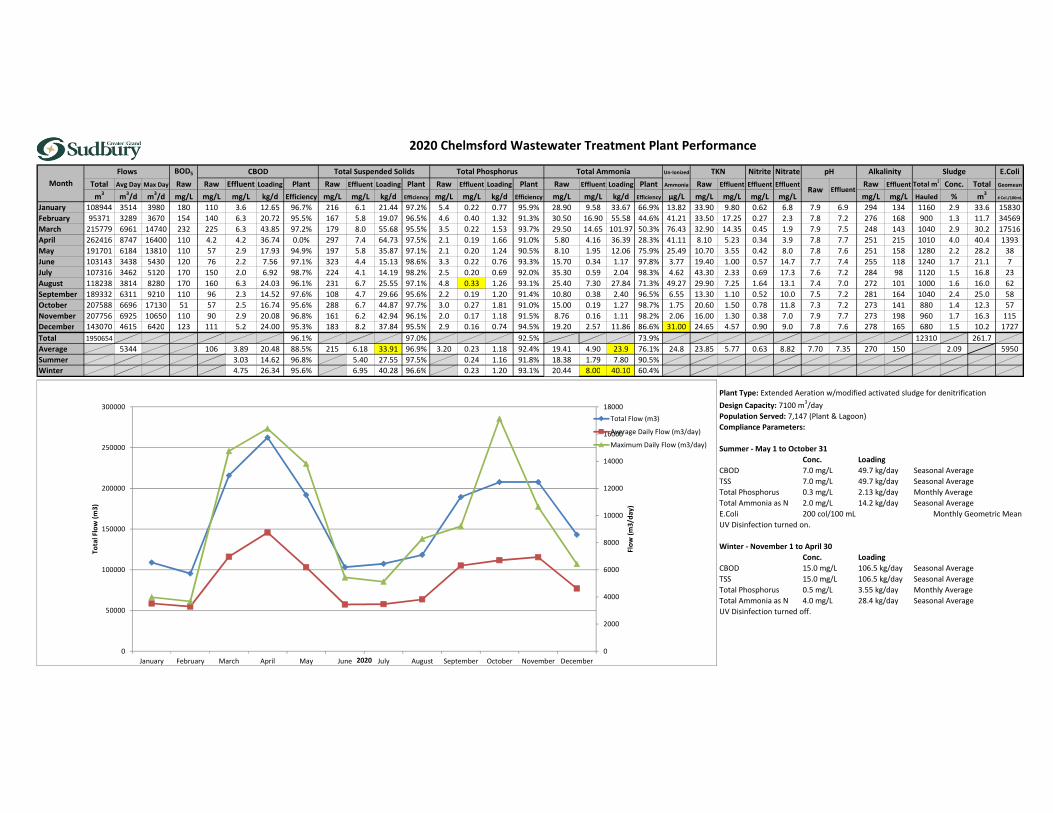
January 108944 3514 3980 180 110 3.6 12.65 96.7% 216 6.1 21.44 97.2% 5.4 0.22 0.77 95.9% 28.90 9.58 33.67 66.9% 13.82 33.90 9.80 0.62 6.8 7.9 6.9 294 134 1160 2.9 33.6 15830
February 95371 3289 3670 154 140 6.3 20.72 95.5% 167 5.8 19.07 96.5% 4.6 0.40 1.32 91.3% 30.50 16.90 55.58 44.6% 41.21 33.50 17.25 0.27 2.3 7.8 7.2 276 168 900 1.3 11.7 34569
March 215779 6961 14740 232 225 6.3 43.85 97.2% 179 8.0 55.68 95.5% 3.5 0.22 1.53 93.7% 29.50 14.65 101.97 50.3% 76.43 32.90 14.35 0.45 1.9 7.9 7.5 248 143 1040 2.9 30.2 17516
April 262416 8747 16400 110 4.2 4.2 36.74 0.0% 297 7.4 64.73 97.5% 2.1 0.19 1.66 91.0% 5.80 4.16 36.39 28.3% 41.11 8.10 5.23 0.34 3.9 7.8 7.7 251 215 1010 4.0 40.4 1393
May 191701 6184 13810 110 57 2.9 17.93 94.9% 197 5.8 35.87 97.1% 2.1 0.20 1.24 90.5% 8.10 1.95 12.06 75.9% 25.49 10.70 3.55 0.42 8.0 7.8 7.6 251 158 1280 2.2 28.2 38
June 103143 3438 5430 120 76 2.2 7.56 97.1% 323 4.4 15.13 98.6% 3.3 0.22 0.76 93.3% 15.70 0.34 1.17 97.8% 3.77 19.40 1.00 0.57 14.7 7.7 7.4 255 118 1240 1.7 21.1 7
July 107316 3462 5120 170 150 2.0 6.92 98.7% 224 4.1 14.19 98.2% 2.5 0.20 0.69 92.0% 35.30 0.59 2.04 98.3% 4.62 43.30 2.33 0.69 17.3 7.6 7.2 284 98 1120 1.5 16.8 23
August 118238 3814 8280 170 160 6.3 24.03 96.1% 231 6.7 25.55 97.1% 4.8 0.33 1.26 93.1% 25.40 7.30 27.84 71.3% 49.27 29.90 7.25 1.64 13.1 7.4 7.0 272 101 1000 1.6 16.0 62
September 189332 6311 9210 110 96 2.3 14.52 97.6% 108 4.7 29.66 95.6% 2.2 0.19 1.20 91.4% 10.80 0.38 2.40 96.5% 6.55 13.30 1.10 0.52 10.0 7.5 7.2 281 164 1040 2.4 25.0 58
October 207588 6696 17130 51 57 2.5 16.74 95.6% 288 6.7 44.87 97.7% 3.0 0.27 1.81 91.0% 15.00 0.19 1.27 98.7% 1.75 20.60 1.50 0.78 11.8 7.3 7.2 273 141 880 1.4 12.3 57
November 207756 6925 10650 110 90 2.9 20.08 96.8% 161 6.2 42.94 96.1% 2.0 0.17 1.18 91.5% 8.76 0.16 1.11 98.2% 2.06 16.00 1.30 0.38 7.0 7.9 7.7 273 198 960 1.7 16.3 115
December 143070 4615 6420 123 111 5.2 24.00 95.3% 183 8.2 37.84 95.5% 2.9 0.16 0.74 94.5% 19.20 2.57 11.86 86.6% 31.00 24.65 4.57 0.90 9.0 7.8 7.6 278 165 680 1.5 10.2 1727
Total 1950654 96.1% 97.0% 92.5% 73.9% 12310 261.7
Average 5344 106 3.89 20.48 88.5% 215 6.18 33.91 96.9% 3.20 0.23 1.18 92.4% 19.41 4.90 23.9 76.1% 24.8 23.85 5.77 0.63 8.82 7.70 7.35 270 150 2.09 5950
Summer 3.03 14.62 96.8% 5.40 27.55 97.5% 0.24 1.16 91.8% 18.38 1.79 7.80 90.5%
Winter 4.75 26.34 95.6% 6.95 40.28 96.6% 0.23 1.20 93.1% 20.44 8.00 40.10 60.4%
Plant Type: Extended Aeration w/modified activated sludge for denitrification
Design Capacity: 7100 m3/day
Population Served: 7,147 (Plant & Lagoon)
Compliance Parameters:
Summer - May 1 to October 31
Conc. Loading
CBOD 7.0 mg/L 49.7 kg/day Seasonal Average
TSS 7.0 mg/L 49.7 kg/day Seasonal Average
Total Phosphorus 0.3 mg/L 2.13 kg/day Monthly Average
Total Ammonia as N 2.0 mg/L 14.2 kg/day Seasonal Average
E.Coli 200 col/100 mL Monthly Geometric Mean
UV Disinfection turned on.
Winter - November 1 to April 30
Conc. Loading
CBOD 15.0 mg/L 106.5 kg/day Seasonal Average
TSS 15.0 mg/L 106.5 kg/day Seasonal Average
Total Phosphorus 0.5 mg/L 3.55 kg/day Monthly Average
Total Ammonia as N 4.0 mg/L 28.4 kg/day Seasonal Average
UV Disinfection turned off.
Month
Flows
Raw Effluent
2020 Chelmsford Wastewater Treatment Plant Performance
TKN pH AlkalinityCBOD Total Suspended Solids Total Phosphorus Total Ammonia Sludge
0
2000
4000
6000
8000
10000
12000
14000
16000
18000
0
50000
100000
150000
200000
250000
300000
January February March April May June July August September October November December
Flo
w (
m3/
day
)
Tota
l Flo
w (
m3)
2020
Total Flow (m3)
Average Daily Flow (m3/day)
Maximum Daily Flow (m3/day)

Parameter (mg/L) January February March April May June July August September October November December Average
Ammonia (as N) 22.3 31.9 45.6 20.2 20.9 123.0 36.2 16.0 23.1 11.3 30.6 19.4 33.4
Nitrate (as N) 0.05 0.50 0.50 0.05 0.50 0.05 0.50 0.50 0.50 0.05 0.5 0.05 0.3125
Nitrite (as N) 0.05 0.50 0.50 0.22 0.50 0.05 0.50 0.50 0.50 0.05 2.80 0.05 0.52
Potassium 34.0 28.0 47.0 60.0 26.0 37.0 24 19.0 31.0 9.0 21.0 12.0 29.0
TKN 397 800 1220 1170 497 944 929 633 1080 254 873 472 772
Total Phosphorus 119 291 164 288 153 260 239 225 367 78 308 86 215
Total Solids 7500 15900 22700 41200 13800 17500 14300 15300 25200 5660 17600 5130 16816
Arsenic 0.03 0.02 0.05 0.08 0.04 0.04 0.02 0.02 0.06 0.01 0.04 0.01 0.0350
Cadmium 0.0031 0.0039 0.0076 0.0115 0.0037 0.0062 0.0040 0.0040 0.0081 0.0012 0.0066 0.0013 0.0051
Chromium 0.08 0.10 0.25 0.34 0.10 0.13 0.10 0.10 0.22 0.02 0.14 0.03 0.1342
Cobalt 0.065 0.074 0.135 0.124 0.041 0.139 0.072 0.064 0.231 0.045 0.129 0.048 0.0973
Copper 2.10 1.80 2.20 5.00 1.90 2.80 2.5 2.50 2.0 0.71 2.70 0.77 2.25
Lead 0.042 0.049 0.087 0.161 0.052 0.080 0.077 0.095 0.131 0.019 0.085 0.020 0.0748
Mercury 0.001 0.002 0.003 0.005 0.001 0.001 0.003 0.002 0.006 0.001 0.002 0.001 0.0023
Molybdenum 0.02 0.02 0.04 0.02 0.01 0.03 0.02 0.02 0.04 0.01 0.02 0.01 0.0217
Nickel 0.29 0.26 0.68 2.80 0.89 0.62 0.29 0.01 0.87 0.17 1.19 0.27 0.70
Selenium 0.015 0.013 0.021 0.039 0.018 0.028 0.015 0.002 0.029 0.005 0.004 0.003 0.0160
Zinc 1.79 1.68 3.68 4.35 1.68 2.67 2.19 2.49 4.66 0.70 2.76 0.70 2.45
Sample Date Jan.8/20 Feb.5/20 Mar.4/20 Apr.1/20 May.6/20 Jun.3/20 Jul.1/20 Aug.14/20 Sep.2/20 Oct.7/20 Nov.4/20 Dec.2/20 #DIV/0!
Work Order 395135
2020 Chelmsford Wastewater Treatment Plant Waste Sludge Analysis
Total Avg Day Raw Effluent Loading Raw Effluent Loading Raw Effluent Loading Effluent Loading Raw Effluent
m3 m3/d mg/L mg/L kg/d mg/L mg/L kg/d mg/L mg/L kg/d mg/L kg/d mg/L mg/L
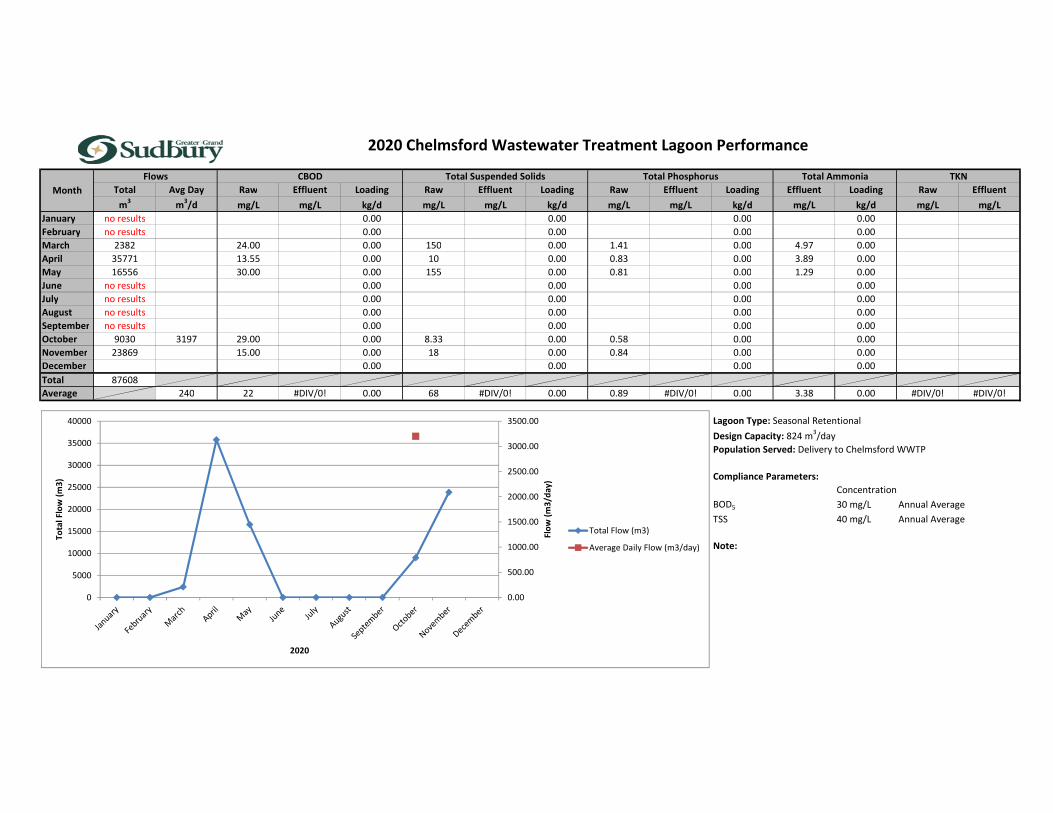
January no results 0.00 0.00 0.00 0.00
February no results 0.00 0.00 0.00 0.00
March 2382 24.00 0.00 150 0.00 1.41 0.00 4.97 0.00
April 35771 13.55 0.00 10 0.00 0.83 0.00 3.89 0.00
May 16556 30.00 0.00 155 0.00 0.81 0.00 1.29 0.00
June no results 0.00 0.00 0.00 0.00
July no results 0.00 0.00 0.00 0.00
August no results 0.00 0.00 0.00 0.00
September no results 0.00 0.00 0.00 0.00
October 9030 3197 29.00 0.00 8.33 0.00 0.58 0.00 0.00
November 23869 15.00 0.00 18 0.00 0.84 0.00 0.00
December 0.00 0.00 0.00 0.00
Total 87608
Average 240 22 #DIV/0! 0.00 68 #DIV/0! 0.00 0.89 #DIV/0! 0.00 3.38 0.00 #DIV/0! #DIV/0!
Lagoon Type: Seasonal Retentional
Design Capacity: 824 m3/day
Population Served: Delivery to Chelmsford WWTP
Compliance Parameters:
Concentration
BOD5 30 mg/L Annual Average
TSS 40 mg/L Annual Average
Note:
2020 Chelmsford Wastewater Treatment Lagoon Performance
TKNTotal Ammonia
Month
Flows CBOD Total Suspended Solids Total Phosphorus
0.00
500.00
1000.00
1500.00
2000.00
2500.00
3000.00
3500.00
0
5000
10000
15000
20000
25000
30000
35000
40000
Flo
w (
m3
/day
)
Tota
l Flo
w (
m3
)
2020
Total Flow (m3)
Average Daily Flow (m3/day)

Un-Ionized TKN Nitrite Nitrate E.Coli
Total Avg Day Max Day Raw Effluent Loading Plant Raw Effluent Loading Plant Raw Effluent Loading Plant Raw Effluent Loading Plant Ammonia Effluent Effluent Effluent Raw Effluent Total m3 Conc. Total Total Residual Geomean
m3
m3/d m
3/d mg/L mg/L kg/d Efficiency mg/L mg/L kg/d Efficiency mg/L mg/L kg/d Efficiency mg/L mg/L kg/d Efficiency µg/L mg/L mg/L mg/L mg/L mg/L Hauled % m
3Kg mg/L # Col./100mL
January 25474 822 1264 140 25.0 20.54 82.1% 75 18.8 15.45 74.9% 7.0 3.37 2.77 51.9% 20.20 18.00 14.79 10.9% 54.6 18.50 0.05 0.05 7.0 6.9 173 165 160 2.7 4.3 39.1 0.76 7280
February 21195 731 1230 100 28.0 20.46 72.0% 95 33.0 24.12 65.3% 4.1 3.10 2.27 24.4% 101.70 18.90 13.81 81.4% 32.0 21.20 0.05 0.05 7.0 7.0 167 161 80 0.0 29.9 0.74 83000
March 70356 2270 5770 84 18.0 40.85 78.6% 46 13.0 29.50 71.7% 3.9 1.52 3.45 61.3% 21.30 18.80 42.67 11.7% 46.4 20.10 0.05 0.07 7.1 7.2 159 135 160 0.5 0.8 60.6 0.82 1000
April 85869 2862 5923 28 14.9 42.65 46.8% 67 7.3 20.89 89.1% 1.7 0.72 2.06 57.6% 5.20 4.11 11.76 21.0% 11.1 6.45 1.58 0.25 7.3 7.3 145 127 120 0.4 0.5 73.4 0.73 35500
May 68015 2194 3970 39 5.4 11.85 86.2% 57 7.0 15.36 87.7% 1.5 1.17 2.57 22.0% 8.88 7.88 17.29 11.3% 35.0 9.50 0.50 0.50 7.6 7.4 182 152 160 0.5 0.8 59.5 0.80 780
June 34953 1165 1781 58 3.4 3.96 94.1% 87 29.6 34.49 66.0% 3.4 3.24 3.77 4.7% 15.20 11.40 13.28 25.0% 93.5 10.10 2.37 0.69 7.4 7.2 201 169 0 0.2 0.0 49.3 0.93 120
July 43015 1388 3807 34 64.2 89.08 -88.8% 70 30.5 42.32 56.4% 3.3 2.99 4.15 9.4% 18.60 20.80 28.86 -11.8% 307.7 21.50 0.05 0.05 7.2 7.2 244 175 40 1.0 0.4 89.1 1.04 1190
August 44245 1427 2949 20 1.0 1.43 95.0% 33 13.1 18.70 60.3% 2.2 3.04 4.34 -38.2% 11.70 12.50 17.84 -6.8% 38.99 14.40 0.05 0.05 7.1 7.5 251 163 0 0.0 92.7 0.70 1220
September 58446 1948 3374 100 18.0 35.07 82.0% 72 12.3 23.96 82.9% 2.3 1.50 2.92 34.8% 9.26 8.56 16.68 7.6% 87.11 8.10 0.05 0.05 7.0 7.2 149 161 80 0.1 0.1 92.5 0.94 7
October 67746 2185 6273 120 12.6 27.54 89.5% 77 12.4 27.10 83.9% 2.7 1.95 4.26 28.0% 10.50 14.00 30.59 -33.3% 78.3 13.80 0.05 0.05 6.6 7.0 184 170 120 2.9 3.5 79.1 0.80 180
November 58990 1966 3834 90 13.0 25.56 85.6% 70 8.2 16.12 88.3% 2.5 1.13 2.22 54.3% 7.44 7.14 14.04 4.0% 39.0 8.30 0.05 0.51 7.0 7.2 154 152 240 0.4 1.0 65.9 0.90 644
December 39456 1273 2301 55 6.5 8.27 88.2% 78 4.3 5.47 94.5% 2.6 1.30 1.65 50.0% 14.30 12.80 16.29 10.5% 186.6 15.30 1.17 0.91 6.9 7.1 157 143 320 1 3.2 39.6 0.86 30
Total 617760 9.7 770.7
Average 1692 72 17.50 27.27 76.5% 69 15.79 22.79 79.6% 3.10 2.09 3.04 35.0% 20.36 12.91 19.83 0.11 84.19 13.94 0.50 0.27 7.10 7.18 181 156 1.21 0.84 802
Plant Type: Extended Aeration
Design Capacity: 3000 m3/day
Population Served: 2,090
Compliance Parameters:
Conc. Loading
BOD5 20 mg/L 35 kg/day *
TSS 20 mg/L 35 kg/day *
E.Coli 200 col/100 mL Annual Geometric Mean
* Average of any 12 consecutive month period.
Month
Flows BOD5 Total Suspended Solids Total Phosphorus Chlorine
Raw Effluent
2020 Coniston Wastewater Treatment Plant Performance
pH AlkalinityTotal Ammonia Sludge
0
1000
2000
3000
4000
5000
6000
7000
0
10000
20000
30000
40000
50000
60000
70000
80000
90000
100000
January February March April May June July August September October November December
Flo
w (m
3/d
ay)
To
tal F
low
(m
3)
2020
Total Flow (m3)
Average Daily Flow (m3/day)
Maximum Daily Flow (m3/day)
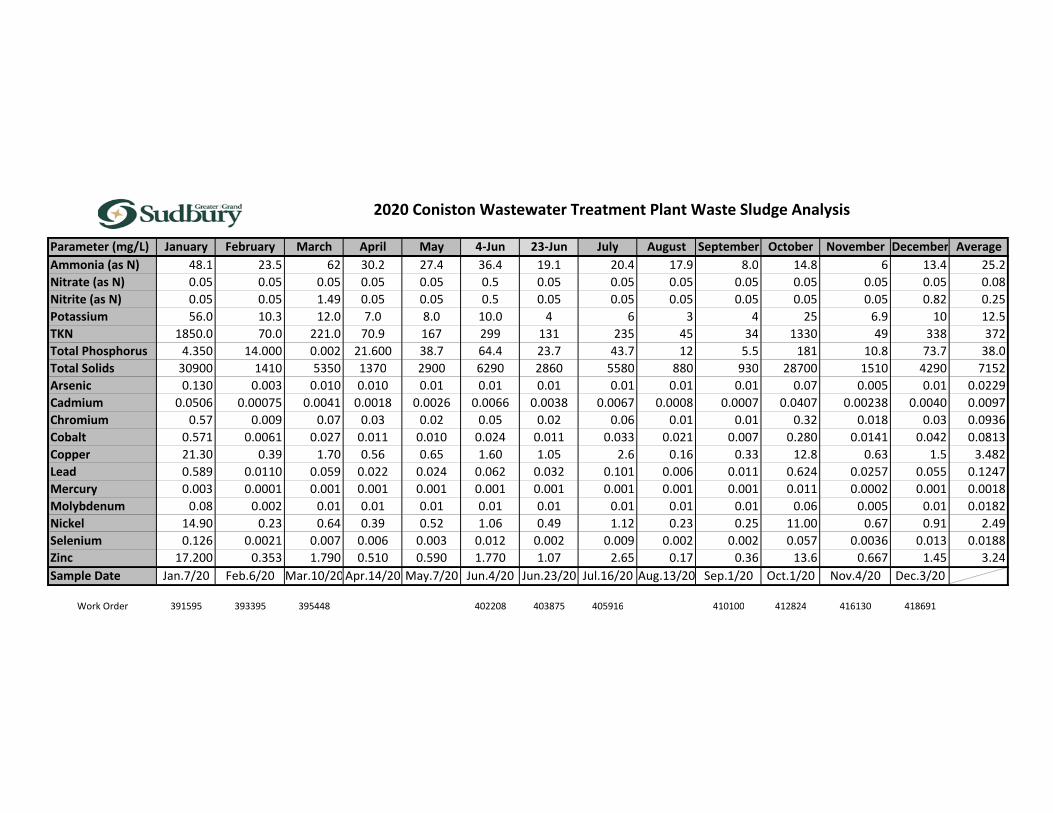
Parameter (mg/L) January February March April May 4-Jun 23-Jun July August September October November December Average
Ammonia (as N) 48.1 23.5 62 30.2 27.4 36.4 19.1 20.4 17.9 8.0 14.8 6 13.4 25.2
Nitrate (as N) 0.05 0.05 0.05 0.05 0.05 0.5 0.05 0.05 0.05 0.05 0.05 0.05 0.05 0.08
Nitrite (as N) 0.05 0.05 1.49 0.05 0.05 0.5 0.05 0.05 0.05 0.05 0.05 0.05 0.82 0.25
Potassium 56.0 10.3 12.0 7.0 8.0 10.0 4 6 3 4 25 6.9 10 12.5
TKN 1850.0 70.0 221.0 70.9 167 299 131 235 45 34 1330 49 338 372
Total Phosphorus 4.350 14.000 0.002 21.600 38.7 64.4 23.7 43.7 12 5.5 181 10.8 73.7 38.0
Total Solids 30900 1410 5350 1370 2900 6290 2860 5580 880 930 28700 1510 4290 7152
Arsenic 0.130 0.003 0.010 0.010 0.01 0.01 0.01 0.01 0.01 0.01 0.07 0.005 0.01 0.0229
Cadmium 0.0506 0.00075 0.0041 0.0018 0.0026 0.0066 0.0038 0.0067 0.0008 0.0007 0.0407 0.00238 0.0040 0.0097
Chromium 0.57 0.009 0.07 0.03 0.02 0.05 0.02 0.06 0.01 0.01 0.32 0.018 0.03 0.0936
Cobalt 0.571 0.0061 0.027 0.011 0.010 0.024 0.011 0.033 0.021 0.007 0.280 0.0141 0.042 0.0813
Copper 21.30 0.39 1.70 0.56 0.65 1.60 1.05 2.6 0.16 0.33 12.8 0.63 1.5 3.482
Lead 0.589 0.0110 0.059 0.022 0.024 0.062 0.032 0.101 0.006 0.011 0.624 0.0257 0.055 0.1247
Mercury 0.003 0.0001 0.001 0.001 0.001 0.001 0.001 0.001 0.001 0.001 0.011 0.0002 0.001 0.0018
Molybdenum 0.08 0.002 0.01 0.01 0.01 0.01 0.01 0.01 0.01 0.01 0.06 0.005 0.01 0.0182
Nickel 14.90 0.23 0.64 0.39 0.52 1.06 0.49 1.12 0.23 0.25 11.00 0.67 0.91 2.49
Selenium 0.126 0.0021 0.007 0.006 0.003 0.012 0.002 0.009 0.002 0.002 0.057 0.0036 0.013 0.0188
Zinc 17.200 0.353 1.790 0.510 0.590 1.770 1.07 2.65 0.17 0.36 13.6 0.667 1.45 3.24
Sample Date Jan.7/20 Feb.6/20 Mar.10/20 Apr.14/20 May.7/20 Jun.4/20 Jun.23/20 Jul.16/20 Aug.13/20 Sep.1/20 Oct.1/20 Nov.4/20 Dec.3/20
Work Order 391595 393395 395448 402208 403875 405916 410100 412824 416130 418691
2020 Coniston Wastewater Treatment Plant Waste Sludge Analysis
Un-Ionized TKN Nitrite Nitrate E.Coli
Total Avg Day Max Day Raw Effluent Loading Plant Raw Effluent Loading Plant Raw Effluent Loading Plant Raw Effluent Loading Plant Ammonia Effluent Effluent Effluent Raw Effluent Total m3 Conc. Total Total Residual Geomean
m3 m3/d m3/d mg/L mg/L kg/d Efficiency mg/L mg/L kg/d Efficiency mg/L mg/L kg/d Efficiency mg/L mg/L kg/d Efficiency µg/L mg/L mg/L mg/L mg/L mg/L Hauled % m3 Kg mg/L # Col./100mL
January 41249 1331 1540 38 4.9 6.52 87.1% 49.0 7.2 9.58 85.3% 1.0 0.69 0.92 31.0% 4.10 0.57 0.76 86.1% 0.24 3.00 0.05 4.78 6.7 6.5 79 48 160 0.0 153.0 0.57 18
February 37145 1281 1570 59 4.2 5.38 92.9% 40.8 6.6 8.45 83.8% 1.0 0.51 0.65 49.0% 9.60 0.59 0.76 93.9% 0.53 2.10 0.05 4.98 6.9 6.9 87 58 80 2.0 1.6 129.4 0.54 9
March 44289 1429 1670 120 3.2 4.57 97.3% 42.2 3.6 5.14 91.5% 1.1 0.44 0.63 60.0% 3.76 1.48 2.11 60.6% 3.87 1.60 0.70 0.05 7.1 7.1 85 56 160 0.0 136.6 0.60 3
April 57696 1923 2160 27 4.5 8.65 83.3% 37.6 4.2 8.08 88.8% 0.9 0.39 0.75 56.7% 4.10 1.78 3.42 56.6% 5.91 3.10 0.43 3.85 7.2 7.2 76 52 200 0.0 143.6 0.54 32
May 72902 2352 2800 34 7.6 17.87 77.6% 34.7 3.9 9.17 88.8% 1.1 0.49 1.15 55.5% 2.13 1.70 4.00 20.2% 2.10 2.90 0.24 2.21 6.6 6.7 75 56 160 0.0 145.6 0.67 16
June 61555 2052 2540 24 8.3 17.03 65.4% 40.2 5.5 11.29 86.3% 0.9 0.50 1.03 44.4% 2.67 1.70 3.49 36.3% 1.70 3.50 0.44 2.49 6.7 6.8 69 50 160 0.0 131.1 0.77 10
July 63523 2049 2670 29 9.2 18.85 68.3% 81.4 5.1 10.45 93.7% 0.8 0.51 1.05 36.3% 2.87 2.41 4.94 16.0% 2.49 4.90 0.82 1.85 6.7 6.8 69 52 160 0.0 132.9 0.75 33
August 58067 1873 2100 32 4.4 8.24 86.4% 45.0 4.7 8.80 89.6% 0.8 0.46 0.86 42.5% 2.98 0.40 0.75 86.6% 0.39 2.50 0.05 4.14 6.5 6.6 70 50 160 0.0 134.8 0.53 21
September 57636 1921 2190 42 5.0 9.61 88.1% 45.3 4.6 8.84 89.8% 0.8 0.45 0.86 43.8% 3.14 0.03 0.06 99.0% 0.09 0.90 0.05 5.29 6.6 6.7 72 51 200 0.0 130.8 0.53 24
October 60978 1967 2490 21 3.7 7.28 82.4% 49.9 6.4 12.59 87.2% 0.6 0.36 0.71 40.0% 2.77 0.06 0.12 97.8% 0.06 0.80 0.05 4.66 6.7 6.6 73 52 200 0.0 175.3 0.56 89
November 63031 2101 2550 31 5.4 11.35 82.6% 28.9 6.1 12.82 78.9% 0.8 0.44 0.92 45.0% 1.69 0.07 0.15 95.9% 0.11 2.20 0.05 4.26 6.7 6.7 74 51 160 0.0 194.1 0.76 17
December 48167 1554 1790 20 4.6 7.15 77.0% 30 5.4 8.39 82.0% 1.5 0.46 0.71 69.3% 2.90 0.09 0.14 96.9% 0.3 1.70 0.35 6.06 6.8 6.69 66 48 240 0.0 170.4 0.82 12
Total 666238 85.0% 88.1% 49.3% 71.5% 2 1777.6
Average 1825 40 5.42 10.21 85.0% 44 5.28 9.47 87.1% 0.94 0.48 0.85 49.3% 3.56 0.91 1.72 0.70 1.48 2.43 0.27 3.72 6.77 6.77 75 52 0.13 0.64 24
Plant Type: Extended Aeration
Design Capacity: 3200 m3/day
Population Served: 1,857
Compliance Parameters:
Conc. Loading
BOD5 25 mg/L 80 kg/day Annual Average
TSS 25 mg/L 80 kg/day Annual Average
Total Phosphorus 1.0 mg/L 3.2 kg/day Annual Average
E.Coli 200 col/100 mL Monthly Geometric Mean
Chlorine
Raw Effluent
2020 Dowling Wastewater Treatment Plant Performance
pH AlkalinityTotal Ammonia Sludge
Month
Flows BOD5 Total Suspended Solids Total Phosphorus
0
500
1000
1500
2000
2500
3000
0
10000
20000
30000
40000
50000
60000
70000
80000
January February March April May June July August September October November December
Flo
w (
m3
/da
y)
Tota
l Flo
w (
m3)
2020
Total Flow (m3)
Average Daily Flow (m3/day)
Maximum Daily Flow (m3/day)
Un-Ionized TKN Nitrite Nitrate E.Coli
Total Avg Day Max Day Raw Effluent Loading Plant Raw Effluent Loading Plant Raw Effluent Loading Plant Raw Effluent Loading Plant Ammonia Effluent Effluent Effluent Average
m3 m3/d m3/d mg/L mg/L kg/d Efficiency mg/L mg/L kg/d Efficiency mg/L mg/L kg/d Efficiency mg/L mg/L kg/d Efficiency µg/L mg/L mg/L mg/L # Col./100mL
January 8502 274 303 200 1.4 0.38 99.3% 102 2.7 0.74 86.7% 7.5 0.04 0.01 99.5% 33.10 0.59 0.16 98.2% 0.510 1.00 0.05 0.36 7.1 7.0 3280
February 8026 277 325 150 1.3 0.36 99.1% 68 2.9 0.80 71.3% 6.1 0.03 0.01 99.5% 33.40 0.53 0.15 98.4% 0.64 0.80 0.05 0.55 7.1 6.9 6000
March 9250 298 491 210 0.9 0.27 99.6% 61 3.6 1.07 71.8% 6.6 0.11 0.03 98.3% 28.60 0.56 0.17 98.0% 0.75 1.00 0.05 0.34 7.2 7.1 1000
April 10305 344 1194 202 2.2 0.76 98.9% 94 2.7 0.93 85.6% 7.5 0.02 0.01 99.7% 51.40 0.34 0.12 99.3% 1.21 0.90 0.05 0.30 7.6 7.3 210
May 9649 311 392 160 1.2 0.37 99.3% 129 3.2 1.00 84.4% 7.2 0.04 0.01 99.4% 38.30 0.13 0.04 99.7% 0.41 1.10 0.05 0.05 7.8 7.5 650
June 10441 348 415 160 1.9 0.66 98.8% 149 4.0 1.39 83.0% 8.6 0.03 0.01 99.7% 47.10 0.07 0.02 99.9% 0.57 1.10 0.05 0.05 7.3 7.1 20
July 12874 415 714 120 0.6 0.25 99.5% 76 2.6 1.08 71.3% 6.7 0.04 0.02 99.4% 35.10 0.11 0.05 99.7% 0.80 1.60 0.05 0.05 7.1 6.8 55
August 11919 384 652 170 0.9 0.35 99.5% 82 2.1 0.81 84.9% 6.9 0.01 0.00 99.9% 38.40 0.15 0.06 99.6% 0.30 0.90 0.05 0.05 6.8 6.5 25
September 9770 326 421 120 2.1 0.68 98.3% 49 2.8 0.91 51.5% 3.4 0.02 0.01 99.4% 17.90 0.03 0.01 99.8% 0.09 0.60 0.05 0.05 7.1 7.0 81
October 8815 284 354 180 1.7 0.48 99.1% 77 2.8 0.80 79.6% 7.0 0.004 0.00 99.9% 44.20 0.01 0.00 100.0% 0.01 0.65 0.05 0.05 6.8 6.9 170
November 8114 270 376 180 1.4 0.38 99.2% 111 2.6 0.70 86.9% 7.0 0.01 0.00 99.9% 40.20 0.14 0.04 99.7% 0.16 1.30 0.05 0.11 7.1 7.2 745
December 7497 242 273 160 3.8 0.92 97.6% 62 3.0 0.73 69.0% 7.4 0.08 0.02 98.9% 43.10 0.31 0.07 99.3% 0.87 3.10 0.50 0.50 6.84 6.9 620
Total 115163 99.1% 80.4% 99.5% 99.4%
Average 316 168 1.62 0.49 99.1% 88 2.92 0.91 80.4% 6.83 0.04 0.01 99.5% 37.57 0.25 0.07 99.3% 0.53 1.17 0.09 0.21 7.15 7.02 1071
Plant Type: Trickling Filter
Design Capacity: 909 m3/day
Population Served: 754
Compliance Parameters:
Conc. Loading
BOD5 15 mg/L 46 kg/day Annual Avg.
TSS 15 mg/L 46 kg/day Annual Avg.
2020 Falconbridge Wastewater Treatment Plant Performance
Month
Flows BOD5 Total Suspended Solids Total Phosphorus Total Ammonia pH
Raw Effluent
0
200
400
600
800
1000
1200
1400
0
2000
4000
6000
8000
10000
12000
14000
Flo
w (
m3
/day
)
Tota
l Flo
w (
m3
)
2020
Total Flow (m3)
Average Daily Flow (m3/day)
Maximum Daily Flow (m3/day)

Un-Ionized Nitrite Nitrate E.Coli
Total Avg Day Max Day Raw Effluent Loading Plant Raw Effluent Loading Plant Raw Effluent Loading Plant Raw Effluent Loading Plant Ammonia Raw Effluent Effluent Effluent Raw Effluent Total m3 Conc. Total Total Residual Geomean
m3 m3/d m3/d mg/L mg/L kg/d Efficiency mg/L mg/L kg/d Efficiency mg/L mg/L kg/d Efficiency mg/L mg/L kg/d Efficiency µg/L mg/L mg/L mg/L mg/L mg/L mg/L Hauled % m3 Kg mg/L # Col./100mL
January 22880 738 922 140 4.4 3.25 96.9% 212 6.6 4.87 96.9% 5.2 0.52 0.38 90.0% 28.70 12.00 8.86 58.2% 6.53 35.1 11.60 0.05 13.30 7.5 6.9 158 38 160 2.1 3.4 19.7 0.60 2.6
February 22584 779 1031 120 4.2 3.27 96.5% 132 5.3 4.13 96.0% 3.1 0.40 0.31 87.1% 26.60 17.10 13.32 35.7% 17.25 33.2 14.30 0.05 3.63 7.2 6.9 157 61 160 2.6 4.2 16.9 0.57 2.2
March 32067 1034 1701 190 4.2 4.34 97.8% 180 6.3 6.52 96.5% 5.1 0.40 0.41 92.2% 24.30 20.40 21.10 16.0% 31.82 26.7 18.50 0.05 67.50 7.3 7.1 176 132 160 1.4 2.2 17.0 0.54 6
April 44679 1489 2694 98 4.0 5.96 95.9% 128 6.8 10.13 94.7% 4.7 0.42 0.63 91.1% 12.80 12.20 18.17 4.7% 20.46 15.7 12.30 1.68 3.52 7.1 6.9 133 85 160 0.0 28.5 0.49 10
May 36428 1175 2064 100 2.4 2.82 97.6% 107 4.9 5.76 95.4% 3.2 0.54 0.63 83.1% 12.20 0.58 0.68 95.2% 0.34 16.5 0.80 0.05 12.80 7.2 6.7 132 45 160 0.0 40.9 0.44 8
June 27905 930 1376 85 2.6 2.42 96.9% 126 6.2 5.77 95.1% 3.7 0.48 0.45 87.0% 17.90 0.14 0.13 99.2% 0.12 23.3 0.80 0.05 18.80 7.1 6.7 156 56 200 0.0 55.2 0.60 31
July 31954 1031 1575 100 2.6 2.68 97.4% 144 9.7 10.00 93.3% 3.9 0.50 0.52 87.2% 18.70 0.16 0.16 99.1% 0.29 27.4 2.10 0.44 16.70 7.0 6.6 150 53 160 0.0 64.5 0.50 13
August 29580 954 1421 67 1.3 1.24 98.1% 174 10.5 10.02 94.0% 2.9 0.57 0.54 80.3% 16.00 0.16 0.15 99.0% 0.18 15.6 0.50 0.05 17.30 7.3 6.6 148 52 160 0.0 63.3 0.55 4
September 35074 1169 1760 160 3.0 3.51 98.1% 139 6.8 7.95 95.1% 2.5 0.42 0.49 83.2% 15.50 0.15 0.18 99.0% 0.14 20.4 0.30 0.05 15.70 7.1 6.8 146 59 200 0.0 74.0 0.59 9
October 38419 1239 2465 48 2.3 2.85 95.2% 142 8.0 9.91 94.4% 2.8 0.43 0.53 84.6% 15.70 0.07 0.09 99.6% 0.06 220.0 0.53 0.05 14.95 6.7 6.6 131 48 160 1.0 1.6 76.1 0.56 5
November 40323 1344 1942 86 1.5 2.02 98.3% 122 6.4 8.60 94.8% 3.1 0.41 0.55 86.9% 12.00 0.03 0.04 99.8% 0.02 15.6 1.10 0.05 11.20 6.7 6.7 110 57 160 2.3 3.7 66.5 0.66 5
December 29577 954 1896 100 4.0 3.82 96.0% 160 6.0 5.72 96.3% 3.6 0.47 0.45 86.9% 19.70 0.10 0.10 99.5% 0.15 22.4 1.00 0.05 18.40 6.9 6.8 156 52 200 2.2 4.4 57.9 0.84 2
Total 391470 97.2% 95.2% 87.3% 71.9% 2040 19.4
Average 1073 108 3.04 3.18 97.2% 147 6.96 7.45 95.2% 3.65 0.46 0.49 87.3% 18.34 5.26 5.25 71.9% 6.45 39.33 5.32 0.22 17.82 7.09 6.78 146 62 1.93 0.58 8
Plant Type: Extended Aeration
Design Capacity: 2270 m3/day
Population Served: 2,320
Compliance Parameters:
Conc. Loading
CBOD 25 mg/L 56.75 kg/day Annual Average
TSS 25 mg/L 56.75 kg/day Annual Average
Total Phosphorus 1.0 mg/L 3.1 kg/day Monthly Average
pH 6.0 to 9.5 inclusive, at all times
E.Coli 200 col/100 mL Monthly Geometric Mean
Month
Flows CBOD Total Suspended Solids Total Phosphorus Chlorine
Raw Effluent
2020 Levack Wastewater Treatment Plant Performance
TKN pH AlkalinityTotal Ammonia Sludge
0
500
1000
1500
2000
2500
3000
0
5000
10000
15000
20000
25000
30000
35000
40000
45000
50000
January February March April May June July August September October November December
Flo
w (
m3/
day
)
Tota
l Flo
w (
m3
)
2020
Total Flow (m3)
Average Daily Flow (m3/day)
Maximum Daily Flow (m3/day)
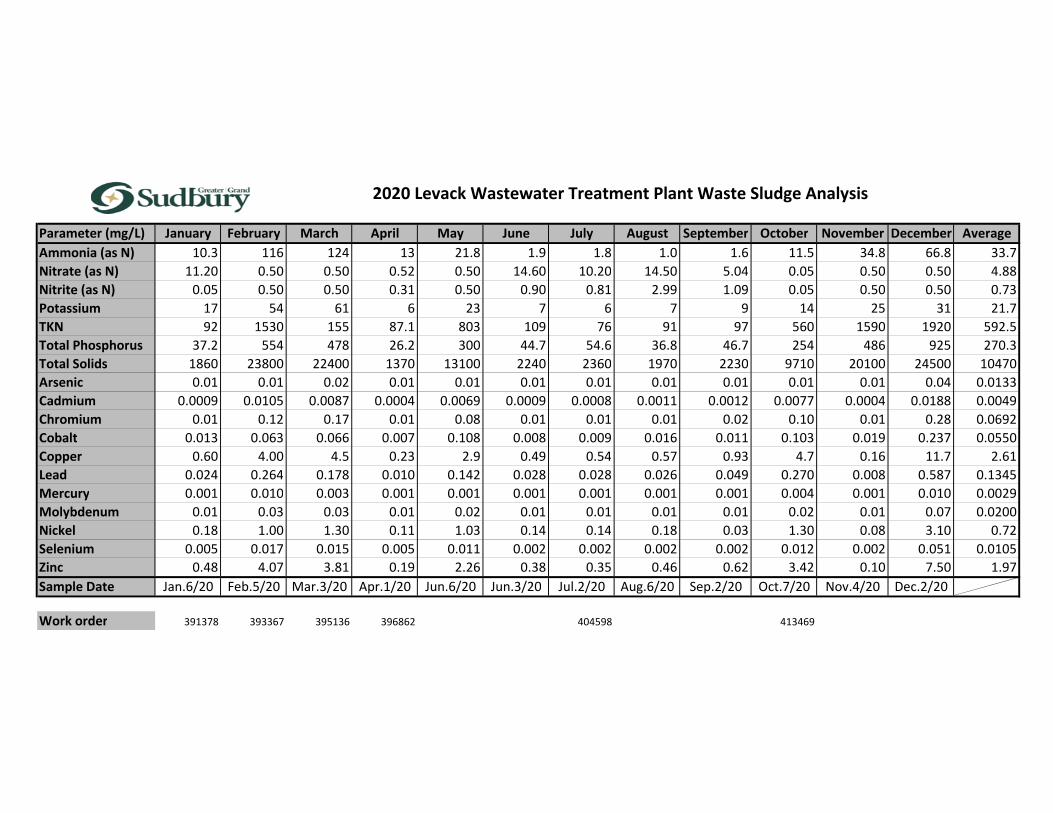
Parameter (mg/L) January February March April May June July August September October November December Average
Ammonia (as N) 10.3 116 124 13 21.8 1.9 1.8 1.0 1.6 11.5 34.8 66.8 33.7
Nitrate (as N) 11.20 0.50 0.50 0.52 0.50 14.60 10.20 14.50 5.04 0.05 0.50 0.50 4.88
Nitrite (as N) 0.05 0.50 0.50 0.31 0.50 0.90 0.81 2.99 1.09 0.05 0.50 0.50 0.73
Potassium 17 54 61 6 23 7 6 7 9 14 25 31 21.7
TKN 92 1530 155 87.1 803 109 76 91 97 560 1590 1920 592.5
Total Phosphorus 37.2 554 478 26.2 300 44.7 54.6 36.8 46.7 254 486 925 270.3
Total Solids 1860 23800 22400 1370 13100 2240 2360 1970 2230 9710 20100 24500 10470
Arsenic 0.01 0.01 0.02 0.01 0.01 0.01 0.01 0.01 0.01 0.01 0.01 0.04 0.0133
Cadmium 0.0009 0.0105 0.0087 0.0004 0.0069 0.0009 0.0008 0.0011 0.0012 0.0077 0.0004 0.0188 0.0049
Chromium 0.01 0.12 0.17 0.01 0.08 0.01 0.01 0.01 0.02 0.10 0.01 0.28 0.0692
Cobalt 0.013 0.063 0.066 0.007 0.108 0.008 0.009 0.016 0.011 0.103 0.019 0.237 0.0550
Copper 0.60 4.00 4.5 0.23 2.9 0.49 0.54 0.57 0.93 4.7 0.16 11.7 2.61
Lead 0.024 0.264 0.178 0.010 0.142 0.028 0.028 0.026 0.049 0.270 0.008 0.587 0.1345
Mercury 0.001 0.010 0.003 0.001 0.001 0.001 0.001 0.001 0.001 0.004 0.001 0.010 0.0029
Molybdenum 0.01 0.03 0.03 0.01 0.02 0.01 0.01 0.01 0.01 0.02 0.01 0.07 0.0200
Nickel 0.18 1.00 1.30 0.11 1.03 0.14 0.14 0.18 0.03 1.30 0.08 3.10 0.72
Selenium 0.005 0.017 0.015 0.005 0.011 0.002 0.002 0.002 0.002 0.012 0.002 0.051 0.0105
Zinc 0.48 4.07 3.81 0.19 2.26 0.38 0.35 0.46 0.62 3.42 0.10 7.50 1.97
Sample Date Jan.6/20 Feb.5/20 Mar.3/20 Apr.1/20 Jun.6/20 Jun.3/20 Jul.2/20 Aug.6/20 Sep.2/20 Oct.7/20 Nov.4/20 Dec.2/20
Work order 391378 393367 395136 396862 404598 413469
2020 Levack Wastewater Treatment Plant Waste Sludge Analysis

BOD5 Un-Ionized Nitrite Nitrate E.Coli
Total Avg Day Max Day Diverted Raw Raw Effluent Loading Plant Raw Effluent Loading Plant Raw Effluent Loading Plant Raw Effluent Loading Plant Ammonia Raw Effluent Effluent Effluent Raw Effluent Total m3 Conc. Total Total Residual Geomean
m3 m3/d m3/d m3mg/L mg/L mg/L kg/d Efficiency mg/L mg/L kg/d Efficiency mg/L mg/L kg/d Efficiency mg/L mg/L kg/d Efficiency µg/L mg/L mg/L mg/L mg/L mg/L mg/L Hauled % m3
Kg mg/L # Col./100mL
January 1929 62 66 10894 0.00 n/a 0.00 n/a 0.00 n/a 0.00 n/a Plant shut down - no results in January 0.0
February 9778 337 894 2821 230 190 27.0 9.10 85.8% 316 35.6 12.02 95.7% 7.2 2.48 0.84 87.0% 58.10 27.40 9.24 82.2% 47.46 66.9 30.10 1.80 0.78 n/a 7.2 221 133 0 0.0 44.7 0.80 11
March 34009 1097 2402 4841 97 87 2.3 2.52 97.4% 215 8.7 9.51 98.2% 8.0 0.60 0.66 96.6% 49.00 25.80 28.30 76.0% 89.04 53.2 26.10 0.05 3.96 7.1 7.2 181 104 0 0.0 76.4 0.85 18
April 40014 1334 2398 3357 110 82 4.9 6.54 94.0% 45 23.3 31.05 71.2% 1.9 0.85 1.13 75.1% 13.70 9.59 12.79 61.1% 14.41 30.1 11.00 0.47 2.31 7.1 7.0 143 108 160 640.0 155.0 0.60 155
May 30397 981 1676 1916 29 42 3.1 3.04 92.6% 31.8 12.9 12.66 76.2% 1.8 0.88 0.86 71.4% 11.50 12.90 12.65 34.4% 21.32 13.9 12.90 0.23 0.32 7.0 6.9 147 113 320 1280.0 128.5 1.00 45
June 22653 755 895 1855 59 37 5.3 4.00 85.7% 49 10.4 7.86 82.1% 2.6 0.52 0.39 83.1% 15.30 14.70 11.10 18.9% 89.60 16.6 16.70 0.67 0.53 7.0 7.2 163 114 400 1120.0 84.2 0.89 21
July 22311 720 1210 2032 57 41 2.6 1.87 93.7% 42 6.1 4.39 91.4% 2.7 0.38 0.27 91.6% 19.70 21.60 15.55 34.8% 71.50 23.6 20.60 0.62 0.66 7.2 7.2 144 108 400 1600.0 73.5 1.00 9
August 26789 864 1525 4098 22 19 0.6 0.52 96.8% 39 4.9 4.19 93.0% 2.1 0.43 0.37 88.4% 13.00 11.20 9.68 51.2% 57.80 16.6 10.90 1.24 0.69 7.2 7.0 220 103 280 1120.0 53.5 0.74 16
September 27103 903 1169 2143 75 61 1.2 1.08 98.0% 56 5.6 5.06 92.3% 1.9 0.46 0.42 81.3% 13.40 16.70 15.09 3.7% 285.30 16.1 14.80 0.42 0.67 7.2 7.0 151 121 400 1280.0 80.8 0.79 15
October 29220 943 3624 3278 53 48 1.6 1.51 96.7% 37 2.8 2.64 98.0% 2.4 0.44 0.41 95.2% 21.00 6.85 6.46 91.5% 31.17 24.7 6.80 0.91 0.99 7.0 7.0 136 81 400 1120.0 91.5 0.89 8
November 30512 1017 1873 2511 51 44 1.2 1.22 97.3% 74 3.4 3.46 97.5% 2.1 0.40 0.40 89.7% 14.10 0.37 0.38 98.6% 0.83 15.4 1.60 0.05 8.02 6.9 7.1 154 63 320 3630.9 113.7 0.82 3
December 28783 928 1863 673 64 52 1.5 1.39 97.1% 48 4.3 3.99 95.5% 2.6 0.58 0.54 88.9% 21.45 8.57 7.96 80.1% 31.51 23.4 7.95 0.43 3.94 7.2 7.2 168 86.29 280 0.0 73.9 0.72 6
Total 303498 94.3% 93.7% 89.8% 70.5% 1134.66 0.0
Average 832 77 64 4.66 2.73 94.1% 87 10.72 8.07 90.1% 3.21 0.73 0.53 86.2% 22.75 14.15 10.8 57.5% 67.27 27.31 14.50 0.63 2.08 7.09 7.09 166 103 269.09 0.83 28
Plant Type: Extended Aeration
Design Capacity: 1600 m3/day
Population Served: 2,761
Compliance Parameters:
Conc. Loading
BOD5 25 mg/L 40 kg/day *
TSS 25 mg/L 40 kg/day *
Total Phosphorus 1.0 mg/L 1.6 kg/day Monthly Average
E.Coli 200 col/100 mL Monthly Geometric Mean
* Annual average of any consecutive 12 month period.
Month
Chlorine
Raw Effluent
Total Suspended Solids Total Phosphorus Total AmmoniaCBOD
2020 Lively Wastewater Treatment Plant Performance
TKN pH AlkalinityFlows Sludge
0
500
1000
1500
2000
2500
3000
3500
4000
0
5000
10000
15000
20000
25000
30000
35000
40000
45000
January February March April May June July August September October November December
Flo
w (
m3
/day
)
Tota
l Flo
w (
m3
)
2020
Total Flow (m3)
Average Daily Flow (m3/day)
Maximum Daily Flow (m3/day)
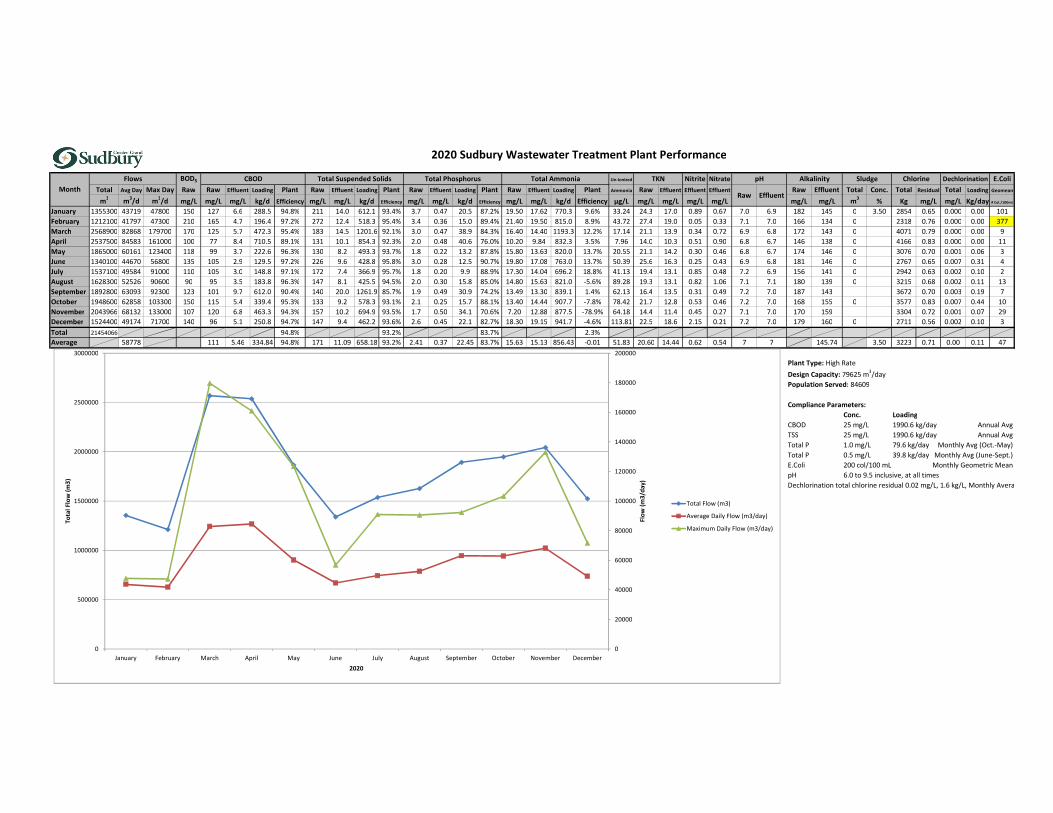
BOD5 Un-Ionized Nitrite Nitrate E.Coli
Total Avg Day Max Day Raw Raw Effluent Loading Plant Raw Effluent Loading Plant Raw Effluent Loading Plant Raw Effluent Loading Plant Ammonia Raw Effluent Effluent Effluent Raw Effluent Total Conc. Total Residual Total Loading Geomean
m3 m3/d m3/d mg/L mg/L mg/L kg/d Efficiency mg/L mg/L kg/d Efficiency mg/L mg/L kg/d Efficiency mg/L mg/L kg/d Efficiency µg/L mg/L mg/L mg/L mg/L mg/L mg/L m3% Kg mg/L mg/L Kg/day # Col./100mL
January 1355300 43719 47800 150 127 6.6 288.5 94.8% 211 14.0 612.1 93.4% 3.7 0.47 20.5 87.2% 19.50 17.62 770.3 9.6% 33.24 24.3 17.0 0.89 0.67 7.0 6.9 182 145 0 3.50 2854 0.65 0.000 0.00 101
February 1212100 41797 47300 210 165 4.7 196.4 97.2% 272 12.4 518.3 95.4% 3.4 0.36 15.0 89.4% 21.40 19.50 815.0 8.9% 43.72 27.4 19.0 0.05 0.33 7.1 7.0 166 134 0 2318 0.76 0.000 0.00 377
March 2568900 82868 179700 170 125 5.7 472.3 95.4% 183 14.5 1201.6 92.1% 3.0 0.47 38.9 84.3% 16.40 14.40 1193.3 12.2% 17.14 21.1 13.9 0.34 0.72 6.9 6.8 172 143 0 4071 0.79 0.000 0.00 9
April 2537500 84583 161000 100 77 8.4 710.5 89.1% 131 10.1 854.3 92.3% 2.0 0.48 40.6 76.0% 10.20 9.84 832.3 3.5% 7.96 14.0 10.3 0.51 0.90 6.8 6.7 146 138 0 4166 0.83 0.000 0.00 11
May 1865000 60161 123400 118 99 3.7 222.6 96.3% 130 8.2 493.3 93.7% 1.8 0.22 13.2 87.8% 15.80 13.63 820.0 13.7% 20.55 21.1 14.2 0.30 0.46 6.8 6.7 174 146 0 3076 0.70 0.001 0.06 3
June 1340100 44670 56800 135 105 2.9 129.5 97.2% 226 9.6 428.8 95.8% 3.0 0.28 12.5 90.7% 19.80 17.08 763.0 13.7% 50.39 25.6 16.3 0.25 0.43 6.9 6.8 181 146 0 2767 0.65 0.007 0.31 4
July 1537100 49584 91000 110 105 3.0 148.8 97.1% 172 7.4 366.9 95.7% 1.8 0.20 9.9 88.9% 17.30 14.04 696.2 18.8% 41.13 19.4 13.1 0.85 0.48 7.2 6.9 156 141 0 2942 0.63 0.002 0.10 2
August 1628300 52526 90600 90 95 3.5 183.8 96.3% 147 8.1 425.5 94.5% 2.0 0.30 15.8 85.0% 14.80 15.63 821.0 -5.6% 89.28 19.3 13.1 0.82 1.06 7.1 7.1 180 139 0 3215 0.68 0.002 0.11 13
September 1892800 63093 92300 123 101 9.7 612.0 90.4% 140 20.0 1261.9 85.7% 1.9 0.49 30.9 74.2% 13.49 13.30 839.1 1.4% 62.13 16.4 13.5 0.31 0.49 7.2 7.0 187 143 3672 0.70 0.003 0.19 7
October 1948600 62858 103300 150 115 5.4 339.4 95.3% 133 9.2 578.3 93.1% 2.1 0.25 15.7 88.1% 13.40 14.44 907.7 -7.8% 78.42 21.7 12.8 0.53 0.46 7.2 7.0 168 155 0 3577 0.83 0.007 0.44 10
November 2043966 68132 133000 107 120 6.8 463.3 94.3% 157 10.2 694.9 93.5% 1.7 0.50 34.1 70.6% 7.20 12.88 877.5 -78.9% 64.18 14.4 11.4 0.45 0.27 7.1 7.0 170 159 3304 0.72 0.001 0.07 29
December 1524400 49174 71700 140 96 5.1 250.8 94.7% 147 9.4 462.2 93.6% 2.6 0.45 22.1 82.7% 18.30 19.15 941.7 -4.6% 113.81 22.5 18.6 2.15 0.21 7.2 7.0 179 160 0 2711 0.56 0.002 0.10 3
Total 21454066 94.8% 93.2% 83.7% 2.3%
Average 58778 111 5.46 334.84 94.8% 171 11.09 658.18 93.2% 2.41 0.37 22.45 83.7% 15.63 15.13 856.43 -0.01 51.83 20.60 14.44 0.62 0.54 7 7 145.74 3.50 3223 0.71 0.00 0.11 47
Plant Type: High Rate
Design Capacity: 79625 m3/day
Population Served: 84609
Compliance Parameters:
Conc. Loading
CBOD 25 mg/L 1990.6 kg/day Annual Avg
TSS 25 mg/L 1990.6 kg/day Annual Avg
Total P 1.0 mg/L 79.6 kg/day Monthly Avg (Oct.-May)
Total P 0.5 mg/L 39.8 kg/day Monthly Avg (June-Sept.)
E.Coli 200 col/100 mL Monthly Geometric Mean
pH 6.0 to 9.5 inclusive, at all times
Dechlorination total chlorine residual 0.02 mg/L, 1.6 kg/L, Monthly Average
Month
Flows Dechlorination
Raw Effluent
2020 Sudbury Wastewater Treatment Plant Performance
TKN pH Alkalinity Sludge ChlorineCBOD Total Suspended Solids Total Phosphorus Total Ammonia
0
20000
40000
60000
80000
100000
120000
140000
160000
180000
200000
0
500000
1000000
1500000
2000000
2500000
3000000
January February March April May June July August September October November December
Flo
w (
m3
/day
)
Tota
l Fl
ow
(m
3)
2020
Total Flow (m3)
Average Daily Flow (m3/day)
Maximum Daily Flow (m3/day)

Parameter (mg/L) January February March 1-Apr 14-Apr May 1-Jun 8-Jun 29-Jun July August September October November December December Average
Ammonia (as N) 276 231 225 308 483 190 329 389 349 328 305 399 280 198 277 646 325.8
Nitrate (as N) 0.5 0.5 0.5 0.5 0.5 0.5 0.5 0.5 0.5 0.05 0.5 0.5 0.5 0.5 0.5 0.5 0.47
Nitrite (as N) 0.5 0.5 4.7 0.5 2.7 2.7 15.2 5.3 0.5 0.05 9.7 8.5 4.3 7.0 10.2 17.6 5.62
Potassium 99 43 77 67 58 53 46 44 51 72 63 54 51 43 91 80 62.0
TKN 1960 1740 1990 1870 1860 2120 1860 1740 2360 2320 2240 2280 2040 1920 2440 2630 2086
Total Phosphorus 483 479 485 576 458 483 487 405 516 564 564 586 516 431 562 210 488
Total Solids 27800 25400 29300 31300 28900 34300 26400 23900 32100 34600 30800 31100 26800 27500 30000 35500 29731
Arsenic 0.11 0.05 0.09 0.12 0.13 0.12 0.06 0.07 0.09 0.14 0.13 0.12 0.10 0.05 0.11 0.14 0.1019
Cadmium 0.0253 0.0141 0.0143 0.0221 0.0228 0.0216 0.0143 0.0161 0.0204 0.0244 0.0238 0.0256 0.0163 0.0084 0.0254 0.0192 0.0196
Chromium 0.38 0.19 0.32 0.28 0.26 0.26 0.18 0.18 0.20 0.32 0.35 0.31 0.21 0.11 0.34 0.30 0.2619
Cobalt 0.209 0.090 0.147 0.156 0.130 0.152 0.094 0.095 0.148 0.253 0.245 0.261 0.196 0.0860 0.2030 0.2390 0.1690
Copper 10.8 4.8 5.6 8.6 10.0 9.0 6.0 6.2 7.4 10.7 11.4 7.3 6.7 3.5 12.5 10.4 8.18
Lead 0.419 0.170 0.215 0.287 0.261 0.286 0.200 0.222 0.331 0.472 0.467 0.447 0.276 0.123 0.486 0.349 0.3132
Mercury 0.005 0.002 0.004 0.003 0.005 0.004 0.001 0.003 0.003 0.007 0.007 0.004 0.005 0.0010 0.0070 0.0040 0.0041
Molybdenum 0.09 0.03 0.05 0.04 0.04 0.04 0.05 0.05 0.05 0.08 0.08 0.06 0.06 0.020 0.090 0.070 0.0563
Nickel 3.3 1.4 2.0 3.8 3.4 3.8 1.8 1.7 2.7 4.1 4.8 2.4 3.3 1.50 4.50 5.30 3.11
Selenium 0.066 0.030 0.033 0.044 0.052 0.050 0.041 0.046 0.035 0.075 0.071 0.071 0.052 0.012 0.096 0.059 0.0521
Zinc 7.80 4.39 5.42 5.52 5.14 6.44 5.27 5.78 7.12 8.80 9.40 5.80 6.00 2.73 9.00 7.13 6.36
Sample Date Jan.1/20 Feb.3/20 Mar.2/20 Apr.1/20 Apr.14/20 May.4/20 Jun.1/20 Jun.8/20 Jun.29/20 Jul.30/20 Aug.4/20 Sep.1/20 Oct.5/20 Nov.2/20 Dec.1/20 Dec.29/20
Work Order 391133 393096 394850 396908 397581 399090 401592 402301 404293 407128 407338 409974 413091 415836 418387 420341
2020 Sudbury Wastewater Treatment Plant Waste Sludge Analysis

Parameter (mg/L) Location January February March Apr.1/10 Apr.14/20 May Jun.1 Jun.8 Jun.29 July August Aug.10 September October November Dec.1 Dec.29 Average
Raw 0.0010 0.0020 0.0030 0.0040 0.0030 0.0080 0.0100 0.0020 0.0100 no results 0.0100 0.0020 0.0020 0.0010 0.0010 0.0100 0.0046
Effluent 0.0010 0.0020 0.0020 0.0030 0.0030 0.0060 0.0100 0.0020 0.0020 no results 0.0010 0.0020 0.0020 0.0020 0.0010 0.0010 0.0100 0.0031
Raw 0.0001 0.0001 0.0001 0.0001 0.0002 0.0001 0.0010 0.0001 0.0010 no results 0.0010 0.0001 0.0001 0.0001 0.0001 0.0010 0.0003
Effluent 0.0001 0.0001 0.0001 0.0001 0.0001 0.0001 0.0010 0.0001 0.0001 no results 0.0001 0.0001 0.0001 0.0001 0.0002 0.0001 0.0010 0.0002
Raw 0.0020 0.0020 0.0040 0.0030 0.0010 0.0020 0.0100 0.0100 0.0100 no results 0.0100 0.0030 0.0030 0.0020 0.0030 0.0100 0.0050
Effluent 0.0010 0.0010 0.0020 0.0020 0.0010 0.0020 0.0100 0.0070 0.0020 no results 0.0010 0.0020 0.0020 0.0020 0.0020 0.0020 0.0100 0.0031
Raw 0.0026 0.0032 0.0015 0.0023 0.0044 0.0024 0.0030 0.0021 0.0020 no results 0.0050 0.0027 0.0019 0.0026 0.0019 0.0030 0.0027
Effluent 0.0027 0.0040 0.0026 0.0024 0.0043 0.0021 0.0020 0.0015 0.0018 no results 0.0031 0.0011 0.0020 0.0019 0.0028 0.0019 0.0030 0.0025
Raw 0.0030 0.0110 0.0040 0.0100 0.0700 0.0040 0.0100 0.0180 0.0200 no results 0.0600 0.0190 0.0160 0.0070 0.0070 0.0200 0.0186
Effluent 0.0070 0.0160 0.0060 0.0160 0.0160 0.0070 0.0100 0.0060 0.0050 no results 0.0090 0.0080 0.0100 0.0050 0.0090 0.0070 0.0100 0.0092
Raw 0.0009 0.0017 0.0001 0.0001 0.0021 0.0001 0.0010 0.0002 0.0010 no results 0.0020 0.0004 0.0002 0.0002 0.0001 0.0010 0.0007
Effluent 0.0002 0.0004 0.0001 0.0001 0.0002 0.0001 0.0010 0.0001 0.0001 no results 0.0002 0.0001 0.0001 0.0001 0.0001 0.0001 0.0010 0.0003
Raw 0.0001 0.0001 0.0001 0.0001 0.0001 0.0001 0.0010 0.0001 0.0010 no results 0.0010 0.0001 0.0001 0.0001 0.0001 0.0010 0.0003
Effluent 0.0001 0.0001 0.0001 0.0001 0.0001 0.0001 0.0010 0.0001 0.0001 no results 0.0001 0.0001 0.0001 0.0001 0.0001 0.0001 0.0010 0.0002
Raw 0.0030 0.0010 0.0010 0.0080 0.0010 0.0240 0.0100 0.0010 0.0100 no results 0.0100 0.0050 0.0030 0.0060 0.0010 0.0100 0.0063
Effluent 0.0010 0.0010 0.0010 0.0170 0.0040 0.0080 0.0100 0.0010 0.0110 no results 0.0010 0.0030 0.0040 0.0040 0.0050 0.0010 0.0100 0.0051
Raw 0.0810 0.0870 0.0520 0.0980 0.1290 0.1010 0.0700 0.0650 0.0600 no results 0.1500 0.0920 0.0660 0.0680 0.0580 0.0700 0.0831
Effluent 0.0720 0.0730 0.0660 0.0980 0.1090 0.0850 0.0500 0.0560 0.0580 no results 0.1070 0.0670 0.0850 0.0610 0.0710 0.0600 0.0700 0.0743
Raw 0.0007 0.0010 0.0005 0.0022 0.0005 0.0002 0.0050 0.0002 0.0020 no results 0.0030 0.0002 0.0011 0.0002 0.0009 0.0020 0.0013
Effluent 0.0006 0.0018 0.0005 0.0055 0.0005 0.0002 0.0040 0.0002 0.0011 no results 0.0014 0.0002 0.0021 0.0055 0.0002 0.0008 0.0020 0.0017
Raw 0.0510 0.0880 0.0020 0.0050 0.0750 0.0060 0.0100 0.0070 0.0100 no results 0.0600 0.0090 0.0060 0.0020 0.0020 0.0100 0.0229
Effluent 0.0270 0.0290 0.0220 0.0090 0.0220 0.0110 0.0200 0.0130 0.0160 no results 0.0190 0.0170 0.0140 0.0090 0.0130 0.0110 0.0100 0.0164
Work Order 391133 393096 394850 396868 397581 399090 401592 402301 404293 no results 407338 407912 409974 413091 415836 418387 420341
no Raw
2020 Sudbury Wastewater Treatment Plant - Raw & Effluent Metals Analysis
Zinc
Arsenic
Cadmium
Chromium
Cobalt
Copper
Lead
Mercury
Molybdenum
Nickel
Selenium

BOD5 Un-Ionized Nitrite Nitrate E.Coli
Total Avg Day Max Day Raw Raw Effluent Loading Plant Raw Effluent Loading Plant Raw Effluent Loading Plant Raw Effluent Loading Plant Ammonia Raw Effluent Effluent Effluent Raw Effluent Total m3 Conc. Total Total Residual Geomean
m3 m3/d m3/d mg/L mg/L mg/L kg/d Efficiency mg/L mg/L kg/d Efficiency mg/L mg/L kg/d Efficiency mg/L mg/L kg/d Efficiency µg/L mg/L mg/L mg/L mg/L mg/L mg/L Hauled % m3Kg mg/L # Col./100mL
January 141101 4552 5198 160 150 6.7 30.50 95.5% 201 8.2 37.32 95.9% 3.5 0.65 2.96 81.2% 35.90 30.05 136.78 16.3% 139.6 36.1 29.5 1.17 1.82 7.5 7.2 207 176 1160 4.1 47.6 211.0 0.79 50
February 122398 4221 5181 230 213 7.3 30.81 96.6% 201 8.3 35.03 95.9% 4.0 0.54 2.28 86.5% 31.80 30.65 129.36 3.6% 126.1 35.8 31.0 3.40 2.60 7.5 7.4 212 175 920 0.0 174.1 0.80 11
March 161129 5198 9715 250 140 8.0 41.58 94.3% 169 13.2 68.61 92.2% 3.2 0.63 3.27 80.2% 32.50 27.15 141.12 16.5% 86.9 33.5 27.1 1.80 1.70 7.4 7.2 214 167 1240 0.0 185.7 0.63 47
April 271177 9039 13106 77 55 9.3 84.06 83.1% 108 9.8 88.58 90.9% 1.7 0.41 3.71 76.2% 10.80 14.59 131.88 -35.1% 32.0 12.8 14.7 1.93 1.98 7.4 7.1 180 155 876 0.0 314.6 0.73 14
May 209457 6757 13048 150 110 5.7 38.51 94.8% 148 8.1 54.73 94.5% 2.4 0.42 2.84 82.6% 13.90 19.10 129.05 -37.4% 30.5 15.1 17.7 1.80 1.90 7.4 7.0 195 163 1160 0.0 316.6 0.81 7
June 139240 4641 5436 150 110 8.1 37.59 92.6% 204 7.8 36.20 96.2% 3.7 0.56 2.60 84.8% 20.80 24.65 114.41 -18.5% 112.2 27.1 24.3 3.30 2.10 7.5 7.2 191 163 1080 0.0 218.2 0.89 11
July 127814 4123 4968 100 77 2.7 11.13 96.5% 160 6.4 26.39 96.0% 3.5 0.54 2.23 84.7% 25.90 26.36 108.68 -1.8% 276.0 26.4 24.6 1.10 1.80 7.5 7.4 203 167 1120 0.0 206.2 0.83 60
August 125848 4060 4650 110 130 3.4 13.80 97.4% 186 5.5 22.33 97.0% 3.9 0.48 1.95 87.6% 23.10 25.78 104.66 -11.6% 242.4 30.4 23.9 1.99 1.91 7.4 7.3 202 157 962 0.0 181.3 0.65 104
September 144923 4831 5580 213 67 4.2 20.29 93.7% 171 6.3 30.43 96.3% 3.2 0.54 2.61 83.2% 19.10 21.38 103.28 -11.9% 245.0 21.7 19.4 1.39 2.19 7.5 7.3 191 158 1080 0.0 199.6 0.70 36
October 178253 5750 11359 180 140 4.2 24.15 97.0% 174 7.8 44.85 95.5% 3.0 0.81 4.66 73.0% 24.70 22.00 126.50 10.9% 211.4 32.8 21.0 3.51 2.32 7.5 7.3 201 163 1200 0.0 242.1 0.77 33
November 186974 6232 8495 110 110 4.4 27.42 96.0% 144 7.4 46.12 94.9% 2.4 0.39 2.43 83.8% 17.90 15.98 99.59 10.7% 176.8 22.4 15.7 1.32 2.22 7.5 7.3 174 154 1240 0.0 294.2 0.83 18
December 150867 4867 9092 140 130 4.5 21.90 96.5% 162 5.7 27.74 96.5% 2.6 0.53 2.58 79.6% 20.90 24.12 117.38 -15.4% 216.8 51.9 23.7 5.56 2.63 7.5 7.2 212 172.8 1240 0.0 250.3 0.80 4
Total 1959181 94.8% 95.1% 81.9% -2.8% 13278 47.6
Average 5368 119 5.71 31.81 94.5% 169 7.88 43.20 95.2% 3.09 0.54 2.84 81.9% 23.11 23.48 120.2 -0.1 157.98 28.83 22.70 2.36 2.10 7.47 7.25 199 164 4.10 232.83 0.77 33
Plant Type: Extended Aeration
Design Capacity: 11,400 m3/day
Population Served: 17,365
Compliance Parameters:
Conc. Loading
CBOD 25 mg/L 284 kg/day Annual Average
TSS 25 mg/L 284 kg/day Annual Average
Total Phosphorus 1.0 mg/L 11.4 kg/day Monthly Average
pH 6.0 to 9.5 inclusive, at all times
E.Coli 200 col/100 mL Monthly Geometric Mean
2020 Valley East Wastewater Treatment Plant Performance
TKN pH AlkalinityCBOD Total Suspended Solids Total Phosphorus Total Ammonia
Month
Flows Chlorine
Raw Effluent
Sludge
0
2000
4000
6000
8000
10000
12000
14000
0
50000
100000
150000
200000
250000
300000
January February March April May June July August September October November December
Flo
w (
m3/
da
y)
Tota
l Flo
w (
m3)
2020
Total Flow (m3)
Average Daily Flow (m3/day)
Maximum Daily Flow (m3/day)
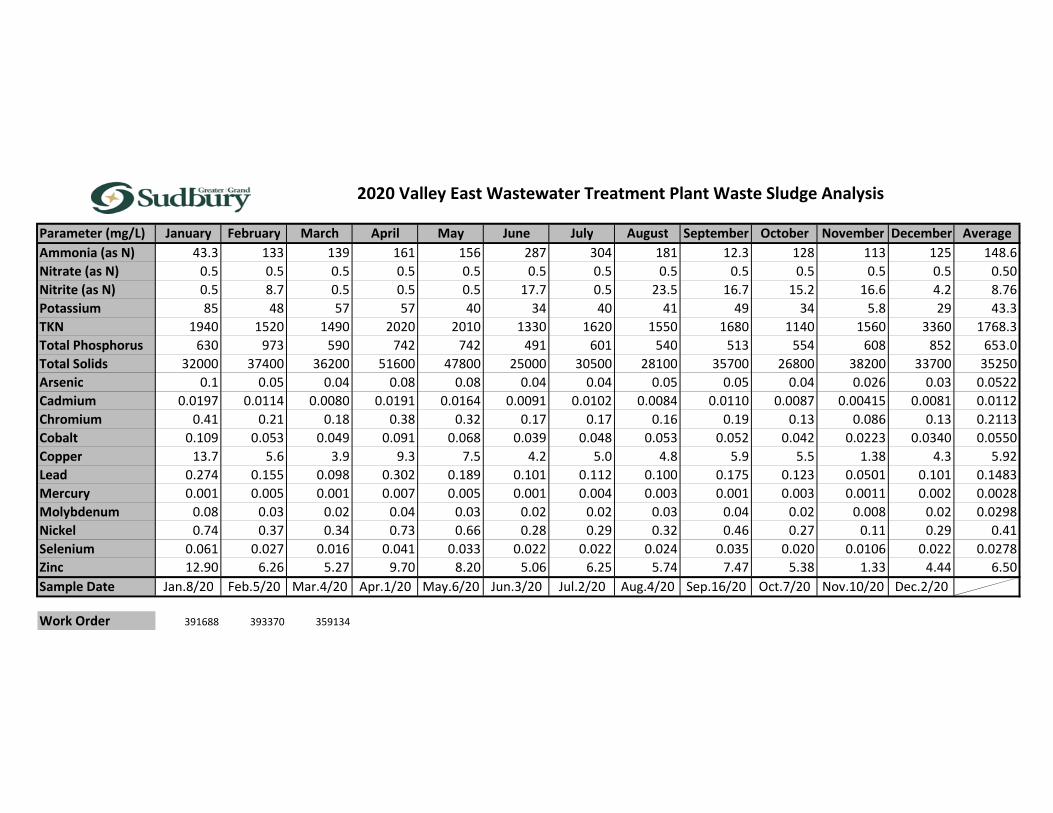
Parameter (mg/L) January February March April May June July August September October November December Average
Ammonia (as N) 43.3 133 139 161 156 287 304 181 12.3 128 113 125 148.6
Nitrate (as N) 0.5 0.5 0.5 0.5 0.5 0.5 0.5 0.5 0.5 0.5 0.5 0.5 0.50
Nitrite (as N) 0.5 8.7 0.5 0.5 0.5 17.7 0.5 23.5 16.7 15.2 16.6 4.2 8.76
Potassium 85 48 57 57 40 34 40 41 49 34 5.8 29 43.3
TKN 1940 1520 1490 2020 2010 1330 1620 1550 1680 1140 1560 3360 1768.3
Total Phosphorus 630 973 590 742 742 491 601 540 513 554 608 852 653.0
Total Solids 32000 37400 36200 51600 47800 25000 30500 28100 35700 26800 38200 33700 35250
Arsenic 0.1 0.05 0.04 0.08 0.08 0.04 0.04 0.05 0.05 0.04 0.026 0.03 0.0522
Cadmium 0.0197 0.0114 0.0080 0.0191 0.0164 0.0091 0.0102 0.0084 0.0110 0.0087 0.00415 0.0081 0.0112
Chromium 0.41 0.21 0.18 0.38 0.32 0.17 0.17 0.16 0.19 0.13 0.086 0.13 0.2113
Cobalt 0.109 0.053 0.049 0.091 0.068 0.039 0.048 0.053 0.052 0.042 0.0223 0.0340 0.0550
Copper 13.7 5.6 3.9 9.3 7.5 4.2 5.0 4.8 5.9 5.5 1.38 4.3 5.92
Lead 0.274 0.155 0.098 0.302 0.189 0.101 0.112 0.100 0.175 0.123 0.0501 0.101 0.1483
Mercury 0.001 0.005 0.001 0.007 0.005 0.001 0.004 0.003 0.001 0.003 0.0011 0.002 0.0028
Molybdenum 0.08 0.03 0.02 0.04 0.03 0.02 0.02 0.03 0.04 0.02 0.008 0.02 0.0298
Nickel 0.74 0.37 0.34 0.73 0.66 0.28 0.29 0.32 0.46 0.27 0.11 0.29 0.41
Selenium 0.061 0.027 0.016 0.041 0.033 0.022 0.022 0.024 0.035 0.020 0.0106 0.022 0.0278
Zinc 12.90 6.26 5.27 9.70 8.20 5.06 6.25 5.74 7.47 5.38 1.33 4.44 6.50
Sample Date Jan.8/20 Feb.5/20 Mar.4/20 Apr.1/20 May.6/20 Jun.3/20 Jul.2/20 Aug.4/20 Sep.16/20 Oct.7/20 Nov.10/20 Dec.2/20
Work Order 391688 393370 359134
2020 Valley East Wastewater Treatment Plant Waste Sludge Analysis

BOD5 Un-Ionized TKN pH H2S E.Coli
Total Avg Day Raw Raw Effluent Loading Raw Loading Removed Plant Raw Effluent Loading Raw Loading Removed Plant Raw Effluent Loading Raw Loading Removed Plant Raw Effluent Loading Raw Loading Removed Plant Ammonia Raw Pre-Discharge Geomean
m3 m3/d mg/L mg/L mg/L kg/d kg/day kg/day Efficiency mg/L mg/L kg/d kg/day kg/day Efficiency mg/L mg/L kg/d kg/day kg/day Efficiency mg/L mg/L kg/d kg/day kg/day Efficiency µg/L mg/L mg/L # Col./100mL
January 17214 555 49 35 0.00 19 19 100.0% 138 33.2 18.41 77 58 76.0% 3.9 0.21 0.12 2.19 2.07 94.7% 7.07 0.40 0.22 3.93 3.70 94.3% 9.5
February 14611 504 no results in February
March 35684 1151 no results in March
April 32239 1075 68 53 3.5 3.76 57 53 93.4% 95 2.6 2.79 102 99 97.3% 3.5 0.04 0.04 3.78 3.74 98.8% 5.26 4.73 5.08 5.65 0.57 10.1% 9.08 15.2 7.00 0.02 10
May 25165 812 68 53 2.5 2.03 43 41 95.3% 95 6.7 5.44 77 72 92.9% 3.52 0.04 0.03 2.86 2.82 98.9% 5.26 4.73 3.84 4.27 0.43 10.1% 72.09 7.97 0.02 54
June 14731 491 68 53 1.1 0.54 26 25 97.9% 95 5.0 2.46 47 44 94.7% 3.52 0.03 0.01 1.73 1.71 99.1% 5.26 0.30 0.15 2.58 2.44 94.3% 3.76 38
July 20017 646 29 20 1.1 0.71 13 12 94.5% 5000 5.0 3.23 3229 3225 99.9% 108.0 0.03 0.02 69.74 69.72 100.0% 4.04 0.3 0.19 2.61 2.41 92.6% 29.0
August 19806 639 no results in August
September 28875 963 no results in September
October 26424 852 38 20 1.8 1.53 17 16 91.0% 658 1.2 1.02 561 560 99.8% 4.6 0.61 0.52 3.89 3.37 86.6% 7.39 0.58 0.49 6.30 5.80 92.2% 1.13 14.6 7.10 0.02
November 29513 984 38 20 3.7 3.64 20 16 81.5% 658 1.6 1.57 647 646 99.8% 4.56 0.03 0.03 4.49 4.45 99.3% 7.39 2.04 2.01 7.27 5.26 72.4% 5.73 7.19 0.02 23
December 18597 600 38 20 1.7 1.00 12 11 91.7% 658 2.4 1.42 395 393 99.6% 4.56 0.43 0.26 2.74 2.48 90.6% 7.39 6.10 3.66 4.43 0.77 17.5% 7.33 6.97 5
Total 282876 207 194 93.6% 5134 5098 99.3% 91 90 98.9% 37 21 57.8%
Average 775 50 34 2.20 1.65 26 24 93.2% 925 7.20 4.54 642 637 95.0% 17.02 0.18 0.13 11.43 11.30 96.0% 6.1 2.40 1.96 4.63 2.67 0.60 16.52 17.1 7.25 0.02 26
Fall 135018 734 50.75 36.5 1.63 1.20 24.75 23.55 92.36% 1462 4.48 3.04 978.3 975.3 97.92% 29.90 0.18 0.15 19.55 19.41 99.25% 5.49 1.48 1.17 3.94 2.77 70.34% 25.66 21.80 7.54 46
Spring 147858 811 48.25 32 2.96 2.10 27.02 24.92 92.45% 387.25 9.93 6.05 305.2 299.1 97.60% 4.15 0.18 0.11 3.30 3.19 96.59% 6.78 3.32 2.74 5.32 2.58 48.45% 7.38 12.35 7.05 13
Lagoon Type: Seasonal Retention
Design Capacity: 1,246 m3/day
Population Served: 1,136
Compliance Parameters:
Concentration
CBOD Seasonal Average
TSS Seasonal Average
pH
Spring Discharge:
Cell 2 & 3 - Pre discharge Apr 10, 2019
Cell #3 Pre-Discharge sampled May 8/15.
Cell #2 & 3 Discharge sampled Apr 17-24, 2019
Total amount discharged approximately XXXX m3.
Fall Discharge:
Cell 1 Pre-Discharge sampled November 22, 2019
Cell #1 -Dishcarge sampled November 29, 2019
Cell #2 & 3 - Discharge Nov 8-15, 2019
Total amount discharged approximately XXXXX m3.
Effluent
2020 Wahnapitae Wastewater Treatment Lagoon Performance
Month
Flows Total Suspended Solids Total Phosphorus Total AmmoniaCBOD
0
200
400
600
800
1000
1200
1400
0
5000
10000
15000
20000
25000
30000
35000
40000
January February March April May June July August September October November December
Flo
w (
m3
/day
)
Tota
l Flo
w (
m3
)
2020
Total Flow (m3)
Average Daily Flow (m3/day)
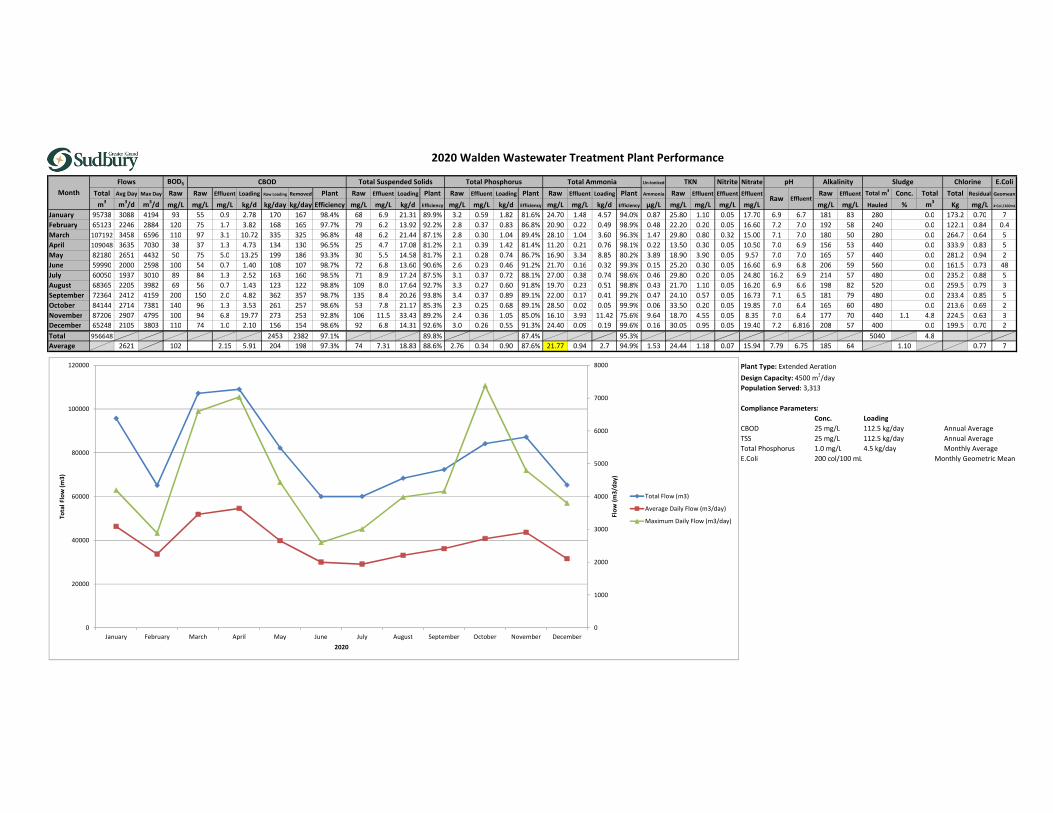
2013 Walden Sewage Treatment Plant Waste Sludge Analysis
BOD5 Un-Ionized Nitrite Nitrate E.Coli
Total Avg Day Max Day Raw Raw Effluent Loading Raw Loading Removed Plant Raw Effluent Loading Plant Raw Effluent Loading Plant Raw Effluent Loading Plant Ammonia Raw Effluent Effluent Effluent Raw Effluent Total m3 Conc. Total Total Residual Geomean
m3 m3/d m3/d mg/L mg/L mg/L kg/d kg/day kg/day Efficiency mg/L mg/L kg/d Efficiency mg/L mg/L kg/d Efficiency mg/L mg/L kg/d Efficiency µg/L mg/L mg/L mg/L mg/L mg/L mg/L Hauled % m3Kg mg/L # Col./100mL
January 95738 3088 4194 93 55 0.9 2.78 170 167 98.4% 68 6.9 21.31 89.9% 3.2 0.59 1.82 81.6% 24.70 1.48 4.57 94.0% 0.87 25.80 1.10 0.05 17.70 6.9 6.7 181 83 280 0.0 173.2 0.70 7
February 65123 2246 2884 120 75 1.7 3.82 168 165 97.7% 79 6.2 13.92 92.2% 2.8 0.37 0.83 86.8% 20.90 0.22 0.49 98.9% 0.48 22.20 0.20 0.05 16.60 7.2 7.0 192 58 240 0.0 122.1 0.84 0.4
March 107192 3458 6596 110 97 3.1 10.72 335 325 96.8% 48 6.2 21.44 87.1% 2.8 0.30 1.04 89.4% 28.10 1.04 3.60 96.3% 1.47 29.80 0.80 0.32 15.00 7.1 7.0 180 50 280 0.0 264.7 0.64 5
April 109048 3635 7030 38 37 1.3 4.73 134 130 96.5% 25 4.7 17.08 81.2% 2.1 0.39 1.42 81.4% 11.20 0.21 0.76 98.1% 0.22 13.50 0.30 0.05 10.50 7.0 6.9 156 53 440 0.0 333.9 0.83 5
May 82180 2651 4432 50 75 5.0 13.25 199 186 93.3% 30 5.5 14.58 81.7% 2.1 0.28 0.74 86.7% 16.90 3.34 8.85 80.2% 3.89 18.90 3.90 0.05 9.57 7.0 7.0 165 57 440 0.0 281.2 0.94 2
June 59990 2000 2598 100 54 0.7 1.40 108 107 98.7% 72 6.8 13.60 90.6% 2.6 0.23 0.46 91.2% 21.70 0.16 0.32 99.3% 0.15 25.20 0.30 0.05 16.60 6.9 6.8 206 59 560 0.0 161.5 0.73 48
July 60050 1937 3010 89 84 1.3 2.52 163 160 98.5% 71 8.9 17.24 87.5% 3.1 0.37 0.72 88.1% 27.00 0.38 0.74 98.6% 0.46 29.80 0.20 0.05 24.80 16.2 6.9 214 57 480 0.0 235.2 0.88 5
August 68365 2205 3982 69 56 0.7 1.43 123 122 98.8% 109 8.0 17.64 92.7% 3.3 0.27 0.60 91.8% 19.70 0.23 0.51 98.8% 0.43 21.70 1.10 0.05 16.20 6.9 6.6 198 82 520 0.0 259.5 0.79 3
September 72364 2412 4159 200 150 2.0 4.82 362 357 98.7% 135 8.4 20.26 93.8% 3.4 0.37 0.89 89.1% 22.00 0.17 0.41 99.2% 0.47 24.10 0.57 0.05 16.73 7.1 6.5 181 79 480 0.0 233.4 0.85 5
October 84144 2714 7381 140 96 1.3 3.53 261 257 98.6% 53 7.8 21.17 85.3% 2.3 0.25 0.68 89.1% 28.50 0.02 0.05 99.9% 0.06 33.50 0.20 0.05 19.85 7.0 6.4 165 60 480 0.0 213.6 0.69 2
November 87206 2907 4795 100 94 6.8 19.77 273 253 92.8% 106 11.5 33.43 89.2% 2.4 0.36 1.05 85.0% 16.10 3.93 11.42 75.6% 9.64 18.70 4.55 0.05 8.35 7.0 6.4 177 70 440 1.1 4.8 224.5 0.63 3
December 65248 2105 3803 110 74 1.0 2.10 156 154 98.6% 92 6.8 14.31 92.6% 3.0 0.26 0.55 91.3% 24.40 0.09 0.19 99.6% 0.16 30.05 0.95 0.05 19.40 7.2 6.816 208 57 400 0.0 199.5 0.70 2
Total 956648 2453 2382 97.1% 89.8% 87.4% 95.3% 5040 4.8
Average 2621 102 2.15 5.91 204 198 97.3% 74 7.31 18.83 88.6% 2.76 0.34 0.90 87.6% 21.77 0.94 2.7 94.9% 1.53 24.44 1.18 0.07 15.94 7.79 6.75 185 64 1.10 0.77 7
Plant Type: Extended Aeration
Design Capacity: 4500 m3/day
Population Served: 3,313
Compliance Parameters:
Conc. Loading
CBOD 25 mg/L 112.5 kg/day Annual Average
TSS 25 mg/L 112.5 kg/day Annual Average
Total Phosphorus 1.0 mg/L 4.5 kg/day Monthly Average
E.Coli 200 col/100 mL Monthly Geometric Mean
Month
Flows Chlorine
Raw Effluent
Sludge
2020 Walden Wastewater Treatment Plant Performance
TKN pH AlkalinityTotal Suspended Solids Total Phosphorus Total AmmoniaCBOD
0
1000
2000
3000
4000
5000
6000
7000
8000
0
20000
40000
60000
80000
100000
120000
January February March April May June July August September October November December
Flo
w (
m3
/day
)
Tota
l Fl
ow
(m
3)
2020
Total Flow (m3)
Average Daily Flow (m3/day)
Maximum Daily Flow (m3/day)