2020 Annual Report - AKITA Drilling
84
Annual Report 2020
Transcript of 2020 Annual Report - AKITA Drilling

Annual Report2020

AKITA DRILLING | 2020 Annual Report2

AKITA DRILLING | 2020 Annual Report 11
CORPORATEPROFILEAKITA Drilling Ltd. is a premier oil and gas drilling contractor with
drilling operations throughout North America. The Company
strives to be the industry leader in customer relations, First
Nations and Aboriginal partnerships, employee expertise, safety,
equipment quality and drilling performance. In addition to
conventional drilling, the Company specializes in pad and other
purpose-built drilling rigs and is active in directional, horizontal
and underbalanced drilling providing specialized drilling
services to a broad range of independent and multinational oil
and gas companies. AKITA currently employs, at full operations,
approximately 1,000 people. The Company has ownership in 37
drilling rigs in all depth ranges.

AKITA DRILLING | 2020 Annual Report2
CONTENTS
1Corporate Profile
4Letter to the Shareowners
6Operational Performance
8Share Performance
10Management's Discussion and Analysis
36Management's Responsibility for Financial Reporting
38Auditor's Report
44Consolidated Financial Statements
48Notes to Consolidated Financial Statements
7810 Year Financial Review
81Corporate Information
AKITA DRILLING | 2020 Annual Report2

AKITA DRILLING | 2020 Annual Report 3
FORWARD-LOOKING STATEMENTSFrom time to time Akita Drilling Ltd. (“AKITA” or the “Company”) makes written and verbal forward-looking statements. These forward-looking statements include but are not limited to comments with respect to our objectives and strategies, financial condition, the results of our operations and our business, our outlook for our industry and our risk management discussion. Forward looking statements are typically identified with words such as “believe”, “expect”, “forecast”, “anticipate”, “intend”, “estimate”, “plan” and “project” and similar expressions of future or conditional events such as “will”, “may”, “should”, “could” or “would”.
By their nature these forward-looking statements involve numerous assumptions, inherent risks and uncertainties, both general and specific, and the risk that predictions and other forward-looking statements will not be achieved. We caution readers of this Annual Report not to place undue reliance on these forward-looking statements as a number of important factors could cause actual future results to differ materially from the plans, objectives, expectations, estimates and intentions expressed in such forward-looking statements.
Forward-looking statements may be influenced by factors such as prevailing economic conditions (including as may be affected by the COVID-19 pandemic); the level of exploration and development activity carried on by AKITA’s customers, world crude oil prices and North American natural gas prices; global liquified natural gas (LNG) demand, weather, access to capital markets; and government policies. We caution that the foregoing list of factors is not exhaustive and that while relying on forward-looking statements to make decisions with respect to AKITA, investors and others should carefully consider the foregoing factors, as well as other uncertainties and events, prior to making a decision to invest in AKITA. Except where required by law, the Company does not undertake to update any forward-looking statement, whether written or oral, that may be made from time to time by it or on its behalf.
Additional information about these and other factors can be found under the “Business Risks and Risk Management” section of the Management’s Discussion and Analysis of this 2020 Annual Report for AKITA.
Annual MeetingThe annual meeting (the “Meeting”) of the shareholders of AKITA DRILLING LTD. (the “Company”) will be held in a virtual only format via live webcast on Tuesday, May 11, 2021 at 10:00 a.m. Mountain Daylight Time. Details on how to access the Meeting can be found in the Company’s Management Information Circular.

AKITA DRILLING | 2020 Annual Report4
LETTER TO THE SHAREOWNERS
LETTER TO THE SHAREOWNERS
AKITA Drilling Ltd.’s net loss for the year ended December 31, 2020, was $93,274,000 (net loss of $2.35 per share (basic and diluted)) on revenue of $119,644,000 compared to a net loss of $19,875,000 ($0.50 loss per share (basic and diluted)) on revenue of $175,890,000 in 2019. The Company recorded an asset impairment loss of $80,000,000 in 2020. Adjusting for the asset impairment loss, the Company’s net loss was $20,674,000 (net loss of $0.52 per share (basic and diluted)). Earnings before interest, depreciation, tax and amortization for the current year was $15,617,000 compared to $19,131,000 in 2019, while net cash from operating activities for 2020 was $22,860,000 compared to $21,558,000 in 2019.
The impact of the North American economic slowdown as a result of initiatives implemented to mitigate the spread of the COVID-19 global pandemic can be seen in the activity levels in both of the Company’s geographical segments. In Canada, the Company’s utilization for the year decreased to 13% in 2020 from 19% in 2019. Operating income for the Canadian segment fell to $8,254,000 in 2020 from $13,278,000 in 2019. The uncertainty in the Canadian oilfield industry that characterized 2019 was further exacerbated by the impact of COVID-19 in
We would like to express appreciation to our partners, customers and suppliers who worked closely with us during 2020 to arrive at innovative solutions for working through challenging times in Canada and the US.
2020, making 2020 one of the worst years on record in the Canadian drilling industry. The Company’s operating margin per day increased to $8,734 per day in 2020 from $8,249 in 2019, due primarily to the mix of rigs that worked in 2020. The federal government's CEWS program provided the Company with $2,269,000 in Canadian Emergency Wage Subsidy (“CEWS”) in 2020.
On November 18, 2020, the Canadian Association of Oilwell Drilling Contractors (“CAODC”) released its 2021 industry drilling forecast, estimating 19% average rig utilization, up from the 16% actual average rig utilization in 2020, and estimating 3,771 wells in 2021, up 475 from 3,296 in 2020. The 2021 forecast was based upon commodity price assumptions of USD $51.25 per barrel for crude oil and CAD $2.27 per mcf for natural gas. Based on the CAODC forecast it would appear that 2021 will be slightly better than 2020. However, without improvements to the existing take-away capacity in Canada, growth in the Canadian market may remain challenged. The Company’s focus in 2021 will be on continued cost control in its Canadian operations, while increasing its active rig count.

AKITA DRILLING | 2020 Annual Report 5
LETTER TO THE SHAREOWNERS
industry, operational excellence and he has been instrumental in building a strong and knowledgeable team to assume his duties at AKITA. I would like to sincerely thank Karl for his long and exemplary tenure with AKITA and its predecessors, and wish him all the best in his future endeavours” says AKITA’s Chairman Linda Southern-Heathcott. Assuming the position of Executive Chair and Chief Executive Officer will be Linda Southern-Heathcott, AKITA’s current Board Chair and a founding board member of the Company.
We would like to express a special thanks to AKITA’s employees for their adaptability, hard work, sacrifices and commitment. We would like to express appreciation to our partners, customers and suppliers who worked closely with us during 2020 to arrive at innovative solutions for working through challenging times in Canada and the US. We also wish to acknowledge the contribution of our directors, whose thoughtful counsel and guidance have helped to create, maintain and grow a strong and successful Company. Finally, we acknowledge AKITA Shareowners for their continued support and confidence in the Company.
On behalf of the Board of Directors,
Linda A. Southern-Heathcott Karl A. RuudChairman of the Board President and Chief Executive Officer
March 11, 2021
In the US, AKITA’s utilization decreased to 41% (2,555 operating days) in 2020, compared to 60% (3,747 operating days) for 2019. The Company began the year with 15 rigs operating in the US but this decreased to five rigs by September of 2020. The impact of COVID-19 on demand for oil, which influences the price of WTI, is the dominant factor contributing to the decrease in activity. Revenue in the US division decreased by 28% to $91,198,000 from $127,514,000 in 2019, due to reduced operating days in 2020. At December 31, 2020, the Company’s active rig count increased to eight active rigs in the US, as the price of oil continued to recover. In the US, the Company is looking at 2021 with some optimism as the active rig count continues to improve. However, a significant recovery is not expected in 2021 and the Company’s focus for 2021 will be on continued cost control.
In the first quarter of 2020, the Company underwent a significant cost cutting exercise to give the Company the financial flexibility required in the depressed market conditions. The Company reduced its total selling and administrative expenses to $12,686,000 in 2020 from $20,339,000 in 2019. Additionally the Company repaid $9,953,000 in debt during 2020 including the high interest debt that was assumed with the acquisition of Xtreme Drilling Corp. in September of 2018.
After providing 45 years of dedicated service to the Company, on January 27, 2021, the Company announced the retirement of its President and Chief Executive Officer, Karl Ruud, effective May 15, 2021. “Karl is a man of great character and strength. He was the driving force behind the negotiations on the Xtreme Acquisition and has built a great legacy at AKITA, a legacy that includes one of the best safety records in the

AKITA DRILLING | 2020 Annual Report6
OPERATIONAL PERFORMANCE
Funds Flow from Continuing Operations ($000's) Capital Expenditures ($000's)
OPERATIONAL PERFORMANCERevenue ($000's) Net Earnings (Loss) ($000's)
80,000
60,000
40,000
20,000
2016 2017 2018 2019 20200
160,000
140,000
120,000
100,000
200,000
180,000
20,000
-100,0002016 2017 2018 2019 2020
-60,000
0
-80,000
-40,000
-20,000
30,000
10,000
2016 2017 2018 2019 2020
20,000
40,000
0
25,000
20,000
5,000
2016 2017 2018 2019 2020
15,000
10,000
0

INTEGRITYRESPECTCOMMITMENT
At AKITA - integrity, respect and commitment are the foundational values and guiding principles engrained into every aspect of our operations.

AKITA DRILLING | 2020 Annual Report8
SHARE PERFORMANCE
SHAREPERFORMANCEThe graph below compares the cumulative return over the last five years on the Class A Non-Voting shares and Class B Common shares of the Company from December 31, 2020 with the cumulative total return of the TSX/S&P Composite Stock Index and the TSX Energy Services Sub-Index over the same period, assuming reinvestment of dividends.
Dec. 31, 2015
Dec. 31, 2016
Dec. 31, 2017
Dec. 31, 2018
Dec. 31, 2019
Dec. 31, 2020
AKITA Class A Non-Voting Shares 100 130 137 70 22 9
AKITA Class B Common Shares 100 129 128 77 28 35
TSX/S&P Composite Index 100 121 132 120 148 156
TSX Energy Services Sub-Index 100 137 108 77 53 17
200
150
100
50
2017 2018 20200
2016 20192015
Five Year Total Return on $100 Investment

AKITA DRILLING | 2020 Annual Report 9
SHARE PERFOMANCE
Share Performance2016 2017 2018 2019 2020
Weighted average number of Class A and Class B shares 17,988,552 17,969,415 24,551,542 39,608,191 39,608,191
Total number of Class A and Class B shares 17,948,502 17,945,661 39,608,191 39,608,191 39,608,191
Market prices for Class A Non-Voting shares High $ 9.20 $ 9.88 $ 8.38 $ 4.42 $ 1.22
Low $ 5.88 $ 6.52 $ 3.41 $ 0.75 $ 0.25
Close $ 8.45 $ 7.36 $ 4.07 $ 1.19 $ 0.48
Volume 930,748 1,324,111 2,192,522 8,875,748 21,339,080
Market prices for Class B Common shares High $ 11.00 $ 9.95 $ 8.16 $ 4.48 $ 2.89
Low $ 7.11 $ 6.94 $ 3.77 $ 1.25 $ 0.67
Close $ 8.53 $ 7.61 $ 4.60 $ 1.57 $ 0.77
Volume 18,674 41,479 19,313 53,746 45,986
Dividend HistoryAKITA began paying dividends to shareholders in 1996. In July 2019, AKITA suspended its dividend program in light of the current economic environment.
2016 2017 2018 2019 2020
Dividends per share ($) 0.34 0.34 0.34 0.17 0.00

AKITA DRILLING | 2020 Annual Report10
MANAGEMENT ’S DISCUSSION & ANALYSIS
MANAGEMENT’SDISCUSSION & ANALYSISThe following management’s discussion and analysis (“MD&A”) of the financial condition and results of operations is intended to help the reader understand the current and prospective financial position and operating results of AKITA Drilling Ltd. (“AKITA” or the “Company”). The MD&A discusses the operating and financial results for the year ended December 31, 2020, is dated March 11, 2021, and takes into consideration information available up to that date. The MD&A is based on the audited annual consolidated financial statements of AKITA for the year ended December 31, 2020. The MD&A should be read in conjunction with the audited annual consolidated financial statements and related notes for the year ended December 31, 2020, prepared in accordance with International Financial Reporting Standards (IFRS).
Additional information is available on AKITA’s website (www.AKITA-Drilling.com) and all previous public filings, including the most recently filed Annual Report and Annual Information Form, are available through SEDAR (www.sedar.com). All amounts are denominated in Canadian dollars (CAD) and stated in thousands unless otherwise identified.
IntroductionAKITA is a premier Canadian oil and gas drilling contractor with a fleet of 37 drilling rigs. AKITA provides contract drilling services through two geographical segments: Canada and the United States (“US”). With a fleet of 20 rigs, AKITA’s Canadian division operates in Alberta, British Columbia, Saskatchewan, and from time to time, in the Yukon and the Northwest Territories. The Canadian division operates both wholly-owned rigs and rigs that are partially owned by AKITA and First Nations, Metis or Inuit joint venture partners including Akita Mistiyapew Aski Drilling Ltd., Akita Equtak Drilling Ltd., and Akita Wood Buffalo Drilling Ltd., each of which has defined geographical boundaries and an equity interest in select AKITA rigs. With a fleet of 17 rigs, AKITA’s US division conducts operations in
North Dakota, Colorado, Wyoming, Texas, Utah, New Mexico, and Oklahoma.
With a focus on the efficient provision of drilling services, rigorous crew training, rig maintenance and safety processes and adherence to a leading quality assurance-quality control program, AKITA strives to ensure it is well positioned to meet the most demanding requirements of global operators who offer long-lasting resource-based drilling programs. The Company has utilized this strategy to enhance its development of pad drilling rigs designed for both heavy oil and unconventional natural gas formations.

AKITA DRILLING | 2020 Annual Report 11
MANAGEMENT ’S DISCUSSION & ANALYSIS
Financial Highlights
$Thousands except per share amounts 2020 2019 Change % Change
Revenue 119,664 175,890 (56,226) (32%)Operating expenses 91,855 137,486 (45,631) (33%)Operating margin (1) 27,809 38,404 (10,595) (28%)Margin % (1) 23% 22% 1% 5%Adjusted EBIDTA (1) 15,617 19,130 (3,513) (18%) Per share 0.39 0.48 (0.09) (19%)Adjusted funds flow from operations (1) 10,321 12,925 (2,604) (20%) Per share 0.26 0.33 (0.07) (21%)Net loss 93,274 19,875 73,399 369% Per share 2.35 0.50 1.85 370%Capital expenditures 7,593 15,238 (7,645) (50%)Dividend declared - 6,734 (6,734) (100%)Weighted average shares outstanding 39,608 39,608 - 0%Total assets 251,521 369,116 (117,595) (32%)Total debt 74,303 84,019 (9,716) (12%)
(1) See “Basis of Analysis in this MD&A and Non-GAAP Items”.
Operational Highlights
2020 2019 Change % Change
Operating days Canada 945 1,606 (661) (41%) United States 2,555 3,747 (1,192) (32%)Revenue per operating day (1)
Canada (2) 35,513 33,415 2,098 6%
United States 35,694 34,031 1,663 5%
Operating and maintenance per operating day (1)
Canada (2) 26,779 25,166 1,613 6% United States 27,750 27,000 750 3%Utilization Canada 13% 19% (6%) (32%) United States 41% 60% (19%) (32%)
(1) See “Basis of Analysis in this MD&A and Non-GAAP Items”.(2) Includes AKITA's share of joint venture revenue and expenses. See “Basis of Analysis in this MD&A and Non-GAAP” items.

AKITA DRILLING | 2020 Annual Report12
MANAGEMENT ’S DISCUSSION & ANALYSIS
General OverviewThe impact of the North American economic slowdown as a result of initiatives implemented to mitigate the spread of the COVID-19 global pandemic can be seen in the Company’s 2020 results. The Company recorded a net loss of $93,274,000 in 2020, compared to a loss of $19,875,000 in 2019. Included in the Company’s net loss for 2020 is an $80,000,000 asset impairment expense. Adjusting for impairment, the Company’s net loss for 2020 was $20,674,000. Adjusted funds flow from operations decreased to $10,321,000 in 2020 from $12,925,000 in 2019 and adjusted EBITDA decreased to $15,617,000 from $19,130,000 over the same period.
The Company began 2020 with 10 rigs operating in Canada and 15 rigs operating in the US. As global oil demand decreased due to the impact of COVID-19 related shut downs, however, the Company’s customers put drilling programs on hold and the Company’s operating rigs dropped to one in Canada and four in the US, in September of 2020. This decrease in active
rig count resulted in a material decrease in operating days. In Canada, operating days fell by 41% to 945 operating days in 2020 from 1,606 operating days in 2019. In the US, activity fell 32% to 2,555 operating days in 2020 from 3,747 operating days in 2019.
In the first quarter of 2020, as a result of both reduced activity and a significant oil price decline, the Company underwent a significant cost cutting initiative, reducing costs in all areas of the Company. As a result of the cost cutting initiative, the Company’s selling and administrative expenses decreased to $12,686,000 in 2020 from $20,339,000 in 2019. Notwithstanding the reduction in the Company’s adjusted funds flow from operations, however, AKITA reduced total debt to $74 million at December 31, 2020 from $84 million at December 31, 2019. The debt reduction included the high interest debt assumed with the acquisition of Xtreme Drilling Corp. (“Xtreme”) in September of 2018.
Industry Overview
1) Source: U.S. Energy Information Administration2) Source: NGX (Natural Gas Exchange)
3) Source: Canadian Association of Oilwell Drilling Contractors (CAODC)4) Source: Baker Hughes North American Rotary Rig Count
JAN FEB MAR APR MAY JUN JUL AUG SEP OCT NOV DEC
80.00
70.00
60.00
50.00
40.00
30.00
20.00
10.00
WTI Prices ($USD) (1)
JAN FEB MAR APR MAY JUN JUL AUG SEP OCT NOV DEC
3.0
2.5
2.0
1.5
1.0
0.5
0
Alberta Natural Gas Price ($CAD/GJ) (2)
JAN FEB MAR APR MAY JUN JUL AUG SEP OCT NOV DEC
50%
40%
30%
20%
10%
0%
Industry Utilization Canada (3)
JAN FEB MAR APR MAY JUN JUL AUG SEP OCT NOV DEC
1,200
1,100
1,000
900
800
700
600
500
400
300
200
US Active Rig Count (4)
202020192018

AKITA DRILLING | 2020 Annual Report 13
MANAGEMENT ’S DISCUSSION & ANALYSIS
Oil and gas contract drilling activity is cyclical and is affected by numerous factors, most importantly world crude oil prices and North American natural gas prices. In March 2020, the World Health Organization declared a global pandemic related to COVID-19. To date, the COVID-19 related economic slowdown has resulted in significant declines and volatility in the stock markets, as well as steep reductions in both global oil demand and prices. Additionally, an increase in the global oil supply, brought about by the Saudi Arabia and Russia oil price war in the first quarter of 2020, placed further negative pressure on oil prices, which reached cycle lows in April of 2020. There is significant ongoing uncertainty surrounding the future impact of COVID-19 on both demand and prices for the Company’s drilling services.
In Canada, industry utilization was higher at the beginning of the first quarter of 2020 than at the same point in 2019, but declined rapidly in March as the above mentioned factors reduced demand for drilling services. This decline in demand
Results by Segment Canada$Thousands except per day amounts 2020 2019 Change % Change
Revenue (1) 33,560 53,665 (20,105) (37%)Operating and maintenance (1) 25,306 40,417 (15,111) (37%)Operating margin 8,254 13,248 (4,994) (38%)Margin % 25% 25% 0% 0%Operating days 945 1,606 (661) (41%)Revenue per operating day (1) (2) 35,513 33,415 2,098 6%Operating and maintenance per operating day (1) (2) 26,779 25,166 1,613 6%Operating margin per operating day (1) (2) 8,734 8,249 485 6%Utilization 13% 19% (6%) (32%)Rig count 20 23 (3) (13%)
(1) Includes AKITA's share of joint venture revenue and expenses. See “Basis of Analysis in this MD&A and Non-GAAP Items”.(2) See "Basis of Analysis in this MD&A and Non-GAPP Items".
reached a low point in June of 2020 before it began to slowly improve, however, demand over the year ended well below 2019 levels. By the end of December 2020, the Company’s Canadian division had three active rigs.
In the US, the activity decline that began in the latter part of 2019, due to the volatility in oil and gas prices and the pressure on operators to operate within free cash flow, continues to impact results. These pressures were exacerbated in late Q1 2020, by the combined effects of the Saudi Arabia and Russia oil price war and the effects of the COVID-19 global pandemic. Several of the Company’s drilling rigs operating in the first quarter shut down drilling operations as prices dropped further, leaving five active rigs at the end of September 2020, down from 11 active rigs at the end of March 2020. The Company ended the year with eight active rigs in December of 2020. The total active rig count in the US dropped 67% from 790 rigs at the start of 2020 to 261 rigs at the end of September 2020 before increasing to 341 rigs by year-end.

AKITA DRILLING | 2020 Annual Report14
MANAGEMENT ’S DISCUSSION & ANALYSIS
Utilization rates are a key statistic for the drilling industry since they directly affect total revenue and influence pricing. During 2020, AKITA achieved 945 operating days in Canada, which corresponds to an annual utilization rate of 13%, compared to a 2020 industry average of 16% and a 2019 utilization rate for the Company of 19% (1,606 days). Historically, AKITA’s utilization in Canada has been above industry standard due to the higher than average number of pad drilling rigs in AKITA’s fleet. Pad drilling rigs typically have higher utilization than conventional drilling rigs as pad drilling is a more efficient way to drill multiple wells without requiring trucks to move. The decreased demand in oil sands drilling in 2020 had the largest impact on the Company’s Canadian utilization as oil sands drilling has been a key market for the Company’s Canadian rigs.
Canadian revenue of $33,560,000 in 2020 was 37% lower than 2019 revenue of $53,665,000, due to decreased activity in 2020. Revenue per day increased in 2020 to $35,513 per day from $33,415 per day in 2019, a 6% increase, as a result of a greater percentage of higher specification rigs working. Included in the Canadian operating results is AKITA’s share of
revenue and costs from its joint ventures, as AKITA provides the same drilling services through its joint venture drilling rigs as it does its wholly-owned rigs.
Operating and maintenance costs are tied to activity levels and decreased to $25,306,000 in 2020 from $40,417,000 in 2019 including AKITA’s share of costs from its joint venture rigs. On a per day basis, 2020 costs increased by 6%, consistent with the increase in revenue per day. Also affecting operating and maintenance expense for 2020 is $1,526,000 in Canadian Emergency Wage Subsidy (“CEWS”) payments from the federal government that reduced total expense.
AKITA moved one rig from its Canadian fleet to the US in 2020 and delisted two rigs taking the Company’s Canadian rig count to 20 rigs at December 31, 2020 from 23 at December 31, 2019.
AKITA’s Canadian segment provided drilling services to eight different customers in 2020 (2019 - 19 different customers), including four customers that each provided more than 10% of AKITA’s Canadian revenue for the year (2019 – five customers).
United States
$Thousands except per day amounts (CAD) 2020 2019 Change % Change
Revenue 91,198 127,514 (36,316) (28%)Operating and maintenance 70,901 101,168 (30,267) (30%)Operating margin 20,297 26,346 (6,049) (23%)Margin % 22% 21% 1% 5%Operating days 2,555 3,747 (1,192) (32%)Revenue per operating day (1) 35,694 34,031 1,663 5%Operating and maintenance per operating day (1) 27,750 27,000 750 3%Operating margin per operating day (1) 7,944 7,031 913 13%Utilization 41% 60% (19%) (32%)Rig count 17 17 - -
(1) See “Basis of Analysis in this MD&A and Non-GAAP Items”.
Activity levels in the US were impacted by the collapse in oil prices as drilling rigs began to shut down near the end of the first quarter and continued to shut down into the third quarter of 2020 before ending the year slightly improved from the lows seen in the third quarter.
Revenue in the US was $91,198,000 for 2020, down from $127,514,000 in 2019. This 28% drop in revenue is attributable to the decrease in operating days, which fell 32% to 2,555 operating days in 2020 from 3,747 operating days over the same period in 2019. The impact of COVID-19 on demand for

AKITA DRILLING | 2020 Annual Report 15
MANAGEMENT ’S DISCUSSION & ANALYSIS
SeasonalityThe Canadian drilling industry is seasonal with activity typically building in the fall as the ground freezes and peaking during the winter months. Northern transportation routes become available once areas with muskeg conditions freeze to allow the movement of drilling rigs and other heavy equipment. The peak Canadian drilling season ends with "spring break-up" at which time drilling operations are curtailed due to seasonal road bans (temporary prohibitions on road use) and restricted access to agricultural land as frozen ground thaws. The summer drilling season begins when road bans are lifted. Some areas are subject to environmental orders for specific well leases which can prevent drilling activity during certain periods when authorities prioritize wildlife or habitat
protections. Such restrictions may affect activity levels and operating results.
While activity in the northern part of the US is subject to a degree of seasonality, it is less affected by spring break-up than AKITA’s operations in northern Canada. Other areas in the US where AKITA conducts drilling operations are infrequently subject to weather constraints, especially in the southern states, but may experience operational restrictions for other reasons.
While seasonality can affect all rig classes, pad drilling rigs are generally less susceptible to seasonality than conventional drilling rigs.
Depreciation and Amortization Expense$Millions 2020 2019 Change % Change
Depreciation and amortization expense 32.7 36.8 (4.1) (11%)
The decrease in depreciation and amortization expense to $32,681,000 during 2020 from $36,763,000 during 2019, is due to the impact of the $80,000,000 asset impairment loss the Company recorded in 2020.
AKITA depreciates its drilling rig assets on a straight-line basis where the estimated useful lives and residual values of various rig components have been chosen to match the expected life of that component. In 2020, drilling rig depreciation accounted for 97% of total depreciation expense, compared to 97% in 2019.
While AKITA conducts some of its drilling operations via joint ventures, the drilling rigs used to conduct those activities are owned jointly by AKITA and its joint venture partners, and not by the joint ventures themselves. As the joint ventures do not hold any property, plant, or equipment assets directly, the Company’s depreciation expense includes depreciation on assets involved in both wholly-owned and joint venture activities.
oil, which influences the price of WTI, is the dominant factor contributing to the decrease in activity. Revenue in the US accounted for 76% of the Company’s total 2020 revenue, up from 72% in 2019.
Operating margin per operating day increased to $7,944 in 2020 from $7,031 in 2019 due to standby revenue received on two of the Company’s rigs.
In the US, AKITA provided drilling services to 13 different customers in 2020 (2019 – 19), including two customers that each provided more than 10% of AKITA’s US revenue for the year (2019 – three).

AKITA DRILLING | 2020 Annual Report16
MANAGEMENT ’S DISCUSSION & ANALYSIS
Selling and administrative expenses decreased to $12,686,000 in 2020 from $20,339,000 in 2019. The decrease in 2020 is related to the cost cutting measures implemented by the company in the first quarter of 2020 in light of the low demand for the Company’s services. Also contributing to the decrease in selling and administrative costs is the receipt of COVID-19 related government grants totalling $723,000. Reductions in selling and administrative expenses
were partially offset by the payment of a one-time, long-service retiring allowance of $3,177,000 in the year.
Selling and administrative expenses equated to 11% of revenue in 2020 compared to 12% in 2019. The single largest component of selling and administrative expenses is salaries and benefits which accounted for 75% of these expenses in 2020 (2019 – 45%).
Asset Impairment $Millions 2020 2019 Change % Change
Asset impairment loss 80.0 0.3 79.7 n/a
Selling and Administrative Expenses $Millions 2020 2019 Change % Change
Selling and administrative expenses 12.7 20.3 (7.6) (37%)
During the year ended December 31, 2020, the Company determined that two external indicators of impairment existed: the uncertainty and volatility of oil prices, which impacts the future earnings potential of the Company’s CGUs (cash generating units), and the Company’s book value of its net assets exceeding its market capitalization and therefore, the Company tested its CGUs for asset impairment.
In the first quarter of 2020, the Company recorded an asset impairment loss of $30,000,000 in each of its Canadian and US CGUs respectively. In the fourth quarter of 2020, both CGU's were tested again for impairment and the Company's US CGU's carrying amount exceeded the recoverable amount resulting in an additional impairment of $20,000,000. The total asset impairment loss for the year ended December 31, 2020 was $80,000,000.
The recoverable amounts of these CGUs were determined using a discounted cash flow model. Assumptions used in the discounted cash flow models include the Company’s Board of Directors approved budgets and an average revenue growth rate ranging from 5% to 15% over a 10 year period depending on the CGU being analyzed. In forecasting its projected cash flows the Company assumed a slow recovery commencing in 2021 for both Canada and the US with improvements in activity and revenue per day over the forecast period. Discounted future cash flows are determined by applying a discount rate of 14.5%. This valuation has a IFRS fair value hierarchy of
Level 3. Additionally, in the fourth quarter, management also obtained external equipment appraisals from independent third party experts which supported the fair value less cost to sell.
Asset impairment testing is subject to numerous assumptions, inherent risks and uncertainties, both general and specific, and the risk that the predictions will not be realized. As a result, the following sensitivity analysis has been performed to recognize that additional outcomes are possible:
• Changed future revenue assumptions by 5% resulting in increases to the Company’s CGUs from $15 million to $35 million per CGU and reductions ranging from $15 million to $35 million per CGU; and
• Changed the Company’s pre-tax discount rate by 1% resulting in reductions between $4 million and $11 million per CGU and increases from $4 million to $10 million per CGU.
As drilling rigs are long lived assets, no sensitivity adjustment was made for the projected forecast period.
As the base case test represented management’s best estimates, these sensitivity reductions were not included in the asset impairment loss reported.

AKITA DRILLING | 2020 Annual Report 17
MANAGEMENT ’S DISCUSSION & ANALYSIS
Equity Income from Joint VenturesEquity income from joint ventures is comprised of the following:
$Millions 2020 2019 Change % Change
Proportionate share of revenue from joint ventures 5.1 5.3 (0.2) (4%)
Proportionate share of operating & maintenance expenses from joint ventures 4.4 4.1 0.3 7%
Proportionate share of selling and administrative expenses from joint ventures 0.1 0.1 - 0%
Equity income from joint ventures 0.6 1.1 (0.5) (45%)
Other Income (Loss) $Millions 2020 2019 Change % Change
Interest income - - - n/a
Interest expense (5.6) (6.8) 1.2 18%
Loss on sale of assets (0.2) (0.4) 0.2 50%
Net other gains - 0.4 (0.4) (100%)
Total other loss (5.8) (6.8) 1.0 15%
During 2020, the Company recorded interest expense of $5,637,000 (2019 – $6,771,000). The reduction of the Company’s interest expense relates to the repayment of the Company’s high interest US dollar denominated debt that was assumed with the acquisition of Xtreme Drilling Corp. in 2018 and repaid during 2020.
During 2020, the Company disposed of non-core assets resulting in a loss of $156,000 with total proceeds of $2,142,000 compared to a loss of $476,000 and proceeds of $1,823,000 in 2019.
The Company provides the same drilling services and utilizes the same management, financial and reporting controls for its joint venture activities as it does for its wholly-owned operations. The analyses of these activities are incorporated throughout the relevant sections of this MD&A relating to
activity, revenue per day as well as operating expenses. The decrease in revenue for the Company’s proportionate share of joint ventures is related to the decreased activity for the Company’s joint venture rigs in 2020 compared to the same period in 2019.

AKITA DRILLING | 2020 Annual Report18
MANAGEMENT ’S DISCUSSION & ANALYSIS
Net Loss, Adjusted Funds Flow and Net Cash From Operating Activities$Millions 2020 2019 Change % Change
Net loss (93.3) (19.9) (73.4) (369%)
Net cash from operating activities 22.9 21.6 1.3 6%
Adjusted funds flow from operations (1) 10.3 12.9 (2.6) (20%)
(1) See “Basis of Analysis in this MD&A and Non-GAAP Items”.
AKITA had an income tax recovery of $9,427,000 in 2020 compared to an income tax recovery of $4,804,000 in 2019. Deferred tax recovery increased to $9,311,000 in 2020 compared to $4,872,000 in 2019. The increase in the Company’s deferred tax recovery relates to the impact of the
asset impairment loss recorded in 2020. To a lesser extent, the reduction in the Alberta corporate tax rate from 11.5% in 2019 to 8% in 2020 affected the deferred tax expense.
During 2020, the Company recorded a net loss of $93,274,000 (net loss of $2.35 per Class A Non-Voting and Class B Common share (basic and diluted)) compared to a net loss of $19,875,000 (net loss of $0.50 per Class A Non-Voting and Class B Common share (basic and diluted)) in 2019. The primary factor influencing net income in 2020 was the $80,000,000 asset impairment loss. After adjusting for the impairment, the Company’s net loss for the year was $20,674,000, a 4% increase in net loss, year-over-year. Also influencing the Company’s net loss was a decrease in revenue due to decreased activity offset by decreased selling and
administrative expenses, decreased interest expense and an increased income tax recovery in the year. The influencing factors noted above are discussed throughout this MD&A.
Net cash from operating activities increased in 2020 to $22,860,000 from $21,558,000 in 2019 due primarily to changes in non-cash working capital.
Adjusted funds flow from operations(1) decreased to 10,321,000 in 2020 from $12,295,000 in 2019 due to decreased revenue in the year.
Income Tax Expense (Recovery) $Millions, except income tax rate (%) 2020 2019 Change % Change
Current tax expense (recovery) (0.1) 0.1 (0.2) (200%)
Deferred tax recovery (9.3) (4.9) (4.4) (90%)
Total income tax recovery (9.4) (4.8) (4.6) (96%)
Effective income tax rate 24.6% 26.6%

AKITA DRILLING | 2020 Annual Report 19
MANAGEMENT ’S DISCUSSION & ANALYSIS
Key trends over the past 12 quarters, after giving consideration to the seasonal nature of AKITA’s operations, are as follows:
• The impact on revenue of the Company’s acquisition of Xtreme at the end of the third quarter of 2018 is reflected in the fourth quarter of 2018;
• Revenue in the first quarter of 2020 and 2019 is very similar but the impact of COVID-19 on demand over the balance of 2020 is striking when compared to the subsequent quarters of prior years;
• Day rates in Canada and the US continue to be below full cycle returns resulting in lower than anticipated funds flow from operations and net earnings for the Company; and
• Net cash from operating activities is not directly correlated to market strength on a quarterly basis. Changes in the balance of this account are tied to the timing of changes in various non-cash working capital accounts.
Summary of Quarterly ResultsThe following table shows key selected quarterly financial information for the Company:
Three Months Ended
$Thousands, except per share (unaudited) Mar. 31 Jun. 30 Sep. 30 Dec. 31 Annual Totals
2020
Revenue 53,572 26,359 18,849 20,884 119,664
Net loss (52,257) (5,221) (8,203) (27,593) (93,274)
Loss per share (basic and diluted) ($) (1.32) (0.13) (0.21) (0.69) (2.35)
Adjusted funds flow from (used in) operations (1) 10,154 2,099 (669) (1,263) 10,321
Cash flow from operations 4,583 13,621 3,374 1,282 22,860
2019
Revenue 52,342 39,119 42,610 41,819 175,890
Net loss (1,470) (5,067) (5,397) (7,941) (19,875)
Loss per share (basic and diluted) ($) (0.04) (0.13) (0.14) (0.19) (0.50)
Adjusted funds flow from operations (1) 7,828 1,559 3,076 462 12,925
Cash flow from (used in) operations (4,287) 24,903 (735) 1,677 21,558
2018
Revenue 27,089 17,293 22,465 51,514 118,361
Net loss (1,912) (2,959) (5,459) (5,609) (15,939)
Loss per share (basic and diluted) ($) (0.11) (0.16) (0.24) (0.14) (0.65)
Adjusted funds flow from (used in) operations (1) 4,519 1,638 (637) 8,615 14,135
Cash flow from (used in) operations 2,819 9,860 (7,428) (13,745) (8,494)
(1) See “Basis of Analysis in this MD&A and Non-GAAP Items”.

AKITA DRILLING | 2020 Annual Report20
MANAGEMENT ’S DISCUSSION & ANALYSIS
Fourth Quarter Analysis Operational Highlights
For the three months ended December 31, 2020 2019 Change % Change
Operating days Canada 100 390 (290) (74%) United States 507 756 (249) (33%)Revenue per operating day (1)
Canada (2) 46,850 34,910 11,940 34%
United States 32,083 40,483 (8,400) (21%)
Operating and maintenance per operating day (1)
Canada (2) 39,473 26,553 12,920 49% United States 24,525 35,631 (11,106) (31%)Operating margin per operating day (1)
Canada (2) 7,377 9,434 (2,057) (22%) United States 7,558 9,670 (2,112) (22%)Utilization Canada 5% 18% (13%) (71%) United States 32% 48% (16%) (33%)
(1) See “Basis of Analysis in this MD&A and Non-GAAP Items”.(2) Includes AKITA's share of joint venture revenue and expenses. See "Basis of Analysis in this MD&A and Non-GAAP Items”.
During the fourth quarter of 2020, the Company had 100 operating days in Canada compared to 390 operating days during the corresponding period in 2019. In the US, operating days decreased by 33% to 507 in the fourth quarter of 2020 from 756 in the fourth quarter of 2019. The negative impact of COVID-19 on oil prices was the key driver for the 2020 fourth quarter activity decline.
AKITA incurred a net loss of $27,593,000 (net loss of $0.69 per Class A Non-Voting and Class B Common share (basic and
diluted)) for the fourth quarter of 2020 compared to a net loss of $7,941,000 (net loss of $0.19 (basic and diluted)) in the fourth quarter of 2019. The increased loss in 2020 is a result of the asset impairment loss recorded on the Company’s US CGU. Decreased activity also contributed to the increased loss. Adjusted funds flow from operations decreased to a loss of $1,262,000 in the fourth quarter of 2020 from $462,000 in the corresponding quarter in 2019 due to lower activity and one-time selling and administrative expenses.

AKITA DRILLING | 2020 Annual Report 21
MANAGEMENT ’S DISCUSSION & ANALYSIS
Three Year Annual Financial Summary The following table highlights AKITA’s annual financial results for the last three years:
Three Year Summary $Thousands, except per share (unaudited)
2020 2019 2018
Revenue 119,664 175,890 118,361Net loss (93,274) (19,875) (15,939)Loss per share (basic and diluted) (2.35) (0.50) (0.65)Dividends per Class A Non-Voting and Class B Common share (1) - 0.17 0.34Adjusted funds flow from operations (2) 10,321 12,925 14,135Net cash from (used in) operating activities 22,860 21,558 (8,494)Year-end working capital 8,683 4,155 11,166Year-end shareholders' equity 152,266 245,134 271,728Year-end total assets 251,521 369,116 403,641
(1) The Company's dividend program was suspended in July of 2019. (2) See “Basis of Analysis in this MD&A and Non-GAAP Items”.
Liquidity and Capital ResourcesAt December 31, 2020, AKITA had $8,683,000 in working capital (working capital ratio of 1.56:1) with $7,108,000 of cash, compared to a working capital of $4,155,000 (working capital ratio of 1.14:1) and nil cash for the previous year. In 2020, AKITA generated $22,860,000 in cash from operating activities. Positive cash was generated from joint venture distributions ($1,411,000) and from proceeds on sales of assets ($2,142,000). During the same period, cash was used for capital expenditures ($7,593,000) and repayment of debt ($9,953,000). Accounts payable at year-end included $5,907,000 in accrued expenses, two thirds of which related to routine operations and one third of which related to one-time items.
The Company has a syndicated credit agreement with the Company’s principal banker as the agent on the syndication and three other Canadian banks in the syndication. The operating loan facility totals $110,000,000 with the term ending in 2023. The credit agreement was amended on July 17, 2020, to include a covenant relief period that extended to June 30, 2021. The facility was further amended two more times to add additional quarters of covenant relief for September 30, 2021 and December 31, 2021. The interest rate during the covenant relief period ranges from 225 to 350 basis points over prime interest rates depending on the Funded
Debt(1) to Tangible Net Worth(1) Ratio. Security for this facility includes all present and after-acquired personal property and a first floating charge over all other present and after-acquired property including real property. The financial covenants are:
1. The Funded Debt(1) to Tangible Net Worth(1) Ratio: the Company shall ensure that for the fiscal quarters ended December 31, 2020 to December 31, 2021, the Funded Debt(1) to Tangible Net Worth(1) Ratio shall not be more than 0.75:1.00.
The Funded Debt(1) to Tangible Net Worth(1) Ratio shall be calculated quarterly on the last day of each Fiscal Quarter on a rolling four quarter basis; and
2. The EBITDA(1) to Interest Expense(1) Ratio: the Company shall ensure that:
(i) For the fiscal quarter ended December 31, 2020, the EBITDA(1) to Interest Expense(1) Ratio shall not be less than 1.25:1.00;
(ii) For the fiscal quarters ended March 31, 2021, and June 30, 2021, the EBITDA(1) to Interest Expense(1) Ratio is waived, and
(iii) For the fiscal quarter ended September 30, 2021, the EBITDA(1) to Interest Expense(1) Ratio shall not be less than 0.75:1.00;
(1) Readers should be aware that each of the EBITDA, Funded Debt, Interest Expense, Eligible Accounts Receivable, Priority Payables and Eligible Fixed Assets have specifically set out definitions in the loan facility agreement and are not necessarily defined by or consistent with either GAAP or determinations by other users for other purposes.

AKITA DRILLING | 2020 Annual Report22
MANAGEMENT ’S DISCUSSION & ANALYSIS
(iv) For the fiscal quarter ended December 31, 2021, the EBITDA(1) to Interest Expense(1) Ratio shall not be less than 1.25:1.00
The EBITDA(1) to Interest Expense(1) Ratio shall be calculated quarterly on the last day of each Fiscal Quarter on a rolling four quarter basis; and
3. A minimum trailing twelve month EBITDA(1) test will be required quarterly during the Covenant Relief Period, with EBITDA(1) varying each period in line with agreed upon forecasts.
Upon the end of the Covenant Relief Period the Company’s covenants revert back to:
(i) Funded Debt(1) to EBITDA(1) Ratio of not more than 3.00:1.00
(ii) EBITDA(1) to Interest Expense(1) Ratio of not less than 3.00:1.00
At December 31, 2020, the Company was in compliance with its covenants with a Funded Debt(1) to Tangible Net Worth(1)
Ratio of 0.38:1.00, an EBITDA(1) to Interest Expense(1) Ratio of 3.94:1.00 and a trailing twelve month EBITDA(1) in excess of the $17,612,000 minimum threshold.
Property, Plant and EquipmentCapital expenditures totaled $7,593,000 in 2020 ($15,238,000 in 2019). Capital spending in 2020 was as follows: $2,920,000 (2019 - $7,545,000) for certifications and overhauls, $1,592,000 (2019 - $2,837,000) in drill pipe and drill collars and $3,081,000 (2019 - $4,856,000) for drilling rig equipment and upgrades.
The facility also includes a borrowing base calculation which is the sum of:
(i) 75% of Eligible Accounts Receivable(1); plus
(ii) 50% of the orderly liquidation value of all Eligible Rig Assets(1); less
(iii) Priority Payables(1) of the Loan Parties.
At December 31, 2020, the Company’s borrowing base totalled $116,796,000.
The Company borrowed $75,000,000 from this facility as at December 31, 2020 (December 31, 2019 - $77,535,000).
The Company's objectives when managing capital are:
• to safeguard the Company's ability to continue as a going concern, so that it can continue to provide returns for shareholders and benefits for other stakeholders; and
• to augment existing resources in order to meet further growth opportunities.
The Company manages the capital structure and makes adjustments to it in light of changes in economic conditions and the risk characteristics of the underlying assets. In order to maintain or adjust the capital structure, the Company may adjust the amount of dividends paid to shareholders, repurchase shares, issue new shares, sell assets or take on long-term debt.
During 2020, the Company sold ancillary assets for $2,142,000 (2019 - $1,823,000) that resulted in a loss of $156,000 (2019 – $476,000).
(1) Readers should be aware that each of the EBITDA, Funded Debt, Interest Expense, Eligible Accounts Receivable, Priority Payables and Eligible Fixed Assets have specifically set out definitions in the loan facility agreement and are not necessarily defined by or consistent with either GAAP or determinations by other users for other purposes.

AKITA DRILLING | 2020 Annual Report 23
MANAGEMENT ’S DISCUSSION & ANALYSIS
23
Financial InstrumentsThe Company’s financial assets and liabilities include cash, accounts receivable, accounts payable, accrued liabilities and financial instruments. Fair values approximate carrying values unless otherwise stated.
The Company is exposed to risks caused by fluctuations in currency exchange rates. US contracts are denominated in United States dollars and, accordingly, a material decrease in the value of the US dollar could negatively impact revenues. The Company does not currently use hedges to offset this risk.
Off Balance Sheet TransactionsAKITA has not entered into any arrangements that involve off balance sheet transactions.
Despite the effect of weak commodity prices for crude oil and natural gas on AKITA’s customers, management continues to consider the credit risk associated with accounts receivable to be generally low. AKITA has conservative credit-granting procedures and in certain situations requires customers to make advance payment prior to provision of services or takes other measures to mitigate credit risk. Provisions have been estimated by management and are included in the accounts to recognize potential credit losses.
sponsorship and advertising contract with Spruce Meadows was $350,000. Costs incurred related to this contract during 2020 were $175,000 (2019 - $325,000). Costs and related services are consistent with parties dealing at arm’s length.
The Company is related to its joint ventures. The following table summarizes transactions and annual balances with its joint ventures. These transactions were made in the normal course of business with regular payment terms and have been recorded at the paid amounts.
$Thousands 2020 2019
Operating and maintenance expenses 837 773
Selling and administrative expenses 115 103
Year-end due to AKITA from partners 991 1,031
Year-end due to AKITA from joint ventures 123 885
Commitments and ContingenciesFrom time to time, the Company enters into drilling contracts with its customers that are for extended periods. At December 31, 2020, the Company had four drilling rigs with multi-year contracts. These multi-year contracts are due to expire in 2021.
The Company has entered into a two year contract with a related party to provide sponsorship and advertising at an annual cost of $175,000.
At December 31, 2020, the Company had capital expenditure commitments of $422,000 (2019 – $1,406,000).
Related Party TransactionsAKITA is affiliated with the ATCO Group of companies and with Spruce Meadows, an equestrian show jumping facility, through its majority shareholder. All related party transactions in 2020 and 2019 were made in the normal course of business with regular payment terms and have been recorded at the paid amounts. Operating purchases totaled $851,000, and included sponsorship and advertising of $175,000, wellsite trailers of $57,000, operational costs of $570,000 and other miscellaneous purchases of $49,000. At December 31, 2020, the outstanding commitment of the Company’s multi-year

AKITA DRILLING | 2020 Annual Report24
MANAGEMENT ’S DISCUSSION & ANALYSIS
Accounting EstimatesThe preparation of AKITA’s consolidated financial statements requires management to make estimates and assumptions that affect the reported amounts of assets and liabilities and disclosure of contingent liabilities as at the date of the consolidated financial statements as well as reported amounts for revenue and expenses for the year. Estimates and judgments are continually evaluated and are based upon historical experience and other factors including expectations of future events that are believed to be reasonable in the circumstances. Actual outcomes could differ materially from these estimates.
The Company makes assumptions relating to transactions that were incomplete at the Statement of Financial Position date.
Depending on the actual transaction, total assets and liabilities of the Company as well as results of operations, including net income, could be either understated or overstated as a result of differences between amounts accrued for incomplete transactions and the subsequent actual balances.
The preparation of AKITA’s consolidated financial statements requires management to make significant estimates relating to the useful lives of drilling rigs. Depreciation methods and rates have been selected so as to amortize the net cost of each asset over its expected useful life to its estimated residual value. The estimated useful lives, residual values and depreciation methods are reviewed at the end of each annual reporting period.
AuthorizedAn unlimited number of Class A Non-Voting shares An unlimited number of Class B Common shares
Issued Class A Non-Voting Class B Common Total
$Thousands, except share amounts
Number of Shares Consideration
Number of Shares Consideration
Number of Shares Consideration
December 31, 2019 37,954,407 144,898 1,653,784 1,366 39,608,191 146,264
Shares issued in 2020 - - - - - -
December 31, 2020 37,954,407 144,898 1,653,784 1,366 39,608,191 146,264
At March 11, 2021, the Company had 37,954,407 Class A Non-Voting shares and 1,653,784 Class B Common shares
Class A and Class B Share Dividends
outstanding. At that date, there were also 842,500 stock options outstanding, of which 249,000 were exercisable.
Class A Non-Voting and Class B Common Shares
B Common shares. The Company’s dividend program was suspended in July of 2019 to improve the Company’s financial flexibility in response to the weakened industry environment.
Per share 2020 2019 Change % Change
Dividends per share ($) - 0.17 (0.17) (100%)
During 2019, AKITA declared dividends totaling $6,374,000 ($0.17 per share) on its Class A Non-Voting shares and Class
AKITA DRILLING | 2020 Annual Report 25
MANAGEMENT ’S DISCUSSION & ANALYSIS
AKITA’s depreciation estimates do not have any effect on the changes to the financial condition for the Company, as depreciation is a non-cash item. However, total assets and results of operations, including net income, could be either understated or overstated as a result of excessively high or low depreciation estimates.
At each reporting date, the Company assesses whether there are indicators of asset impairment. If such indicators exist, the Company performs an asset impairment test and, if required, the Company recognizes an asset impairment loss calculated as the lesser of the difference between the amortized cost of the asset and the present value of the estimated future cash flows or the recoverable amount. The carrying amount of the asset is reduced by the impairment loss.
AKITA’s asset impairment estimates do not have any effect on the changes to financial condition for the Company, as any asset write down would be a non-cash item. However, total assets and results of operations, including net income, could be overstated as a result of projections of discounted future cash flows that are too high.
A significant estimate used in the preparation of AKITA’s consolidated financial statements relates to the long-term defined benefit pension liability for certain employees and retired employees that was recorded as $5,710,000 at December 31, 2020 (2019 - $5,208,000). Changes in AKITA’s pension liability estimates do not have any effect on the changes to the financial condition of the Company, since the defined benefit pension is a non-cash item. However, total liabilities and results of operations, including net income, could be either understated or overstated as a result of pension estimates that are either too high or too low. AKITA utilizes the services of a third party to assist in the actuarial estimate of the Company’s pension expense and liability. For 2020, a key assumption is the 2.3% discount rate (2019 – 3.0%).
The Company makes assumptions relating to deferred income taxes, including future tax rates, timing of reversals of timing differences and the anticipated tax rules that will be in place when timing differences reverse. Consequently, total liabilities of the Company as well as results of operations, including net income, could be either understated or overstated.
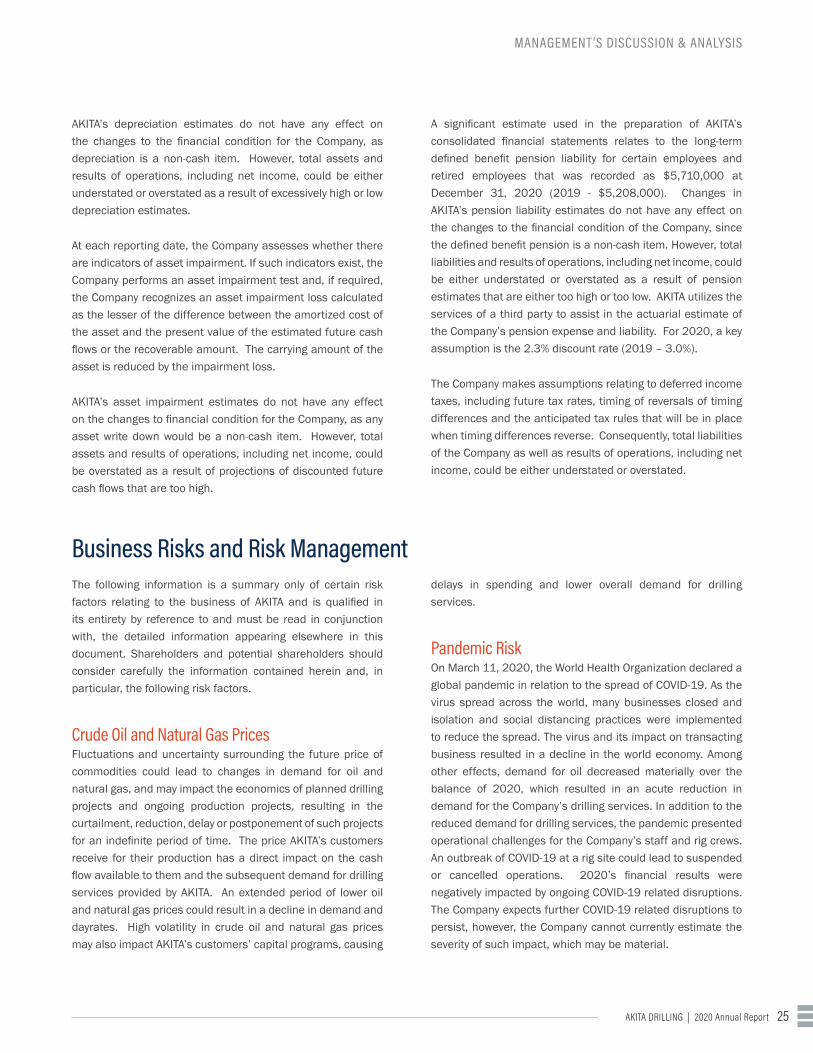
Business Risks and Risk ManagementThe following information is a summary only of certain risk factors relating to the business of AKITA and is qualified in its entirety by reference to and must be read in conjunction with, the detailed information appearing elsewhere in this document. Shareholders and potential shareholders should consider carefully the information contained herein and, in particular, the following risk factors.
Crude Oil and Natural Gas PricesFluctuations and uncertainty surrounding the future price of commodities could lead to changes in demand for oil and natural gas, and may impact the economics of planned drilling projects and ongoing production projects, resulting in the curtailment, reduction, delay or postponement of such projects for an indefinite period of time. The price AKITA’s customers receive for their production has a direct impact on the cash flow available to them and the subsequent demand for drilling services provided by AKITA. An extended period of lower oil and natural gas prices could result in a decline in demand and dayrates. High volatility in crude oil and natural gas prices may also impact AKITA’s customers’ capital programs, causing
delays in spending and lower overall demand for drilling services.
Pandemic RiskOn March 11, 2020, the World Health Organization declared a global pandemic in relation to the spread of COVID-19. As the virus spread across the world, many businesses closed and isolation and social distancing practices were implemented to reduce the spread. The virus and its impact on transacting business resulted in a decline in the world economy. Among other effects, demand for oil decreased materially over the balance of 2020, which resulted in an acute reduction in demand for the Company’s drilling services. In addition to the reduced demand for drilling services, the pandemic presented operational challenges for the Company’s staff and rig crews. An outbreak of COVID-19 at a rig site could lead to suspended or cancelled operations. 2020’s financial results were negatively impacted by ongoing COVID-19 related disruptions. The Company expects further COVID-19 related disruptions to persist, however, the Company cannot currently estimate the severity of such impact, which may be material.

AKITA DRILLING | 2020 Annual Report26
MANAGEMENT ’S DISCUSSION & ANALYSIS
Debt Service AKITA has a syndicated credit facility. Variations in interest rates and principal repayments, under the terms of the facility, could result in significant changes in the amount required to be applied to debt service before payment of any amounts by AKITA. Although management’s view is that AKITA’s current facility is sufficient, there is no assurance that it will be adequate for the future financial obligations of AKITA or that additional funds can be obtained if required.
AKITA’s credit facility is a revolving facility which matures on September 11, 2023 and is subject to annual extensions of an additional year on each anniversary date of the closing date, contingent upon the consent of the lenders holding two-thirds of the aggregate commitments under the facility. To the extent the facility is not extended, the drawn down principal would be due on the maturity date. Interest payments are required quarterly and are based on the Canadian prime rate for Canadian prime rate loans and the US prime rate for US rate loans.
Leverage and Restrictive Covenants AKITA has third party debt service obligations under its credit facility. The degree to which AKITA is leveraged could have important consequences to shareholders, including:
i. a portion of the consolidated cash flow from operations could be dedicated to the payment of the principal and interest on indebtedness, thereby reducing cash available for other initiatives; and
ii. certain borrowings are at variable rates of interest, which exposes AKITA to the risk of increased interest rates.
AKITA's ability to make scheduled payments of principal and interest on, or to refinance, its indebtedness will depend on its future operating performance and cash flow, which are subject to prevailing economic conditions, prevailing interest rate levels and financial, competitive, business and other factors, many of which are beyond its control.
AKITA’s credit facilities contain certain customary operating covenants that limit the discretion of management to incur additional indebtedness, to create liens or other
encumbrances, to pay dividends or make certain other payments, investments, loans and guarantees and to sell or otherwise dispose of assets and merge or consolidate with another entity. In addition, AKITA is required to satisfy and maintain two financial ratio tests, Debt to EBITDA and EBITDA to Interest Expense. A failure to comply with the obligations in the agreements in respect of the credit facilities could result in an event of default which, if not cured or waived, could permit acceleration of the repayment of the relevant indebtedness. If the repayment of the indebtedness under the credit facilities were to be accelerated, there can be no assurance that AKITA's assets would be sufficient to repay the debt. Currently AKITA is in a covenant relief period whereby the financial covenants are relaxed or waived until December 31, 2021.
Competition The contract drilling industry is highly competitive and includes a large number of drilling contractors with varied rig fleets. Drilling contracts are usually awarded through a competitive bid process with pricing and rig suitability and availability being primary drivers in the bid process. Other factors that influence the bid process include: mobility and efficiency of the rig; experience and quality of service provided by rig crews; safety record of the rig as well as the contractor as a whole; and the adaptability of equipment to utilize new technologies. Rigs can be moved from one region to another depending on the competitive environment within that region and therefore a contractor’s competitive advantage in a region can be quickly eroded by other contractors moving in equipment from other regions. Reduced levels of activity in the oil and gas industry can also increase competition and therefore lower day rates.
Operating Hazards AKITA’s operations are subject to numerous hazards inherent to the drilling industry, including but not limited to: fires or explosions, hydrocarbon influx or kicks, loss of well control, well blow-outs, cratering, collapse of the well, damage to, or loss of, drilling equipment and equipment lost down the hole. AKITA’s insurance policies and contractual indemnity rights may not adequately cover all losses, and therefore, the Company may not have adequate insurance coverage or rights to indemnity for all risks. Pollution and environmental risks may not be fully insurable. AKITA generally attempts to obtain contractual protection against uninsured operating risks from

AKITA DRILLING | 2020 Annual Report 27
MANAGEMENT ’S DISCUSSION & ANALYSIS
its customers. However, customers who provide contractual indemnification protection may not in all cases maintain adequate insurance or otherwise have the financial resources necessary to support their indemnification obligations. AKITA’s insurance or indemnification arrangements may not adequately protect it against liability or loss from all operating hazards. Further, certain states in the US where AKITA operates have anti-indemnity legislation that could preclude operator indemnification in certain circumstances. The occurrence of a significant event that has not been fully insured or indemnified against, the failure of a customer to meet its indemnification obligations to the Company, or the applicability of anti-indemnification legislation could materially and adversely affect the results of operations and financial condition.
Dependence on Major Customers AKITA earned 61% of its total revenue in 2020 from two major customers. These were the only customers who individually provided over 10% of the Company’s revenue for the year. The loss of one or more major customers or a significant reduction in the business done with any customer without offsetting new revenue could have a material adverse effect on AKITA’s business, results of operations and prospects.
Seasonal Nature of Industry In Canada, the level of activity in the contract drilling industry, particularly for conventional rigs, is influenced by seasonal weather patterns. Spring breakup, which typically occurs between mid-March and mid-June, makes the ground unstable leaving many secondary roads temporarily incapable of supporting the weight of heavy equipment, thereby reducing drilling activity levels. In addition, during excessively rainy periods, equipment moves may be delayed, thereby adversely affecting revenue.
Typically, there is greater demand for contract drilling services in the winter as freezing permits the movement and operation of heavy equipment. Drilling activities tend to increase in the fall as the ground begins to freeze and peak in the winter months of November through February as areas having muskeg conditions also become accessible to drilling operations. Variability in the weather can therefore create unpredictability in activity and utilization rates. Unusually warm weather may limit access to drilling sites and could have a material adverse
effect on the Company’s business, financial condition, results of operations and cash flows.
Generally speaking, AKITA’s US operations are less affected by seasonality than AKITA’s Canadian operations. Areas in the US where AKITA operates are infrequently subject to weather constraints like hurricanes in the southern states, but the Company may experience operational constraints such as floods, blizzards and other extreme winter conditions in the Rocky Mountain region in addition to operational restrictions for a variety of other reasons. These restrictions could have a material adverse effect on the Company’s business, financial condition, results of operations and cash flows.
Volatility of Industry Conditions The demand, pricing and terms for contract drilling services are dependent upon the level of industry activity for Canadian and US crude oil and natural gas exploration and development. Industry conditions are influenced by numerous factors which AKITA does not control including (without limitation): current crude oil and natural gas prices, expectations about future crude oil and natural gas prices, the cost of exploring for, producing and delivering crude oil and natural gas, the expected rates of decline in current production for AKITA’s customers, discovery rates of new oil and gas reserves by AKITA’s customers, available pipeline and other oil and gas transportation capacity, weather conditions, political, regulatory and economic conditions, influences from special interest groups, the use of energy generated from sources that are not crude oil or natural gas based, the ability of oil and gas companies to raise equity capital or debt financing and technological advances in the exploration and production of crude oil and natural gas.
The level of activity in both the Canadian and US oil and gas exploration and production industry is volatile. No assurance can be given that the expected trends in oil and gas exploration and production activities will continue or that demand for contract drilling services will reflect the level of activity in the industry. Current global economic events and uncertainty have significantly affected, and may continue to significantly affect, commodity pricing. Any prolonged substantial reduction in crude oil and natural gas prices would likely continue to affect oil and gas production levels and therefore adversely affect the demand for drilling services to oil and gas customers. Any

AKITA DRILLING | 2020 Annual Report28
MANAGEMENT ’S DISCUSSION & ANALYSIS
elimination or curtailment of government incentives or adverse changes in government regulation could have a significant impact on the contract drilling industry in Canada or in the US. These factors could lead to a further decline in demand for AKITA’s services which could result in a material adverse effect on AKITA’s business, financial condition, results of operations and cash flows.
Labour The contract drilling industry is dependent upon attracting, developing and maintaining a skilled and safe workforce. During periods of peak activity levels, AKITA is susceptible to increased labour costs as a result of a competitive labour market or may be faced with a lack of experienced personnel to operate AKITA’s equipment. AKITA is also faced with the challenge of retaining employees during periods of low utilization. The Company’s financial results depend, at least in part, upon its ability to attract, develop and maintain a skilled work force, while maintaining a cost structure that varies with activity levels.
A number of AKITA’s key customers evaluate the ability of contract drilling companies to provide and maintain a high standard of safe operations prior to their selecting a drilling contractor for the provision of drilling services. AKITA’s financial success is related to its ability to continue to meet those expectations.
Capital Overbuild in Contract Drilling Industry Drilling rigs have a long life span. Further, there is a significant lag between when the decision to build a rig is made and when the construction is complete. These two factors contribute to the supply of rigs in the industry not always aligning with the demand for drilling rigs. High demand typically spurs greater capital expenditures by drilling contractors which may, in turn, lead to excessive supply in future periods. A potential capital overbuild could lead to a general reduction in rates in the industry as a whole, which could have a material adverse effect on AKITA’s business, financial condition, results of operations and cash flows. The cyclical nature of AKITA’s business makes the impact of this risk significant.
Access to Additional Financing AKITA may find it necessary in the future to obtain additional debt or equity financing to support ongoing operations, undertake capital expenditures or undertake acquisitions
or other business combination activities. There can be no guarantee that AKITA will have access to the required capital as its ability to do so is dependent on, among other factors, the overall state of capital markets, interest rates, the oil and gas industry as well as the appetite for investment in the oilfield drilling industry. As an oilfield service company, AKITA’s ability to obtain additional debt or equity financing could be constrained by pressure from investors and environmental groups to divest from fossil fuel related investments. An inability to obtain necessary financing, on terms that are acceptable to AKITA, could limit AKITA’s growth and could have a material adverse effect on AKITA’s business, financial condition and cash flows in the future. Access to financing also impacts AKITA’s customers, potentially limiting capital budgets and therefore the demand for AKITA’s services.
Foreign Exchange and Foreign Operations Risk AKITA’s expansion into the United States increases the Company’s exposure to risks inherent in foreign operations. The Company is exposed to risks caused by fluctuations in currency exchange rates. US contracts are denominated in United States dollars and, accordingly, a material decrease in the value of the United States dollar could negatively impact revenues.
In addition to foreign exchange, risks include, but are not limited to: different taxation regimes, potential litigation and potential political protectionist measures. While AKITA has increased its insurance coverage to offset the increased chance of litigation and has engaged third party experts to assist in taxation matters, there can be no assurance that the Company will be fully effective in mitigating foreign operation risks. Such risks could have material adverse effects on AKITA’s business, financial condition, results of operations and cash flows.
Regulation of IndustryAKITA’s operations are subject to a variety of federal, provincial, state and local laws, regulations and guidelines relating to health and safety, the conduct of operations, the operation of equipment used in drilling operations and the transportation of materials and equipment provided to customers. Compliance with, or breaches of, such laws, or costs or implications of changes to such laws, regulations and guidelines could have a material effect on AKITA’s business, financial condition, results of operations and cash flows.

AKITA DRILLING | 2020 Annual Report 29
MANAGEMENT ’S DISCUSSION & ANALYSIS
Carbon Emissions, Climate Change Activism and Environmental RegulationsWhile AKITA’s operations, and those of its customers, are subject to numerous laws, regulations and guidelines governing the management, transportation and disposal of hazardous substances and other waste materials and otherwise relating to the protection of the environment, the trend in environmental regulation has been to impose more restrictions and limitations on activities that may impact the environment, particularly regarding the generation of carbon emissions. AKITA operates in jurisdictions that have regulated, or proposed to regulate, industrial carbon emissions. Laws and regulations implemented to reduce carbon emissions have potential to impose significant compliance costs on the oil and gas, potash and mining companies that the Corporation provides drilling services for. Consequently, future oil and gas, potash and mining development could face increased operating costs relating to increased carbon regulation which could result in a reduced demand for the drilling services that AKITA provides.
In recent years, public support for climate change action and pressure by climate activists to shift from fossil fuels to alternative and renewable energy technology has grown. Climate change activism impact could reduce demand for hydrocarbons in favour of lower carbon intense fuels. Further, within Canada, increased climate change activism has translated to opposition to new pipeline approvals, to ongoing oil sands development and to the practice of hydraulic fracturing. In the US, the Biden Administration has recently implemented restrictions of drilling permits on federal lands and has stopped the construction of the Keystone pipeline.
Laws, regulations and guidelines relating to carbon emissions, spills, releases, and discharges of hazardous substances or other waste materials into the environment, requiring removal or remediation of pollutants or contaminants are increasingly becoming more stringent and can impose civil and criminal penalties for violations. Some of the laws, regulations and guidelines that apply to AKITA’s operations also authorize the recovery of natural resource damages by governmental authorities, injunctive relief and the imposition of stop, control, remediation and abandonment orders. The costs arising from compliance with such laws, regulations and guidelines may be material to AKITA.
While AKITA maintains liability insurance, including insurance for environmental claims, there can be no assurance that insurance will continue to be available to AKITA on commercially
reasonable terms, that the possible types of liabilities that may be incurred by AKITA will be covered by AKITA’s insurance, or that the dollar amount of such liabilities will not exceed AKITA’s policy limits. Even a partially uninsured claim, if successful and of sufficient magnitude, could have a material adverse effect on AKITA’s business, results of operations and prospects.
Key ManagementThe success and growth of AKITA are dependent upon its key management personnel. The loss of services of any of such persons without suitable replacements could have a material adverse effect on the business and operations of AKITA. While this risk is mitigated by ongoing succession planning, no assurance can be provided that AKITA will be able to retain key management members.
DilutionAKITA’s articles permit the issuance of an unlimited number of Class A Non-Voting or Class B Common shares and the Company may make future acquisitions or enter into financings or other transactions involving the issuance of securities of AKITA which may be dilutive.
Energy AlternativesAKITA’s management cannot predict the impact of changing demand for crude oil and natural gas products. Fuel conservation measures, alternative fuel requirements, opposition to fossil fuel energy, increasing consumer demand for alternatives to crude oil and gas and technological advances in fuel economy and energy generation devices could reduce the demand for crude oil, natural gas and other liquid hydrocarbons. Any major change in demand for crude oil, natural gas or other liquid hydrocarbons could result in a reduction in the demand for drilling services and could have a material adverse effect on AKITA’s business, financial condition, results of operations and cash flow.

AKITA DRILLING | 2020 Annual Report30
MANAGEMENT ’S DISCUSSION & ANALYSIS
Risk Management AKITA manages its risks by:
• maintaining a conservative balance sheet that includes a low cost structure for the Company;
• having its risk management committee deliberate periodically to assess, evaluate and develop a plan to deal with the risk conditions for the Company;
• developing an annual strategic business plan and budget to help determine the levels of capital and operating expenditures;
• continuously developing long-term relationships with a core base of customers who maintain ongoing drilling programs during all phases of the economic cycle;
• obtaining multi-year drilling contracts whenever possible, but especially when tailoring rig construction or reconfiguration to customer demand;
• maintaining an efficient fleet of drilling rigs through a rigorous ongoing maintenance program;
• continually upgrading its rig fleet;
• employing well-trained, experienced and responsible employees;
• ensuring that all employees comply with clearly defined safety standards;
• reducing health, safety and operational risk by maintaining its API Q2 certification in Canada;
• improving the skills of its employees through training programs;
• maintaining effective systems of internal control to safeguard assets and ensure timely and accurate reporting of financial results;
• maintaining comprehensive insurance policies with respect to its operations;
• reducing environmental risk through the implementation of industry-leading standards, policies and procedures;
• developing and maintaining a succession plan to provide for a smooth transition in the event of key personnel turnover; and
• diversifying into the US market where demand for drilling services is correlated to West Texas Intermediate pricing rather than Western Canadian Select pricing as in Canada and which allows AKITA to generate revenue denominated in US currency.
Furthermore, in response to the COVID-19 pandemic, the Company actively assessed and responded to the effects of the COVID-19 pandemic on employees, customers, suppliers and service providers, and evaluated governmental actions being taken to curtail its spread. The Company successfully implemented a mandatory work-from-home program for a portion of the year for those employees who could perform their day-to-day activities working remotely. At our operation facilities and for active rig personnel, in accordance with applicable laws, the Company implemented measures to safeguard employees unable to work remotely through enhanced administrative controls, employee monitoring strategies, more rigorous cleaning practices, as well as physical distancing and through provision of personal protective equipment. The Company also implemented measures to reduce corporate overhead through wage and employee reductions together with qualification for COVID-19 related government assistance programs

AKITA DRILLING | 2020 Annual Report 31
MANAGEMENT ’S DISCUSSION & ANALYSIS
Future Outlook and StrategyThe drilling industry is cyclical and certain key factors that have an impact on AKITA’s results are beyond management’s control. Like other drilling contractors, AKITA is exposed to the effects of fluctuating oil and gas prices and changes in the exploration and development budgets of its customers. The outlook for the drilling industry continues to be uncertain. The impact of COVID-19 on demand for oil should begin to decrease as COVID-19 vaccinations ramp up globally and mobility restrictions are eased. This should have a corresponding effect on the demand for drilling services and the first signs of this can already be seen in Canada and the US as demand has begun to improve from the lows seen in September of 2020.
The drilling industry in Canada, has begun to see some signs of improvement from the lows seen in 2020 which is positive, however, insufficient pipeline capacity, arguably the main challenge to the drilling industry in Canada, remains unresolved. This may limit the speed and size of any recovery that the Canadian industry may see. One area that is showing a significant improvement over 2020 is SAGD drilling in the oil sands. With multiple Aboriginal joint ventures in the area, and several of its newest rigs tailored for SAGD drilling, the oil sands market has always been a key focus of the Company. Low oil sands activity over the last two years, however, has resulted in reduced utilization for AKITA’s Canadian fleet. Improved activity in the oil sands market should improve results in the Canadian segment. Despite the strengthening in the oil sands market there is still an oversupply of drilling
rigs for the Canadian drilling industry as a whole which affects both utilization and pricing for drilling services. Accordingly, the Company’s focus for its Canadian division in the near term will be financial discipline.
Similar to Canada, the US has begun to recover from the lows seen in September of 2020 but the active rig count still remains below 400 rigs, less than half the number of rigs that were active at the start of 2020. Demand for high specification rigs remains steady and is anticipated to grow as activity levels rebound. Pricing for drilling services is still low, however, and it will take more rigs going back to work before contractors are able to influence prices. The impact that the new US administration will have on the oil and gas industry and the demand for drilling services is still unknown. The Company is optimistic that 2021 will build on from the gains made in the first quarter of 2020 (before the gains dropped off in the second quarter of the year) and remain strong throughout the balance of the year. Until there is more certainty in the size and stability of a recovery, cost control remains a priority in the US.
The focus in 2021 will be debt reduction to improve the Company’s financial strength. Only a modest capital program is planned for Canada and the US with the majority of free cash flow going to debt repayment. Management feels that debt repayment is the best use of cash in the current market and the strategy should allow AKITA the ability to pursue growth opportunities once the Company’s debt is reduced.
Disclosure Controls and Internal Controls Over Financial ReportingAs of December 31, 2020, the Company’s management evaluated the effectiveness of the Company’s disclosure controls and procedures as required by the Canadian Securities Administrators (“CSA”). This evaluation was performed under the supervision of, and with the participation of the President and Chief Executive Officer (“CEO”) and the Vice President, Finance and Chief Financial Officer (“CFO”).
Disclosure controls and procedures are designed to provide reasonable assurance that information required to be disclosed in documents filed with the securities regulatory authorities is
recorded, processed, summarized and reported on a timely basis. The controls also seek to assure that this information is accumulated and communicated to management, including the CEO and CFO, as appropriate, to allow timely decisions on required disclosure. Based on this evaluation, the CEO and CFO have concluded that the Company’s disclosure controls and procedures were effective at December 31, 2020.
As of December 31, 2020, management evaluated the effectiveness of the Company’s internal control over financial reporting as required by the CSA. This evaluation was

AKITA DRILLING | 2020 Annual Report32
MANAGEMENT ’S DISCUSSION & ANALYSIS
performed utilizing the framework developed by the Committee of Sponsoring Organizations of the Treadway Commission, as revised effective May 14, 2013 under the supervision of, and with the participation of the CEO and CFO.
The Company’s internal control over financial reporting is designed to provide reasonable assurance regarding the reliability of financial reporting and the preparation of financial statements in accordance with IFRS.
Based on this evaluation, the CEO and CFO have concluded that the Company’s internal control over financial reporting was effective at December 31, 2020.
There was no change in the Company’s internal control over financial reporting that occurred during the period that began on October 1, 2020 and ended December 31, 2020 that materially affected, or is reasonably likely to materially affect, the Company’s internal control over financial reporting. There was also no change in the Company’s internal control over financial reporting that has occurred since December 31, 2020.
Basis of Analysis in this MD&A and Non-GAAP Items
Revenue and Operating and Maintenance Expenses in Canada and Adjusted Revenue and Adjusted Operating and Maintenance ExpensesRevenue and operating and maintenance expenses in AKITA’s Canadian operating segment includes revenue and expenses from AKITA’s wholly-owned drilling rigs as well as its share of joint venture revenue and expenses. Adjusted revenue and
adjusted operating and maintenance expenses includes total revenue and expenses from Canada including AKITA’s share of joint ventures, as well as US revenue and expenses.
$Thousands 2020 2019
Revenue from wholly-owned drilling rigs in Canada 28,466 48,376
Revenue from joint venture drilling rigs 5,094 5,289
Revenue in Canada 33,560 53,665
Operating and maintenance expenses from wholly-owned drilling rigs in Canada 20,954 36,248
Operating and maintenance expenses from joint venture drilling rigs 4,352 4,169
Operating and maintenance expenses in Canada 25,306 40,417
Per Operating DayAKITA’s revenue per operating day and AKITA’s operating and maintenance expenses per operating day are not recognized GAAP measures under IFRS. Management and certain investors, however, may find “per operating day” measures for AKITA’s revenue indicative of pricing strength, while AKITA’s operating and maintenance expenses per operating day
demonstrates a degree of cost control and provides a proxy for specific inflation rates incurred by the Company. Readers should be cautioned that in addition to the foregoing, other factors, including the mix of drilling rigs that are utilized can also influence these results.
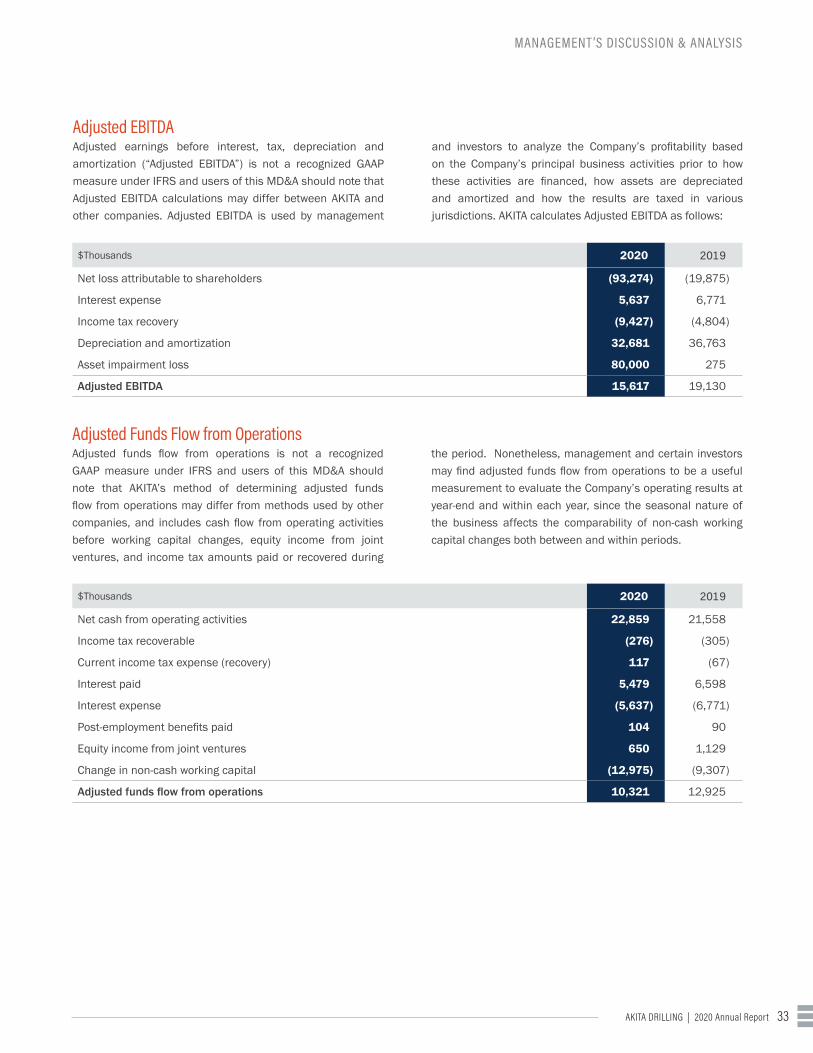
AKITA DRILLING | 2020 Annual Report 33
MANAGEMENT ’S DISCUSSION & ANALYSIS
Adjusted EBITDAAdjusted earnings before interest, tax, depreciation and amortization (“Adjusted EBITDA”) is not a recognized GAAP measure under IFRS and users of this MD&A should note that Adjusted EBITDA calculations may differ between AKITA and other companies. Adjusted EBITDA is used by management
and investors to analyze the Company’s profitability based on the Company’s principal business activities prior to how these activities are financed, how assets are depreciated and amortized and how the results are taxed in various jurisdictions. AKITA calculates Adjusted EBITDA as follows:
$Thousands 2020 2019
Net loss attributable to shareholders (93,274) (19,875)
Interest expense 5,637 6,771
Income tax recovery (9,427) (4,804)
Depreciation and amortization 32,681 36,763
Asset impairment loss 80,000 275
Adjusted EBITDA 15,617 19,130
Adjusted Funds Flow from OperationsAdjusted funds flow from operations is not a recognized GAAP measure under IFRS and users of this MD&A should note that AKITA’s method of determining adjusted funds flow from operations may differ from methods used by other companies, and includes cash flow from operating activities before working capital changes, equity income from joint ventures, and income tax amounts paid or recovered during
the period. Nonetheless, management and certain investors may find adjusted funds flow from operations to be a useful measurement to evaluate the Company’s operating results at year-end and within each year, since the seasonal nature of the business affects the comparability of non-cash working capital changes both between and within periods.
$Thousands 2020 2019
Net cash from operating activities 22,859 21,558
Income tax recoverable (276) (305)
Current income tax expense (recovery) 117 (67)
Interest paid 5,479 6,598
Interest expense (5,637) (6,771)
Post-employment benefits paid 104 90
Equity income from joint ventures 650 1,129
Change in non-cash working capital (12,975) (9,307)
Adjusted funds flow from operations 10,321 12,925

AKITA DRILLING | 2020 Annual Report34
MANAGEMENT ’S DISCUSSION & ANALYSIS
Upcoming Accounting Standard Changes Certain new or amended standards or interpretations have been issued by the International Accounting Standards Board or the International Financial Reporting Interpretations Committee that are not required to be adopted in the current
period. There are no standards and interpretations that have been issued, but are not yet effective, that the Company anticipates will have a material effect on the financial statements once adopted.
Other Information Additional information is provided by the Company in its Annual Information Form, Notice of Annual Meeting and Information Circular all dated March 11, 2021. Copies of these documents including additional copies of the Annual Report for the year
ended December 31, 2020 may be obtained upon request from the Vice President, Finance and Chief Financial Officer of the Company at 1000, 333 – 7th Avenue S.W., Calgary, Alberta, T2P 2Z1 or at www.sedar.com.
Forward-Looking StatementsFrom time to time AKITA makes forward-looking statements. These statements include but are not limited to comments with respect to AKITA’s objectives and strategies, financial condition, results of operations, the outlook for industry and risk management discussions.
By their nature, these forward-looking statements involve numerous assumptions, inherent risks and uncertainties, both general and specific, and therefore carry the risk that the predictions and other forward-looking statements will not be realized. Readers of this MD&A are cautioned not to place undue reliance on these statements as a number of important factors could cause actual future results to differ materially from the plans, objectives, estimates and intentions expressed in such forward-looking statements.
Forward-looking statements may be influenced by factors such as prevailing economic conditions (including as may be affected by the COVID-19 pandemic); the level of exploration and development activity carried on by AKITA’s customers, world crude oil prices and North American natural gas prices; global liquified natural gas (LNG) demand, weather, access to capital markets; and government policies. We caution that the foregoing list of factors is not exhaustive and that while relying on forward-looking statements to make decisions with respect to AKITA, investors and others should carefully consider the foregoing factors, as well as other uncertainties and events, prior to making a decision to invest in AKITA. Except where required by law, the Company does not undertake to update any forward-looking statement, whether written or oral, that may be made from time to time by it or on its behalf.

AKITA DRILLING | 2020 Annual Report 35
MANAGEMENT ’S DISCUSSION & ANALYSIS

AKITA DRILLING | 2020 Annual Report36 AKITA DRILLING | 2020 Annual Report36
MANAGEMENT’S RESPONSIBILITY FOR FINANCIAL REPORTING
The accompanying consolidated financial statements of
AKITA Drilling Ltd., Management's Discussion and Analysis
and other information relating to AKITA contained in this
Annual Report are the responsibility of management and have
been approved by the Board of Directors. The consolidated
financial statements have been prepared in accordance with
accounting policies detailed in the notes to the consolidated
financial statements and are in conformity with International
Financial Reporting Standards (“IFRS”) using methods
appropriate for the industry in which the Company operates.
Where necessary, management made estimates and
assumptions that affect the reported amounts of assets and
liabilities and disclosure of contingent assets and liabilities
as at the date of the financial statements including estimates
related to transactions and operations that were incomplete
at year-end, the useful lives of drilling rigs and other assets,
the measurement of the defined benefit pension liability,
assumptions around future income tax calculations and the
measurement of asset impairments. Financial information
throughout this Annual Report is consistent with the
consolidated financial statements except as noted.
MANAGEMENT ’S RESPONSIBILIT Y FOR FINANCIAL REPORTING

AKITA DRILLING | 2020 Annual Report 37AKITA DRILLING | 2020 Annual Report 37
Management ensures the integrity of the consolidated financial
statements by maintaining a system of internal control. This
system of internal control is based on the control criteria
framework of the Committee of Sponsoring Organizations of the
Treadway Commission published in their report titled, Internal
Control – Integrated Framework, as revised effective May 14,
2013. The system is designed to provide reasonable assurance
that transactions are executed as authorized and accurately
recorded; that assets are safeguarded; and that accounting
records are sufficiently reliable to permit the preparation of
financial statements that conform in all material respects
with IFRS. The Company maintains disclosure controls and
procedures designed to ensure that information required to be
disclosed in reports is disclosed, processed and summarized
and reported within specified time periods. Internal controls are
monitored through self-assessments and are reinforced through
a Code of Business Conduct, which sets forth the Company’s
commitment to conduct business with integrity, and within both
the letter and the spirit of the law.
PricewaterhouseCoopers LLP, the Company's independent
auditors, have conducted an examination of the consolidated
financial statements and have had full access to the Audit
Committee.
The Board of Directors, through its Audit Committee comprised
of four independent directors as defined in National Instrument
52-110 – Audit Committees (“NI 52-110”), and one director who
is exempt from the independence requirements of NI 52-110,
oversees management's responsibilities for financial reporting.
The Audit Committee meets regularly with management and the
independent auditors to discuss auditing and financial matters
and to gain assurance that management is carrying out its
responsibilities
Karl A. Ruud Darcy Reynolds President and Chief Vice President, Finance Executive Officer and Chief Financial Officer
March 11, 2021
MANAGEMENT ’S RESPONSIBILIT Y FOR FINANCIAL REPORTING

AKITA DRILLING | 2020 Annual Report38
INDEPENDENT AUDITOR'S REPORT

AKITA DRILLING | 2020 Annual Report 39
INDEPENDENT AUDITOR'S REPORT

AKITA DRILLING | 2020 Annual Report40
INDEPENDENT AUDITOR'S REPORT

AKITA DRILLING | 2020 Annual Report 41
INDEPENDENT AUDITOR'S REPORT

AKITA DRILLING | 2020 Annual Report42
INDEPENDENT AUDITOR'S REPORT


AKITA DRILLING | 2020 Annual Report44
CONSOLIDATED FINANCIAL STATEMENTS
$ThousandsDecember 31,
2020December 31,
2019
ASSETS
Current Assets
Cash $ 7,108 $ -Accounts receivable Note 12 15,128 32,108Income taxes recoverable Note 7 - 159Prepaid expenses and other 1,834 1,964
24,070 34,231Non-current Assets
Other long-term assets 1,782 1,959Investments in joint ventures Note 11 887 1,648Right-of-use assets Note 9 2,199 2,951Property, plant and equipment Note 10 222,583 328,327
TOTAL ASSETS $ 251,521 $ 369,116LIABILITIES
Current Liabilities
Accounts payable and accrued liabilities Note 12 $ 13,916 $ 18,942Deferred revenue 422 461Current portion of lease obligations Note 9 1,049 1,351Current portion of long-term debt Note 14 - 9,322
15,387 30,076Non-current Liabilities
Deferred income taxes Note 7 1,859 11,272Deferred share units Note 17 77 222Pension liability Note 18 5,710 5,208Lease obligations Note 9 1,919 2,507Long-term debt Note 14 74,303 74,697
Total Liabilities 99,255 123,982
SHAREHOLDERS' EQUITY
Class A and Class B shares Note 16 146,264 146,264Contributed surplus 5,197 5,015Accumulated other comprehensive income (loss) 11 (213)Retained earnings 794 94,068
Total Equity 152,266 245,134TOTAL LIABILITIES AND EQUITY $ 251,521 $ 369,116
The accompanying notes are an integral part of these financial statements.
Approved by the Board,
Director Director
Consolidated Statements of Financial Position

AKITA DRILLING | 2020 Annual Report 45
CONSOLIDATED FINANCIAL STATEMENTS
Consolidated Statements of Net Loss & Comprehensive Loss
$Thousands, except per share amounts
Year Ended December 31
2020 2019
REVENUE Note 4 $ 119,664 $ 175,890COSTS AND EXPENSES
Operating and maintenance Note 6 91,855 137,486Depreciation and amortization Note 10 32,681 36,763Asset impairment loss Note 10 80,000 276Selling and administrative Note 6 12,686 20,339
Total Costs and Expenses 217,222 194,864
Revenue Less Costs and Expenses (97,558) (18,974)
EQUITY INCOME FROM JOINT VENTURES Note 11 650 1,129
OTHER INCOME (LOSS)
Interest income 35 20Interest expense (5,637) (6,771)Loss on sale of assets (156) (476)Net other gains (losses) (35) 393
Total Other Loss (5,793) (6,834)
Loss Before Income Taxes (102,701) (24,679)
Income tax recovery Note 7 (9,427) (4,804)
NET LOSS FOR THE PERIOD ATTRIBUTABLE TO SHAREHOLDERS (93,274) (19,875)
OTHER COMPREHENSIVE INCOME (LOSS) Items that will not subsequently be reclassified to profit or loss
Remeasurement of pension liability and other 314 (284)
Items that may be subsequently be reclassified to profit or lossForeign currency translation adjustment (90) (15)
Total Other Comprehensive Income (Loss) 224 (299)
COMPREHENSIVE LOSS FOR THE PERIOD ATTRIBUTABLE TO SHAREHOLDERS $ (93,050) $ (20,174)
NET LOSS PER CLASS A AND CLASS B SHARE Note 3Basic $ (2.35) $ (0.50)Diluted $ (2.35) $ (0.50)
The accompanying notes are an integral part of these financial statements.

AKITA DRILLING | 2020 Annual Report46
CONSOLIDATED FINANCIAL STATEMENTS
Consolidated Statements of Changes in Shareholders’ EquityAttributable to the Shareholders of the Company
$Thousands
Class ANon-Voting
Shares
Class BCommon
Shares
Total Class A
andClass BShares
ContributedSurplus
AccumulatedOther
Comprehensive Income (Loss)
RetainedEarnings
TotalEquity
BALANCE AT DECEMBER 31, 2018 $ 144,898 $ 1,366 $ 146,264 $ 4,701 $ 86 $ 120,677 $ 271,728
Net loss for the year — — — — — (19,875) (19,875)
Foreign currency translation adjustment — — — — (15) — (15)
Remeasurement of pension liability — — — — (284) — (284)
Stock options charged to expense — — — 314 — — 314
Dividends — — — — — (6,734) (6,734)
BALANCE AT DECEMBER 31, 2019 $ 144,898 $ 1,366 $ 146,264 $ 5,015 $ (213) $ 94,068 $ 245,134
Net loss for the year — — — — — (93,274) (93,274)
Foreign currency translation adjustment — — — — 538 — 538
Remeasurement of pension liability — — — — (314) — (314)
Stock options charged to expense — — — 182 — — 182
BALANCE AT DECEMBER 31, 2020 $ 144,898 $ 1,366 $ 146,264 $ 5,197 $ 11 $ 794 $ 152,266
The accompanying notes are an integral part of these financial statements.

AKITA DRILLING | 2020 Annual Report 47
CONSOLIDATED FINANCIAL STATEMENTS
Consolidated Statements of Cash Flows
$Thousands
Year Ended December 31
2020 2019
OPERATING ACTIVITIESNet loss $ (93,274) $ (19,875)Non-cash items included in net loss:
Depreciation and amortization Note 10 32,681 36,763Asset impairment loss 80,000 276Deferred income tax recovery Note 7 (9,311) (4,872)Defined benefit pension plan expense Note 18 19 37Stock options and deferred share units expense Note 17 51 120Loss on sale of assets 156 476
Change in non-cash working capital Note 13 12,975 9,307Equity income from joint ventures Note 11 (650) (1,129)Post-employment benefits (104) (90)Interest expense 5,637 6,771Interest paid (5,479) (6,598)Current income tax expense (recovery) Note 7 (116) 67Income tax recoverable 275 305Net Cash From Operating Activities 22,860 21,558
INVESTING ACTIVITIESCapital expenditures Note 10 (7,593) (15,238)Change in non-cash working capital related to capital Note 13 (930) (2,087)Distributions from investments in joint ventures Note 11 1,411 3,937Change in restricted cash - 756Change in long-term assets (10) (976)Proceeds from sale of assets 2,142 1,823Net Cash Used In Investing Activities (4,980) (11,785)
FINANCING ACTIVITIESChange in debt Note 14 (9,953) 1,024Dividends paid - (10,101)Change in lease obligations (1,187) (1,873)Loan commitment fee (165) (311)Net Cash Used In Financing Activities (11,305) (11,261)
Effect of Foreign Exchange on Cash 533 (15)
Increase (Decrease) In Cash 7,108 (1,503)Cash, beginning of year - 1,503
CASH, END OF YEAR $ 7,108 $ -
The accompanying notes are an integral part of these financial statements.

AKITA DRILLING | 2020 Annual Report48
NOTES TO THE CONSOLIDATED FINANCIAL STATEMENTS
NOTES CONTENTS49BUSINESS AND ENVIRONMENT1. General Information 49
2. Basis of Preparation 49
51RESULTS FOR THE YEAR3. Net Loss per Share 51
4. Revenue 51
5. Government Subsidies 52
6. Expenses by Nature 53
7. Income Taxes 53
8. Segmented Information 55
56LONG-TERM ASSETS9. Leases 56
10. Property, Plant and Equipment 58
11. Investments in Joint Ventures 61
63WORKING CAPITAL12. Financial Instruments 63
13. Change in Non-Cash Working Capital 67
67DEBT AND EQUITY14. Debt 67
15. Capital Management 69
16. Share Capital 70
71PERSONNEL17. Share-Based Compensation Plans 71
18. Employee Future Benefits 74
76OTHER NOTES19. Commitments and Contingencies 76
20. Related Party Transactions 76
AKITA DRILLING | 2020 Annual Report48

AKITA DRILLING | 2020 Annual Report 49
NOTES TO THE CONSOLIDATED FINANCIAL STATEMENTS
NOTES TO THE CONSOLIDATED FINANCIAL STATEMENTSFor the years ended December 31, 2020 and December 31, 2019
BUSINESS AND ENVIRONMENT1. General InformationAKITA Drilling Ltd. and its subsidiaries (the “Company” or “AKITA”) provide contract drilling services, primarily to the oil and gas industry, in Canada and the United States (“US”). The Company owns and operates 37 drilling rigs (35.65 net of joint venture ownership).
The Company conducts certain rig operations via joint ventures with First Nations, Metis or Inuit partners whereby rig assets are jointly owned. While joint venture interests are at least 50% owned by the Company, in each case the joint venture is governed on a joint basis.
The Company is a limited liability company incorporated and domiciled in Alberta, Canada. The address of its registered office is 1000, 333 – 7th Avenue SW, Calgary, Alberta. The Company is listed on the Toronto Stock Exchange. The Company is controlled by Sentgraf Enterprises Ltd. and its controlling share owner, the Southern family.
2. Basis of PreparationThe consolidated financial statements for the year ended December 31, 2020, have been prepared in accordance with International Financial Reporting Standards (“IFRS”) as issued by the International Accounting Standards Board (“IASB”). These consolidated financial statements have been prepared under the historical cost convention, except as specifically stated within these notes.
These consolidated financial statements were approved by the Company’s Board of Directors on March 11, 2021.
ConsolidationThe consolidated financial statements of the Company consolidate the accounts of AKITA and its subsidiaries which are entities over which the Company has control. Control exists when the Company has the power, directly or indirectly, to direct the relevant activities of an entity so as to obtain benefit from its activities. Subsidiaries are fully consolidated from the date on which control is transferred to the Company and are deconsolidated from the date that control ceases. Inter-company transactions, balances and unrealized gains and losses from inter-company transactions are eliminated on consolidation.
AKITA DRILLING | 2020 Annual Report50
NOTES TO THE CONSOLIDATED FINANCIAL STATEMENTS
Functional and presentation currencyItems included in the financial statements of each of the Company's entities are measured using the currency of the primary economic environment in which the entity operates ("the functional currency"). The functional currency of the Company and its Canadian subsidiaries is the Canadian dollar ("CAD") while the functional currency of its US subsidiaries is the US dollar ("USD").
The consolidated financial statements are presented in CAD, which is the Company's presentation currency.
Foreign currency translation(i) Transactions and balances
Foreign currency transactions are translated into the functional currency using the exchange rates prevailing at the dates of the transactions. Foreign exchange gains and losses resulting from the settlement of such transactions and from the translation of monetary assets and liabilities denominated in foreign currencies at year-end exchange rates are recognized in the statement of net income and comprehensive income.
(ii) Group companies
The results and financial position of foreign operations that have a functional currency different from the presentation currency are translated into the presentation currency as follows:
• assets and liabilities for each statement of financial position presented are translated at the closing rate at the date of that balance sheet;
• income and expenses for each statement of net income and comprehensive income are translated at average exchange rates (unless this is not a reasonable approximation of the cumulative effect of the rates prevailing on the transaction dates, in which case income and expenses are translated at the dates of the transactions); and
• all resulting exchange differences are recognized in other comprehensive income (“OCI”).
Estimates and judgmentsThe preparation of these consolidated financial statements required management to make estimates and judgments. Estimates and judgments are continually evaluated and are based on historical experience and other factors, including expectations of future events that are believed to be reasonable in the circumstances. Actual results could differ materially from these estimates. Estimates and judgments which are material to the consolidated financial statements are found in the following notes:
• Note 4 - Revenue• Note 7 - Income Taxes• Note 9 - Leases• Note 10 - Property, Plant and Equipment• Note 12 – Financial Instruments• Note 18 – Employee Future Benefits
In March 2020, the World Health Organization declared a global pandemic related to COVID-19. To date, the COVID-19 related economic slowdown has resulted in significant declines and volatility in the stock markets, as well as steep reductions in both global oil demand and prices. Additionally, an increase in the global oil supply has placed further negative pressure on oil prices. There is significant ongoing uncertainty surrounding the future impact of COVID-19 on demand and prices for the Company’s drilling services.

AKITA DRILLING | 2020 Annual Report 51
NOTES TO THE CONSOLIDATED FINANCIAL STATEMENTS
The economic conditions resulting from COVID-19 and the increase in global oil supply have affected the Company’s financial results for the year ended December 31, 2020. The Company recorded an asset impairment loss of $60,000,000 in the first quarter of 2020 and an additional asset impairment loss of $20,000,000 in the fourth quarter of 2020 (Note 10), and increased its expected credit loss (Note 12).
In the current environment, assumptions about future commodity prices, exchange rates, interest rates and customer credit performance are subject to greater variability than normal, which could in future significantly affect the valuation of the Company’s assets.
RESULTS FOR THE YEAR3. Net Loss per ShareBasic earnings per share is calculated by dividing the net income for the period attributable to shareholders of the Company by the weighted average number of Class A Non-Voting and Class B Common shares outstanding during the period.
Diluted earnings per share is calculated by adjusting the weighted average number of Class A Non-Voting and Class B Common shares outstanding to assume conversion of all dilutive potential Class A Non-Voting shares, typically stock options granted to directors and employees. The calculation is performed for the stock options to determine the number of shares that could have been acquired at fair value (determined as the average quarterly or annual, as appropriate, market share price of the Company’s outstanding Class A Non-Voting shares) based on the monetary value of the subscription rights attached to outstanding stock options. The number of shares calculated as above is compared with the number of shares that would have been issued assuming the exercise of stock options.
Year Ended
December 31 2020
December 31 2019
Net loss ($Thousands) $ (93,274) $ (19,875)
Weighted average outstanding shares 39,608,191 39,608,191Incremental shares for diluted loss calculation (1) - - Weighted average outstanding shares for loss per share - diluted 39,608,191 39,608,191
Loss per share - basic $ (2.35) $ (0.50)Loss per share - diluted $ (2.35) $ (0.50)
(1) For the year ended December 31, 2020 and the year ended December 31, 2019, the outstanding shares that would have been issued under the Stock Option Plan were excluded in calculating the weighted average number of diluted shares as the Company incurred a net loss during the year and therefore the shares were considered anti-dilutive.
4. Revenue
Accounting PoliciesRevenue is recognized when the Company satisfies a performance obligation by transferring promised goods or services to a customer and the amount recorded is measured at the fair value of the consideration received. A typical contract with a customer includes performance obligations to provide drilling services and rig equipment, which are satisfied over time. Once determined, the transaction price will be allocated to each performance obligation based on stand-alone selling prices. Where stand-alone selling prices are not directly observable, the Company will make an estimate based on expected cost-plus margin.

AKITA DRILLING | 2020 Annual Report52
NOTES TO THE CONSOLIDATED FINANCIAL STATEMENTS
Where possible, the Company will apply the practical expedient not to disclose the transaction price for unsatisfied performance if the performance obligation is part of a contract that has an original expected duration of one year or less. The Company does not expect to have any contracts where the period between the transfer of the promised goods or services to the customer and payment by the customer exceeds one year. Consequently, the Company does not adjust any of the transaction prices for the time value of money.
The receipt of unearned contract revenue is recorded as deferred revenue until the contracted passage of time has occurred. Contract cancellation revenue is recognized when both parties to the contract have agreed upon an amount, collection is probable, and the Company does not have any further services to render in order to earn the revenue.
Significant Estimates and Judgments – Relative Stand-Alone Selling Price The majority of the Company’s contracts contain both a lease and a service element. IFRS 15, “Revenue from Contracts with Customers” requires that contract revenue be presented separately from lease revenue. In this case, the transaction price will be allocated to each of the lease and service elements based on the stand-alone selling prices. Where these are not directly observable, they are estimated based on expected cost-plus margin.
The Company’s revenue streams are comprised of the following:
Year Ended
$ThousandsDecember 31
2020December 31
2019
Contract drilling services $62,491 $86,560 Rig lease rental 57,173 89,330 Total revenue $119,664 $175,890
Significant Customers During 2020 two customers (2019 – two customers) each provided more than 10% of the Company’s revenue. While the loss of one or more of these customers may have a material adverse effect on the financial results of the Company, in management’s assessment, the future viability of the Company is not dependent upon these major customers.
5. Government SubsidiesDuring the year ended December 31, 2020, the Company adopted the following accounting policy as a result of qualifying for the Canada Emergency Wage Subsidy (“CEWS”) program as enacted on April 11, 2020, by the federal government of Canada. The program is in effect from March 15, 2020 to June 30, 2021 and provides a 75 percent wage subsidy, to a maximum of $847 per employee per week.
Government subsidies are recognized when there is reasonable assurance that the subsidy will be received and that the Company will comply with all relevant conditions. Government subsidies related to current expenses are recorded as a reduction of the related expenses.
For the year ended December 31, 2020, the Company recorded $2,269,000 from the CEWS program.
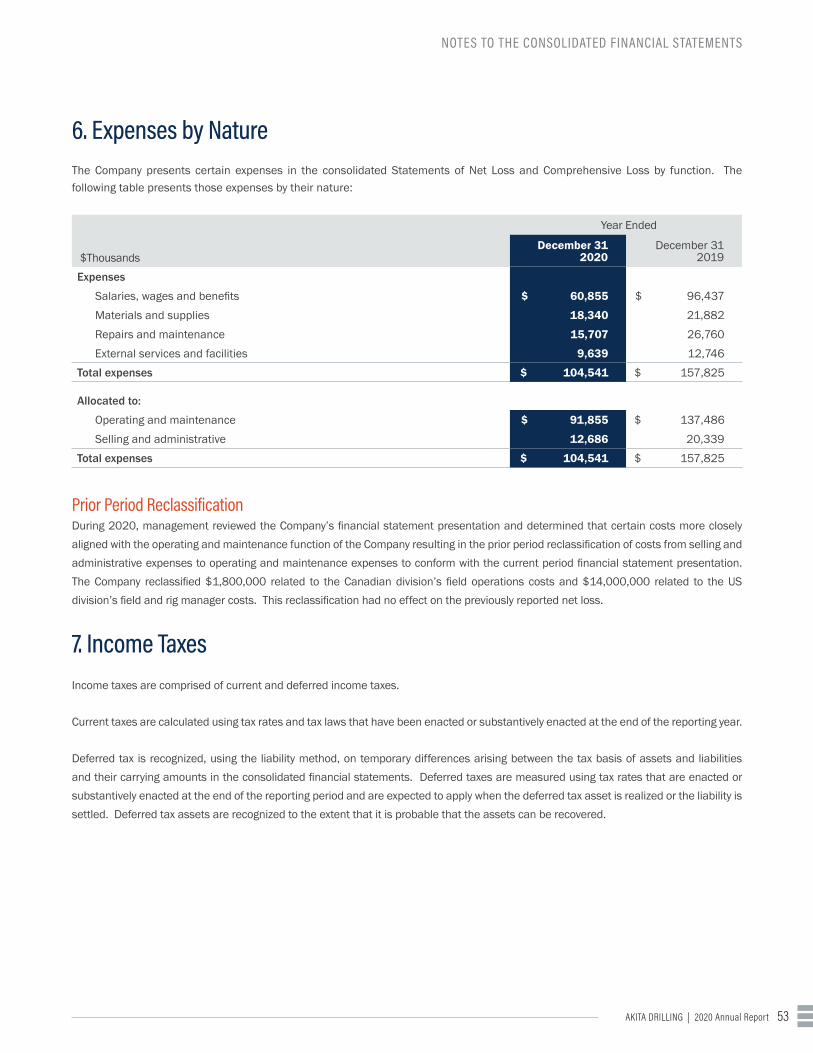
AKITA DRILLING | 2020 Annual Report 53
NOTES TO THE CONSOLIDATED FINANCIAL STATEMENTS
6. Expenses by NatureThe Company presents certain expenses in the consolidated Statements of Net Loss and Comprehensive Loss by function. The following table presents those expenses by their nature:
Year Ended
$ThousandsDecember 31
2020December 31
2019
Expenses
Salaries, wages and benefits $ 60,855 $ 96,437 Materials and supplies 18,340 21,882 Repairs and maintenance 15,707 26,760 External services and facilities 9,639 12,746
Total expenses $ 104,541 $ 157,825
Allocated to:
Operating and maintenance $ 91,855 $ 137,486 Selling and administrative 12,686 20,339
Total expenses $ 104,541 $ 157,825
Prior Period ReclassificationDuring 2020, management reviewed the Company’s financial statement presentation and determined that certain costs more closely aligned with the operating and maintenance function of the Company resulting in the prior period reclassification of costs from selling and administrative expenses to operating and maintenance expenses to conform with the current period financial statement presentation. The Company reclassified $1,800,000 related to the Canadian division’s field operations costs and $14,000,000 related to the US division’s field and rig manager costs. This reclassification had no effect on the previously reported net loss.
7. Income TaxesIncome taxes are comprised of current and deferred income taxes.
Current taxes are calculated using tax rates and tax laws that have been enacted or substantively enacted at the end of the reporting year.
Deferred tax is recognized, using the liability method, on temporary differences arising between the tax basis of assets and liabilities and their carrying amounts in the consolidated financial statements. Deferred taxes are measured using tax rates that are enacted or substantively enacted at the end of the reporting period and are expected to apply when the deferred tax asset is realized or the liability is settled. Deferred tax assets are recognized to the extent that it is probable that the assets can be recovered.

AKITA DRILLING | 2020 Annual Report54
NOTES TO THE CONSOLIDATED FINANCIAL STATEMENTS
Income taxes are comprised of the following:
Year Ended
$ThousandsDecember 31
2020December 31
2019
Current tax expense (recovery) $ (116) $ 68
Deferred tax recovery (9,311) (4,872)
Total income tax recovery $ (9,427) $ (4,804)
The following table reconciles the income tax expense (recovery) using a weighted average Canadian federal and provincial rate of 25.17% (2019 – 26.63%) to the reported tax expense (recovery). The rate decrease is due to the reduction in the Alberta corporate tax rate. The reconciling items represent, aside from the impact of tax rate differentials and changes, non-taxable benefits or non-deductible expenses arising from permanent differences between the local tax base and the financial statements.
Year Ended
$ThousandsDecember 31
2020December 31
2019
Loss before income taxes $ (102,701) $ (24,679)
Expected income tax at the statutory rate (25,853) (6,572)
Add (deduct):
Change in income tax rates 36 (1,265)
Permanent differences 47 363
Jurisdictional rate difference 1,193 406
Change in unrecognized deferred tax asset 15,248 3,142
Return to provision adjustment (40) (390)
Other (58) (488)
Total income tax recovery $ (9,427) $ (4,804)

AKITA DRILLING | 2020 Annual Report 55
NOTES TO THE CONSOLIDATED FINANCIAL STATEMENTS
The deferred tax balance consists of the following:
$Thousands
Property, Plant and
Equipment
Defined Benefit
Pension Plan Benefits
Non-Capitlal Losses Other Total
Balance as at December 31, 2018 $ 44,019 $ (1,162) $ (21,585) $ (5,037) $ 16,235
Credited to net loss (2,162) (33) (1,933) (744) (4,872)
Credited to OCI - (91) - - (91)
Balance as at December 31, 2019 41,857 (1,286) (23,518) (5,781) 11,272
Charged (credited) to net loss (8,177) (37) 2,971 (4,068) (9,311)
Credited to OCI - (102) - - (102)
Balance as at December 31, 2020 $ 33,680 $ (1,425) $ (20,547) $ (9,849) $ 1,859
A net deferred tax asset has not been recognized for $67 million (2019 – $54 million). This amount is primarily related to non-capital losses carried forward.
Total gross tax losses available to the Company are $368,594,000 with $340,020,000 in the US and $28,574,000 in Canada. The first of these losses will begin to expire in 2031.
Significant Estimates and Judgments - Deferred Income Taxes The Company makes estimates and judgments relating to the measurement of deferred income taxes, including future tax rates, timing of reversals of temporary timing differences and the anticipated tax rules that will be in place when timing differences reverse.
8. Segmented InformationThe Company has one operating segment providing contract drilling services primarily to the oil and gas industry. From time to time, the Company is involved in other forms of drilling related to potash mining and the development of storage caverns. The Company determines its operating segments based on internal information, regularly reviewed by management, to allocate resources and assess performance.
Geographical information is provided below:
Year Ended December 31, 2020 Year Ended December 31, 2019
$Thousands Canada US Total Canada US Total
Revenue $ 28,466 $ 91,198 $ 119,664 $ 48,376 $ 127,514 $ 175,890
Revenue less costs and expenses $ (43,106) $ (54,452) $ (97,558) $ (17,832) $ (1,142) $ (18,974)
December 31, 2020 December 31, 2019
$Thousands Canada US Total Canada US Total
Property, plant and equipment $ 53,394 $ 169,189 $ 222,583 $ 102,870 $ 225,457 $ 328,327

AKITA DRILLING | 2020 Annual Report56
NOTES TO THE CONSOLIDATED FINANCIAL STATEMENTS
LONG-TERM ASSETS9. Leases
Leasing Activities and PoliciesThe Company leases various offices, yards, rig equipment, vehicles and office equipment. Lease contracts are typically made for fixed periods of two to five years, but may have extension or termination options. Lease terms are negotiated on an individual basis and contain a wide range of different terms and conditions. The lease agreements do not impose any covenants, but leased assets may not be used as security for borrowing purposes.
Assets and liabilities arising from a lease are initially measured on a present value basis.
Lease liabilities include the net present value of the following lease payments:
• fixed payments less any lease incentives receivable;
• amounts expected to be payable by the lessee under residual value guarantees;
• the exercise price of a purchase option if the lessee is reasonably certain to exercise that option; and
• payments of penalties for terminating the lease, if the lease term reflects the lessee exercising that option.
Each lease payment is allocated between the liability and finance cost. The finance cost is charged to profit or loss over the lease period so as to produce a constant periodic rate of interest on the remaining balance of the liability for each period.
The lease payments are discounted using the interest rate implicit in the lease. If that rate cannot be determined, the lessee’s incremental borrowing rate is used, being the rate that the lessee would have to pay to borrow the funds necessary to obtain an asset of similar value in a similar economic environment with similar terms and conditions. The discount rates range from 5.01% to 6.06%.
The Right of Use (“ROU”) assets are measured at cost comprising of the following:
• the amount of the initial measurement of the lease liability;
• any lease payments made at or before the commencement date less any lease incentives received;
• any initial direct costs; and
• restoration costs.
ROU assets are depreciated over the lease term on a straight-line basis.
Payments associated with short-term leases and leases of low-value assets are recognized on a straight-line basis as an expense in profit or loss. Short-term leases are leases with a lease term of 12 months or less. Low-value assets are comprised of office and IT software.
ROU assets are reviewed for internal and external indicators of impairment at each reporting date or when facts and circumstances suggest that the carrying amount may exceed its recoverable amount. If indicators of impairment exist, the recoverable amount of the ROU asset is estimated as the greater of value-in-use (“VIU”) and fair value less costs of disposal (“FVLCOD”). VIU is estimated as the present value of the future cash flows expected to arise from the continuing use of a ROU asset. FVLCOD is determined by estimating the discounted after-tax future net cash flows.
If the recoverable amount of the ROU asset is less than the carrying amount, an impairment loss is recognized.

AKITA DRILLING | 2020 Annual Report 57
NOTES TO THE CONSOLIDATED FINANCIAL STATEMENTS
Continuity of ROU Assets
$ThousandsLand and property
Rig equipment
Office equipment
and software Vehicles Total
Balance as at December 31, 2018 $ - $ - $ - $ - $ -
January 1, 2019 additions 1,786 934 833 362 3,915
Additions 1,781 - 40 - 1,821
ROU asset writedown and impairment loss (859) - - - (859)
Amortization expense (965) (448) (325) (188) (1,926)
Balance as at December 31, 2019 1,743 486 548 174 2,951
Additions 187 - 204 - 391
Amortization expense (474) (210) (317) (142) (1,143)
Balance as at December 31, 2020 $ 1,456 $ 276 $ 435 $ 32 $ 2,199
Lease ObligationsThe Company recorded $198,000 in interest expense related to its lease obligations for the year ended December 31, 2020 (2019 - $183,000).
Continuity of Lease Obligations
$ThousandsLand and property
Rig equipment
Office equipment
and software Vehicles Total
Balance as at December 31, 2018 $ - $ - $ - $ - $ -
January 1, 2019 additions 1,786 934 833 362 3,915
Change in lease obligations (1,028) (433) (260) (181) (1,902)
Lease additions 1,805 - 40 - 1,845
Balance as at December 31, 2019 2,563 501 613 181 3,858
Change in lease obligations (635) (162) (244) (146) (1,187)
Lease additions 187 - 219 - 406
Lease terminations - - (109) - (109)
Balance as at December 31, 2020 $ 2,115 $ 339 $ 479 $ 35 $ 2,968
$ThousandsLand and property
Rig equipment
Office equipment
and software Vehicles Total
Current portion $ 611 $ 339 $ 68 $ 35 $ 1,053
Long-term portion 1,504 - 411 - 1,915
Balance as at December 31, 2020 $ 2,115 $ 339 $ 479 $ 35 $ 2,968

AKITA DRILLING | 2020 Annual Report58
NOTES TO THE CONSOLIDATED FINANCIAL STATEMENTS
Significant Estimates and Judgments In determining the lease term, management considers all facts and circumstances that create an economic incentive to exercise an extension option, or not exercise a termination option. Extension options (or periods after termination options) are only included in the lease term if the lease is reasonably certain to be extended (or not terminated).
The assessment is reviewed if a significant event or a significant change in circumstances occurs which affects this assessment and that is within the control of the lessee.
10. Property, Plant and Equipment
Accounting Policies Property, plant and equipment ("PP&E") are recognized at cost less accumulated depreciation and impairment.
Cost includes expenditures directly attributable to the acquisition of the asset. The cost of assets constructed by the Company includes the cost of all materials and services used in the construction and direct labour on the project. Costs cease to be capitalized as soon as the asset is ready for productive use. Subsequent costs associated with equipment upgrades that result in increased capabilities or performance enhancements of PP&E are capitalized. Costs incurred to repair or maintain PP&E are charged to expense as incurred. The carrying amount of a replaced asset is derecognized when replaced.
The PP&E cash generating units (“CGUs”) are reviewed for internal and external indicators of impairment at each reporting date or when facts and circumstances suggest that the carrying amount may exceed its recoverable amount. If indicators of impairment exist, the recoverable amount of the CGU is estimated as the greater of VIU and FVLCOD. VIU is estimated as the present value of the future cash flows expected to arise from the continuing use of a CGU. FVLCOD is determined by estimating the discounted after-tax future net cash flows or through the use of external equipment appraisals obtained from independent third party valuation experts, less an estimated cost to sell.
If the recoverable amount of the CGU is less than the carrying amount, an impairment loss is recognized. An impairment loss is allocated to the CGU and then to reduce the carrying amounts of the assets in the CGU.
Impairment losses recognized in prior periods are assessed at each reporting date for any indicators that the impairment losses may no longer exist or may have decreased. In the event that an impairment loss reverses, the carrying amount of the asset is increased to the revised estimate of its recoverable amount, but only to the extent that the carrying amount does not exceed the amount that would have been determined had no impairment loss been recognized on the asset in prior periods. The amount of the reversal is recognized in net earnings.
Significant Estimates and Judgments
Useful Lives of Drilling RigsDepreciation is recognized on PP&E excluding land. Depreciation methods and rates have been selected so as to amortize the net cost of each asset over its expected useful life to its estimated residual value. The estimated useful lives, residual values and depreciation methods are reviewed at the end of each annual reporting period.
Major renovations are depreciated over the remaining useful life of the related asset or to the date of the next major renovation, whichever is sooner.

AKITA DRILLING | 2020 Annual Report 59
NOTES TO THE CONSOLIDATED FINANCIAL STATEMENTS
Future Cash FlowsImpairment testing involves the use of estimates and judgments in the calculation of future cash flows which include future revenue projections, discount rates, probabilities of cash flow variability, future capital and operating costs, salvage values and income taxes and may consider the report of an external appraiser.
Depreciation MethodsA summary of depreciation methodologies for the Company’s major PP&E classes as at December 31, 2020, is as follows:
Equipment Class Depreciation Method Depreciation Rates
Drilling rigs Straight-line 10 to 20 years
Major inspection and overhaul expenditures Straight-line 3 to 5 years
Drill pipe and other ancillary drilling equipment Straight-line 2 to 8 years
Furniture, fixtures and equipment Straight-line 10 years
Buildings Straight-line 10 to 20 years
The salvage values for the drilling rig equipment ranges from zero to 10% depending on the specific rig component. There are no salvage values for the remaining equipment classes.
Impairment of AssetsDuring the year ended December 31, 2020, the Company determined that two external indicators of impairment existed: the uncertainty and volatility of oil prices, which impacts the future earnings potential of the Company’s CGUs, and the Company’s book value of its net assets exceeding its market capitalization were external indicators of impairment and therefore, the Company tested its CGUs for asset impairment.
In the first quarter of 2020, the Company recorded an impairment loss of $30,000,000 in each of its Canadian and US CGUs respectively. In the fourth quarter of 2020, both CGUs were tested again for impairment and the Company's US CGUs carrying amount exceeded the recoverable amount resulting in an additional impairment of $20,000,000. The total impairment loss for the year ended December 31, 2020 was $80,000,000.
The recoverable amounts of these CGUs were determined using a discounted cash flow model. Assumptions used in the discounted cash flow models include the Company’s Board of Directors approved budgets and an average revenue growth rate ranging from 5% to 15% over a 10 year period depending on the CGU being analyzed. In forecasting its projected cash flows the Company assumed a slow recovery commencing in 2021 for both Canada and the US with improvements in activity and revenue per day over the forecast period. Discounted future cash flows are determined by applying a discount rate of 14.5%. This valuation has an IFRS fair value hierarchy of Level 3. Additionally, in the fourth quarter, management also obtained external equipment appraisals from independent third party experts which supported the fair value less cost to sell.
Asset impairment testing is subject to numerous assumptions, inherent risks and uncertainties, both general and specific, and the risk that the predictions will not be realized. As a result, the following sensitivity analysis has been performed over the significant assumptions to recognize that additional outcomes are possible:
• Changed future revenue assumptions by 5% resulting in increases to the Company’s CGUs from $15 million to $35 million per CGU and reductions ranging from $15 million to $35 million per CGU; and

AKITA DRILLING | 2020 Annual Report60
NOTES TO THE CONSOLIDATED FINANCIAL STATEMENTS
• Changed the Company’s pre-tax discount rate by 1% resulting in reductions between $4 million and $11 million per CGU and increases from $4 million to $10 million per CGU.
As drilling rigs are long lived assets, no sensitivity adjustment was made for the projected forecast period.
As the base case test represented management’s best estimates, these sensitivity reductions were not included in the asset impairment loss reported.
Property, Plant and Equipment Continuity
Cost $Thousands
Land and Buildings Drilling Rigs Other Total
Balance as at December 31, 2018 $ 9,449 $ 558,397 $ 10,208 $ 578,054
IFRS 16, "Leases" reclass to ROU assets - - (546) (546)
Additions 138 14,986 114 15,238
Disposals (1,285) (11,667) (366) (13,318)
Balance as at December 31, 2019 8,302 561,716 9,410 579,428
Additions 94 7,230 269 7,593
Disposals (1,261) (8,786) (574) (10,621)
Balance as at December 31, 2020 $ 7,135 $ 560,160 $ 9,105 $ 576,400
Accumulated Depreciation $Thousands
Land and Buildings Drilling Rigs Other Total
Balance as at December 31, 2018 $ 1,547 $ 218,645 $ 7,514 $ 227,706
IFRS 16, "Leases" reclass to ROU assets - - (46) (46)
Disposals (118) (10,607) (295) (11,020)
Depreciation expense 445 33,368 648 34,461
Balance as at December 31, 2019 1,874 241,406 7,821 251,101
Disposals (72) (7,834) (417) (8,323)
Depreciation expense 316 30,123 600 31,039
Asset write-downs and impairment loss - 80,000 - 80,000
Balance as at December 31, 2020 $ 2,118 $ 343,695 $ 8,004 $ 353,817
Net Book Value $Thousands
Land and Buildings Drilling Rigs Other Total
As at December 31, 2018 $ 7,902 $ 339,752 $ 2,694 $ 350,348
As at December 31, 2019 $ 6,428 $ 320,310 $ 1,589 $ 328,327
As at December 31, 2020 $ 5,017 $ 216,465 $ 1,101 $ 222,583
At December 31, 2020 the Company had $468,000 in PP&E that was not being depreciated, as these assets were under construction (December 31, 2019 – $74,000).

AKITA DRILLING | 2020 Annual Report 61
NOTES TO THE CONSOLIDATED FINANCIAL STATEMENTS
In addition to depreciation on its PP&E, the Company had amortization expense of $1,642,000 for the year ended December 31, 2020 (2019 - $2,302,000).
11. Investments in Joint VenturesThe Company conducts certain rig operations via joint ventures with First Nations, Métis or Inuit partners whereby rig assets are jointly owned. Currently, there are eight different First Nations, Métis or Inuit groups with equity investments in six of AKITA’s drilling rigs. These equity investments are facilitated through joint venture agreements. Each joint venture operates the drilling rig with the joint venture partners’ owning a share of each drilling rig directly. The equity ownership of the drilling rigs for each First Nations, Métis or Inuit partner varies between rigs and groups and ranges from 5% to 50% per group per rig.
While joint venture interests are at least 50% owned by the Company, in each case the joint venture is governed on a joint basis. The accounting policies of the joint ventures are consistent with the policies described herein.
The Company has assessed the nature of its joint arrangements and determined them to be joint ventures. Joint ventures are accounted for using the equity method of accounting whereby the Company’s share of individual assets and liabilities are recognized as an investment in the joint venture account on the consolidated Statements of Financial Position, and revenues and expenses are recognized as an equity income from investments in joint ventures on the consolidated Statements of Net Income and Comprehensive Income.
The following table lists the Company’s active joint ventures. All joint ventures operate in Canada.
Active Joint Ventures AKITA Ownership Interest
AKITA Wood Buffalo Joint Venture 25 85%
AKITA Wood Buffalo Joint Venture 26 85%
AKITA Wood Buffalo Joint Venture 27 85%
AKITA Wood Buffalo Joint Venture 28 70%
Akita Mistiyapew Aski Joint Venture 56 90%
AKITA Equtak Joint Venture 61 50%

AKITA DRILLING | 2020 Annual Report62
NOTES TO THE CONSOLIDATED FINANCIAL STATEMENTS
Continuity of Investments in Joint Ventures
$Thousands Investments in Joint Ventures
Balance as at December 31, 2018 $ 4,456
Net income for the year ended December 31, 2019 1,129
Distributions for the year ended December 31, 2019 (3,937)
Balance as at December 31, 2019 1,648
Net income for the year ended December 31, 2020 650
Distributions for the year ended December 31, 2020 (1,411)
Balance as at December 31, 2020 $ 887
Summarized Joint Venture Financial Information This summarized financial information is a reconciliation of the Company’s investments in joint ventures to the aggregate of the amounts included in the IFRS financial statements of the joint ventures which include both the Company’s and joint venture partners’ interests.
December 31, 2020 December 31, 2019
$Thousands AKITA % JV Partner % Total AKITA % JV Partner % Total
Cash $ 231 $ 68 $ 299 $ 220 $ 70 $ 290
Other current assets 915 159 1,074 2,610 437 3,047
Non-current assets 55 - 55 55 - 55
Total assets 1,201 227 1,428 2,885 507 3,392
Current liabilities (314) (103) (417) (1,237) (215) (1,452)
Net assets $ 887 $ 124 $ 1,011 $ 1,648 $ 292 $ 1,940
Year Ended December 31, 2020 Year Ended December 31, 2019
$Thousands AKITA % JV Partner % Total AKITA % JV Partner % Total
Revenue $ 5,094 $ 769 $ 5,863 $ 5,289 $ 1,120 $ 6,409
Net income and comprehensive income $ 650 $ 67 $ 717 $ 1,129 $ 245 $ 1,374

AKITA DRILLING | 2020 Annual Report 63
NOTES TO THE CONSOLIDATED FINANCIAL STATEMENTS
WORKING CAPITAL12. Financial Instruments
Accounting Policies Due to the short-term nature of the Company’s financial instruments, fair values approximate carrying values unless otherwise stated.
The Company discloses its financial instruments within a hierarchy prioritizing the inputs to fair value measurements at the following three levels:
• Level 1 – unadjusted quoted prices in active markets for identical assets or liabilities;
• Level 2 – inputs other than quoted prices that are observable for the asset or liability either directly or indirectly; and
• Level 3 – inputs that are not based on observable market data.
Classification and measurement The Company classifies its financial instruments in the following measurements categories depending on the Company's business model for managing financial assets on the contractual terms of the cash flows:
(i) Financial assets at amortized cost:
Assets that are held for collection of contractual cash flows where those cash flows represent solely payments of principal and interest are measured at amortized cost. Interest income from these financial assets is included in finance income using the effective interest rate method. Any gain or loss arising on derecognition is recognized directly in profit or loss and presented in other gains (losses), together with foreign exchange gains and losses. As at December 31, 2020, the Company’s financial assets in this category include cash and accounts receivable.
(ii) Financial liabilities at amortized cost:
Financial liabilities that are measured at amortized cost are initially recognized at the amount required to be paid less, when material, a discount to reduce the payables and accrued liabilities to fair value. Subsequently, financial liabilities are measured at amortized cost using the effective interest rate method. As at December 31, 2020, the Company's financial liabilities in this category include accounts payable and accrued liabilities and its operating loan facility.
(iii) Fair value through other comprehensive income (“FVOCI”):
Assets that are held for collection of contractual cash flows and for selling the financial assets, where the assets’ cash flows represent solely payments of principal and interest, are measured at FVOCI. Movements in the carrying amount are taken through OCI, except for the recognition of impairment gains or losses, interest revenue and foreign exchange gains and losses which are recognized in profit or loss. When the financial asset is derecognized, the cumulative gain or loss previously recognized in OCI is reclassified from equity to profit or loss and recognized in other gains (losses) and impairment expenses are presented as a separate line item on the statement of profit or loss. As at December 31, 2020, the Company held no financial instruments in this category.

AKITA DRILLING | 2020 Annual Report64
NOTES TO THE CONSOLIDATED FINANCIAL STATEMENTS
(iv) Fair value through profit or loss (“FVPL”):
Assets that do not meet the criteria for amortized cost or FVOCI are measured at FVPL. A gain or loss on a debt investment that is subsequently measured at FVPL is recognized in profit or loss and presented net within other gains (losses) in the period in which it arises. Financial assets at FVPL are financial assets held for trading. Derivatives are also categorized as held for trading and measured at FVPL unless they are designated as hedges. As at December 31, 2020, the Company held no financial instruments in this category.
Impairment of financial assetsThe Company assesses, on a forward-looking basis, the expected credit losses associated with its debt instruments carried at amortized cost. The impairment methodology applied depends on whether there has been a significant increase in credit risk.
Financial Instrument Risk Exposure and ManagementThe Company is exposed to the following risks associated with its financial instruments:
Credit riskCredit risk is the risk of financial loss if a customer or counterparty to a financial instrument fails to meet its contractual obligations and arises primarily from the Company’s trade and other receivables. The credit risk is managed via the Company’s credit-granting procedures which include an evaluation of the customer’s financial condition and payment history. In certain circumstances the Company may require customers to make advance payment prior to the provision of services, issue a letter of credit or take other measures to reduce credit risk.
For trade receivables, the Company applies the simplified approach to measuring expected credit losses which uses a lifetime expected loss allowance for all trade receivables. To measure the expected credit losses, trade receivables and contract assets have been grouped based on shared credit-risk characteristics and analyzed. Accounts receivable are written-off when there is no reasonable expectation of recovery. Indicators that there is no reasonable expectation of recovery include, amongst others, the failure of a debtor to engage in a repayment plan with the Company and a failure to make contractual payments for a period greater than 180 days past due.
The terms of the Company’s contracts generally require payment within 30 days. The Company continuously monitors the recoverability of its accounts receivable balances and subject to agreed payment terms, generally considers the balance to be overdue when it ages over 90 days. In management’s judgment there is no significant credit risk exposure in the balances outstanding at:
$Thousands December 31, 2020 December 31, 2019
Within 30 days $ 11,934 $ 23,566
31 to 60 days 2,078 6,868
61 to 90 days - 1,989
Over 90 days 1,791 285
Estimated credit losses (675) (600)
Total accounts receivable $ 15,128 $ 32,108

AKITA DRILLING | 2020 Annual Report 65
NOTES TO THE CONSOLIDATED FINANCIAL STATEMENTS
Significant Estimates and Judgments – Estimated Credit Losses
The loss allowances for financial assets are based on assumptions about risk of default and expected loss rates. The Company uses judgment in making these assumptions and selecting the inputs to the impairment calculation, based on the Company’s past history, existing market conditions as well as forward-looking estimates at the end of each reporting period.
Liquidity riskLiquidity risk is the risk that the Company will not be able to meet its financial obligations as they come due. The Company mitigates liquidity risk through management of its working capital balance, monitoring actual and forecasted cash flows and using its operating loan facility when necessary. At December 31, 2020, this risk was limited by positive cash flows from operations, $8.7 million in a positive working capital balance and $35.0 million available in the Company’s undrawn banking facility.
If future results do not meet the Company’s expectations there is a risk that the Company could be offside with its financial covenants in its banking facility and lose the ability to draw on the facility to meet its financial obligations or have to repay the amounts outstanding on the facility. The Company maintains a positive working relationship with the banks in its syndicated facility and on July 17, 2020, entered into an amending agreement with its lenders in the syndicate to provide a five quarter covenant relief period. This covenant relief period has been extended until December 31, 2021 (Note 14).
Maturity information regarding the Company’s long-term debt is as follows:
$Thousands Less than 1 Year 1-4 Years Total
Bank credit facility - principal $ - $ 74,303 $ 74,303
Bank credit facility - interest 3,708 7,416 11,124
Total $ 3,708 $ 81,719 $ 85,427
Maturity information regarding the Company’s long-term lease obligations is as follows:
$Thousands Less than 1 Year 2-3 years 4-5 Years Total
Lease obligations $ 1,049 $ 1,561 $ 358 $ 2,968
Lease obligations - interest 138 109 10 257
Total $ 1,187 $ 1,670 $ 368 $ 3,225
Foreign currency exchange - transaction riskForeign currency exchange transaction risk is the risk that future cash flows will fluctuate as a result of changes in foreign currency exchange rates. The Company’s geographical divisional operations are primarily denominated in their local currency with limited

AKITA DRILLING | 2020 Annual Report66
NOTES TO THE CONSOLIDATED FINANCIAL STATEMENTS
exposure to foreign currency exchange transaction risk through capital expenditures or financial instruments. From time to time the company may enter into forward currency contracts to manage this risk.
Foreign currency exchange - translation riskThe Company is exposed to foreign currency exchange translation risk as revenues, expenses and working capital from its US operations are denominated in USD. In addition, the Company’s foreign subsidiaries are subject to unrealized foreign currency exchange translation gains or losses on consolidation.
Interest rate riskThe Company is exposed to changes in interest rates on borrowings under its operating loan facility which is subject to floating interest rates.
Commodity riskThe Company is exposed to the effects of fluctuating crude oil and natural gas prices through the resultant changes in the exploration and development budgets of its customers.
Accounts Payable and Accrued LiabilitiesAccounts payable and accrued liabilities are comprised of the following:
$Thousands December 31, 2020 December 31, 2019
Trade payables $ 7,415 $ 3,516
Statutory liabilities 504 923
Accrued expenses 5,907 14,413
Post-employment benefits 90 90
Total accounts payable and accrued liabilities $ 13,916 $ 18,942
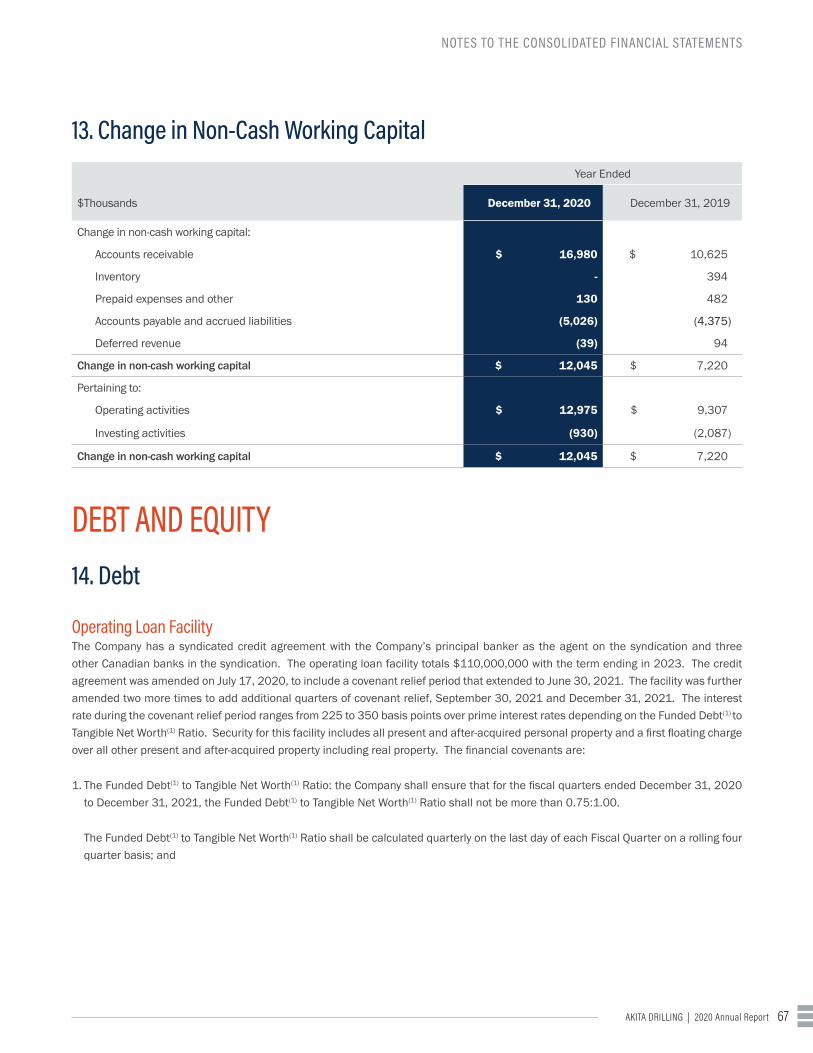
AKITA DRILLING | 2020 Annual Report 67
NOTES TO THE CONSOLIDATED FINANCIAL STATEMENTS
13. Change in Non-Cash Working CapitalYear Ended
$Thousands December 31, 2020 December 31, 2019
Change in non-cash working capital:
Accounts receivable $ 16,980 $ 10,625
Inventory - 394
Prepaid expenses and other 130 482
Accounts payable and accrued liabilities (5,026) (4,375)
Deferred revenue (39) 94
Change in non-cash working capital $ 12,045 $ 7,220
Pertaining to:
Operating activities $ 12,975 $ 9,307
Investing activities (930) (2,087)
Change in non-cash working capital $ 12,045 $ 7,220
DEBT AND EQUITY14. Debt
Operating Loan Facility The Company has a syndicated credit agreement with the Company’s principal banker as the agent on the syndication and three other Canadian banks in the syndication. The operating loan facility totals $110,000,000 with the term ending in 2023. The credit agreement was amended on July 17, 2020, to include a covenant relief period that extended to June 30, 2021. The facility was further amended two more times to add additional quarters of covenant relief, September 30, 2021 and December 31, 2021. The interest rate during the covenant relief period ranges from 225 to 350 basis points over prime interest rates depending on the Funded Debt(1) to Tangible Net Worth(1) Ratio. Security for this facility includes all present and after-acquired personal property and a first floating charge over all other present and after-acquired property including real property. The financial covenants are:
1. The Funded Debt(1) to Tangible Net Worth(1) Ratio: the Company shall ensure that for the fiscal quarters ended December 31, 2020 to December 31, 2021, the Funded Debt(1) to Tangible Net Worth(1) Ratio shall not be more than 0.75:1.00.
The Funded Debt(1) to Tangible Net Worth(1) Ratio shall be calculated quarterly on the last day of each Fiscal Quarter on a rolling four quarter basis; and

AKITA DRILLING | 2020 Annual Report68
NOTES TO THE CONSOLIDATED FINANCIAL STATEMENTS
2. The EBITDA(1) to Interest Expense(1) Ratio: the Company shall ensure that:
(i) For the fiscal quarter ended December 31, 2020, the EBITDA(1) to Interest Expense(1) Ratio shall not be less than 1.25:1.00;
(ii) For the fiscal quarters ended March 31, 2021, and June 30, 2021, the EBITDA(1) to Interest Expense(1) Ratio is waived;
(iii) For the fiscal quarter ended September 30, 2021, the EBITDA(1) to Interest Expense(1) Ratio shall not be less than 0.75:1.00; and
(iv) For the fiscal quarter ended December 31, 2021, the EBITDA(1) to Interest Expense(1) Ratio shall not be less than 1.25:1.00.
The EBITDA(1) to Interest Expense(1) Ratio shall be calculated quarterly on the last day of each Fiscal Quarter on a rolling four quarter basis; and
3. A minimum trailing twelve month EBITDA(1) test will be required quarterly during the Covenant Relief Period, with EBITDA(1) varying each period in line with agreed upon forecasts.
Upon the end of the Covenant Relief Period the Company’s covenants revert back to:
(i) Funded Debt(1) to EBITDA(1) Ratio of not more than 3.00:1.00; and
(ii) EBITDA(1) to Interest Expense(1) Ratio of not less than 3.00:1.00.
At December 31, 2020, the Company was in compliance with its covenants with a Funded Debt(1) to Tangible Net Worth(1) Ratio of 0.38:1.00, an EBITDA(1) to Interest Expense(1) Ratio of 3.94:1.00 and a trailing twelve month EBITDA(1) in excess of the $17,612,000 minimum threshold.
The facility also includes a borrowing base calculation which is the sum of:
(i) 75% of Eligible Accounts Receivable(1); plus
(ii) 50% of the orderly liquidation value of all Eligible Rig Assets(1); less
(iii) Priority Payables(1) of the Loan Parties.
At December 31, 2020, the Company’s borrowing base totalled $116,796,000.
The Company borrowed $75,000,000 from this facility as at December 31, 2020 (December 31, 2019 - $77,535,000).
(1) Funded Debt, Tangible Net Worth, EBITDA, Interest Expense, Eligible Accounts Receivable, Eligible Rig Assets and Priority Payables are all defined terms in the Company’s credit agreement.

AKITA DRILLING | 2020 Annual Report 69
NOTES TO THE CONSOLIDATED FINANCIAL STATEMENTS
Continuity of Debt
$Thousands Debt
Balance at December 31, 2019 $ 84,019
Drawn on credit facility 9,000
Repayment of debt (18,953)
Unamoritized deferred loan fees 237
Balance as at December 31, 2020 $ 74,303
$Thousands Debt
Current portion $ -
Long-term portion 74,303
Balance as at December 31, 2020 $ 74,303
15. Capital ManagementThe Company has determined capital to include long-term debt and share capital. The Company's objectives when managing capital are:
• to safeguard the Company's ability to continue as a going concern, so that it can continue to provide returns for shareholders and benefits for other stakeholders; and
• to augment existing resources in order to meet growth opportunities.
The Company manages the capital structure and makes adjustments to it in light of changes in economic conditions and the risk characteristics of the underlying assets. In order to maintain or adjust the capital structure, the Company may adjust the amount of dividends paid to shareholders, repurchase shares, issue new shares, sell assets or take on long-term debt.

AKITA DRILLING | 2020 Annual Report70
NOTES TO THE CONSOLIDATED FINANCIAL STATEMENTS
16. Share CapitalAuthorized:
• An unlimited number of Series Preferred shares, issuable in series, designated as First Preferred shares, no par value• An unlimited number of Series Preferred shares, issuable in series, designated as Second Preferred shares, no par value• An unlimited number of Class A Non-Voting shares, no par value• An unlimited number of Class B Common shares, no par value
Issued:• All issued shares are fully paid
The shares outstanding at December 31, 2020 and December 31, 2019 are:
Number of shares Class A Non-Voting Class B Common Total
Shares outstanding 37,954,407 1,653,784 39,608,191
Each Class B Common share may be converted into one Class A Non-Voting share at the shareholder’s option.
The holders of Class A Non-Voting shares have no right to participate if a takeover bid is made for Class B Common shares unless:• an offer to purchase Class B Common shares is made to all or substantially all holders of Class B Common shares;
• at the same time, an offer to purchase Class A Non-Voting shares on the same terms and conditions is not made to the holders of Class A Non-Voting shares; and
• holders of more than 50% of the Class B Common shares do not reject the offer in accordance with the terms of AKITA's articles of incorporation.
If these three pre-conditions are met, then the holders of Class A Non-Voting shares will be entitled to exchange each Class A Non-Voting share for one Class B Common share for the purpose of depositing the resulting Class B Common shares pursuant to the terms of the takeover bid.
The Class A Non-Voting shares and Class B Common shares rank equally in all other respects.
Incremental costs attributable to the issue of new shares or options are recorded as a reduction in equity, net of income taxes.
Shares repurchased by the Company are recorded as a reduction of shareholders’ equity based upon the consideration paid, including any directly incremental costs, net of income taxes. All shares repurchased by the Company are cancelled upon repurchase.

AKITA DRILLING | 2020 Annual Report 71
NOTES TO THE CONSOLIDATED FINANCIAL STATEMENTS
PERSONNEL17. Share-Based Compensation PlansThe Company has three share-based compensation plans. Stock options qualify as an equity-settled share-based compensation plan while deferred share units (“DSUs”) and share appreciation rights (“SARs”) qualify as cash-settled share-based compensation plans. For all three of the share-based compensation plans, associated services received are measured at fair value and are calculated by multiplying the number of options, DSUs or SARs expected to vest with the fair value of one option, DSU or SAR as of the grant date.
Stock OptionsSubject to the approval of the Company’s Board of Directors, the Company’s Corporate Governance, Nomination, Compensation and Succession Committee may designate directors, officers, employees and other persons providing services to the Company to be granted options to purchase Class A Non-Voting shares.
The vesting provisions and exercise period (which cannot exceed 10 years) are determined at the time of the grant. Each tranche is considered a separate award with its own vesting period and grant date fair value. The fair value of each tranche is measured at the date of grant using either the Binomial or the Black Scholes option pricing model. The number of awards expected to vest is reviewed at least annually, with any impact being recognized immediately.
The following table summarizes stock options reserved, granted and available for future issuance:
Number of optionsDecember 31,
2020December 31,
2019
Reserved under the current stock option plan 3,100,000 3,100,000
Balance at beginning of year 292,000 644,500
Expired 130,000 -
Cancelled 746,000 -
Granted (355,000) (352,500)
Available for future issuance 813,000 292,000

AKITA DRILLING | 2020 Annual Report72
NOTES TO THE CONSOLIDATED FINANCIAL STATEMENTS
A summary of the Company’s stock options is presented below:
2020 2019
Number of Options
Weighted Average
Exercise PriceNumber of
Options
Weighted Average
Exercise Price
Options outstanding at January 1 1,406,000 $ 8.20 1,053,500 $ 9.63
Granted 355,000 $ 0.44 352,500 $ 3.03
Cancelled (746,000) $ 10.55 - $ -
Expired (172,500) $ 8.50 - $ -
Options outstanding at December 31 842,500 $ 2.80 1,406,000 $ 8.20
Options exercisable at December 31 249,000 $ 3.60 914,000 $ 9.99
The following table summarizes outstanding stock options at December 31:
2020 2019
Vesting Period (Years)
Exercise Price
Number Outstanding
Remaining Contractual Life (Years)
Number Exercisable
Number Outstanding
Remaining Contractual Life (Years)
Number Exercisable
5 $ 9.87 130,000 0.2 130,000
5 $ 10.32 76,000 1.2 76,000
5 $ 10.86 82,500 2.2 82,500
5 $ 13.81 87,500 3.7 87,500
5 $ 16.02 115,000 4.7 115,000
5 $ 10.28 90,000 5.3 90,000
5 $ 7.13 197,500 6.3 158,000
5 $ 8.26 97,500 7.3 58,500
5 $ 5.62 162,500 7.7 97,500 177,500 8.7 71,000
5 $ 3.93 327,500 8.2 81,000 352,500 9.2 45,500
5 $ 0.44 352,500 7.5 70,500
Weighted Average Contractual Life 7.8 6.0
Deferred Share UnitsThe Company has a cash-settled share-based long-term incentive compensation plan for certain employees. Each DSU granted equates to one Class A Non-Voting share and entitles the holder to receive a cash payment equal to the Company’s share price on the payment date. DSU holders are entitled to share in dividends, which are credited as additional DSUs, at each dividend payment date. DSUs vest immediately but are not exercisable until resignation or retirement from management and/or the Board of Directors.
Units issued under the Company’s DSU plan are measured at fair value using the intrinsic value method when granted and subsequently re-measured at each reporting date using the Company’s Class A Non-Voting share price at the reporting date with the associated expense recognized in selling and administrative expense. The Company assumes a zero forfeiture rate.

AKITA DRILLING | 2020 Annual Report 73
NOTES TO THE CONSOLIDATED FINANCIAL STATEMENTS
A summary of the Company’s DSU plan is presented below:
2020 2019
DSUs (#)
Fair Value
($000's)DSUs
(#)
Fair Value
($000's)
DSUs outstanding at January 1 187,011 $222 102,370 $417
Granted - - 71,711 273
Redeemed (27,129) (14) - -
Issued in lieu of dividends - - 12,930 39
Change in fair value (131) (507)
DSUs outstanding at December 31 159,882 $77 187,011 $222
Share Appreciation RightsSARs may be granted to directors, officers and key employees of the Company. The vesting provisions (which range from three to eight years) and exercise period (which cannot exceed 10 years) are determined at the time of grant. The holder is entitled on exercise to receive a cash payment from the Company equal to any increase in the market price of the Class A Non-Voting shares over the base value of the SAR exercised. The base value is equal to the closing price of the Class A Non-Voting shares on the day before the grant.
Share-Based Compensation Expense The fair value of the services received is recognized as selling and administrative expense. In the case of equity-settled share-based payment plans, the selling and administrative expense results in a corresponding increase in contributed surplus over the vesting period of the respective plan. When stock options are exercised, shares are issued and the amount of the proceeds, together with the amount recorded in contributed surplus, is recognized in share capital. For cash-settled share-based payment plans, a corresponding liability is recognized. The fair value of the cash-settled share-based payment plans is remeasured at each Statement of Financial Position date through the Statement of Net Income and Comprehensive Income until settlement.
Share-based compensation expense consists of the following:
Year Ended
$Thousands December 31, 2020 December 31, 2019
Stock option expense $ 182 $ 314
DSUs recovery (131) (194)
Total share-based compensation expense $ 51 $ 120
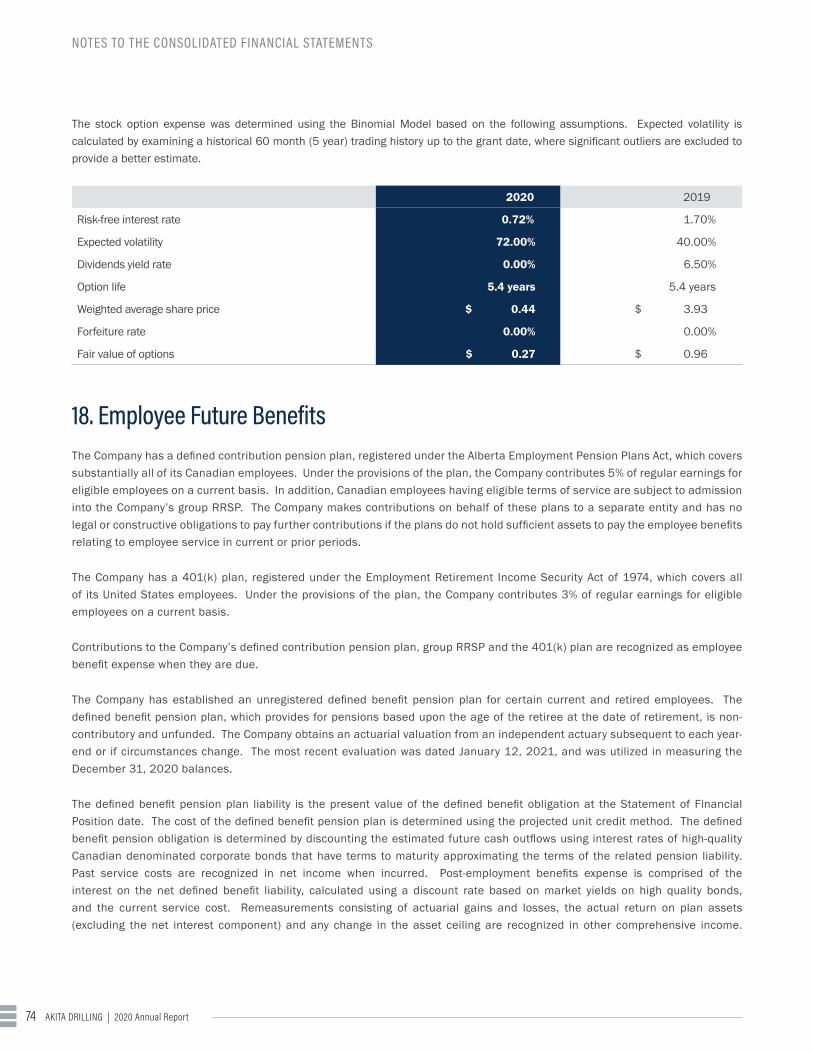
AKITA DRILLING | 2020 Annual Report74
NOTES TO THE CONSOLIDATED FINANCIAL STATEMENTS
The stock option expense was determined using the Binomial Model based on the following assumptions. Expected volatility is calculated by examining a historical 60 month (5 year) trading history up to the grant date, where significant outliers are excluded to provide a better estimate.
2020 2019
Risk-free interest rate 0.72% 1.70%
Expected volatility 72.00% 40.00%
Dividends yield rate 0.00% 6.50%
Option life 5.4 years 5.4 years
Weighted average share price $ 0.44 $ 3.93
Forfeiture rate 0.00% 0.00%
Fair value of options $ 0.27 $ 0.96
18. Employee Future BenefitsThe Company has a defined contribution pension plan, registered under the Alberta Employment Pension Plans Act, which covers substantially all of its Canadian employees. Under the provisions of the plan, the Company contributes 5% of regular earnings for eligible employees on a current basis. In addition, Canadian employees having eligible terms of service are subject to admission into the Company’s group RRSP. The Company makes contributions on behalf of these plans to a separate entity and has no legal or constructive obligations to pay further contributions if the plans do not hold sufficient assets to pay the employee benefits relating to employee service in current or prior periods.
The Company has a 401(k) plan, registered under the Employment Retirement Income Security Act of 1974, which covers all of its United States employees. Under the provisions of the plan, the Company contributes 3% of regular earnings for eligible employees on a current basis.
Contributions to the Company’s defined contribution pension plan, group RRSP and the 401(k) plan are recognized as employee benefit expense when they are due.
The Company has established an unregistered defined benefit pension plan for certain current and retired employees. The defined benefit pension plan, which provides for pensions based upon the age of the retiree at the date of retirement, is non-contributory and unfunded. The Company obtains an actuarial valuation from an independent actuary subsequent to each year-end or if circumstances change. The most recent evaluation was dated January 12, 2021, and was utilized in measuring the December 31, 2020 balances.
The defined benefit pension plan liability is the present value of the defined benefit obligation at the Statement of Financial Position date. The cost of the defined benefit pension plan is determined using the projected unit credit method. The defined benefit pension obligation is determined by discounting the estimated future cash outflows using interest rates of high-quality Canadian denominated corporate bonds that have terms to maturity approximating the terms of the related pension liability. Past service costs are recognized in net income when incurred. Post-employment benefits expense is comprised of the interest on the net defined benefit liability, calculated using a discount rate based on market yields on high quality bonds, and the current service cost. Remeasurements consisting of actuarial gains and losses, the actual return on plan assets (excluding the net interest component) and any change in the asset ceiling are recognized in other comprehensive income.

AKITA DRILLING | 2020 Annual Report 75
NOTES TO THE CONSOLIDATED FINANCIAL STATEMENTS
$Thousands 2020 2019
Actuarial present value of defined benefit obligation at January 1 $ 5,298 $ 4,802
Interest cost 158 173
Current service cost 19 37
Benefits paid (90) (90)
Unrealized actuarial loss 415 376
Actuarial present value of defined benefit obligation at December 31 $ 5,800 $ 5,298
$Thousands 2020 2019
Pension liability allocated to:
Accounts payable and accrued liabilities $ 90 $ 90
Non-current liabilities 5,710 5,208
Pension liability outstanding at December 31 $ 5,800 $ 5,298
Key Assumptions
Year Ended
December 31, 2020 December 31, 2019
Discount rate at beginning of the year 3.0% 3.6%
Anticipated retirement age of plan members 65 to 67 years 63 to 67 years
The Company’s pension expense is recorded in selling and administrative expenses and interest expense and is comprised of the following:
Year Ended
$Thousands December 31, 2020 December 31, 2019
Defined benefit pension plan
Interest cost $ 158 $ 173
Service cost 19 37
Expense for defined benefit pension plan 177 210
Expense for defined contribution pension plans 1,893 3,156
Total expense $ 2,070 $ 3,366

AKITA DRILLING | 2020 Annual Report76
NOTES TO THE CONSOLIDATED FINANCIAL STATEMENTS
Significant Estimates and Judgments – Defined Benefit Pension Liability Significant estimates used in the preparation of AKITA’s financial statements relate to the measurement of the non-current defined benefit pension liability for selected current and retired employees that was recorded as $5,710,000 at December 31, 2020 (December 31, 2019 - $5,208,000). AKITA utilizes the services of a third party to assist in the actuarial estimate of the Company’s defined benefit pension expense and liability. At December 31, 2020, a key assumption is the discount rate of 2.3% (2019 – 3.0%). From the perspective of a sensitivity analysis, a 1% decrease in the discount rate would result in a $781,000 increase in the defined benefit obligation while a 1% increase in the discount rate would result in a $646,000 decrease in the defined benefit obligation. Additionally, if members’ lives should be one year longer than actuarial expectations, the defined benefit obligation would increase by $127,000. Except for the impact on the discount rate used in the pension assumptions, recent changes in the global economy and related markets have not otherwise affected the measurement of the Company’s defined benefit pension liability.
OTHER NOTES19. Commitments and ContingenciesFrom time to time, the Company enters into drilling contracts with its customers that are for extended periods. At December 31, 2020, the Company had four drilling rigs with multi-year contracts. Of these contracts, four are due to expire in 2021.
The Company has entered into a two year contract with a related party to provide sponsorship and advertising at an annual cost of $175,000.
At December 31, 2020, the Company had capital expenditure commitments of $422,000 (2019 – $1,406,000).
20. Related Party TransactionsAll related party transactions were made in the normal course of business with regular payment terms and have been recorded at the amounts agreed upon with the related parties.
a) ATCO Group and Spruce MeadowsThe Company is related to the ATCO Group of companies and to Spruce Meadows through its controlling shareholder (see Note 1 – General Information). The transactions and year-end balances with those affiliates are presented below:
Year Ended
$Thousands December 31, 2020 December 31, 2019
Revenue (computer services, rent) $ 85 $ 84
Purchases
Property, plant and equipment (wellsite trailers) $ 57 $ -
Sponsorship and advertising (Note 19) $ 175 $ 365
Selling and administrative $ 49 $ 53
Operating $ 570 $ 458
Year-end accounts payable $ 31 $ 70

AKITA DRILLING | 2020 Annual Report 77
NOTES TO THE CONSOLIDATED FINANCIAL STATEMENTS
b) Joint ventures and joint venture partners The Company is related to its joint ventures and joint venture partners. The joint ventures’ and joint venture partners’ transactions and year-end balances with AKITA are presented below:
Year Ended
$Thousands December 31, 2020 December 31, 2019
Operating costs $ 837 $ 773
Selling and administrative costs $ 115 $ 103
Year Ended
$Thousands December 31, 2020 December 31, 2019
Due to AKITA from joint venture partners $ 991 $ 1,031
Due to AKITA from joint ventures $ 123 $ 885
c) Key management compensationKey management includes the officers and directors of the Company. The compensation paid or payable to key management for services in the capacity as either officers or directors is shown below:
Year Ended
$Thousands December 31, 2020 December 31, 2019
Salaries, director's fees and other short-term benefits $ 1,431 $ 2,344
Long-service retiring allowance $ 3,177 $ -
Post-employment benefits $ 78 $ 141
Share-based payments $ 132 $ 765
Long-service retiring allowance payable $ 1,500 $ -

AKITA DRILLING | 2020 Annual Report78
10 YEAR FINANCIAL REVIEW
10 YEAR FINANCIAL REVIEW$Thousands (except per share)
Annual Ranking 2020 2019 2018 2017 2016 2015 2014 2013 2012 2011
Summary of OperationsRevenue 6 $ 119,664 $ 175,890 $ 118,361 $ 71,198 $ 61,061 $ 112,488 $ 165,274 $ 168,111 $ 203,440 $ 199,934
Income (loss) before income taxes 10 $ (102,701) $ (24,679) $ (12,228) $ (53,230) $ 7,535 $ (44,544) $ 28,121 $ 35,682 $ 38,413 $ 31,762
Income taxes expense (recovery) 8 $ (9,427) $ (4,804) $ 3,651 $ (14,053) $ 2,206 $ (10,579) $ 7,042 $ 9,167 $ 9,658 $ 8,409
Net income (loss) 6 $ (15,939) $ (19,875) $ (15,939) $ (39,177) $ 5,329 $ (33,965) $ 21,079 $ 26,515 $ 28,755 $ 23,353
As a percentage of average shareholders’ equity 8 (10.5%) (8.1%) (5.9%) (22.5%) 2.4% (14.2%) 8.3% 11.3% 13.5% 12.1%
Earnings (loss) per Class A and Class B share (basic) 9 $ (2.03) $ (0.50) $ (0.65) $ (2.18) $ 0.30 $ (1.89) $ 1.17 $ 1.48 $ 1.60 $ 1.29
Funds flow from operations 9 $ 10,321 $ 12,925 $ 14,306 $ 6,607 $ 34,500 $ 38,510 $ 56,195 $ 57,619 $ 59,474 $ 42,895
As a percentage of average shareholders’ equity 7 6.8% 5.3% 5.3% 3.8% 15.7% 16.0% 22.2% 24.6% 28.0% 22.3%
Financial Position at Year EndWorking capital (deficiency) 8 $ 8,683 $ 4,032 $ 11,166 $ 15,528 $ 34,907 $ 16,002 $ (5,028) $ 40,645 $ 31,214 $ 44,265
Current ratio 7 1.56:1 1.14:1 1.31:1 2.02:1 4.49:1 2.45:1 0.90:1 2.93:1 1.70:1 2.37:1
Total assets 8 $ 251,521 $ 369,116 $ 403,641 $ 207,497 $ 257,907 $ 254,516 $ 340,926 $ 291,748 $ 292,994 $ 247,130
Shareholders’ equity 10 $ 152,266 $ 245,134 $ 271,728 $ 174,455 $ 219,646 $ 220,200 $ 259,841 $ 245,288 $ 223,998 $ 201,104
per share 10 $ 3.84 $ 6.19 $ 6.86 $ 9.72 $ 12.24 $ 12.27 $ 14.48 $ 13.65 $ 12.49 $ 11.15
OtherCapital expenditures (net) 10 $ 7,593 $ 15,238 $ 17,546 $ 20,348 $ 13,193 $ 17,960 $ 103,949 $ 35,113 $ 65,356 $ 54,509
Depreciation and amortization 3 $ 32,681 $ 36,763 $ 26,614 $ 27,126 $ 23,959 $ 36,748 $ 30,200 $ 26,825 $ 24,342 $ 20,933
Dividends paid 10 $ - $ 10,101 $ 7,942 $ 6,100 $ 6,100 $ 6,101 $ 6,015 $ 5,567 $ 5,038 $ 5,066
per share 10 $ - $ 0.17 $ 0.34 $ 0.34 $ 0.34 $ 0.34 $ 0.34 $ 0.32 $ 0.28 $ 0.28
Note: Readers should be aware that these revenue amounts reported for 2012 through 2020 include revenue solely generated by the Company from its wholly-owned operations.

AKITA DRILLING | 2020 Annual Report 79
10 YEAR FINANCIAL REVIEW
$Thousands (except per share)Annual
Ranking 2020 2019 2018 2017 2016 2015 2014 2013 2012 2011
Summary of OperationsRevenue 6 $ 119,664 $ 175,890 $ 118,361 $ 71,198 $ 61,061 $ 112,488 $ 165,274 $ 168,111 $ 203,440 $ 199,934
Income (loss) before income taxes 10 $ (102,701) $ (24,679) $ (12,228) $ (53,230) $ 7,535 $ (44,544) $ 28,121 $ 35,682 $ 38,413 $ 31,762
Income taxes expense (recovery) 8 $ (9,427) $ (4,804) $ 3,651 $ (14,053) $ 2,206 $ (10,579) $ 7,042 $ 9,167 $ 9,658 $ 8,409
Net income (loss) 6 $ (15,939) $ (19,875) $ (15,939) $ (39,177) $ 5,329 $ (33,965) $ 21,079 $ 26,515 $ 28,755 $ 23,353
As a percentage of average shareholders’ equity 8 (10.5%) (8.1%) (5.9%) (22.5%) 2.4% (14.2%) 8.3% 11.3% 13.5% 12.1%
Earnings (loss) per Class A and Class B share (basic) 9 $ (2.03) $ (0.50) $ (0.65) $ (2.18) $ 0.30 $ (1.89) $ 1.17 $ 1.48 $ 1.60 $ 1.29
Funds flow from operations 9 $ 10,321 $ 12,925 $ 14,306 $ 6,607 $ 34,500 $ 38,510 $ 56,195 $ 57,619 $ 59,474 $ 42,895
As a percentage of average shareholders’ equity 7 6.8% 5.3% 5.3% 3.8% 15.7% 16.0% 22.2% 24.6% 28.0% 22.3%
Financial Position at Year EndWorking capital (deficiency) 8 $ 8,683 $ 4,032 $ 11,166 $ 15,528 $ 34,907 $ 16,002 $ (5,028) $ 40,645 $ 31,214 $ 44,265
Current ratio 7 1.56:1 1.14:1 1.31:1 2.02:1 4.49:1 2.45:1 0.90:1 2.93:1 1.70:1 2.37:1
Total assets 8 $ 251,521 $ 369,116 $ 403,641 $ 207,497 $ 257,907 $ 254,516 $ 340,926 $ 291,748 $ 292,994 $ 247,130
Shareholders’ equity 10 $ 152,266 $ 245,134 $ 271,728 $ 174,455 $ 219,646 $ 220,200 $ 259,841 $ 245,288 $ 223,998 $ 201,104
per share 10 $ 3.84 $ 6.19 $ 6.86 $ 9.72 $ 12.24 $ 12.27 $ 14.48 $ 13.65 $ 12.49 $ 11.15
OtherCapital expenditures (net) 10 $ 7,593 $ 15,238 $ 17,546 $ 20,348 $ 13,193 $ 17,960 $ 103,949 $ 35,113 $ 65,356 $ 54,509
Depreciation and amortization 3 $ 32,681 $ 36,763 $ 26,614 $ 27,126 $ 23,959 $ 36,748 $ 30,200 $ 26,825 $ 24,342 $ 20,933
Dividends paid 10 $ - $ 10,101 $ 7,942 $ 6,100 $ 6,100 $ 6,101 $ 6,015 $ 5,567 $ 5,038 $ 5,066
per share 10 $ - $ 0.17 $ 0.34 $ 0.34 $ 0.34 $ 0.34 $ 0.34 $ 0.32 $ 0.28 $ 0.28


AKITA DRILLING | 2020 Annual Report 81
CORPORATE INFORMATIONDirectorsLoraine M. CharltonCorporate DirectorCalgary, Alberta
Douglas A. DafoePresident and CEOEmber Resources Inc.Calgary, Alberta
Harish K. MohanCorporate DirectorCalgary, Alberta
Dale R. RichardsonVice President, Sentgraf Enterprises Ltd.Calgary, Alberta
Karl A. RuudPresident and Chief Executive Officer, AKITA Drilling Ltd. Calgary, Alberta
Nancy C. SouthernChairman, President and Chief Executive Officer, ATCO Ltd., Canadian Utilities Limited, and CU Inc. Calgary, Alberta
Linda A. Southern-HeathcottPresident and Chief Executive Officer, Spruce Meadows Ltd.,President, Team Spruce Meadows Inc.,Chairman of the Board, AKITA Drilling Ltd. Calgary, Alberta
Head OfficeAKITA Drilling Ltd.,1000, 333 - 7th Avenue SWCalgary, Alberta T2P 2Z1403.292.7979
BankerATB FinancialCalgary, Alberta
CounselBennett Jones LLPCalgary, Alberta
AuditorsPricewaterhouseCoopers LLPCalgary, Alberta
Registrar and Transfer AgentAST Trust Company (Canada)Calgary, Alberta and Toronto, Ontario 1.800.387.0825
Share Symbol/TSXClass A Non-Voting (AKT.A)
Class B Common (AKT.B)
Websitewww.akita-drilling.com
Henry G. WilmotCorporate DirectorCalgary, Alberta
Charles W. WilsonCorporate DirectorBoulder, Colorado
OfficersRaymond T. ColemanPresident, USA Division
Colin A. DeaseVice President, Canadian Operations, Corporate Secretary and Legal Counsel
Craig W. KushnerDirector of Human Resources
Darcy ReynoldsVice President, Finance and Chief Financial Officer
Karl A. RuudPresident and Chief Executive Officer

AKITA DRILLING 2020 Annual Report
HEAD OFFICEAKITA Drilling Ltd., 1000, 333 - 7th Ave SW
Calgary, Alberta T2P 2Z1 Canadawww.akita-drilling.com