Greenest City 2020 Action Plan - the City's - City of Vancouver

3
2020 ACTION PLAN
2015–2016 IMPLEMENTATION UPDATE

4
PROGRESS HIGHLIGHTS
10% OF COMMUTING TRIPS MADE BY CYCLING
48,900 NEW TREES PLANTED
DECREASE -IN-
COMMUNITY GREENHOUSE
GASES SINCE 2007
15%BIODIVERSITY STRATEGY
APPROVED
DECREASE IN SOLID WASTE SENT TO LANDFILL AND INCINERATOR SINCE 2008
INCREASE IN NEIGHBOURHOOD
FOOD ASSETS SINCE 2010
-TRIPS MADE BY-
WALKING, CYCLING, OR TRANSIT
38%
50%
DECREASE -IN-
VEHICLE KM DRIVEN
PER PERSON SINCE 2007
27%
23%
SINCE 2010
20%
DECREASE IN GREENHOUSE GASES FROM BUILDINGS
JUNE 2007

GOAL AND TARGETS INDICATOR BASELINE 2015
CHANGE
FROM
BASELINE
IMPROVED
OVER
BASELINE
2020
TARGET
CLIMATE AND RENEWABLES
Target 1: Reduce community-based greenhouse
gas emissions by 33% from 2007 levels.
Total tonnes of community CO2e emissions
from Vancouver
2,850,000 tCO2e
(2007) 12,410,000 tCO2e -15% Yes 1,910,000 tCO2e
GREEN BUILDINGS
Target 1: Require all buildings constructed from
2020 onward to be carbon neutral in operations.
Kilograms of CO2e per square metre of newly
built floor area
20.7 kgCO2e/m2
(2007)
14.4 kgCO2e/m2
(2014)
-30% Yes carbon neutral
Target 2: Reduce energy use and GHG emissions
in existing buildings by 20% from 2007 levels.
Total tonnes of CO2e from all community
buildings
1,625,000 tCO2e
(2007)2
1,295,000 tCO2e -20% Yes 1,300,000
tCO2e
GREEN TRANSPORTATION
Target 1: Make the majority of trips (over 50%)
by foot, bicycle and public transit.
Per cent mode share by walk, bike and transit 40%3 50% of trips +10%3 Yes 50% of trips
Target 2: Reduce average distance driven per
resident by 20% from 2007 levels.
Total vehicle km driven per person 5,950 km (2007) 4,319 km -27% Yes 4,760 km
ZERO WASTE
Target 1: Reduce total solid waste going to the
landfill or incinerator by 50% from 2008 levels.
Annual solid waste disposed to landfill and
incinerator from Vancouver
480,000 tonnes
(2008)
370,000 tonnes
(2014)4
-23% Yes 240,000 tonnes
ACCESS TO NATURE
Target 1: Ensure that every person lives within
a five-minute walk of a park, greenway or other
green space.
Per cent of city’s land base within a five-min
walk to a green space
92.6% (2010) 92.7% +0.1% Yes 95%5
Target 2: Plant 150,000 additional trees. Total number of additional trees planted - - (2010) 48,900 trees +48,900 Yes 150,000 trees
<NEW> Target 3: Restore or enhance 25 hectares
of natural areas between 2010 and 2020.
Total hectares of natural areas restored or
enhanced
- - (2010) 14 hectares +14 Yes 25 hectares
<NEW> Target 4: Increase canopy cover to 22%
by 2050.
Per cent of city’s land area covered by tree-leaf
canopies
18% (2013) Survey to be
conducted in 2017
- - - - 22% (2050)
CLEAN WATER
Target 1: Meet or beat the most stringent of
British Columbian, Canadian and appropriate
international drinking water quality standards
and guidelines.
Total number of instances of not meeting
drinking water quality standards
0 instances
(2006)
0 instances 0 Yes 0 instances
Target 2: Reduce per-capita water consumption
by 33% from 2006 levels.
Total water consumption per capita 583 L/person/
day (2006)
493 L/person/
day
-15% Yes 390 L/person/
day
LOCAL FOOD
Target: Increase city-wide and neighbourhood
food assets by a minimum of 50% over 2010
levels.
Total number of neighbourhood food assets6
in Vancouver
3,344 food assets
(2010)
4,612 food assets +38% Yes 5,158 food
assets
CLEAN AIR
Target: Meet or beat the most stringent air
quality guidelines from Metro Vancouver, BC,
Canada, and the World Health Organization.
Total number of instances of not meeting of air
quality standards for ozone, particulate matter
(PM 2.5), nitrogen dioxide and sulphur dioxide
from both the Kitsilano and Downtown stations
combined7
27 instances
(2008)
3 instances -89% Yes 0 instances
GREEN ECONOMY
Target 1: Double the number of green jobs over
2010 levels.
Total number of green jobs 16,700 jobs
(2010)
19,900 jobs
(2013)8
19% Yes 33,400 jobs
Target 2: Double the number of companies that
are actively engaged in greening their operations
over 2011 levels.
Per cent of businesses engaged in greening
their operations
5% of businesses
engaged (2011)
Survey to be
conducted in
20168
- - - - 10% of
businesess
engaged
LIGHTER FOOTPRINT
Target: Reduce Vancouver’s ecological footprint
by 33% over 2006 levels.
Proxy: Number of people empowered9 by a
City-led or City-supported project to take
personal action in support of a Greenest City
goal and/or to reduce levels of consumption
(cumulative)
600 people
(2011)
13,400 people +12,800 Yes To be
determined
DASH- BOARD
1 Emissions for baseline and subsequent years have been revised due to updated methods for calculating emissions from buildings (see Green Buildings section) and the Vancouver Landfill (see Climate Leadership section on landfill gas capture).
2 Emissions for baseline and subsequent years have been revised due to a correction in FortisBC’s data set around which buildings fall within city limits. Totals now also include industrial buildings. This metric previously included only residential and commercial buildings.
3 Mode share totals for baseline year (40% of trips in 2008) was based on data gathered through a TransLink “Trip Diary” survey that is conducted about once every five years. To obtain more regular statistics, the City began an annual survey of Vancouver residents that is slightly different in methodology but is believed to better capture the full range of travel by residents. This will be used to measure Green Transportation indicators going forward.
4 Solid waste data is compiled first at a regional level and then at the city level. As a result, Vancouver’s data is always one year behind the reporting period.
5 5% of the city’s land-base is industrial land area, and is not considered part of the target.
6 Food assets include: number of community garden plots, farmers markets, community orchards, community composting facilities, community kitchens, community produce stands, and urban farms.
7 Air quality metrics are measured by Metro Vancouver from data from two monitoring stations in Vancouver: one in Kitsilano and one at Robson Square. Four indicators of air quality are used for comparison to world standards. They are: 24-hour average particulate matter (PM2.5) concentration >25 μg/m3 , one-hour average nitrogen dioxide (NO
2) concentration >200 μg/m3, 24-hour average sulphur dioxide
(SO2) concentration >20 μg/m3,and eight hour ground-level ozone (O
3)
concentration >52 ppb.
8 New green jobs and greening business surveys will be conducted in 2016.
9 “People empowered to take action” are defined as those who are enabled by City-supported programs to change their lifestyle or are implementing a community project that helps Vancouver achieve its Greenest City goals as a result of support provided by a City-led or City-supported program. Examples include learning to preserve food or ride a bike in a community centre class, as well as people involved in projects supported by the Vancouver Foundation and City of Vancouver Greenest City Fund. The definition excludes people participating in a dialogue or consultation, attending an event, using infrastructure (e.g., bike lanes, food scraps collection), or receiving a personal incentive (e.g., home energy retrofits).

5
AWARDS
This update is organized according to the 10 goals of the Greenest City 2020 Action Plan, which can be found at: vancouver.ca/GreenestCityActionPlan
2015 World Wildlife Fund Earth Hour City Challenge: Canadian Earth
Hour Capital
2015 Economist Intelligence Unit Global Livability Index: Third overall
globally; first in North America
2015 Asia-Pacific Economic Cooperation, Building Better Cities Survey: Top Three Cities
2015 C40 Cities Awards: Carbon
Measurement & Planning (for the
Greenest City 2020 Action Plan)
CDP: One of 10 Top Cities for Climate
Reporting and Disclosure in 2015
2015 Royal Architectural Institute of Canada, Metro Vancouver Chapter: Advocates of Architecture Award
(CityStudio)
2016 Mercer Quality of Living Survey: Fifth overall globally; first in
North America
2016 Federation of Canadian Municipalities Sustainable Communities Award: Transportation (Active
Transportation Infrastructure)
2016 Mediacorp Canada Inc.: Canada’s
Greenest Employers
2016 Tripadvisor’s Travelers’ Choice Awards: Top Destination in Canada
(specifically for our forests and
“grand parks”)

6
OVERVIEW
“The future of Vancouver’s economy and
liveability will depend on our ability to
confront and adapt to climate change.”
From Greenest City 2020 Action Plan Part Two: 2015-2020
In 2011, Vancouver set a goal to become
the greenest city in the world by 2020.
The Greenest City 2020 Action Plan
(GCAP) aims to meet that goal by
building a vibrant community, a
thriving green economy, and a greener,
healthier way of living, while preparing
Vancouver for the potential impacts of
climate change.
Last year, at the halfway mark and with
80% of its original high-priority actions
completed, GCAP went through a
refresh. Staff identified more than 50
new actions in collaboration with over
300 internal and external advisors. The
public provided its input, during the
Bright Green Summer Campaign in 2015
(see the Climate and Renewables section
for the whole story).
The result is a bigger and better GCAP,
and a new road map to becoming the
greenest city in the world by 2020. In
the meantime, this update recaps some
of the work done in the past year by
City staff and residents to get us closer
to our goals.

7
CLIMATE CHANGE ADAPTATION
Scientists project that Vancouver
will experience increased annual
precipitation and temperatures, with
hotter, drier summers, due to climate
change. More intense and frequent
rain and wind storms are expected,
and sea level rise will pose a significant
challenge by mid-century.
Climate adaptation is the City’s
response to these and other impacts of
climate change, while taking advantage
of opportunities and reducing
associated risks. The first step was to
see what we might encounter in the
future, so we know what to prepare for.
In 2013, Vancouver began a Coastal
Flood Risk Assessment, the first of its
kind in Canada to be done at a city
level. This work wrapped up in 2015
by identifying and prioritizing ways
for us as a community to adapt to and
recover quickly from flooding events:
a major risk given our seaside location.
Meanwhile, in 2014 the Urban Forest
Strategy Framework established a goal
to regrow our urban tree canopy (see
the Access to Nature section), and the
Integrated Rainwater Management
Plan, passed in early 2016 will help build
community resilience to heavy rainfall
(see the Clean Water section).
For more information on Vancouver’s
adaptation plan, go to
vancouver.ca/climateadaptation

8
CLIMATE AND RENEWABLES 1/
INDICATOR BASELINE 2015 CHANGE
Total tonnes of community CO2e emissions
from Vancouver
2,850,000 tCO2e (2007)* 2,410,000 tCO
2e -15%
* Emissions for baseline and subsequent years have been revised due to updated methods for calculating emissions from buildings
(see Green Buildings section) and the Vancouver Landfill (see Climate and Renewables section on landfill gas capture).
DECREASE IN COMMUNITY GREENHOUSE GASES SINCE 2007
15%TARGET:
• Reduce community-based
greenhouse gas emissions by 33%
from 2007 levels.
GOAL: ELIMINATE DEPENDENCE ON FOSSIL FUELS
9
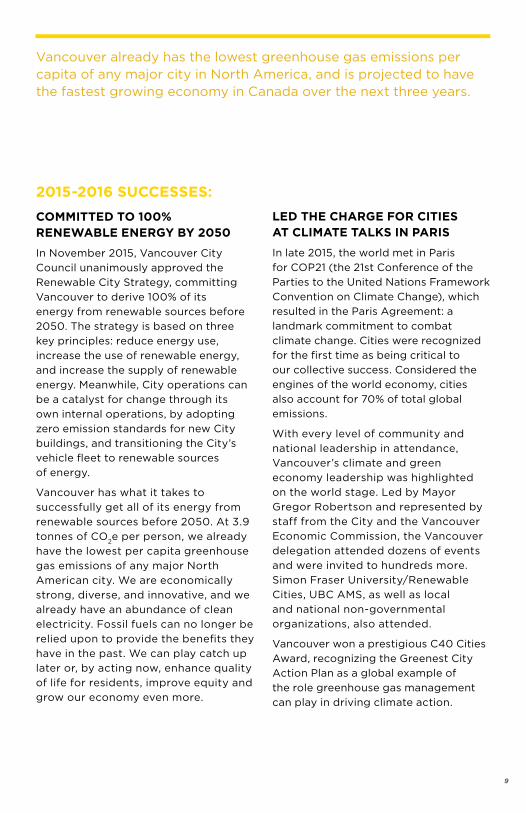
2015-2016 SUCCESSES:
COMMITTED TO 100% RENEWABLE ENERGY BY 2050
In November 2015, Vancouver City
Council unanimously approved the
Renewable City Strategy, committing
Vancouver to derive 100% of its
energy from renewable sources before
2050. The strategy is based on three
key principles: reduce energy use,
increase the use of renewable energy,
and increase the supply of renewable
energy. Meanwhile, City operations can
be a catalyst for change through its
own internal operations, by adopting
zero emission standards for new City
buildings, and transitioning the City’s
vehicle fleet to renewable sources
of energy.
Vancouver has what it takes to
successfully get all of its energy from
renewable sources before 2050. At 3.9
tonnes of CO2e per person, we already
have the lowest per capita greenhouse
gas emissions of any major North
American city. We are economically
strong, diverse, and innovative, and we
already have an abundance of clean
electricity. Fossil fuels can no longer be
relied upon to provide the benefits they
have in the past. We can play catch up
later or, by acting now, enhance quality
of life for residents, improve equity and
grow our economy even more.
LED THE CHARGE FOR CITIES AT CLIMATE TALKS IN PARIS
In late 2015, the world met in Paris
for COP21 (the 21st Conference of the
Parties to the United Nations Framework
Convention on Climate Change), which
resulted in the Paris Agreement: a
landmark commitment to combat
climate change. Cities were recognized
for the first time as being critical to
our collective success. Considered the
engines of the world economy, cities
also account for 70% of total global
emissions.
With every level of community and
national leadership in attendance,
Vancouver’s climate and green
economy leadership was highlighted
on the world stage. Led by Mayor
Gregor Robertson and represented by
staff from the City and the Vancouver
Economic Commission, the Vancouver
delegation attended dozens of events
and were invited to hundreds more.
Simon Fraser University/Renewable
Cities, UBC AMS, as well as local
and national non-governmental
organizations, also attended.
Vancouver won a prestigious C40 Cities
Award, recognizing the Greenest City
Action Plan as a global example of
the role greenhouse gas management
can play in driving climate action.
Vancouver already has the lowest greenhouse gas emissions per capita of any major city in North America, and is projected to have the fastest growing economy in Canada over the next three years.

10
This award places Vancouver in the
company of past winners London and
Copenhagen. Vancouver was also
widely recognized for the Renewable
City Strategy, an example of a city
accelerating and intensifying the
actions and investments needed for a
sustainable low-carbon future.
CONTINUED TO REFINE LANDFILL GAS CAPTURE
Methane, emitted when landfill waste
decomposes, contributes to climate
change. Twenty-five times more
damaging than CO2, methane must
be properly managed. Every year the
City makes upgrades at the Vancouver
Landfill to capture more of this gas for
heating and power generation. New
opportunities for beneficial use of landfill
gas are also under review. In 2015,
71% of the gas emitted by the Landfill
was captured. This is based on recent
capture-system upgrades and a more
precise methodology for determining
how much methane the Landfill
emits. The new methodology is more
appropriate for the Vancouver Landfill
compared to the previous methodology,
which used the same criteria across the
province and did not account for specific
conditions at individual landfills.
CHALLENGES Previously there had been little to no
action on climate change at the federal
level in Canada, leaving provinces and
cities to take on the task alone. As
Vancouver continues to advocate with all
levels of government for strong climate
action, the new federal government
has signalled that climate mitigation
and adaptation are priorities and are
exploring progressive, science-based
policies. The 2016 Federal Budget
provides significant funding for public
transit and accelerated design and
implementation for projects such as the
Broadway Corridor SkyTrain extension,
plus an additional $518M for climate
change mitigation and adaptation
infrastructure projects.
LIMES LEMONS

AR
NA
UD
BO
UIS
SO
U
11

12
GREEN BUILDINGS2/
INDICATOR BASELINE 2015 CHANGE
Kilograms of CO2e per square metre of newly
built floor area
20.7 tCO2e/m2 (2007) 14.4 tCO
2e/m2 (2014) -30%
Total tonnes of CO2e from all buildings 1,625,000 tCO
2e (2007)* 1,295,000 tCO
2e -20%
* Emissions for baseline and subsequent years have been revised due to a correction in FortisBC’s data set around which buildings
fall within city limits. Totals now also include industrial buildings. This metric previously included only residential and commercial
buildings.
DECREASE INGREENHOUSE
GASES FROM
BUILDINGSSINCE 2007
20%
TARGETS:
• Require all buildings constructed
from 2020 onward to be carbon
neutral in operations.
• Reduce energy use and greenhouse
gas emissions in existing buildings
by 20% from 2007 levels.
GOAL: LEAD THE WORLD IN GREEN BUILDING DESIGN AND CONSTRUCTION

13
2015-2016 SUCCESSES:
APPROVED THE BUILDING RETROFIT INNOVATION FUND
Passed by Council in February 2016,
the Building Energy Retrofit Fund will
support and expand programs that
result in energy efficiency upgrades for
buildings throughout the city. The Fund
will support existing programs and new
approaches to engage, support, and
provide incentives for building owners to
invest in energy efficiency improvements
in existing buildings.
The fund supports the Building Energy
Retrofit Strategy (adopted by Council
in June 2014), which targets the
buildings that have the most potential
to reduce energy use and emissions.
Implementation of the initial programs
that the fund aims to support will result
in an estimated 3,000 tCO2e reduction
annually. The $1 million fund is also
anticipated to leverage an estimated
$8 million in partner funding from
provincial programs, utility incentives,
and private investments in energy
efficiency in Vancouver.
ENABLED PASSIVE HOUSE DEVELOPMENTS
Cutting heating in a home can involve
installing smart thermostats or more
efficient boilers. But what if there was
an opportunity to do away with heating
altogether? Passive design is based on
the simple principle that a thoughtfully
designed, better-insulated building can
reduce or even eliminate the necessity
and costs associated with heating and
cooling, while staying comfortable for
occupants year-round.
Passive House is a well-established
ultra-low energy building performance
standard. There are over 40,000 Passive
House buildings in every climate around
the world. In 2015, the City enabled the
Certified Passive House standard in new
homes in Vancouver by relaxing certain
restrictions for homes that committed to
the standard.
Casa Luca, the first Certified Passive
House in Vancouver, was completed in
early 2016 and demonstrated that by
building with commonly used details,
materials, and components, construction
costs were nearly the same as standard
techniques. Meanwhile, Passive House
certified buildings can also have up
to 90% lower emissions than typical
buildings, translating to cost savings as
well. In its first few months of occupancy
by a family of four in the middle of winter,
Casa Luca’s heating bills were below $20
a month.
SUPPORTED MULTI-ETHNIC ENGAGEMENT AROUND ENERGY CONSERVATION
Vancouver has a diverse population, with
new and long-term residents originating
from all corners of the world. Engaging all
Vancouverites inclusively around energy
conservation requires an understanding
of some of the potential barriers, which
range from language and cultural
differences to everyday living habits
in a new climate.
Buildings constructed to 2015 requirements emit 30% fewer greenhouse gases per square metre than those built to the 2007 requirements.

14
In 2015, the City began supporting
Empower Me, an award-winning
energy-conservation program for new
immigrants and ethnic communities in
BC. Delivered by trusted community
peers, in their own languages, and in the
comfort of their homes, it encourages
peer-learning and actions that save
energy, reduce energy costs, and
increase the overall comfort and safety of
participants’ homes. Since its inception
in 2012, Empower Me has reached more
than 1,300 homes, saved an average of
$200 in annual utility bills per home, and
removed over 7,500 tonnes of CO2e from
the atmosphere.
INTRODUCED METRIC FOR LOW CARBON NEW BUILDINGS
Setting the policies to achieve low-
carbon new buildings means measuring
where we are now and in the past. Data
shows that between 2007 and 2014, the
greenhouse gas emissions per square
metre of newly built floor area decreased
by 30% from 2007 levels, over the period
the City’s green building policies began
to take effect.
CHALLENGESWhile introducing world-leading green
building policies is needed to keep
us on track towards our GCAP goals,
the City recognizes industry has to
be able to keep up with the pace of
change. Continued engagement with
the development and construction
industries will help create awareness,
capacity, and supply chains so these
policies can flourish.
Vancouver is one of the few cities in BC
to have its own building bylaw; other
municipalities follow the Provincial
code, which is different. Having our own
building code allows us to accelerate
the shift to greater energy efficiency
and greener buildings. Working
with the provincial government to
consolidate and standardize building
code regionally and provincially would
help reduce confusion, align industry
priorities, and create a bigger market
for green building technologies and
techniques.

15
BA
RN
OW
L P
HO
TO
S A
ND
DL
P A
RC
HIT
EC
TU
RE

16
GREEN TRANSPORTATION3/
* Mode share totals for baseline year (40% of trips in 2008) was based on data gathered through a TransLink “Trip Diary” survey that
is conducted about once every five years. To obtain more regular statistics, the City began an annual survey of Vancouver residents
that is slightly different in methodology but is believed to better capture the full range of travel by residents. This will be used to
measure Green Transportation indicators going forward.
INDICATOR BASELINE 2015 CHANGE
Per cent mode share by foot, bike and transit 40%* 50% of trips +10%
Total vehicle km driven per person 5,950 km/person/year 4,319 km/person/year -27%
27%
TARGETS:
• Make the majority (over 50%) of trips
by foot, bicycle and public transit.
• Reduce average distance driven per
resident by 20% from 2007 levels.
GOAL: MAKE WALKING, CYCLING AND PUBLIC TRANSIT PREFERRED TRANSPORTATION OPTIONS
DECREASE -IN-
VEHICLE KM DRIVEN
PER PERSON SINCE 2007

17
10% of work commutes are made by bicycle which is as high or higher than any other North American city with a population over 500,000.
2015-2016 SUCCESSES:
INTRODUCED A BIKE-SHARE PROGRAM
Public bike share is coming to
Vancouver. Announced in February 2016,
Mobi will hit the streets in summer 2016.
The launch will include 1,000 bicycles
and 100 stations, with an additional
500 bikes and 50 stations by end of the
summer. The initial service area includes
the Downtown Peninsula, extending
to Arbutus Street, 16th Avenue, and
Main Street. Vancouver’s Mobi bikes
are “Smart Bikes” and can be activated
and unlocked from a docking station
through an interface on the bike or
through a payment kiosk, making them
an easy and convenient option for short
trips. Specially designed helmets will be
available on bikes at no additional cost.
CONTINUED BUILDING A SAFER AND MORE BIKE-FRIENDLY CITY
Projects of all sizes, from smaller “spot
improvements” to large infrastructure
projects, help make Vancouver’s streets
safer for everyone. For instance, a small
design change in 2015 at the intersection
of Dunsmuir and Hornby Streets led to
an 80-90% drop in illegal left turns by
cars and greatly improved safety for
everyone. And once completed, the
latest round of upgrades to the Burrard
Bridge, which began in February 2016,
will improve safety for all users at the
Burrard-Pacific intersection at the north
end. This is currently the second highest
collision location in the city.
The City continued to invest in safe-
cycling infrastructure with an increased
focus on building protected bike lanes
that feel comfortable for people of all
ages and abilities, leading to record
levels of cycling across the city. The
number of daily trips by bike increased
by a third in 2015. In the city, 7% of all
trips are now made by bike. In some
neighbourhoods, that figure is as
high as 17%. More than a quarter of
Vancouverites report riding at least
twice a week in fair weather, and over
half of residents indicate they would like
to cycle more often.
SECURED THE FUTURE OF THE ARBUTUS GREENWAY
For several years, the City and CP
Rail were in discussions regarding
the 42 acres of land known as the
Arbutus Corridor. In March 2016, the
City announced the purchase of the
Corridor from CP. The creation of a
future Arbutus Greenway will feature
separated spaces for walking, cycling
and public realm features connecting
neighbourhoods from False Creek
all the way to Marpole. The Arbutus
Greenway represents a once-in-a-
generation opportunity to repurpose a
transportation corridor, similar to New
York’s High Line and other international
examples. The City is inviting residents
to get involved and provide input as the
design and planning process gets under
way: sign up to receive more information

18
CHALLENGESThe “NO” result of 2015’s Transportation
and Transit Plebiscite had a significant
impact on the future of transportation
throughout the region. The Broadway
Corridor is the busiest bus corridor
in North America and remains a top
transportation priority for Vancouver.
An agreement in June 2016 between
the federal and provincial governments
and TransLink committed funding for
the first three-year phase of Metro
Vancouver’s 10-year transit plan.
This includes accelerated design and
implementation for projects such as the
Broadway Corridor SkyTrain extension.
However, the question of funding for the
second, seven-year phase remains. The
City and TransLink are now working with
senior government agencies to secure
full project funding and to ensure we are
ready to build once funding is confirmed.
Driverless vehicles are a rapidly
emerging technology that some predict
could be on the roads in the next five
to 10 years, with as much as 75% of
cars sold being driverless by 2040.
This could have major implications
on cities, impacting car ownership
levels, how people choose to get
around, transportation safety, and
land use and community design. For
Vancouver, this will also have direct
implications for the plans laid out in the
Transportation 2040, Greenest City,
and Renewable City strategies. Staff is
looking into potential impacts on the
City’s sustainability, transportation, land
use, and economic plans, and how to
maximize the benefits to come, while
mitigating any negative aspects.
Cycling trips across the Burrard Bridge increased over 30% in the first year after the South intersection and Seaside Greenway upgrades were completed in 2014. Data shows that travel times for other road users were unaffected.

19
The Arbutus Greenway represents a once-in-a-generation opportunity to repurpose a transportation corridor.

20
ZERO WASTE4/
INDICATOR BASELINE 2014* CHANGE
Annual solid waste disposed to landfill and
incinerator from Vancouver
480,000 tonnes (2008) 370,000 tonnes -23%
* Solid waste data is compiled first at a regional level and then at the city level. As a result, Vancouver’s data is always one year behind
the reporting period.
DECREASE IN SOLID WASTE SENT TO LANDFILL AND INCINERATOR SINCE 2008
23%
TARGET:
• Reduce solid waste going to
landfill and incinerator by 50%
from 2008 levels.
GOAL: CREATE ZERO WASTE

21
2015-2016 SUCCESSES:
DIVERTED CONSTRUCTION WASTE FROM LANDFILL
Demolition of pre-1940 homes in
Vancouver must comply with the
new Green Demolition Bylaw, which
stipulates that 75% of the demolition
material must be reused or recycled
(90% in the case of character homes).
In December 2015, Council approved
expanding the bylaw to include pre-
1950 homes as of January 1, 2017, and
all homes as of January 1, 2018. Council
also approved amendments to the
bylaw to provide greater incentives
for contractors to salvage and reuse
demolition material.
So far, more than 96% of single-family
home demolitions have complied
with the Green Demolition bylaw, with
an average diversion rate of 86%,
compared to a typical demolition which
only diverts around 50%. The bylaw
has resulted in nearly 10,000 tonnes of
material being diverted from landfill in
2015 alone. Last year, roughly 3,000
tonnes of greenhouse gases were
avoided by diverting wood waste from
landfill. This plan is currently focused on
smaller wood structures, because large
concrete and steel buildings already
have good recycling rates.
CONTINUED DIVERSION OF ORGANIC WASTE FROM LANDFILL
It has been three years since the City
began collecting food scraps from
residences as part of the Green Bin
program. Since then, the amount of
food and yard waste collected annually
from single-family homes has increased
by nearly 75% and garbage collected
has decreased by 45%. Nearly 100%
of all apartment and condo buildings
with City waste collection now have
access to the Green Bin program or
alternative measures. Staff will continue
to engage residents throughout the
year to promote the Green Bin program
and increase awareness of the organics
disposal ban.
Green businesses are diverting organics
as well. Seven out of 10 businesses that
generate food waste in the city have set
up an organics-recycling program. The
City has been contacting and educating
the remaining businesses about the
disposal ban on food scraps, how
businesses can comply with the ban and
how they can reduce food waste.
Nearly 23,000 volunteers participated in the Keep Vancouver Spectacular litter cleanup movement in 2015.

22
20TH ANNIVERSARY OF KEEP VANCOUVER SPECTACULAR
The Keep Vancouver Spectacular (KVS)
program was established by the City
of Vancouver and Tourism Vancouver
to empower residents who want to
help keep Vancouver clean, green and
spectacular. Over the years, more than
225,000 volunteers—including school
groups, sports teams, businesses,
neighbourhood associations and
community policing centres—have taken
to the streets to keep the city beautiful
for those who visit and live here. In 2015,
over 12,000 bags of litter were collected
by volunteers; one volunteer alone
collected 560 bags!
DIVERTED ELECTRONICS FROM THE LANDFILL WITH FREE DROP-OFF EVENTS
The City teamed up with volunteers
from their Keep Vancouver Spectacular
program, ElectroRecycle and Encorp
to set up electronic recycling drop-off
events throughout the year. These drop-
off events provided a convenient and free
option for Vancouverites to recycle their
electronics, small appliances, power tools
and household batteries. In 2015, over
11,000 electronics and small appliances
were diverted from disposal and recycled
through our drop-off events.
CHALLENGESChanging habits and encouraging
residents and businesses to divert their
compostable organic waste from the
garbage to their Green Bin continues to
be a challenge. About 60% of privately
serviced buildings are in compliance
with the organics ban and have set up
organics-recycling programs. A recent
bylaw revision in 2016 allows the City to
ticket violators, and staff will continue to
assist, educate, and engage the remaining
businesses on how they can comply with
the ban and reduce food waste.
Now that we are at the half-way
point to 2020, the City needs a long-
term plan for achieving “zero waste”
success. A Zero Waste plan is currently
under development, and will outline
how Vancouver as a community can
achieve zero waste over the long term.
The plan will address waste across the
major supply chains—food, products,
and building materials—as well as take
a life-cycle approach: looking at how
the community can generate less waste
in the first place, as well as diverting it
from landfill and incinerator.

23

NIC
K P
AG
E
24
ACCESS TO NATURE5/
INDICATOR BASELINE 2015 CHANGE
Per cent of city’s land base within a 5 minute
walk to a green space
92.6% (2010) 92.7% +0.1%
Total number of additional trees planted -- (2010) 48,900 trees +48,900
<NEW> Total hectares of natural areas
restored or enhanced
-- (2010) 14 hectares +14
<NEW> Per cent of city’s land area covered
by tree leaf canopies
18% (2013) Survey to be conducted
in 2017
--
48,900 NEW TREES PLANTED SINCE 2010
TARGETS:
• All Vancouver residents live within a
five-minute walk of a park, greenway, or
other green space.
• Plant 150,000 new trees.
• <NEW> Restore or enhance 25 hectares of
natural areas between 2010 and 2020.
• <NEW> Increase canopy cover to 22%
by 2050.
GOAL: VANCOUVER RESIDENTS ENJOY INCOMPARABLE ACCESS TO GREEN SPACES, INCLUDING THE WORLD’S MOST SPECTACULAR URBAN FOREST

25
2015-2016 SUCCESSES:
APPROVED BIODIVERSITY STRATEGY TO SUPPORT NATURE ACROSS THE CITY
The Park Board and City Council
adopted a city-wide Biodiversity
Strategy earlier this year. Together
with the Urban Forest Strategy, the
Rewilding Action Plan, and the Bird
Strategy, the Biodiversity Strategy
provides a foundation for protecting
and restoring natural areas, species, and
ecological processes, and for improving
access to nature in all of Vancouver’s
neighbourhoods. It describes strategies
to restore priority habitats such as
forests, wetlands and shorelines as part
of a city-wide ecological network, to
change the Park Board’s operations
to better support biodiversity, and to
celebrate biodiversity as an important
part of city life.
Biodiversity in urban landscapes
depends on maintaining an “ecological
network” of natural areas anchored
by larger patches, such as Stanley
Park, that function as a connected
system. One of the 10 priority actions
in the Biodiversity Strategy is to use
park acquisition, tree planting, and
the development planning process to
expand and connect parks and build the
city’s ecological network.
INTRODUCED A NEW BIODIVERSITY GCAP TARGET
Embedded in the Biodiversity Strategy
is a new Greenest City target for Access
to Nature to restore or enhance 25
hectares (ha) of natural areas between
2010 and 2020. This is about the size
of VanDusen Botanical Garden, or half
the size of Langara Golf Course. The
new target will be met by creating and
restoring a variety of natural areas on
public and private land. It will include
habitat restoration in parks, such as salt
marsh creation in New Brighton Park
and daylighting Tatlow Creek. Smaller
projects, including native plant gardens
in neighbourhood parks, pollinator
meadows in community gardens, rain
gardens on street edges, and backyard
bird habitats will also contribute to
meeting the target.
RESTORED NATIVE TREES IN OUR URBAN FOREST
The target to plant 150,000 trees by
2020 encompasses planting on streets,
parks and private lands. One of the
initiatives by the Park Board is to restore
native forests in larger parks such as
Jericho, Musqueam and Everett Crowley
Parks. Many of these parks are forested
with red alder and black cottonwood
What’s the best place to see spawning salmon in east Vancouver? Still Creek at Natal Street and Cornett Avenue in the middle of November.

26
that established after land clearing;
invasive species such as Japanese
knotweed and Himalayan blackberry
are also common. The goal of forest
restoration is to increase the proportion
of native evergreen trees, as well as to
create a diverse understorey dominated
by tall shrubs and sub-canopy. Adding
logs helps recreate the structural
diversity found in native forests. About
4,100 native trees were planted in
parks in 2015. The long-term goal is to
increase the forest canopy, while at the
same time enhancing habitat for birds,
native mammals and other species.
BEGAN DEVELOPING NEW SALT MARSH AT NEW BRIGHTON PARK
The Park Board and the Vancouver
Fraser Port Authority have teamed up
to develop a two-hectare salt marsh on
the eastern side of New Brighton Park.
It is a unique initiative to restore the
rich intertidal zone—with marsh areas,
mud flats, and tidal channels—that used
to make up the south shore of Burrard
Inlet. Salt marshes are critical habitat
for fish, particularly migrating juvenile
salmon, which feed along the shoreline
of Burrard Inlet as they leave the Indian,
Seymour, and Capilano Rivers, and other
small streams. The marsh will connect to
Creekway Park, created in 2014, as part
of the long-term restoration of Hastings
Creek in Hastings Park.
CHALLENGESThe five-minute walk target currently
measures how much land is in proximity
to green space, not how many people or
the quality of the green space. As such,
it does not factor for population density,
constraints to access, or green space
located on private land. Staff is looking
at realigning this target to better reflect
these factors, as well as to focus on
true accessibility: not just distance, but
how people are reaching green spaces
and whether there are barriers, such as
major roads and intersections that may
hinder access.
ROSALIND LEBLANC

NIC
K P
AG
E
27

15% DECREASE
-IN- TOTAL WATER CONSUMPTION
SINCE 2006
TARGETS:
• Meet or beat the strongest of British
Columbian, Canadian and appropriate
international drinking water quality
standards and guidelines.
• Reduce per capita water consumption
by 33% from 2006 levels.
GOAL: VANCOUVER WILL HAVE THE BEST DRINKING WATER OF ANY CITY IN THE WORLD
28
CLEAN WATER6/
INDICATOR BASELINE 2015 CHANGE
Total number of instances of not meeting
drinking water quality standards
0 0 0
Total water consumption per capita 583 L/person/day (2006) 493 L/person/day -15%

29
2015-2016 SUCCESSES:
VANCOUVERITES CONSERVED WATER DURING DRY SUMMER
In 2015, a mild winter, low snowpack
in the surrounding mountains, and a
dry spring all combined for one of the
driest summers in recent memory. Due
to the dry conditions, water use was
actually on the rise in spring 2015—up
12% from the same period in 2014—
until Stage 3 water restrictions were
implemented. Vancouver residents and
businesses took action; even taking
shorter showers, letting lawns go “gold”
and letting cars get a little dirtier helped
reverse the trend and drop our city-
wide water use dramatically for the rest
of 2015.
APPROVED THE INTEGRATED RAINWATER MANAGEMENT PLAN
When rainwater lands on hard
surfaces such as streets, roofs and
other impermeable surfaces, it picks
up pollutants, which then run into
local water bodies. Green and natural
infrastructure—including permeable
pavement, green roofs, and rain
gardens—captures and filters out
pollutants before they reach these water
bodies, improving water quality for
people, animals and flora. In April 2016,
the City adopted a long-term target to
capture and treat 90% of Vancouver’s
average annual rainfall through green
infrastructure. Moving forward, the City
will develop a detailed plan to make this
happen. Green and natural infrastructure
will not only give the City cleaner local
waterways, but will also support the
Biodiversity Strategy and help build
resilience to heavier and more frequent
rainfall events caused by climate change
in the future.
VOLUNTEERS REDUCED LAUNDRY WATER USE AT GATHERING PLACE
The Gathering Place Community
Centre has been an integral part of the
Downtown South community since
1995. Free laundry and shower facilities
are among the services it offers to
Vancouver’s vulnerable populations.
Last year, the centre logged over
2,000 showers per month. Looking to
help others and ensure best practices,
Gathering Place volunteers worked
with laundry users to ensure washing
machines were running with only full
loads. Just this simple measure resulted
in significant savings in water and energy
used at the facility.
Reducing water use also reduces energy use, as less pumping and UV treatment is needed to deliver clean drinking water to residents and businesses.

30
CHALLENGESThough it could have been much higher
if not for the water restrictions, city-
wide water use still increased slightly
in 2015. Our dry summer last year
highlighted the need to conserve. To
help drive long-term actions, Council
approved the 2016-2020 Clean Water
Work Program in November 2015.
Priorities include working with industries
in the city to increase water efficiency,
as well as expanding and accelerating
universal water metering.
Unusually high coliform counts
have been measured in False Creek,
especially during summertime.
The Park Board led a public-information
campaign in 2015 to inform the
recreational boating community about
water quality protection while moored
in False Creek and will expand the
campaign in 2016. Moving forward, the
new Biodiversity Strategy has a priority
action to “improve the ecosystem
health of False Creek”. As well, the City
and the Park Board have established
a working group to review the issues,
identify contamination sources and look
at possible solutions alongside partners
from Vancouver Coastal Health, Metro
Vancouver, Transport Canada and Port
Metro Vancouver.
“The beauty of Vancouver water is that it’s soft and therefore great for brewing. It’s basically a blank slate for brewers to work with, so it gives us more creative flexibility”
Dominic Bernard, Brewing and Brewery Operations Diploma program, Kwantlen Polytechnic

31

32
LOCAL FOOD7/
* Food assets include: number of community garden plots, farmers markets, community orchards, community composting facilities,
community kitchens, community food markets, and urban farms.
INDICATOR BASELINE 2015 CHANGE
Total number of neighbourhood food assets*
in Vancouver
3,340 food assets (2010) 4,612 food assets +38%
INCREASE IN NEIGHBOURHOOD FOOD ASSETS SINCE 2010
38%
TARGET:
• Increase city-wide and neighbourhood
food assets by a minimum of 50% over
2010 levels.
GOAL: VANCOUVER WILL BECOME A GLOBAL LEADER IN URBAN FOOD SYSTEMS

33
2015-2016 SUCCESSES:
PASSED BYLAWS AND GUIDELINES TO SUPPORT URBAN FARMING
Growing food to sell is referred to as
urban farming. Urban farming supports
many of our green initiatives including
improved biodiversity, making use
of under-utilized spaces, reducing
food import impacts and enhancing
Vancouver’s green economy. Currently,
there are approximately 18 urban-farm
businesses and organizations operating
in Vancouver, including the Urban
Farming Society, a non-profit dedicated
to increasing the sustainability of urban
farming in Vancouver.
In March 2016, City Council adopted
a set of Urban Farm Guidelines and
changed bylaws to assist in the
development of safe, neighbourly,
and productive urban farms and
to create a more sustainable food
system for Vancouver. Increasing
opportunities for food production
for urban residents will have positive
social, economic and environmental
impacts by reducing “distance to
fork” and creating opportunities for
neighbourhood-focused farms. Cities
everywhere are increasingly looking
to develop innovative policies that
address food-related issues in urbanized
areas to create more equitable and
sustainable food systems. The Urban
Farming Guidelines are a key example
of Vancouver’s leadership in the area of
urban food policy.
SUPPORTED COMMUNITY KITCHENS
A community kitchen is a place for
people to gather and prepare meals
together. Groups often meet in
community facilities, such as churches,
neighbourhood houses and community
centres. Community kitchens are
community-driven programs that play
an important role as public facilities for
people to learn and share knowledge
about nutrition and cooking and to
meet new people and build community.
The City supports community kitchens
through grants and infrastructure
upgrades to City-owned buildings
that host these kitchens. In 2015, City
grants helped to purchase kitchen
equipment for the Kivan and Kimount
In 2015, the Sustainable Food Systems Grants distributed $170,000 to non-profits offering programs and services that increase access to food, promote inclusion and participation and build sustainable food systems.
Vancouver has 4,450 community garden plots, an increase from 2014 despite garden removals along the Arbutus Corridor.

34
Boys and Girls Clubs in East Vancouver,
which provide safe, inclusive places
for children and youth to receive
nutritious food and to develop skills and
knowledge about healthy eating.
SUPPORTED FOOD RESCUE PROGRAMS
Surplus food is wasted every day in
Vancouver. Highly nutritious, safe-to-
eat produce and other perishable food
ends up in the compost or landfill. Food
rescue programs see that as an untapped
resource and redirect good food to help
feed our most vulnerable residents.
Vancouver’s Sustainable Food
Systems Grants help fund community
programs and services that increase
access to food, promote inclusion and
participation, and build sustainable
food systems. In 2015, Frog Hollow
and Kiwassa Neighbourhood Houses,
and Hastings Community Centre
received funding to assist food rescue
programs in their neighbourhood, to
work together to partner with local
food companies to redistribute healthy
food. At Kiwassa Neighbourhood House
alone, over two tonnes of produce and
other food is rescued, sorted
and redistributed every week to
those in need.
CHALLENGESShifting urban form and land use
highlights the need for resilient,
adaptable urban agriculture. Since
2008, the drive to build urban
agriculture infrastructure focused
in part on greatly increasing the
number of community garden plots
through the city. Moving forward,
additional resources will be allocated
to improvements to help maintain the
aesthetics of existing gardens and
momentum for public uptake.

35

36
CLEAN AIR8/
INDICATOR BASELINE 2015 CHANGE
Total # of instances of not meeting air quality
standards for ozone, particulate matter (PM
2.5), nitrogen dioxide and sulfur dioxide from
both the Kitsilano and Downtown stations
combined*
27 (2008) 3 -89%
ELECTRIC VEHICLES
ALLOWED IN HOV LANES
TARGET:
• Meet or beat the most stringent
air quality guidelines from Metro
Vancouver, BC, Canada, and the World
Health Organization.
GOAL: BREATHE THE CLEANEST AIR OF ANY MAJOR CITY IN THE WORLD
* Air quality metrics are measured by Metro Vancouver from data from two monitoring stations in Vancouver: one in Kitsilano and one
at Robson Square. Four indicators of air quality are used for comparison to world standards. They are: 24 hour average particulate
matter (PM2.5) concentration >25 μg/m3, one hour average nitrogen dioxide (NO2) concentration >200 μg/m3, 24 hour average
sulfur dioxide (SO2) concentration >20μg/m3,and eight hour ground-level ozone (O
3) concentration >52 ppb.

37
2015-2016 SUCCESSES:
PROVINCE JOINED ZEV ALLIANCE
In December 2015 at COP21, BC
became the 14th jurisdiction to sign
on to the International Zero-Emission
Vehicle (ZEV) Alliance. Members of
the alliance have committed to make
all new passenger vehicles purchased
in their jurisdictions ZEVs by 2050.
Achieving this will accelerate the global
transition to ZEVs and could reduce
transportation-sector climate impacts
by more than one billion tonnes of
carbon dioxide emissions per year by
2050, lowering global vehicle emissions
by about 40%. ZEVs in use today include
battery-electric, plug-in hybrid, biofuel,
and hydrogen fuel cell vehicles.
The City supports this move, which is
aligned with the City’s Renewable City
Strategy goal of renewably powered
transportation. Since electricity in BC
is already more than 93% renewable,
increasing use of electrically powered
personal vehicles will be a key
component of this transition. And as
the provincial government regulates
fuel standards, the city and its residents
will benefit greatly from the strong
provincial policies that will be necessary
to achieve the goals of the International
ZEV Alliance.
PROVINCE RENEWED ZEV INCENTIVES
In April 2015, the Government of BC
renewed its incentive for clean-energy
vehicles, which includes electric
vehicles, plug-in hybrid electric vehicles
and hydrogen fuel cell vehicles. The
previous incentive program was so well
subscribed that the three-year funding
was exhausted in just 10 months. In
addition to the vehicle incentive, which
provides a rebate of up to $6,000,
prospective vehicle buyers can also
receive up to $3,000 in the provincial
Scrap-It program for trading in older
vehicles. The provincial government is
also providing up to $4,500, or 75% of
installation costs, for electric vehicle
charging stations in apartment and
condo buildings.
The official public launch of the Empire Fields DC fast-charge station—which allows users to get an 80% charge in 20 minutes—adds to Vancouver’s existing public network of over 250 Level 2 charging stations.
The number of electric vehicles registered to Vancouver residents nearly doubled in 2015.

38
CHALLENGES 2015 was the hottest year globally,
since records began in the 19th century,
beating out the previous record set
in 2014. The warmer temperatures,
coupled with lower snowpack in many
regions, led to a number of wildfires
along the south coast of BC. Although
they did not occur within Metro
Vancouver, the wildfires released large
amounts of particulate matter into the
local airshed, which can have serious
effects on people with asthma or other
respiratory problems, children, and
the elderly. The extent of smoke was
serious enough for Metro Vancouver
to issue air quality advisories. With
longer, drier summers expected as a
result of the changing climate, wildfires
are expected to occur earlier in the
year and more frequently. The City will
need to continue working with local
governments in the region to reduce
future risk and severity.
Past studies have shown that lower
prices at the gas pump cause demand
for SUVs and trucks to rise. This has an
impact on local air quality. However,
recent data shows electric vehicle (EV)
sales in Vancouver, BC and throughout
Canada continue to increase. Canadian
EV sales were up 33% in 2015 over
2014; in Vancouver, the number of EVs
registered to residents doubled. Here
in BC, the low cost of electricity is just
one advantage of electric vehicles.
Many EV owners also cite performance
and driving experience as well as
environmental benefits as their reasons
for choosing an EV.
Landlords and strata corporations
are regulated provincially; however,
currently, no laws exist to compel
them to allow EV charging in their
buildings. The ability to charge at
home is understandably important to
users, so the ability for tenants and
strata lot owners to install and use
charging stations is key to widespread
EV uptake. The City is advocating that
the provincial government update the
Strata Property Act to include “right to
charge” requirements, similar to those
already in place in California, Hawaii,
and other jurisdictions.

39

40
GREEN ECONOMY9/
ESTIMATED VALUE OF VANCOUVER’SBRAND
TARGETS:
• Double the number of green jobs
over 2010 levels.
• Double the number of companies that
are actively engaged in greening their
operations over 2011 levels.
INDICATOR BASELINE 2013 CHANGE
Total number of green jobs 16,700 jobs (2010) 19,900 jobs* +19%
Per cent of businesses engaged in greening
their operations
5% of businesses engaged
(2011)
Survey to be conducted in
2016*
* New green jobs and greening business surveys will be conducted in fall 2016.
GOAL: SECURE VANCOUVER’S INTERNATIONAL REPUTATION AS A MECCA OF GREEN ENTERPRISE
$31BILLION

41
2015-2016 SUCCESSES:
SHOWCASED VANCOUVER BUSINESSES IN PARIS AND AT HOME
Vancouver businesses shone on the
world stage in 2015 and 2016. The
Vancouver Economic Commission
(VEC) supported over 30 businesses
that took part in the activities at the
UN Climate Conference in Paris in 2015
( also known as “COP21”), to access
speaking opportunities, connect with
Canada’s ambassador to France in
Paris, and build stronger connections
to Europe. The VEC also promoted
Vancouver as an international hub for
green business, presenting to over 600
business leaders and investors at the
World Climate Summit. The Plastic Bank,
a local company, collected a “Sustainia
Award” for social innovation with their
#socialplastic recycling program.
In part as a result of the VEC’s effort in
Paris, Vancouver’s long-standing
GLOBE green-business conference
(in February 2016) brought the world
to Vancouver, attracting more than
12,000 attendees. Building on the
huge interest at COP21 to learn more
about Vancouver’s green economy
opportunities, the VEC hosted trade
delegations, investor events, and
company tours to connect the city’s
many green solutions providers with
global investors and clients. Ten
companies brought forward real-
life business challenges, which 100
experts then explored during a half-day
Renewable Energy Challenge workshop.
CREATED THE CLIMATE PLEDGE
Ahead of COP21, the VEC created
the Climate Pledge and rallied over
200 businesses—representing over
60,000 employees—to pledge
support for strong climate action and
a renewable energy future. Notable
companies such as TELUS, MEC, the
Vancouver Aquarium and Hootsuite
were among the signatories. Over 80%
of the companies pledged support for
Vancouver’s vision to shift to 100%
renewable energy by 2050, and more
than 50% pledged to set their own
science-based carbon reduction targets
or to move towards renewable energy
sources.
EXPANDED THE GREEN AND DIGITAL DEMONSTRATION PROGRAM
Last year, the City of Vancouver and
the VEC announced a collaborative
program for local entrepreneurs and
startups called the Green and Digital
Demonstration Program (GDDP). The
GDDP allows innovators to test their
products or technologies on city-owned
assets. It helps businesses to quickly
scale, commercialize, and access new
overseas markets, using VEC’s support
and the City as a reference. Eighty
companies have applied to the program
to date.
Early successes include TSO Logic’s
data-centre optimization testing, which
resulted in immediate recommendations
to the City for reducing its energy
Over 200 businesses, representing over 60,000 employees, pledged their support for strong climate action through the new Climate Pledge.

SATURNA GREEN SYSTEMS
42
consumption and carbon footprint.
Meanwhile, Saturna Green Systems,
a fully integrated electric scooter
sharing service, has received significant
media attention due to participation in
the program.
SUPPORTED THE CIRCULAR ECONOMY
In 2015, the VEC launched
UpcycleVancouver.com to highlight local
circular economy businesses and help
with “matchmaking” deconstruction
professionals, material recovery and
reuse outlets, and the upcycle design
community. The community already has
100 active members.
CHALLENGESThe amount of light-industrial space
available in Vancouver is limited, and
it can be a struggle for businesses,
especially startups and emerging
industries like clean tech, to find industrial
facilities that suit their spatial needs.
Businesses are co-locating to solve this
problem, which can often have additional
circular-economy benefits. Work is
currently underway by the VEC and the
City to develop a long-range economic
strategy and local area plan for the False
Creek Flats, an area with significant
opportunities for the circular economy,
smart logistics, space matching, and
solutions-based regulation.
“Seeing the creativity and diversity of entrepreneurs and industrial businesses in the False Creek Flats was inspiring. Vancouver Economic Commission’s approach to identifying and supporting sustainable new business models is something that other cities should keep a close eye on.”
David Gilford, New York City Economic Development Corporation

SATURNA GREEN SYSTEMS
43

44
LIGHTER FOOTPRINT10/
13,400 PEOPLE EMPOWERED TO TAKE ACTION ON GREENEST CITY
TARGET:
• Reduce Vancouver’s ecological
footprint by 33% over 2006 levels.
GOAL: ACHIEVE A ONE-PLANET ECOLOGICAL FOOTPRINT
* “People empowered to take action” are defined as those who are enabled by City-supported programs to change their lifestyle or
are implementing a community project that helps Vancouver achieve its Greenest City goals as a result of support provided by a
City-led or City-supported program. Examples include learning to preserve food or ride a bike in a community centre class, as well
as people involved in projects supported by the Vancouver Foundation and City of Vancouver Greenest City Fund. The definition
excludes people participating in a dialogue or consultation, attending an event, using infrastructure (e.g., bike lanes, food scraps
collection), or receiving a personal incentive (e.g., home energy retrofits).
INDICATOR BASELINE 2015 CHANGE
Proxy: Number of people empowered* by a
City-led or City-supported project to take
personal action in support of a Greenest City
goal and/or to reduce levels of consumption
(cumulative)
600 people empowered to
take action (2011)
13,400 people empowered to
take action
+12,800

45
2015-2016 SUCCESSES:
SUPPORTED STUDENT AND RESIDENT-LED GREEN INITIATIVES
CityStudio students once again brought
their innovation and creativity to the
streets of Vancouver in 2015. YIMBY
Vancouver (Yes In My BackYard) sought
to foster a more inclusive community
for homeless citizens. At four cafes
along Commercial Drive, patrons were
encouraged to purchase an extra item,
in the form of an anonymous voucher,
to post on a YIMBY board to be later
redeemed by a homeless citizen at the
cost of kindness. This channelling of
peoples’ kindness led to over 235 YIMBY
vouchers redeemed in one week, and
the voucher system has caught on in
other cities, inspiring the development
of a toolkit to empower future
YIMBYists.
Over four years of the Greenest City
Fund, the Vancouver Foundation in
partnership with the City of Vancouver
distributed $1.9 million to fund 573
projects. In 2015, over $550,000 was
granted to 136 worthy projects. One
standout was Sustainability at Work
in False Creek Flats: the delivery of in-
person interactive courses and resources
to False Creek Flats businesses and
building owners around green buildings,
sustainable purchasing, and zero waste.
Another project, Build-a-Bicyclist,
provided newcomers to Vancouver with
a bicycle and gear, as well as a safety
course, to enable them to integrate city
cycling into their daily lives.
ENGAGED THOUSANDS IN THE NEXT PHASE OF GREENEST CITY
The Greenest City 2020 Action Plan
received a “refresh” in 2015. Over 50
new actions were added to help us
move closer to realizing our targets,
and the public provided their input
during the “Bright Green Summer” in
2015. Through events and celebrations,
Pop-Up City Hall, and a Pecha Kucha
grand finale, over 46,000 people were
included in this process, of which over
13,000 were engaged (in-person, online,
and social media feedback). All of the
feedback was used to contribute to and
refine the Greenest City actions that will
get us to 2020.
In partnership with the Vancouver Foundation, the Greenest City Fund awarded grants to 573 community initiatives over the four years of the program, totalling approximately $1.9 million.

46
CHALLENGES
Measuring Vancouver’s ecological
footprint is very complex, and much of
the required data has been unavailable
since 2006, when the last national
long-form census occurred. This was
reinstated for 2016, and now the City
is partnering with experts to redevelop
and update this measure of our
community’s environmental impact.
The City has limited influence in
changing people’s daily habits. Through
engaging people via the personal
Climate Change Action Pledge launched
in late 2015, we can measure the pulse
of resident involvement in the Greenest
City Action Plan. Success, however,
ultimately relies on local action by
community groups and individuals.
After four successful years, the Greenest
City Fund is going to get a refresh, just
like the plan itself. The City of Vancouver
and the Vancouver Foundation are
grateful for the support and interest
in the Fund over the past four years.
The City of Vancouver is committed to
continuing to enable the community in
activating projects that help achieve the
Greenest City Goals. Staff are currently
exploring how the Fund will continue in
2017 and beyond.
“It’s not just about the coffee. It’s the small act behind it.”
Jason, homeless Vancouver resident and recipient of a YIMBY voucher

NIC
K P
AG
E
47

WALKING THE TALK
48
GREEN OPERATIONS
TARGETS:
• 50% reduction in GHGs from City operations from 2007 levels
• 70% waste diversion in public-facing City facilities, and 90% waste diversion
in all other City-owned facilities
• Reduce water use in City operations by 33% from 2006 levels
* Without the benefit of universal water metering of our civic facilities, metric tracking is a best estimate only. The available data and
extrapolation indicates a civic water reduction of 19% from the 2006 baseline. The accuracy of the metric will increase through
planned water meter installations at prioritized City buildings beginning in mid-2016.
INDICATOR BASELINE 2015 CHANGE
Total tonnes of CO2e emissions from
City operations
490,000 tCO2e 250,000 tCO
2e -49%
Total waste diversion rate in
City facilities and operations
--% (public-facing facilities)
70% (other City-owned
facilities)
67% (public-facing facilities)
84% (other City-owned
facilities)
--%
(public-facing
facilities)
14% (other
City-owned
facilities)
Total water use in City operations 2,550,000 m3 (2006) 2,055,000 m3 -19%*

49
2015-2016 SUCCESSES:
CUT WATER USE IN LIBRARY SQUARE
Heating inside the Central Library
downtown comes from steam. As
energy is extracted from the steam, it
turns to hot water (called condensate),
which must be cooled down with more
water before it can be sent to the
sewers. Like many other downtown
buildings with this system, this process
wasted large amounts of otherwise
perfectly good water. Improving this
was a priority.
Staff implemented a creative solution,
rerouting condensate through a heat
exchanger (like a radiator in a car)
to recover some of this excess heat.
The cooler condensate that comes
out means water use has drastically
decreased. The modification also saves
energy and reduces greenhouse gas
emissions and, best of all, it cost almost
nothing to implement—just a simple
re-routing of pipes and an extra pump.
CONTINUED REDUCING GREENHOUSE GAS EMISSIONS FROM CITY BUILDINGS
The City owns or operates nearly
600 buildings, encompassing over
11,000,000 square feet of floor
space. The City’s Facilities Energy
Management Strategy focusses on
upgrading mechanical and electrical
systems, optimizing building system
performance, and changing the energy-
saving behaviour of staff. The City also
supports green building standards for
new City buildings and renewable or
low-carbon energy opportunities.
Retrofit programs at 31 of the largest
City-owned buildings have decreased
GHG emissions by 10%, and saved over
$500,000 in annual energy costs. Most
recently, the Police Tactical Training
Centre reduced its natural gas use by
43% over a four year period, simply by
optimizing its ventilation and lighting
control systems.
IMPROVED RECYCLING THROUGH CIVIC ZERO-WASTE PROGRAM
The City continues to improve the
corporate waste-diversion program that
began four years ago. In 2015, the City
achieved an 84% waste diversion rate
in City buildings (such as City Hall and
the Crossroads building at 507 West
Broadway). City staff have set a target
of 90% by 2020.
The Green Operations Plan is a collection of the City’s strategies to lead the way on green initiatives. It’s about how we do the work we do in a more sustainable way. The vision is for the City to become a world leader in environmentally responsible operations. Over the next few years Green Operations will also focus on reducing waste generation, continuing to improve the capture of landfill gas, reducing the use of toxic materials, and reducing water consumption in City operations.

50
VANCOUVER POLICE: PART OF THE SUSTAINABILITY STORY
While keeping Vancouver safe, the
Vancouver Police Department (VPD)
is also part of the City’s sustainability
efforts. The “POPATCH” is a 700-square-
foot vegetable garden created on the
rooftop of VPD headquarters by VPD
staff volunteers in 2013. A large portion
of the food is donated to the Urban
Native Youth Association (UNYA) for
use in their culinary program, as well
as the nearby Lookout Shelter. In 2015,
through a partnership with Hives for
Humanity, two bee hives were added to
the rooftop. Beekeeping, also known as
apiculture, supports urban biodiversity
and strengthens positive relationships
between police and community partners.
Part of making Vancouver a more bike-
friendly city is addressing the issue of
bike theft. Only about 5% of the 2,000
bikes stolen every year in Vancouver
are ever reunited with their owners. In
2015, the VPD launched 529 Garage,
a city-wide bike registry program in
partnership with Project 529. Users
register photos and details of their
bike, and serial-numbered stickers act
as a deterrent and provide a unique
identifier for each bike registered. As
soon as a bike is taken, an owner can
send out an alert across the network of
529 Garage users to be on the lookout.
Since late 2015, this crowd-driven
solution has already returned five out of
seven serial-numbered stolen bikes to
their happy owners.
Greenhouse gas emissions from all City of Vancouver-owned buildings have dropped by 23% between 2007 and 2015. Emissions from fleet operations have decreased by 13% over the same period.

51
529 Garage reunites stolen bike with happy owner

22
GET INVOLVED!We love our city. Vancouver is continually
rated one of the most livable cities in the
world, and we want to make it even more
amazing. Last year, at the half-way point
of the implementation of the GCAP, we
upped the ante by introducing over 50
new priority actions. And now with only
four years left to 2020, and a long-term
plan to be powered by 100% renewable
energy before 2050, working together
with residents, businesses, and industry
will be the only way we can succeed in
the work that lies ahead.
Subscribe to the Greenest City Newsletter at: vancouver.ca/greenestcity Facebook: Vancouver’s Greenest City Initiative
Twitter: @GreenestCity
Thank you to all staff and members of the community for your hard work
and for allowing us to share the stories of your success.
ACKNOWLEDGEMENTS

© CITY OF VANCOUVER 2016 16-147
For More Information:
Visit: vancouver.ca
Phone: 3-1-1 TTY: 7-1-1
Outside Vancouver: 604-873-7000
3-1-1
PRODUCT CERTIFIED FORREDUCED ENVIRONMENTALIMPACT. VIEW SPECIFICATTRIBUTES EVALUATED: UL.COM/EL UL 2771
By Glenmoreglenmorecustomprint.com/sustainability/