dwuconsulting.com 2019AB OS.pdf · NEW ISSUE – BOOK-ENTRY ONLY RATINGS: See “RATINGS” In the...
352
NEW ISSUE – BOOK-ENTRY ONLY RATINGS: See “RATINGS” In the opinion of Bond Counsel to the County to be delivered upon the issuance of the Series 2019 Bonds, under existing law and assuming continuing compliance by the County with certain requirements of the Internal Revenue Code of 1986, as amended (the “Code”), that must be met subsequent to the issuance of the Series 2019 Bonds, with which the County has certified, represented and covenanted its compliance, (i) interest on the Series 2019A Bonds is excludable from gross income for federal income tax purposes, except for interest on any Series 2019A Bonds for any period during which such Series 2019A Bonds are held by a person who is a “substantial user” of the facilities financed or a “related person,” as those terms are used in Section 147(a) of the Code; (ii) interest on the Series 2019A Bonds is an item of tax preference for purposes of the federal alternative minimum tax imposed on individuals; and (iii) the Series 2019 Bonds and the income thereon will not be subject to taxation under the laws of the State of Florida, except as to estate taxes and taxes under Chapter 220, Florida Statutes, on interest, income or profits on debt obligations owned by corporations as defined in said Chapter 220. INTEREST ON THE SERIES 2019B BONDS IS NOT EXCLUDABLE FROM GROSS INCOME FOR FEDERAL INCOME TAX PURPOSES. See “TAX MATTERS” for a description of certain other tax consequences to the Series 2019 Bonds. $494,925,000 MIAMI-DADE COUNTY, FLORIDA $282,180,000 Aviation Revenue Bonds Series 2019A (AMT) $212,745,000 Aviation Revenue Refunding Bonds Series 2019B (Taxable) Dated: Date of delivery Due: October 1, as shown on inside cover page Miami-Dade County, Florida (the “County”), is issuing its $282,180,000 Aviation Revenue Bonds, Series 2019A (AMT) (the “Series 2019A Bonds”), and its $212,745,000 Aviation Revenue Refunding Bonds, Series 2019B (Taxable) (the “Series 2019B Bonds” and, together with the Series 2019A Bonds, the “Series 2019 Bonds”). The Series 2019 Bonds are being issued as fully registered bonds, initially registered in the name of Cede & Co. as nominee of The Depository Trust Company, New York, New York (“DTC”), which will act as securities depository for the Series 2019 Bonds. So long as the Series 2019 Bonds are in book-entry form, purchases of beneficial interests in the Series 2019 Bonds will be made in book-entry only form, without certificates, in denominations of $5,000 or integral multiples of $5,000. See “AUTHORIZATION FOR THE SERIES 2019 BONDS.” Interest on the Series 2019 Bonds will accrue from their initial date of delivery and will be payable on April 1 and October 1 of each year, commencing on October 1, 2019. Principal of and interest on the Series 2019 Bonds will be payable at the corporate trust offices of The Bank of New York Mellon (successor in interest to JPMorgan Chase Bank), as trustee (the “Trustee”), in New York, New York. So long as DTC or its nominee is the registered owner of the Series 2019 Bonds, payments of the principal of and interest on the Series 2019 Bonds will be paid directly to DTC or its nominee, and disbursements of such payments to beneficial owners will be the responsibility of DTC and its participants. See “THE SERIES 2019 BONDS – Book-Entry Only System.” Certain of the Series 2019 Bonds will be subject to optional and mandatory redemption prior to maturity at the prices, in the manner and at such times as set forth in this Official Statement. See “THE SERIES 2019 BONDS – Redemption.” The Series 2019 Bonds are being issued to provide funds, together with any other legally available funds of the Miami-Dade County Aviation Department, for the purposes of: (a) refunding all of the then outstanding Miami-Dade County, Florida Aviation Commercial Paper Notes, Series C (AMT), (b) refunding all or a portion of certain Outstanding aviation revenue bonds of the County as described in this Official Statement, (c) making a deposit to the Reserve Account (as defined herein), (d) financing or reimbursing the County for all or a portion of the cost of certain Improvements to the Port Authority Properties (as such terms are defined herein), (e) paying certain costs of issuance relating to the Series 2019 Bonds and (f) paying capitalized interest on a portion of the Series 2019 Bonds. See “INTRODUCTORY STATEMENT” and “PLAN OF FINANCE.” THE SERIES 2019 BONDS WILL BE SPECIAL, LIMITED OBLIGATIONS OF THE COUNTY PAYABLE SOLELY FROM A PLEDGE OF NET REVENUES (AS DESCRIBED IN THIS OFFICIAL STATEMENT) DERIVED FROM THE PORT AUTHORITY PROPERTIES, INCLUDING THE OPERATION OF THE MIAMI INTERNATIONAL AIRPORT, AS DESCRIBED IN THIS OFFICIAL STATEMENT, AND CERTAIN OTHER MONIES. THE SERIES 2019 BONDS WILL BE SECURED ON A PARITY BASIS WITH THE COUNTY’S OUTSTANDING BONDS UNDER THE TRUST AGREEMENT DESCRIBED IN THIS OFFICIAL STATEMENT. NEITHER THE FAITH AND CREDIT OF THE STATE OF FLORIDA OR THE COUNTY NOR THE FAITH AND CREDIT OF ANY AGENCY OR POLITICAL SUBDIVISION OF THE STATE OF FLORIDA OR THE COUNTY ARE PLEDGED TO THE PAYMENT OF THE PRINCIPAL OF OR INTEREST ON THE SERIES 2019 BONDS. THE ISSUANCE OF THE SERIES 2019 BONDS SHALL NOT DIRECTLY, INDIRECTLY OR CONTINGENTLY OBLIGATE THE STATE OF FLORIDA OR THE COUNTY OR ANY AGENCY OR POLITICAL SUBDIVISION OF THE STATE OF FLORIDA OR THE COUNTY TO LEVY ANY TAXES FOR THE PAYMENT OF THE SERIES 2019 BONDS OR TO MAKE ANY APPROPRIATION FOR THEIR PAYMENT EXCEPT FROM THE NET REVENUES AND CERTAIN OTHER MONIES PLEDGED TO THE PAYMENT OF THE SERIES 2019 BONDS UNDER THE TRUST AGREEMENT. See the inside cover page for maturities, principal amounts, interest rates, yields, prices and initial CUSIP numbers of the Series 2019 Bonds. This cover page contains information for quick reference only. It is not a summary of the Series 2019 Bonds. Investors must read the entire Official Statement, including the APPENDICES attached hereto, to obtain information essential to the making of an informed investment decision. Unless otherwise specified, cross-references are to specific captioned sections of this Official Statement. The Series 2019 Bonds are offered when, as and if issued by the County and accepted by the Underwriters, subject to opinions on certain legal matters relating to their issuance of Greenberg Traurig, P.A., Miami, Florida, and Edwards & Feanny, P.A., Miami, Florida, Bond Counsel. Certain legal matters will be passed upon for the County by the Office of the Miami-Dade County Attorney. Certain other legal matters relating to disclosure will be passed upon for the County by Hunton Andrews Kurth LLP, Miami, Florida, and DiFalco & Fernandez LLLP, Miami, Florida, Disclosure Counsel. Certain legal matters will be passed upon for the Underwriters by their counsel, Bryant Miller Olive P.A., Miami, Florida. The Financial Advisor to the Miami-Dade County Aviation Department is Hilltop Securities Inc., Miami, Florida. It is expected that the Series 2019 Bonds will be available for delivery through DTC in New York, New York on or about May 30, 2019. RAYMOND JAMES Cabrera Capital Markets, LLC Ramirez & Co., Inc. Rice Financial Products Company Siebert Cisneros Shank & Co., L.L.C. Barclays Blaylock Van, LLC Citigroup Drexel Hamilton Estrada Hinojosa & Company, Inc. Jefferies Loop Capital Markets Morgan Stanley RBC Capital Markets Dated: May 10, 2019
Transcript of dwuconsulting.com 2019AB OS.pdf · NEW ISSUE – BOOK-ENTRY ONLY RATINGS: See “RATINGS” In the...

NEW ISSUE – BOOK-ENTRY ONLY RATINGS: See “RATINGS”
In the opinion of Bond Counsel to the County to be delivered upon the issuance of the Series 2019 Bonds, under existing law and assuming continuing compliance by the County with certain requirements of the Internal Revenue Code of 1986, as amended (the “Code”), that must be met subsequent to the issuance of the Series 2019 Bonds, with which the County has certified, represented and covenanted its compliance, (i) interest on the Series 2019A Bonds is excludable from gross income for federal income tax purposes, except for interest on any Series 2019A Bonds for any period during which such Series 2019A Bonds are held by a person who is a “substantial user” of the facilities financed or a “related person,” as those terms are used in Section 147(a) of the Code; (ii) interest on the Series 2019A Bonds is an item of tax preference for purposes of the federal alternative minimum tax imposed on individuals; and (iii) the Series 2019 Bonds and the income thereon will not be subject to taxation under the laws of the State of Florida, except as to estate taxes and taxes under Chapter 220, Florida Statutes, on interest, income or profits on debt obligations owned by corporations as defined in said Chapter 220. INTEREST ON THE SERIES 2019B BONDS IS NOT EXCLUDABLE FROM GROSS INCOME FOR FEDERAL INCOME TAX PURPOSES. See “TAX MATTERS” for a description of certain other tax consequences to the Series 2019 Bonds.
$494,925,000MIAMI-DADE COUNTY, FLORIDA
$282,180,000Aviation Revenue Bonds
Series 2019A (AMT)
$212,745,000Aviation Revenue Refunding Bonds
Series 2019B (Taxable)
Dated: Date of delivery Due: October 1, as shown on inside cover page
Miami-Dade County, Florida (the “County”), is issuing its $282,180,000 Aviation Revenue Bonds, Series 2019A (AMT) (the “Series 2019A Bonds”), and its $212,745,000 Aviation Revenue Refunding Bonds, Series 2019B (Taxable) (the “Series 2019B Bonds” and, together with the Series 2019A Bonds, the “Series 2019 Bonds”). The Series 2019 Bonds are being issued as fully registered bonds, initially registered in the name of Cede & Co. as nominee of The Depository Trust Company, New York, New York (“DTC”), which will act as securities depository for the Series 2019 Bonds. So long as the Series 2019 Bonds are in book-entry form, purchases of beneficial interests in the Series 2019 Bonds will be made in book-entry only form, without certificates, in denominations of $5,000 or integral multiples of $5,000. See “AUTHORIZATION FOR THE SERIES 2019 BONDS.”
Interest on the Series 2019 Bonds will accrue from their initial date of delivery and will be payable on April 1 and October 1 of each year, commencing on October 1, 2019.
Principal of and interest on the Series 2019 Bonds will be payable at the corporate trust offices of The Bank of New York Mellon (successor in interest to JPMorgan Chase Bank), as trustee (the “Trustee”), in New York, New York. So long as DTC or its nominee is the registered owner of the Series 2019 Bonds, payments of the principal of and interest on the Series 2019 Bonds will be paid directly to DTC or its nominee, and disbursements of such payments to beneficial owners will be the responsibility of DTC and its participants. See “THE SERIES 2019 BONDS – Book-Entry Only System.” Certain of the Series 2019 Bonds will be subject to optional and mandatory redemption prior to maturity at the prices, in the manner and at such times as set forth in this Official Statement. See “THE SERIES 2019 BONDS – Redemption.”
The Series 2019 Bonds are being issued to provide funds, together with any other legally available funds of the Miami-Dade County Aviation Department, for the purposes of: (a) refunding all of the then outstanding Miami-Dade County, Florida Aviation Commercial Paper Notes, Series C (AMT), (b) refunding all or a portion of certain Outstanding aviation revenue bonds of the County as described in this Official Statement, (c) making a deposit to the Reserve Account (as defined herein), (d) financing or reimbursing the County for all or a portion of the cost of certain Improvements to the Port Authority Properties (as such terms are defined herein), (e) paying certain costs of issuance relating to the Series 2019 Bonds and (f) paying capitalized interest on a portion of the Series 2019 Bonds. See “INTRODUCTORY STATEMENT” and “PLAN OF FINANCE.”
THE SERIES 2019 BONDS WILL BE SPECIAL, LIMITED OBLIGATIONS OF THE COUNTY PAYABLE SOLELY FROM A PLEDGE OF NET REVENUES (AS DESCRIBED IN THIS OFFICIAL STATEMENT) DERIVED FROM THE PORT AUTHORITY PROPERTIES, INCLUDING THE OPERATION OF THE MIAMI INTERNATIONAL AIRPORT, AS DESCRIBED IN THIS OFFICIAL STATEMENT, AND CERTAIN OTHER MONIES. THE SERIES 2019 BONDS WILL BE SECURED ON A PARITY BASIS WITH THE COUNTY’S OUTSTANDING BONDS UNDER THE TRUST AGREEMENT DESCRIBED IN THIS OFFICIAL STATEMENT. NEITHER THE FAITH AND CREDIT OF THE STATE OF FLORIDA OR THE COUNTY NOR THE FAITH AND CREDIT OF ANY AGENCY OR POLITICAL SUBDIVISION OF THE STATE OF FLORIDA OR THE COUNTY ARE PLEDGED TO THE PAYMENT OF THE PRINCIPAL OF OR INTEREST ON THE SERIES 2019 BONDS. THE ISSUANCE OF THE SERIES 2019 BONDS SHALL NOT DIRECTLY, INDIRECTLY OR CONTINGENTLY OBLIGATE THE STATE OF FLORIDA OR THE COUNTY OR ANY AGENCY OR POLITICAL SUBDIVISION OF THE STATE OF FLORIDA OR THE COUNTY TO LEVY ANY TAXES FOR THE PAYMENT OF THE SERIES 2019 BONDS OR TO MAKE ANY APPROPRIATION FOR THEIR PAYMENT EXCEPT FROM THE NET REVENUES AND CERTAIN OTHER MONIES PLEDGED TO THE PAYMENT OF THE SERIES 2019 BONDS UNDER THE TRUST AGREEMENT.
See the inside cover page for maturities, principal amounts, interest rates, yields, prices and initial CUSIP numbers of the Series 2019 Bonds.
This cover page contains information for quick reference only. It is not a summary of the Series 2019 Bonds. Investors must read the entire Official Statement, including the APPENDICES attached hereto, to obtain information essential to the making of an informed investment decision. Unless otherwise specified, cross-references are to specific captioned sections of this Official Statement.
The Series 2019 Bonds are offered when, as and if issued by the County and accepted by the Underwriters, subject to opinions on certain legal matters relating to their issuance of Greenberg Traurig, P.A., Miami, Florida, and Edwards & Feanny, P.A., Miami, Florida, Bond Counsel. Certain legal matters will be passed upon for the County by the Office of the Miami-Dade County Attorney. Certain other legal matters relating to disclosure will be passed upon for the County by Hunton Andrews Kurth LLP, Miami, Florida, and DiFalco & Fernandez LLLP, Miami, Florida, Disclosure Counsel. Certain legal matters will be passed upon for the Underwriters by their counsel, Bryant Miller Olive P.A., Miami, Florida. The Financial Advisor to the Miami-Dade County Aviation Department is Hilltop Securities Inc., Miami, Florida. It is expected that the Series 2019 Bonds will be available for delivery through DTC in New York, New York on or about May 30, 2019.
RAYMOND JAMES Cabrera Capital Markets, LLC Ramirez & Co., Inc. Rice Financial Products Company Siebert Cisneros Shank & Co., L.L.C. Barclays Blaylock Van, LLC Citigroup Drexel Hamilton Estrada Hinojosa & Company, Inc. Jefferies Loop Capital Markets Morgan Stanley RBC Capital Markets
Dated: May 10, 2019

MATURITIES, PRINCIPAL AMOUNTS, INTEREST RATES, YIELDS, PRICES AND INITIAL CUSIP NUMBERS OF THE SERIES 2019 BONDS
$282,180,000 AVIATION REVENUE BONDS
SERIES 2019A (AMT)
$46,880,000 4.000% Term Bond Due October 1, 2044, Yield 3.130%, Price 107.628*
Initial CUSIP No. 59333P 4C9(1)
$46,870,000 5.000% Term Bond Due October 1, 2044, Yield 2.850%, Price 119.127* Initial CUSIP No. 59333P 4B1(1)
$188,430,000 5.000% Term Bond Due October 1, 2049, Yield 2.940%, Price 118.242* Initial CUSIP No. 59333P 4D7(1)
$212,745,000
AVIATION REVENUE REFUNDING BONDS SERIES 2019B (Taxable)
Maturity Date (October 1)
Principal Amount Interest Rate Yield Price
Initial CUSIP No.(1)
2020 $ 1,675,000 2.569% 2.569% 100.000 59333P 4E5 2021 1,720,000 2.586 2.586 100.000 59333P 4F2 2022 11,675,000 2.608 2.608 100.000 59333P 4G0 2023 1,495,000 2.755 2.755 100.000 59333P 4H8 2024 8,470,000 2.805 2.805 100.000 59333P 4J4 2025 15,350,000 2.949 2.949 100.000 59333P 4K1 2026 17,040,000 3.049 3.049 100.000 59333P 4L9 2027 31,095,000 3.135 3.135 100.000 59333P 4M7 2028 36,560,000 3.175 3.175 100.000 59333P 4N5 2029 37,570,000 3.275 3.275 100.000 59333P 4P0 2030 22,300,000 3.375 3.375 100.000 59333P 4Q8 2034 27,795,000 3.555 3.555 100.000 59333P 4R6
* Priced to first call date of October 1, 2029. (1) CUSIP numbers have been assigned by an organization not affiliated with the County and are included solely for the convenience of the holders of the Series 2019 Bonds. The County is not responsible for the selection or use of these CUSIP numbers, nor is any representation made as to their correctness on the Series 2019 Bonds or as indicated above. The CUSIP numbers are subject to being changed after execution and delivery of the Series 2019 Bonds as a result of various subsequent actions including, but not limited to, a refunding in part or as a result of the procurement of secondary market portfolio insurance or other similar enhancement by investors that is applicable to all or a portion of the Series 2019 Bonds.
MIAMI-DADE COUNTY, FLORIDA Carlos A. Gimenez, Mayor
MEMBERS OF THE BOARD OF COUNTY COMMISSIONERS Audrey M. Edmonson, Chairwoman
Rebeca Sosa, Vice-Chairwoman
Name District Name District Barbara J. Jordan 1 Daniella Levine Cava 8 Jean Monestime 2 Dennis C. Moss 9 Audrey M. Edmonson 3 Senator Javier D. Souto 10 Sally A. Heyman 4 Joe A. Martinez 11 Eileen Higgins 5 Jose “Pepe” Diaz 12 Rebeca Sosa 6 Esteban L. Bovo, Jr. 13 Xavier L. Suarez 7
COUNTY CLERK COUNTY ATTORNEY
Harvey Ruvin Abigail Price-Williams, Esq.
DEPUTY MAYOR / FINANCE DIRECTOR Edward Marquez
AVIATION DEPARTMENT Lester Sola
Aviation Director and Chief Executive Officer
Kenneth A. Pyatt Deputy Aviation Director
Sergio San Miguel Chief Financial Officer
Oscar Aguirre Capital Finance Manager
BOND COUNSEL Greenberg Traurig, P.A. Edwards & Feanny, P.A.
Miami, Florida Miami, Florida
DISCLOSURE COUNSEL Hunton Andrews Kurth LLP
Miami, Florida DiFalco & Fernandez LLLP
Miami, Florida
FINANCIAL ADVISOR Hilltop Securities Inc.
Miami, Florida
CONSULTING ENGINEERS HNTB Corporation
Miami, Florida
TRAFFIC ENGINEERS LeighFisher, Inc.
Burlingame, California
INDEPENDENT CERTIFIED PUBLIC ACCOUNTANTS Cherry Bekaert LLP
Tampa, Florida

NO DEALER, BROKER, SALESPERSON OR OTHER PERSON HAS BEEN AUTHORIZED BY THE COUNTY, THE MIAMI-DADE COUNTY AVIATION DEPARTMENT (THE “AVIATION DEPARTMENT”) OR THE UNDERWRITERS TO GIVE ANY INFORMATION OR TO MAKE ANY REPRESENTATIONS OTHER THAN AS SET FORTH IN THIS OFFICIAL STATEMENT AND, IF GIVEN OR MADE, SUCH OTHER INFORMATION OR REPRESENTATION MUST NOT BE RELIED UPON AS HAVING BEEN AUTHORIZED BY THE COUNTY, THE AVIATION DEPARTMENT OR THE UNDERWRITERS. THIS OFFICIAL STATEMENT DOES NOT CONSTITUTE AN OFFER TO SELL OR THE SOLICITATION OF AN OFFER TO BUY NOR SHALL THERE BE ANY SALE OF THE SERIES 2019 BONDS BY A PERSON IN ANY JURISDICTION IN WHICH IT IS UNLAWFUL FOR SUCH PERSON TO MAKE SUCH AN OFFER, SOLICITATION OR SALE. THIS OFFICIAL STATEMENT IS NOT TO BE CONSTRUED AS A CONTRACT WITH THE PURCHASERS OF THE SERIES 2019 BONDS.
THE UNDERWRITERS HAVE PROVIDED THE FOLLOWING SENTENCE FOR INCLUSION IN THIS OFFICIAL STATEMENT. THE UNDERWRITERS HAVE REVIEWED THE INFORMATION IN THIS OFFICIAL STATEMENT IN ACCORDANCE WITH, AND AS A PART OF, THEIR RESPONSIBILITIES TO INVESTORS UNDER THE FEDERAL SECURITIES LAWS AS APPLIED TO THE FACTS AND CIRCUMSTANCES OF THIS TRANSACTION, BUT THE UNDERWRITERS DO NOT GUARANTEE THE ACCURACY OR COMPLETENESS OF SUCH INFORMATION.
THE SERIES 2019 BONDS HAVE NOT BEEN REGISTERED UNDER THE SECURITIES ACT OF 1933, AS AMENDED, OR ANY STATE SECURITIES LAW, NOR HAVE THE TRUST AGREEMENT, THE SERIES 2019 RESOLUTION OR THE AUTHORIZATIONS DESCRIBED IN THIS OFFICIAL STATEMENT BEEN QUALIFIED UNDER THE TRUST INDENTURE ACT OF 1939, AS AMENDED, IN RELIANCE UPON EXEMPTIONS CONTAINED IN SUCH ACTS.
IN MAKING AN INVESTMENT DECISION, INVESTORS MUST RELY UPON THEIR OWN EXAMINATION OF THE TERMS OF THE OFFERING, INCLUDING THE MERITS AND RISKS INVOLVED.
THESE SECURITIES HAVE NOT BEEN RECOMMENDED BY ANY FEDERAL OR STATE SECURITIES COMMISSION OR REGULATORY AUTHORITY. FURTHERMORE, THE FOREGOING AUTHORITIES HAVE NOT CONFIRMED THE ACCURACY OR DETERMINED THE ADEQUACY OF THIS DOCUMENT. ANY REPRESENTATION TO THE CONTRARY IS A CRIMINAL OFFENSE.
IN CONNECTION WITH THIS OFFERING, THE UNDERWRITERS MAY OVERALLOT OR EFFECT TRANSACTIONS WHICH STABILIZE OR MAINTAIN THE MARKET PRICE OF THE SERIES 2019 BONDS AT A LEVEL ABOVE THAT WHICH MIGHT OTHERWISE PREVAIL IN THE OPEN MARKET. SUCH STABILIZING, IF COMMENCED, MAY BE DISCONTINUED AT ANY TIME. THE UNDERWRITERS MAY OFFER AND SELL THE SERIES 2019 BONDS TO CERTAIN DEALERS AND OTHERS AT YIELDS HIGHER THAN THE PUBLIC OFFERING YIELDS REFLECTED ON THE INSIDE COVER PAGE OF THIS OFFICIAL STATEMENT, AND SUCH PUBLIC OFFERING YIELDS MAY BE CHANGED FROM TIME TO TIME, AFTER THE INITIAL OFFERING TO THE PUBLIC, BY THE UNDERWRITERS.
THE ORDER AND PLACEMENT OF MATERIALS IN THIS OFFICIAL STATEMENT, INCLUDING THE APPENDICES, ARE NOT TO BE DEEMED A DETERMINATION OF RELEVANCE, MATERIALITY OR IMPORTANCE, AND THIS OFFICIAL STATEMENT, INCLUDING THE APPENDICES, MUST BE CONSIDERED IN ITS ENTIRETY. THE CAPTIONS AND HEADINGS IN THIS OFFICIAL STATEMENT ARE FOR CONVENIENCE OF REFERENCE ONLY AND IN NO WAY DEFINE, LIMIT OR DESCRIBE THE SCOPE OR INTENT, OR AFFECT THE MEANING OR CONSTRUCTION, OF ANY PROVISIONS OR SECTIONS IN THIS OFFICIAL STATEMENT. THE OFFERING OF THE SERIES 2019 BONDS IS MADE ONLY BY MEANS OF THIS ENTIRE OFFICIAL STATEMENT.
THIS OFFICIAL STATEMENT IS BEING PROVIDED TO PROSPECTIVE PURCHASERS EITHER IN BOUND PRINTED FORM (“ORIGINAL BOUND FORMAT”) OR IN ELECTRONIC FORMAT ON THE FOLLOWING WEBSITES: WWW.MUNIOS.COM AND WWW.EMMA.MSRB.ORG. THIS OFFICIAL STATEMENT MAY BE RELIED UPON ONLY IF IT IS IN ITS ORIGINAL BOUND FORMAT OR AS PRINTED IN ITS ENTIRETY DIRECTLY FROM SUCH WEBSITES.

CERTAIN STATEMENTS INCLUDED OR INCORPORATED BY REFERENCE IN THIS OFFICIAL STATEMENT CONSTITUTE “FORWARD-LOOKING STATEMENTS.” SUCH STATEMENTS GENERALLY ARE IDENTIFIABLE BY THE TERMINOLOGY USED, SUCH AS “PLAN,” “EXPECT,” “ESTIMATE,” “BUDGET” OR OTHER SIMILAR WORDS. SUCH FORWARD-LOOKING STATEMENTS INCLUDE, BUT ARE NOT LIMITED TO, CERTAIN STATEMENTS CONTAINED IN THE INFORMATION UNDER THE CAPTIONS “ESTIMATED SOURCES AND USES OF FUNDS,” “CERTAIN INVESTMENT CONSIDERATIONS,” AND “AVIATION DEPARTMENT FINANCIAL INFORMATION – MANAGEMENT’S DISCUSSION OF FINANCIAL INFORMATION,” IN THIS OFFICIAL STATEMENT. THE ACHIEVEMENT OF CERTAIN RESULTS OR OTHER EXPECTATIONS CONTAINED IN SUCH FORWARD-LOOKING STATEMENTS INVOLVE KNOWN AND UNKNOWN RISKS, UNCERTAINTIES AND OTHER FACTORS THAT MAY CAUSE ACTUAL RESULTS, PERFORMANCE OR ACHIEVEMENTS TO BE MATERIALLY DIFFERENT FROM ANY FUTURE RESULTS, PERFORMANCE OR ACHIEVEMENTS EXPRESSED OR IMPLIED BY SUCH FORWARD-LOOKING STATEMENTS. AMONG THE FACTORS THAT MAY CAUSE PROJECTED REVENUES AND EXPENDITURES TO BE MATERIALLY DIFFERENT FROM THOSE ANTICIPATED ARE AN INABILITY TO INCUR DEBT AT ASSUMED RATES, CONSTRUCTION DELAYS, INCREASES IN CONSTRUCTION COSTS, GENERAL ECONOMIC DOWNTURNS, FACTORS AFFECTING THE AIRLINE INDUSTRY IN GENERAL, FEDERAL LEGISLATION AND/OR REGULATIONS, AND REGULATORY AND OTHER RESTRICTIONS, INCLUDING, BUT NOT LIMITED TO, THOSE THAT MAY AFFECT THE ABILITY TO UNDERTAKE, THE TIMING OR THE COSTS OF CERTAIN PROJECTS. ANY FORECAST IS SUBJECT TO SUCH UNCERTAINTIES. THEREFORE, THERE ARE LIKELY TO BE DIFFERENCES BETWEEN FORECASTS AND ACTUAL RESULTS, AND THOSE DIFFERENCES MAY BE MATERIAL. OTHER THAN THE CUSTOMARY FINANCIAL REPORTING ACTIVITIES OF THE COUNTY AND THE AVIATION DEPARTMENT OR REPORTING ACTIVITIES NECESSARY TO COMPLY WITH LEGAL OR CONTRACTUAL REQUIREMENTS, NEITHER THE COUNTY NOR THE AVIATION DEPARTMENT PLAN TO ISSUE ANY UPDATES OR REVISIONS TO SUCH FORWARD-LOOKING STATEMENTS IF OR WHEN (i) THE EXPECTATIONS OF THE COUNTY OR THE AVIATION DEPARTMENT CHANGE, OR (ii) THE EVENTS, CONDITIONS OR CIRCUMSTANCES ON WHICH SUCH FORWARD-LOOKING STATEMENTS ARE BASED ACTUALLY OCCUR OR FAIL TO OCCUR.
THIS OFFICIAL STATEMENT IS IN THE FORM DEEMED FINAL BY THE COUNTY FOR PURPOSES OF RULE 15c2-12 PROMULGATED UNDER THE SECURITIES EXCHANGE ACT OF 1934, AS AMENDED.

(i)
TABLE OF CONTENTS
Page INTRODUCTORY STATEMENT ............................................................................................................................... 1 AUTHORIZATION FOR THE SERIES 2019 BONDS ............................................................................................... 3 PLAN OF FINANCE .................................................................................................................................................... 3 ESTIMATED SOURCES AND USES OF FUNDS ..................................................................................................... 5 THE SERIES 2019 BONDS .......................................................................................................................................... 5
General ..................................................................................................................................................................... 5 Redemption .............................................................................................................................................................. 5 Acceleration Upon Default ...................................................................................................................................... 7 Book-Entry Only System ......................................................................................................................................... 7 Discontinuance of Book-Entry Only System ........................................................................................................... 7
SECURITY FOR THE SERIES 2019 BONDS ............................................................................................................. 8 Pledge of Net Revenues ........................................................................................................................................... 8 Rate Covenant .......................................................................................................................................................... 9 Airline Use Agreement .......................................................................................................................................... 10 Reserve Account .................................................................................................................................................... 14 Issuance of Additional Bonds ................................................................................................................................ 15 Issuance of Refunding Bonds ................................................................................................................................ 16 Funds and Flow of Funds ....................................................................................................................................... 16
CERTAIN INVESTMENT CONSIDERATIONS ...................................................................................................... 18 Factors Affecting Air Transportation Industry....................................................................................................... 19 American Airlines .................................................................................................................................................. 19 Airline Economic Considerations .......................................................................................................................... 20 The Federal Budget and Sequestration .................................................................................................................. 22 Agreement with Customs and Border Patrol Agency ............................................................................................ 22 PFC Collections ..................................................................................................................................................... 23 Federal Legislation ................................................................................................................................................ 23 Airport Security Requirements .............................................................................................................................. 24 Airport Competition ............................................................................................................................................... 25 Cost and Schedule of Capital Improvements Program .......................................................................................... 26 Report of the Traffic Engineers ............................................................................................................................. 26 Growth of Transportation Network Companies ..................................................................................................... 26 Cyber-Security ....................................................................................................................................................... 27 Climate Change ...................................................................................................................................................... 27 Environmental Liabilities ....................................................................................................................................... 27 Airport Insurance ................................................................................................................................................... 27 Local Construction Market Conditions .................................................................................................................. 27
AVIATION-RELATED DEBT ................................................................................................................................... 28 Outstanding Bonds Under the Trust Agreement .................................................................................................... 28 Debt Service Schedule ........................................................................................................................................... 29 Double-Barreled Aviation Bonds ........................................................................................................................... 29 Commercial Paper Notes ....................................................................................................................................... 30 Other Airport-Related Debt ................................................................................................................................... 30 Capital Leases ........................................................................................................................................................ 31 Independent Financing of the Rental Car Center ................................................................................................... 31 Future Indebtedness; Other Capital Expenditures .................................................................................................. 32
AIRPORT SYSTEM GOVERNANCE AND MANAGEMENT ................................................................................ 32 Governance ............................................................................................................................................................ 32 Management........................................................................................................................................................... 32 Employees .............................................................................................................................................................. 35
AIRPORT SYSTEM FACILITIES ............................................................................................................................. 35 Introduction ............................................................................................................................................................ 35 Terminal Building .................................................................................................................................................. 35

(ii)
Commercial Operations Facilities .......................................................................................................................... 39 Airside Facilities .................................................................................................................................................... 40 Parking Facilities ................................................................................................................................................... 42 Roadway Access to MIA ....................................................................................................................................... 42 Cargo and Other Facilities at the Airport ............................................................................................................... 44 MIA Pharma Hub Development ............................................................................................................................ 46 MIA Foreign Trade Zone Development ................................................................................................................ 46 The General Aviation Airports .............................................................................................................................. 46 Airport Insurance ................................................................................................................................................... 49
AIRPORT TRAFFIC ACTIVITY ............................................................................................................................... 50 Airlines Serving the Airport ................................................................................................................................... 54 Selected Carrier Activity ........................................................................................................................................ 57 Air Service Incentive Program ............................................................................................................................... 59
CAPITAL IMPROVEMENT PROGRAM ................................................................................................................. 59 Overview ................................................................................................................................................................ 59 Details of the CIP ................................................................................................................................................... 62 * Future Capital Projects ....................................................................................................................................... 63
FUNDING SOURCES FOR CAPITAL PROJECTS .................................................................................................. 63 Federal Grants ........................................................................................................................................................ 63 State Grants ............................................................................................................................................................ 64 Passenger Facility Charges .................................................................................................................................... 64 Reserve Maintenance Fund and Improvement Fund .............................................................................................. 66 Other Revenues ...................................................................................................................................................... 67 Future Financings .................................................................................................................................................. 67
AVIATION DEPARTMENT FINANCIAL INFORMATION ................................................................................... 67 Historical Financial Results ................................................................................................................................... 67 Management’s Discussion of Financial Information ............................................................................................. 69 Other Post-Employment Benefits and Pension Benefits ........................................................................................ 70
COUNTY INVESTMENT POLICY ........................................................................................................................... 71 TAX MATTERS ......................................................................................................................................................... 72
General – Opinions ................................................................................................................................................ 72 Series 2019A Bonds ............................................................................................................................................... 72 Series 2019B Bonds (Taxable) .............................................................................................................................. 74
CONTINUING DISCLOSURE ................................................................................................................................... 77 Obligated Persons .................................................................................................................................................. 78 Airline Disclosure .................................................................................................................................................. 78 Procedures and Past Performance .......................................................................................................................... 78 Limited Information; Limited Rights of Enforcement ........................................................................................... 79 EMMA System ...................................................................................................................................................... 79
RATINGS .................................................................................................................................................................... 80 ENFORCEABILITY OF REMEDIES ........................................................................................................................ 80 UNDERWRITING ...................................................................................................................................................... 80 FINANCIAL ADVISOR ............................................................................................................................................. 81 RELATIONSHIPS OF PARTIES ............................................................................................................................... 81 FINANCIAL STATEMENTS ..................................................................................................................................... 81 CERTAIN LEGAL MATTERS .................................................................................................................................. 81 LITIGATION .............................................................................................................................................................. 82
General ................................................................................................................................................................... 82 Aviation Environmental Matters ............................................................................................................................ 82
DISCLOSURE REQUIRED BY FLORIDA BLUE SKY REGULATIONS .............................................................. 84 VERIFICATION OF MATHEMATICAL COMPUTATIONS .................................................................................. 85 CERTIFICATE OF FINANCE DIRECTOR AND AVIATION DIRECTOR CONCERNING THIS OFFICIAL STATEMENT ............................................................................................................................................................. 85 MISCELLANEOUS .................................................................................................................................................... 85

(iii)
APPENDIX A REPORT OF THE TRAFFIC ENGINEERS APPENDIX B AUDITED FINANCIAL STATEMENTS OF THE AVIATION DEPARTMENT FOR THE
FISCAL YEAR ENDED SEPTEMBER 30, 2018 APPENDIX C SUMMARY OF CERTAIN PROVISIONS OF THE TRUST AGREEMENT APPENDIX D SUMMARY OF CERTAIN PROVISIONS OF THE 2018 AIRLINE USE AGREEMENT
AND THE PREFERENTIAL GATE USE AGREEMENT APPENDIX E PROPOSED FORM OF BOND COUNSEL OPINION APPENDIX F PROPOSED FORM OF DISCLOSURE COUNSEL OPINION APPENDIX G CONTINUING DISCLOSURE UNDERTAKING APPENDIX H BOOK-ENTRY ONLY SYSTEM

OFFICIAL STATEMENT
relating to
$494,925,000 MIAMI-DADE COUNTY, FLORIDA
$282,180,000
Aviation Revenue Bonds Series 2019A (AMT)
$212,745,000
Aviation Revenue Refunding Bonds Series 2019B (Taxable)
INTRODUCTORY STATEMENT
This Official Statement of Miami-Dade County, Florida (the “County”), which includes the cover page, the inside cover page and the Appendices, furnishes information in regard to the Port Authority Properties (the “Port Authority Properties”) and other assets owned by the County and operated by the Miami-Dade County Aviation Department (the “Aviation Department”) and other information in connection with the issuance and sale of the County’s $282,180,000 Aviation Revenue Bonds, Series 2019A (AMT) (the “Series 2019A Bonds”), and its $212,745,000 Aviation Revenue Refunding Bonds, Series 2019B (Taxable) (the “Series 2019B Bonds” and, together with the Series 2019A Bonds, the “Series 2019 Bonds”).
The Series 2019 Bonds are being issued pursuant to (1) Chapters 125 and 166, Florida Statutes, as amended (collectively, the “Act”), (2) the Amended and Restated Trust Agreement dated as of December 15, 2002 (the “Trust Agreement”), by and among the County, The Bank of New York Mellon (successor in interest to JPMorgan Chase Bank), as trustee (the “Trustee”), and U.S. Bank National Association (successor in interest to Wachovia Bank, National Association), as co-trustee (the “Co-Trustee”), and (3) Resolution No. R-311-19 (the “Series 2019 Resolution”) adopted by the Board of County Commissioners of Miami-Dade County, Florida (the “Board”) on March 19, 2019, approving the issuance of the Series 2019 Bonds. In addition, the Series 2019A Bonds are being issued pursuant to the authority of certain ordinances previously enacted by the Board. See “AUTHORIZATION FOR THE SERIES 2019 BONDS” and “APPENDIX C – SUMMARY OF CERTAIN PROVISIONS OF THE TRUST AGREEMENT.”
The Series 2019 Bonds are being issued to provide funds, together with any other legally available funds of the Aviation Department, for the purposes of (a) refunding all of the then outstanding Miami-Dade County, Florida Aviation Commercial Paper Notes, Series C (AMT) issued to finance Improvements to the Port Authority Properties (the “CP Notes”); (b) refunding and redeeming, as applicable, all or a portion of the outstanding (i) Miami-Dade County, Florida Aviation Revenue Bonds, Series 2009A (the “Series 2009A Bonds”); (ii) Miami-Dade County, Florida Aviation Revenue Bonds, Series 2010A (the “Series 2010A Bonds”), and (iii) Miami-Dade County, Florida Aviation Revenue Bonds, Series 2010B (the “Series 2010B Bonds” and, collectively with the Series 2009A Bonds and the Series 2010A Bonds, the “Refunded Bonds”) 2, (c) making a deposit to the Reserve Account (as defined in the Trust Agreement), (d) financing or reimbursing the County for all or a portion of the cost of certain Improvements to the Port Authority Properties, (e) paying the costs of issuing the Series 2019 Bonds and refunding the bonds to be refunded, and (f) paying capitalized interest on a portion of the Series 2019 Bonds. See “PLAN OF FINANCE” for a detailed description of the portion of the listed Series of Outstanding Bonds being refunded.
The Series 2019 Bonds are payable from and are secured by a pledge of Net Revenues (as described in this Official Statement) of the Port Authority Properties. See “SECURITY FOR THE SERIES 2019 BONDS – Pledge of Net Revenues.” The major components of the Port Authority Properties are (1) the terminals, grounds, runways and taxiways of (a) the Miami International Airport (the “Airport” or “MIA”), (b) three general aviation airports (Miami-Opa locka Executive Airport, Homestead General Aviation Airport and Miami Executive Airport), (c) one flight training airport (Dade-Collier Training and Transition Airport), and (d) one decommissioned airport
2 The Series 2009A Bonds, Series 20010A Bonds and Series 2010B Bonds are not eligible for advance refunding with tax-exempt bonds and as such, the portions of the Series 2009A Bonds, Series 2010A Bonds and Series 2010B Bonds being refunded will be refunded with proceeds of the Series 2019B Bonds.

2
(Opa-locka West Airport), and (2) all facilities or improvements of the County’s airports that are designated as Port Authority Properties pursuant to the Trust Agreement.
Reference herein to “Port Authority Properties” means the Port Authority Properties as the same exist unless otherwise indicated. Port Authority Properties do not include any facilities or improvements at the County’s airports financed by obligations not issued under the Trust Agreement or not otherwise designated as Port Authority Properties under the Trust Agreement. The entire airport system operated by the County is referred to herein as the “Airport System.”
The Airport is located approximately seven miles west of the downtown area of the City of Miami and includes approximately 3,230 acres and approximately 184 buildings. As of the first quarter of 2019, the Airport provided approximately 478 departing non-stop daily flights to 170 airports throughout the United States and around the world. The Airport provides service to most capital and secondary cities in South America, Central America and the Caribbean and many major cities in Europe and other parts of the world. As of December 31, 2018, a total of 108 international destinations were served, and for the 12-month period ended December 31, 2018, a total of 45.0 million passengers traveled through the Airport.
American Airlines is the predominant carrier at the Airport. Including the operation of its affiliate, Envoy Air, Inc., which operates under the American Eagle brand, American Airlines accounted for approximately 66.0% and 67.0% of the enplaned passengers at the Airport and approximately 37.5% and 37.1% of Airport revenues during the 12-month periods ended December 31, 2017, and December 31, 2018, respectively.
While the Net Revenues of all Port Authority Properties are pledged under the Trust Agreement, the majority of Net Revenues are generated by the Airport. Under the Trust Agreement, the proceeds of Passenger Facilities Charges (“PFCs”) do not constitute Revenues and currently are not pledged to the payment of any Bonds (as defined below), including the Series 2019 Bonds. The County, however, has previously utilized certain revenues derived from PFCs to make payments on the Bonds and may, in its discretion, elect to do so in the future. See “SECURITY FOR THE SERIES 2019 BONDS – Pledge of Net Revenues,” “– Rate Covenant” and “– Airline Use Agreement,” “CERTAIN INVESTMENT CONSIDERATIONS – PFC Collections” and “APPENDIX C – SUMMARY OF CERTAIN PROVISIONS OF THE TRUST AGREEMENT.”
The Series 2019 Bonds are being issued on a parity basis with the $4,979,115,0003 aggregate principal amount of aviation revenue bonds currently Outstanding, as defined in the Trust Agreement (the “Outstanding Bonds”), and not otherwise being refunded with the proceeds of the Series 2019 Bonds and other legally available funds of the Aviation Department, as to the pledge of, lien on and source of payment from Net Revenues. Subject to certain conditions, the County may issue Additional Bonds and Refunding Bonds (as such terms are defined below) under the Trust Agreement on a parity basis with the Outstanding Bonds and the Series 2019 Bonds. See “SECURITY FOR THE SERIES 2019 BONDS – Issuance of Additional Bonds” and “– Issuance of Refunding Bonds.” The Series 2019 Bonds, the Outstanding Bonds and any Additional Bonds and Refunding Bonds hereafter issued on a parity basis with such bonds are collectively referred to in this Official Statement as the “Bonds.” See “AVIATION-RELATED DEBT – Outstanding Bonds Under the Trust Agreement,” “AVIATION DEPARTMENT FINANCIAL INFORMATION” and “APPENDIX C – SUMMARY OF CERTAIN PROVISIONS OF THE TRUST AGREEMENT.”
This Official Statement contains descriptions of, among other matters, the Series 2019 Bonds, the Trust Agreement, the Aviation Department, the Airport, its facilities and operations, the capital improvement program (“CIP”) of the Aviation Department, and the Terminal Optimization Program which comprises a portion of the CIP. Such descriptions do not purport to be comprehensive or definitive. Certain information in this Official Statement has been provided by The Depository Trust Company (“DTC”). See “APPENDIX H – BOOK-ENTRY ONLY SYSTEM.” Neither the County nor the Underwriters have provided information in this Official Statement with respect to DTC, and neither the County nor the Underwriters certify as to the accuracy or sufficiency of the disclosure policies of or content provided by DTC, and neither are responsible for the information provided by DTC. All references in this Official Statement to the Trust Agreement and related documents are qualified in their entirety
3 Amount has been updated from the Preliminary Official Statement dated April 29, 2019, to exclude the Refunded Bonds. Does not include the Series 2019 Bonds.

3
by reference to such documents. References in this Official Statement to the Series 2019 Bonds are qualified in their entirety by reference to the form of the Series 2019 Bonds included in the Trust Agreement.
A Report of the Aviation Department’s traffic engineers is included as APPENDIX A. Audited financial statements of the Aviation Department for the Fiscal Year ended September 30, 2018, are included as APPENDIX B. A summary of certain provisions of the Trust Agreement is included as APPENDIX C. A summary of certain provisions of the 2018 Airline Use Agreement and the Preferential Gate Use Agreement is included as APPENDIX D. The substantially final form of the approving opinions to be delivered by Greenberg Traurig, P.A. and Edwards & Feanny, P.A., Bond Counsel, is included as APPENDIX E. The substantially final form of the opinions to be delivered by Hunton Andrews Kurth LLP and DiFalco & Fernandez LLLP, Disclosure Counsel, is included as APPENDIX F. The County’s continuing disclosure undertaking is included as APPENDIX G.
All capitalized terms not otherwise defined in this Official Statement shall have the meanings ascribed to them in the Trust Agreement. See “APPENDIX C – SUMMARY OF CERTAIN PROVISIONS OF THE TRUST AGREEMENT” for definitions of certain of those terms.
AUTHORIZATION FOR THE SERIES 2019 BONDS
Pursuant to the Act, the County is authorized to construct, acquire, establish, improve, extend, enlarge, reconstruct, equip, maintain, repair and operate projects, within or outside the territorial boundaries of the County, including, but not limited to, airport facilities of all kinds, including all properties, rights, easements and franchises relating to such airport facilities. The Airport, three general aviation airports, one flight training airport, one decommissioned airport, and airport-related properties and improvements constituting the Port Authority Properties are operated by the County through the Aviation Department. Title to the Port Authority Properties is vested in the County.
The Act authorizes the issuance of aviation revenue bonds to mature not later than 40 years from their date of issuance for any of the purposes set forth in the Act, including for the purpose of refunding bonds previously issued thereunder. Such revenue bonds do not constitute a debt of the County, or a pledge of the faith and credit of the County, but are payable solely from Net Revenues of the Port Authority Properties.
The Series 2019 Bonds are being issued pursuant to the Act, the Trust Agreement and the Series 2019 Resolution. In addition to the above, the Series 2019A Bonds are also issued pursuant to Ordinance No. 95-38 enacted by the Board on February 21, 1995, authorizing the issuance of up to $1,200,000,000 in aviation revenue bonds (the “1995 Authorization”); Ordinance No. 96-31 enacted by the Board on February 6, 1996, authorizing the issuance of up to $2,600,000,000 in additional aviation revenue bonds (the “1996 Authorization”); Ordinance No. 97-207 enacted by the Board on November 4, 1997, authorizing the issuance of up to $500,000,000 in additional aviation revenue bonds (the “1997 Authorization”); and Ordinance No. 08 121 enacted by the Board on October 21, 2008, authorizing the issuance of up to $1,900,000,000 in additional aviation revenue bonds (the “2008 Authorization,” and collectively with the 1995 Authorization, the 1996 Authorization and the 1997 Authorization, the “Authorizations”). Of the $6.2 billion in Authorizations, approximately $5,917,820,000 of aviation revenue bonds have been issued, leaving approximately $282,180,000 in Authorizations remaining prior to the issuance of the Series 2019A Bonds for the issuance of Bonds (other than Refunding Bonds) to fund projects at the Airport.
PLAN OF FINANCE
The net proceeds of the Series 2019 Bonds will be applied, together with any other legally available funds of the Aviation Department, for the purposes of (a) refunding all of the then outstanding CP Notes; (b) refunding and redeeming, as applicable, the Refunded Bonds, (c) making a deposit to the Reserve Account (as defined in the Trust Agreement), (d) financing or reimbursing the County for all or a portion of the cost of certain Improvements to the Port Authority Properties, (e) paying the costs of issuing the Series 2019 Bonds and refunding the Refunded Bonds, and (f) paying capitalized interest on a portion of the Series 2019 Bonds. The maturities of the Refunded Bonds are summarized in the following table:

4
Bond
Maturity/Amortization
Date Interest
Rate Par AmountOutstanding
Par AmountRefunded
Redemption Date
RedemptionPrice
Series 2009A: Serial 10/1/2022 5.750% $ 9,910,000 $ 9,910,000 10/1/2019 100%
Series 2010A: Serial 10/1/2024 5.250 6,930,000 6,930,000 10/1/2020 100 Serial 10/1/2025 5.500 13,940,000 13,940,000 10/1/2020 100 Serial 10/1/2030 5.250 8,100,000 8,100,000 10/1/2020 100
Term 2029 10/1/2027 5.000 13,605,000 13,605,000 10/1/2020 100 Term 2029 10/1/2028 5.000 18,840,000 18,840,000 10/1/2020 100 Term 2029 10/1/2029 5.000 19,775,000 19,775,000 10/1/2020 100
Term 2035 10/1/2034 5.375 29,265,000 29,265,000 10/1/2020 100
Series 2010B: Serial 10/1/2026 5.000 15,940,000 15,940,000 10/1/2020 100 Serial 10/1/2027 5.000 16,670,000 16,670,000 10/1/2020 100 Serial 10/1/2028 5.000 17,440,000 17,440,000 10/1/2020 100 Serial 10/1/2029 5.000 18,165,000 18,165,000 10/1/2020 100 Serial 10/1/2030 5.000 655,000 655,000 10/1/2020 100 Serial 10/1/2030 5.000 14,585,000 14,585,000 10/1/2020 100
The County will enter into an irrevocable Escrow Deposit Agreement with the Trustee relating to the refunding of the Refunded Bonds (the “Escrow Agreement”). The Escrow Agreement will provide that cash and/or direct obligations of, or obligations the principal of and the interest on which are unconditionally guaranteed by, the United States of America (the “Government Obligations”) will be deposited to the escrow fund created under the Escrow Agreement (the “Escrow Fund”). Such Government Obligations will mature and bear interest at times and in amounts sufficient, together with any uninvested cash in such escrow fund, to pay principal of and interest on the Refunded Bonds from the date the Series 2019 Bonds are issued until the Refunded Bonds are called for redemption. Integrity Public Finance Consulting LLC (the “Verification Agent”), has verified the arithmetic accuracy of the mathematical computations of the adequacy of the maturing principal of and interest on the Government Obligations deposited to the Escrow Fund to pay the Refunded Bonds through their respective redemption dates. See “VERIFICATION OF MATHEMATICAL COMPUTATIONS.”
[Remainder of page intentionally left blank.]

5
ESTIMATED SOURCES AND USES OF FUNDS
The proceeds derived from the sale of the Series 2019 Bonds and other legally available funds are expected to be applied as follows:
Series 2019A Series 2019B Total SOURCES OF FUNDS:
Aggregate Par Amount $282,180,000.00 $212,745,000.00 $494,925,000.00 Plus: Original Issue Premium 46,914,231.90 0.00 46,914,231.90 Other Legally Available Funds(1) 0.00 1,747,057.29 1,747,057.29
TOTAL SOURCES $329,094,231.90 $214,492,057.29 $543,586,289.19 USES OF FUNDS:
Deposit to Series 2019A Account of the Construction Fund:
Projects $142,738,682.66 $ 0.00 $142,738,682.66 Payments of CP Notes 170,000,000.00 0.00 170,000,000.00 Capitalized Interest(2) 11,404,722.78 0.00 11,404,722.78
Deposit to Escrow Fund 0.00 212,819,764.03 212,819,764.03 Deposit to Debt Service Reserve Fund 2,476,268.09 0.00 2,476,268.09 Underwriters’ Discount(3) 1,399,864.43 861,461.15 2,261,325.58 Costs of Issuance(4) 1,074,693.94 810,832.11 1,885,526.05
TOTAL USES $329,094,231.90 $214,492,057.29 $543,586,289.19 (1) Represents amount held in funds and accounts under the Trust Agreement for the Refunded Bonds. (2) Consists of capitalized interest on the Series 2019A Bonds to April 1, 2020. (3) Includes fees of Underwriters’ Counsel. (4) Includes fees of Bond Counsel, Disclosure Counsel, Financial Advisor, Verification Agent and other costs of issuing the Series 2019 Bonds.
THE SERIES 2019 BONDS
General
The Series 2019 Bonds will be dated as of their date of delivery, will bear interest at such rates, will be payable at such times, and will mature on the dates and in the principal amounts set forth on the inside cover page of this Official Statement. Interest on the Series 2019 Bonds will be payable on April 1 and October 1 of each year, commencing on October 1, 2019. Certain of the Series 2019 Bonds will be subject to optional and mandatory redemption as described in this Official Statement. The Series 2019 Bonds are being issued as fully registered bonds in denominations of $5,000 or any integral multiple of $5,000, and when issued will be initially registered in the name of Cede & Co., as nominee of DTC. Purchases of beneficial interests in the Series 2019 Bonds will be made in book-entry only form, without certificates. If the book-entry only system is discontinued, such beneficial interests are exchangeable for one or more fully registered bonds of like principal amount.
So long as any of the Series 2019 Bonds are in book-entry only form, the registered owner of the Series 2019 Bonds will be Cede & Co. for all purposes of the Trust Agreement and the principal of and interest on the Series 2019 Bonds will be payable as described under “THE SERIES 2019 BONDS – Book-Entry Only System.”
Redemption
The Series 2019 Bonds are subject to optional and mandatory redemption prior to their stated maturity, as set forth below.
Optional Redemption of Series 2019A Bonds
The Series 2019A Bonds may be redeemed prior to their respective maturities at the option of the County, either in whole or in part, from any monies that may be available for such purpose, on any date on or after October 1, 2029, at a redemption price equal to 100% of the principal amount of such Series 2019A Bonds or

6
portion of such Series 2019A Bonds to be redeemed, plus accrued interest to the date of redemption, without premium.
Optional Redemption of Series 2019B Bonds
The Series 2019B Bonds maturing on or before October 1, 2029, shall not be subject to optional redemption prior to maturity. The Series 2019B Bonds maturing on or after October 1, 2030, may be redeemed prior to their respective maturities at the option of the County, either in whole or in part, from any monies that may be available for such purpose, on any date on or after October 1, 2029, at a redemption price equal to 100% of the principal amount of such Series 2019B Bonds or portion of such Series 2019B Bonds to be redeemed, plus accrued interest to the date of redemption, without premium.
Mandatory Redemption of Series 2019A Bonds
The Series 2019A Bonds maturing on October 1, 2044, and bearing interest at a rate of 4.000%, are subject to mandatory redemption prior to maturity at a redemption price equal to the principal amount of such Series 2019A Bonds, without premium, in the following principal amounts, which constitute the Amortization Requirements for such Series 2019A Bonds, on October 1 of the years set forth below:
Year Amount
2042 $14,945,000 2043 15,615,000 2044* 16,320,000
* Payment at maturity
The Series 2019A Bonds maturing on October 1, 2044, and bearing interest at a rate of 5.000%, are subject to mandatory redemption prior to maturity at a redemption price equal to the principal amount of such Series 2019A Bonds, without premium, in the following principal amounts, which constitute the Amortization Requirements for such Series 2019A Bonds, on October 1 of the years set forth below:
Year Amount
2042 $14,940,000 2043 15,615,000 2044* 16,315,000
* Payment at maturity
The Series 2019A Bonds maturing on October 1, 2049, are subject to mandatory redemption prior to maturity at a redemption price equal to the principal amount of such Series 2019A Bonds, without premium, in the following principal amounts, which constitute the Amortization Requirements for such Series 2019A Bonds, on October 1 of the years set forth below:
Year Amount
2045 $34,100,000 2046 35,805,000 2047 37,600,000 2048 39,475,000 2049* 41,450,000
* Payment at maturity
Redemption of Portions of the Series 2019 Bonds
In the event of a partial redemption of the Series 2019 Bonds, the Series 2019 Bonds may be redeemed in any order of maturity determined by the County. If less than all of the Series 2019 Bonds of any one maturity shall
7
be called for redemption, the particular Series 2019 Bonds to be redeemed shall be selected by lot by the Trustee by such method as it shall deem fair and appropriate. However, so long as the Series 2019 Bonds are fully registered in book-entry form and registered in the name of Cede & Co. (DTC’s partnership nominee), the provisions for selecting Series 2019 Bonds for redemption may be altered in order to conform to the requirements of DTC.
Notice and Effect of Redemption; Conditional Notice
Notice of the proposed redemption of any Series 2019 Bonds shall be mailed, postage prepaid, to Cede & Co., as nominee of DTC, as registered owner of the Series 2019 Bonds, or, if DTC is no longer the registered owner of the Series 2019 Bonds, to the then registered owners of the Series 2019 Bonds, as applicable, which notice shall be mailed at least 30 days prior to the date fixed for redemption (the “Redemption Date”).
The Series 2019 Resolution states that, in the case of an optional redemption, the notice of redemption may state that (i) it is conditioned upon the deposit of monies, in an amount equal to the amount necessary to effect the redemption, with the Trustee no later than the Redemption Date, or (ii) the County retains the right to rescind such notice on or prior to the scheduled Redemption Date (in either case, a “Conditional Redemption”), and such notice and optional redemption shall be of no effect if such monies are not so deposited or if the notice is rescinded as described in this paragraph. Any such notice of Conditional Redemption shall be captioned “Conditional Notice of Redemption.” Any Conditional Redemption may be rescinded at any time prior to the Redemption Date if the County delivers a written direction to the Trustee directing the Trustee to rescind the redemption notice. The Trustee shall give prompt notice of such rescission to the affected holders of Series 2019 Bonds. Any Series 2019 Bonds subject to Conditional Redemption where redemption has been rescinded shall remain Outstanding, and neither the rescission nor the failure by the County to make such funds available shall constitute an Event of Default. The Trustee shall give immediate notice to the securities information repositories and the affected holders of Series 2019 Bonds that the redemption did not occur and that the Series 2019 Bonds called for redemption and not so paid remain Outstanding.
No interest shall accrue after the Redemption Date of any Series 2019 Bonds if notice has been duly given as provided in the Trust Agreement and payment for such Series 2019 Bonds has been duly provided, and in such event, the Series 2019 Bonds (or portion of such Series 2019 Bonds) called for redemption will no longer be protected by the lien of the Trust Agreement, but shall be secured solely by the monies held for the redemption payment of such Series 2019 Bonds. The failure to mail a notice of redemption as required in the Trust Agreement shall not affect the validity of the proceedings for such redemption.
Acceleration Upon Default
All principal of and accrued interest on the Series 2019 Bonds may become immediately due and payable, without premium, upon an Event of Default under the Trust Agreement if the Trustee (1) exercises its option to so declare or (2) is directed to so declare by the holders of not less than a majority in principal amount of the Outstanding Bonds. See “APPENDIX C – SUMMARY OF CERTAIN PROVISIONS OF THE TRUST AGREEMENT – Remedies of Bondholders.”
Book-Entry Only System
DTC will act as securities depository for the Series 2019 Bonds pursuant to a book-entry system. Information regarding DTC and its book-entry system appears as APPENDIX H. Such information has been provided by DTC, and the County assumes no responsibility for the accuracy or completeness of such information. The County may decide to discontinue use of the system of book-entry transfers through DTC (or a successor securities depository). In that event, Bond certificates will be printed and delivered.
Discontinuance of Book-Entry Only System
In the event the County determines that it is in the best interest of the Beneficial Owners to obtain Series 2019 Bond certificates, the County may notify DTC and the Trustee, whereupon DTC will notify the DTC Participants, of the availability through DTC of Series 2019 Bond certificates. In such event, the County shall prepare and execute, and the Trustee shall authenticate, transfer and exchange, Series 2019 Bond certificates as requested by DTC in appropriate amounts and within the guidelines set forth in the Series 2019 Resolution. DTC

8
also may determine to discontinue providing its services with respect to the Series 2019 Bonds at any time by giving written notice to the County and the Trustee and discharging its responsibilities with respect thereto under applicable law. Under such circumstances (if there is no successor securities depository), the County and the Trustee shall be obligated to deliver Series 2019 Bond certificates as described herein. In the event Series 2019 Bond certificates are issued, the provisions of the Trust Agreement and the Series 2019 Resolution shall apply to, among other things, the transfer and exchange of such certificates and the method of payment of principal of and interest on such Series 2019 Bonds in certificated form. Whenever DTC requests the County and the Trustee to do so, the County will direct the Trustee to cooperate with DTC in taking appropriate action after reasonable notice (i) to make available one or more separate certificates evidencing the Series 2019 Bonds to any DTC Participant having Series 2019 Bonds credited to its DTC account; or (ii) to arrange for another securities depository to maintain custody of certificates evidencing the Series 2019 Bonds.
SECURITY FOR THE SERIES 2019 BONDS
Pledge of Net Revenues
The Series 2019 Bonds and all other Outstanding Bonds and the interest on the Series 2019 Bonds and all other Outstanding Bonds are payable solely from and are secured by a pledge of the Net Revenues of the Port Authority Properties. The security for the Series 2019 Bonds and all other Outstanding Bonds does not include any mortgage or lien or any security interest in any of the Port Authority Properties.
“Net Revenues” are defined in the Trust Agreement as the amount of the excess of the Revenues of the Port Authority Properties over the total of the Current Expenses of the Port Authority Properties. “Revenues” are defined in the Trust Agreement as all monies received or earned by the County for the use of, and for the services and facilities furnished by, the Port Authority Properties and all other income derived by the County from the operation or ownership of said Port Authority Properties, including any ground rentals for land on which buildings or structures may be constructed, whether such buildings or structures shall be financed by Bonds issued under the provisions of the Trust Agreement or otherwise, and Hedge Receipts. “Revenues” do not, however, include any monies received as a grant or gift from the United States of America or the State of Florida (the “State”) or any department or agency of either of them or any monies received from the sale of property. “Current Expenses” are defined in part as the County’s reasonable and necessary current expenses of maintenance, repair and operation of the Port Authority Properties and shall include, without limiting the generality thereof, amounts payable to any bank or other financial institution for the issuance of a Credit Facility, Liquidity Facility or Reserve Facility, but shall not include any reserves for extraordinary maintenance or repair, or any allowance for depreciation, or any Hedge Obligations or Hedge Charges. See “APPENDIX C – SUMMARY OF CERTAIN PROVISIONS OF THE TRUST AGREEMENT.”
For purposes of the Trust Agreement, unless otherwise provided by resolution of the Board, the proceeds of PFCs are excluded from the definition of Revenues and therefore are not included in Net Revenues and are not pledged to the payment of the Bonds. The Board has not provided by resolution for the PFCs to be part of Revenues. The County, however, has previously utilized a portion of the PFCs to pay debt service on Bonds and may, in its discretion, elect to do so in the future. See “– Rate Covenant” under this caption.
In addition, the amounts held under the Trust Agreement in the Construction Fund, the Revenue Fund, the Sinking Fund (including the Bond Service Account, the Reserve Account and the Redemption Account), the Reserve Maintenance Fund and the Improvement Fund are pledged to secure holders of the Bonds, subject to certain limitations provided in the Trust Agreement.
THE SERIES 2019 BONDS WILL BE SPECIAL, LIMITED OBLIGATIONS OF THE COUNTY PAYABLE SOLELY FROM A PLEDGE OF NET REVENUES DERIVED FROM THE PORT AUTHORITY PROPERTIES, INCLUDING THE OPERATION OF THE AIRPORT AND CERTAIN OTHER MONIES. THE SERIES 2019 BONDS WILL BE SECURED ON A PARITY BASIS WITH THE COUNTY’S OUTSTANDING BONDS UNDER THE TRUST AGREEMENT. NEITHER THE FAITH AND CREDIT OF THE STATE OF FLORIDA OR THE COUNTY NOR THE FAITH AND CREDIT OF ANY AGENCY OR POLITICAL SUBDIVISION OF THE STATE OF FLORIDA OR THE COUNTY ARE PLEDGED TO THE PAYMENT OF THE PRINCIPAL OF OR INTEREST ON THE SERIES 2019 BONDS. THE ISSUANCE OF THE SERIES 2019 BONDS SHALL NOT DIRECTLY, INDIRECTLY OR CONTINGENTLY OBLIGATE THE STATE OF

9
FLORIDA OR THE COUNTY OR ANY AGENCY OR POLITICAL SUBDIVISION OF THE STATE OF FLORIDA OR THE COUNTY TO LEVY ANY TAXES FOR THE PAYMENT OF THE SERIES 2019 BONDS OR TO MAKE ANY APPROPRIATION FOR THEIR PAYMENT EXCEPT FROM THE NET REVENUES AND CERTAIN OTHER MONIES PLEDGED TO THE PAYMENT OF THE SERIES 2019 BONDS UNDER THE TRUST AGREEMENT.
Rate Covenant
The County has covenanted in the Trust Agreement that it will at all times fix, charge and collect rates and charges for the use of and for the services and facilities furnished by the Port Authority Properties, and that from time to time, and as often as it shall appear necessary, it will revise such rates and charges as may be necessary or proper, in order that the Revenues will at all times be sufficient (the “Rate Covenant” or the “Rate Covenant Requirement”):
(i) to provide funds for the payment of Current Expenses;
(ii) to provide for making the deposits to the Reserve Maintenance Fund of the amounts recommended by the Consulting Engineers under the Trust Agreement; and
(iii) to provide for (a) making deposits to the Sinking Fund (other than the Reserve Account) in each 12-month period ending September 30th (each, a “Fiscal Year”) of an amount not less than 120% of the Principal and Interest Requirements for such Fiscal Year on account of the Bonds of each Series then Outstanding and (b) making deposits required to be made during such Fiscal Year into the Reserve Account and/or payments required to be made during such Fiscal Year to providers of Reserve Facilities in connection with draws under such facilities.
Consistent with the terms of the Airline Use Agreement, as described below, the County includes a portion of the monies remaining in the Improvement Fund at the end of each Fiscal Year as “Revenues” in the following Fiscal Year for the purposes of satisfying the Rate Covenant Requirement. This inclusion may affect the actual amount that the County must collect in Revenues in any given year to comply with the Rate Covenant as well as the charges to be set and collected under the Airline Use Agreement. See “AVIATION DEPARTMENT FINANCIAL INFORMATION – PORT AUTHORITY PROPERTIES HISTORICAL OPERATING RESULTS.”
The County also has the ability to deposit funds from non-Revenue sources (e.g., PFCs) directly into the Bond Service Account and the Redemption Account to reduce the Principal and Interest Requirements for purposes of meeting the Rate Covenant (i.e., the dollar amount of debt service that the Rate Covenant requires to be covered each year with the 20% coverage factor). As discussed in the next paragraph, in the past, the County has deposited substantial amounts derived from PFCs into the Bond Service Account and may choose to do so in the future to the extent of debt service attributable to eligible projects that may be paid for with PFCs. Such deposits effectively reduce the total amount of Revenues that must be collected each year to comply with the Rate Covenant.
The Aviation Department deposited $54,500,000, $55,000,000, $53,000,000, $63,000,000 and $58,000,000 of PFCs into the Bond Service Account for Fiscal Years 2014 through 2018, respectively. On October 4, 2018, the Aviation Department transferred $55,000,000 in PFC revenues to the Sinking Fund for payment of Fiscal Year 2019 Principal and Interest Requirements. The Aviation Department plans to continue to make such deposits in the future, although the amount may vary depending on numerous factors at the time the budget is prepared. To the extent such PFC amounts or other Revenues are not available for deposit into the Bond Service Account, airline rates and charges under the Airline Use Agreement would be increased to make up the difference, which would result in an increase in the airlines’ costs per enplaned passenger. For Fiscal Years 2014 through 2018, the airlines’ costs per enplaned passenger were $20.56, $19.93, $19.85, $19.83 and $19.20, respectively. The Aviation Department’s forecasted cost per enplaned passenger for Fiscal Year 2019 is $19.87. See “FUNDING SOURCES FOR CAPITAL PROJECTS – Passenger Facility Charges.” See “APPENDIX D – SUMMARY OF CERTAIN PROVISIONS OF THE 2018 AIRLINE USE AGREEMENT AND THE PREFERENTIAL GATE USE AGREEMENT” for additional information on the airlines’ costs per enplaned passenger.

10
The Trust Agreement provides that the County may enter into new leases or other agreements or contracts for the use of services or facilities of the Port Authority Properties on such terms and for such periods of time as the County shall determine to be proper, provided that the rents, fees and charges applicable thereto shall not be less than those prevailing for similar services or facilities on the date of execution of the Trust Agreement, unless approved by the Traffic Engineers.
The County has also covenanted in the Trust Agreement that any leases or other agreements entered into after November 1, 1985 for the use of any services or facilities of the Port Authority Properties shall contain a provision (the “rental adjustment provision”) to the effect that if a court of competent jurisdiction shall determine that any of the rentals, fees or other charges (the “rental charges”) imposed by the County under such leases or agreements, or under leases or other agreements for the use of similar services or facilities of the Port Authority Properties, are unjustly discriminatory, the County shall have the right to increase or otherwise adjust the rental charges imposed by any leases or other agreements containing the rental adjustment provision in such manner as the County shall determine is necessary and fair so that such rental charges shall not thereafter be unjustly discriminatory, nor shall any such rental adjustment diminish rental income to such an extent as to prevent the County from meeting its covenants under the Trust Agreement or from adhering to its representations made in any official statement distributed in connection with any Bonds issued under the Trust Agreement after November 1, 1985. Any such rental adjustment provision may also provide that in the event of a substantial upward adjustment in the rental charges pursuant to said provision, the lessee or other user of such services or facilities shall have the right to terminate such lease or other agreement by 60 days’ written notice given to the County within one year of the effective date of such upward adjustment.
See “– Funds and Flow of Funds” under this caption for a description of the priority of monthly deposits to the Sinking Fund and the Reserve Maintenance Fund.
Airline Use Agreement
Introduction
The Airline Use Agreement (the “AUA”) is the primary document between the County and the airlines operating at the Airport (the “Airlines”) that identifies the Airlines’ rights and obligations for their use of MIA. The AUA (1) sets forth (a) the County’s operating policies such as gate and ticket counter assignments and ground and cargo handling regulations, (b) the mechanism for the Airlines’ approval of capital improvement projects for the Airport System, and (c) the rates and charges methodologies that apply to the calculation of landing fees, terminal building rental rates and aviation fees, and (2) confirms the Airlines’ acceptance of the landing fees being determined under the Airport System residual methodology, which assures collection of revenues sufficient to meet the 120% bond coverage requirement.
The Aviation Department and the Airlines recently negotiated a new AUA called the “2018 AUA,” whose terms will extend for approximately fifteen years, expiring on April 30, 2033. The 2018 AUA was approved by the Board of County Commissioners at its July 24, 2018, meeting and became effective August 10, 2018. As of March 2019, 89% of the 90 scheduled air carriers operating at the Airport have executed the 2018 AUA and are Signatory Airlines.
2018 AUA
The 2018 AUA obligates the Signatory Airlines to pay landing fees (“Landing Fees”) and other charges including specifically those required to meet the Rate Covenant Requirement under the Trust Agreement or any successor financing document, for so long as Signatory Airlines operate at the Airport or any other airport in the Airport System or until a new airline use agreement is adopted, whichever is earlier. In addition, each Signatory Airline has consented to the Airport System residual methodology for calculation of Landing Fees, and a cost-based, equalized rate setting methodology for calculating rents and user fees for the use of facilities, equipment and services at the Airport’s terminal building (the “Terminal Building”). See “Landing Fee Calculation and Payment” and “Terminal Rents and User Fees” under this caption.

11
The 2018 AUA requires the Aviation Department to consult with the Miami Airport Affairs Committee (the “MAAC”) to review Capital Projects for the Airport System. The MAAC is composed of at least eleven (11) Signatory Airlines drawn from the highest thirty-five (35) airlines by landed weight at MIA, each of which must be in good standing under the 2018 AUA. The MAAC must use best efforts to include at least one European passenger airline, one Caribbean/Central American passenger airline, one South American passenger airline, one cargo airline, and one regional airline, even if any such airlines are not among the top 35 Signatory Airlines by landed weight, and any Signatory Airline among the top 10 airlines on the Aviation Department’s landed weight list for the prior year if the Signatory Airline requests to be a member. Any otherwise eligible MIA airline may request the MAAC to permit such airline to be a MAAC member, and the MAAC shall give due consideration to such request. In no event shall the MAAC be required to have more than twenty-one (21) members.
The 2018 AUA also provides that the MAAC’s review is either (1) a disapproval review of those Capital Projects required to be reviewed by the MAAC through a majority-in-interest of the MAAC members (an “MII” decision) or else (2) when the Airport’s annual projection of airline costs per enplaned passenger exceeds $35.00 (in 2018 dollars) in six or more years of the 10-year projection period, a moratorium is placed on Capital Projects that may nonetheless be completed by the Aviation Department if (a) the MAAC fails to disapprove a project through the MII process during a moratorium upon submission of the project for the MAAC’s review, or (b) after a drop in the airline cost per enplaned passenger, the project is approved by the Board. The MII review and disapproval process is described in “APPENDIX D – SUMMARY OF CERTAIN PROVISIONS OF THE 2018 AIRLINE USE AGREEMENT AND THE PREFERENTIAL GATE USE AGREEMENT.”
As part of the 2018 AUA, each Signatory Airline has agreed that the MAAC will represent the interests of all airlines operating at the Airport in making decisions required by the 2018 AUA and that any decision of the MAAC made through the MII process will be binding on all Signatory Airlines. An MII decision is a decision made by a combination of Signatory Airlines in good standing with the MAAC that (1) are not less than 51% in number of the then existing MAAC members and (2) collectively with their Affiliated Airlines (as defined in the 2018 AUA) represent more than 25% of the total landed weight for which Landing Fees were paid during the previous Fiscal Year by all such Signatory Airlines and any of their Affiliated Airlines.
The 2018 AUA contains two significant changes from the previous AUA: (i) the parties agreed that Signatory Airlines would have the right to use certain gates on a preferential use basis, and (ii) beginning in Fiscal Year 2020, all fees associated with international arriving passengers would be charged under an international use rate, so that only carriers with international arriving passengers that utilize the Federal Inspection Services (“FIS”) facility will pay for the terminal space costs related to the international arriving facilities. The costs related to the latter change were previously recovered through the basic Concourse Use Fee charged to all arriving and departing aircraft seats at MIA.
Regarding preferential use gates, the 2018 AUA confirms the long-standing policy of the County that all gates at the Airport—whether used on a common use basis or a preferential use basis—are not leased nor are they to be used on an exclusive basis. The Aviation Department alone has the right to determine which of the current 138 gates at MIA are eligible for use on a preferential use basis, and the Aviation Department has initially determined that 77 of the 138 gates are so eligible, leaving 61 gates to be used on a common use basis. Of the 77 gates eligible for use on a preferential basis, 61 gates are at the North Terminal currently occupied by American Airlines, with the remaining 16 gates located throughout the other five concourses.
The 2018 AUA contains explicit qualification requirements for an airline’s eligibility for continued use of a preferential use gate, and provides specific procedures allowing the Aviation Department to recapture a preferential use gate that is not being sufficiently utilized by an airline. An airline having a preferential use gate is required to sign a Preferential Gate Use Agreement and to allow the Aviation Department to assign to airlines on a daily basis the use of the preferential use gate in the event the gate becomes available on any day. The Aviation Department retains its exclusive right to make the daily assignments of common use gates to the airlines.
Noted below is a table that highlights the major provision changes from the previous AUA to the 2018 AUA. Additional comparative information can be found in “APPENDIX A – REPORT OF THE TRAFFIC ENGINEERS.”

12
Major Changes in 2018 AUA
MAAC review process of capital projects—Majority-in-Interest (“MII”) decision is less restrictive. All projects submitted to the MAAC are deemed to be approved unless disapproved by an MII vote. Requires only a disapproval review for the various review levels, including a moratorium.
Gate usage—previously all MIA gates were utilized on a common use basis whereas the 2018 AUA will allow for preferential use gate assignment and usage based on certain operational qualifications. All non-preferentially used gates continue to be common use gates.
International Facility Fee—Aviation Department will not only recover costs for equipment and services specific to the FIS facilities at MIA on a per international arriving aircraft seat basis but will also recover the terminal space costs for the FIS facilities at MIA, which will no longer be recovered through the base Concourse Use Fee.
Base Concourse Use Fee—Aviation Department will charge for usage of common use gates to recover the holdroom and post-security circulation space costs on a per aircraft seat basis and charges for preferential use gates will be based on a per square foot cost for the holdroom space and a portion of the post-security circulation space.
All other Aviation Fees—Aviation Department will recover costs related to certain areas of the terminal (baggage claim, security screening and outbound baggage makeup) on a per arriving or departing aircraft seat basis with the only change being that the terminal space costs related to the area used for passenger and employee security screening are added to the Security Screening Fee and no longer recovered through the base Concourse Use Fee.
As part of executing the new 2018 AUA, the Federal Aviation Administration (the “FAA”) requires the Aviation Department to submit to the FAA an “Updated Competition Plan” to “demonstrate how the Aviation Department will provide for new entrant access and expansion by incumbent carriers at MIA.” The Aviation Department submitted its Updated Competition Plan to the FAA, which was approved by the FAA in September 2018. Under federal law, an airport is required to have a Competition Plan as a condition to (i) the FAA’s approval of the collection or use of any new passenger facility charges imposed at the Airport and (ii) the FAA’s award to the Aviation Department of any FAA grant funds.
Aviation Capital Account and Sub-Accounts
Under the previous AUA, the Aviation Department created the Aviation Capital Account and its two sub-accounts, the Retainage Sub-Account and the Performance Sub-Account. The initial setup provided that the Retainage Sub-Account be funded annually in an amount up to $5,000,000 from monies in the Improvement Fund, subject to a maximum cumulative balance of $15,000,000. The 2018 AUA contains similar requirements but with increased maximum annual contributions and cumulative balance amounts of $7,600,000 and $28,800,000, respectively. Both of these amounts are subject to adjustment annually up or down by the percentage change in the U.S. Bureau of Labor Statistics Consumer Price Index for All Urban Consumers for the Miami-Fort Lauderdale combined metropolitan service area with the third calendar quarter of 2018 to serve as the base time period. The Performance Sub-Account may be funded annually from monies in the Improvement Fund in an amount equal to 50% of the Revenues that exceed breakeven costs of the Cargo and Commercial Aviation Support Facilities (as defined in the 2018 AUA). There is no cap on the annual deposit to, or the balance in, the Performance Sub-Account.
As of December 31, 2018, the estimated balance in the Retainage Sub-Account was $27.2 million and the balance in the Performance Sub-Account was $10.3 million. Currently, these two sub-accounts in the Aviation Capital Account are held in the Improvement Fund and are subject to a lien in favor of holders of the Bonds. However, the Aviation Department has the option of maintaining these accounts outside of the Improvement Fund, and in such case, such monies will not be subject to a lien in favor of holders of the Bonds. The Aviation Department may use the monies in the Retainage Sub-Account and the Performance Sub-Account for any lawful aviation-related purposes. For instance, monies in the Retainage Sub-Account have been used to pay the Florida Department of Transportation State Infrastructure Bank loan as further described under “AVIATION-RELATED DEBT – Other Airport-Related Debt.”

13
Landing Fee Calculation and Payment
The 2018 AUA provides that the County establish a landing fee rate (the “Landing Fee Rate”) under a residual methodology as described in “APPENDIX D – SUMMARY OF CERTAIN PROVISIONS OF THE 2018 AIRLINE USE AGREEMENT AND THE PREFERENTIAL GATE USE AGREEMENT.” Based upon the proposed annual budget for the Port Authority Properties, the Aviation Department calculates the Landing Fee Rate to be effective each October 1st on the basis of estimated total landed weight for the annual period. Prior to the adoption of the budget by the Board, the Aviation Department will meet with the MAAC to review the proposed budget and the calculation of the Landing Fee Rate as stated in the 2018 AUA. The Landing Fee Rate may also be adjusted on April 1st of each year or to meet emergencies at any other time. The Landing Fee Rate is calculated so that the Net Revenues to be received by the County in each Fiscal Year, after deducting required deposits to the Reserve Maintenance Fund, will not be less than 120% of the maximum Principal and Interest Requirements for such Fiscal Year (or not less than whatever other applicable percentage amount may be established in the Trust Agreement or any other successor trust indenture entered into by the County) on account of Bonds Outstanding under the Trust Agreement and adjusted as may be necessary to meet the requirements and obligations on account of all other Airport System indebtedness (including any commercial paper, interest rate swap agreements, and subordinated debt).
As set forth in the 2018 AUA, an airline will pay 100% of the Landing Fee Rate and certain aviation use fees (collectively the “Aviation Fees”) during the initial ninety-day period and if it has not both signed the 2018 AUA and qualified for the Aviation User Credit Program (“AUCP”) within the ninety-day period, the Airline must pay 110% during a second ninety-day period retroactive to the effective date of the 2018 AUA or its first day of service. If the Airline fails to both sign the 2018 AUA and qualify for the AUCP within the second ninety-day period, the Airline must pay 150% of the fees, retroactive to the effective date of the 2018 AUA or the Airline’s first day of service. Under the 2018 AUA, all AUCP fees are due by the 15th calendar day of the following month. Any airline, however, whether a Signatory or Non-Signatory Airline under the 2018 AUA that does not participate in the AUCP or fails to comply with the terms of the AUCP, is required to pay 150% of Aviation Activities Fees in cash or its equivalent each time it uses the Airport facilities. A copy of the 2018 AUA is available upon request from the Aviation Department, and a summary of certain provisions of the 2018 AUA is contained in “APPENDIX D – SUMMARY OF CERTAIN PROVISIONS OF THE 2018 AIRLINE USE AGREEMENT AND THE PREFERENTIAL GATE USE AGREEMENT.”
Terminal Rents and User Fees
The Terminal Building includes space leased exclusively by airlines for uses such as ticket counters, offices, passenger lounges and VIP clubs, but the majority of the space within the Terminal Building constitutes common use or preferential use space, including concourses and passenger hold rooms. An airline using either exclusive use space, preferential use or common use space in the Terminal Building must pay rents and user fees calculated in accordance with the methodology established by resolution of the Board. Consistent with the cost-based, equalized rate setting methodology mentioned above, the Aviation Department uses a blended or equalized rate approach for determining terminal rents and user fees. This means that each airline pays the same rate for a particular class of property regardless of its location within the Terminal Building. Under the 2018 AUA, the holdroom area associated with a preferential use gate will be charged on a per square foot basis to the carrier with the preferential use rights to the gate along with a proportionate share of post-security passenger circulation space.
Airlines requiring exclusive use space in the Terminal Building have entered into separate five-year Terminal Building Lease Agreements (“TBLAs”) covering their rights and obligations regarding the use of such space. Each TBLA grants the tenant two lease rights: (1) the general right to occupy undesignated space in the Terminal Building that is appropriate for the airline tenant’s aeronautical needs, and (2) the airline’s specific right to lease the designated Terminal Building premises identified in the TBLA. The TBLA is on a month-to-month term not to exceed five years for the specifically designated portion of the Terminal Building, with either party having the right to cancel the lease for such specific space on 30 days’ notice. The month-to-month lease term for specifically identified Terminal Building space permits the Airport and the airline tenant to have maximum flexibility by permitting the airline to increase, decrease or abandon its leased space area depending on the airline’s operating-requirements, and by allowing the Airport to relocate the airline to a different location if the Airport’s needs require it. As a result, under both the terms of the TBLA that allow an airline to terminate the lease on 30 days’ notice and

14
the terms of the 2018 AUA that obligates an airline to pay landing and Aviation Fees only for so long as it uses the Airport, an airline may discontinue its operations at the Airport without substantial financial penalty.
Reserve Account
The Trust Agreement provides for the maintenance of a common Reserve Account to secure payment of all Bonds Outstanding under the Trust Agreement and requires the County to make deposits to the Reserve Account until the amounts on deposit therein (including amounts available under any Reserve Facilities) equal one-half of the maximum annual Principal and Interest Requirements for any Fiscal Year thereafter on all Bonds then Outstanding (the “Reserve Account Requirement”). The Trust Agreement further provides that upon the delivery of Additional Bonds, the increase, if any, in the Reserve Account Requirement may be funded from proceeds of such Additional Bonds or from monthly deposits to the Reserve Account, which are required to be made in an amount equal to 1/60th of the Reserve Account Requirement, until the Reserve Account Requirement is met. If the required deposit to the Reserve Account is being satisfied by the reinstatement of any amount drawn under a Reserve Facility, the Trust Agreement requires the County to pay to the provider thereof such amount as shall be required to cause the provider to reinstate no less than the required deposit for such month.
Notwithstanding the foregoing, in lieu or in satisfaction of any required deposit into the Reserve Account or in substitution for all or a portion of the amounts on deposit, the County may cause to be deposited into the Reserve Account a Reserve Facility for the benefit of the holders of the Bonds, provided that prior to the deposit of a Reserve Facility into the Reserve Account, the Board shall adopt a resolution fixing, or providing for the fixing of, all details with respect to such Reserve Facility and draws thereunder. Any such Reserve Facility shall be available to be drawn (upon the giving of notice as required thereunder) on any payment date on which a deficiency exists for payment of the Bonds, which deficiency is payable from the Reserve Account and which cannot be cured by monies in the Reserve Account or any other Fund or Account held pursuant to the Trust Agreement and available for such purpose. If any such Reserve Facility is substituted for monies on deposit in the Reserve Account, the excess monies in the Reserve Account shall be applied to satisfy any deficiency in any of the Funds and Accounts, and any remaining balance shall be deposited with the Trustee to the credit of the Improvement Fund. If a disbursement is made from a Reserve Facility, the County shall be obligated, in accordance with the provisions of the Trust Agreement, to either (i) reinstate such Reserve Facility, (ii) deposit monies in the Reserve Account, or (iii) undertake a combination of such alternatives. See “– Funds and Flow of Funds” below.
In the event the Reserve Account is at any time funded with more than one Reserve Facility, any required draw under such Reserve Facilities shall be made on a pro-rata basis; provided, however, that if at the time of such draw the Reserve Account is only partially funded with one or more Reserve Facilities, prior to drawing on such facilities, there shall first be applied any cash and securities on deposit in the Reserve Account and, if after such application a deficiency exists, the Trustee shall make up the deficiency by drawing on such facilities as provided in this paragraph. Amounts drawn or paid under a Reserve Facility shall be reimbursed to the provider in accordance with the terms and provisions of the reimbursement or other agreement governing such facility entered into between the County and such provider.
The Trust Agreement requires that any Reserve Facility must be with a provider rated on the date of deposit of such facility into the Reserve Account in one of the two highest rating categories (without regard to any gradations in such categories) of a nationally recognized rating agency (the “Threshold”). Upon the issuance of the Series 2019 Bonds, the Reserve Facilities remaining on deposit in the Reserve Account that are below the Threshold (the “Deficient Reserve Facilities”) will be excluded from the calculation of the Reserve Account Requirement until such Deficient Reserve Facilities are upgraded to the Threshold. In the event such Deficient Reserve Facilities meet the Threshold, the County shall withdraw cash from the Reserve Account to the extent of any excess above the Reserve Account Requirement. Such excess shall be transferred by the Trustee to the credit of the Redemption Account or withdrawn by the Trustee and deposited with the Co-Trustee to the credit of the Improvement Fund as may be specified in a certificate signed by the Aviation Director and filed with the Trustee and the Co-Trustee in accordance with the Trust Agreement.
Upon the issuance of the Series 2019 Bonds and the refunding of the Refunded Bonds, the Reserve Account Requirement for all Bonds Outstanding is $197,941,513. The actual amounts and the values of Reserve Facilities credited to the Reserve Account Requirement are set forth in the table below, together with cash and investments held in the Reserve Account in order to meet the Reserve Account Requirement.

15
Reserve Account Surety Policies and Cash and Investments Held to Meet Reserve Account Requirement
as of May 8, 2019
Provider Expiration Date Surety Amount
Value Credited to the Reserve Account
Requirement Assured Guaranty Municipal Corp. 10/1/2036 $15,126,564 $ 15,126,564 Financial Guaranty Insurance Corporation (1) 10/1/2035 7,156,087 0 MBIA Insurance Corporation (1) 10/1/2024 6,763,108 0 Financial Guaranty Insurance Corporation (1) 10/1/2037 6,897,438 0 CIFG Assurance North America, Inc. (2) 10/1/2038 3,332,670 3,332,670 Syncora Guarantee, Inc. (1) 10/1/2040 8,278,287 0 Assured Guaranty Corp. 10/1/2038 6,802,095 6,802,095 Assured Guaranty Municipal Corp. 10/1/2041 8,836,139 8,836,139 Total Value Credited to the Reserve Account
Requirement (1)
$ 34,097,468Cash and Market Value of Investments 161,367,777 Total Coverage $195,465,245Additional Series 2019A Deposit 2,476,268 Total $197,941,513 (1) The value of the Reserve Facilities provided by Financial Guaranty Insurance Corporation, MBIA Insurance Corporation and Syncora
Guarantee, Inc. has been excluded from the total value of the Reserve Facilities credited to the Reserve Account Requirement due to such providers’ credit ratings falling below the required Threshold. As a result, the aggregate value credited to the Reserve Account Requirement from Reserve Facilities as of the date of this Official Statement, is $34,097,468.17, rather than the aggregate face amount of the Reserve Facilities of $63,192,387.80. However, the County still expects to draw on these surety policies, if necessary.
(2) On or about July 5, 2016, CIFG Holding Inc., the parent company of CIFG Assurance North America, Inc. merged with and into Assured Guaranty Corp. As a result, the referenced Reserve Facility is now a direct insurance obligation of Assured Guaranty Corp. and is included in the total value of the Reserve Facilities credited to the Reserve Account Requirement, as the credit rating of Assured Guaranty Corp. is above the required Threshold.
Monies on deposit to the credit of the Reserve Account shall, as nearly as may be practicable, be invested and reinvested by the Trustee, at the direction of the County, in Authorized Investments which shall mature, or which shall be subject to redemption by the holder thereof at the option of such holder, not later than 15 years after the date of such investment.
Issuance of Additional Bonds
The County may issue aviation revenue bonds under Section 210 of the Trust Agreement, on a parity basis with Bonds Outstanding under the Trust Agreement, at any time or times for the purpose of, among other things, paying all or part of the cost of any additional Improvements or Projects or any portions thereof, including the payment of any notes or other obligations of the County or the repayment of any advances made from any source to temporarily finance such cost (“Additional Bonds”). Such Additional Bonds may not be issued unless, among other things:
(i) the proceeds (excluding accrued interest) of such Additional Bonds to be applied to the cost of the Improvements or Project or portions thereof to be financed in whole or in part by the issuance of such Additional Bonds, at the purchase price to be paid therefor, together with the other funds which have been or will be made available for such purpose as set forth in the certificate of the Aviation Director required by the Trust Agreement, shall be not less than the total cost of the Improvements or Project or portions thereof to be financed in whole or in part by the issuance of such Additional Bonds as estimated by the Consulting Engineers in the statement required by the Trust Agreement, and
(ii) either, (a) the percentage derived by dividing (1) the amount of Net Revenues (which may be adjusted as described in the Trust Agreement) for any period of 12 consecutive calendar months selected by the County out of the 18 calendar months immediately preceding the date of the certificate of

16
the Aviation Director required by the Trust Agreement by (2) the largest amount of the Principal and Interest Requirements for any succeeding Fiscal Year on account of all Bonds previously issued under the Trust Agreement and then outstanding and the Additional Bonds then requested to be authenticated and delivered shall not be less than 120%, or (b) the percentage derived by dividing (1) the amount of annual Net Revenues in each of the five Fiscal Years immediately following the date of a statement of the Traffic Engineers estimating the annual Net Revenues for the applicable five Fiscal Years or, if interest on the Additional Bonds then requested to be authenticated and delivered is to be paid from proceeds of such Additional Bonds, in each of the five Fiscal Years immediately following the last date on which interest on such Additional Bonds is to be paid from proceeds of such Additional Bonds, by (2) the amount of Principal and Interest Requirements for each of such Fiscal Years, shall not be less than 120%, and
(iii) the amount to the credit of the Reserve Account in the Sinking Fund (including amounts available under any Reserve Facilities) shall be not less than the amount then required to be on deposit to the credit of the Reserve Account under the Trust Agreement.
The County may issue Additional Bonds under the Trust Agreement for completion of a Project being financed by a Series of Bonds without satisfying the above described financial test if proceeds of such Series of Bonds issued for such Project are insufficient to complete such Project. See “APPENDIX C – SUMMARY OF CERTAIN PROVISIONS OF THE TRUST AGREEMENT – Issuance of Additional Bonds” for a more complete discussion of the issuance of Additional Bonds.
Issuance of Refunding Bonds
The County may issue aviation revenue bonds under Section 211 of the Trust Agreement payable on a parity basis with Bonds Outstanding under the Trust Agreement to refund all or a portion of the Bonds of any Series Outstanding under the Trust Agreement or certain other obligations (the “Refunding Bonds”). Conditions for the issuance of Refunding Bonds include, among others, a requirement that either: (1) the total Principal and Interest Requirements for the Refunding Bonds during their term is less than the total Principal and Interest Requirements for the bonds to be refunded during their term; (2) the percentage derived by dividing (a) the Net Revenues for the relevant Computation Period by (b) the maximum amount of Principal and Interest Requirements for any succeeding Fiscal Year on account of all aviation revenue bonds theretofore issued under the provisions of the Trust Agreement and then Outstanding (other than refunded bonds) and the proposed Refunding Bonds, as set forth in a certificate of the Aviation Director, approved by the Traffic Engineers as to (a) above to the extent of any adjustment to Net Revenues and approved by the Trustee as to item (b) above, shall not be less than 120%; or (3) the percentages derived by dividing (a) the estimated amount of annual Net Revenues in each of the five Fiscal Years immediately following delivery of the Refunding Bonds (such Net Revenues to be determined from the Revenues and Current Expenses as estimated by the Traffic Engineers in a statement signed by the Traffic Engineers) by (b) the amount of the Principal and Interest Requirements for each of such five Fiscal Years on account of all aviation revenue bonds theretofore issued under the provisions of the Trust Agreement and then Outstanding (other than the refunded bonds) and the proposed Refunding Bonds, as set forth in a certificate of the Aviation Director, shall not, in each such year, be less than 120%. See “APPENDIX C – SUMMARY OF CERTAIN PROVISIONS OF THE TRUST AGREEMENT – Issuance of Refunding Bonds” for a more complete discussion of the requirements for the issuance of Refunding Bonds.
The Series 2019B Bonds are being issued as Refunding Bonds under the Trust Agreement.
Funds and Flow of Funds
The Trust Agreement provides for the following funds and accounts:
(i) Construction Fund;
(ii) Revenue Fund;
(iii) Sinking Fund, including Bond Service Account, Reserve Account and Redemption Account;

17
(iv) Reserve Maintenance Fund; and
(v) Improvement Fund.
The amounts held in such Funds and Accounts are pledged to secure the holders of the Bonds.
The Trust Agreement provides for all Revenues to be collected by the County and deposited with the Co-Trustee to the credit of the Revenue Fund and to be held, invested and disbursed in accordance with the Trust Agreement.
Monies in the Revenue Fund are to be applied first to the payment of Current Expenses as the same become due and payable in accordance with the Annual Budget for each Fiscal Year, subject to covenants of the County in the Trust Agreement that such expenditures are incurred in maintaining, repairing and operating Port Authority Properties.
After paying such Current Expenses each month and after reserving in the Revenue Fund an amount not to exceed 20% of the Current Expenses for the current Fiscal Year as shown in the Annual Budget (it being noted that the County complies with the provision by currently budgeting 16% of its budgeted Current Expenses as an Operating Reserve), the Co-Trustee shall, on the 20th day of each month, cause the balance of monies in the Revenue Fund to be remitted to the Trustee and/or deposited to the credit of the following Accounts or Funds in the following order:
(i) to the credit of the Bond Service Account in the Sinking Fund held by the Trustee, an amount equal to 1/6th of the amount of the next interest payment on all Bonds Outstanding and (beginning with the twelfth month preceding the first maturity of any serial bond of a Series) an amount equal to 1/12th of the next maturing installment of principal of such serial bonds;
(ii) to the credit of the Redemption Account in the Sinking Fund held by the Trustee, an amount equal to 1/12th of the Amortization Requirement, if any, for such Fiscal Year for any term bonds then Outstanding, plus an amount equal to 1/12th of the premium, if any, which would be payable on the redemption date with respect to such Amortization Requirement if such principal amount of bonds should be redeemed on such date from monies in the Sinking Fund;
(iii) to the credit of the Reserve Account in the Sinking Fund held by the Trustee, an amount equal to 1/60th of the Reserve Account Requirement until the Reserve Account Requirement (including amounts available under any Reserve Facilities) is met;
(iv) to the credit of the Reserve Maintenance Fund held by the Co-Trustee, the amount required during such Fiscal Year to equal the recommendation of Consulting Engineers in the report following inspection of the Port Authority Properties or such greater amount as directed by the Aviation Director, or by amendment to the Annual Budget, to pay for all or part of the cost of unusual or extraordinary maintenance or repairs, renewals and replacements, the cost of replacing equipment and premiums on insurance required under the Trust Agreement; and
(v) to the credit of the Improvement Fund held by the Co-Trustee, the balance, if any, of monies in the Revenue Fund after the aforementioned required deposits to the Bond Service Account, the Redemption Account, the Reserve Account and the Reserve Maintenance Fund, unless the County by resolution directs the Trustee to deposit all or part of such balance from the Revenue Fund to the credit of the Redemption Account.
If the amount so deposited in any month to the credit of any Account mentioned in clauses (i), (ii), and (iii) above shall be less than the required amount, the requirement therefor shall nevertheless be cumulative and the amount of any deficiency in any month shall be added to the amount otherwise required to be deposited to the credit of any such Fund or Account in each month thereafter until such time as such deficiency shall be made up. See “APPENDIX C – SUMMARY OF CERTAIN PROVISIONS OF THE TRUST AGREEMENT.”

18
The chart below summarizes the application of Revenues under the Trust Agreement.
Revenue Fund Depository for all Revenues of Port Authority Properties (including the retention at all times of a Reserve of 20%* of the budgeted current annual expenses to be held as an operating reserve)
Pay Current Expenses
Sinking Fund – Bond Service Account Satisfy interest requirements to be paid for all Bonds and principal requirements of serial Bonds**
Sinking Fund – Redemption Account Satisfy the Amortization Requirements, if any, for term Bonds, plus the amount of premium, if any, payable on such Bonds**
Sinking Fund – Reserve Account Establish and maintain a balance of 1/2 of the maximum Principal and Interest Requirements for any future Fiscal Year
Reserve Maintenance Fund Deposit the amount recommended by the Consulting Engineers for paying all or part of the cost of unusual or extraordinary maintenance or repairs, renewals and replacements, the costs of replacing equipment and premiums on insurance required under the Trust Agreement
Improvement Fund Provide monies for any Airport or Airport-related purpose, including the payment of the Double-Barreled Bonds, the redemption of Bonds and payment of interest on any outstanding CP Notes***
Note: * The Trust Agreement authorizes the Board to designate a lesser percentage by resolution. Currently, the Board budgets 16% of the budgeted current expenses as an operating reserve.
** Requirements payable from Revenues may be reduced to the extent such requirements are satisfied from other sources outside the Trust Agreement (e.g., PFCs) set aside and deposited into the Bond Service Account or Redemption Account for such purpose.
*** Certain monies are transferred annually from the Improvement Fund to the Revenue Fund pursuant to the terms of the 2018 AUA. Such transferred deposits to the Revenue Fund are treated as Revenues under the Trust Agreement. In addition, monies on deposit in the Aviation Capital Account of the Improvement Fund are used to pay debt service on the FDOT State Infrastructure Bank Loan.
CERTAIN INVESTMENT CONSIDERATIONS
Payment of the Series 2019 Bonds is dependent on the collection of Net Revenues in an amount sufficient to pay debt service on the Series 2019 Bonds and all other Outstanding Bonds. Net Revenues consist of all Revenues of the Port Authority Properties in excess of Current Expenses, all as defined in the Trust Agreement. Accordingly, payment of debt service on the Series 2019 Bonds depends on the sufficiency of Revenues generated by the Airport and other Port Authority Properties.
This section provides a general overview of certain investment considerations that should be taken into account, in addition to the other matters set forth in this Official Statement, in evaluating an investment in the Series 2019 Bonds and the sufficiency of the Revenues expected to be generated by the Airport and other Port Authority Properties. This section is not meant to be a comprehensive or definitive discussion of the risks associated with an investment in the Series 2019 Bonds, and the order in which this information is presented does not necessarily reflect the relative importance of the investment considerations. Potential investors in the Series 2019 Bonds are advised to consider the following factors, among others, and to review this entire Official Statement to obtain

19
information essential to the making of an informed investment decision. Any one or more of the investment considerations discussed below, among others, could lead to a decrease in the market value and/or the marketability of the Series 2019 Bonds. There can be no assurance that other investment considerations not discussed herein will not become material in the future.
Factors Affecting Air Transportation Industry
The generation of Revenues is heavily dependent on the volume of the commercial flights, the number of passengers, and the amount of cargo processed at the Airport. All three are dependent upon a wide range of factors including: (1) local, national and international economic conditions, including international trade volume, (2) regulation of the airline industry, (3) passenger reaction to disruptions and delays arising from security concerns and government shutdowns, (4) airline operating and capital expenses, including security, labor and fuel costs, (5) environmental regulations, (6) the capacity of the national air traffic control system, (7) currency values and (8) world-wide infectious diseases (e.g., Ebola and SARS). The airline industry has faced and will continue to face economic challenges, reflecting both increased costs and overall economic conditions. As a result, airlines have faced major financial losses and, in some cases, bankruptcy. See “CERTAIN INVESTMENT CONSIDERATIONS – Airline Economic Considerations—Airline Bankruptcies.” Increased costs and other factors arising from the September 11, 2001 terrorist attacks and related regulatory reaction are discussed separately below in “Security Requirements.” Other particular factors are discussed below.
American Airlines
American Airlines is the predominant carrier at the Airport having served MIA as a hub carrier since 1989 when it purchased Eastern Airlines’ Latin American routes. Including the operation of American Eagle, American Airlines accounted for approximately 66.0% and 67.0% of the enplaned passengers at the Airport and approximately 37.5% and 37.1% of Airport revenues during the 12-month periods ended December 31, 2017 and December 31, 2018, respectively.
American Airlines was founded in 1930 as American Airways and renamed American Airlines in 1934. The company is the principal wholly-owned subsidiary of American Airlines Group Inc. (AAG), formerly known as AMR Corporation (“AMR”). American Airlines has hubs in Charlotte, Chicago, Dallas/Fort Worth, Los Angeles, Miami, New York, Philadelphia, Phoenix and Washington, D.C. As of the end of 2018, American Airlines operated 956 mainline aircraft and 595 regional aircraft. American Airlines is supported by AAG’s wholly-owned regional airline subsidiaries and third-party regional carriers operating as American Eagle and together offer an average of nearly 6,700 flights daily to nearly 350 destinations in more than 50 countries. American Airlines is a founding member of the oneworld® alliance, whose members and members-elect serve nearly 1,000 destinations with 14,250 daily flights to over 150 countries. American Airline’s cargo division provides a wide range of freight and mail services, with facilities and interline connections available across the globe. In 2015, American Airlines Group Inc. topped Fortune magazine’s list of best business turnarounds and its stock (NASDAQ: AAL) joined the S&P 500 index.
The following information regarding American Airlines’ financial results of operations has been derived from AAG’s filings with the SEC, including its filing on Form 10-K of the audited financial results of AAG for the full year ended December 31, 2018. See “CONTINUING DISCLOSURE – Airline Disclosure.”
For the year ended December 31, 2018, AAG reported operating income of $2.7 billion versus $4.2 billion reported for the year ended December 31, 2017. In addition, as of December 31, 2018, AAG had approximately $7.6 billion in total available liquidity, consisting of unrestricted cash and short-term investments of $4.8 billion and $2.8 billion in undrawn revolving credit facilities, along with a restricted cash and short-term investments position of $154 million.

20
Airline Economic Considerations
Overview
The financial strength and stability of airlines serving the Airport will affect future airline traffic. For the last nine years, the U.S. airline industry has been moderately profitable, following 10 years of stagnation during which carriers accumulated combined losses of $50 billion. To mitigate such losses, U.S. carriers merged, reduced their route networks and flight schedules, and negotiated with employees, lessors, and vendors to cut costs. These mitigation tactics have often occurred within the context of the carriers’ Chapter 11 federal bankruptcy proceedings. In the last 10 -11 years, the mega-mergers have consisted of Delta and Northwest in 2008, Southwest and AirTran in 2010 and United and Continental in 2010. The most recent mega-merger is that between American Airlines and U.S. Airways in December 2013 and on a lesser scale, Virgin America and Alaska Airlines merged in 2018.
These mitigation measures have contributed to the return to industry profitability, as reflected in the realization of record profits in 2015. However, airline net profits in the U.S. were down just under $11 billion in 2016, bringing in $14.0 billion in 2016 compared to $24.8 billion in 2015. In 2017, the net profits increased to $15.5 billion, which is 10.2% over 2016. The U.S. Department of Transportation Bureau of Transportation Statistics released statistics that reported that both fuel and labor costs increased in 2017.
Largely as a result of consolidations, U.S. scheduled air carriers’ overall domestic capacity, as measured by available seat miles, declined 10.3% from 2007 to 2009 with the 2007 measurement as the high and the 2009 measurement as the low. By 2015, domestic capacity by U.S. scheduled carriers had recovered back to the 2007 level and by October 2018 domestic capacity had increased to 14.1% above 2007, as measured by available seat miles. By comparison, international capacity for U.S. air carriers has increased 19.3% between 2007 and October 2018, as measured by available seat miles.
The volatility in jet fuel prices, which track just above crude oil prices, has significantly affected airlines’ operating costs over the last 11 years. The price of jet fuel peaked in the second quarter of 2008 to just below $180.00 per barrel, as contrasted with the world price of $77.69 per barrel as of February 1, 2019 as reported by IATA. American Airlines reported in its 2017 Form 10-K Annual Report the following:
With respect to fuel costs, the price of Brent crude oil per barrel, which jet fuel prices tend to follow, was on average approximately 33% higher in 2018 as compared to 2017. The average daily spot price for Brent crude oil during 2018 was $72 per barrel as compared to an average daily spot price of $54 per barrel during 2017. On a daily basis, Brent crude oil prices fluctuated during 2018 between a high of $86 per barrel to a low of $50 per barrel, and closed the year on December 31, 2018 at $54 per barrel. Brent crude oil prices were higher in the 2018 period due principally to reductions of global inventories driven by strong demand and continued production restraint led primarily by the Organization of Petroleum Exporting Countries. U.S. sanctions against Iran, coupled with declining output from Venezuela further limited supply. Concerns about slowing global growth and lower demand for oil surfaced in the fourth quarter of 2018 causing Brent crude oil prices to drop.
Fuel costs are expected to remain volatile and may affect future increases in passenger traffic, which depend on stable international conditions as well as national and global economic growth. Any resumption of financial losses could force airlines to further retrench, merge, consolidate, seek bankruptcy protection, discontinue marginal operations, or liquidate. The restructuring, merging, or liquidation of one or more of the large network airlines could drastically affect air service at many connecting hub airports, offer business opportunities for the remaining airlines, and change air travel patterns throughout the U.S. and the world aviation system.
Impact of Boeing 737 MAX Grounding
On March 13, 2019, following two deadly aircraft crashes involving the Boeing 737 MAX airplane, the FAA’s Acting Administrator issued an Emergency Order of Prohibition (the “FAA Order”). The FAA Order prohibits the operation of two series of the Boeing 737 MAX airplane in the territory of the United States for passenger carrying operations until the FAA Order is rescinded or modified. The FAA Order concludes that similarities between the two crashes warrant further investigation of the possibility of a shared cause for the two incidents.

21
In February 2019, prior to the grounding of all Boeing 737 MAX planes, the 737 MAX accounted for 8.2% of flight operations at MIA, compared to 1.0% in the U.S. overall. Thirty-seven of 354 average daily departing American Airlines flights and two GOL Airlines flights were operated with 737 MAX aircraft in February 2019. The initial impact on the Airport was a decrease of approximately 25 to 30 flights per day; however, after the first two to three weeks of cancellations, American adjusted its schedule to decrease its number of flights and replaced several 737 MAX with other aircraft to lower the number of canceled flights. GOL Airlines has shifted to 737-800 aircraft for one of its two daily flights and has suspended the other.
Airline Bankruptcies
Airlines using the Airport may file for protection under U.S. or foreign bankruptcy laws, and any such airline (or a trustee on its behalf) would usually have the right to seek rejection of any executory airport lease or contract within certain specified time periods after the filing, unless extended by the bankruptcy court. In addition, during the pendency of a bankruptcy proceeding, a debtor airline using the Airport typically may not, absent a court order, make any payments to the Aviation Department either on account of services provided to the airline prior to the bankruptcy filing date or the airline’s use of airport facilities prior to the bankruptcy filing date (such services or use being referred to as “pre-petition” items). Thus, the Aviation Department’s stream of payments from a debtor airline may be interrupted to the extent such payments are for pre-petition items, including any accrued rent, Landing Fees, aviation fees, and PFCs. For any domestic or foreign airline not intending to continue operating at MIA, the airline will likely reject all contracts with the Airport, and the Airport’s recovery of amounts owed to it under the contracts prior to the filing date will typically be limited to the security deposits on hand for that airline and the percentage distribution of the airline’s assets that all creditors receive at the conclusion of the bankruptcy proceeding.
On the other hand, an airline in bankruptcy that plans to continue operating at MIA will not typically reject its terminal building leases (the “TBLAs”) or its current AUA (see “SECURITY FOR THE SERIES 2019 BONDS--Airline Use Agreement”) because there is no economic advantage in doing so. A bankrupt company usually rejects executory leases and contracts to avoid long-term commitments in the documents, unusual contract terms, or high fixed fees. However, all TBLAs (i) are on a month to month basis, (ii) have standard terms, and (iii) are based on standardized fees applicable to all airlines. In turn, the 2018 AUA (a) set forth the conditions under which an airline can operate at the Airport and have the same terms for all airlines, (b) contain a highly advantageous credit program that permits airlines to pay landing and other fees on a monthly basis rather than on a daily basis each time an aircraft lands at the Airport, and (c) impose a 50% administrative charge on landing and aviation fees for airlines not participating in the credit program. For all these reasons, an airline in bankruptcy that plans to continue operations at the Airport at the same level of activity would have little economic incentive to reject either its TBLA or its AUA. Moreover, the County has the statutory and regulatory right to impose such fees on the airline regardless of any contractual arrangement with the airline, so the airline must always pay the post-petition rentals and landing and aviation fees for actual use of the Airport regardless of whether or not it has rejected the TBLA or AUA. There can be no assurance, however, that an airline in bankruptcy will not seek to avoid its contractual obligations under its TBLA or AUA. See “SECURITY FOR THE SERIES 2019 BONDS – Airline Use Agreement” and “APPENDIX D – SUMMARY OF CERTAIN PROVISIONS OF THE 2018 AIRLINE USE AGREEMENT AND THE PREFERENTIAL GATE USE AGREEMENT.”
For a description of the possible effects of airline bankruptcies on PFC collections see below “PFC Collections – Possible Bankruptcy Effects.”
International Traffic
International traffic constituted over 48% of the Airport’s passenger traffic in Fiscal Year 2018. See “AIRPORT TRAFFIC ACTIVITY” and “AVIATION DEPARTMENT FINANCIAL INFORMATION – Historical Financial Results.”

22
Additional Information on Airlines
Certain of the Signatory Airlines under the 2018 AUA and other airlines operating at the Airport (or their respective parent corporations) file reports and other information with the Securities and Exchange Commission (SEC). These filings are collectively referred to as the “SEC Reports.” Certain information, including financial information, as of particular dates, concerning each such airline (or their respective parent corporations) is included in the SEC Reports. These SEC Reports can be found on the SEC website, https://www.sec.gov/search/search.htm.
In addition, each Signatory Airline and certain other airlines are required to file periodic reports of financial and operating statistics with the United States Department of Transportation (“U.S. DOT”). Such reports can be inspected at the following location: Research and Innovative Technology Administration, U.S. Department of Transportation, 1200 New Jersey Avenue, SE, Washington, DC 20590 or at http://www.rita.dot.gov/contacts/ and copies of such reports can be obtained from the Department of Transportation at prescribed rates. The foreign airlines also provide certain information concerning their operations and financial affairs, which may be obtained from the respective airlines.
The Federal Budget and Sequestration
Another factor that has affected the industry in the last several years is the federal deficit reductions enacted through implementation of the sequestration provisions of the Budget Control Act of 2011, which established automatic cuts to the federal legislation’s discretionary budget authority based upon certain spending thresholds. The sequestration provisions were first triggered in 2013, cutting the budgets of federal agencies, including the Federal Aviation Administration (“FAA”), Customs and Border Patrol Agency (“CBP”) and Transportation Security Administration (“TSA”). While reductions have continued in some form in every year since, Congress has acted several times to prevent “sequester” cuts to discretionary programs. The most recent of these actions was the Bipartisan Budget Act of 2018 (BBA18), which prevents automatic discretionary sequester cuts for 2018 and 2019. The sequester will return in 2020 under current law. Should sequestration be triggered again, it could adversely affect FAA, CBP and TSA budgets and operations and the availability of certain federal grant funds typically received annually by the Airport System. Such budget cuts could also lead to the FAA, CBP and TSA being forced to implement furloughs of their employees and freeze hiring, and could result in flight delays and cancellations.
Agreement with Customs and Border Patrol Agency
As part of sequestration in 2013, CBP’s budget was reduced, causing CBP to lower overtime staffing, which resulted in significant increases in international arriving passenger processing times (up to 3-4 hours) at a number of U.S. gateway airports, including MIA. In reaction to this staff reduction, U.S. gateway airports, including MIA, implemented a number of solutions that lessened the wait times for international passengers, including directly paying for CBP overtime and installing Automated Passport Control (“APC”) kiosks that assist with processing passengers through customs. During Fiscal Year 2014, the Aviation Department entered into an agreement with CBP under the provisions of Section 560 of Division D of the Consolidated and Further Continuing Appropriations Act of 2013 (“Section 560”), for CBP services on a reimbursable basis. Under this agreement, the Aviation Department has paid CBP $1.1 million and $1.2 million in Fiscal Years 2017 and 2018, respectively. As of December 31, 2018, there have been no payments made in Fiscal Year 2019 under this agreement. The Aviation Department has entered into a new agreement for CBP services effective October 1, 2018, pursuant to Section 559 of Title V of Division F of the Consolidated Appropriations Act, 2014, the successor to Section 560, but it has not yet been ratified by the Board.
By the end of Fiscal Year 2018, the Aviation Department had installed 144 APC kiosks, which enable CBP to process international arriving passengers faster and more efficiently. MIA currently processes over 70% of all arriving passengers on APC kiosks.
In December 2017 MIA reopened its E-Federal Inspection Station processing international arriving passengers utilizing facial recognition. This is the first Federal Inspection Station in the United States to process all of its arriving passengers with the use of this new technology. In 2019, the Aviation Department anticipates both the D and J Federal Inspection Stations will process all of their arriving passengers with facial recognition technology.

23
PFC Collections
General
Pursuant to federal authorization, the Airport collects passenger facility (or passenger facilities) charges (“PFCs”) on each qualifying enplaned passenger. The Airport currently collects a PFC of $4.50 per enplaned passenger, subject to certain exceptions. The applicable airline collects the PFCs and remits them monthly to the Airport net of a $0.11 per PFC administrative charge.
PFCs constitute a substantial portion of revenues collected by the Aviation Department, providing $79.50 million and $82.1 million for the Fiscal Years ended September 30, 2017 and 2018, respectively. Collections for the three-month periods ended on December 31, 2017 and December 31, 2018, were $19.4 million and $21.1 million, respectively. Such collections are subject to federal regulation and control, and their volume is affected by the economic and other conditions affecting passenger volume at the Airport. See “FUNDING SOURCES FOR CAPITAL PROJECTS – Passenger Facility Charges.”
Use of PFCs; Rate Covenant
PFCs provide a portion of the funding for the CIP, including terminal construction. Also, while PFCs do not constitute Revenues under the Trust Agreement and are therefore not pledged to the payment of the Bonds, the Aviation Department anticipates continuing its practice of depositing PFC revenues into the Sinking Fund’s Bond Service Account and Redemption Account each year to reduce the Principal and Interest Requirements on the Bonds. Such deposits effectively reduce the amount of Revenues that must be collected to comply with the rate covenant under the Trust Agreement. Failure to make such deposits as aforesaid may result in an increase in the airlines’ costs per enplaned passenger. The Report of the Traffic Engineers, attached as APPENDIX A, makes certain assumptions regarding the collection and use of PFCs as set forth therein. See “SECURITY FOR THE SERIES 2019 BONDS – Rate Covenant” and “FUNDING SOURCES FOR CAPITAL PROJECTS – Passenger Facility Charges.”
Possible Bankruptcy Effects
Applicable federal legislation and regulations provide that PFCs collected and held by an airline constitute a trust fund for the benefit of the applicable airport and create additional protections intended to ensure the regular transfer of PFCs to airports in the event of an airline bankruptcy. There can be no assurance, however, that during the bankruptcy of any airline, payment to the Airport of PFCs will not be delayed or reduced.
Federal Legislation
Federal legislation affects the grant funding that the Aviation Department receives from the FAA, the Aviation Department’s PFC collections, and the operational requirements imposed on the Aviation Department. The FAA operates under an authorization-appropriation process created by Congress in which the authorization bill continues an agency’s operation and the appropriation bill provides the funding for the activity under the authorization bill. Most authorization bills are for multiple years while the appropriation bills are done on an annual basis. In some cases, the bills can be combined as noted below.
The FAA Modernization and Reform Act of 2012 (the “FAA Act”) was signed into law on February 14, 2012, as the permanent legislative solution to the temporary short-term extensions that had been enacted as a funding stop-gap over the previous five years. This $63.6 billion reauthorization, which ran through September 30, 2015, provided $13.4 billion in funding for airport improvement projects and provided $10.9 billion in funding for the “Next Gen GPS” system, which is intended to modernize the air traffic control system and accelerate the integration of drones into the domestic airspace. The FAA Act continued the federal cap on PFCs at $4.50 and authorized $3.35 billion per year for the Airport Improvement Program (“AIP”) through Fiscal Year 2015. The AIP has continued to operate since October 1, 2015, on two short term authorization extensions, the most recent of which extended the FAA’s authorization and appropriation through October 7, 2018, and continued the $3.35 billion annual funding.

24
The FAA Reauthorization Act of 2018 was signed into law on October 5, 2018. This Act extends general expenditure authority for the Airport and Airway Trust Fund from September 30, 2018, through September 30, 2023, and extends aviation taxes funding the Airport and Airway Trust Fund for the same period. In addition, the Act removes obsolete restrictions on the Passenger Facility Charge, improves the aircraft certification process, improves aviation safety, prohibits involuntary bumping of passengers once they have already boarded the plane, and addresses miscellaneous provisions relating to air travel and the FAA.
There is no assurance that the FAA will receive spending authorization, and the FAA could be impacted by sequestration, as previously discussed. The Airport cannot predict the level of available AIP funding it may receive.
Airport Security Requirements
General
Legislative and regulatory requirements since 2001, relating to security, have imposed substantial costs on the Airport and its airlines. The most significant ones are discussed below.
Federal legislation created the TSA, an agency within the Department of Homeland Security (“DHS”). Mandates of federal legislation and federal agencies such as TSA and DHS have imposed extensive new requirements related to screening of baggage and cargo (including explosive detection), screening of passengers, employees and vehicles, and airport buildings and structures, among other things.
The Federal Aviation and Transportation Security Act (“ATSA”) makes airport security the responsibility of TSA. The Homeland Security Act of 2002 and subsequent directives issued by DHS have mandated stronger cockpit doors on commercial aircraft, an increased presence of armed federal marshals on commercial flights, establishment of 100% checked baggage screening, among other things, and replacement of all passenger and baggage screeners with federal employees who must undergo criminal history background checks and be U.S. citizens.
ATSA also mandates airport security measures, that include: (1) screening or inspection of all individuals, goods, property, vehicles and equipment before entry into secured and sterile areas of the airport, (2) security awareness programs for airport employees, (3) screening all checked baggage for explosives with explosives detection systems (“EDS”) or other means of technology approved by the Undersecretary of the United States Department of Transportation, (4) deployment of sufficient EDS for all checked baggage, and (5) operation of a system to screen, inspect or otherwise ensure the security of all cargo to be transported in all-cargo aircraft. Due to a lack of TSA funding, airports have borne some or all of the cost of designing, constructing, and installing automated in-line baggage screening systems and passenger screening checkpoints to meet the specifications that the TSA screening process requires for operation at full design capacity.
EDS equipment purchased by the federal government has been installed at the Airport. In some cases, installation of EDS equipment necessitated structural modifications to the Terminal Building. Substantially all of the costs of those modifications and the installation were borne by TSA during the initial deployment. The in-line EDS has been installed and is operational in the South Terminal and the North Terminal at an approximate cost of $98.8 million, of which TSA funded $74.2 million. TSA has committed $101 million for an in-line EDS system in Central Terminal and for enhancements to the in-line EDS in the South Terminal. TSA also has issued additional unfunded mandates through TSA security directives including: (1) transmittal to TSA of personal information on all employees holding, applying for or renewing an airport-issued identification badge for the performance of a Security Threat Assessment (“STA”) and retrieval of STA results prior to issuing badges and other forms of identification, (2) performance of inspections of all vendors and vendor products entering the sterile concourse areas of the airport, (3) reduction in the number of airport employees authorized to escort visitors in the secured areas, (4) annual audits of all airport-issued identification media, (5) the implementation of a substantive training program for all persons designated as an authorized signatory in the airport’s identification media system, (6) recording and retention of personal identification media used to obtain an airport-issued identification badge and (7) recurrent Criminal History Records Check (“CHRC”) for airport-issued identification badge holders with access to the restricted areas of the airport every two years. The Airport is now enrolled in the TSA/FBI Rap Back Program, which provides for continuous CHRCs on airport badged employees with access to the secure and sterile areas of the airport.

25
Airport security programs have also been affected by an additional requirement for the Airport to control access at the TSA passenger screening checkpoint exit lanes during TSA non-operational hours and on a 24 hours/7 days basis for exit lanes that are not co-located to the passenger screening checkpoints. This function was previously performed by TSA personnel. Additionally, TSA continues to pressure airports to increase the rate of required random inspections of employees and vehicles accessing the restricted areas of the Airport. Thus far, the Airport has not only been able to meet but also to exceed TSA’s expectations in this regard with its long-standing static and random employee screening program.
Cargo Security
Both federal legislation and TSA rules have imposed additional requirements relating to air cargo. These include providing information for a central database on shippers, extending the areas of the Airport subject to security controls, and criminal background checks on additional employees, which inhibits the ability of operators to hire temporary workers during peak periods.
TSA also requires carriers to screen 100% of all loaded cargo on passenger and on all-cargo aircraft. TSA has developed a Certified Cargo Screening Program (“CCSP”) for a “supply chain-wide solution” to cargo security that will certify cargo shippers so that they are able to screen cargo earlier in the chain. The Airport currently is actively participating in the CCSP program.
TSA has also initiated an explosive detection canine program at the Airport dedicated to cargo screening. Currently the Airport has one of the largest TSA Canine Units in the country. The Airport has successfully met the new cargo screening requirements without significant adverse impact. A Cargo Security Consortium for the Airport involving the relevant agencies and business partners meets quarterly to discuss issues, and TSA, both nationally and locally, has been working with airports and carriers to develop security options that meet the regulatory mandates while minimizing the adverse effect on air cargo operations.
Costs
The Aviation Department has included in its current budget additional funds to deal with any potential costs imposed by the requirements described above. The Fiscal Year 2019 operating budget includes approximately $20.4 million for security costs. To date, the Airport has been able to meet the additional financial burdens imposed by new security requirements, but the Aviation Department anticipates additional unfunded security directives that may impose significant costs beyond its operating budget. Such requirements may include biometric access control and the transferring of access control responsibility to the Airport at TSA passenger screening checkpoint exit lanes during checkpoint operational hours. Additionally, any elevation of the national threat advisory level would impose significant additional law enforcement and overtime costs on the Aviation Department.
Airport Competition
The Airport competes with other airports for domestic and international passengers. Fort Lauderdale-Hollywood International Airport (“FLL”) is the closest competing airport, and MIA’s biggest competitor for domestic origin-destination (“O&D”) passengers, i.e., those passengers that begin or end their trips at the airport rather than connecting through the airport en route to their destination. FLL also has substantially more low-cost carrier service than MIA. Low-cost carriers accounted for 72% (6.0 million) of all domestic scheduled departing seats at FLL for the first half of Fiscal Year 2019 (up from 30% in 2000), while low-cost carriers accounted for just 2% (158,000) of all domestic scheduled departing seats at MIA for the same time period (compared to 3% in 2000). Low-cost carrier Norwegian airline moved its daily direct flight to London from FLL to MIA beginning March 31, 2019, citing the higher number of business travelers and demand for premium tickets at MIA.
In the Fiscal Years 2008 through the 12 months ended June 30, 2018 (the most recent full Fiscal Year for which DOT O&D Survey data is available), FLL averaged over 4.0 million more domestic O&D passengers per year than MIA. Although the number of domestic departing seats increased approximately 17% at MIA and 27% at FLL between Fiscal Years 2008 and 2018, MIA gained market share in domestic O&D passengers in the South Florida region, from 32.5% in Fiscal Year 2008 to 36.8% in the 12 months ended June 30, 2018.

26
Average domestic airfares at MIA tend to be approximately 25-35% higher than those at FLL, for trips of similar distance, due largely to the higher number of premium-fare passengers at MIA and the greater concentration of low-cost carrier service at FLL. In the 12 months ended June 30, 2018, average domestic airfares remained flat at MIA and decreased slightly year over year (1.3%) at FLL. However, DOT airfare data understate the true cost of air travel, as they do not include ancillary charges (e.g., checked baggage fees), which have been increasingly implemented throughout the industry since 2008.
For passengers traveling between other parts of the United States and international destinations in the Caribbean and Latin America, there are an increasing number of alternative routings, both nonstop flights and connecting services, via other U.S. and Latin American gateway airports.
Cost and Schedule of Capital Improvements Program
The estimated costs and schedule of the CIP projects described herein under the caption “CAPITAL IMPROVEMENT PROGRAM” depend on various sources of funding, including additional bonds, and are subject to a number of uncertainties. The ability of the County to complete the CIP may be adversely affected by various factors including: (i) estimating variations, (ii) design and engineering variations, (iii) changes to the scope of the projects, (iv) delays in contract awards, (v) material and/or labor shortages, (vi) unforeseen site conditions, (vii) casualty events or adverse weather and environmental conditions, (viii) contractor defaults, (ix) labor disputes, (x) unanticipated levels of inflation and (xi) additional security improvements and associated costs mandated by the federal government. A delay in the completion of certain projects under the CIP could delay the collection of revenues in respect to such projects, increase costs for such projects, and cause the rescheduling of other projects. There can be no assurance that the cost of construction of the CIP projects will not exceed the currently budgeted dollar amount or that the completion of the projects will not be delayed beyond the currently projected completion dates. Any schedule delays or costs increases could result in the need to issue additional bonds beyond those currently projected as a funding source for the CIP projects.
Report of the Traffic Engineers
The Report of the Traffic Engineers prepared by LeighFisher and dated April 29, 2019 (the “Report”), is attached as APPENDIX A. The Report evaluates the ability of the County to satisfy the requirements of the Rate Covenant of the Trust Agreement through a forecast period from the County’s fiscal year ended September 30, 2019 through, and including, fiscal year ended September 30, 2025, taking into account estimated annual debt service requirements using assumptions documented in the Report. LeighFisher has provided its consent to the inclusion of the Report as APPENDIX A hereto. The Report has been included herein in reliance upon the knowledge and experience of LeighFisher as the Traffic Engineer. As stated in the Report, any forecast is subject to uncertainties. Therefore, there will be differences between forecast and actual results, and those differences may be material. The Report has not been updated to reflect the final pricing terms of the Series 2019 Bonds or other changes that may have occurred after the date of the Report. The forecasts presented in the Report are based on various assumptions that reflect the best information available to the County and the knowledge and experience of LeighFisher as of the date of the Report. The County’s future operating and financial performance, however, will vary from the forecasts and such variances may be material. The Report should be read in its entirety for an understanding of the forecasts and the underlying assumptions.
Growth of Transportation Network Companies
A significant source of non-airline revenues is generated from ground transportation activity, including use of on-Airport parking facilities, rental car transactions, trip fees paid by taxi, limousine, and transportation network companies such as Uber and Lyft (“TNCs”) that connect paying passengers with drivers who provide the transportation using their own commercial and non-commercial vehicles. In 2016, the Airport negotiated licenses with Uber and Lyft that have since been extended on a month-to-month basis by the Airport. The Airport receives $2.00 per TNC passenger pickup at the Airport. There is currently no drop off fee.
The introduction of TNCs at the Airport has led to declines in the revenues that the Airport receives from other ground transportation activities. Such declines have been offset to a certain extent by revenues received from the TNC operators. Table 39 of the Report breaks down the Airport’s revenues and revenues per originating enplaned passenger from TNCs, parking and rental cars. See “APPENDIX A – REPORT OF THE TRAFFIC ENGINEERS.”

27
Cyber-Security
Computer networks and systems used for data transmission and collection are vital to the efficient operations of the County. County systems provide support to departmental operations and constituent services by collecting and storing sensitive data, including intellectual property, security information, proprietary business process information, information applying to suppliers and business partners, and personally identifiable information of customers, constituents and employees. The secure processing, maintenance and transmission of this information is critical to departmental operations and the provision of citizen services. Increasingly, governmental entities are being targeted by cyberattacks seeking to obtain confidential data or disrupt critical services. A rapidly changing cyber risk landscape may introduce new vulnerabilities that attackers/hackers can exploit in attempts to effect breaches or service disruptions. Employee error and/or malfeasance may also contribute to data loss or other system disruptions. Any such breach could compromise networks and the confidentiality, integrity and availability of systems and the information stored there. The potential disruption, access, modification, disclosure or destruction of data could result in interruption of the efficiency of County commerce, initiation of legal claims or proceedings, liability under laws that protect the privacy of personal information, regulatory penalties, disruptions in operations and the services provided, and the loss of confidence in County operations, ultimately adversely affecting County revenues. The County has established a dedicated Enterprise Security Office tasked with the protection of County digital assets through a defense in depth approach to risk and vulnerability mitigation, implementation of policy and compliance standards and cyber incident response capabilities.
Climate Change
The State of Florida is naturally susceptible to the effects of extreme weather events and natural disasters including floods, droughts, and hurricanes, which could result in negative economic impacts on coastal communities like the County. Such effects can be exacerbated by a longer-term shift in the climate over several decades (commonly referred to as climate change), including increasing global temperatures and rising sea levels.
The County is addressing the threat of climate change in the following ways: (1) implementing new policies and initiatives, including environmental protections, sustainability measures, and energy and water conservation; and (2) completing a systematic assessment of the future vulnerability of the most critical County-owned infrastructure and using that information to direct investment into protective measures for the County’s most exposed assets. The County’s climate change strategy is outlined in the GreenPrint link on the County’s website (http://www.miamidade.gov/GreenPrint/) and in the Southeast Florida Regional Climate Change Compact’s (the “Compact”) Regional Climate Action Plan (http://www.southeastfloridaclimatecompact.org/wp-content/uploads/2018/04/RCAP-2.0-Abridged-Version.pdf). For planning purposes the County relies upon the Compact’s Unified Sea Level Rise Projection for Southeast Florida.
Environmental Liabilities
For a discussion of the environmental liabilities of the Aviation Department, see “LITIGATION – Aviation Environmental Matters.”
Airport Insurance
The Aviation Department maintains insurance in accordance with industry standards, but the operations of the Airport create risks of significant losses that may not be fully covered by insurance (see “AIRPORT SYSTEM FACILITIES – Airport Insurance”).
Local Construction Market Conditions
Demand for construction services in the South Florida market continues to be high; however, the projects have been advertised and awarded as planned and the Capital Improvement Program is moving ahead as scheduled. See “CAPITAL IMPROVEMENT PROGRAM.”

28
AVIATION-RELATED DEBT
Outstanding Bonds Under the Trust Agreement
Upon the issuance of the Series 2019 Bonds and the refunding of the Refunded Bonds, the total aggregate principal amount of Outstanding Bonds under the Trust Agreement is as set forth below. See also below “Double-Barreled Aviation Bonds.”
Outstanding Bonds Dated
Date of Issue Principal
Amount Issued Principal Amount
Outstanding
Series 2002A Bonds December 19, 2002 $ 600,000,000 $ 15,000 Series 2008A Bonds June 26, 2008 433,565,000 15,000 Series 2009A Bonds May 7, 2009 388,440,000 26,635,000 Series 2009B Bonds May 7, 2009 211,560,000 14,855,000 Series 2010A Bonds January 28, 2010 600,000,000 86,370,000 Series 2010B Bonds August 5, 2010 503,020,000 372,090,000 Series 2012A Bonds(1) December 11, 2012 669,670,000 518,310,000 Series 2012B Bonds(1) December 11, 2012 106,845,000 82,885,000 Series 2014 Bonds(1) March 28, 2014 328,130,000 301,260,000 Series 2014A Bonds(1) December 17, 2014 598,915,000 586,645,000 Series 2014B Bonds(1) December 17, 2014 162,225,000 157,485,000 Series 2015A Bonds(1) July 8, 2015 498,340,000 456,850,000 Series 2015B Bonds(1) July 8, 2015 38,500,000 38,500,000Series 2016A Bonds(1) August 25, 2016 315,730,000 315,730,000 Series 2016B Bonds(1) August 25, 2016 428,645,000 417,665,000 Series 2017A Bonds(1) March 24, 2017 145,800,000 145,800,000 Series 2017B Bonds(1) August 29, 2017 378,870,000 354,975,000 Series 2017D Bonds(1) August 29, 2017 314,565,000 312,285,000 Series 2018A Bonds(1) August 30, 2018 19,745,000 19,745,000 Series 2018B Bonds(1) August 30, 2018 4,185,000 4,185,000 Series 2018C Bonds(1) August 30, 2018 766,815,000 766,815,000 Series 2019A Bonds May 30, 2019 282,180,000 282,180,000 Series 2019B Bonds(1) May 30, 2019 212,745,000 212,745,000 TOTAL $8,008,490,000 $5,474,040,000
(1) Denotes Refunding Bond issues.
[Remainder of page intentionally left blank.]

29
Debt Service Schedule
The following table shows the annual Principal and Interest Requirements on all Outstanding Bonds, including the Series 2019 Bonds (but excluding Double-Barreled Aviation Bonds described on the following page), as of the date of delivery of the Series 2019 Bonds for the Fiscal Years ending September 30, 2019 through the final maturity of the Outstanding Bonds.
AVIATION REVENUE BONDS (OUTSTANDING BONDS UNDER THE TRUST AGREEMENT)
PRINCIPAL AND INTEREST REQUIREMENTS
Fiscal Year (1)
Principal & Interest on
Outstanding Bonds (2)
Principal on Series 2019 Bonds
Interest on Series 2019
Bonds(3)
Principal & Interest on
Series 2019 Bonds
Total Aggregate Principal & Interest (4)
2019 $ 366,568,512 - $ 6,853,288 $ 6,853,288 $ 373,421,800 2020 361,519,671 $ 1,675,000 20,389,949 22,064,949 383,584,619 2021 357,577,965 1,720,000 20,346,918 22,066,918 379,644,884 2022 345,598,147 11,675,000 20,302,439 31,977,439 377,575,585 2023 354,552,999 1,495,000 19,997,955 21,492,955 376,045,954 2024 347,617,563 8,470,000 19,956,768 28,426,768 376,044,331 2025 338,844,454 15,350,000 19,719,184 35,069,184 373,913,638 2026 340,260,874 17,040,000 19,266,513 36,306,513 376,567,386 2027 321,717,743 31,095,000 18,746,963 49,841,963 371,559,706 2028 319,142,875 36,560,000 17,772,135 54,332,135 373,475,010 2029 319,956,907 37,570,000 16,611,355 54,181,355 374,138,261 2030 338,284,930 22,300,000 15,380,937 37,680,937 375,965,867 2031 362,631,672 - 14,628,312 14,628,312 377,259,984 2032 371,288,079 - 14,628,312 14,628,312 385,916,392 2033 377,919,516 - 14,628,312 14,628,312 392,547,828 2034 347,537,140 27,795,000 14,628,312 42,423,312 389,960,452 2035 380,517,425 - 13,640,200 13,640,200 394,157,625 2036 380,509,041 - 13,640,200 13,640,200 394,149,241 2037 378,531,253 - 13,640,200 13,640,200 392,171,453 2038 381,727,074 - 13,640,200 13,640,200 395,367,274 2039 382,242,826 - 13,640,200 13,640,200 395,883,026 2040 382,242,378 - 13,640,200 13,640,200 395,882,578 2041 381,732,034 - 13,640,200 13,640,200 395,372,234 2042 5,008,875 29,885,000 13,640,200 43,525,200 48,534,075 2043 5,009,875 31,230,000 12,295,400 43,525,400 48,535,275 2044 5,012,325 32,635,000 10,890,050 43,525,050 48,537,375 2045 5,010,775 34,100,000 9,421,500 43,521,500 48,532,275 2046 - 35,805,000 7,716,500 43,521,500 43,521,500 2047 - 37,600,000 5,926,250 43,526,250 43,526,250 2048 - 39,475,000 4,046,250 43,521,250 43,521,250 2049 - 41,450,000 2,072,500 43,522,500 43,522,500
Totals (4) $8,258,562,926 $494,925,000 $435,347,702 $930,272,702 $9,188,835,628 (1) With respect to each Fiscal Year, excludes payments due on October 1 of such Fiscal Year and includes payments due on October 1 of the
following Fiscal Year. (2) Includes principal and interest payments made on April 1, 2019. (3) Includes capitalized interest on the Series 2019A Bonds to April 1, 2020. (4) Totals may not add due to rounding.
Double-Barreled Aviation Bonds
On March 4, 2010, the County issued its Double-Barreled Aviation Bonds (General Obligation), Series 2010 (the “Double-Barreled Aviation Bonds”), in the aggregate principal amount of $239,775,000, and currently outstanding in the amount of $209,010,000. Debt service on the Double-Barreled Aviation Bonds is secured by a pledge of both (1) Net Available Airport Revenues (as such term is defined below), a lien that is subordinate to the lien securing the Bonds, and (2) ad valorem taxes levied on all taxable property in the County. “Net Available

30
Airport Revenues” is defined to mean any unencumbered funds held for the credit of the Improvement Fund created under the Trust Agreement after the payment of all obligations of the County pertaining to the County airports which are payable pursuant to, and subject to the restrictions of (i) the Trust Agreement, (ii) any Airline Use Agreement then in effect or (iii) any other indenture, trust agreement or contract. To date, it has not been necessary for the County to apply any ad valorem tax revenues to pay debt service on the Double-Barreled Aviation Bonds.
The following table shows the annual principal and interest requirements on the Double-Barreled Aviation Bonds for the Fiscal Years ending September 30, 2019 through their final maturity. The table does not include debt service on other Airport-related debt.
DOUBLE-BARRELED AVIATION BONDS PRINCIPAL AND INTEREST REQUIREMENTS
Fiscal Year Ending September 30,
Principal and Interest on Double-Barreled Aviation Bonds
2019 $ 15,430,8372020 15,433,5122021 15,433,512 2022 15,434,0122023 15,430,5122024 15,432,5122025 15,430,2622026 15,432,012 2027 15,431,7622028 15,433,7622029 15,432,0122030 15,430,7622031 15,431,087 2032 15,432,8372033 15,431,8372034 15,432,0752035 15,434,7502036 15,431,250 2037 15,430,5002038 15,431,000 2039 15,431,2502040 15,434,7502041 15,429,750
TOTALS(1) $354,936,555 (1) Numbers may not add up to an exact amount due to rounding.
Commercial Paper Notes
On March 2, 2016, the County issued the initial tranche of the CP Notes in the amount of $5,000,000. No more than $200,000,000 in CP Notes may be outstanding at any one time. As of May 7, 2019, the outstanding balance of the CP Notes was $170,000,000. Payment of all outstanding CP Notes is secured by and payable under an irrevocable transferrable direct-pay Letter of Credit issued by Bank of America, N.A., which expires on March 2, 2021. The CP Notes are intended to provide temporary funding for the cost of capital projects at the Airport.
Other Airport-Related Debt
FDOT State Infrastructure Bank Loan
The Viaduct East Project (the “VEP”) is an elevated roadway over NW 25th Street completed and opened to traffic in July 2011. The VEP provides the only major access from the Palmetto Expressway (State Road 826) to MIA’s Westside and Northside air cargo handling facilities. Trucks entering and exiting the air cargo area of the Airport travel on the Viaduct and avoid NW 25th Street congestion. VEP was funded in part with a $50 million loan

31
to the County from the Florida Department of Transportation (“FDOT”) State Infrastructure Bank. The FDOT loan is secured by a County covenant to annually budget and appropriate from legally available non-ad valorem revenues of the County funds sufficient to pay debt service costs. As of September 30, 2018, the Aviation Department on behalf of the County has paid an aggregate of $45 million for annual debt service payments, which commenced October 1, 2009. The Aviation Department earmarked approximately $5 million per year over the balance of the 11-year life of the loan (the last payment is due October 1, 2019) from the Aviation Capital Account to pay FDOT. This payment is subordinate to all other Aviation Department funding requirements, including all other debt to be paid from the Improvement Fund.
Capital Leases
The County has entered into various capital leases to finance the purchase of equipment at the Airport. In 2014, the County entered into an approximately $33,000,000 lease-purchase agreement to finance the cost of various energy conservation improvements at the Airport and on December 19, 2017, the County entered into an approximately $47,600,000 lease-purchase agreement to finance the cost of various additional energy conservation improvements at the Airport (collectively, the “Sustainability Leases”). The Sustainability Leases are considered “budget neutral” since the cost of acquiring and installing the improvements will be covered by the energy cost savings expected to be generated by the improvements. The Sustainability Leases and the County’s other Airport-related capital leases are secured by a County covenant to annually budget and appropriate from legally available non-ad valorem revenues of the County funds sufficient to pay debt service costs. Payments on such capital leases are subordinate to all other Aviation Department funding requirements, including all other debt to be paid from the Improvement Fund.
Third-Party Obligations
The County may issue revenue bonds related to the Airport System outside the provisions of the Trust Agreement and not payable from Revenues pledged under the Trust Agreement, subject to the condition, among others, that it will not construct, or consent to the construction of, any project, whether at the Airport or any other site, unless there is filed with the Clerk of the Board a statement signed by the Traffic Engineers and the Consulting Engineers certifying that, in their respective opinions, the operation of such additional project will not affect the County’s compliance with the Rate Covenant Requirement or impair the operating efficiency of the Port Authority Properties. The County has not issued any revenue bonds related to the Airport System outside of the Trust Agreement.
The Miami-Dade County Industrial Development Authority has issued revenue bonds in the combined aggregate principal amount of $223,590,000 for the benefit of conduit borrowers, the proceeds of which have been used by those conduit borrowers to finance the construction of their air cargo and other facilities at the Airport. As of September 30, 2018, such bonds were outstanding in the aggregate principal amount of $51,440,000. Neither the Airport nor the County has any obligation with respect to these bonds. See “APPENDIX C – SUMMARY OF CERTAIN PROVISIONS OF THE TRUST AGREEMENT – Bonds Secured Otherwise Than by the Trust Agreement.”
Independent Financing of the Rental Car Center
In August 2005 and August 2007, FDOT, in cooperation with the County, closed on $270 million in loans from the United States Department of Transportation under the Transportation Infrastructure Financing Innovation Act (“TIFIA”) loan program. Under various agreements, FDOT agreed to procure the financing, acquire the land, and construct the Rental Car Center (“RCC”) (formerly known as the Rental Car Facility), at the Miami Intermodal Center (“MIC”). The loan proceeds were used by FDOT to design and construct the RCC, which commenced operations in July 2010. The revenues pledged for repayment of the loan are the proceeds of the Customer Facility Charges (“CFC”) collected by car rental companies for their customers at the Airport and, if required, rent payments from the car rental companies sufficient to cover any shortfall. Loan payments (which commenced on October 1, 2012) have been made through March 31, 2019, without the need for any rent payment from the rental car companies. The repayment of the TIFIA loan is not secured by Revenues or any other revenues of the Aviation Department. See “AIRPORT SYSTEM FACILITIES – Commercial Operations Facilities” and “– Roadway Access to MIA.”

32
Future Indebtedness; Other Capital Expenditures
The Aviation Department has identified a number of future capital projects under its Capital Improvement Program (the “CIP”), primarily related to the Central Terminal, as well as the maintenance of existing assets and safety and security programs. The proposed projects include roadway improvements, aircraft remote parking expansion, and concourse and terminal refurbishment. In addition, airfield taxiway improvement projects to increase safety and capacity are currently under construction. All the funding sources of the CIP are described in further detail under “CAPITAL IMPROVEMENT PROGRAM” and “FUNDING SOURCES FOR CAPITAL PROJECTS.”
AIRPORT SYSTEM GOVERNANCE AND MANAGEMENT
Governance
The Aviation Department is a department of the County, which is a political subdivision of the State and a home rule county authorized by the Florida Constitution. Pursuant to Florida Statutes and the Home Rule Amendment and Charter of Miami-Dade County, as amended (the “Home Rule Charter”), the elected 13-member Board is the legislative and governing body of the County. On January 23, 2007, the electors of the County approved an amendment to the Home Rule Charter which established a strong mayor form of government. This amendment expands the Mayor’s powers over administrative matters. Under this system, the Mayor also appoints all department heads, including the Aviation Director.
Management
Brief descriptions of the director of the County Finance Department and the executive staff and selected division managers of the Aviation Department follow.
Edward Marquez - Miami-Dade County Deputy Mayor/Finance Director
Edward Marquez is Deputy Mayor of the County and Director of the Finance Department. Mr. Marquez oversees the Finance, Management and Budget, Audit and Management Services, Information Technology and Internal Services Departments and liaises with the Housing Finance Authority, Clerk of the Board and Eleventh Judicial Circuit of Florida. Mr. Marquez was the County’s Finance Director from 1986 to 1996, during which time he was responsible for all financial and controllership operations of County government. Later, Mr. Marquez served as Manager of the City of Miami where he directed development of the City’s five-year fiscal and operational recovery plan. Mr. Marquez has also served as an investment banker and financial advisor, and he has comprehensive knowledge of a wide range of business operations and complex financial transactions.
Prior to re-joining the County, Mr. Marquez was a Senior Vice President of First Southwest Company, LLC where his clients included the Miami-Dade Expressway Authority, City of Miami and North Miami Community Redevelopment Districts, among others. He also served as Chief Financial Officer of the Miami-Dade County Public Schools, the fourth largest school district in the United States with operating and construction budgets of $2.6 and $1.7 billion, respectively.
Mr. Marquez holds a Bachelor of Business Administration from Florida International University and an Associate of Arts in Business Administration from the University of Florida.
Lester Sola - Aviation Department, Aviation Director and Chief Executive Officer
Lester Sola is the Director and Chief Executive Officer of the Miami-Dade Aviation Department. He oversees operations at Miami International Airport (MIA) and four general aviation (GA) airports in the Miami area, which together generate $33.7 billion in business revenue and support more than 280,000 direct and indirect jobs. MIA leads the way, handling more than 44 million passengers and more than two million tons of cargo annually, placing it among America’s busiest international passenger and cargo airports.

33
Mr. Sola has served Miami-Dade County for more than 26 years, most recently as Director of the Miami-Dade Water and Sewer Department. As Director of the largest utility in the southeastern United States, Mr. Sola was responsible for: providing high-quality drinking water and wastewater disposal services to more than 2.3 million residents, businesses and visitors daily; managing more than 2,700 employees and an annual operating budget of $796 million; and leading the largest capital improvement program in Miami-Dade County’s history. During Mr. Sola’s tenure at the department from 2015 to 2017, nearly 1,000 projects worth more than $1.1 billion were completed.
During the next 15-20 years, the multi-billion-dollar program to upgrade the County’s entire water and sewer infrastructure will include certification of 63 pump stations out of moratorium, allowing for community growth and economic development. The Department has approximately 900 additional projects in varying stages of progress.
Prior to his appointment to the Water and Sewer Department, Mr. Sola was the Director of the Internal Services Department (ISD) since October of 2011. ISD is responsible for Miami-Dade County’s procurement of goods and services, small business development, architectural and engineering selection services, capital improvement programs, design and construction services, facilities and fleet management, risk management, parking operations, printing and graphics services, surplus asset disposal and capital inventory oversight. Mr. Sola managed an operating budget of $370 million, capital projects totaling over $400 million, and over 850 employees.
Mr. Sola began his career with Miami-Dade County government in 1992 as a member of the County Manager Management Training Program. He has held several high-level positions including: Contract Coordination Officer in the County Executive Manager’s Office; Architectural and Engineering Consultant Coordinator for the County Executive Manager’s Office; Assistant to the County Manager; Associate Director for the Aviation Department; Deputy Director for the Department of Business Development; Supervisor of Elections; and Director of the Internal Services Department.
During his more than two decades of public service, Mr. Sola has been responsible for: the reorganization of several County departments; coordination and refocusing of the capital program at Miami International Airport; the establishment of small and minority-based programs for the procurement of goods and services; establishment of centralized systems for the tracking of County capital expansion programs and professional services; and the provision of management direction to County departments, management agreements and agencies such as Aviation, Seaport, Beacon Council, Performing Arts Center and the American Airlines Arena.
Mr. Sola has a master’s degree and bachelor’s degree in public administration, with a minor in organizational psychology from Florida International University.
Kenneth A. Pyatt - Aviation Department, Deputy Aviation Director
Kenneth A. Pyatt became Deputy Aviation Director in July 2010, following a 36-year career with American Airlines. From 1997 to 2007, Mr. Pyatt served as Managing Director of Passenger Services and Ramp Operations for American Airlines at MIA, where he was responsible for customer service, security, baggage, international and ramp operations, on-time performance, contract management and vendor oversight. He was corporate liaison with the Transportation Security Administration and managed 200 daily aircraft operations, nearly 1,800 unionized employees and 45 managers.
As a member of the American Airlines management staff, Mr. Pyatt held senior operations management positions at New York’s John F. Kennedy and LaGuardia Airports, O’Hare (Chicago) and MIA from 2007 to 2010. In this capacity, he was responsible for all phases of airport operations, including aircraft operations, safety, security, prevention of aircraft damage, facilities maintenance, contractor management, and customer relations.
As Deputy Aviation Director, Mr. Pyatt is responsible for all operations divisions at MIA and the general aviation airports, including Airside, Landside, Terminal, Facilities (both Maintenance and Development), Protocol, Noise Abatement, Public Safety and Security, Police and Fire.
Mr. Pyatt holds a Bachelor of Arts from Queens College, New York.

34
Sergio San Miguel - Aviation Department, Chief Financial Officer
Sergio San Miguel is the Chief Financial Officer (“CFO”) of the Aviation Department. Mr. San Miguel manages and oversees five Finance and Strategy divisions: Accounting; Capital Finance; Financial Planning and Performance Analysis; Program Controls; and Strategic Planning. As CFO, he is responsible for planning and directing the financial and budgetary management for the Aviation Department. In addition, he provides strategic assistance to the Aviation Department’s executive management team in establishing long-range goals, strategies, plans and policies. He also serves as the Aviation Department’s liaison to the County’s Finance Department and Office of Management and Budget.
Mr. San Miguel joined the Aviation Department in 2009 as Assistant Controller, and was later promoted to the positions of Capital Finance Manager and Controller before being appointed CFO in 2018. Before joining the Aviation Department, Mr. San Miguel served as the Chief Financial Officer for the County’s Transit Department beginning in 2007, supervising a staff of 100 employees responsible for business management functions such as budgeting, financial and performance auditing, grant management, accounting and revenue collections and processing. He was also responsible for overseeing the department’s overall $388 million operating budget and $425 million capital budget.
Prior to his positions with the County, Mr. San Miguel served in similar roles in the private sector as an independent management consultant and chief financial officer for organizations including Cemusa, Inc., Staf Airlines, Dole Food Company and Mega Bank. His work experience also includes positions as an audit manager with Coopers & Lybrand and as an auditor and accountant with Jackson Memorial Hospital.
Mr. San Miguel has been a certified public accountant in the State of Florida since 1981 and earned a bachelor’s degree in business administration from Florida International University. He is a member of the American Institute of Certified Public Accountants.
Oscar Aguirre - Aviation Department, Capital Finance Manager
Oscar Aguirre is the Capital Finance Manager for the Aviation Department. Mr. Aguirre is responsible for the management and administration of debt issuance for the Aviation Department. Mr. Aguirre also ensures that cash needs are met in order to maintain the capital program schedule and debt service is managed in order to minimize the Aviation Department’s cost per enplaned passenger. Additionally, he serves as the departmental functional lead for Enterprise Resource Planning Financial System upgrades, as well as the Security and Workflow Administrator.
Prior to assuming the position of Capital Finance Manager, Mr. Aguirre was the Airport Accounting Chief, a position he held since 2004. His main responsibilities consisted of managing the general ledger to include financial reporting and issuance of the Aviation Department’s annual audited financial statements. Mr. Aguirre has served in many different roles and positions since joining the Aviation Department in 1988. He has managed the Accounts Payable, Fixed Assets and Revenue Sections during his tenure.
Mr. Aguirre earned a bachelor’s degree in Business Administration from Florida International University.
Jose A. Ramos R.A. LEED AP - Division Director for Aviation Planning, Land-Use and Grants Division
Jose A. Ramos is currently the Division Director for Aviation Planning- Land-Use and Grants Division. He has 18 years of professional airport planning experience including airfield, terminal, and airport operations gained steadily during his tenure with the Aviation Department.
Mr. Ramos is responsible for overseeing the orderly and efficient development of the Airport System to meet aviation demands and assure compatibility with the surrounding communities. He is responsible for all aviation system and master (strategic) planning and forecasting of aircraft activity, airfield planning, on-airport facility development and off-airport proposed land use development reviews. He directs and manages the Strategic Airport Master Planning 2015-2050 effort for the Airport System, and is the lead technical liaison with the responsibility of coordinating with the FAA and the FDOT in administering the Federal and State grants-in aid program for the Airport System.

35
Mr. Ramos is a State of Florida registered, LEED AP certified architect. He earned a Master of Architecture degree in 1985 from the University of Florida.
Employees
The Aviation Department had approximately 1,318 employees as of June 30, 2018. Collective bargaining units represent approximately 1,207 or (91%) of the 1,318 employees. Florida Statutes prohibit public employees from striking against their employers. Police and fire services are provided by their respective County departments through dedicated Aviation Department forces, with supplemental services provided and paid for as needed.
AIRPORT SYSTEM FACILITIES
Introduction
The Airport is located in the unincorporated area of the County, approximately seven miles west of the downtown area of the City of Miami and nine miles west of the City of Miami Beach. Its close in-city location provides convenient and immediate access to the Greater Miami area.
During the 12-month period ended December 31, 2018, a total of 45.0 million passengers traveled through MIA, of which 21.9 million or 48.6% were international, and 23.2 million or 51.4% were domestic. MIA maintains one of the highest international to domestic passenger ratios of any U.S. airport, supported by South Florida’s culturally diverse population and international tourist destination status. The Airport supports multiple airline and multiple daily frequencies to virtually every capital and secondary city/business center in the Latin American/Caribbean region. According to the most recent statistics compiled by the Airports Council International, MIA, in calendar year 2017, ranked 40th worldwide in terms of total passengers (both arriving and departing).
MIA includes approximately 3,230 acres and approximately 184 buildings, ranging from airfield lighting vaults, aircraft engine test cells, chiller plants, cargo warehouses, office buildings, and hangars, to a main terminal building. Currently, the main terminal has over eight million square feet of space.
Terminal Building
This subsection describes terminal facilities in operation as of December 31, 2018.
The Terminal Building has been divided into three major geographic development areas, consisting of six concourses: North Terminal consisting of Concourse D; Central Terminal consisting of Concourses E, E/E-Satellite, F and G; and South Terminal consisting of Concourses H and J. In a maximum narrow body aircraft configuration, the Terminal currently has 138 gates. Concourse D has 49 gates and 12 regional jet ground load gates (with parking space for 15 regional jets). Concourse E/E-Satellite has 18 gates; Concourse F has 17 gates; Concourse G has 14 gates (three of which are ground load commuter gates); Concourse H has 13 gates; and Concourse J has 15 gates. (See the Maps of the Airport, Terminal Building and Gates below). In a maximum wide-body configuration, the Terminal can accommodate a total of 110 wide-body aircraft at its gates: the North Terminal (Concourse D) can accommodate 23 wide-body and 22 narrow-body aircraft; the Central Terminal (Concourses E, F, and G) can accommodate 29 wide-body and 13 narrow-body aircraft; and the South Terminal (Concourses H and J) can accommodate 13 wide-body and 10 narrow-body aircraft.
There are three Federal Inspection Services (“FIS”) areas in the Airport. In the North Terminal, the first level of the Terminal Building includes the arrivals area with domestic baggage claim and ground transportation, as well as outbound baggage systems. The second level is the departure level with security checkpoints, gate hold rooms and 522 ticket positions, the majority of which have common use equipment. The Airport differs from many airports in that the Airport does not have a separate international terminal. Accordingly, the Terminal Building’s third level is capable of conveying arriving international passengers from Concourses D, E/E-Satellite, and F to the FIS located in the North Terminal, and conveying arriving international passengers from Concourses H and J to a second FIS in the South Terminal near Concourse J. A third FIS facility in the Central Terminal, located in Concourse E, was opened in December 2017 equipped with facial recognition technology for CBP to clear passengers. That same technology is expected to be implemented in the other two FIS areas in the North and South

36
Terminals in 2019. The Terminal has three multiple passenger loading bridge A380 capable loading gates with an upper deck loading bridge, one in Concourse J (J17), and two in Concourse E (E6 and E24).
Additionally, the Aviation Department is considering certain near-term renovations to the Central Terminal. For a discussion of the CIP with respect to the terminal facilities, see “CAPITAL IMPROVEMENT PROGRAM.”
[Remainder of page intentionally left blank.]

37

38

39
Commercial Operations Facilities
The MIA Terminal Building
The MIA Terminal Building has 226 permanent concession locations occupying 279,839 square feet of duty-free, food and beverage and retail space and six temporary units occupying 2,011 square feet. There are also seven permanent locations occupying approximately 9,710 square feet that are closed temporarily. Approximately 21% of the concessions are located pre-security and approximately 79% of the concessions are located post-security. The current concession locations are consistent with the Airport’s concession master plan.
The MIA Terminal Building also provides locations for services such as advertising, banks and ATM machines, currency exchanges, baggage wrap machines, luggage carts, vending machines, baggage checkroom, hotel with restaurant, and airline clubs.
The Aviation Department utilizes a concession agreement structure to manage its concession locations. Under this structure, the concession operator pays the Aviation Department the greater of a percentage of gross revenues or a minimum amount guaranteed in the contract. The costs associated with the buildout of concession locations and on-going maintenance are also paid by the concessionaire. The table below lists the concession operators currently operating at the Airport.
Area
Type of Concession Agreement
Retail Food & Beverage
Central Terminal Westfield Concessions Management, Inc. South Terminal Faber, Coe & Gregg
HMS Host Areas USA Concessions Miami
North Terminal Faber, Coe & Gregg HMS Host The Hudson Group Newslink/Adler Newslink of South Florida
Areas USA Concessions Miami
A solicitation for the Central/South Terminal Retail Program is planned for early summer 2019. The Aviation Department is currently developing four solicitations for concession services: commercial banking, luggage carts, automated retail, and VIP Concierge Services.
In the North Terminal, the CIP is complete and 100% of the permanent concession locations are open and operating. All the principal concession solicitations have been completed and concession agreements for all of the locations have been awarded. The Department has awarded and opened concession contracts for all locations in the Miami Marketplace, a series of modular units offering products that represent the South Florida market.
The MIA Rental Car Center
Currently, there are 15 rental car companies doing business from 15 rental counter locations at the MIA Rental Car Center (“RCC”) including Alamo, Avis, Budget, Dollar, Enterprise, Hertz, National, Sixt and Thrifty, among others. A new rental car company, ACE, was assigned its own rental car location and commenced operating in March 2019. The RCC was the first phase of the Miami Intermodal Center (the “MIC”) and is located immediately east of the Airport’s main entrance. The RCC is connected to the Airport by an elevated automated people mover system (the “MIA Mover”), constructed by the Aviation Department over Central Boulevard between the Airport’s Dolphin and Flamingo parking garages. The RCC and the Airport are connected to downtown Miami via an extension of the County’s elevated heavy rail system (“Metrorail”). The Metrorail Airport extension began operation during the summer of 2012. The Aviation Department owns and oversees the operation of the RCC, but does not directly operate either the RCC or the MIC. The RCC is operated by the rental car company tenants. See “AIRPORT SYSTEM FACILITIES – Roadway Access to MIA” for a description of the MIC and the MIA Mover.

40
The MIA Hotel
The MIA Hotel, located on the second level of Terminal E, is currently operated through a management agreement with MCR Investors LLC. The MIA Hotel has 259 rooms and includes one of the first Air Margarita restaurants in the United States, located in the hotel lobby. Air Margarita is an island-inspired chain of restaurants that is very popular in the Caribbean and Mexico. The restaurant operates under a direct lease between the Aviation Department and IMCMV MIA LLC, an Airport concessionaire. This same concessionaire opened on the seventh floor of the MIA Hotel the Brazilian themed concept called Viena, which is a full service restaurant. The MIA Hotel is an independently branded hotel with the distinct advantage of its in-terminal location over the rest of the Airport-district area hotels. As of December 31, 2018, the MIA Hotel occupancy for the prior 12 consecutive months was 86.6% as compared to 83.6% for the comparable set, comprised of 10 area hotels. The average daily rate for the same period was $154.55 as compared to $133.62 for the comparable set.
Airside Facilities
Runways
The Airport has four commercial service air carrier runways, consisting of three parallel east-west runways and one diagonal runway oriented in the northwest to southeast heading. For a map of the runways, see “AIRPORT SYSTEM FACILITIES – Terminal Building.” These runways provide operational facilities covering 97% of prevailing wind conditions and are connected by a system of dual taxiways and aprons. The runways are equipped with high-intensity runway lighting systems. Category I Instrument Landing Systems are provided for six of the eight runway approach directions to permit operations under poor weather conditions. The four runways, their direction, length and width are as follows:
Runway Direction Length Width
8L-26R East-west 8,600 feet 150 feet 8R-26L East-west 10,506 feet 200 feet 9-27 East-west 13,016 feet 150 feet 12-30 Northwest-southeast 9,355 feet 150 feet
Runways 8L-26R and 8R-26L are located north of the Airport, 800 feet apart, separated by Taxiway
Lima “L”. Runway 9-27 runs parallel to Runways 8L-26R and 8R-26L, almost a mile to the south of Runway 8R-26L. Runway 12-30 runs diagonally to the other three runways, and is used sequentially with the parallel runways during operations with easterly wind conditions with the application of land-and-hold-short procedures on the longer Runway 9 permitting converging landings. These runways are capable of handling any size commercial passenger or cargo aircraft planned or currently in use, with Runways 8R-26L and 9-27 approved as contingency and primary runways, respectively, for handling the Airbus A380 and the Boeing 747-8. MIA’s four-runway layout permits peak hour aircraft movements of between 50 and 60 take-off and landing flight operations per hour during optimal weather conditions.
[Remainder of page intentionally left blank.]

41
The four runways are flexible pavement facilities constructed with bituminous asphalt surfacing, over a compacted lime rock base sub-grade, and can be strengthened as necessary by additional overlays of bituminous asphalt to accommodate sustained operations by heavier aircraft in the future. All runways are grooved, permitting all-weather landing and optimal wet runway condition braking performance.
To minimize take-off delays, most runways are supplemented at each end with taxiways, which permit the bypassing of most aircraft facing delay by other departing aircraft except in the case of the very large aircraft, like the Airbus A380 and the Boeing 747-8. A system of numerous high-speed exits (turnoffs) from the runways, permitting landing aircraft to make smooth exits from the runways to the taxiway system, minimizing runway occupancy times and enhancing airfield performance and capacity. An extensive system of dual parallel taxiways supports all four runways and serves the entire area of the Airport’s terminal complex. These dual-parallel taxiways provide by-pass taxiway capability for all but the largest aircraft during high airfield utilization periods such as during peak periods when air traffic control needs to reshuffle departure queues to enable the most delayed departures to take-off prior to other flights.
Aircraft Parking Positions
The Airport has a sufficient number of aircraft parking positions at the Terminal Building, and elsewhere on the Airport there are ramps to enable the Airport to position passenger and cargo aircraft in an orderly manner. In order to make efficient use of the Terminal Building, aircraft that are not engaged in active loading or unloading of passengers are temporarily relocated to distant aircraft parking positions (called “hardstand” or “remote parking” positions) to await the time when they are scheduled to resume their active passenger loading or unloading activities at the Terminal Building gates. This temporary relocation makes gates available for revenue producing incoming

42
aircraft that need to load or unload passengers, rather than having gates serve as non-revenue producing parking lots for aircraft. As shown on the “Aircraft Gates and Parking Positions” map below, the Airport has 24 “Terminal Area Hardstand Positions” that are used by passenger aircraft for this purpose. The airport also has an additional 110 “Cargo & Remote Hardstand Positions” used on a common-use basis, 39 of which are used primarily by passenger aircraft and 71 primarily by air cargo aircraft. These 110 positions are in addition to the 27 air cargo positions located on airline leaseholds and used by the air cargo tenants exclusively. (See “AIRPORT SYSTEM FACILITIES - Cargo and Other Facilities at the Airport”).
Parking Facilities
The Airport offers several public parking facilities: (i) the covered parking facilities known as the Dolphin and Flamingo parking garages, positioned within the linear horseshoe configuration of the Terminal Building; (ii) the North and South Valet facilities, located within the Dolphin and Flamingo garages, respectively; (iii) the two stacked parking lots perpendicular to the west end of the garages, with the top lot exposed to the elements; (iv) the surface lot across from the South Terminal; and (v) the high vehicle lot that accommodates vehicles that exceed seven feet in height (collectively, the “MIA Parking Facilities”), all of which operate 24 hours a day, seven days per week. Ground transportation and curbside services are situated on the main arrivals and departures access roadways across from the parking garages. As of December 31, 2018, MIA has 8,388 public parking spaces within the MIA Parking Facilities that are allocated for valet parking, surface lot parking, and garage parking.
All MIA Parking Facilities are currently owned by the Aviation Department and are managed pursuant to a management agreement (the “Airport Parking Management Agreement”) between Airport Parking Associates Joint Venture and the County. Although the final extended term of the Airport Parking Management Agreement expired September 30, 2018, the County and the parking manager executed an extension, extending the current contract until September 30, 2019, unless otherwise terminated in writing by the Aviation Department. The Aviation Department is in the process of issuing a solicitation to request proposals from the general public for parking management services to MIA.
MIA has a unified parking rate structure which was implemented October 1, 2011. The unified parking rate structure eliminated the need to differentiate between short and long term parking. The main exit from the parking garages is through a centrally-located revenue collection plaza, which serves all facilities, while the valet operations have separate exits. The central plaza allows for centralized ticketing access to and from the garages with a parking revenue control system. The parking revenue control system is currently being upgraded with state of the art technology by way of a solicitation issued by MIA to the general public, which is in the process of being awarded. In addition to cash and credit card payments, the collection plaza provides drive through lanes with different payment options like Pay On Foot, SunPass Plus® and EMV credit cards. Pay On Foot allows patrons to pay for parking prior to exiting the collection plaza. SunPass is a prepaid toll program, which expedites a patron’s exit through the collection plaza with the use of transponders. EMV refers to the “pin and chip” credit cards. These payment options reduce the number of staffed cash lanes and reduce labor expenses.
Roadway Access to MIA
The primary ingress and egress routes for passengers and visitors to MIA are (1) from LeJeune Road (NW 42nd Avenue, the eastern geographic boundary of the Airport) to NW 21st Street, (2) the Dolphin Expressway – SR 836 (the southern boundary of the Airport) to LeJeune Road, and (3) a direct connection to Interstate I-95 from the Airport Expressway State Road 112 (SR 112) with dedicated ramps from the North, South and East all leading to the Terminal Building and the revenue parking Central Collection Plaza via the MIA main access roadway “Central Boulevard” (which is an extension of NW 21st Street). The Central Boulevard roadway connects to all passenger landside and terminal facilities and on approach to the terminal is grade separated with access to the first (ground) level for all arrivals and an elevated roadway level serving the entire second level for all departures.
Airport roadway access infrastructure includes the Central Collection Plaza and the Terminal South Drives Extension Projects. The Central Collection Plaza provides a centralized point of entry and exit from the revenue parking garages with an automated payment system. The Southside Drives Extension project, which extended the grade separated terminal roadway system with additional curb frontage for arriving and departing passengers to support the South Terminal building and Concourse J expansion opened for service in 2007. The Southside Drives

43
Extension project greatly improved the circulation, vehicle weaving and way finding for drivers accessing the new terminal and exiting the Airport.
Other Airport surface access improvements have some CIP contributions but are primarily funded by entities other than the County to enhance the surface accessibility and functionality of roadways serving the Airport and include the Airport’s interface with the Rental Car Center (the “RCC”) and the transit oriented Miami Intermodal Center (MIC), and improved ingress and egress for both passengers and cargo both on the east (terminal) and west (air-cargo) sides of the airport. Significant access improvements include:
• FDOT and the Miami-Dade County Expressway Authority (MDX) have funded several projects to enhance access to the Airport from adjoining roads. Completed projects include the RCC, the widening of LeJeune Road (NW 42nd Avenue), the MIC core building, the rebuilding of the SR 826/SR 836 Interchange, direct connect ramps from the Airport to State Roads 836 and 112, the SR 826/NW 36th Street Interchange, the widening of Perimeter Road from NW 72nd Avenue to NW 57th Avenue to four lanes, and the NW 25th Street Viaduct East Project, which was completed in July 2016. See “AVIATION-RELATED DEBT – Other Airport-Related Debt – FDOT State Infrastructure Bank Loan” for a description of the NW 25th Street Viaduct East Project. The Viaduct Project involved two major parts: the roadway reconstruction and widening of NW 25th Street from the Palmetto Expressway (SR 826) to NW 89 Court and the construction of a viaduct. The viaduct, elevated about 30 feet, is situated mainly along the north side of NW 25th Street and connects with the existing east viaduct and then crosses over the expressway to a point just east of NW 82nd Avenue. The Viaduct Project began construction in June 2012 and was completed in July 2016. In 2015, MDX began construction on a new widening and re-alignment project for SR 836, from NW 17th Ave to NW 57th Ave. This project will improve capacity of the SR 836 mainline and includes the complete reconstruction and realignment of the SR 836/LeJeune Road interchange. The interchange reconstruction will enhance access and provide greater safety and efficiencies for accessing MIA from SR 836. The project is expected to be completed in 2019.
• In August 2015, MDX completed capacity improvements of the primary access to the Airport’s passenger terminal which were needed to balance MIA’s terminal roadway system with the Airport’s increased airfield and terminal capacity. This project, known as the “MIA Central Boulevard Widening, Realignment and Service Loop Project,” was constructed by MDX at no cost to the Aviation Department. Specifically, the project widened Central Boulevard from three to four lanes in the west-bound ingress direction and from four to five lanes in the east-bound egress direction. The improved roadway project provides links to the Airport’s major feeder roads and highways, such as LeJeune Road (NW 42nd Avenue), State Road 836, and State Road 112. Central Boulevard is now also the direct link to the RCC and the MIC.
• The MIC is a multi-phased development program that relieves area roadway congestion and improves access to the Airport by creating a regional transportation center east of LeJeune Road. The MIC acts as a remote ground transportation hub for MIA by relieving terminal curbside congestion. Its total cost was $2.043 billion. The primary structures include a separate MIC core building and the RCC, both of which were constructed by FDOT with loan proceeds from the United States Department of Transportation under the TIFIA loan program. The MIA Mover, funded through the CIP and $101.2 million in FDOT grants, connects the RCC to the Terminal Building and connects both the RCC and the Airport to the County’s Metrorail system. The MIA Mover began operations in September 2011. FDOT plans to construct other transportation-related facilities in the immediate area, all of which will be made commercially compatible with the RCC and the MIC core building.
The County’s responsibilities for the MIC project were primarily limited to (1) designing, constructing and operating the MIA Mover; (2) calculating CFCs sufficient to pay off the TIFIA loan secured by FDOT and imposing upon car rental companies the obligation to collect CFCs from their customers and remit them to a trustee; and (3) operating and maintaining the RCC and paying for the costs thereof from the CFCs. The CFCs are not Revenues.
Another roadway improvement under continued consideration consists of the widening and re-alignment of the eastern section of Perimeter Road from NW 57th Avenue to NW 42nd Court and connecting Perimeter Road to

44
NW 20th Street, which would allow the aviation fuel-farm to be enclosed within the Airport’s Airfield Operations Area. The project would include replacing the existing NW 15th Street bridge with a new bridge just south of the existing one. The proposed bridge will provide a more direct connection from Perimeter Road to NW 14th Street. A project book for the proposed replacement bridge has been completed. It is expected that the design and construction of this section of Perimeter Road will be eligible for federal and state funding. A Project Development and Environment study will need to be prepared in order to proceed with this project.
Airport Layout Plan – Miami International Airport Roadway Access Improvements
Source: Miami-Dade County Aviation Department.
Cargo and Other Facilities at the Airport
The Airport has a number of facilities that are used for cargo operations (mostly warehouse space), testing aircraft engines (aircraft engine test cell facilities), aircraft maintenance (both narrow-body and wide-body aircraft hangars), and aircraft flight crew training (flight simulators). These facilities are in three areas of the Airport: (i) the northeast area, which covers approximately 146 acres, (ii) the north central corridor, which covers 79 acres, and (iii) the northwest and west areas, which comprise 573 acres.
As of December 31, 2017, the Aviation Department managed approximately 8.74 million square feet of potentially rentable cargo and other facilities of the Airport outside of the Terminal including aircraft maintenance repair and overhaul facilities as well as hangars, office space, simulator bays and other training areas, aircraft engine repair, and aircraft engine testing facilities. Storage areas and operational support facilities make up the rest of the square footage managed by the Aviation Department. As of the end of Fiscal Year 2018, the leased facilities produced approximately $60.9 million in annual rental revenues ($36.8 million from buildings; $22.0 million from

45
land; and $2.1 million from pavement), which constitute approximately 7.7% of Fiscal Year 2018 operating revenues. This total does not include the $11.4 million in rental and other rental-related revenues generated from the general aviation airports during the same fiscal year.
Cargo plays a significant role in the financial health of the Airport. Annual revenues generated from the rental of cargo facilities, combined with Landing Fees of all-cargo airlines operating at MIA, totaled $71.9 million and $75.1 million for Fiscal Years 2017 and 2018, respectively. Cargo tonnage handled at the Airport increased 1.28% in Fiscal Year 2017 over Fiscal Year 2016 and 5.10% for the nine-month period ended June 30, 2018, over the same nine-month period of the prior year.
Prior to 2013, the majority of the MIA airfield development in the last 20 years had been for cargo handling facilities. On the west side of the Airport, three belly cargo buildings and three cargo buildings with direct aircraft access known as the Western “U” were developed by the Aviation Department and are leased to cargo tenants. Four other cargo buildings with direct aircraft access were constructed by the airlines in partnership with private developers and make up the Eastern “U.” In February 2013, a 500,000 square foot cargo facility containing 166,000 square feet of refrigerated warehouse built by Centurion Air Cargo, Inc. (“Centurion”) (in partnership with a developer) opened in the northeast section of the Airport. This development is the largest single tenant leasehold in the Airport.
All of the buildings in the Eastern “U” are operated by tenants or third parties under lease development agreements. United Airlines built a 118,000 square foot cargo facility (and has transferred its interest in this facility to AMB Codina MIA Cargo Center, LLC); Arrow Air completed a 127,089 square foot facility; and LAN (Chile) built an approximately 410,000 square foot cargo and office complex, which serves as LAN’s headquarters for its U.S. operations. These development lease agreements typically have terms of 20 to 30 years, and provide that each company pays ground rent to the Aviation Department during the period of the lease, and fair market rents on the facilities at the conclusion of the initial term. Each company constructed its facilities at its own cost, using its own source of financing.
Other cargo related facilities financed under lease development agreements include a 35,000 square foot courier facility built by UPS in 2001, which is located in the northwest area of the Airport and adjacent to a 157,000 square foot cargo facility already occupied by UPS. These facilities serve as UPS’s Latin American gateway hub. In 2012, DHL spent $21 million to expand its cargo warehouse to 130,000 square feet and made MIA its Latin American gateway. FedEx also built a 189,000 square foot facility along the north side of the Airport that was completed in 2004. Currently, the Airport has 2.6 million square feet of cargo facilities.
The aforementioned Centurion development was constructed under a 40-year development lease agreement with the County. This agreement was assigned to Aero Miami, III, LLC (“Aero Miami”) for the financing, design, construction and management of the warehouse, with both Centurion and Aero Miami serving as joint lessees under the lease. Centurion was also given the right to purchase from the County the Building 890/891 hangar facility for the sum of $6.4 million and paid that amount to the Aviation Department through Aero Miami’s construction of Taxiway “K” that runs adjacent to Centurion’s buildings, with any additional reimbursable cost of approximately $2 million, reimbursable to Aero Miami through ground rent credits. The Aviation Department reimbursed Aero Miami $2.8 million for environmental remediation costs of the warehouse site plus a contract-required interest payment of $500,000 payable to Aero Miami. The warehouse and hangar refurbishment received certificates of occupancy in February 2013 and the Taxiway K work was completed in 2014. The credits were applied accordingly and the developer began paying rent at the end of August 2014.
The Aviation Department is currently negotiating with Fed Ex and its developer for an additional 100,000 square foot warehouse facility contiguous to its existing 141,000 square foot facility known as Bldg. 831. This project will level ramp elevations on the west side of the facility. Moreover, an upsurge in demand for cargo warehouse space towards the end of 2017 makes it certain that the Department will not have any cargo warehouse vacancies (currently 281,347 square feet) by the middle of 2019.
In addition to the cargo facilities, the Aviation Department has a number of cargo loading (aircraft apron) positions located throughout the airfield that serve and support cargo operations at the Airport. Of the 110 “Cargo & Remote Hardstand Positions” mentioned above (see “AIRPORT SYSTEM FACILITIES - Airside Facilities”), 71 of these positions (as of December 31, 2018) are used primarily by cargo aircraft, and of this number 44 are common-

46
use positions that are assigned by the Aviation Department’s Airside staff, and the remaining 27 positions are on airline leasehold properties used exclusively by the air cargo tenants. Assignment of the common-use cargo loading positions is based on the location of airline cargo warehouse leaseholds, aircraft types, and operating schedules of the cargo airlines.
Three separate tenants have also negotiated the repair and upgrade of two hangars and an engine repair facility for approximately $9.1 million. The projects are subject to BCC approval and are to be completed by October 2021. Two will yield $334,600 annually in ground rent during the renovation and amortization period and the third will yield $204,600 annually for an eight year period. These yields increase to $1.02 million annually for the two hangar complexes after five years and $1.05 million for the engine repair facility after eight years.
MIA Pharma Hub Development
In 2015, the International Air Transport Association (“IATA”) designated MIA as the first “pharma hub” airport community in North America. The Aviation Department has been actively pursuing an initiative to grow the transport of pharmaceuticals at MIA by encouraging the local cargo business community to train and receive m the IATA Center of Excellence for Independent Validators Pharma Certification for the proper handling of temperature-sensitive pharma products. Working with MIA, a total of six members of the local cargo business community including two (2) airlines, two (2) ground handling companies and two (2) international freight forwarders have obtained IATA CEIV Pharma Certifications. The CEIV certification is an industry competence standard that builds expertise in properly handling pharma and generates opportunities for business growth in an already large industry. Total value of Pharma products transported through MIA increased by 70% since 2013 to nearly $4.64 billion in 2018 (through October). In addition to strengthening capacity of handling pharma, the “MIA Pharma Hub” business community lends itself to attracting pharma manufacturers to base their operations close to the local MIA cargo and logistics community and to MIA’s extensive international air route network. The pharma industry (as part of the Life Sciences industry) and the transport of pharma (Trade and Logistics industry), represent two of the top seven target industries of the County’s One Community One Goal initiative and are considered to be higher than average paying industries.
MIA Foreign Trade Zone Development
In an effort to expand and diversify its international business base, the Aviation Department gained final approval from the U.S. Department of Commerce to designate MIA as a Foreign Trade Zone (“FTZ”) Magnet Site. An FTZ lowers costs and increases profits for businesses by reducing taxes and import tariffs and providing logistical flexibility and supply chain security. Businesses located in an FTZ facility can defer, reduce, or eliminate customs duties on goods passing through the airport or during the process of applying value-added services to the goods. Accordingly, MIA can position itself to attract new types of business, increase trade, enhance air service development and diversify the airport’s revenue stream. Additionally, the MIA FTZ is expected to utilize currently vacant warehouse and office space at the Airport and create new jobs in the process.
The General Aviation Airports
In addition to MIA, the Aviation Department operates four (4) General Aviation Airports (the “GAAs”). Three (3) such GAAs are used for traditional general aviation activities such as fixed base operations, aircraft storage and maintenance facilities, and the fourth GAA is used primarily for training purposes. The following narrative describes the facilities at each of these airports.
Miami-Opa locka Executive Airport
The County acquired Miami-Opa locka Executive Airport (“OPF”), formerly Opa-locka Executive Airport, from the United States government in 1961. In 1962 the remainder of the former Naval Air Station Miami property, except for a portion reserved for the United States Coast Guard, was transferred to the County and became Opa-locka Executive Airport. In 1965, the U.S. Coast Guard Air Station Miami (“CGAS”) transferred its aircraft and operations from its Dinner Key installation to the Opa-locka Airport, re-establishing CGAS on site. OPF encompasses 1,810 acres, and it is considered a reliever airport for MIA.

47
OPF has three active runways. The two east-west runways are 8,002 feet and 4,306 feet in length, respectively, and 150 and 100 feet in width respectively, with one runway having two Instrument Landing Systems (“ILS”) and Category I capabilities. The southeast-northwest runway (the diagonal) is 6,800 feet in length and 150 feet in width, and also has ILS and Category I capability. Other facilities include corporate hangars, an aircraft rescue and firefighting facility and a Customs and Border Patrol private aircraft clearance facility. In addition, third parties operate or are in the process of developing a number of the facilities at OPF, including corporate hangars. The U.S. Coast Guard Air Station Miami; Miami-Dade County Police Department, Aviation Division; and Miami-Dade County Fire Department actively operate from OPF.
At OPF, there are currently over 500 acres leased for development. In 2007, the Aviation Department facilitated the release of large tracts of land held by developers since the late 1990s in order to accommodate various requests for additional facilities. Since that time, new facilities including corporate hangars, a fixed based operator (“FBO”) building, an air traffic control tower, offices, retail/industrial facilities and a United States Post Office distribution center were built. Total public and private investment at OPF since 2007 is approximately $127 million. OPF continues to grow with additional development underway that includes an additional FBO and a new 800,000 square-foot Amazon distribution center, equipped with the latest versions of Amazon Robotics and generating approximately 1,000 new full-time positions for Miami-Dade County area workers.
Miami-Executive Airport
Since its opening in 1967, Miami-Executive Airport (“TMB”), previously known as Kendall-Tamiami Executive Airport, has become one of the busiest general aviation airports in the United States, supporting 267,408 aircraft operations in 2018. TMB is a designated reliever airport for MIA. TMB’s property is composed of 1,360 acres.
TMB’s airfield consists of three active runways: two east-west runways of 6,000 feet and 5,002 feet in length, respectively, and 150 feet in width, and a southeast-northwest runway (diagonal) of 4,001 feet in length and 150 feet in width. The primary east-west runway is equipped with high intensity runway lighting, ILS and Category I capabilities; the secondary runways have medium intensity runway edge lighting. Facilities at TMB include FBOs, T-hangar bays, corporate hangars, an aviation museum and office space, some built by the Aviation Department and others by private parties. The County’s Police and Fire Departments’ aircraft are headquartered at TMB. The FAA operates the Air Traffic Control Tower. TMB has an airfield rescue and firefighting unit stationed at the airfield. Miami-Dade College’s Eig-Watson School of Aviation has a satellite campus located at TMB, which provides flight training programs. TMB also has a Customs and Border Patrol facility to service international traffic.
Among TMB’s major tenants are several aircraft maintenance businesses, FBOs, air taxi/charter operators, and flight schools. With its on-site aviation-related schools and the airport’s close proximity to businesses in the South Florida region, TMB has a significant number of flight training, corporate, and charter operations. TMB is also experiencing a robust amount of real estate development within its boundaries, with six private developers investing approximately $30 million over the last 10 years in new projects covering 75 acres of TMB land.
In February 2018 TMB started a 390 day Runway Incursion Mitigation Project (“RIM”) that, when completed, will provide users with a new Taxiway and Run-up area. RIM will also redesign existing runway intersections by narrowing the Taxiway entrances allowing only one aircraft at a time to enter the runway. The redesign will minimize the possibility of runway incursions.
TMB Airport continues to grow and as part of the development plans the following projects are underway or are in the planning stages:
1. The construction of two new hangars to replace hangars 102 and 109 – February 2019.
2. Security infrastructure facility improvements – replacing security gates from rollers to tracks and from wireless to fiber.
3. Creation of a new Aviation Mall at the main entrance of the airport – August 2019.

48
4. Extension of State Road 874 (Don Shula Ramp Expressway Connector) and widening of SW 128th Street will allow airport customers to have direct access to the highway – late 2019.
5. Custom border patrol private aircraft clearing facility pilot program to extend hours of operations.
Miami-Homestead General Aviation Airport
Miami-Homestead General Aviation Airport (“X-51”), which was completed in 1963 and was rebuilt after suffering significant windstorm damage from Hurricane Andrew in 1992, serves the general public, agricultural users and recreational sports aviation users in the southern portion of the County. X-51 is in close proximity to the Everglades National Park and 20 minutes from Biscayne National Park. It is the closest airport to the Homestead/Miami Speedway and a short 30-minute drive to Key Largo and the Ocean Reef Yacht Club. The airport is located on 960 acres in an agricultural community minutes west of South Dade business areas and the City of Homestead.
Since 1992 more than five million dollars has been invested in improvements at X-51, including new airfield signage and lighting, two FBOs, aircraft hangars and a self-service Jet-A and 100LL fuel dispensing station. X-51 has no landing fees.
Prior to June 30, 2020, X-51 will undergo a Security Enhancement Project partially funded by a grant from the Federal Department of Transportation in the amount of $764,500.00. The Aviation Department has identified the need for an Airport Operations Area Fence, Security Cameras, High Mast Lighting, and Airside to Landside Gates and Matrix card readers to provide an improved level of safety and to enhance security.
X-51’s airfield consists of three general aviation runways: an east-west runway 3,000 feet in length and 75 feet in width; a parallel east-west turf runway 2,500 feet in length and 150 feet in width, reserved for ultra-light and glider activity; and a north-south runway 4,000 feet in length and 100 feet in width. Each of the paved runways has parallel lighted taxiways and medium intensity edge lighting. All taxiway lights were upgraded to LED lighting in 2014.
The Dade-Collier Training and Transition Airport
The Dade-Collier Training and Transition Airport (“TNT”), located partially within Dade County and partially within Collier County, is approximately 46 miles west of MIA and was opened in 1970. It is used for commercial air carrier, military flight training, and private aircraft training. TNT’s property is composed of 24,960 acres, which includes approximately 900 acres of developed and operational land.
TNT consists of a single east-west runway (10,500 feet in length and 150 feet in width), equipped with high-intensity runway lights and pavement geometry configured for efficient operation of wide-body aircraft. The County owns all facilities at this airport. The ILS and medium intensity approach lighting system with runway alignment indicator lights has been decommissioned and is slated to be removed by the FAA this year.
The undeveloped property of TNT is managed and operated by the Florida Fish and Wildlife Conservation Commission. Environmental concerns for the environmental protection of the Everglades resulted in the negotiation of the Everglades Jetport Pact, which is a multi-party agreement among the County, the State, and the United States (acting through the Secretary of Transportation and the Secretary of the Interior) restricting the development of TNT to a single runway and a parallel taxiway.
The County is currently examining options to determine how best to maximize revenue from these extremely environmentally sensitive premises.

49
Airport Insurance
General Liability
The County maintains third party liability insurance coverage for bodily injury and property damage arising from airport operations at MIA and the GAAs. The limit of liability is $1 billion per occurrence, with a self-insured retention of $50,000 per occurrence, and an annual aggregate of $500,000. Terrorism coverage is provided under this program with a $1 billion limit per occurrence for Terrorist Acts Certified by the U.S. Secretary of the Treasury and $200 million in the aggregate for non-Certified Terrorist Acts.
Claims within the retention are administered by the County’s Internal Services Department – Risk Management Division. The program complies with and is subject to the limitations of Florida Statutes, Section 768.28, regarding claims against governmental bodies.
Property Insurance
Aviation Department property is insured under the countywide master program (the “Countywide Master Program”), which covers most County properties subject to policy terms and conditions. The program covers damage to real and personal property and includes coverage for boiler and machinery, flood and terrorism. Related loss prevention services are also provided under this program. The limit provided is $350 million with a $5 million deductible per occurrence for other than damage caused by terrorism or a named windstorm. For named windstorms, coverage is limited to $150 million with a $200 million deductible per occurrence. The County has $200 million in coverage subject to a $5 million per occurrence deductible for property damage caused by acts of terrorism. The current Countywide Master Program is effective through April 15, 2020.
Report of Insurance Consultant
The County has covenanted in the Trust Agreement to maintain a practical insurance program with reasonable terms, conditions, provisions and costs which the Aviation Director determines, with the approval of an independent risk management consultant (“Insurance Consultant”), will afford adequate protection against loss caused by damage to or destruction of all or any part of the Port Authority Properties and also such comprehensive public liability insurance on such properties for bodily injury and property damage and in such amounts as may be approved by the Insurance Consultant.
In its Trust Report and Insurance Program Review dated March 7, 2019 (the “2019 Insurance Program Review”), the Insurance Consultant, Siver Insurance Consultants, St. Petersburg Florida (“Siver”), concluded that, subject to comments included in the 2019 Insurance Program Review, the Aviation Department’s current insurance program complies with the requirements of the Trust Agreement. Siver indicates that during the last few years significant improvements have been made in the insurance program. However, the firm continues to caution that the amount of property insurance purchased may be inadequate to cover damage arising out of a catastrophic event.
While the 2019 Insurance Program Review makes a number of recommendations, it identifies four priority recommendations, all of which reflect that all property of the Aviation Department is covered by the Countywide Master Program. The priority recommendations are as follows:
(1) The purchase of a separate property insurance program insuring only the Aviation Department’s facilities.
(2) Increase the limit of property insurance, especially for named windstorm damage.
(3) Decrease the named windstorm deductible.
(4) Increase the coverage limits for property damage caused by terrorism.
50
All such priority recommendations are subject to availability of such changes at a reasonable cost. The Aviation Director has forwarded the 2019 Insurance Program Review to the Trustee and Co-Trustee as a part of the annual insurance report required by the Trust Agreement.
Representatives of the County, the County Internal Services Department and the Aviation Department continue to explore practical measures to address the concerns and recommendations of the Insurance Consultant. These measures include reducing the property insurance deductible, investigating other means to secure the deductible, and developing a plan for the allocation of property loss recoveries between the Airport System and other County properties. Neither the County nor the Aviation Department can, however, give any assurances that it will be practical to improve the insurance program to meet all the concerns and recommendations of the Insurance Consultant, within reasonable terms, conditions, provisions and costs.
To comply with certain federal regulations, on an annual basis, the County submits for review detailed information on the County’s property insurance programs to the Office of Insurance Regulation of the Florida Department of Financial Services. If the Office of Insurance Regulation determines the Countywide Master Program is not adequate, the County must acquire additional coverage or provide the Office of Insurance Regulation with a reasonable basis for not obtaining such coverage. The Office of Insurance Regulation has never determined the Countywide Master Program to be not adequate.
AIRPORT TRAFFIC ACTIVITY
The Airport offers an extensive network of air service, enhanced by multiple daily scheduled and non-scheduled flight frequencies covering 170 cities on five continents. Based on Official Airline Guide data for flights scheduled for the first quarter of 2019, from January 1, 2019 through March 31, 2019, the Airport’s stronghold market, the Latin America/Caribbean region, is served by more passenger flights from the Airport than from any other U.S. airport. In April 2019, Royal Air Maroc began operating three weekly flights to Morocco, marking the first passenger flights from MIA to Africa since 2000.
The Airport is a major transshipment point by air for the Americas. During 2017, the Airport handled 83% of all air imports and 79% of all air exports between the U.S. and the Latin American/Caribbean region. In the rankings for calendar year 2017, the Airport was the nation’s number one airport in international freight4 (excluding mail and transit freight) and third in international passenger traffic.
The Airport stimulates a host of industries such as tourism, the cruise industry and international banking and commerce. The Airport’s activities resonate throughout the State. For the 12 months ended September 2017, the Airport was the port of entry for 59.0% of all international passenger traffic arriving by air to the State. In terms of trade, Department of Commerce data for 2017, the most recent period for which such information is available, showed that the Airport handled 94% of the dollar value of the State’s total air imports and exports, and 40% of the dollar value of the State’s total air and sea trade internationally. The Airport is American Airline’s largest hub for international passengers and international cargo. American Airlines accounted for 60.0% of the enplaned passengers at the Airport during the 12-month period ended December 31, 2018, and together with its affiliate, Envoy Air Inc. which operates under the American Eagle brand, 67.0% of all enplaned passengers during such period.5
The following table reflects the Airport’s activity trends, including enplaned and deplaned passengers, landings and take-offs and enplaned and deplaned cargo during the last ten Fiscal Years.
[Remainder of page intentionally left blank.]
4 Although the Airports Council International (“ACI”) ranks Ted Stevens Anchorage International Airport (“ANC”) number one in its rankings, MIA excludes ANC from its rankings because of ANC’s particular methodology of accounting for freight. MIA’s total freight only reflects enplaned and deplaned freight, while ANC chooses to include a large amount of transit (same aircraft) freight. If ANC’s transit freight is excluded, MIA ranks first. Source: Miami-Dade County Aviation Department. 5 Unless otherwise noted, statistical data in this section was compiled by the Aviation Department.

51
AIRPORT TRAFFIC ACTIVITY TRENDS FOR MIAMI INTERNATIONAL AIRPORT (For the Fiscal Year Ended September 30)
Fiscal Year
Total Enplaned and
Deplaned Passengers
Percentage Change
Landings and Take-Offs
Percentage Change
Total Enplaned and
Deplaned Cargo (Tons)
Percentage Change
2009 33,875,470 -0.60% 348,487 -7.70% 1,699,219 -18.30% 2010 35,029,106 3.40 363,322 4.30 1,991,467 17.20 2011 37,633,119 7.40 386,233 6.30 2,006,722 0.802012 39,564,476 5.10 389,919 1.00 2,101,561 4.70 2013 40,115,305 1.40 393,355 0.88 2,134,943 1.60 2014 40,844,964 1.80 397,261 0.99 2,187,474 2.50 2015 43,347,129 6.13 405,896 2.17 2,206,306 0.86 2016 44,901,753 3.59 413,401 1.85 2,219,606 0.60 2017 43,758,409 -2.55* 407,160 -1.51* 2,247,913 1.28 2018 44,938,486 2.70 415,781 2.12 2,368,617 5.37
Three months
ended 12/31
2017 11,164,156 2.88 106,544 3.61 641,089 5.99 2018 11,269,982 0.95 104,488 -1.93 620,496 -3.21
Source: Miami-Dade County Aviation Department. *Hurricanes Matthew (Oct/2016) and Irma (Sept/2017) contributed to the decrease in total passengers and landings and take-offs in Fiscal Year
2017 when compared to the previous fiscal year.
The wide range of international air service, along with positive international air route development programs, contribute to the Airport’s importance as a worldwide international connecting hub for many air carriers. As indicated in the following table, the Airport ranked first in the United States in the number of tons of international cargo, excluding mail, and third in the number of international passengers in calendar year 2017. These statistics are summarized in the table below (the most recent period for which such information is available):
TOP FIVE U.S. AIRPORTS’ INTERNATIONAL ACTIVITY RANKINGS (For Calendar Year 2017)
International Enplaned/Deplaned Passengers International Enplaned/Deplaned Freight
(U.S. Tons)(1)
1. New York Kennedy (JFK) 32,431,419 1. Miami International (MIA) 1,946,619 2. Los Angeles (LAX) 24,151,229 2. Los Angeles (LAX) 1,301,188 3. Miami International (MIA) 21,473,311 3. Chicago O’Hare (ORD) 1,223,052 4. San Francisco (SFO) 13,425,328 4. New York Kennedy (JFK) 1,046,803 5. Newark (EWR) 12,903,546 5. Memphis (MEM) 636,758
Source: Airports Council International (“ACI”) and Miami-Dade County Aviation Department. (1) ACI rankings include Ted Stevens Anchorage International Airport (“ANC”). The Airport excludes ANC from its rankings because of ANC’s
particular methodology of accounting for freight. The Airport’s total freight reflects only enplaned and deplaned freight, while ANC chooses to include a large amount of transit (same aircraft) freight.
The top five U.S. airports based on the number of international passengers for the 12 months ended June 30, 2018 (the most recent data available), together with FLL, are listed below. Also shown below are the number of enplaned passengers and the percentage for the same airports for the 12 months ended September 30, 2007, which immediately preceded the most recent national economic recession.

52
INTERNATIONAL ENPLANED PASSENGERS (in thousands)
(Top Five U.S. Airports, Fort Lauderdale-Hollywood International Airport (FLL), All Other U.S. Airports)
12 Months Ended September 30, 2007 12 Months Ended June 30, 2018
Airport Passengers Percentage Airport Passengers Percentage
JFK 10,708 13.5% JFK 16,352 14.2%LAX 8,330 10.5 LAX 12,488 10.8MIA 7,763 9.8 MIA 10,552 9.1SFO 4,253 5.3 SFO 6,637 5.7EWR 5,279 6.6 EWR 6,630 5.7FLL 1,438 1.8 FLL 3,861 3.3Other U.S. Airports 41,789 52.5 Other U.S. Airports 59,034 51.2
Total 79,560 100.0% Total 115,554 100.0% Sources: U.S. DOT, Schedule T100.
The table below shows the number of domestic, international and total enplaned passengers for MIA and Fort-Lauderdale-Hollywood International Airport.
ENPLANED PASSENGERS MIAMI INTERNATIONAL AIRPORT VERSUS
FORT LAUDERDALE-HOLLYWOOD INTERNATIONAL AIRPORT (12 Months Ended September 30)
Miami Fort Lauderdale Domestic International Total Domestic International Total
2009 8,987,096 7,897,003 16,884,099 8,947,048 1,520,840 10,467,888 2010 9,179,436 8,225,894 17,405,330 9,260,615 1,652,303 10,912,918 2011 9,796,191 8,904,929 18,701,120 9,836,257 1,835,273 11,671,530 2012 10,155,304 9,528,373 19,683,677 9,962,653 1,779,080 11,741,733 2013 10,033,126 9,842,751 19,875,877 10,033,252 1,761,019 11,794,271 2014 10,342,784 9,877,147 20,219,931 9,844,866 2,179,848 12,024,714 2015 11,197,406 10,177,689 21,375,095 10,515,257 2,699,212 13,214,469 2016 11,774,663 10,379,626 22,154,289 11,329,962 3,022,648 14,352,610 2017 11,132,819 10,469,975 21,602,794 12,252,383 3,552,834 15,805,217 2018 11,571,473 10,648,950 22,220,423 13,358,448 4,302,731 17,661,179
Three
months ended 12/31
2017 2,821,475 2,658,569 5,480,044 3,062,420 955,386 4,017,806 2018 2,814,938 2,726,181 5,541,119 3,262,162 1,102,916 4,365,078
Source: Miami-Dade County Aviation Department; Broward County Aviation Department.
[Remainder of page intentionally left blank.]

53
The table below shows the top 10 domestic and international markets to and from which enplaning and deplaning passengers at MIA are traveling.
TOP TEN MARKETS AND TOTAL PASSENGERS (12 Months Ended June 30, 2018)
Domestic International
City Passengers Country Passengers
1. New York, New York 3,568,173 1. Brazil 1,695,819 2. Atlanta, Georgia 1,554,508 2. Colombia 1,409,214 3. Chicago, Illinois. 1,327,816 3. Cuba 1,344,731 4. Washington D.C. 1,318,184 4. Mexico 1,320,432 5. Dallas/Fort Worth, Texas 1,176,943 5. United Kingdom 984,152 6. Los Angeles, California 993,977 6. Dominican Republic 963,205 7. Orlando, Florida 785,984 7. Argentina 943,7638. Charlotte, North Carolina 751,615 8. Spain 813,890 9. Philadelphia, Pennsylvania 711,195 9. Panama 752,767 10. Boston, Massachusetts 704,544 10. Canada 731,212
Source: U.S. DOT Schedule, T100.
The table below shows (1) international enplaned and deplaned passengers as a percentage of total enplaned and deplaned passengers at MIA and (2) international cargo as a percentage of total cargo at MIA.
AIRPORT INTERNATIONAL ACTIVITY PERCENTAGES OF PASSENGERS AND CARGO
(For the Fiscal Year Ended September 30)
Fiscal Year
Enplaned and Deplaned International Passengers as a
Percentage of Total Passengers
Enplaned and Deplaned International Cargo as a
Percentage of Total Cargo
2009 47% 87% 2010 47 88 2011 48 88 2012 49 86 2013 50 87 2014 49 88 2015 48 87 2016 47 86 2017 49 86 2018 48 86
Source: Miami-Dade County Aviation Department.
[Remainder of page intentionally left blank.]

54
The table below shows the number and percentage of Origin-Destination enplaned passengers versus connecting enplaned passengers to the Caribbean, Central America and South America at each of the selected airports.
ENPLANED PASSENGERS FROM THE U.S. TO THE CARIBBEAN, CENTRAL AMERICA AND SOUTH AMERICA
AT SELECTED U.S. GATEWAY AIRPORTS
12 Months Ended June 30, 2018
Origin-Destination Enplaned Passengers
Connecting Enplaned Passengers
Airport O&D % of Total Connecting % of Total Total
Miami International (MIA) 4,428,830 60.3% 2,917,653 39.7% 7,346,483 New York (JFK - LGA - EWR) 4,709,256 86.7 723,025 13.3 5,432,281Fort Lauderdale (FLL) 1,928,418 69.6 842,154 30.4 2,770,572Atlanta (ATL) 456,538 20.5 1,772,291 79.5 2,228,829 Houston (IAH) Worth 440,2018 28.4 1,109,766 71.6 1,549,967 Orlando (MCO) 918,5263 87.9 126,593 12.1 1,045,119 Sources: U.S. DOT, Schedules T100; Air Passenger Origin-Destination Survey, reconciled to Schedules T100. Notes: Mexico not included. Connecting enplaned passengers includes domestic-to-international connections and international-to-
international connections on U.S. airlines. International-to-international connections on foreign-flag airlines are included with O&D figure.
The table below shows the number of outbound Origin-Destination passengers from MIA to the selected destinations for the past 10 Fiscal Years.
INTERNATIONAL ORIGIN-DESTINATION OUTBOUND PASSENGERS (In thousands)
Fiscal Year End September 30,
South America
Central America Mexico Caribbean
Transatlantic (Europe, Mid- East, Africa) Canada Total
2009 1,430 590 295 868 966 164 4,313 2010 1,464 566 301 906 963 215 4,415 2011 1,722 566 300 883 1,126 216 4,813 2012 1,950 619 355 933 1,227 233 5,317 2013 2,212 635 362 900 1,234 273 5,616 2014 2,209 612 341 865 1,214 204 5,445 2015 2,168 553 370 885 1,456 236 5,668 2016 2,202 585 463 965 1,666 235 6,115 2017 2,090 605 459 1,228 1,824 241 6,448 2018* 2,064 626 419 1,237 1,793 259 6,399
Sources: U.S. DOT, Schedule T100; U.S. DOT, Air Passenger Origin Destination Survey, reconciled to Schedule T100. Notes: Because foreign-flag carriers do not report passenger numbers to the U.S. DOT O&D Survey, estimates prepared by LeighFisher
were used to develop the data in the above table. Figures reflect passengers on scheduled flights only. Rows may not add to totals shown because of rounding. * For the 12 months ended June 30, 2018, the most recent data available.
Airlines Serving the Airport
As of December 31, 2018, scheduled service was provided at the Airport by 90 airlines; of these, 59 provide domestic or international passenger or passenger-cargo combination service, and 31 provide scheduled all-cargo service. The number of carriers providing scheduled service varies monthly. As of December 31, 2018, non-scheduled service on charter authority was provided by 12 airlines, five of which provide domestic or international passenger or passenger cargo combination service, and seven of which provide all cargo service.

55
59 SCHEDULED PASSENGER/CARGO COMBINATION CARRIERS
8 U.S. Scheduled Passenger/Cargo Combination Carriers, including Commuters
American Airlines* ExecAir American Eagle (Envoy Air)* Frontier Airlines* American Eagle (Republic Airways) Sun Country(1)
Delta Air Lines* United Airlines*
Source: Miami-Dade County Aviation Department. * Signatory Airline (1) This airline generally operates flights seasonally.
51 Foreign Scheduled Passenger/Cargo Combination Carriers
Aeroflot (Russia)* Jetairfly (Belgium) Aerolineas Argentinas (Argentina)* KLM (Netherlands)* Aeromexico (Mexico)* LATAM Airlines (Chile)* Aer Lingus (Ireland) LATAM Airlines Brazil (Brazil)* Air Canada (Canada)* LATAM Airlines Argentina (Argentina)* Air Europa (Spain)* LATAM Airlines Colombia (Colombia)* Air France (France)* LATAM Airlines Ecuador (Ecuador)* Air Italy (Italy)* LATAM Airlines Peru (Peru) Alitalia (Italy)* Lufthansa (Germany)* Aruba Airlines (Aruba)* Ocean Air dba as Avianca Brazil (Brazil)* Austrian Airlines (Austria)* Qatar Airways (Qatar)* Avianca (Colombia)* SAS Scandinavian Airlines (Scandinavia)* Avior (Venezuela)* Sunwing (Canada) (1) Bahamasair (Bahamas)* Surinam Airways (Suriname)* BOA - Boliviana de Aviacion (Bolivia)* Swiss International Airlines (Switzerland)* British Airways (United Kingdom)* TACA International (El Salvador)* Caribbean Airlines (Trinidad and Tobago)* TACA Peru (Peru)* Cayman Airways (Cayman Islands)* TAP Air Portugal (Portugal)* COPA (Panama)* TUIFLY (Netherlands) El Al Israel Airlines (Israel)* Turkish Airlines (Turkey)* Eurowings (Germany)* Virgin Atlantic (United Kingdom)* Finnair (Finland)(1)* Viva Air (Colombia)* Flair (Canada) (1) Volaris (Mexico)* GOL (Brazil) WestJet (Canada Iberia (Spain)* XL Airways (France)(1)* Interjet (Mexico)
Source: Miami-Dade County Aviation Department. * Signatory Airline (1) This airline generally operates flights seasonally.
[Remainder of this page intentionally left blank.]

56
31 SCHEDULED ALL CARGO CARRIERS
14 U.S. Scheduled All Cargo Carriers 17 Foreign Scheduled All Cargo Carriers
21 AIR* Aerounion (Mexico)* ABX Air* Asiana Airlines (Korea)* Aeronaves TSM (UPS feeder) Cargolux Airlines Int’l (Luxembourg)* Amerijet* Cathay Pacific Airways (Hong Kong)* Atlas Air (separate passenger charter service)* China Airlines (Taiwan)* DHL Express* DHL Aeroexpreso (Panama)* Federal Express (FedEx) Estafeta (Mexico)* IBC Airways Ethiopian Airlines (Ethiopia) Mountain Air Cargo (FedEx Feeder) KLM/Martinair Cargo (Holland)* Polar Air Cargo Korean Air (Korea)* SkyLease (Tradewinds Airlines)* LATAM Cargo Brazil (Brazil) Southern Air LATAM Cargo Chile (Chile)* United Parcel Service (UPS)* LATAM Cargo Colombia (Colombia)* Western Global Airlines(1) LATAM Cargo Mexico (Mexico)* Tampa Cargo, dba as Avianca (Colombia)* Transcarga Int’l Airways (Venezuela) Transportes Aereos Bolivianos (Bolivia)
Source: Miami-Dade County Aviation Department. * Signatory Airline (1) This airline generally operates flights seasonally.
12 NON-SCHEDULED SERVICE CARRIERS
5 U.S. Passenger/Cargo Combination Carriers 7 U.S. All Cargo Carriers
Aztec Airways Air Transport International Eastern Airlines* IFL Group Miami Air International* Kalitta Air* Swift Air* Martinaire Aviation World Atlantic Airlines* National Airlines* Northern Air Cargo* Sky Way Enterprises
Source: Miami-Dade County Aviation Department. * Signatory Airline
[Remainder of page intentionally left blank.]

57
Selected Carrier Activity
ENPLANED PASSENGERS
Three Months Ended December 31, Fiscal Year Ended September 30, 2018 2017 2018 2017 2016 2015
Number % of Total Number
% of Total Number
% of Total Number
% of Total Number
% of Total Number
% of Total
American Airlines 3,352,220 60.50% 3,231,862 58.98% 13,254,456 59.65% 12,902,731 59.73% 13,432,978 60.63% 12,951,451 60.59% American Eagle 370,409 6.68 397,314 7.25 1,570,196 7.07 1,349,019 6.24 1,239,302 5.59 1,113,411 5.21 Delta Airlines 309,390 5.58 309,064 5.64 1,333,523 6.00 1,360,904 6.30 1,341,937 6.06 1,238,827 5.80 United Airlines 148,783 2.69 171,567 3.13 679,655 3.06 672,516 3.11 561,016 2.53 451,431 2.11 Frontier 44,450 0.80 132,463 2.42 361,900 1.63 232,114 1.07 301,067 1.36 245,295 1.15 TAM Linhas Aereas 91,639 1.65 85,792 1.57 340,979 1.53 313,716 1.45 414,420 1.87 488,978 2.29 Swift Air 95,318 1.72 69,592 1.27 302,531 1.36 70,882 0.33 68,486 0.31 65,113 0.30 Avianca 106,287 1.92 59,563 1.09 294,100 1.32 338,972 1.57 329,901 1.49 328,390 1.54 COPA Airlines 73,652 1.33 65,066 1.19 279,757 1.26 259,371 1.20 243,876 1.10 245,369 1.15 British Airways 77,275 1.39 64,276 1.17 245,029 1.10 238,780 1.11 247,657 1.12 236,352 1.11 All Others 871,696 15.73 893,485 16.30 3,558,297 16.01 3,863,789 17.89 3,973,649 17.94 4,010,478 18.76 Total 5,541,119 100.00% 5,480,044 100.00% 22,220,423 100.00% 21,602,794 100.00% 22,154,289 100.00% 21,375,095 100.00%
Source: Miami-Dade County Aviation Department Note: Percentages may not total 100% due to rounding.
[Remainder of page intentionally left blank.]

58
COMMERCIAL AIRCRAFT LANDED WEIGHT (1,000 LBS.)
Three Months Ended December 31, Fiscal Year Ended September 30, 2018 2017 2018 2017 2016 2015
Number % of Total Number
% of Total Number
% of Total Number
% of Total Number
% of Total Number
% of Total
American Airlines 4,144,334 42.91% 4,026,532 41.80% 16,241,161 43.36% 16,376,922 44.27% 17,172,948 45.28% 16,610,363 45.23% American Eagle 419,449 4.34 473,193 4.91 1,771,506 4.73 1,682,254 4.55 1,473,176 3.88 1,338,893 3.65 AtlasAir 430,333 4.46 399,106 4.14 1,387,638 3.70 1,155,305 3.12 795,183 2.1 869,020 2.37 Delta Airlines 327,635 3.39 326,011 3.38 1,357,972 3.63 1,421,379 3.84 1,400,432 3.69 1,292,180 3.52 United Parcel Service 272,946 2.83 341,799 3.55 1,212,708 3.24 1,119,769 3.03 1,114,208 2.94 1,093,200 2.98 LATAM Airlines 177,378 1.84 216,230 2.24 752,475 2.01 900,105 2.43 898,995 2.37 843,778 2.3 Amerijet 175,040 1.81 202,563 2.10 703,924 1.88 618,770 1.67 629,702 1.66 688,280 1.87 United Airlines 156,411 1.62 181,641 1.89 701,602 1.87 677,940 1.83 588,685 1.55 706,564 1.92 Tampa Cargo S.A. 192,871 2.00 161,070 1.67 675,668 1.80 741,748 2.01 799,568 2.11 798,339 2.17 ABX Air 120,540 1.25 164,832 1.71 621,212 1.66 636,572 1.72 732,288 1.93 696,668 1.9 All Others 3,241,938 33.56 3,139,197 32.59 12,031,242 32.12 11,658,746 31.52 12,321,709 32.49 11,784,422 32.09 Total 9,658,875 100.00% 9,632,174 100.00% 37,457,108 100.00% 36,989,510 100.00% 37,926,894 100.00% 36,721,707 100.00%
Source: Miami-Dade County Aviation Department. *US Airways activity is reported under American Airlines beginning in January 2016. Note: Percentages may not total 100% due to rounding.
FLIGHT OPERATIONS (TAKE-OFFS AND LANDINGS)
Three Months Ended December 31 Fiscal Year Ended September 30, 2018 2017 2018 2017 2016 2015 Number % of Total Number % of Total Number % of Total Number % of Total Number % of Total Number % of Total
American Airlines 45,976 44.00% 45,040 42.27% 182,305 43.85% 180,747 44.39% 186,362 45.08% 182,029 44.85% American Eagle 13,515 12.93 45,676 13.77 57,105 13.73 52,113 12.80 45,689 11.05 44,467 10.96 Delta Airlines 4,576 4.38 4,768 4.48 19,501 4.69 20,694 5.08 20,371 4.93 18,463 4.55 United Airlines 2,197 2.10 2,427 2.28 9,567 2.30 9,424 2.31 8,173 1.98 6,777 1.67 United Parcel Service 2,030 1.94 2,423 2.27 8,811 2.12 7,976 1.96 7,952 1.92 7,829 1.93 Swift Air 1,913 1.83 1,654 1.55 6,798 1.63 1,839 0.45 1,743 0.42 1,468 0.36 Frontier 566 0.54 1,877 1.76 4,873 1.17 3,120 0.77 4,154 1.00 3,376 0.83 Atlas Air 1,640 1.57 1,427 1.34 4,769 1.15 3,633 0.89 2,324 0.56 2,103 0.52 Amerijet Int’l 1,094 1.05 1,464 1.37 4,515 1.06 4,178 1.03 4,591 1.11 4,474 1.10 ABX Air 758 0.73 1,096 1.03 4,085 0.98 4,227 1.04 4,999 1.21 4,972 1.22 All Others 30,223 28.92 29,692 27.87 113,452 27.29 118,757 29.17 127,538 30.85 130,787 32.22 Total 104,488 100.00% 106,544 100.00% 415,781 100.00% 407,160 100.00% 413,401 100.00% 405,896 100.00%
Source: Miami-Dade County Aviation Department. Note: Table reflects only commercial flights and excludes military and general aviation flights. Percentages may not total 100% due to rounding. *US Airways activity is reported under American Airlines beginning in January 2016.

59
Air Service Incentive Program
On October 15, 2015, the Airport’s fifth Air Service Incentive Program (“ASIP5”) was implemented by the Aviation Department. ASIP5 provides incentives for air carriers to establish scheduled domestic and international passenger flights, as well as freight flights from targeted international markets, by offering credits on Landing Fees for a maximum period of 12 months. In addition, ASIP5 offers separate incentive packages for passenger and freighter service initiated from Africa, Asia and the Middle East/Gulf markets by offering credits on Landing Fees for a maximum period of 24 months. ASIP5 also offers any carrier establishing scheduled, international, year-round passenger service to an international destination (city and/or airport) not currently served by MIA by any carrier, the opportunity to participate in a matching-funds advertising campaign to assist in promoting the new route. The Aviation Department will offer the carrier up to $50,000, to be matched with an equal amount from the carrier, to establish a mutually agreed upon advertising campaign. The collaborative advertising campaign provided under this incentive will begin at commencement of the qualifying new route and will conclude at the end of the 12-month benefit period. Service from Africa, Asia and the Middle East/Gulf markets will be offered up to $100,000 per year for two years. The new service associated with the marketing support incentive must operate for 12 consecutive months, and will then qualify for the second-year advertising funds allocation from the Aviation Department. Carriers choosing to arrive at MIA during designated off-peak hours at the Central or South Terminals will receive additional incentives. The primary goal of ASIP5 is to stimulate domestic passenger, international passenger and cargo service at the Airport, and to increase revenues at the Airport. Even with a waiver of Landing Fees, each new flight generates revenue, including, but not limited to, concourse user fees, terminal rental and other fees, PFCs, and concession revenues. The ASIP5 is no longer available to new carriers and promotions. The Airport’s sixth Air Service Incentive Program is expected to be approved in the spring of 2019.
The following airlines remain on the ASIP5: American Airlines (domestic passenger carrier), EL AL (foreign passenger carrier) and Turkish Airlines CARGO (foreign passenger carrier). These airlines will be receiving aggregate landing fee benefits totaling $194,976 at the conclusion of the respective promotional periods under ASIP5. In addition, El AL’s promotional period qualified for a second year under a separate incentive package offered under ASIP5 for service initiated from Africa, Asia and the Middle East/Gulf markets. Under the off-peak hour additional incentive, EL AL will also qualify for $200,000 per year in matching funds, for two separate years, from the Aviation Department for its collaborative advertising campaign. Turkish Airlines CARGO qualified for $25,000 for one year under a separate incentive package offered under ASIP5 for freighter service initiated from Africa, Asia and the Middle East/Gulf markets for its collaborative advertising campaign.
CAPITAL IMPROVEMENT PROGRAM
Overview
As part of its ongoing review of the Airport’s Master Plan, the Aviation Department is defining a path to optimize and expand the functionality of existing terminal building assets. Most of the terminal building (the North and South Terminals) was renovated and expanded as part of a capital program that began in 1994 and was substantially completed in 2014 (the “1994 CIP”). Those relatively small portions of the 1994 CIP that were not completed by 2014 were carved out from the 1994 CIP and have been referred to as the “CIP Carryover Projects.” The Central Terminal was largely untouched by the 1994 CIP, so in July 2015 the Aviation Department created the Terminal Optimization Program (the “TOP”), a 10-year capital program to modernize these older terminal facilities. The TOP was planned to be completed in two phases, Phase I from Fiscal Year 2015 to Fiscal Year 2018, and Phase II from Fiscal Year 2019 to Fiscal Year 2025. In July 2015, TOP Phase I was submitted to the MAAC as part of the MII review process resulting in a $651 million budget authorization. This original MII review was referred to as the TOP Baseline 2015 that consisted of four subprograms: MIA Central Base Apron & Utilities, Concourse E, South Terminal and Miscellaneous Projects.
As a result of the Airport’s changing facility needs, scope changes, additional projects and the need to expedite Phase II projects, the Aviation Department decided to merge the two phases into what is now referred to as the “TOP Rebaseline 2017.” The change was submitted for MII review in August 2017 and received authorization for a $1.45 billion budget from the MAAC. The TOP Rebaseline 2017 consists of the original, and in some cases expanded, four subprograms plus the addition of a new subprogram: Passenger Boarding Bridges. The TOP Rebaseline 2017 extended the schedule duration to Fiscal Year 2023.

60
The capital program has now evolved into the Capital Improvement Program (the “CIP”) in order to include work beyond the CIP Carryover Projects and the TOP. This approach allows the Aviation Department to address the Airport System’s needs as a whole, including airside, landside, cargo, terminal and general aviation projects. As the Airport System’s needs grow, the CIP will be adjusted to include more scope under the existing subprograms or potentially new subprograms. Currently, the CIP has the following fifteen subprograms: MIA Central Base Apron and Utilities, Concourse E, South Terminal, Miscellaneous Projects, Passenger Boarding Bridges, Central Terminal, North Terminal, Terminal Wide, Concourse G Projects, Concourse H Projects, Airside Projects, Landside Projects, Cargo Projects, General Aviation Airport Projects, and Reserve Maintenance Fund Projects.
The CIP by subprograms and funding sources is listed below as of December 31, 2018. The CIP budget below includes the $1.45 billion as approved through the MII review process in August 2017 as well as all the other Capital Projects planned (approximately $106.4 million) for the next Fiscal Year that do not require an MII review. Most of the CIP’s funding is to come from bond proceeds, PFC revenue and federal and state grants.
[Remainder of this page intentionally left blank.]

61
CAPITAL IMPROVEMENT PROGRAM FUNDING PLAN As of December 31, 2018
(in Thousands)
FUNDING SOURCES
Approved Budget
Pay-as-you-Go Future
TSA OTA
Reserve Maintenance
Fund Improvement
Fund Other
Bond Proceeds on Hand
Aviation
Subprogram FDOT Grants
FAA Grants
PFC Revenue
Revenue Bonds
MIA Central Base Apron & Utilities $ 108,482 $ 8,996 $35,668 $42,500 $ 21,318 Concourse E 404,678 56,378 8,735 $73,798 $ 3,576 $ 75,000 187,191 South Terminal 412,769 $101,161 31,003 3,389 2,221 274,995 Miscellaneous Projects 322,482 15,371 40,035 31,700 48,000 30,132 157,244 Passenger Boarding Bridges 77,850 68,300 9,550 Airside Projects 23,964 4,097 6,660 13,207 General Aviation Airports 28,012 2,359 4,152 900 4,453 16,148 North Terminal 8,523 7,860 $663 Central Terminal 4,516 4,516 Concourse G Projects 5,239 5,239 Concourse H Projects 3,219 3,219
Land Side Projects 22,852 12,675 10,177 Cargo Projects 2,300 2,300
Program Contingency 136,080 136,080 $1,560,966 $101,161 $118,204 $91,979 $142,500 $90,592 $72,849 $663 $127,285 $815,733

62
Details of the CIP
As of January 2019, the status of the TOP subprograms, which will be tracked as part of the CIP in the future, are as follows: the Central Base project is projected to start construction during the second quarter of calendar year 2019; most of the projects related to the Concourse E subprogram are completed and in use; South Terminal is progressing with the installation of the new outbound baggage handling system; the Miscellaneous Projects subprogram is progressing with the installation of the new Central Terminal ticket counters; and the Passenger Boarding Bridge subprogram has started with the fabrication of the first seven passenger boarding bridges.
More specifically, as of December 31, 2018, the CIP had incurred $389.5 million in costs out of the $1.56 billion total budget. The Concourse E and the South Terminal subprograms represent a major portion of these costs. The Concourse E renovation work has included replacing all the passenger boarding bridges, elevators, escalators, the train that connects Concourse E Satellite with Lower Concourse E, roof, and finishes (e.g., flooring and hold room seating); upgrading the life safety features; and rehabbing the Concourse E Satellite apron pavement area. The South Terminal work primarily has included the installation of a new roof at Concourse H and the ongoing installation of a new baggage handling system.
The MIA Central Base Apron and Utilities subprogram is expected to begin construction in the spring of 2019 for the primary purpose of adding needed aircraft parking hardstand positions in the northeast corner of the Airport. The first phase within this subprogram consists of (1) placing a culvert in the canal intersecting the northeast portion of the airfield so that the canal can be paved over as part of the airfield and (2) reconfiguring and resizing some of the existing aircraft parking apron in that area to increase the overall number of aircraft parking positions. The remainder of the adjoining area also will be paved to expand the number of aircraft parking hardstands.
The Capital Projects within the Concourse E subprogram are, for the most part, completed and in use; however, exterior painting, mechanical, and electrical work still needs to be done as well as the construction of a new chiller plant. A designer is currently being procured for this project.
The South Terminal subprogram primarily consists of enhancing and replacing the Central Terminal and South Terminal outbound baggage handling system. TSA has supported this project by awarding the Aviation Department a $101.2 million grant to pay for part of this project and allowing the Aviation Department to extend the grant expiration deadline. As of December 31, 2018, this project is about 41% complete and is estimated to be finished by the first quarter of 2021. This subprogram also includes the re-roofing of Concourse H, which has been completed, and the Concourse H Headhouse.
The Miscellaneous Projects subprogram includes a wide range of projects at MIA including construction of the Airport Operation Center, which groups operations and control functions into one location; relocation of the taxi lot to enable future airfield expansion; construction of an employee parking garage to accommodate the employee growth of all Airport tenants; replacement of the Central Terminal ticket counters that have been in place for 20 plus years; and rehabilitation of Taxiways R, S, T, extension of Taxiway R, and reconfiguration of Connector Taxiway M5. As of December 31, 2018, the Central Terminal H-G Ticket Counters installation is complete. Construction began on the taxiway project in March 2018; is about 15% complete; and is expected to be completed by the second quarter of 2021.
The Passenger Boarding Bridges (“PBB”) subprogram encompasses the replacement during the next five years of thirty-four (34) passenger boarding bridges throughout Concourses D, E, F, G, and potentially H. The Airport’s current bridges are over 20 years old and reaching the end of their useful lives. The scope includes the removal and disposal of the existing PBBs and the installation of new PBBs. As of December 31, 2018, the first seven PBBs are under fabrication and scheduled for installation by the end of 2019.
The remaining subprograms primarily represent Capital Projects that did not require an MII review by the MAAC. These projects include the installation of pre-conditioned air equipment on five of the Concourse G gates, the installation of a new jet fuel tank at MIA, and a number of projects at the general aviation airports.

63
* Future Capital Projects *
The Aviation Department’s Master Plan is in its final stages of preparation and will be presented to the Board in the second quarter of calendar year 2019. The Master Plan contemplates between $4.0 billion and $5.0 billion (including the $1.56 billion discussed in “Details of the CIP” above) in capital development by 2035 and beyond. In the near term, the Aviation Department is planning to redevelop a portion of the Central Terminal in the Concourse F area, to reconfigure the North Terminal aircraft apron parking and to reconfigure the ground loading regional jet operation at the west end of Concourse D (gate D60). The plans and budgets are nearing completion and will be presented to the MAAC in the second quarter of calendar year 2019 followed by an MII vote request.
FUNDING SOURCES FOR CAPITAL PROJECTS
Federal Grants
The Airport and Airway Improvement Act of 1982, as amended by the Airport and Airway Safety and Capacity Expansion Act of 1987 (the “FAA Act”), created the AIP. The AIP is administered by the FAA and funded by the Airport and Airway Trust Fund, which is financed through federal aviation user fees and taxes. Grants-in-aid funds for airport infrastructure improvements to enhance safety, security, capacity and access are made available to airport sponsors in the form of “entitlements” and “discretionary” allocations for eligible projects. The AIP “entitlement” grant amounts vary annually. Amounts are based on an airport’s level of enplaned passengers and air-cargo landed weight in the prior calendar year, the amount of funds appropriated by Congress, and any revisions to the statutory formula for calculating such funding. AIP “discretionary” funds are selectively disbursed based on the competitiveness of the project within the national priority system established by the FAA. They are also affected by Congressional actions.
As previously discussed, the FAA Act provided stability and predictability for the AIP program through Fiscal Year 2015. The Act also provided tools such as “multi-year” grants that allowed an airport to commence projects and be confident that future funding would be available to complete the projects. See “CERTAIN INVESTMENT CONSIDERATIONS – Federal Legislation” for a further discussion of the FAA Act and recent federal legislation extending the AIP through September 30, 2023.
Federal aviation grants apportioned (for entitlements) to the County for the last five Fiscal Years are as follows:
FEDERAL AVIATION GRANTS TO COUNTY Entitlement
Fiscal Year Passenger Cargo Discretionary Total
2014(1) $ 5,504,372 $ 6,020,940 $11,525,3122015(2) 5,612,523 5,596,994 11,209,5172016 12,436,857 4,507,536 16,944,393 2017 12,247,467 17,579,142 $10,065,104 39,891,713 2018 5,625,367 5,664,592 308,625 11,598,584
Source: FAA website and Miami-Dade County Aviation Department. (1) Fiscal Year 2014 grants funds were rolled over to Fiscal Year 2015. (2) Fiscal Year 2015 grants funds were rolled over to Fiscal Year 2016.
In Fiscal Years 2014 and 2015, the Aviation Department requested the FAA to roll over entitlement funds to Fiscal Year 2016 because the Aviation Department was assessing the TOP planning and implementation strategies for various projects. In Fiscal Year 2016, the County received $16,944,393 in FAA funding for (1) the construction of MIA E Satellite Passenger Loading Bridges and MIA Cc “H” Roof Replacement; (2) the design of
* Paragraph has been updated from the Preliminary Official Statement dated April 29, 2019.

64
MIA Taxiway “S,” “T” and “R” and M-5 Connector, and MIA Central Base Apron and Utilities Modification & Expansion; and (3) the design of TMB Taxiway A&D Connector and OPF Interior Service Road Phase 2 projects.
On August 29, 2018, the County received grants for a total amount of $11,598,584 from the FAA for construction work to be performed under: (1) MIA Rehabilitate Central Base Apron Phase 1A, Part A and MIA Expand Cargo Apron Bldg. 716, (2) MIA Acquire Ground Vehicle ADS-B Squitter Equipment and Installation and (3) Miami Executive Airport (TMB) RIM HS1 Taxiway H West Extension to Threshold Design Services. This project contains elements addressing Runway Incursion Mitigation issues identified by FAA at TMB.
State Grants
Aviation projects throughout the State are funded by the State through fuel taxes. Approximately 60% of state airport funding comes from the aviation fuel tax, with the remaining 40% generated by highway fuel taxes. State funding of aviation projects is made through the FDOT under Chapter 332 of the Florida Statutes. The State’s aviation grant funds are non-competitive grants for non-exclusive use capital projects that are similar to the scope and eligibility criteria of projects eligible for FAA funding. These grants are generally used to supplement federal and local funds by providing 50% of the County’s local share of eligible project costs at MIA and the GAAs when federal funds are available or 50% of the County’s eligible project costs at MIA and 80% at the GAAs when federal funds are available. FDOT personnel are authorized to commit State aviation grant funds through its five-year capital improvement program, known as the five-year work plan, to publicly owned, public use airports in the State. FDOT bases its grant allocations on FDOT funding policies that give priority to matching federal funds and projects involving safety, security, preservation and maintenance of facilities and capacity.
FDOT grants received by the County for the last five Fiscal Years are as follows:
Fiscal Year AIP Discretionary Total Collected
2014 $10,272,049 $9,022,093 $19,294,142 2015 17,946,782 4,742,311 22,689,093 2016 22,690,713 5,069,408 27,760,121 2017 15,590,683 80,000 15,670,683 2018 24,341,737 1,000,000 25,341,737
Source: FDOT website and Miami-Dade County Aviation Department.
Combining the Fiscal Year 2019 grant awards and the funding programmed in the Five-Year Work Plan for Fiscal Years 2020 through 2024, the Aviation Department is anticipating to receive a total of $131.7 million in FDOT funds.
In Fiscal Years 2019 and 2020, the following capital projects are slated to receive FDOT grant funding: MIA Taxiway R Realignment & Fuel Demolition with $8 million, MIA Terminal E Thru F Connector with $7.5 million, MIA Fuel Storage Facility Expansion (Fuel Tank) with $5 million, MIA Perimeter Road Widening & Realignment with $5 million, and Miami Executive Airport Taxiway Rehabilitation project with $2 million, MIA Central Base Apron & Utilities Modification Phase 1 $7.3 million, MIA South Terminal and GSE Facility with $5.5 million and MIA Consolidated Office Complex with $1.5 million.
Passenger Facility Charges
The Airport currently collects passenger facility charges (“PFCs”) of $4.50 on each passenger enplaned on an air carrier at the Airport, subject to certain limitations. PFCs must be used to finance specific eligible projects as described below. Currently, PFCs are capped at $4.50 per segment of flight (up to a maximum of $18.00 per round trip). In the past, proposed federal legislation has contemplated an increase of $2.00 to $4.00 per segment, but to date, no such increase has been authorized. See “CERTAIN INVESTMENT CONSIDERATIONS – Federal Legislation.”

65
The amount of PFC revenues will vary depending on actual levels of passenger enplanements at the Airport and, accordingly, no assurance can be given as to the timing or amount of PFC revenues that will be available. The FAA may terminate the Aviation Department’s ability to collect PFCs if the FAA determines that the Aviation Department is in violation of the PFC Act or the regulations promulgated under the PFC Act (“PFC Regulations”) or certain provisions of the Airport Noise and Capacity Act of 1990 (the “Noise Act”). Both the PFC Regulations and the Noise Act, however, provide procedural safeguards that limit the FAA’s ability to summarily terminate the Aviation Department’s ability to impose PFCs.
Under the PFC Regulations, PFC revenues can only be used to pay the costs of approved projects or debt service and financing costs associated with bonds issued for such projects. PFC revenues are currently not included in Revenues under the Trust Agreement and must be applied specifically as required by the PFC Regulations. Accordingly, PFC revenues are not pledged to or held by the Trustee for the benefit of the owners of the Bonds unless and until they are specifically pledged pursuant to a resolution of the Board. However, the County intends to continue its current practice of depositing a portion of the PFCs into the Sinking Fund at the beginning of each Fiscal Year, which is credited against the Principal and Interest Requirements on the Bonds for that particular Fiscal Year. Under the definition of Principal and Interest Requirements in the Trust Agreement, the County is allowed to exclude from the computation of Principal and Interest Requirements any funds set aside or deposited for purposes of paying debt service in that Fiscal Year. Therefore, in calculating its rate covenant requirement, the County reduces the Principal and Interest Requirements by the amount of PFC revenue set aside per the Annual Budget for debt service payment in that Fiscal Year, thus reducing the coverage amount otherwise required. See “SECURITY FOR THE SERIES 2019 BONDS – Rate Covenant.”
The balance in the PFC Revenue Account as of June 30, 2018, was $221 million. On October 4, 2018, the Aviation Department transferred $55 million in PFC revenues to the Sinking Fund for payment of Fiscal Year 2019 Principal and Interest Requirements.
The FAA authorized the Aviation Department to impose a PFC of $3 per passenger commencing November 1, 1994. On October 21, 2001, the FAA approved the collection of a PFC of $4.50 effective date of January 1, 2002. In December 2002, the FAA approved an application that enables the Aviation Department to use PFC revenues to pay debt service related to the North and South Terminal Programs. As mentioned under the heading “AVIATION-RELATED DEBT – Future Indebtedness; Other Capital Expenditures,” in Fiscal Year 2019, the Aviation Department plans to use PFC revenues to fund a portion of the TOP, which will require the Aviation Department to submit another PFC application to fund on a pay-as-you-go basis a portion of the PFC eligible project costs related to the TOP.
[Remainder of page intentionally left blank.]

66
The Aviation Department has been authorized to collect PFCs in the estimated aggregate amount of $2.6 billion, including interest. This authorization is currently scheduled to expire in October 2035. The amount of PFC collections from inception through December 31, 2018, was $1.3 billion. With interest, PFC collections were approximately $1.4 billion. Of this amount, the Aviation Department has expended $1.2 billion as of December 31, 2018. Under generally accepted accounting principles, PFCs are reported as non-operating revenues. Aviation Department annual PFC collections from inception through Fiscal Year 2018 are as follows:
Fiscal Year PFC Collections
1996 $38,187,434 1997 35,491,604 1998 36,424,124 1999 39,164,381 2000 35,707,692 2001 37,298,407 2002 42,868,403 2003 50,746,842 2004 53,877,379 2005 53,969,695 2006 51,978,979 2007 59,295,761 2008 60,822,212 2009 58,476,343 2010 61,682,383 2011 67,376,838 2012 71,090,000 2013 75,085,1132014 69,204,436 2015 82,235,233 2016 81,412,522 2017 79,504,021 2018 82,069,642
For the three-month period ended December 31, 2018, PFC collections were $21,017,542 versus
$19,446,248 for the corresponding period in 2017.
Reserve Maintenance Fund and Improvement Fund
Reserve Maintenance Fund monies are used to fund renewal and replacement projects. However, the Aviation Director in previous years has requested that some monies from the Revenue Fund be set aside in the Reserve Maintenance Fund to finance various major maintenance projects such as the Central Chiller and the replacement of the Concourse E Satellite Train, which is part of the TOP.
The Aviation Department has set aside $50 million in the Improvement Fund from the Fiscal Year 2014 surplus (the “2014 Surplus”) as authorized by the MAAC. Per the 2018 AUA, any surplus monies in the Improvement Fund resulting from better than expected financial results (i.e., actual revenues exceeding budgeted estimates and actual operating expenses being under budget), are to be used to offset the subsequent year’s expenses in the annual landing fee calculation unless the MAAC authorizes a set-aside, as it did in Fiscal Year 2014. Through December 2015, the MAAC has authorized usage of $2.5 million from the 2014 Surplus for the relocation of the Aviation Department’s identification badging office from the heliport to within the Terminal Building. In February 2016, the MAAC approved another $3.1 million set-aside from surplus Fiscal Year 2015 funds for start-up costs related to a new four million gallon fuel tank at MIA. In Fiscal Year 2017, the MAAC authorized the construction of an Airport employee parking garage, which is in the TOP Miscellaneous Projects subprogram, with funds from the 2014 Surplus.

67
Other Revenues
In Fiscal Year 2013, TSA issued a $101.2 million “other transaction agreement” (“OTA”) for MIA Checked Baggage Recapitalization Screening Design and Construction Services project for the South Terminal, which is included in the TOP under the South Terminal Projects subprogram. The Aviation Department received its first payment under the OTA in June 2016. The project is currently in its construction phase, and requests for reimbursement continue to be submitted under the OTA as project costs are incurred. The TSA grant expiration date has been extended to September 1, 2020.
Future Financings
Ordinances previously enacted by the Board to fund Airport capital projects have authorized the issuance of up to $6.2 billion in aviation revenue bonds, of which approximately $5,917,820,000 have been issued, with the remaining $282,180,000 having been authorized but not issued. Upon the issuance of the Series 2019 Bonds the full prior authorization will have been used. The Aviation Department expects to request authorization to fund approximately $552 million in revenue bonds required to finance the remaining portion of the current capital program in the next 12 to 18 months. Refunding Bonds are not limited by such authorizations.
AVIATION DEPARTMENT FINANCIAL INFORMATION
The tables included in this section present a summary of the financial operating results of the Port Authority Properties for Fiscal Year 2014 through Fiscal Year 2018 and for the three-month periods ended December 31, 2017 and December 31, 2018.
The information for the three-month periods ended December 31, 2017 and December 31, 2018, is unaudited. The information for Fiscal Years 2014 through 2018 is also derived from unaudited financial statements. The data should be read in conjunction with the audited financial statements and related notes included in “APPENDIX B – AUDITED FINANCIAL STATEMENTS OF THE AVIATION DEPARTMENT FOR THE FISCAL YEAR ENDED SEPTEMBER 30, 2018.”
Historical Financial Results
The following table presents a summary of revenues and expenses from Port Authority Properties for the five Fiscal Years ended September 30, 2018 and includes debt service coverage ratios for those five Fiscal Years. The method of presentation required under the Trust Agreement and presented in the following table is on a cash basis, which differs from the Aviation Department’s financial statements, which are prepared on an accrual basis in accordance with generally accepted accounting principles. The numbers in the summary do not constitute part of the audited financial statements of the Aviation Department. Attached as APPENDIX B are audited financial statements for the Aviation Department for the Fiscal Year ended September 30, 2018.
[Remainder of this page intentionally left blank.]

68
PORT AUTHORITY PROPERTIES HISTORICAL OPERATING RESULTS (in Thousands)* (Cash Basis, Unaudited)
Three Months Ended
December 31, Fiscal Year Ended
September 30, 2018 2017 2018 2017 2016 2015 2014
MIA Aviation Fees $ 91,005 $ 84,805 $379,777 $379,779 $393,812 $382,497 $372,581 Deposit from Improvement Fund(1) 9,791 12,105 97,709 87,220 81,427 77,336 95,974 Total MIA Aviation Fees $100,796 $ 96,910 $477,486 $466,999 $475,239 $459,833 $468,555 Commercial Operations: Management Agreements $ 20,454 $ 19,611 $ 79,545 $ 79,869 $ 84,800 $ 88,144 $ 86,229 Concessions 46,840 45,896 194,108 191,869 188,293 189,262 188,244 Total Commercial Operations $ 67,294 $ 65,507 $273,653 $271,738 $273,093 $277,406 $274,473 Rentals $ 35,015 $ 34,560 $139,188 $138,665 $134,933 $129,501 $121,540 Other Revenues 6,790 5,705 32,914 24,137 33,736 17,997 22,139 Sub-total Revenues $209,895 $202,682 $923,241 $901,539 $917,001 $884,737 $886,707 General Aviation Airports 2,000 2,447 8,559 11,612 8,547 8,109 7,372 Gross Revenues $211,895 $205,129 $931,800 $913,151 $925,548 $892,846 $894,079 Expenses: Current Expenses $ 69,793 $ 66,108 $388,053 $368,097 $353,597 $339,840 $323,331 Current Expenses under Mgmt. Agmt. 3,790 4,439 23,849 21,722 22,416 25,002 26,233 Current Expenses under Oper. Agmt. 9,896 9,740 42,969 40,155 39,541 37,989 37,571 Total Current Expenses $ 83,479 $ 80,287 $454,871 $429,974 $415,554 $402,831 $387,135 Net Revenues: Less: Reserve Maintenance Fund $128,416 $124,842 $476,929 $483,177 $509,994 $490,015 $506,944 Deposit 15,000 19,448 20,000 30,000 25,000 17,000 15,000 Net Revenues After Deposits $113,416 $105,394 $456,929 $453,177 $484,994 $473,015 $491,944 Total Debt Service N/A N/A $359,326 $363,068 $360,386 $362,028 $365,397 Less: PFC Revenue(used for d/s) N/A N/A 58,000 63,000 53,000 55,000 54,500 Debt Service N/A N/A $301,326 $300,068 $307,386 $307,028 $310,897 Debt Service Coverage(1)(2) N/A N/A 1.52x 1.51x 1.58x 1.54x 1.58x
Source: Miami-Dade County Aviation Department. (1) During each Fiscal Year, certain monies from the previous Fiscal Year remaining in the Improvement Fund are deposited in the Revenue Fund. The amount of such deposit is included as Revenues
and is required by the 2018 AUA to be taken into account in determining the amount of the landing fee rate required for the next succeeding Fiscal Year. (2) Calculated in accordance with the Trust Agreement by dividing Net Revenues after deposits by the required Debt Service amount. * Numbers may not total due to rounding. N/A = not applicable

69
Management’s Discussion of Financial Information
• Aviation fees, consisting mostly of concourse use fees and landing fees, remained flat in Fiscal Year 2018 as compared to Fiscal Year 2017. This result is due primarily to minimal changes in landing fee rates and concourse use fee rates along with the underlying terminal rental rate, which affects the basic concourse use fee rate.
• The Deposit from the Improvement Fund represents the surplus cash amount realized in the prior Fiscal Year that is transferred during the current Fiscal Year from the Improvement Fund to the Revenue Fund. The amount transferred varies but is relatively stable from year to year and is used to offset the landing fee requirement. Some of the surplus is not transferred back, but rather has been set aside in the Improvement Fund for capital projects as described below.
• In Fiscal Year 2018, the Aviation Department received $273.7 million in commercial revenues as compared to $271.7 million in Fiscal Year 2017, a $1.9 million or 0.70% increase. The greatest increase occurred in ground transportation, which increased by $1.7 million or 13.3%, primarily due to the increase in usage of Transportation Network Entities by MIA passengers. The other significant increase was in the food and beverage category, which increased $1.0 million or 4.5% over the prior Fiscal Year due to increased traffic, more food and beverage selections and passengers spending more money on a per passenger basis on food and beverage. Most other commercial revenue categories slightly increased or decreased over the previous Fiscal Year in terms of dollar amounts.
• Other Revenues increased by $8.8 million or 36.4% primarily due to the increase in interest income from some of the Trust Agreement funds, which in turn is due to the increase in investment interest rates experienced by the County.
• Operating or Current Expenses during Fiscal Year 2018 as compared to Fiscal Year 2017 increased by 5.8%. The major increase is reflected in salary/fringes primarily due to additional personnel, in order to adequately staff the Aviation Department for managing capital projects and to keep up with new regulations, demands, and programs underway and to mitigate any impact to the customer experience. In addition, outside contracts increased because of enhancements to existing contracts and contract escalation costs. Overall, the Aviation Department has sought to minimize increases in operating expenses over the last several Fiscal Years to offset the significant increases in debt service. The Aviation Department’s ultimate goal is to keep MIA air carriers’ costs per enplaned passenger reasonable.
• The Aviation Department had an extraordinary surplus in Fiscal Year 2015 because the actual operating expenses were significantly below, and the operating revenues above, the amounts budgeted. This surplus was set aside by the MAAC in the Improvement Fund and some was transferred to the Reserve Maintenance Fund as authorized by the Aviation Director to pay for certain Airport refurbishment projects. In the subsequent Fiscal Years, the surplus amounts have been modest with some monies being transferred to the Reserve Maintenance Fund to reflect the repayment by fuel flowage fees for fuel farm assets that were paid with Reserve Maintenance Fund monies in prior years and to pay for certain Airport refurbishment projects. See “FUNDING SOURCES FOR CAPITAL PROJECTS - Reserve Maintenance Fund and Improvement Fund” for further explanation.
• The Aviation Department implemented a personnel reduction plan that resulted in budgeted positions decreasing from a high of 1,664 in Fiscal Year 2006 to 1,206 in Fiscal Year 2012. A portion of the decrease in positions is due to removing police and fire personnel from the Aviation Department’s payroll and paying the County’s Fire Rescue and Police Departments directly for these services. Excluding the fire and police related changes, personnel went from a high of 1,772 in Fiscal Year 2006 to 1,491 in Fiscal Year 2012, a 15.9% decrease. For Fiscal Year 2019, the adopted budget allowed for an increase in personnel to 1,400, which is a difference of 194 positions or a modest 16.1% increase over seven years (since Fiscal Year 2012).

70
• The Aviation Department’s discretionary cash position has been increasing over the last few years as noted below, primarily due to the increase in the operating reserve requirement and a greater surplus build-up in the Improvement Fund. This build-up is due to the MAAC approving a $50 million set aside in the Improvement Fund in Fiscal Year 2015, which has been authorized by the MAAC to be used for relocating the employee identification badging area at MIA and for a new employee parking garage. As of December 31, 2018, $49.2 million is remaining in this set-aside. An additional $3.125 million set-aside was approved by the MAAC in Fiscal Year 2016 to provide initial funding for the design costs related to the purchase and installation of a new fuel tank at MIA. As of December 31, 2018, $2.5 million is remaining in this set-aside. Shown below is the Aviation Department’s operating cash position as of December 31, 2018, and September 30 for the Fiscal Years noted.
As of 12/31/2018 2018 2017 2016
Revenue Fund (1) $117,087,733 $104,492,845 $ 99,082,693 $110,082,711 Reserve Maintenance Fund 88,085,993 79,544,104 81,479,341 57,718,008 Improvement Fund (2) 208,162,505 213,405,684 208,767,537 201,097,911Total $413,336,231 $397,442,633 $389,329,571 $368,898,630
(1) Includes the operating reserve requirement which, as required by the Trust Agreement, was based on 17.0% of the Current Expense annual
budget amount for the respective Fiscal Years noted. (2) The Improvement Fund balances as of the end of the 2016-2018 Fiscal Years include an amount to be transferred back to the Revenue Fund
in the subsequent Fiscal Year as required by the 2018 AUA. For Fiscal Year 2018, the amount was $91.3 million, for Fiscal Year 2017, the amount was $97.7 million, for Fiscal Year 2016, the amount was $87.2 million.
In September 2018, the Board approved the Aviation Department’s Fiscal Year 2019 budget. This budget reflects a decrease in the landing fee from $1.67 per thousand pound unit (in Fiscal year 2018) to $1.62 per thousand pound unit; the Aviation Department’s expectation of a minimal (0.2%) increase in budgeted passengers or 22.8 million enplaned passengers; a $18.5 million, or 3.7%, increase in Current Expenses; use of $55.0 million in PFC revenues to pay debt service (compared to $58.0 million used in Fiscal Year 2018); and a decrease from $20.0 million to $15.0 million in the annual deposit to the Reserve Maintenance Fund. Overall debt service will decrease by $6.3 million and with the decrease in the PFC revenue contribution, the net debt service amount is decreased by $3.3 million. Total budgeted positions increased 2.5% from 1,366 in Fiscal Year 2018 to 1,400 in Fiscal Year 2019.
Other Post-Employment Benefits and Pension Benefits
The County provides paid medical and dental plans to active employees of the County. The County also provides retirees the opportunity to participate in the group employee health insurance plans. Employees who retire and begin receiving benefits under the Florida Retirement System and who were participants in the existing medical plan at the time of retirement are entitled to participate in the plan together with their eligible spouses and dependents. The County contributes to both the pre-65 and post-65 retiree medical coverage. The postretirement medical coverage is funded on a pay-as-you-go basis, where the County’s contribution is the actual amount of pay-as-you-go postemployment benefit payments less participant contributions for the period. Medical contributions vary based on plan and tier selected by the retiree. Retirees pay the full cost of dental coverage.
In June 2015, the Governmental Accounting Standards Board issued Statement No. 75 “Accounting and Financial Reporting for Postemployment Benefits Other Than Pensions” (“GASB No. 75”), which first became effective for the Aviation Department’s Fiscal Year ended September 30, 2018, and replaces the requirements of Statement No. 45, “Accounting and Financial Reporting by Employers for Postemployment Benefits Other Than Pensions, as amended.” This Statement addresses how state and local governments should account for and report their expenses and liabilities related to post-employment health care and other non-pension benefits referred to as other post-employment benefits (“OPEB”). This Statement requires the liability (“Total OPEB Liability”) of employers to be measured as the portion of the present value of projected benefit payments to be provided to current active and inactive employees that is attributed to the employees’ past periods of service. The greatest impact of GASB No. 75 on the Aviation Department is the inclusion of the Total OPEB Liability, which will reduce the Aviation Department’s Unrestricted Net Position and Total Net Position. Additionally, OPEB expense will no

71
longer be equal to annual OPEB costs, but instead will be equal to the change in Net OPEB Liability from year to year, with adjustments for deferred amounts. The Aviation Department will also be required to include more extensive footnote disclosures and supplementary schedules. As of September 30, 2018, the Aviation Department reported a Total OPEB Liability of approximately $23.9 million and an annual OPEB expense of approximately $1.2 million. During the Fiscal Year ended September 30, 2018, the Aviation Department contributed $1,365,000 towards retirees’ medical benefits on a pay-as-you-go basis. As of September 30, 2018, no assets have been segregated and restricted to provide postretirement benefits.
The annual OPEB expense and Total OPEB Liability is based on an actuarial valuation of the County’s postemployment benefit plan performed by Arthur J. Gallagher & Co. (“Gallagher”), an independent actuary firm. The actuary valuation report is prepared by Gallagher and provided to the County on a biennial basis, the latest actuarial valuation report was provided to the County in December 2018 with a valuation date as of September 30, 2018.
All of the decreases and increases associated with GASB No. 75 are accrual based accounting changes, and do not represent decreases or increases in cash or liquidity positions. The Aviation Department does not expect that implementation of GASB No. 75 will have any effect on the County’s ability to pay debt service on the Series 2019 Bonds.
In regard to pension benefits, the Aviation Department contributes to the Florida Retirement System (the “FRS”), a cost-sharing multi-employer plan administered by the State of Florida. Through Fiscal Year 2010, the Aviation Department’s pension plan was noncontributory. Beginning July 1, 2011, Aviation Department employees were required to make a 3% pretax contribution. Combined with the employees’ contribution, the County contributed 100% of the annual (Fiscal Year 2018) required contribution to the FRS, which is consistent with past practices by the County.
The Governmental Accounting Standards Board issued Statement No. 68, “Accounting and Financial Reporting for Pensions” (“GASB No. 68”) – an amendment to GASB Statement No. 27, “Accounting for Pensions by State and Local Governmental Employers,” which first became effective for the Aviation Department’s Fiscal Year ended September 30, 2015. As a participating employer, the Aviation Department implemented GASB No. 68, which requires an employer participating in cost-sharing multiple-employer defined benefit pension plans to report the employer’s proportionate share of the net pension liabilities of the defined benefit pension plans. The greatest impact of GASB No. 68 on the Aviation Department is the inclusion of the Aviation Department’s proportionate share of the FRS Net Pension Liability (the “Net Pension Liability”), which reduces the Aviation Department’s Unrestricted Net Position and Total Net Position. Additionally, pension expense is no longer equal to pension contributions made, but instead is equal to the change in net pension liability from year to year, with adjustments for deferred amounts. The Aviation Department is also now required to include more extensive footnote disclosures and supplementary schedules. As of September 30, 2018, the Aviation Department reported a Net Pension Liability of approximately $61.1 million and $17.3 million for its proportionate share of the FRS benefits and the Retiree Health Insurance Subsidy Program, respectively.
All of the decreases associated with GASB No. 68 are accrual based accounting changes, and do not represent decreases in cash or liquidity positions. The Aviation Department does not expect that implementation of GASB No. 68 will have any effect on the County’s ability to pay debt service on the Series 2019 Bonds.
Additional information can be found regarding OPEB and the funding of the pension plan in the footnotes section of “APPENDIX B – AUDITED FINANCIAL STATEMENTS OF THE AVIATION DEPARTMENT FOR THE FISCAL YEAR ENDED SEPTEMBER 30, 2018.”
COUNTY INVESTMENT POLICY
Pursuant to Florida Statutes, Section 218.415, which requires a written investment policy by the Board, the County adopted an investment policy (the “Investment Policy”) which applies to all funds held by or for the benefit of the Board in excess of those required to meet short-term expenses, except for proceeds of bond issues (including the Series 2019 Bonds) which are specifically exempted by Board ordinance or resolution.

72
The primary objectives of the Investment Policy, listed in order of importance are:
1. the safety of principal;
2. the liquidity of funds; and
3. the maximization of investment income.
The Investment Policy limits the securities eligible for inclusion in the County’s portfolio to a maximum maturity of five years. The Investment Policy allows investments in repurchase agreements with a maximum length to maturity of 14 days from the date of purchase; the collateral shall be “marked to market” as needed.
To enhance safety, the Investment Policy requires the diversification of the portfolio to control the risk of loss resulting from over-concentration of assets in a specific maturity, issuer, instrument, dealer, or bank through which the instruments are bought and sold. The Investment Policy also requires monthly performance reports to be presented to the County Clerk and to the County’s Finance Director, quarterly performance reports to be submitted to the Investment Advisory Committee and an annual report to be presented to the Board within 120 days of the end of the Fiscal Year.
The Investment Policy may be modified by the Board as it deems appropriate to meet the needs of the County.
TAX MATTERS
General – Opinions
The following discussion is a summary of the opinions of Bond Counsel to the County that are to be rendered on the tax status of interest on the Series 2019 Bonds and of certain federal income tax considerations that may be relevant to prospective purchasers of the Series 2019 Bonds. This summary is based on existing law, including current provisions of the Internal Revenue Code of 1986, as amended (the “Code”), existing and proposed regulations under the Code, and current administrative rulings and court decisions, all of which are subject to change.
Upon issuance of the Series 2019 Bonds, Bond Counsel to the County will provide their opinions, expected to be in the proposed forms set forth in APPENDIX D, to the effect that, under existing law, as currently enacted and construed, and subject to the assumptions described under “Series 2019A Bonds” below: (i) interest on the Series 2019A Bonds is excludable from gross income for federal income tax purposes, except for interest on any Series 2019A Bonds for any period during which such Series 2019A Bonds are held by a person who is a “substantial user” of the facilities financed or a “related person,” as those terms are used in Section 147(a) of the Code; (ii) interest on the Series 2019A Bonds is an item of tax preference for purposes of the federal alternative minimum tax imposed on individuals; and (iii) the Series 2019 Bonds and the income thereon will not be subject to taxation under the laws of the State of Florida, except as to estate taxes and taxes under Chapter 220, Florida Statutes, on interest, income or profits on debt obligations owned by corporations as defined in said Chapter 220. INTEREST ON THE SERIES 2019B BONDS IS NOT EXCLUDABLE FROM GROSS INCOME FOR FEDERAL INCOME TAX PURPOSES.
Series 2019A Bonds
The foregoing federal tax opinions as to excludability of interest on the Series 2019A Bonds from federal gross income will assume continuing compliance by the County with certain requirements of the Code that must be met subsequent to the issuance of the Series 2019A Bonds. The County will certify, represent and covenant to comply with such requirements. Failure to comply with such requirements could cause the interest on the Series 2019A Bonds to be included in gross income, or could otherwise adversely affect such opinions, retroactive to the date of issuance of the Series 2019A Bonds.

73
If a holder purchases a Series 2019A Bond for an amount that is greater than its stated redemption price at maturity (a “Premium Series 2019A Bond”), such holder will be considered to have purchased the Premium Series 2019A Bond with “amortizable bond premium” equal in amount to such excess. A holder must amortize such premium using a constant yield method over the remaining term of the Premium Series 2019A Bond, based on the holder’s yield to maturity. As bond premium is amortized, the holder’s tax basis in such Premium Series 2019A Bond is reduced by a corresponding amount, resulting in an increase in the gain (or decrease in the loss) to be recognized for federal income tax purposes upon a sale or other disposition of the Premium Series 2019A Bond prior to its maturity. No federal income tax deduction is allowed with respect to amortizable bond premium on a Premium Series 2019A Bond. Purchasers of the Premium Series 2019A Bonds with amortizable bond premium should consult with their own tax advisors regarding the proper computation of amortizable bond premium and the state and local tax consequences of owning such Premium Series 2019A Bonds.
Owners of Premium Series 2019A Bonds should consult their own tax advisers as to the determination for federal income tax purposes of the amount of bond premium properly accruable in any period and as to other federal tax consequences, and the treatment of bond premium for purposes of state and local taxes on, or based on, income.
Except as described above under “General – Opinions”, Bond Counsel will express no opinion regarding the federal income tax consequences resulting from the receipt or accrual of the interest on the Series 2019A Bonds, or the ownership or disposition of the Series 2019A Bonds. Prospective purchasers of Series 2019A Bonds should be aware that the ownership of Series 2019A Bonds may result in other collateral federal tax consequences, including (a) the denial of a deduction for interest on indebtedness incurred or continued to purchase or carry the Series 2019A Bonds, (b) the reduction of the loss reserve deduction for property and casualty insurance companies by the applicable statutory percentage of certain items, including the interest on the Series 2019A Bonds, (c) the inclusion of the interest on the Series 2019A Bonds in the earnings of certain foreign corporations doing business in the United States for purposes of a branch profits tax, (d) the inclusion of the interest on the Series 2019A Bonds in the passive income subject to federal income taxation of certain Subchapter S corporations with Subchapter C earnings and profits at the close of the taxable year and (e) the inclusion of interest on the Series 2019A Bonds in the determination of the taxability of certain Social Security and Railroad Retirement benefits to certain recipients of such benefits. The nature and extent of the other tax consequences described above will depend on the particular tax status and situation of each owner of the Series 2019A Bonds. Prospective purchasers of the Series 2019A Bonds should consult their own tax advisors as to the impact of these other tax consequences.
The IRS has an ongoing program of auditing state and local government obligations, which may include randomly selected bond issues for audit, to determine whether interest paid to the holders is properly excludable from gross income for federal income tax purposes. It cannot be predicted whether the Series 2019A Bonds will be audited. If an audit is commenced, under current IRS procedures the holders of the Series 2019A Bonds may not be permitted to participate in the audit process. Moreover, public awareness of an audit of the Series 2019A Bonds could adversely affect their value and liquidity.
Bond Counsel to the County will render their opinions as of the issuance date, and will assume no obligation to update their opinions after the issuance date to reflect any future facts or circumstances, or any future changes in law or interpretation, or otherwise. Moreover, the opinions of Bond Counsel are not binding in the courts on the IRS; rather, such opinions represent Bond Counsel’s legal judgment based upon their review of existing law and upon the certifications, representations and covenants referenced above.
Interest paid on Series 2019A Bonds such as the Series 2019A Bonds is subject to information reporting to the IRS in a manner similar to interest paid on taxable obligations. This reporting requirement does not affect the excludability of interest on the Series 2019A Bonds from gross income for federal income tax purposes. However, in conjunction with that information reporting requirement, the Code subjects certain non-corporate owners of Series 2019A Bonds, under certain circumstances, to “backup withholding” at the rates set forth in the Code, with respect to payments on the Series 2019A Bonds and proceeds from the sale of Series 2019A Bonds. Any amount so withheld would be refunded or allowed as a credit against the federal income tax of such owner of Series 2019A Bonds. This withholding generally applies if the owner of Series 2019A Bonds (i) fails to furnish the payor such owner’s social security number or other taxpayer identification number (“TIN”), (ii) furnished the payor an incorrect TIN, (iii) fails to properly report interest, dividends, or other “reportable payments” as defined in the Code, or (iv) under certain circumstances, fails to provide the payor or such owner’s securities broker with a certified statement,

74
signed under penalty of perjury, that the TIN provided is correct and that such owner is not subject to backup withholding. Prospective purchasers of the Series 2019A Bonds may also wish to consult with their tax advisors with respect to the need to furnish certain taxpayer information in order to avoid backup withholding.
From time to time, there are legislative proposals suggested, debated, introduced or pending in Congress that, if enacted into law, could alter or amend one or more of the federal tax matters described above including, without limitation, the excludability from gross income of interest on the Series 2019A Bonds, adversely affect the market price or marketability of the Series 2019A Bonds, or otherwise prevent the holders from realizing the full current benefit of the status of the interest thereon. It cannot be predicted whether or in what form any such proposal may be enacted, or whether, if enacted, any such proposal would apply to the Series 2019A Bonds. If enacted into law, such legislative proposals could affect the market price or marketability of the Series 2019A Bonds. Prospective purchasers of the Series 2019A Bonds should consult their tax advisors as to the effects of any proposed or pending legislation.
Series 2019B Bonds (Taxable)
In General
INTEREST ON THE TAXABLE BONDS IS NOT EXCLUDABLE FROM GROSS INCOME FOR FEDERAL INCOME TAX PURPOSES. In general, prospective purchasers of the Taxable Bonds should consult their tax advisors regarding the federal, state, local, and foreign tax consequences of acquisition, ownership, and disposition of Taxable Bonds. For example, the legal defeasance of the Taxable Bonds may result in a deemed sale or exchange of the Taxable Bonds under certain circumstances, with concomitant tax consequences.
The following summary is not a complete analysis or description of all potential U.S. federal tax considerations that may be relevant to, or of the actual tax effect that any of the matters described herein will have on, a particular Owner of Taxable Bonds, and is generally limited to U.S. Owners. “U.S. Owners” are beneficial Owners of the Taxable Bonds that for U.S. federal income tax purposes are individual citizens or residents of the Unites States, corporations or other entities taxable as corporations created or organized in or under the laws of the United States or any state or the District of Columbia, and certain estates or trusts with specific connections to the United States. As used in this summary, the term “Non-U.S. Owner” means a beneficial Owner of Taxable Bonds that is not a U.S. Owner.
In particular, this summary does not address (a) special classes of taxpayers that are subject to special treatment under the federal income tax laws, such as S corporations, mutual funds, insurance companies, financial institutions, small business investment companies, regulated investment companies, real estate investment trusts, grantor trusts, former citizens of the United States, broker-dealers, traders in securities, and tax-exempt organizations, (b) persons that own Taxable Bonds as a hedge against, or as obligations that are hedged against, currency risk, or that are part of a hedge, straddle, conversion, or other integrated transaction, or (d) persons whose functional currency is not the U.S. dollar. This summary also does not address the tax consequences to an Owner of Taxable Bonds held through a partnership or other pass-through entity treated as a partnership for federal income tax purposes. Partnerships holding Taxable Bonds, and partners in such partnerships, should consult their tax advisors regarding the tax consequences of an investment in the Taxable Bonds, including their status as U.S. Owners.
Further, this discussion is limited to persons purchasing the Taxable Bonds for cash in this original offering at the respective prices indicated on the inside front cover of this Official Statement (the “issue prices”). Owners that purchase the Taxable Bonds at prices other than their respective issue prices or after their original execution and delivery should consult their tax advisors regarding other tax considerations, such as market discount, as to all of which Bond Counsel expresses no opinion. This discussion assumes that the Taxable Bonds will be held as capital assets within the meaning of Code Section 1221.

75
Certain U.S. Federal Income Tax Consequences to U.S. Owners
Interest. In general, interest paid or accrued on the Taxable Bonds, generally will be taxable to a U.S. Owner as ordinary interest income at the time such amounts are accrued or received, in accordance with the U.S. Holder’s method of accounting for federal income tax purposes. Under recently-enacted legislation known as the Tax Cuts and Jobs Act, U.S. Owners that use an accrual method of accounting for U.S. federal income tax purposes generally are required to include certain amounts in income no later than the time such amounts are reflected on certain financial statements. This rule generally is effective for tax years beginning after December 31, 2017, (or, for debt securities issued with original issue discount, for tax years beginning after December 31, 2018). Accrual method U.S. Owners should consult their tax advisors regarding the potential applicability of this rule to their particular situation.
Disposition of the Taxable Bonds. Upon the sale, exchange, retirement, or other taxable disposition of a Bond, a U.S. Owner, in general, will recognize gain or loss equal to the difference between the amount realized from the sale, exchange, retirement, or other disposition and the Owner’s adjusted basis, or applicable portion of the adjusted basis, in the Taxable Bond. The Owner’s adjusted basis generally will equal the Owner’s cost of the Taxable Bond, reduced by any principal payments (and any other payments on the Taxable Bonds not treated as qualified stated interest). Any such gain or loss generally will be long-term capital gain or loss, provided that the Taxable Bonds have been held for more than one year at the time of disposition. Net long-term capital gain recognized by an individual U.S. Owner generally will be subject to tax at a lower rate than that for net short-term capital gain or ordinary income. The deductibility of capital losses is subject to limitations.
Additional Tax on Net Investment Income. An additional 3.8% tax is imposed on the “net investment income” of certain U.S. citizens and residents, and on the undistributed “net investment income” of certain estates and trusts. Among other items, “net investment income” generally includes gross income from interest and certain net gain from the sale, exchange, redemption, or other taxable disposition of a debt instrument that produces interest, minus certain deductions. A U.S. Owner that is an individual, estate, or trust should consult its tax advisor regarding the applicability of this additional tax.
Information Reporting and Backup Withholding. The Trustee must report annually to the IRS and to each U.S. Owner any interest payable to the U.S. Owner, subject to certain exceptions. A non-corporate U.S. Owner of the Taxable Bonds may be subject to backup withholding (currently at a rate of 24%) with respect to “reportable payments,” which include interest paid on the Taxable Bonds and the gross proceeds of a sale, exchange, redemption, or retirement of the Taxable Bonds, unless the Owner provides an accurate taxpayer identification number and certifies on an IRS Form W-9, under penalties of perjury, that the Owner is not subject to backup withholding and otherwise complies with applicable requirements of the backup rules or otherwise establishes an exemption.
Certain U.S. Federal Income Tax Consequences to Non-U.S. Owners
Interest. Subject to the discussion below under “Application of Foreign Account Tax Compliance Act”, interest on any Taxable Bond owned by a Non-U.S. Owner is generally not subject to U.S. federal income or withholding tax, provided that:
• the Non-U.S. Owner does not own, actually or constructively, 10% or more of the total combined voting power of all classes of voting stock of the Issuer, and is not a controlled foreign corporation related to the Issuer, directly or indirectly, through stock ownership;
• the Non-U.S. Owner is not a bank receiving such interest in the manner described in Code Section 881(c)(3)(A); and
• the Non-U.S. Owner certifies on IRS Form W-8BEN or W-8BEN-E, under penalties of perjury, that it is not a United States person. Special certification rules apply to Bonds that are held through foreign intermediaries.

76
If, however, a Non-U.S. Owner is engaged in a trade or business in the United States, and if interest on the Taxable Bonds is effectively connected with the conduct of such trade or business (and, if an income tax treaty applies, the interest is attributable to a permanent establishment or fixed base maintained by the Non-U.S. Holder in the United States), such interest will be subject to U.S. federal income tax in a manner similar to that for Taxable Bonds owned by a U.S. Owner, as described above, and, in the case of a Non-U.S. Owner that is a foreign corporation, may also be subject to an additional branch profits tax (currently imposed at a rate of 30%, or a lower applicable treaty rate) on its effectively connected earnings and profits, subject to adjustments. Non-U.S. Owners should consult their tax advisors regarding the tax consequences of owning the Taxable Bonds.
Disposition of the Taxable Bonds. Subject to the discussion below under “Application of Foreign Account Tax Compliance Act”, a Non-U.S. Owner generally will not be subject to U.S. federal income or withholding tax on any amount of gain recognized by the Non-U.S. Owner upon the sale, exchange, retirement, or other taxable disposition of a Taxable Bond unless:
• the gain is effectively connected with the conduct of a trade or business in the United States by the Non-U.S. Owner (and, if an income tax treaty applies, is attributable to a permanent establishment or fixed base maintained by the Non-U.S. Owner in the United States); or
• in the case of an individual, the Non-U.S. Owner is present in the United States for 183 days or more in the taxable year in which the sale, exchange, retirement, or other taxable disposition takes place and certain other conditions are met.
Application of Foreign Account Tax Compliance Act. The Foreign Account Tax Compliance Act (“FATCA”) generally imposes a 30% withholding tax on interest payments and gross proceeds from the sale of interest-bearing obligations for payments made after the relevant effective date to (i) certain foreign financial institutions that fail to certify their FATCA compliance and (ii) non-financial foreign entities if certain disclosure requirements related to direct and indirect United States shareholders and/or United States accountholders are not satisfied.
Under applicable Treasury Regulations and administrative guidelines, a 30% FATCA withholding tax generally will be imposed, subject to certain exceptions, on payments of (i) interest on Taxable Bonds and (ii) gross proceeds from the sale or other disposition of Taxable Bonds on or after January 1, 2019, where such payments are made to persons described in the immediately preceding paragraph.
While FATCA withholding would also have applied to payments of gross proceeds from the sale or other disposition of Taxable Bonds on or after January 1, 2019, recently proposed Treasury Regulations eliminate FATCA withholding on payments of gross proceeds entirely. Taxpayers generally may rely on these proposed Treasury Regulations until final Treasury Regulations are issued.
With respect to payments made to a “foreign financial institution” either as a beneficial owner or as an intermediary, the FATCA withholding tax generally will be imposed, subject to certain exceptions, unless such institution (i) enters into (or is otherwise subject to) and complies with an agreement with the U.S. government (a “FATCA Agreement”) or (ii) is required by and complies with applicable foreign law enacted in connection with an intergovernmental agreement between the United States and a foreign jurisdiction (an “IGA”), in either case to, among other things, collect and provide to the United States or other relevant tax authorities certain information regarding U.S. account holders of such institution. With respect to payment made to a foreign entity that is not a financial institution (as a beneficial owner), the FATCA withholding tax generally will be imposed, subject to certain exceptions, unless such entity provides to the withholding agent a certification that such entity does not have any “substantial” U.S. owner (generally, any specified U.S. person that owns, directly or indirectly, more than a specified percentage of such entity) or identifies its “substantial” U.S. owners.
If the Taxable Bonds are held through a foreign financial institution that inters into (or is otherwise subject to) a FATCA Agreement, subject to certain exceptions, such foreign financial institution (or, in certain cases, a person paying amounts to such foreign institution) generally will be required to withhold the 30% FATCA tax on the payment of dividends or the items described above made to (i) a person (including an individual) that fails to

77
comply with certain information requests, or (ii) a foreign financial institution that has not entered into (and is not otherwise subject to) a FATCA Agreement, and that is not required to comply with FATCA pursuant to applicable foreign law enacted in connection with an IGA. Coordinating rules may limit duplicative withholding where the withholding described above under “Information Reporting and Backup Withholding” also applies.
If any amount of, or in respect of, U.S. withholding tax were to be deducted or withheld from payments made on Taxable Bonds because of a failure by the investor (or an institution through which an investor holds the Taxable Bonds) to comply with FATCA, none of the County, any paying agent, or any person would, pursuant to the terms of the Taxable Bonds, be required to pay additional amounts with respect to any Taxable Bonds because of the deduction or withholding of such tax. Non-U.S. Owners should consult their tax advisors regarding the application of FATCA to the ownership or disposition of Taxable Bonds.
CONTINUING DISCLOSURE
The County has covenanted in the Series 2019 Resolution, in accordance with the provisions of, and to the degree necessary to comply with, the continuing disclosure requirements of Rule 15c2-12, as amended (“Rule 15c2-12”) of the SEC, to provide or cause to be provided for the benefit of the beneficial owners of the Series 2019 Bonds to the Municipal Securities Rulemaking Board (the “MSRB”) via its Electronic Municipal Market Access System (“EMMA”) and in an electronic format prescribed by the MSRB and such other municipal securities information repository as may be required by law or applicable regulation, from time to time (each such information repository, a “MSIR”), the following annual financial information (the “Annual Information”), with the first such installment of Annual Information to be provided with respect to the Fiscal Year ending September 30, 2019:
(1) Revenues and Net Revenues of the Aviation Department and operating information for the prior Fiscal Year of the type and in a form which is generally consistent with the presentation of such information in this Official Statement for the Series 2019 Bonds, and such additional operating information as may be determined by the Aviation Department; and
(2) The audited Aviation Department’s Comprehensive Annual Financial Report utilizing generally accepted accounting principles applicable to local governments.
The information in paragraphs (1) and (2) above is expected to be available on or before June 1 of each year for the preceding Fiscal Year and will be made available, in addition to the Trustee and each MSIR, to each Beneficial Owner of the Series 2019 Bonds who requests such information in writing. The audited Aviation Department’s Comprehensive Annual Financial Report referred to in paragraph (2) above is expected to be available separately from the information in paragraph (1) above and will be provided by the County as soon as practical after the acceptance of such statements from the auditors by the Aviation Department. If not available within eight months from the end of the Fiscal Year, unaudited information will be provided in accordance with the time frame set forth above and audited financial statements will be provided as soon after such time as they become available.
The County has also agreed to provide or cause to be provided, in a timely manner, to each MSIR, in the appropriate format required by law or applicable regulation, notice of its failure to provide the Annual Information with respect to itself on or prior to June 1 following the end of the preceding Fiscal Year.
The foregoing obligations of the County shall remain in effect only so long as the Series 2019 Bonds are Outstanding. The County has reserved the right to terminate its obligation to provide the Annual Information and notices of material events, as set forth above, if and when the County no longer remains an “obligated person” with respect to the Series 2019 Bonds within the meaning of the Rule.
Notwithstanding the foregoing, each MSIR to which information shall be provided shall include each MSIR approved by the SEC prior to the issuance of the Series 2019 Bonds. In the event that the SEC approves any additional MSIRs after the date of issuance of the Series 2019 Bonds, the County will, if the County is notified of such additional MSIRs, provide such information to the additional MSIRs. Failure to provide such information to any new MSIR whose status as a MSIR is unknown to the County shall not constitute a breach of this covenant.

78
The requirements of filing the Annual Information do not necessitate the preparation of any separate annual report addressing only the Series 2019 Bonds. The requirements may be met by the filing of an annual information statement or the audited general purpose financial statements of the Aviation Department or the County’s Comprehensive Annual Financial Report, provided such report includes all of the required Annual Information and is available by June 1 of each year for the preceding Fiscal Year. Additionally, the County may incorporate any information in any prior filing with each MSIR or included in any official statement of the County, provided such official statement is filed with the MSRB.
The County has selected Digital Assurance Certification, L.L.C. (“DAC”) to serve as the County’s disclosure dissemination agent for purposes of filing the Annual Information as required by the Rule with the MSRB in an electronic format prescribed by the MSRB. During any period that DAC or any other party is acting as disclosure dissemination agent for the County with respect to the County’s continuing disclosure obligations, the County will comply with the provisions of any agreement by and between the County and any such disclosure dissemination agent.
The County has reserved the right to modify from time to time the specific types of information provided or the format of the presentation of such information, to the extent necessary or appropriate in the judgment of the County, provided that the County has agreed that any such modification will be done in a manner consistent with the Rule. See “APPENDIX G – CONTINUING DISCLOSURE UNDERTAKING” for a complete copy of the County’s continuing disclosure undertaking.
Obligated Persons
The County has determined that as of the issuance of the Series 2019 Bonds, the County will be the sole Obligated Person (as defined in the Rule) with respect to the Series 2019 Bonds.
Because the County will be the sole Obligated Person with respect to the Series 2019 Bonds at the time of their issuance, the County’s continuing disclosure undertaking does not provide for, and no undertaking is being made by the County or the Aviation Department to update, any information contained in this Official Statement with respect to any individual airline. Under the 2018 AUA, each Signatory Airline is contractually obligated to make payments only to the extent of its use of the Airport during any Fiscal Year.
Airline Disclosure
Copies of the SEC filings (including (i) an Annual Report on Form 10-K, and (ii) a Quarterly Report on Form 10-Q, annual, quarterly and special reports, information statements and other information) for any individual airline which is required to file such reports pursuant to Sections 13(a), 13(c), 14 or 15(d) of the Exchange Act of 1934, as amended, are available over the Internet at the web site of the Securities and Exchange Commission at http://www.sec.gov; or at the SEC’s public reference room in Washington, D.C. See also “CERTAIN INVESTMENT CONSIDERATIONS – Airline Economic Considerations – Additional Information on Airlines” for the location of other financial and operating data which may be available as to individual airlines operating at the Airport.
Procedures and Past Performance
The County has procedures in place with respect to its continuing disclosure undertakings and, as noted above, utilizes DAC to assist it in its compliance. The following information describes the instances of non-compliance with such undertakings, known to the County, in the past five years.
The County inadvertently failed to provide timely notice of the occurrence of the County’s failure to comply with the terms of the rate covenant in the master ordinance (the “Seaport Bond Master Ordinance”) for its revenue bonds secured by the Net Revenues of the Seaport Department (the “Seaport Revenue Bonds”) and general obligation bonds secured by both the Net Revenues of the Seaport Department and the obligation of the County to budget from ad valorem taxes levied on property in the County without limit as to rate or amount (the “Seaport General Obligation Bonds”), for Fiscal Year 2013. Based on an adjustment to Seaport Revenues for a credit due

79
under a cruise line incentive agreement required by the County’s outside auditor in the course of performing its annual audit for Fiscal Year 2013, it was determined that the Seaport Department did not have sufficient Seaport Revenues to meet the rate covenant in the Seaport Bond Master Ordinance for Fiscal Year 2013. Due to the timing of the adjustment, the County failed to timely file notice within ten days of the occurrence of the notice event, as required by the Rule. The notice filing with respect to the failure to meet the terms of the rate covenant was cured on April 3, 2014.
With respect to the County’s Guaranteed Entitlement Refunding Revenue Bonds, Series 2007 (the “Series 2007 Guaranteed Entitlement Revenue Bonds”), the County has included agreed-upon annual financial information relating to such bonds in its Annual Report to Bondholders filed each year with EMMA, but failed to provide proper indexing of such information in relation to the Series 2007 Guaranteed Entitlement Revenue Bonds. This indexing discrepancy was remedied by the County on April 30, 2014 and reflected correctly on the EMMA system as of May 1, 2014.
In addition, the County inadvertently failed to file notices of ratings downgrades by Standard & Poor’s Rating Services of MBIA Insurance Corporation (“MBIA”) affecting the insured ratings on certain bonds issued by the County and insured by MBIA. Each of these notice failures was cured by the County on November 22, 2013, April 1, 2014 and April 21, 2015.
The County is the sole borrower under loans from the Sunshine State Governmental Financing Commission (the “Commission”), funded by the Commission’s fixed-rate Revenue Bonds (Miami-Dade County Program), Series 2010A-1, 2010B-1, 2011A, 2011B-1 and 2011C-1 (collectively, the “Commission Bonds”) and, as such, an “obligated person” under the Rule. Pursuant to its undertakings with the Commission, the County is required to provide certain annual financial information, including its comprehensive annual financial report (the “CAFR”), for filing by the Commission with the MSRB by June 1 of each year, along with County event and late filing notices, as required by the Rule. While the County independently filed its required annual financial information for Fiscal Years 2011 through 2014 with the MSRB, such information was not cross-referenced to the CUSIP numbers for the Commission Bonds. In September 2015, the Commission made the corrective filings needed to incorporate the County’s annual financial information for Fiscal Years 2011 through 2014 into the continuing disclosure archive for the Commission Bonds.
Limited Information; Limited Rights of Enforcement
The County’s obligation under its continuing disclosure undertaking with respect to the Series 2019 Bonds is limited to supplying limited information at specified times and may not provide all information necessary to determine the value of the Series 2019 Bonds at any particular time.
The County has agreed that its undertaking pursuant to the Rule set forth in the Series 2019 Resolution and this Official Statement is intended to be for the benefit of the Beneficial Owners of the Series 2019 Bonds and shall be enforceable by the Trustee on behalf of such Beneficial Owners in the manner provided in the Trust Agreement if the County fails to cure a breach within a reasonable time after receipt of written notice from a Beneficial Owner that a breach exists; provided that the right to enforce the provisions of this undertaking shall be limited to a right to obtain specific performance of the County’s obligations in a Federal or State court located within the County and any failure by the County to comply with the provisions of this undertaking shall not be a default with respect to the Series 2019 Bonds.
EMMA System
Under existing law, County filings of continuing disclosure under the County’s continuing disclosure undertaking must be made through the EMMA system (Electronic Municipal Market Access), established and maintained by the MSRB. Investors can access the EMMA system at www.emma.msrb.org and follow the instructions provided on such website to locate filings by the County with respect to the Series 2019 Bonds.

80
While all filings under the Rule must be made through EMMA, filings made by the County prior to July 1, 2009 with respect to its continuing disclosure obligations relating to the Outstanding Bonds, cannot be found through the EMMA system and must be located through the pre-existing MSIRs.
RATINGS
S&P Global Ratings, a business unit of Standard & Poor’s Financial Services LLC (“S&P”), Kroll Bond Rating Agency (“KBRA”) and Fitch Ratings (“Fitch,” and together with S&P and KBRA, the “Rating Agencies”) have assigned the ratings of “A” (stable outlook), “AA-” (stable outlook) and “A” (positive outlook), respectively, to the Series 2019 Bonds.
The ratings reflect only the view of the Rating Agencies. Any desired explanation of the significance of such ratings should be obtained from the Rating Agency furnishing the same. Generally, the Rating Agencies base their ratings on the information and materials furnished to them and on investigations, studies and assumptions by them. There is no assurance that the ratings will continue for any given period of time or that the same will not be revised downward or withdrawn entirely by the Rating Agency furnishing the same if, in its judgment circumstances so warrant. Any such downward revision or withdrawal of the rating may have an adverse effect on the market price of the Series 2019 Bonds.
ENFORCEABILITY OF REMEDIES
The remedies available to the owners of the Series 2019 Bonds upon an event of default under the Trust Agreement are in many respects dependent upon regulatory and judicial actions, which are often subject to discretion and delay. Under existing laws and judicial decisions, the remedies provided for under the Trust Agreement may not be readily available or may be limited. The various legal opinions to be delivered concurrently with the delivery of the Series 2019 Bonds will be qualified to the extent that the enforceability of certain legal rights related to the Series 2019 Bonds is subject to limitations imposed by bankruptcy, reorganization, insolvency or other similar laws affecting the enforcement of creditors’ rights generally and by equitable remedies and proceedings generally.
UNDERWRITING
The Series 2019 Bonds are being purchased by the Underwriters listed on the cover page hereof, for whom Raymond James & Associates, Inc. is acting as representative. Subject to certain conditions, the Underwriters have agreed to purchase all of the (i) Series 2019A Bonds at a purchase price of $327,694,367.47, representing the original principal amount of $282,180,000.00, plus original issue premium of $46,914,231.90, and less an Underwriters’ discount of $1,399,864.43; and (ii) Series 2019B Bonds at a purchase price of $211,883,538.85, representing the original principal amount of $212,745,000.00, less an Underwriters’ discount of $861,461.15. The Bond Purchase Agreement (the “BPA”) between the Underwriters and the County provides that the Underwriters will purchase all of the Series 2019 Bonds, if any are purchased. The prices and yields for the Series 2019 Bonds set forth on the inside cover page may be changed after the initial offering by the Underwriters.
The Underwriters are being compensated by the underwriting discounts set forth in the BPA described above. Payment or receipt of the underwriting discounts is contingent on the closing of the transaction and the amount of the discounts may be based, in whole or in part, on a percentage of the principal amount of the Bonds. While this form of compensation is customary in the municipal securities market, it presents a conflict of interest since the Underwriters may have an incentive to recommend to the issuer a transaction that is unnecessary or to recommend that the size of the transaction be larger than is necessary unless a larger deal size is deemed by the issuer to be financially beneficial.
Certain of the Underwriters and their respective affiliates are full service financial institutions engaged in various activities, which may include sales and trading, commercial and investment banking, advisory, investment management, investment research, principal investment, hedging, market making, brokerage and other financial and non-financial activities and services. Certain of the Underwriters and their respective affiliates have provided, and may in the future provide, a variety of these services to the County and to persons and entities with relationships with the County, for which they received or will receive customary fees and expenses.

81
In the ordinary course of their various business activities, certain of the Underwriters and their respective affiliates, officers, directors and employees may purchase, sell or hold a broad array of investments and actively traded securities, derivatives, loans, commodities, currencies, credit default swaps and other financial instruments for their own account and for the accounts of their customers, and such investment and trading activities may involve or relate to assets, securities and/or instruments of the County (directly, as collateral securing other obligations or otherwise) and/or persons and entities with relationships with the County. Certain of the Underwriters and their respective affiliates may also communicate independent investment recommendations, market color or trading ideas and/or publish or express independent research views in respect of such assets, securities or instruments and may at any time hold, or recommend to clients that they should acquire, long and/or short positions in such assets, securities and instruments. Such investment and securities activities may involve securities and instruments of the County.
In addition, certain of the Underwriters have entered into distribution agreements with other broker-dealers (that have not been designated by the County as Underwriters) for the distribution of the Series 2019 Bonds at the original issue prices. Such agreements generally provide that the relevant Underwriter will share a portion of its underwriting compensation or selling concession with such broker-dealers.
FINANCIAL ADVISOR
Hilltop Securities Inc., Miami, Florida, served as financial advisor (the “Financial Advisor”) to the Aviation Department with respect to the offering of the Series 2019 Bonds. The Financial Advisor has assisted the County in the preparation of this Official Statement and has advised the County as to other matters relating to the planning, structuring and issuance of the Series 2019 Bonds. The Financial Advisor is not obligated to undertake and has not undertaken to make an independent verification or to assume responsibility for the accuracy, completeness or fairness of the information contained in this Official Statement. The fee payable to the Financial Advisor is contingent upon the issuance and delivery of the Series 2019 Bonds.
RELATIONSHIPS OF PARTIES
A number of the firms serving as Bond Counsel, Disclosure Counsel or Underwriters’ counsel (1) have represented and may continue to represent the Trustee and one or more of the Underwriters in connection with other transactions and (2) represent the County on certain other matters.
FINANCIAL STATEMENTS
The financial statements of the Aviation Department as of and for the Fiscal Year ended September 30, 2018, included in APPENDIX B have been audited by Cherry Bekaert LLP, independent auditors, as stated in their report appearing in APPENDIX B. Such financial statements speak only as of September 30, 2018 and have been included as a matter of public record. Cherry Bekaert LLP (1) has not been engaged to perform and has not performed since the date of its report on such financial statements any procedures with respect to such financial statements and (2) has not performed any procedures relating to this Official Statement. The consent of Cherry Bekaert LLP for the use of the financial statements herein has not been sought. See “APPENDIX B – AUDITED FINANCIAL STATEMENTS OF THE AVIATION DEPARTMENT FOR THE FISCAL YEAR ENDED SEPTEMBER 30, 2018.”
CERTAIN LEGAL MATTERS
Certain legal matters incident to the issuance of the Series 2019 Bonds are subject to the legal opinions of Greenberg Traurig, P.A., Miami, Florida, and Edwards & Feanny, P.A., Miami, Florida, Bond Counsel to the County. Certain legal matters will be passed upon for the County by the Office of the Miami-Dade County Attorney. Certain other legal matters relating to disclosure will be passed upon for the County by Hunton Andrews Kurth LLP, Miami, Florida, and DiFalco & Fernandez LLLP, Miami, Florida, Disclosure Counsel, whose opinions will be delivered with the Series 2019 Bonds. Bryant Miller Olive P.A., Miami Florida, is acting as counsel to the Underwriters. The fees payable to Bond Counsel, Disclosure Counsel and Underwriters’ counsel are contingent upon the issuance and delivery of the Series 2019 Bonds.

82
The proposed text of the separate legal opinions of Bond Counsel and Disclosure Counsel are set forth as “APPENDIX E – PROPOSED FORM OF BOND COUNSEL OPINION” and “APPENDIX F – PROPOSED FORM OF DISCLOSURE COUNSEL OPINION,” respectively. The actual legal opinions to be delivered may vary from the text of APPENDIX E and APPENDIX F, if necessary, to reflect facts and law on the date of delivery of the Series 2019 Bonds. The opinions will speak only as of their date and subsequent distribution of it by recirculation of this Official Statement or otherwise shall not create any implication that subsequent to the date of the opinions Bond Counsel has affirmed its opinion or that Disclosure Counsel has reviewed or expressed any opinion concerning any of the matters referenced in this Official Statement.
The approving legal opinions of Bond Counsel will be limited to the matters set forth therein and will make no statement regarding the accuracy and completeness of this Official Statement.
The legal opinions of Bond Counsel, Disclosure Counsel and the Office of the Miami-Dade County Attorney are based on existing law, which is subject to change. Such opinions are further based on factual representations made to Bond Counsel, Disclosure Counsel and the Office of the Miami-Dade County Attorney as of the date thereof. Bond Counsel, Disclosure Counsel and the Office of the Miami-Dade County Attorney assume no duty to update or supplement their respective opinions to reflect any facts or circumstances, including changes in law that may thereafter occur or become effective.
The legal opinions to be delivered concurrently with the delivery of the Series 2019 Bonds express the professional judgment of the attorneys rendering the opinions regarding the legal issues expressly addressed therein. By rendering a legal opinion, the attorneys providing such opinion do not become insurers or guarantors of the result indicated by that expression of professional judgment, of the transaction on which the opinion is rendered, or of the future performance of parties to the transaction. Nor does the rendering of an opinion guarantee the outcome of any legal dispute that may arise out of the transaction.
LITIGATION
General
The County is a party, from time to time, to various lawsuits relating to the Airport and the Aviation Department, all of which the County has, and will continue to, vigorously defend and/or prosecute. There is not now pending any litigation restraining or enjoining the issuance or delivery of the Series 2019 Bonds or questioning or affecting the validity of the Series 2019 Bonds or the proceedings and authority under which they are to be issued. Neither the creation, organization or existence, nor the title of the present members of the Board or other officers of the County to their respective offices, is being contested. Except as noted below, there is no litigation pending, or to the knowledge of County officials threatened, which, if it were decided against the County or the Aviation Department, would have a material adverse effect upon the financial affairs of the County or the Aviation Department, with regard to Port Authority Properties. There is not now pending any claim, or, to the knowledge of County officials, any threatened claim, that the Landing Fees or any other rates and charges at the Airport are not in accordance with federal, state or local law.
Aviation Environmental Matters
In August 1993, the Aviation Department and the County’s Department of Environmental Resources Management (“DERM”) entered into a Consent Agreement (the “DERM Consent Agreement”). Under the DERM Consent Agreement, the Aviation Department became liable to address and correct subsurface contamination resulting from various Airport tenants’ operations and failure to comply with their legal obligations at the Airport, including facilities previously occupied by Eastern Air Lines and Pan American World Airways. In addition, the Aviation Department had a preliminary study performed by an independent engineering firm to estimate the Aviation Department’s damages imposed by the DERM Consent Agreement. This study, known as the “Opinion of Cost,” was used as a basis to record the cost of environmental remediation liability at the Airport as of September 30, 1993.

83
In each subsequent year, the Aviation Department received an updated study performed by Wood Environment and Infrastructure Solutions, Inc. (“Wood”), formerly known as AMEC Foster Wheeler Environment and Infrastructure, Inc. and MACTEC Engineering and Consulting, an independent engineering firm, to further update the estimated costs to correct the environmental violations noted in the Consent Order based on additional information and further refinement of estimated costs to be incurred.
As a result of the updated study and costs incurred in Fiscal Year 2018, the total cumulative estimated cost to correct such violations was $188.4 million. This estimate allows for uncertainties as to the nature and extent of environmental reparations and the methods which must be employed for the remediation. The cumulative amount of environmental expenditures spent through September 30, 2018 approximated $150.0 million. The Aviation Department has also spent $56.3 million in other environmental-related projects which are not part of any consent order.
During Fiscal Year 1998, the Florida Department of Environmental Protection (the “FDEP”) required the Aviation Department to enter into a Consent Order (“FDEP Consent Order”). The FDEP Consent Order, which encompasses and replaces the DERM Consent Agreement, requires the Aviation Department to address and correct subsurface contamination at all locations at the Airport that are contaminated as well as additional sites where contamination is suspected. Under these and other consent orders/agreements, environmental regulatory agencies are entitled to penalties for the violations cited in the consent orders/agreements entered into by the Aviation Department.
In 1999, the Board authorized the Aviation Department’s Environmental Cost Recovery Program to recover the costs of remediation of environmental contamination at MIA from responsible parties, insurers, and regulatory programs. As part of that program, the County proceeded with demand for payment and litigation against current and former users of the Airport, including the U.S. government. It also pursued payments from FDEP under its Inland Protection Trust Fund which allows for the reimbursement or pre-approval for payment of certain qualified petroleum cleanups. A more detailed discussion of some of those efforts follows.
The Aviation Department also applied for $40 million of reimbursable costs from the Inland Protection Trust Fund for eligible petroleum cleanup costs. Initially, $24 million was approved for reimbursement. The Aviation Department appealed approximately $10.1 million in denied supplemental payment requests for reimbursement and audited amounts, which was settled for an additional $4.6 million that brought the total reimbursed to $28.6 million. In addition, certain Airport sites where contamination is suspected are recorded in the FDEP Consent Order under a “Protective Filing.” If contamination were documented at these sites, the State would be required to incur the costs of remediation after the first $200,000 of costs incurred by the Aviation Department. Because the State will be required to pay for remediation of sites filed in the Protective Filing and because the contamination at these sites is unknown at this time, these sites appear in the Opinion of Cost report with no dollar amounts. To date, the airlines and the other tenants have complied with all actions requested of them by the Aviation Department in order to comply with the FDEP Consent Order.
As noted above, in addition to the state regulatory administrative challenges, the Aviation Department has commenced various lawsuits against responsible parties and insurers to recover damages arising out of the costs associated with environmental contamination addressed by the DERM Consent Agreement and FDEP Consent Order. The County has settled claims against numerous responsible parties and insurers and litigation remains pending or will be brought against others. The County has recovered approximately $30 million as a result of these settlements, which, along with the IPTF recoveries, brings the total recovered under the Cost Recovery Program to approximately $60.3 million.
In January 2019, the Opinion of Cost report was further updated to reflect changes that occurred during Fiscal Year 2018. The estimated cost to the Aviation Department to address the contamination as of September 30, 2018 is approximately $38.3 million. Such amounts are scheduled by Wood to be incurred by the County over seven years, but based on recent historical spending levels, it will take longer to complete the work. As a result, the Aviation Department has recorded a liability of $38,355,000 for the Airport as of September 30, 2018. The liability recorded by the Aviation Department does not include an estimate of any environmental violations at the three general aviation airports or at the two training airports. Management is not aware of any such liabilities, and the occurrence of any would not be material to the Airport’s financial statements. Management also believes that no

84
specific amount in the range represents a better estimate of the ultimate liability. Environmental costs that are operating in nature will be included in the annual operating budget while those costs that are directly related to capital projects will be paid from the related project’s funding source(s) including the Cost Recovery Program.
In addition to the studies conducted to determine the environmental damage to the sites formerly occupied by Eastern Air Lines and Pan American World Airways, the Aviation Department caused studies to be performed to determine the amount required to remove or otherwise contain the asbestos in certain buildings occupied by the airlines. The Aviation Department has also estimated the amount required to remove or otherwise encapsulate the asbestos in buildings other than those formerly occupied by Eastern Air Lines and Pan American World Airways. The studies estimate the cost to correct the damage related to all buildings to be approximately $4.5 million. The Aviation Department does not intend to correct all assessed damage related to asbestos in the near future as they pose no imminent danger to the public. Specific issues will be addressed when and if the Aviation Department decides to renovate or demolish related buildings. At such time, the Aviation Department will obligate itself to the cleanup or asbestos abatement. As emergencies or containment issues, if any, arise from these conditions, they will be isolated and handled on a case-by-case basis as part of the Airport’s repair and maintenance program. Such amounts do not represent a liability of the Aviation Department until a decision is made by the Aviation Department’s management to modify the buildings, which would require the Aviation Department to correct such matters. As a result, no amounts are recorded as of September 30, 2018.
The nature of ground and groundwater contamination at MIA can be divided into two categories: petroleum-related contamination and hazardous/nonhazardous contamination. The Opinion of Cost is divided into three large areas: the Inland Protection Trust Fund (IPTF), which was created by the State of Florida to deal with contamination related to petroleum products in sites that qualified for that program; the non-IPTF contamination relating to other sites that might include petroleum as well as hazardous- /nonhazardous-related contamination; and the nonconsent items, which can be either of the above categories but were not specifically listed in the Consent Order.
The table below summarizes the remediation liability by nature of contaminant as of September 30, 2018.
Nature of contamination IPTF Non-IPTF Nonconsent Totals
Petroleum $4,435,000 -- -- $ 4,435,000 Hazardous / nonhazardous -- $29,475,000 $4,445,000 33,920,000 Total $4,435,000 $29,475,000 $4,445,000 $38,355,000
DISCLOSURE REQUIRED BY FLORIDA BLUE SKY REGULATIONS
Florida law requires the County to make a full and fair disclosure of any bonds or other debt obligations which it has issued or guaranteed and which are or have been in default as to principal or interest at any time after December 31, 1975 (including bonds or other debt obligations for which it has served as a conduit issuer). The County is not and has not been in default as to principal and interest on bonds or other debt obligations that it has issued as the principal obligor.
There are several special purpose governmental authorities that serve as conduit issuers of private activity bonds for purposes such as housing, industrial development, education and health care. Defaults have occurred in connection with some of those private activity bonds; however, such defaults affect only the defaulted issues and will have no effect on the payment of the Series 2019 Bonds. The County has no obligation to pay such bonds and the conduit issuers had only a limited obligation to pay such bonds from the payments made by the underlying obligors with respect to such issues. Defaults relating to conduit issuers are not material with regard to the Series 2019 Bonds.
85
VERIFICATION OF MATHEMATICAL COMPUTATIONS
The arithmetical accuracy of certain computations included in the schedules provided by the Financial Advisor on behalf of the County relating to the computation of forecasted receipts of principal and interest on the Government Obligations and the forecasted payments of principal and interest to pay through their applicable redemption dates the Refunded Bonds and supporting the conclusion of Bond Counsel that the Series 2019 Bonds do not constitute “arbitrage bonds” under Section 148 of the Internal Revenue Code of 1986, as amended, was examined by the Verification Agent. Such computations were based solely upon assumptions and information supplied by the Financial Advisor on behalf of the County. The Verification Agent has restricted its procedures to examining the arithmetical accuracy of certain computations and has not made any study or evaluation of the assumptions and information upon which the computations are based and, accordingly, has not expressed an opinion on the data used, the reasonableness of the assumptions, or the achievability of the forecasted outcome.
CERTIFICATE OF FINANCE DIRECTOR AND AVIATION DIRECTOR CONCERNING THIS OFFICIAL STATEMENT
Concurrently with the delivery of the Series 2019 Bonds, the Finance Director and the Aviation Director will furnish a certificate to the effect that, to the best of their knowledge, this Official Statement, as of its date and as of the date of delivery of the Series 2019 Bonds, does not contain an untrue statement of a material fact and does not omit to state a material fact which should be included in this Official Statement for the purpose for which this Official Statement is to be used, or which is necessary to make the statements contained in this Official Statement, in light of the circumstances in which they were made, not misleading.
MISCELLANEOUS
This Official Statement is not to be construed as a contract with the purchasers of the Series 2019 Bonds. The references, excerpts and summaries of all documents referred to in this Official Statement do not purport to be complete statements of the provisions of such documents, and potential investors should refer to all such documents for full and complete statements of all matters relating to the Series 2019 Bonds, the security for the payment of the Series 2019 Bonds and the rights and obligations of the owners of the Series 2019 Bonds. The information set forth in this Official Statement has been obtained from the County and other sources that are believed to be reliable. The information and expressions of opinion in this Official Statement are not subject to change without notice and neither the delivery of this Official Statement nor any sale made shall under any circumstances create any implication that there has been no change in the matters referred to in this Official Statement since its date.
The delivery of this Official Statement by the County has been duly authorized by the Board.

[THIS PAGE INTENTIONALLY LEFT BLANK]

APPENDIX A
REPORT OF THE TRAFFIC ENGINEERS

[THIS PAGE INTENTIONALLY LEFT BLANK]

Appendix A
REPORT OF THE TRAFFIC ENGINEERS
on the proposed issuance of
MIAMI-DADE COUNTY, FLORIDA, AVIATION REVENUE BONDS, SERIES 2019A and
AVIATION REVENUE REFUNDING BONDS, SERIES 2019B
Prepared for
Miami-Dade County Aviation Department Miami-Dade County, Florida
Prepared by
LeighFisher Inc. Burlingame, California
April 29, 2019

[THIS PAGE INTENTIONALLY LEFT BLANK]

April 29, 2019
Mr. Lester Sola, Aviation Director and Chief Executive Officer Miami-Dade County Aviation Department P. O. Box 592075 Miami, Florida 33159
Re: Report of the Traffic Engineers Miami-Dade County, Florida, Aviation Revenue Bonds, Series 2019A and Aviation Revenue Refunding Bonds, Series 2019B
Dear Mr. Sola:
We are pleased to submit this Report of the Traffic Engineers (the Report) on certain aspects of the proposed issuance of Aviation Revenue Bonds, Series 2019A and Aviation Revenue Refunding Bonds, Series 2019B (collectively, the 2019 Bonds), by Miami-Dade County (the County) on behalf of the Miami-Dade County Aviation Department (MDAD). This letter and the accompanying attachment and exhibits constitute our Report.
The proposed 2019 Bonds are being issued under the Amended and Restated Trust Agreement (the Trust Agreement) dated as of December 15, 2002 and are secured by a pledge of Net Revenues. Capitalized terms not otherwise defined in this Report have the meanings set forth in the Trust Agreement and the Airline Use Agreement (the 2018 AUA).
The net proceeds of the new money 2019 Bonds, and certain investment earnings thereon, are to be used to (1) finance or reimburse the County for all or a portion of the cost of certain capital projects (described below); (2) satisfy the Reserve Account Requirement related to the 2019 Bonds, if necessary; and (3) pay certain costs of issuance of the 2019 Bonds.
The purpose of this Report is to evaluate the ability of the County to satisfy the requirements of the Rate Covenant (defined below) of the Trust Agreement throughout the forecast period, taking into account the Outstanding Bonds, the proposed new money 2019 Bonds, and the anticipated 2020 Bonds. The forecast period covers fiscal year (FY) 2019 through FY 2025. The County’s fiscal year ends on September 30.
AIRPORT SYSTEM
The County owns Miami International Airport (the Airport or MIA), the principal airport serving the Miami-Dade County region, three active general aviation airports, one decommissioned general aviation airport, and one airport used primarily for flight training. The six airports together constitute the Airport System and are operated by MDAD.
CAPITAL IMPROVEMENT PROGRAM
MDAD has identified a Capital Improvement Program (CIP) for the Airport System, totaling $1.56 billion of project costs expected to be incurred over the period FY 2015 to FY 2023. The majority of these improvements (costing approximately $917 million) relate to improvements to the terminals and concourses at MIA.

Mr. Lester Sola April 29, 2019
A-2
MDAD intends to issue Aviation Revenue Bonds to finance a portion of the CIP. Where applicable, the elements of the CIP have been reviewed and approved by the airlines as part of the majority-in-interest (MII) review process and all elements of the CIP requiring MII review have received full authorization. The CIP is currently under development and is expected to be completed by FY 2023. For purposes of this Report, the proposed 2019 Bonds and the anticipated 2020 Bonds required to complete the CIP have been included in the financial analysis.
TRUST AGREEMENT
The County issues Aviation Revenue Bonds for improvements to the Airport System on behalf of MDAD pursuant to the terms and conditions set forth in the Trust Agreement between the County and the Trustee and Co-Trustee. Aviation Revenue Bonds are special, limited obligations of the County payable solely from and secured by Net Revenues of the Port Authority Properties (PAP), which generally includes all properties in the Airport System, except for third-party-financed facilities. The faith and credit of the County are not pledged to the payment of Aviation Revenue Bonds. Principal and Interest Requirements on Outstanding Bonds are payable from the Sinking Fund, to which the County has covenanted to deposit sufficient Net Revenues after retention of an operating reserve. Discussions in this Report regarding the Trust Agreement and the 2018 AUA are not intended to be comprehensive or definitive, and all such references are qualified in their entirety by reference thereto.
Security for the Proposed 2019 Bonds
The proposed 2019 Bonds are to be issued under the Trust Agreement on a parity basis with other Outstanding Bonds and are likewise to be secured by Net Revenues. The proposed 2019 Bonds are to be issued as fixed-rate debt.
Pursuant to the Trust Agreement, unless otherwise provided by resolution of the Board of County Commissioners (the Board), Passenger Facility Charge (PFC) revenues are excluded from Revenues and, therefore, are not included in Net Revenues, and are not pledged to the payment of the Aviation Revenue Bonds. However, MDAD has historically elected to use PFC revenues to pay principal and interest on Aviation Revenue Bonds and plans to continue to do so in the future at its discretion. Pursuant to the Trust Agreement, Principal and Interest Requirements exclude the amount of funds set aside or deposited for debt service payments in the Bond Service Account. Thus, for purposes of this Report, principal and interest expected to be paid from PFC revenues are excluded in computing Principal and Interest Requirements for the corresponding forecast fiscal years. Assumptions regarding the use of PFC revenues to pay Principal and Interest Requirements are as described in this Report.
Customer facility charge (CFC) revenues are also not included in the definition of Revenues under the Trust Agreement. CFC revenues are used to pay the operating costs of the Rental Car Center (RCC), among other uses.

Mr. Lester Sola April 29, 2019
A-3
Rate Covenant
Section 501 of the Trust Agreement (the Rate Covenant) provides that Revenues will, at all times, be sufficient to (1) provide funds for the payment of Current Expenses; (2) provide for making deposits to the Reserve Maintenance Fund in the amounts recommended by the Consulting Engineers; and (3) provide for (a) deposits to the Sinking Fund (other than the Reserve Account) that in each fiscal year will equal not less than 120% of the Principal and Interest Requirements due in that fiscal year and (b) deposits to the Reserve Account and payments to reimburse providers of Reserve Facilities.
AIRLINE AGREEMENTS
In addition to the Trust Agreement, the 2018 AUA with the airlines operating at the Airport is also a key document governing MDAD’s financial operations.
Airline Use Agreement
The County has entered into separate but substantially similar AUAs with various airlines serving the Airport (the Signatory Airlines). The 2018 AUA became effective on August 10, 2018, for approximately a 15-year term through April 30, 2033. The 2018 AUA provides that the County, acting through the Board, has the right to calculate a landing fee using an Airport System residual methodology, and to collect such fee from the Signatory Airlines so that related revenues together with revenues from other sources will, at all times, be sufficient to meet the Revenue Requirement, including (1) the Rate Covenant and other requirements under the Trust Agreement; (2) certain other requirements, including funding of certain indebtedness payable from moneys in the Improvement Fund; and (3) funding of a discretionary capital account. The Revenue Requirement is described in detail in Section 3.2 of this Report.
The Signatory Airlines have agreed to pay landing fees as long as they operate at the Airport or at any other airports in the Airport System. If any airline ceases operations at the Airport System, then it would have no obligation to pay landing fees, and the landing fees payable by other Signatory Airlines would, other things being equal, be increased to make up for the landing fee revenue that would otherwise have been received from airlines terminating service.
As of the date of this Report, substantially all of the airlines operating at MIA have signed the 2018 AUA. American Airlines and its affiliate, American Eagle*, accounted for approximately 66.7% of all enplaned passengers at the Airport during FY 2018.
Terminal Building Lease Agreements
MDAD has also entered into separate but substantially similar Terminal Building Lease Agreements (TBLA) with various airlines (including American Airlines) providing for the general right of the Signatory Airlines to use and occupy space in the passenger terminal premises for a 5-year term, and the specific right to designated lease space as identified in that airline’s TBLA. Under the TBLA, the separate provisions for specific space are subject to cancellation by either party on 30-days’ notice.
*All references to American Eagle in this Report, unless otherwise noted, refer to American Eagle Airlines
together with other regional affiliates of American Airlines operating under the American Eagle brand.

Mr. Lester Sola April 29, 2019
A-4
SCOPE OF THE REPORT
This Report was prepared to evaluate the ability of the County to generate Revenues sufficient to satisfy the requirements of the Rate Covenant throughout the forecast period, taking into account Outstanding Bonds, the proposed 2019 Bonds, and anticipated Aviation Revenue Bonds, Series 2020, to be issued during the forecast period to complete the CIP.
In preparing the Report, we analyzed:
� Future airline traffic demand at the Airport, considering the demographic and economic characteristics of the region served; historical trends in airline traffic; recent airline service development and airfares; and other key factors that may affect future airline traffic at the Airport
� The status, schedule, and estimated costs of the CIP
� Historical and future awarded and anticipated grants from the Federal Aviation Administration (FAA), the State of Florida, and the Transportation Security Administration (TSA)
� Sources and uses of funds and annual Principal and Interest Requirements for the proposed 2019 Bonds and the anticipated 2020 Bonds
� Historical relationships among revenues, expenses, and airline traffic at the Airport
� Historical and forecast PFC revenues, and MDAD’s intention to use PFC revenues to reduce the amount of the Principal and Interest Requirements and to pay capital project costs on a pay-as-you-go basis during the forecast period
� Historical financial results for the Airport System, the FY 2019 budget, the preliminary FY 2020 budget, projected staffing requirements, and other operational considerations
� The County’s policies and contractual arrangements relating to the use and occupancy of Airport System facilities, including the calculation of airline rentals, fees, and charges under the 2018 AUA; the operation of concession privileges; and the leasing of buildings and grounds
We have relied upon MDAD and its consultants regarding the status of the CIP and plan for future projects, including Hilltop Securities Inc., MDAD’s financial advisor, for the projected debt service on the proposed 2019 Bonds and anticipated 2020 Bonds for the CIP.
We also identified key factors upon which the future financial results of the Airport System may depend and, with MDAD management, formulated assumptions about those factors. Based on those assumptions, we assembled the financial forecasts presented in the exhibits provided at the end of this Report.

Mr. Lester Sola April 29, 2019
A-5
RATE COVENANT COMPLIANCE AND DEBT SERVICE COVERAGE
As shown in Exhibit G and the table below, the residual cost rate-setting methodology for computing landing fee rates is forecast to result in calculated Net Revenues sufficient to meet the requirements of the Rate Covenant, based on the assumption that the passenger and all-cargo airlines will collectively pay landing fees and other rentals, fees, and charges calculated under the 2018 AUA. Principal and Interest Requirements shown in the table below are net of PFC revenues MDAD has deposited or intends to deposit for the payment of debt service.
Debt Service Coverage Forecast
Miami-Dade County Aviation Department For Fiscal Years Ending September 30
(in thousands except coverage)
Forecast Airline Payments per Enplaned Passenger
The following table presents estimates and forecasts of passenger airline payments to MDAD in the form of terminal rentals, landing fees, and other charges under the 2018 AUA.
The landing fees, passenger terminal rentals and user fees, and related terminal charges paid by the passenger airlines are often expressed in relation to numbers of enplaned passengers; the ratio is known as airline payments per enplaned passenger, or cost per enplaned passenger (CEP). The CEP represents the average unit cost paid to an airport operator by the passenger airlines serving the Airport.
Deposit to Gross Deposit Principal and DebtFiscal Net Reserve debt of PFC Interest serviceYear Revenues Maint. Fund Subtotal service revenues Requirements coverage
[A] [B] [C]=[A+B] [D] [E] [F]=[D+E] [C]/[F]
2019 430,170$ (15,000)$ 415,170$ 371,810$ (55,000)$ 316,810$ 1.31 2020 402,600 (18,000) 384,600 379,296 (82,000) 297,296 1.29 2021 412,745 (24,000) 388,745 382,649 (85,000) 297,649 1.31 2022 451,642 (27,000) 424,642 415,044 (88,000) 327,044 1.30 2023 462,792 (30,000) 432,792 422,414 (89,000) 333,414 1.30 2024 467,181 (35,000) 432,181 422,416 (90,000) 332,416 1.30 2025 466,586 (35,000) 431,586 422,417 (91,000) 331,417 1.30

Mr. Lester Sola April 29, 2019
A-6
Forecast Airline Payments per Enplaned Passenger
Miami-Dade County Aviation Department For Fiscal Years Ending September 30
Assumptions Underlying the Financial Forecasts
The financial forecasts are based on information and assumptions that were provided by, or reviewed with and agreed to by, MDAD management. Accordingly, the forecasts reflect management’s expected course of action during the forecast period and, in management’s judgment, present fairly the expected financial results of the Airport System.
Those key factors and assumptions that are significant to the forecasts are set forth in the attachment, “Background, Assumptions, and Rationale for the Financial Forecasts.” The attachment should be read in its entirety for an understanding of the forecasts and the underlying assumptions.
In our opinion, the underlying assumptions provide a reasonable basis for the forecasts. However, any forecast is subject to uncertainties and there can be no assurance that the forecast financial results will be realized. Inevitably, some assumptions will not be realized, and unanticipated events and circumstances may occur. Therefore, there are likely to be differences between the forecast and actual results, and those differences may be material. Neither LeighFisher nor any person acting on behalf of LeighFisher makes any warranty, expressed or implied, with respect to the information, assumptions, forecasts, opinions, or conclusions disclosed in the Report.
We have no responsibility to update this Report for events and circumstances occurring after the date of the Report.
* * * * *
Airline Enplaned PaymentsFiscal payments passengers per enplanedYear (thousands) (thousands) passenger
2019 452,995$ 22,725 19.93$ 2020 450,382 23,075 19.52 2021 510,361 23,425 21.79 2022 554,081 23,775 23.31 2023 575,411 24,125 23.85 2024 595,513 24,475 24.33 2025 613,935 24,825 24.73
Note: Payments by passenger airlines.

Mr. Lester Sola April 29, 2019
A-7
We appreciate the opportunity to assist the County and MDAD on this proposed financing.
Respectfully submitted,
LEIGHFISHER
p y ,
LEIGHFISHER

A-8
[THIS PAGE INTENTIONALLY LEFT BLANK]

A-9
Attachment
BACKGROUND, ASSUMPTIONS, AND RATIONALE FOR THE FINANCIAL FORECASTS
REPORT OF THE TRAFFIC ENGINEERS
on the proposed issuance of
MIAMI-DADE COUNTY, FLORIDA, AVIATION REVENUE BONDS, SERIES 2019A and
AVIATION REVENUE REFUNDING BONDS, SERIES 2019B

A-10
[THIS PAGE INTENTIONALLY LEFT BLANK]

A-11
CONTENTS
Page
1. OVERVIEW ...................................................................................................................... A-17
1.1 Airports in the System .......................................................................................... A-17 1.2 Existing Facilities at Miami International Airport ................................................. A-18
1.2.1 Terminal Facilities .................................................................................... A-18 1.2.2 Landside Facilities .................................................................................... A-19 1.2.3 Airfield Facilities ...................................................................................... A-20 1.2.4 Cargo and Other Facilities ....................................................................... A-20
1.3 Capital Improvement Program ............................................................................. A-21
2. AVIATION DEMAND AND AIRLINE TRAFFIC ANALYSIS.................................................... A-24
2.1 Airport Service Region .......................................................................................... A-24 2.2 Demand for Passenger and Cargo Service ............................................................ A-26
2.2.1 Economy of the Airport Service Region .................................................. A-26 2.2.2 Key International Markets ....................................................................... A-39 2.2.3 International Trade Sector ...................................................................... A-47
2.3 Airline Service and Traffic ..................................................................................... A-52 2.3.1 Airport Rankings and Roles ..................................................................... A-54 2.3.2 Airline Service at the Airport and Competing Airports ........................... A-67 2.3.3 Historical Airline Traffic at the Airport .................................................... A-78
2.4 Key Factors Affecting Future Airline Traffic .......................................................... A-86 2.4.1 Economic, Political, and Security Conditions .......................................... A-86 2.4.2 Financial Health of the Airline Industry ................................................... A-87 2.4.3 Airline Service and Routes ....................................................................... A-89 2.4.4 Airline Competition, Airfares, and Airport Charges ................................ A-89 2.4.5 Availability and Price of Aviation Fuel ..................................................... A-91 2.4.6 Aviation Safety and Security Concerns .................................................... A-92 2.4.7 Capacity of the National Air Traffic Control System ................................ A-93 2.4.8 Capacity of the Airport ............................................................................ A-93 2.4.9 Operating Efficiencies for American Airlines ........................................... A-93
2.5 Airline Traffic Forecasts ........................................................................................ A-93 2.5.1 Airline Traffic Forecast Assumptions ....................................................... A-93 2.5.2 Passenger Forecast Summary.................................................................. A-94

A-12
CONTENTS (continued)
Page
3. FINANCIAL ANALYSIS ...................................................................................................... A-98
3.1 Framework for Financial Operations .................................................................... A-98 3.1.1 The Trust Agreement ............................................................................... A-98 3.1.2 Net Revenues .......................................................................................... A-98 3.1.3 Application of Revenues .......................................................................... A-99 3.1.4 Rate Covenant ......................................................................................... A-99 3.1.5 Conditions for Issuing Additional Bonds ................................................. A-101
3.2 Airline Agreements and Related Fees .................................................................. A-102 3.2.1 Airline Use Agreement ............................................................................ A-102 3.2.2 Key Nonairline Agreements ..................................................................... A-107
3.3 The Passenger Facility Charge Program ............................................................... A-107 3.4 Bond Issuance and Debt Service ........................................................................... A-107
3.4.1 The Proposed 2019 Bonds and Anticipated 2020 Bonds ........................ A-107 3.4.2 Debt Service Paid from PFC Revenues .................................................... A-108 3.4.3 Other Debts Payable from Revenues ...................................................... A-108
3.5 Current Expenses .................................................................................................. A-109 3.6 Revenues .............................................................................................................. A-109
3.6.1 Aviation Fees ........................................................................................... A-109 3.6.2 Commercial Revenues ............................................................................. A-111 3.6.3 Rental Revenues ...................................................................................... A-115 3.6.4 General Aviation Airports Revenues ....................................................... A-115 3.6.5 Other Revenues ....................................................................................... A-115
3.7 Passenger Airline Payments ................................................................................. A-116 3.8 Application of Revenues ....................................................................................... A-116 3.9 Rate Covenant Compliance and Debt Service Coverage ...................................... A-117

A-13
TABLES
Page
1 Gate Distribution and Use by Concourse ......................................................................... A-19
2 Public Parking Facilities .................................................................................................... A-20
3 Capital Improvement Program Estimated Cost ............................................................... A-22
4 Capital Improvement Program Funding Plan ................................................................... A-23
5 Economic Projections for the United States .................................................................... A-27
6 Economic Projections for the State and Airport Service Region ..................................... A-29
7 Historical and Projected Population Trends .................................................................... A-32
8 Per Capita Personal Income Trends ................................................................................. A-33
9 Total Nonagricultural Employment Trends ...................................................................... A-35
10 Top Private Sector Employers in Miami-Dade and Broward Counties ............................ A-36
11 Visitors to Miami-Dade County ........................................................................................ A-37
12 Cruise Ship Passengers ..................................................................................................... A-38
13 Latin America and the Caribbean: Historical Economic Indicators ................................. A-41
14 Latin America and the Caribbean: Selected Economic Indicators .................................. A-43
15 Miami Customs District Exports ....................................................................................... A-48
16 Miami Customs District Imports ...................................................................................... A-49
17 Historical Enplaned Passengers by Airline Group ............................................................ A-53
18 Enplaned Passengers at Top-Ranking U.S. Airports ......................................................... A-55
19 Originating Passengers at Top-Ranking U.S. Airports ...................................................... A-56
20 Connecting Passengers at Top-Ranking U.S. Airports ...................................................... A-57
21 International Passengers at Top-Ranking U.S. Airports ................................................... A-58
22 Scheduled Departing Seats on Flights Operated by American at U.S. Airports ............... A-59
23 Scheduled Departing Seats by Alliance Group ................................................................. A-62
24 Scheduled International Departing Seats, by World Region Destination ........................ A-64

A-14
TABLES (continued)
Page
25 Comparative Trends in International Air Cargo ............................................................... A-66
26 Trends in Scheduled Passenger Service ........................................................................... A-71
27 Domestic Originating Patterns and Airline Service .......................................................... A-74
28 International Originating Patterns and Airline Service .................................................... A-75
29 Ranking of Cities in the United States by Gateway Shares of International Departing Passengers....................................................................................................... A-77
30 Historical Enplaned Passengers, by Component.............................................................. A-78
31 Airline Market Shares of Enplaned Passengers ............................................................... A-82
32 Trends in Total Air Cargo Tonnage, by Type of Airline .................................................... A-83
33 Summary of Airlines Reporting Air Cargo ........................................................................ A-84
34 Airline Market Shares of Air Cargo Tonnage .................................................................... A-85
35 Enplaned Passenger Forecast .......................................................................................... A-96
36 Forecasts of Departing Seats, Flight Operations, and Aircraft Landed Weight ............... A-97
37 Comparison of Key Provisions in the Prior AUA and the 2018 AUA ................................ A-103
38 FY 2018 Revenues ............................................................................................................ A-110
39 Ground Transportation Revenue Trends ......................................................................... A-114

A-15
FIGURES Page
1 Airport Layout Plan .......................................................................................................... A-18
2 Airport Service Region ..................................................................................................... A-25
3 Historical Enplaned Passengers ....................................................................................... A-52
4 Connecting Passengers on American Airlines .................................................................. A-60
5 Originating Passengers on American Airlines .................................................................. A-61
6 Passengers Enplaned on Flights from the United States to Cuba .................................... A-65
7 U.S. Airport Served by Daily Scheduled Nonstop Passenger Flights ................................ A-68
8 Airports in Mexico, Central America, South America, and the Caribbean Served by Scheduled Nonstop Passenger Flights ............................................................ A-69
9 Transatlantic Destinations Served by Scheduled Nonstop Passenger Flights ................. A-70
10 Enplaned Passengers ....................................................................................................... A-72
11 Trends in Domestic Originating Passengers and Airline Fares ......................................... A-73
12 Enplaned Passenger Trends by Passenger Segment ........................................................ A-79
13 Originating Passenger Trends by Type of Passenger ....................................................... A-80
14 Historical Enplaned Passengers on U.S. Airlines .............................................................. A-86
15 Net Income for U.S. Airlines ............................................................................................. A-88
16 Historical Domestic Yield for U.S. Airlines ....................................................................... A-90
17 Historical Monthly Jet Fuel Prices for U.S. Airlines .......................................................... A-91
18 Enplaned Passenger Forecast .......................................................................................... A-95
19 Application of Port Authority Properties Revenues Under the Trust Agreement ....................................................................................................................... A-100

A-16
EXHIBITS
Page
A Sources and Uses of Funds .............................................................................................. A-118
B Principal and Interest Requirements ............................................................................... A-119
C Historical and Forecast PFC Revenues ............................................................................. A-120
D Current Expenses ............................................................................................................. A-121
E Revenues .......................................................................................................................... A-122
E-1 Airline Landing Fee ........................................................................................................... A-123
E-2 Terminal and Concourse Use Fees and Revenues ........................................................... A-124
E-3 Airline Payments per Enplaned Passenger ...................................................................... A-125
F Application of Revenues .................................................................................................. A-126
G Rate Covenant Compliance .............................................................................................. A-127
H Summary of Financial Forecasts ...................................................................................... A-128

A-17
1. OVERVIEW
Miami-Dade County operates the Airport System through MDAD with policy guidance from the County Mayor and the Board of County Commissioners. The County operates under a strong mayoral form of government; the Mayor is the chief administrative officer and appoints the Aviation Director, who serves as the chief administrative officer of MDAD. MDAD operates the Airport System as a financially self-sufficient entity, without property tax or budgetary support from the County.*
In 1973, the Board established the Dade County Aviation Department as the successor organization to the Dade County Port Authority and, in 1997, this organization was renamed the Miami-Dade Aviation Department to reflect the change in the County’s name to Miami-Dade County. The term “Port Authority Properties” (PAP) as used in the Trust Agreement remains in effect.
PAP includes all properties financed or refinanced by debt obligations issued under the Trust Agreement and any other properties added to the PAP pursuant to Section 1308 of the Trust Agreement. PAP generally includes all land in the Airport System, the runways and taxiways in the Airport System, the passenger terminal building at the Airport, and most other infrastructure of the Airport System.
The County pledges Net Revenues derived from PAP to secure bonds issued under the Trust Agreement. All properties that were not financed or refinanced using bonds backed by PAP revenues or that were not converted to PAP status under Section 1308 of the Trust Agreement are referred to herein as Non-Port Authority Properties (NPAP). Such properties are mainly tenant-financed cargo facilities and may include other types of tenant-financed facilities. Any NPAP can be added to PAP subject to the provisions of Section 1308 of the Trust Agreement. As of the date of this Report, the County has no plan to add any existing NPAP to PAP under the Trust Agreement.
1.1 AIRPORTS IN THE SYSTEM
The Airport System consists of five active airports and one decommissioned airport. MIA is the only commercial-service airport in the Airport System and accounted for 99% of the Revenues of the Airport System in FY 2018. MIA occupies approximately 3,230 acres of land in the unincorporated area of the County, approximately 7 miles west of the downtown area of the City of Miami and 9 miles west of the City of Miami Beach.
Miami-Opa-locka Executive Airport is the largest general aviation airport in the Airport System and is designated as a reliever to MIA. Kendall-Tamiami Executive Airport is one of the busiest general aviation airports in Florida. Homestead General Aviation Airport serves sport, agricultural, and other private users. Dade-Collier Training and Transition Airport is used for commercial air carrier and military flight training. Opa-locka West Airport was decommissioned in 2006. For purposes of this Report, it was assumed that no mining operations would be conducted during the forecast period.
*In 2010, the County issued Double-Barreled Aviation Bonds (General Obligation), Series 2010 (the 2010
Double-Barreled Bonds) to fund certain projects at the Airport. Debt service on the 2010 Double-Barreled Bonds is expected to be paid from airline rentals, fees, and charges during the forecast period.

A-18
1.2 EXISTING FACILITIES AT MIAMI INTERNATIONAL AIRPORT
Existing facilities at the Airport include terminal, landside, airfield, cargo, and other facilities.
1.2.1 Terminal Facilities
Figure 1 shows the Airport Layout Plan (ALP) for MIA. The terminal complex at MIA consists of a single horseshoe-shaped passenger terminal with six concourses (designated by a letter code) radiating from the passenger terminal building. Counterclockwise from the northeast, the concourses are D*, E, F, G, H, and J.
Figure 1
Airport Layout Plan
MIC = Miami Intermodal Center; RCC = Rental Car Center.
Source: Miami-Dade County Aviation Department.
Concourse D and the associated terminal areas are referred to as the North Terminal. Concourses E, F, and G and associated terminal areas between those concourses are referred to as the Central Terminal. Concourses H and J, together with the associated terminal area between those concourses, are referred to as the South Terminal. Table 1 shows the distribution and use of gates by concourse.
*Former Concourses A-D were renamed Concourse D in 2009.

A-19
Table 1 Gate Distribution and Use by Concourse
Miami International Airport (March 2019)
Notes: Numbers may not add to totals shown because of rounding. Excludes charter (non-scheduled) activity. Utilization measures calculated on the basis of gates used, rather than gates in existence.
Source: Miami-Dade County Aviation Department, February 2019.
Federal Inspection Services (FIS) centers for U.S. Immigration and Customs Enforcement are located in Concourse E, Concourse J, and in the North Terminal. Passengers on international flights arrive at the Airport through the dual-purpose gates located on Concourses D, E, F, H, and J, which could accommodate both international and domestic operations. MIA’s terminals also provide facilities and services for processing interline and international in-transit passengers. Additional facilities include the 259-room Miami International Airport Hotel (the Hotel), owned by MDAD and located within the terminal building near Concourse E.
1.2.2 Landside Facilities
Table 2 presents the number of public parking spaces at MIA as of February 2019. Most of the parking spaces are provided in two parking garages, referred to as the Dolphin and Flamingo garages, located within the semicircle formed by the passenger terminal building and its access roadway.
Direct access to the bi-level roadway serving the passenger terminal building is provided via NW 21st Street. LeJeune Road (NW 42nd Avenue), which borders the Airport on the east, is the arterial road feeding NW 21st Street. LeJeune Road draws traffic from the north via State Road 112 (Airport Expressway) and Okeechobee Road, and from the south via State Road 836 (Dolphin Expressway) and Flagler Street. Airport Expressway and Dolphin Expressway connect with north-south Interstate 95 east of the Airport. A four-lane roadway directly connects Airport Expressway with
Average dailydepartures
Gates Per PerPreferential Common Total In Use Number gate Number departure
North TerminalConcourse D 61 - 61 61 313.5 5.1 45,809 146
North Terminal 61 - 61 61 313.5 5.1 45,809 146
Central TerminalConcourse E - 18 18 18 51.2 2.8 7,664 150 Concourse F 5 12 17 17 14.4 0.8 2,993 208 Concourse G 4 10 14 14 27.3 1.9 4,351 160
Central Terminal 9 40 49 49 92.8 1.9 15,008 162
South TerminalConcourse H 6 7 13 13 35.9 2.8 6,693 186 Concourse J 1 14 15 15 47.4 3.2 10,129 214
South Terminal 7 21 28 28 83.3 3.0 16,822 202
AIRPORT TOTAL 77 61 138 138 489.6 3.5 77,638 159
Average dailydeparting seats
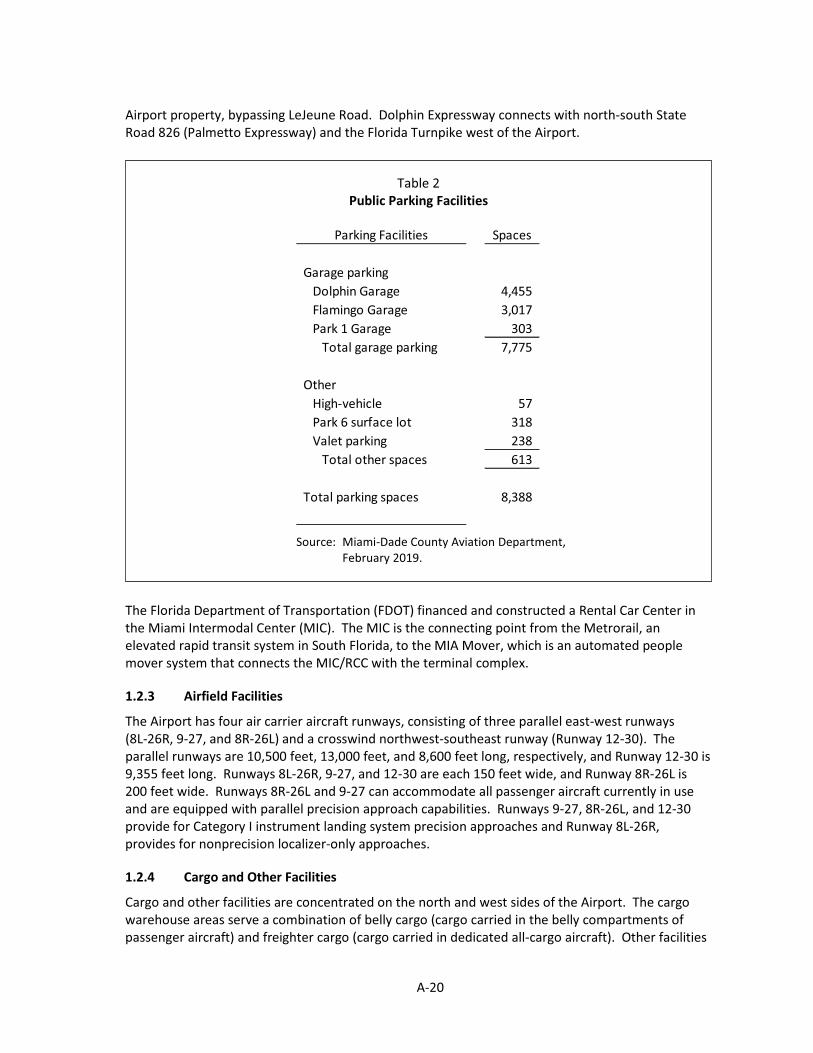
A-20
Airport property, bypassing LeJeune Road. Dolphin Expressway connects with north-south State Road 826 (Palmetto Expressway) and the Florida Turnpike west of the Airport.
Table 2
Public Parking Facilities
Source: Miami-Dade County Aviation Department, February 2019.
The Florida Department of Transportation (FDOT) financed and constructed a Rental Car Center in the Miami Intermodal Center (MIC). The MIC is the connecting point from the Metrorail, an elevated rapid transit system in South Florida, to the MIA Mover, which is an automated people mover system that connects the MIC/RCC with the terminal complex.
1.2.3 Airfield Facilities
The Airport has four air carrier aircraft runways, consisting of three parallel east-west runways (8L-26R, 9-27, and 8R-26L) and a crosswind northwest-southeast runway (Runway 12-30). The parallel runways are 10,500 feet, 13,000 feet, and 8,600 feet long, respectively, and Runway 12-30 is 9,355 feet long. Runways 8L-26R, 9-27, and 12-30 are each 150 feet wide, and Runway 8R-26L is 200 feet wide. Runways 8R-26L and 9-27 can accommodate all passenger aircraft currently in use and are equipped with parallel precision approach capabilities. Runways 9-27, 8R-26L, and 12-30 provide for Category I instrument landing system precision approaches and Runway 8L-26R, provides for nonprecision localizer-only approaches.
1.2.4 Cargo and Other Facilities
Cargo and other facilities are concentrated on the north and west sides of the Airport. The cargo warehouse areas serve a combination of belly cargo (cargo carried in the belly compartments of passenger aircraft) and freighter cargo (cargo carried in dedicated all-cargo aircraft). Other facilities
Parking Facilities Spaces
Garage parking Dolphin Garage 4,455 Flamingo Garage 3,017 Park 1 Garage 303
Total garage parking 7,775
OtherHigh-vehicle 57 Park 6 surface lot 318 Valet parking 238
Total other spaces 613
Total parking spaces 8,388

A-21
include aircraft maintenance hangars and shops; aircraft simulator and flight training facilities; test cell engine facilities; a Cargo Clearance Center that houses U.S. Customs and Border Protection, the U.S. Department of Agriculture and the Food and Drug Administration; a fixed base operator (FBO) and General Aviation Center; two aircraft rescue and firefighting (ARFF) stations; a U.S. Postal Service center; and the FAA’s Airport Traffic Control Tower and Terminal Radar Approach Control facility.
1.3 CAPITAL IMPROVEMENT PROGRAM
MDAD has identified a CIP for the Airport System, totaling $1.56 billion of project costs expected to be incurred over the period FY 2015 to FY 2023. The majority of these improvements (costing approximately $917 million) relate to improvements to the terminals and concourses at MIA. The CIP encompasses two project categories previously defined by MDAD, as follows:
� MDAD continuously reviews its future capital project needs, including a long-term strategic redevelopment plan for the Central Terminal. MDAD desires to rehabilitate and renovate the Central Terminal due to the age of the facility to improve operating efficiency. In 2015, MDAD defined a Terminal Optimization Program (TOP) to accomplish this objective, with an approved project budget of $1.45 billion.
� From 1994 to 2014, the Aviation Department implemented and substantially completed a 20-year $6.5 billion capital program that expanded and renovated the North and South Terminals, along with other improvements to the airfield, parking and roadway, and other facilities at MIA. There are a limited number of projects related to this program, previously defined by MDAD as “Carryforward Projects”, in the amount of approximately $106.4 million, which are being completed.
The major elements of the CIP are summarized as follows:
� South Terminal projects (costing $412.8 million): Replacement and upgrade of outbound baggage systems serving the Central Terminal and the South Terminal, and other terminal improvements
� Concourse E projects (costing $404.7 million): Rehabilitation of Concourse E to accommodate expected passenger growth
� MIA Central Base Apron and Utilities projects (costing $108.5 million): Construction of additional aircraft hardstand parking positions
� Passenger Loading Bridges (costing $77.9 million): Replacement of several old passenger loading bridges at the Airport that have reached the end of their useful lives.
� Miscellaneous projects (costing $322.5 million): A wide range of projects to improve operations at MIA.
The total cost estimate for the CIP also includes a program contingency of $136.1 million.
The estimated project costs for the major elements of CIP are summarized in Table 3.

A-22
Table 3
Capital Improvement Program Estimated Cost Miami-Dade Aviation Department
(in thousands)
Source: Miami-Dade County Aviation Department.
The estimated funding sources for the CIP include federal grants, state grants, PFC revenue, Reserve Maintenance funds, funds available in the Improvement Fund, previously issued general obligation bonds, Aviation Revenue Bonds, and other miscellaneous funding sources.
CIP project costs and funding sources have been provided to the airlines for review under the MII process as required by the 2018 AUA.
The estimated funding sources for the CIP are identified in Table 4. Approximately $275 million in net proceeds of the proposed 2019 Bonds is planned to be used to fund the CIP projects. The remainder of the Aviation Revenue Bonds estimated to be required for the CIP, or about $542 million, is expected to be issued during FY 2020*. The future Aviation Revenue Bonds estimated to
*A portion of MDAD’s previously issued Aviation Revenue Bonds, Series 2015, was also used for CIP funding.
Project Description Cost
Terminal projectsSouth Terminal projects 412,769$ North Terminal projects 8,523 Central Terminal projects 4,516 Concourse E projects 404,678 Concourse G projects 5,239 Concourse H projects 3,219 Passenger Loading Bridges 77,850
916,794 Other projects
MIA Central Base Apron and Utilities 108,482$ General aviation projects 28,012 Airside projects 23,964 Landside projects 22,852 Cargo projects 2,300 Miscellaneous projects 322,482
Total project costs 1,424,886
Program Contingency 136,080
Total 1,560,966$

A-23
be required for the CIP have been included in the financial analysis presented in this Report and are referred to as the anticipated 2020 Bonds.
MDAD is currently in the process of preparing a Master Plan update for the Airport, and it is expected that several major Airport development projects will be identified as part of this planning process. The Master Plan update is expected to be completed during 2019. The analysis and the financial forecasts described in this Report do not reflect the development of additional projects identified as part of the Master Plan, or the associated impact on future Aviation Revenue Bond issuance requirements, Revenues or Current Expenses.
Table 4
Capital Improvement Program Funding Plan Miami-Dade Aviation Department
(in thousands)
Source: Miami-Dade County Aviation Department.
Funding Sources TotalTSA FDOT FAA PFC Reserve Improvement Prior Future Project
Project Description OTA Grants Grants Revenue Maintenance Fund Other Bonds Bonds Costs
Terminal projectsSouth Terminal projects 101,161$ 31,003$ 3,389$ -$ -$ -$ -$ 2,221$ 274,995$ 412,769$ North Terminal projects - - - - - 7,860 663 - - 8,523 Central Terminal projects - - - - - - - 4,516 - 4,516 Concourse E projects - 56,378 8,735 - 73,798 3,576 - 75,000 187,191 404,678 Concourse G projects - - - - - - - 5,239 - 5,239 Concourse H projects - - - - 3,219 - - - - 3,219 Passenger Loading Bridges - - - 68,300 - - - - 9,550 77,850
101,161$ 87,381$ 12,124$ 68,300$ 77,017$ 11,436$ 663$ 86,976$ 471,736$ 916,794$ Other projects
MIA Central Base Apron and Utilities -$ 8,996$ 35,668$ 42,500$ -$ -$ -$ -$ 21,318$ 108,482$ General aviation projects - 2,359 4,152 - 900 4,453 - - 16,148 28,012 Airside projects - 4,097 - - - 6,660 - - 13,207 23,964 Landside projects - - - - 12,675 - - 10,177 - 22,852 Cargo projects - - - - - 2,300 - - - 2,300 Miscellaneous projects - 15,371 40,035 31,700 - 48,000 - 30,132 157,244 322,482
Total project costs and funding 101,161$ 118,204$ 91,979$ 142,500$ 90,592$ 72,849$ 663$ 127,285$ 679,653$ 1,424,886$
Program Contingency - - - - - - - - 136,080 136,080
Total 101,161$ 118,204$ 91,979$ 142,500$ 90,592$ 72,849$ 663$ 127,285$ 815,733$ 1,560,966$

A-24
2. AVIATION DEMAND AND AIRLINE TRAFFIC ANALYSIS
The economy of an airport service region is a major factor affecting long-term airline traffic at the airport(s) serving the region. Residents and visitors who travel on commercial flights to and from southeast Florida have a choice of using MIA or Fort Lauderdale-Hollywood International Airport (FLL), and their decision regarding which airport to use depends on several factors. There is a strong relationship between traffic flows through MIA and FLL, and the underlying economies of both Miami-Dade and Broward counties, which this section discusses.
2.1 AIRPORT SERVICE REGION
The Airport is the only commercial service airport in the County. Commercial airline service is also available at FLL, which is located 27 miles north of MIA, in Broward County. Residents of and visitors to Miami-Dade and Broward counties (together, the Airport Service Region or the Region) choose to patronize either MIA or FLL depending on such factors as ground accessibility, airfares, and the level and scope of airline service.* Figure 2 shows the Airport Service Region.
The aviation demand analysis in this Report is focused on each county in the Region. Miami-Dade County is an important international trading center with a large Hispanic population that generates demand for both international and domestic air transportation, while Broward County has a greater concentration of domestic economic activity. Both counties are home to substantial numbers of secondary residences, both vacation properties and investment real estate, which also affect air travel demand. Tourism and cruise activity, important components of the economies of both counties, also affect demand for air travel.
*The Greater Miami Visitors & Convention Bureau reports that most visitors arriving at the Airport are
destined for points within the Region.

A-25
Figure 2 Airport Service Region

A-26
2.2 DEMAND FOR PASSENGER AND CARGO SERVICE
The demographics and economy of the Region—as measured by changes in population, employment, and per capita income—are important factors affecting demand for originating passenger air travel (i.e., those itineraries that begin or end at MIA). Approximately 70% of MIA’s domestic enplaned passengers are originating passengers, and approximately 66% of MIA’s international enplaned passengers begin or end their trips in the Region. A well-developed tourism infrastructure also contributes to airline travel demand to and from the Region. Demand for international airline travel is also related to factors such as relative currency values and the presence of a dynamic international business community in the Region.
Connecting passenger traffic is determined to a large extent by the route network decisions of the hubbing airline, as discussed in Section 2.3.1, “Airport Rankings and Roles.” MIA’s role as an international gateway is due, in part, to its geographic location and to the route network decisions by American Airlines, its principal hub airline.
Demand for international air cargo service is derived from the demand for import, export, and transshipment of merchandise which, in turn, is driven by the underlying economic factors in the United States, the Region, and the principal overseas markets served by MIA. In addition to economic factors, the County’s international trade activities are driven by its strategic geographic location relative to Latin America and the Caribbean on the one hand, and North America, Europe, and Asia on the other.
2.2.1 Economy of the Airport Service Region
National economic trends are key determinants of the economic performance of the Region through their impact on the demand for goods and services and investment in the Region. This section reviews the outlook for the national and the Region’s economies.
Major industries in the Region, such as tourism, business and professional services, retail trade, information technology, and entertainment, are significant contributors to Regional income and employment. These industries also have a significant effect on airline travel to and from the Region.
Both air travel and the movement of cargo through MIA depend on the economic linkages between the national, State, and Regional economies reflected by key indicators such as employment, income, trade, and other factors discussed in this section.
National Economy
The current economic expansion, which began in July 2009, is headed into its tenth year in 2019. While longer than average, this expansion has been one of the slowest in the past century.* During the past nine years of economic expansion (2009 – 2018), the economy expanded at an average annual rate of only 2.3%, compared to an average annual rate of 4.3% for the past ten cyclical expansion periods starting in 1949. The lack of strength in this expansion cycle can be attributed to several factors including: the depth of the real estate market downturn during the recession that reduced household net worth; the continued below-average growth of the global economy and slower than expected growth in the larger emerging markets of Brazil, Russia, India, and China (BRIC); and a higher degree of uncertainty as demonstrated by swings in consumer confidence. *According to the National Bureau of Economic Research, the last recession began in December 2007 and
ended in June 2009.

A-27
Most of the growth during this expansion can be attributed to consumer spending. The U.S. economy began to gather momentum in the second half of 2014, fueled by greater consumer spending triggered by increasing jobs, record low interest rates, a recovery in household net worth following a rebound in the housing market, and a sharp drop in oil prices. This late-cycle growth acceleration has held firm through 2018. On the other hand, business investment expenditures have lagged, despite the boost in corporate cash flows from the drop in the corporate tax rate from 35% to 21% by the tax reform law of December 2017.
Moody’s Economy.com projects that the U.S. economy will maintain its current momentum with 2.9% growth during 2018-2019, which is above the U.S. historical average of 2.6% over the past 35 years, before slowing down beginning in 2020.* The economy is then forecast to slow notably in 2021 to 0.9% growth, followed by a recovery during 2022 – 2025. Table 5 shows that for the forecast period of 2017 – 2025, U.S. Gross Domestic Product (GDP) is projected to expand at an average annual rate of 2.2%, which is below the historical average. Average productivity in the U.S. economy is forecast to improve moderately above the historical average.
Inflation is forecast to peak at 2.5% during 2018 - 2019 due to: 1) the recent uptrend in oil prices; 2) wage pressures from historically low unemployment rates; 3) strength of consumer spending that has been pushing production closer to full capacity; and 4) below-normal growth in labor productivity. With slower growth in 2020, inflation is then projected to subside, averaging 2.2% during 2020 – 2025, which is below the 38-year historical average of 3.3%.
Table 5
Economic Projections for the United States
Real GDP growth Inflation Productivity
2012 2.2% 2.1% 0.6% 2013 1.8 1.5 0.2 2014 2.5 1.6 0.6 2015 2.9 0.1 0.8 2016 1.6 1.3 -0.2 2017 2.2 2.1 0.6
1979-2017 2.6% 3.3% 1.3% 2017-2020 2.2 2.2 1.1 2020-2025 2.2 2.2 1.6 2017-2025 2.2 2.2 1.4
Note: Productivity is GDP divided by non-agriculture employment.
Sources: U.S. Department of Commerce, Bureau of Economic Analysis; Moody's Economy.com, November 2018.
*Moody’s Economy.com, a division of Moody’s Analytics, Inc., is a recognized independent provider of
economic analysis, data, and forecasting and credit risk services.

A-28
State and Regional Economies
In 2017, Florida was the third most populous state in the nation, with 21.0 million residents. Between 1979 and 2017, Florida’s Gross State Product increased an average of 3.3% per year, higher than the national GDP average growth of 2.2% per year.* The State benefited from strong in-migration from other states as well as from other countries, which generated increases in construction activity and related industries. The Census Bureau estimates that during 2010 – 2017 47.0% of the increase in the State’s population was due to domestic in-migration, followed by 41.8% for international in-migration, and 10.8% for natural increase. The Regional economy is an important magnet for the State’s international migration.
The last U.S. recession had a greater impact on the Regional economy than on the economy of the rest of the nation owing to a more severe correction in the Regional real estate markets. Between 2007 and 2009 U.S. GDP fell an accumulated 4.0%, whereas the Region’s Gross Product fell by 11.8%.** However, this contributed to a relatively stronger recovery for the Region, particularly in terms of residential real estate values, influenced in part by foreign investors from Latin America, the Caribbean, and Europe, who seized on attractive property values at the trough of the real estate cycle in 2012. Based on the Case
-Shiller home price index, single family home values for the Region were up 72.2% in June 2018 with respect to the trough of the real estate cycle in November 2011, versus 59.0% for the United States with respect to its trough in March 2012.
Table 6 shows that total economic activity for the Region is projected to grow 2.4% per year, on average, from 2017 to 2020, which is moderately below the 38-year average of 2.8%, and then slightly lower during 2020 – 2025. A similar pattern is anticipated for the State, but at a moderately faster pace driven in part by more dynamic growth in the Orlando and Tampa Bay areas.
The flow of international trade in goods and services through the Region also affects employment and income within the Region and generates substantial activity at the Airport. In 2017, the value of merchandise trade through the Region’s ports—exports plus imports—represented 46.4% of the Region’s Gross Product, compared to 20% for the United States. This significant share of international trade lessens the Region’s business cycle volatility, because of its diversified domestic and international economic base. International trade in services represents another important channel of economic impact on the Region. These activities include tourism, retail trade, transportation, real estate investments, professional and business services, education, and healthcare.
*Gross State Product is the state counterpart of GDP; it represents the value added in production by the
labor and property located in a state. **Since the recession ended in June 2009, using the annual GDP and County Gross Product understate the
cumulative decline to the trough of the cycle.

A-29
Table 6
Economic Projections for the State and Airport Service Region Compound Annual Growth Rates
1979-2017 2017-2020 2020-2025
Gross State/Municipal Product Florida 3.3% 2.7% 2.8% Region 2.8 2.4 2.3 Miami-Dade County 2.3 2.3 2.2 Broward County 3.5 2.4 2.4
Productivity
Florida 0.8% 0.5% 1.9% Region 0.6 0.6 1.7 Miami-Dade County 0.4 0.6 1.6 Broward County 1.0 0.7 1.8
Real personal income
Florida 3.8% 4.2% 4.5% Region 3.0 4.0 4.1 Miami-Dade County 3.0 3.9 4.2 Broward County 3.1 4.0 4.0
Nonagricultural employment
Florida 2.5% 2.2% 0.9% Region 2.1 1.7 0.6 Miami-Dade County 1.9 1.8 0.6 Broward County 2.5 1.7 0.6
Notes: Gross State and Municipal Product are the analogous measures of GDP for states and counties, respectively.
Productivity is Gross State and Municipal Product divided by nonagricultural employment.
Sources: Historical: U.S. Department of Commerce, Bureau of Economic Analysis; Forecast: Moody's Economy.com, November 2018.
Risks to the U.S. Economic Outlook that Impact the State and Regional Economies
The risks to the economic outlook include: (1) higher inflation and interest rates; (2) protracted trade policy battles; (3) higher fiscal deficits; (4) financial markets turbulence and crisis of confidence; and (5) slower growth and a cyclical downturn in the global economy. These risks are discussed below.
Higher Inflation and Interest Rates
The outlook for the U.S., based on Moody’s Economy.com forecast, calls for the economy to begin to slow in 2019-2020, along with a slowing of inflation. Nevertheless, there is the possibility that stronger demand growth from consumer spending, more dynamic business investment spending, and favorable tail winds from the global economy, such as healthy growth in China, could lead to higher inflation than what is forecast in this analysis for 2019-2020. U.S. inflation averaged 2.4% in
A-30
2018, based on the consumer price index. Yet, most recently, the Federal Reserve’s view of a possible slowdown as early as 2019 with lower inflation led to their announcement placing further increases in the Fed Funds band on stand-by, pending any changes in economic data. Nevertheless, higher than expected inflation could lead financial markets to push medium- to long-term interest rates above what the Federal Reserve may be targeting. Record-low U.S. unemployment rates of 3.8%, below-average labor productivity growth, the recent uptrend in oil prices since the beginning of 2019, and continued consumer spending momentum during the first half of 2019, could trigger moderately higher inflation than currently expected thus adding upward pressure to interest rates. Higher inflation and interest rates could trigger a more pronounced slowdown in 2020 with moderately higher inflation than what is anticipated in this forecast. As explained below, the risk of higher fiscal deficits could also push medium- to long-term interest rates higher, with adverse consequences for the U.S. economy.
Protracted Trade Policy Battles
The decision in 2018 by the United States to impose tariffs on selected products on goods imported from several countries represents a shift in U.S. trade policy towards more aggressive engagement. These tariffs will inevitably be passed through to final end-users of goods and services, thus contributing to higher inflation, particularly at a time of robust growth in the United States. More recent measures have narrowed the focus of the tariff battles to the United States and China. In view of the importance of the United States and China as the largest economies in the world, an escalation of these tariff frictions could undermine global economic growth; yet, because of the competitive situation between the two countries, trade tensions are likely to persist in the medium- to long-term. This forecast assumes that the recent use of tariffs will not escalate into a more serious confrontation, and that the economy maintains its current momentum.
Higher Fiscal Deficits
When the economy begins to lose momentum, possibly in 2020, higher U.S. fiscal deficits could raise investors’ concerns. The preliminary estimate of the Federal deficit for FY 2018 was $782 billion or 3.9% of GDP, up $119 billion from the FY 2017 deficit of $666 billion. Despite the stronger economy, the 2017 Tax Reform Law will result in higher deficits due to the magnitude of the cut in the corporate income tax rate, from 34% to 21%, and a more moderate cut in effective personal income taxes. In April 2018, the U.S. Congressional Budget Office issued an initial projection of the deficit incorporating the 2017 tax reform that averaged 4.9% of GDP during 2018 – 2028. Such persistent high fiscal deficits could result in a credit downgrading of the U.S. Federal government that would lead to higher interest rates.
Financial Markets Turbulence and Crisis of Confidence
Political tensions, investors’ recession fears, and increased market turbulence, as evidenced in equity markets during 2018, could trigger greater market anxieties which could compromise the current expansion. A divisive political environment, with a Republican majority in the Senate and a Democratic majority in the House of Representatives, could lead to a policy deadlock and thus a setback for investor confidence. Emerging markets would be more vulnerable in this environment to a weaker investor appetite for global risk.
Slower Growth and Cyclical Downturn in the Global Economy
Moody’s forecasts a slowdown in the U.S. economy in 2020, which is also predicted for the global economy by the International Monetary Fund (IMF) as well as independent analysts such as the

A-31
Economist Intelligence Unit. There is a risk that a cyclical downturn in the United States and in China in 2020 could trigger a global recession with repercussions for the medium- to long-term outlook.
Continued weakness in the global economy could also adversely affect the U.S. economy. The Euro Area is still trying to establish sustainable economic expansion.* The United States is more vulnerable to negative developments in the global economy now than over the past 50 years. After the United States recovered from the 1982 recession, it accounted for approximately 22% of global GDP in 1984, followed by Japan with 8.4%, and the top Euro Area economies of Germany, France, and Italy with 15.1%.** In 1984, China represented only 2.8% of global GDP. By 2017, the IMF estimates that China had reached 18.2% of world GDP, followed by the United States with 15.3%. The share of emerging markets and developing countries increased from 36.1% of global GDP in 1984 to 58.7% in 2017. The increasing importance of the emerging and developing markets is also reflected in the robust growth in world trade and travel.
Economy of the Airport Service Region
The principal components of the Region’s economy are discussed below in terms of: (1) demographic characteristics; (2) income trends; (3) employment structure and growth; (4) tourism flows; and (5) the rising technology, pharmaceutical, and media industries.
Demographic Characteristics
The County is the most populous county in Florida, followed by Broward County. Based on the U.S. Department of Commerce, Bureau of the Census estimates for 2017, the County was home to 13.1% of the State’s population, and Broward County was home to 9.2% of the State's population. Collectively, the Airport Service Region represented 22.3% of the State’s population.
In comparison with the population of the State, Broward County, and the nation, the County’s population is younger and has a lower educational attainment. In 2017, 81.0% of the County’s residents were high school graduates compared with 88.6% in Broward County, 87.6% in the State, and 87.3% in the nation. The County’s foreign-born residents represent 52.9% of the total population, compared with 33.1% in Broward County, 20.2% in the State, and 13.4% in the nation.***
Table 7 shows that the Airport Service Region’s share of total U.S. population is projected to average 1.5% during the forecast period 2018 – 2025, while its share of the State’s population is projected to decrease from 22.3% in 2017 to 21.5% in 2025. Moody’s Economy.com projects that the Region’s population growth will be moderately higher throughout the forecast period compared to the 2000 – 2017 period, particularly in the near term, as growth of employment leads to an increase in net in-migration (higher in-migration, lower out-migration). With higher projected employment growth for the State, its population will grow at a faster pace than the nation.
*The Euro Area is made up of 17 countries: Austria, Belgium, Cyprus, Estonia, Finland, France, Germany,
Greece, Ireland, Italy, Luxembourg, Malta, the Netherlands, Portugal, Slovakia, Slovenia, and Spain. **These GDP figures were compiled by the IMF and are expressed in U.S. dollars converted at purchasing
power parity-adjusted exchange rates. ***Statistics on education and foreign-born residents are estimates made by the U.S. Census Bureau based on
the American Community Survey.

A-32
Table 7
Historical and Projected Population Trends (In thousands, except percentages)
United States Florida
Broward County
Miami-Dade County
Region as Percent of
United States
Region as Percent of
Florida
Historical 1960 181,053 5,034 334 935 0.7% 25.2% 1970 205,052 6,845 625 1,278 0.9 27.8 1980 227,255 9,841 1,026 1,643 1.2 27.1 1990 249,618 13,033 1,263 1,944 1.3 24.6 2000 282,162 16,048 1,631 2,260 1.4 24.2 2010 309,326 18,846 1,753 2,507 1.4 22.6 2017 326,498 20,984 1,936 2,752 1.4 22.3
Projected 2018 327,968 21,397 1,968 2,788 1.5% 22.2% 2019 330,108 21,828 2,001 2,825 1.5 22.1 2020 332,110 22,259 2,035 2,862 1.5 22.0 2025 342,779 24,412 2,200 3,043 1.5 21.5
Compound annual growth rate (%)
Historical 1960-1970 1.3% 3.1% 6.5% 3.2% 1970-1980 1.0 3.7 5.1 2.5 1980-1990 0.9 2.8 2.1 1.7 1990-2000 1.2 2.1 2.6 1.5 2000-2017 0.9 1.6 1.0 1.2 1960-2017 1.0 2.5 3.1 1.9
Projected 2017-2020 0.6% 2.0% 1.7% 1.3% 2020-2025 0.6 1.9 1.6 1.2 2017-2025 0.6 1.9 1.6 1.3
Sources: Historical: Moody's Economy.com based on U.S. Census Bureau. Projected: Moody's Economy.com as of November 2018.

A-33
Income Trends
Table 8 shows that the County’s per capita income growth rates lagged that of the State and the nation during the 1990’s, but then out-performed the State and the nation between 2000 and 2017. The projection shows the County per capita income growing at a modestly faster pace than the State and the nation during 2017 – 2025; thus, the purchasing power of households in the County is growing modestly faster than the State and the nation.
Table 8
Per Capita Personal Income Trends (2012 dollars)
Year United States Florida
Broward County
Miami-Dade County
Region as Percent of
United States
Region as Percent of
Florida
Historical 1970 20,135 19,854 24,074 22,110 113.0% 114.6% 1980 24,775 24,671 29,686 25,440 109.3 109.7 1990 31,072 31,499 37,135 29,156 103.9 102.5 2000 39,194 37,522 39,784 33,968 92.9 97.0 2010 42,395 40,240 42,479 39,848 96.5 101.7 2017 48,713 44,953 46,165 44,932 93.3 101.1
Projected 2018 49,547 45,744 47,055 45,984 93.7% 101.5% 2019 50,438 47,110 48,456 47,460 94.9 101.6 2020 51,107 48,073 49,454 48,520 95.7 101.7 2025 54,717 54,905 55,655 56,109 102.2 101.8
Compound annual growth rate (%)
Historical 1970-1980 2.1% 2.2% 2.1% 1.4% 1980-1990 2.3 2.5 2.3 1.4 1990-2000 2.3 1.8 0.7 1.5 2000-2017 1.6 1.3 1.1 2.0 1970-2017 2.0 1.9 1.5 1.6
Projected 2017-2020 1.6% 2.3% 2.3% 2.6% 2020-2025 1.4 2.7 2.4 2.9 2017-2025 1.5 2.5 2.4 2.8
Note: Nominal figures were adjusted by a consumer spending deflator. Sources: Historical: Moody's Economy.com based on U.S. Department of Commerce, Bureau
of Economic Analysis. Projected: Moody's Economy.com as of November 2018.
A-34
Employment
Historically, U.S. employment in the services industries has been steadily increasing in importance. The Region’s economy has relied on an even greater concentration of services industries than the nation. In 2017, employment in services industries accounted for 92.4% of all private sector nonagricultural jobs in the County, 91.1% for Broward County, and 89.8% for the State, compared with 86.3% for the nation.
The highest growth sector of the County’s economy has been professional and business services, in which employment increased an average of 4.6% per year from 1990 through 2017. Employment in education and health care services has grown at a rate of 2.6% per year since 1990. Employment growth in these two sectors in Broward County was 6.4% and 2.9%, respectively.
In terms of total employment, the top five industry groupings for the County in 2017 were: education & healthcare (15.6%), professional & business services (14.6%), retail trade (12.6%), government (12.2%), and leisure & hospitality (12.0%).
Manufacturing employment as a share of total employment has been declining in the Region, the State, and the nation since 1990. Manufacturing accounted for 3.6% of total nonagricultural employment in the County in 2017, down from 10.1% in 1990. This trend has been partially offset by the growth of high-technology manufacturing such as pharmaceutical, semiconductors, and other electronic components.
Table 9 shows employment projections through 2025. Employment growth for the County is projected to be lower than the statewide average but higher than the national average.

A-35
Table 9
Total Nonagricultural Employment Trends (numbers of jobs in thousands)
Year United States Florida
Broward County
Miami-Dade
County
Region as Percent of
United States
Region as Percent
of Florida
Historical 1970 71,007 2,152 176.5 393.9 0.8% 26.5% 1980 90,531 3,576 349.2 606.3 1.1 26.7 1990 109,531 5,364 490.2 854.6 1.2 25.1 2000 132,034 7,055 673.6 998.7 1.3 23.7 2010 130,353 7,173 705.0 985.3 1.3 23.6 2017 146,624 8,570 836.8 1,175.0 1.4 23.5
Projected 2018 149,010 8,795 851.9 1,197.1 1.4% 23.3% 2019 151,221 9,041 871.3 1,227.4 1.4 23.2 2020 151,748 9,152 879.1 1,238.7 1.4 23.1 2025 155,822 9,589 907.1 1,276.4 1.4 22.8
Compound annual growth rate
Historical 1970-1980 2.5% 5.2% 7.1% 4.4% 1980-1990 1.9 4.1 3.4 3.5 1990-2000 1.9 2.8 3.2 1.6 2000-2017 0.8 1.4 1.6 1.2 1970-2017 1.7 3.2 3.6 2.5
Projected 2017-2020 1.2% 2.2% 1.7% 1.8% 2020-2025 0.5 0.9 0.6 0.6 2017-2025 0.8 1.4 1.0 1.0
Sources: Historical: Moody's Economy.com based on U.S. Department of Labor, Bureau of Labor Statistics.
Projected: Moody’s Economy.com as of November 2018.
Table 10 shows the largest private sector employers within Miami-Dade and Broward counties as of 2015. In Miami-Dade, three of the top employers were providers of healthcare, three were in the hospitality industry, and two were in financial services. For Broward, three were in retail, two in IT/software, and two in education.

A-36
Table 10
Top Private Sector Employers in Miami-Dade and Broward Counties
Miami-Dade County Broward County
Employer Number of employees Employer
Number of employees
University of Miami 12,818 Nova Southeastern Univ. 6,685 Baptist Health South Florida 11,353 AutoNation 4,100 American Airlines 11,031 American Express 3,500 Carnival Cruise Lines 3,500 Spirit Airlines 3,349 Miami Children’s Hospital 3,500 Citrix 1,700 Mount Sinai Medical Center 3,321 JM Family Enterprises, Inc. 1,700 Florida Power & Light Company 3,011 Ultimate Software 1,678 Royal Caribbean Intl./Celebrity
Cruises 2,989
DHL Express 1,400 Wells Fargo 2,050 City Furniture 1,349 Bank of America Merrill Lynch 2,000 Kaplan 1,291 Fontainebleau Miami Beach 1,987 The Castle Group 1,062 Burger King Corporation 1,885 Magic Leap 900
Sources: Miami-Dade County, The Beacon Council (2015), and Broward Alliance (2015).
Tourism
The County is a leading center for tourism in the State. It is the second-largest tourist destination in Florida for domestic air travelers after Orlando. It is also the principal gateway in the State for international air travelers and the second in the nation after New York (excluding travelers from Canada and Mexico). According to the Greater Miami Convention & Visitors Bureau (GMCVB) as of December 2017, about 54,523 hotel and motel rooms were located in the County. Based on 18 new hotel projects under construction through 2019, capacity will increase by 2,592 new rooms. The largest project is the Miami World Center slated for completion in 2020, which includes 1,800 rooms.
Table 11 shows that the County hosted 15.9 million visitors in 2017, of which 50.8% were domestic visitors. The direct expenditures of domestic and international visitors were estimated to be $26.0 billion in 2017 by the GMCVB, which represents approximately 18.5% of the Gross Product of the County.* The number of overnight visitors to the County in 2017, arriving via all modes of transportation, was up 0.9% year-over-year, driven by an increase in international visitors (up 2.3%). Domestic visitors declined by 0.5% in part because of Hurricane Irma, which struck in the beginning of September 2017 and damaged numerous destinations along the beaches.
The number of visitors from South America decreased 2.9% between 2016 and 2017 due to the recessions in Argentina and Brazil, and the economic and political crisis in Venezuela. The depreciation of their currencies with respect to the U.S. dollar discouraged visitors from the Latin America and Caribbean (LAC) region and those who did visit Florida spent less money on food,
*The percent of Gross Product is calculated by StratInfo based on data provided by Moody’s Economy.com.

A-37
entertainment, and shopping. With the recovery in Argentina and Brazil, the international component is expected to assume a larger share of the County’s visitors’ market.
Table 11
Visitors to Miami-Dade County
Number (thousands) Percent of total Area of Origin 2000 2010 2017 2000 2005 2013
South America 2,304 2,837 3,632 20.7% 22.5% 22.9% Central America 421 525 673 3.8 4.2 4.2 Caribbean 739 689 905 6.6 5.5 5.7
LAC 3,464 4,050 5,210 31.0 32.1 32.9
Europe 1,419 1,307 1,664 12.7 10.4 10.5 Canada 633 587 654 5.7 4.7 4.1 Other 169 116 271 1.5 0.9 1.7
Total International 5,685 6,060 7,798 51.0 48.1 49.2
Domestic visitors 5,472 6,544 8,062 49.0 51.9 50.8
Total visitors 11,157 12,604 15,860 100.0 100.0 100.0
Note: LAC is Latin America and the Caribbean. Source: Greater Miami Convention & Visitors Bureau, April 2018.
The relatively even split of domestic and international visitors has helped to sustain the steady growth of visitors to the County. Following the 2001 recession and terrorist attacks, international visitors to the County decreased, hampered by travel restrictions and the severity of the Argentinean crisis, while the number of domestic visitors recovered. Then, as the 2008-2009 recession adversely affected the number of domestic visitors, international visitors, particularly those from Latin America, continued to increase. Again during 2014 – 2015, with the collapse of oil prices, U.S. consumers experienced a substantial increase in purchasing power from lower fuel and energy costs resulting in robust growth of domestic visitors to the County. The boost in domestic tourist arrivals helped to offset the impact from a weakening in the international market when Argentina and Brazil entered a recession, compounding the ongoing impact from the Venezuelan crisis. At the same time, the weakening of the U.S. dollar relative to the Euro led to an increase in European visitors.
The tourism market in the County reflects the scale and variety of its leisure attractions. In 2017, 86.2% of total visitors to the County traveled for leisure purposes, including cruises, or to visit family and friends. Most visitors were in the 25-54 age group, the average party size was 2.17, and 96.1% of visitors arrived by air.
Having completed the main phase of an expansion project, the Miami Beach Convention Center is expected to boost the flow of convention business to the County. The $620 million renovation added 263 thousand square feet to reach 1.4 million square feet of space, constructed a new

A-38
exterior face of the center, and in November 2018, Miami Beach voters approved the building of a new convention center hotel which developers plan to complete within the next five years.
Port Miami (in the County) is the world’s largest multi-day cruise port, and the majority of cruise ship passengers embarking from the Port arrive via commercial flights to MIA. Table 12 shows that the number of cruise ship passengers embarking and disembarking through the Port Miami increased from 1.5 million in 1980 to 5.6 million in 2018. The increases in the number of cruise passengers in 2017 and 2018 were attributable to the arrival of new larger vessels at Port Miami. Port Everglades (in Broward County), despite more volatile passenger volumes since 1980, accommodated 3.9 million passengers in 2018. With the arrival of new mega-ships, the number of multi-day cruises at Port Everglades has increased, while single-day cruise volumes have fallen.
Table 12
Cruise Ship Passengers Embarkation and Debarkation
(in thousands)
Port Miami Port Everglades
12 months ended September 30
Passengers
Percent increase
(decrease)
Passengers
Percent increase
(decrease)
1980 1,467 122 1990 2,735 2,188 2000 3,365 2,737 2010 4,145 3,674 2015 4,916 3,773 2016 4,980 1.3% 3,826 1.4% 2017 5,340 7.2 3,864 1.0 2018 5,592 4.7 3,870 0.2
Compound annual growth rate
1980-1990 6.4% 33.5% 1990-2000 2.1 2.3 2000-2010 2.1 3.0 2010-2018 3.8 0.7
Note: Passenger figures for the Port of Miami are multi-day cruise passengers until 2013 when single-day cruises were introduced, while those for Port Everglades include both single-day and multi-day cruise travelers.
Sources: Port of Miami and Port Everglades, February 2019.

A-39
Port Miami is now home to 37 cruise ships that operate year-round, including several mega-cruise ships. Its infrastructure allows for the accommodation of ships with individual capacities up to 6,500 passengers. The construction of a tunnel connecting the Port of Miami to a downtown expressway, which was opened in August 2014, has improved traveler and cargo access. In 2015, the completion of the Port’s dredging project increased its depth from 42 to 50 feet in order to handle the New-Panamax ships, which are the new class of mega ships that fit within the new widened locks of the Panama Canal.* The dredging project will allow the Port to accommodate the new, mega cargo vessels that pass through the expanded Panama Canal. This activity includes diversion of merchandise bound for the U.S. East Coast from Asia that currently enters by West Coast ports. All of these factors will have a favorable effect on employment and income in the County.
Technology, Pharmaceutical, and Media Industries
The County is home to over 1,900 information technology and telecommunications firms, including those in computer equipment manufacturing, computer systems design, telecommunications, and data processing. The County is also home to biomedical and pharmaceutical manufacturers. The University of Miami has created a major Bioscience Center in the City of Miami.
The film, television, and print production industry is also an important sector of the County’s economy. According to the U.S. Census Bureau, in 2016, this industry included 354 motion picture and video production companies, 42 post-production facilities, 76 sound recording production and distribution facilities, and 29 cable companies in the County. The County is a center for Spanish language broadcasting in the United States, and home to Spanish media companies focusing on the LAC markets. The County is also a center for the Latin American music industry.
2.2.2 Key International Markets
Key international markets include: the LAC region, Europe, and Asia. These markets are discussed below.
Latin America and Caribbean
LAC countries are the Region’s principal international markets for goods and services and represent a key driver of demand for airline passenger transportation. MIA is a major hub for airline travel between LAC, the Region, and other parts of the world; it is also a key transshipment facility for merchandise trade between these economic areas. A significant portion of the businesses in the Region are directly linked to trade in goods and services with LAC. Because of their location, these firms, in turn, are users of airline services at MIA.
The economic outlook for LAC countries is therefore an important determinant of the demand for air transportation at and through MIA. Because of their geographic location, LAC countries have close economic links to the United States. In 2017, 43.9% of LAC exports were to the United States, 8.9% to the Euro Area, 10.2% to China, and 16.0% to other LAC countries as part of intra-regional trade. These shares have shifted substantially since 2000, when LAC exports to the United States were 58.0%, to the EU 9.2%, to China 1.0% and to other LAC countries 18.6%. The remaining exports were bound for other world areas. Asia has been the fastest growing world destination for LAC exports since 2000, and this trend is projected to continue. Of all LAC imports in 2017, 32.6% *The New-Panamax ships have a cargo capacity of 14,000 TEU (twenty-foot equivalent units), versus 5,000
TEU for the Panamax ships.

A-40
were from the United States, down from 49.5% in 2000, 17.6% from China, up from 2.1% in 2000, 11.3% from the Euro Area, and 15.9% from other LAC countries. Much of the air trade between the LAC region and Europe and Asia is transshipped through MIA.
Following the economic and debt crisis of the early 1980s, the implementation of market-based economic reforms in the LAC region during the 1980’s contributed to a period of sustained economic expansion from 1990 to the Latin American recession of 2002. A gradual recovery in 2003 was followed by a period of robust economic expansion, particularly in South America, which benefitted from growth in demand for natural resources by China, India, and other fast-growing emerging markets.
Legislative reforms in the 1990s strengthened fiscal discipline in the LAC region. During the last global recession in 2008 - 2009, marked by large fiscal deficits in the United States and the Euro Area and the default by Greece on its external debt in 2011, the fiscal deficits in the LAC region averaged only 2.3% of GDP, leaving greater room in the capital markets to finance investment by the private sector.
Governments in LAC countries also pursued reforms in the financial sector. Most LAC currencies are now market-determined or can trade within a flexible band. Stable economic policies combined with external trade surpluses contributed to much less volatile LAC currencies. However, due to the dominance of natural resource-based exports, particularly in South America, LAC currencies are vulnerable to swings in commodity prices. When commodity prices fell by 30% in 2009, the currencies of Argentina, Brazil, Chile, Colombia, Mexico, and Peru depreciated in value with respect to the U.S. dollar; and then again in 2015, when the commodity price index fell by 35%. Venezuela and Argentina, with their significant economic policy problems and high inflation, experienced more significant decreases in the value of their currencies.*
Table 13 shows that the most dramatic improvement in the LAC region since the 1990s has occurred in the rate of inflation, which decreased from rates exceeding 100% during the early 1990s to more recent rates in the single digits. Lower inflation rates were made possible through consistent implementation of structural economic reforms in the 1980s, such as fiscal discipline, which resulted in an average fiscal deficit of 2.25% between 1995 and 2017.
The other significant improvement in financial health shown by the data in Table 13 is the decline in the ratio of external debt to exports which fell from an average of 3.9 prior to 1995, to 1.3 during 2007 – 2010. Nevertheless, with the widening of the current account deficits, which measure a country’s shortfall in trade of goods and services, during the 2010 – 2017 period, the Region’s debt ratios have been rising but are still manageable, particularly with the region’s significant international reserves coverage.
Because of its emphasis on commodity exports, the LAC region experienced only a moderate recession during the global downturn in 2008-2009 with a decline of 2.0% in 2009, as commodity prices did not drop until 2009 and then recovered quickly. However, other country-specific factors have negatively affected Argentina, Brazil, and Venezuela during the period since 2009.
*Source for the commodity index is the IMF, the index is: “World: Commodity Price Index includes both Fuel
and Non-Fuel Price Indices.”

A-41
The most serious has been Venezuela, whose economy is still reeling from an economic depression and hyper-inflation starting in 2014 with increasing government control over the economy and censoring of the media. This crisis worsened further with the collapse of oil prices during the last quarter of 2014. Further clampdown by President Maduro against his political opposition resulted in his re-election in May 2018, which has been denounced as illegitimate by the international community. Estimates by the IMF show that between 2014 and 2018, the Venezuelan economy fell by a cumulative 73% in terms of real GDP. In January 2019, as the economy continued to experience hyperinflation and a significant drop in domestic production, with widespread scarcities of food, medicine, and other essential products, Juan Guaidó, head of Venezuela’s National Assembly, declared himself interim President of Venezuela and was quickly recognized by the United States. In view of the current volatile situation in Venezuela and the high degree of uncertainty surrounding any possible outcome, it has been excluded from the LAC projections presented in this Report. If Venezuela were able to resolve its current problems, however, and make material progress in reconstructing its economy, this would have a positive impact on the LAC outlook and the Region’s economy, through trade and commerce.
Table 13
Latin America and the Caribbean: Historical Economic Indicators
1995-2000 2000-2007 2007-2010 2010-2017 (a)
GDP growth 3.0% 3.4% 2.7% 1.6%
Inflation (percentage) 12.3% 6.1% 5.1% 5.2%
Government deficit (percent of GDP) 2.1% 2.0% 2.3% 2.7%
Current account surplus/(deficit) (millions of U.S. dollars) (b)
($59,424) $8,925 ($55,147) ($135,296)
Foreign direct investment (millions of U.S. dollars)
$63,996 $54,628 $97,802 $141,446
External debt to exports ratio 2.5 2.2 1.3 1.6
Notes: Figures are annual averages. The periods shown by this table since 2000 correspond to the cyclical swings in the
global economy, marked by the global recession in 2007-2010.
(a) Due to the severe economic and financial crisis, ECLAC has excluded the economic figures for Venezuela for 2016 – 2017.
(b) The current account balance measures the difference between exports and imports of goods and services, where a surplus leads to an improvement in the country’s international liquidity position, while a deficit requires an influx of foreign capital to cover the country’s earnings gap.
Sources: U.N. Economic Commission for Latin America and the Caribbean (ECLAC); International Monetary Fund (IMF), as adjusted by StratInfo, December 2018.

A-42
Brazil was hit by low commodity prices and a major political scandal in 2015 involving large-scale bribery that went beyond the country’s borders and eventually led to the impeachment of its President. Brazil’s GDP declined a cumulative 7% during 2015 – 2016.
Since 2014, the Argentinian economy was mired in another inflation/devaluation workout session aggravated by greater government intervention in the economy, which ended with the election of a new president in 2016 who has been striving to re-stabilize the economy since taking office. However, market pessimism about the new government’s ability to restore economic growth caused a run against the Argentinian currency by investors during the first half of 2018, which led the IMF to make an emergency liquidity loan to stabilize the currency so that the government could continue to implement its stabilization program.
Other countries in the region, such as Chile, Colombia, the Dominican Republic, Mexico, Panama, and Peru, have posted healthy performance. While Colombia and Mexico are oil producing countries, the substantial drop in oil prices during the second half of 2014 was more than offset by strengthening of consumer purchasing power through the lower cost of energy, particularly for their expanding middle classes.
Outlook
Table 14 shows that the economies of LAC countries are projected by StratInfo to grow an average of 2.4% per year between 2017 to 2020, as measured by real GDP, which reflects the slow recovery in Argentina and Brazil, with some strengthening to 3.2% between 2020 – 2025, helped by an improving outlook for the global economy, after the expected global slowdown in 2020. Expansion of the global economy in the latter part of the forecast period will benefit the Region with its abundant natural resources and positive fundamentals such as low inflation, manageable deficits, and low debt ratios. Investments in infrastructure will also support improving growth. The average growth rate for the full forecast period of 2017 – 2025 is 2.9%, which is slightly higher than the average growth rate during the past 20 years of 2.5%.
The outlook for LAC regional economies assumes that international trade will continue to be the main engine of growth and that commodity prices will increase at a moderate pace. The fundamental competitive factors supporting LAC’s growth in exports include: abundant natural resources, lower production costs, and trade-creation opportunities with the United States and China as well as other countries in Europe and Asia.
This forecast also assumes that, despite weak expansion in global demand, the positive fundamentals in the LAC region will continue to support growth during the forecast period. These advantages are likely to be sustained through the application of economic policies that promote investment and increased trade. Several of the LAC countries have been able to maintain sizable foreign exchange reserves to protect against a sudden downfall in export earnings, while low debt to export ratios provide additional borrowing capacity to finance needed infrastructure investments.

A-43
Table 14
Latin America and the Caribbean: Selected Economic Indicators
GDP Real GDP GDP per Debt (millions of (millions of Population capita to exports current US$) 2010 US$) (thousands) (US$) ratio
Historical 1990 1,188,478 2,731,993 443,032 2,683 3.0 2000 2,240,273 3,697,127 526,278 4,257 2.1 2010 5,076,880 5,076,880 597,562 8,496 1.4 2015 6,246,751 5,663,351 632,381 9,878 2.0 2016 6,027,638 5,615,403 639,049 9,432 2.1 2017 6,639,884 5,686,550 645,593 10,285 2.0
Projected 2018 6,484,113 5,786,142 651,985 9,945 2.0 2019 6,680,995 5,945,434 658,439 10,147 2.0 2020 6,915,222 6,109,544 664,892 10,401 1.9 2025 9,060,928 7,137,032 698,255 12,977 1.8
Compound annual growth rate
Historical 1990-2000 6.5% 3.1% 1.7% 4.7% 2000-2010 8.5 3.2 1.3 7.2 2010-2017 3.9 1.6 1.1 2.8
Projected 2017-2020 1.4 2.4 1.0 0.4 2020-2025 5.6 3.2 1.0 4.5 2017-2025 4.0 2.9 1.0 2.9
Note: Given the extreme volatility in the Venezuelan economy since 2016 and great uncertainty about its future, it has been excluded from the LAC forecast. Based on an estimate by the IMF, the GDP of Venezuela (in U.S. dollars) represented approximately 3% of the LAC GDP in 2017.
Sources: Historical: ECLAC, IMF, and World Bank, as adjusted by StratInfo, November 2018. Projected: StratInfo, November 2018.
Trade Expansion in LAC through Free Trade Agreements. There is a strong historical relationship between economic (GDP) growth in Latin America and the Caribbean and growth in the volume of international trade to and from LAC countries. Between 2017 and 2024, the LAC region’s projected real annual economic growth (real GDP) of 2.9%, according to StratInfo, implies growth in the volume of international trade, especially through increased trade with Developing Asia and the expansion of regional free trade agreements.* Trade between LAC countries and China has increased, driven largely by commodities exported from LAC countries. In 2017, China was the second most important supplier to the Region, after the United States and that share is expected to *Developing Asian economies refers to 27 emerging and developing economies of Asia as established by the
International Monetary Fund (IMF) in the World Economic Outlook (WEO), April 2012. This category includes China, India, Indonesia, Thailand, and Pakistan, among others.

A-44
grow significantly in the future. Total merchandise exports from the LAC region will be a significant contributor to economic growth as their share of GDP are projected to rise from 18.4% in 2017 to 21.4% in 2025. Existing and pending free trade agreements are expected to bolster the growth in trade between the LAC region and the United States through the County.
The following major U.S. trade agreements are in effect: The North American Free Trade Agreement (NAFTA) (1993), the Chile Free Trade Agreement (2004), the Central America-Dominican Republic Free Trade Agreement (CAFTA-DR) (2006), the Peru Free Trade Agreement (2007), the Colombia Free Trade Agreement (2011), and the Panama Free Trade Agreement (2011). These free trade agreements are estimated to have resulted in a material increase in international trade.
Renegotiation of NAFTA. After 25 years, the NAFTA agreement was re-negotiated, updated and replaced by a new trade agreement, called the United States-Mexico-Canada Agreement (USMCA), which makes some changes to the previous agreement. The primary changes of the USMCA include: (1) adaptation to the dynamic changes in international trade, particularly technology and intellectual property; (2) tightening of loopholes in rules of origin that allowed duty-free entry of products by non-NAFTA countries, which are expected to have a significant impact on the automotive industry; and (3) market access in areas still protected by the original agreement, although current tariffs on steel and aluminum imports will remain until further notice. The USMCA has also made modifications to the labor and the environment chapters of the original agreement. The new agreement still needs to be ratified by the U.S. Congress and its counterparts in Canada and Mexico.
Normalization of United States-Cuba Relations
The normalization of United States-Cuba relations could result in an end to the U.S. embargo by the U.S. Congress. Forty-seven years after the United States broke off diplomatic relations with Cuba, bilateral relations between the two countries were re-established in July 2015, restoring full diplomatic ties, and easing travel restrictions. However, in June 2017, the United States issued new restrictions on individual travel and on relations with the Cuban government but did not break diplomatic relations. Additional measures were implemented in the fall of 2017, following reports of mysterious ailments afflicting U.S. personnel in Cuba. Despite the intermittent shifts in relations between the two countries, further positive political changes in Cuba could, in the medium-term, lead to a re-opening between the two nations.
If the United States were to eliminate the embargo and Cuba implements fundamental market reforms during a transition period, the United States could potentially become the biggest trade partner for the country. However, the very high level of risk that will characterize the initial transition period makes it very difficult to project the growth of the economy and for that reason this scenario has not been incorporated in the regional LAC outlook in Table 14. During the initial opening of the market, Cuba should benefit from an influx of financing and technical assistance from the International Monetary Fund, the World Bank, and the Inter-American Development Bank, as well as U.S. agencies such as AID and the EximBank. Cuba’s strength will be in tourism, agriculture, and some sectors of light manufacturing and assembly. As a tourist destination, the Cuban market would be a competitor to other Caribbean destinations; the extent will depend on how rapidly it builds up its infrastructure to handle a much larger volume of visitors. During the initial phase of economic reconstruction, Cuba may need to rely on logistics support from nearby regional transportation hubs such as MIA and Port Miami to handle the large volume of its imports of goods.

A-45
Risks to the Latin American and Caribbean Outlook. The projected economic indicators for the LAC region are based on assumptions regarding the underlying economic environment, and the risks associated with the outlook. The principal risks facing the LAC region are discussed below.
Deeper global economic slowdown and recession. The principal risk in the short term is the possibility of a global economic slowdown or recession. A global downturn would in turn affect LAC’s exports and access to capital, leading to greater volatility in their currency markets. Global recession would bring down commodity prices; and a prolonged period of weak commodity prices beyond what is assumed in this analysis would curtail the economic expansion in the region. However, weak commodity prices would have an uneven effect on LAC economies depending on the export base for each country. Low energy prices would impact Venezuela, Ecuador, Colombia, and, to a lesser extent, Mexico, which has a broader export base linked to the U.S. industrial market. On the other hand, weak non-oil commodity prices would adversely impact exporters of natural resources such as food, agricultural raw materials, minerals and metals throughout the LAC region.
The LAC region would be adversely affected by a confrontation between the United States and China on trade issues, and its positive economic outlook would be undermined by significant escalation in the trade policy conflict between the two countries.
This analysis assumes that there will be a slowdown in the growth of the U.S. economy in 2020. More adverse economic conditions in the United States than assumed in this forecast could curtail exports and remittances. Finally, a sharper than expected slowdown in China would also have an unfavorable effect on the region’s exports.
Inflation and high interest rates. With the continued momentum in the global economy, particularly in the United States and other large economies, demand pressures could trigger higher inflation and, consequently, higher interest rates. Any increase in interest rates would increase the debt service burden of countries in the LAC region, resulting in higher external deficit and bigger balance of payments deficits.
Political risks. Changes in government policies and new governments that adopt policies that adversely impact economic growth and development would alter the outlook for the LAC region. Political developments in Venezuela have resulted in a severe worsening of the country’s economy. At the same time, the inability to enforce economic policies, due to a weak institutional framework to implement reforms, would compromise the countries’ economic performance.
Fiscal deficits. While fiscal deficits have been largely under control through increased discipline, the rise in the deficits could lead to higher interest rates, inflation, and greater currency volatility. Without pension reforms that reduce the fiscal burden from rapid growth in retirement benefits due to a decreasing percentage of the working population, and tighter controls over other expenditure categories, larger than expected fiscal deficits could materialize.
Internal security. A worsening of crime and internal violence could undermine the growth prospects for the region. Violence in Mexico and Central America has also become a concern because of the ill effects it has on investment, tourism, and economic activity.

A-46
Europe Outlook
Europe (European Union, EU) is an important market for the Region in terms of tourism, trade in goods and services, and the flow of investments. After emerging from recession in 2009, financial and fiscal problems in the EU led to another recession in 2012 with a moderate decline in GDP of 0.33%. The economic crisis in Greece, which peaked during its default in 2011, and subsequent banking system and fiscal problems in Italy, Portugal, and Spain were key factors driving the area’s economic volatility. The EU has since benefitted from favorable global growth and the momentum is expected to continue through 2019.
While Europe’s economic and financial woes posed a challenge to the sustainability of the narrower Euro Area, which is composed of 19 countries that adopted the euro as their national currency, the recent improvements in the economic environment have dissipated these concerns. Nevertheless, the decision by U.K. voters in June 2016 to exit from the EU raises the possibility that other EU member countries may take that path, including those within the Euro Area.
Because of Brexit and the uncertainty associated with its outcome, the United Kingdom could incur moderate economic losses over a period. The outcome will depend on their exit terms. After officially notifying the EU of its intention to leave in 2017, and a long negotiating period on terms of its departure, the U.K. government’s negotiated agreement was soundly rejected by British Parliament in January 2019, thereby increasing the uncertainty over the final terms of its exit from the EU and any resulting economic impact. Key issues include the movement of people, merchandise, trade, and financial flows. The latest rejection of the exit terms increases the likelihood of an outright exit from the EU with the United Kingdom losing access to that market area. The economic losses would be greater under this scenario and would also adversely affect the EU through a decline in bilateral trade and investment. If the United Kingdom can negotiate some type of trade agreement with the EU, which is the more likely outcome, then the economic growth rate for the United Kingdom could be approximately half a percentage point per year lower through 2021. Nevertheless, a moderately high level of financial and economic uncertainty associated with Brexit will persist in the medium-term outlook.
This forecast assumes that the major member countries of the Euro Area, such as Germany and France, will continue to financially support the weaker economies. A continuing challenge to the Euro Area is the reduction in the fiscal deficits in line with the goals established at the time of the monetary union. As of 2017, the IMF estimated the gross debts of the Euro Area countries to represent 86.3% of GDP. Further strengthening of the banking systems in Italy, Portugal, and Spain is also important for the sustainability of the economic expansion.
The December 2018 outlook for the European Union (EU) by Economist Intelligence Unit calls for moderate growth during 2018 – 2023 averaging an annual rate of 1.8%, which is the same as the October 2018 IMF forecast for the same period.
Because of the importance of currency values to the flow of trade in goods and services, greater volatility in the exchange rate between the U.S. dollar and the euro could adversely affect trade, particularly tourism, between Europe and Florida, generally, and the Region, specifically. The decline in the value of the euro between 2014 and 2017 dampened growth of European visitors to the Region. On the other hand, a higher value of the euro would increase the flow of European visitors to the region.

A-47
European trade and investments in the Region’s economy will also be affected by currency fluctuations. With a lower value of the euro relative to the U.S. dollar, greater imports from Europe into the Region will be driven by the cheaper cost in U.S. dollar terms, while exporters from the Region will face tougher market conditions in Europe. Investments in the Region, particularly real estate, will also be adversely affected by the lower value of the euro. These trends are mostly cyclical and will, therefore, likely have a short- to medium-term duration. From a long-term perspective, market fundamentals of economic growth will be a significant driver for trade in goods and services between the Region and Europe.
Based on the positive global economic growth and currency outlook assumed in this Section, the County is projected to maintain its role as a merchandise transshipment hub between Europe, the United States, and the LAC region.
Asian Outlook
Developing Asia is expected to remain the highest-growth area in the world economy. Prior to the 2008 – 2009 global downturn, Developing Asian economies, which include China and India, had posted the highest GDP growth rate in more than two decades, averaging 9.1% per year. Rapid growth in Asia was accompanied by large international trade surpluses, contributing to sizable international reserves. Since the 2008 global recession, China slowed to a still robust growth rate of 6.8% per year during 2015 - 2017; while India maintained a moderately stronger rate of 7.3%.
According to the Economist Intelligence Unit forecast for November 2018, growth of GDP in China between 2018 – 2023 will average 5.7% per year; the IMF forecast is nearly the same at 5.9% per year. Growth will be driven more by consumer spending, which will result in a significantly higher growth of merchandise imports.
China has become one of the principal sources of merchandise imports into the Region. In recent years, China has developed stronger economic ties with the LAC region through investments in natural resources industries. The LAC region is also a lucrative market for Chinese exports of consumer and industrial products.
2.2.3 International Trade Sector
MIA plays an important role in the movement of merchandise at the national and local levels.
MIA exports are characterized by high-value goods, such as computers and parts, telecommunications equipment, other electronic products, medical equipment, and aircraft and parts. Imports, by contrast, are dominated by perishables, especially flowers, fish, and vegetables; and MIA accounts for a sizeable share of U.S. imports of these products. Both exports and imports also include transshipment of goods between LAC, the United States, and other parts of the world.
Miami Customs District
The growing importance of international trade in the Region is also evidenced by growth in the volume of export and import activity through the Miami Customs District (MCD), which includes all airports and seaports located in Miami, Fort Lauderdale, Fort Pierce, Key West, and West Palm Beach. In 2017, MIA accounted for 59.5% of the value of total MCD exports and 52.2% of total imports.

A-48
Exports
Since 1992, the value of exports from South Florida has increased an average of 6.6% per year. Table 15 shows that the MCD has accounted for a growing share of total U.S. exports, but was also impacted by cyclical downturns in its principal markets in Latin America and the Caribbean, increasing from 3.6% in 1992 to 3.8% in 2017, although it peaked at 4.6% in 2010. Of the top 15 export markets, 14 are in the LAC region.
Table 15
Miami Customs District Exports
Miami Customs District (MCD)
Total U.S. exports (millions of US$)
Total export value (millions of US$)
MCD percent of U.S. total
Top 15 countries Value
(millions of US$) Percent
of MCD total
1992 $ 448,164 $16,041 3.6% $ 11,929 74.4 1995 584,741 22,279 3.9 17,291 76.0 2000 781,918 31,119 4.0 24,402 78.4 2005 901,082 34,096 3.8 25,785 75.6 2010 1,278,495 58,861 4.6 45,961 78.1 2015 1,503,328 58,618 3.9 41,950 71.6 2017 1,546,273 59,190 3.8 40,790 68.9
Source: U.S. Department of Commerce, Bureau of the Census – Foreign Trade Division, November 2018.
Key trends affecting the growth of merchandise exports from the MCD include: (1) expansion of the global economy and global trade; (2) economic cycles in the LAC region, MCD’s principal export market; (3) growth of offshore production, which is reflected in exports from the MCD to countries where the products are assembled, mainly in the LAC region, and then shipped back to the United States; and (4) relative currency values, which is also a significant factor in explaining the growth in air travel between MCD and the principal overseas markets of the County.* Whenever the value of the U.S. dollar depreciates, demand for air travel to and from the Region increases.
*Based on MCD data, Venezuela was the second largest export market in 2012, with MCD exports of
$6.0 billion. However, due to its severe economic and political crisis, MCD exports to Venezuela fell to only $0.9 billion in 2017. When Venezuela is able to return to some degree of normalcy, the Region’s economy would benefit from the recovery of international trade and commerce with that historically important market.

A-49
Imports
Table 16 shows that the MCD’s share of total U.S. imports has increased from 1.8% in 1992 to 2.1% in 2017.
Table 16
Miami Customs District Imports
Miami Customs District (MCD) MCD Top 15 countries Total U.S. imports
(millions of US$) Total import value (millions of US$)
percent of U.S. total
Value (millions of US$)
Percent of MCD total
1992 $ 532,665 $ 9,651 1.8% $ 6,892 71.4% 1995 743,543 13,328 1.8 9,390 70.5 2000 1,218,022 24,700 2.0 17,687 71.6 2005 1,673,455 31,802 1.9 22,384 70.4 2010 1,913,857 36,637 1.9 25,740 70.3 2015 2,248,811 48,222 2.1 32,184 66.7 2017 2,341,963 48,489 2.1 34,158 70.4
Source: U.S. Department of Commerce, Bureau of the Census – Foreign Trade Division, November 2018.
As with exports, MCD imports are concentrated within the top 15 countries, which accounted for 70.4% of the total in 2017. The top 15 countries were more geographically diversified for imports, however, with China as the top supplier.
International Trade-Related Services and Activities
The strength of international trade-related services in the County is due, in part, to the availability and interaction of many facilitators, such as import/export firms, freight forwarders, customs brokers, and other trade-related service providers. This segment of the trade community consists of over 600 freight forwarders/ customs brokers and 25 trade associations.
The County offers several operating locations for Free Trade Zones that provide international trade companies different venues for their business logistics:
The Miami Free Trade Zone is one of the largest and oldest privately-owned free trade zones in the nation, located just west of the Airport, with products imported from 65 countries and exported to more than 75 countries worldwide. The free trade zone offers a combination of warehousing and distribution facilities. It was designed and developed to complement and enhance international cargo activities at MIA.
Port Miami Foreign Trade Zone 281 is a General-Purpose Foreign Trade Zone established under the Alternative Site Framework (ASF). It covers a wide area within the County including many industrial areas and critical logistics components including: Miami International Airport, Opa-locka Airport, PortMiami, rail yards, and other transportation infrastructure. Cargo merchandise may be brought into FTZ 281 for storage, inspection, testing, repair, distribution, relabeling, repackaging, display,

A-50
and disposal. With approval, companies are also able to manufacture, assemble, and process goods within the Foreign Trade Zone.
Homestead Foreign Trade Zone 166 (Vision Council, Inc.) is a General-purpose zone located in east Homestead. It is comprised of approximately 1,000 acres.
International Banking
International trade is also supported by the availability of international banking in the County and the presence of foreign bank agencies. These agencies are primarily involved in trade finance and international private banking, and thus contribute to the growth of the Region in international trade and of the Airport in international travel and air cargo.
The most important categories of international banking in the County are foreign bank agencies and the international departments of domestic banks. According to the Florida Department of Banking, at the end of 2014, 12 banks in the County were registered as foreign agencies or branches, of which eight were from the LAC region, two were from Europe, one from Canada, and one from Israel. The agencies are primarily involved in trade finance and international private banking. Total assets of the foreign agencies amounted to $14.4 billion at the end of 2017. The decline in these assets from $20.0 billion in 2001 reflects two major developments: first, the adverse effect on international banking activities resulting from the restrictive regulations imposed by the U.S. Patriot Act, aimed at preventing money laundering and terrorist financing; and second, the global recession during 2007-2009 and the banking problems in Europe resulting in bank failures and consolidations, which led to further downsizing by European banks of their agencies in the County. In addition to the foreign bank agencies, there were six representative offices at the end of 2017, four from the LAC region, one from Europe, and one from the Middle East. These entities serve as liaisons for the home bank’s customers and act in a supporting role but may not conduct any banking business. In addition to the registered foreign banking entities, there are numerous domestic banks in the County that are active in international banking, providing services to foreign individuals and businesses including the financing of international trade.
Multinational Corporations
In connection with the substantial amount of international trade, as discussed above, many multinational companies have established operations in the County. According to World City’s 2018 report, 1,412 multinational companies operate facilities in the County. Of these, 833 are from the United States, 39 from Canada, 367 from Europe, 96 from the LAC region, and 65 from Asia. These companies represent a diversity of multinational industries primarily serving the United States and Latin America.
Surface Transportation and Warehousing Services
Surface transportation and warehousing services are a crucial component of the infrastructure for international trade, accommodating the movement of goods to be shipped overseas and the distribution of imported merchandise. According to the U.S. Census Bureau, in 2016 there were 9,023 companies in wholesale trade, 140 in warehousing, 159 in air transportation, and 212 in support of air transportation, located in the County.

A-51
Trade in Other International Services
Other international trade-related services firms located in the County include the following:
� Accounting and legal services firms: Many firms providing accounting and legal services have offices throughout the United States, as well as foreign offices or affiliations with other firms to better serve international businesses. Several of the largest firms have established their Latin American centers in the County.
� Architectural firms: Miami-Dade architectural firms have designed projects on every continent and maintain a significant presence overseas. According to the Census Bureau, there were 371 architectural firms in 2016.
� Government and nongovernmental organizations: The County is home to 100 foreign consulates and trade offices, of which 39 are from the Americas (Latin America, the Caribbean, and Canada), 35 are from Europe, and the remainder are from Africa, the Middle East, and Asia. The County has the third largest Consular Corps in the United States and 46 bi-national chambers of commerce—22 are Latin American, 14 are European, 6 are Asian, 3 are African, and 1 is from the Middle East. These organizations provide valuable links between their countries and the County’s international trade community.

A-52
2.3 AIRLINE SERVICE AND TRAFFIC
Figure 3 shows the number of passengers enplaned at MIA from FY 1978 through FY 2018. The split of originating and connecting passengers, according to airline data reported to the U.S. Department of Transportation (DOT), is shown for each year starting in FY 1991. American Airlines’ build-up of its hubbing operation at MIA in the first half of the 1990’s, after purchasing Eastern Air Lines’ route authorities and operating infrastructure in Latin America, is visible. Enplaned passengers at MIA increased 2.6% per year, on average, in the 41 years following U.S. airline deregulation in FY 1978. In FY 2018, enplaned passengers at MIA reached a record level of 22.2 million.
Figure 3
Historical Enplaned Passengers Miami International Airport
(Fiscal Years ended September 30)
Sources: Miami-Dade County Aviation Department; U.S. DOT, Air Passenger Origin-Destination Survey, reconciled to Schedules T100 and 298C T1.

A-53
As shown in Table 17, for FY 2018, American accounted for 53.4% of originating passengers and 95.7% of connecting passengers at MIA. Connecting passengers on American accounted for 45.3% of the airline’s enplaned passengers.
Table 17
Historical Enplaned Passengers by Airline Group Miami International Airport
(Fiscal Year ended September 30, 2018)
Notes: Rows and columns may not add to totals shown because of rounding. Percentages were calculated using unrounded numbers.
(a) Originating-resident passengers are defined as those passengers whose flight itineraries began at MIA. These passengers are apt to make use of facilities at the Airport.
(b) Originating-visitor passengers are defined as those passengers whose flight itineraries began at airports other than MIA. These passengers are apt to make use of ground transportation, including rental cars, at the airport.
Sources: Miami-Dade County Aviation Department; U.S. DOT, Air Passenger Origin-Destination Survey, reconciled to Schedule T100.
Average daily enplaned passengers Distribution by airline groupAll other All All other All
American airlines Airlines American airlines AirlinesBy sector
Domestic 9,175,467 2,396,006 11,571,473 61.9% 32.4% 52.1%International 5,649,185 4,999,765 10,648,950 38.1 67.6 47.9
Total 14,824,652 7,395,771 22,220,423 100.0% 100.0% 100.0%
By type of passengerOriginating - resident (a) 3,735,219 3,068,669 6,803,888 25.2% 41.5% 30.6%Originating - visitor (b) 4,375,713 4,022,967 8,398,680 29.5 54.4 37.8
Subtotal originating 8,110,932 7,091,636 15,202,568 54.7% 95.9% 68.4%Connecting 6,713,720 304,135 7,017,855 45.3 4.1 31.6
Total 14,824,652 7,395,771 22,220,423 100.0% 100.0% 100.0%
Share of passengersOriginating 53.4% 46.6% 100.0%Connecting 95.7 4.3 100.0
Total 66.7 33.3 100.0

A-54
2.3.1 Airport Rankings and Roles
Table 18 shows the 30 largest U.S. airports ranked by enplaned passengers. By this measure, in the 12 months ended September 30, 2018, MIA ranked 14th and FLL ranked 19th.
Table 19 shows the 30 largest U.S. airports ranked by enplaned originating passengers. By this measure, in 2018, MIA ranked 15th and FLL ranked 13th. Between 2010 and 2018, growth in enplaned originating passengers at MIA outpaced the rate of growth for the top 30 U.S. airports, taken together.
Table 20 shows the 30 largest U.S. airports ranked by connecting passengers. By this measure, in 2018, MIA ranked 11th and FLL ranked 22nd.
Table 21 shows the 30 largest U.S. gateway airports ranked by international passengers. Increased international service at MIA has resulted in increased numbers of international passengers since 2010. In 2018, MIA ranked third among U.S. gateway airports, down from second in 2010. FLL ranked 10th.
Role in the American Airlines Route System
Table 22 shows that, within American’s U.S. airport network, MIA ranks first in terms of departing seats on international flights, with almost twice the number offered at Dallas/Fort Worth International Airport (DFW), the airline’s second-ranked gateway. MIA ranks sixth in American’s network in terms of departing seats on domestic flights and fourth in terms of total departing seats.

A-55
Table 18
Enplaned Passengers at Top-Ranking U.S. Airports (calendar years, except 2018)
Notes: Airports shown are the top 30 U.S. airports ranked by number of passengers for 12 months ended September 30, 2018.
Percentages were calculated using unrounded numbers.
(a) Data are for the 12 months ended September 30, 2018, the most recent available.
Source: U.S. DOT, Schedule T100.
Increase (decrease)
2018 Enplaned passengers (millions) 2018 as 2010-2018Rank City (airport) 2010 2014 2018 (a) % of 2010 (thousands)
1 Atlanta 43.0 46.6 51.4 119.5% 8.42 Los Angeles (International) 28.9 34.3 42.5 147.4 13.73 Chicago (O'Hare) 32.2 33.8 39.7 123.6 7.64 Dallas/Fort Worth 27.0 30.8 32.8 121.2 5.75 Denver 25.2 26.0 30.9 122.3 5.6
6 New York (Kennedy) 22.9 26.2 30.2 131.6 7.27 San Francisco 19.3 22.8 27.9 144.3 8.68 Seattle 15.4 17.9 23.7 154.2 8.39 Las Vegas 18.9 20.4 23.6 124.7 4.7
10 Orlando (International) 17.0 17.3 22.8 133.8 5.8
11 Newark 16.6 17.7 22.7 136.7 6.112 Charlotte 18.6 21.5 22.2 119.1 3.613 Phoenix (Sky Harbor) 18.9 20.3 21.5 113.6 2.614 Miami 17.0 19.5 21.1 124.0 4.115 Houston (Bush) 19.5 19.8 20.8 106.8 1.3
16 Boston 13.6 15.5 19.7 145.5 6.217 Minneapolis-St. Paul 15.5 17.0 18.5 119.2 3.018 Detroit 15.6 15.8 17.4 111.1 1.719 Fort Lauderdale 10.8 12.0 17.2 159.3 6.420 Philadelphia 14.9 14.8 15.1 101.0 0.2
21 New York (LaGuardia) 12.0 13.5 15.1 125.4 3.122 Baltimore 10.8 11.0 13.4 123.7 2.623 Salt Lake City 9.9 10.1 12.1 121.8 2.224 San Diego 8.4 9.3 12.0 142.3 3.625 Washington DC (Dulles) 11.3 10.4 11.4 101.3 0.2
26 Washington DC (Reagan) 8.7 10.1 11.4 130.6 2.727 Chicago (Midway) 8.5 10.3 10.8 126.2 2.228 Tampa 8.1 8.5 10.3 126.0 2.129 Portland, Oregon 6.6 7.9 9.7 147.6 3.130 Honolulu 8.7 9.5 9.6 110.6 0.9
Total—top 30 airports 126.4%

A-56
Table 19
Originating Passengers at Top-Ranking U.S. Airports (calendar years, except 2018)
Notes: Airports shown are the top 30 U.S. airports ranked by originating passengers for 12 months ended September 30, 2018.
Percentages were calculated using unrounded numbers. Includes a very small number of passengers on foreign-flag airlines making connections
between international flights.
(a) Data are for the 12 months ended September 30, 2018, the most recent available.
Sources: U.S. DOT, Schedule T100; U.S. DOT, Air Passenger Origin-Destination Survey, reconciled to Schedule T100.
IncreaseOriginating passengers (decrease)
2018 (millions) 2018 as 2010-2018Rank City (airport) 2010 2014 2018 (a) % of 2010 (millions)
1 Los Angeles (International) 22.2 26.1 34.6 156.4% 12.52 New York (Kennedy) 18.1 20.7 25.5 140.5 7.33 Chicago (O'Hare) 15.6 17.3 23.1 147.8 7.54 San Francisco 15.0 17.9 21.9 146.0 6.95 Orlando (International) 16.0 16.5 21.7 135.6 5.7
6 Las Vegas 16.0 17.2 20.5 127.9 4.57 Denver 12.9 15.2 19.9 153.7 6.98 Atlanta 13.9 14.5 19.7 141.9 5.89 Boston 13.0 14.6 18.6 143.1 5.6
10 Newark 11.8 12.7 17.9 151.8 6.1
11 Seattle 11.3 12.7 16.8 148.8 5.512 Dallas/Fort Worth 11.0 12.3 15.2 138.6 4.213 Fort Lauderdale 10.0 10.8 14.6 145.8 4.614 Phoenix (Sky Harbor) 10.9 11.6 14.4 132.4 3.515 Miami 9.6 11.3 14.1 146.3 4.5
16 New York (LaGuardia) 11.1 12.0 13.7 123.7 2.617 San Diego 8.0 8.8 11.3 141.2 3.318 Minneapolis-St. Paul 8.1 9.0 11.3 139.9 3.219 Houston (Bush) 7.7 8.9 10.7 137.7 2.920 Philadelphia 8.8 8.6 10.4 118.3 1.6
21 Detroit 7.5 8.0 10.3 136.5 2.722 Washington DC (Reagan) 7.2 8.4 10.1 140.1 2.923 Tampa 7.5 8.1 9.9 131.4 2.424 Baltimore 8.3 7.8 9.6 116.3 1.425 Portland, Oregon 5.6 6.6 8.6 152.2 2.9
26 Honolulu 7.0 7.7 8.1 114.8 1.027 Washington DC (Dulles) 6.5 6.4 7.7 117.8 1.228 Salt Lake City 5.0 5.4 7.4 147.6 2.429 Austin 4.0 4.9 7.2 180.2 3.230 Chicago (Midway) 5.5 6.2 7.0 126.2 1.4
Total—top 30 airports 140.1%

A-57
Table 20
Connecting Passengers at Top-Ranking U.S. Airports (calendar years, except 2018)
Notes: Airports shown are the top 30 U.S. airports ranked by connecting passengers for 12 months ended September 30, 2018.
Percentages were calculated using unrounded numbers. Excludes a very small number of passengers on foreign-flag airlines making connections
between international flights.
(a) Data are for the 12 months ended September 30, 2018, the most recent available.
Source: U.S. DOT, Air Passenger Origin-Destination Survey, reconciled to Schedule T100.
Increase (decrease)
2018 Connecting passengers (millions) 2018 as 2010-2018Rank City (airport) 2010 2014 2018 (a) % of 2010 (millions)
1 Atlanta 29.1 32.1 31.7 108.8% 2.62 Dallas/Fort Worth 16.1 18.4 17.6 109.3 1.53 Chicago (O'Hare) 16.6 16.5 16.7 100.7 0.14 Charlotte 13.7 16.1 15.4 112.4 1.75 Denver 12.3 10.8 11.0 89.3 (1.3)
6 Houston (Bush) 11.8 10.9 10.2 86.4 (1.6)7 Los Angeles (International) 6.7 8.2 7.9 117.7 1.28 Minneapolis-St. Paul 7.4 8.0 7.2 96.7 (0.2)9 Detroit 8.1 7.8 7.1 87.7 (1.0)
10 Phoenix (Sky Harbor) 8.0 8.7 7.1 88.3 (0.9)
11 Miami 7.4 8.2 7.0 95.0 (0.4)12 Seattle 4.1 5.1 6.9 169.1 2.813 San Francisco 4.3 4.9 6.0 138.3 1.714 Newark 4.8 5.1 4.8 99.9 (0.0)15 New York (Kennedy) 4.8 5.5 4.7 98.1 (0.1)
16 Philadelphia 6.2 6.2 4.7 76.4 (1.5)17 Salt Lake City 4.9 4.7 4.6 95.1 (0.2)18 Chicago (Midway) 3.0 4.1 3.8 126.3 0.819 Washington DC (Dulles) 4.8 4.0 3.8 78.8 (1.0)20 Baltimore 2.5 3.1 3.7 148.1 1.2
21 Las Vegas 2.9 3.2 3.1 106.9 0.222 Fort Lauderdale 0.8 1.2 2.7 319.4 1.823 Dallas (Love) 1.1 1.2 2.6 234.1 1.524 Houston (Hobby) 1.2 1.9 2.4 200.2 1.225 St. Louis 0.9 1.1 1.8 193.1 0.9
26 Honolulu 1.7 1.7 1.6 93.1 (0.1)27 New York (LaGuardia) 0.9 1.5 1.4 146.4 0.428 Washington DC (Reagan) 1.5 1.7 1.3 86.6 (0.2)29 Boston 0.6 0.9 1.2 198.4 0.630 Portland, Oregon 0.9 1.3 1.1 120.5 0.2
Total—top 30 airports 106.2%

A-58
Table 21
International Passengers at Top-Ranking U.S. Airports (calendar years, except 2018)
Notes: n.c. = not calculated. Airports shown are the top 30 U.S. airports (excluding airports in Puerto Rico, the islands of the
Pacific Trust, and the U.S. Virgin Islands) ranked by international passengers for 12 months ended September 30, 2018.
Percentages were calculated using unrounded numbers.
(a) Data are for the 12 months ended September 30, 2018, the most recent available.
Sources: U.S. DOT, Schedule T100.
IncreaseEnplaned international passengers (decrease)
2018 (millions) 2018 as 2010-2018Rank City (airport) 2010 2014 2018 (a) % of 2010 (millions)
1 New York (Kennedy) 11.4 13.8 16.4 144.1% 5.02 Los Angeles (International) 7.7 9.2 12.6 164.5 5.03 Miami 8.4 10.0 10.6 126.2 2.24 Newark 5.7 5.8 6.8 119.7 1.15 San Francisco 4.2 5.0 6.7 160.2 2.5
6 Chicago (O'Hare) 5.2 5.7 6.7 129.5 1.57 Atlanta 4.5 5.3 6.1 135.0 1.68 Houston (Bush) 4.2 4.8 5.2 123.9 1.09 Dallas/Fort Worth 2.5 3.5 4.1 162.7 1.6
10 Fort Lauderdale 1.6 2.2 4.1 250.7 2.4
11 Washington DC (Dulles) 3.0 3.5 3.9 128.8 0.912 Boston 1.8 2.3 3.6 192.1 1.713 Orlando (International) 1.6 2.1 3.1 196.3 1.514 Seattle 1.4 1.8 2.6 193.0 1.315 Honolulu 1.8 2.5 2.4 130.6 0.6
16 Philadelphia 1.9 2.0 1.9 99.7 (0.0)17 Detroit 1.4 1.6 1.8 127.7 0.418 Las Vegas 1.1 1.6 1.8 170.1 0.819 Charlotte 1.3 1.5 1.5 115.1 0.220 Minneapolis-St. Paul 1.1 1.2 1.5 130.4 0.3
21 Denver 1.0 1.1 1.4 150.8 0.522 New York (LaGuardia) 0.5 0.9 1.1 210.0 0.623 Phoenix (Sky Harbor) 1.0 1.1 1.0 98.6 (0.0)24 Baltimore 0.2 0.4 0.6 294.6 0.425 Houston (Hobby) 0.0 0.0 0.5 n.c. 0.5
26 San Diego 0.1 0.3 0.5 389.5 0.427 Salt Lake City 0.2 0.2 0.5 203.2 0.228 Tampa 0.2 0.3 0.5 242.5 0.329 Oakland 0.1 0.1 0.5 435.9 0.430 San Jose 0.1 0.2 0.5 715.3 0.4
Total—top 30 airports 146.7%

A-59
Table 22
Scheduled Departing Seats on Flights Operated by American at U.S. Airports
Top U.S. Airports in the American Airlines System (calendar years)
Notes: Includes regional codesharing affiliates. Columns may not add to totals shown because of rounding. Percentages were calculated using unrounded numbers.
Source: OAG Aviation Worldwide Ltd., OAG Analyser database, accessed December 2018.
2018 Seats (in thousands) Percent increase (decrease)Rank City (Airport) 2010 2014 2018 2010-2014 2014-2018
Domestic1 Dallas/Fort Worth 28,572 28,788 30,012 0.8% 4.3%2 Charlotte 20,066 22,710 23,613 13.2 4.03 Chicago (O'Hare) 14,374 14,686 16,196 2.2 10.34 Philadelphia 12,511 12,559 11,825 0.4 (5.8)5 Phoenix (Sky Harbor) 11,113 12,062 11,503 8.5 (4.6)6 Miami 8,758 9,489 9,802 8.3 3.37 Los Angeles 6,372 7,413 8,600 16.3 16.08 Washington (Reagan) 7,426 7,490 7,281 0.9 (2.8)9 New York (LaGuardia) 6,622 5,165 5,097 (22.0) (1.3)
10 Boston 4,795 4,410 4,201 (8.0) (4.7)All other 81,466 82,171 87,182 0.9 6.1
Total—U.S. system 202,074 206,943 215,314 2.4% 4.0%
International1 Miami 6,814 7,327 7,348 7.5% 0.3%2 Dallas/Fort Worth 2,885 3,685 4,056 27.7 10.13 Philadelphia 2,127 2,243 1,983 5.5 (11.6)4 Charlotte 1,608 1,857 1,803 15.5 (2.9)5 New York (Kennedy) 2,200 1,792 1,534 (18.5) (14.4)6 Los Angeles 390 570 1,296 46.2 127.27 Chicago (O'Hare) 1,527 1,299 1,178 (15.0) (9.3)8 Phoenix (Sky Harbor) 1,035 882 635 (14.7) (28.0)9 New York (LaGuardia) 225 248 145 10.3 (41.7)
10 Fort Lauderdale 82 109 111 33.5 1.2All other 478 193 186 (59.7) (3.3)
Total—U.S. system 19,371 20,206 20,275 4.3% 0.3%
Total1 Dallas/Fort Worth 31,457 32,473 34,068 3.2% 4.9%2 Charlotte 21,674 24,568 25,417 13.4 3.53 Chicago (O'Hare) 15,901 15,984 17,374 0.5 8.74 Miami 15,571 16,815 17,150 8.0 2.05 Philadelphia 14,638 14,802 13,808 1.1 (6.7)6 Phoenix (Sky Harbor) 12,148 12,945 12,138 6.6 (6.2)7 Los Angeles 6,762 7,983 9,897 18.1 24.08 Washington (Reagan) 7,471 7,578 7,337 1.4 (3.2)9 New York (LaGuardia) 6,847 5,413 5,242 (20.9) (3.2)
10 New York (Kennedy) 4,982 4,867 4,372 (2.3) (10.2)All other 83,993 83,720 88,786 (0.3) 6.1
Total—U.S. system 221,444 227,149 235,589 2.6% 3.7%

A-60
Since 2015, American has focused on allotting more seat capacity to more profitable originating passengers than to less profitable connecting traffic across its route network. As shown on Figure 4 and Figure 5, this strategic shift resulted in American’s connecting passengers decreasing 13.3% at MIA between 2013 and 2018, while its originating passengers increased 33.4%. Figure 4 shows that, over the same period, four other American hub airports recorded even larger decreases in connecting passengers than MIA, in percentage terms. In absolute terms, Philadelphia and Phoenix both recorded greater decreases in connections than MIA.
Figure 4 Connecting Passengers on American Airlines
at American’s U.S. Hub Airports
Note: Rolling 12-month averages through September 30, 2018.
Source: U.S. DOT, Air Passenger Origin-Destination Survey, reconciled to Schedule T100.
Figure 5 shows that American’s increase in originating passengers at MIA between 2013 and 2018 exceeded its systemwide average. Among American’s 10 hub airports, only New York’s Kennedy and LaGuardia airports did not record sizeable increases in originating passenger traffic over the 5-year period.

A-61
Figure 5 Originating Passengers on American Airlines
at American’s U.S. Hub Airports
Note: Rolling 12-month averages through September 30, 2018.
Sources: U.S. DOT, Schedule T100; U.S. DOT, Air Passenger Origin-Destination Survey, reconciled to Schedule T100.
Role in Alliance Networks
American Airlines is the founding member of the oneworld alliance, which in addition to American Airlines, includes 12 foreign-flag airlines: British Airways, Cathay Pacific, Finnair, Iberia, Japan Airlines, LATAM, Malaysia Airlines, Qantas, Qatar Airways, Royal Jordanian, S7 Airlines, Sri Lankan Airlines, and their respective affiliates. The alliance links the networks of the member airlines to improve passenger connections, enhance revenue and market share, gain cost synergies, and mitigate restrictive bilateral agreements. oneworld alliance members also link their frequent flier programs and share airport lounge facilities. As of December 2018, the oneworld alliance offered approximately 12,700 daily flights in 158 countries; American operated approximately 6,200 daily flights in 57 countries.* Alliances typically involve marketing, code-sharing, and scheduling and pricing arrangements to facilitate the transfer of passengers between the airlines.
*The most recent data available, according to the oneworld alliance website, accessed December 14, 2018.

A-62
Table 23 shows that market shares at MIA are highly concentrated among oneworld alliance partners, which account for 78.5% of departing seats on domestic flights and 66.6% of departing seats on international flights at the Airport in March 2019. Major competing alliances, SkyTeam and Star Alliance, have much lower shares of departing seats at MIA. Airlines that are not members of one of these three alliances accounted for 3.2% of departing seats on domestic flights and 10.5% of departing seats on international flights at the Airport in March 2019. At FLL, by comparison, nonaligned carriers—primarily low-cost carriers (LCCs)—accounted for 72.6% of departing seats on domestic flights and 83.0% of departing seats on international flights.
Foreign governments sometimes limit the rights of U.S. airlines to carry passengers beyond the designated gateway city in a foreign country. To improve access to foreign markets, American, like other major U.S. airlines that provide international service, has established marketing relationships in addition to the oneworld alliance with other airlines.*
Table 23
Scheduled Departing Seats by Alliance Group Miami International Airport
(March 2019)
Note: Columns may not add to totals shown because of rounding.
(a) Alliance members as of December 2018. (b) LATAM Airlines Group is comprised of LATAM airlines of Argentina, Brazil, Chile,
Colombia, Ecuador, Paraguay, and Peru. (c) Star Alliance airlines serving MIA include Air Canada, Austrian, Avianca, Copa,
Lufthansa, SAS, Swiss, TACA, TAP, Turkish, and United. (d) SkyTeam alliance airlines serving MIA include Aeroflot, Aerolineas Argentinas,
Aeromexico, Air Europa, Air France, Alitalia, Delta, and KLM.
Source: OAG Aviation Worldwide Ltd., OAG Analyser database, accessed December 2018.
*According to its 2017 Annual Report, American Airlines has such marketing relationships with Air Tahiti Nui,
Alaska Airlines, Cape Air, Cathay Dragon, China Southern Airlines, EL AL, Etihad Airways, Fiji Airways, Gulf Air, Hainan Airlines, Hawaiian Airlines, Interjet, Jetstar Group, Korean Air, Seaborne Airlines, and WestJet.
Domestic International Totaloneworld alliance:
American 919,534 666,664 1,586,198LATAM Airlines Group (b) - 91,825 91,825British Airways - 35,433 35,433Iberia - 20,352 20,352Qatar - 8,773 8,773Finnair - 3,549 3,549
oneworld total 919,534 826,596 1,746,130Percent of total 78.5% 66.6% 72.4%
Star alliance (c) 82,190 204,399 286,589SkyTeam alliance (d) 131,581 80,196 211,777Unaligned carriers 37,823 130,475 168,298Airport total 1,171,128 1,241,666 2,412,794
Alliance group (a)Airline

A-63
Role as an International Gateway
MIA is a major connecting hub. Approximately 7.1 million passengers connected between flights at MIA in FY 2018, representing 32% of all passengers enplaned at the Airport. Approximately 6.2 million of those passengers were making connections to, from, or between international flights (“gateway connections”). New York’s John F. Kennedy International Airport (JFK), Los Angeles International Airport (LAX), and MIA are the busiest international gateway airports in the United States. Table 24 shows that, among all U.S. airports, MIA offers the most departing seats for Latin America (defined here as South America and Central America, excluding Mexico) and Caribbean travel—28% of the U.S. total. MIA offers 42% of all seats departing for South America from the United States. MIA is also a connecting point for travel between Europe and Latin America, between the Caribbean and Latin America, and in some cases, between one Latin American country and another.
American Airlines, in conjunction with the integrated route networks of its American Eagle regional affiliates and its oneworld alliance partners, conducts the only airline hubbing activity at MIA. American and its oneworld partners account for most passengers connecting between domestic and international flights (gateway connections) at MIA. Passengers also connect between American’s domestic flights at MIA, including those to and from Puerto Rico and the U.S. Virgin Islands.

A-64
Table 24
Scheduled International Departing Seats, by World Region Destination Top 20 U.S. Gateway Airports
(calendar year 2018)
Note: Columns and rows may not add to totals shown because of rounding.
(a) Includes Australia, New Zealand, the South Pacific, Africa, and the Middle East.
Source: OAG Aviation Worldwide Ltd., OAG Analyser database, accessed December 2018.
Departing seats (in thousands)Caribbean and Latin America
Other South CentralRank City(-Airport) Bahamas Caribbean America America Total Europe Asia Canada Mexico Other (a) TOTAL
1 New York-Kennedy 157 3,357 1,507 376 5,397 9,333 2,185 459 1,133 2,067 20,5732 Los Angeles - 10 380 801 1,191 3,452 4,473 1,447 2,870 2,330 15,7633 Miami 398 3,067 4,099 1,496 9,060 2,543 - 440 883 148 13,0754 San Francisco - - - 227 227 2,350 3,349 1,071 796 756 8,5495 New York-Newark 59 783 289 302 1,432 4,195 953 1,083 358 504 8,5256 Chicago-O'Hare 19 213 100 175 507 3,379 1,489 1,286 1,242 521 8,4247 Atlanta 283 1,073 639 675 2,671 2,301 375 554 1,076 264 7,2428 Houston-Bush 42 203 575 1,183 2,002 1,150 388 615 2,082 462 6,7009 Dallas/Ft. Worth 23 105 443 256 827 976 735 481 1,926 451 5,395
10 Fort Lauderdale 568 1,948 800 565 3,882 296 - 683 414 69 5,34311 Washington DC-Dulles 1 79 130 294 504 2,532 536 383 197 782 4,93412 Boston 20 449 54 96 618 2,446 319 719 127 279 4,50813 Orlando 103 269 682 366 1,420 1,244 - 744 385 102 3,89514 Honolulu - - - - - - 2,539 196 - 609 3,34415 Seattle - - - - - 905 921 1,041 215 126 3,20816 Philadelphia 44 340 - - 385 1,542 - 387 188 103 2,60517 Detroit 4 26 35 - 65 1,020 484 341 363 9 2,28118 Las Vegas - - 13 56 69 556 115 1,084 429 - 2,25319 Charlotte 128 691 - 44 863 631 - 173 265 - 1,93320 Guam - - - - - - 1,802 - - 99 1,901
Total—top 20 gateways 1,850 12,613 9,746 6,912 31,121 40,851 20,662 13,187 14,950 9,680 130,452All other gateways 76 1,159 42 387 1,664 4,118 1,283 6,302 4,534 21 17,922Total—all U.S. gateways 1,926 13,771 9,788 7,299 32,785 44,969 21,945 19,490 19,484 9,701 148,374

A-65
Role as a Departure Point for Cuba
The March 2016 easing of federal restrictions on individual travel between the United States and Cuba has resulted in an increase in the number of passengers boarding flights to Cuba at both MIA and other U.S. airports. Figure 6 shows that passengers traveling between the United States and Cuba doubled between 2016 and 2017, driven largely by the launch of new scheduled service at airports other than MIA. In the first 9 months of 2018, however, the number of passengers bound for Cuba from airports other than MIA decreased 23.1% year-over-year, while the number of passengers traveling from MIA to Cuba continued to increase robustly (+9.0%).
Figure 6
Passengers Enplaned on Flights from the United States to Cuba Miami International Airport and All Other U.S. Airports
(calendar years)
Note: YTD=year-to-date, 9 months ended September 30.
Source: U.S. DOT, Schedule T100.

A-66
Role as a Cargo Hub
MIA is a major transshipment point for international air cargo. As previously discussed, demand for international air cargo service at the Airport is derived from the demand for import, export, and transshipment of merchandise, driven by economic factors of participating markets. The international trade activities are also driven by MIA’s strategic geographic location relative to Latin America and the Caribbean on the one hand, and North America, Europe, and Asia on the other. Table 25 shows that the Airport is the country’s second largest international air cargo hub after Anchorage International Airport. The prominence of Anchorage as a cargo hub results from a geographic location that minimizes route circuity between North America and Asia.
Table 25
Comparative Trends in International Air Cargo At Top 10 U.S. Airports
(calendar years; cargo in thousands of tons)
Note: Cargo data obtained from U.S. DOT differs from cargo data reported to the airports by the airlines.
(a) Includes total enplaned, deplaned and through freight and mail onboard scheduled and nonscheduled (i.e., charter) flights departing to and arriving from non-U.S. destinations, excluding Canada.
(b) Data for the 12 months ended September 30, 2018, the most recent available.
Source: U.S. DOT, Schedule T100.
Increase/(decrease) in
Onboard in air cargo 2018 as2018 air cargo weight (a) tonnage percentRank City(-Airport) 2010 2018 (b) 2010-2018 of 2010
1 Anchorage 2,424.0 2,297.3 (127) 94.8%2 Miami 1,642.1 1,704.2 62 103.83 Los Angeles 874.8 1,432.5 558 163.84 Chicago-O'Hare 581.7 982.6 401 168.95 New York-Kennedy 859.8 958.5 99 111.56 Memphis 390.5 487.1 97 124.77 San Francisco 284.6 415.4 131 145.98 Cincinnati 52.3 345.5 293 661.39 Atlanta 244.1 324.1 80 132.8
10 New York-Newark 363.2 294.9 (68) 81.2

A-67
2.3.2 Airline Service at the Airport and Competing Airports
Figure 7 shows the U.S. airports linked with MIA by scheduled daily nonstop passenger flights in March 2019. Most domestic destinations are situated east of the Mississippi River.
In March 2019, about 83% of the scheduled international passenger flights at MIA operated to Latin America, Mexico, and the Caribbean; Figure 8 shows the airports in those regions served by nonstop flights. In addition, an average of 27 daily flights operated from MIA to transatlantic destinations (see Figure 9), and an average of 13 daily flights operated from MIA to destinations in Canada.
Eight new airlines—Corsair, Estelar, Flair Air, GOL, LOT, Norwegian Air, Royal Air Maroc, and Sunwing—began or are scheduled to begin service at MIA between July 2018 and June 2019. Over the same period, service was initiated to 17 new destinations, and discontinued to 9, for a net increase of 8.
Table 26 shows that, from March 2010 through March 2019, the total number of destinations served nonstop from MIA increased from 121 to 170, while the number of airlines serving those destinations increased from 38 to 53.* The total number of departing seats from MIA increased 30% over the 9-year period.
Between 2010 and 2019, service in both the domestic and international sectors experienced broadly similar trends at MIA—increases in the number of destinations served nonstop and departing seats. In the domestic sector, departing seats on routes shorter than 600 miles increased 19%, while seats to longer-haul destinations, considered together, increased 27% over the period. The international sector was characterized by increasing service offered by both American Airlines as well as the foreign-flag airlines. In March 2019, American is scheduled to provide 99% of all international capacity offered by U.S. airlines at MIA. Delta is the only other U.S. airline offering international service. American is scheduled to offer 54% of all international seats at MIA in March 2019, down from 63% in March 2010.
*In all discussions of historical airline service and passenger traffic by airline in this report, unless otherwise
noted, data for merged airlines are accounted for with the surviving airline (i.e., America West Airlines, Trans World Airlines, and US Airways with American Airlines; Northwest Airlines with Delta Air Lines; Continental Airlines with United Airlines; Midwest Airlines with Frontier Airlines; AirTran Airways with Southwest Airlines; and Virgin America with Alaska Airlines).

A-68
Figure 7
U.S. Airport Served by Daily Scheduled Nonstop Passenger Flights Miami International Airport
(March 2019)
Source: OAG Aviation Worldwide Ltd., OAG Analyser database, accessed December 2018.

A-69
Figure 8
Airports in Mexico, Central America, South America, and the Caribbean Served by Scheduled Nonstop Passenger Flights
Miami International Airport (March 2019)
Source: OAG Aviation Worldwide Ltd., OAG Analyser database, accessed December 2018.

A-70
Figure 9
Transatlantic Destinations Served by Scheduled Nonstop Passenger Flights
Miami International Airport (March 2019)
Source: OAG Aviation Worldwide Ltd., OAG Analyser database, accessed December 2018.

A-71
Table 26
Trends in Scheduled Passenger Service Miami International Airport
(for the month of March of years noted)
Note: Columns and rows may not add to totals shown because of rounding.
(a) Short-haul=less than 600 miles; medium-short haul=600-1,199 miles; medium-long haul=1,200-1,799 miles; long-haul=1,800+ miles.
(b) Each mainline airline and its code-sharing affiliates were counted as one airline.
Source: OAG Aviation Worldwide Ltd., OAG Analyser database, accessed December 2018.
Number of Number of Scheduled departing seats
airports served airlines Seats Changenonstop serving (b) (in thousands) 2010-
2010 2019 2010 2019 2010 2019 2019
TOTAL – All destinations 121 170 38 53 1,862 2,413 551
Total domestic 49 62 6 5 936 1,171 235Short-haul 9 11 4 3 189 226 36Medium-short haul 31 37 4 5 588 721 133Medium-long haul 3 7 4 5 66 104 37Long-haul 6 7 2 2 92 121 28
Total international 72 108 34 50 926 1,242 316U.S. airlines 59 76 2 2 587 676 89Foreign-flag airlines 45 68 32 48 339 565 227
International by region:South America 21 26 11 13 291 362 71
U.S. airlines 16 20 1 1 169 164 (5)Foreign-flag airlines 16 23 10 12 122 198 76
Caribbean 28 36 11 9 280 354 74U.S. airlines 27 34 2 2 231 320 89Foreign-flag airlines 9 8 9 7 49 34 (16)
Central America 9 10 5 4 136 129 (7)U.S. airlines 9 10 1 1 102 86 (16)Foreign-flag airlines 6 5 4 3 34 43 9
Europe, Mid-East, & Africa 8 24 10 24 113 256 143U.S. airlines 3 5 1 1 24 54 29Foreign-flag airlines 8 23 9 23 89 203 114
Mexico 3 6 2 5 59 74 15U.S. airlines 2 5 1 1 33 48 15Foreign-flag airlines 3 3 1 4 26 26 0
Canada 3 6 4 5 47 67 20U.S. airlines 2 2 1 1 28 17 (11)Foreign-flag airlines 3 6 3 4 19 50 31
Destination regionLength of haul (a)
Airline flag

A-72
Regional Competition for Passenger Traffic
The availability of scheduled passenger airline service at MIA and FLL (the nearest major commercial service airport to MIA) gives consumers a choice of airport. In selecting their airport, airline travelers generally evaluate their options in terms of trade-offs among airline service quality (schedule, frequency, number and location of en route stops and connections, total travel time, schedule reliability, aircraft comfort, and other similar factors), airfares (including ancillary fees and frequent flier benefits), and the cost and convenience of ground access to and from the respective airports.
As airline traffic has grown at FLL, the airport service regions for MIA and FLL increasingly overlap, and more travelers to and from South Florida have a choice of two airports. Figure 10 shows that FLL experienced larger increases than MIA in domestic and international enplaned passengers between FY 2010 and FY 2018. Even so, in FY 2018, MIA had 4.6 million more passengers than FLL.
Figure 10
Enplaned Passengers Miami and Fort Lauderdale-Hollywood International Airports
(Fiscal Years ended September 30)
Sources: Miami-Dade Aviation Department; Broward County Aviation Department.

A-73
Because of the proximity of MIA and FLL, many airline passengers ascribe less importance to airport access and more importance to service and fares in selecting their airport in southeastern Florida. Figure 11 shows that, since FY 2010, the average domestic airfare paid was substantially higher at MIA than at FLL. Over the 8-year period, the distance traveled by domestic originating passengers at MIA has averaged only 6% longer than at FLL, meaning that differences in average airfares paid at the two airports do not result simply from passengers traveling different distances. The greater number of premium-fare passengers at MIA and the greater concentration of LCCs at FLL contribute significantly to this airfare difference.
Figure 11
Trends in Domestic Originating Passengers and Airline Fares Miami and Fort Lauderdale-Hollywood International Airports
(Fiscal Years ended September 30)
Note: Average one-way fares are net of all taxes, fees, and PFCs and exclude ancillary fees charged by the airlines.
Source: U.S. Department of Transportation, Air Passenger Origin-Destination Survey, reconciled to Schedule T100.
Domestic Origin-Destination Markets
As shown in Table 27, the top 20 domestic passenger markets accounted for 77.3% of domestic originating passengers at MIA during FY 2018. New York is the top domestic market for MIA, accounting for 20.3% of domestic originating passengers. Other major markets include Washington D.C., Chicago, Atlanta, and Los Angeles, each accounting for 5%-6% of domestic originating passengers. Each of the top 20 domestic markets was served nonstop from the Airport in March 2019, with service provided by 2 or more airlines to 12 of the top 20 markets and 3 or more airlines to 6 of the top 20 markets.

A-74
Table 27 Domestic Originating Patterns and Airline Service
Miami International Airport
(a) Market includes Newark, LaGuardia, and Kennedy airports. (b) Market includes Reagan, Dulles, and Baltimore airports. (c) Market includes Midway and O'Hare airports. (d) Market includes Los Angeles, Burbank, Long Beach, Ontario, and Orange County airports. (e) Market includes San Francisco, San Jose, and Oakland airports. (f) Market includes Dallas/Fort Worth Airport and Love Field. (g) Market includes Hobby and Bush airports.
Source: U.S. DOT, Air Passenger Origin-Destination Survey, reconciled to Schedule T100; OAG Aviation Worldwide Ltd, OAG Analyser database, accessed January 2019.
International Origin-Destination Markets
As shown in Table 28, the top 20 international passenger markets at MIA in terms of international originating passenger bookings accounted for 44.3% of the total in FY 2018.* Passenger bookings *As defined by the International Air Transport Association (IATA), a passenger airline “booking,” equivalent to
the term “reservation,” means the allotment in advance of seating accommodation for a passenger. IATA, Passenger Glossary of Terms, www.iata.org.
Air miles Percent of domestic Average daily scheduledfrom originating passengers nonstop departures Number of
Rank Market Miami FY 2018 March 2019 airlines1 New York (a) 1,093 20.3% 37 42 Washington D.C. (b) 928 6.1 13 33 Chicago (c) 1,198 5.9 13 34 Atlanta 595 5.7 20 35 Los Angeles (d) 2,337 5.4 8 16 Boston 1,259 3.3 7 17 Philadelphia 1,015 3.3 7 28 San Francisco (e) 2,580 3.2 5 29 Dallas/Fort Worth (f) 1,119 2.7 10 1
10 Denver 1,707 2.6 5 311 Las Vegas 2,170 2.6 3 112 Houston (g) 959 2.6 11 213 Detroit 1,147 2.5 4 214 San Juan 1,044 2.3 6 215 Minneapolis-St. Paul 1,501 1.8 6 316 Orlando 192 1.6 9 117 Raleigh-Durham 701 1.5 3 218 Tampa 204 1.4 7 119 Phoenix 1,967 1.3 3 120 Charlotte 651 1.2 8 1
Cities listed 77.3% 186Other cities 22.7 83All cities 100.0% 269

A-75
include data for U.S. and foreign-flag airlines and are used as a proxy for international originating passengers due to reporting limitations of U.S. DOT data. Buenos Aires, Argentina, is the largest market with 6.4% of international originating passenger bookings, followed by Sao Paulo, Brazil (4.0%); Mexico City, Mexico (3.3%); Havana, Cuba (2.6%); and Bogota, Colombia (2.5%). Each of the top 20 international destinations was served nonstop from MIA in March 2019, with service provided by 2 or more airlines to 18 of the top 20 markets, and 3 or more airlines to 10 of the top 20 markets.
Table 28
International Originating Patterns and Airline Service Miami International Airport
Note: For Fiscal Year ended September 30, 2018. Data are for international originating passenger bookings.
(a) Market includes Aeroparque and Ezeiza airports. (b) Market includes Guarulhos, Congonhas, and Viracopas airports. (c) Market includes Jaurez and Toluca airports. (d) Market includes Heathrow, Gatwick, Stanstead, and London City airports. (e) Market includes Charles de Gaulle and Orly airports. (f) Market includes Galeao and Santos Dumont airports. Sources: OAG Aviation Worldwide Ltd, OAG Analyser database and OAG Traffic database, accessed January 2019.
Air miles Percent of international Average daily scheduledfrom originating passengers nonstop departures Number of
Rank Market Miami FY 2018 March 2019 airlines1 Buenos Aires (a) 4,420 6.4% 5 32 Sao Paulo (b) 4,081 4.0 5 33 Mexico City (c) 1,273 3.3 8 44 Havana 234 2.6 7 25 Bogota 1,511 2.5 8 36 London (d) 4,419 2.4 6 47 Toronto 1,235 2.2 9 58 Santiago, Chile 4,133 2.1 3 29 Lima 2,619 2.1 5 3
10 Cancun 530 2.0 5 211 Lynden Pindling 184 1.9 8 212 Caracas 1,361 1.9 3 313 Santo Domingo 848 1.6 5 114 Paris (e) 4,577 1.5 2 215 Managua 1,017 1.4 4 216 Madrid 4,413 1.4 4 317 Medellin 1,393 1.3 3 318 Rio de Janeiro (f) 4,171 1.3 2 219 Quito 1,793 1.3 3 220 Guayaquil 1,929 1.2 2 1
Cities listed 44.3% 97Other cities 55.7 124
All cities 100.0% 221

A-76
Competition among International Gateway Airports
The availability of international service at MIA and other U.S. airports gives consumers a choice of international flights via those airports. International airline travelers generally evaluate their flight options in terms of trade-offs among airline service quality and airfares. Total travel time is significantly affected by the directness of the itinerary routing and by the connecting time between flights at the gateway airport and other en route airports.
MIA has long served as the primary air transportation gateway between the United States and the Caribbean, South America, and Central America. Consumers traveling between these regions, however, have an increasing number of international flight options via other gateway airports, both in the United States and in Latin America, which increase competition for MIA. Table 29 shows that, between 2010 and the 12 months ended September 30, 2018 (the most recent data available), MIA lost market share to these regions, as measured by departing passengers, to competing U.S. airports alone. It is important to recognize that in none of these cases did MIA’s decrease in share correspond with an actual decrease in departing passengers at MIA over the 8-year period; the rates of overall growth in traffic from the United States to these world regions simply exceeded the rates of traffic growth at the Airport. MIA remains the largest single U.S. gateway to South and Central America and the second-largest gateway to the Caribbean.
� To Caribbean destinations, the total number of passengers departing from U.S. gateway airports increased 48%, greater than the 16% increase experienced at MIA. MIA lost share (down 6.6 percentage points), as did New York and Charlotte, while the Fort Lauderdale and Atlanta gateways gained share.
� To South American destinations, the total number of passengers departing from U.S. gateway airports increased 39%, greater than the 23% increase experienced at MIA. MIA lost share (down 5.4 percentage points), as did Atlanta, while the FLL and Orlando gateways gained share. New York’s share remained unchanged.
� To Central American destinations, the total number of passengers departing from U.S. gateway airports increased 52%, greater than the 4% increase experienced at MIA. MIA lost share (down 9.5 percentage points), as did Houston, Atlanta, and New York, while Los Angeles gained share.
Other smaller gateway airports, not ranked in the top five per market, collectively gained market share to the Caribbean and Central America and lost share to South America over the period.

A-77
Table 29
Ranking of Cities in the United States by Gateway Shares of International Departing Passengers
(calendar years)
Note: Includes enplaned (originating and connecting) passengers as well as through passengers. Excludes U.S. gateway airports in Alaska, Hawaii, Puerto Rico, the U.S. Virgin Islands, and
the U.S. Pacific Trust.
(a) Data for the 12 months ended September 30, 2018, the most recent available. (b) Includes Kennedy, Newark, and LaGuardia airports. (c) Includes Los Angeles, Burbank, Long Beach, Ontario, and Orange County airports.
Sources: U.S. DOT, Schedule T100.
Destination area 2018 2010 2018 (a)U.S. gateway city Rank Passengers Share Passengers Share
Caribbean (includes Bahamas) 8,273,385 12,248,267New York (b) 1 2,515,987 30.4% 3,506,328 28.6%Miami 2 2,510,468 30.3 2,908,035 23.7Fort Lauderdale 3 750,002 9.1 1,829,388 14.9Atlanta 4 720,403 8.7 1,154,003 9.4Charlotte 5 548,472 6.6 651,854 5.3All other gateways 1,228,053 14.8 2,198,659 18.0
South America 5,586,350 7,749,616Miami 1 2,650,941 47.5% 3,257,081 42.0%New York (b) 2 1,013,337 18.1 1,400,459 18.1Fort Lauderdale 3 254,304 4.6 642,189 8.3Orlando 4 114,826 2.1 533,228 6.9Atlanta 5 516,752 9.3 526,734 6.8All other gateways 1,036,190 18.5 1,389,925 17.9
Central America (excludes Mexico) 3,815,814 5,785,750Miami 1 1,139,066 29.9% 1,180,358 20.4%Houston 2 754,754 19.8 1,039,286 18.0Los Angeles (c) 3 357,505 9.4 664,297 11.5Atlanta 4 376,513 9.9 558,900 9.7New York (b) 5 365,904 9.6 542,576 9.4All other gateways 822,072 21.5 1,800,333 31.1

A-78
2.3.3 Historical Airline Traffic at the Airport
Table 30 shows that enplaned passengers averaged 3.1% annual growth at MIA between FY 2010 and FY 2018.
Table 30
Historical Enplaned Passengers, by Component Miami International Airport
(Fiscal Years ended September 30; passengers in thousands)
Notes: Rows may not add to totals shown because of rounding. Percentages were calculated using unrounded
numbers.
(a) Includes domestic originating passengers, international originating passengers who boarded domestic flights at Miami bound for international destinations via other U.S. gateway airports, passengers on nonscheduled (charter) flights, and nonrevenue passengers.
(b) Includes international originating passengers on scheduled flights, along with small numbers of passengers on nonscheduled flights, nonrevenue passengers, and international-to international connections on foreign flag airlines.
Sources: Actual—Miami-Dade County Aviation Department; U.S. DOT, Air Passenger Origin-Destination Survey, reconciled to Schedule T100.
Passengers enplaned onDomestic flights International flights All flights
Fiscal Year Originating (a) Connecting Total Originating (b) Connecting Total Originating Connecting Total2010 5,412 3,767 9,179 4,722 3,504 8,226 10,134 7,271 17,4052011 5,699 4,097 9,796 5,438 3,467 8,905 11,137 7,564 18,7012012 5,796 4,359 10,155 5,828 3,700 9,528 11,624 8,059 19,6842013 5,858 4,175 10,033 5,963 3,880 9,843 11,821 8,055 19,8762014 6,188 4,154 10,343 5,860 4,017 9,877 12,049 8,171 20,2202015 6,765 4,433 11,197 6,051 4,127 10,178 12,815 8,560 21,3752016 7,784 4,000 11,784 6,702 3,668 10,370 14,485 7,668 22,1542017 7,613 3,520 11,133 7,107 3,363 10,470 14,720 6,883 21,6032018 8,090 3,482 11,571 7,113 3,536 10,649 15,203 7,018 22,220
Average annual percent increase (decrease)2010-2014 3.4% 2.5% 3.0% 5.5% 3.5% 4.7% 4.4% 3.0% 3.8%2014-2018 6.9 (4.3) 2.8 5.0 (3.1) 1.9 6.0 (3.7) 2.42010-2018 5.2 (1.0) 2.9 5.3 0.1 3.3 5.2 (0.4) 3.1
Annual percent increase (decrease)2010-2011 5.3% 8.8% 6.7% 15.2% (1.0%) 8.3% 9.9% 4.0% 7.4%2011-2012 1.7 6.4 3.7 7.2 6.7 7.0 4.4 6.5 5.32012-2013 1.1 (4.2) (1.2) 2.3 4.8 3.3 1.7 (0.1) 1.02013-2014 5.6 (0.5) 3.1 (1.7) 3.5 0.3 1.9 1.4 1.72014-2015 9.3 6.7 8.3 3.2 2.7 3.0 6.4 4.8 5.72015-2016 15.1 (9.8) 5.2 10.8 (11.1) 1.9 13.0 (10.4) 3.62016-2017 (2.2) (12.0) (5.5) 6.1 (8.3) 1.0 1.6 (10.2) (2.5)2017-2018 6.3 (1.1) 3.9 0.1 5.2 1.7 3.3 2.0 2.9
Share of Airport total2010 31.1% 21.6% 52.7% 27.1% 20.1% 47.3% 58.2% 41.8% 100.0%2014 30.6 20.5 51.2 29.0 19.9 48.8 59.6 40.4 100.02017 35.2 16.3 51.5 32.9 15.6 48.5 68.1 31.9 100.02018 36.4 15.7 52.1 32.0 15.9 47.9 68.4 31.6 100.0

A-79
The total number of passengers enplaned at the Airport in FY 2018 (22.2 million) was 28% higher than the FY 2010 level (17.4 million). The increase was entirely due to growth in the number of originating passengers, which increased 50%, or by 5.1 million enplaned passengers. The number of connecting enplaned passengers decreased 3%, or by 250,000, primarily due to American’s greater focus on more profitable originating passengers throughout its route network, at the expense of less profitable connecting passengers.
As a result, the traffic mix at MIA shifted somewhat between FY 2010 and FY 2018. The proportion of connecting passengers decreased from 41.8% to 31.6% of total passengers, while the proportion of originating passengers increased from 58.2% to 68.4%. The number of passengers enplaned on domestic flights decreased slightly from 52.7% to 52.1% of total passengers, while the number of passengers enplaned on international flights increased from 47.3% to 47.9%.
Figure 12 shows the domestic originating, international originating, and connecting passenger segments at the Airport since FY 2010.
Figure 12
Enplaned Passenger Trends by Passenger Segment Miami International Airport
(Fiscal Years ended September 30)
Sources: MDAD; U.S. DOT, Air Passenger Origin-Destination Survey, reconciled to Schedule T100.

A-80
The size of the originating passenger market at MIA reflects the strong familial, social, cultural, and economic linkages to the Caribbean and Latin America, the role of the Miami area as a center of international trade and finance, and the attractiveness of Miami as a vacation and cruise destination, for both domestic and international visitors.
For connecting passengers, MIA is ideally located geographically to facilitate travel between the United States, the Caribbean, and Latin America. Many major population centers in the Caribbean and South America lie east (and south) of Miami, thereby making MIA a logical connecting airport in the United States for passenger flows to and from those areas. Connecting through Miami is often less circuitous relative to alternatives via other hubs.
Figure 13
Originating Passenger Trends by Type of Passenger Miami International Airport
(Fiscal Years ended September 30)
Sources: MDAD; U.S. DOT, Air Passenger Origin-Destination Survey, reconciled to Schedule T100.
Figure 13 shows that both residents and visitors increased between FY 2010 and FY 2018, averaging growth of 7.1% and 3.9% per year, respectively. Although visitors have the largest market share (55% in FY 2018), residents gained market share, from 39% in FY 2010 to 45% in FY 2018.

A-81
Airline Concentration
Table 31 shows that American accounted for 66.7% of all passengers enplaned at the Airport in FY 2018, down from 70.8% in FY 2010. Delta, the second-ranking airline serving MIA in terms of enplaned passengers, enplaned 6.0% of the total in FY 2018.
American has a particularly large share of the Airport’s domestic passenger market. Approximately 79.3% of domestic passengers at MIA in FY 2018 boarded a flight operated by either American or its regional affiliates, compared with 81.2% in FY 2010.
Approximately 53.0% of international passengers at MIA in FY 2018 were carried by American, down from 59.2% in FY 2010. Eight of the nine remaining top carriers of international passengers at the Airport in FY 2018 were foreign-flag airlines, of which three (LATAM Group, British Airways, and Iberia) are members of the oneworld alliance to which American belongs.
Compared with other U.S. international gateway airports with a single hubbing airline, MIA has a similar degree of airline concentration, in terms of airline share of enplaned passengers, as Newark (United, 65.3%) and Washington-Dulles (United, 62.6%), and a lower degree of concentration than Houston-Bush (United, 77.3%). Among American’s other major U.S. connecting hub airports, American’s share at MIA is lower than its share at Philadelphia (69.2%), Dallas/Fort Worth (84.3%), and Charlotte (90.9%). American’s two major connecting hubs with lower degrees of airline concentration than MIA, Chicago-O’Hare and Phoenix, are both airports served by two hubbing airlines. A lower relative level of airline concentration at MIA suggests a healthy degree of airline competition.

A-82
Table 31
Airline Market Shares of Enplaned Passengers Miami International Airport
(Fiscal Years ended September 30; passengers in thousands)
Notes: Fiscal Year to Date (FYTD) is 3 months ended December 2018.
Columns may not add to totals shown because of rounding. Passengers reported by regional affiliates have been grouped with their respective code-sharing partners.
(a) LATAM Group was created when LAN Group, which includes LAN Argentina, LAN Chile, LAN Colombia, LAN Ecuador, LAN Peru, acquired TAM Airlines. TAM is included for all years shown, although its merger with LAN did not occur until June 2012.
(b) Includes Avianca Brazil and Avianca Costa Rica. Avianca and TACA merged in May 2013. TACA and TACA Peru are included for all years shown.
Sources: Miami-Dade Aviation Department.
Enplaned passengers Percent of total
2018 Fiscal Years FYTD Fiscal Years FYTD
Rank Airline 2010 2014 2018 2018 2019 2010 2014 2018 2018 2019Domestic:
1 American 7,452.5 8,674.7 9,175.5 2,209.8 2,314.4 81.2% 83.9% 79.3% 78.3% 82.2%2 Delta 999.6 1,157.7 1,290.1 297.4 293.5 10.9 11.2 11.1 10.5 10.43 United 526.1 489.8 682.7 171.9 152.5 5.7 4.7 5.9 6.1 5.44 Frontier - - 361.9 132.5 44.5 - - 3.1 4.7 1.65 Sun Country 5.6 10.8 20.2 2.1 3.8 0.1 0.1 0.2 0.1 0.1
All others 195.6 9.9 41.1 7.8 6.3 2.1 0.1 0.4 0.3 0.2Total 9,179.4 10,342.8 11,571.5 2,821.5 2,814.9 100.0% 100.0% 100.0% 100.0% 100.0%
International:1 American 4,870.9 5,429.0 5,649.2 1,419.4 1,408.3 59.2% 55.0% 53.0% 53.4% 51.7%2 LATAM Group (a) 647.2 1,023.8 831.6 215.6 201.8 7.9 10.4 7.8 8.1 7.43 Avianca (b) 553.8 550.6 633.8 150.4 155.2 6.7 5.6 6.0 5.7 5.74 Eastern - 30.8 284.9 69.2 109.9 - 0.3 2.7 2.6 4.05 Copa 127.1 248.9 279.8 65.1 73.7 1.5 2.5 2.6 2.4 2.76 British Airways 215.7 237.4 245.0 64.3 77.3 2.6 2.4 2.3 2.4 2.87 Lufthansa 160.0 172.7 209.2 56.5 54.8 1.9 1.7 2.0 2.1 2.08 Iberia 107.9 155.6 179.5 40.7 42.0 1.3 1.6 1.7 1.5 1.59 Aerolineas Argentinas 67.9 147.9 173.9 44.9 35.2 0.8 1.5 1.6 1.7 1.3
10 Air Canada 78.0 92.4 167.3 31.3 36.2 0.9 0.9 1.6 1.2 1.3All others 1,397.2 1,788.0 1,994.9 501.4 531.8 17.0 18.1 18.7 18.9 19.5Total 8,225.9 9,877.1 10,649.0 2,658.6 2,726.2 100.0% 100.0% 100.0% 100.0% 100.0%
Total:1 American 12,323.4 14,103.7 14,824.7 3,629.2 3,722.6 70.8% 69.8% 66.7% 66.2% 67.2%2 Delta 999.6 1,158.4 1,333.5 309.1 309.4 5.7 5.7 6.0 5.6 5.63 LATAM Group (a) 647.2 1,023.8 831.6 215.6 201.8 3.7 5.1 3.7 3.9 3.64 United 526.1 489.8 682.7 171.9 152.5 3.0 2.4 3.1 3.1 2.85 Avianca (b) 553.8 550.6 633.8 150.4 155.2 3.2 2.7 2.9 2.7 2.86 Frontier - - 361.9 132.5 44.5 - - 1.6 2.4 0.87 Eastern - 32.8 302.5 69.6 112.7 - 0.2 1.4 1.3 2.08 Copa 127.1 248.9 279.8 65.1 73.7 0.7 1.2 1.3 1.2 1.39 British Airways 215.7 237.4 245.0 64.3 77.3 1.2 1.2 1.1 1.2 1.4
10 Lufthansa 160.0 172.7 209.2 56.5 54.8 0.9 0.9 0.9 1.0 1.0All others 1,852.3 2,201.6 2,515.8 616.1 636.7 10.6 10.9 11.3 11.2 11.5Total 17,405.3 20,219.9 22,220.4 5,480.0 5,541.1 100.0% 100.0% 100.0% 100.0% 100.0%

A-83
Trends in Air Cargo
Table 32 shows that total cargo tonnage at the Airport increased 2.2% per year, on average, between FY 2010 and FY 2018. International cargo tonnage increased 1.6% per year, on average (231,000 tons), while domestic cargo increased an average of 6.4% per year (149,000 tons), albeit from a substantially smaller base. All-cargo airlines accounted for most of the increase over this period. International cargo tonnage accounted for 83.9% of the Airport total in FY 2018, down from 88.4% in FY 2010; while domestic cargo tonnage accounted for the remainder.
Table 32
Trends in Total Air Cargo Tonnage, by Type of Airline Miami International Airport
(Fiscal Years ended September 30; cargo in thousands of tons)
Notes: Sum of enplaned and deplaned freight and mail. Rows may not add to totals shown because of rounding.
Source: Miami-Dade Aviation Department.
Of the total cargo tonnage carried to and from MIA in FY 2018, 71.7% was carried on all-cargo (i.e., freighter) aircraft, while the remainder (28.3%) was carried on passenger flights. The carriage of cargo is a key source of operating revenue for many passenger airlines serving MIA, particularly the foreign-flag airlines, and an important contributor to the viability of their passenger flights.
Fiscal Domestic International TotalYear Passenger All-cargo Total Passenger All-cargo Total Passenger All-cargo Total2010 60.4 171.3 231.7 459.5 1,298.2 1,757.6 519.8 1,469.5 1,989.32011 63.4 184.4 247.8 500.6 1,258.3 1,758.9 564.0 1,442.7 2,006.72012 57.5 229.3 286.8 493.4 1,321.3 1,814.7 550.9 1,550.6 2,101.62013 57.0 227.1 284.1 548.9 1,302.0 1,850.9 605.9 1,529.1 2,134.92014 59.6 213.3 272.9 571.7 1,342.8 1,914.5 631.3 1,556.1 2,187.42015 64.1 212.8 276.9 585.2 1,344.5 1,929.8 649.3 1,557.3 2,206.72016 72.1 234.5 306.6 571.3 1,337.9 1,909.2 643.4 1,572.4 2,215.92017 75.7 243.2 318.8 583.0 1,346.1 1,929.1 658.6 1,589.3 2,247.92018 72.8 307.5 380.4 597.8 1,390.4 1,988.2 670.6 1,698.0 2,368.6
Compound annual growth rate2010-2014 (0.3%) 5.6% 4.2% 5.6% 0.8% 2.2% 5.0% 1.4% 2.4%2014-2018 5.1 9.6 8.7 1.1 0.9 0.9 1.5 2.2 2.02010-2018 2.4 7.6 6.4 3.3 0.9 1.6 3.2 1.8 2.2
Share of Airport total2010 3.0% 8.6% 11.6% 23.1% 65.3% 88.4% 26.1% 73.9% 100.0%2014 2.7 9.7 12.5 26.1 61.4 87.5 28.9 71.1 100.02018 3.1 13.0 16.1 25.2 58.7 83.9 28.3 71.7 100.0

A-84
Table 33 shows that air cargo tonnage was reported by 89 airlines at MIA in FY 2018. A total of 30 U.S. airlines accounted for 63% of the total cargo tonnage. Foreign-flag airlines handled the remainder, of which more than half was accounted for by South American airlines.
Table 33
Summary of Airlines Reporting Air Cargo Miami International Airport
(Fiscal Year ended September 30, 2018)
Notes: Sum of enplaned and deplaned freight and mail. Rows may not add to totals shown because of rounding.
Source: Miami-Dade County Aviation Department.
Table 34 shows that domestic cargo is more concentrated among the airlines than international cargo at the Airport. The top five ranking carriers of domestic cargo at MIA (FedEx, Atlas Air, American, UPS, and ABX Air) together accounted for 92.2% of total domestic tonnage in FY 2018. In contrast, the top five carriers of international cargo at MIA (the LATAM Group, Atlas Air, UPS, Tampa, and Amerijet) together accounted for 56.4% of the international total. Atlas Air was the overall top-ranking cargo airline at the Airport in FY 2018—handling an average of nearly 1,000 tons of cargo per day. Eight of the top 10 airlines reporting cargo tonnage at the Airport in FY 2018 were all-cargo airlines.
Cargo tonnage by type of flightNumber of (in thousands of tons)
airlines Domestic International TotalAll airlines 89 380.0 1,988.6 2,368.6
U.S. airlines 30 380.0 1,102.0 1,482.0
Foreign-flag airlines 59 886.6 886.6By carrier flag world area:
South America 14 531.8 531.8Europe, Mid-East, & Africa 27 161.1 161.1Asia 4 87.1 87.1Mexico & Central America 10 71.3 71.3Caribbean 3 0.6 0.6Canada 1 34.8 34.8

A-85
Table 34
Airline Market Shares of Air Cargo Tonnage Miami International Airport
(Fiscal Years ended September 30; cargo in thousands of tons)
Notes: Fiscal Year to Date (FYTD) is 3 months ended December 2018. Sum of enplaned and deplaned freight and mail. Columns may not add to totals shown because of rounding.
(a) LATAM Group was created when LAN Group, which includes LAN Argentina, LAN Chile, LAN Colombia, LAN Ecuador, LAN Peru, acquired TAM Airlines. TAM is included for all years shown, although its merger with LAN did not occur until June 2012.
(b) Includes Avianca Brazil and Avianca Costa Rica. Avianca and TACA merged in May 2013. TACA and TACA Peru are included for all years shown.
Source: Miami-Dade County Aviation Department.
Air Cargo Tonnage Percent of total2018 Fiscal Years FYTD Fiscal Years FYTD
Rank Airline 2010 2014 2018 2018 2019 2010 2014 2018 2018 2019Domestic:
1 FedEx 107.9 107.3 106.1 25.4 27.7 46.6% 39.3% 27.9% 24.4% 26.0%2 Atlas Air 4.8 9.9 80.6 25.2 24.7 2.1 3.6 21.2 24.2 23.23 American 49.1 47.8 61.9 16.4 15.8 21.2 17.5 16.3 15.7 14.84 UPS 24.7 47.1 55.6 15.9 12.0 10.7 17.3 14.6 15.3 11.35 ABX Air 21.6 46.6 46.2 12.2 16.5 9.3 17.1 12.2 11.7 15.56 Northern Air Cargo - - 5.7 0.0 1.2 - - 1.5 0.0 1.27 Delta 4.6 5.3 4.9 1.3 1.0 2.0 2.0 1.3 1.3 1.08 United 4.3 2.9 4.7 1.6 0.7 1.9 1.1 1.2 1.6 0.7
All others 14.7 6.0 14.3 6.1 6.8 6.3 2.2 3.8 5.8 6.4Total 231.7 272.9 380.0 104.1 106.6 100.0% 100.0% 100.0% 100.0% 100.0%
International:1 LATAM Group (a) 325.6 381.3 279.2 80.4 76.4 18.5% 19.9% 14.0% 15.0% 14.9%2 Atlas Air 89.4 154.4 267.5 73.9 74.2 5.1 8.1 13.5 13.8 14.43 UPS 147.9 198.4 226.5 59.3 55.1 8.4 10.4 11.4 11.0 10.74 Tampa 150.0 176.7 180.3 45.2 48.9 8.5 9.2 9.1 8.4 9.55 Amerijet Int'l 87.0 115.4 167.8 47.4 39.2 4.9 6.0 8.4 8.8 7.66 American 94.4 104.5 135.7 39.0 31.0 5.4 5.5 6.8 7.3 6.07 ABX Air 61.8 125.5 111.9 30.2 25.9 3.5 6.6 5.6 5.6 5.08 Tradewinds - 156.7 92.8 26.3 17.2 - 8.2 4.7 4.9 3.49 Avianca (b) 7.0 12.6 55.6 15.9 15.5 0.4 0.7 2.8 3.0 3.0
10 Cathay Pacific 26.7 42.9 42.7 12.3 12.2 1.5 2.2 2.1 2.3 2.4All others 767.9 446.2 428.6 107.1 118.2 43.7 23.3 21.6 19.9 23.0Total 1,757.6 1,914.5 1,988.6 537.0 513.9 100.0% 100.0% 100.0% 100.0% 100.0%
Total:1 Atlas Air 94.2 164.2 348.1 99.1 98.9 4.7% 7.5% 14.7% 15.5% 15.9%2 UPS 172.6 245.5 282.1 75.3 67.2 8.7 11.2 11.9 11.7 10.83 LATAM Group (a) 325.6 381.3 279.2 80.4 76.4 16.4 17.4 11.8 12.5 12.34 American 143.4 152.3 197.5 55.3 46.8 7.2 7.0 8.3 8.6 7.55 Tampa 150.0 176.7 180.3 45.2 48.9 7.5 8.1 7.6 7.0 7.96 Amerijet Int'l 87.0 115.4 167.8 47.4 39.2 4.4 5.3 7.1 7.4 6.37 ABX Air 83.4 172.1 158.2 42.4 42.4 4.2 7.9 6.7 6.6 6.88 FedEx 108.6 107.3 106.8 25.9 27.7 5.5 4.9 4.5 4.0 4.59 Tradewinds - 156.9 92.8 26.3 17.2 - 7.2 3.9 4.1 2.8
10 Avianca (b) 7.0 12.6 55.6 15.9 15.5 0.4 0.6 2.3 2.5 2.5All others 817.5 503.2 500.2 128.0 140.2 41.1 23.0 21.1 20.0 22.6Total 1,989.3 2,187.4 2,368.6 641.1 620.5 100.0% 100.0% 100.0% 100.0% 100.0%

A-86
2.4 KEY FACTORS AFFECTING FUTURE AIRLINE TRAFFIC
In addition to the demographics and economy of the Airport service region, as discussed earlier, key factors that will affect future airline traffic at the Airport include:
� Economic, political, and security conditions � Financial health of the airline industry � Airline service and routes � Airline competition, airfares, and airport charges � Availability and price of aviation fuel � Aviation safety and security concerns � Capacity of the national air traffic control system � Capacity of the Airport � Operating efficiencies for American Airlines
2.4.1 Economic, Political, and Security Conditions
Historically, airline passenger traffic nationwide has correlated closely with the state of the U.S. economy and levels of real disposable income. As illustrated on Figure 14, recessions in the U.S. economy in 2001 and 2008-2009 and associated high unemployment reduced discretionary income and resulted in reduced airline travel.
Figure 14
Historical Enplaned Passengers on U.S. Airlines
Notes: Data shown are 12-month moving averages of enplaned passengers on scheduled and non-scheduled flights to domestic and international destinations. Shaded areas indicate months of economic recession.
Sources: U.S. DOT, Bureau of Transportation Statistics, T100 Market and segment, www.transtats.bts.gov, accessed March 2019; National Bureau of Economic Research, US Business Cycle Expansions and Contractions, www.nber.org.

A-87
Passenger traffic at U.S. airports is also influenced by the globalization of business and increased importance of international trade and tourism, international economics, trade balances, currency exchange rates, government policies, and geopolitical relationships.
Concerns about hostilities, terrorist attacks, and other perceived security and public health risks, and associated travel restrictions also affect travel demand to and from particular international destinations. Beginning in March 2017, the Trump administration issued various orders seeking to restrict travel to the United States from certain countries, mainly in the Middle East and Africa. Following court challenges, in June 2018, the U.S. Supreme Court upheld the administration’s most recent travel restrictions. As the restrictions are implemented, increased scrutiny by U.S. Customs and Border Protection could prevent or discourage some airline travel.
Sustaining current passenger traffic nationally and at the Airport, and achieving forecast increases at the Airport, will depend partly on global economic growth, a stable and secure international travel environment, and government policies that do not unreasonably restrict or deter travel.
2.4.2 Financial Health of the Airline Industry
The number of passengers at the Airport will depend partly on the profitability of the U.S. airline industry and the associated ability of the industry and individual airlines, particularly American Airlines, to make the investments necessary to provide service. Figure 15 shows historical net income for U.S. airlines.
As a result of the 2001 economic recession, the disruption of the airline industry that followed the September 2001 attacks, increased fuel and other operating costs, and price competition, the industry experienced financial losses. From 2001 through 2006, the major U.S. passenger airlines collectively recorded net losses of approximately $46 billion. To mitigate those losses, the major network airlines restructured their route networks and flight schedules and reached agreements with their employees, lessors, vendors, and creditors to cut costs. Between 2002 and 2005, Delta, Northwest, United, and US Airways filed for Chapter 11 bankruptcy protection and restructured their operations.
In 2007, the U.S. passenger airline industry was profitable, recording net income of approximately $7 billion, but, in 2008, as oil and aviation fuel prices increased to unprecedented levels and the U.S. economy contracted, the U.S. passenger airline industry recorded net losses of approximately $26 billion. The industry responded by grounding less fuel-efficient aircraft, eliminating unprofitable routes and hubs, reducing seat capacity, and increasing airfares. Between 2007 and 2009, U.S. passenger airlines collectively reduced domestic capacity by approximately 10%, as measured by available seat-miles.
From 2010 to 2013, the U.S. passenger airline industry recorded net income of approximately $18 billion, notwithstanding sustained high fuel prices, by controlling capacity and nonfuel expenses, increasing airfares, recording high load factors, and increasing ancillary revenues. Between 2009 and 2013, the airlines collectively increased domestic seat-mile capacity by an average of 1.0% per year. American filed for bankruptcy protection in 2011.

A-88
Figure 15 Net Income for U.S. Airlines
Notes: Includes scheduled service on U.S. carriers only. Shaded areas indicate quarters of economic recession. Data for the fourth quarter of 2005 and the first quarter of 2006 were adjusted to account for United bankruptcy claims which were settled for less than had been originally reported.
Source: U.S. DOT, Bureau of Transportation Statistics, Net Income, F41 Schedule P12, www.transtats.bts.gov, accessed March 2019.
In 2014, the U.S. passenger airline industry reported net income of $9 billion, assisted by reduced fuel prices. In 2015, the industry achieved record net income of $26 billion as fuel prices decreased further, demand remained strong, and capacity control allowed average fares and ancillary charges to remain high. Strong industry profitability continued in 2016 through 2018.
Recent agreements between the major airlines and their unionized employees have resulted in increased labor costs. According to Airlines for America, U.S. airlines increased wages and benefits per full-time employee by 28% between 2013 and 2018. Contributing to the increased costs, a shortage of qualified airline pilots resulting from retirements and changed FAA qualification standards and duty and rest rules has required the airlines to increase salaries and improve benefits to attract and retain pilots.
Sustained industry profitability will depend on, among other factors, economic growth to support airline travel demand, continued capacity control to enable increased airfares, and stable fuel prices and labor costs.
Consolidation of the U.S. airline industry has resulted in the acquisition of Trans World by American (2001), the merger of US Airways and America West (2005), the merger of Delta and Northwest (2009), the merger of United and Continental (2010), the acquisition of AirTran by Southwest (2011), the merger of American and US Airways (2013), and the acquisition of Virgin America by Alaska (2016).

A-89
Such consolidation has resulted in four airlines (American, Delta, Southwest, and United) and their regional affiliates now accounting for approximately 80% of domestic seat-mile capacity. The consolidation has contributed to industry profitability. However, any resumption of financial losses could cause one or more U.S. airlines to seek bankruptcy protection or liquidate. The liquidation of any of the large network airlines would drastically affect airline service at certain connecting hub airports and change airline travel patterns nationwide.
2.4.3 Airline Service and Routes
The Airport serves as a gateway to South Florida and as a connecting hub. The number of originating passengers at the Airport depends primarily on the intrinsic attractiveness of the region as a business and leisure destination, the propensity of its residents to travel, and the airfares and service provided at the Airport and at other competing airports. By contrast, the number of connecting passengers depends almost entirely on the airline service provided.
The large airlines have developed hub-and-spoke systems that allow them to offer high-frequency service to many destinations. Because most connecting passengers have a choice of airlines and intermediate airports, connecting traffic at an airport depends primarily on the route networks and flight schedules of the airlines serving that airport and competing hub airports. Since 2003, as the U.S. airline industry consolidated, airline service has been reduced at many former connecting hub airports, including those serving St. Louis (American, 2003-2005), Dallas-Fort Worth (Delta, 2005), Pittsburgh (US Airways, 2006-2008), Las Vegas (US Airways, 2007-2010), Cincinnati (Delta, 2009-2011), Memphis (Delta, 2011-2013), and Cleveland (United, 2014).
The Airport is an important hub in American Airlines’ system and a significant percentage of passengers at the Airport connect between flights. As a result, much of the connecting passenger traffic at the Airport results from the route network and flight schedule of American rather than the economy of the Airport service region. If American were to further reduce connecting service at the Airport, such service would not necessarily be replaced by other airlines, although reductions in service by any airline would create business opportunities for others.
2.4.4 Airline Competition, Airfares, and Airport Charges
Airline fares have an important effect on passenger demand, particularly for relatively short trips for which automobile and other surface travel modes are potential alternatives, and for price-sensitive “discretionary” travel. The price elasticity of demand for airline travel increases in weak economic conditions when the disposable income of potential airline travelers is reduced. Airfares are influenced by airline capacity and yield management; passenger demand; airline market presence; labor, fuel, and other airline operating costs; taxes, fees, and other charges assessed by governmental and airport agencies; and competitive factors. Future passenger numbers, both nationwide and at the Airport, will depend in part on the level of airfares.
Figure 16 shows the historical average domestic yield (airfare per passenger-mile) for U.S. airlines. Overcapacity in the industry, the ability of consumers to compare airfares and book flights easily via the Internet, and the 2001 recession combined to reduce the average yield between 2000 and 2004. The average yield then increased between 2004 and 2008 before again decreasing during the 2008-2009 recession. The average yield then increased between 2009 and 2014 as airline travel demand strengthened and the airlines collectively reduced available seat capacity and were able to sustain airfare increases. Between 2014 and 2016, the average yield decreased, but since 2016 has been fairly stable.

A-90
Figure 16 Historical Domestic Yield for U.S. Airlines
Notes: Average yields shown are net of all taxes, fees, and PFCs and exclude ancillary fees charged by the airlines. Shaded areas indicate economic recession during all or part of year.
(a) Data are for the 12 months ended September 30, 2018, the most recent available.
Source: U.S. DOT, Air Passenger Origin-Destination Survey, reconciled to Schedules T100 and 298C T1.
Beginning in 2006, charges were introduced by most airlines for optional services such as checked baggage, preferred seating, in-flight meals, and entertainment, thereby increasing the effective price of airline travel more than yield figures indicate.
Airfares at MIA are significantly related to the competitive structure of the airline industry, as well as service and airfare competition in individual markets served from MIA and FLL. Given the fare sensitivity of consumers, airlines typically respond to lower fares offered by a competitor. While competition determines how low an airline must price its fares to attract passengers, costs determine how low an airline can price its seats and still make a profit. Thus, if fare reductions are not offset by increases in revenue from additional passengers and ancillary sources as well as by greater operating efficiencies, then operating results will suffer, and service in such markets may be reduced. In this context, airport charges can be relevant.
Airport charges are often expressed in terms of airline payments (cost) per enplaned passenger (CEP). CEP is used for comparison purposes, even though inherent issues affect the comparability of such ratios. (For instance, airlines serving regions with greater numbers of business and premium-fare-paying travelers can often better bear higher CEP, given more robust yields.) In general, however, most airlines will move to curtail their networks’ least profitable flights, if practical, in the face of increased costs. A high CEP at MIA could adversely affect the profitability of airlines’ flights at the Airport which could, in turn, negatively affect levels of air service, airfares, and passenger traffic at MIA. These are complex and unique business decisions for individual airlines, which underscores why there is no clear, predictable relationship among (1) projected CEP, (2) future

A-91
levels of airline service and fares, and (3) future levels of passenger traffic. The later Section 3.6 has additional information on the current forecast of CEP at the Airport.
2.4.5 Availability and Price of Aviation Fuel
The price of aviation fuel is a critical and uncertain factor affecting airline operating economics. Figure 17 shows the historical fluctuation in aviation fuel prices caused by the many factors influencing the global demand for and supply of oil.
Between 2011 and 2014, aviation fuel prices were relatively stable, partly because of increased oil supply from U.S. domestic production, made possible by the hydraulic fracturing of oil-bearing shale deposits and other advances in extraction technologies. As of mid-2014, average fuel prices were approximately three times those at the end of 2003 and accounted for between 30% and 40% of expenses for most airlines.
Beginning in mid-2014, an imbalance between worldwide demand and supply resulted in a precipitous decline in the price of oil and aviation fuel through the end of 2015. Fuel prices have since increased, but the average price of aviation fuel at the end of 2018 was still approximately 30% below the price at mid-2014. Lower fuel prices have a positive effect on airline profitability as well as far-reaching implications for the global economy.
Figure 17
Historical Monthly Jet Fuel Prices for U.S. Airlines
Notes: Data shown are monthly averages and were converted from gallons to barrels. Shaded areas indicate months of economic recession.
Source: U.S. DOT, Bureau of Transportation Statistics, Airline Fuel Cost and Consumption, F41 Schedule P12A, www.transtats.bts.gov, accessed March 2019.

A-92
Airline industry analysts hold differing views on how oil and aviation fuel prices may change in the near term, although, absent unforeseen disruptions, prices are expected to remain stable. There is widespread agreement that fuel prices are likely to increase over the long term as global energy demand increases in the face of finite oil supplies that are becoming more expensive to extract. Some economists predict that the development of renewable sources of energy, pressures to combat global climate change, the widespread use of electric cars, and other trends will eventually result in a decline in the demand for oil and resulting downward pressure on fuel prices.
Aviation fuel prices will continue to affect airfares, passenger numbers, airline profitability, and the ability of airlines to provide service. Airline operating economics will also be affected as regulatory costs are imposed on the airline industry as part of efforts to reduce aircraft emissions contributing to climate change.
2.4.6 Aviation Safety and Security Concerns
Concerns about the safety of airline travel and the effectiveness of security precautions influence passenger travel behavior and airline travel demand. Anxieties about the safety of flying and the inconveniences and delays associated with security screening procedures lead to both the avoidance of travel and the switching from air to surface modes of transportation for short trips.
Safety concerns in the aftermath of the September 2001 terrorist attacks were largely responsible for the steep decline in airline travel nationwide in 2002. Since 2001, government agencies, airlines, and airport operators have upgraded security measures to guard against changing threats and maintain confidence in the safety of airline travel. These measures include strengthened aircraft cockpit doors, changed flight crew procedures, increased presence of armed federal air marshals, federalization of airport security functions under the Transportation Security Administration (TSA), more effective dissemination of information about threats, more intensive screening of passengers and baggage, and deployment of new screening technologies. The TSA has introduced “pre-check” service to expedite the screening of passengers who have submitted to background checks.
Following the fatal crashes of B 737 MAX aircraft that are suspected to have been caused by the malfunction of the aircraft’s automated flight control system, all B 737 MAX aircraft were grounded in March 2019. Among North American airlines, Air Canada, American, Southwest, and United are being affected. At the time of the grounding, B 737 MAX aircraft accounted for approximately 1.5% of U.S. airline seat capacity. As of February 2019, B 737 MAX aircraft accounted for 8.9% of seat capacity at MIA. Flights cancellations at MIA were short-lived, however, and American has since adjusted its aircraft deployment nationwide to re-accommodate travel demand. It is expected that the grounding will last several months while the flight control system software is updated and approved by the FAA and pilot training is completed.
Historically, airline travel demand has recovered after temporary decreases stemming from terrorist attacks or threats, hijackings, aircraft crashes, and other aviation safety concerns. Provided there are no major events and precautions by government agencies, airlines, and airport operators serve to maintain confidence in the safety of commercial aviation, without imposing unacceptable inconveniences for airline travelers, future demand for airline travel will depend primarily on economic, not safety or security, factors.

A-93
2.4.7 Capacity of the National Air Traffic Control System
Demands on the national air traffic control system have, in the past, caused delays and operational restrictions affecting airline schedules and passenger traffic. The FAA is gradually implementing its Next Generation Air Transportation System (NextGen) air traffic management programs to modernize and automate the guidance and communications equipment of the air traffic control system and enhance the use of airspace and runways through improved air navigation aids and procedures. Since 2007, airline traffic delays nationwide have decreased because of reduced numbers of aircraft operations (down approximately 15% between 2007 and 2018) but, as airline travel increases in the future, flight delays and restrictions can be expected.
2.4.8 Capacity of the Airport
In addition to any future constraints that may be imposed by the capacity of the national air traffic control and airport systems, future growth in airline traffic at MIA will depend on the capacity of the Airport itself. MIA’s airfield and terminal capacity are expected to be sufficient to accommodate future growth in airline traffic at the Airport over the forecast period (through FY 2025).
2.4.9 Operating Efficiencies for American Airlines
American, based on its share of activity at MIA, pays more in airline charges at the Airport than all other airlines combined. At the same time, American achieves substantial operating benefits from the North Terminal. These benefits are achieved through more cost-efficient passenger and baggage throughput, reduced connection times, and reduced aircraft taxiing times, which produce operational savings through reduced crew time and fuel burn. While MIA has higher airport charges than many other U.S. airports, the value of these benefits helps to offset the charges and improve American’s profitability at the Airport, particularly given the higher yields commanded on Latin American routes.
2.5 AIRLINE TRAFFIC FORECASTS
Forecasts of airline traffic at MIA through FY 2025 were developed based on the economic outlook for the Region, the nation, and MIA’s key international markets; trends in historical airline traffic; and key factors likely to affect future traffic, all as discussed earlier in this Report. Forecasts for MIA included in the FAA's Terminal Area Forecast (TAF), issued in January 2018, were also reviewed.
In developing the forecasts in this Report, it was assumed that, over the long term, airline traffic at MIA will increase as a function of growth in the economy of the Region and continued airline service. It was assumed that airline service at MIA will not be constrained by the availability of aviation fuel, the capacity of the air traffic control system or the Airport, charges for the use of aviation facilities, or government policies or actions that restrict growth.
2.5.1 Airline Traffic Forecast Assumptions
The traffic forecasts for MIA were developed based on the assumptions that:
1. The economies of the nation, the Region, and MIA’s key international markets will grow as described in the earlier section “Demand for Passenger and Cargo Service.”
2. Demand for passenger travel to and from South Florida will remain strong based on the diversity of the local economy, the area’s economic and cultural linkages with LAC countries, and the area’s attractiveness as a tourist destination.

A-94
3. The Airport will continue to be the primary gateway to Latin America and the Caribbean in American’s system, and the percentage of passengers connecting at the Airport will not materially change.
4. American, from its operation at MIA, will continue to compete with airlines serving the Caribbean, Central America, and South America from competing U.S. gateway airports.
5. While airfares paid at MIA are expected to increase over time, competition among the airlines serving MIA and the prominent LCC presence at neighboring FLL will serve to maintain downward pressure on airfares.
6. There will be no physical constraints on growth at FLL during the forecast period.
7. A generally stable international political environment and safety and security precautions will ensure airline traveler confidence in aviation without imposing unreasonable inconveniences.
8. There will be no major disruption of airline service or airline travel behavior due to international hostilities, terrorist acts or threats, or government policies restricting or deterring travel.
9. Reduced airline seat capacity caused by the grounding of B 737 MAX aircraft will be temporary and not have a material effect on forecast numbers of enplaned passengers at MIA.
2.5.2 Passenger Forecast Summary
In the first 5 months of FY 2019, the number of enplaned passengers at MIA increased 3.0%, as compared to the same period of the previous year. Advance schedule filings by the airlines (which are subject to change) indicate a 2.4% increase in the number of departing seats at MIA between the first 9 months of FY 2018 and the first 9 months of FY 2019 (compared with an estimated nationwide increase of 4.0%). Based on actual passenger results in the first 5 months of FY 2019, advance airline schedules and projected trends in airline capacity, passenger load factors, and flight completion factors, the number of enplaned passengers at MIA is forecast to be 22.7 million in FY 2019, up 2.3% from the number enplaned in FY 2018.
Between FY 2019 and FY 2025, the number of enplaned passengers is forecast to increase 350,000 enplaned passengers per year, in line with historical trends, which equates to an average growth rate of 1.5%. This is lower than the average rate forecast by the FAA for MIA in the TAF (2.1% per year). A higher rate of growth is not unusual in passenger forecasts prepared for purposes of facility and operational planning, such as the TAF, compared with forecasts such as the one presented herein, prepared for purposes of financial planning.
The number of enplaned passengers at MIA is forecast to be 24.8 million in FY 2025, an increase of 11.7% from FY 2018. Connecting passengers are forecast to account for a slightly smaller share of enplaned passengers in FY 2025 (30.6%) than as estimated for FY 2018 (31.6%). Figure 18 presents the forecast of enplaned passengers graphically. Table 35 presents historical and forecast enplaned passengers at MIA by originating and connecting components and provides domestic and international subtotals.

A-95
Landed Weight Forecast
Table 36 shows that approximately 37.5 billion pounds of aircraft landed weight were reported by the airlines operating at MIA in FY 2018. Between FY 2018 and FY 2025, aircraft landed weight is forecast to increase at a 1.4% average annual growth rate, somewhat lower than the 1.6% average annual rate of growth forecast for total enplaned passengers.
Figure 18
Enplaned Passenger Forecast Miami International Airport
(Fiscal Years)
This forecast was prepared on the basis of the information and assumptions given in the text. The achievement of any forecast is dependent upon the occurrence of future events, which cannot be assured. Therefore, the actual results may vary from the forecast, and the variance could be material.
Sources: Actual—Miami-Dade County Aviation Department. Forecast—LeighFisher, February 2019.

A-96
Table 35
Enplaned Passenger Forecast Miami International Airport
(Fiscal Years; passengers in thousands)
This forecast was prepared on the basis of the information and assumptions given in the text. The achievement of any forecast is dependent upon the occurrence of future events, which cannot be assured. Therefore, the actual results may vary from the forecast, and the variance could be material.
Notes: Rows may not add to totals shown because of rounding. Percentages were calculated using unrounded numbers.
(a) Includes domestic originating passengers, international originating passengers who boarded domestic flights at Miami bound for international destinations via other U.S. gateway airports, passengers on nonscheduled (charter) flights, and nonrevenue passengers.
(b) Includes international originating passengers on scheduled flights, along with small numbers of passengers on nonscheduled flights, nonrevenue passengers, and international-to international connections on foreign flag airlines.
Sources: Actual—Miami-Dade County Aviation Department; U.S. DOT, Air Passenger Origin-Destination Survey, reconciled to Schedule T100. Forecast—LeighFisher, February 2019.
Passengers enplaned onDomestic flights International flights All flights
Fiscal Year Originating (a) Connecting Total Originating (b) Connecting Total Originating Connecting TotalActual2016 7,784 4,000 11,784 6,702 3,668 10,370 14,485 7,668 22,1542017 7,613 3,520 11,133 7,107 3,363 10,470 14,720 6,883 21,6032018 8,090 3,482 11,571 7,113 3,536 10,649 15,203 7,018 22,220
Forecast2019 8,190 3,510 11,700 7,440 3,585 11,025 15,630 7,095 22,7252020 8,295 3,555 11,850 7,600 3,625 11,225 15,895 7,180 23,0752021 8,400 3,600 12,000 7,760 3,665 11,425 16,160 7,265 23,4252022 8,505 3,645 12,150 7,920 3,705 11,625 16,425 7,350 23,7752023 8,610 3,690 12,300 8,080 3,745 11,825 16,690 7,435 24,1252024 8,715 3,735 12,450 8,240 3,785 12,025 16,955 7,520 24,4752025 8,820 3,780 12,600 8,400 3,825 12,225 17,220 7,605 24,825
Average annual percent increase (decrease)Actual2016-2017 (2.2%) (12.0%) (5.5%) 6.1% (8.3%) 1.0% 1.6% (10.2%) (2.5%)2017-2018 6.3 (1.1) 3.9 0.1 5.2 1.7 3.3 2.0 2.9
Forecast2018-2019 1.2% 0.8% 1.1% 4.6% 1.4% 3.5% 2.8% 1.1% 2.3%2019-2025 1.2 1.2 1.2 2.0 1.1 1.7 1.6 1.2 1.52018-2025 1.2 1.2 1.2 2.4 1.1 2.0 1.8 1.2 1.6

A-97
Table 36
Forecasts of Departing Seats, Flight Operations, and Aircraft Landed Weight Miami International Airport
(Fiscal Years)
This forecast was prepared on the basis of the information and assumptions given in the text. The achievement of any forecast is dependent upon the occurrence of future events, which cannot be assured. Therefore, the actual results may vary from the forecast, and the variance could be material.
Note: A=Actual; F=Forecast.
Sources: Actual—Miami-Dade County Aviation Department. Forecast—LeighFisher, February 2019.
Avg. landed weight Total landed weightEnplaned Load Departing Aircraft landings (pounds) (millions of pounds)
Fiscal Year passengers factor (a) seats Passenger All-cargo Total Passenger All-cargo Passenger All-cargo TotalActual2016 22,153,851 84.0% 26,369 168,922 37,728 206,650 182.5 188.2 30,825 7,101 37,9272017 21,602,794 84.0% 25,731 166,737 36,756 203,493 179.0 194.5 29,841 7,149 36,9902018 22,220,423 86.3% 25,740 169,868 37,871 207,739 175.7 201.0 29,846 7,611 37,457
Forecast2019 22,725,000 85.5% 26,577 174,100 38,000 212,100 177.8 201.5 30,956 7,656 38,6122020 23,075,000 85.8% 26,880 175,600 38,100 213,700 178.4 202.0 31,320 7,695 39,0152021 23,425,000 86.1% 27,211 177,200 38,200 215,400 178.9 202.5 31,709 7,734 39,4432022 23,775,000 86.3% 27,539 178,900 38,300 217,200 179.6 203.0 32,123 7,774 39,8972023 24,125,000 86.6% 27,866 180,400 38,400 218,800 180.2 203.5 32,501 7,813 40,3142024 24,475,000 86.8% 28,192 182,000 38,500 220,500 180.7 204.0 32,894 7,853 40,7472025 24,825,000 87.1% 28,515 183,600 38,600 222,200 181.3 204.5 33,288 7,892 41,180
Average annual percent increase (decrease)Actual2016-2017 (2.5%) (2.4%) (1.3%) (2.6%) (1.5%) (1.9%) 3.3% (3.2%) 0.7% (2.5%)2017-2018 2.9 0.0 1.9 3.0 2.1 (1.8) 3.3 0.0 6.5 1.3
Forecast2018-2019 2.3% 3.3% 2.5% 0.3% 2.1% 1.2% 0.3% 3.7% 0.6% 3.1%2019-2025 1.5 1.2 0.9 0.3 0.8 0.3 0.2 1.2 0.5 1.12018-2025 1.6 1.5 1.1 0.3 1.0 0.4 0.2 1.6 0.5 1.4

A-98
3. FINANCIAL ANALYSIS
The purpose of the financial analysis is to evaluate the ability of the Airport System to generate Net Revenues sufficient to satisfy the requirements of the Rate Covenant of the Trust Agreement, taking into account Outstanding Bonds, the proposed new money 2019 Bonds, and the anticipated 2020 Bonds. The analysis covers the forecast period through FY 2025. The financial data for FY 2017 and FY 2018 reflect actual operating results of the Airport System; data for FY 2019 reflects MDAD’s budget; and data for FY 2020 is forecast based on MDAD’s preliminary FY 2020 budget. Data for FY 2021 through FY 2025 were forecast taking into consideration historical operating results, the actual results for FY 2018, the budget for FY 2019, and the preliminary budget for FY 2020.
3.1 FRAMEWORK FOR FINANCIAL OPERATIONS
3.1.1 The Trust Agreement
The County issues Aviation Revenue Bonds pursuant to the terms and conditions set forth in the Trust Agreement between the County and the Trustee and Co-Trustee. Aviation Revenue Bonds are special, limited obligations of the County payable solely from and secured by the Net Revenues of the PAP. The faith and credit of the County are not pledged to the payment of the Bonds. Principal and Interest Requirements on Outstanding Bonds are payable from the Sinking Fund, to which the County has covenanted to deposit sufficient Net Revenues of the PAP after retention of an operating reserve. MDAD accounts for its operation on a cash basis for Trust Agreement purposes and on an accrual basis for financial reporting purposes.
3.1.2 Net Revenues
In the Trust Agreement, Net Revenues are defined as Revenues minus Current Expenses. Under the Trust Agreement, the term “Revenues” is defined as “all moneys received or earned by the County for the use of, and for the services and facilities furnished by, the Port Authority Properties and all other income derived by the County from the operation or ownership of said Properties….” Revenues include ground rent paid for land on which PAP and most NPAP are located. Revenues also include certain moneys remaining in the Improvement Fund at the end of a fiscal year that are transferred to the Revenue Fund in the subsequent fiscal year. Revenues do not include moneys received from federal or State grants, the sale of surplus property as permitted under the Trust Agreement, or PFC revenues, unless otherwise provided for by resolution of the Board. CFC revenues are also not included in the definition of Revenues.
The Trust Agreement defines “Current Expenses” to mean the reasonable and necessary current expenses of maintenance, repair, operation, and administration of the PAP, including reasonable payments to pension or retirement funds, insurance premiums, and taxes. Current Expenses do not include depreciation, reserves for extraordinary maintenance or repair, or deposits to the credit of the Sinking Fund, the Reserve Maintenance Fund, or the Improvement Fund.

A-99
3.1.3 Application of Revenues
The Trust Agreement provides that all Revenues of the PAP are to be deposited in the Revenue Fund to be held in trust by the Co-Trustee. Moneys in the Revenue Fund are to be applied as illustrated on Figure 19.
Deposits to the Improvement Fund are to be used to make payments subordinate to the requirements described above, after satisfying the requirements under the Trust Agreement. Under the landing fee rate-making methodology adopted by resolution of the Board and incorporated in the 2018 AUA, certain moneys remaining in the Improvement Fund, after satisfying the requirements under the Trust Agreement, the Ordinance (defined below) and the 2018 AUA, are to be transferred to the Revenue Fund in the succeeding fiscal year. The moneys transferred are considered Revenues in the succeeding fiscal year.
3.1.4 Rate Covenant
The County has covenanted in Section 501 of the Trust Agreement that it will, at all times, establish and collect rates and charges relating to PAP that will be sufficient to:
1. Provide adequate funds for the payment of Current Expenses.
2. Provide for making deposits to the Reserve Maintenance Fund in the amounts recommended by the Consulting Engineers.
3. Provide for (a) deposits to the Sinking Fund (other than the Reserve Account) that in each fiscal year will equal not less than 120% of the Principal and Interest Requirements due in that fiscal year and (b) deposits to the Reserve Account and payments to reimburse providers of Reserve Facilities.

A-100
Figure 19
Application of Port Authority Properties Revenues Under the Trust Agreement

A-101
3.1.5 Conditions for Issuing Additional Bonds
Outstanding Bonds constitute all debt obligations issued under the Trust Agreement that are currently in force (i.e., accruing principal and interest payments and not yet defeased or retired). Section 210 of the Trust Agreement requires, among other requirements, that before debt for new facilities or improvements can be issued on an equal standing with Outstanding Bonds, the additional Bonds must meet either a historical or a prospective earnings test:
� The historical earnings test requires a test period consisting of 12 consecutive calendar months during the 18 months immediately preceding the date of the certificate of indebtedness issued by the Aviation Director. During this test period, Net Revenues shall not be less than 120% of the maximum Principal and Interest Requirements in any fiscal year on all Outstanding Bonds and the additional Bonds then being issued. If the rates and charges established and charged for PAP are revised prior to the date of the certificate of indebtedness, the Net Revenues for the test period may be adjusted to reflect the amounts that would have been collected had the revised rates and charges been in effect throughout the entire test period.
� The prospective earnings test requires that the estimated Net Revenues for each of the 5 fiscal years immediately following either the date of the Statement of the Traffic Engineers or the last date on which interest is to be paid from the proceeds of the additional Bonds shall not be less than 120% of the Principal and Interest Requirements in each such fiscal year of all Outstanding Bonds and the additional Bonds then being issued.
Section 211 of the Trust Agreement provides for the issuance of Bonds to refund all or some of the series of Outstanding Bonds, provided that the total Principal and Interest Requirements of the refunding bonds during their term are less than the Principal and Interest Requirements during the term of the Outstanding Bonds that are being refunded. Alternatively, refunding Bonds may be issued by satisfying either the historical or prospective earnings test of Net Revenues under terms identical to those required to issue additional Bonds.
Under Section 212 of the Trust Agreement, the County may also issue Bonds to refund debt that was not issued under the Trust Agreement, the principal and interest payments of which are to be made from sources related to any airport or airport-related project if, among other things, the conditions of the prospective earnings test of Net Revenues, identical to that required for issuing additional Bonds, are met and the full amount then required for the Reserve Account is on deposit. Also, any airport or airport-related project or property that is not part of PAP may be added to PAP under Section 1308 of the Trust Agreement provided that Net Revenues, after deducting the average annual deposits to the Reserve Maintenance Fund for the projects or properties added to PAP, are no less than 120% of the Principal and Interest Requirements on all Outstanding Bonds in each of the 5 fiscal years following the inclusion of such property or project in PAP.

A-102
3.2 AIRLINE AGREEMENTS AND RELATED FEES
In addition to the Trust Agreement, the financial operation of PAP is governed by the agreements with the airlines and other tenants operating at the Airport.
3.2.1 Airline Use Agreement
The County recently entered into new, separate but substantially similar, agreements with the Signatory Airlines. The 2018 AUA incorporates the methodologies for calculating landing fees, terminal building rental rates, and aviation user fees, as established annually by the Board. The Signatory Airlines have agreed to pay landing fees for as long as they operate at the Airport or at any airport in the Airport System. The 2018 AUA became effective on August 10, 2018 and is scheduled to expire on April 30, 2033.
The 2018 AUA provides that the County, acting through the Board, has the right to calculate and collect a landing fee using a residual methodology for the Airport System, so that Revenues from Signatory Airline landing fees together with Revenues from other sources will, at all times, be sufficient to meet:
1. The requirements of the Rate Covenant, and
2. Certain other requirements, including funding of certain indebtedness payable from moneys in the Improvement Fund, including debt service related to the 2010 Double-Barreled Bonds.
Landing fee rates, under the terms of the 2018 AUA, are reviewed annually and appropriately adjusted effective October 1, and semi-annually adjusted effective April 1. Landing fees can also be adjusted at other times, as required, as a result of “emergency conditions” determined by the County in consultation with the airlines. The County reserves the right to modify the landing fee methodology from time to time, as well as all other applicable fees and charges established by the County or MDAD, in order to comply with its requirements under the Trust Agreement or under federal law, or as a result of a Board-approved modification resulting after consultation with the airlines serving MIA.
While the 2018 AUA is substantially similar to the prior AUA that had been in effect at the Airport for several years – in both cases reflecting an Airport System residual airline ratemaking methodology – there are some differences in the calculation methodology for certain individual fees and changes, as well as allowing the airlines to occupy gates on a preferential use basis subject to certain operational requirements. Key changes between the prior AUA and 2018 AUA are summarized in Table 37.
Additionally, FY 2019 and FY 2020 are transitional years from the prior methodology to the new methodology for calculating certain terminal building rentals and concourse use fees. During FY 2019, the same methodology as employed under the prior AUA continues in effect. The new methodology goes into full effect at the start of FY 2021 (i.e., on October 1, 2020). During FY 2020, certain changes are made to the previous methodology, but the new methodology is not fully in effect.

A-103
Specifically, for FY 2020, the allocated cost of space for the provision of federal inspection services is included in the international facilities fee and excluded from the concourse use fee. This is expected to result in a significant reduction in the concourse use fee and an increase in the international facilities fee in FY 2020.
In FY 2021, a new fee – the preferential gate use fee – is introduced and levied on airlines occupying gates on a preferential use basis. Airlines occupying common use gates will continue to pay a concourse use fee.
Table 37
Comparison of Key Provisions in the Prior AUA and the 2018 AUA
Source: Miami-Dade County Aviation Department.
Prior 2018AUA Provision AUA AUA Change from Prior AUA
Airline ratemaking methodology
Airport system residual landing fee calculation Airport system residual landing fee calculation No change
Rate covenant requirement
Landing fees are sufficient to meet Rate Covenant
Landing fees are sufficient to meet Rate Covenant
No change
Airline Majority-In-Interest (MII)
MII review and approval required All projects are deemed approved unless disapproved by MII vote. Requires only a disapproval review for the various approval levels, including a moratorium
Less restrictive than prior AUA
Gate utilization All gates are common use Preferential gate use based on certain operational requirements. All non-preferentially occupied gates continue to be common use
Preferential gate utilization is new
Base Concourse User Fee
Charge for use of common use gates to recover costs of holdroom and post-security circulation space on a per aircraft seat basis
Charge for common use gates on a per aircraft seat basis. Charges for preferential use gates are charged per square foot for holdroom space and a portion of post-security circulation space.
No change, except certain space costs are reallocated to the International Use Fee
International Facility Fee
Recover costs for equipment and services for FIS activities on a per international arriving seat basis
Recover costs for equipment, services and space for FIS activities on a per international arriving seat basis
Space costs of FIS occupied areas added to this fee, and deducted from the Concourse Use Fee
All other airline fees
Cost recovery of certain terminal areas and equipment (including baggage claim, outbound bag makeup and security screening) on a per arriving or departing aircraft seat basis
Cost recovery of certain terminal areas and equipment (including baggage claim, outbound bag makeup and security screening) on a per arriving or departing aircraft seat basis
No changes, except space costs for security screening area are added to the Security Screening Fee and deducted from the Common Use Fee

A-104
The 2018 AUA establishes procedures for a limited disapproval review of the Airport’s capital projects, and exempts certain categories of projects from airline review as follows: projects with costs (net of other funding sources such as grants, Reserve Maintenance Fund moneys, and PFC revenues) less than $15 million (expressed in 2018 dollars); projects financed by tenants or third parties; projects certified by the Consulting Engineers to be necessary under the Trust Agreement; projects to meet regulatory requirements or other specified objectives (e.g., to repair casualty damage or satisfy judgments); and overruns for projects within the CIP provided that such overruns do not exceed 20% of the originally approved cost of the project.
For projects that require MII disapproval review, certain steps are required to be undertaken by the airlines to disapprove those projects, and the specific requirements vary depending on whether the net project cost is greater than or less than $50 million (expressed in 2018 dollars). For projects less than $50 million, MDAD may proceed with that project after waiting at least 180 days and resubmit-ting it to the airlines. MDAD may also proceed with projects having net costs greater than $50 million, subject to certain steps which include County Board review, notwithstanding MII disapproval.
If MDAD’s annual projection of airline cost per enplaned passenger exceeds $35.00 in six or more of a 10-year projection period (expressed in 2018 dollars), then MDAD may not incur costs during the following fiscal year to design or construct capital projects, except by following certain procedures outlined in Article 6 of the 2018 AUA.
Where applicable, MDAD has already received airline MII approval of the CIP projects, as summarized in Section 1.3.
Terminal Building Lease Agreement
MDAD has also entered into separate but substantially similar Terminal Building Lease Agreements (TBLA) with various airlines (including American Airlines) providing for the general right of the Signatory Airlines to use and occupy space in the passenger terminal premises for a 5-year term, and the specific right to designated lease space as identified in that airline’s TBLA. Under the TBLA, the separate provisions for specific space are subject to cancellation by either party on 30-days’ notice.
Landing Fee Calculation
Landing fees for the Signatory Airlines are based on Revenue Requirements and Revenue Credits, both of which are accounted for on a cash basis. Revenue Requirements include:
1. Estimated Principal and Interest Requirements on bonds then outstanding and on bonds to be issued during the period of the fee calculation
2. A coverage margin calculated as 20% of the estimated Principal and Interest Requirements
3. Estimated Current Expenses
4. Estimated change in the operating reserve for Current Expenses, which is calculated as a percentage (not to exceed 20%) of estimated Current Expenses
5. Estimated deposit, if any, from Revenues to the bond Reserve Account required to meet the Reserve Account Requirement

A-105
6. Deposit to the Reserve Maintenance Fund in the amount recommended by the Consulting Engineers
7. Estimated debt service payable from Revenues on commercial paper then outstanding and on commercial paper to be issued during the period of the fee calculation, including amounts necessary to make hedge or termination payments
8. Estimated debt service and revenue covenant requirements payable from Revenues on other indebtedness (for example, subordinate debt, PFC-backed debt, or general obliga-tion bonds, including the 2010 Double-Barreled Bonds) then outstanding and on other indebtedness to be issued during the period of the fee calculation
9. Estimated deposits to funds and accounts payable from Revenues that may be required in connection with commercial paper or other indebtedness,
10. Costs of Aviation Development Facilities (ADF), if any, that may be payable from Revenues pursuant to a merger of ADF and PAP, net of ADF revenues related to such costs
The Revenue Requirement does not include depreciation costs, imputed interest, or the amortiza-tion of costs financed with moneys in the Aviation Capital Account.
The Revenue Credits to be received during the period of the fee calculation include revenues from all sources, including transfers from the Improvement Fund and Revenues from the Nonsignatory Landing Fee Differential, but exclusive of Revenues from landing fees and interest earnings on moneys in the Reserve Maintenance Fund and the Improvement Fund.
The aggregate landing fee requirement is calculated by subtracting the Revenue Credits from the Revenue Requirement. The landing fee is then established as three landing fees: the Signatory Landing Fee; the Nonsignatory Landing Fee (105% of the Signatory Landing Fee) for nonsignatory airlines that have complied with the County’s Aviation User Credit Program requirements (referred to as the Non-Signatory Differential); and a fee of 150% of the Signatory Landing Fee for airlines not complying with the County’s Aviation User Credit Program requirements (e.g., cash-paying airlines).
Under the landing fee methodology adopted by resolution of the Board and incorporated in the 2018 AUA, moneys remaining in the Improvement Fund are to be transferred to the Revenue Fund in the succeeding fiscal year, except for moneys in the Improvement Fund that are required to pay current indebtedness and moneys retained by MDAD in the subaccounts of the Aviation Capital Account.
� The resolution provides that MDAD can deposit $7.6 million per year into the Retainage Subaccount, subject to a cap of $22.8 million for the total amount on deposit therein, which amount is subject to annual adjustment for inflation.
� The resolution also provides that MDAD can deposit annually to the Performance Subaccount 50% of the Revenues that exceed break-even costs of the Cargo and Commercial Aviation Support Facilities.*
*The Cargo and Commercial Aviation Support Facilities are inventoried by MDAD in consultation with a MAAC
consultant, and include cargo building, aircraft maintenance hangars, ground service equipment buildings, and other buildings and associated parking areas.

A-106
The funds in the Retainage Subaccount and Performance Subaccount are available for any lawful airport purposes.
Calculation of Terminal Rents and User Fees
The 2018 AUA establishes that the County sets terminal rents and user fees using an equalized-rate methodology that was first adopted by the Board in 1990 (Resolution No. R-1054-90). Under this methodology, airlines pay the same rate for a category of terminal space, even though the space used by one airline may differ significantly from the same category of space used by another airline in terms of age, location, cost to construct, replacement value, undepreciated value, and other factors that may affect how the value of the space is perceived.
As previously noted, while the rate making approach in the 2018 AUA is similar to that included in the prior AUA, there are certain differences in the method used to calculate terminal building fees and charges in the 2018 AUA, as shown earlier in Table 37. Further, there is a two-year transition period during FY 2019 and FY 2020 before the new approach is fully in effect in FY 2021.
The terminal costs include Principal and Interest Requirements, coverage requirement, and Current Expenses, that are allocable to the Terminal Building. The terminal costs are offset by applicable credits and are divided by usable space to calculate the Class III terminal rental rate. The terminal rental rate is then applied to different types of occupied terminal space for the calculation of other terminal fees.
The terminal building-related fees in effect at the Airport under the 2018 AUA (to come fully into effect on October 1, 2020) and the activities on which they are based, including fees for Common-Use Terminal Equipment (CUTE), are summarized below.
Rents and Fees Basis
Preferential gate use fee Preferentially occupied gates Rental rates Rentable square footage Concourse use fee All departing, and domestic arriving, aircraft seats Domestic bag claim fee Domestic arriving aircraft seats Screening fee All departing aircraft seats International facilities fee International arriving aircraft seats Outbound baggage makeup fee All departing aircraft seats CUTE gate usage fee Departing aircraft seats for all airlines using CUTE gates
Terminal rents and user fees are set to recover a portion of the costs of operating the terminal, including: direct Current Expenses, allocated (indirect) Current Expenses, allocated Principal and Interest Requirements and coverage requirements, among others.
Terminal rents are assessed to the airlines for exclusive-use premises. Airlines are also charged a concourse use fee for common-use areas (e.g., holdrooms). Airlines with international arriving passengers are assessed an international facilities fee for the cost of special equipment and services, including international baggage claim equipment as well as (starting in FY 2020) the space cost of FIS facilities.

A-107
Additional terminal fees are assessed for the cost of security screening; domestic baggage claim, including the cost of the corresponding terminal space; and outbound baggage makeup facilities. All airlines using CUTE-equipped gates are assessed a fee to cover the costs of infrastructure to support CUTE at those gates. There are separate fees and charges associated with common user self-service (CUSS) kiosks, signage displays, and CUTE at ticket counters and back office locations.
3.2.2 Key Nonairline Agreements
Key leases and agreements related to nonairline and commercial revenues are described in Section 3.6.2 (“Commercial Revenues”).
3.3 THE PASSENGER FACILITY CHARGE PROGRAM
The federal PFC Program currently allows the collection of a PFC up to $4.50 per eligible enplaned passenger at commercial airports controlled by public agencies. Airport operators use PFC revenues to fund FAA-approved projects that enhance safety, security, or capacity; reduce noise; or increase air carrier competition. MDAD has used PFC revenues in two ways: to pay for eligible projects on a pay-as-you-go basis and to pay debt service on the eligible-projects portion of funded debt.
The FAA has approved the collection and use of $2.6 billion in PFC revenues, including interest, for projects at the Airport, over a collection period through 2037. As of December 31, 2018, MDAD had collected $1.45 billion of PFCs (including restricted interest income). The unspent PFC balance as of that date was $221.8 million.
MDAD expects to receive approval to use PFC revenues to pay $142.5 million of CIP costs on a pay-as-you-go basis, as described in Section 1.3, and on Exhibit C.
3.4 BOND ISSUANCE AND DEBT SERVICE
3.4.1 The Proposed 2019 Bonds and Anticipated 2020 Bonds
Exhibit A presents the sources and uses of the funds for the proposed new money 2019 Bonds, and the anticipated 2020 Bonds. Exhibit B presents the annual Principal and Interest Requirements for Outstanding Bonds, the proposed 2019 Bonds, and the anticipated 2020 Bonds. The majority of the proceeds of the proposed 2019 Bonds are to be used to pay for CIP costs (and the paydown of related commercial paper balances). In addition, the anticipated 2020 Bonds will be used to pay for costs of the CIP, as shown on Exhibit A and discussed earlier in Section 1.3.
The proposed new money 2019 Bonds are assumed to be issued as fixed-rate bonds with final maturity of 2049 and an estimated all-in true interest cost of 4.88%. The anticipated 2020 Bonds are assumed to be issued as fixed-rate bonds with a final maturity of 2050 and an estimated all-in true interest cost of 5.70%. In each case, these assumptions were provided by Hilltop Securities Inc., MDAD’s financial advisor.
MDAD is considering issuing additional Bond series in conjunction with the issuance of the 2019 Bonds to refund a portion of its currently outstanding Aviation Revenue Bonds. The potential debt service savings associated with such refundings, or other refundings that may occur during the forecast period, are not reflected in Exhibit B.

A-108
Principal and Interest Requirements exclude, among other amounts, funds set aside or deposited for the payment of debt service. For purposes of this Report, principal and interest expected to be paid from PFC revenues were excluded in computing Principal and Interest Requirements for the forecast period.
Debt service on the 2010 Double-Barreled Bonds does not constitute Principal and Interest Requirements under the Trust Agreement, although the related amount is included in the Revenue Requirement and recovered through airline rates and charge.
3.4.2 Debt Service Paid from PFC Revenues
Exhibit C presents historical and forecast PFC revenues. MDAD evaluates the amount of PFC revenues for eligible debt service on an annual basis. For the purpose of this Report, it was assumed that MDAD would use an annual amount of between $55 million and $91 million of PFC revenues to pay eligible debt service between FY 2019 and FY 2025. MDAD may choose to use a higher or lower amount than projected in this Report and will adjust airline rates and charges to ensure its compliance to the Rate Covenant.
Additionally, MDAD expects to apply approximately $142.5 million of PFC revenue to CIP project costs on a pay-as-you-go basis as noted earlier.
3.4.3 Other Debts Payable from Revenues
Other obligations payable from Revenues include the 2010 Double-Barreled Bonds and MDAD’s share of the FDOT Infrastructure Bank Loan which will be fully paid off by the end of FY 2019. Additionally, MDAD has obligations under certain lease/purchase agreements.
2010 Double-Barreled Bonds
In February 2010, the County issued the 2010 Double-Barreled Bonds on behalf of MDAD under Ordinance 86-75 enacted by the Board, as supplemented by Resolution 1346-09. The 2010 Double-Barreled Bonds constitute general obligations of the County secured by the full faith, credit, and taxing power of the County. Debt service payments on the 2010 Double-Barreled Bonds, which are approximately $15.4 million per year through FY 2041, are included as requirements under the residual rate-setting methodology of the 2018 AUA and are expected to be paid from airline rates and charges during the forecast period.
Florida Department of Transportation Infrastructure Bank Loan
This loan funded $50 million in capital costs for the NW 25th Street Viaduct project in 2007. MDAD has paid approximately $5 million per year from the Aviation Capital Account to reimburse the County. This loan will be fully paid off by the end of FY 2019.
Lease/Purchase Agreements
MDAD has entered into five different lease/purchase agreements with various parties related to the acquisition of certain equipment primarily related to utilities for use in Airport operations. Annual obligations under these agreements range between $2.4 million and $11.4 million, and they will fully expire in FY 2034.

A-109
3.5 CURRENT EXPENSES
Exhibit D presents historical and forecast Current Expenses by division and by category for FY 2017 through FY 2025. Data for FY 2017 and FY 2018 are actual Current Expenses. Data for FY 2019 are based on MDAD’s budget. Data for FY 2020 are based on MDAD’s preliminary FY 2020 budget. Current Expenses were forecast using FY 2020 as the base year. Current Expenses are forecast to increase by an average of 6.0% annually from FY 2018 to FY 2025.
Personnel expenses in FY 2019 are estimated to represent 28% of Current Expenses. Personnel expenses are forecast to increase at an average rate of 5.3% from FY 2018 to FY 2025, based on MDAD expectation of personnel salaries and benefits trends.
Outside contract services for FY 2019 are estimated to represent 40% of total Current Expenses. Expenses within this category include fire services, police expenses, external auditing services, external consulting services, architectural and engineering services for in-house projects, building maintenance, insurance, and general fund support charges. Outside contract services are forecast to increase at an average rate of 6.1% from FY 2018 to FY 2025, based on MDAD expectations.
Utilities expenses are estimated to represent 9.7% of total Current Expenses for FY 2019 and forecast to maintain a similar share over the forecast period.
Other expenses are estimated to represent 8.0% of total Current Expenses in FY 2019. Expenses in this category include insurance, telephone service, sales and use tax payments, gasoline purchases, and Trustee and Co-Trustee agent fees.
Capital outlays represent spending for maintenance to be funded from the Revenue Fund and are expensed rather than capitalized for airline rates and charges purposes. These expenses are estimated to represent less than 1.0% of total Current Expenses in FY 2019 and expected to represent a similar share during the forecast period.
Management agreement expenses are estimated to represent 14.5% of total Current Expenses in FY 2019. Management agreement expenses are forecast to increase at a rate of 5.4% per year through the forecast period.
3.6 REVENUES
The forecast of Revenues from all sources is shown in Exhibit E. Revenues include aviation fees, commercial revenues, rental revenues, general aviation airports revenues, and other revenues.
3.6.1 Aviation Fees
Aviation fees include landing fees, concourse use and international facilities fees, and equipment and aircraft parking fees (i.e., mostly activity-based fees) calculated under the 2018 AUA. Aviation fees also include the annual deposit from the Improvement Fund made from any residual balance resulting from the prior year in the Improvement Fund, which offsets the Revenue Requirement under the landing fee calculation. The Improvement Fund deposit reflects 20% coverage on the Principal and Interest Requirements of the prior fiscal year, interest earnings on certain funds excluded from the landing fee calculation, and any operating surplus or deficit from the prior fiscal year, after deducting annual deposits to the Aviation Capital Account in the prior fiscal year.
In FY 2018, aviation fees accounted for approximately 51% of Revenues, as shown in Table 38.

A-110
Table 38
FY 2018 Revenues (in millions)
Source: Miami-Dade County Aviation Department.
Landing Fees
Landing fees are calculated to recover the Revenue Requirement net of Revenue Credits. Total landing fee revenues include payments from cargo airlines. Exhibit E-1 shows the budgeted and forecast calculations of Signatory Airline landing fee rates through FY 2025.
In addition to Principal and Interest Requirements and 20% coverage and Current Expenses, the Revenue Requirement may also include the following, among other requirements:
� Operating Reserve. MDAD is required to maintain a balance in the Revenue Fund, designated as an operating reserve, equal to 20% of the estimated Current Expenses or a lesser amount as specified by the County. Historically, MDAD has maintained the operating reserve at a level specified by the County, which is approximately 17% of Current Expenses.
Amount Percent
Aviation fees Deposit from Improvement Fund 97.7$ 10.5% Landing fees 61.5 6.6% Concourse use fees 242.0 26.0% Equipment and aircraft parking fees 76.3 8.2% Total aviation fees 477.5$ 51.2%
Commercial revenues Duty free 26.2$ 2.8% Food and beverage 26.2 2.8% Public parking 44.0 4.7% Rental car 49.8 5.3% Retail/merchandise 21.0 2.3% Fuel farm 17.6 1.9% Passenger services 53.7 5.8% Transportation & operation support 35.1 3.8% Total commercial revenue 273.7$ 29.4%
Rental revenues Passenger terminal building rentals 71.3$ 7.7% Other rentals 67.9 7.3% Total rental revenues 139.2$ 14.9%
General airport revenues 8.6$ 0.9%Other revenues 32.9 3.5%
Total Revenues 931.8$ 100.0%

A-111
It was assumed that MDAD would maintain the operating reserve level at approximately the same ratio of Current Expenses through the forecast period.
� Reserve Account Deposit. The Revenue Requirements include estimated deposits, if any, from the Revenue Fund to the Reserve Account to meet the reserve requirement. It was assumed that no such deposits will be required to be made to the Reserve Account during the forecast period.
� Reserve Maintenance Fund Deposit. Section 503 of the Trust Agreement stipulates that, on or before July 1 of each year, the Consulting Engineers are to recommend amounts to be deposited to the Reserve Maintenance Fund. The Consulting Engineers have determined an annual range of future deposits to the Reserve Maintenance Fund for PAP. For purposes of this Report, it was assumed that the annual deposit will increase from $15 million in FY 2019 to $35 million in FY 2025.
� Deposit for the 2010 Double-Barreled Bonds. MDAD intends to make periodic deposits to the debt service account to pay debt service on the 2010 Double-Barreled Bonds. Annual debt service during the forecast period is approximately $15.4 million through FY 2041.
Concourse Use Fees, International Use Fees, and Equipment and Aircraft Parking Fees
The concourse use fees include the product of the terminal rental rate and the concourse space rental rate for domestic and international operations, as well as international facilities fees, preferential gate use fees, CUTE infrastructure fees, and CUTE gate fees (as summarized in Exhibit E-2). As discussed in Section 3.2.1, terminal rental rates are calculated to recover a portion of the costs allocable to the Terminal Building through passenger terminal building rentals and other terminal user fees.
Equipment and aircraft parking fees include domestic bag claim fees, screening fees, outbound baggage makeup fees, aircraft parking fees, and loading bridge fees. MDAD periodically adjusts the rate for aircraft parking and loading bridge uses and recalculates other rates annually under the 2018 AUA.
3.6.2 Commercial Revenues
Commercial revenues include revenues derived from duty free stores, food and beverage concessions, public parking, rental cars, merchandise, the fuel farm, passenger services, and transportation and operation support. The business terms applicable to each type of commercial revenues are governed by management or concession agreements. Revenues received pursuant to management agreements are gross revenues of MDAD with corresponding expenses reported as Current Expenses, while revenues received by MDAD under concession agreements are based on negotiated terms not related to the expenses to operate the facility. Several management and concession agreements are scheduled to expire during the forecast period, as further described below. For purposes of this Report, it was assumed that subsequent agreements would have similar terms as the existing ones.
Exhibit E includes forecast revenues to MDAD from commercial operations, including revenues earned under management and concession agreements. Commercial revenues are forecast to be driven by the forecast increase in numbers of enplaned passengers, and higher gross sales per enplaned passenger as a result of inflation, among other factors.

A-112
Duty Free
In December 2005, MDAD entered into a 10-year agreement with Duty Free Americas Miami, LLC (Duty Free Americas), extendable for two 1-year periods upon mutual agreement. Duty Free Americas currently operates 21 stores encompassing a total of 48,003 square feet of selling space. Under the agreement, Duty Free Americas is obligated to pay MDAD the higher of a percentage fee of gross sales or the sum of a minimum annual guarantee (MAG) plus terminal rent. The initial MAG was set at $20 million and is adjusted by the square footage of store space in operation and the growth rate in international enplaned passengers. The first amendment to the duty free contract excluded South Terminal store space from the MAG calculation during the first year of beneficial occupancy. The second and third amendments excluded Central Terminal store space from the MAG calculation through January 31, 2015. The fourth and fifth amendments extended the whole agreement until February 13, 2024. The percentage fee has a tiered structure ranging from 25% to 31% of gross sales.
In March 2018, MDAD entered into a separate agreement with Duty Free Americas Beauty LLC to provide a premium cosmetic concessions program at the Airport, with a term through September 2024 and with one two-year extension option.
For purposes of this Report, it was assumed that the overall average percentage fees received from the duty free agreement would continue through the forecast period.
Food and Beverage Concessions
Global Concessions and Host International, Inc., are the primary providers of food and beverage concessions at the Airport. The agreement with Global Concessions is scheduled to expire in FY 2019 (for its Central Terminal outlets), with the agreement related to its North Terminal outlets having been extended by amendment until February 13, 2024. The Central Terminal agreement with Host International expired on January 31, 2015, but is currently on holdover status until a new RFP process for services in the Central and South terminals has been concluded. Host also operates a separate group of 12 stores under its North Terminal agreement awarded in February 2010 and expiring in February 2024. Concessions Miami, LLC, and Areas USA, Inc., operate primarily from the South Terminal, with other smaller concessionaires located throughout the terminal complex.
Food and beverage revenues were forecast to be driven by changes in the numbers of enplaned passengers and allowances for inflation.
Public Parking
Public parking facilities at the Airport are operated by Airport Parking Associates Joint Venture, under a management agreement. As of February 2019, MDAD has 8,388 public parking spaces.
Off-Airport parking provided by third parties is available at several locations near the Airport. MDAD does not implement a privilege fee on off-Airport parking operators but does charge these operators a ground transportation fee or a per trip fee.

A-113
It was assumed that, during the forecast period:
� Existing parking space will remain available and additional space will be added if demands warrants
� The balance between on-Airport and off-Airport parking will be maintained
� Parking transactions per O&D passenger and duration per transaction will remain consistent with the ratios budgeted on a preliminary basis for FY 2020, and
� MDAD will not increase parking rates during the forecast period
Rental Cars
Rental car companies operating at MIA include Alamo Rent A Car, Avis Rent A Car System, Budget Rent A Car System, Dollar Rent A Car, Enterprise Rent-A-Car, Hertz Rent a Car, National Car Rental, Sixt, Thrifty Car Rental and other smaller operators. The rental car companies pay MDAD the higher of a privilege fee calculated as 10% of gross revenues (or 5% for disadvantaged business enterprises) or the MAG.
Two Airport facilities are related to rental car operations:
� The Rental Car Center was constructed by FDOT and the costs were financed by CFC collections and the Transportation Infrastructure Finance and Innovation Act of 1998 (TIFIA) loans granted by the U.S. DOT to FDOT. In November 2011, FDOT conveyed a fee-simple interest in the RCC to MDAD through a quitclaim deed. As the RCC was not constructed with funds provided under the Trust Agreement, it is not part of PAP, nor are the CFCs collected included in MDAD Revenues.
� The MIA Mover connects the RCC with the Airport terminals and is a part of PAP. Pursuant to a Memorandum of Understanding between the County and the rental car companies, 50% of the MIA Mover operating expenses in the first 5 years of operation was reimbursed using CFC revenues. Reimbursement beyond the first 5-year period is determined annually based on the number of riders using the MIA Mover to access the RCC. During FY 2018, CFCs contributed 73.1% to the payment of MIA Mover operating expenses. For purposes of this Report, it was assumed that 50% of the MIA Mover operating expenses (50% of approximately $4.0 million annually) will be reimbursed using CFC revenues through the forecast period.
Rental car revenues were forecast to be driven by changes in the numbers of O&D passengers. Recovery of 50% of the MIA Mover’s operating expenses is classified as other revenues.
Transportation Network Companies (TNCs)
On May 26, 2016, a TNC operator using the trade name Lyft received a license from MDAD to operate at the Airport. On July 11, 2016, a second TNC operator using the trade name Uber received a similar license to operate at the Airport. These licenses have been extended on a month-to-month basis by MDAD since then. In both cases MDAD levies a per-trip fee of $2.00 per TNC passenger pickup at the Airport. There is currently no drop off fee.

A-114
The introduction of TNC activities at the Airport has led to declines in the revenues that MDAD receives from other ground transportation activities at the Airport (including parking, rental car, and taxi). Such declines have been offset to a certain extent by revenues received from the TNC operators. Table 39 shows the trends in MDAD revenues and revenues per originating enplaned passenger from FY 2016 through FY 2018, and on a budgeted basis for FY 2019 and FY 2020. FY 2016 figures reflect a partial year of TNC activity at the Airport (from July to September 2016).
Table 39
Ground Transportation Revenue Trends (in thousands, except ratios)
Note: Revenues shown are amounts received by MDAD. Figures in this table may not
tie to amounts shown in Exhibit E because certain categories are grouped differently.
(a) Including taxi lot revenues. (b) TNC revenues for FY 2016 reflect a partial year of activity (July to September 2016). (c) Other revenues include employee parking, ground transportation permits, and other
miscellaneous items.
Source for revenue information: MDAD.
PreliminaryActual Actual Actual Budget budget
FY 2016 FY 2017 FY 2018 FY 2019 FY 2020
Ground transportation revenuesParking (a) 50,748$ 47,351$ 46,113$ 48,392$ 45,407$ Rental cars 51,823 50,739 49,835 50,853 49,050TNCs (b) 510 3,104 4,010 3,456 4,186Other (c) 9,491 9,668 10,460 9,438 11,552
112,572$ 110,861$ 110,418$ 112,139$ 110,196$
O&D enplaned passengers 14,485 14,720 15,150 15,575 15,840
Ground transportation revenuesper O&D enplanement
Parking 3.50$ 3.22$ 3.04$ 3.11$ 2.87$ Rental cars 3.58 3.45 3.29 3.27 3.10 TNCs 0.04 0.21 0.26 0.22 0.26 Other 0.66 0.66 0.69 0.61 0.73
7.77$ 7.53$ 7.29$ 7.20$ 6.96$

A-115
Merchandise
Several concessionaires operate merchandise operation throughout the terminal complex, including Westfield Concessions Management and HMS Host, among others. Non-duty free retail activities encompass approximately 111,000 square feet of space.
General merchandise revenues were forecast to be driven by the changes in the numbers of enplaned passengers and allowances for inflation.
Fuel Farm
The fuel farm is operated under a management agreement with Allied Aviation Services. Under the terms of the management agreement, MDAD receives total gross revenues and pays operating expenses plus a management fee. Revenues and expenses in this category also reflect the operation of the midfield fueling facility, which offers automobile gas and diesel fuel for several MIA tenants. Fuel farm revenues were forecast to recover operating expenses as well as amortization of historical capital investment.
Passenger Services
Passenger services include revenues from catering, hotel, restaurant, and miscellaneous concessions offering goods and services to passengers. Passenger services revenues were forecast to be driven by changes in the numbers of enplaned passengers, and allowances for inflation for hotel and restaurant operations.
Transportation and Operation Support
Transportation and operation support revenues include revenues from general aeronautical services, employee parking, ground transportation, and miscellaneous concession operations. Revenues in this category were forecast to be driven by changes in airline traffic.
3.6.3 Rental Revenues
Rental revenues include passenger terminal rents, ground rents, utilities reimbursements, and other rents primarily from cargo facilities, maintenance facilities, and support buildings. Passenger termi-nal rental rates were calculated using the methodology described in Section 3.2.4 and were forecast to increase with increases in Current Expenses and the Principal and Interest Requirements on Bonds.
Rental rates from ground leases, as well as maintenance and cargo buildings, which are based on annual appraisals, are forecast to increase an average of 3.8% per year from FY 2018 to FY 2025. Utilities reimbursements are forecast to increase, based on utility expenses growth rates.
3.6.4 General Aviation Airports Revenues
General aviation airports revenues include revenues from the general aviation airports and from Dade-Collier Training and Transition Airport. General aviation airports revenues are forecast to increase by an average of 3.8% per year from FY 2018 to FY 2025.
3.6.5 Other Revenues
Other revenues include applicable interest earnings, delinquency charges, sales taxes, nonrecurring operating grant revenues, reimbursements for other capital items paid with operating revenues, and other nonoperating revenues.

A-116
3.7 PASSENGER AIRLINE PAYMENTS
Exhibit E-3 shows the calculation of historical and forecast passenger airline payments per enplaned passenger, including landing fees, concourse and international use fees, equipment and parking fees, and passenger terminal building rentals paid to MDAD for the use and occupancy of PAP facili-ties. Revenues from airline rentals, fees, and charges are forecast to increase in the future to meet the requirements of the Rate Covenant. The calculation of passenger airline payments excludes landing fees paid by cargo airlines, which accounted for approximately 20% of total landing fees collected at the Airport in FY 2018. It was assumed that cargo airline landing fees will account for a similar share of total landing fees throughout the forecast period.
3.8 APPLICATION OF REVENUES
The estimated and forecast application of Revenues is shown in Exhibit F. After making the deposits as illustrated in steps 1 through 6 on Figure 19, remaining Revenues are to be deposited to the Improvement Fund and can be used for any airport or airport-related purpose, including the payment of current indebtedness payable from the Improvement Fund and for deposits to the Aviation Capital Account.
MDAD has indicated that the following items are to be paid from the Improvement Fund, ordered by priority:
� Commercial Paper Interest. Payment for commercial paper interest has the first claim on the deposit to the Improvement Fund. There is no commercial paper outstanding as of the date of this Report. MDAD may use commercial paper as a financing instrument in the future, but there are no specific plans or assumptions to be used in connection with this Report.
� Debt Service on the 2010 Double-Barreled Bonds. MDAD intends to make periodic deposits to the Improvement Fund to pay debt service on the 2010 Double-Barreled Bonds.
� Debt Service Related to the County’s Share of FDOT Infrastructure Bank Loan. This loan funded $50 million in capital costs for the NW 25th Street Viaduct project in 2007. MDAD intends to earmark approximately $5 million per year from the Aviation Capital Account to reimburse the County through the end of FY 2019.
� Deposit to Retainage Subaccount in the Aviation Capital Account. According to the 2018 AUA, the annual deposit to the Retainage Subaccount is $7.6 million, adjusted for inflation, assumed at 2.0% per year through the forecast period for financial analysis purposes. The FY 2019 deposit is estimated to be $7.7 million.
� Deposit to Performance Subaccount in the Aviation Capital Account. The deposit to the Performance Subaccount is calculated as 50% of the revenues that exceed breakeven costs in the Cargo and Commercial Aviation Support Facilities cost center. For purposes of this analysis, it was assumed there would be no deposit to the Performance Subaccount during the forecast period.

A-117
3.9 RATE COVENANT COMPLIANCE AND DEBT SERVICE COVERAGE
Exhibit G presents the Rate Covenant compliance test and the calculation of debt service coverage under Section 501 of the Trust Agreement, taking into consideration the repayment obligations for the Outstanding Bonds and the proposed 2019 Bonds, as well as the anticipated 2020 Bonds to be issued to fund the CIP.
In each year of the forecast period, debt service coverage is forecast to be higher than the required 1.20 coverage ratio. This conclusion assumes that the Signatory Airlines will collectively pay all amounts required under the residual cost rate-setting methodology of the 2018 AUA.
Exhibit H summarizes the estimated and forecast financial results as presented in Exhibits A through G.

Exhibit A
SOURCES AND USES OF FUNDSMiami-Dade County Aviation Department
(dollars in thousands)
This exhibit is based on information from the sources indicated and assumptions provided by, or reviewed with andapproved by, MDAD management, as described in the accompanying text. Inevitably, some of the assumptions
used to develop the forecasts will not be realized and unanticipated events and circumstances could occur. Therefore, the actual results will vary from those forecast, and the variations could be material.
ProposedNew Money Anticipated2019 Bonds 2020 Bonds Total
Sources of FundsPar Amount 282,180$ 552,130$ 834,310$Premium 15,745 39,532 55,276
Total Sources of Funds 297,925$ 591,662$ 889,586$
Uses of FundsCP Repayment / Project Deposit (a) 274,547$ 541,986$ 816,533$Capitalized Interest Fund 13,332 31,497 44,830Debt Service Reserve Fund 7,294 12,793 20,087Cost of Issuance 1,270 2,486 3,756Underwriter's Discount 1,481 2,899 4,380
Total Uses of Funds 297,925$ 591,662$ 889,586$
(a) The $274.5 million shown for CP Repayment/Project Deposit for the 2019 Bonds reflects the paydown of all CPbalances at the time the 2019 Bonds transaction closes. The remainder will be used to directly fund CIP project costs.As of March 15, 2019, the outstanding balance of the CP Notes was $160 million.
Source: Hilltop Securities Inc., February 2019.
A-118

Exhibit B
PRINCIPAL AND INTEREST REQUIREMENTSMiami-Dade County Aviation DepartmentFor Fiscal Years Ending September 30
(dollars in thousands)
This exhibit is based on information from the sources indicated and assumptions provided by, or reviewed with and approved by, MDAD management,as described in the accompanying text. Inevitably, some of the assumptions used to develop the forecasts will not be realized and unanticipated events
and circumstances could occur. Therefore, the actual results will vary from those forecast, and the variations could be material.
Historical Estimated Estimated Forecast2017 2018 2019 2020 2021 2022 2023 2024 2025
Principal and Interest RequirementsPrior Issues through 2009 104,623$ 38,029$ 15,961$ 15,964$ 15,960$ 10,502$ 2$ 2$ 2$2010A 31,210 32,444 23,763 23,763 23,764 23,763 23,765 23,760 19,3162010B 39,998 35,457 34,292 34,270 34,249 34,231 34,210 34,130 34,0762012A 56,740 44,533 44,535 44,537 56,673 60,483 60,486 60,478 40,6252012B 8,653 6,274 6,271 6,272 6,277 9,078 14,516 14,522 14,5212014 20,244 23,238 23,246 23,248 23,245 23,245 15,168 15,165 13,0232014A 32,512 32,513 32,516 32,516 28,999 28,999 28,999 28,999 30,1042014B 9,186 9,187 9,189 9,189 7,740 7,740 7,740 7,740 30,3602015A 37,595 37,598 37,602 37,600 26,475 22,266 22,269 22,268 24,8082015B 1,925 1,925 1,925 1,925 1,925 1,925 1,925 1,925 5,2852016A 15,787 15,787 15,787 15,787 15,787 21,832 29,874 19,740 25,7862016B 17,698 17,696 17,696 17,696 45,239 41,646 47,209 57,428 46,1252017A 3,029 5,832 5,832 5,832 5,832 5,832 5,832 5,832 5,8322017B - 42,720 42,721 42,716 15,177 15,177 15,177 15,177 15,1772017D - 13,280 13,279 23,928 23,984 24,006 11,550 11,547 11,5502018A - 76 10,803 492 492 492 492 492 4922018B - 17 1,620 1,493 1,475 - - - - 2018C - 2,721 34,773 34,775 34,770 34,773 45,253 45,257 45,252
Outstanding Bonds 379,200$ 359,326$ 371,810$ 372,002$ 368,060$ 365,990$ 364,466$ 364,460$ 362,333$Proposed New Money 2019 Bonds - - - 7,294 14,589 14,589 14,589 14,589 14,589Anticipated 2020 Bonds - - - - - 34,465 43,360 43,367 45,496
Gross Debt Service 379,200$ 359,326$ 371,810$ 379,296$ 382,649$ 415,044$ 422,414$ 422,416$ 422,417$Less: PFC deposits (64,000) (58,000) (55,000) (82,000) (85,000) (88,000) (89,000) (90,000) (91,000)
Net Principal and Interest Requirements 315,200$ 301,326$ 316,810$ 297,296$ 297,649$ 327,044$ 333,414$ 332,416$ 331,417$
Source: Miami-Dade County Aviation Department and Hilltop Securities Inc., February 2019.
A-119

Exhibit C
HISTORICAL AND FORECAST PFC REVENUESMiami-Dade County Aviation DepartmentFor Fiscal Years Ending September 30
(dollars in thousands except PFC amount)
This exhibit is based on information from the sources indicated and assumptions provided by, or reviewed with and approved by, MDAD management,as described in the accompanying text. Inevitably, some of the assumptions used to develop the forecasts will not be realized and unanticipated events
and circumstances could occur. Therefore, the actual results will vary from those forecast, and the variations could be material.
Historical Estimated Estimated Forecast2017 2018 2019 2020 2021 2022 2023 2024 2025
PFC CollectionsEnplaned passengers 21,603 22,220 22,725 23,075 23,425 23,775 24,125 24,475 24,825
Percent PFC-eligible 83.8% 84.1% 83.9% 83.9% 83.9% 83.9% 83.9% 83.9% 83.9%PFC-eligible enplaned passengers 18,110 18,695 19,064 19,358 19,652 19,945 20,239 20,533 20,826
PFC amount (a) 4.39$ 4.39$ 4.39$ 4.39$ 4.39$ 4.39$ 4.39$ 4.39$ 4.39$PFC collections (excluding interest) 79,504$ 82,070$ 83,693$ 84,982$ 86,271$ 87,560$ 88,849$ 90,138$ 91,427$
PFC FundPFC Fund beginning balance 254,366$ 283,477$ 243,350$ 198,517$ 164,645$ 146,364$ 146,949$
Less: Debt service paid with PFCs (55,000) (82,000) (85,000) (88,000) (89,000) (90,000) (91,000)Less: Future PFC pay-as-you-go - (43,530) (46,533) (33,866) (18,571) - -
Subtotal 199,366$ 157,947$ 111,817$ 76,651$ 57,074$ 56,364$ 55,949$PFC collections (excluding interest) 83,693 84,982 86,271 87,560 88,849 90,138 91,427PFC Fund interest income 418 422 428 435 441 447 454
PFC Fund ending balance 283,477$ 243,350$ 198,517$ 164,645$ 146,364$ 146,949$ 147,830$
(a) Net of $0.11 PFC airline collection fee.Source: Miami-Dade County Aviation Department for historical data.
A-120

Exhibit D
CURRENT EXPENSESMiami-Dade County Aviation DepartmentFor Fiscal Years Ending September 30
(dollars in thousands)
This exhibit is based on information from the sources indicated and assumptions provided by, or reviewed with and approved by, MDAD management,as described in the accompanying text. Inevitably, some of the assumptions used to develop the forecasts will not be realized and unanticipated events
and circumstances could occur. Therefore, the actual results will vary from those forecast, and the variations could be material.
Historical Budget Budget (a) Forecast2017 2018 2019 2020 2021 2022 2023 2024 2025
Current Expenses by divisionOperations:
Airside operations 9,332$ 10,059$ 11,381$ 12,008$ 12,548$ 13,113$ 13,703$ 14,319$ 14,964$Terminal operations 13,827 14,085 15,768 15,723 16,431 17,170 17,943 18,750 19,594Landside operations 12,365 12,427 13,722 14,027 14,658 15,317 16,007 16,727 17,480
Administrative 49,553 51,657 64,454 65,453 68,398 71,476 74,693 78,054 81,566Police 33,005 33,948 36,321 37,428 39,112 40,873 42,712 44,634 46,642Safety 13,310 16,790 20,413 20,692 21,623 22,596 23,613 24,675 25,786Fire rescue 27,016 27,218 30,274 32,773 34,248 35,789 37,400 39,083 40,841Maintenance 108,434 114,816 124,835 141,889 148,274 154,947 161,919 169,206 176,820Planning and development 6,200 11,211 13,168 15,046 15,723 16,431 17,170 17,943 18,750Information systems and tech support 37,090 36,233 38,514 38,255 39,977 41,776 43,655 45,620 47,673Environmental engineering 7,144 6,704 8,876 10,347 10,812 11,299 11,807 12,339 12,894Non-departmental O&M/utilities 48,338 50,434 61,616 63,433 66,287 69,270 72,387 75,644 79,048General aviation airports 2,482 2,470 2,907 3,064 3,202 3,346 3,497 3,654 3,818
Subtotal 368,097$ 388,053$ 442,250$ 470,137$ 491,294$ 513,402$ 536,505$ 560,648$ 585,877$Operating management agreements 40,155 42,969 46,006 47,231 49,357 51,578 53,899 56,324 58,859Commercial management agreements 21,722 23,849 28,701 30,463 31,834 33,266 34,763 36,328 37,962
Current Expenses 429,974$ 454,871$ 516,957$ 547,832$ 572,484$ 598,246$ 625,167$ 653,299$ 682,698$
Current Expenses by typeSalary and benefits 125,415$ 129,990$ 142,845$ 149,932$ 156,679$ 163,730$ 171,098$ 178,797$ 186,843$Outside contract services (b) 171,785 182,958 204,844 221,952 231,940 242,377 253,284 264,682 276,593Utilities 47,541 48,717 50,372 50,887 53,176 55,569 58,070 60,683 63,414Other 20,031 23,600 41,126 44,110 46,095 48,169 50,337 52,602 54,969Capital outlay 3,324 2,788 3,063 3,256 3,403 3,556 3,716 3,883 4,058
Subtotal 368,097$ 388,053$ 442,250$ 470,137$ 491,294$ 513,402$ 536,505$ 560,648$ 585,877$Management agreements 61,877 66,818 74,707 77,694 81,190 84,844 88,662 92,652 96,821
Current Expenses 429,974$ 454,871$ 516,957$ 547,832$ 572,484$ 598,246$ 625,167$ 653,299$ 682,698$Annual percent change 3.5% 5.8% 13.6% 6.0% 4.5% 4.5% 4.5% 4.5% 4.5%
(a) FY 2020 Budget is preliminary and subject to change.(b) Includes Insurance, MOU, and Charge for County Services.Source: Miami-Dade County Aviation Department for historical and budgeted data.
A-121
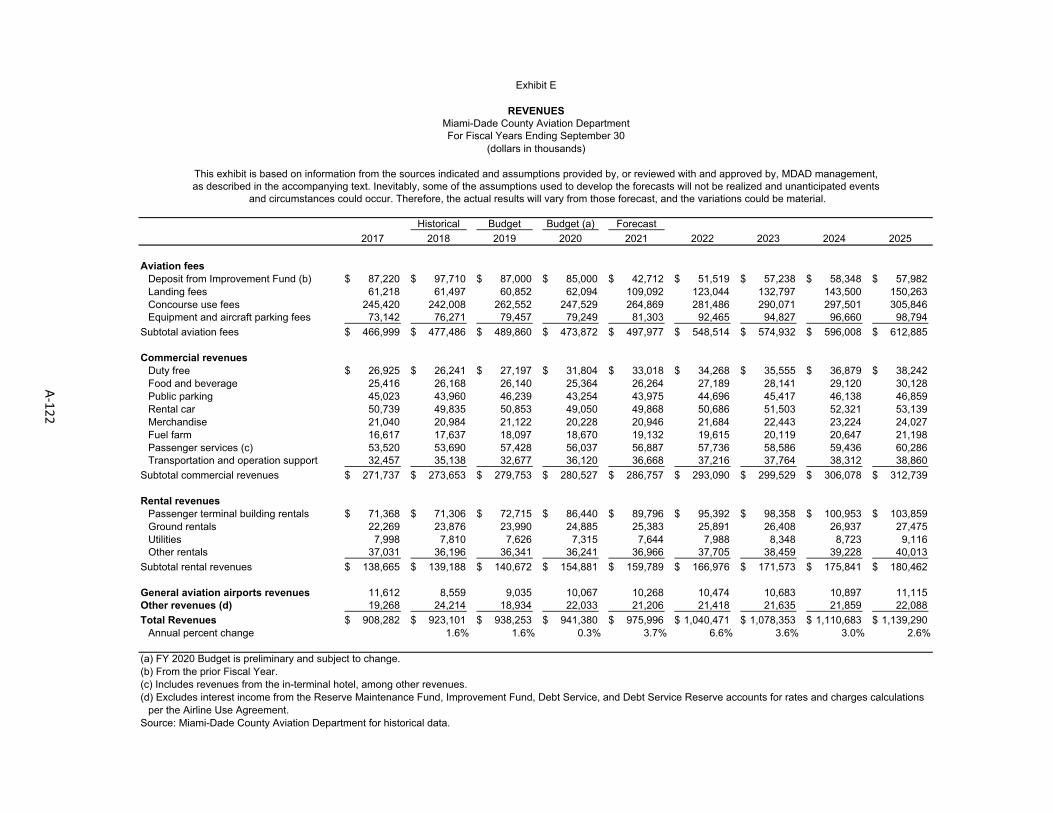
Exhibit E
REVENUESMiami-Dade County Aviation DepartmentFor Fiscal Years Ending September 30
(dollars in thousands)
This exhibit is based on information from the sources indicated and assumptions provided by, or reviewed with and approved by, MDAD management,as described in the accompanying text. Inevitably, some of the assumptions used to develop the forecasts will not be realized and unanticipated events
and circumstances could occur. Therefore, the actual results will vary from those forecast, and the variations could be material.
Historical Budget Budget (a) Forecast2017 2018 2019 2020 2021 2022 2023 2024 2025
Aviation feesDeposit from Improvement Fund (b) 87,220$ 97,710$ 87,000$ 85,000$ 42,712$ 51,519$ 57,238$ 58,348$ 57,982$Landing fees 61,218 61,497 60,852 62,094 109,092 123,044 132,797 143,500 150,263Concourse use fees 245,420 242,008 262,552 247,529 264,869 281,486 290,071 297,501 305,846Equipment and aircraft parking fees 73,142 76,271 79,457 79,249 81,303 92,465 94,827 96,660 98,794
Subtotal aviation fees 466,999$ 477,486$ 489,860$ 473,872$ 497,977$ 548,514$ 574,932$ 596,008$ 612,885$
Commercial revenuesDuty free 26,925$ 26,241$ 27,197$ 31,804$ 33,018$ 34,268$ 35,555$ 36,879$ 38,242$Food and beverage 25,416 26,168 26,140 25,364 26,264 27,189 28,141 29,120 30,128Public parking 45,023 43,960 46,239 43,254 43,975 44,696 45,417 46,138 46,859Rental car 50,739 49,835 50,853 49,050 49,868 50,686 51,503 52,321 53,139Merchandise 21,040 20,984 21,122 20,228 20,946 21,684 22,443 23,224 24,027Fuel farm 16,617 17,637 18,097 18,670 19,132 19,615 20,119 20,647 21,198Passenger services (c) 53,520 53,690 57,428 56,037 56,887 57,736 58,586 59,436 60,286Transportation and operation support 32,457 35,138 32,677 36,120 36,668 37,216 37,764 38,312 38,860
Subtotal commercial revenues 271,737$ 273,653$ 279,753$ 280,527$ 286,757$ 293,090$ 299,529$ 306,078$ 312,739$
Rental revenuesPassenger terminal building rentals 71,368$ 71,306$ 72,715$ 86,440$ 89,796$ 95,392$ 98,358$ 100,953$ 103,859$Ground rentals 22,269 23,876 23,990 24,885 25,383 25,891 26,408 26,937 27,475Utilities 7,998 7,810 7,626 7,315 7,644 7,988 8,348 8,723 9,116Other rentals 37,031 36,196 36,341 36,241 36,966 37,705 38,459 39,228 40,013
Subtotal rental revenues 138,665$ 139,188$ 140,672$ 154,881$ 159,789$ 166,976$ 171,573$ 175,841$ 180,462$
General aviation airports revenues 11,612 8,559 9,035 10,067 10,268 10,474 10,683 10,897 11,115Other revenues (d) 19,268 24,214 18,934 22,033 21,206 21,418 21,635 21,859 22,088Total Revenues 908,282$ 923,101$ 938,253$ 941,380$ 975,996$ 1,040,471$ 1,078,353$ 1,110,683$ 1,139,290$
Annual percent change 1.6% 1.6% 0.3% 3.7% 6.6% 3.6% 3.0% 2.6%
(a) FY 2020 Budget is preliminary and subject to change.(b) From the prior Fiscal Year.(c) Includes revenues from the in-terminal hotel, among other revenues.(d) Excludes interest income from the Reserve Maintenance Fund, Improvement Fund, Debt Service, and Debt Service Reserve accounts for rates and charges calculations
per the Airline Use Agreement.Source: Miami-Dade County Aviation Department for historical data.
A-122

Exhibit E-1
AIRLINE LANDING FEEMiami-Dade County Aviation DepartmentFor Fiscal Years Ending September 30
(dollars in thousands except landing fee rate)
This exhibit is based on information from the sources indicated and assumptions provided by, or reviewed with and approved by, MDAD management,as described in the accompanying text. Inevitably, some of the assumptions used to develop the forecasts will not be realized and unanticipated events
and circumstances could occur. Therefore, the actual results will vary from those forecast, and the variations could be material.
Budget (a) Budget (a,b) Forecast2019 2020 2021 2022 2023 2024 2025
Landing fee calculationPrincipal and Interest Requirements 321,914$ 290,002$ 297,649$ 327,044$ 333,414$ 332,416$ 331,417$
Coverage factor 1.20 1.20 1.20 1.20 1.20 1.20 1.20P&I Requirements and coverage 386,296$ 348,002$ 357,179$ 392,453$ 400,097$ 398,899$ 397,701$Current Expenses 516,957 547,832 572,484 598,246 625,167 653,299 682,698Increase in operating reserve 3,153 5,249 2,911 4,380 4,577 4,783 4,998Deposit to Reserve Account - - - - - - -Deposit to Reserve Maintenance Fund 15,000 18,000 24,000 27,000 30,000 35,000 35,000AP Energy Debt Payments 4,521 10,004 7,016 6,241 6,423 6,611 6,804Deposit for 2010 Double-Barreled Bonds (c) 15,326 15,294 15,434 15,434 15,431 15,433 15,430Deposit from Bond Service Account (Interest) (3,000) (3,000) (3,027) (3,283) (3,341) (3,341) (3,341)
Revenue Requirement 938,253$ 941,380$ 975,996$ 1,040,471$ 1,078,353$ 1,110,683$ 1,139,290$Revenues net of landing fees (877,402) (879,287) (866,904) (917,427) (945,556) (967,184) (989,028)
Amount recovered from landing fees 60,852$ 62,094$ 109,092$ 123,044$ 132,797$ 143,500$ 150,263$Estimated one month landing fee of prior year (3,906) (4,593) (5,174) (9,091) (10,254) (11,066) (11,958)
Landing fees required for 11 months 56,946$ 57,501$ 103,918$ 113,953$ 122,543$ 132,433$ 138,304$
Landing fee rate calculationEstimated landed weight (in million pound units) 38,400 38,896 39,443 39,897 40,314 40,747 41,180Estimated landed weight for 11 months 35,200 35,952 36,156 36,572 36,955 37,351 37,748
Landing fee rate (per 1,000 pound unit) 1.62$ 1.60$ 2.87$ 3.12$ 3.32$ 3.55$ 3.66$
(a) Principal and interest requirements, AP Energy Debt Payments, Deposit for 2010 Double-Barreled Bonds, and estimated landed weight reflect budgeted and not estimated or forecast amounts for FY 2019 and FY 2020.
(b) FY 2020 Budget is preliminary and subject to change.(c) General Obligation bonds.
A-123

Exhibit E-2
TERMINAL AND CONCOURSE USE FEES AND REVENUESMiami-Dade County Aviation DepartmentFor Fiscal Years Ending September 30
(dollars in thousands except rate)
This exhibit is based on information from the sources indicated and assumptions provided by, or reviewed with and approved by, MDAD management,as described in the accompanying text. Inevitably, some of the assumptions used to develop the forecasts will not be realized and unanticipated events
and circumstances could occur. Therefore, the actual results will vary from those forecast, and the variations could be material.
Budget Budget (a) Forecast2019 2020 2021 2022 2023 2024 2025
Concourse use fees and revenuesTerminal rental rate
Allocated Expenses 245,065$ 248,983$ 259,325$ 271,703$ 284,675$ 298,270$ 312,531$Allocated Debt Service 205,635 178,681 183,485 196,766 201,037 200,137 199,2372010 Double-Barreled Bonds 7,663 7,647 7,717 7,717 7,715 7,716 7,715 Adjustment 596 (1,712) - - - - - AP Energy Debt Payments 2,260 2,264 1,838 1,400 1,439 1,479 1,520 Debt Service Coverage - - 51 4,125 894 - -
Terminal Rent Requirement 461,219$ 435,863$ 452,416$ 481,711$ 495,760$ 507,601$ 521,004$Divided by Rentable Space - Class III Equivalent 5,132 4,437 4,437 4,437 4,437 4,437 4,437
Class III Terminal Rental Rate - (avg. cost per sq. ft.; rounded) 89.88$ 98.24$ 101.97$ 108.57$ 111.74$ 114.40$ 117.43$Annual percent change 9.30% 3.80% 6.47% 2.92% 2.38% 2.65%
Holdroom and circulation space revenues (b) 230,040$ 102,340$ 114,085$ 121,469$ 125,015$ 127,991$ 131,381$
International facility use fee rate 2.36$ 10.96$ 11.22$ 11.74$ 11.94$ 12.09$ 12.28$International facility use fee revenues 30,918$ 143,898$ 149,435$ 158,607$ 163,582$ 167,970$ 172,856$
Other concourse use fee revenues 1,594$ 1,291$ 1,349$ 1,410$ 1,473$ 1,540$ 1,609$
Total concourse use fee revenues 262,552$ 247,529$ 264,869$ 281,486$ 290,071$ 297,501$ 305,846$
Equipment and aircraft parking fees
Baggage claim fee rate 1.56$ 0.89$ 0.92$ 0.96$ 0.98$ 1.00$ 1.02$ Baggage claim fee revenues 21,684$ 12,520$ 13,030$ 13,728$ 14,148$ 14,572$ 15,001$
Baggage makeup fee rate 1.20$ 1.15$ 1.18$ 1.51$ 1.54$ 1.56$ 1.58$ Baggage makeup fee revenues 17,510$ 16,186$ 16,549$ 25,374$ 25,958$ 26,263$ 26,567$
Screening fee rate 0.49$ 0.99$ 0.92$ 0.96$ 0.99$ 1.01$ 1.04$ Screening fee revenues 13,230$ 24,313$ 25,285$ 26,703$ 27,865$ 28,759$ 29,953$
Other equipment and aircraft parking fee revenues 27,033$ 26,230$ 26,439$ 26,660$ 26,856$ 27,065$ 27,274$
Total equipment and aircraft parking fees 79,457$ 79,249$ 81,303$ 92,465$ 94,827$ 96,660$ 98,794$
(a) FY 2020 Budget is preliminary and subject to change.(b) Includes concourse use fee and preferential gate use revenues; preferential gate use charges become effective FY 2021.
A-124

Exhibit E-3
AIRLINE PAYMENTS PER ENPLANED PASSENGERMiami-Dade County Aviation DepartmentFor Fiscal Years Ending September 30
(dollars in thousands except CEP)
This exhibit is based on information from the sources indicated and assumptions provided by, or reviewed with and approved by, MDAD management,as described in the accompanying text. Inevitably, some of the assumptions used to develop the forecasts will not be realized and unanticipated events
and circumstances could occur. Therefore, the actual results will vary from those forecast, and the variations could be material.
Estimated Estimated Forecast2019 2020 2021 2022 2023 2024 2025
Passenger airline paymentsLanding fees 60,852$ 62,094$ 109,092$ 123,044$ 132,797$ 143,500$ 150,263$
Less: cargo airline landing fees (a) (12,153) (12,271) (21,559) (24,316) (26,244) (28,359) (29,695)Concourse use fees 262,552 247,529 264,869 281,486 290,071 297,501 305,846Equipment and aircraft parking fees 79,457 79,249 81,303 92,465 94,827 96,660 98,794Passenger terminal building rentals 72,715 86,440 89,796 95,392 98,358 100,953 103,859
Less: non-airline terminal rentals (10,427) (12,659) (13,140) (13,991) (14,399) (14,742) (15,132)Total passenger airline payments 452,995$ 450,382$ 510,361$ 554,081$ 575,411$ 595,513$ 613,935$
Enplaned passengers 22,725 23,075 23,425 23,775 24,125 24,475 24,825
Airline payments per e.p. (CEP) 19.93$ 19.52$ 21.79$ 23.31$ 23.85$ 24.33$ 24.73$CEP in 2018 dollars (b) 19.54 18.76 20.53 21.53 21.60 21.61 21.53
Airline payments as % of Revenues 48.3% 47.8% 52.3% 53.3% 53.4% 53.6% 53.9%
(a) Cargo airline landing fees are assumed to account for approximately 20% of total landing fees for the forecast period.(b) Discounted to 2018 dollars or 2.0% per year (the assumed inflation rate). Source: Miami-Dade County Aviation Department for historical data.
A-125

Exhibit F
APPLICATION OF REVENUESMiami-Dade County Aviation DepartmentFor Fiscal Years Ending September 30
(dollars in thousands)
This exhibit is based on information from the sources indicated and assumptions provided by, or reviewed with and approved by, MDAD management,as described in the accompanying text. Inevitably, some of the assumptions used to develop the forecasts will not be realized and unanticipated events
and circumstances could occur. Therefore, the actual results will vary from those forecast, and the variations could be material.
Estimated Estimated Forecast2019 2020 2021 2022 2023 2024 2025
RevenuesAviation fees 489,860$ 473,872$ 497,977$ 548,514$ 574,932$ 596,008$ 612,885$Commercial revenues 279,753 280,527 286,757 293,090 299,529 306,078 312,739Rental revenues 140,672 154,881 159,789 166,976 171,573 175,841 180,462General aviation airports revenues 9,035 10,067 10,268 10,474 10,683 10,897 11,115Other revenues (a) 18,934 22,033 21,206 21,418 21,635 21,859 22,088
Revenues 938,253$ 941,380$ 975,996$ 1,040,471$ 1,078,353$ 1,110,683$ 1,139,290$
Application of RevenuesCurrent Expenses 516,957$ 547,832$ 572,484$ 598,246$ 625,167$ 653,299$ 682,698$Operating reserve 3,153 5,249 2,911 4,380 4,577 4,783 4,998Bond Service Account 316,810 297,296 297,649 327,044 333,414 332,416 331,417Deposit from Bond Service Account (Interest) (3,000) (3,000) (3,027) (3,283) (3,341) (3,341) (3,341)Reserve Account - - - - - - -Reserve Maintenance Fund 15,000 18,000 24,000 27,000 30,000 35,000 35,000Improvement Fund
Deposit for 2010 Double-Barreled Bonds 15,431 15,434 15,434 15,434 15,431 15,433 15,430AP Energy Debt Payments 4,521 10,004 7,016 6,241 6,423 6,611 6,804Retainage Sub-account 7,700 7,854 8,011 8,171 8,335 8,501 8,671Performance Sub-account - - - - - - -Restricted for transfer to Revenue Fund 61,682 42,712 51,519 57,238 58,348 57,982 57,612
Total application of Revenues 938,253$ 941,380$ 975,996$ 1,040,471$ 1,078,353$ 1,110,683$ 1,139,290$
(a) Excludes interest income from the Reserve Maintenance Fund, Improvement Fund, Debt Service, and Debt Service Reserve accounts for rates and charges calculations per the Airline Use Agreement.
Source: Miami-Dade County Aviation Department for historical data.
A-126

Exhibit G
RATE COVENANT COMPLIANCEMiami-Dade County Aviation DepartmentFor Fiscal Years Ending September 30
(dollars in thousands)
This exhibit is based on information from the sources indicated and assumptions provided by, or reviewed with and approved by, MDAD management,as described in the accompanying text. Inevitably, some of the assumptions used to develop the forecasts will not be realized and unanticipated events
and circumstances could occur. Therefore, the actual results will vary from those forecast, and the variations could be material.
Estimated Estimated Forecast2019 2020 2021 2022 2023 2024 2025
Rate Covenant complianceRevenues 938,253$ 941,380$ 975,996$ 1,040,471$ 1,078,353$ 1,110,683$ 1,139,290$
Plus: Interest Income (a) 8,874 9,051 9,233 9,417 9,606 9,798 9,994Less: Current expenses (516,957) (547,832) (572,484) (598,246) (625,167) (653,299) (682,698)
Net revenues 430,170$ 402,600$ 412,745$ 451,642$ 462,792$ 467,181$ 466,586$Reserve Maintenance Fund (15,000) (18,000) (24,000) (27,000) (30,000) (35,000) (35,000)Principal and Interest Requirements
Gross debt service (371,810) (379,296) (382,649) (415,044) (422,414) (422,416) (422,417)Less: PFC deposits 55,000 82,000 85,000 88,000 89,000 90,000 91,000
Net Principal and Interest Requirements (316,810)$ (297,296)$ (297,649)$ (327,044)$ (333,414)$ (332,416)$ (331,417)$20% coverage (63,362) (59,459) (59,530) (65,409) (66,683) (66,483) (66,283)Reserve Account - - - - - - -
Must not be less than zero 34,998$ 27,844$ 31,566$ 32,189$ 32,695$ 33,283$ 33,885$
Debt Service CoverageNet revenues 430,170$ 402,600$ 412,745$ 451,642$ 462,792$ 467,181$ 466,586$
Reserve Maintenance Fund (15,000) (18,000) (24,000) (27,000) (30,000) (35,000) (35,000)Reserve account - - - - - - -
Revenues available to pay debt service 415,170$ 384,600$ 388,745$ 424,642$ 432,792$ 432,181$ 431,586$Principal and Interest Requirements (b) 316,810 297,296 297,649 327,044 333,414 332,416 331,417
Debt service coverage ratio (c) 1.31 1.29 1.31 1.30 1.30 1.30 1.30
(a) Includes interest income from the Reserve Maintenance Fund, Improvement Fund, Debt Service, and Debt Service Reserve accounts for Rate Covenant compliance calculations that are excluded from rates and charges calculations per the Airline Use Agreement.
(b) Net of PFCs applied to debt service.(c) Calculated pursuant to Section 501 of the Trust Agreement.Source: Miami-Dade County Aviation Department for historical data.
A-127

Exhibit H
SUMMARY OF FINANCIAL FORECASTSMiami-Dade County Aviation DepartmentFor Fiscal Years Ending September 30
(dollars in thousands except CEP)
This exhibit is based on information from the sources indicated and assumptions provided by, or reviewed with and approved by, MDAD management,as described in the accompanying text. Inevitably, some of the assumptions used to develop the forecasts will not be realized and unanticipated events
and circumstances could occur. Therefore, the actual results will vary from those forecast, and the variations could be material.
Estimated Estimated Forecast2019 2020 2021 2022 2023 2024 2025
RevenuesAviation fees
Deposit from Improvement Fund 87,000$ 85,000$ 42,712$ 51,519$ 57,238$ 58,348$ 57,982$Other aviation fees 402,860 388,872 455,264 496,995 517,695 537,660 554,903
Subtotal aviation fees 489,860$ 473,872$ 497,977$ 548,514$ 574,932$ 596,008$ 612,885$Commercial revenues 279,753 280,527 286,757 293,090 299,529 306,078 312,739Rental revenues 140,672 154,881 159,789 166,976 171,573 175,841 180,462Other revenues 27,969 32,101 31,474 31,891 32,318 32,756 33,203
Total revenues 938,253$ 941,380$ 975,996$ 1,040,471$ 1,078,353$ 1,110,683$ 1,139,290$Plus: Interest Income (a) 8,874 9,051 9,233 9,417 9,606 9,798 9,994Less: Current expenses (516,957) (547,832) (572,484) (598,246) (625,167) (653,299) (682,698)
Net revenues 430,170$ 402,600$ 412,745$ 451,642$ 462,792$ 467,181$ 466,586$Less: Deposit to Reserve Maintenance Fund (15,000) (18,000) (24,000) (27,000) (30,000) (35,000) (35,000)
Net revenues less deposit to Reserve Maintenance Fund 415,170$ 384,600$ 388,745$ 424,642$ 432,792$ 432,181$ 431,586$
Principal and Interest RequirementsGross debt service 371,810$ 379,296$ 382,649$ 415,044$ 422,414$ 422,416$ 422,417$
Less: PFC deposits (55,000) (82,000) (85,000) (88,000) (89,000) (90,000) (91,000)Net Principal and Interest Requirements 316,810$ 297,296$ 297,649$ 327,044$ 333,414$ 332,416$ 331,417$
Debt service coverage 1.31 1.29 1.31 1.30 1.30 1.30 1.30
Passenger airline payments 452,995$ 450,382$ 510,361$ 554,081$ 575,411$ 595,513$ 613,935$Enplaned Passengers 22,725 23,075 23,425 23,775 24,125 24,475 24,825
Airline payments per enplaned passenger (CEP) 19.93$ 19.52$ 21.79$ 23.31$ 23.85$ 24.33$ 24.73$
(a) Includes interest income from the Reserve Maintenance Fund, Improvement Fund, Debt Service, and Debt Service Reserve accounts for Rate Covenant compliance calculations that are excluded from rates and charges calculations per the Airline Use Agreement.
Source: Miami-Dade County Aviation Department for historical data.
A-128

APPENDIX B
AUDITED ANNUAL FINANCIAL STATEMENTS OF THE AVIATION DEPARTMENT FOR THE FISCAL YEAR ENDED SEPTEMBER 30, 2018

[THIS PAGE INTENTIONALLY LEFT BLANK]

–
Comprehensive Annual Financial Report
Fiscal Year Ended September 30, 2018
Prepared by: Finance & Strategy Division

INDEX
Introductory Section (Unaudited)
Letter of Transmittal……………………………………………………………………………………………………………………………………………….. i Miami‐Dade County Elected Officials ……………………………………………………………………………………………………………………… vi Miami‐Dade Aviation Department Senior Staff ………………………………………………………………………………………………………. vii Miami‐Dade Aviation Department Organizational Chart ………………………………………………………………………………………… viii GFOA Certificate of Achievement …………………………………………………………………………………………………………………………… ix
Financial Section
Report of Independent Auditor ……………………….……………………………………………………………………………………………………… 1 Management’s Discussion and Analysis (Unaudited) ………………………………………………………………………………………………. 3 Financial Statements Statement of Net Position………………………………………………………………………………………………………………………………. 13 Statement of Revenues, Expenses, and Changes in Net Position ……………………………………………………………………. 15 Statement of Cash Flows ……………………………………………………………………………………………………………………………….. 16 Notes to Financial Statements ………………………………………………………………………………………………………………………………… 18 Required Supplementary Information (Unaudited)
Florida Retirement System: Schedule of Employer Contributions (Unaudited) …………………………………………………………………………………..…. 63 Schedule of Employer Proportionate Share of Net Pension Liability and Related Ratios (Unaudited) ……..…. 64 Supplemental Health Insurance Subsidy Pension Information: Schedule of Employer Contributions (Unaudited) ……………………………………………………………………………………… 65 Schedule of Employer Proportionate Share of Net Pension Liability and Related Ratios (Unaudited) ………… 66 Postemployment Benefits Other than Pensions – Schedule of Changes in Total Liability & Related Ratios .……. 67
Statistical Section (Unaudited) Overview ………………………………………………………………………………………………………………………………………………………………… 68 Department Schedules of Revenues and Expenses …………………………………………………………………………………………………. 69 Department Statements of Net Position …………………………………………………………………………………………………………………. 70 Department Changes in Cash and Cash Equivalents ……………………………………………………………………………………………….. 71 Department’s Largest Sources of Revenue ……………………………………………………………………………………………………………… 72 Key Usage Fees and Charges …………………………………………………………………………………………………………………………………… 73 Concession Revenue per Enplaned Passenger ………………………………………………………………………………………………………… 74 Parking Revenue per Enplaned Passenger ………………………………………………………………………………………………………………. 75 Rental Car Revenue per Enplaned Passenger ………………………………………………………………………………………………………….. 76 Terminal Rent Revenue Per Enplaned Passenger …………………………………………………………….……………………………………… 77 Food and Beverage Revenues per Enplaned Passenger ………………………………………………………………………………………….. 78 Department Employee Strength …………………………………………………………………………………………………………………………….. 79 Aircraft Operations ……………………………………………………………………………………………………………………………….................... 80 Aircraft Landed Weight …………………………………………………………………………………………………………………………………………… 81 Passenger Enplanements ………………………………………………………………………………………………………………………………………… 82 Passenger Deplanements ……………………………………………………………………………………………………………………………………….. 83 Enplanement Market Share by Airline by Fiscal Year ………………………………………………………………………………………………. 84 Air Cargo Activity ……………………………………………………………………………………………………………………………………………………. 85 Miami‐Dade County Population and Per Capita Personal Income ……………………………………………………………………….…. 86 Principal Employers in Miami‐Dade County ……………………………………………………………………………………………………………. 87 Revenue Bond Debt Service Coverage ……………………………………………………………………………………………………………………. 88 Outstanding Debt ……………………….………………………………………………………………………………………………………………………….. 89 Long Term Debt per Enplaned Passenger ………………………………………………………………………………….…………………………… 90 Capital Assets …………………………………………………………………………………………………………………………………..…………………….. 91
Comprehensive Annual Financial Report For the Fiscal Year Ended September 30, 2018

FinancialSection
Independent Auditors’ Report
Management Discussion & Analysis
Financial Statements
Report of Independent Auditor The Honorable Mayor and Members The Board of County Commissioners Miami-Dade County Miami, Florida
Report on the Financial Statements We have audited the accompanying financial statements of the Miami-Dade County Aviation Department (Aviation Department), an enterprise fund of Miami-Dade County, Florida, as of and for the year ended September 30, 2018, and the related notes to the financial statements, as listed in the table of contents. Management’s Responsibility for the Financial Statements Management is responsible for the preparation and fair presentation of these financial statements in accordance with accounting principles generally accepted in the United States of America; this includes the design, implementation, and maintenance of internal control relevant to the preparation and fair presentation of financial statements that are free from material misstatement, whether due to fraud or error.
Auditor’s Responsibility Our responsibility is to express an opinion on these financial statements based on our audit. We conducted our audit in accordance with auditing standards generally accepted in the United States of America and the standards applicable to financial audits contained in Government Auditing Standards, issued by the Comptroller General of the United States. Those standards require that we plan and perform the audit to obtain reasonable assurance about whether the financial statements are free from material misstatement. An audit involves performing procedures to obtain audit evidence about the amounts and disclosures in the financial statements. The procedures selected depend on the auditor’s judgment, including the assessment of the risks of material misstatement of the financial statements, whether due to fraud or error. In making those risk assessments, the auditor considers internal control relevant to the entity’s preparation and fair presentation of the financial statements in order to design audit procedures that are appropriate in the circumstances, but not for the purpose of expressing an opinion on the effectiveness of the entity’s internal control. Accordingly, we express no such opinion. An audit also includes evaluating the appropriateness of accounting policies used and the reasonableness of significant accounting estimates made by management, as well as evaluating the overall presentation of the financial statements.
We believe that the audit evidence we have obtained is sufficient and appropriate to provide a basis for our audit opinion.
Opinion In our opinion, the financial statements referred to above present fairly, in all material respects, the financial position of the Aviation Department, an enterprise fund of Miami-Dade County, Florida, as of September 30, 2018, and the changes in financial position and cash flows thereof for the year then ended in accordance with accounting principles generally accepted in the United States of America. Emphasis of Matters As discussed in Note 1(a), the financial statements present only the Aviation Department and do not purport to, and do not present fairly the financial position of Miami-Dade County, Florida, as of September 30, 2018, the changes in its financial position or, where applicable, its cash flows for the year then ended, in accordance with accounting principles generally accepted in the United States of America. Our opinion is not modified with respect to this matter.

2
As discussed in note 2(t), the Aviation Department adopted new accounting guidance, Government Accounting Standards Board (GASB) Statement No. 75, Accounting and Financial Reporting for Postemployment Benefits Other than Pensions effective October 1, 2017. Adoption of the new accounting guidance resulted in a restatement of beginning net position. Our opinion is not modified with respect to this matter. As discussed in note 2(k), the Aviation Department implemented a change in accounting estimate. The change resulted in the recognition of a previously deferred contribution in the amount of approximately $324,270,000. Our opinion is not modified with respect to this matter. Other Matters Required Supplementary Information
Accounting principles generally accepted in the United States of America require that the management’s discussion and analysis and the required supplementary information as listed in the table of contents, be presented to supplement the basic financial statements. Such information, although not a part of the basic financial statements, is required by the Governmental Accounting Standards Board who considers it to be an essential part of financial reporting for placing the basic financial statements in an appropriate operational, economic, or historical context. We have applied certain limited procedures to the required supplementary information in accordance with auditing standards generally accepted in the United States of America, which consisted of inquiries of management about the methods of preparing the information and comparing the information for consistency with management’s responses to our inquiries, the basic financial statements, and other knowledge we obtained during our audit of the basic financial statements. We do not express an opinion or provide any assurance on the information because the limited procedures do not provide us with sufficient evidence to express an opinion or provide any assurance.
Other Information
Our audit was conducted for the purpose of forming an opinion on the Aviation Department’s basic financial statements. The introductory and statistical sections are presented for purposes of additional analysis and are not a required part of the basic financial statements.
The introductory and statistical sections have not been subjected to the auditing procedures applied in the audit of the basic financial statements and, accordingly, we do not express an opinion or provide any assurance on them.
Other Reporting Required by Government Auditing Standards In accordance with Government Auditing Standards, we have also issued our report dated February 19, 2019 on our consideration of the Aviation Department’s internal control over financial reporting and on our tests of its compliance with certain provisions of laws, regulations, contracts, and grant agreements and other matters. The purpose of that report is to describe the scope of our testing of internal control over financial reporting and compliance and the results of that testing, and not to provide an opinion on the effectiveness of the Aviation Department’s internal control over financial reporting or on compliance. That report is an integral part of an audit performed in accordance with Government Auditing Standards in considering the Aviation Department’s internal control over financial reporting and compliance.
Tampa, Florida February 19, 2019

MIAMI‐DADE COUNTY AVIATION DEPARTMENT AN ENTERPRISE FUND OF MIAMI‐DADE COUNTY, FLORIDA MANAGEMENT’S DISCUSSION AND ANALYSIS SEPTEMBER 30, 2018 (UNAUDITED)
3
Introduction The following discussion and analysis of the financial performance and activity of the Miami-Dade County Aviation Department (the Aviation Department) is to provide an introduction and understanding of the financial statements of the Aviation Department for the year ended September 30, 2018. This discussion has been prepared by management and should be read in conjunction with the financial statements and the notes thereto, which follow this section. The Aviation Department’s beginning net position was restated by $21.7 million (a net decrease) due to the recognition of a liability for other post-employment benefits, known as the total other post-employment benefit liability. This adjustment was required by the implementation of Governmental Accounting Standards Board (GASB) Statement No. 75, Accounting and Financial Reporting for Postemployment Benefits Other Than Pensions (GASB 75). See Note 2(t) of the accompanying financial statements. The Aviation Department operates an airport system consisting of Miami International Airport (MIA), four general aviation airports; Miami-Opa Locka Executive Airport, Miami Homestead General Aviation Airport, Miami Executive Airport; and the Dade-Collier Training and Transition Airport. The Aviation Department operates as an enterprise fund of Miami-Dade County, Florida (the County). The Aviation Department is self-supporting, using aircraft landing fees, fees from terminal and other rentals, and revenue from concessions to fund operating expenses. The Aviation Department merged the two capital project programs, the CIP Carryover Projects and the Terminal Optimization Program (TOP) into a single long-term capital project program, the Capital Improvement Program (CIP). The CIP, which is scheduled to be completed in fiscal year 2023, is primarily funded by bonds, federal and state grants, Passenger Facility Charges (PFCs), and monies set aside from the Reserve Maintenance Fund and Improvement Fund. Required Financial Statements The Aviation Department’s financial report includes three financial statements: the statement of net position, statement of revenue, expenses, and changes in net position, and statement of cash flows. The financial statements are prepared in accordance with U.S. generally accepted accounting principles as promulgated by the Governmental Accounting Standards Board (GASB). The Aviation Department is structured as a single enterprise fund with revenue recognized when earned and expenses recognized when incurred. Capital asset costs, with the exception of land and construction in progress, are capitalized and depreciated over their estimated useful lives. Certain net position balances are restricted for debt service, construction activities, and major maintenance-type activities. The statement of net position includes all of the Aviation Department’s assets, deferred outflows of resources, liabilities, and deferred inflows of resources and provides information about the nature and amounts of investments in resources (assets) as well as obligations to creditors and investors (liabilities). This statement also provides the basis for evaluating the capital structure of the Aviation Department and assessing liquidity and financial flexibility.

MIAMI‐DADE COUNTY AVIATION DEPARTMENT AN ENTERPRISE FUND OF MIAMI‐DADE COUNTY, FLORIDA MANAGEMENT’S DISCUSSION AND ANALYSIS SEPTEMBER 30, 2018 (UNAUDITED)
4
The statement of revenue, expenses, and changes in net position report the operating revenue and expenses and nonoperating revenue and expenses of the Aviation Department for the fiscal year with the difference, net income or loss, being combined with any capital contributions to arrive at the change in net position for the fiscal year. This statement captures the amount of operating revenue that the Aviation Department earned for the fiscal year along with the amount of operating expenses that were incurred during the same period, thus determining whether the Aviation Department was able to cover its operating obligations with its operating income. The statement of cash flows provides information about the Aviation Department’s cash receipts and payments during the reporting period. These statements report cash receipts, cash payments, and net changes in cash resulting from operating, investing, and capital and noncapital financing activities and provide an insight regarding sources providing cash and activities using cash. Activity Highlights MIA experienced a 2.9% increase in enplaned passenger traffic in fiscal year 2018, as compared to fiscal year 2017. MIA total passenger growth was 2.7% when compared to fiscal year 2017. Landed weight, which represents the total weight of the commercial aircraft that landed at MIA, increased by 1.3% in fiscal year 2018 reflecting the increase in heavier aircraft being used at MIA over the prior fiscal year. Enplaned cargo increased by 4.9% in fiscal year 2018, as compared to fiscal year 2017. Below is a comparison of these activities at MIA by fiscal year:
2018 2017
Enplanements 22,220,423 21,602,794 Landed weight (1,000 pounds) 37,457,108 36,989,510 Enplaned cargo (in tons) 999,894 952,769
Financial Highlights During fiscal year 2018, operating revenue was $821.5 million, an increase of $16.8 million, or 2.1%, as
compared to fiscal year 2017. The increase in operating revenue is primarily attributable to the increase in revenue from landing fees, concourse use charges, aircraft parking charges, land rent, food and beverage charges, and aeronautical services charges.
During fiscal year 2018, operating expenses before depreciation and amortization were $474.3 million, an
increase of $37.0 million, or 8.5%, as compared to fiscal year 2017. The increase in operating expenses is primarily attributed to an increase in expenses for outside contracts, repairs and maintenance, general administrative expenses, and services provided by other County departments.

MIAMI‐DADE COUNTY AVIATION DEPARTMENT AN ENTERPRISE FUND OF MIAMI‐DADE COUNTY, FLORIDA MANAGEMENT’S DISCUSSION AND ANALYSIS SEPTEMBER 30, 2018 (UNAUDITED)
5
The table below shows the composition of assets, deferred outflows of resources, liabilities, deferred inflows of resources, and net position as of September 30, 2018 and 2017:
2018 2017 (1)
(In thousands) (In thousands)Current Assets:
Unrestricted assets 395,993$ 382,687$ Restricted assets 305,818 285,166
Total Current Assets 701,811 667,853 Noncurrent Assets:
Restricted assets 693,395 632,401 Capital assets, net 6,062,007 6,178,268 Other assets 4,692 7,372
Total Assets 7,461,905$ 7,485,894$
Deferred Outflows of Resources:Deferred outflow - pension 30,706$ 33,835$ Deferred loss on refunding 150,009 125,275
Total Deferred Outflows 180,715$ 159,110$
Current Liabilities:Current liabilities payable from unrestricted assets 85,073$ 88,462$ Current liabilities payable from restricted assets 271,612 265,193
Total Current Liabilities 356,685 353,655 Noncurrent liabilities 6,048,480 6,332,650
Total Liabilities 6,405,165$ 6,686,305$
Deferred Inflows of Resources:Deferred inflow - pension 7,648$ 5,250$ Deferred inflow - other post-employment benefit 1,241 -
Total Deferred Inflows 8,889$ 5,250$
Net Position:Net investment in capital assets 327,993$ 65,879$ Restricted 719,116 683,147 Unrestricted 181,457 204,423
Total Net Position 1,228,566$ 953,449$
(1) Amounts for fiscal year 2017 have not been restated for the adoption of GASB No. 75 Capital assets, net as of September 30, 2018 were $6.1 billion, $116.3 million lower than at September 30, 2017. The decreases were due primarily to current year depreciation expense exceeding capital asset additions.

MIAMI‐DADE COUNTY AVIATION DEPARTMENT AN ENTERPRISE FUND OF MIAMI‐DADE COUNTY, FLORIDA MANAGEMENT’S DISCUSSION AND ANALYSIS SEPTEMBER 30, 2018 (UNAUDITED)
6
As of September 30, 2018, the assets and deferred outflows of resources exceeded liabilities and deferred inflows of resources by approximately $1.2 billion, an increase of approximately $275.1 million as compared to fiscal year 2017, prior to the adoption of GASB 75. Changes in net position can be determined by reviewing the following summary of revenue, expenses, and changes in net position for the years ended September 30, 2018 and 2017:
2018 2017 (1)
(In thousands) (In thousands)Operating revenues:
Aviation fees 384,989$ 372,977$ Rentals 149,111 144,046 Commercial operations 276,150 270,322 Other operating 11,259 12,229 Other – environmental remediation - 5,150
Nonoperating revenues:Passenger facility charges 82,242 88,914 Investment income 14,261 5,796 Other 2,956 2,489
Total Revenues 920,968 901,923
Operating expenses:Operating expenses 318,363 292,639 Operating expenses – environmental
remediation 2,621 368 Operating expenses – commercial operations 59,977 56,578 General and administrative expenses 93,387 87,773 Depreciation and amortization 262,821 259,280
Nonoperating expenses:Interest expense 259,857 268,118
Total Expenses 997,026 964,756
Loss before capital contributions (76,058) (62,833) Capital contributions 48,552 48,525 Change in accounting estimate 324,270 -
Change in net position 296,764 (14,308) Net position at beginning of year, as restated (note 2t) 931,802 967,757
Net position at end of year 1,228,566$ 953,449$
(1) Amounts for fiscal year 2017 have not been restated for the adoption of GASB No. 75
Total revenue for fiscal year 2018 was $921.0 million, an increase of $19.0 million, or 2.1%, as compared to fiscal year 2017. Operating revenue in fiscal year 2018 was $821.5 million, an increase of $16.8 million, or 2.1%, as compared to fiscal year 2017. The increase in operating revenue is primarily attributable to the increase in revenue from landing fees, concourse use charges, aircraft parking charges, land rent, food and beverage charges, and aeronautical services charges.

MIAMI‐DADE COUNTY AVIATION DEPARTMENT AN ENTERPRISE FUND OF MIAMI‐DADE COUNTY, FLORIDA MANAGEMENT’S DISCUSSION AND ANALYSIS SEPTEMBER 30, 2018 (UNAUDITED)
7
Total expenses, including depreciation and amortization, for fiscal year 2018 were $997.0 million, an increase of $32.2 million, or 3.3%, as compared to fiscal year 2017. Operating expenses, excluding depreciation and amortization, were $474.3 million, an increase of $37.0 million, or 8.5%, as compared to fiscal year 2017. The increase in operating expenses is primarily attributed to an increase in expenses for outside contracts, repairs and maintenance, general administrative expenses, and services provided by other County departments. In accordance with the amended and restated Trust Agreement (the Trust Agreement), the Aviation Department is required to meet its rate covenant, which means the Aviation Department is required to maintain, charge, and collect rates and charges for the use of and for the services and facilities provided to all users of these facilities. In addition, these rates and charges are to provide revenue sufficient to pay current expenses: to make the required Reserve Maintenance Fund annual deposits as recommended by the Consulting Engineers and to make deposits to the Sinking Fund, which comprises the Bond Service Account, the Reserve Account, and the Redemption Account, of not less than 120% of the Principal and Interest Requirements of the Outstanding bonds, as defined in the Trust Agreement (all capitalized terms referenced in the last few sentences are defined terms in the Trust Agreement). The Aviation Department uses an airport system residual cost recovery methodology to set its landing fee rate. The manner in which the residual landing fee is calculated enables the Aviation Department to establish rates to meet its rate covenant. Capital Assets and Debt Administration Capital Assets As of September 30, 2018 and 2017, the Aviation Department had $6.1 billion and $6.2 billion, respectively, invested in capital assets, net of accumulated depreciation. The following table summarizes the composition of capital assets, net of accumulated depreciation, as of September 30, 2018 and 2017:
2018 2017
(In thousands) (In thousands)
Land 127,026$ 127,026$ Buildings, improvements, and systems 4,741,652 4,888,922 Infrastructure 585,418 627,074 Furniture, machinery, and equipment 429,605 453,102
5,883,701 6,096,124 Construction in progress 178,306 82,144
Total capital assets, net 6,062,007$ 6,178,268$

MIAMI‐DADE COUNTY AVIATION DEPARTMENT AN ENTERPRISE FUND OF MIAMI‐DADE COUNTY, FLORIDA MANAGEMENT’S DISCUSSION AND ANALYSIS SEPTEMBER 30, 2018 (UNAUDITED)
8
The Aviation Department has grown its capital program to a long term and bigger Capital Improvement Program (CIP) with an approved budget of $1.52 billion. The CIP includes projects and funding sources from fiscal year 2015 thru 2023. The program consists of 52 capital projects grouped in seven subprograms; MIA Central Base Apron and Utilities, Concourse E, South Terminal, Miscellaneous Projects, Passenger Boarding Bridges, Improvement Projects, and Support Projects; plus the Reserve Maintenance Projects subprogram for miscellaneous environmental and maintenance projects under the Reserve Maintenance Division for a total of 8 subprograms. As of September 30, 2018, the status of the CIP can be described as follows: 17 projects in planning and design: $312.4 Million
These projects include: MIA Satellite E New Chiller Plan, MIA Satellite E Ramp Level Bus Hold room, MIA Concourse E to F Connector, MIA Concourse H Headhouse, MIA Parking Garage Structural Repairs, MIA Airport Operations Center (AOC), MIA Fuel Tender Facility, MIA Taxi and Transportation Network Company (TNC) Parking Lot and Facilities, MIA Employee Parking Garage, MIA Fuel Storage Facility Expansion - Design phase, MIA South Terminal Smoke Evacuation, MIA Central Terminal Fire Protection Notice of Violation, TMB New Bldgs. 102 &109, MIA Bldg. 845 Parking Lot Improvements, MIA CC J Gates Safegate, MIA Public Address System Renovation and MIA Multilateral Surveillance System (MLAT).
11 projects in Bid & Award: $163.3 Million These projects include: MIA Central Base Apron and Utilities Modifications and Expansion, MIA Lower Cc
E Third Level Sterile Corridor, MIA Partial Demo Bldg. 704, FPL Vault Relocation & Wash Rack Relocation, MIA Bldg. 704 Tenants Relocation and Finish Out Bldg. 701, MIA Fumigation Facility Temporary Relocation, MIA RCF D60 New Swing Doors, MIA CC G Preconditioned Air Equipment, MIA Parking Guidance System, MIA Central Terminal CCTV and Access Control, OPF Interior Service Road (Phase 2) and MIA Credentialing and Identity Management System – COTS.
12 projects under Construction: $924.6 Million These Capital projects primarily consist of: MIA Lower Concourse E Renovations, MIA Lower Cc E
Passenger Loading Bridges, MIA Lower Cc E Roofing, Mechanical, and Electrical Equipment Replacement, MIA Satellite E Renovation, MIA Satellite E Ramp Level Demolition and Additional Work, MIA Satellite E Passenger Loading Bridges, MIA Satellite E Roofing, Mechanical, and Electrical Equipment Replacement, MIA Concourse H Roof Replacement, MIA South and Central Terminal BHS Improvements, MIA Rehabilitation of Taxiways R, S, T; Extend Taxiway R, Reconfigure Connector Taxiway M5, MIA Central Terminal E-H Ticket Counters and MIA North and Central Terminal Passenger Boarding Bridges (PBBs) - Phase 1, and also include in this group is the Program Contingency for $91.8 Million.
12 projects in Close Out: $118.5 Million These projects include: MIA Cc E Satellite Automated People Mover Replacement, MIA Lower Cc E
Admirals Club Elevators, MIA Lower Cc E APM Station 4th Level, MIA Lower Cc E FIS Area Renovations - Phase I, MIA Satellite E New Generator, MIA Satellite E ICE Detention Center, MIA Satellite E 4th Level Demolition Work, MIA Satellite E Fire Pump Room, MIA Satellite E Pavement Rehabilitation, MIA FOD Detection System, MIA ID Section Relocation and MIA - Concourse J-J3 EDS Room.
Additional information on the Aviation Department’s capital assets can be found in Note 5 to the financial statements of this report.

MIAMI‐DADE COUNTY AVIATION DEPARTMENT AN ENTERPRISE FUND OF MIAMI‐DADE COUNTY, FLORIDA MANAGEMENT’S DISCUSSION AND ANALYSIS SEPTEMBER 30, 2018 (UNAUDITED)
9
Debt Administration As of September 30, 2018 and 2017, the Aviation Department had a total of $5.8 billion in long-term debt outstanding. The long-term debt consists of Aviation Revenue Bonds issued under the Trust Agreement, Double-Barreled Aviation Bonds issued by the County, Commercial Paper Notes and the State Infrastructure Bank Loan. Maturity dates range from 2019 to 2046, and the interest rates range from 1.183% to 5.750%. Both principal and interest for the Aviation Revenue Bonds are payable solely from net revenue generated from the airport facilities constructed under the provisions of the Trust Agreement. These Aviation Revenue Bonds do not constitute debt of the County or a pledge of the full faith and credit of the County. In addition to net revenue, the Aviation Department used $58.0 million of PFC revenue to pay principal and interest due in fiscal year 2018. On August 30, 2018, the Aviation Department issued 19,745,000 of Refunding Bonds at a premium of approximately $1,359,000, Series 2018A with an interest rate of 4.00% to 5.00%. The proceeds were used as follows:
partially refund $10,100,000 of principal amount outstanding for the Revenue Bond Series 2003E
partially refund $10,820,000 of principal amount outstanding for the Revenue Bond Series 2008A
The net proceeds were placed in an irrevocable trust account to refund the 2003E and 2008A Bonds which matured on October 1, 2018. Payments were scheduled to be made accordingly by the Trustees. As of September 30, 2018, the Irrevocable Escrow Account for the advanced refunding had approximately $21,426,000. On August 30, 2018, the Aviation Department issued 4,185,000 of Refunding Bonds at a premium of approximately $255,000, Series 2018B with an interest rate of 4.00% to 5.00%. The proceeds were used as follows:
partially refund $4,405,000 of principal amount outstanding for the Revenue Bond Series 2008B The net proceeds were placed in an irrevocable trust account to refund the 2008B Bonds which matured on October 1, 2018. Payments were scheduled to be made accordingly by the Trustees. As of September 30, 2018, the Irrevocable Escrow Account for the advanced refunding had approximately $4,494,000. On August 30, 2018, the Aviation Department issued 766,815,000 of Refunding Bonds at par, Series 2018C with an interest rate of 2.76% to 4.28%. The proceeds were used as follows:
partially advanced refund $316,025,000 of principal amount outstanding for the Revenue Bond Series 2009A
partially advanced refund $49,300,000 of principal amount outstanding for the Revenue Bond
Series 2009B
partially advanced refund $363,935,000 of principal amount outstanding for the Revenue Bond Series 2010A

MIAMI‐DADE COUNTY AVIATION DEPARTMENT AN ENTERPRISE FUND OF MIAMI‐DADE COUNTY, FLORIDA MANAGEMENT’S DISCUSSION AND ANALYSIS SEPTEMBER 30, 2018 (UNAUDITED)
10
The net proceeds were placed in an irrevocable trust account to refund the 2009A Bonds which will mature on October 1, 2019, 2009B Bonds which will mature on October 1, 2019, and the 2010A Bonds which will mature on October 1, 2020. Payments were scheduled to be made accordingly by the Trustees. As of September 30, 2018, the Irrevocable Escrow Account for the advanced refunding had approximately $777,528,000. As a result, the refunded principal portion of the Revenue Bond Series 2003E, 2008A, 2008B, 2009A, 2009B, and 2010A are considered defeased and the liability for these bonds were removed from long-term debt. Accordingly, the assets and liabilities for the portion of the refunded Series are not included in the Aviation Department’s financial statements. Prior to refunding, the net cash flow needed was approximately $1,455,347,000. The new refunding debt service is approximately $1,343,102,000. As a result of the refunding, the Aviation Department had a net present value savings of approximately $71,379,000. Some issues of General Aviation Revenue Bonds are insured by various original monoline insurance companies whose credit ratings reflect the financial capacity of these companies. The purchase of insurance at the time the debt was issued elevated bond ratings by Standard and Poor’s, Moody’s Investor Service, and Fitch Ratings, respectively, to AAA, Aaa, and AAA and lowered the interest rate on the related debt. The Trust Agreement requires that insurers have certain minimum ratings in order to insure County bonds. The policies provide that insurers will make debt service payments in the unlikely event that the County is unable to do so. Since the insured bonds were issued, the ratings of the various monoline insurers have been lowered or withdrawn by the rating agencies. The rating downgrades do not necessarily affect the insurance companies’ ability to pay claims, and the various insurance policies remain in effect. However, the Reserve Account was affected by the rating downgrades of the Surety policies that were purchased in lieu of cash funding the Debt Service Reserve Requirement. The Aviation Department funded the reserve requirement shortfall by funding the difference over a specified time period. As a result, the Aviation Department has a fully funded cash reserve along with potentially viable but unusable Surety policies unless the ratings of the Reserve Surety Providers are upgraded to “AA/Aa” or higher. The County’s cash flow and its ability to pay its debt service obligation have not been affected. As of September 30, 2018, the public underlying ratings for the Aviation Department’s outstanding General Aviation Revenue Bonds were A with a stable outlook, AA- with a stable outlook, and A with a stable outlook per Standard and Poor’s, Kroll Bond Rating Agency, and Fitch Ratings, respectively. Additional information on the Aviation Department’s debt administration can be found in Note 6 of this report. Economic Factors and Outlook In previous years, airline rates and charges at MIA had significantly increased primarily due to the large amount of new money Aviation Revenue Bonds that was issued between 1994 and 2010. All of this additional debt translated into higher annual debt service costs and resulted in MIA becoming one of the more expensive U.S. airports from an airline rates and charges perspective. Under the Aviation Department’s airline rates structure, these debt service costs are passed along to the MIA air carriers, mostly through aviation fees and terminal rental rates. The increase in the airline costs due to the higher annual debt service has been mitigated for the reasons noted below:
1) The higher than anticipated surplus revenue (i.e., realizing higher than budgeted revenue and spending less than budgeted expenses), which is used to offset the residual landing fee related costs in the subsequent fiscal year. In fact, the landing fee rate has stayed below fiscal year 2014 landing fee rate for the last five years; $1.75 in fiscal year 2014 with the subsequent fiscal years being no higher than $1.68 and the current fiscal year (2019) being $1.62.

MIAMI‐DADE COUNTY AVIATION DEPARTMENT AN ENTERPRISE FUND OF MIAMI‐DADE COUNTY, FLORIDA MANAGEMENT’S DISCUSSION AND ANALYSIS SEPTEMBER 30, 2018 (UNAUDITED)
11
2) The refunding of the Aviation Revenue Bonds that were issued between 1994 and 2010. These refunding transactions have resulted in a net present value savings of $569.8 million based on a par amount of $4.9 billion for the refunded bonds; an overall net present value savings of 11.6%.
3) The Aviation Department has controlled its budgeted (and thereby the actual) operating expenses as
shown by a moderate increase in operating expenses (excluding depreciation and amortization) over the last few years. The higher than anticipated nonairline revenue in various years has also offset the airline costs under the residual rate methodology.
MIA principally serves the metropolitan area of Miami-Dade County. The local residents in Miami-Dade County serve as a portion of the MIA passenger traffic, which means that the local economy affects the Airport’s revenue. During fiscal year 2018, Miami-Dade County has continued to show signs of improvement economically. The not seasonally adjusted unemployment rate decreased from 4.8% to 3.6% (or 25%) from September 2017 to September 2018. Home prices increased 5.3% from September 2017 to September 2018 according to the S&P/Case-Shiller Home Price Index. The Greater Miami Convention & Visitors Bureau reported in May 2018 the following information.
a) A record-breaking $26 billion in expenditures was made by overnight visitors to Greater Miami in 2017, representing a 2.1% increase over the previous year.
b) Employment in the leisure and hospitality industry grew by 2.4% reaching a record 144,800 jobs in Miami-Dade for 2017.
c) Greater Miami continued the growth trend in the first quarter of 2018 compared to the same time period the previous year, increasing hotel occupancy by 4.3%, hotel room rate by 11.8% and revenue per available hotel room (RevPar) by 16.6%, as reported by Smith Travel Research.
In terms of passenger growth at MIA, the numbers are noted in the following table.
Total Percentage
Fiscal Year Passengers Change2009 33,875,470 -0.6%2010 35,029,106 3.4%2011 37,633,119 7.4%2012 39,564,476 5.1%2013 40,115,305 1.4%2014 40,844,964 1.8%2015 43,347,129 6.1%2016 44,901,753 3.6%2017 43,758,409 -2.5%2018 44,938,486 2.7%
The drop in passengers in FY2017 is due to Hurricane Irma in September 2017 in which MIA was closed for a number of days. This closure resulted in a significant number of cancelled flights during the Airport closure as well as the days prior to and just after the closure. Since Concourse D was completed in 2010, American Airlines has been able to grow its hub operation at MIA. American Airlines along with its regional airline, Envoy, has significantly increased service to MIA, which is represented by its 20.3% enplaned passenger growth rate from fiscal years 2009 to 2018.

MIAMI‐DADE COUNTY AVIATION DEPARTMENT AN ENTERPRISE FUND OF MIAMI‐DADE COUNTY, FLORIDA MANAGEMENT’S DISCUSSION AND ANALYSIS SEPTEMBER 30, 2018 (UNAUDITED)
12
The financial strength and stability of the airlines serving MIA may affect future airline traffic. While passenger demand at the Airport is expected to increase in the future, there can be no assurance given as to the levels of aviation activity that will be achieved at the Airport in the future. Any financial or operational difficulties incurred by American Airlines or any other major air carriers at the Airport could have a material adverse effect on the Airport as well as any natural disasters such as hurricanes, although the Aviation Department would take measures to mitigate these potential effects. Air cargo tonnage at MIA has grown at a healthy rate for the past fiscal year as noted by the 5.4% increase in cargo tonnage for fiscal year 2018, as compared to fiscal year 2017. MIA benefits from its geographic location because MIA acts as a transshipment location with a major portion of the goods being shipped beyond MIA. During 2017, the Airport handled 83% of all air imports and 79% of all air exports between the United States and the Latin American/Caribbean region.
Request for Information This financial report is designed to provide customers, creditors, and other interested parties with a general overview of the Aviation Department’s finances. Questions concerning any of the information provided in the report or requests for additional financial information should be addressed in writing to the Chief Financial Officer, Miami-Dade County Aviation Department, 4200 N.W. 36th Street, Suite 300, Miami, Florida 33122.

MIAMI‐DADE COUNTY AVIATION DEPARTMENT AN ENTERPRISE FUND OF MIAMI‐DADE COUNTY, FLORIDA STATEMENT OF NET POSITION SEPTEMBER 30, 2018 (IN THOUSANDS)
See accompanying notes to the financial statements. 13
ASSETS
Current Assets:Cash and cash equivalents 272,104$ Investments, including interest receivable 69,982 Accounts receivable, net of allowance for doubtful accounts of
$5,466 44,351 Inventories, prepaid expenses, and other current assets 7,890 Due from County Agencies 1,666
Total Current Unrestricted Assets 395,993
Restricted Assets:Current Restricted Assets:
Cash and cash equivalents 16,765 Investments, including interest receivable 257,456 Government grants receivable 23,812 Passenger facility charges receivable 7,785
Total Current Restricted Assets 305,818
Total Current Assets 701,811
Noncurrent Assets:Restricted Assets:
Cash and cash equivalents 597,827 Investments, including interest receivable 95,568
Total Noncurrent Restricted Assets 693,395
Capital assets, net 6,062,007 Other noncurrent assets 1,791 Due from County Agencies 2,901
Total Noncurrent Assets 6,760,094
Total Assets 7,461,905$
Deferred Outflows of Resources:Deferred outflows pension 30,706$ Deferred loss on refundings 150,009
Total Deferred Outflows of Resources 180,715$

MIAMI‐DADE COUNTY AVIATION DEPARTMENT AN ENTERPRISE FUND OF MIAMI‐DADE COUNTY, FLORIDA STATEMENT OF NET POSITION (CONTINUED) SEPTEMBER 30, 2018 (IN THOUSANDS)
See accompanying notes to the financial statements. 14
LIABILITIES AND NET POSITION
Current Liabilities Payable from Unrestricted Assets:Accounts payable and accrued expenses 35,920$ Security deposits 17,325 Environmental remediation liability 4,175 Compensated absences 7,042 Rent advances 7,992 Capital lease liability 3,447 Due to County Agencies 9,172
Total Current Liabilities Payable from Unrestricted Assets 85,073
Current Liabilities Payable from Restricted Assets:Accounts and contracts payable and other liabilities 29,880 Bonds payable within one year:
Bonds payable 131,365 Interest payable 110,367
Total Current Liabilities Payable from Restricted Assets 271,612
Total Current Liabilities Payable 356,685
Noncurrent Liabilities:Bonds and loans payable after one year 5,671,657 Commercial paper notes 140,168 Environmental remediation liability, net of current portion 34,180 Compensated absences, net of current portion 17,735 Rent advances 5,236 Capital lease liability, net of current portion 77,236 Total other post-employment benefit liability 23,917 Net pension liability 78,351
Total Noncurrent Liabilities 6,048,480
Total Liabilities 6,405,165$
Deferred Inflows of Resources:Deferred inflows pension 7,648$ Deferred inflows other post-employment benefit 1,241
Total Deferred Inflows of Resources 8,889$
Net Position:Net investment in capital assets 327,993$ Restricted:
Restricted for debt service 323,913 Restricted for reserve maintenance 71,526 Restricted for construction 323,677
Unrestricted 181,457
Total Net Position 1,228,566$

MIAMI‐DADE COUNTY AVIATION DEPARTMENT AN ENTERPRISE FUND OF MIAMI‐DADE COUNTY, FLORIDA STATEMENT OF REVENUE, EXPENSES, AND CHANGES IN NET POSITION YEAR ENDED SEPTEMBER 30, 2018 (IN THOUSANDS)
See accompanying notes to the financial statements. 15
Operating Revenue:Aviation fees 384,989$ Rentals 149,111 Commercial operations:
Management agreements 73,595 Concessions 202,555
Other 11,259
Total Operating Revenue 821,509
Operating Expenses:Operating expenses 318,363 Operating expenses – environmental remediation 2,621 Operating expenses under management agreements 18,041 Operating expenses under operating agreements 41,936 General and administrative expenses 93,387
Total Operating Expenses Before Depreciation and Amortization 474,348
Operating income before depreciation and amortization 347,161 Depreciation and amortization 262,821
Operating Income 84,340
Nonoperating Revenues (Expenses):Environmental cost recovery 21 Passenger facility charges 82,242 Interest expense (259,857) Investment income 14,261 Other revenue 2,935
Total Nonoperating Expenses (160,398)
Loss before capital contributions (76,058) Capital contributions 48,552 Change in accounting estimate (Note 2k) 324,270
Change in Net Position 296,764
Net position, beginning of year, as restated (Note 2t) 931,802
Net position, end of year 1,228,566$

MIAMI‐DADE COUNTY AVIATION DEPARTMENT AN ENTERPRISE FUND OF MIAMI‐DADE COUNTY, FLORIDA STATEMENT OF CASH FLOWS YEAR ENDED SEPTEMBER 30, 2018 (IN THOUSANDS)
See accompanying notes to the financial statements. 16
Cash flows from operating activities:
Cash received from customers and tenants 814,284$ Cash paid to suppliers for goods and services (332,063) Cash paid to employees for services (130,011)
Net cash from operating activities 352,210
Cash flows from capital and related financing activities:
Proceeds from bonds issues and commercial paper 1,368,311 Principal paid on bonds, loans, and commercial paper (1,372,429) Interest paid on bonds, loans, and commercial paper (315,369) Purchase and construction of capital assets (141,693) Proceeds from sale of property 1,099 Capital contributed by federal and state governments 35,408 Passenger facility charges 85,373 Proceeds from environmental reimbursements 21 Capital lease proceeds 47,602
Net cash from capital and related financing activities (291,677)
Cash flows from noncapital financing activity:
Other reimbursements received 2,935
Net cash from noncapital financing activity 2,935
Cash flows from investing activities:
Purchase of investments (1,152,098) Proceeds from sales and maturities of investments 1,252,064 Interest and dividends on investments 12,999
Net cash from investing activities 112,965
Net change in cash and cash equivalents 176,433 Cash and cash equivalents, beginning of year 710,263
Cash and cash equivalents, end of year 886,696$
Cash and cash equivalents reconciliation:
Unrestricted assets 272,104$
Restricted assets 614,592
Cash and cash equivalents 886,696$

MIAMI‐DADE COUNTY AVIATION DEPARTMENT AN ENTERPRISE FUND OF MIAMI‐DADE COUNTY, FLORIDA STATEMENT OF CASH FLOWS (CONTINUED) YEAR ENDED SEPTEMBER 30, 2018 (IN THOUSANDS)
See accompanying notes to the financial statements. 17
Reconciliation of operating income to net cash from
operating activities:
Operating income 84,340$ Adjustments to reconcile operating income to net cash
from operating activities:Depreciation and amortization 262,821 Provision for uncollectible accounts 4,775 Loss (gain) on sale of property (10) Changes in operating assets and liabilities:
Accounts receivable (12,512) Inventories, prepaid expenses, and other assets 550 Due from County Agencies 1,428 Deferred outflows related to pensions 3,129 Accounts and contracts payable and accrued expenses 4,979 Security deposits 948 Due to County Agencies 3,446 Rent and contribution advances (1,854) Liability for compensated absences 993 Liability for other post-employment benefits (1,363) Net pension liability (5,534) Other liabilities 2,435 Deferred inflows related to pensions 2,398 Deferred inflows related to other post-employment benefits 1,241
Total adjustments 267,870
Net cash from operating activities 352,210$
Noncash investing, capital, and financing activities:
Decrease in fair value of investments (857)$ Increase in construction in progress accrual 3,453 Decrease in contribution advances (324,270) Capital contribution from State 324,270 Capitalized interest 2,503 Decrease in premium from bonds (21,422)

MIAMI‐DADE COUNTY AVIATION DEPARTMENT AN ENTERPRISE FUND OF MIAMI‐DADE COUNTY, FLORIDA NOTES TO THE FINANCIAL STATEMENTS SEPTEMBER 30, 2018
18
Note 1—General a. Description – Miami-Dade County, Florida (the County) is a chartered political subdivision of the State of Florida and is granted home rule county powers by the Constitution of the State of Florida and Florida Statutes. The Board of County Commissioners (the Board or the BCC) is the legislative and governing body of the County. The Miami-Dade County Aviation Department (the Aviation Department), established on February 6, 1973, is included as an enterprise fund in the County’s comprehensive annual financial report as part of the County’s reporting entity. These financial statements present only the Aviation Department and do not purport to, and do not, present fairly the financial position of the County as of September 30, 2018, and the changes in its financial position and its cash flows for the year then ended, in conformity with U.S. generally accepted accounting principles (GAAP). Pursuant to the general laws of Florida, the County owns Miami International Airport (MIA), three general aviation airports, and two training airports, one of which has been closed (collectively the airports), all of which are operated by the Aviation Department. b. Basis of Presentation – The Aviation Department operates as an enterprise fund of the County. An enterprise fund is used to account for the financing of services to the general public, since substantially all of the costs involved are paid in the form of charges by users of such services. Accordingly, the Aviation Department’s financial statements have been prepared using the economic resources measurement focus and accrual basis of accounting. Revenue is recorded when earned and expenses are recorded at the time liabilities are incurred, regardless of when the related cash flows take place. c. Authority to Fix Rates – Under the provisions of the Trust Agreement, amended and restated dated December 15, 2002 by the County, The Bank of New York, successor in interest to JP Morgan Chase Bank, New York, New York, as trustee (the Trustee), and U.S. Bank National Association (successor in interest to Wachovia Bank, National Association, Miami, Florida) as cotrustee (the CoTrustee) (the Trust Agreement), which amended and restated the Trust Agreement dated as of October 1, 1954 with the Chase Manhattan Bank (predecessor-in-interest to the Trustee) and First Union National Bank of Miami (predecessor-in-interest to the CoTrustee), as amended and supplemented (the Original Trust Agreement), the Aviation Department is required to maintain, charge, and collect rates and charges for the use and services provided, which will provide revenue sufficient to: Pay current expenses, as defined in the Trust Agreement.
Make the Reserve Maintenance Fund (the Reserve Maintenance Account) deposits recommended by the Consulting Engineers.
Make deposits to the Interest and Sinking Fund (the Sinking Fund Account) comprising the Bond Service Account, the Reserve Account, and the Redemption Account of not less than 120% of the principal and interest requirements of the Trust Agreement Aviation Revenue Bonds, as defined in the Trust Agreement.
Any remaining balance in the Revenue Fund, after meeting the requirements noted above, is deposited to the Improvement Fund (the Improvement Account), as defined in the Trust Agreement.

MIAMI‐DADE COUNTY AVIATION DEPARTMENT AN ENTERPRISE FUND OF MIAMI‐DADE COUNTY, FLORIDA NOTES TO THE FINANCIAL STATEMENTS SEPTEMBER 30, 2018
19
Note 1—General (continued) d. Agreements with Airlines – The Airline Use Agreement (AUA) which was in effect since May 2002 was replaced with a new AUA, which became effective in August 2018. The AUA establishes an airport system residual landing fee such that all costs not recovered through other revenue will be recovered from the landing fee revenue. Pursuant to the requirements of the AUA, remaining money residing in the Improvement Fund at the end of the fiscal year in excess of $7.6 million, adjusted annually by the Consumer Price Index (CPI), is to be transferred to the Revenue Fund in the subsequent fiscal year, thus reducing the amounts otherwise to be paid by the MIA air carriers in that fiscal year. The $7.6 million annual contribution is deposited into a separate account that has a cumulative cap of $22.8 million also subject to a CPI adjustment and can be used for any discretionary airport-related purpose. As of September 30, 2018, the excess deposit, which was transferred to the Revenue Fund annually by March, was approximately $97,710,000. e. Relationship with County Departments – The Aviation Department reimburses the County’s General Fund for its portion of the direct administrative service cost, such as audit and management services, the Board, Clerk of the Courts, computer services and information systems, fire, police, personnel, and others. In 1996, an internal study was conducted by the County to determine the appropriate method as a basis to establish the indirect administrative services cost reimbursement for the year ended September 30, 1996 and subsequent years. This study was updated in 2003. The General Fund Cost Allocation Study is performed by a consultant, every two years, to establish the appropriate allocation to the General Fund. The study accords all administrative costs consistent treatment through the application of GAAP appropriate to the circumstances, and conforms to the accounting principles and standards prescribed by the Office of Management and Budget (OMB) Circular A-87, and Cost Principles for State, Local and Indian Tribal Governments (2 CFR Part 225). The latest cost allocation study that is currently in use was completed in fiscal year 2017, using administrative costs for fiscal year 2015. For the year ended September 30, 2018, the Aviation Department recorded an expense in the amount of approximately $4,273,000, for the indirect administrative services cost reimbursement in accordance with the formula developed as a result of the study. As of September 30, 2018, the Aviation Department owes the County approximately $9,172,000, for various services. For this same period, the Aviation Department has receivables due from the County in the amount of approximately $4,567,000. On March 20, 2003, the U.S. Department of Transportation and Office of the Inspector General (OIG) issued Report No. AV-2003-030 entitled Oversight of Airport Revenue in connection with their audit of amounts paid to the County by the Aviation Department. The OIG reported that the County diverted Aviation Department revenue of approximately $38 million from 1995 to 2000. On August 9, 2005, upon receiving additional information from the Aviation Department, the OIG agreed to adjust the finding to $8.1 million, plus interest. The Oversight of Airport Revenue report was updated to include the years 2001 through 2005, and the total diversion of revenue was increased to $12 million, plus interest of $2.3 million for a total of $14.3 million. The County repaid the Aviation Department $1,450,728 in fiscal years 2018. The amount due from the County was approximately $4,352,000 at September 30, 2018. In addition, the Aviation Department pays other County departments directly for most services provided such as fire, police, legal, and general services administration. The total cost to the Aviation Department for these services was approximately $76,399,000 for the year ended September 30, 2018.

MIAMI‐DADE COUNTY AVIATION DEPARTMENT AN ENTERPRISE FUND OF MIAMI‐DADE COUNTY, FLORIDA NOTES TO THE FINANCIAL STATEMENTS SEPTEMBER 30, 2018
20
Note 2—Summary of significant accounting policies a. Basis of Accounting – The financial statements are presented on the accrual basis of accounting. Under this method, revenue is recorded when earned and expenses are recorded when incurred. b. Cash and Cash Equivalents – Cash includes cash on hand, amounts in demand deposits, and positions in investment pools that can be deposited or withdrawn without notice or penalty. Cash equivalents are short-term highly liquid securities with known market values and maturities, when acquired, of less than three months. c. Investments – Investments consist primarily of U.S. government securities and are carried at fair value based on quoted market prices. d. Inventories – Inventories, consisting of building materials/supplies and spare parts, are valued at cost using the first-in, first-out method. e. Capital Assets and Depreciation – Property acquired with an initial individual cost of $1,000 or more and an estimated useful life in excess of one year is capitalized at cost. Capital assets are recorded at cost, except for contributions by third parties, which are recorded at acquisition value at the date of contribution. Expenditures for maintenance, repairs, minor renewals, and betterments are expensed as incurred. When property is disposed of, the cost and related accumulated depreciation is eliminated from the accounts, and any gain or loss is reflected in the statements of revenue, expenses, and changes in net position. The Aviation Department depreciates assets using the straight-line method of depreciation over the assets’ estimated useful lives as follows:
Years
Buildings, improvements, and systems 40Infrastructure 20-30Furniture, machinery, and equipment 5-16
Management evaluates whether there has been a significant unexpected decline in the utility of a capital asset that could indicate an impairment in the capital asset. If there is an indication that an asset may be impaired, the Aviation Department follows Governmental Accounting Standards Board (GASB) Statement No. 42, Accounting and Financial Reporting for Impairment of Capital Assets and for Insurance Recoveries, to determine whether an impairment should be recognized. The Aviation Department concluded that no impairment exists as of September 30, 2018. f. Interest on Indebtedness – Interest is charged to expense as incurred, except for interest related to borrowings used for construction projects. The Aviation Department capitalizes interest costs as part of the cost of constructing specified qualifying assets. In situations involving qualifying assets financed with the proceeds of tax-exempt debt, the amount of interest capitalized is reduced by any interest income earned on the temporary investment of such moneys. Interest is capitalized throughout the construction period. Total interest costs incurred during the year ended September 30, 2018 amounted to approximately $262,360,000. Of this amount, approximately $2,503,000 was capitalized during fiscal year 2018.

MIAMI‐DADE COUNTY AVIATION DEPARTMENT AN ENTERPRISE FUND OF MIAMI‐DADE COUNTY, FLORIDA NOTES TO THE FINANCIAL STATEMENTS SEPTEMBER 30, 2018
21
Note 2—Summary of significant accounting policies (continued) g. Restricted Assets – Assets required to be reserved for airport maintenance and debt service pursuant to the Trust Agreement are classified as restricted assets and are not available for payment of current expenses. In accordance with the terms of the Trust Agreement, assets of the Reserve Maintenance Account are restricted for unusual or extraordinary maintenance or repairs, renewals, and replacements, the cost of replacing equipment, and premiums on insurance required to be carried under the provisions of the Trust Agreement and are not available for the payment of current expenses. Unexpended Passenger Facility Charges (PFC) revenue and accumulated interest earnings are restricted to be used on Federal Aviation Administration (FAA) approved capital projects and are classified as restricted assets. When both restricted and unrestricted resources are available for use, it is the Aviation Department’s policy to use restricted resources first, then unrestricted resources as needed. h. Compensated Absences – The Aviation Department accounts for compensated absences by accruing a liability for employees’ compensation of future absences in accordance with GASB Statement No. 16, Accounting for Compensated Absences. The Aviation Department’s policy permits employees to accumulate unused vacation and sick pay benefits that will be paid to them upon separation from service. The Aviation Department recognizes a liability and expense in the period vacation and sick pay benefits are earned. As of September 30, 2018, liabilities related to compensated absences were approximately $24,777,000. i. Environmental Remediation – Both environmental remediation expenses that relate to current operations and environmental remediation expenses that relate to an existing condition caused by past operations, and which do not contribute to current or future revenue generation are expensed. Assets acquired for environmental remediation are capitalized as appropriate. j. Deferred Outflows/Inflows of Resources – The statement of net position reports a separate section for deferred outflows of resources in addition to assets. Deferred outflows of resources represent the consumption of net position that is applicable to a future reporting period. As of September 30, 2018, the Aviation Department reported deferred outflows of resources for pension related items as discussed in Note 10 and for deferred losses on refundings. The deferred loss on refundings results from the difference in the carrying value of the refunded debt and its reacquisition price. This amount is deferred and amortized over the shorter of the life of the refunded or the refunding debt as a component of interest expense using the weighted-average method, since the results are not significantly different from the effective-interest method, over the remaining life of the old debt or the life of the new debt, whichever is shorter. The statement of net position reports a separate section for deferred inflows of resources in addition to liabilities. Deferred inflows of resources represent an acquisition of net position that is applicable to a future reporting period. As of September 30, 2018, the Aviation Department reported deferred inflows of resources for pension related items as discussed in Note 10 and for other postemployment benefits (OPEB) related items as discussed in Note 12.
MIAMI‐DADE COUNTY AVIATION DEPARTMENT AN ENTERPRISE FUND OF MIAMI‐DADE COUNTY, FLORIDA NOTES TO THE FINANCIAL STATEMENTS SEPTEMBER 30, 2018
22
Note 2—Summary of significant accounting policies (continued) k. Change In Accounting Estimate – The Aviation Department had deferred a capital contribution received on December 20, 2011 related to the conveyance of the rental car center over the period in which the Transportation Infrastructure Financing Innovation Act (TIFIA) loan (see Note 11(b)) remained outstanding as denoted in the reverter clause in the quitclaim deed. Although the TIFIA loan does not represent a liability of the Aviation Department, it was determined that if the Customer Facility Charges and contingent rent related to the rental car center were not sufficient to pay the required debt service of the TIFIA loan, then the Aviation Department may be required to cover the shortfall in order to retain the rental car center. During the year ending September 30, 2018, management obtained additional information which demonstrated that the Customer Facility Charges related to the rental car center has been sufficient to pay down the TIFIA loan in a shorter time frame than is required. Based on this additional information, management determined that it is no longer necessary to defer this capital contribution. The remaining capital contribution of approximately $324,270,000 was recognized during the year ending September 30, 2018 and is included as a change in accounting estimate in the accompanying statement of revenue, expenses, and changes in net position. l. Bond Discount/Premium and Issuance Costs – Discount/premium on bonds are amortized using the straight-line method over the life of the related bond issue since the results are not significantly different from the effective interest method of amortization. Bond issuance costs are expensed as incurred, except any portion related to prepaid insurance costs, which are amortized. m. Pension Plan – The Aviation Department contributes to FRS, a cost-sharing multiemployer plan. The Aviation Department follows GASB Statement No. 68, Accounting and Financial Reporting for Pensions – an amendment to GASB No. 27, GASB Statement No. 71, Pension Transition for Contributions Made Subsequent to the Measurement Date and GASB Statement No. 82, Pension Issues – an amendment to GASB Statements No. 67, 68, and 73. For the purposes of measuring the net pension liability, deferred outflows of resources and deferred inflows of resources related to pensions, and pension expense, information about the fiduciary net position of FRS and HIS and additions to/deductions from FRS and HIS’s fiduciary net position have been determined on the same basis as they are reported by FRS and HIS. For this purpose, benefit payments (including refunds of employee contributions) are recognized when due and payable in accordance with the benefit terms. Investments are reported at fair value. n. Other Postemployment Benefits (OPEB) – The Aviation Department contributes to a single-employer defined-benefit healthcare plan administered by the County. The postretirement health benefits are funded on a pay-as-you go basis (i.e. the County funds on a cash basis as benefits are paid). The Aviation Department follows GASB Statement No. 75, Accounting and Financial Reporting for Postemployment Benefits Other Than Pensions. o. Net Position Classifications – Net position is classified and displayed in three components:
Net Investment In Capital Assets – Consists of capital assets, net of accumulated depreciation and reduced by the outstanding balances of any bonds, notes, or other borrowings and deferred outflows of resources that are attributable to the acquisition, construction, or improvement of those assets. Restricted Net Position – Consists of net position with constraints placed on the use either by (1) external groups, such as creditors, grantors, contributors, or laws or regulations of other governments or (2) law through constitutional provisions or enabling legislation. Unrestricted Net Position – All other net position that does not meet the definition of “restricted” or “net investment in capital assets.”

MIAMI‐DADE COUNTY AVIATION DEPARTMENT AN ENTERPRISE FUND OF MIAMI‐DADE COUNTY, FLORIDA NOTES TO THE FINANCIAL STATEMENTS SEPTEMBER 30, 2018
23
Note 2—Summary of significant accounting policies (continued) p. Revenue Classifications – The Aviation Department defines operating revenue as revenue earned from aviation operations and charged to customers and tenants. Nonoperating revenue includes interest earnings, certain grants, and PFC collections. The components of the major revenue captions are as follows:
Aviation Fees – landing fees, concourse use charges, loading bridge use charges, baggage claim use charges, screening fees, airplane parking fees, and other similar facilities and service use fees and charges. Rentals – rentals of land, buildings, and machinery and equipment. Management Agreements – revenue from the sale of publications, automotive parking fees, pharmacy facilities, baggage services, special services lounges, the Airport Hotel, and the Fuel Farm. Concessions – revenue from the sale of duty-free merchandise, rental car companies, and various services provided by terminal complex concessionaires.
q. Grants from Government Agencies – Grants received for the acquisition or construction of capital assets are recorded as capital contributions, when earned. Grants are earned when costs relating to such capital assets, which are reimbursable under the terms of the grants, have been incurred. During fiscal year 2018, the Aviation Department recorded approximately $48,552,000 in grants relating to contributions consisting of federal and state grants in aid of construction. Grants receivables relating to the contributions as of September 30, 2018 were approximately $23,812,000. r. Passenger Facility Charges – The FAA authorized the Aviation Department to impose a PFC of $3.00 per passenger commencing November 1, 1994. In October 2001, with an effective date of January 1, 2002, the FAA approved an increase in the PFC at MIA to $4.50. The net receipts from PFCs are restricted to be used for funding FAA-approved capital projects and debt service attributable to such approved capital projects. PFC revenue is reported as nonoperating revenue. The Aviation Department has been authorized to collect PFCs on eligible enplaning revenue-generating passengers in the aggregate amount not to exceed $2,597,103,503 including interest, of which $1,430,038,000 has been earned through September 30, 2018. s. Use of Estimates – The preparation of the financial statements requires management of the Aviation Department to make a number of estimates and assumptions relating to the reported amounts of assets and deferred outflows of resources and liabilities and deferred inflows of resources and the disclosure of contingent assets and liabilities at the date of the financial statements and the reported amounts of revenue and expenses during the reporting period. Actual results could differ from those estimates.

MIAMI‐DADE COUNTY AVIATION DEPARTMENT AN ENTERPRISE FUND OF MIAMI‐DADE COUNTY, FLORIDA NOTES TO THE FINANCIAL STATEMENTS SEPTEMBER 30, 2018
24
Note 2—Summary of significant accounting policies (continued) t. Implementation of New Accounting Standards – In June 2015, GASB issued Statement No. 75, Accounting and Financial Reporting for Postemployment Benefits Other Than Pensions, which is effective for fiscal years beginning after June 15, 2017. The primary objective of this statement is to improve accounting and financial reporting by state and local governments for postemployment benefits other than pensions (other postemployment benefits or OPEB). The Aviation Department adopted GASB 75 in the fiscal year 2018 and the results are reflected in the financial statements, in Note 12. The adoption of this statement resulted in a $21.7 million reduction of beginning net position from $953.5 million to $931.8, due to the addition of a total other post-employment benefit liability. In March 2016, GASB issued Statement No. 81, Irrevocable Split-Interest Agreement, which is effective for periods beginning after December 15, 2016. This statement makes certain requirements for governments that receive resources pursuant to an irrevocable split-interest agreement. The adoption of GASB 81 in fiscal year 2018 did not impact the Aviation Department’s basic financial statements and related disclosures. In March 2017, GASB issued Statement No. 85, Omnibus 2017, which is effective for reporting periods beginning after June 15, 2017. This statement addressed a variety of topics including issues related to blending component units, goodwill, fair value measurement and application, and postemployment benefits. The Aviation Department adopted GASB 85 in fiscal year 2018 and the results are reflected in the financial statements, in Note 12 and the OPEB related Required Supplementary Information to the financial statements. In May 2017, GASB issued Statement No. 86, Certain Debt Extinguishment Issues, which is effective for reporting periods beginning after June 15, 2017. This statement establishes the requirements for when a government places cash and other monetary assets acquired with only existing resources in an irrevocable trust to extinguish debt. The adoption of GASB 86 in fiscal year 2018 did not impact the Aviation Department's basic financial statements and related disclosures. u. Future Accounting Standards - In November 2016, GASB issued Statement No. 83, Certain Asset Retirement Obligations, which is effective for reporting periods beginning after June 15, 2018. This statement addresses accounting and financial reporting for certain asset retirement obligation (AROs). The Aviation Department is still in the process of determining what effect, if any, the above statement will have on the basic financial statements and related disclosures.
In January 2017, GASB issued Statement No. 84, Fiduciary Activities, which is effective for reporting periods beginning after December 15, 2018. This statement establishes the criteria for identifying fiduciary activities of all state and local governments. The Aviation Department is still in the process of determining what effect, if any, the above statement will have on the basic financial statements and related disclosures.
In June 2017, GASB issued Statement No. 87, Leases, which is effective for reporting periods beginning after December 15, 2019. This statement establishes a single model for lease accounting based on the foundational principle that leases are financings of the right to use an underlying asset. A lessee is required to recognize a lease liability and an intangible right-to-use lease asset, and a lessor is required to recognize a lease receivable and a deferred inflow of resources. The Aviation Department is still in the process of determining what effect, if any, the above statement will have on the basic financial statements and related disclosures.

MIAMI‐DADE COUNTY AVIATION DEPARTMENT AN ENTERPRISE FUND OF MIAMI‐DADE COUNTY, FLORIDA NOTES TO THE FINANCIAL STATEMENTS SEPTEMBER 30, 2018
25
Note 2—Summary of significant accounting policies (continued) In April 2018, GASB issued Statement No. 88, Certain Disclosures Related to Debt, including Direct Borrowings and Direct Placements, which is effective for reporting periods beginning after June 15, 2018. This statement defines debt for purposes of disclosure in notes to financial statements and establishes additional financial statement note disclosure requirements related to debt obligations of governments, including direct borrowings. The Aviation Department is still in the process of determining what effect, if any, the above statement will have on the basic financial statements and related disclosures. In June 2018, GASB issued Statement No. 89, Accounting for Interest Cost Incurred before the End of a Construction Period, which is effective for reporting periods beginning after December 15, 2019. This statement establishes accounting requirements for interest cost incurred before the end of a construction period. This statement requires that interest cost before the end of a construction period be recognized as an expense in the period in which the cost is incurred for financial statements prepared using the economic resources measurement focus. The Aviation Department is still in the process of determining what effect, if any, the above statement will have on the basic financial statements and related disclosures. In August 2018, GASB issued Statement No. 90, Majority Equity Interests, which is effective for reporting periods beginning after December 15, 2018. This statement modifies previous guidance for reporting a government’s majority equity interest in a legally separate organization and guidance for reporting a component unit if a government acquires 100% equity in that component unit. The Aviation Department is still in the process of determining what effect, if any, the above statement will have on the basic financial statements and related disclosures. Note 3—Cash and cash equivalents and investments The County is authorized through Florida Statutes §218.415, Ordinance No. 84-47, Resolution R-31-09 and its Investment Policy to make certain investments. The Investment Policy was updated and adopted on January 22, 2009 in response to current and possible uncertainties in the domestic and international financial markets. The County’s overall investment objectives are, in order of priority, the safety of principal, liquidity of funds, and maximizing investment income.
As of September 30, 2018, total unrestricted and restricted cash and cash equivalents and investments comprise the following (in thousands): Cash and cash equivalents 886,696$ Investments, including interest receivable 423,006
1,309,702$

MIAMI‐DADE COUNTY AVIATION DEPARTMENT AN ENTERPRISE FUND OF MIAMI‐DADE COUNTY, FLORIDA NOTES TO THE FINANCIAL STATEMENTS SEPTEMBER 30, 2018
26
Note 3—Cash and cash equivalents and investments (continued) The carrying amounts of the Aviation Department’s local deposits were approximately $39,395,000 as of September 30, 2018. All deposits are fully insured by Federal Depository Insurance and are held in qualified public depositories pursuant to Florida Statutes Chapter 280, Florida Security for Public Deposits Act (the Act). Under the Act, all qualified public depositories are required to pledge eligible collateral having a market value equal to or greater than the average daily or monthly balance of all public deposits times the depository’s collateral pledging level. The pledging level may range from 50% to 125% depending upon the depository’s financial condition and establishment period. All collateral must be deposited with an approved financial institution. Any losses to public depositors are covered by applicable deposit insurance, sale of securities pledged as collateral, and, if necessary, assessments against other qualified public depositories of the same type as the depository in default. As a rule, the Aviation Department intends to hold all purchased securities until their final maturity date. There may be occasional exceptions, including, but not limited to the need to sell securities to meet unexpected liquidity needs. Cash, cash equivalents, and investments as of September 30, 2018 are summarized as follows (in thousands):
Cash deposits 39,395$
U.S. government securities 701,585 Treasury bills 143,408 Treasury notes 31,110 Commercial paper 343,244 Money market 50,960
Total cash equivalents and investments 1,270,307
Total cash, cash equivalents, and investments 1,309,702$
At September 30, 2018, the carrying value of cash equivalents and investments included the following (in thousands):
Investment Type Fair Value
Federal Home Loan Mortgage Corporation 162,910$ Federal Home Loan Bank 221,512 Federal Farm Credit Bank 116,155 Federal National Mortgage Association 201,008 Treasury bills 143,408 Treasury notes 31,110 Commercial paper 343,244 Money market 50,960
1,270,307$

MIAMI‐DADE COUNTY AVIATION DEPARTMENT AN ENTERPRISE FUND OF MIAMI‐DADE COUNTY, FLORIDA NOTES TO THE FINANCIAL STATEMENTS SEPTEMBER 30, 2018
27
Note 3—Cash and cash equivalents and investments (continued) a. Credit Risk – The Aviation Department’s Investment Policy (the Policy) minimizes credit risk by restricting authorized investments to: Local Government Surplus Funds Trust Fund or any intergovernmental investment pool authorized pursuant to the Florida Interlocal Cooperation Act; Securities and Exchange Commission (SEC) registered money market funds with the highest credit quality rating from a nationally recognized rating agency; interest-bearing time deposits or savings accounts in qualified public depositories, pursuant to Florida Statutes §280.02, which are defined as banks, savings bank, or savings association organized under the laws of the United States with an office in this state that is authorized to receive deposits, and has deposit insurance under the provisions of the Federal Deposit Insurance Act; direct obligations of the U.S. Treasury; federal agencies and instrumentalities; securities of, or other interest in, any open-end or closed-end management-type investment company or investment trust registered under the Investment Company Act of 1940, provided that the portfolio is limited to the obligations of the U.S. government or any agency or instrumentality thereof and to repurchase agreements fully collateralized by such U.S. government obligations, and provided that such investment company or investment trust takes delivery of such collateral either directly or through an authorized custodian; commercial paper of prime quality with a stated maturity of 270 days or less from the date of its issuance, which has the highest letter and numerical rating as provided for by at least one nationally recognized rating service; banker acceptances that have a stated maturity of 180 days or less from the date of its issuance, and have the highest letter and numerical rating as provided for by at least one nationally recognized rating service, and are drawn on and accepted by commercial banks and that are eligible for purchase by the Federal Reserve Bank; and investments in Repurchase Agreements (Repos) collateralized by securities authorized by this policy. All Repos shall be governed by a standard SIFMA Master Repurchase Agreement; municipal securities issued by U.S. state or local governments, having at time of purchase, a stand-alone credit rating of AA or better assigned by two or more recognized credit rating agencies or a short-term credit rating of A1/P1 or equivalent from one or more recognized credit rating agencies. The table below summarizes the investments by type and credit ratings as of September 30, 2018:
S&P Moody’s Fitch
Federal Home Loan Mortgage Corporation AA+/A-1+ Aaa/ P-1 AAA/F1+ Federal Home Loan Bank AA+/A-1+ Aaa/P-1 N/AFederal Farm Credit Bank AA+/A-1+ Aaa /P-1 AAA /F1+Federal National Mortgage Association AA+/A-1+ Aaa /P-1 AAA /F1+Treasury bills AA+/A-1+ Aaa /P-1 AAA /F1+Treasury notes AA+/A-1+ Aaa /P-1 AAA /F1+Commercial paper NA/A1 NA/P-1 NA/F1
Money market AAAM Aaa-mf AAA mmf
Investment Type
Credit Rating

MIAMI‐DADE COUNTY AVIATION DEPARTMENT AN ENTERPRISE FUND OF MIAMI‐DADE COUNTY, FLORIDA NOTES TO THE FINANCIAL STATEMENTS SEPTEMBER 30, 2018
28
Note 3—Cash and cash equivalents and investments (continued) b. Custodial Credit Risk – The Policy requires that bank deposits be secured per Chapter 280, Florida Statutes. This requires local governments to deposit funds only in financial institutions designated as qualified public depositories by the Chief Financial Officer of the State of Florida and creates the Public Deposits Trust Fund, a multiple financial institution pool with the ability to assess its member financial institutions for collateral shortfalls if a default or insolvency has occurred. As of September 30, 2018, all of the County’s bank deposits were in qualified public depositories. The Policy requires the execution of a Custodial Safekeeping Agreement for all purchased securities and shall be held for the credit of the County in an account separate and apart from the assets of the financial institution.
c. Concentration of Credit Risk – The Policy establishes limitations on portfolio composition by investment type and by issuer to limit its exposure to concentration of credit risk. The Policy provides that a maximum of 50% of the portfolio may be invested in the State of Florida Local Government Surplus Trust Fund (the Pool); however, bond proceeds may be temporarily deposited in the Pool until other investments have been purchased. Prior to any investment in the Pool, approval must be received from the Board. A maximum of 30% of the portfolio may be invested in SEC-registered money market funds with no more than 10% to any single money market fund. A maximum of 20% of the portfolio may be invested in interest-bearing time deposits or demand accounts with no more than 5% deposited with any one issuer. There is no limit on the percentage of the total portfolio that may be invested in direct obligations of the U.S. Treasury or federal agencies and instrumentalities, with no limits on individual issuers (investment in agencies containing call options shall be limited to a maximum of 25% of the total portfolio). A maximum of 5% of the portfolio may be invested in open-end or closed-end funds. A maximum of 50% of the portfolio may be in prime commercial paper with a maximum of 5% with any one issuer. A maximum of 25% of the portfolio may be invested in bankers’ acceptances with a maximum of 10% with any one issuer, but a maximum of 60% of the portfolio may be invested in both commercial paper and bankers’ acceptances. A maximum of 20% of the portfolio may be invested in repurchase agreements with the exception of one (1) business day agreement, with a maximum of 10% of the portfolio in any one institution or dealer with the exception of one (1) business day agreement. Investments in derivative products shall be prohibited by the County. A maximum of 25% of the portfolio may be directly invested in municipal obligations, up to 5% with any one municipal issuer. As of September 30, 2018, the following issuers held 5% or more of the investment portfolio: Issuer
Federal Home Loan Mortgage Corporation 12.82%Federal Home Loan Bank 17.44Federal Farm Credit Bank 9.14Federal National Mortgage Association 15.82Treasury bills 11.29Commercial paper 27.02

MIAMI‐DADE COUNTY AVIATION DEPARTMENT AN ENTERPRISE FUND OF MIAMI‐DADE COUNTY, FLORIDA NOTES TO THE FINANCIAL STATEMENTS SEPTEMBER 30, 2018
29
Note 3—Cash and cash equivalents and investments (continued) d. Interest Rate Risk – The Policy limits interest rate risk by requiring the matching of known cash needs and anticipated net cash outflow requirements; following historical spread relationships between different security types and issuers; and evaluating both interest rate forecasts and maturity dates to consider short-term market expectations. The Policy requires that investments made with current operating funds shall maintain a weighted average of no longer than one year. Investments for bond reserves, construction funds, and other nonoperating funds shall have a term appropriate to the need for funds and in accordance with debt covenants. The Policy limits the maturity of an investment to a maximum of five years.
As of September 30, 2018, the County had the following investments with the respective weighted average maturity in years:
Investment Type
Federal Home Loan Mortgage Corporation 0.508 Federal Home Loan Bank 2.180 Federal Farm Credit Bank 0.362 Federal National Mortgage Association 1.709 Treasury bills 0.182 Treasury notes 0.900 Commercial paper 0.088 Money market 0.003
e. Foreign Currency Risk – The Policy limits the Aviation Department’s foreign currency risk by excluding foreign investments as an investment option. f. Fair Value Measurement – The Aviation Department follows GASB Statement No. 72 Fair Value Measurement and Application, issued in February 2015, by categorizing its investments according to the fair value hierarchy established by generally accepted accounting principles. The hierarchy is based on the valuation inputs used to measure the fair value of the assets. Level 1 inputs are quoted prices in active markets for identical assets; Level 2 inputs are significant other observable inputs; Level 3 inputs are significant unobservable inputs. Level 1 assets are valued using quoted prices in an active market for identical assets that can be readily obtained, and Level 2 assets are valued using a matrix pricing technique of quoted prices for similar assets or liabilities in active markets. Money market funds are reported at amortized cost which approximates fair value.

MIAMI‐DADE COUNTY AVIATION DEPARTMENT AN ENTERPRISE FUND OF MIAMI‐DADE COUNTY, FLORIDA NOTES TO THE FINANCIAL STATEMENTS SEPTEMBER 30, 2018
30
Note 3—Cash and cash equivalents and investments (continued) At September 30, 2018, the carrying value of cash equivalents and investments included the following (in thousands): Investments at Fair Value Fair Value Level 1 Level 2 Level 3
Federal Home Loan Mortgage Corporation 162,910$ -$ 162,910$ -$ Federal Home Loan Bank 221,512 - 221,512 - Federal Farm Credit Bank 116,155 - 116,155 - Federal National Mortgage Association 201,008 - 201,008 - Treasury bills 143,408 - 143,408 - Treasury notes 31,110 - 31,110 - Commercial paper 343,244 - 343,244 - Total Investments at Fair Value 1,219,347 -$ 1,219,347$ -$
Money market at amortized cost 50,960
Total Investments and Cash Equivalents 1,270,307$
Note 4—Disaggregation of receivables and payables a. Receivables – As of September 30, 2018, accounts receivable, net of the allowance for doubtful accounts, in the amount of $44,351,000 comprise accounts from customers (tenants, carriers, and business partners) representing 97.1%, and government agencies representing 2.9%. American Airlines represents $20,460,000 or 46.1% of accounts receivable, net of the allowance for doubtful accounts. American Airlines also represents approximately $260,127,000 or 31.7% of total operating revenue for the year ended September 30, 2018. b. Payables – As of September 30, 2018, accounts payable and accrued expenses and contracts payables totaled $65,800,000. This amount comprised 95% for amounts payable to vendors, 4% due to employees, and 1% due to government agencies.

MIAMI‐DADE COUNTY AVIATION DEPARTMENT AN ENTERPRISE FUND OF MIAMI‐DADE COUNTY, FLORIDA NOTES TO THE FINANCIAL STATEMENTS SEPTEMBER 30, 2018
31
Note 5—Capital assets and depreciation A summary of capital asset activity and changes in accumulated depreciation for the year ended September 30, 2018 is as follows (in thousands):
Balance at Deletions/ Balance at
September 30, Additions/ Transfers and September 30,
2017 Transfers Retirements 2018
Capital assets not being depreciated:Land 127,026$ -$ -$ 127,026$ Construction in progress 82,144 131,927 (35,765) 178,306
Total capital assets notbeing depreciated 209,170 131,927 (35,765) 305,332
Capital assets being depreciated:Buildings, improvements, and
systems 7,203,928 27,645 (136) 7,231,437 Infrastructure 1,510,558 1,209 - 1,511,767 Furniture, machinery, and
equipment 853,411 22,633 (4,830) 871,214
Total capital assetsbeing depreciated 9,567,897 51,487 (4,966) 9,614,418
Less accumulated depreciation for:Buildings, improvements, and
systems (2,315,006) (174,915) 136 (2,489,785) Infrastructure (883,484) (42,865) - (926,349) Furniture, machinery, and
equipment (400,309) (45,041) 3,741 (441,609)
Total accumulateddepreciation (3,598,799) (262,821) 3,877 (3,857,743)
Depreciable capitalassets, net 5,969,098 (211,334) (1,089) 5,756,675
Net capital assets 6,178,268$ (79,407)$ (36,854)$ 6,062,007$

MIAMI‐DADE COUNTY AVIATION DEPARTMENT AN ENTERPRISE FUND OF MIAMI‐DADE COUNTY, FLORIDA NOTES TO THE FINANCIAL STATEMENTS SEPTEMBER 30, 2018
32
Note 6—Debt a. Aviation Revenue Bonds – Aviation Revenue Bonds are issued to finance the construction of facilities at the airports pursuant to the Trust Agreement and are payable solely from and are collateralized by a pledge of net revenue, as defined in the Trust Agreement. The Aviation Revenue Bonds do not constitute a debt of the County or a pledge of the full faith and credit of the County (in thousands):
Revenue Bonds Issue date Rate Maturity Amount
Serial bonds:2015A July 2015 5.000% 2022-2034 27,690$ 2010B August 2010 3.625%-5.000% 2019-2031 193,585 2010A January 2010 4.250%-5.250% 2019-2031 127,445 2009B May 2009 4.125%-4.625% 2019-2023 19,345 2009A May 2009 5.500%-5.750% 2019-2023 44,510 2008B June 2008 4.125% 2019 1,365 2002A December 2002 5.050% 2037 15
413,955 Term bonds:
2015A July 2015 4.250%–5.000% 2037–2046 45,595 2010B August 2010 5.000% 2036–2042 274,225 2010A January 2010 5.470% 2035 81,485 2008A June 2008 5.500% 2042 15
401,320
Miami‐Dade County Aviation Department Debt Outstanding, September 30, 2018
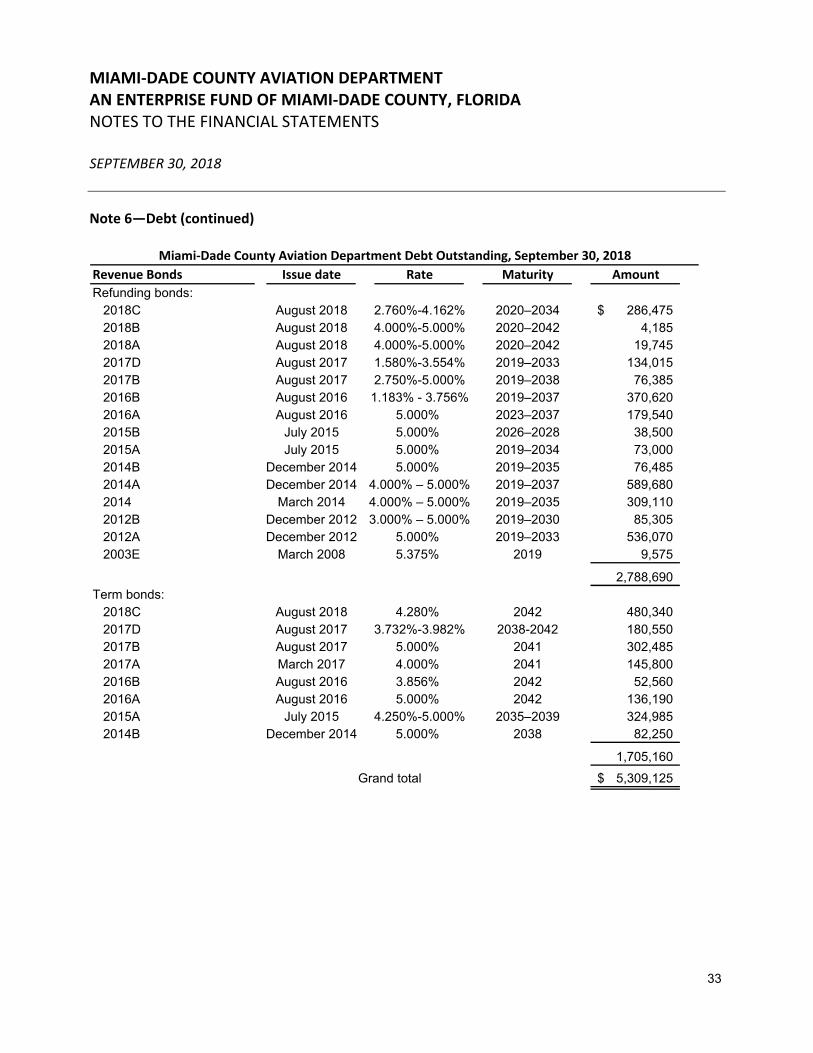
MIAMI‐DADE COUNTY AVIATION DEPARTMENT AN ENTERPRISE FUND OF MIAMI‐DADE COUNTY, FLORIDA NOTES TO THE FINANCIAL STATEMENTS SEPTEMBER 30, 2018
33
Note 6—Debt (continued)
Revenue Bonds Issue date Rate Maturity Amount
Refunding bonds:2018C August 2018 2.760%-4.162% 2020–2034 286,475$ 2018B August 2018 4.000%-5.000% 2020–2042 4,185 2018A August 2018 4.000%-5.000% 2020–2042 19,745 2017D August 2017 1.580%-3.554% 2019–2033 134,015 2017B August 2017 2.750%-5.000% 2019–2038 76,385 2016B August 2016 1.183% - 3.756% 2019–2037 370,620 2016A August 2016 5.000% 2023–2037 179,540 2015B July 2015 5.000% 2026–2028 38,500 2015A July 2015 5.000% 2019–2034 73,000 2014B December 2014 5.000% 2019–2035 76,485 2014A December 2014 4.000% – 5.000% 2019–2037 589,680 2014 March 2014 4.000% – 5.000% 2019–2035 309,110 2012B December 2012 3.000% – 5.000% 2019–2030 85,305 2012A December 2012 5.000% 2019–2033 536,070 2003E March 2008 5.375% 2019 9,575
2,788,690 Term bonds:
2018C August 2018 4.280% 2042 480,340 2017D August 2017 3.732%-3.982% 2038-2042 180,550 2017B August 2017 5.000% 2041 302,485 2017A March 2017 4.000% 2041 145,800 2016B August 2016 3.856% 2042 52,560 2016A August 2016 5.000% 2042 136,190 2015A July 2015 4.250%-5.000% 2035–2039 324,985 2014B December 2014 5.000% 2038 82,250
1,705,160
Grand total 5,309,125$
Miami‐Dade County Aviation Department Debt Outstanding, September 30, 2018

MIAMI‐DADE COUNTY AVIATION DEPARTMENT AN ENTERPRISE FUND OF MIAMI‐DADE COUNTY, FLORIDA NOTES TO THE FINANCIAL STATEMENTS SEPTEMBER 30, 2018
34
Note 6—Debt (continued) b. Maturities of Bonds Payable – The annual debt service requirements are as follows (in thousands):
Aviation
Revenue
Bonds
Years Ending September 30, Principal Interest
2019 126,190$ 233,136$ 2020 135,145 236,665 2021 141,500 230,502 2022 143,925 224,135 2023 147,630 218,360 2024-2028 820,735 995,484 2029-2033 1,032,090 793,809 2034-2038 1,378,525 518,900 2039-2043 1,369,610 163,343 2044-2046 13,775 1,258
5,309,125 3,615,592$
Plus unamortized premium 275,732
5,584,857$
On August 30, 2018, the Aviation Department issued 19,745,000 of Refunding Bonds at a premium of approximately $1,359,000, Series 2018A with an interest rate of 4.00% to 5.00%. The proceeds were used as follows: partially refund $10,100,000 of principal amount outstanding for the Revenue Bond Series 2003E partially refund $10,820,000 of principal amount outstanding for the Revenue Bond Series 2008A
The net proceeds were placed in an irrevocable trust account to refund the 2003E Bonds which will mature on October 1, 2018 and the 2008A Bonds which will mature on October 1, 2018. Payments were scheduled to be made accordingly by the Trustees. As of September 30, 2018, the Irrevocable Escrow Account for the advanced refunding had approximately $21,426,000. On August 30, 2018, the Aviation Department issued 4,185,000 of Refunding Bonds at a premium of approximately $255,000, Series 2018B with an interest rate of 4.00% to 5.00%. The proceeds were used as follows: partially refund $4,405,000 of principal amount outstanding for the Revenue Bond Series 2008B

MIAMI‐DADE COUNTY AVIATION DEPARTMENT AN ENTERPRISE FUND OF MIAMI‐DADE COUNTY, FLORIDA NOTES TO THE FINANCIAL STATEMENTS SEPTEMBER 30, 2018
35
Note 6—Debt (continued) The net proceeds were placed in an irrevocable trust account to refund the 2008B Bonds which will mature on October 1, 2018. Payments were scheduled to be made accordingly by the Trustees. As of September 30, 2018, the Irrevocable Escrow Account for the advanced refunding had approximately $4,494,000. On August 30, 2018, the Aviation Department issued 766,815,000 of Refunding Bonds at par, Series 2018C with an interest rate of 2.76% to 4.28%. The proceeds were used as follows: partially advanced refund $316,025,000 of principal amount outstanding for the Revenue Bond Series
2009A partially advanced refund $49,300,000 of principal amount outstanding for the Revenue Bond Series
2009B partially advanced refund $363,935,000 of principal amount outstanding for the Revenue Bond Series
2010A
The net proceeds were placed in an irrevocable trust account to refund the 2009A Bonds which will mature on October 1, 2019, 2009B Bonds which will mature on October 1, 2019, and the 2010A Bonds which will mature on October 1, 2020. Payments were scheduled to be made accordingly by the Trustees. As of September 30, 2018, the Irrevocable Escrow Account for the advanced refunding had approximately $777,528,000. As a result, the refunded principal portion of the Revenue Bond Series 2003E, 2008A, 2008B, 2009A, 2009B, and 2010A are considered defeased and the liability for these bonds were removed from long-term debt. Accordingly, the assets and liabilities for the portion of the refunded Series are not included in the Aviation Department’s financial statements. Prior to refunding, the net cash flow needed was approximately $1,455,347,000. The new refunding debt service is approximately $1,343,102,000. As a result of the refunding, the Aviation Department had a net present value savings of approximately $71,379,000. On August 29, 2017, the Aviation Department issued $314,565,000 of Refunding Bonds, Series 2017D with an interest rate of 1.580% to 3.982%. The net proceeds were placed in an irrevocable trust account to refund the 2003E Bonds which matured on April 1, 2018, 2008A Bonds which will mature on October 1, 2018, and 2009A Bonds which will mature on October 1, 2019. Payments were scheduled to be made accordingly by the Trustees. As of September 30, 2018, the Irrevocable Escrow Account for the advanced refunding had approximately $271,917,000. On August 25, 2016, the Aviation Department issued $315,730,000 of Refunding Bonds, Series 2016A with an interest rate of 5.00%. The net proceeds were placed in an irrevocable trust account to refund the 2007B Bonds which matured on October 1, 2017, 2008B Bonds which will mature on October 1, 2018, 2009B Bonds which will mature on October 1, 2019, and the 2010A Bonds which will mature on October 1, 2020. Payments were scheduled to be made accordingly by the Trustees. As of September 30, 2018, the Irrevocable Escrow Account for the advanced refunding had approximately $330,619,000.

MIAMI‐DADE COUNTY AVIATION DEPARTMENT AN ENTERPRISE FUND OF MIAMI‐DADE COUNTY, FLORIDA NOTES TO THE FINANCIAL STATEMENTS SEPTEMBER 30, 2018
36
Note 6—Debt (continued) On August 25, 2016, the Aviation Department issued $428,645,000 of Refunding Bonds, Series 2016B with an interest rate of 0.950% to 3.856%. The net proceeds were placed in an irrevocable trust account to refund the 2003E Bonds which matured on April 1, 2018, 2007A Bonds which matured on October 1, 2017, 2007C Bonds which matured on October 1, 2017, 2008A Bonds which will mature on October 1, 2018, and the 2009A Bonds which will mature on October 1, 2019. Payments were scheduled to be made accordingly by the Trustees. As of September 30, 2018, the Irrevocable Escrow Account for the advanced refunding had approximately $183,253,000. Bond premium is added, and bond discount is deducted from the face amount of bonds payable. Deferred loss on defeased debt is shown separately as a deferred outflow in the statements of net position in accordance with GASB Statement No. 65. Bond premium and discount are amortized as additional interest expense using the straight-line method, which approximates the effective-interest method. Amortization of bond discount or premium for Aviation Revenue Bonds and Double-Barreled Aviation Bonds was approximately $21,422,000 for year ended September 30, 2018, and is included in interest expense in the accompanying statement of revenue, expenses, and changes in net position. c. Double-Barreled Aviation Bond – On March 4, 2010, the County issued its Double-Barreled Aviation Bond (General Obligation), Series 2010, in the aggregate principal amount of $239,775,000. The Series 2010 Bonds are a General Obligation of the County, secured by the full faith, credit and taxing power of the County. The Series 2010 Bonds are payable from ad valorem taxes levied on all taxable property in the County, without limitation as to rate or amount, to the extent that Net Available Airport Revenues are insufficient to pay debt services on the Series 2010 Bonds. “Net Available Airport Revenues” is defined to mean any unencumbered funds held for the credit of the Improvement Fund created under the Trust Agreement after the payment of all obligations of the County pertaining to the County airports which are payable pursuant to, and subject to the restrictions of (i) the Trust Agreement, (ii) any Airline Use Agreement then in effect or (iii) any other indenture, trust agreement, or contract. Series 2010 was issued to provide long-term financing for certain capital improvement comprising a part of the Capital Improvement Program for the Aviation Department. Proceeds of the Series 2010 Bonds will be used for financing or reimbursing the County for costs of the acquisition, construction, improvement and/or installation by the Aviation Department of its MIA Mover Program and a portion of its North Terminal Program. The Series 2010 bonds bear stated interest ranging from 2.00% to 5.00%, with $129,995,000 serial bonds due July 1, 2012 to 2032 and $109,760,000 term bonds due July 1, 2033 to 2041.
Issue Date Rate Maturity Amount
Revenue serial:2010 March 2010 3.500%-5.000% 2019-2032 99,250$
99,250 Revenue term:
2010 March 2010 4.750%–5.000% 2033–2041 109,760
109,760
Total 209,010$
Miami‐Dade County Aviation Department Debt Outstanding (In Thousands)
September 30, 2018

MIAMI‐DADE COUNTY AVIATION DEPARTMENT AN ENTERPRISE FUND OF MIAMI‐DADE COUNTY, FLORIDA NOTES TO THE FINANCIAL STATEMENTS SEPTEMBER 30, 2018
37
Note 6—Debt (continued) d. Maturities of Double-Barreled Aviation Bonds Payable – The annual debt service requirements are as follows (in thousands):
General
Obligation
Bonds
Years Ending September 30, Principal Interest
2019 5,175$ 10,256$ 2020 5,375 10,059 2021 5,590 9,843 2022 5,870 9,564 2023 6,160 9,271 2024-2028 35,635 41,525 2029-2033 45,440 31,719 2034-2038 57,740 19,420 2039-2041 42,025 4,271
209,010 145,928$
Plus unamortized premium 3,881
212,891$
e. State Infrastructure Bank Note – On February 6, 2007, the Board approved the construction of the N.W. 25th Street Viaduct Project (Viaduct Project) by the Florida Department of Transportation (FDOT) and approved a County loan in the amount of $50 million from the FDOT State Infrastructure Bank to fund the County’s share of the total cost of the Viaduct Project. FDOT and the County subsequently entered into a joint participation agreement on March 12, 2007 whereby FDOT will construct the Viaduct Project. The loan, which closed on March 21, 2007, is secured by a County covenant to annually budget and appropriate from the County legally available non-ad valorem revenue funds sufficient to pay debt service costs. The debt service costs will be reimbursed to the County by the Aviation Department. The funds were held in escrow by the FDOT State Infrastructure Bank for the construction of the project. As of September 30, 2018, there was no cash held in escrow by agent. As of September 30, 2018, the outstanding loan balance was approximately $5,274,000. The loan bears interest at 2% per annum. The maturity date of the loan is October 1, 2019. The annual debt service requirements are as follows (in thousands): Years Ending September 30, Principal Interest
2019 -$ -$ 2020 5,274 105
5,274$ 105$

MIAMI‐DADE COUNTY AVIATION DEPARTMENT AN ENTERPRISE FUND OF MIAMI‐DADE COUNTY, FLORIDA NOTES TO THE FINANCIAL STATEMENTS SEPTEMBER 30, 2018
38
Note 6—Debt (continued) f. Capital Leases – The Aviation Department has entered into various agreements with banks to provide capital to finance the lease/purchase of certain energy improvement equipment. During fiscal year 2018, the Aviation Department entered into a new capital lease financing agreement totaling $47.6 million. The future minimum payments for principal and interest under these agreements are as follows (in thousands): Years Ending September 30, Principal Interest
2019 3,447$ 2,405$ 2020 8,295 3,094 2021 4,994 2,022 2022 4,379 1,863 2023 4,690 1,734 2024-2028 27,817 6,431 2029-2033 24,734 2,288 2034 2,327 68
80,683$ 19,905$
The capitalized cost related to the capital leases is $56.8 million, which has a carrying value, net of accumulated depreciation of $8.7 million, of $48.1 million.

MIAMI‐DADE COUNTY AVIATION DEPARTMENT AN ENTERPRISE FUND OF MIAMI‐DADE COUNTY, FLORIDA NOTES TO THE FINANCIAL STATEMENTS SEPTEMBER 30, 2018
39
Note 6—Debt (continued) g. Long-Term Liabilities – Changes in long-term liabilities are as follows (in thousands):
September 30, Total at
2017 September 30, Due Within
(as restated) Additions Reductions 2018 One Year
Revenue bonds 5,391,080$ 790,745$ (872,700)$ 5,309,125$ 126,190$
Add amounts:
For issuance premiums/
discounts, net 289,306 7,566 (21,140) 275,732 -
General obligation bonds 213,940 - (4,930) 209,010 5,175
Add amounts:
For issuance premium 4,163 - (282) 3,881 -
State Infrastructure Bank loan 10,073 - (4,799) 5,274 -
Total bonds and loans
payable, net 5,908,562 798,311 (903,851) 5,803,022 131,365
Other liabilities:
Commercial paper notes 60,066 571,417 (491,315) 140,168 -
Environmental remediation 35,920 3,545 (1,110) 38,355 4,175
Compensated absences 23,784 11,297 (10,304) 24,777 7,042
Rent and contribution
advances 339,352 7,992 (334,116) 13,228 7,992
Capital lease payable 33,081 47,643 (41) 80,683 3,447
Postemployment benefits 25,280 - (1,363) 23,917 -
Net pension liability:
FRS 65,109 - (4,019) 61,090 -
HIS 18,776 - (1,515) 17,261 -
Total long-term
liabilities 6,509,930$ 1,440,205$ (1,747,634)$ 6,202,501$ 154,021$

MIAMI‐DADE COUNTY AVIATION DEPARTMENT AN ENTERPRISE FUND OF MIAMI‐DADE COUNTY, FLORIDA NOTES TO THE FINANCIAL STATEMENTS SEPTEMBER 30, 2018
40
Note 6—Debt (continued) h. Commercial Paper Notes – At September 30, 2018, the County had $140,000,000 outstanding of Commercial Paper Notes (Notes) plus accrued interest of $168,329. The proceeds of the Notes were used to finance certain airport and airport related improvements. The Notes and accrued interest are payable solely from proceeds of future Revenue Bonds and any unencumbered monies in the Improvement Fund. The Notes are secured and payable under an irrevocable transferrable direct-pay letter of credit. The letter of credit, in the amount of $200,000,000, was approved for the purpose of making funds readily available for the payment of principal and interest on the Notes. As of September 30, 2018, there was $60,000,000 available on the letter of credit. The letter of credit expires on March 2, 2019, subject to earlier termination as provided therein and to extension or renewal as provided therein. On February 6, 2019, an amendment to the letter of credit agreement was executed, extending the expiration date to March 2, 2021. The outstanding Notes and accrued interest have been excluded from current liabilities because the Aviation Department intends to refinance the Notes with long-term revenue bonds. Following is a schedule of changes in Notes (in thousands):
Balance as of October 1, 2017 60,066$ Additions 571,417 Deductions (491,315)
Balance as of September 30, 2018 140,168$
i. Defeased Debt – The County defeased certain series of Revenue Bonds by placing the proceeds of the new bond issues in irrevocable trusts. Such proceeds are invested in direct obligations of the U.S. government and will provide for all future debt service payments on the old bonds. The related assets and liabilities are not included in the financial statements of the Aviation Department.
Defeasance Date Maturity 2018
Revenue bonds:2003E August 2018 2020 10,100$ 2008A August 2018 2039 - 2042 10,820 2008B August 2018 2020 - 2022 4,405 2009A August 2018 2024 - 2042 316,025 2009B August 2018 2038 - 2042 49,300 2010A August 2018 2027 - 2042 363,935
754,585$

MIAMI‐DADE COUNTY AVIATION DEPARTMENT AN ENTERPRISE FUND OF MIAMI‐DADE COUNTY, FLORIDA NOTES TO THE FINANCIAL STATEMENTS SEPTEMBER 30, 2018
41
Note 7—Restricted assets A summary of restricted assets at September 30, 2018 is as follows (in thousands): Construction account 485,324$ Bond service and reserve account 434,280 Reserve maintenance 79,609
999,213$
Note 8—Management, operating, concession, and lease agreements a. Management Agreements – Certain properties are provided under management agreements with nationally recognized firms or local firms with expertise in their areas of service. Among these properties are public parking, special service lounges, Fuel Farm, and the Airport Hotel. The Aviation Department receives all revenue. These agreements provide for reimbursement of approved budgeted operating expenses and a fixed management fee or fees based on percentages of revenue or operating profits of the facilities. While the Aviation Department generally looks toward the management companies for recommendations relative to operation of the facilities, the Aviation Department does exercise complete budgetary control and establishes standards, guidelines, and goals for growth and performance. Such actions are taken within the rights reserved to the Aviation Department under these agreements to control all aspects of the businesses. These include such matters as pricing, staffing, employee benefits, operating hours, facilities maintenance requirements, service levels, market selections, personnel policies, and marketing strategies. In the event the management firm is not performing in accordance with the standards established by the Aviation Department, the Aviation Department has the authority to cancel such agreements.
b. Operating Agreements – Certain other services are provided under operating agreements with nationally recognized firms or local firms with expertise in their areas of service. These agreements provide necessary services of employee shuttle transportation and janitorial services to the Aviation Department. These agreements provide for reimbursement of approved budgeted operating expenses and a fixed management fee. While the Aviation Department generally looks toward the operating companies for recommendations relative to these operations, the Aviation Department does exercise complete budgetary control and establishes standards, guidelines, and goals for service and performance. Such actions are taken within the rights reserved to the Aviation Department under these agreements to control all aspects of the businesses. These include such matters as personnel policies, staffing, employee benefits, facilities maintenance requirements, and service levels. In the event the operating firm is not performing in accordance with the standards established by the Aviation Department, the Aviation Department has the authority to cancel such operating agreements. The operating firms do not act as general agents on behalf of the County and, therefore, cannot obligate or commit the Aviation Department beyond the scope of what is required to run the day-to-day operations of managed properties as established by the budget approved by the Aviation Department. The expenses associated with the operation of these facilities and services are recorded as operating expenses under operating agreements in the accompanying statement of revenue, expenses, and changes in net position.

MIAMI‐DADE COUNTY AVIATION DEPARTMENT AN ENTERPRISE FUND OF MIAMI‐DADE COUNTY, FLORIDA NOTES TO THE FINANCIAL STATEMENTS SEPTEMBER 30, 2018
42
Note 8—Management, operating, concession, and lease agreements (continued) c. Concession Agreements – The Aviation Department has entered into concession agreements with retail stores and newsstands, duty-free merchandise shops, food and beverage facilities, various rent-a-car companies, aeronautical service companies, and other passenger services through 2023. The agreements consist of both cancelable and noncancellable agreements and provide for a minimum annual rental and a franchise fee based on a percentage of the gross revenue, whichever is greater. These agreements generated revenue of approximately $202,555,000 during fiscal year 2018. Minimum future fees under such noncancellable concession agreements as of September 30, 2018 are as follows (in thousands):
Years Ending September 30,
2019 114,706$ 2020 112,355 2021 110,620 2022 102,538 2023 73,692
513,911$
d. Lease Agreements – The leasing operations of the Aviation Department consist principally of the leasing of land, buildings, and office space. The lease agreements consist of both cancelable and noncancellable agreements and permit the Aviation Department to periodically adjust rents and maximize operational flexibility. Minimum future rentals under such noncancellable lease agreements as of September 30, 2018 are as follows (in thousands): Years Ending September 30,
2019 10,585$ 2020 9,929 2021 8,744 2022 8,457 2023 8,222 2024-2028 28,945 2029-2033 10,146 2034-2038 8,395 2039-2043 5,031 2044-2048 3,094 2049-2051 1,848
103,396$
The Aviation Department recognized approximately $149,111,000 of rental income for the year ended September 30, 2018.

MIAMI‐DADE COUNTY AVIATION DEPARTMENT AN ENTERPRISE FUND OF MIAMI‐DADE COUNTY, FLORIDA NOTES TO THE FINANCIAL STATEMENTS SEPTEMBER 30, 2018
43
Note 9—Insurance The Aviation Department, along with most other County departments, participates in the self-insurance program of the County for workers’ compensation, automobile and general liability insurance covering employees and officials of the County. The program is administered by the Risk Management Division of the Internal Services Department. Allocations of the self-insurance programs are based on the Aviation Department’s claims history and administrative costs to adjudicate the claims. The long-term estimated liability for claims payable, including incurred but not reported, is recorded and retained at the County level. Therefore, such long-term liability is not included in the accompanying financial statements. The Aviation Department’s long-term liability for workers’ compensation and general liability is estimated to be approximately $3,493,000 as of September 30, 2018, based on an independent actuarial valuation. The short-term liability for claims payable in the amount of approximately $559,000 is included in due to County Agencies in the accompanying statement of net position as of September 30, 2018. The Aviation Department also pays premiums to commercial insurance carriers for airport liability insurance and property insurance. The airport liability coverage provides comprehensive general liability, contractual liability, and personal injury liability at all airports. The limit of liability is $1 billion with a self-insured retention of $50,000 per occurrence and an annual aggregate retention of $500,000. The limit for personal injury is $50 million per occurrence. The property of the Aviation Department is insured under a countywide master program that covers most County properties. The Aviation Department allocation is based on the value of the property of the Aviation Department as a percentage of the total value of the property insured. The limit is $350 million countywide with a $5 million deductible per occurrence for most perils and a $200 million deductible for Named Storms. The sublimit for flood is $50 million. Terrorism is included in the program with a limit of $200 million. The Business Interruption limit for the Aviation Department is $17.9 million. There were no significant reductions in coverage in 2018. The amounts of insurance settlements during the past three fiscal years have not exceeded the Aviation Department’s insurance coverage. Note 10—Retirement benefits Miami Dade County provides retirement benefits to its employees through the FRS and a Deferred Retirement Option Program (DROP), as well as state approved OPEB in the form of subsidized health insurance premiums. Florida Retirement System Overview – The County participates in the FRS. The FRS was created in Chapter 121, Florida Statutes, to provide a defined benefit pension plan for participating public employees. The FRS was amended in 1998 to add the DROP under the defined benefit plan and amended in 2000 to provide a defined contribution plan alternative to the defined benefit plan for FRS members effective October 1, 2002. This integrated defined contribution pension plan is the FRS Investment Plan. Chapter 112, Florida Statutes, established the Retiree HIS Program, a cost-sharing multiple-employer defined benefit pension plan, to assist retired members of any state-administered retirement system in paying the costs of health insurance.

MIAMI‐DADE COUNTY AVIATION DEPARTMENT AN ENTERPRISE FUND OF MIAMI‐DADE COUNTY, FLORIDA NOTES TO THE FINANCIAL STATEMENTS SEPTEMBER 30, 2018
44
Note 10—Retirement benefits (continued) Essentially all regular employees of the County are eligible to enroll as members of the State-administered FRS. Provisions relating to the FRS are established by Chapters 121 and 122, Florida Statutes; Chapter 112, Part IV, Florida Statutes; Chapter 238, Florida Statutes; and FRS Rules, Chapter 60S, Florida Administrative Code; wherein eligibility, contributions, and benefits are defined and described in detail. Such provisions may be amended at any time by further action from the Florida Legislature. The FRS is a single retirement system administered by the Florida Department of Management Services, Division of Retirement, and consists of the two cost-sharing, multiple-employer defined benefit plans and other nonintegrated programs. A comprehensive annual financial report of the FRS, which includes its financial statements, required supplementary information, actuarial report, and other relevant information, is available from the Florida Department of Management Services’ Web site (http://www.dms.myflorida.com/workforce_operations/retirement/publications). FRS Pension Plan
Plan Description – The FRS Pension Plan (FRS Plan) is a cost-sharing multiple-employer defined benefit pension plan, with DROP for eligible employees. The general classes of membership are as follows:
Regular Class – Members of the FRS who do not qualify for membership in the other classes.
Elected County Officers Class – Members who hold specified elective offices in local government.
Senior Management Service Class (SMSC) – Members in senior management level positions.
Special Risk Class – Members who are employed as law enforcement officers and meet the criteria to qualify for this class.
Employees enrolled in the FRS Plan prior to July 1, 2011 vest at six years of creditable service and employees enrolled in the FRS Plan on or after July 1, 2011 vest at eight years of creditable service. All vested members, enrolled prior to July 1, 2011, are eligible for normal retirement benefits at age 62 or at any age after 30 years of service (except for members classified as special risk who are eligible for normal retirement benefits at age 55 or at any age after 25 years of service). All members enrolled in the FRS Plan on or after July 1, 2011, once vested, are eligible for normal retirement benefits at age 65 or any time after 33 years of creditable service (except for members classified as special risk who are eligible for normal retirement benefits at age 60 or at any age after 30 years of service). Members of the FRS Plan may include up to four years of credit for military service toward creditable service. The FRS Plan also includes an early retirement provision; however, there is a benefit reduction for each year a member retires before his or her normal retirement date. The FRS Plan provides retirement, disability, death benefits, and annual cost-of-living adjustments to eligible participants. DROP, subject to provisions of Section 121.091, Florida Statutes, permits employees eligible for normal retirement under the FRS Plan to defer receipt of monthly benefit payments while continuing employment with an FRS employer. An employee may participate in DROP for a period not to exceed 60 months after electing to participate, except that certain instructional personnel may participate for up to 96 months. During the period of DROP participation, deferred monthly benefits are held in the FRS Trust Fund and accrue interest. The net pension liability does not include amounts for DROP participants, as these members are considered retired and are not accruing additional pension benefits.

MIAMI‐DADE COUNTY AVIATION DEPARTMENT AN ENTERPRISE FUND OF MIAMI‐DADE COUNTY, FLORIDA NOTES TO THE FINANCIAL STATEMENTS SEPTEMBER 30, 2018
45
Note 10—Retirement benefits (continued) Benefits Provided – Benefits under the FRS Plan are computed on the basis of age and/or years of service, average final compensation, and service credit. Credit for each year of service is expressed as a percentage of the average final compensation. For members initially enrolled before July 1, 2011, the average final compensation is the average of the five highest fiscal years’ earnings; for members initially enrolled on or after July 1, 2011, the average final compensation is the average of the eight highest fiscal years’ earnings. The total percentage value of the benefit received is determined by calculating the total value of all service, which is based on the retirement class to which the member belonged when the service credit was earned. Members are eligible for in-line-of-duty or regular disability and survivors’ benefits. The following chart shows the percentage value for each year of service credit earned:
Class, Initial Enrollment, and Retirement Age/Years of Service % Value
Regular Class members initially enrolled before July 1, 2011 Retirement up to age 62 or up to 30 years of service 1.60 Retirement at age 63 or with 31 years of service 1.63 Retirement at age 64 or with 32 years of service 1.65 Retirement at age 65 or with 33 or more years of service 1.68
Regular Class members initially enrolled on or after July 1, 2011 Retirement up to age 65 or up to 33 years of service 1.60 Retirement at age 66 or with 34 years of service 1.63 Retirement at age 67 or with 35 years of service 1.65 Retirement at age 68 or with 36 or more years of service 1.68
Elected County Officers Service as Supreme Court Justice, district court of appeal judge, Circuit court judge, or county judge 3.33 Service as Governor, Lt Governor, Cabinet Officer, Legislator, state attorney, public defender, elected county official, or elected official of a city or special district that chose EOC membership for its elected officials 3.00
Senior Management Service Class 2.00 Special Risk Regular Service from December 1, 1970 through September 30, 1974 2.00 Service on and after October 1, 1974 3.00
As provided in Section 121.101, Florida Statutes, if the member is initially enrolled in the FRS before July 1, 2011, and all service credit was accrued before July 1, 2011, the annual cost-of-living adjustment is 3% per year. If the member is initially enrolled before July 1, 2011, and has service credit on or after July 1, 2011, there is an individually calculated cost-of-living adjustment. The annual cost-of-living adjustment is a proportion of 3% determined by dividing the sum of the pre-July 2011 service credit by the total service credit at retirement multiplied by 3%. FRS Plan members initially enrolled on or after July 1, 2011 will not have a cost-of-living adjustment after retirement.

MIAMI‐DADE COUNTY AVIATION DEPARTMENT AN ENTERPRISE FUND OF MIAMI‐DADE COUNTY, FLORIDA NOTES TO THE FINANCIAL STATEMENTS SEPTEMBER 30, 2018
46
Note 10—Retirement benefits (continued) Miami-Dade County Allocation – The County allocated the FRS Plan amounts to the different departments based on their proportionate share of contributions to total contributions made by the County to the FRS during fiscal year 2018, (October 2017 through September 2018). The Aviation Department’s proportionate share of the contributions was 2.59% of the total contributions made by the County to the FRS during fiscal year 2018. Contributions – The Florida Legislature establishes contribution rates for participating employers and employees. Contribution rates in effect from July 1, 2017 through June 30, 2018 were as follows:
Percent of Gross Salary
Class Employee Employer (1)
FRS, Regular 3.00 7.92FRS, Elected County Officers 3.00 45.50FRS, Senior Management Service 3.00 22.71FRS, Special Risk Regular 3.00 23.27DROP – Applicable to:
Members from All of the Above Classes 0.00 13.26
Contribution rates in effect from July 1, 2018 through September 30, 2018 were as follows:
Percent of Gross Salary
Class Employee Employer (2)
FRS, Regular 3.00 8.26FRS, Elected County Officers 3.00 48.70FRS, Senior Management Service 3.00 24.06FRS, Special Risk Regular 3.00 24.50DROP – Applicable to:
Members from All of the Above Classes 0.00 14.03
(1) Employer rates include 1.66% for the postemployment health insurance subsidy. Also, employer rates, other than for DROP participants, include 0.06% for administrative costs of the Investment Plan.
(2) Employer rates include 1.66% for the postemployment health insurance subsidy. Also, employer rates,
other than for DROP participants, include 0.06% for administrative costs of the Investment Plan.

MIAMI‐DADE COUNTY AVIATION DEPARTMENT AN ENTERPRISE FUND OF MIAMI‐DADE COUNTY, FLORIDA NOTES TO THE FINANCIAL STATEMENTS SEPTEMBER 30, 2018
47
Note 10—Retirement benefits (continued) The Aviation Department’s contributions for FRS totaled $6.4 million and employee contributions totaled $1.9 million for the fiscal year ended September 30, 2018. Pension Liabilities, Pension Expense, and Deferred Outflows of Resources and Deferred Inflows of Resources Related to Pensions – At September 30, 2018, the Aviation Department reported a liability of $61.1 million for its proportionate share of the FRS Plan’s net pension liability. The net pension liability was measured as of June 30, 2018, and the total pension liability used to calculate the net pension liability was determined by an actuarial valuation as of July 1, 2018. The Aviation Department’s proportionate share of the net pension liability was based on the Aviation Department’s 2017-2018 fiscal year contributions relative to the 2017-2018 fiscal year contributions of all participating members of the FRS Plan. At June 30, 2018, the Aviation Department’s proportionate share was 0.2028%, which was an increase from its proportionate share of 0.2201% measured at June 30, 2017. For the fiscal year ended September 30, 2018, the Aviation Department recognized pension expense of $10.2 million related to the FRS Plan. In addition, for the year ended September 30, 2018, the Aviation Department reported deferred outflows of resources and deferred inflows of resources related to pensions from the following sources (in thousands):
Deferred Deferred
Outflows Inflows
Description of Resources of Resources
Differences between expected and actual experience 5,175$ 188$ Change of assumptions 19,961 - Net difference between projected and actual earnings on FRS
pension plan investments - 4,720 Changes in proportion and differences between Aviation Department
FRS contributions and proportionate share of contributions 1,066 778 Aviation Department FRS contributions subsequent to
the measurement date 1,659 -
Total 27,861$ 5,686$

MIAMI‐DADE COUNTY AVIATION DEPARTMENT AN ENTERPRISE FUND OF MIAMI‐DADE COUNTY, FLORIDA NOTES TO THE FINANCIAL STATEMENTS SEPTEMBER 30, 2018
48
Note 10—Retirement benefits (continued) The deferred outflows of resources related to pensions, totaling $1.7 million, resulting from Aviation Department’s contributions to the FRS Plan subsequent to the measurement date, will be recognized as a reduction of the net pension liability in the fiscal year ended September 30, 2019. Other amounts reported as deferred outflows of resources and deferred inflows of resources related to pensions will be recognized in pension expense as follows (in thousands):
Deferred
Outflows
Fiscal Year Ending September 30, (Inflows), Net
2019 7,550$ 2020 5,405 2021 992 2022 3,740 2023 2,457 Thereafter 372
Total 20,516$
Actuarial Assumptions – The FRS pension actuarial valuation was determined using the following actuarial assumptions, as of July 1, 2018, applied to all periods included in the measurement:
Inflation 2.60 percent
Salary Increases 3.25 percent, average, including inflation
Investment rate of return 7.00 percent, net of pension plan investment expense, including inflation
Mortality rates were based on the Generational RP-2000 with Projection Scale BB tables. The actuarial assumptions used in the July 1, 2018 valuation were based on the results of an actuarial experience study for the period July 1, 2008 through June 30, 2013.

MIAMI‐DADE COUNTY AVIATION DEPARTMENT AN ENTERPRISE FUND OF MIAMI‐DADE COUNTY, FLORIDA NOTES TO THE FINANCIAL STATEMENTS SEPTEMBER 30, 2018
49
Note 10—Retirement benefits (continued) Long-Term Expected Rate of Return – The long-term expected rate of return on pension plan investments was not based on historical returns, but instead is based on a forward-looking capital market economic model. The allocation policy’s description of each asset class was used to map the target allocation to the asset classes shown below. Each asset class assumption is based on a consistent set of underlying assumptions, and includes an adjustment for the inflation assumption. The target allocation and best estimates of arithmetic and geometric real rates of return for each major asset class are summarized in the following table:
Compound
Annual Annual
Target Arithmetic (Geometric) Standard
Asset Class Allocation (1) Return Return Deviation
Cash 1.00% 2.90% 2.90% 1.80%Fixed income 18.00% 4.40% 4.30% 4.00%Global equity 54.00% 7.60% 6.30% 17.00%Real estate (property) 11.00% 6.60% 6.00% 11.30%Private equity 10.00% 10.70% 7.80% 26.50%Strategic investments 6.00% 6.00% 5.70% 8.60%
Total 100.00%
Assumed inflation - Mean 2.60% 1.90%
Note: (1) As outlined in the Plan's investment policy
Discount Rate – The discount rate used to measure the total pension liability was 7.00%. The projection of cash flows used to determine the discount rate assumed that employee contributions will be made at the current contribution rate and that contributions will be made at the statutorily required rates. The FRS Plan’s fiduciary net position was projected to be available to make all projected future benefit payments of current active and inactive employees. Therefore, the discount rate for calculating the total pension liability is equal to the long-term expected rate of return. The FRS Actuarial Assumption Conference is responsible for setting the assumptions used in the valuations of the defined benefit pension plans pursuant to Section 216.136(10), Florida Statutes. The 7.00% rate of return assumption used in the June 30, 2018 calculations was determined by the FRS Plan’s consulting actuary to be reasonable and appropriate per Actuarial Standard of Practice No. 27 (ASOP 27) for accounting purposes which differs from the rate used for funding purposes which is used to establish the contribution rates for the FRS Plan.

MIAMI‐DADE COUNTY AVIATION DEPARTMENT AN ENTERPRISE FUND OF MIAMI‐DADE COUNTY, FLORIDA NOTES TO THE FINANCIAL STATEMENTS SEPTEMBER 30, 2018
50
Note 10—Retirement benefits (continued) Sensitivity of the Aviation Department’s Proportionate Share of the Net Position Liability to Changes in the Discount Rate – The following presents the Aviation Department’s proportionate share of the net pension liability calculated using the discount rate of 7.00%, as well as what the Aviation Department’s proportionate share of the net pension liability would be if it were calculated using a discount rate that is 1-percentage-point lower (6.00%) or 1-percentage-point higher (8.00%) than the current rate (in thousands):
1% Current 1%
Decrease Discount Rate Increase
(6.00%) (7.00%) (8.00%)
Aviation Department's proportionate share ofthe net pension liability 111,492$ 61,090$ 19,228$
Pension Plan Fiduciary Net Position – Detailed information about the Plan’s fiduciary net position is available in the separately issued FRS Pension Plan and Other State Administered Systems Comprehensive Annual Financial Report. The Retiree HIS Program Plan Description – The Retiree Health Insurance Subsidy Program (HIS Plan) is a cost-sharing multiple-employer defined benefit pension plan established under section 112.363, Florida Statutes, and may be amended by the Florida Legislature at any time. The benefit is a monthly payment to assist retirees of the State-administered retirement systems in paying their health insurance costs and is administered by the Division of Retirement within the Florida Department of Management Services. Benefits Provided – For the fiscal year ended September 30, 2018, eligible retirees and beneficiaries received a monthly HIS payment of $5 for each year of creditable service completed at the time of retirement, with a minimum HIS payment of $30 and a maximum HIS payment of $150 per month, pursuant to Section 112.363, Florida Statutes. To be eligible to receive a HIS Plan benefit, a retiree under a State-administered retirement system must provide proof of health insurance coverage, which may include Medicare. Miami-Dade County Allocation – The County allocated the HIS Plan amounts to the different departments based on their proportionate share of contributions to total contributions made by the County to the FRS during fiscal year 2018, (October 2017 through September 2018). The Aviation Department’s proportionate share of the contributions was 2.59% of the total contributions made by the County to the FRS during fiscal year 2018. Contributions – The HIS Plan is funded by required contributions from FRS participating employers as set by the Florida Legislature. Employer contributions are a percentage of gross compensation for all active FRS members. For the fiscal year ended September 30, 2018, the HIS contribution for the period July 1, 2017 through June 30, 2018 and from July 1, 2018 through September 30, 2018 was 1.66%. The Aviation Department contributed 100% of its statutorily required contributions for the current fiscal year. The HIS Plan contributions are deposited in a separate trust fund from which payments are authorized. The HIS Plan benefits are not guaranteed and are subject to annual legislative appropriation. In the event the legislative appropriation or available funds fail to provide full subsidy benefits to all participants, benefits may be reduced or canceled.

MIAMI‐DADE COUNTY AVIATION DEPARTMENT AN ENTERPRISE FUND OF MIAMI‐DADE COUNTY, FLORIDA NOTES TO THE FINANCIAL STATEMENTS SEPTEMBER 30, 2018
51
Note 10—Retirement benefits (continued) The Aviation Department’s contributions to the HIS Plan totaled $0.9 million for the fiscal year ended September 30, 2018. Pension Liabilities, Pension Expense, and Deferred Outflows of Resources and Deferred Inflows of Resources Related to Pensions – At September 30, 2018, the Aviation Department reported a net pension liability of $17.3 million for its proportionate share of the HIS Plan’s net pension liability. The total pension liability used to calculate the net pension liability was determined by an actuarial valuation as of June 30, 2018. The Aviation Department’s proportionate share of the net pension liability was based on the Aviation Department’s 2017-2018 fiscal year contributions relative to the total 2017-2018 fiscal year contributions of all participating members of the HIS Plan. At June 30, 2018, the Aviation Department’s proportionate share was 0.1631%, which was a decrease from its proportionate share of 0.1756% measured as of June 30, 2017. For the fiscal year ended September 30, 2018, the Aviation Department recognized pension expense of $1.3 million related to the HIS Plan. In addition, for the year ended September 30, 2018, the Aviation Department reported deferred outflows of resources and deferred inflows of resources related to pensions from the following sources (in thousands):
Deferred Deferred
Outflows Inflows
Description of Resources of Resources
Differences between expected and actual experience 264$ 29$
Change of assumptions 1,920 1,825 Net difference between projected and actual earnings on HIS pension
plan investments 10 - Changes in proportion and differences between Aviation Department
HIS contributions and proportionate share of HIS contributions 408 108 Aviation Department contributions subsequent to the
measurement date 243 -
Total 2,845$ 1,962$

MIAMI‐DADE COUNTY AVIATION DEPARTMENT AN ENTERPRISE FUND OF MIAMI‐DADE COUNTY, FLORIDA NOTES TO THE FINANCIAL STATEMENTS SEPTEMBER 30, 2018
52
Note 10—Retirement benefits (continued) The deferred outflows of resources related to pensions, totaling $0.2 million, resulting from the Aviation Department’s contributions to the HIS Plan subsequent to the measurement date will be recognized as a reduction of the net pension liability in the fiscal year ended September 30, 2019. Other amounts reported as deferred outflows of resources and deferred inflows of resources related to pensions will be recognized in pension expense as follows (in thousands):
Deferred
Outflows
Fiscal Year Ending September 30, (Inflows), Net
2019 275$ 2020 274 2021 223 2022 89 2023 (207) Thereafter (14)
Total 640$
Actuarial Assumptions – The HIS pension as of July 1, 2018 actuarial valuation was determined using the following actuarial assumptions, applied to all periods included in the measurement:
Inflation 2.60 percent
Salary Increases 3.25 percent, average, including inflation
Municipal Bond Rate 3.87 percent
Mortality rates were based on the Generational RP-2000 with Projected Scale BB tables. The actuarial assumptions used in the June 30, 2018 valuation were based on the results of an actuarial experience study for the period July 1, 2008 through June 30, 2013. Discount Rate – The discount rate used to measure the total pension liability was 3.87%. In general, the discount rate for calculating the total pension liability is equal to the single rate equivalent to discounting at the long-term expected rate of return for benefit payments prior to the projected depletion date. Because the HIS benefit is essentially funded on a pay-as-you-go basis, the depletion date is considered to be immediate, and the single equivalent discount rate is equal to the municipal bond rate selected by the HIS Plan sponsor. The Bond Buyer General Obligation 20-Bond Municipal Bond Index was adopted as the applicable municipal bond index.

MIAMI‐DADE COUNTY AVIATION DEPARTMENT AN ENTERPRISE FUND OF MIAMI‐DADE COUNTY, FLORIDA NOTES TO THE FINANCIAL STATEMENTS SEPTEMBER 30, 2018
53
Note 10—Retirement benefits (continued) Sensitivity of the Aviation Department’s Proportionate Share of the Net Pension Liability to Changes in the Discount Rate – The following presents the Aviation Department’s proportionate share of the net pension liability calculated using the discount rate of 3.87%, as well as what the Aviation Department’s proportionate share of the net pension liability would be if it were calculated using a discount rate that is 1-percentage-point lower (2.87%) or 1-percentage-point higher (4.87%) than the current rate (in thousands):
1% Current 1%
Decrease Discount Rate Increase
(2.87%) (3.87%) (4.87%)
Aviation Department's proportionate share ofthe net pension liability 19,697$ 17,261$ 15,232$
Pension Plan Fiduciary Net Position – Detailed information about the HIS Plan’s fiduciary net position is available in the separately issued FRS Pension Plan and Other State Administered Systems Comprehensive Annual Financial Report.
FRS – Defined Contribution Pension Plan
The County contributes to the FRS Defined Contribution Investment Plan (Investment Plan). The Investment Plan is administered by the State Board of Administration (SBA), and is reported in the SBA’s annual financial statements and in the State of Florida Comprehensive Annual Financial Report. As provided in Section 121.4501, Florida Statutes, eligible FRS members may elect to participate in the Investment Plan in lieu of the FRS defined-benefit plan. County employees participating in the DROP are not eligible to participate in the Investment Plan. Employer and employee contributions, including amounts contributed to individual member’s accounts, are defined by law, but the ultimate benefit depends in part on the performance of investment funds. Benefit terms, including contribution requirements, for the Investment Plan are established and may be amended by the Florida Legislature. The Investment Plan is funded with the same employer and employee contribution rates that are based on salary and membership class (Regular Class, Elected County Officers, etc.) as the FRS defined benefit plan. Contributions are directed to individual member accounts, and the individual members allocate contributions and account balances among various approved investment choices.
Allocations to the investment members’ accounts, as established by Section 121.72, Florida Statutes, during the 2017-2018 fiscal year were as follows:
Percent of
Gross
Membership Class Compensation
FRS, Regular 6.30 FRS, Elected County Officers 11.34 FRS, Senior Management Service 7.67 FRS, Special Risk Regular 14.00

MIAMI‐DADE COUNTY AVIATION DEPARTMENT AN ENTERPRISE FUND OF MIAMI‐DADE COUNTY, FLORIDA NOTES TO THE FINANCIAL STATEMENTS SEPTEMBER 30, 2018
54
Note 10—Retirement benefits (continued) For all membership classes, employees are immediately vested in their own contributions and are vested after one year of service for employer contributions and investment earnings. If an accumulated benefit obligation for service credit originally earned under the FRS Pension Plan is transferred to the Investment Plan, the member must have the years of service required for FRS Pension Plan vesting (including the service credit represented by the transferred funds) to be vested for these funds and the earnings on the funds. Non-vested employer contributions are placed in a suspense account for up to five years. If the employee returns to FRS-covered employment within the five-year period, the employee will regain control over their account. If the employee does not return within the five-year period, the employee will forfeit the accumulated account balance. Costs of administering the Investment Plan, including the FRS Financial Guidance Program, are funded through an employer contribution of 0.06% from July 1, 2017 through September 30, 2018 and by forfeited benefits of Investment Plan members. For the fiscal year ended September 30, 2018, the information for the amount of forfeitures was unavailable from the SBA; however, management believes that these amounts, if any, would be immaterial to the County. After termination and applying to receive benefits, the member may rollover vested funds to another qualified plan, structure a periodic payment under the Investment Plan, receive a lump-sum distribution, leave the funds invested for future distribution, or any combination of these options. Disability coverage is provided; the member may either transfer the account balance to the FRS Pension Plan when approved for disability retirement to receive guaranteed lifetime monthly benefits under the FRS Pension Plan, or remain in the Investment Plan and rely upon that account balance for retirement income. The Aviation Department’s Investment Plan pension contributions totaled approximately $630,500 and employee contributions totaled approximately $561,200 for the fiscal year ended September 30, 2018. Note 11—Commitments and contingencies a. Environmental Matters – In August 1993, the Aviation Department and the Dade County Department of Environmental Resources Management (DERM) entered into a Consent Order. Under the Consent Order, the Aviation Department was required to correct environmental violations resulting from various tenants’ failure to comply with their environmental obligations at the airport including those facilities previously occupied by Eastern Airlines (Eastern) and Pan Am Airlines (Pan Am). In addition, the Aviation Department had a preliminary study performed by an independent engineering firm to estimate the cost to correct the environmental violations noted in the Consent Order. This study was used as a basis to record the environmental remediation liability as of September 30, 1993. In each subsequent year, the Aviation Department has received an updated study performed by an independent engineering firm to further update the estimated costs to correct the environmental violations noted in the Consent Order based on additional information and further refinement of estimated costs to be incurred. As a result of the updated study and costs incurred in fiscal year 2018, the total cumulative estimate to correct such violations was approximately $188.4 million. This estimate allows for uncertainties as to the nature and extent of environmental reparations and the methods, which must be employed for the remediation. The cumulative amount of environmental expenditures spent through September 30, 2018 approximated $150.0 million. The Aviation Department has also spent approximately $56.3 million in other environmental-related projects not part of any Consent Order.

MIAMI‐DADE COUNTY AVIATION DEPARTMENT AN ENTERPRISE FUND OF MIAMI‐DADE COUNTY, FLORIDA NOTES TO THE FINANCIAL STATEMENTS SEPTEMBER 30, 2018
55
Note 11—Commitments and contingencies (continued) During fiscal year 1998, a Consent Order (FDEP Consent Order) was signed with the State of Florida Department of Environmental Protection (FDEP). The FDEP Consent Order encompasses and replaces the DERM agreement and includes additional locations. The FDEP Consent Order includes all locations at MIA that are contaminated as well as additional sites where contamination is suspected. The Aviation Department included other sites where contamination is suspected in the FDEP Consent Order under a Protective Filing. If contamination is documented at these sites, the State would be required to incur the costs of remediation. Because the State will be required to pay for remediation of sites filed in the Protective Filing and because the contamination at the sites is unknown, an accrual amount is not reflected in the Opinion of Cost report or in the accompanying financial statements. Currently, the County has several pending lawsuits in State Court against the Potentially Responsible Parties (PRPs) and insurers to address recovery of past and future damages associated with the County’s liability under the FDEP Consent Order. As of September 30, 2018, the Aviation Department has received approximately $60,331,000 from the State, insurance companies, and PRPs. The outstanding liability amount at September 30, 2018 was $38,355,000 representing the unexpended environmental remediation costs based on the Opinion of Cost performed by an independent engineering firm. At September 30, 2018, the long-term liability was $34,180,000 and the short-term liability was $4,175,000. Management has allocated a portion of bond proceeds to fund this obligation and believes that the remaining amount can be funded from recoveries and the operations of the Aviation Department. The liability recorded by the Aviation Department does not include an estimate of any environmental violations at the three general aviation airports or at the two training airports. Management is not aware of any such liabilities, and the occurrence of any would not be material to the financial statements. In addition to the studies conducted to determine the environmental damage to the sites occupied by Eastern and Pan Am, the Aviation Department caused studies to be performed to determine the amount required to remove or otherwise contain the asbestos in certain buildings occupied by the airlines. The Aviation Department has also estimated the amount required to remove or otherwise contain the asbestos in buildings other than those formerly occupied by Eastern and Pan Am. The studies that estimate the cost to correct such damage related to all buildings were assessed at approximately $4.5 million. The Aviation Department has no intention of correcting all assessed damage related to asbestos in the near future as they pose no imminent danger to the public. Specific issues will be addressed when and if the Aviation Department decides to renovate or demolish related buildings. At such time, the Aviation Department will obligate itself to the cleanup or asbestos abatement. As emergencies or containment issues may arise from this condition, they will be isolated and handled on a case-by-case basis as repair and maintenance. Such amounts do not represent a liability of the Aviation Department until such time as a decision is made by the Aviation Department’s management to make certain modifications to the buildings, which would require the Aviation Department to correct such matters. As such, no amounts are recorded as of September 30, 2018. The nature of ground and groundwater contamination at MIA can be divided into two categories: petroleum-related contamination and hazardous/nonhazardous contamination. The Opinion of Cost is divided in three large areas: the Inland Protection Trust Fund (IPTF), which was created by the State of Florida to deal with contamination related to petroleum products in sites that qualified for that program; the non-IPTF contamination relates to other sites that might include petroleum as well as hazardous/nonhazardous-related contamination; and the nonconsent items, which can be either of the two above but were not specifically listed in the Consent Order.

MIAMI‐DADE COUNTY AVIATION DEPARTMENT AN ENTERPRISE FUND OF MIAMI‐DADE COUNTY, FLORIDA NOTES TO THE FINANCIAL STATEMENTS SEPTEMBER 30, 2018
56
Note 11—Commitments and contingencies (continued) The table below summarizes the remediation liability by nature of contaminant as of September 30, 2018: Nature of Contamination IPTF Non‐IPTF Nonconsent Totals
Petroleum 4,435,000$ -$ -$ 4,435,000$ Hazardous/nonhazardous - 29,475,000 4,445,000 33,920,000
Total 4,435,000$ 29,475,000$ 4,445,000$ 38,355,000$
b. Other Commitments and Contingencies – As of September 30, 2018, the Aviation Department had approximately $192.9 million of construction commitments outstanding. American International Group (AIG), through various subsidiaries provided insurance for the North Terminal Development Program at MIA, for the period of December 31, 2007 to December 31, 2014. Based on an audit performed by AIG after the completion of construction, AIG asserted that the Aviation Department owed an additional $9,235,449 plus interest, under the insurance policies. On July 29, 2016, the Aviation Department paid AIG $4,000,000 and disputed the legitimacy of the remaining $5,235,449 plus interest that AIG claimed was still owed. As a result, AIG brought an action in the South District of New York to either force arbitration pursuant to the payment agreement under the insurance policies or in the alternate, for breach of contract for nonpayment. The County counterclaimed for breach of contract. During this time, the County and AIG discussed settlement and agreed on the sum of $3,300,000 to be paid from the County to AIG, rather than the $5,235,449, in exchange for AIG’s waiver of interest, release of claims by both parties, and dismissal of the lawsuit with prejudice. This settlement agreement has not yet been approved by the Board. As of September 30, 2018, the Aviation Department recorded a liability of $3,300,000. A number of claims and lawsuits are pending against the County relating to the Aviation Department resulting from the normal course of conducting its operations. However, in the opinion of management and the County Attorney, the ultimate outcome of such actions will not have a material adverse effect on the financial position of the Aviation Department. The Aviation Department receives grants from federal and state financial assistance programs, which are subject to audit and adjustment by the grantor agencies. It is the opinion of management that no material liabilities will result to the Aviation Department from any such audit. In a quitclaim deed dated December 20, 2011, the Rental Car Facility (RCF) at the Miami Intermodal Center (MIC) adjacent to the airport was conveyed to the County through its Aviation Department by FDOT. The conveyance was recorded in the amount of approximately $393,327,000 ($42,000,000 for the land and $351,327,000 for the building and improvements), which represented the acquisition value at the date of the conveyance. The quitclaim deed requires that the RCF be used as a rental car facility. In the event that it ceases to be used as such, all property rights in it revert to FDOT.

MIAMI‐DADE COUNTY AVIATION DEPARTMENT AN ENTERPRISE FUND OF MIAMI‐DADE COUNTY, FLORIDA NOTES TO THE FINANCIAL STATEMENTS SEPTEMBER 30, 2018
57
Note 11—Commitments and contingencies (continued) The RCF was designed and constructed by FDOT, which borrowed $270 million from the United States Department of Transportation (USDOT) under the TIFIA loan program. The loan will be repaid through the collection of Customer Facility Charges (CFCs) and contingent rent, if needed, from car rental company customers using the RCF. The car rental companies remit these funds directly to the Fiscal Agent servicing the loan; the CFCs are not revenue of the Aviation Department. The County and the Aviation Department do not own nor do they have access to accounts held by the Fiscal Agent. The repayment of the TIFIA loan is not secured by any Aviation Department revenue and in no event will the Aviation Department be required to use any airport revenue for the payment of debt service on the RCF portion of the TIFIA loan or any additional RCF financing. Note 12—Postemployment benefits other than pensions a. Plan Description – The County administers a single-employer defined-benefit healthcare plan (the Plan) that provides postretirement medical, hospital, pharmacy and dental coverage to retirees as well as their eligible spouses and dependents. Benefits are provided through the County’s group health insurance plan, which covers both active and retired members. Benefits are established and may be amended by the Miami-Dade County Board of County Commissioners (the BCC), whose powers derive from F.S. 125.01(3)(a). The Plan does not issue a publicly available financial report. Participation in the Plan consisted of the following at September 30, 2018:
Actives 23,882 Retirees under age 65 2,465 Eligible spouses under age 65 733 Retirees age 65 and over 663 Eligible spouses age 65 and over 345
Total 28,088
Eligibility: To be eligible to receive retiree medical and dental benefits, participants must be eligible for retirement benefits under FRS and pay required contributions.
Regular Class Employees (all employees not identified as members of the Special Risk Class) hired prior
to July 1, 2011 are eligible for postemployment benefits at age 62 with six years of service, or with 30 years of service at any age. Eligibility for reduced retirement is six years of service at any age. Those hired after July 1, 2011 are eligible at age 65 with eight years of service, or 33 years of service at any age.
Special Risk Employees (Police Officers, Firefighters, and Corrections Officers) that were hired prior to July 1, 2011 are eligible for postemployment benefits at age 55 with six years of service, or with 25 years of service at any age. Eligibility for reduced retirement is six years of service at any age. Those hired after July 1, 2011 are eligible at age 60 with eight years of service, or 30 years of service at any age.
Benefits: A number of plan changes to the pre-Medicare retiree plans were made effective January 1, 2017. The valuation reflects the impact of these changes.

MIAMI‐DADE COUNTY AVIATION DEPARTMENT AN ENTERPRISE FUND OF MIAMI‐DADE COUNTY, FLORIDA NOTES TO THE FINANCIAL STATEMENTS SEPTEMBER 30, 2018
58
Note 12—Postemployment benefits other than pensions (continued)
Eligible pre-Medicare retirees receive health care coverage through one of the four self-funded medical plans:
AvMed POS AvMed HMO High AvMed HMO Select Jackson First HMO
Retirees may continue coverage beyond Medicare eligibility by enrolling in one of the County-sponsored, self-insured Medicare Supplemental plans provided by AvMed. The County only contributes to post-65 retirees electing one of these plans.
AvMed Medicare Supplement Low Option with RX AvMed Medicare Supplement High Option with RX AvMed Medicare Supplement High Option without RX
b. Funding Policy – The County contributes to both the pre-65 and post-65 retiree medical coverage. Medical contributions vary based on plan and tier. Retirees pay the full cost of dental coverage. The postretirement medical is currently funded on a pay-as-you go basis (i.e., Miami-Dade County funds on a cash basis as benefits are paid). The County’s contribution is the actual pay-as-you-go postemployment benefit payments less participant contributions for the period October 1, 2017 to September 30, 2018. No assets have been segregated and restricted to provide postretirement benefits. Contributions are required for both retiree and dependent coverage. Retirees contribute a portion of the full active premium equivalent rates for health coverage. The full monthly premiums, retiree contribution amounts, and the County subsidies effective January 1, 2018 through December 31, 2018 are provided in the tables below. The County subsidy is assumed to remain flat.

MIAMI‐DADE COUNTY AVIATION DEPARTMENT AN ENTERPRISE FUND OF MIAMI‐DADE COUNTY, FLORIDA NOTES TO THE FINANCIAL STATEMENTS SEPTEMBER 30, 2018
59
Note 12—Postemployment benefits other than pensions (continued)
AvMed HMO High Full
PremiumCounty Subsidy
Retiree Contribution
Retiree Only $774.24 $204.36 $569.88
Retiree + Spouse $1,625.02 $360.38 $1,264.64
Retiree + Child(ren) $1,505.18 $339.47 $1,165.71
Retiree + Family $1,981.83 $418.43 $1,563.40
Retiree Only $1,496.89 $177.80 $1,319.09
Retiree + Spouse $2,849.77 $302.75 $2,547.02
Retiree + Child(ren) $2,611.66 $175.12 $2,436.54Retiree + Family $3,868.19 $711.37 $3,156.82
AvMed SelectFull
PremiumCounty Subsidy
Retiree Contribution
Retiree Only $720.05 $204.36 $515.69
Retiree + Spouse $1,511.29 $360.38 $1,150.91
Retiree + Child(ren) $1,399.80 $339.47 $1,060.33
Retiree + Family $1,843.10 $418.43 $1,424.67
Jackson First HMOFull
PremiumCounty Subsidy
Retiree Contribution
Retiree Only $684.04 $204.36 $479.68
Retiree + Spouse $1,435.74 $360.38 $1,075.36
Retiree + Child(ren) $1,329.81 $339.47 $990.34
Retiree + Family $1,750.93 $418.43 $1,332.50
Med Supp HighFull
PremiumCounty Subsidy
Retiree Contribution
Retiree Only $990.03 $233.58 $756.45
Retiree + Spouse 65+ $1,696.09 $260.15 $1,435.94
Med Supp LowFull
PremiumCounty Subsidy
Retiree Contribution
Retiree Only $884.11 $208.59 $675.52
Retiree + Spouse 65+ $1,514.70 $232.33 $1,282.37
Med Supp High No RxFull
PremiumCounty Subsidy
Retiree Contribution
Retiree Only $430.33 $101.53 $328.80
Retiree + Spouse 65+ $737.25 $113.08 $624.17
PRE MEDICARE PREMIUM EQUIVALENT RATES
MEDICARE RETIREE PREMIUM EQUIVALENT RATES
AvMed POSFull
PremiumCounty Subsidy
Retiree Contribution

MIAMI‐DADE COUNTY AVIATION DEPARTMENT AN ENTERPRISE FUND OF MIAMI‐DADE COUNTY, FLORIDA NOTES TO THE FINANCIAL STATEMENTS SEPTEMBER 30, 2018
60
Note 12—Postemployment benefits other than pensions (continued) c. Total OPEB Liability – The Aviation Department’s total OPEB liability of $23,917,000 was measured as of September 30, 2018, and was determined by an actuarial valuation as of that date. d. Actuarial Assumptions and Other Inputs – The total OPEB liability in the September 30, 2018 actuarial valuation was determined using the following actuarial assumptions and other inputs, applied to all periods included in the measurement unless otherwise specified: Valuation date September 30, 2018Discount rate 3.63% per annum (beginning of year)
4.24% per annum (end of year)Salary increases rate 3.5% per annumMedical consumer price index trend 2.0% per annumInflation rate 3.0% per annumActuarial cost method Entry age normal based on level percentage
of projected salary.Amortization method 11.4 yearsHealthcare cost trend rates Medical/Rx 7.0% initial to 4.5% ultimateRetirees' share of benefit-related costs 43.1%Mortality tables RP-2014 generational table scaled using MP-18
and applied on a gender-specific basis
The discount rate was based on the Bond Buyer 20-Bond GO index. The actuarial assumptions used in the September 30, 2018 valuation were based on FRS’s valuation assumptions and the County’s claim experience for the period of October 1, 2017 to September 30, 2018. e. Changes in Total OPEB Liability – Changes in the Aviation Department’s total OPEB liability for the year ended September 30, 2018 are as follows (in thousands):
Balance at September 30, 2017 25,280$
Charges for the year:
Service cost 454 Interest 909
Change in assumptions or other inputs (1,361) Benefits payments (1,365)
Balance at September 30, 2018 23,917$

MIAMI‐DADE COUNTY AVIATION DEPARTMENT AN ENTERPRISE FUND OF MIAMI‐DADE COUNTY, FLORIDA NOTES TO THE FINANCIAL STATEMENTS SEPTEMBER 30, 2018
61
Note 12—Postemployment benefits other than pensions (continued) The decrease in the total OPEB liability is mostly due to: (1) a change in the actuarial cost method from Projected Unit Credit to Entry Age Normal, (2) a change to the chained CPI, which is used to calculate the excise tax, and (3) resetting the base trend. Sensitivity of the Total OPEB Liability to Changes in the Discount Rate – The following presents the total OPEB liability of the Aviation Department, as well as what the Aviation Department’s total OPEB liability would be if it were calculated using a discount rate that are 1-percentage-point lower or 1-percentage-point higher than the current discount rate (in thousands):
Current
1% Decrease Discount Rate 1% Increase
(3.24%) (4.24%) (5.24%)
Total OPEB Liability 26,209$ 23,917$ 21,910$
Sensitivity of the Total OPEB Liability to Changes in the Healthcare Cost Trend – The following presents the total OPEB liability of the Aviation Department, as well as what the Aviation Department’s total OPEB liability would be if it were calculated using healthcare cost trend rates that are 1-percentage-point lower or 1-percentage-point higher than the current healthcare trend rates (in thousands):
1% Decrease Current Trend 1% Increase
(6.0% initial to 3.5%) (7.0% initial to 4.5%) (8.0% initial to 5.5%)
Total OPEB Liability 21,768$ 23,917$ 26,558$ f. OPEB Expense and Deferred Outflows of Resources and Deferred Inflows of Resources – For the year ended September 30, 2018, the Aviation Department recognized OPEB expense of $1,159,000. At September 30, 2018, the Aviation Department reported deferred inflows of resources related to OPEB from the following sources (in thousands):
Deferred Deferred
Outflows Inflows
Description of Resources of Resources
Changes in assumptions / inputs -$ 1,241$
Total -$ 1,241$

MIAMI‐DADE COUNTY AVIATION DEPARTMENT AN ENTERPRISE FUND OF MIAMI‐DADE COUNTY, FLORIDA NOTES TO THE FINANCIAL STATEMENTS SEPTEMBER 30, 2018
62
Note 12—Postemployment benefits other than pensions (continued) Amounts reported as Deferred Outflows of Resources and Deferred Inflows of Resources related to OPEB will be recognized in OPEB Expense as follows (in thousands):
Deferred
Fiscal Year Ending September 30, Inflows
2019 120$ 2020 120 2021 120 2022 120 2023 120 Thereafter 641
Total 1,241$

REQUIRED SUPPLEMENTARY INFORMATION

MIAMI‐DADE COUNTY AVIATION DEPARTMENT AN ENTERPRISE FUND OF MIAMI‐DADE COUNTY, FLORIDA FLORIDA RETIREMENT SYSTEM – SCHEDULE OF EMPLOYER CONTRIBUTIONS (UNAUDITED) SEPTEMBER 30, 2018 (IN THOUSANDS)
63
2018 2017 2016 2015 2014
Contractually required FRS contribution 6,363$ 5,846$ 5,609$ 5,229$ 4,759$
FRS contribution in relation to the contractually required contribution 6,363 5,846 5,609 5,229 4,759
FRS contribution deficiency (excess) -$ -$ -$ -$ -$
Miami-Dade County Aviation Department's covered payroll 90,624$ 89,272$ 87,034$ 81,844$ 78,639$
FRS contribution as a percentage of covered payroll 7.02% 6.55% 6.44% 6.39% 6.05%
Note: The amounts presented for each fiscal year were determined as of the fiscal year-end date, September 30th.
Schedule is intended to show information for 10 years. Additional years will be displayed as they become available.
Unaudited - see accompanying report of independent auditor

MIAMI‐DADE COUNTY AVIATION DEPARTMENT AN ENTERPRISE FUND OF MIAMI‐DADE COUNTY, FLORIDA FLORIDA RETIREMENT SYSTEM – SCHEDULE OF EMPLOYER PROPORTIONATE SHARE OF NET PENSION LIABILITY AND RELATED RATIOS (UNAUDITED) SEPTEMBER 30, 2018 (IN THOUSANDS)
64
2018 2017 2016 2015 2014
Miami-Dade County Aviation Department's proportion of the FRS net pension liability 0.2028% 0.2201% 0.2198% 0.2145% 0.2172%
Miami-Dade County Aviation Department’s proportionate share of the FRS net pension liability 61,090$ 65,109$ 55,498$ 27,704$ 13,255$
Miami-Dade County Aviation Department's covered payroll 90,784$ 86,951$ 83,925$ 81,195$ 77,815$
Miami-Dade County Aviation Department's proportionate share of the net pension liability as a percentage of its covered payroll 67.29% 74.88% 66.13% 34.12% 17.03%
FRS Plan fiduciary net position as a percentage of the total pension liability 84.26% 83.89% 84.88% 92.00% 96.09%
Note: The amounts presented for each fiscal year were determined as of the measurement date, June 30th.
Schedule is intended to show information for 10 years. Additional years will be displayed as they become available.
Unaudited - see accompanying report of independent auditor

MIAMI‐DADE COUNTY AVIATION DEPARTMENT AN ENTERPRISE FUND OF MIAMI‐DADE COUNTY, FLORIDA SUPPLEMENTAL HEALTH INSURANCE SUBSIDY PENSION INFORMATION – SCHEDULE OF EMPLOYER CONTRIBUTIONS (UNAUDITED) SEPTEMBER 30, 2018 (IN THOUSANDS)
65
2018 2017 2016 2015 2014
Contractually required HIS contribution 891$ 948$ 928$ 682$ 608$
HIS contribution in relation to the contractually required contribution 891 948 928 682 608
HIS contribution deficiency (excess) -$ -$ -$ -$ -$
Miami-Dade County Aviation Department's covered payroll 71,907$ 70,477$ 68,821$ 65,131$ 63,806$
HIS contribution as a percentage of covered payroll 1.24% 1.35% 1.35% 1.05% 0.95%
Note: The amounts presented for each fiscal year were determined as of the fiscal year-end date, September 30th.
Schedule is intended to show information for 10 years. Additional years will be displayed as they become available.
Unaudited - see accompanying report of independent auditor

MIAMI‐DADE COUNTY AVIATION DEPARTMENT AN ENTERPRISE FUND OF MIAMI‐DADE COUNTY, FLORIDA SUPPLEMENTAL HEALTH INSURANCE SUBSIDY PENSION INFORMATION – SCHEDULE OF EMPLOYER PROPORTIONATE SHARE OF NET PENSION LIABILITY AND RELATED RATIOS (UNAUDITED) SEPTEMBER 30, 2018 (IN THOUSANDS)
66
2018 2017 2016 2015 2014
Miami-Dade County Aviation Department proportion of the HIS net pension liability 0.1631% 0.1756% 0.1769% 0.1784% 0.1776%
Miami-Dade County Aviation Department’s proportionate share of
the HIS net pension liability 17,261$ 18,776$ 20,618$ 18,194$ 16,608$
Miami-Dade County Aviation Department's covered payroll 72,088$ 68,481$ 66,497$ 64,806$ 63,306$
Miami-Dade County Aviation Department's proportionate share of
the net pension liability as a percentage of its covered payroll 23.94% 27.42% 31.01% 28.07% 26.23%
HIS Plan fiduciary net position as a percentage of the total pension liability 2.15% 1.64% 0.97% 0.50% 0.99%
Note: The amounts presented for each fiscal year were determined as ofthe measurement date, June 30th.
Schedule is intended to show information for 10 years. Additional years will be displayed as they become available.
Unaudited - see accompanying report of independent auditor

MIAMI‐DADE COUNTY AVIATION DEPARTMENT AN ENTERPRISE FUND OF MIAMI‐DADE COUNTY, FLORIDA POSTEMPLOYMENT BENEFITS OTHER THAN PENSIONS – SCHEDULE OF CHANGES IN TOTAL LIABILITY AND RELATED RATIOS (UNAUDITED) SEPTEMBER 30, 2018 (IN THOUSANDS)
67
Total OPEB liability
Service cost 454$
Interest 909
Change of assumptions or other inputs (1,361)
Benefit payments (1,365)
Net change in total OPEB liability (1,363)
Total OPEB liability - beginning 25,280
Total OPEB liability - ending 23,917$
Covered payroll 85,430$
Total OPEB liability as a percentage of
covered payroll 28.00%
There are no assets accumulated in a trust to pay related benefits
Note: Schedule is intended to show information for 10 years. Additional years will be displayed as
they become available
Unaudited - see accompanying report of independent auditor

[THIS PAGE INTENTIONALLY LEFT BLANK]

APPENDIX C
SUMMARY OF CERTAIN PROVISIONS OF THE TRUST AGREEMENT

[THIS PAGE INTENTIONALLY LEFT BLANK]

C-1
APPENDIX C
SUMMARY OF CERTAIN PROVISIONS OF THE TRUST AGREEMENT
The following summaries and statements are brief outlines of certain provisions of the Amended and Restated Trust Agreement dated as of December 15, 2002, by and among the County and The Bank of New York Mellon (successor in interest to JPMorgan Chase Bank, N.A.), as Trustee, and U.S. Bank National Association (successor in interest to Wachovia Bank, National Association), as Co-Trustee (the “Trust Agreement”). Such outlines do not purport to be complete, and reference is made to the Trust Agreement, copies of which are on file and available for examination at the offices of the Aviation Department, the Trustee and the Co-Trustee, for the complete terms thereof. Terms not defined below or in the Official Statement shall have the meanings set forth in the Trust Agreement.
The Trust Agreement authorizes the issuance, from time to time, in one or more Series, of revenue bonds of the County subject to the conditions set forth in the Trust Agreement. The provisions and covenants of the Trust Agreement are for the equal and proportionate benefit and security of the holders of all of the revenue bonds issued thereunder, all of which, regardless of the time or times of their issue or maturity, shall be of equal rank without preference, priority or distinction as to lien or otherwise of any of the revenue bonds over any other thereof, except as otherwise expressly provided in the Trust Agreement.
Defined Terms
The following are certain defined words and terms used by the Trust Agreement:
“Accreted Value” means, as of any date of computation with respect to any capital appreciation bond, an amount equal to the principal amount of such capital appreciation bond at its initial offering plus the interest accrued on such capital appreciation bond from the date of delivery to the original purchasers thereof to the Compounding Date next preceding the date of computation or the date of computation if a Compounding Date plus, with respect to matters related to the payment upon redemption or acceleration of the capital appreciation bond, if such date of computation shall not be a Compounding Date, a portion of the difference between the Accreted Value as of the immediately preceding Compounding Date (or the date of original issuance if the date of computation is prior to the first Compounding Date succeeding the date of original issuance) and the Accreted Value as of the immediately succeeding Compounding Date, calculated based on the assumption that Accreted Value accrues during any period in equal daily amounts on the basis of a year of 360 days consisting of 12 months of 30 days each. Interest shall accrue on any capital appreciation bond and be compounded periodically at such rate and at such times as provided in, or pursuant to, the resolution authorizing the issuance of said capital appreciation bond.
“Amortization Requirement” means for any fiscal year, as applied to the term bonds of any Series, the principal amount fixed for such fiscal year by resolution of the Board prior to the delivery of such bonds for the retirement of such term bonds by purchase or redemption.
“Annual Budget” means the budget adopted or in effect for each fiscal year.
“Appreciated Value” means, with respect to any capital appreciation and income bond: (a) as of any date of computation prior to the Interest Commencement Date, an amount equal to the principal amount thereof on the date of original issuance plus the interest accrued on such capital appreciation and income bond from the date of original issuance of such capital appreciation and income bond to the Compounding Date next preceding the date of computation or the date of computation if a Compounding Date, such interest to compound periodically at the times and at the rate provided in, or pursuant to, the resolution authorizing the issuance of said capital appreciation and income bond, plus, if such date of computation shall not be a Compounding Date, a portion of the difference between the Appreciated Value as of the immediately preceding Compounding Date (or the date of original issuance if the date of computation is prior to the first Compounding Date succeeding the date of original issuance) and the Appreciated Value as of the immediately succeeding Compounding Date, calculated based upon an assumption that Appreciated Value accrues during any period in equal daily amounts on the basis of a year of 360 days consisting of

C-2
12 months of 30 days each; and (b) as of any date of computation on and after the Interest Commencement Date, the Appreciated Value on the Interest Commencement Date.
“Authorized Investments” include: (i) direct obligations of, or obligations the principal of and the interest on which are unconditionally guaranteed by, the United States of America (“Government Obligations”), (ii) bonds, debentures or notes issued by any of the following Federal agencies: Banks for Cooperatives, Federal Intermediate Credit Banks, Federal Home Loan Banks, Export-Import Bank of the United States, Government National Mortgage Association, Federal Land Banks or the Federal National Mortgage Association (including participation certificates issued by such Association), (iii) all other obligations issued or unconditionally guaranteed as to principal and interest by an agency or persons controlled or supervised by and acting as an instrumentality of the United States Government pursuant to authority granted by the Congress, (iv) repurchase agreements with financial institutions fully secured by Government Obligations, (v) all other obligations which are permitted investments of public funds under Florida law, (vi) time deposits, certificates of deposits or similar arrangements with any bank or trust company which is a member of the Federal Deposit Insurance Corporation and any Federal or State of Florida savings and loan association which is a member of the Savings Association Insurance Fund and which are secured in the manner provided in the Trust Agreement, and (vii) any obligations as directed by Section 218.415, Florida Statutes, unless otherwise authorized by state law or by county ordinance, in which event or events any obligations so authorized by such law or ordinance.
“Bond,” “bonds,” “revenue bond” or “revenue bonds” means any bond or bonds or all of the bonds, as the case may be, issued under the provisions of the Trust Agreement. For purposes of the Trust Agreement, bonds issued under the provisions of the Trust Agreement include bonds issued under the provisions of the Prior Agreement.
“Capital appreciation bonds” means any bonds as to which interest is compounded periodically on each Compounding Date and which are payable in an amount equal to the then current Accreted Value only at maturity, earlier redemption or other payment date therefor, all as designated by, or pursuant to, the resolution authorizing the issuance of such bonds, and which may be either serial bonds or term bonds.
“Capital appreciation and income bonds” means any bonds as to which accruing interest is not paid prior to the Interest Commencement Date specified in, or pursuant to, the resolution authorizing the issuance of such bonds and with respect to which, until such Interest Commencement Date, the Appreciated Value is compounded periodically on each Compounding Date, and which may be either serial bonds or term bonds.
“Compounding Date” means, with respect to any capital appreciation bond or capital appreciation and income bond, the dates on which interest shall compound, as specified in the resolutions authorizing the issuance of such bond.
“Convertible bonds” means bonds which are convertible, at the option of the County, into a type of bonds permitted by the Trust Agreement other than the type of such bonds at the time they were issued.
“Counterparty” means a financial institution who enters into a Hedge Agreement with the County in connection with any bonds issued under the Trust Agreement and whose senior long-term debt obligations, or whose payment obligations under such Hedge Agreement are guaranteed by an entity whose senior long-term debt obligations, are rated on the date the Hedge Agreement is entered into in one of the three highest rating categories (without regard to any gradations within such categories) of a nationally recognized rating agency.
“Credit Facility” means each and every irrevocable letter of credit, policy of municipal bond insurance, surety bond, guaranty, purchase agreement, credit agreement or similar facility in which the entity providing such facility irrevocably agrees to provide funds to make payment of the principal of and interest on bonds when due.
“Current Expenses” means the County’s reasonable and necessary current expenses of maintenance, repair and operation of the Port Authority Properties and shall include, without limiting the generality of the foregoing, all ordinary and usual expenses of maintenance, repair and operation, which may include expenses not annually recurring, all administrative expenses and any reasonable payments to pension or retirement funds properly

C-3
chargeable to the Port Authority Properties, insurance premiums, engineering expenses relating to maintenance, repair and operation, fees and expenses of the Trustee, the Co-Trustee and the Paying Agents, legal expenses, fees of consultants, fees, expenses and other amounts payable to any bank or other financial institution for the issuance of a Credit Facility, Liquidity Facility or Reserve Facility, and to any indexing agent, depository, remarketing agent, tender agent or any other person or institution whose services are required with respect to the issuance of bonds of any Series, any taxes which may be lawfully imposed on the Port Authority Properties or the income therefrom and reserves for such taxes, and any other expenses required to be paid by the County under the provisions of the Trust Agreement or by law, but shall not include any reserves for extraordinary maintenance or repair, or any allowance for depreciation, or any Hedge Obligations or Hedge Charges, or any deposits to the credit of the Sinking Fund, the Reserve Maintenance Fund and the Improvement Fund.
“Director” means the person employed by the County to supervise the operation of the Port Authority Properties and to perform the duties imposed on the Director by the Trust Agreement.
“Effective Date” means December 15, 2002.
“Fiscal year” means the period commencing on the first day of October and ending on the last day of September of the following year.
“Hedge Agreement” means an interest rate exchange agreement, an interest rate swap agreement, a forward purchase contract, a put option contract, a call option contract or any other financial product which is used by the County as a hedging device with respect to its obligation to pay debt service on any of the bonds, entered into between the County and a Counterparty; provided that such arrangement shall be specifically designated in a certificate of the Director and the County’s Finance Director as a “Hedge Agreement” for purposes of the Trust Agreement.
“Hedge Charges” means charges payable by the County to a Counterparty upon the execution, renewal or termination of any Hedge Agreement, any periodic fee payable by the County to keep such Hedge Agreement in effect and all other payments required under such Hedge Agreement, including, to the extent permitted by law, indemnification payments, tax-gross up payments and default related payments, but excluding Hedge Obligations.
“Hedge Obligations” means net payments required to be made by the County under a Hedge Agreement from time to time as a result of fluctuation in hedged interest rates, or fluctuation in the value of any index of payment, but not including Hedge Charges.
“Hedge Receipts” means net payments received by the County from a Counterparty under a Hedge Agreement.
“Improvements” means such buildings, structures and equipment and such renewals, replacements, additions, extensions and betterments, other than ordinary maintenance and repairs, as may be deemed necessary by the County to place or to maintain any Project in proper condition for its safe, efficient and economic operation, or to preserve, extend, increase or improve the service rendered by it, including any property acquired therefor.
“Interest Commencement Date” means, with respect to any particular capital appreciation and income bonds, the date specified in, or pursuant to, the resolution authorizing the issuance of such bonds (which date must be prior to the maturity date for such bonds) after which interest accruing on such bonds shall be payable on a periodic basis, with the first such payment date being the applicable interest payment date immediately succeeding such Interest Commencement Date.
“Liquidity Facility” means a letter of credit, policy of insurance, surety bond, guaranty, purchase agreement, credit agreement or similar facility in which the entity providing such facility agrees to provide funds to pay the purchase price of, or agrees to purchase, put bonds upon their tender by the holders thereof, and which facility is acceptable to the provider of any Credit Facility issued in connection with such put bonds.

C-4
“Net Revenues” for any particular period means the amount of the excess of the Revenues of the Port Authority Properties over the total of the Current Expenses.
“Outstanding” when used with reference to bonds means, as of a particular date and unless otherwise provided in, or pursuant to, a resolution authorizing a particular Series of bonds, all bonds theretofore issued under the Trust Agreement, except:
(1) bonds theretofore cancelled by the Trustee or delivered to the Trustee for cancellation;
(2) bonds for the payment of which money, Government Obligations, or a combination of money and Government Obligations, in an amount sufficient to pay on the date when such bonds are to be paid or redeemed the principal or redemption price of, and the interest accruing to such date on, the bonds to be paid or redeemed, have been deposited with the Trustee in trust for the holders of such bonds; Government Obligations, shall be deemed to be sufficient to pay or redeem bonds on a specified date if the principal of and interest on such Government Obligations, when due, will be sufficient to pay on such date the principal or redemption price of, and the interest accruing on, such bonds to such date;
(3) bonds to be redeemed and deemed to be not Outstanding in accordance with the Trust Agreement;
and
(4) bonds in exchange for or in lieu of which other bonds have been issued; provided, that in determining whether the holders of the requisite Outstanding bonds have given any request, demand, authorization, direction, notice, consent or waiver under the Trust Agreement bonds owned by the County or any affiliate of the County shall be disregarded and deemed not to be Outstanding, except that, in determining whether the Trustee shall be protected in relying upon any such request, demand, authorization, direction, notice, consent or waiver, only bonds that an authorized officer of the Trustee either actually knows to be so owned or has received written notice thereof shall be so disregarded. Bonds so owned that have been pledged in good faith may be regarded as Outstanding if the pledgee establishes to the satisfaction of the Trustee the pledgee’s right so to act with respect to such bonds and that the pledgee is not the County or any affiliate of the County.
In determining whether bonds are not “Outstanding” under clauses (2) and (3) above:
(a) in the case of variable rate bonds, the amount required for the interest thereon shall be calculated at the maximum rate permitted by the terms of the provisions which authorized the issuance of such variable rate bonds; provided, however, that if on any date, as a result of such variable rate bonds having borne interest at less than such maximum rate for any period, the total amount of monies and/or Government Obligations on deposit for the payment of interest on such variable rate bonds is in excess of the total amount which would have been required to be deposited on such date in respect of such variable rate bonds in order to fully pay the principal or redemption price of, and the interest accruing on, such bonds, and so long as no event of default or other event, which with the passage of time or the giving of notice, or both, would become an event of default with respect to such variable rate bonds has occurred and is continuing, the County may use the amount of such excess, free and clear of any trust, lien, security interest, pledge or assignment securing said variable rate bonds or otherwise existing under the Trust Agreement; and
(b) in the case of put bonds, either the principal or redemption price of, and the interest accruing on, said bonds shall have been paid as they became due and payable or there shall have been deposited monies and/or Government Obligations which shall be sufficient at the time of such deposit to pay when due the maximum amount of principal or redemption price of, and interest accruing on, such put bonds which could become payable to the holders of such bonds, including upon the exercise of any tender options provided to the holders of such bonds; provided, however, that if, at the time a deposit is made, the tender options originally exercisable on the put bonds are no longer exercisable, such bonds shall not be considered put bonds for these purposes.
“Passenger Facilities Charges” means any fees which the United States Secretary of Transportation may grant the County authority to impose upon passengers of air carriers enplaned at airports controlled by the County in

C-5
order to finance eligible airport-related projects pursuant to 49 U.S.C. § 40117, as amended, including investment earnings thereon, or any similar fee or charge authorized by any amendment thereto or by any successor federal law.
“Port Authority Properties” means Miami International Airport, the airports owned and/or operated by the County known as Homestead General Aviation Airport, Miami Executive Airport, Miami-Opa locka Executive Airport, Opa-locka West Airport and the Training and Transition Airport, and such other Projects as shall be financed or refinanced under the provisions of the Trust Agreement together with all improvements thereof (excluding any buildings, structures or other facilities constructed at Miami International Airport or other airports of the County and financed by obligations not issued under the provisions of the Trust Agreement) and any other airport or airport related properties or facilities (including any facilities financed by obligations not issued under the provisions of the Trust Agreement) that may be added to the Port Authority Properties under the provisions of the Trust Agreement.
“Principal and Interest Requirements” for any fiscal year, as applied to the bonds of any Series, means the sum of:
(a) the amount required to pay the interest on all bonds of such Series, both serial and term, then Outstanding which is payable from October 2 in such fiscal year through October 1 in the next succeeding fiscal year,
(b) the amount required to pay the principal of all serial bonds of such Series then Outstanding which is payable from October 2 in such fiscal year through October 1 in the next succeeding fiscal year, and
(c) the Amortization Requirement for the term bonds of such Series for such fiscal year.
In computing “Principal and Interest Requirements,” for any fiscal year, the following rules shall apply:
(i) in the case of variable rate bonds, interest shall be computed at the average rate of interest which was payable on such bonds in the last 12 months during which such bonds were Outstanding or the actual number of months that such bonds were Outstanding if less than 12, except that (i) with respect to any variable rate bonds which are being issued on the date of computation, interest shall be computed at the estimated initial rate of interest of such bonds upon issuance thereof, as set forth in a certificate of the principal underwriters with respect to such bonds delivered to the Trustee and the Co-Trustee, and (ii) with respect to deposits to the Reserve Account, interest on any Outstanding variable rate bonds shall be computed (A) with respect to such bonds which were Outstanding in the preceding fiscal year or portion thereof, at the average rate of interest which was payable on such bonds in the preceding fiscal year or portion thereof and (B) with respect to such bonds which were not Outstanding in the preceding fiscal year or portion thereof, at the initial rate of interest on such bonds upon issuance thereof;
(ii) in the case of put bonds, the date or dates on which the holders of such put bonds may elect or be required to tender such bonds for payment or purchase shall be ignored and the stated dates for Amortization Requirements and principal payments thereof shall be used for purposes of this calculation so long as the source for said payment or purchase is a Liquidity Facility and the provider of such facility maintains a rating in one of the three highest short-term rating categories (without regard to any gradations within such categories) of a nationally recognized rating agency; provided, however, that notwithstanding the foregoing or the provisions of clause (i) above, during any period of time after the provider of a Liquidity Facility has advanced funds under a Liquidity Facility and before such amount is repaid, Principal and Interest Requirements shall include the principal amount so advanced and interest thereon, in accordance with the principal repayment schedule and interest rate or rates specified in the reimbursement or other similar agreement relating to such Liquidity Facility;
(iii) in the case of capital appreciation bonds, the principal and interest portions of the Accreted Value becoming due at maturity or by virtue of an Amortization Requirement shall be included when due and payable;
C-6
(iv) in the case of capital appreciation and income bonds, the principal and interest portions of the Appreciated Value becoming due at maturity or by virtue of an Amortization Requirement shall be included when due and payable;
(v) in the case of convertible bonds, the calculations shall be based on the type of the bonds as of the time of the calculation without regard to any unexercised conversion feature;
(vi) if all or a portion of the principal or Amortization Requirement of or interest on bonds is payable from funds set aside or deposited for such purpose (other than funds on deposit in the Reserve Account), including funds deposited to the credit of the Construction Fund as provided in the Trust Agreement, together with projected earnings thereon, such principal, Amortization Requirement or interest shall not be included in computing Principal and Interest Requirements if such funds, together with the investment earnings thereon, will provide sufficient monies to pay when due such principal, Amortization Requirement or interest, as applicable; and
(vii) to the extent that the County has entered into a Hedge Agreement with respect to any bonds and notwithstanding the provisions of clauses (i) through (vi) above, while the Hedge Agreement is in effect and so long as the Counterparty has not defaulted thereunder and so long as the senior-long term debt obligations of the Counterparty or of any entity guaranteeing the payment obligations of the Counterparty under the Hedge Agreement are rated in one of the three highest rating categories (without regard to any gradations within such categories) of three nationally recognized rating agencies (or such lesser number of nationally recognized rating agencies as are then in existence), for the purpose of determining the Principal and Interest Requirements the interest rate with respect to the principal amount of such bonds equal to the “notional” amount specified in the Hedge Agreement shall be assumed to be (A) if the County’s Hedge Obligations under the Hedge Agreement are computed based upon a fixed rate of interest, the actual rate of interest upon which the County’s Hedge Obligations are computed under such Hedge Agreement, and (B) if the County’s Hedge Obligations under the Hedge Agreement are computed based upon a variable rate of interest, the average rate of interest for the County’s Hedge Obligations under the Hedge Agreement for the prior fiscal year or portion thereof while the Hedge Agreement was in effect or if the Hedge Agreement was not in effect during such prior fiscal year, then the lesser of (X) the initial rate of interest for the County’s Hedge Obligations under the Hedge Agreement and (Y) the average rate of interest for the prior fiscal year under a published variable interest rate index selected by the County which is generally consistent with the formula which shall be used to determine the County’s Hedge Obligations; “average rate” with respect to the County’s Hedge Obligations for the prior fiscal year means the rate determined by dividing the total annualized amount paid by the County under the Hedge Agreement in such fiscal year or portion thereof (without taking into account Hedge Receipts during such prior fiscal year or portion thereof) by the “notional” amount specified in the Hedge Agreement for such fiscal year.
“Project” means any project which shall be financed or refinanced under the provisions of the Trust Agreement, including, without limitation, any project permitted under Chapter 125, Florida Statutes, or Chapter 166, Florida Statutes.
“Put bonds” means all bonds which in accordance with, or pursuant to, the resolution authorizing the issuance of a Series of bonds, may be tendered for payment or purchase by or on behalf of the County prior to the stated maturities thereof.
“Reserve Account Requirement” means, as of any date of calculation, one half (1/2) of the maximum amount of Principal and Interest Requirements for any fiscal year thereafter on account of all bonds then Outstanding.
“Reserve Facility” means any insurance policy, surety bond, irrevocable letter of credit or other credit agreement or similar facility maintained by the County in lieu of or in substitution for cash or securities on deposit in the Reserve Account, which is issued by a provider rated on the date of deposit of such facility into the Reserve Account created in the Sinking Fund in one of the two highest rating categories (without regard to any gradations

C-7
within such categories) of a nationally recognized rating agency, including in every case the nationally recognized rating agency which rated the bonds on account of which such facility is obtained.
“Revenues” means all monies received or earned by the County for the use of, and for the services and facilities furnished by, the Port Authority Properties and all other income derived by the County from the operation or ownership of said Properties, including any ground rentals paid for land on which buildings or structures may be constructed, whether such buildings or structures shall be financed by bonds issued under the provisions of the Trust Agreement or otherwise, and Hedge Receipts, but shall not include any monies received as a grant or gift from the United States of America or the State of Florida or any department or agency of either thereof or any monies received from the sale of property under the provisions of the Trust Agreement or, unless otherwise provided by resolution of the Board, any Passenger Facilities Charges. The County may select whether to use a cash or accrual basis of accounting, but if it chooses a method that is different than the method then being used, it may only make a change to the extent such change is presented retroactively for each year as if it had been in effect for the last five years.
“Variable rate bonds” means bonds issued with a variable, adjustable, convertible or other similar interest rate which is not fixed in percentage for the entire term thereof at the date of issue and which may be convertible to a fixed interest rate.
Application of Bond Proceeds
The Trust Agreement provides for the creation of the Construction Fund held by the Co-Trustee to the credit of which shall be deposited the proceeds of any bonds issued for Projects or Improvements. Separate Series Accounts are required to be created in the Construction Fund with respect to each Series of bonds issued. The monies in the Construction Fund shall be disbursed to pay the cost of Improvements or Projects upon submission by the County to the Co-Trustee of requisitions therefor or to pay interest on bonds as provided in, or pursuant to, the resolution authorizing such bonds. Monies in the Construction Fund shall be subject to a lien and charge in favor of the holders of the bonds until paid out or transferred.
Collection and Disposition of Revenues
Revenue Fund, Annual Budget and Payment of Current Expenses
The Trust Agreement provides for all Revenues to be deposited with the Co-Trustee in the Revenue Fund and to be disbursed only in accordance with the terms of the Trust Agreement. Funds in the Revenue Fund are to be applied first to the payment of Current Expenses as the same become due and payable. Monies on deposit to the credit of the Revenue Fund shall be invested by the Co-Trustee, at the direction of the County, in Authorized Investments having such maturities as specified by the County.
The Trust Agreement requires the preparation and adoption by the County of an Annual Budget of Current Expenses and Capital Expenditures for each fiscal year. The Trust Agreement provides that all expenditures for Current Expenses shall be made only upon the filing with the Co-Trustee of the requisitions required by the Trust Agreement. The County may requisition from the Co-Trustee, at one time or from time to time, a sum or sums aggregating not more than $100,000 (exclusive of reimbursement) to be used as a revolving fund for the payment of Current Expenses as cannot conveniently otherwise be paid. The County covenants that it will at all times maintain and operate the Port Authority Properties in an efficient and economical manner and keep the same in good repair and sound operating condition and make all necessary repairs, renewals and replacements. The County covenants that the Current Expenses incurred in any fiscal year will not exceed the reasonable and necessary amount thereof.
In addition to the Revenue Fund, the Trust Agreement creates three other funds: the Sinking Fund (and three accounts therein - the Bond Service Account, the Reserve Account and the Redemption Account), the Reserve Maintenance Fund and the Improvement Fund. After reserving in the Revenue Fund as of the end of each month an amount up to 20% of the Current Expenses for the current fiscal year as shown by the Annual Budget, the Co-Trustee shall remit to the Trustee the balance of the monies in the Revenue Fund. The Trustee shall deposit the money so received to the credit of the following Accounts or Funds in the order set forth below:

C-8
Bond Service Account
There is required to be deposited to the credit of the Bond Service Account in the Sinking Fund an amount equal to 1/6 of the amount of the next interest payment on all bonds Outstanding and (beginning with the twelfth month preceding the first maturity of any serial bonds of a Series) an amount equal to 1/12 of the amount of the next principal payment on account of any such serial bonds.
This requirement shall be cumulative and the amount of any deficiency in any month shall be added to the amount otherwise required to be deposited to the credit of such Account in each month thereafter until such time as such deficiency shall be made up.
The Trustee shall from time to time withdraw sufficient monies from the Bond Service Account to pay the interest on all Outstanding bonds and the principal of all serial bonds as the same become due.
Redemption Account
From the monies remaining after making the required deposit to the Bond Service Account, there is required to be deposited to the credit of the Redemption Account in the Sinking Fund an amount equal to 1/12 of the Amortization Requirement, if any, for such fiscal year for any term bonds then Outstanding, plus an amount equal to 1/12 of the premium, if any, which shall be payable on the redemption date with respect to such Amortization Requirement if such principal amount of bonds should be redeemed on such date from monies in the Sinking Fund.
This requirement shall be cumulative and the amount of any deficiency in any month shall be added to the amount otherwise required to be deposited to the credit of such Account in each month thereafter until such time as such deficiency shall be made up.
Monies held for the credit of the Redemption Account shall be used to retire bonds issued under the Trust Agreement as follows:
(a) Subject to paragraph (c) below, the Trustee shall endeavor to purchase bonds, whether or not such bonds shall then be subject to redemption, at the most advantageous price obtainable with reasonable diligence, having due regard to interest rate and price, such price not to exceed the principal and premium, if any, which would be payable on the next redemption date with respect to such bonds. (Accrued interest on such bonds shall be paid from the Bond Service Account, with the purchase price payable from the Redemption Account.)
(b) Subject to the provisions of the Trust Agreement relating to the redemption of bonds and to paragraph (c) below, the Trustee shall call for redemption on each interest payment date on which bonds are subject to redemption from monies in the Sinking Fund such amount of bonds then subject to redemption as, with the redemption premium, if any, will as nearly as possible exhaust the Redemption Account, provided that not less than $50,000 principal amount of bonds shall be called at any one time.
(c) Monies in the Redemption Account shall be applied to the purchase or redemption of bonds in the
following order:
First, term bonds of each Series, if any, in the order of their issuance, to the extent of the Amortization Requirement, if any, of the then current fiscal year for such term bonds plus the applicable premium, if any, and any deficiency in preceding fiscal years in the purchase or redemption of such term bonds; provided, however, that if none of the term bonds of a Series shall be subject to redemption from monies in the Sinking Fund and if the Trustee shall at any time be unable to exhaust the monies applicable to the bonds of any such Series in the purchase of such bonds under the provisions of paragraph (a) above, such monies or the balance of such monies, as the case may be, shall be retained in the Redemption Account and, as soon as it is feasible, applied to the retirement of the term bonds of such Series;

C-9
Second, to the purchase of any bonds secured under the provisions of the Trust Agreement and then Outstanding, whether or not such bonds shall be subject to redemption, in accordance with the provisions of paragraph (a) above;
Third, term bonds of each Series in proportion (as nearly as practicable) to the aggregate principal amount of the bonds of each such Series originally issued; and
Fourth, after the retirement of all Outstanding term bonds, serial bonds issued under the provisions of the Trust Agreement in the inverse order of their maturities and, to the extent the serial bonds of different Series mature on the same date, in proportion (as nearly as practicable) to the principal amount of the bonds of each Series maturing on such date.
Reserve Account
From the monies remaining in the Revenue Fund after making the required monthly deposits to the Bond Service Account and Redemption Account described above, there shall be deposited to the credit of the Reserve Account in the Sinking Fund an amount equal to 1/60 of the Reserve Account Requirement under the Trust Agreement until the amount to the credit of the Reserve Account (including amounts available under any Reserve Facilities) shall be equal to the Reserve Account Requirement; provided, however, that if the required deposit to the Reserve Account is being satisfied by the reinstatement of any amount drawn under a Reserve Facility, there shall be paid to the provider thereof such amount as shall be required to cause the provider to reinstate no less than the required deposit for such month.
This requirement shall be cumulative and the amount of any deficiency in any month shall be added to the amount otherwise required to be deposited to the credit of such Account in each month thereafter until such time as such deficiency shall be made up.
Monies in the Reserve Account shall be used by the Trustee to pay the interest due on the Outstanding bonds and maturing principal of serial bonds whenever and to the extent that the monies held for the credit of the Bond Service Account are insufficient for such purpose, and, immediately following the use of such monies for the payment of such interest and principal for the purpose of making up any prior deficiencies in deposits to the credit of the Redemption Account whenever the monies in the Revenue Fund are insufficient for such purpose. If at any time the balance in the Reserve Account shall exceed the Reserve Account Requirement, such excess shall be transferred to the credit of the Redemption Account or withdrawn by the Trustee and deposited with the Co-Trustee to the credit of the Improvement Fund as may be specified by the County.
In lieu or in satisfaction of any required deposit into the Reserve Account or in substitution for all or a portion of the amounts on deposit therein, the County may cause to be deposited into the Reserve Account a Reserve Facility for the benefit of the holders of the bonds, which Reserve Facility shall be available to be drawn (upon the giving of notice as required thereunder) on any payment date on which a deficiency exists for payment of the bonds, which deficiency is payable from the Reserve Account and which cannot be cured by monies in the Reserve Account or any other fund or account held pursuant to the Trust Agreement and available for such purpose. If any such Reserve Facility is substituted for monies on deposit in the Reserve Account, the excess monies in the Reserve Account shall be applied to satisfy any deficiency in any of the funds and accounts, and any remaining balance shall be deposited with the Co-Trustee to the credit of the Improvement Fund. If a disbursement is made from a Reserve Facility, the County shall be obligated, in accordance with the provisions of the Trust Agreement, to either (i) reinstate such Reserve Facility, (ii) deposit monies in the Reserve Account, or (iii) undertake a combination of such alternatives.
In the event the Reserve Account is at any time funded with more than one Reserve Facility, any required draw under such facilities shall be made on a pro-rata basis thereunder; provided, however, that if at the time of such draw the Reserve Account is only partially funded with one or more Reserve Facilities, prior to drawing on such facilities, there shall first be applied any cash and securities on deposit in the Reserve Account and, if after such application a deficiency exists, the Trustee shall make up the deficiency by drawing on such facilities as provided in this paragraph. Amounts drawn or paid under a Reserve Facility shall be reimbursed to the provider thereof in

C-10
accordance with the terms and provisions of the reimbursement or other agreement governing such facility entered into between the County and such provider.
Reserve Maintenance Fund
From the monies remaining in the Revenue Fund after making the required deposits to the Bond Service Account, Redemption Account and Reserve Account described above, there shall be deposited with the Co-Trustee to the credit of the Reserve Maintenance Fund the amount required to make the amount deposited during such fiscal year equal to the amount recommended by the Consulting Engineers in a report prepared after an annual inspection of the Port Authority Properties by the Consulting Engineers or such greater amount as may from time to time be directed by the Director in writing to the Co-Trustee, such amount to be increased or decreased in accordance with any amendments to the Annual Budget of Capital Expenditures.
Monies held for the credit of the Reserve Maintenance Fund shall be used only for paying all or part of the cost of unusual or extraordinary maintenance or repairs, renewals and replacements, the cost of replacing equipment, and premiums on insurance required by the Trust Agreement; provided, however, that monies in said Fund may also be disbursed:
(a) To meet an emergency caused by some extraordinary occurrence, so characterized by a certificate signed by the Consulting Engineers and filed with the Co-Trustee and accompanied by a certificate from the Director stating that funds to the credit of the Revenue Fund are insufficient to meet such emergency,
(b) To pay interest due on the Outstanding bonds and the principal on serial bonds, or the deposits required to be made to the credit of the Redemption Account, in the event the monies to the credit of the Bond Service Account and the Reserve Account are insufficient for such purpose, and
(c) To pay any additional amount necessary to repair, replace or reconstruct damaged or destroyed property over and above any proceeds of insurance covering such damaged or destroyed property.
Monies may also be transferred from the Reserve Maintenance Fund to the Revenue Fund if the County shall direct the same by resolution and the Consulting Engineers shall certify that the amount to be transferred is not required for the purposes for which the Reserve Maintenance Fund was created.
Improvement Fund
The balance of any monies remaining in the Revenue Fund after making the required deposits to the Bond Service Account, the Redemption Account, the Reserve Account and the Reserve Maintenance Fund described above shall be deposited with the Co-Trustee to the credit of the Improvement Fund; provided, however, that the County may by resolution direct the Trustee to deposit all or part of such balance from the Revenue Fund to the credit of the Redemption Account.
Monies held for the credit of the Improvement Fund may be disbursed by the County from time to time for any airport or airport-related purpose, and for the retirement of any bonds issued under the provisions of the Trust Agreement or may be pledged by the County to the payment of any bonds or other obligations issued or assumed by it. Unencumbered funds in the Improvement Fund shall be used to make up a deficiency in any Series Account in the Construction Fund in the amount required to complete payment of the cost of any Improvements or Project payable from such Series Account.
There may also be deposited to the credit of the Improvement Fund any monies received by the County from any property or facilities owned or operated by it which do not constitute a part of the Port Authority Properties.
C-11
Alternate Provisions for Certain Bonds and Hedge Agreements
A resolution authorizing the issuance of a particular Series of bonds may provide alternative provisions relating to the payment of the principal of and interest on such bonds, in which event deposits to the credit of the Bond Service Account, the Redemption Account and the Reserve Account on account of the bonds of such Series, shall, if and to the extent provided in, or pursuant to, such resolution, be made at such times and in such amounts, and may be set aside and held for the account of and disposition by the County, all as shall be provided in such resolution.
The County may authorize, by resolution, a Hedge Agreement with respect to any Series of bonds, including any Outstanding bonds and any bonds thereafter issued under the Trust Agreement. Such resolution may provide for deposits to the credit of the Bond Service Account under the Trust Agreement for the payment of Hedge Obligations (but not Hedge Charges) to be made at such time and in such amounts, and to be set aside and held for the account of and for the disposition by the County all as shall be provided in such resolution; provided, however, that the Counterparty shall under no circumstances be granted a lien upon or pledge of Net Revenues ranking prior to or on a parity basis with the lien or pledge created by the Trust Agreement; and provided further, however, that Hedge Charges shall only be payable from the Improvement Fund.
Investment of Funds
Monies on deposit to the credit of any funds and accounts held under the Trust Agreement, including the Construction Fund, shall as nearly as may be practicable, be invested and reinvested, at the direction of the County, in Authorized Investments. Monies on deposit to the credit of the Reserve Account shall, as nearly as practicable, be invested and reinvested by the Trustee, at the direction of the County, in Authorized Investments which shall mature or which shall be subject to redemption at the option of the holder not later than fifteen (15) years after the date of such investment.
Monies on deposit to the credit of the Revenue Fund, the Reserve Maintenance Fund and the Improvement Fund shall be invested by the Co-Trustee, at the direction of the County, in Authorized Investments having such maturities as specified in a certificate of the County.
Temporary Financing
The County may at any time or times issue its notes or other obligations to finance temporarily any of the Improvements or Projects for which it may issue additional bonds under the Trust Agreement, payable not from Revenues, but solely from the proceeds of such bonds or from any unencumbered monies in the Improvement Fund. If additional bonds are issued under the Trust Agreement to pay such notes or obligations, the Improvements or Project financed with such notes or other obligations shall then constitute a part of the Port Authority Properties.
Issuance of Additional Bonds
The County may issue additional bonds payable on a parity basis with the bonds under the Trust Agreement (the “Additional Bonds”) at any time or times for the purpose of paying all or part of the cost of any additional Improvements or Project or any portions thereof, including the payment of any notes or other obligations of the County or the repayment of any advances made from any source to temporarily finance such cost, and for making a deposit to the Reserve Account in an amount not to exceed the increase in the Reserve Account Requirement related to the issuance of such Series of bonds. Such bonds shall not be authenticated by the Trustee, in accordance with the then-current form of the Trust Agreement, until the following documents, among others, have been received and the following conditions have been met:
(a) A copy of the resolution authorizing the issuance of the Additional Bonds.
(b) If not provided in the resolution under (a) above, a copy of the resolution awarding such Additional Bonds and directing the authentication and delivery of such Additional Bonds to or upon the order of the principal underwriters upon payment of the purchase price therefor.

C-12
(c) A statement, signed by the Consulting Engineers certifying that the construction or acquisition of the Improvements or Project described in the resolution authorizing the issuance of such Additional Bonds is, in their opinion, necessary to place or maintain the Port Authority Properties in proper condition for their safe, efficient and economic operation or to preserve, extend, increase or improve the service rendered by the Port Authority Properties, and giving their estimate of the total cost of the Improvements or Project or portions thereof (including a reserve for contingencies), to be financed in whole or in part by the issuance of such Additional Bonds.
(d) To the extent necessary for purposes of (h)(ii) below, a statement, signed by the Traffic Engineers, giving their estimates (taking into account the information contained in item (iv) of the certificate of the Director mentioned in (e) below) of:
(i) The amounts of the Current Expenses in each of the five fiscal years immediately following the date of said statement or, if interest on the Additional Bonds is to be paid from proceeds of such Additional Bonds, in each of the five fiscal years immediately following the last date on which interest on such Additional Bonds is to be paid from proceeds of such Additional Bonds, and
(ii) The amount of annual Net Revenues in each of the five fiscal years immediately following the date of said statement or, if interest on the Additional Bonds is to be paid from proceeds of such Additional Bonds, in each of the five fiscal years immediately following the last date on which interest on such Additional Bonds it to be paid from proceeds of such Additional Bonds.
(e) A certificate, signed by the Director (and approved by the Trustee as to item (i) below and by the Traffic Engineers as to any adjustments described in item (iii) below), setting forth:
(i) The amount of the Principal and Interest Requirements for each succeeding fiscal year on account of all bonds then Outstanding and the Additional Bonds,
(ii) The amount, if any, which is then available or will be made available for paying the cost of such Improvements or Project or portions thereof and the source or sources from which such amount has been or will be received,
(iii) To the extent necessary for purposes of (h)(ii) below, the amount of Net Revenues for
any period of 12 consecutive calendar months selected by the County out of the eighteen calendar months immediately preceding the date of said certificate (the “Computation Period”); provided, however, that if the rates and charges for the use of, and for the services and facilities furnished by, the Port Authority Properties shall have been revised prior to the date of such certificate, the Net Revenues for the Computation Period may be adjusted to reflect the amounts which would have been received had such rates and charges been in effect throughout the Computation Period, and
(iv) If interest on the Additional Bonds is to be paid from proceeds of such Additional Bonds, the last date on which interest on such Additional Bonds is expected to be paid from proceeds of such Additional Bonds.
(f) A certificate of the Director stating that the County is not in default under any provisions of the Trust Agreement.
(g) An opinion of the County Attorney stating that the proposed Additional Bonds have been duly authorized and all conditions to their delivery have been met.
(h) The Trustee has determined that:
(i) The proceeds (excluding accrued interest) of such Additional Bonds to be applied to the costs of the Improvements or Project or portions thereof to be financed in whole or in part by the Additional Bonds, together with any other funds made available therefor, shall be not less than the

C-13
estimated total cost of the Improvements or Project or portions thereof to be financed in whole or in part by the Additional Bonds;
(ii) e certificate of the Director mentioned in (e) above by the largest amount of Principal and Interest Requirements shown for any fiscal year in item (i) of said certificate mentioned in (e) above shall not be less than 120%, or (b) the percentages derived by dividing the amount of Net Revenues for each of the fiscal years shown in item (ii) of the statement of the Traffic Engineers mentioned in (d) above by the amount of Principal and Interest Requirements shown for the corresponding fiscal years in item (i) of the certificate of the Director mentioned in (e) above shall not be less than 120%; and
(iii) The amount to the credit of the Reserve Account in the Sinking Fund (including amounts available under any Reserve Facilities) shall be not less than the amount then required to be on deposit to the credit of the Reserve Account at such time under the terms of the Trust Agreement.
The proceeds of any such Additional Bonds, exclusive of accrued interest, are to be deposited in the Reserve Account to the extent necessary and the balance is to be deposited with the Co-Trustee to the credit of the related Series Account in the Construction Fund.
The Trust Agreement also provides an alternative for the issuance of Additional Bonds for completion of any Improvements or a Project in the event that the bonds initially issued for such Improvements or Project are insufficient to complete that Improvement or Project. Such Additional Bonds may be issued without meeting the requirements set forth in (a) through (h) above in order to provide additional funds for completion of Improvements or Projects, as shown by a resolution of the Board and a statement of the Consulting Engineers. Such Additional Bonds shall constitute a part of the same Series of the bonds as the bonds initially issued for the uncompleted Improvement or Project. Such Additional Bonds shall bear the same date as the bonds initially issued for such Improvements or Projects, but may be made subject to redemption at different times and prices. If the bonds initially issued were serial bonds, then the Additional Bonds shall be serial bonds maturing in annual installments beginning not earlier than one year after their delivery and ending in the year of the latest stated maturity of the bonds initially issued, and the annual installments shall be in such amounts that the Principal and Interest Requirements of such Additional Bonds shall be as nearly equal as the County deems practicable. If the bonds initially issued shall consist of term bonds or both serial bonds and term bonds, then the Additional Bonds shall be term bonds maturing on the same date as the term bonds initially issued, and the resolution authorizing the Additional Bonds shall fix, or provide for the fixing of, the Amortization Requirements for such Additional Bonds, beginning not earlier than one year after the date of delivery of such Additional Bonds and being that percentage, as nearly as practicable, of the Amortization Requirements for the term bonds initially issued which is derived by dividing the principal amount of the Additional Bonds by the principal amount of the term bonds initially issued. If an issue of Additional Bonds meets the requirements set forth in (a) through (h) above, such Additional Bonds do not have to meet the requirements set forth in this paragraph.
Issuance of Refunding Bonds
The County may issue revenue refunding bonds payable on a parity basis with the Bonds issued under the Trust Agreement (the “Refunding Bonds”) to:
(a) Refund at their maturity all or any portion of the Outstanding bonds of any Series which mature within 3 months thereafter. Such Refunding Bonds shall mature in a year not earlier than the year of the latest stated maturity of any bonds then Outstanding under the Trust Agreement.
(b) Redeem prior to or paying at their maturity all or any portion of the Outstanding bonds of any Series issued under the provisions of the Trust Agreement, including the payment of any redemption premium thereon and interest to accrue thereon to the date fixed for their redemption or maturity, as applicable, paying costs of issuance with respect thereto and making a deposit to the Reserve Account in an amount not to exceed the increase, if any, in the Reserve Account Requirement relating to the issuance of such Series Refunding Bonds.

C-14
(c) Refund all or any portion of obligations then outstanding which have not been issued under the provisions of the Trust Agreement for the payment of which there are pledged revenues of any airport or airport-related project or projects.
Refunding Bonds may be issued only if there shall be filed with the Trustee (i) a copy of the resolution authorizing such Refunding Bonds, (ii) if not provided in the resolution under (i) above, a copy of the resolution awarding such Refunding Bonds and directing the authentication and delivery of such Refunding Bonds, (iii) an opinion of the County Attorney stating that the issuance of such Refunding Bonds has been duly authorized and all conditions precedent thereto have been fulfilled and (iv) if such Refunding Bonds are to be issued for the purpose of redeeming bonds of any Series prior to their stated maturity, such documents as shall be required by the Trustee to show that provision has been duly made in accordance with the Trust Agreement for the redemption of all bonds to be refunded which are to be redeemed prior to their stated maturity.
Refunding Bonds may only be issued for the purpose described in (b) above if, among other conditions described in the Trust Agreement, either (A) the total Principal and Interest Requirements for the Refunding Bonds during their term is less than the total Principal and Interest Requirements for the bonds to be refunded during their term, (B) the percentage derived by dividing (i) the Net Revenues for the Computation Period by (ii) the maximum amount of Principal and Interest Requirements for any succeeding fiscal year on account of all bonds theretofore issued under the provisions of the Trust Agreement and then Outstanding (other than the refunded bonds) and the proposed Refunding Bonds, as set forth in a certificate of the Director, approved by the Traffic Engineers as to (i) above to the extent of any adjustments to Net Revenues and approved by the Trustee as to item (ii) above, shall not be less than 120%, or (C) the percentages derived by dividing (i) the estimated amount of annual Net Revenues in each of the five fiscal years immediately following delivery of the Refunding Bonds (such Net Revenues to be determined from the Revenues and Current Expenses as estimated by the Traffic Engineers in a statement signed by the Traffic Engineers) by (ii) the amount of the Principal and Interest Requirements for each of such five fiscal years on account of all bonds theretofore issued under the provisions of the Trust Agreement and then Outstanding (other than the refunded bonds) and the proposed Refunding Bonds, as set forth in a certificate of the Director, shall not, in each such year, be less than 120%.
Issuance of Refunding Bonds for the purpose described in (c) above may be undertaken only if, among other conditions described in the Trust Agreement, (A) the percentages derived by dividing the estimated amount of annual Net Revenues of the Port Authority Properties, including the project or projects financed with the obligations to be refunded, in each of the five fiscal years immediately following delivery of such Refunding Bonds, as estimated by the Traffic Engineers in accordance with the terms of the Trust Agreement, by the amount of the Principal and Interest Requirements for the corresponding fiscal years for all bonds then Outstanding and the proposed Refunding Bonds shall not, in each such year, be less than 120%, and (B) the County is not then in default under the Trust Agreement and there is no deficiency in the Reserve Account in the Sinking Fund.
Refunding Bonds issued for any of the above purposes shall mature not later than forty years from their date and may be subject to redemption prior to maturity (including from Amortization Requirements for any term bonds).
Other Types of Bonds, Credit Enhancement and Hedge Agreements
The County may (i) provide that any bonds authorized to be issued under the Trust Agreement may be issued as capital appreciation bonds, capital appreciation and income bonds, convertible bonds, put bonds, variable rate bonds or such other types of bonds as may be marketable from time to time, or any combination thereof, (ii) provide that such bonds shall be additionally secured by a Credit Facility and/or Liquidity Facility, (iii) enter into agreements with any bank, dealer in tax exempt bonds or other institution for the remarketing of bonds which have been tendered for payment, (iv) enter into agreements with any bank or other financial institution providing a Credit Facility or Liquidity Facility for the reimbursement of funds advanced under such Credit Facility or Liquidity Facility, and (v) enter into Hedge Agreements.
For purposes of determining the principal amount of a capital appreciation bond or a capital appreciation and income bond for redemption, acceleration or computation of the amount of bonds held by the holder thereof in giving any notice, consent, request or demand pursuant to the Trust Agreement for any purpose whatsoever, the

C-15
principal amount of a capital appreciation bond shall be deemed to be its Accreted Value and the principal amount of a capital appreciation and income bond shall be deemed to be its Appreciated Value.
Use of Port Authority Properties
The County covenants that it will establish and enforce reasonable rules and regulations governing the use of the Port Authority Properties and the operation thereof, that all compensation, salaries, fees and wages paid by it in connection with the maintenance, repair and operation of the Port Authority Properties will be reasonable, that no more persons will be employed by it than are necessary, and that it will maintain and operate the Port Authority Properties in an efficient and economical manner, that it will at all times maintain the same in good repair and in sound operating condition and will make all necessary repairs, renewals and replacements.
Disposal of Port Authority Properties
The County covenants that except as otherwise permitted in the Trust Agreement it will not sell or otherwise dispose of or encumber the Port Authority Properties or any part thereof and will not create or permit to be created any charge or lien on the Revenues thereof ranking equally with or prior to the charge or lien on such Revenues of the bonds issued under and secured by the Trust Agreement; provided, however, that the County may, from time to time, sell or otherwise dispose of property forming part of the Port Authority Properties, if the Director shall determine that such property is no longer needed or is no longer useful in connection with the construction or operation and maintenance of the Port Authority Properties (with any proceeds thereof to be applied to the replacement of the property so sold or disposed of or deposited to the credit of the Redemption Account in the Sinking Fund, the Reserve Maintenance Fund or the Revenue Fund as the Board shall determine by resolution).
Bonds Secured Otherwise Than by the Trust Agreement
Nothing in the Trust Agreement is to be construed as preventing the issuance by the County of obligations secured by other than the revenues pledged as security for the bonds issued under the provisions of the Trust Agreement. The County covenants, however, that: (1) none of the Revenues of the Port Authority Properties will be used for any purpose other than as provided in the Trust Agreement, (2) it will not construct or consent to the construction of any project (including any building or structure at Miami International Airport) other than such projects as shall be financed by Additional Bonds under the Trust Agreement unless there shall be filed with the Clerk of the Board (a) a statement, signed by the Traffic Engineers, certifying that in their opinion, the operation of such project will not affect the County’s compliance with the rate covenant set forth in the Trust Agreement and (b) a statement, signed by the Consulting Engineers, certifying that the operation of such project will not impair the operating efficiency of the Port Authority Properties, and (3) no contracts will be entered into or any action taken that would impair or diminish the rights of the Trustee, the Co-Trustee, and the bondholders. An airport or airport-related project financed by obligations not issued under the Trust Agreement may be added to the Port Authority Properties by resolution of the Board if the amount of the annual Net Revenues of the Port Authority Properties including such project in each of the five fiscal years immediately following the inclusion of such project in the Port Authority Properties, as estimated by the Traffic Engineers in accordance with the terms of the Trust Agreement, after deducting the amount of the average annual deposits estimated by the Consulting Engineers to be required to be made to the credit of the Reserve Maintenance Fund in such five fiscal years, will, in each such fiscal year, be not less than 120% of the Principal and Interest Requirements for such fiscal year on account of all bonds then Outstanding under the Trust Agreement.
Insurance
The County covenants that it will maintain a practical insurance program, with reasonable terms, conditions, provisions and costs which the Director determines, with the approval of an independent risk management consultant having a nationwide and favorable repute for skill and experience in such work selected by the County, will afford adequate protection against loss caused by damage to or destruction of the Port Authority Properties or any part thereof and also such comprehensive public liability insurance on the Port Authority Properties for bodily injury and property damage and in such amounts as may be approved by such independent risk management consultant.

C-16
All such insurance policies shall be carried in a responsible insurance company or companies authorized and qualified under the laws of the State of Florida to assume the risks thereof.
The proceeds of all such insurance covering damage to or destruction of Port Authority Properties shall be deposited with the Co-Trustee and shall be available for and shall, to the extent necessary and in the opinion of the Consulting Engineers desirable, be applied to the repair, replacement or reconstruction of the damaged or destroyed property, and shall be paid out in the manner provided in the Trust Agreement for payments from the Construction Fund. If such proceeds are more than sufficient for such purpose, the balance remaining shall be deposited to the credit of the Reserve Maintenance Fund. If such proceeds shall be insufficient for such purpose, the deficiency shall be supplied out of any monies in the Reserve Maintenance Fund.
Engineers
The County covenants to employ an independent engineer or engineering firm or corporation having a nationwide and favorable repute for skill and experience in such work for the purpose of carrying out the duties imposed on the Consulting Engineers as detailed in the Trust Agreement, and to employ an independent engineer or engineering firm or corporation having a nationwide and favorable repute for skill and experience in such work to perform the duties imposed on the Traffic Engineers by the Trust Agreement.
Audits and Reports
The County covenants to keep accurate records and accounts of the Revenues of the Port Authority Properties, of the application of such Revenues and of all items of costs and expenditures relating to the Port Authority Properties. Such records and accounts shall be open to the inspection of all interested persons.
The County also covenants to file monthly with the Trustee and Co-Trustee and mail to the Consulting Engineers and each bondholder who has filed his name and address with the County for such purpose, any revisions of the rates and charges for the Port Authority Properties made during the preceding calendar month and a report of the preceding calendar month setting forth the Revenues and Current Expenses of the Port Authority Properties, the deposits to, and withdrawals from, each special fund and account created under the Trust Agreement, the details of all bonds issued, paid, purchased or redeemed, a balance sheet as of the end of such month, the balance in each fund and account and the details of investments thereof and the proceeds received from any sales of property.
The County further covenants that it will cause an audit of its books and accounts to be made annually by an independent firm of certified public accountants of recognized ability and standing, and that it will cause an annual report of the operations of the Port Authority Properties covering matters usually contained in annual reports for similar properties, to be prepared and filed with the County, the Consulting Engineers, the Trustee, the Co-Trustee, each provider of a Credit Facility and each bondholder who shall have filed his name and address with the County for such purposes. Such annual reports shall be open to the inspection of all interested persons.
Defeasance
If, in addition to any requirements set forth in any resolution authorizing the issuance of a particular Series of bonds, when the bonds secured under the Trust Agreement shall have become due and payable in accordance with their terms or shall have been duly called for redemption or irrevocable instructions to call the bonds for redemption shall have been given by the County to the Trustee, the whole amount of the principal and the interest and the premium, if any, so due and payable upon all of the bonds and coupons then Outstanding shall be paid or sufficient monies, Government Obligations, or a combination of monies and Government Obligations, shall be held by the Trustee or the Paying Agents for such purpose, and provision shall also be made for paying all other sums payable under the Trust Agreement by the County, then and in that case the right, title and interest of the Trustee and of the Co-Trustee shall thereupon cease, determine and become void, and the Trustee and the Co-Trustee in such case, on demand of the County, shall release the Trust Agreement and shall execute such documents to evidence such release as may be reasonably required by the County, and shall turn over to the County or to such officer, board or body as may then be entitled by law to receive the same any surplus in any account in the Sinking Fund and all balances

C-17
remaining in any other funds or accounts other than monies held for redemption or payment of bonds or coupons; otherwise the Trust Agreement shall be, continue and remain in full force and effect.
For purposes of the above paragraph, Government Obligations shall be deemed sufficient to pay or redeem bonds if the principal of and interest on such Government Obligations, when due, will be sufficient to pay the principal and the interest and the redemption premium, if any, due on the bonds.
Amendments or Modifications
Any of the provisions of the Trust Agreement may be modified or amended from time to time by supplemental agreements entered into by the County and Trustees upon the consent of the holders of not less than two-thirds in an aggregate principal amount of the bonds then Outstanding, provided that any such modification or amendment will not permit (a) extension of the maturity of the principal of or the interest on any bond, (b) a reduction of the principal amount of any bond or the redemption premium or the rate of interest of any bond, (c) the creation of a lien or a pledge of revenues ranking prior to or on a parity basis with the lien or pledge created by the Trust Agreement, (d) a preference or priority of any bond or bonds over any other bond or bonds, or (e) a reduction in the aggregate principal amount of the bonds required for consent to such supplemental agreements.
The County and the Trustees may, without the consent of the bondholders, enter into supplemental agreements to cure any ambiguity, formal defect or omission in the Trust Agreement or any supplemental agreement or to grant to or confer upon the Trustees or either of them for the benefit of the bondholders any additional rights, remedies, powers, authority or security that may lawfully be granted to or conferred upon the bondholders or the Trustees or either of them.
So long as the provider of a Credit Facility has not defaulted in its obligations thereunder, such provider will be deemed the holder of all bonds secured by such Credit Facility for purposes of any required consents and approvals to such supplemental agreements from the holders of bonds.
The holders of any Series of bonds to be issued under the Trust Agreement shall be deemed to have consented to a supplemental agreement if the principal underwriters of such Series of bonds shall consent in writing to such supplemental agreement and the nature of such supplemental agreement is disclosed in any offering document pursuant to which such Series of bonds is being offered for sale.
Remedies of Bondholders
The Trust Agreement defines events of default as (i) the failure to pay the principal of and any redemption premium on any of the bonds and, if provided in, or pursuant to, the resolution authorizing the issuance of a particular Series of bonds, payment of the purchase price thereof, when the same shall become due and payable, whether at maturity, pursuant to optional or mandatory tender or upon call for redemption or otherwise, (ii) the failure to pay interest within 10 days after the same shall become due and payable, (iii) the failure to deposit to the credit of the Redemption Account in any fiscal year an amount equal to the Amortization Requirement for such fiscal year for the term bonds of each Series then Outstanding, (iv) the County shall for any reason be rendered incapable of fulfilling its obligations under the Trust Agreement, (v) a final judgment for the payment of money shall be rendered against the County as a result of the ownership, control or operation of the Port Authority Properties and not discharged, appealed or stayed within 60 days from the entry thereof, (vi) a receiver of the Port Authority Properties or the Revenues shall have been appointed and, if such appointment was without the consent or acquiescence of the County, shall not have been vacated, stayed, or discharged within 60 days after the entry of an order or decree appointing said receiver, (vii) any proceeding shall be instituted with the consent and acquiescence of the County, for the purpose of effecting a composition or adjustment of claims between the County and creditors pursuant to any federal or state statute, if such claims are payable out of Revenues, and (viii) the default by the County, after 30 days’ notice thereof by the Trustee, in the due and punctual performance of any of the covenants or provisions in the bonds or in the Trust Agreement, provided that if such default shall be of a type which can be remedied but not within 30 days, it shall not constitute an event of default if the County in good faith begins and diligently pursues to remedy such default within such 30-day period.

C-18
The Trust Agreement provides that failure to meet the minimum requirements, set forth in subparagraphs (ii) and (iii) under the caption “SECURITY FOR THE SERIES 2019 BONDS – Rate Covenant” in the main body of the Official Statement, in any fiscal year, of the Reserve Maintenance Fund or the Sinking Fund does not in itself constitute an event of default if the County shall comply with all recommendations of the Traffic Engineers as to rates and charges; however, the Trustee or the holders of not less than a majority in principal amount of bonds Outstanding may, or upon the request of the holders of not less than a majority, in principal amount of bonds Outstanding, and upon being indemnified to its satisfaction, the Trustee shall institute appropriate action to compel the County to revise the rates and changes.
In the event of default, the Trustee may, and upon the request of the holders of not less than a majority in principal amount of the bonds Outstanding shall, declare the principal of all Outstanding bonds to be due and payable immediately. The Trustee may, and upon the request of the holders of not less than a majority in principal amount of the Outstanding bonds shall, proceed to protect and enforce its rights and the rights of the bondholders by such suits, actions or special proceedings in equity or at law as the Trustee being advised by counsel shall deem most effectual to protect and enforce such rights. Anything in the Trust Agreement to the contrary notwithstanding, the holders of a majority in principal amount of bonds then Outstanding shall have the right, subject to the obligation to indemnify the Trustee pursuant to the terms of the Trust Agreement, to direct the method and place of conducting all remedial proceedings, to the extent lawful and in the opinion of the Trustee not unjustly prejudicial to other bondholders not parties to such directions. No remedy is intended to be exclusive of any other remedy or remedies, and each and every remedy is cumulative and is in addition to every other remedy given under the Trust Agreement or existing at law.
No holder of any of the bonds, except as described above, shall have any right to institute any suit, action, mandamus or other proceedings in equity or at law for the enforcement of any right under the Trust Agreement or the laws of Florida, unless such holder previously shall have given to the Trustee written notice of the event of default or breach of trust or duty on account of which such suit, action or proceeding is to be taken, and unless the holders of not less than a majority in principal amount of the Outstanding bonds shall have made written request of the Trustee after the right to exercise such powers or right of action, as the case may be, shall have accrued, and shall have afforded the Trustee a reasonable opportunity either to exercise its granted powers or to institute such action, suit or proceedings, and unless there shall have been offered to the Trustee reasonable security and indemnity against the costs, expenses and liabilities to be incurred therein or thereby, and the Trustee shall have refused or neglected to comply with such request within a reasonable time.
So long as the provider of a Credit Facility has not defaulted in its obligations thereunder, such provider will be deemed the holder of all bonds secured by such Credit Facility for purposes of exercising the rights of the holders of bonds upon the occurrence of any event of default.

APPENDIX D
SUMMARY OF CERTAIN PROVISIONS OF THE 2018 AIRLINE USE AGREEMENT AND THE PREFERENTIAL GATE USE AGREEMENT

[THIS PAGE INTENTIONALLY LEFT BLANK]

D-1
APPENDIX D
SUMMARY OF CERTAIN PROVISIONS OF THE 2018 AIRLINE USE AGREEMENT AND THE PREFERENTIAL GATE USE AGREEMENT
I. THE 2018 AIRLINE USE AGREEMENT
The 2018 Airline Use Agreement (“2018 AUA”) sets forth the operating privileges and responsibilities at Miami International Airport (“MIA” or the “Airport”) for an airline operating at MIA that has signed the 2018 AUA (a “Signatory Airline”). The 2018 AUA does not lease or convey any property interest to the Signatory Airline and is effective as to any successor governing authority of the Airport.
The following is a summary of certain provisions of the 2018 AUA. This summary does not purport to be complete. A copy of the 2018 AUA is on file and available at the office of the Aviation Department for a review of its complete terms. Terms not defined in this Summary or in this Official Statement shall have meanings set forth in the 2018 AUA.
Under the 2018 AUA, each Signatory Airline agrees that its obligations to pay Landing Fees and aviation charges, whether incurred for operations at MIA or any other airport within the County’s Airport System (the “Airport System”), shall continue beyond any expiration of the agreements for so long as the Signatory Airline operates at MIA or such other airport in the Airport System and bonds are outstanding under the Trust Agreement or any successor trust indenture. Conversely, if the Signatory Airline discontinues its operations at a County airport, the Signatory Airline has no further obligation to the airport at which it operated other than for payment of incurred charges.
The Signatory Airline agrees to pay whatever Landing Fees and aviation charges are established by the County from time to time, and agrees that (1) the Landing Fee Rate may be based on a residual method of calculating Landing Fees set forth in Tab G of the 2018 AUA and discussed below, and (2) Terminal Building fees may be based on the cost-based equalized rate-setting methodology described in Tabs H1, H2, and H3 of the 2018 AUA. The County may modify such methodologies after consultation with the Signatory Airlines or the Miami Airport Affairs Committee (the “MAAC”), in order to comply with its requirements under the Trust Agreement or under federal law, or as a result of a modification approved by the Board of County Commissioners (the “Board”) resulting after such consultation.
Each Signatory Airline agrees that the Passenger Facility Charge revenue belongs to the Airport and not the airline. Each Signatory Airline further agrees that it will (1) comply with all rules and regulations of the Airport, (2) indemnify and reimburse the County for any failure to so comply, (3) comply with all applicable noise abatement regulations, (4) obtain appropriate airline operating certificates and liability insurance, (5) comply with all security requirements and directives, (6) not discriminate in violation of applicable law, and (7) control its employees in the use of the Airport. The Signatory Airline acknowledges the primacy of the Trust Agreement.
Each Signatory Airline agrees that the MAAC shall represent the interests of all airlines at MIA for voting on matters on which the 2018 AUA requires a decision and that any Majority-In-Interest (“MII”) decision by the MAAC required by the 2018 AUA shall be binding on the Signatory Airline. A Majority-In-Interest of the MAAC Airlines shall be defined as those Signatory Airlines (a) that are members in good standing of the MAAC, (b) having not less than 51% in number of the then existing MAAC members and (c) which collectively with their Affiliated Airlines represent more than 25% of the total landed weight for which landing fees were paid during the previous Fiscal Year by all MAAC Airlines and their Affiliated Airlines. An “Affiliated Airline” is any airline of a designated relationship to the Signatory Airline that is shown on the Signatory Airline’s Tab F of its AUA as being an airline for which the Signatory Airline has agreed to be financially responsible.
Capital Projects Not Subject to MII Review
Without submitting a Capital Project for review by a MII of the MAAC, the Aviation Department may incur costs to plan, program, design and construct any Capital Project that is considered an Exempt Project as

D-2
described by one or more of the following specific provisions: (1) Capital Projects that will be classified as Non-Port Authority Properties, provided they will cause no increase in Airline Costs Per Enplaned Passenger (as defined below), (2) Capital Projects whose individual estimated net costs (i.e., project costs less equity sources such as grants or PFC revenue) do not exceed $15 million (expressed in 2018 dollars), (3) Capital Projects that are financed by special facility revenue bonds not payable from Airport System funds, (4) Capital Projects that are financed by a tenant or third-party source and not subject to reimbursement from Airport System funds, (5) Capital Projects in connection with the reclassification to Port Authority Properties, (6) Capital Projects required under the Trust Agreement as certified by the Consulting Engineers, (7) Capital Projects required to comply with a rule, regulation, order or requirement of any federal, state or governmental agency, (8) Capital Projects necessary to settle lawful claims, satisfy judgments or comply with judicial orders against the County by reason of its ownership, operation, maintenance or use of the Port Authority Properties or parts thereof, (9) Capital Projects needed as a result of an emergency, (10) Capital Projects needed to repair or replace casualty damage, provided that costs are funded to the maximum extent possible from insurance proceeds and funds collected for such losses from subrogation efforts, (11) Capital Projects that will be paid for by one or more Airlines, (12) Capital Projects in the form of an improvement that an Airline desires and will pay for based on an agreement between the Airline and the Aviation Department, and (13) Capital Projects previously approved by the MIIs, but if the Net Project Costs are estimated to increase by more than 20%, another MII review is required. The term Net Project Costs means Total Project Costs of a Capital Project less equity funding sources such as grants or PFC revenues.
All non-Exempt Projects require a MII review, which shall consist of a disapproval review or moratorium based on whether the projected Airline Costs Per Enplaned Passenger (“CEP”) is above a stated level, as expressed in 2018 dollars. The CEP means the ratio created by dividing Airline Costs at the Airport for a Fiscal Year by Enplaned Passengers at the Airport for the same Fiscal Year. “Airline Costs” means that portion of Airport Revenues received by the County from Airlines in payment of (1) rents, fees and charges for use and occupancy of the Terminal Building, concourses and facilities related to the processing of air passengers and to the accommodation of passenger aircraft for loading and unloading of passengers and their bags and (2) landing fees and Aviation Activities fees at airports in the Airport System.
Moratorium Review
If the CEP is $35.00 (in 2018 dollars) or below, then a Disapproval Review is required and if the CEP exceeds $35.00 (in 2018 dollars) in 6 or more years of the 10-year projection period, the Aviation Department may not incur costs on Capital Projects, except under the following procedures:
(a) Each Capital Project that is not an Exempt Project shall be deemed to be approved by the MIIs unless responses from the MIIs disapprove the submitted Capital Project within 45 days.
(b) If the Capital Project is disapproved, the County may resubmit the Capital Project to the MAAC after 180 days and the resubmitted Capital Project is deemed approved unless responses from the MIIs disapprove the Capital Project within 45 days.
(c) If the Capital Project is disapproved again, the Capital Project may not go forward until the CEP falls below $35 (in 2018 dollars) and in that event, the Aviation Department may submit it to the Board for approval as the basis to move forward with the Capital Project once the Board approval is received.
Aviation User Credit Program
Each Signatory Airline is entitled to participate in the Aviation User Credit Program (“AUCP”). The Aviation Department is entitled to collect all fees for an Airline’s use of the Airport in cash each time an Airline uses the Airport. To avoid the administrative inconvenience to the Aviation Department and to the Airline of collecting such cash payments or their equivalent at each time of use, the 2018 AUA permits the Signatory Airline to participate in the AUCP under which the airline self-reports and self-pays the designated Aviation Fees by the 15th calendar day following the month in which the fees were incurred.

D-3
“Aviation Fees” refers to the fees and charges specifically established from time to time by the Board. Aviation Fees include Aviation User Fees and all other fees and charges established by the Board from time to time.
“Aviation User Fees” include landing fees, aircraft parking fees, concourse use fees (for both domestic and international flights), Preferential Gate fees, common use gate concourse fees, international facilities fees, inbound and outbound baggage fees, loading bridge fees, all other gate-related fees, terminal building fees for facilities, equipment, and services, and other uses of the landing areas, taxiways, and ramps.
An Airline is allowed up to 90 days to participate in the AUCP. If the Airline fails to both sign the 2018 AUA and participate in the AUCP within the 90-day period after initiating service to the Airport, the Airline must pay 110% of the fees, retroactive to the effective date of the 2018 AUA or the Airline’s first day of service. If the Airline then fails to sign and participate in the AUCP within a second 90-day period, the Airline must start paying 150% of the Aviation Activities fees, retroactive to the effective date of the 2018 AUA or the Airline’s first day of service (with credit for the 10% already paid), until the Airline signs the 2018 AUA and participates in the AUCP.
Landing Fees
The Aviation Department calculates the Landing Fee Rate to be effective as of October 1 of each year based upon the annual budget for the Port Authority Properties and estimates of Total Landed Weight. The Landing Fee Rate may be adjusted semi-annually effective April 1. If the County is required because of emergency conditions to adjust the Landing Fee Rate effective at a time other than October 1 or April 1, the Aviation Department may, after proper notification to the MIA air carriers and consultation with the MAAC, adjust the Landing Fee Rate 15 calendar days after such notification. Promptly upon the cessation of the emergency conditions requiring any such adjustment, the Aviation Department will notify the air carriers of any additional adjustment that can be made because of the cessation of such emergency conditions and the effective date upon which the adjustment will take effect.
For the use of the airfield at the Airport, each airline shall pay the County monthly Landing Fees determined by multiplying its Total Landed Weight during the month by the then-current Landing Fee Rate.
Landing Fees are calculated by determining the difference between anticipated Revenue Credits and the total Revenue Requirement for the forthcoming year. The Revenue Requirement for the period of the fee calculation is estimated on a cash basis by totaling the following amounts:
(i) Estimated Principal and Interest Requirements on Bonds issued under the Trust Agreement then outstanding and on Bonds to be issued during the period of the fee calculation;
(ii) A coverage margin calculated as 20% of the estimated Principal and Interest
Requirements;
(iii) Estimated Current Expenses;
(iv) Estimated change in the operating reserve for Current Expenses, which reserve is calculated as a percentage (not to exceed 20%) of estimated Current Expenses;
(v) Estimated deposit, if any, from Revenues to the Bond Reserve Account required to meet the reserve requirement;
(vi) Deposit to the Reserve Maintenance Fund in the amount recommended by the Consulting Engineers;
(vii) Estimated debt service payable from Revenues on commercial paper then outstanding and on commercial paper to be issued during the period of the fee calculation, including amounts necessary to make hedge or termination payments;

D-4
(viii) Estimated debt service and revenue covenant requirements payable from Revenues on other indebtedness (including, for example, subordinate debt, Passenger Facility Charge debt, or general obligation bonds) then outstanding and on other indebtedness to be issued during the period of the fee calculation;
(ix) Estimated deposits to funds and accounts payable from Revenues that may be required in connection with commercial paper or other indebtedness; and
(x) Costs of Aviation Development Facilities (“ADF”), if any, that may be payable from Revenues pursuant to a merger of the Port Authority Properties (“PAP”) and ADF, net of ADF revenues related to such costs. This merger of PAP and ADF occurred in May 2003.
The total Revenue Credits for the period of the Landing Fee calculation is estimated on a cash basis by totaling the following amounts:
(i) Revenues to be received during the period of the fee calculation from all sources, including the transfer from the Improvement Fund and Revenues from the Non-Signatory Differential, but exclusive of Revenues from (a) landing fees, (b) interest earnings on monies in the Reserve Maintenance Fund, and (c) interest earnings on monies in the Improvement Fund; and
(ii) Revenues to be received from landing fees for aircraft landings conducted prior to the effective date of the revised Landing Fee Rate (which, for example, includes Revenues received in October for landings conducted in September when computing the October 1 Landing Fee Rate).
The resulting differential between Revenue Requirement and Revenue Credits is then divided by estimated Total Landed Weight for the period to determine the Landing Fee Rate per one thousand (1,000) pounds of aircraft weight. (When computing the October 1 Landing Fee Rate, Total Landed Weight covers the 11-month period from October through August.)
Improvement Fund Transfer
In the 2018 AUA, the Signatory Airlines acknowledge that the County (1) may deduct from the monies remaining in the Improvement Fund at the end of each Fiscal Year the sum of $7.6 million to be deposited into the Retainage Sub-account up to a cumulative maximum balance of $22.8 million, to be used by the Aviation Department for any lawful airport purpose, (both of these dollar amounts are subject to an annual CPI percentage adjustment, up or down, as defined in the 2018 AUA) and (2) may deposit to the Performance Sub-account 50% of the revenue amounts that exceed the break-even costs of the Cargo and Commercial Aviation Support Facilities. No maximum cumulative amount applies to the amounts in this Performance Sub-account, and monies in this sub-account may be used for any lawful airport purpose.
Use of Gates
The 2018 AUA provides for the use of the gates at MIA on either a common use or preferential use basis. Under the prior AUA, all gates were assigned by the Aviation Department on a common use basis. Under the 2018 AUA, the Aviation Department continues to assign all gates—whether common use or preferential use—but an Airline qualifying for the use of a gate on a preferential basis has the right to the use of the gate for its scheduled and non-scheduled aircraft. The Airport currently has 138 operating gates consisting of contact gates (i.e., gates having loading bridges) and ground load gates (i.e., gates requiring the passengers to access the aircraft from the ground), and the Aviation Department identified 77 of these gates to be eligible for preferential use before the effective date of the 2018 AUA as required in the 2018 AUA. The remaining 61 gates are considered common use gates, but the Aviation Department has the right to convert these common use gates to preferential use based on criteria specified in the 2018 AUA. In addition, the Aviation Department may convert preferential use gates back to common use gates if an Airline no longer qualifies for or decides to release Preferential Use Gates under specific terms set out in the 2018 AUA.

D-5
An Airline desiring to use a Preferential Use Gate determines the number of gates it qualifies for by dividing by five either (a) on a “look back” basis, a six-month rolling average aggregate total number of daily departures operated in the past by the Airline and its TAB F Affiliated Airlines, or (b) on a “look-forward” basis, the average daily departures schedule in the published Official Airline Guide (OAG) to be operated for at least three months in the case of an entrant Airline or an existing Airline increasing its operations at the Airport. Based on the resulting whole number (fractional interests do not qualify for a Preferential Use Gate), the Airline may choose how many of its qualifying gates it will select, and then sign a Preferential Gate Use Agreement (PGUA) applicable to the chosen gate or gates. The PGUA (discussed below) extends for the duration of the remaining period of the 2018 AUA, and the Airline is contractually committed to pay the Preferential Use Gate fees for such entire period, unless it chooses to release a gate or gates within a 120-day period prior to May 1, 2022 or May 1, 2027.
The Aviation Department has the right to change the number and locations of preferential gates, to assign other Airlines to a Preferential Use Gate if the gate is not then being used, and recapture the gate if the Airline with the Preferential Gate assignment fails to 1) operate an average of five departures per day on a gate and operate an average of two international arrivals per day on any gate capable of being used for international arrival operations or 2) operate an average of five departures per day for a domestic only gate under the terms set out in the 2018 AUA.
An Airline that has been assigned a Preferential Gate will pay a fixed cost per square foot for the Preferential Gate’s related holdroom space plus an allocation of post-security circulation concourse space. Common use gate users will continue to be charged in a manner similar to the methodology used in the prior AUA, under which the costs related to the common use gate holdroom space and allocated post-security circulation concourse space will be recovered based on an airline’s arriving and departing aircraft seats except for international arriving seats that are not pre-cleared.
Following the Effective Date of the 2018 AUA, the Aviation Department has started to assign Airlines to Preferential Gates for which they qualify. However, theses Airlines will be required to pay the common use gate charges for these gates until October 1, 2020, at which time the differing charges for the common use and Preferential Use gates will go into effect.
The 2018 AUA made two other changes to the charging methodology for Terminal Building use. In the past, some of the terminal space costs associated with international arriving passengers (e.g., the federal inspection services area) were allocated to the Common Use Concourse Fee and paid for by all Airlines, domestic and international alike. Under the 2018 AUA, all such space costs will be allocated to the International Facilities Fee and charged to international arriving airlines alone, excluding Airlines with pre-cleared international arrivals. The second change was to add the space costs related to security screening to the Security Screening Fee; previously these costs had been recovered under the base Concourse Use Fee.
II. PREFERENTIAL GATE USE AGREEMENT SUMMARY
The Preferential Gate Use Agreement (“PGUA”) must be signed by any airline that qualifies for and chooses to use a Preferential Gate(s) identified by the Aviation Department as being eligible for such use. A summary of the PGUA provisions includes the following:
(1) Exhibit A of the PGUA contains a list of the preferential gates awarded by the Aviation Department to the qualifying Airline and the effective date on which such use may begin;
(2) The Airline acknowledges in the PGUA that its use of any gate at the Airport is not on an
exclusive use or leased use basis;
(3) The PGUA confirms that an Airline’s use of any Exhibit A gates shall continue for the duration of
the 2018 AUA, which will be no later than April 30, 2033 when the 2018 AUA expires;
(4) If the PGUA expires or is terminated as to any gate, the Aviation Department may add such gate to the pool of common use gates or may award the gate to another Airline that qualifies to use it as a Preferential Use gate;

D-6
(5) The Airline is obligated to continue paying common use gate charges for any Preferential Use Gate until October 1, 2020, at which time the Airline must commence paying the Preferential Gate charges as set forth in Tab H(3) of the 2018 AUA;
(6) The Airline acknowledges the Aviation Department’s right to (i) change the numbers and locations of the Preferential Gates, (ii) recapture the Preferential Gates if they are not being sufficiently used, and (iii) assign other Airlines to a Preferential Gate if the gate is then available for use by the other Airline;
(7) The Airline in turn agrees to cooperate with the Aviation Department in any such use of a Preferential Gate by another Airline and agrees to act at all times in good faith so that a Preferential Gate may be efficiently used;
(8) The PGUA confirms an Airline’s right to request the use of additional Preferential Gate(s) if it then qualifies for them, and confirms that the Aviation Department has no obligation to accept the return of a Preferential Gate earlier than the expiration of the contract time for such use, except for the two dates in 2022 and 2027 when Preferential Gates may be relinquished to the Aviation Department; and
(9) The PGUA confirms that an Airline’s right to use any gate on a preferential use basis is subject at all times to the acceptability of Preferential Gate use at the Airport by the FAA and the U.S. Department of Transportation (“USDOT”), and that the Aviation Department has the right to discontinue the use of any Preferential Gate and may modify the terms applicable to its use based on FAA or USDOT requirements.

APPENDIX E
PROPOSED FORM OF BOND COUNSEL OPINION

[THIS PAGE INTENTIONALLY LEFT BLANK]

E-1
FORM OF APPROVING OPINIONS OF BOND COUNSEL GREENBERG TRAURIG, P.A.
AND EDWARDS & FEANNY, P.A. MIAMI, FLORIDA
_________ __, 2019
Board of County Commissioners of Miami-Dade County, Florida Miami, Florida
Miami-Dade County, Florida Miami-Dade County, Florida $282,180,000 $212,745,000
Aviation Revenue Bonds Aviation Revenue Refunding Bonds Series 2019A (AMT) Series 2019B (Taxable)
Ladies and Gentlemen:
We have acted as Bond Counsel in connection with the issuance by Miami-Dade County, Florida (the “County”) of its $282,180,000 Aviation Revenue, Series 2019A (AMT) (the “Series 2019A Bonds”), and its $212,745,000 Aviation Revenue Refunding Bonds, Series 2019B (Taxable) (the “Series 2019B Bonds,” and, together with the Series 2019A Bonds, the “Series 2019 Bonds”) dated of even date herewith. The Series 2019 Bonds are being issued pursuant to the authority of the Constitution and laws of the State of Florida, including particularly Chapters 125 and 166, Florida Statutes, as amended, The Home Rule Amendment and Charter of Miami-Dade County, Florida, as amended, the Code of Miami-Dade County, as amended (collectively, the “Act”), the Amended and Restated Trust Agreement dated as of December 15, 2002 (the “Trust Agreement”) by and among the County, The Bank of New York Mellon (successor in interest to JP Morgan Chase Bank), New York, New York, as trustee, and U.S. Bank National Association (successor in interest to Wachovia Bank, National Association), as co-trustee, Ordinance No. 95-38 duly enacted by the Board of County Commissioners of Miami-Dade County, Florida (the “Board”) on February 21, 1995 (the “1995 Ordinance”), Ordinance No. 96-31 enacted by the Board on February 6, 1996 (the “1996 Ordinance”), Ordinance No. 97-207 enacted by the Board on November 4, 1997 (the “1997 Ordinance”) and Ordinance No. 08-121 (the “2008 Ordinance” and collectively with the 1995 Ordinance, the 1996 Ordinance and the 1997 Ordinance, the “Ordinance”) and Resolution No. R-311-19 adopted by the Board on March 19, 2019 (the “Series 2019 Resolution,” and collectively with the Ordinance, the “Bond Ordinance”).
In rendering this opinion we have examined the transcript of the proceedings (the “Transcript”) relating to the issuance of the Series 2019 Bonds, which include the Trust Agreement, the Bond Ordinance and certain other documentation, each of the executed Series 2019 Bonds or facsimiles thereof and such other documents as we have deemed necessary to render this opinion.
Based on this examination, we are of the opinion that, under existing law:
1. The County is a validly existing political subdivision of the State of Florida under the Constitution and laws of the State of Florida, with the power to issue the Series 2019 Bonds.
2. All conditions precedent in the Trust Agreement to the delivery of the Series 2019 Bonds have been duly fulfilled and the Bond Ordinance has been duly enacted or adopted by the Board and constitutes a valid and legally binding obligation of the County enforceable in accordance with its terms.
3. The issuance and sale of the Series 2019 Bonds have been duly authorized by the Board and the Series 2019 Bonds constitute valid and legally binding limited obligations of the County, payable solely from the

E-2
Net Revenues (as defined in the Trust Agreement) in the manner and to the extent specified in the Trust Agreement and the Bond Ordinance.
4. Except as expressly provided for in the Bond Ordinance, the issuance of the Series 2019 Bonds shall not directly or indirectly or contingently obligate the State of Florida, the County or any agency or political subdivision thereof to levy or to pledge any form of taxation whatsoever nor shall the Series 2019 Bonds constitute a charge, lien or encumbrance, legal or equitable, upon any property of the County other than the Net Revenues (in the manner and to the extent specified in the Trust Agreement and the Bond Ordinance), and the owners of the Series 2019 Bonds shall have no recourse to the taxing power of the County, the State of Florida or any agency or political subdivision thereof.
5. Under existing statutes, regulations, rulings and court decisions, subject to the assumption stated below: (i) interest on the Series 2019A Bonds is excludable from gross income for federal income tax purposes, except for interest on any Series 2019A Bonds for any period during which such Series 2019A Bonds are held by a person who is a “substantial user” of the facilities refinanced by the Series 2019A Bonds, or a “related person,” as those terms are used in Section 147(a) of the Internal Revenue Code of 1986, as amended (the “Code”); (ii) interest on the Series 2019A Bonds is an item of tax preference for purposes of the federal alternative minimum tax imposed on individuals; and (iii) the Series 2019 Bonds and the income thereon will not be subject to taxation under the laws of the State of Florida, except as to estate taxes and taxes under Chapter 220, Florida Statutes, on interest, income or profits on debt obligations owned by corporations as defined in said Chapter 220. Federal legislation enacted in 2017 eliminates alternative minimum tax for corporations for taxable years beginning after December 31, 2017. INTEREST ON THE SERIES 2019B BONDS IS NOT EXCLUDABLE FROM GROSS INCOME FOR FEDERAL INCOME TAX PURPOSES.
In rendering the opinions contained in paragraph no. 5 above, we have assumed continuing compliance by the County with the requirements of the Code that must be met after the issuance of the Series 2019 Bonds in order that interest on the Series 2019A Bonds be, and continue to be, excludable from gross income for federal income tax purposes. The County has covenanted in the Bond Ordinance to comply with the requirements of the Code in order to maintain the excludability of interest on the Series 2019A Bonds from gross income for federal income tax purposes. The failure by the County to meet certain of such requirements may cause interest on the Series 2019A Bonds to be included in gross income for federal income tax purposes retroactively to the date of issuance of the Series 2019 Bonds.
Except as stated in paragraph no. 5 above, we express no opinion as to any other tax consequences regarding the Series 2019 Bonds.
This opinion is qualified to the extent that the enforceability of the Series 2019 Bonds, the Bond Ordinance and the Trust Agreement, respectively, may be limited by general principles of equity which may permit the exercise of judicial discretion, and by bankruptcy, insolvency, moratorium, reorganization or similar laws relating to the enforcement of creditors’ rights generally, now or hereafter in effect.
In rendering the foregoing opinions we have assumed the accuracy and truthfulness of all public records and of all certifications, documents and other proceedings examined by us that have been executed or certified by public officials acting within the scope of their official capacities and have not verified the accuracy or truthfulness thereof. We have also assumed the genuineness of the signatures appearing upon such public records, certifications, documents and proceedings.
We have not been engaged nor have we undertaken to review or verify and therefore express no opinion as to the accuracy, adequacy, fairness or completeness of any official statement or other offering materials relating to the Series 2019 Bonds, except as may be otherwise set forth in our supplemental opinion delivered to the initial purchaser of the Series 2019 Bonds. In addition, other than as expressly set forth herein, we have not passed upon and therefore express no opinion as to the compliance by the County or any other party involved in this financing, or the necessity of such parties complying, with any federal or state registration requirements or security statutes, regulations or rulings with respect to the offer and sale of the Series 2019 Bonds.

E-3
We express no opinion with respect to any other document or agreement entered into by the County or by any other person in connection with the Series 2019 Bonds, other than as expressed herein.
Our opinions expressed herein are predicated upon present laws, facts and circumstances, and we assume no affirmative obligation to update the opinions expressed herein if such laws, facts or circumstances change after the date hereof.
Respectfully submitted,

[THIS PAGE INTENTIONALLY LEFT BLANK]

APPENDIX F
PROPOSED FORM OF DISCLOSURE COUNSEL OPINION

[THIS PAGE INTENTIONALLY LEFT BLANK]

F-1
On the date of issuance of the Series 2019 Bonds in definitive form, Hunton Andrews Kurth LLP, and DiFalco & Fernandez LLLP, Disclosure Counsel, propose to deliver their opinions in substantially the
following form, which is subject to change:
_________, 2019
Board of County Commissioners of Miami-Dade County, Florida Miami, Florida
MIAMI-DADE COUNTY, FLORIDA
$282,180,000 Aviation Revenue Bonds
Series 2019A (AMT)
$212,745,000
Aviation Revenue Refunding Bonds Series 2019B (Taxable)
Ladies and Gentlemen:
We have served as Disclosure Counsel to Miami-Dade County, Florida (the “County”), in connection with the issuance by the County of its $282,180,000 Aviation Revenue Bonds, Series 2019A (AMT) (the “Series 2019A Bonds”), and its $212,745,000 Aviation Revenue Refunding Bonds, Series 2019B (Taxable) (the “Series 2019B Bonds” and, together with the Series 2019A Bonds, the “Series 2019 Bonds”).
In this capacity, we have examined a copy of the Official Statement of the County, dated May 10, 2019 (the “Official Statement”), relating to the Series 2019 Bonds. We have reviewed the Official Statement generally and have discussed certain information and statements therein with representatives of the County from the Finance Department, the Aviation Department and the County Attorney’s Office; Hilltop Securities Inc., Financial Advisor to the Aviation Department; LeighFisher, Inc., Traffic Engineer to the Aviation Department; and Greenberg Traurig, P.A. and Edwards & Feanny, P.A., Bond Counsel.
In connection with the issuance of the Series 2019 Bonds, and pursuant to Resolution No. R-311-19, adopted by the Board of County Commissioners of the County, on March 19, 2019, the County covenanted to comply with the continuing disclosure requirements of the Securities and Exchange Commission Rule 15c2-12.
We also have examined certain proceedings of the County, and originals or copies identified to our satisfaction of such agreements, instruments, opinions, certificates and other documents as we have deemed necessary for purposes of the advice contained in this letter. We have assumed the genuineness of signatures on documents submitted to us as originals, the authenticity thereof and the conformity with the originals of any documents submitted to us as copies or specimens. We also have assumed the accuracy of the opinion of Bond Counsel.
On the basis of the foregoing and subject to the limitations stated herein, and in accordance with customary legal opinion practice, we advise you as follows:
1. We have not verified and are not passing upon, and we do not assume any responsibility for, the accuracy or completeness of the statements contained in the Official Statement. Nothing, however, has come to our attention during the course of our review and discussion of the Official Statement that would cause us to believe that the Official Statement, on the date thereof or on this date, contains any untrue statement of a material fact or omits to state any material fact necessary to make the statements therein, in light of the circumstances under which they were made, not misleading.

F-2
2. Our advice in paragraph 1 does not apply to the financial statements and financial or statistical data contained or incorporated by reference in the Official Statement, including the Appendices.
3. In our opinion, with respect to the issuance of the Series 2019 Bonds, the continuing disclosure undertaking of the County complies as to form in all material respects with the requirements for such an agreement in paragraph (b)(5) of Securities and Exchange Commission Rule 15c2-12.
Very truly yours,

APPENDIX G
CONTINUING DISCLOSURE UNDERTAKING

[THIS PAGE INTENTIONALLY LEFT BLANK]

G-1
CONTINUING DISCLOSURE UNDERTAKING (Section 10 of the Series 2019 Resolution)
A. The County agrees, in accordance with the provisions of, and to the degree necessary to comply with, the continuing disclosure requirements of the Rule, to provide or cause to be provided for the benefit of the beneficial owners of the Series 2019 Bonds (the “Beneficial Owners”) to the Municipal Securities Rulemaking Board (“MSRB”) in an electronic format prescribed by the MSRB and such other municipal securities information repository as may be required by law or applicable legislation, from time to time (each such information repository, a “MSIR”), the following annual financial information (the “Annual Information”), with the first such installment of Annual Information to be provided with respect to the Fiscal Year ending September 30, 2019:
(1) Revenues and Net Revenues of the Aviation Department and operating information for the prior Fiscal Year of the type and in a form which is generally consistent with the presentation of such information in the Official Statement for the Series 2019 Bonds, and such additional operating information as may be determined by the Aviation Department; and
(2) The audited Aviation Department’s Comprehensive Annual Financial Report utilizing generally accepted accounting principles applicable to local governments.
The information in paragraphs (1) and (2) above shall be available on or before June 1 of each year for the preceding Fiscal Year and shall be made available, in addition to the Trustee and each MSIR, to each Beneficial Owner of the Series 2019 Bonds who requests such information in writing. The audited Aviation Department’s Comprehensive Annual Financial Report referred to in paragraph (2) above is expected to be available separately from the information in paragraph (1) above and shall be provided by the County as soon as practical after acceptance of the audited financial statements from the auditors by the Aviation Department. If not available within eight (8) months from the end of the Fiscal Year, unaudited information will be provided in accordance with the time frame set forth above and audited financial statements will be provided as soon after such time as they become available.
B. The County agrees to provide or cause to be provided, in a timely manner (not in excess of ten (10) business days) after the occurrence of the event, to each MSIR in the appropriate format required by law or applicable regulation, notice of occurrence of any of the following events with respect to the Series 2019 Bonds:
(1) principal and interest payment delinquencies;
(2) non-payment related defaults, if material;
(3) unscheduled draws on debt service reserves reflecting financial difficulties;
(4) unscheduled draws on credit enhancements reflecting financial difficulties;
(5) substitution of credit providers, or their failure to perform;
(6) Adverse tax opinions, the issuance by the Internal Revenue Service of proposed or final determinations of taxability, Notices of Proposed Issue (IRS Form 5701-TEB) or other material notices or determinations with respect to the tax status of the Tax-Exempt Bonds, or other material events affecting the tax status of the Tax-Exempt Bonds;
(7) modifications to rights of Registered Owners of the Series 2019 Bonds, if material;
(8) Series 2019 Bond calls, if material, and tender offers;
(9) defeasances;

G-2
(10) release, substitution or sale of any property securing repayment of the Series 2019 Bonds, if material;
(11) rating changes;
(12) bankruptcy, insolvency, receivership or similar event of the County (which is considered to occur when any of the following occur: the appointment of a receiver, fiscal agent or similar officer for the County in a proceeding under the U.S. Bankruptcy Code or in any other proceeding under state or federal law in which a court or governmental authority has assumed jurisdiction over substantially all of the assets or business of the County, or if such jurisdiction has been assumed by leaving the existing governing body and officials or officers in possession but subject to the supervision and orders of a court or governmental authority, or the entry of an order confirming a plan of reorganization, arrangement or liquidation by a court or governmental authority having supervision or jurisdiction over substantially all of the assets or business of the County);
(13) the consummation of a merger, consolidation or acquisition involving the County or the sale of all or substantially all of the assets of the County, other than in the ordinary course of business, the entry into a definitive agreement to undertake such an action or the termination of a definitive agreement relating to any such actions, other than pursuant to its terms, if material;
(14) appointment of a successor or additional trustee, or the change of name of a trustee, if material;
(15) incurrence of a Financial Obligation of the Obligated Person, if material, or agreement to covenants, events of default, remedies, priority rights, or other similar terms of a Financial Obligation of the Obligated Person, any of which affect security holders, if material; and
(16) default, event of acceleration, termination event, modification of terms, or other similar events under the terms of a Financial Obligation of the Obligated Person, any of which reflect financial difficulties.
For purposes of clauses subsections (15) and (16) above, “financial obligation” shall have the meaning set forth in the Rule.
C. The County agrees to provide or cause to be provided, in a timely manner, to each MSIR, in the appropriate format required by law or applicable regulation, notice of its failure to provide the Annual Information with respect to itself on or prior to June 1 following the end of the preceding Fiscal Year.
D. The obligations of the County under this Section 10 shall remain in effect only so long as the Series 2019 Bonds are Outstanding. The County reserves the right to terminate its obligations to provide the Annual Information and notices of material events, as set forth above, if and when the County no longer remains an Obligated Person with respect to the Series 2019 Bonds.
E. The County agrees that its undertaking pursuant to the Rule set forth in this Section 10 is intended to be for the benefit of the Beneficial Owners of the Series 2019 Bonds and shall be enforceable by the Trustee on behalf of such Beneficial Owners in the manner provided in the Trust Agreement if the County fails to cure a breach within a reasonable time after receipt of written notice from a Beneficial Owner that a breach exists; provided, however, that the Trustee’s right to enforce the provisions of this undertaking shall be on behalf of all Beneficial Owners and shall be limited to a right to obtain specific performance of the County’s obligations under this Section 10 in a federal or state court located within the County and any failure by the County to comply with the provisions of this undertaking shall not be a default with respect to the Series 2019 Bonds.
F. Notwithstanding the foregoing, each MSIR to which information shall be provided shall include each MSIR approved by the Securities and Exchange Commission prior to the issuance of the Series 2019 Bonds. In the event that the Securities and Exchange Commission approves any additional MSIRs after the date of issuance

G-3
of the Series 2019 Bonds, the County shall, if the County is notified of such additional MSIRs, provide such information to the additional MSIRs. Failure to provide information to any new MSIR whose status as a MSIR is unknown to the County shall not constitute breach of this covenant.
G. The requirements of subsection A above do not necessitate the preparation of any separate annual report addressing only the Series 2019 Bonds. The requirements of subsection A above may be met by the filing of an annual information statement or the audited Aviation Department’s Comprehensive Annual Financial Report or the County’s Comprehensive Annual Financial Report, provided such report includes all of the required Annual Information and is available by June 1 of each year for the preceding Fiscal Year. Additionally, the County may incorporate any information in any prior filing with each MSIR or included in any official statement of the County, provided such official statement is filed with the MSRB.
H. The County reserves the right to modify from time to time the specific types of information provided or the format of the presentation of such information, to the extent necessary or appropriate in the judgment of the County; provided that the County agrees that any such modification shall be done in a manner consistent with the Rule.
I. Except to cure any ambiguity, inconsistency or formal defect or omission in the provisions of this Section 10, the County agreements as to continuing disclosure (the “Covenants”) may only be amended if:
(1) the amendment is made in connection with a change in circumstances that arises from a change in legal requirements, a change in law or a change in the identity, nature or status of the Aviation Department or type of business conducted; the Covenants, as amended, would have complied with the requirements of the Rule at the time of award of the Series 2019 Bonds, after taking into account any amendments or change in circumstances; and the amendment does not materially impair the interests of the Beneficial Owners, as determined by Disclosure Counsel or other independent counsel knowledgeable in the area of federal securities laws and regulations; or
(2) all or any part of the Rule, as interpreted by the staff of the Securities and Exchange Commission at the date of the adoption of this Series 2019 Resolution, ceases to be in effect for any reason, and the County elects that the Covenants shall be deemed amended accordingly.
Any assertion of beneficial ownership must be filed with the County along with full documentary support as part of the written request described above.
J. The Board further authorizes and directs the County Mayor to cause all other agreements to be made or action to be taken as required in connection with meeting the County’s obligations as to the Covenants. The County Mayor shall further be authorized to make such additions, deletions and modifications to the Covenants prior to the issuance of the Series 2019 Bonds as he shall deem necessary or desirable in consultation with the County Attorney, Bond Counsel and Disclosure Counsel.
K. Any change in Obligated Persons shall be reported by the County in connection with its Annual Information. If any person, other than the County, becomes an Obligated Person relating to the Series 2019 Bonds, the County shall use its reasonable best efforts to require such Obligated Person to comply with all provisions of the Rule applicable to such Obligated Person; provided, however, that the County takes, and shall take, no responsibility for the accuracy or completeness of any financial information or operating data or other materials submitted by any future Obligated Person.

[THIS PAGE INTENTIONALLY LEFT BLANK]

APPENDIX H
BOOK-ENTRY ONLY SYSTEM

[THIS PAGE INTENTIONALLY LEFT BLANK]

H-1
BOOK-ENTRY ONLY SYSTEM
The following description of the procedures and record keeping with respect to beneficial ownership interests in the Series 2019 Bonds, payment of interest and principal on the Series 2019 Bonds to Participants or Beneficial Owners of the Series 2019 Bonds, confirmation and transfer of beneficial ownership interest in the Series 2019 Bonds and other related transactions by and between DTC, the Participants and the Beneficial Owners of the Series 2019 Bonds is based solely on information furnished by DTC on its website. Accordingly, the County can make no representations concerning these matters or take any responsibility for the accuracy or completeness of such information.
DTC will act as securities depository for the Series 2019 Bonds. The Series 2019 Bonds will be issued as fully-registered bonds registered in the name of Cede & Co. (DTC’s partnership nominee) or such other name as may be requested by an authorized representative of DTC. One fully-registered bond certificate will be issued for each issue of the Series 2019 Bonds, each in the aggregate principal amount of such issue, and will be deposited with DTC.
DTC, the world’s largest securities depository, is a limited-purpose trust company organized under the New York Banking Law, a “banking organization” within the meaning of the New York Banking Law, a member of the Federal Reserve System, a “clearing corporation” within the meaning of the New York Uniform Commercial Code, and a “clearing agency” registered pursuant to the provisions of Section 17A of the Securities Exchange Act of 1934. DTC holds and provides asset servicing for over 3.5 million issues of U.S. and non-U.S. equity issues, corporate and municipal debt issues, and money market instruments (from over 100 countries) that DTC’s participants (the “Direct Participants”) deposit with DTC. DTC also facilitates the post-trade settlement among Direct Participants of sales and other securities transactions in deposited securities, through electronic computerized book-entry transfers and pledges between Direct Participants’ accounts. This eliminates the need for physical movement of securities certificates. Direct Participants include both U.S. and non-U.S. securities brokers and dealers, banks, trust companies, clearing corporations, and certain other organizations. DTC is a wholly-owned subsidiary of The Depository Trust & Clearing Corporation (“DTCC”). DTCC is the holding company for DTC, National Securities Clearing Corporation and Fixed Income Clearing Corporation, all of which are registered clearing agencies. DTCC is owned by the users of its regulated subsidiaries. Access to the DTC system is also available to others such as both U.S. and non-U.S. securities brokers and dealers, banks, trust companies, and clearing corporations that clear through or maintain a custodial relationship with a Direct Participant, either directly or indirectly (the “Indirect Participants”). DTC has a Standard & Poor’s rating of AA+. The DTC Rules applicable to its Participants are on file with the Securities and Exchange Commission. More information about DTC can be found at www.dtcc.com.
Purchases of the Series 2019 Bonds under the DTC system must be made by or through Direct Participants, which will receive a credit for such Series 2019 Bonds on DTC’s records. The ownership interest of each actual purchaser of each Series 2019 Bond (“Beneficial Owner”) is in turn to be recorded on the Direct and Indirect Participants’ records. Beneficial Owners will not receive written confirmation from DTC of their purchase. Beneficial Owners are, however, expected to receive written confirmations providing details of the transaction, as well as periodic statements of their holdings, from the Direct or Indirect Participant through which the Beneficial Owner entered into the transaction. Transfers of ownership interests in the Series 2019 Bonds are to be accomplished by entries made on the books of Direct and Indirect Participants acting on behalf of the Beneficial Owners. Beneficial Owners will not receive bond certificates representing their ownership interests in the Series 2019 Bonds, except in the event that use of the book-entry system for the Series 2019 Bonds is discontinued.
To facilitate subsequent transfers, all Series 2019 Bonds deposited by Direct Participants with DTC are registered in the name of DTC’s partnership nominee, Cede & Co., or such other name as may be requested by an authorized representative of DTC. The deposit of the Series 2019 Bonds with DTC and their registration in the name of Cede & Co. or such other DTC nominee do not effect any change in beneficial ownership. DTC has no knowledge of the actual Beneficial Owners of the Series 2019 Bonds; DTC’s records reflect only the identity of the Direct Participants to whose accounts such Series 2019 Bonds are credited, which may or may not be the Beneficial Owners. The Direct and Indirect Participants will remain responsible for keeping an account of their holdings on behalf of their customers.

H-2
Conveyance of notices and other communications by DTC to Direct Participants, by Direct Participants to Indirect Participants, and by Direct Participants and Indirect Participants to Beneficial Owners will be governed by arrangements made among them, subject to any statutory or regulatory requirements as may be in effect from time to time. Beneficial Owners of Series 2019 Bonds may wish to take certain steps to augment the transmission to them of notices of significant events with respect to the Series 2019 Bonds, such as redemptions, tenders, defaults, and proposed amendments to the Trust Agreement. For example, Beneficial Owners of the Series 2019 Bonds may wish to ascertain that the nominee holding the Series 2019 Bonds for their benefit has agreed to obtain and transmit notices to Beneficial Owners. In the alternative, Beneficial Owners may wish to provide their names and addresses to the Registrar and Paying Agent and request that copies of notices be provided directly to them.
Redemption notices shall be sent by the Registrar and Paying Agent to DTC. If less than all of the Series 2019 Bonds are being redeemed, DTC’s practice is to determine by lot the amount of the interest of each Direct Participant in such Series 2019 Bonds to be redeemed.
Neither DTC nor Cede & Co. (nor any other DTC nominee) will consent or vote with respect to the Series 2019 Bonds unless authorized by a Direct Participant in accordance with DTC’s MMI Procedures. Under its usual procedures, DTC mails an Omnibus Proxy to the County as soon as possible after the record date. The Omnibus Proxy assigns Cede & Co.’s consenting or voting rights to those Direct Participants to whose accounts the Series 2019 Bonds are credited on the record date (identified in a listing attached to the Omnibus Proxy).
Redemption proceeds, distributions, and dividend payments on the Series 2019 Bonds will be made to Cede & Co., or to such other nominee as may be requested by an authorized representative of DTC. DTC’s practice is to credit Direct Participants’ accounts upon DTC’s receipt of funds and corresponding detail information from the County or the Registrar and Paying Agent on the payable date in accordance with their respective holdings shown on DTC’s records. Payments by Participants to Beneficial Owners will be governed by standing instructions and customary practices, as is the case with securities held for the accounts of customers in bearer form or registered in “street name,” and will be the responsibility of such Participant and not of DTC, the Registrar and Paying Agent, or the County, subject to any statutory or regulatory requirements as may be in effect from time to time. Payment of redemption proceeds, distributions and dividend payments to Cede & Co. (or such other nominee as may be requested by an authorized representative of DTC) is the responsibility of the County and/or the Registrar and Paying Agent, for the Series 2019 Bonds. Disbursement of such payments to Direct Participants will be the responsibility of DTC, and disbursement of such payments to the Beneficial Owners will be the responsibility of the Direct and Indirect Participants.
DTC may discontinue providing its services as securities depository with respect to the Series 2019 Bonds at any time by giving reasonable notice to the Issuer or its agent. Under such circumstances, in the event that a successor securities depository is not obtained, Series 2019 Bond certificates are required to be printed and delivered.
The Issuer may decide to discontinue use of the system of book-entry-only transfers through DTC (or a successor securities depository). In that event, Series 2019 Bond certificates will be printed and delivered to DTC.
The information in this section concerning DTC and DTC’s book-entry system has been obtained from sources that the Issuer believes to be reliable, but the Issuer takes no responsibility for the accuracy thereof.
Registration, Transfer and Exchange
In the event of discontinuance of the book-entry only system, the Series 2019 Bonds will be subject to transfer and exchange as described below. The County shall cause the Registrar and Paying Agent to be kept at the designated corporate trust office of the Registrar and Paying Agent. Upon surrender for transfer of any Series 2019 Bonds at the designated corporate trust office of the Registrar and Paying Agent, duly endorsed by, or accompanied by a written instrument of transfer in form satisfactory to the Registrar and Paying Agent and duly executed by, the registered owner or the attorney of such owner duly authorized in writing with signature guaranteed by a member firm of STAMP, SEMP or MSP signature guaranty medallion program, the County shall execute and the Registrar and Paying Agent shall authenticate, date and deliver in the name of the transferees a new Series 2019 Bond or Series 2019 Bonds of the same series and maturity, of Authorized Denominations, for the same aggregate principal

H-3
amount and of like tenor. Any Series 2019 Bond may be exchanged at the office of the Registrar and Paying Agent for the same aggregate principal amount of such Series 2019 Bonds and of like tenor. The execution by the County of any Series 2019 Bonds shall constitute full and due authorization of such Series 2019 Bonds and the Registrar and Paying Agent shall thereby be authorized to authenticate, deliver and date such Series 2019 Bonds.
The County and the Registrar and Paying Agent shall deem and treat the registered owner of any Series 2019 Bond as the absolute owner of such Series 2019 Bond for the purpose of receiving payment of or on account of principal of such Series 2019 Bond and premium, if any, thereon and interest due thereon and for all other purposes.

[THIS PAGE INTENTIONALLY LEFT BLANK]


MIA
MI-D
AD
E C
OU
NT
Y, F
LO
RID
A • A
vIA
TIO
N RE
vE
NU
E BO
ND
s, sE
RIE
s 2019A (A
MT
) AN
D Av
IAT
ION R
Ev
EN
UE R
EF
UN
DIN
g BO
ND
s, sE
RIE
s 2019B (T
Ax
AB
LE)