2019 YEAR-END - KLNB
16
2019 YEAR-END OFFICE | INDUSTRIAL REPORT REGION Capital Central • •
Transcript of 2019 YEAR-END - KLNB

2019 YEAR-ENDOFFICE | INDUSTRIAL REPORT
REGIONCapitalCentral
•
•

2
115 EMPLOYEES87 BROKERS
RETAIL
OFFICE
INDUSTRIAL
LAND
DATA CENTER
GOVERNMENT SERVICES
AN OFFICE IN EVERYMAJOR MARKET
PARTNER OWNED, COLLABORATIVE APPROACH
BY THE NUMBERS | 2019
$1.7 BTRANSACTION VOLUME
1,000 10.4 MILLION
TRANSACTIONS
SF LEASED & SOLD
8 MILLIONSF UNDER MANAGEMENT
OVER
Arris Realty Capital is a joint venture between KLNB and ColumbiaNational Real Estate Finance, LLC (CNREF) whose sole purpose is to provide commercial real estate financing options to KLNB clients.
KLNB Management, a subsidiary of KLNB, LLC, is a full-service provider of commercial real estate property and asset management services.
Financial & Investment Services
• Investment Acquisitions & Sales
• Mortgage Brokerage
• Structured Lease Finance
• 1031 Exchange Services
Management Services
• Property & Asset Management
On-Line Services
• Transaction Management
• Surplus Property Hosting/Marketing
• Market Research & News
• Demographic/Mapping Services
• LoopNet
• CoStar Property
®
®
Services
Baltimore | Columbia | Washington, D.C. | Northern Virginia | klnb.com
Brokerage Services
• Tenant/Landlord Representation
• Buyer/Seller Representation
• Sales/Leasing/Subleasing
• Portfolio Marketing
• Market Reports & Opinions of Value
• Site Selection Analysis
• Market Research/Mapping/Demos
• Government Advisory Services
Lease Consulting Services
• Lease Auditing/Compliance
• Lease Abstracting
• Lease Databases & Administration
• Lease Consulting

Trend #1: WeWork Affect. WeWork mirrors our first trend from our 2018 Year End Report because it is the most newsworthy topic in the office market, both nationally and regionally. Starting 2019 with a $47B market valuation, this year has been challenging for WeWork, particularly since Fall. As the behemoth in the coworking industry, WeWork continued to burn through cash and September’s Initial Public Offering had to be cancelled. After firing its founder and CEO for misspending (including his $60M private jet) and mismanagement charges, WeWork’s lead investor Softbank acquired the company with an infusion of $5B for an 80% stake. As of this writing, 2,400 employees lost their jobs and those numbers could increase significantly in 2020.
In order for WeWork to succeed, Softbank is looking to replace its CEO (rumored to be turn-around specialist John Legere of T-Mobile) and initiate the following three step process: 1) stop building new office space (there is a 3 to 4 year supply), 2) cut costs elsewhere, and 3) cut off side businesses (ones not related to subleasing office space). We are already seeing this locally; WeWork is finishing its construction of space at Harbor Point, but other leases under negotiation were ceased.
The future of coworking space is somewhat uncertain. However, market statistics indicate coworking space only represents 1.5% of the total supply of office space in the United States. That in itself, does not indicate a factor that could severely adversely affect the national office real estate market. Coworking space tends to be prevalent in major urban office markets that are densely populated, such as WeWork’s heavily leased markets like New York, Washington and Boston. Although
3
coworking has grown about 26% annually in recent years, 2020 projections are for a 10% to 15% growth.
In a recent New York real estate seminar made up of panelists of WeWork competitors, one executive stated that coworking is here to stay; it’s just unfortunate that WeWork gave the industry a black eye. NAI KLNB’s position is there will be a place for coworking, but the days of landlords salivating for fifteen year leases in exchange for providing a minimum full year of free rent and shoveling $120 to $150 per square foot toward tenant improvements to unproven tenants may be gone.
Trend #2: Construction Material Costs Are Expected to Rise. Despite trade tensions between the U.S. and nearly all of its major trade partners, the cost of many materials remained relatively stable in 2019 (though subcontractors have been raising their bids in anticipation of materials prices rising). Even the cost of labor has been relatively stable, despite an extreme shortage of construction workers. However, the cost of construction materials may rise again in 2020. “I think the lull in materials cost increases is close to ending,” says Ken Simonson, chief economist for the Associated General Contractors of America (ACG). In turn, this increase will contribute to higher building prices, labor costs, and tenant improvement costs.
However, in the Washington/Baltimore MSA, there has been no lull or we missed it. We have been concerned and sometimes shocked at the steady increase in the costs of tenant improvements. Some subcontractors are validating their bids for no longer than 24 hours due to demand and material/labor constraints.
Some general contractors have seen a 60% cost increase related to tariffs.
According to the Associated Builders and Contractors of Greater Baltimore, several causes for the rise in these materials, which are passed on to the landlord and tenant, are as follows:
• Tariff Increases – Many of the materials used by building contractors are imported to the US. When tariffs are imposed on materials, such as steel and aluminum, contractors are forced to increase bid prices onto the consumers.
• Rising Fuel Prices - Materials often have to get transported across the country to reach their destination. Higher fuel costs to ship materials cause contractors to pay more for their materials.
• Shortage of Skilled Craftsmen – A shortage of labor means less people available to complete projects. In turn, companies need to offer a good wage to their workers to stay competitive in the marketplace. A rise in salaries and wages also trickles down to people who buy the materials.
• Increased Costs for Chinese Imports – A federal ruling imposed a 10% tariff on billions of dollars of Chinese goods, including construction materials. Again, these increases are being passed onto the consumer.
• Rising Lumber Costs - Demand for lumber and gypsum is likely to increase over the next six months as developers build more single-family homes. With interest rates remaining low, people will continue to have new home construction.
Trends In The Changing World of Commercial Real Estate
Baltimore | Columbia | Washington, D.C. | Northern Virginia | klnb.com

4
Trend #3: High Tenant Improvement Costs: Expectation vs Reality. The age-old question from tenants is “how much will that cost and will the landlord cover it?” As recently as three years ago, the rule of thumb was to go with your gut on cost with the caveat that improvements would have to be priced. In today’s market, a seasoned tenant representation broker goes with their gut, adds 20%, warns that improvements must be priced, and that the landlord may not cover any upgraded finishes. While actual statistics may not support that ballpark 20% number, managing expectations has become more important than ever when it comes to tenant fit-outs.
Rapidly growing construction costs due to pricey labor and materials have had a major impact on the office leasing market. When looking at commercial construction costs on a macro level, the consensus average increase is about 3% per year. While this number is in line with typical inflation, detailed and smaller tenant improvement jobs have seen more exaggerated price spikes. While it is encouraging that contractors are too busy to be buying work, the burden of value
engineering has fallen on the landlords and tenants prior to signing a lease.
Defining “building standard finishes” has become a very prevalent point of contention in the office leasing sector. Pricier “industrial chic” materials in more modern office spaces have become the norm as standard carpet and paint comes up short on the “cool factor” needed to recruit young talent. A common compromise in more suburban markets is for tenants to ask landlords to provide modern finishes (LVT or concrete floors, exposed ceilings, upgraded/recessed LED lighting) in common areas where client interaction takes place, but to keep
dedicated employee areas standard. This is not necessarily the case in urban markets where rental rates support a higher level of build-out.
Value engineering prior to having a signed lease causes deal fatigue in a lot of cases. The Catch-22 is that hourly soft architectural/engineering costs add up as more work is done to ”save money.” We anticipate that this trend of higher-than-anticipated tenant improvement costs will continue until corrected by a recession, which will create more competition in the small commercial construction sector.
KLNB agents have transactional experience working for both the tenant and the landlord. This knowledge, along with local insight, allows our team to define motivations properly and streamline an ever more challenging construction process.
Trend #4: Forest Conservation Bill . The Maryland Forest Conservation Act (FCA) was aimed at restoring forests to counteract the effect of larger-scale
tree and forest demolition for housing developments and commercial or industrial projects. The FCA currently
requires that for every four acres of
forest removed, only one acre of trees must be planted in nearby areas as mitigation or reforestation. Developers
will bear the greatest impact of
this legislation by having the added expense of being obligated to meet the reforestation requirements when they
have development projects. Currently,
many developers use the fee-in-lieu price to comply with restoration. Another
way to make it easier for developers to
comply with this government legislation is through forest mitigation banking.
This would enable developers to meet reforestation requirements off site and outsource the planting and mitigation of new tree stands to forest mitigation banks, thus taking the responsibility of finding tracts to plant new growth away from the developers. Several Maryland counties are revising their laws and regulations to encourage compliance of the Forest Conservation Act.
Trend #5: Overall Economy. Our economy
was very resilient in 2019 as we are
experiencing the longest economic
expansion/bull market since World War
II. The word “recession” was put on hold
for 2019. The US unemployment rate is
the lowest in its 50 year history, where
there are more job openings than people
looking for employment. Maryland’s
unemployment rate as of October 2019
was 3.6%. The gross domestic product
(GDP) and consumer spending are doing
well, but we expect both to slow down
in 2020. A recession was avoided due
to the federal interest rate cuts. The
debt markets are strong and 2019 was a
good year to be a borrower. The capital
markets have done well with lower
interest rates, lower inflation, stable
environment, abundance of capital to
drive the economy, and an increase in
investment volume. The technology
sector will continue to dominate the
office industry. Industrial and logistics
currently have an equal supply and
demand in availabilities along with a
healthy rent growth. Cold storage,
data centers, last mile industries, and e-commerce continue to drive the industrial/distribution space. It will be interesting as we move into 2020 with the upcoming presidential election as to
what the future will hold.
Trends In The Changing World of Commercial Real Estate
Baltimore | Columbia | Washington, D.C. | Northern Virginia | klnb.com

C L A S S A & B VA C A N C Y R AT E S & A B S O R P T I O N
END OF YEAR2019
# OF BUILDINGS
RBATOTAL
VACANT (SF)TOTAL VACANCY
RATE %TOTAL NET
ABSORPTIONRENTAL RATE
PSF (AVERAGE)CONSTRUCTION
COMPLETIONS (SF)FREDERICK COUNTY
Total Class A Direct 25 2,066,352 111,843 5.4% 26,891 $21.95 0
Total Class A Sublet 0 0.0% 0 $15.00
Total Class B Direct 120 4,283,123 857,602 20.0% (355,825) $17.58 0
Total Class B Sublet 6,322 0.1% 21,703 $17.90
MONTGOMERY COUNTY
Total Class A Direct 205 37,127,505 4,458,592 12.0% 10,386 $32.41 319,014
Total Class A Sublet 487,921 1.3% (254,066) $28.05
Total Class B Direct 506 28,720,974 3,394,090 11.8% (166,694) $25.82 0
Total Class B Sublet 154,896 0.5% 100,497 $23.56
PRINCE GEORGE’S COUNTY
Total Class A Direct 72 9,028,513 1,396,648 15.5% 479,758 $23.65 310,528
Total Class A Sublet 32,972 0.4% (13,002) $22.41
Total Class B Direct 312 12,817,921 1,880,104 14.7% (25,355) $21.10 0
Total Class B Sublet 30,818 0.2% (23,875) $18.14
Frederick County – Office EOY 2019 11/21/19 Vacancy Rate (%)
Net Absorption (SF)
Class A & B Vacancy Rate (%)
Frederick County – Office EOY 2019 11/21/19 Vacancy Rate (%)
Net Absorption (SF)
Class A Class B
Net Absorption (SF)
Class A & B Vacancy Rate (%)
Montgomery County – Office EOY 2019 11/21/19 Vacancy Rate (%)
Net Absorption (SF)
Montgomery County – Office EOY 2019 11/21/19 Vacancy Rate (%)
Net Absorption (SF)
Class A Class B
Net Absorption (SF)
FREDERICK COUNTY
Class A & B Vacancy Rate (%)
Prince George’s County – Office EOY 2019 12/20/19 Vacancy Rate (%)
Net Absorption (SF)
Prince George’s County – Office EOY 2019 12/20/19 Vacancy Rate (%)
Net Absorption (SF)
Class A Class B
Net Absorption (SF)
PRINCE GEORGE’S COUNTYMONTGOMERY COUNTY
5
Class A Class B Class A Class B Class A Class B
Office Market StatisticsCapital Region
Baltimore | Columbia | Washington, D.C. | Northern Virginia | klnb.com

BALTIMORE COUNTY
C L A S S A & B VA C A N C Y R AT E S & A B S O R P T I O N
END OF YEAR2019
# OF BUILDINGS
RBATOTAL
VACANT (SF)TOTAL VACANCY
RATE %TOTAL NET
ABSORPTIONRENTAL RATE
PSF (AVERAGE)CONSTRUCTION
COMPLETIONS (SF)ANNE ARUNDEL COUNTY
Total Class A 107 10,270,350 1,101,568 10.7% 182,689 $30.77 128,957
Total Class A Sublet 96,128 0.9% (56,016) $29.54
Total Class B 265 8,355,923 874,839 10.5% 18,750 $21.89 0
Total Class B Sublet 18,663 0.2% (8,943) $20.99
BALTIMORE CITY
Total Class A 69 16,313,000 2,552,537 15.6% (96,833) $26.77 0
Total Class A Sublet 174,132 1.1% (64,356) $31.58
Total Class B 316 24,155,777 1,450,839 6.0% (10,240) $18.30 29,257
Total Class B Sublet 24,715 0.1% 58,934 $20.86
BALTIMORE COUNTY
Total Class A 131 13,272,952 1,319,355 9.9% (16,413) $23.19 95,930
Total Class A Sublet 171,474 1.3% (92,142) $18.69
Total Class B 442 21,220,659 1,997,709 9.4% 1,686 $18.93 40,000
Total Class B Sublet 57,493 0.3% (584) $17.13
Anne Arundel County – Office EOY 2019 11/21/19 Vacancy Rate (%)
Net Absorption (SF)
Class A & B Vacancy Rate (%)
Anne Arundel County – Office EOY 2019 11/21/19 Vacancy Rate (%)
Net Absorption (SF)
Class A Class B
Net Absorption (SF)
Class A & B Vacancy Rate (%)
Baltimore City – Office EOY 2019 11/21/19 Vacancy Rate (%)
Net Absorption (SF)
Baltimore City – Office EOY 2019 11/21/19 Vacancy Rate (%)
Net Absorption (SF)
Class A Class B
Net Absorption (SF)
ANNE ARUNDEL COUNTY
Class A & B Vacancy Rate (%)
Baltimore County – Office EOY 2019 11/21/19 Vacancy Rate (%)
Net Absorption (SF)
Baltimore County – Office EOY 2019 11/21/19 Vacancy Rate (%)
Net Absorption (SF)
Class A Class B
Net Absorption (SF)
BALTIMORE CITY
6
Class A Class B Class A Class B Class A Class B
Office Market StatisticsCentral Region
Baltimore | Columbia | Washington, D.C. | Northern Virginia | klnb.com

HOWARD COUNTY
C L A S S A & B VA C A N C Y R AT E S & A B S O R P T I O N
END OF YEAR2019
# OF BUILDINGS
RBATOTAL
VACANT (SF)TOTAL VACANCY
RATE %TOTAL NET
ABSORPTIONRENTAL RATE
PSF (AVERAGE)CONSTRUCTION
COMPLETIONS (SF)HARFORD COUNTY
Total Class A Direct 17 1,487,314 526,374 35.4% 30,000 $22.77 0
Total Class A Sublet 15,324 1.0% 0 $20.00
Total Class B Direct 94 2,255,561 190,397 8.4% 51,562 $17.15 24,000
Total Class B Sublet 1,600 0.1% (1,600) $12.50
HOWARD COUNTY
Total Class A Direct 84 8,714,311 834,719 9.6% 255,448 $27.53 0
Total Class A Sublet 63,086 0.7% (39,430) $24.99
Total Class B Direct 233 8,488,675 704,996 8.3% (24,861) $21.59 0
Total Class B Sublet 62,218 0.7% (12,166) $21.41
Harford County – Office EOY 2019 11/21/19 Vacancy Rate (%)
Net Absorption (SF)
Class A & B Vacancy Rate (%)
Harford County – Office EOY 2019 11/21/19 Vacancy Rate (%)
Net Absorption (SF)
Class A Class B
Net Absorption (SF)
Class A & B Vacancy Rate (%)
Howard County – Office EOY 2019 11/21/19 Vacancy Rate (%)
Net Absorption (SF)
Class A Class B
Net Absorption (SF)
HARFORD COUNTY
7
Class A Class B Class A Class B
Howard County – Office EOY 2019 11/21/19 Vacancy Rate (%)
Net Absorption (SF)
Baltimore | Columbia | Washington, D.C. | Northern Virginia | klnb.com
Office Market StatisticsCentral Region

BulkOffice/WhsFlex
Frederick County – Industrial EOY 2019 11/20/19 Vacancy Rate (%)
Net Absorption (SF)
Vacancy Rate (%)Frederick County – Industrial EOY 2019 11/20/19 Vacancy Rate (%)
Net Absorption (SF)
Net Absorption (SF)
Montgomery County – Industrial EOY 2019 11/20/19 Vacancy Rate (%)
Net Absorption (SF)
Vacancy Rate (%)Montgomery County – Industrial EOY 2019 11/20/19 Vacancy Rate (%)
Net Absorption (SF)
Net Absorption (SF)
Prince George’s County – Industrial EOY 2019 11/20/19 Vacancy Rate (%)
Net Absorption (SF)
Vacancy Rate (%)Prince George’s County – Industrial EOY 2019 11/20/19 Vacancy Rate (%)
Net Absorption (SF)
Net Absorption (SF)
BulkOffice/WhsFlex
BulkOffice/WhsFlex
END OF YEAR2019
# OF BUILDINGS
RBA SFTOTAL
VACANT (SF) TOTAL VACANCY
RATE (%)TOTAL NET
ABSORPTION (SF) RENTAL RATE
PSF (AVERAGE)CONSTRUCTION
COMPLETIONS (SF)FREDERICK COUNTY
Total Bulk 53 4,592,604 446,762 9.7% 143,901 $6.63 112,000
Total Office/Warehouse 72 2,866,467 143,374 5.0% 33,731 $6.74 0
Total Flex 118 4,308,018 294,783 6.8% 45,257 $9.06 0
MONTGOMERY COUNTY
Total Bulk 80 4,065,126 398,065 9.8% (31,944) $14.10 0
Total Office/Warehouse 98 3,609,081 311,266 8.6% (105,438) $13.97 0
Total Flex 408 13,390,281 833,783 6.2% (139,080) $15.36 0
PRINCE GEORGE’S COUNTY
Total Bulk 257 22,817,454 1,963,088 8.6% 402,120 $6.94 104,973
Total Office/Warehouse 347 17,020,736 699,208 4.1% (8,811) $7.56 0
Total Flex 595 19,726,983 1,348,715 6.8% 19,163 $8.17 122,289
FREDERICK COUNTY MONTGOMERY COUNTY
B U L K , O F F I C E / WA R E H O U S E & F L E X VA C A N C Y R AT E S A N D A B S O R P T I O N
PRINCE GEORGE’S COUNTY
BulkOffice/WhsFlex
BulkOffice/WhsFlex
BulkOffice/WhsFlex
8
Industrial Market StatisticsCapital Region
Baltimore | Columbia | Washington, D.C. | Northern Virginia | klnb.com

END OF YEAR2019
# OF BUILDINGS
RBA SFTOTAL
VACANT (SF) TOTAL VACANCY
RATE (%)TOTAL NET
ABSORPTION (SF) RENTAL RATE
PSF (AVERAGE)CONSTRUCTION
COMPLETIONS (SF)FREDERICK COUNTY
Total Bulk 53 4,592,604 446,762 9.7% 143,901 $6.63 112,000
Total Office/Warehouse 72 2,866,467 143,374 5.0% 33,731 $6.74 0
Total Flex 118 4,308,018 294,783 6.8% 45,257 $9.06 0
MONTGOMERY COUNTY
Total Bulk 80 4,065,126 398,065 9.8% (31,944) $14.10 0
Total Office/Warehouse 98 3,609,081 311,266 8.6% (105,438) $13.97 0
Total Flex 408 13,390,281 833,783 6.2% (139,080) $15.36 0
PRINCE GEORGE’S COUNTY
Total Bulk 257 22,817,454 1,963,088 8.6% 402,120 $6.94 104,973
Total Office/Warehouse 347 17,020,736 699,208 4.1% (8,811) $7.56 0
Total Flex 595 19,726,983 1,348,715 6.8% 19,163 $8.17 122,289
B U L K , O F F I C E / WA R E H O U S E & F L E X VA C A N C Y R AT E S A N D A B S O R P T I O N
BulkOffice/WhsFlex
Vacancy Rate (%)Anne Arundel County – Industrial EOY 2019 11/20/19 Vacancy Rate (%)
Net Absorption (SF)
Net Absorption (SF)
Baltimore City – Industrial EOY 2019 11/20/19 Vacancy Rate (%)
Net Absorption (SF)
Vacancy Rate (%)Baltimore City – Industrial EOY 2019 11/20/19 Vacancy Rate (%)
Net Absorption (SF)
Net Absorption (SF)
Baltimore County – Industrial EOY 2019 11/20/19 Vacancy Rate (%)
Net Absorption (SF)
Vacancy Rate (%)Baltimore County – Industrial EOY 2019 11/20/19 Vacancy Rate (%)
Net Absorption (SF)
Net Absorption (SF)
BulkOffice/WhsFlex
BulkOffice/WhsFlex
END OF YEAR2019
# OF BUILDINGS
RBA SFTOTAL
VACANT (SF) TOTAL VACANCY
RATE (%)TOTAL NET
ABSORPTION (SF) RENTAL RATE
PSF (AVERAGE)CONSTRUCTION
COMPLETIONS (SF)ANNE ARUNDEL COUNTY
Total Bulk 114 16,005,207 1,972,148 12.3% 775,671 $5.74 0
Total Office/Warehouse 134 6,714,047 710,133 10.6% (110,892) $7.22 0
Total Flex 309 10,532,649 1,233,460 11.7% (304,183) $9.47 215,090
BALTIMORE CITY
Total Bulk 146 15,933,483 833,278 5.2% (666,597) $4.63 94,350
Total Office/Warehouse 264 16,949,387 869,242 5.1% (242,343) $4.37 0
Total Flex 519 20,598,543 1,259,854 6.1% 11,617 $5.77 0
BALTIMORE COUNTY
Total Bulk 155 24,413,299 4,546,108 18.6% (28,223) $5.03 0
Total Office/Warehouse 269 20,184,534 2,865,534 14.2% (96,125) $4.73 0
Total Flex 446 22,777,585 3,403,040 14.9% 102,721 $5.54 0
ANNE ARUNDEL COUNTY BALTIMORE CITY
B U L K , O F F I C E / WA R E H O U S E & F L E X VA C A N C Y R AT E S A N D A B S O R P T I O N
BALTIMORE COUNTY
BulkOffice/WhsFlex
BulkOffice/WhsFlex
BulkOffice/WhsFlex
9
Industrial Market StatisticsCentral Region
Baltimore | Columbia | Washington, D.C. | Northern Virginia | klnb.com
Anne Arundel County – Industrial EOY 2019 11/20/19 Vacancy Rate (%)
Net Absorption (SF)

Baltimore | Columbia | Washington, D.C. | Northern Virginia | klnb.com
Vacancy Rate (%) Vacancy Rate (%) Vacancy Rate (%)
END OF YEAR2019
# OF BUILDINGS
RBATOTAL
VACANT (SF) TOTAL VACANCY
RATE (%)TOTAL NET
ABSORPTION RENTAL RATE
PSF (AVERAGE)CONSTRUCTION
COMPLETIONS (SF)CARROLL COUNTY
Total Bulk 24 2,619,544 411,800 15.7% 11,200 $5.23 0
Total Office/Warehouse 47 3,919,029 223,177 5.7% (27,763) $5.89 0
Total Flex 71 3,268,707 203,223 6.2% (107,251) $6.16 0
CECIL COUNTY
Total Bulk 22 5,637,500 219,980 3.9% 1,000 $4.25 0
Total Office/Warehouse 14 669,471 49,800 7.4% 9,000 $4.50 0
Total Flex 15 577,613 4,000 .7% (5,800) $13.00 0
HARFORD COUNTY
Total Bulk 75 18,939,535 1,619,498 8.5% (341,113) $4.59 1,018,370
Total Office/Warehouse 59 3,451,790 251,411 7.3% 21,939 $5.09 0
Total Flex 86 3,304,768 84,442 2.6% (43,607) $6.25 0
HOWARD COUNTY
Total Bulk 172 23,049,413 1,990,265 8.6% 300,094 $6.99 0
Total Office/Warehouse 157 10,720,124 660,730 6.2% (221,782) $6.47 0
Total Flex 203 7,771,346 332,957 4.3% 107,551 $12.23 0
CARROLL COUNTY CECIL COUNTY
B U L K , O F F I C E / WA R E H O U S E & F L E X VA C A N C Y R AT E S A N D A B S O R P T I O N
HARFORD COUNTYCarroll County – Industrial EOY 2019 11/20/19 Vacancy Rate (%)
Net Absorption (SF)
Cecil County – Industrial EOY 2019 11/20/19 Vacancy Rate (%)
Net Absorption (SF)
BulkOffice/WhsFlex
BulkOffice/WhsFlex
BulkOffice/WhsFlex
Howard County – Industrial EOY 2019 11/20/19 Vacancy Rate (%)
Net Absorption (SF)
BulkOffice/WhsFlex
HOWARD COUNTY
Vacancy Rate (%)
BulkOffice/WhsFlex
Carroll County – Industrial EOY 2019 11/20/19 Vacancy Rate (%)
Net Absorption (SF)
Net Absorption (SF)
Cecil County – Industrial EOY 2019 11/20/19 Vacancy Rate (%)
Net Absorption (SF)
Net Absorption (SF)
Harford County – Industrial EOY 2019 11/20/19 Vacancy Rate (%)
Net Absorption (SF)
Net Absorption (SF)
BulkOffice/WhsFlex
BulkOffice/WhsFlex
Howard County – Industrial EOY 2019 11/20/19 Vacancy Rate (%)
Net Absorption (SF)
Net Absorption (SF)
BulkOffice/WhsFlex
10
Industrial Market StatisticsCentral Region
Harford County – Industrial EOY 2019 11/20/19 Vacancy Rate (%)
Net Absorption (SF)
Baltimore | Columbia | Washington, D.C. | Northern Virginia | klnb.com
END OF YEAR2019
# OF BUILDINGS
RBATOTAL
VACANT (SF) TOTAL VACANCY
RATE (%)TOTAL NET
ABSORPTION RENTAL RATE
PSF (AVERAGE)CONSTRUCTION
COMPLETIONS (SF)CARROLL COUNTY
Total Bulk 24 2,619,544 411,800 15.7% 11,200 $5.23 0
Total Office/Warehouse 47 3,919,029 223,177 5.7% (27,763) $5.89 0
Total Flex 71 3,268,707 203,223 6.2% (107,251) $6.16 0
CECIL COUNTY
Total Bulk 22 5,637,500 219,980 3.9% 1,000 $4.25 0
Total Office/Warehouse 14 669,471 49,800 7.4% 9,000 $4.50 0
Total Flex 15 577,613 4,000 .7% (5,800) $13.00 0
HARFORD COUNTY
Total Bulk 75 18,939,535 1,619,498 8.5% (341,113) $4.59 1,018,370
Total Office/Warehouse 59 3,451,790 251,411 7.3% 21,939 $5.09 0
Total Flex 86 3,304,768 84,442 2.6% (43,607) $6.25 0
HOWARD COUNTY
Total Bulk 172 23,049,413 1,990,265 8.6% 300,094 $6.99 0
Total Office/Warehouse 157 10,720,124 660,730 6.2% (221,782) $6.47 0
Total Flex 203 7,771,346 332,957 4.3% 107,551 $12.23 0
B U L K , O F F I C E / WA R E H O U S E & F L E X VA C A N C Y R AT E S A N D A B S O R P T I O N
11
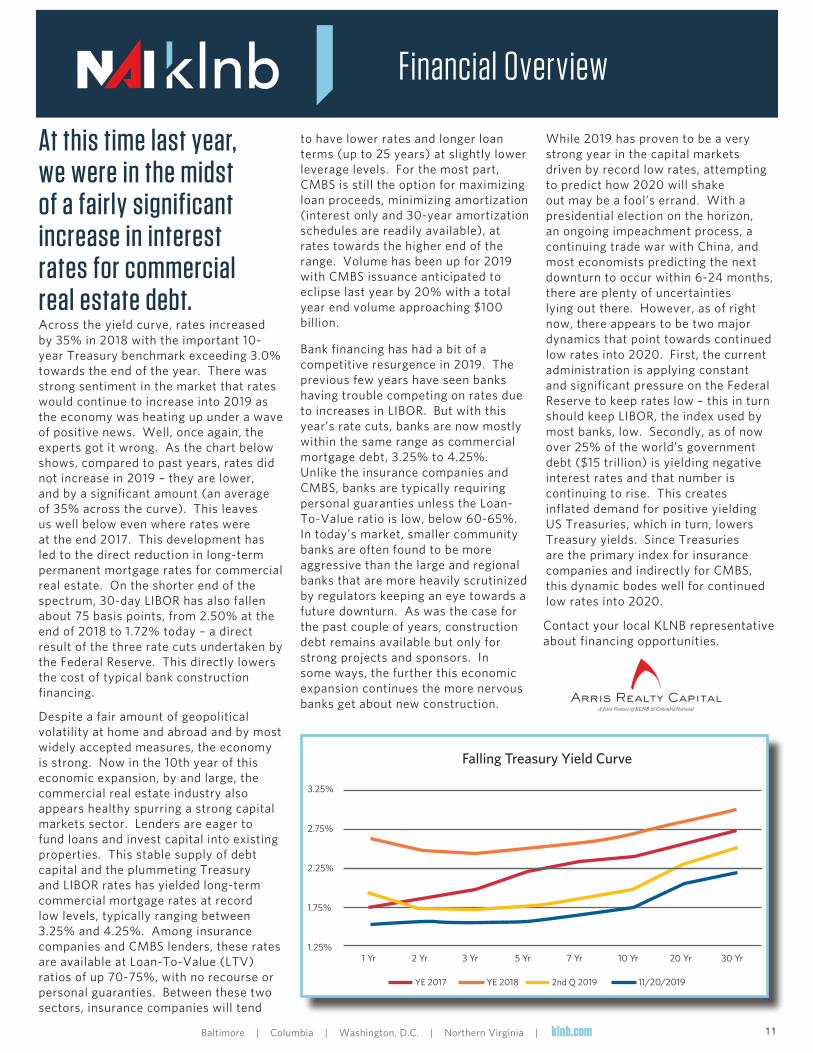
to have lower rates and longer loan terms (up to 25 years) at slightly lower leverage levels. For the most part, CMBS is still the option for maximizing loan proceeds, minimizing amortization (interest only and 30-year amortization schedules are readily available), at rates towards the higher end of the range. Volume has been up for 2019 with CMBS issuance anticipated to eclipse last year by 20% with a total year end volume approaching $100 billion.
Bank financing has had a bit of a competitive resurgence in 2019. The previous few years have seen banks having trouble competing on rates due to increases in LIBOR. But with this year’s rate cuts, banks are now mostly within the same range as commercial mortgage debt, 3.25% to 4.25%. Unlike the insurance companies and CMBS, banks are typically requiring personal guaranties unless the Loan-To-Value ratio is low, below 60-65%. In today’s market, smaller community banks are often found to be more aggressive than the large and regional banks that are more heavily scrutinized by regulators keeping an eye towards a future downturn. As was the case for the past couple of years, construction debt remains available but only for strong projects and sponsors. In some ways, the further this economic expansion continues the more nervous banks get about new construction.
While 2019 has proven to be a very strong year in the capital markets driven by record low rates, attempting to predict how 2020 will shake out may be a fool’s errand. With a presidential election on the horizon, an ongoing impeachment process, a continuing trade war with China, and most economists predicting the next downturn to occur within 6-24 months, there are plenty of uncertainties lying out there. However, as of right now, there appears to be two major dynamics that point towards continued low rates into 2020. First, the current administration is applying constant and significant pressure on the Federal Reserve to keep rates low – this in turn should keep LIBOR, the index used by most banks, low. Secondly, as of now over 25% of the world’s government debt ($15 trillion) is yielding negative interest rates and that number is continuing to rise. This creates inflated demand for positive yielding US Treasuries, which in turn, lowers Treasury yields. Since Treasuries are the primary index for insurance companies and indirectly for CMBS, this dynamic bodes well for continued low rates into 2020.
Across the yield curve, rates increased by 35% in 2018 with the important 10-year Treasury benchmark exceeding 3.0% towards the end of the year. There was strong sentiment in the market that rates would continue to increase into 2019 as the economy was heating up under a wave of positive news. Well, once again, the experts got it wrong. As the chart below shows, compared to past years, rates did not increase in 2019 – they are lower, and by a significant amount (an average of 35% across the curve). This leaves us well below even where rates were at the end 2017. This development has led to the direct reduction in long-term permanent mortgage rates for commercial real estate. On the shorter end of the spectrum, 30-day LIBOR has also fallen about 75 basis points, from 2.50% at the end of 2018 to 1.72% today – a direct result of the three rate cuts undertaken by the Federal Reserve. This directly lowers the cost of typical bank construction financing.
Despite a fair amount of geopolitical volatility at home and abroad and by most widely accepted measures, the economy is strong. Now in the 10th year of this economic expansion, by and large, the commercial real estate industry also appears healthy spurring a strong capital markets sector. Lenders are eager to fund loans and invest capital into existing properties. This stable supply of debt capital and the plummeting Treasury and LIBOR rates has yielded long-term commercial mortgage rates at record low levels, typically ranging between 3.25% and 4.25%. Among insurance companies and CMBS lenders, these rates are available at Loan-To-Value (LTV) ratios of up 70-75%, with no recourse or personal guaranties. Between these two sectors, insurance companies will tend
Financial Overview
1.25%
1.75%
2.25%
2.75%
3.25%
1 Yr 2 Yr 3 Yr 5 Yr 7 Yr 10 Yr 20 Yr 30 Yr
YE 2017 YE 2018 2nd Q 2019 11/20/2019
Falling Treasury Yield Curve
At this time last year, we were in the midst of a fairly significant increase in interest rates for commercial real estate debt.
Contact your local KLNB representative about financing opportunities.

In the words of one industry analyst, “Retail’s pain is Industrial’s gain.” Much of this notion is perceptional, as retail leasing fundamentals are quite sound with a nationwide vacancy rate of around 4.5 percent. Certain retail segments, like shopping malls, have seen their struggles and are evolving. However, the prevailing perception that the physical store model is dead in favor of home delivery is fanning the flames of interest from investors in last mile warehouse and distribution buildings and driving yield expectations for industrial real estate investments to record lows.
In the Baltimore/Washington industrial market, strong leasing market fundamentals have further helped to support these record values. According to Costar, the industrial vacancy rate across the entire region has fallen to 6.8 percent, down from a 10-year average of 9.1 percent. The current market rent stands at $8.67 per square foot, up from around $6.75 in 2012. The average market capitalization rate in the region’s industrial segment reached a record low of 6.8 percent.
Unlike other metropolitan areas, our market and the Washington side of the market, in particular, benefits from tremendous land constraints to new development. So, while over 10.2 million square feet of industrial product was delivered since January 2018 across the region, the industrial market still managed over 9.6 million square feet of positive net absorption. All these positive leasing trends have rewarded even the most aggressive investors.
Thankfully, our leasing fundamentals in this region do not mirror the nationwide trend, where new supply is outstripping demand, and the heaviest supply of new industrial deliveries yet, is anticipated for 2020. There is more than 300 million square feet of industrial product under construction across the country, according to Costar.
The most aggressive investors have been institutional investors. These investors are often deploying capital that is sourced from
overseas where interest rates are in many cases negative. As such, these overseas investors are willing to tolerate very modest returns on the very highest quality industrial investments, properties where these investors perceive less downside risk and less recurring capital expense.
The distress that exploded out of the “great recession” has been effectively resolved. One indicator, according to Trepp, is the special servicing rate continues to reach new post-crisis lows with each passing month. For instance, the CMBS delinquency rate in October fell to 2.47 percent, down from 3.42 percent a year ago.
through 12/12/2019
12
Investment Market Overview- A Focus on Industrial
Baltimore | Columbia | Washington, D.C. | Northern Virginia | klnb.com
Is a new recession on the horizon that will rain on the parade? The probabilityof a recession within twelve months, as predicted by the New York Federal Reserve (based on a model using the slope of the yield curve), stands at about 29 percent as of October 2019. So, it remains a relatively safe bet that 2020 will prove another banner year for industrial real estate investors. However, we are ten years into this current expansion. This, along with an escalating trade war, does raise concerns. Job gains have also decelerated; the labor market is so tight that it makes further economic growth more challenging owing to labor shortages.
For our clients, we would recommend focusing on acquiring industrial product around and inside the Washington Capital Beltway. It is in this part of the region where land constraints are the greatest and we also perceive less downside risk. Washington’s relatively larger population drives significant demand from ecommerce and other users needing last mile distribution space. Also, the massive federal government presence tends to soften the blow to the area’s commercial real estate market in a recession. When the economy does a downturn, the government tends to ramp up spending by countering in “Keynesian” fashion, creating government and government contractor jobs and driving demand for space.
The best opportunities for private and regional investors are the infill, middle market, Class B warehouse opportunities, where there is no competition from institutional investors playing with “nearly free money” and willing to tolerate in some cases, absurdly low returns. Thanks to mortgage rates well below 4 percent, positive leverage can be achieved when investing in this space. Even in the great recession, the national vacancy rate in the industrial market never climbed above about 10.5 percent. Plan for some future recession in 2021 or beyond, and build a portfolio with a diversity of tenants financed with long- term debt at modest levels of leverage to weather the next downturn.
Greater Baltimore/Washington Market Office/Industrial/Flex MarketNumber of Sales
Market Report EOY 2019
1200
1000
800
600
400
200
0
Num
ber o
f Sal
es
2015 2016 2017 2018 2019 *
Greater Baltimore/Washington Market Office/Industrial/Flex - Volume of Sales (in millions of $)
Market Report EOY 2019
Market Report EOY 2019
$10,000
$8,000
$6,000
$4,000
$2,000
$0
2015 2016 2017 2018 2019
Volu
me
in S
ales
(in
mill
ions
$)
*
Greater Baltimore/Washington Market Office/Industrial/Flex Average Capitalization Rate
Cap
Rat
e
7.6%7.5%7.4%7.3%7.2%7.1%
7.0%6.9%
2015 2016 2017 2018 2019
Cap
Rate
*
*

Baltimore | Columbia | Washington, D.C. | Northern Virginia | klnb.com
ADVISORY & PLANNING
We start by listening more than we talk, and then proceed to develop the best plan of action for your circumstances. Our Global Corporate Services advisory & planning process provides a wider scope of vision for your overall strategy and can produce a more comprehensive plan of action. Our strategic consultation method presents valuable options aligned with your goals which fosters your potential to be a more effective and successful business producer within your own core competency.
TRANSACTION MANAGEMENT
As globalization drives cross-border activity, our established system helps our clients follow their market regionally or internationally with seamless worldwide service. NAI Global offers a transaction management matrix that gives clients access to some of the most successful, independent property consultants in the world. The end result is global capability with highly reputable local expertise in more markets—large and small.
PROJECT MANAGEMENT
Our technology platform enables us to create private and secure intranets for our clients, electronically uniting an entire team into an online integrated inventory and project management system. In assembling all the parts of a project, be it construction management, green initiatives, planned maintenance, a relocation or capital improvement, we generate systematic processes which improve cycle time and reduce errors. With this system, we have the benefit of providing tested relationships with top-tier experts and vendors who deliver the best product for each project.
PORTFOLIO MANAGEMENT
Our team has expertise in executing optimum portfolio management services including property & facilities management, building consultancy and workspace planning & design. We deliver cost savings through attention to tenant retention, seamless lease administration, energy efficiency audits, project bidding and by taking advantage of the extensive amount of property we manage globally.
Our approach is consultative, partnering with you as one team. Starting with an advisory & planning process, we are able to align your business goals with your real estate needs for transaction management, project management or portfolio management.
13
Corporate Services

Baltimore | Columbia | Washington, D.C. | Northern Virginia | klnb.com
ADDRESS PRODUCT PRICE PRICE PSF SF USE BUYER SELLERANNE ARUNDEL COUNTY
521 McCormick Drive Industrial $15,700,000 $147 107,100 Investment RLIF East 2 LLC McCormick Industrial, LLC
999 Corporate Boulevard Office $10,400,000 $154 71,286 Investment Goodier Properties Heritage Properties, Inc.
7030 Dorsey Road Office $8,850,000 $141 62,733 Investment GCP Assets FRP Development Corp.
6704 Curtis Court Flex $5,644,800 $100 56,448 User Vision Technologies HCP
301 and 303 Najoles Road Flex $4,770,000 $79 60,525 Investment Nellis Corp. Polm Cos.
BALTIMORE CITY
Thames Street Wharf Office $101,000,000 $387 260,651 Investment Armada Hoffler Properties KBS Realty Advisors
1030 N. Charles Street Office $5,750,000 $120 54,000 User Agora Khan Realty
1900 S. Charles Street Industrial $3,200,000 $107 30,000 User Premier Storage Investors Pratt Thompson Co.
36 S. Charles Street Office $26,850,000 $86 360,282 Investment Zamir Equities Laurus Corp.
1770 Union Avenue (2 properties) Industrial $5,050,000 $32 208,335 Investment XD2 Investments Greenspring Realty Partners
BALTIMORE COUNTY
11333 McCormick Road Office $99,280,000 $295 330,802 Investment Spirit Realty Capital, Inc. Inland Private Capital Corp.
4, 6, and 10 North Park Drive Office $44,000,000 $148 342,870 Investment North Park Ventures Greenfield Partners
401 Washington Avenue Office $7,500,000 $68 110,065 User State of MD / Towson University Towson Associates, Inc.
4100 Maple Avenue Specialty $7,500,000 $41 183,500 Investment H&H Rock Cos. Good Shepherd Services
2800 Eastern Boulevard Industrial $19,993,700 $10 1,914,359 Investment Blue Ocean Middle River Station Development
CARROLL COUNTY
1332 Londontown Boulevard (2 properties) Flex $15,775,000 $43 365,812 Investment K&S Londontown De, LLC 1332 Londontown Road, LLC
1130 Business Parkway South Industrial $2,450,000 $60 41,000 Investment Business Parkway Management The Strouse Corporation
FREDERICK COUNTY
1 State Farm Drive Office $18,500,000 $48 387,008 User Frederick Health Lone Star Funds
30 West Patrick Street Office $15,900,000 $239 66,469 Investment Lee Development Group Atlas West End Patrick Center
7311 Governor's Way Industrial $5,950,000 $105 56,438 Investment Rouhanians Investments, LLC J & N Properties
7320 Executive Way Flex $5,800,000 $132 43,978 User Block Construction, LLC EOS, LLC
17750 Creamery Road, Buildings A and B Office $2,004,880 $98 20,550 User The Kay Fund For Children, Inc. Catoctin Holdings, Inc.
HARFORD COUNTY
650 McHenry Road Office $18,000,000 $189 95,200 User University of Maryland Upper Chesapeake Health Merritt Properties
1502 Quarry Drive Industrial $11,700,000 $106 110,875 Investment The Blackstone Group, LP FRP Development Corporation
1003-1015 Old Philadelphia Road Industrial $6,340,000 $24 268,010 Investment FRP Cranberry Run 1001 Partnership
HOWARD COUNTY
9755, 9770, 9780, 9790, 9800,9810, 9820, 9830 Patuxent Woods Drive Office $47,499,999 $163 294,730 Investment Center Court Properties, LLC Greenfield Partners
6740 Dorsey Road Industrial $15,450,000 $129 120,186 Investment High Street Equity Advisors Prologis
8215 Dorsey Run Road Industrial $7,510,000 $85 88,438 Investment GCP Fortified Terreno Realty Corporation
6655 Dobbin Road Industrial $5,450,000 $70 78,000 Investment Hill Management Services Velsor Properties
8510 Corridor Road Office $3,550,000 $118 30,186 User VersaTech Columbia Acquisition, LLC
10977 Guilford Road Office $2,700,000 $120 22,500 Investment Camson Construction, Inc. Greenman-Pedersen, Inc.
MONTGOMERY COUNTY
5600 Fishers Lane Office $436,000,000 $339 1,283,646 Investment Boyd Watterson Asset Mgmt. The JBG Companies
Metro Park North, WesTech Business Park, Meadow Business Park (28 bldgs) Office/Flex $148,800,000 $113 1,320,356 Investment DSC Partners PS Business Parks
8701 Georgia Avenue Office $18,953,846 $199 100,175 Investment The Siligman Group Guardian Realty Management
110 and 112 Frederick Avenue Industrial $3,600,000 $91 39,558 Investment Joshua Levine Frederick Avenue Limited Partnership
PRINCE GEORGE’S COUNTY
7704 Matapeake Business Drive Office $20,595,000 $334 61,614 Investment Hammes Partners Foulger-Pratt Companies
4949 Allentown Road Flex $14,600,000 $88 165,751 User From the Heart Ministries, Inc. Ameikor Investment Group, LLC
10000 Derekwood Lane Industrial $8,713,000 $193 45,100 Investment Gaulin Properties KMK Derekwood, Inc.
8800 Walker Mill Road Industrial $8,500,000 $113 75,551 User HSRE Fund VI Holding Company Ferguson
SALE TRANSACTIONS
14
2019 Notable Sale Transactions

Baltimore | Columbia | Washington, D.C. | Northern Virginia | klnb.com
ADDRESS PRODUCT SQUARE FEET TENANT NAME
ANNE ARUNDEL COUNTY
187 Harry S. Truman Parkway Office 128,957 Administrative Office of the Courts
509 McCormick Drive Flex 31,649 Bonsai Fine Arts
7550 Teague Road Office 30,200 By Light Professional IT Services
1745 Dorsey Road Flex 22,789 Rolling Wave Technologies
1750 Forest Drive Office 20,612 National Park Service and EPA
BALTIMORE CITY
5900 Holabird Avenue Industrial 169,000 R Ace Logistics
4241 Brookhill Road Industrial 130,000 Everything Warehouse
901 S. Bond Street Office 92,952 Brown Advisory Inc.
1801 62nd Street Industrial 63,325 SBS Transportation
McHenry Row Office 44,533 Helm Services for McHenry Row
1501 S. Clinton Street Office 29,000 Johns Hopkins Federal Credit Union
BALTIMORE COUNTY
9101 Yellow Brick Road Industrial 135,600 Case Mason Filling
3119 Hammonds Ferry Road Industrial 118,000 Form Services
211 Schilling Circle Office 86,419 Disabilities Determination Services
11350 McCormick Road Office 22,514 MassMutual
2330 West Joppa Road Office 20,449 Morgan Stanley Smith Barney
210 W. Pennsylvania Avenue Office 18,058 Imre
CARROLL COUNTY
1430 Progress Way Industrial 10,037 Maryland Allstars
FREDERICK COUNTY
8425 Precision Way Office 79,200 Precision Bioservices
7311 Governor's Way Industrial 46,938 Rouhanians Investments, LLC
5221 Intercoastal Drive Industrial 40,000 MR Stone, LLC
HARFORD COUNTY
1000 Woodley Road Industrial 628,320 The Container Store Distribution Ctr.
600 Hickory Drive Office 205,030 SK Realty Management
1001 Old Philadelphia Road Industrial 40,000 Chesapeake Spice
2029 Pulaski Highway Office 24,000 State of Maryland
HOWARD COUNTY
8880 Gorman Road Industrial 59,349 Antenna Research Associates (ARA)
8205 Patuxent Range Road Industrial 56,987 Office Depot
7120 Samuel Morse Drive Office 33,371 Maryland Office of Health Care Quality
7000 Columbia Gateway Drive Office 17,100 DreamPort
8110 Maple Lawn Boulevard Office 15,000 MagView
MONTGOMERY COUNTY
3300 75th Avenue Industrial 266,000 General Services Administration
4000 Garden City Drive Office 176,000 Kaiser Permanente
2277 Research Boulevard Office 117,684 CNSI
930 Clopper Road Industrial 60,022 Kite Pharma
12006 Cherry Hill Road Office 9,607 Adventist Healthcare
PRINCE GEORGE’S COUNTY
4600 Silver Hill Road Office 367,000 Bureau of Labor Statistics
9301 Largo Drive West Industrial 97,636 Phoenix International
8400 Westphalia Road Industrial 65,529 Hydralift Industrial Truck, Inc.
1000 Hampton Park Boulevard Industrial 38,408 Goodman Distribution, Inc.
LEASE TRANSACTIONS
15
2019 Notable Lease Transactions
*R = Renewal

-
While we have no reason to doubt the accuracy of any of the information supplied, we cannot, and do not, guarantee its accuracy. All information should be independently verified prior to a purchase or lease of the property. We are not responsible for errors, omissions, misuse, or misinterpretation of information contained herein & make no warranty of any kind, express or implied, with respect to the property or any other matters.
Our Team
KLNB MANAGEMENT - HQ KLNB MANAGEMENT60 West Street Suite 204Annapolis, Maryland 21401Tel: 866-280-4488
B/W CORRIDOR 6011 University BoulevardSuite 350Ellicott City, Maryland 21043Tel: 410-290-1110
VIRGINIA8065 Leesburg PikeSuite 700Tysons, Virginia 22182Tel: 703-268-2700
BALTIMORE/TOWSON 100 West Road Suite 505Baltimore, Maryland 21204Tel: 410-321-0100
WASHINGTON, DC - HQ1130 Connecticut Ave, NW Suite 600Washington, DC 20036Tel: 202-375-7500
* Denotes Partner
OFFICE
Charles A. Breitenother 443-574-1422
*
PRESIDENT
Marc A. Menick 202-420-7771
*
INVESTMENT SALES
Craig P. Morrell, SIOR 443-574-1425
*
INVESTMENT SALES
Christopher B. Kubler, CCIM 443-574-1415
*
INVESTMENT SALES
Brad Berzins, SIOR 443-632-2048
*
OFFICE
Jesse Schwartzman 443-632-2067
INDUSTRIAL
James V. Caronna, SIOR 443-632-2070
*
INDUSTRIAL
Peter I. Dudley 443-632-2064
*
INDUSTRIAL
Jonathan M. Green 443-632-2055
INDUSTRIAL
Michael P. Moran443-574-1402
INDUSTRIAL
Walter L. Patton443-632-2062
*
OFFICE
Zubin K. David443-574-1446
OFFICE
Spence Daw 443-574-1429
OFFICE
David J. Fritz, CCIM, SIOR 443-574-1410
*
OFFICE
Abby Glassberg 443-574-1433
OFFICE
Michael T. Mull 443-632-2063
OFFICE
Joseph P. Nolan, SIOR443-632-2065
*
INDUSTRIAL
Robert Z. Smith443-574-1411
*
INDUSTRIAL
Christopher P. Wright443-914-2600
OFFICE/INDUSTRIAL
Alan M. Coppola, SIOR443-574-1404
OFFICE/INDUSTRIAL
Richard E. Fields, SIOR443-574-1428
INVESTMENT SALES
Don Schline443-632-2046
MARKETING
Kate Mirabile443-574-1406
MARKETING
Fred Rohlfing443-632-2066
ADMINISTRATIVE
Carol Mox443-574-1405
100 West RoadSuite 505Towson, Maryland 21204Tel: 866-280-4488
Founded in 1968, KLNB is a leading provider of commercial real estate services throughout the Mid-Atlantic region. An independently owned and operated commercial brokerage and real estate services firm, KLNB provides a variety of services including tenant and landlord representation, leasing, consulting, investment sales, property management and financing services. 115 full-time brokerage professionals work across KLNB’s four offices strategically located throughout the Washington, D.C./Balto. region.
INVESTMENT SALES
Aaron B. Carroll 443-574-1409
ADMINISTRATIVE