2019 Third Quarter Results...Investor Relations page of investor.clearchannel.com. Reconciliations...
24
2019 Third Quarter Results November 6, 2019
Transcript of 2019 Third Quarter Results...Investor Relations page of investor.clearchannel.com. Reconciliations...

2019 Third Quarter Results
November 6, 2019

2
Safe Harbor Statement
Forward Looking Language
Certain statements in this presentation constitute “forward-looking statements” within the meaning of the Private Securities Litigation Reform Act of 1995. Such forward-looking statements
involve known and unknown risks, uncertainties and other factors which may cause the actual results, performance or achievements of Clear Channel Outdoor Holdings, Inc. to be materially
different from any future results, performance or achievements expressed or implied by such forward-looking statements. The words or phrases “guidance,” “believe,” “expect,” “anticipate,”
“estimates,” “forecast” and similar words or expressions are intended to identify such forward-looking statements. In addition, any statements that refer to expectations or other characterizations
of future events or circumstances, such as statements about our guidance and outlook, our business plans, strategies and initiatives and our expectations about certain markets, are forward-
looking statements. These statements are not guarantees of future performance and are subject to certain risks, uncertainties and other factors, some of which are beyond our control and are
difficult to predict. Various risks that could cause future results to differ from those expressed by the forward-looking statements included in this presentation include, but are not limited to: weak
or uncertain global economic conditions; our ability to service our debt obligations and to fund our operations and capital expenditures; industry conditions, including competition; our
dependence on our management team and other key individuals; our ability to obtain key municipal concessions for our street furniture and transit products; fluctuations in operating costs;
technological changes and innovations; shifts in population and other demographics; other general economic and political conditions in the United States and in other countries in which we
currently do business; changes in labor conditions and management; the impact of future dispositions, acquisitions and other strategic transactions; legislative or regulatory requirements;
regulations and consumer concerns regarding privacy and data protection; a breach of our information security measures; increases in tax rates or changes in tax laws or regulations;
restrictions on outdoor advertising of certain products; capital expenditure requirements; fluctuations in exchange rates and currency values; risks of doing business in foreign countries; new or
increased tariffs or unfavorable changes in trade policy; the risk that we may be more susceptible to adverse events following the Separation; the risk that we may be unable to replace the
services iHeartCommunications provided us in a timely manner or on comparable terms; the risk that the Separation may result in unfavorable tax consequences for us and impair our ability to
utilize our federal income tax net operating loss carryforwards in future years; the impact of our substantial indebtedness, including the effect of our leverage on our financial position and
earnings; the ability of our subsidiaries to dividend or distribute funds to us in order for us to repay our debts; the restrictions contained in the agreements governing our indebtedness and our
Preferred Stock limiting our flexibility in operating our business; and the effect of analyst or credit ratings downgrades. Other unknown or unpredictable factors also could have material adverse
effects on the Company’s future results, performance or achievements. In light of these risks, uncertainties, assumptions and factors, the forward-looking events discussed in this presentation
may not occur. You are cautioned not to place undue reliance on these forward-looking statements, which speak only as of the date stated, or if no date is stated, as of the date of this
presentation. Other key risks are described in the section entitled "Item 1A. Risk Factors" of the Company’s reports filed with the U.S. Securities and Exchange Commission, including the
Company's Annual Report on Form 10-K for the year ended December 31, 2018, as updated and supplemented by the Company's Quarterly Report on Form 10-Q for the quarter ended June
30, 2019. Except as otherwise stated in this presentation, the Company does not undertake any obligation to publicly update or revise any forward-looking statements because of new
information, future events or otherwise.
Non-GAAP Financial Measures
This presentation includes information that does not conform to U.S. generally accepted accounting principles ("GAAP"), such as (i) revenue, direct operating expenses and SG&A expenses,
each excluding the effects of foreign exchange rates; (ii) corporate expenses, excluding non-cash compensation expenses and the effects of foreign exchange rates; and (iii) OIBDAN and
OIBDAN excluding the effects of foreign exchange rates. Since these non-GAAP financial measures are not calculated in accordance with GAAP, they should not be considered in isolation of,
or as a substitute for, the most directly comparable GAAP financial measures as an indicator of operating performance. Furthermore, these measures may not be consistent with similar
measures provided by other companies. This data should be read in conjunction with previously published Company reports on Forms 10-K, 10-Q and 8-K. These reports are available on the
Investor Relations page of investor.clearchannel.com. Reconciliations of non-GAAP measures to the most directly comparable GAAP measures are included at the end of this presentation.
This presentation should be read in conjunction with the 2019 earnings releases and Form 10-Q filings of Clear Channel Outdoor Holdings, Inc., available at
investor.clearchannel.com.
Numbers may not sum due to rounding. In this presentation, OIBDAN is defined as consolidated operating income adjusted to exclude non-cash compensation expenses included within
corporate expenses, as well as the following line items presented in the Company's Statement of Comprehensive Loss: depreciation and amortization, impairment charges, and other operating
income (expense), net. Certain financial information shown in this presentation excludes the effects of foreign exchange rates. See reconciliations in the Appendix.

3

4
Executing on Four Strategic Pillars
Growing the "Out-of-Home"(OOH) Medium
⦁ Benefit from positive audience trends and core strengths of the outdoor medium
⦁ Build on unique global footprint – operating in key markets with strong demographic strengths
Technology Leadership
⦁ Leverage our leadership position in technology and data in OOH
⦁ Make OOH advertisements even easier to plan and buy
⦁ Apply data to provide customers with proof of campaign delivery/return on investment
⦁ Improve OOH’s core proposition through digital displays, making the medium even more flexible and creative to draw consumer interest
CustomerFocus
⦁ Further develop our sales excellence, with sophisticated revenue management tools to optimize yield of our asset base
⦁ Use our distinctive global presence to build relationships with key global advertisers across our portfolio
⦁ Differentiate on brand safety versus other mediums
Opportunistic Expansion
⦁ Leverage our strong operational performance to optimize capital structure
⦁ Pursue opportunities for accretive M&A in a fragmented marketplace
⦁ Exploit potential for portfolio expansion with acquisitions benefiting from our technology
⦁ Utilize our deep know-how and experienced management team
Creating a Unique, Mass-Reach, Global Media Platform Delivering Client Messages Across Distinctive Portfolio of Digital and Traditional Displays

5
World-Class, Digital Network with 16,000+ digital displays
Installed 1,004 new digital
displays for a total of 15,000+
digital displays in 21
International markets
Installed 18 new
digital billboards for a
total of 1,300+ digital
billboards and 1,600+
digital displays in
U.S.

6
The Clear Channel Outdoor Difference
Continued Execution On:
• Expanding the value and revenue-generating ability of our assets with CCO RADAR –efficiently leverages data analytics to deliver highly targeted and measurable advertising solutions.
• Simplifying ad placement process to enhance overall advertiser experience and increase efficiency.
• Evolving our omnichannel suite of solutions, including our first-to-market RADAR platform in the U.S.
• RADAR leverages aggregated, anonymized, privacy-compliant opt-in data sets to
reach the right audience segments, in ways that deliver measurable results.
• Intend to launch RADAR in Europe in 2020, beginning with the UK, Sweden and
Spain.
• Our efforts are resonating with advertisers – and giving us a seat at the table.
Delivering Greater Return on Investment

7
Americas – Generating Strong Revenue in the U.S.
• Expanding digital capabilities with 1st weather-triggered
ad campaign in Times Square, as well as airports and
roadside inventory
• Enabling advertisers to reach consumers in a
contextually-relevant way
• Partnering with major movie studio to develop a unique
campaign that expands the footprint of print displays
beyond the L.A. and N.Y. markets
• 161 bulletins in 16 markets
• Transforming San Jose International Airport into 1st all-
digital and most advanced airport advertising program in
the U.S.
• Integrated with RADAR, our suite of audience planning,
amplification and measurement solutions
• Completing the transformation and launch of 1,300+ new,
visually striking, printed OOH displays across the small,
mid and large U.S market footprint
• Premiere panels bring nearly bulletin-sized media down-
to-earth for even greater visibility

8
International – Enhancing Global Position
• Close to completing the roll-out of 1,600+ street furniture
units in Paris and are delivering advertising campaigns for
Éric Bompard, Chanel, Netflix, Uber, Coca-Cola and
Calvin Klein
• Our partnership with the City of Paris runs through 2024
• Winning 6-year contract for subway in Toulouse, one of
France’s largest metropolitan areas
• Increase digital screens from 30 to 95
• Installing 2,000th Adshel Live digital screen in U.K., which
cements the position of our Adshel Live network as the
country's largest individual digital OOH network
• Enables advertisers to reach 38% of population weekly
• Continuing our expansion efforts to reach 1,000 digital
screens across Sweden’s biggest cities: Stockholm,
Malmö, Gothenburg and Solna
• Only OOH provider to offer digital street furniture in the
cities of Stockholm, Malmö and Gothenburg

9
Q3 2019 Key Financial Highlights
Notes: In this presentation, OIBDAN is defined as consolidated operating income adjusted to exclude non-cash compensation expenses included within corporate expenses, as
well as the following line items presented in the Company's Statement of Comprehensive Loss: depreciation and amortization, impairment charges, and other operating income
(expense), net. Certain financial information shown in this presentation excludes the effects of foreign exchange rates. See reconciliations in the Appendix.
• Revenue: $653.4 million (down 1.6%, $10.3 million)
• Up 0.6% adjusting for FX
• Operating Income: $47.7 million (down $3.5 million)
• OIBDAN: $130.6 million (down 5.8%, $8.0 million)
• Down 5.3% adjusting for FX
Note: Comparisons are to the same period of 2018.

10
Financial Results: Americas
(USD, in millions)
Three Months Ended September 30,
2019 2018 Variance
Revenue $ 328.3 $ 303.4 8.2%
Direct operating & SG&A expenses (excluding D&A) $ 192.5 $ 180.5 6.6%
Operating income $ 98.1 $ 83.2 18.0%
OIBDAN $ 135.8 $ 122.9 10.5%
Revenue: Up 8.2%; Adjusted Revenue: Up 8.2%
• Largest driver -- digital revenue up 17.6%, with digital revenue from billboards & street furniture up 19.3%; combination of organic
growth and the deployment of new digital displays
• Additional increases from print billboards, transit displays and wallscapes
• National sales up 10.0%; local sales up 7.0%
Direct operating & SG&A expenses (excluding D&A): Up 6.6%; Adjusted Expenses: Up 6.6%
• Increase in direct operating expenses primarily due to higher site lease expenses, including variable site lease expense related to
higher revenue
• Increase in SG&A expenses largely due to higher employee compensation expense, including variable incentive compensation
Outlook:
• Revenue and OIBDAN growth expected to be mid-to-high single digits in 2H 2019
Notes: In this presentation, OIBDAN is defined as consolidated operating income adjusted to exclude non-cash compensation expenses included within corporate expenses, as
well as the following line items presented in the Company's Statement of Comprehensive Loss: depreciation and amortization, impairment charges, and other operating income
(expense), net. Certain financial information shown in this presentation excludes the effects of foreign exchange rates. See reconciliations in the Appendix.

11
Financial Results: International
(USD, in millions)
Three Months Ended September 30,
Adjusted*
2019 2018 Variance 2019 2018 Variance
Revenue $ 325.2 $ 360.3 (9.7)% $ 339.6 $ 360.3 (5.8)%
Direct operating & SG&A expenses (excluding D&A) $ 294.9 $ 310.0 (4.9)% $ 307.9 $ 310.0 (0.7)%
Operating income $ (4.0) $ 13.7 (129.4)%
OIBDAN $ 30.3 $ 50.3 (39.7)% $ 31.7 $ 50.3 (37.0)%
*Adjusted results exclude the impact of FX
Revenue: Down 9.7%
Adjusted Revenue: Down 5.8%
• Primarily due to decrease in China revenues due to weakening economic conditions
• Non-renewal of contracts in certain countries, including Italy and Spain, also contributed to the decrease in revenue
• Partially offset by increases in revenue from digital display expansion in various markets, particularly in the United Kingdom
• Total digital revenue up 17.4% (excludes impacts of FX)
Direct operating & SG&A expenses (excluding D&A): Down 4.9%
Adjusted Expenses: Down 0.7%
• Direct operating expenses slightly increased primarily due to higher site lease expenses in countries experiencing revenue growth
partially offset by lower site lease expenses in Italy and Spain due to non-renewal of contracts
• SG&A expenses decreased largely due to decreased costs in Spain related to non-renewal of contracts
Outlook (excluding China and foreign exchange impact):
• Revenue and OIBDAN growth expected to be low single digits in H2 2019
• Seasonal strength coming in the fourth quarter
Notes: In this presentation, OIBDAN is defined as consolidated operating income adjusted to exclude non-cash compensation expenses included within corporate expenses, as
well as the following line items presented in the Company's Statement of Comprehensive Loss: depreciation and amortization, impairment charges, and other operating income
(expense), net. Certain financial information shown in this presentation excludes the effects of foreign exchange rates. See reconciliations in the Appendix.

12
Capital Expenditures
(USD, in millions)
Nine Months Ended September 30,
2019 2018 $ %
Americas $ 46.5 $ 50.2 $ (3.7) (7.4)%
International 82.7 57.5 25.2 43.8%
Corporate 10.5 2.4 8.1 333.9%
Total Capex $ 139.7 $ 110.1 $ 29.5 26.8%
Due to rounding, totals may not equal the sum of the line items in the table above.
Key Drivers:
• Americas: Constructing and sustaining our billboards and other out-of-home advertising displays, including digital boards
• International: Constructing and sustaining our street furniture and other out-of-home advertising displays, including digital displays;
increase primarily attributable to new street furniture contract in Paris and build-out of additional bus shelters in China
• Corporate: Increase primarily due to build-out of the new San Antonio office & IT infrastructure due to Separation
Guidance:
• FY 2019 consolidated capital expenditures expected to be in the $225 million to $235 million range

13
Benefits from Recent Capital Market Activities
Improved balance sheet, stronger cash flow generation and a significantly
extended maturity profile
Equity Offer:
• 100 million shares of common stock
• Priced on July 25, 2019 at $3.50
• Closed July 30, 2019
• Net proceeds used to redeem ~$333.5 million aggregate principal amount of 9.25% CCWH Subordinated Notes due 2024
• Expected to decrease annual cash interest payments by ~$31 million
• Resulted in credit upgrades - enabled company to efficiently refinance all senior debt
Debt Refinancing:
• Issued:
• $1,250 million of 5.125% Senior Secured Notes due 2027
• $2 billion, seven-year Term Loan B Facility at LIBOR plus 350 basis points
• Redeemed
• $375 million CCIBV 8.75% Senior Notes due 2020
• $2,725 million CCWH 6.5% Senior Notes due 2022
• Expected to decrease annual cash interest payments by ~$32 million
14
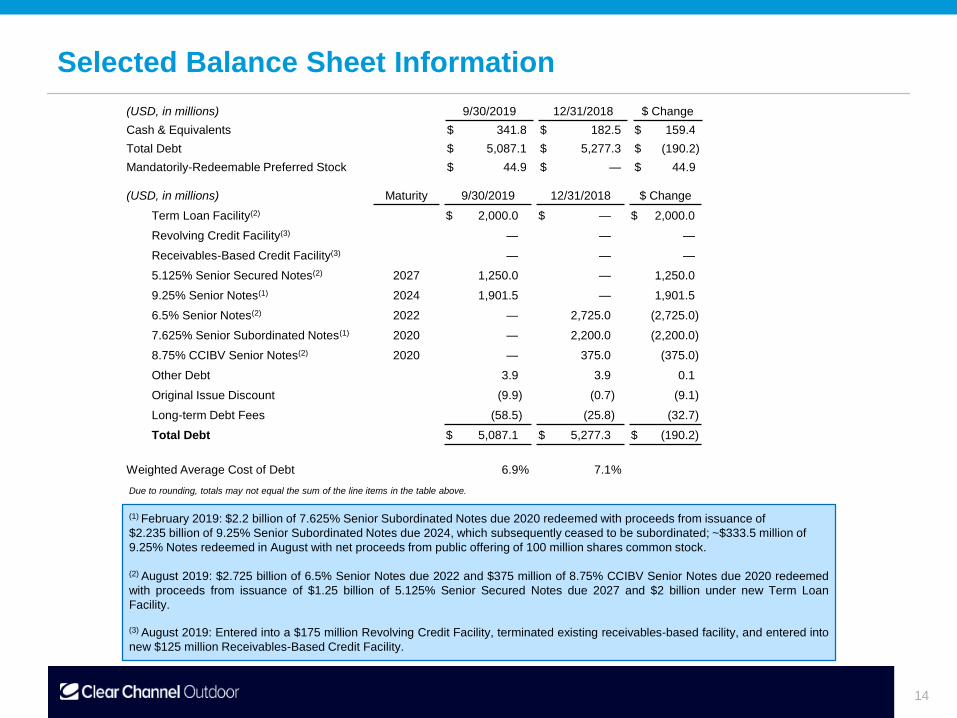
Selected Balance Sheet Information
(USD, in millions) 9/30/2019 12/31/2018 $ Change
Cash & Equivalents $ 341.8 $ 182.5 $ 159.4
Total Debt $ 5,087.1 $ 5,277.3 $ (190.2)
Mandatorily-Redeemable Preferred Stock $ 44.9 $ — $ 44.9
(USD, in millions) Maturity 9/30/2019 12/31/2018 $ Change
Term Loan Facility(2) $ 2,000.0 $ — $ 2,000.0
Revolving Credit Facility(3) — — —
Receivables-Based Credit Facility(3) — — —
5.125% Senior Secured Notes(2) 2027 1,250.0 — 1,250.0
9.25% Senior Notes(1) 2024 1,901.5 — 1,901.5
6.5% Senior Notes(2) 2022 — 2,725.0 (2,725.0)
7.625% Senior Subordinated Notes(1) 2020 — 2,200.0 (2,200.0)
8.75% CCIBV Senior Notes(2) 2020 — 375.0 (375.0)
Other Debt 3.9 3.9 0.1
Original Issue Discount (9.9) (0.7) (9.1)
Long-term Debt Fees (58.5) (25.8) (32.7)
Total Debt $ 5,087.1 $ 5,277.3 $ (190.2)
Weighted Average Cost of Debt 6.9% 7.1%
(1) February 2019: $2.2 billion of 7.625% Senior Subordinated Notes due 2020 redeemed with proceeds from issuance of
$2.235 billion of 9.25% Senior Subordinated Notes due 2024, which subsequently ceased to be subordinated; ~$333.5 million of
9.25% Notes redeemed in August with net proceeds from public offering of 100 million shares common stock.
(2) August 2019: $2.725 billion of 6.5% Senior Notes due 2022 and $375 million of 8.75% CCIBV Senior Notes due 2020 redeemed
with proceeds from issuance of $1.25 billion of 5.125% Senior Secured Notes due 2027 and $2 billion under new Term Loan
Facility.
(3) August 2019: Entered into a $175 million Revolving Credit Facility, terminated existing receivables-based facility, and entered into
new $125 million Receivables-Based Credit Facility.
Due to rounding, totals may not equal the sum of the line items in the table above.

15
Appendix

16
GAAP Measures by Segment
(In thousands) Three Months Ended September 30, Nine Months Ended September 30,
2019 2018 Variance 2019 2018 Variance
Revenue
Americas $ 328,250 $ 303,421 8.2% $ 928,114 $ 859,190 8.0%
International 325,197 360,318 (9.7)% 1,010,464 1,114,927 (9.4)%
Consolidated Revenue $ 653,447 $ 663,739 (1.6)% $ 1,938,578 $ 1,974,117 (1.8)%
Direct Operating and SG&A Expenses (Excluding Depreciation and Amortization)1
Americas $ 192,465 $ 180,488 6.6% $ 566,076 $ 532,448 6.3%
International 294,853 309,990 (4.9)% 889,785 944,952 (5.8)%
Consolidated Direct Operating and SG&A Expenses1 $ 487,318 $ 490,478 (0.6)% $ 1,455,861 $ 1,477,400 (1.5)%
Operating Income2
Americas $ 98,132 $ 83,150 18.0% $ 240,331 $ 199,332 20.6%
International (4,029) 13,701 (129.4)% 17,913 56,100 (68.1)%
Corporate (41,735) (38,724) (7.8)% (112,059) (114,039) 1.7%
Impairment charges(5,300) (7,772) 31.8% (5,300) (7,772) 31.8%
Other operating income (expense), net 620 825 (1,632) 1,700
Consolidated Operating Income $ 47,688 $ 51,180 (6.8)% $ 139,253 $ 135,321 2.9%
1 Direct Operating and SG&A Expenses refers to the sum of direct operating expenses (excluding depreciation and amortization) and selling,
general and administrative expenses (excluding depreciation and amortization).
2 Americas and International operating income (loss) is calculated as revenue less: (a) direct operating and SG&A expenses and (b)
depreciation and amortization. Corporate is calculated as the sum of corporate expenses, including non-cash compensation expenses, and
corporate depreciation and amortization. Refer to the reconciliation of OIBDAN to operating income (loss) within these slides for the
depreciation and amortization amounts for each period.

17
Non-GAAP Measures by Segment
(In thousands) Three Months Ended September 30, Nine Months Ended September 30,
2019 2018 Variance 2019 2018 Variance
Revenue Excluding Movements in Foreign Exchange
Americas $ 328,249 $ 303,421 8.2% $ 928,112 $ 859,190 8.0%
International 339,596 360,318 (5.8)% 1,071,228 1,114,927 (3.9)%
Consolidated Revenue Excluding FX $ 667,845 $ 663,739 0.6% $ 1,999,340 $ 1,974,117 1.3%
Direct Operating and SG&A Expenses Excluding Movements in Foreign Exchange (Excluding Depreciation and Amortization)
Americas $ 192,464 $ 180,488 6.6% $ 566,075 $ 532,448 6.3%
International 307,874 309,990 (0.7)% 943,933 944,952 (0.1)%
Consolidated Direct Operating and SG&A Expenses Excluding FX $ 500,338 $ 490,478 2.0% $ 1,510,008 $ 1,477,400 2.2%
OIBDAN
Americas $ 135,785 $ 122,933 10.5% $ 362,038 $ 326,742 10.8%
International 30,344 50,328 (39.7)% 120,679 169,975 (29.0)%
Corporate (35,514) (34,597) (2.7)% (92,640) (104,335) 11.2%
Consolidated OIBDAN $ 130,615 $ 138,664 (5.8)% $ 390,077 $ 392,382 (0.6)%
OIBDAN Excluding Movements in Foreign Exchange
Americas $ 135,785 $ 122,933 10.5% $ 362,037 $ 326,742 10.8%
International 31,722 50,328 (37.0)% 127,295 169,975 (25.1)%
Corporate (36,222) (34,597) (4.7)% (94,869) (104,335) 9.1%
Consolidated OIBDAN Excluding FX $ 131,285 $ 138,664 (5.3)% $ 394,463 $ 392,382 0.5%
Note: Revenue excluding effects of foreign exchange rates, direct operating and SG&A expenses excluding effects of foreign exchange rates, and
OIBDAN excluding effects of foreign exchange rates are calculated by converting the current period's amounts in local currency to U.S. dollars
using average foreign exchange rates for the comparable prior period.

18
Reconciliations of Revenue
(In thousands) Three Months Ended September 30, Nine Months Ended September 30,
2019 2018 2019 2018
Revenue:
Consolidated revenue $ 653,447 $ 663,739 $ 1,938,578 $ 1,974,117
Excluding: Effects of foreign exchange 14,398 — 60,762 —
Consolidated revenue excluding effects of foreign exchange $ 667,845 $ 663,739 $ 1,999,340 $ 1,974,117
Americas revenue $ 328,250 $ 303,421 $ 928,114 $ 859,190
Excluding: Effects of foreign exchange (1) — (2) —
Americas revenue excluding effects of foreign exchange $ 328,249 $ 303,421 $ 928,112 $ 859,190
International revenue $ 325,197 $ 360,318 $ 1,010,464 $ 1,114,927
Excluding: Effects of foreign exchange 14,399 — 60,764 —
International revenue excluding effects of foreign exchange $ 339,596 $ 360,318 $ 1,071,228 $ 1,114,927
International digital revenue $ 88,068 $ 78,716 $ 250,581 $ 236,709
Excluding: Effects of foreign exchange 4,331 — 15,055 —
International digital revenue excluding effects of foreign exchange $ 92,399 $ 78,716 $ 265,636 $ 236,709

19
Reconciliations of Direct Operating and SG&A Expenses
(In thousands) Three Months Ended September 30, Nine Months Ended September 30,
2019 2018 2019 2018
Direct operating and SG&A expenses1
Consolidated direct operating and SG&A expenses $ 487,318 $ 490,478 $ 1,455,861 $ 1,477,400
Excluding: Effects of foreign exchange 13,020 — 54,147 —
Consolidated direct operating and SG&A expenses excluding effects of foreign exchange $ 500,338 $ 490,478 $ 1,510,008 $ 1,477,400
Americas direct operating and SG&A expenses $ 192,465 $ 180,488 $ 566,076 $ 532,448
Excluding: Effects of foreign exchange (1) — (1) —
Americas direct operating and SG&A expenses excluding effects of foreign exchange $ 192,464 $ 180,488 $ 566,075 $ 532,448
International direct operating and SG&A expenses $ 294,853 $ 309,990 $ 889,785 $ 944,952
Excluding: Effects of foreign exchange 13,021 — 54,148 —
International direct operating and SG&A expenses excluding effects of foreign exchange $ 307,874 $ 309,990 $ 943,933 $ 944,952
1 Direct Operating and SG&A Expenses refers to the sum of direct operating expenses (excluding depreciation and amortization) and selling,
general and administrative expenses (excluding depreciation and amortization).

20
Reconciliation of Corporate Expenses
(In thousands) Three Months Ended September 30, Nine Months Ended September 30,
2019 2018 2019 2018
Corporate Expense $ 37,535 $ 37,729 $ 105,056 $ 111,092
Excluding: Non-cash compensation expense (2,021) (3,132) (12,416) (6,757)
Corporate Expense excluding non-cash compensation expense $ 35,514 $ 34,597 $ 92,640 $ 104,335
Excluding: Effects of foreign exchange 708 — 2,229 —
Corporate Expense excluding non-cash compensation expense and effects of foreign exchange $ 36,222 $ 34,597 $ 94,869 $ 104,335

21
Reconciliation of OIBDAN excluding effects of foreign exchange and OIBDAN to Operating Income (Loss)
(In thousands)
OIBDAN excluding effects
of foreign exchange
Effects of foreign
exchangeOIBDAN
(subtotal)
Non-cash compensation
expenses
Depreciation and
amortizationImpairment
charges
Other operating (income)
expense, netOperating
income (loss)
Three Months Ended September 30, 2019
Americas $ 135,785 $ — $ 135,785 $ — $ 37,653 $ — $ — $ 98,132
International 31,722 (1,378) 30,344 — 34,373 — — (4,029)
Corporate (36,222) 708 (35,514) 2,021 4,200 — — (41,735)
Impairment charges — — — — — 5,300 — (5,300)
Other operating income, net — — — — — — (620) 620
Consolidated $ 131,285 $ (670) $ 130,615 $ 2,021 $ 76,226 $ 5,300 $ (620) $ 47,688
Three Months Ended September 30, 2018
Americas $ 122,933 $ — $ 122,933 $ — $ 39,783 $ — $ — $ 83,150
International 50,328 — 50,328 — 36,627 — — 13,701
Corporate (34,597) — (34,597) 3,132 995 — — (38,724)
Impairment charges — — — — — 7,772 — (7,772)
Other operating income, net — — — — — — (825) 825
Consolidated $ 138,664 $ — $ 138,664 $ 3,132 $ 77,405 $ 7,772 $ (825) $ 51,180
Nine Months Ended September 30, 2019
Americas $ 362,037 $ 1 $ 362,038 $ — $ 121,707 $ — $ — $ 240,331
International 127,295 (6,616) 120,679 — 102,766 — — 17,913
Corporate (94,869) 2,229 (92,640) 12,416 7,003 — — (112,059)
Impairment charges — — — — — 5,300 — (5,300)
Other operating expense, net — — — — — — 1,632 (1,632)
Consolidated $ 394,463 $ (4,386) $ 390,077 $ 12,416 $ 231,476 $ 5,300 $ 1,632 $ 139,253
Nine Months Ended September 30, 2018
Americas $ 326,742 $ — $ 326,742 $ — $ 127,410 $ — $ — $ 199,332
International 169,975 — 169,975 — 113,875 — — 56,100
Corporate (104,335) — (104,335) 6,757 2,947 — — (114,039)
Impairment charges — — — — — 7,772 — (7,772)
Other operating income, net — — — — — — (1,700) 1,700
Consolidated $ 392,382 $ — $ 392,382 $ 6,757 $ 244,232 $ 7,772 $ (1,700) $ 135,321

22
Non-GAAP Guidance
Note About Reconciliation of Free Cash Flow to Net Cash Provided by Operating Activities
We have not reconciled free cash flow guidance to net cash provided by operating activities for 2021 because of the
uncertainty regarding, and the potential variability of, the reconciling items between free cash flow and net cash provided
by operating activities. The actual amount of the reconciling items will have a significant impact on our net cash provided
by operating activities and, accordingly, a reconciliation of net cash provided by operating activities to free cash flow for
2021 is not available without unreasonable efforts.
Note About Reconciliation of Consolidated EBITDA to Net Cash Provided by Operating Activities
Net leverage is defined as consolidated debt divided by Consolidated EBITDA, as calculated in accordance with the
credit agreement. We have not reconciled Consolidated EBITDA, as calculated in accordance with the credit agreement,
to net cash provided by operating activities because of the uncertainty regarding, and the potential variability of, the
reconciling items between Consolidated EBITDA, as calculated in accordance with the credit agreement, and net cash
provided by operating activities. The actual amount of the reconciling items will have a significant impact on net cash
provided by operating activities and, accordingly, a reconciliation of net cash provided by operating activities to
Consolidated EBITDA, as calculated in accordance with the credit agreement, is not available without unreasonable
efforts.

23
Items Impacting Comparability
$US Dollars in millions
Revenue
Foreign Exchange Impact:
Q3 2019
Total $ (14.4)
$US Dollars in millions
Direct Operating and SG&A Expenses
Foreign Exchange Impact:
Q3 2019
Total $ (13.0)

24
About Clear Channel Outdoor Holdings, Inc.
Clear Channel Outdoor Holdings, Inc. (NYSE: CCO) is one of
the world’s largest outdoor advertising companies with a
diverse portfolio of approximately 450,000 print and digital
displays in 31 countries across Asia, Europe, Latin America
and North America, reaching millions of people monthly. A
growing digital platform includes more than 15,000 digital
displays in international markets and more than 1,600 digital
displays, including more than 1,300 digital billboards, in the
U.S. Comprised of two business divisions – Clear Channel
International (CCI), covering markets in Asia, Europe and Latin
America, and Clear Channel Outdoor Americas (CCOA), the
U.S. and Caribbean business division – CCO employs
approximately 6,300 people globally. More information is
available at investor.clearchannel.com,
clearchannelinternational.com and clearchanneloutdoor.com.
Investors Eileen McLaughlin Vice President - Investor Relations [email protected]