2019 TEDS-D Codebook
100
TREATMENT EPISODE DATA SET DISCHARGES (TEDS-D) 2019 CODEBOOK Center for Behavioral Health Statistics and Quality Substance Abuse and Mental Health Services Administration
Transcript of 2019 TEDS-D Codebook
TREATMENT EPISODE DATA SET DISCHARGES (TEDS-D)
2019
CODEBOOK
Center for Behavioral Health Statistics and Quality Substance Abuse and Mental Health Services Administration
ii
Acknowledgments This data file was prepared for the Substance Abuse and Mental Health Services Administration (SAMHSA), U.S. Department of Health and Human Services (HHS).
Terms of Use These data are distributed under the following terms of use; by continuing past this page, you signify agreement to comply with the requirements below.
Privacy of Study Respondents Any intentional identification of an individual or organization, or unauthorized disclosure of identifiable information, violates the promise of confidentiality given to the providers of the information. Disclosure of identifiable information may also be punishable under federal law. Therefore, users of data agree to:
Use these data sets solely for research or statistical purposes, and not for investigation or re- identification of specific individuals or organizations.
Make no use of the identity of any individual discovered inadvertently, and report any such discovery to SAMHSA ([email protected]).
Public Domain Notice All material appearing in this document is in the public domain and may be reproduced or copied without permission from SAMHSA. Citation of the source is appreciated. This publication may not be reproduced or distributed for a fee without specific, written authorization of the Office of Communications, SAMHSA, U.S. Department of Health and Human Services.
Recommended Citation Substance Abuse and Mental Health Services Administration, Treatment Episode Data Set (TEDS) Discharges, 2019. Rockville, MD: Substance Abuse and Mental Health Services Administration, 2021.
Authors who use these data are encouraged to send citations of their publications to SAMHSA for inclusion in a database of related work ([email protected]).
Disclaimers Data users acknowledge that SAMHSA and Eagle Technologies, Inc., bear no responsibility for use of the data or for interpretations or inferences based upon such uses.
SAMHSA complies with applicable federal civil rights laws and does not discriminate on the basis of race, color, national origin, age, disability, or sex. SAMHSA cumple con las leyes federales de derechos civiles aplicables y no discrimina por motivos de raza, color, nacionalidad, edad, discapacidad o sexo.
iii
Violations If SAMHSA determines this terms of use agreement has been violated, possible sanctions include:
● report of the violation to the Research Integrity Officer, Institutional Review Board, or Human Subjects Review Committee of the user’s institution;
● report of the violation to the Federal Office for Human Research Protections, if the confidentiality of human subjects has been violated;
● report of the violation of federal law to the United States Attorney General for possible prosecution; and
● court-awarded payments of damages to any individual(s) or organization(s) harmed by the breach of confidential data.
1
TREATMENT EPISODE DATA SET — DISCHARGES (TEDS-D), 2019
Introduction to TEDS The Treatment Episode Data Set (TEDS) system serves as a repository of treatment data routinely collected by states for the purposes of monitoring their substance use treatment systems. It is comprised of selected data items from states’ administrative records that are converted to a standardized format which is consistent across all states. These standardized data constitute TEDS.
The TEDS system is comprised of two major components: the admissions data set (TEDS-A) and the discharges data set (TEDS-D). Data for the TEDS-Admissions (TEDS-A) file were first reported in 1992, while data for the TEDS-D were first reported in 2000.
Admissions TEDS-A provides demographic, clinical, and substance use characteristics of admissions to alcohol or drug treatment in facilities that report to state administrative data systems. The unit of analysis is treatment admissions to state-licensed or certified substance use treatment centers that receive federal public funding.
TEDS-A has two parts: a minimum data set and a supplemental data set. The former is collected by all states; the latter is collected by some.
The minimum data set consists of 19 items that include:
● demographic information;
● primary, secondary, and tertiary substances used by the subject, and their route of administration, frequency of use, and age at first use;
● source of referral to treatment;
● number of prior treatment episodes; and
● service type, including planned use of medication-assisted (i.e., methadone, buprenorphine, or naltrexone) opioid therapy.
TEDS-A’s supplemental data set includes 15 psychiatric, social, and economic items.
2
Discharges The second major component of the TEDS system, TEDS-D (consisting of discharge records), includes the same variables as the admissions (TEDS-A) component, with the addition of:
● type of service at discharge,
● length of stay, and
● reason for discharge or discontinuation of service. Management of TEDS Since 1992, the Center for Behavioral Health Statistics and Quality, or CBHSQ (known until 2010 as the Office of Applied Studies, or OAS), of the Substance Abuse and Mental Health Services Administration (SAMHSA), U.S. Department of Health and Human Services (DHHS), has funded and been responsible for TEDS. CBHSQ coordinates and manages the collection of TEDS data from U.S. states, territories, and Compact of Free Association (COFA) partners.
CBHSQ also develops descriptive and analytical reports from TEDS to provide national and state- level data on the number and types of clients treated, as well as the characteristics of facilities providing services.
Purpose This codebook provides background for the TEDS files, as well as descriptive information for the variables, frequencies of their values, and limitations of the data. For detailed documentation regarding data collected in each state as they correspond to the TEDS data elements, including state-by-state descriptions of exceptions or anomalies in reporting practices, refer to the TEDS Crosswalks available from SAMHSA. The crosswalks are frequently updated as new information becomes available.
Contents of This Codebook and Data Set This codebook corresponds to “Treatment Episode Data Set — Discharges (TEDS-D), 2019.” This data set contains records of TEDS discharges from substance use treatment that occurred in 2019.
Note that this codebook corresponds to a public use file for TEDS-D, which consists of data characterizing treatment episodes that were recorded at the time of discharge.
A full list of the variables that appear in this data set may be found in Appendix A of this codebook. Please note that none of the variables in this data set are weighted, nor are the frequencies for their values as listed in the Variable Descriptions and Frequencies section.

3
Universe The universe for this public use file is TEDS discharges in calendar year 2019 that were received and processed through November 3, 2020. These discharges were linked to either new admissions or transfers to treatment in another service type.
Data Collection For a complete, detailed description of how states are instructed to process and submit TEDS data, consult the Combined Substance Abuse and Mental Health Treatment Episode Data Set (TEDS) State Instruction Manual and the Data Submission System (DSS) State User Manual available from the SAMHSA website.
Confidentiality Protection Several measures are taken to protect the confidentiality of the TEDS records. Variables that potentially identify an individual in their raw form undergo routine top- or bottom-coding in order to prevent high and low values from distinguishing a respondent’s record. For example, age as a continuous variable has the potential to identify both the youngest and oldest participants in a public release file. For this reason, age is recoded into 11 categories for the public use file to reduce disclosure risk. The youngest category for age combines the ages of 12–14 years. Similarly, ages of 65 years and older were top-coded. All the variables recoded are documented in Appendix B.
Disclosure analysis is used to identify records that remained unique after routine measures were taken to protect confidentiality. Disclosure analysis is used to discern combinations of indirect identifiers that potentially link an individual to a record. Records identified are classified as subject to disclosure risk using a combination of between seven and eight socio-demographic variables.
In order to satisfy stringent confidentiality standards, data swapping is applied to the TEDS using an algorithm that matches, in the following order, for:
● records in a different state, but within the same Census region and division; or, if a match is not found;
● records outside the Census division; or, if still no match is found,
● records from outside the Census region.
If a parallel record is still not found, the combination of socio-demographic characteristics against which to match another record is reduced to between six and seven variables, and the process is repeated until a match is found and swap achieved.
Data swapping is implemented to de-identify records in TEDS. This method has several benefits over other disclosure protection options: (1) the overall impact to the data is typically small; (2) nearly all of the data are left intact; (3) data for special populations (e.g., minorities, pregnant women) are no more impacted than other data; (4) the procedures typically do not affect any analytic uses of the file; and (5) the procedures allow greater detail to remain on the public use file (e.g., the original ethnicity codes).
The statistical disclosure control (SDC) method employed for TEDS manages disclosure risk below a tolerable risk threshold while ensuring high-utility, high-quality statistical data.
4
Coverage The TEDS attempts to include all admissions to providers receiving public funding. Because each state or jurisdiction decides the TEDS eligibility of a provider, there is no independent check on the actual sources of funding. Although SAMHSA requests that states submit data on all admissions to any publicly funded treatment facility, reporting in some state agencies is structured so that only clients treated with public funds are included in the TEDS. The number and characteristics of clients in these facilities whose treatment is not publicly funded is unknown.
Data Limitations The TEDS, while comprising a significant proportion of all admissions to substance use treatment, does not include all such admissions. The TEDS is a compilation of facility data from state administrative systems. The scope of facilities included in the TEDS is affected by differences in state licensure, certification, accreditation, and disbursement of public funds.
For example, some state substance abuse agencies regulate private facilities and individual practitioners, while others do not. In some states, hospital-based substance use treatment facilities are not licensed through the state substance abuse agency. Some state substance abuse agencies track treatment in correctional facilities (state prisons and local jails), while others do not.
In general, facilities reporting TEDS data receive state alcohol and/or drug agency funds (including federal block grant funds) for the provision of alcohol and/or drug treatment services. Most states are able to report all admissions to all eligible facilities, although some report only admissions financed by public funds. States may report data from facilities that do not receive public funds, but generally do not because of the difficulty in obtaining data from these facilities. The TEDS generally does not include data on facilities operated by federal agencies, including the Bureau of Prisons, the Department of Defense, and the Department of Veterans Affairs. However, some facilities operated by the Indian Health Service are included.
The primary goal of TEDS is to monitor the characteristics of treatment episodes for substance users. Implicit in the concept of treatment is a planned, continuing treatment regimen. Thus, the TEDS does not include early intervention programs; these are considered to be prevention programs. Crisis intervention facilities such as sobering-up stations and hospital emergency departments are not included in the TEDS.
The TEDS is a large and powerful data set. Like all data sets, however, care must be taken that interpretation does not extend beyond the limitations of the data. Limitations fall into two broad categories: those related to the scope of the data collection system, and those related to the difficulties of aggregating data from highly diverse state data collection systems.
5
Limitations to be kept in mind while analyzing TEDS data include:
● The number and client mix of TEDS records depends, to some extent, on external factors, including the availability of public funds. In states with higher funding levels, a larger percentage of the substance-using population may be admitted to treatment, including the less severely impaired and the less economically disadvantaged.
● The primary, secondary, and tertiary substances of use reported to the TEDS are those substances that led to the treatment episode, and not necessarily a complete enumeration of all drugs used at the time of admission.
● The way an admission is defined may vary from state to state such that the absolute number of admissions is not a valid measure for comparing states.
● States continually review the quality of their data processing. As systematic errors are identified, revisions may be enacted in historical TEDS data files. While this system improves the data set over time, reported historical statistics may change slightly from year to year.
● States vary in the extent to which coercion plays a role in referral to treatment. This variation derives from criminal justice practices and differing concentrations of user subpopulations.
● Public funding constraints may direct states to selectively target special populations—pregnant women or adolescents, for example.
● Many states submit records that include multiple admissions for the same client. Therefore, any statistics derived from the data will represent admissions, not clients. It is possible for clients to have multiple initial admissions within a state—and even within providers that have multiple treatment sites within the state. A few states uniquely identify clients at the state-level; several more are attempting to achieve this level of client identification. The TEDS provides a good national snapshot of what is seen at admission to treatment, but is currently unable to follow individual clients through a sequence of treatment episodes.
● The TEDS distinguishes between transfer admissions and initial admissions. Transfers are admissions of clients transferred for distinct services within an episode of treatment. Only initial admissions are included in the public use files.
● Some states have no opioid treatment programs (OTPs) that provide medication-assisted therapy using methadone, buprenorphine, or naltrexone. Consult the TEDS state crosswalks for information regarding data collected by each state.
6
Created Variables The TEDS files contain several variables created from the original variables submitted by the states. For example, a variable was created to indicate whether a given drug was recorded as an admission’s primary, secondary, or tertiary drug of use. These are called flag variables. Their names and labels reflect the drug in question: alcflg for alcohol flag variable, cokeflg for cocaine flag, etc.
Some variables in the TEDS reports are created by combining or recoding original variables submitted by states. A Technical Note is provided in Appendix C detailing how these variables are derived.
Formats Available for This Public Use File The TEDS public use files are provided in SAS, SPSS, Stata, R, and ASCII comma-delimited formats.
7
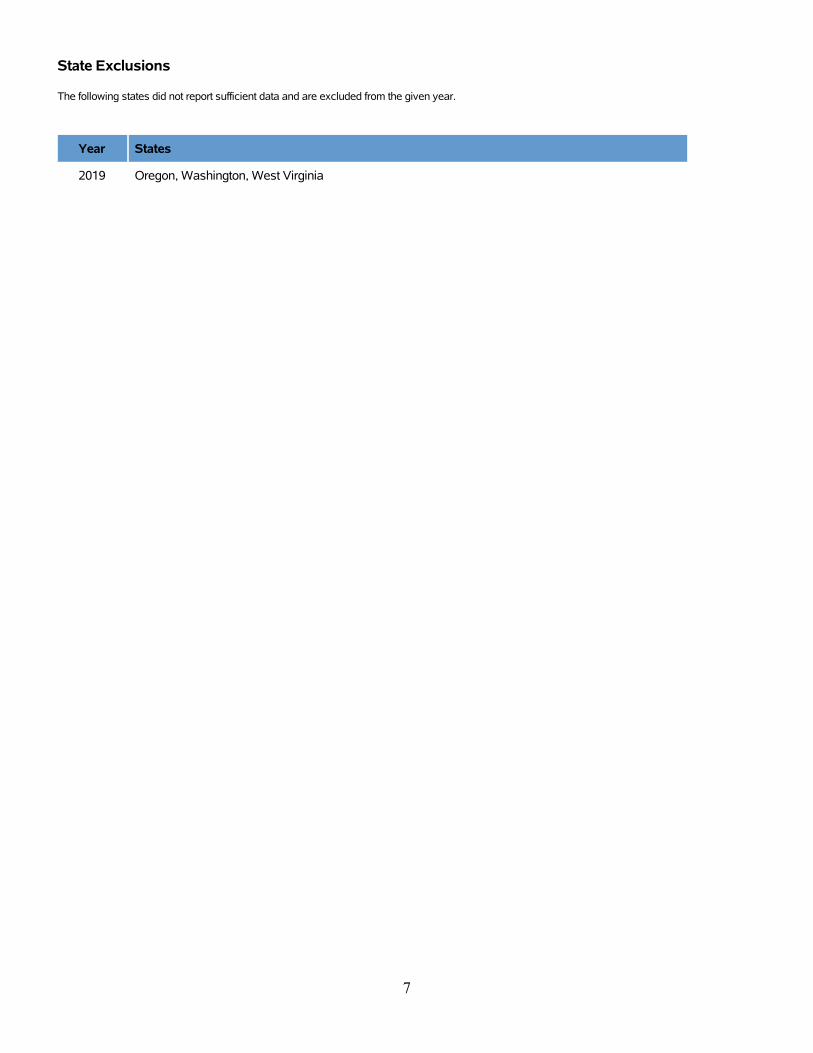
State Exclusions
The following states did not report sufficient data and are excluded from the given year.
Year States
2019 Oregon, Washington, West Virginia
8
Variable Descriptions and Frequencies
9
CASEID: Case identification number
Program generated case (record) identifier.
A frequency distribution of this variable is not shown; each case has a unique value generated for identification purposes.
Width: 11; Decimal: 0
Variable Type: numeric
10
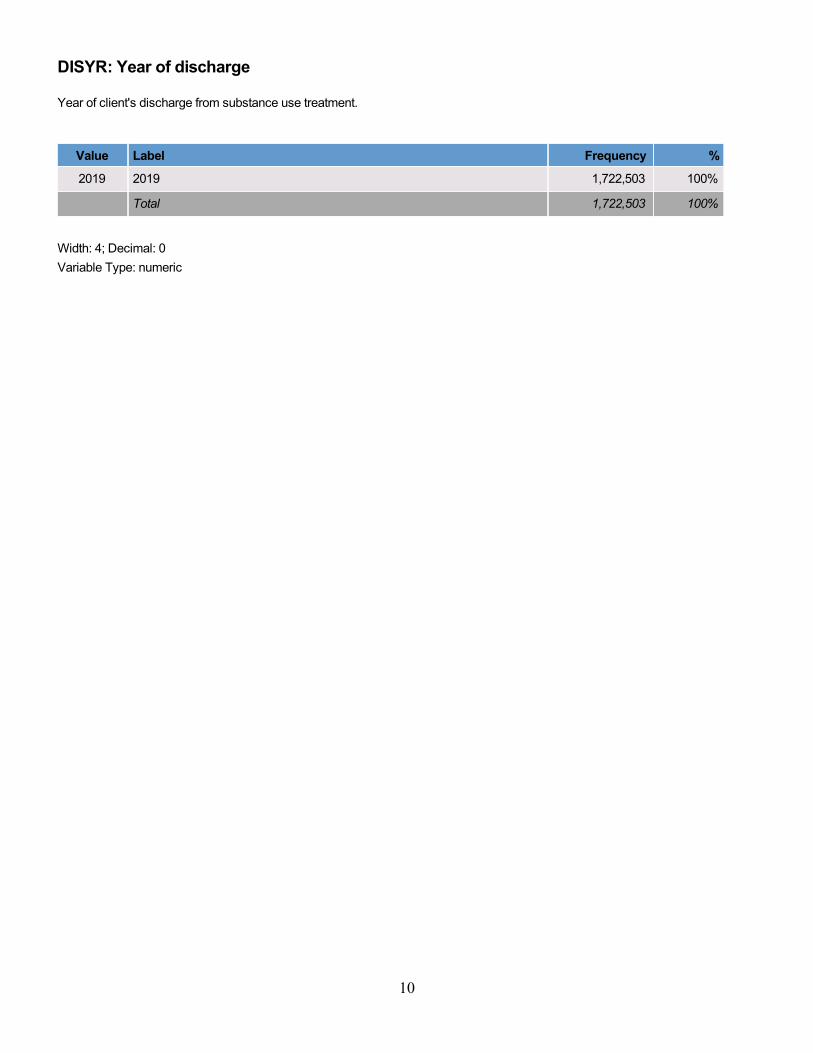
DISYR: Year of discharge
Year of client's discharge from substance use treatment.
Value Label Frequency %
2019 2019 1,722,503 100%
Total 1,722,503 100%
Width: 4; Decimal: 0
Variable Type: numeric
11
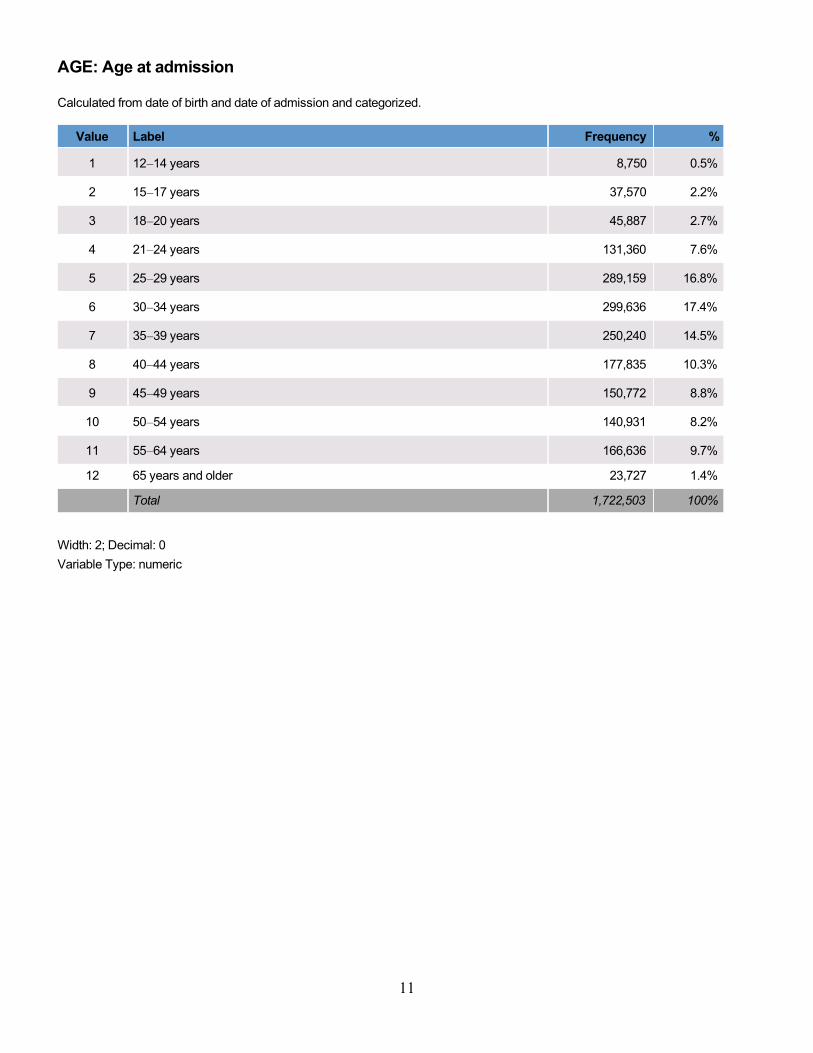
AGE: Age at admission
Calculated from date of birth and date of admission and categorized.
Value Label Frequency %
1 12–14 years 8,750 0.5%
2 15–17 years 37,570 2.2%
3 18–20 years 45,887 2.7%
4 21–24 years 131,360 7.6%
5 25–29 years 289,159 16.8%
6 30–34 years 299,636 17.4%
7 35–39 years 250,240 14.5%
8 40–44 years 177,835 10.3%
9 45–49 years 150,772 8.8%
10 50–54 years 140,931 8.2%
11 55–64 years 166,636 9.7%
12 65 years and older 23,727 1.4%
Total 1,722,503 100%
Width: 2; Decimal: 0
Variable Type: numeric
12
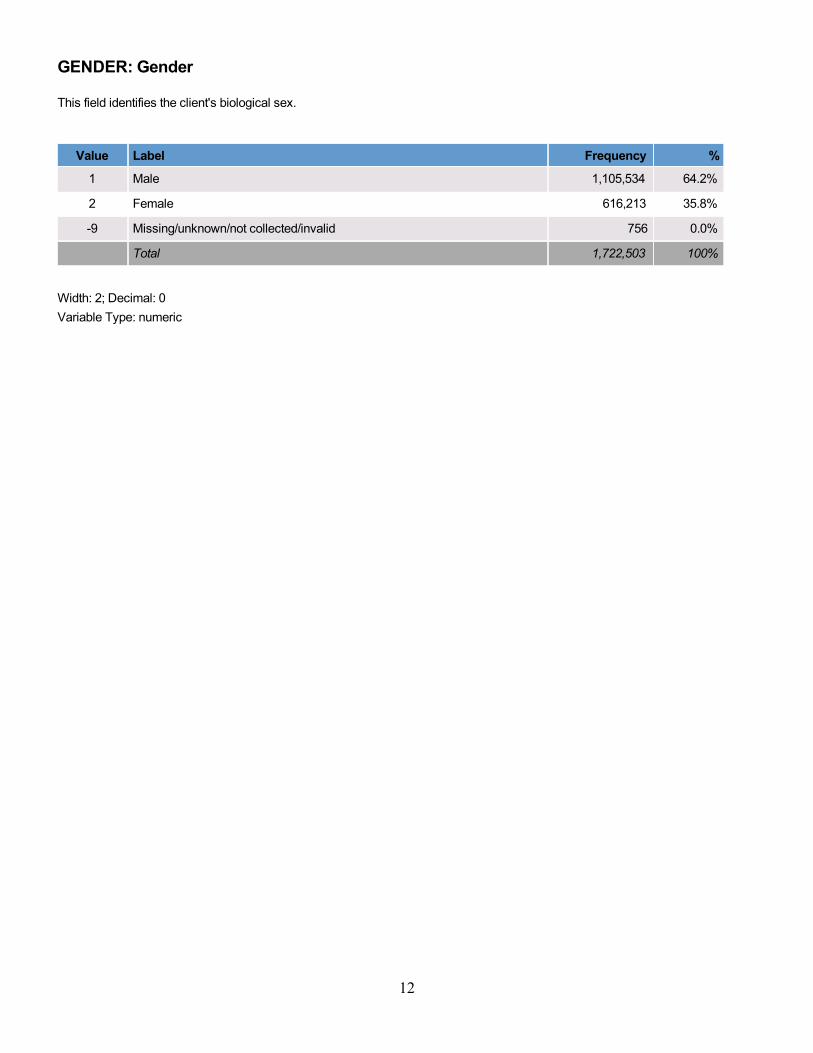
GENDER: Gender
This field identifies the client's biological sex.
Value Label Frequency %
1 Male 1,105,534 64.2%
2 Female 616,213 35.8%
-9 Missing/unknown/not collected/invalid 756 0.0%
Total 1,722,503 100%
Width: 2; Decimal: 0
Variable Type: numeric
13
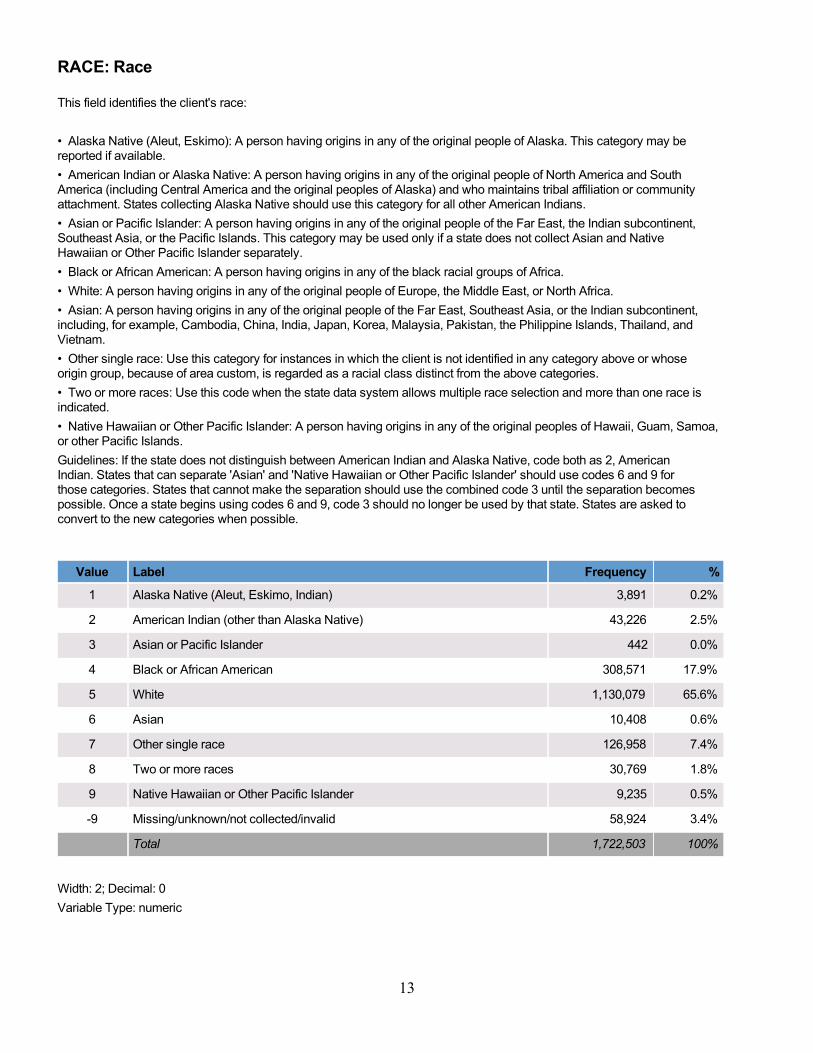
RACE: Race
This field identifies the client's race:
• Alaska Native (Aleut, Eskimo): A person having origins in any of the original people of Alaska. This category may bereported if available.
• American Indian or Alaska Native: A person having origins in any of the original people of North America and SouthAmerica (including Central America and the original peoples of Alaska) and who maintains tribal affiliation or communityattachment. States collecting Alaska Native should use this category for all other American Indians.
• Asian or Pacific Islander: A person having origins in any of the original people of the Far East, the Indian subcontinent,Southeast Asia, or the Pacific Islands. This category may be used only if a state does not collect Asian and NativeHawaiian or Other Pacific Islander separately.
• Black or African American: A person having origins in any of the black racial groups of Africa.
• White: A person having origins in any of the original people of Europe, the Middle East, or North Africa.
• Asian: A person having origins in any of the original people of the Far East, Southeast Asia, or the Indian subcontinent,including, for example, Cambodia, China, India, Japan, Korea, Malaysia, Pakistan, the Philippine Islands, Thailand, andVietnam.
• Other single race: Use this category for instances in which the client is not identified in any category above or whoseorigin group, because of area custom, is regarded as a racial class distinct from the above categories.
• Two or more races: Use this code when the state data system allows multiple race selection and more than one race isindicated.
• Native Hawaiian or Other Pacific Islander: A person having origins in any of the original peoples of Hawaii, Guam, Samoa,or other Pacific Islands.
Guidelines: If the state does not distinguish between American Indian and Alaska Native, code both as 2, AmericanIndian. States that can separate 'Asian' and 'Native Hawaiian or Other Pacific Islander' should use codes 6 and 9 forthose categories. States that cannot make the separation should use the combined code 3 until the separation becomespossible. Once a state begins using codes 6 and 9, code 3 should no longer be used by that state. States are asked toconvert to the new categories when possible.
Value Label Frequency %
1 Alaska Native (Aleut, Eskimo, Indian) 3,891 0.2%
2 American Indian (other than Alaska Native) 43,226 2.5%
3 Asian or Pacific Islander 442 0.0%
4 Black or African American 308,571 17.9%
5 White 1,130,079 65.6%
6 Asian 10,408 0.6%
7 Other single race 126,958 7.4%
8 Two or more races 30,769 1.8%
9 Native Hawaiian or Other Pacific Islander 9,235 0.5%
-9 Missing/unknown/not collected/invalid 58,924 3.4%
Total 1,722,503 100%
Width: 2; Decimal: 0
Variable Type: numeric
14
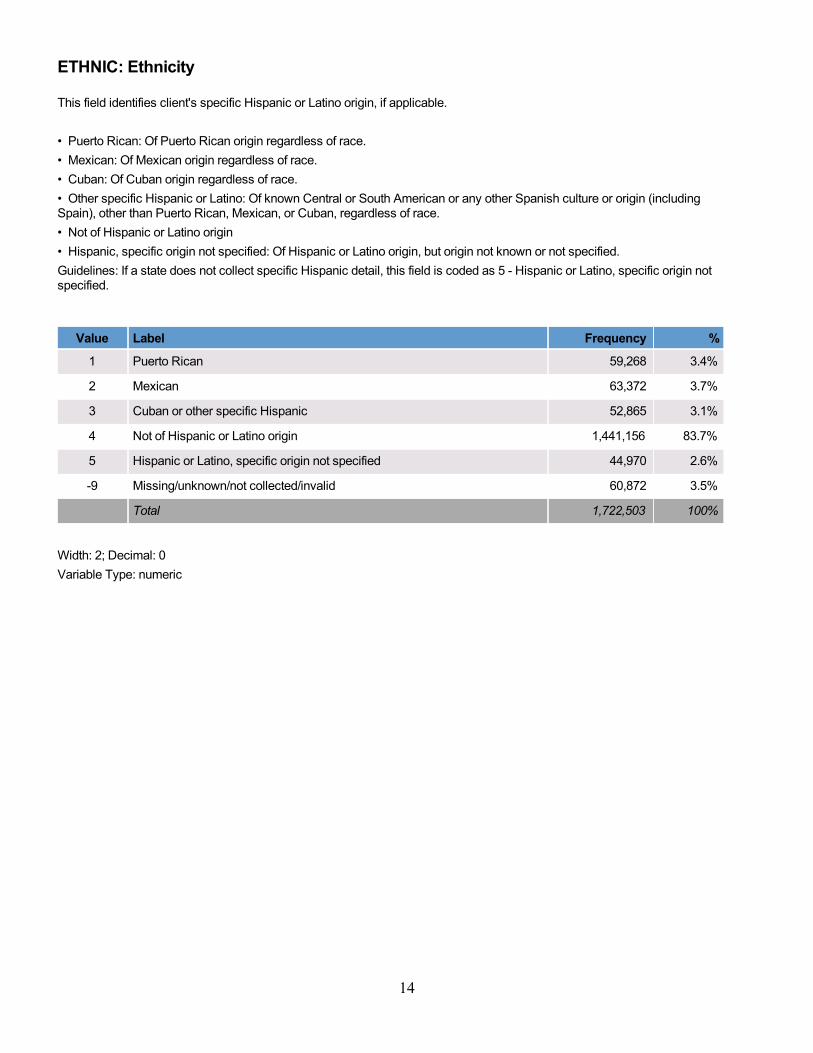
ETHNIC: Ethnicity
This field identifies client's specific Hispanic or Latino origin, if applicable.
• Puerto Rican: Of Puerto Rican origin regardless of race.
• Mexican: Of Mexican origin regardless of race.
• Cuban: Of Cuban origin regardless of race.
• Other specific Hispanic or Latino: Of known Central or South American or any other Spanish culture or origin (includingSpain), other than Puerto Rican, Mexican, or Cuban, regardless of race.
• Not of Hispanic or Latino origin
• Hispanic, specific origin not specified: Of Hispanic or Latino origin, but origin not known or not specified.
Guidelines: If a state does not collect specific Hispanic detail, this field is coded as 5 - Hispanic or Latino, specific origin notspecified.
Value Label Frequency %
1 Puerto Rican 59,268 3.4%
2 Mexican 63,372 3.7%
3 Cuban or other specific Hispanic 52,865 3.1%
4 Not of Hispanic or Latino origin 1,441,156 83.7%
5 Hispanic or Latino, specific origin not specified 44,970 2.6%
-9 Missing/unknown/not collected/invalid 60,872 3.5%
Total 1,722,503 100%
Width: 2; Decimal: 0
Variable Type: numeric
15
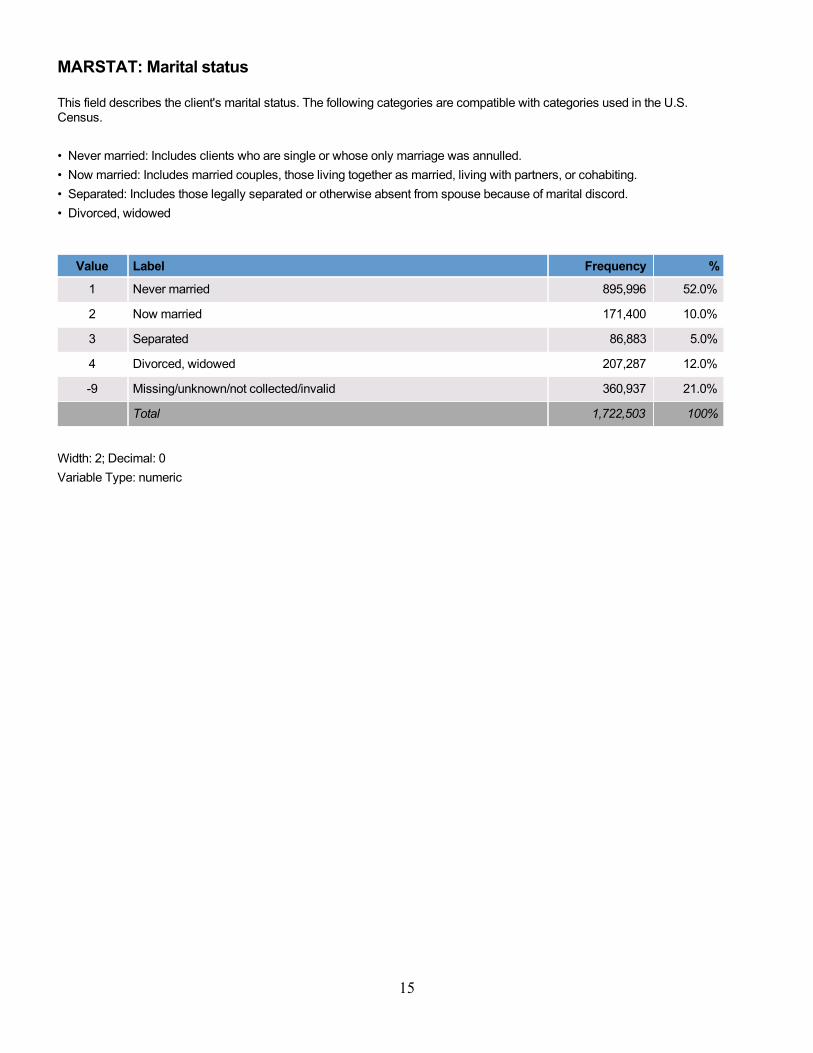
MARSTAT: Marital status
This field describes the client's marital status. The following categories are compatible with categories used in the U.S.Census.
• Never married: Includes clients who are single or whose only marriage was annulled.
• Now married: Includes married couples, those living together as married, living with partners, or cohabiting.
• Separated: Includes those legally separated or otherwise absent from spouse because of marital discord.
• Divorced, widowed
Value Label Frequency %
1 Never married 895,996 52.0%
2 Now married 171,400 10.0%
3 Separated 86,883 5.0%
4 Divorced, widowed 207,287 12.0%
-9 Missing/unknown/not collected/invalid 360,937 21.0%
Total 1,722,503 100%
Width: 2; Decimal: 0
Variable Type: numeric
16
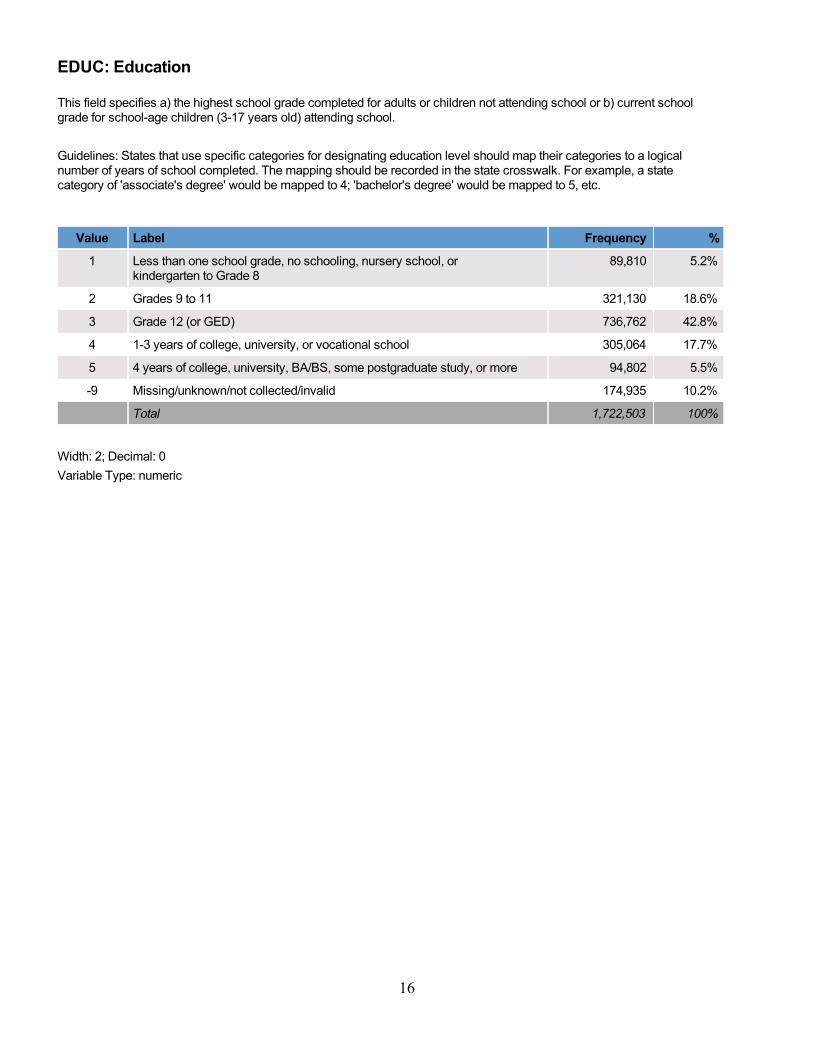
EDUC: Education
This field specifies a) the highest school grade completed for adults or children not attending school or b) current schoolgrade for school-age children (3-17 years old) attending school.
Guidelines: States that use specific categories for designating education level should map their categories to a logicalnumber of years of school completed. The mapping should be recorded in the state crosswalk. For example, a statecategory of 'associate's degree' would be mapped to 4; 'bachelor's degree' would be mapped to 5, etc.
Value Label Frequency %
1 Less than one school grade, no schooling, nursery school, orkindergarten to Grade 8
89,810 5.2%
2 Grades 9 to 11 321,130 18.6%
3 Grade 12 (or GED) 736,762 42.8%
4 1-3 years of college, university, or vocational school 305,064 17.7%
5 4 years of college, university, BA/BS, some postgraduate study, or more 94,802 5.5%
-9 Missing/unknown/not collected/invalid 174,935 10.2%
Total 1,722,503 100%
Width: 2; Decimal: 0
Variable Type: numeric

17
EMPLOY: Employment status at admission
This field identifies the client’s employment status at admission.
• Full-time: Working 35 hours or more each week, including active duty members of the uniformed services.
• Part-time: Working fewer than 35 hours each week.
• Unemployed: Looking for work during the past 30 days or on layoff from a job.
• Not in labor force: Not looking for work during the past 30 days or a student, homemaker, disabled, retired, or an inmateof an institution. Clients in this category are further defined in Detailed Not in Labor Force.
Guidelines: Seasonal workers are coded in this category based on their employment status at the time of admission. Forexample, if they are employed full time at the time of admission, they are coded as 01. If they are not in the labor force atthe time of admission, they are coded 04.
Value Label Frequency %
1 Full-time 279,602 16.2%
2 Part-time 112,728 6.5%
3 Unemployed 634,880 36.9%
4 Not in labor force 542,928 31.5%
-9 Missing/unknown/not collected/invalid 152,365 8.8%
Total 1,722,503 100%
Width: 2; Decimal: 0
Variable Type: numeric
18
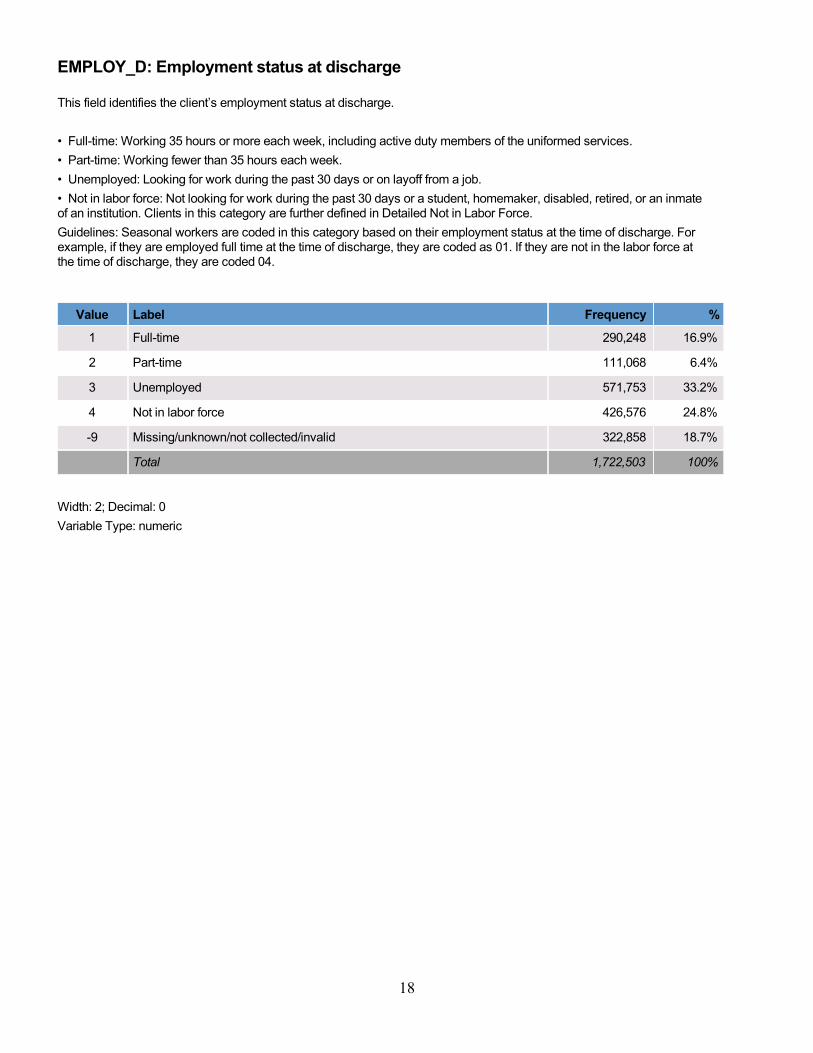
EMPLOY_D: Employment status at discharge
This field identifies the client’s employment status at discharge.
• Full-time: Working 35 hours or more each week, including active duty members of the uniformed services.
• Part-time: Working fewer than 35 hours each week.
• Unemployed: Looking for work during the past 30 days or on layoff from a job.
• Not in labor force: Not looking for work during the past 30 days or a student, homemaker, disabled, retired, or an inmateof an institution. Clients in this category are further defined in Detailed Not in Labor Force.
Guidelines: Seasonal workers are coded in this category based on their employment status at the time of discharge. Forexample, if they are employed full time at the time of discharge, they are coded as 01. If they are not in the labor force atthe time of discharge, they are coded 04.
Value Label Frequency %
1 Full-time 290,248 16.9%
2 Part-time 111,068 6.4%
3 Unemployed 571,753 33.2%
4 Not in labor force 426,576 24.8%
-9 Missing/unknown/not collected/invalid 322,858 18.7%
Total 1,722,503 100%
Width: 2; Decimal: 0
Variable Type: numeric
19
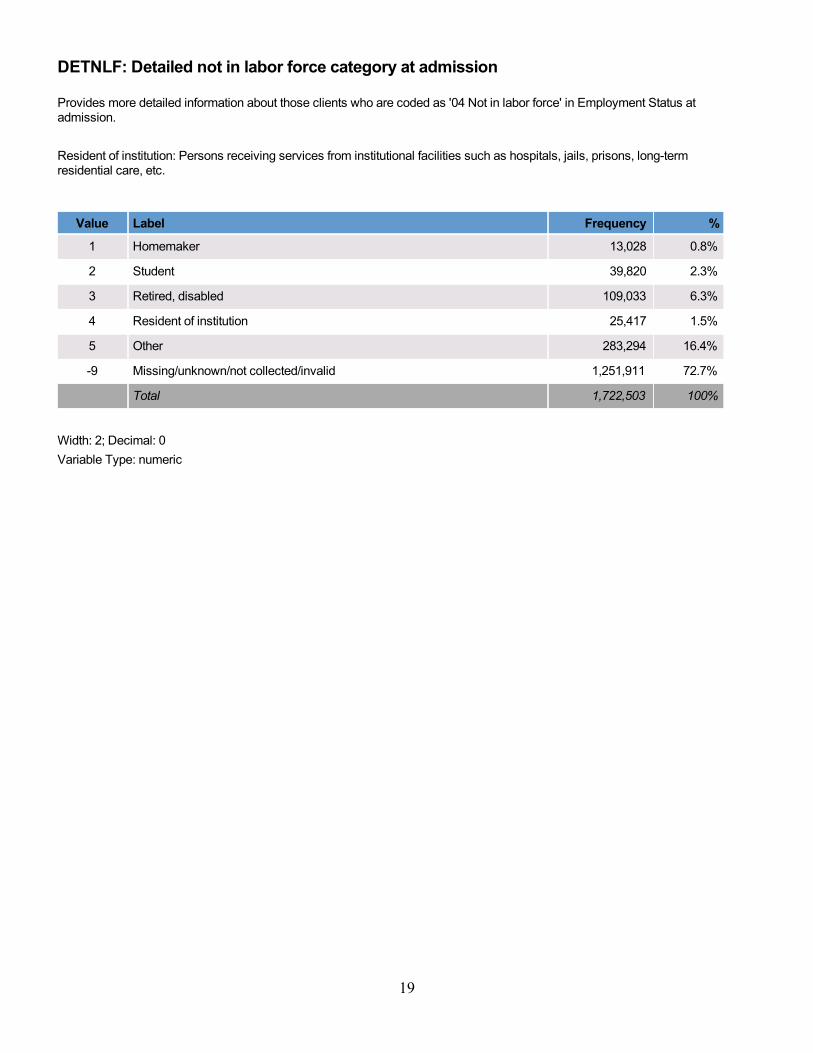
DETNLF: Detailed not in labor force category at admission
Provides more detailed information about those clients who are coded as '04 Not in labor force' in Employment Status atadmission.
Resident of institution: Persons receiving services from institutional facilities such as hospitals, jails, prisons, long-termresidential care, etc.
Value Label Frequency %
1 Homemaker 13,028 0.8%
2 Student 39,820 2.3%
3 Retired, disabled 109,033 6.3%
4 Resident of institution 25,417 1.5%
5 Other 283,294 16.4%
-9 Missing/unknown/not collected/invalid 1,251,911 72.7%
Total 1,722,503 100%
Width: 2; Decimal: 0
Variable Type: numeric
20
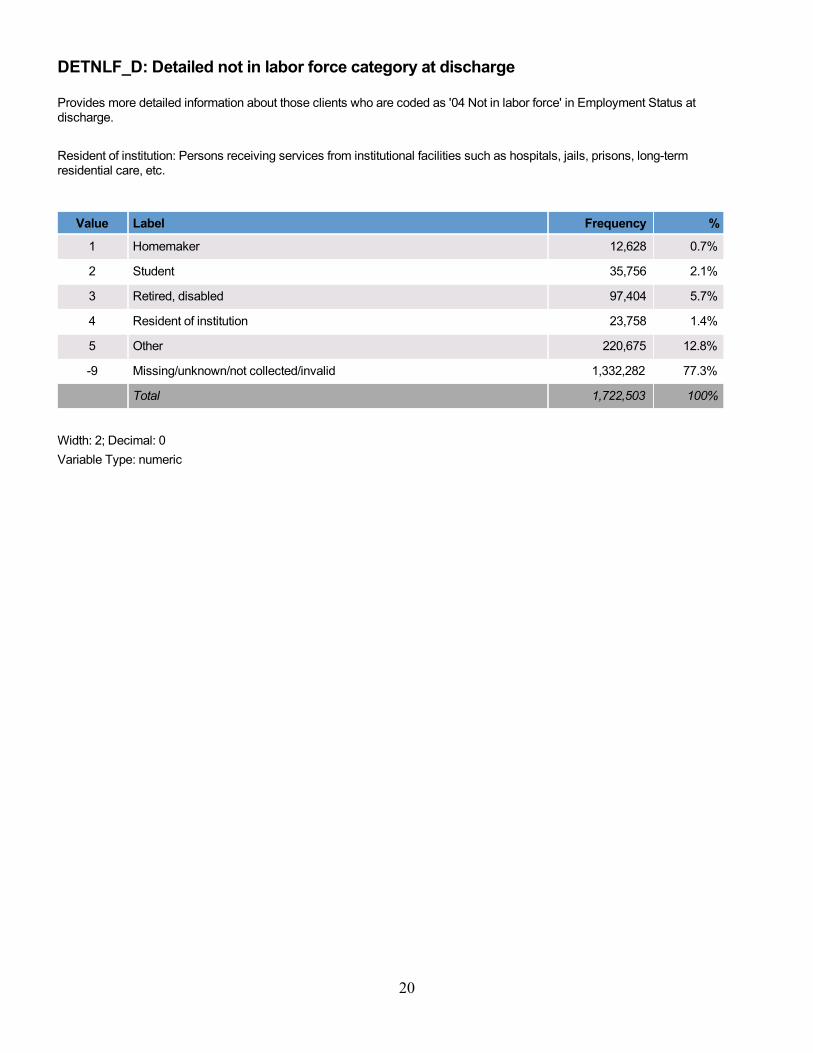
DETNLF_D: Detailed not in labor force category at discharge
Provides more detailed information about those clients who are coded as '04 Not in labor force' in Employment Status atdischarge.
Resident of institution: Persons receiving services from institutional facilities such as hospitals, jails, prisons, long-termresidential care, etc.
Value Label Frequency %
1 Homemaker 12,628 0.7%
2 Student 35,756 2.1%
3 Retired, disabled 97,404 5.7%
4 Resident of institution 23,758 1.4%
5 Other 220,675 12.8%
-9 Missing/unknown/not collected/invalid 1,332,282 77.3%
Total 1,722,503 100%
Width: 2; Decimal: 0
Variable Type: numeric
21
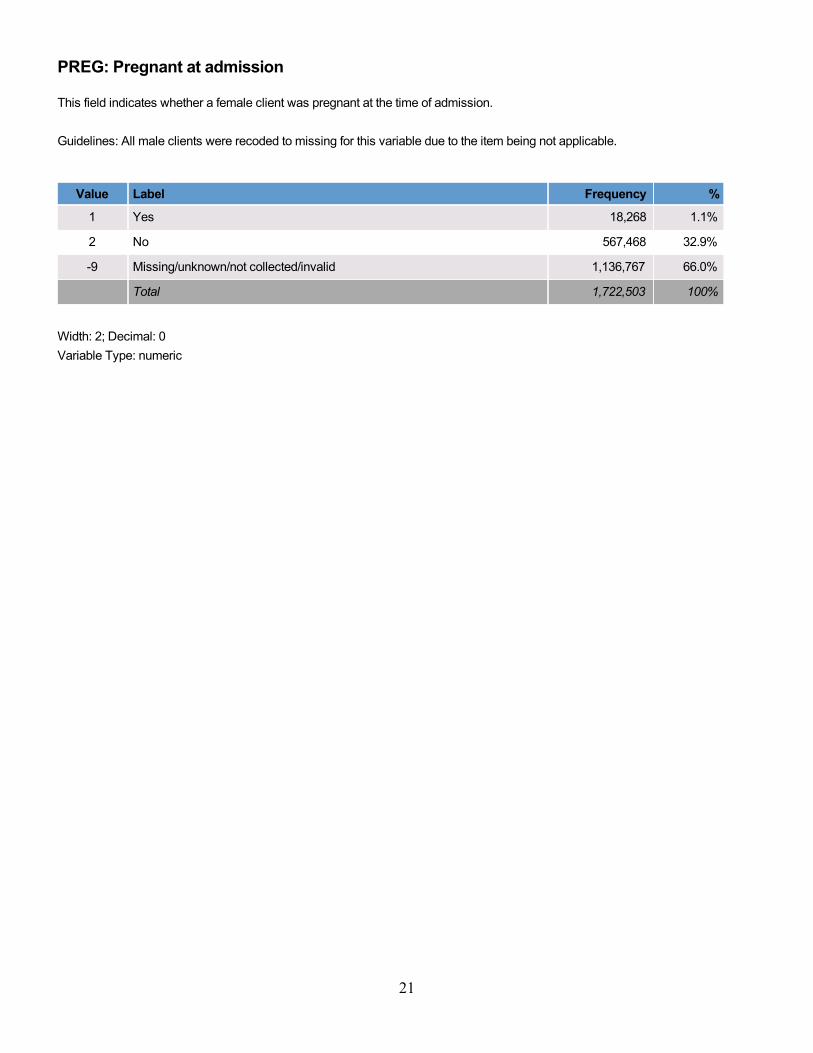
PREG: Pregnant at admission
This field indicates whether a female client was pregnant at the time of admission.
Guidelines: All male clients were recoded to missing for this variable due to the item being not applicable.
Value Label Frequency %
1 Yes 18,268 1.1%
2 No 567,468 32.9%
-9 Missing/unknown/not collected/invalid 1,136,767 66.0%
Total 1,722,503 100%
Width: 2; Decimal: 0
Variable Type: numeric
22
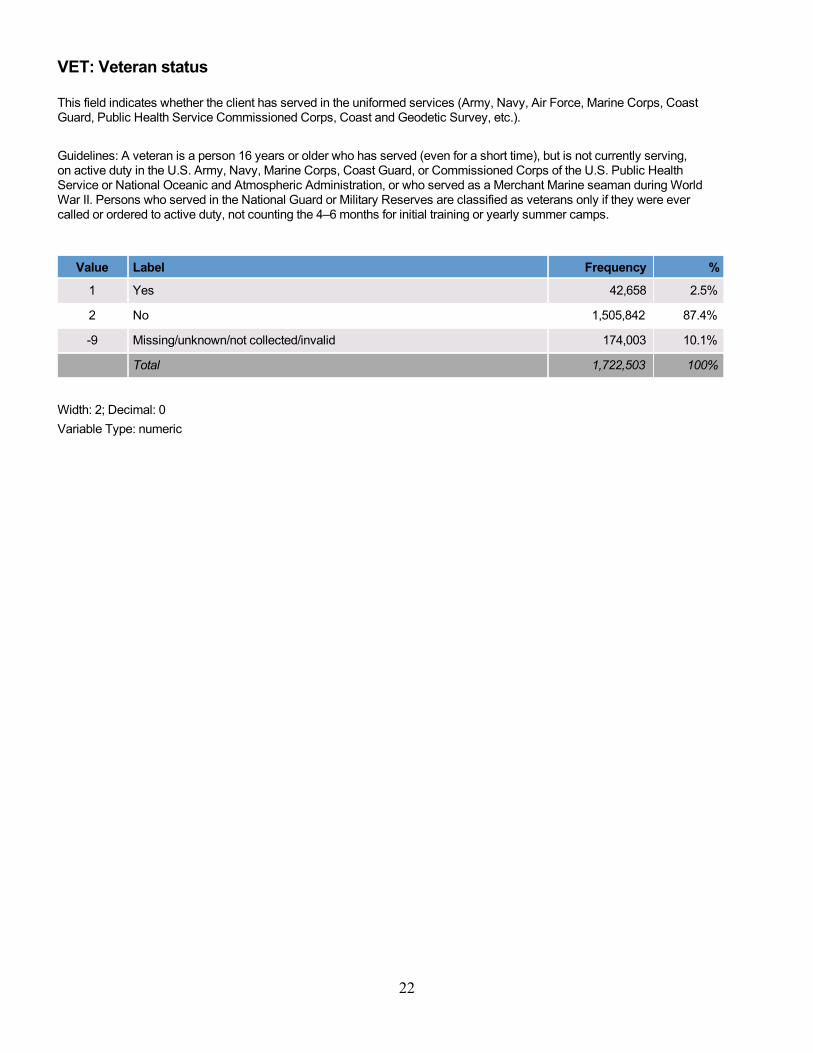
VET: Veteran status
This field indicates whether the client has served in the uniformed services (Army, Navy, Air Force, Marine Corps, CoastGuard, Public Health Service Commissioned Corps, Coast and Geodetic Survey, etc.).
Guidelines: A veteran is a person 16 years or older who has served (even for a short time), but is not currently serving,on active duty in the U.S. Army, Navy, Marine Corps, Coast Guard, or Commissioned Corps of the U.S. Public HealthService or National Oceanic and Atmospheric Administration, or who served as a Merchant Marine seaman during WorldWar II. Persons who served in the National Guard or Military Reserves are classified as veterans only if they were evercalled or ordered to active duty, not counting the 4–6 months for initial training or yearly summer camps.
Value Label Frequency %
1 Yes 42,658 2.5%
2 No 1,505,842 87.4%
-9 Missing/unknown/not collected/invalid 174,003 10.1%
Total 1,722,503 100%
Width: 2; Decimal: 0
Variable Type: numeric
23
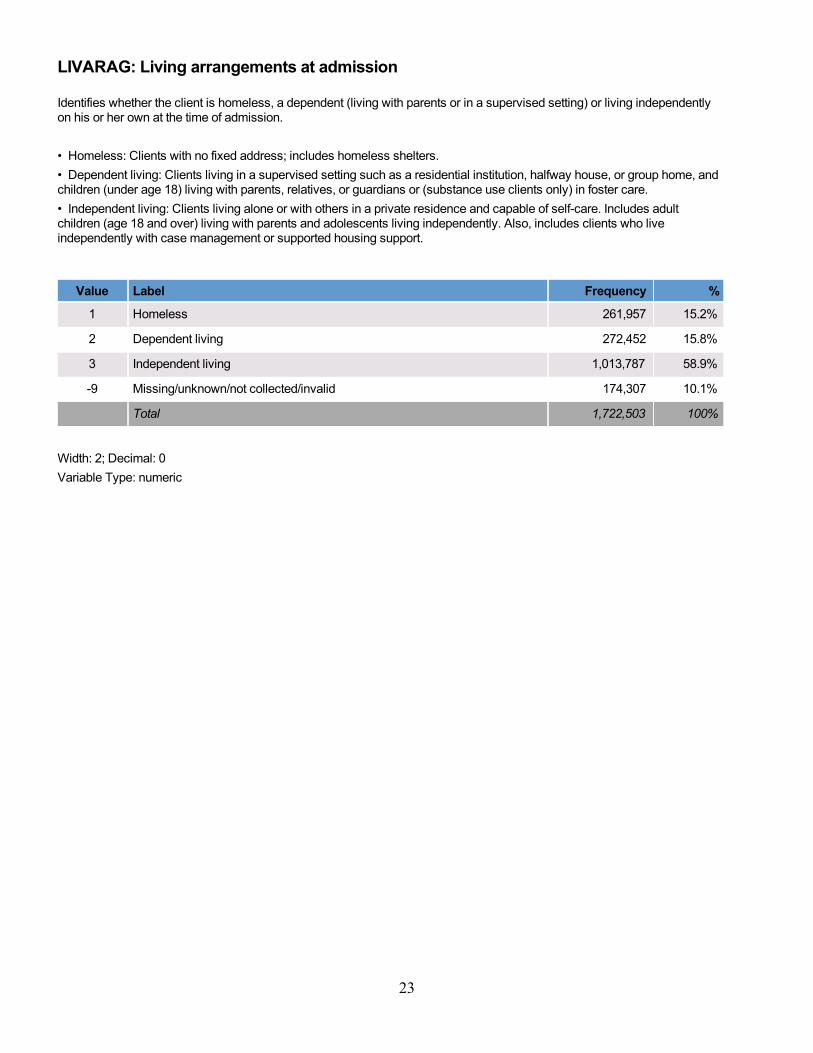
LIVARAG: Living arrangements at admission
Identifies whether the client is homeless, a dependent (living with parents or in a supervised setting) or living independentlyon his or her own at the time of admission.
• Homeless: Clients with no fixed address; includes homeless shelters.
• Dependent living: Clients living in a supervised setting such as a residential institution, halfway house, or group home, andchildren (under age 18) living with parents, relatives, or guardians or (substance use clients only) in foster care.
• Independent living: Clients living alone or with others in a private residence and capable of self-care. Includes adultchildren (age 18 and over) living with parents and adolescents living independently. Also, includes clients who liveindependently with case management or supported housing support.
Value Label Frequency %
1 Homeless 261,957 15.2%
2 Dependent living 272,452 15.8%
3 Independent living 1,013,787 58.9%
-9 Missing/unknown/not collected/invalid 174,307 10.1%
Total 1,722,503 100%
Width: 2; Decimal: 0
Variable Type: numeric
24
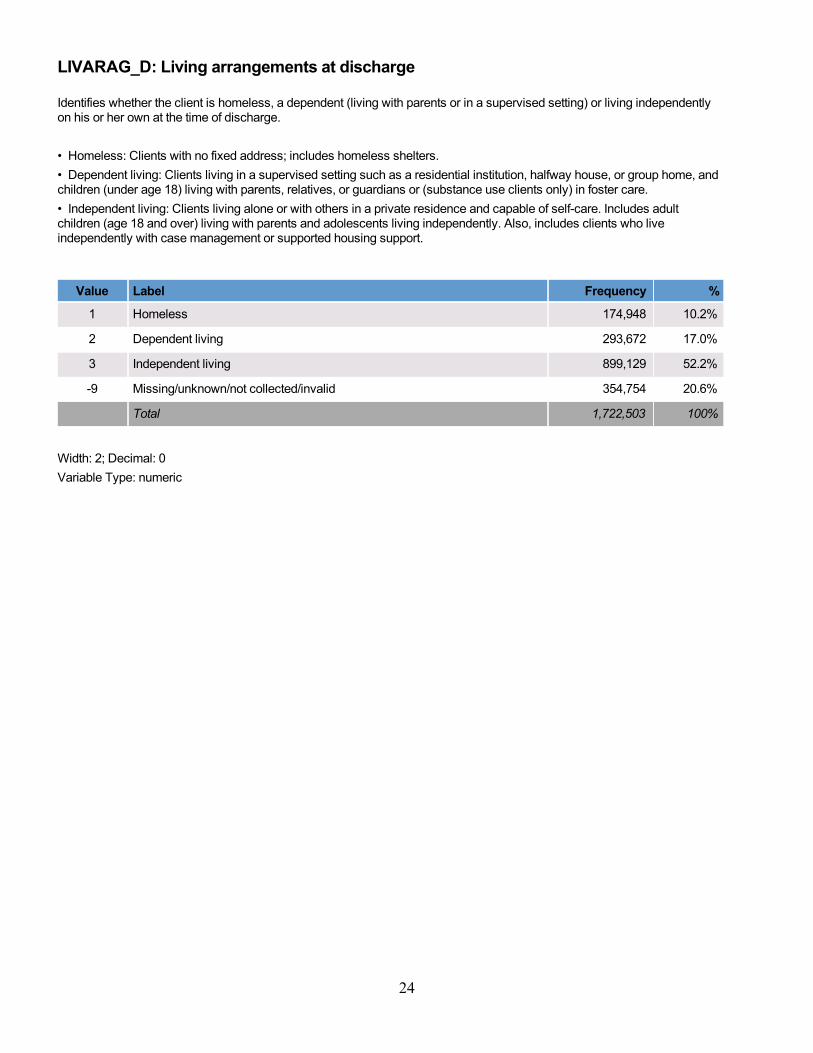
LIVARAG_D: Living arrangements at discharge
Identifies whether the client is homeless, a dependent (living with parents or in a supervised setting) or living independentlyon his or her own at the time of discharge.
• Homeless: Clients with no fixed address; includes homeless shelters.
• Dependent living: Clients living in a supervised setting such as a residential institution, halfway house, or group home, andchildren (under age 18) living with parents, relatives, or guardians or (substance use clients only) in foster care.
• Independent living: Clients living alone or with others in a private residence and capable of self-care. Includes adultchildren (age 18 and over) living with parents and adolescents living independently. Also, includes clients who liveindependently with case management or supported housing support.
Value Label Frequency %
1 Homeless 174,948 10.2%
2 Dependent living 293,672 17.0%
3 Independent living 899,129 52.2%
-9 Missing/unknown/not collected/invalid 354,754 20.6%
Total 1,722,503 100%
Width: 2; Decimal: 0
Variable Type: numeric
25
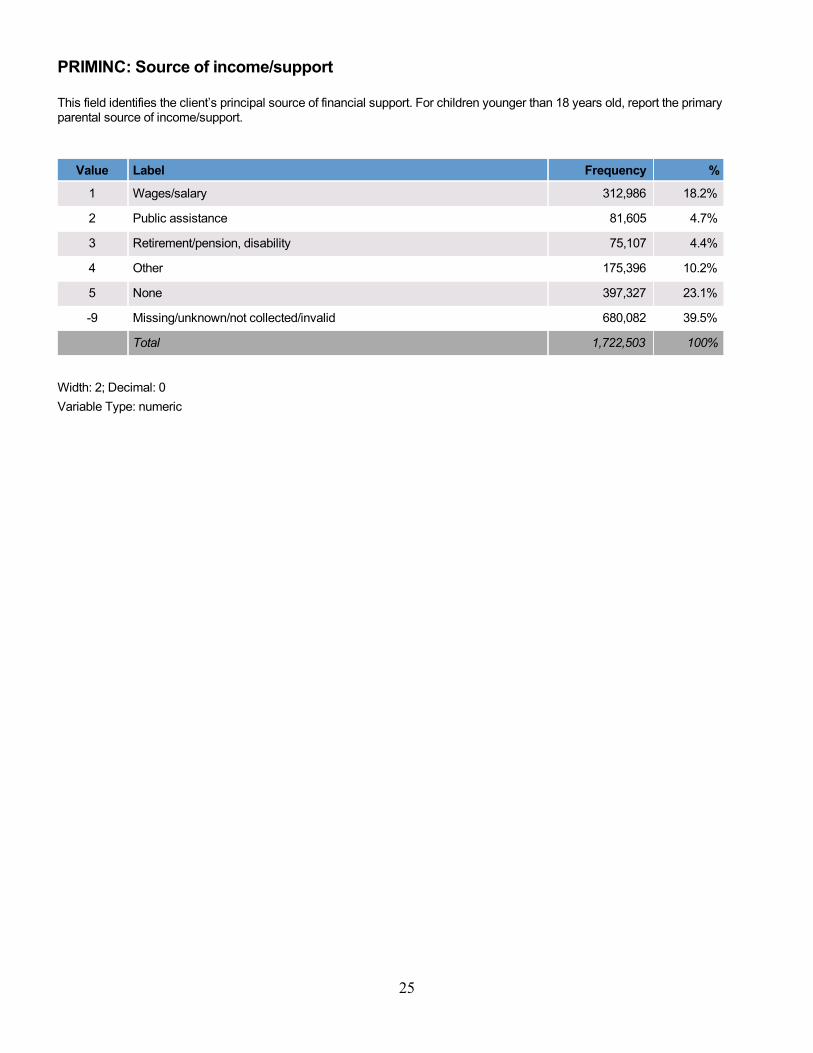
PRIMINC: Source of income/support
This field identifies the client’s principal source of financial support. For children younger than 18 years old, report the primaryparental source of income/support.
Value Label Frequency %
1 Wages/salary 312,986 18.2%
2 Public assistance 81,605 4.7%
3 Retirement/pension, disability 75,107 4.4%
4 Other 175,396 10.2%
5 None 397,327 23.1%
-9 Missing/unknown/not collected/invalid 680,082 39.5%
Total 1,722,503 100%
Width: 2; Decimal: 0
Variable Type: numeric

26
ARRESTS: Arrests in past 30 days prior to admission
Indicates the number of arrests in the 30 days prior to the reference date (i.e., date of admission). This field is intended tocapture the number of times the client was arrested (not the number of charges) for any cause during the reference period.Any formal arrest should be counted, regardless of whether incarceration or conviction resulted.
Guidelines: This field is intended to capture the number of times the client was arrested for any cause during the 30 dayspreceding the date of admission to treatment. Any formal arrest is to be counted regardless of whether incarceration orconviction resulted and regardless of the status of proceedings incident to the arrest at the time of admission.
Value Label Frequency %
0 None 1,418,790 82.4%
1 Once 102,517 6.0%
2 Two or more times 19,080 1.1%
-9 Missing/unknown/not collected/invalid 182,116 10.6%
Total 1,722,503 100%
Width: 2; Decimal: 0
Variable Type: numeric
27
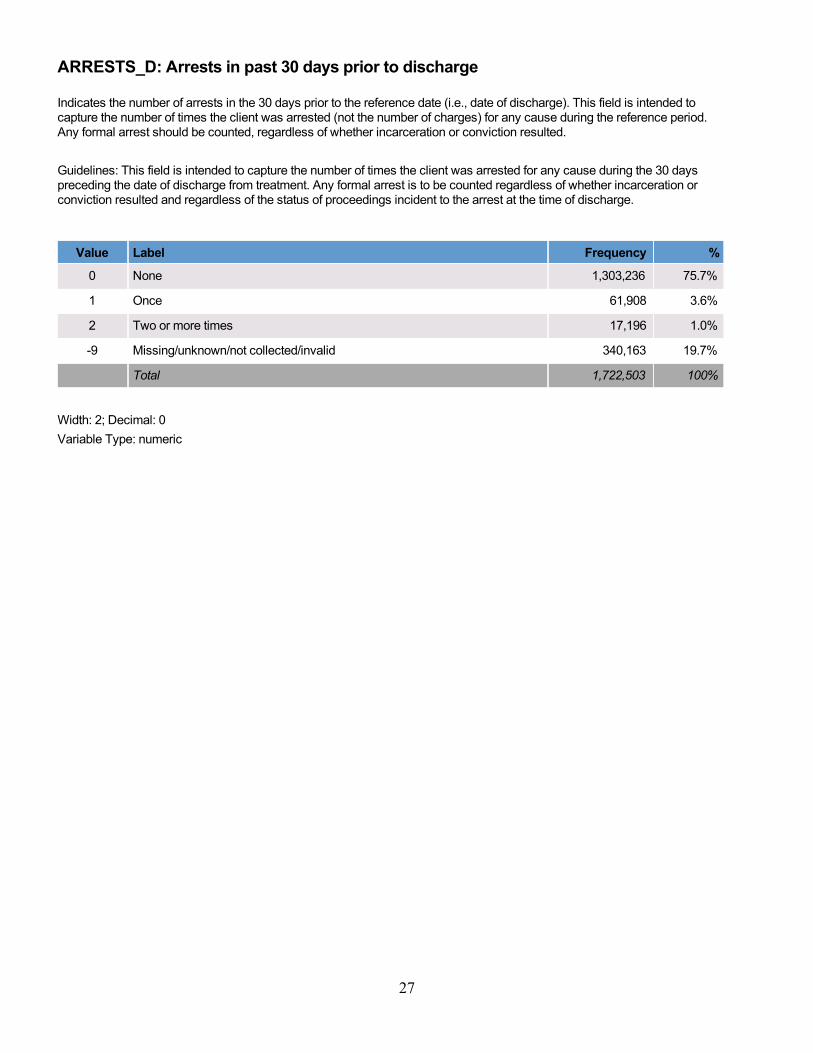
ARRESTS_D: Arrests in past 30 days prior to discharge
Indicates the number of arrests in the 30 days prior to the reference date (i.e., date of discharge). This field is intended tocapture the number of times the client was arrested (not the number of charges) for any cause during the reference period.Any formal arrest should be counted, regardless of whether incarceration or conviction resulted.
Guidelines: This field is intended to capture the number of times the client was arrested for any cause during the 30 dayspreceding the date of discharge from treatment. Any formal arrest is to be counted regardless of whether incarceration orconviction resulted and regardless of the status of proceedings incident to the arrest at the time of discharge.
Value Label Frequency %
0 None 1,303,236 75.7%
1 Once 61,908 3.6%
2 Two or more times 17,196 1.0%
-9 Missing/unknown/not collected/invalid 340,163 19.7%
Total 1,722,503 100%
Width: 2; Decimal: 0
Variable Type: numeric
28
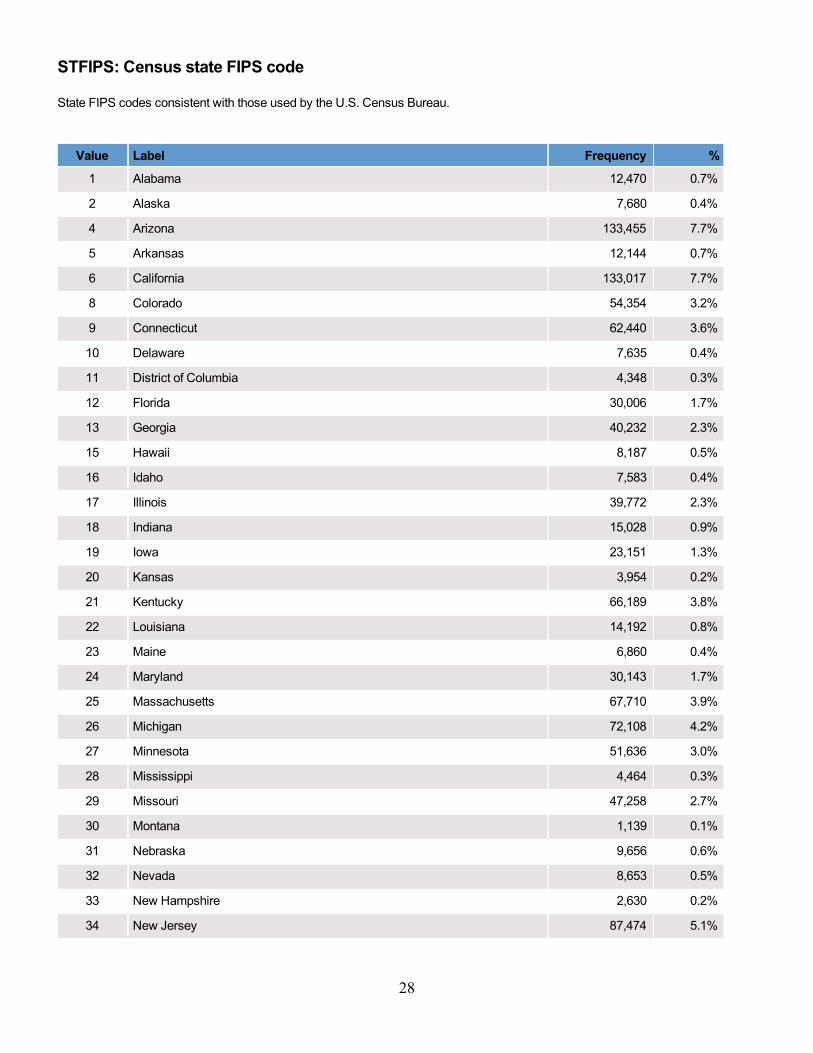
STFIPS: Census state FIPS code
State FIPS codes consistent with those used by the U.S. Census Bureau.
Value Label Frequency %
1 Alabama 12,470 0.7%
2 Alaska 7,680 0.4%
4 Arizona 133,455 7.7%
5 Arkansas 12,144 0.7%
6 California 133,017 7.7%
8 Colorado 54,354 3.2%
9 Connecticut 62,440 3.6%
10 Delaware 7,635 0.4%
11 District of Columbia 4,348 0.3%
12 Florida 30,006 1.7%
13 Georgia 40,232 2.3%
15 Hawaii 8,187 0.5%
16 Idaho 7,583 0.4%
17 Illinois 39,772 2.3%
18 Indiana 15,028 0.9%
19 Iowa 23,151 1.3%
20 Kansas 3,954 0.2%
21 Kentucky 66,189 3.8%
22 Louisiana 14,192 0.8%
23 Maine 6,860 0.4%
24 Maryland 30,143 1.7%
25 Massachusetts 67,710 3.9%
26 Michigan 72,108 4.2%
27 Minnesota 51,636 3.0%
28 Mississippi 4,464 0.3%
29 Missouri 47,258 2.7%
30 Montana 1,139 0.1%
31 Nebraska 9,656 0.6%
32 Nevada 8,653 0.5%
33 New Hampshire 2,630 0.2%
34 New Jersey 87,474 5.1%
29
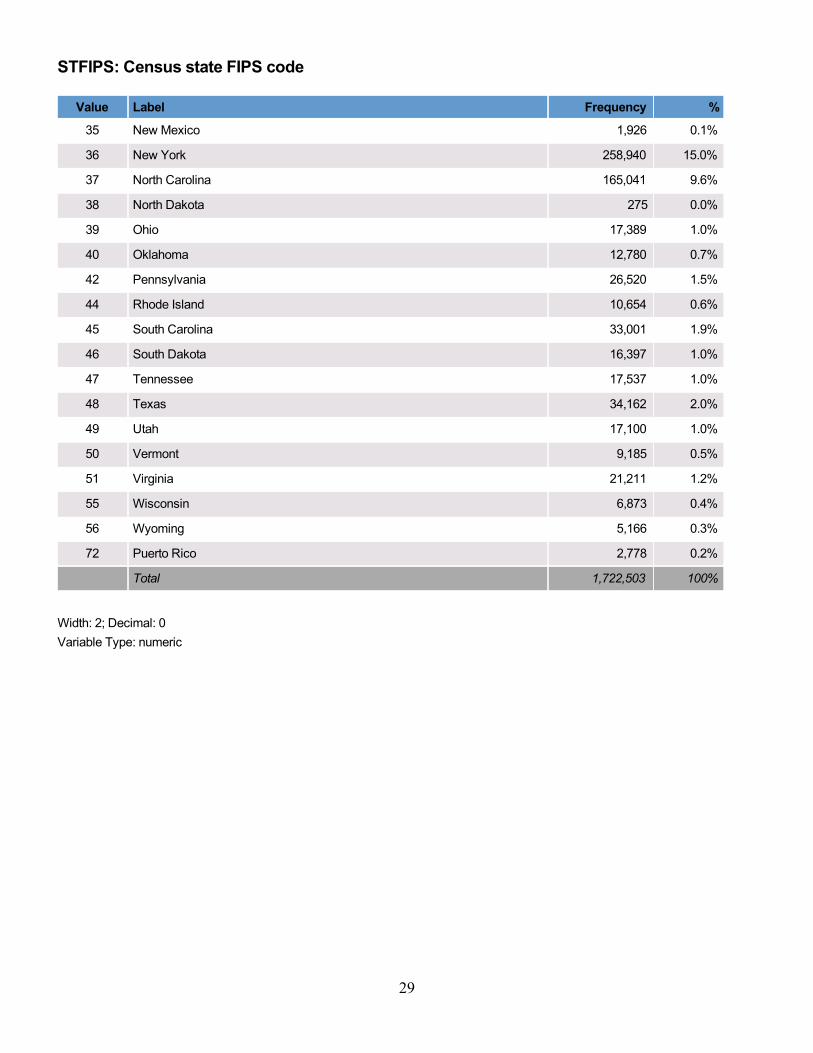
STFIPS: Census state FIPS code
Value Label Frequency %
35 New Mexico 1,926 0.1%
36 New York 258,940 15.0%
37 North Carolina 165,041 9.6%
38 North Dakota 275 0.0%
39 Ohio 17,389 1.0%
40 Oklahoma 12,780 0.7%
42 Pennsylvania 26,520 1.5%
44 Rhode Island 10,654 0.6%
45 South Carolina 33,001 1.9%
46 South Dakota 16,397 1.0%
47 Tennessee 17,537 1.0%
48 Texas 34,162 2.0%
49 Utah 17,100 1.0%
50 Vermont 9,185 0.5%
51 Virginia 21,211 1.2%
55 Wisconsin 6,873 0.4%
56 Wyoming 5,166 0.3%
72 Puerto Rico 2,778 0.2%
Total 1,722,503 100%
Width: 2; Decimal: 0
Variable Type: numeric
30
CBSA2010: CBSA 2010 code
The term 'Core Based Statistical Area' (CBSA) is a collective term for both metro and micro areas. Metropolitan andmicropolitan statistical areas (metro and micro areas) are geographic entities defined by the U.S. Office ofManagement and Budget (OMB) for use by federal statistical agencies in collecting, tabulating, and publishing federalstatistics. A metro area contains a core urban area with a population of at least 50,000, and a micro area contains anurban core with a population of at least 10,000 but less than 50,000. Each metro or micro area consists of one ormore counties and includes the counties containing the core urban area, as well as any adjacent counties that have ahigh degree of social and economic integration (as measured by commuting to work) with the urban core.
Frequencies for this variable are not displayed in the codebook. To view the response categories, please analyze the datafile in the statistical package of your choice (SAS, SPSS, STATA, R, ASCII).
Width: 5; Decimal: 0
Variable Type: numeric
31
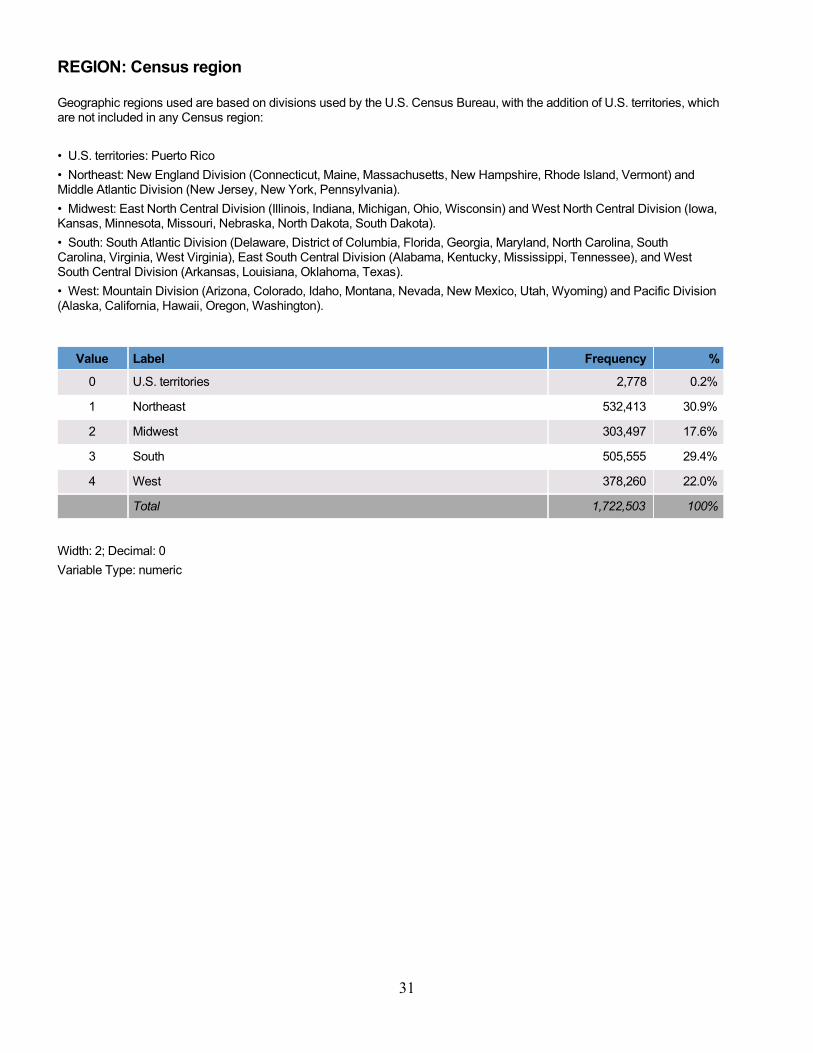
REGION: Census region
Geographic regions used are based on divisions used by the U.S. Census Bureau, with the addition of U.S. territories, whichare not included in any Census region:
• U.S. territories: Puerto Rico
• Northeast: New England Division (Connecticut, Maine, Massachusetts, New Hampshire, Rhode Island, Vermont) andMiddle Atlantic Division (New Jersey, New York, Pennsylvania).
• Midwest: East North Central Division (Illinois, Indiana, Michigan, Ohio, Wisconsin) and West North Central Division (Iowa,Kansas, Minnesota, Missouri, Nebraska, North Dakota, South Dakota).
• South: South Atlantic Division (Delaware, District of Columbia, Florida, Georgia, Maryland, North Carolina, SouthCarolina, Virginia, West Virginia), East South Central Division (Alabama, Kentucky, Mississippi, Tennessee), and WestSouth Central Division (Arkansas, Louisiana, Oklahoma, Texas).
• West: Mountain Division (Arizona, Colorado, Idaho, Montana, Nevada, New Mexico, Utah, Wyoming) and Pacific Division(Alaska, California, Hawaii, Oregon, Washington).
Value Label Frequency %
0 U.S. territories 2,778 0.2%
1 Northeast 532,413 30.9%
2 Midwest 303,497 17.6%
3 South 505,555 29.4%
4 West 378,260 22.0%
Total 1,722,503 100%
Width: 2; Decimal: 0
Variable Type: numeric
32
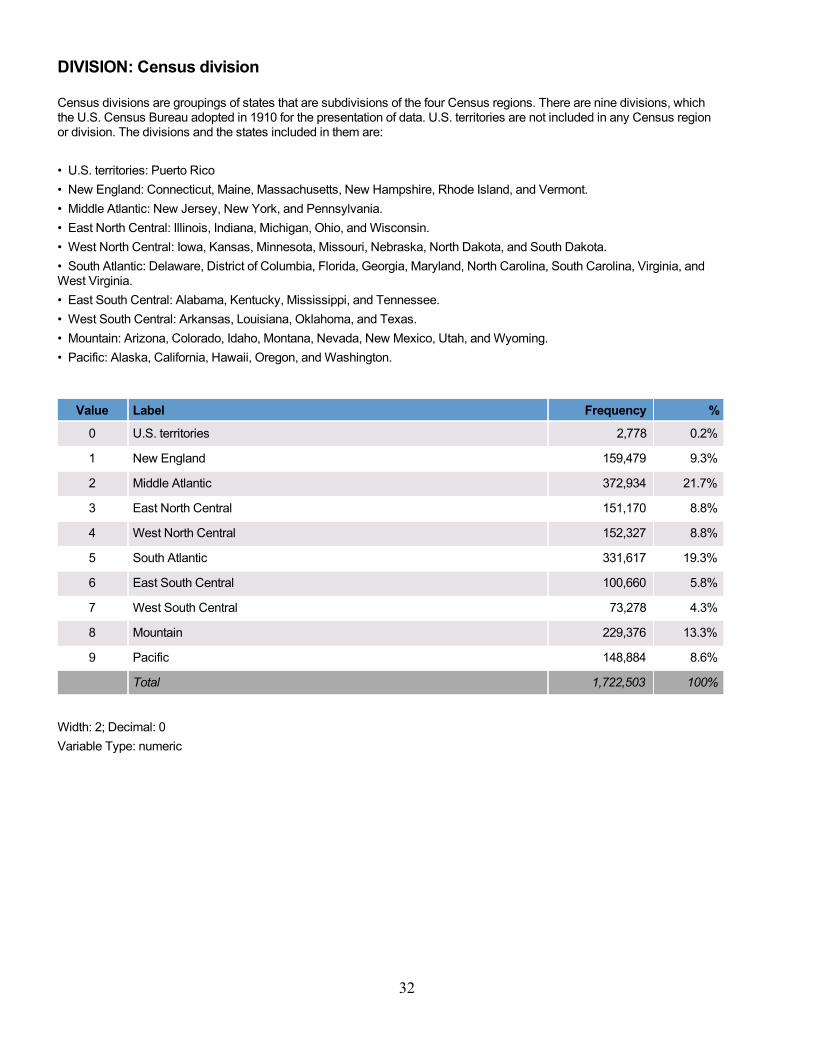
DIVISION: Census division
Census divisions are groupings of states that are subdivisions of the four Census regions. There are nine divisions, whichthe U.S. Census Bureau adopted in 1910 for the presentation of data. U.S. territories are not included in any Census regionor division. The divisions and the states included in them are:
• U.S. territories: Puerto Rico
• New England: Connecticut, Maine, Massachusetts, New Hampshire, Rhode Island, and Vermont.
• Middle Atlantic: New Jersey, New York, and Pennsylvania.
• East North Central: Illinois, Indiana, Michigan, Ohio, and Wisconsin.
• West North Central: Iowa, Kansas, Minnesota, Missouri, Nebraska, North Dakota, and South Dakota.
• South Atlantic: Delaware, District of Columbia, Florida, Georgia, Maryland, North Carolina, South Carolina, Virginia, andWest Virginia.
• East South Central: Alabama, Kentucky, Mississippi, and Tennessee.
• West South Central: Arkansas, Louisiana, Oklahoma, and Texas.
• Mountain: Arizona, Colorado, Idaho, Montana, Nevada, New Mexico, Utah, and Wyoming.
• Pacific: Alaska, California, Hawaii, Oregon, and Washington.
Value Label Frequency %
0 U.S. territories 2,778 0.2%
1 New England 159,479 9.3%
2 Middle Atlantic 372,934 21.7%
3 East North Central 151,170 8.8%
4 West North Central 152,327 8.8%
5 South Atlantic 331,617 19.3%
6 East South Central 100,660 5.8%
7 West South Central 73,278 4.3%
8 Mountain 229,376 13.3%
9 Pacific 148,884 8.6%
Total 1,722,503 100%
Width: 2; Decimal: 0
Variable Type: numeric
33
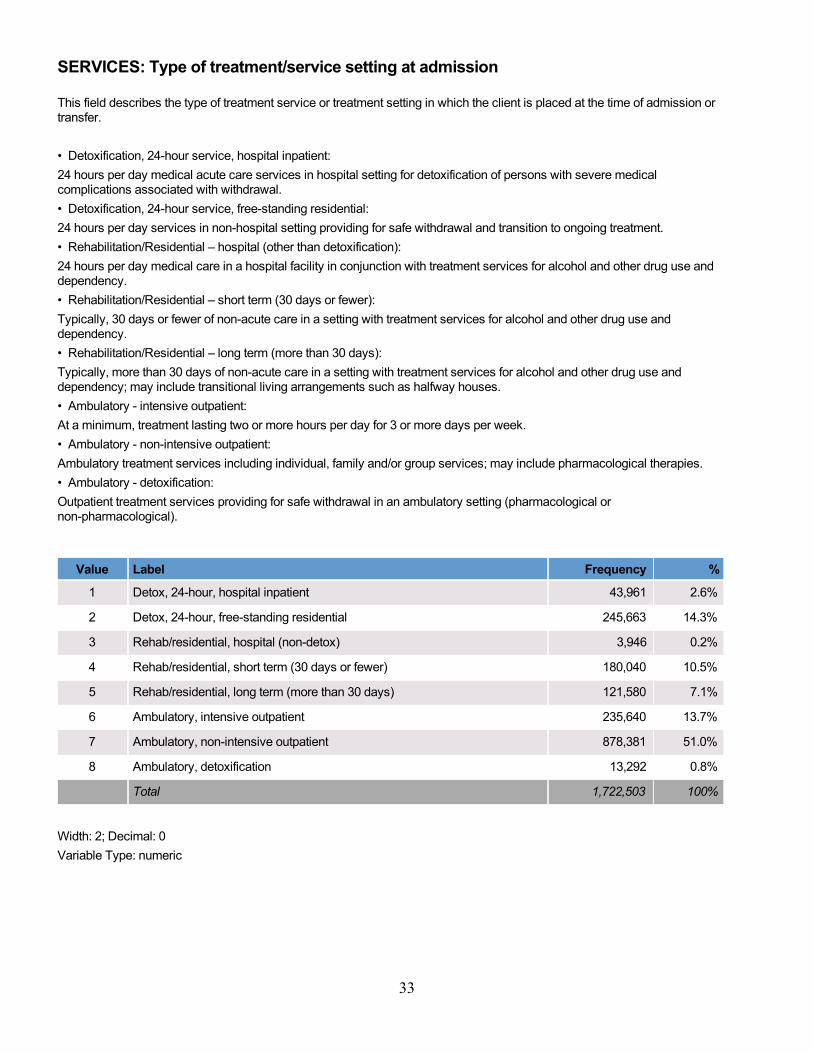
SERVICES: Type of treatment/service setting at admission
This field describes the type of treatment service or treatment setting in which the client is placed at the time of admission ortransfer.
• Detoxification, 24-hour service, hospital inpatient:
24 hours per day medical acute care services in hospital setting for detoxification of persons with severe medicalcomplications associated with withdrawal.
• Detoxification, 24-hour service, free-standing residential:
24 hours per day services in non-hospital setting providing for safe withdrawal and transition to ongoing treatment.
• Rehabilitation/Residential – hospital (other than detoxification):
24 hours per day medical care in a hospital facility in conjunction with treatment services for alcohol and other drug use anddependency.
• Rehabilitation/Residential – short term (30 days or fewer):
Typically, 30 days or fewer of non-acute care in a setting with treatment services for alcohol and other drug use anddependency.
• Rehabilitation/Residential – long term (more than 30 days):
Typically, more than 30 days of non-acute care in a setting with treatment services for alcohol and other drug use anddependency; may include transitional living arrangements such as halfway houses.
• Ambulatory - intensive outpatient:
At a minimum, treatment lasting two or more hours per day for 3 or more days per week.
• Ambulatory - non-intensive outpatient:
Ambulatory treatment services including individual, family and/or group services; may include pharmacological therapies.
• Ambulatory - detoxification:
Outpatient treatment services providing for safe withdrawal in an ambulatory setting (pharmacological ornon-pharmacological).
Value Label Frequency %
1 Detox, 24-hour, hospital inpatient 43,961 2.6%
2 Detox, 24-hour, free-standing residential 245,663 14.3%
3 Rehab/residential, hospital (non-detox) 3,946 0.2%
4 Rehab/residential, short term (30 days or fewer) 180,040 10.5%
5 Rehab/residential, long term (more than 30 days) 121,580 7.1%
6 Ambulatory, intensive outpatient 235,640 13.7%
7 Ambulatory, non-intensive outpatient 878,381 51.0%
8 Ambulatory, detoxification 13,292 0.8%
Total 1,722,503 100%
Width: 2; Decimal: 0
Variable Type: numeric
34
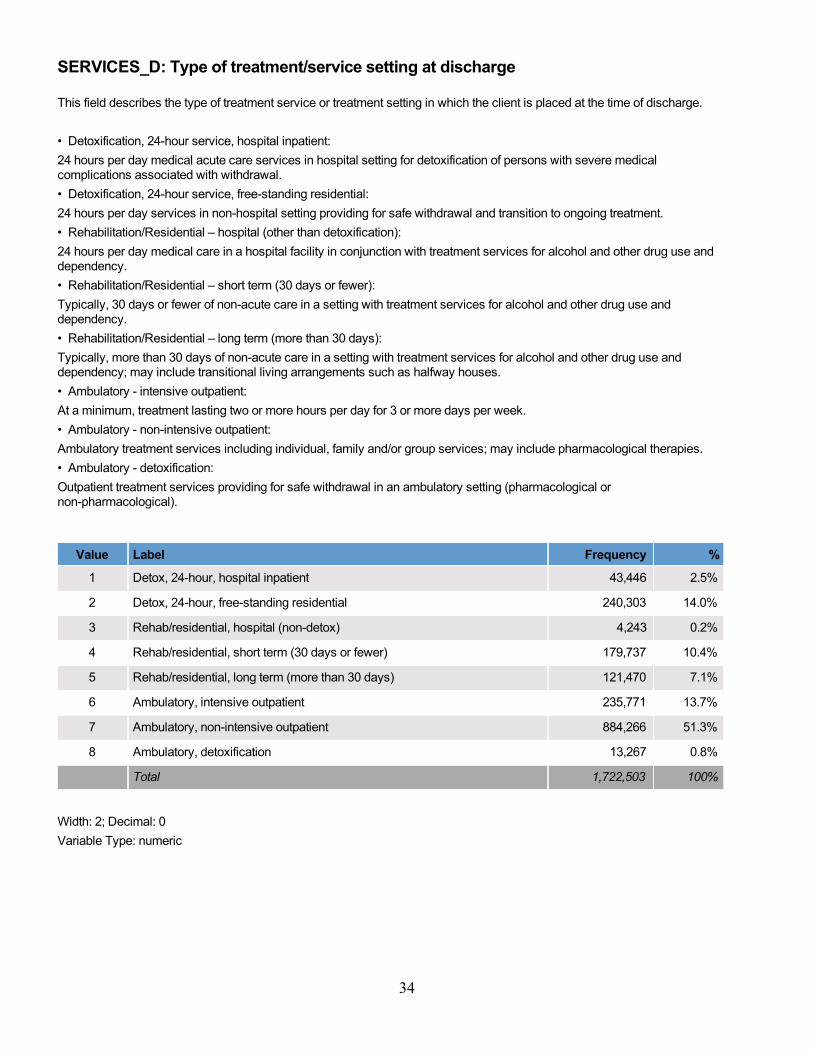
SERVICES_D: Type of treatment/service setting at discharge
This field describes the type of treatment service or treatment setting in which the client is placed at the time of discharge.
• Detoxification, 24-hour service, hospital inpatient:
24 hours per day medical acute care services in hospital setting for detoxification of persons with severe medicalcomplications associated with withdrawal.
• Detoxification, 24-hour service, free-standing residential:
24 hours per day services in non-hospital setting providing for safe withdrawal and transition to ongoing treatment.
• Rehabilitation/Residential – hospital (other than detoxification):
24 hours per day medical care in a hospital facility in conjunction with treatment services for alcohol and other drug use anddependency.
• Rehabilitation/Residential – short term (30 days or fewer):
Typically, 30 days or fewer of non-acute care in a setting with treatment services for alcohol and other drug use anddependency.
• Rehabilitation/Residential – long term (more than 30 days):
Typically, more than 30 days of non-acute care in a setting with treatment services for alcohol and other drug use anddependency; may include transitional living arrangements such as halfway houses.
• Ambulatory - intensive outpatient:
At a minimum, treatment lasting two or more hours per day for 3 or more days per week.
• Ambulatory - non-intensive outpatient:
Ambulatory treatment services including individual, family and/or group services; may include pharmacological therapies.
• Ambulatory - detoxification:
Outpatient treatment services providing for safe withdrawal in an ambulatory setting (pharmacological ornon-pharmacological).
Value Label Frequency %
1 Detox, 24-hour, hospital inpatient 43,446 2.5%
2 Detox, 24-hour, free-standing residential 240,303 14.0%
3 Rehab/residential, hospital (non-detox) 4,243 0.2%
4 Rehab/residential, short term (30 days or fewer) 179,737 10.4%
5 Rehab/residential, long term (more than 30 days) 121,470 7.1%
6 Ambulatory, intensive outpatient 235,771 13.7%
7 Ambulatory, non-intensive outpatient 884,266 51.3%
8 Ambulatory, detoxification 13,267 0.8%
Total 1,722,503 100%
Width: 2; Decimal: 0
Variable Type: numeric
35
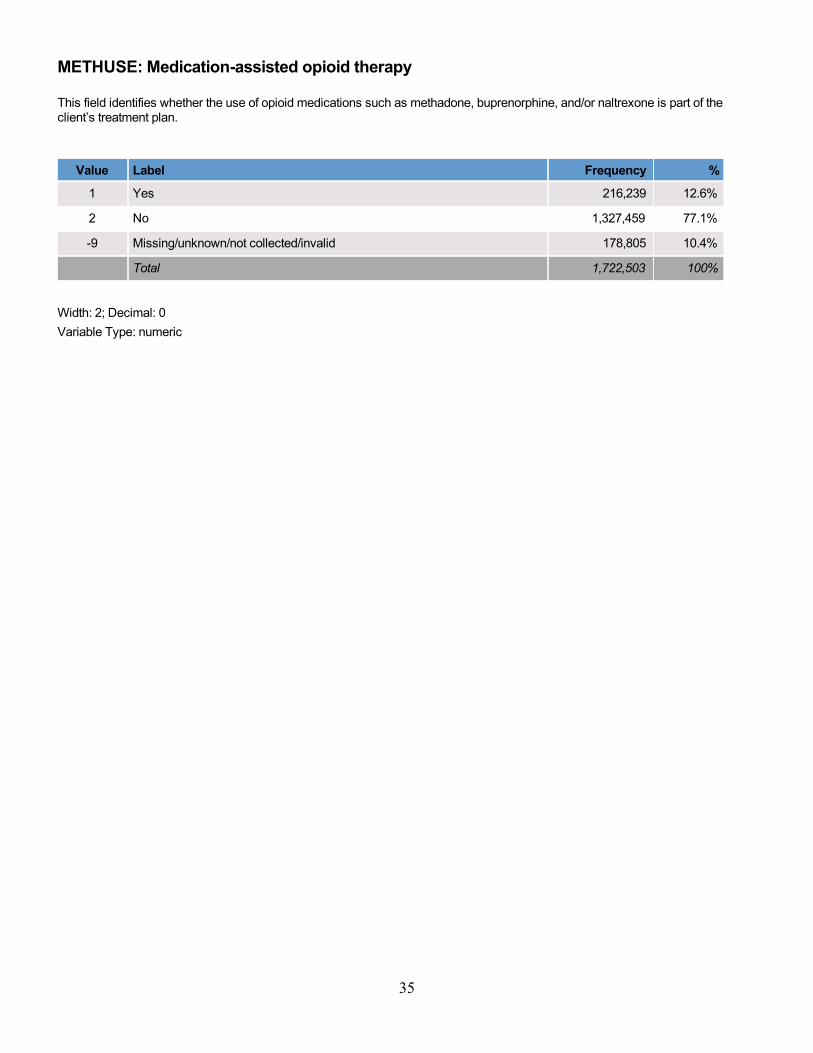
METHUSE: Medication-assisted opioid therapy
This field identifies whether the use of opioid medications such as methadone, buprenorphine, and/or naltrexone is part of theclient’s treatment plan.
Value Label Frequency %
1 Yes 216,239 12.6%
2 No 1,327,459 77.1%
-9 Missing/unknown/not collected/invalid 178,805 10.4%
Total 1,722,503 100%
Width: 2; Decimal: 0
Variable Type: numeric
36
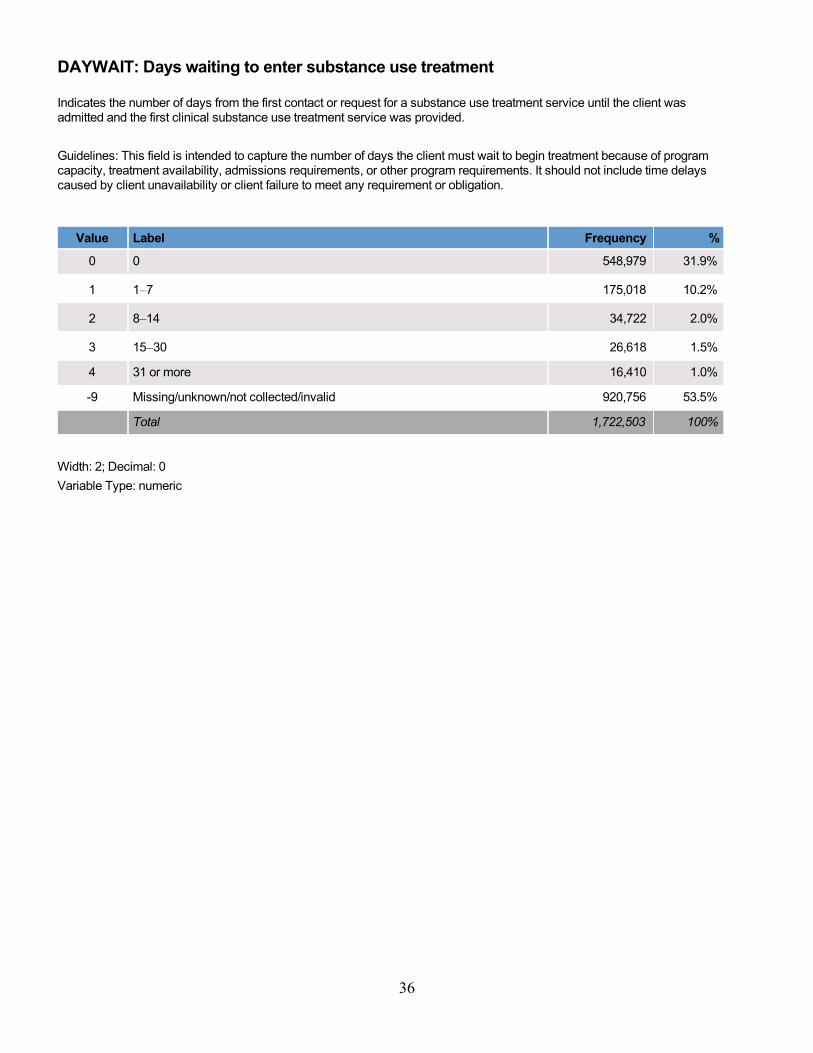
DAYWAIT: Days waiting to enter substance use treatment
Indicates the number of days from the first contact or request for a substance use treatment service until the client wasadmitted and the first clinical substance use treatment service was provided.
Guidelines: This field is intended to capture the number of days the client must wait to begin treatment because of programcapacity, treatment availability, admissions requirements, or other program requirements. It should not include time delayscaused by client unavailability or client failure to meet any requirement or obligation.
Value Label Frequency %
0 0 548,979 31.9%
1 1–7 175,018 10.2%
2 8–14 34,722 2.0%
3 15–30 26,618 1.5%
4 31 or more 16,410 1.0%
-9 Missing/unknown/not collected/invalid 920,756 53.5%
Total 1,722,503 100%
Width: 2; Decimal: 0
Variable Type: numeric
37
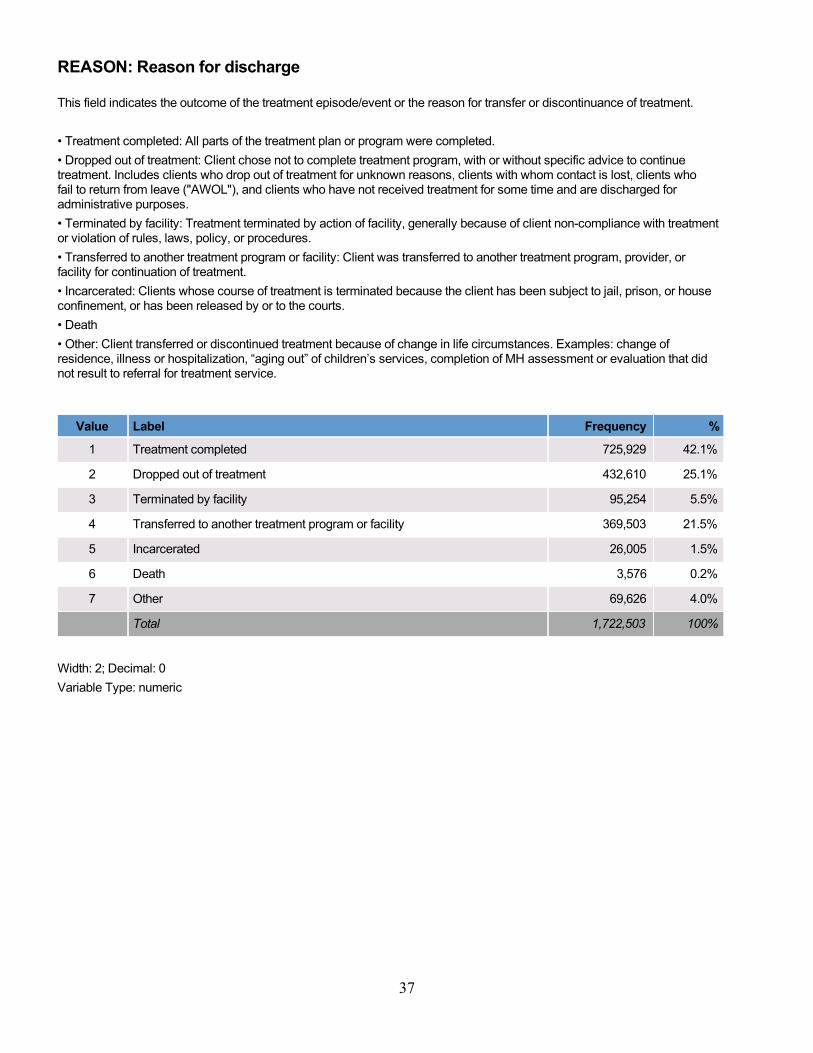
REASON: Reason for discharge
This field indicates the outcome of the treatment episode/event or the reason for transfer or discontinuance of treatment.
• Treatment completed: All parts of the treatment plan or program were completed.
• Dropped out of treatment: Client chose not to complete treatment program, with or without specific advice to continuetreatment. Includes clients who drop out of treatment for unknown reasons, clients with whom contact is lost, clients whofail to return from leave ("AWOL"), and clients who have not received treatment for some time and are discharged foradministrative purposes.
• Terminated by facility: Treatment terminated by action of facility, generally because of client non-compliance with treatmentor violation of rules, laws, policy, or procedures.
• Transferred to another treatment program or facility: Client was transferred to another treatment program, provider, orfacility for continuation of treatment.
• Incarcerated: Clients whose course of treatment is terminated because the client has been subject to jail, prison, or houseconfinement, or has been released by or to the courts.
• Death
• Other: Client transferred or discontinued treatment because of change in life circumstances. Examples: change ofresidence, illness or hospitalization, “aging out” of children’s services, completion of MH assessment or evaluation that didnot result to referral for treatment service.
Value Label Frequency %
1 Treatment completed 725,929 42.1%
2 Dropped out of treatment 432,610 25.1%
3 Terminated by facility 95,254 5.5%
4 Transferred to another treatment program or facility 369,503 21.5%
5 Incarcerated 26,005 1.5%
6 Death 3,576 0.2%
7 Other 69,626 4.0%
Total 1,722,503 100%
Width: 2; Decimal: 0
Variable Type: numeric
38
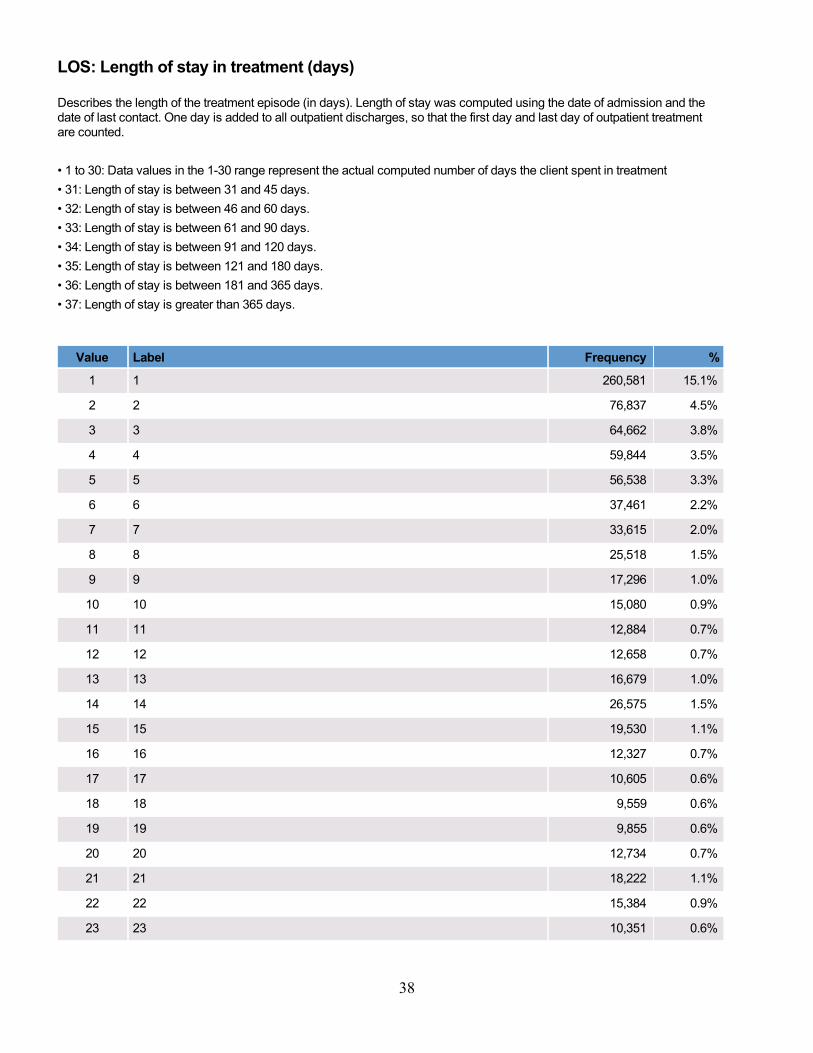
LOS: Length of stay in treatment (days)
Describes the length of the treatment episode (in days). Length of stay was computed using the date of admission and thedate of last contact. One day is added to all outpatient discharges, so that the first day and last day of outpatient treatmentare counted.
• 1 to 30: Data values in the 1-30 range represent the actual computed number of days the client spent in treatment
• 31: Length of stay is between 31 and 45 days.
• 32: Length of stay is between 46 and 60 days.
• 33: Length of stay is between 61 and 90 days.
• 34: Length of stay is between 91 and 120 days.
• 35: Length of stay is between 121 and 180 days.
• 36: Length of stay is between 181 and 365 days.
• 37: Length of stay is greater than 365 days.
Value Label Frequency %
1 1 260,581 15.1%
2 2 76,837 4.5%
3 3 64,662 3.8%
4 4 59,844 3.5%
5 5 56,538 3.3%
6 6 37,461 2.2%
7 7 33,615 2.0%
8 8 25,518 1.5%
9 9 17,296 1.0%
10 10 15,080 0.9%
11 11 12,884 0.7%
12 12 12,658 0.7%
13 13 16,679 1.0%
14 14 26,575 1.5%
15 15 19,530 1.1%
16 16 12,327 0.7%
17 17 10,605 0.6%
18 18 9,559 0.6%
19 19 9,855 0.6%
20 20 12,734 0.7%
21 21 18,222 1.1%
22 22 15,384 0.9%
23 23 10,351 0.6%
39
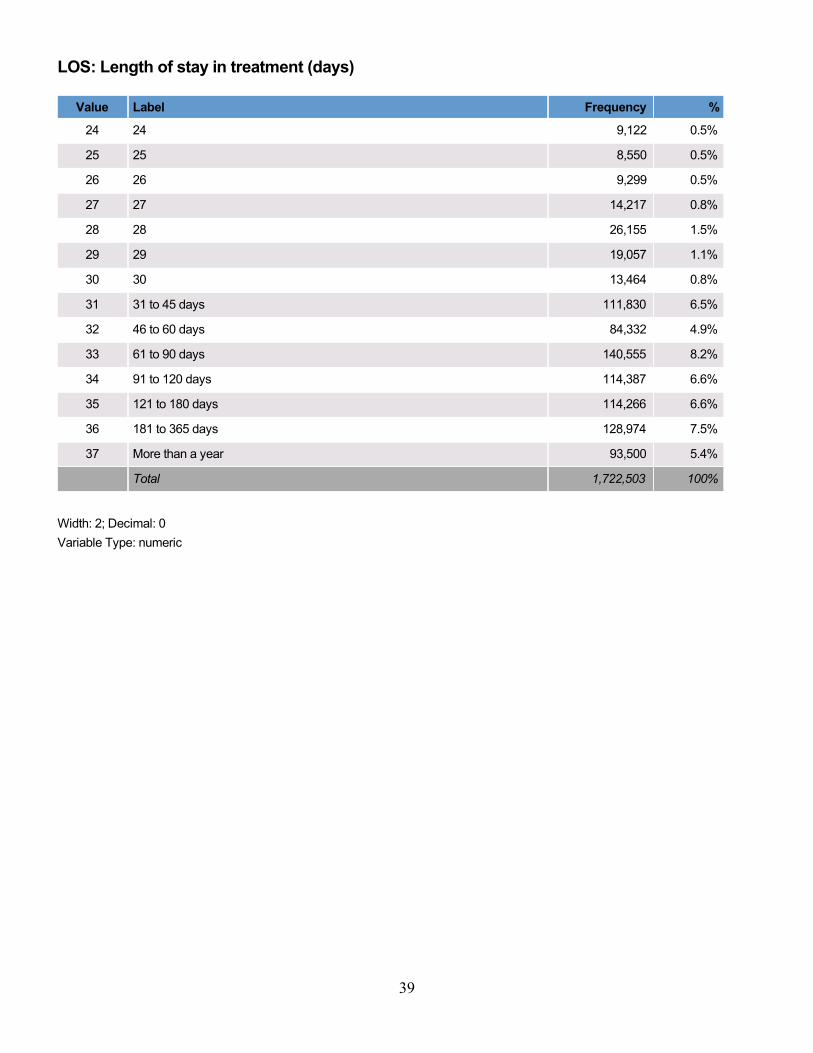
LOS: Length of stay in treatment (days)
Value Label Frequency %
24 24 9,122 0.5%
25 25 8,550 0.5%
26 26 9,299 0.5%
27 27 14,217 0.8%
28 28 26,155 1.5%
29 29 19,057 1.1%
30 30 13,464 0.8%
31 31 to 45 days 111,830 6.5%
32 46 to 60 days 84,332 4.9%
33 61 to 90 days 140,555 8.2%
34 91 to 120 days 114,387 6.6%
35 121 to 180 days 114,266 6.6%
36 181 to 365 days 128,974 7.5%
37 More than a year 93,500 5.4%
Total 1,722,503 100%
Width: 2; Decimal: 0
Variable Type: numeric
40
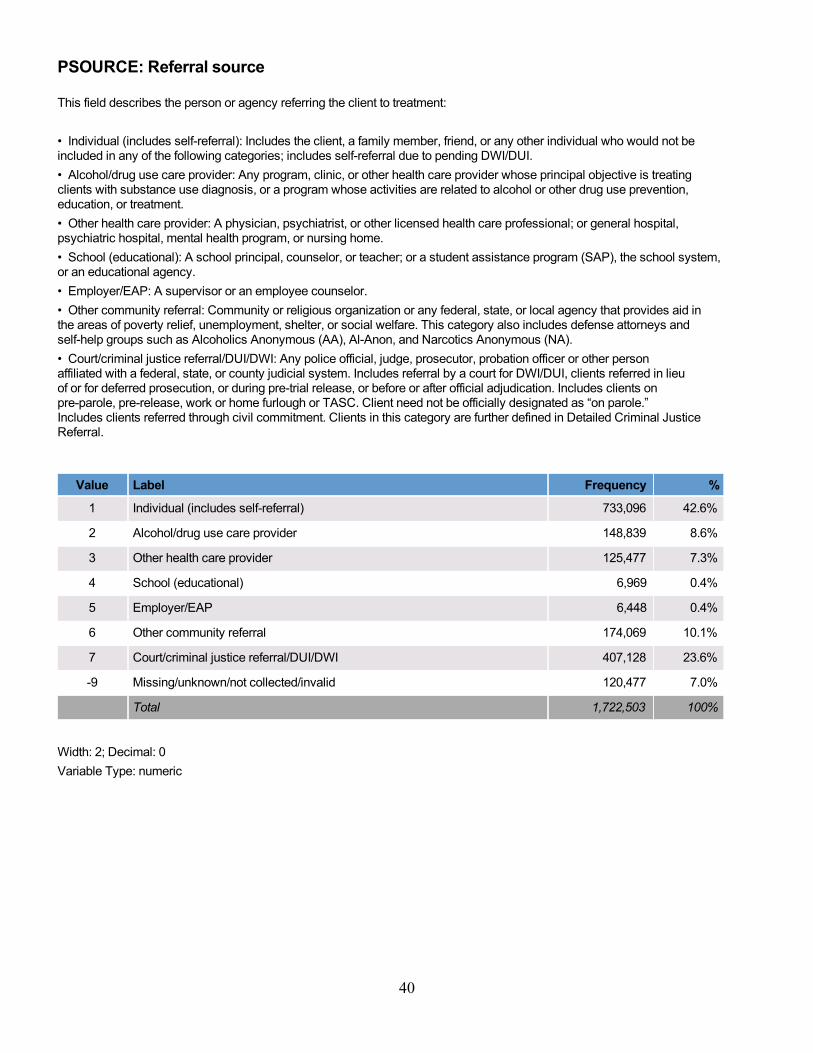
PSOURCE: Referral source
This field describes the person or agency referring the client to treatment:
• Individual (includes self-referral): Includes the client, a family member, friend, or any other individual who would not beincluded in any of the following categories; includes self-referral due to pending DWI/DUI.
• Alcohol/drug use care provider: Any program, clinic, or other health care provider whose principal objective is treatingclients with substance use diagnosis, or a program whose activities are related to alcohol or other drug use prevention,education, or treatment.
• Other health care provider: A physician, psychiatrist, or other licensed health care professional; or general hospital,psychiatric hospital, mental health program, or nursing home.
• School (educational): A school principal, counselor, or teacher; or a student assistance program (SAP), the school system,or an educational agency.
• Employer/EAP: A supervisor or an employee counselor.
• Other community referral: Community or religious organization or any federal, state, or local agency that provides aid inthe areas of poverty relief, unemployment, shelter, or social welfare. This category also includes defense attorneys andself-help groups such as Alcoholics Anonymous (AA), Al-Anon, and Narcotics Anonymous (NA).
• Court/criminal justice referral/DUI/DWI: Any police official, judge, prosecutor, probation officer or other personaffiliated with a federal, state, or county judicial system. Includes referral by a court for DWI/DUI, clients referred in lieuof or for deferred prosecution, or during pre-trial release, or before or after official adjudication. Includes clients onpre-parole, pre-release, work or home furlough or TASC. Client need not be officially designated as “on parole.”Includes clients referred through civil commitment. Clients in this category are further defined in Detailed Criminal JusticeReferral.
Value Label Frequency %
1 Individual (includes self-referral) 733,096 42.6%
2 Alcohol/drug use care provider 148,839 8.6%
3 Other health care provider 125,477 7.3%
4 School (educational) 6,969 0.4%
5 Employer/EAP 6,448 0.4%
6 Other community referral 174,069 10.1%
7 Court/criminal justice referral/DUI/DWI 407,128 23.6%
-9 Missing/unknown/not collected/invalid 120,477 7.0%
Total 1,722,503 100%
Width: 2; Decimal: 0
Variable Type: numeric
41
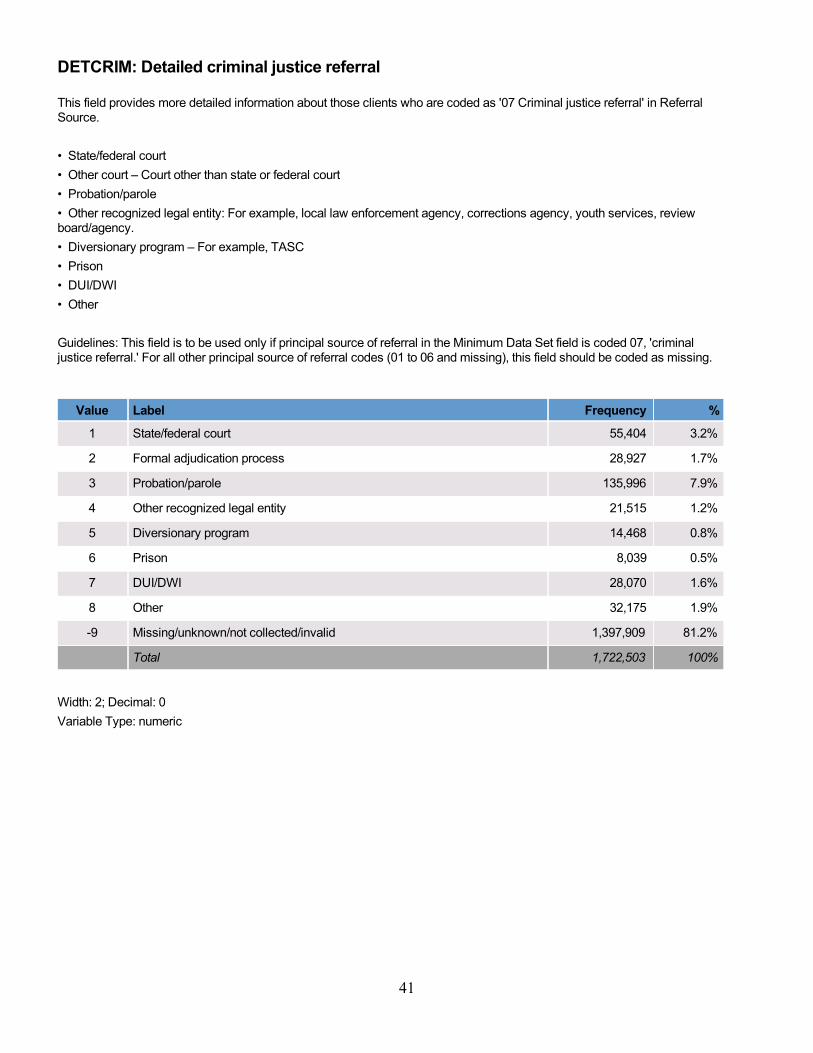
DETCRIM: Detailed criminal justice referral
This field provides more detailed information about those clients who are coded as '07 Criminal justice referral' in ReferralSource.
• State/federal court
• Other court – Court other than state or federal court
• Probation/parole
• Other recognized legal entity: For example, local law enforcement agency, corrections agency, youth services, reviewboard/agency.
• Diversionary program – For example, TASC
• Prison
• DUI/DWI
• Other
Guidelines: This field is to be used only if principal source of referral in the Minimum Data Set field is coded 07, 'criminaljustice referral.' For all other principal source of referral codes (01 to 06 and missing), this field should be coded as missing.
Value Label Frequency %
1 State/federal court 55,404 3.2%
2 Formal adjudication process 28,927 1.7%
3 Probation/parole 135,996 7.9%
4 Other recognized legal entity 21,515 1.2%
5 Diversionary program 14,468 0.8%
6 Prison 8,039 0.5%
7 DUI/DWI 28,070 1.6%
8 Other 32,175 1.9%
-9 Missing/unknown/not collected/invalid 1,397,909 81.2%
Total 1,722,503 100%
Width: 2; Decimal: 0
Variable Type: numeric
42
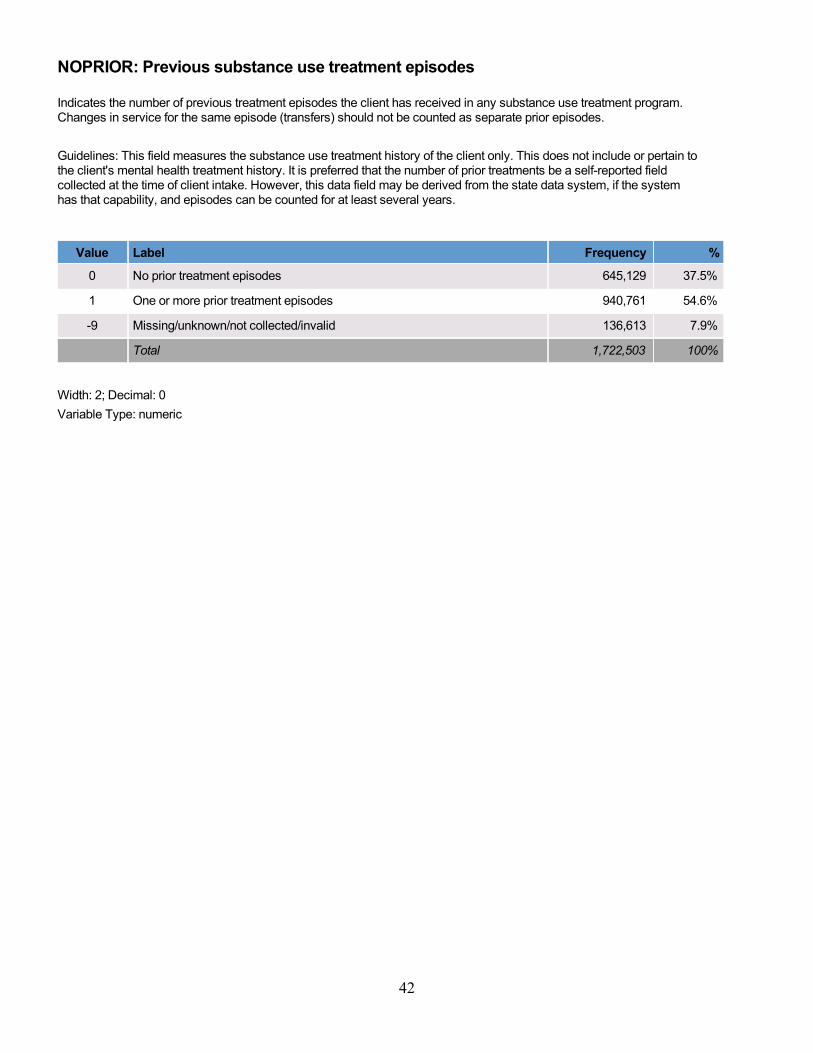
NOPRIOR: Previous substance use treatment episodes
Indicates the number of previous treatment episodes the client has received in any substance use treatment program.Changes in service for the same episode (transfers) should not be counted as separate prior episodes.
Guidelines: This field measures the substance use treatment history of the client only. This does not include or pertain tothe client's mental health treatment history. It is preferred that the number of prior treatments be a self-reported fieldcollected at the time of client intake. However, this data field may be derived from the state data system, if the systemhas that capability, and episodes can be counted for at least several years.
Value Label Frequency %
0 No prior treatment episodes 645,129 37.5%
1 One or more prior treatment episodes 940,761 54.6%
-9 Missing/unknown/not collected/invalid 136,613 7.9%
Total 1,722,503 100%
Width: 2; Decimal: 0
Variable Type: numeric
43
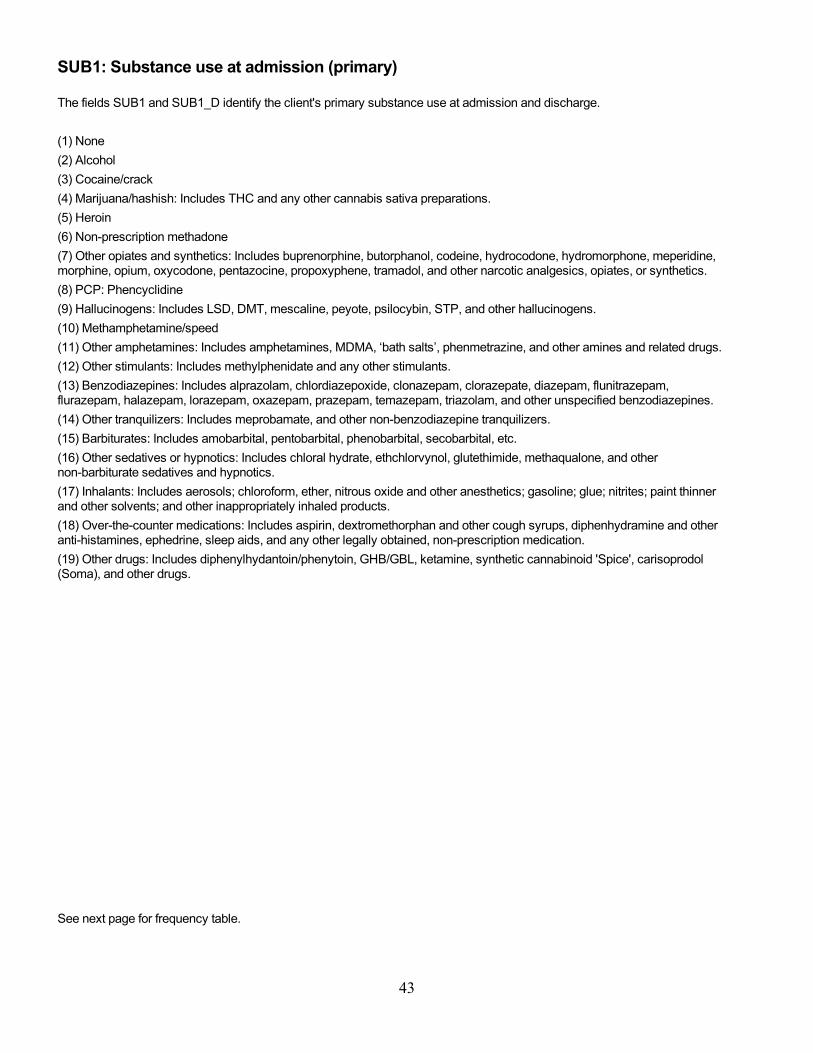
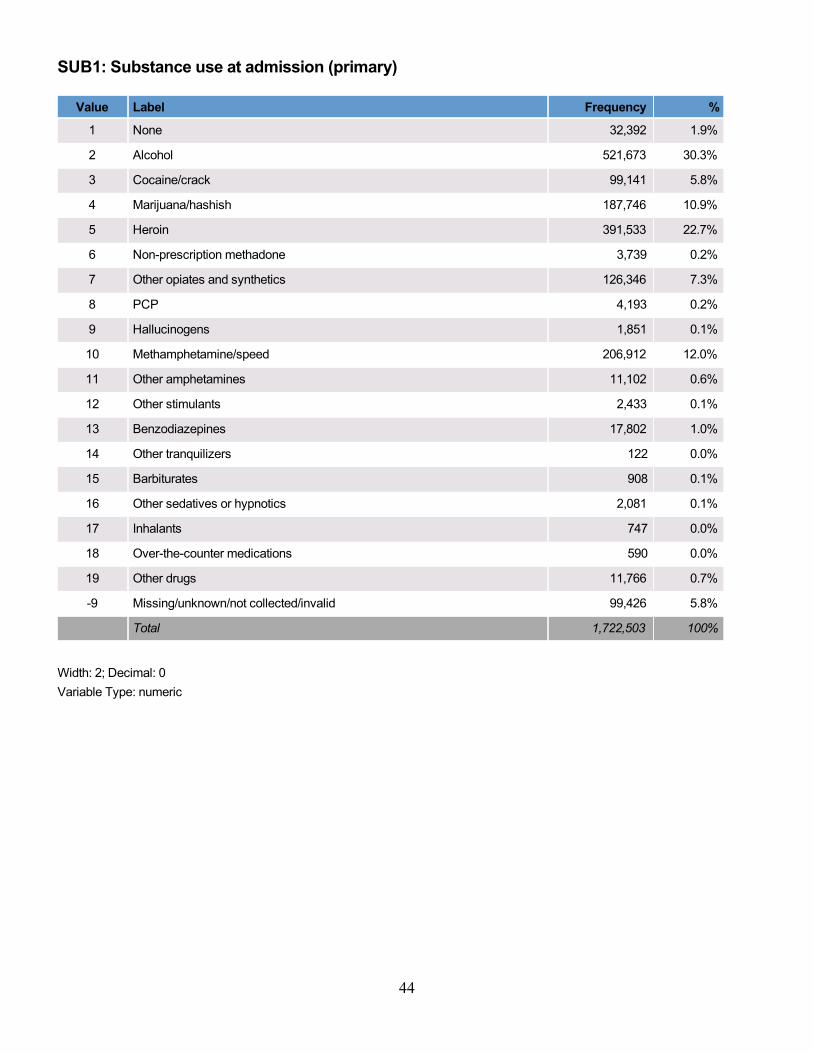
SUB1: Substance use at admission (primary)
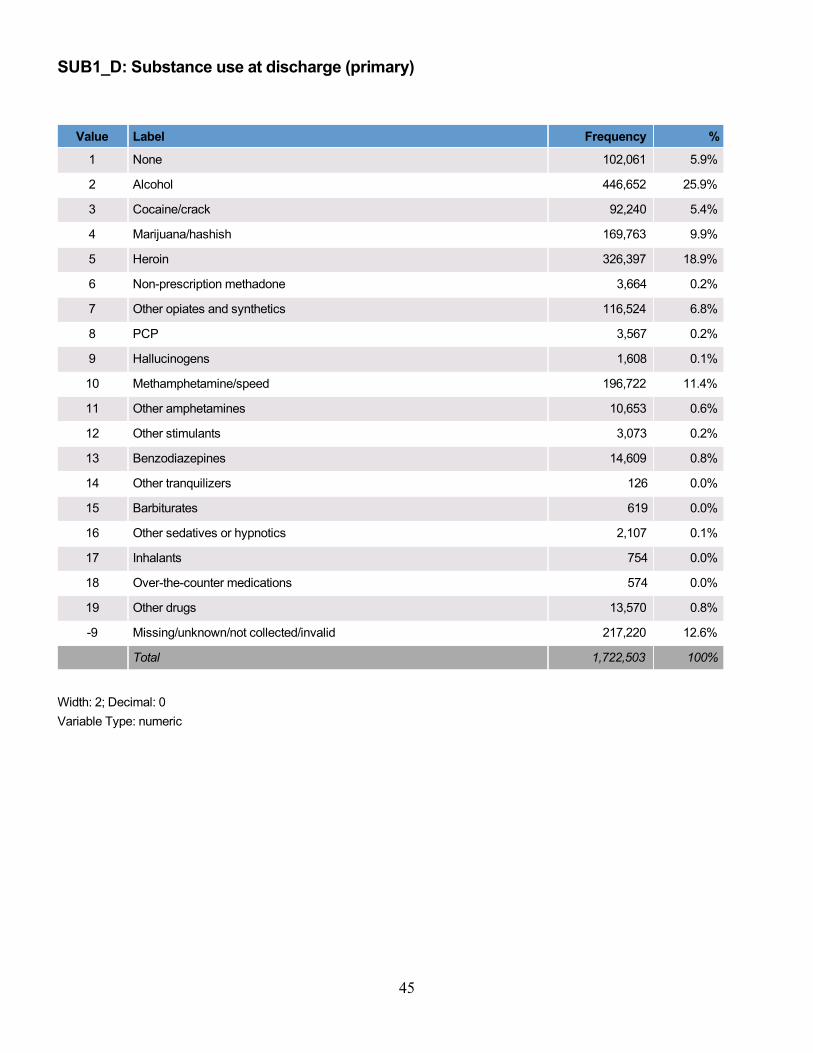
The fields SUB1 and SUB1_D identify the client's primary substance use at admission and discharge.
(1) None
(2) Alcohol
(3) Cocaine/crack
(4) Marijuana/hashish: Includes THC and any other cannabis sativa preparations.
(5) Heroin
(6) Non-prescription methadone
(7) Other opiates and synthetics: Includes buprenorphine, butorphanol, codeine, hydrocodone, hydromorphone, meperidine,morphine, opium, oxycodone, pentazocine, propoxyphene, tramadol, and other narcotic analgesics, opiates, or synthetics.
(8) PCP: Phencyclidine
(9) Hallucinogens: Includes LSD, DMT, mescaline, peyote, psilocybin, STP, and other hallucinogens.
(10) Methamphetamine/speed
(11) Other amphetamines: Includes amphetamines, MDMA, ‘bath salts’, phenmetrazine, and other amines and related drugs.
(12) Other stimulants: Includes methylphenidate and any other stimulants.
(13) Benzodiazepines: Includes alprazolam, chlordiazepoxide, clonazepam, clorazepate, diazepam, flunitrazepam,flurazepam, halazepam, lorazepam, oxazepam, prazepam, temazepam, triazolam, and other unspecified benzodiazepines.
(14) Other tranquilizers: Includes meprobamate, and other non-benzodiazepine tranquilizers.
(15) Barbiturates: Includes amobarbital, pentobarbital, phenobarbital, secobarbital, etc.
(16) Other sedatives or hypnotics: Includes chloral hydrate, ethchlorvynol, glutethimide, methaqualone, and othernon-barbiturate sedatives and hypnotics.
(17) Inhalants: Includes aerosols; chloroform, ether, nitrous oxide and other anesthetics; gasoline; glue; nitrites; paint thinnerand other solvents; and other inappropriately inhaled products.
(18) Over-the-counter medications: Includes aspirin, dextromethorphan and other cough syrups, diphenhydramine and otheranti-histamines, ephedrine, sleep aids, and any other legally obtained, non-prescription medication.
(19) Other drugs: Includes diphenylhydantoin/phenytoin, GHB/GBL, ketamine, synthetic cannabinoid 'Spice', carisoprodol(Soma), and other drugs.
See next page for frequency table.
44
SUB1: Substance use at admission (primary)
Value Label Frequency %
1 None 32,392 1.9%
2 Alcohol 521,673 30.3%
3 Cocaine/crack 99,141 5.8%
4 Marijuana/hashish 187,746 10.9%
5 Heroin 391,533 22.7%
6 Non-prescription methadone 3,739 0.2%
7 Other opiates and synthetics 126,346 7.3%
8 PCP 4,193 0.2%
9 Hallucinogens 1,851 0.1%
10 Methamphetamine/speed 206,912 12.0%
11 Other amphetamines 11,102 0.6%
12 Other stimulants 2,433 0.1%
13 Benzodiazepines 17,802 1.0%
14 Other tranquilizers 122 0.0%
15 Barbiturates 908 0.1%
16 Other sedatives or hypnotics 2,081 0.1%
17 Inhalants 747 0.0%
18 Over-the-counter medications 590 0.0%
19 Other drugs 11,766 0.7%
-9 Missing/unknown/not collected/invalid 99,426 5.8%
Total 1,722,503 100%
Width: 2; Decimal: 0
Variable Type: numeric
45
SUB1_D: Substance use at discharge (primary)
Value Label Frequency %
1 None 102,061 5.9%
2 Alcohol 446,652 25.9%
3 Cocaine/crack 92,240 5.4%
4 Marijuana/hashish 169,763 9.9%
5 Heroin 326,397 18.9%
6 Non-prescription methadone 3,664 0.2%
7 Other opiates and synthetics 116,524 6.8%
8 PCP 3,567 0.2%
9 Hallucinogens 1,608 0.1%
10 Methamphetamine/speed 196,722 11.4%
11 Other amphetamines 10,653 0.6%
12 Other stimulants 3,073 0.2%
13 Benzodiazepines 14,609 0.8%
14 Other tranquilizers 126 0.0%
15 Barbiturates 619 0.0%
16 Other sedatives or hypnotics 2,107 0.1%
17 Inhalants 754 0.0%
18 Over-the-counter medications 574 0.0%
19 Other drugs 13,570 0.8%
-9 Missing/unknown/not collected/invalid 217,220 12.6%
Total 1,722,503 100%
Width: 2; Decimal: 0
Variable Type: numeric
46
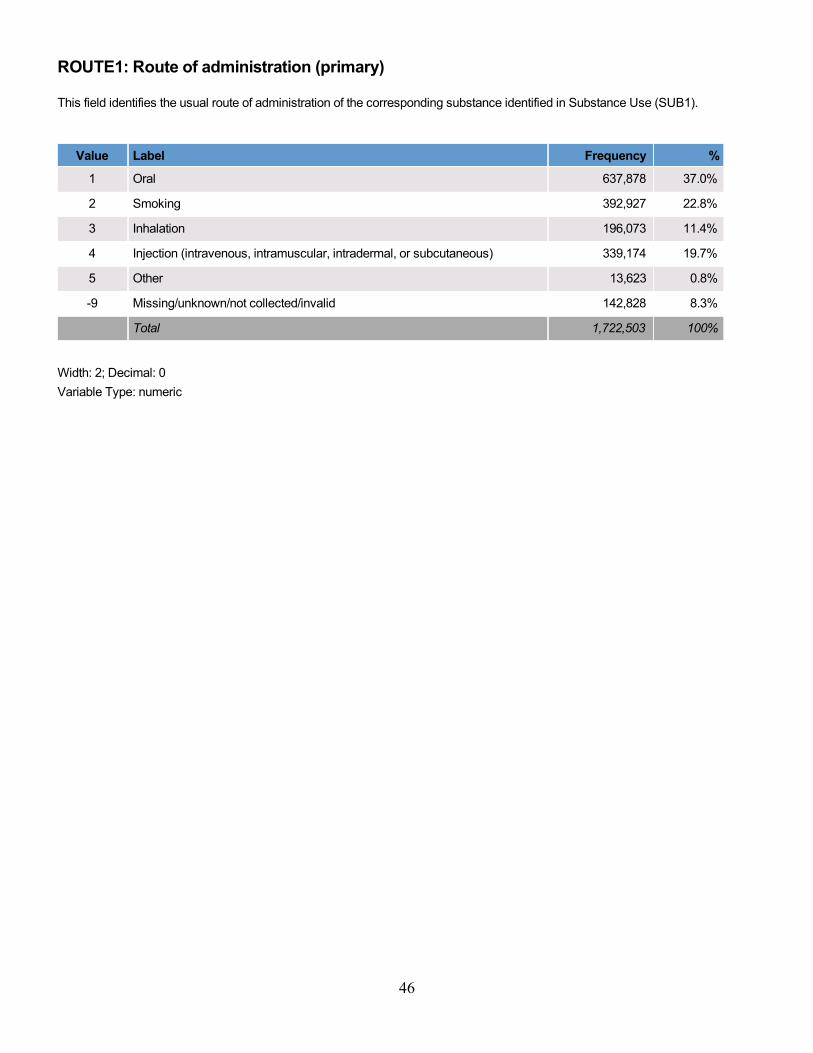
ROUTE1: Route of administration (primary)
This field identifies the usual route of administration of the corresponding substance identified in Substance Use (SUB1).
Value Label Frequency %
1 Oral 637,878 37.0%
2 Smoking 392,927 22.8%
3 Inhalation 196,073 11.4%
4 Injection (intravenous, intramuscular, intradermal, or subcutaneous) 339,174 19.7%
5 Other 13,623 0.8%
-9 Missing/unknown/not collected/invalid 142,828 8.3%
Total 1,722,503 100%
Width: 2; Decimal: 0
Variable Type: numeric
47
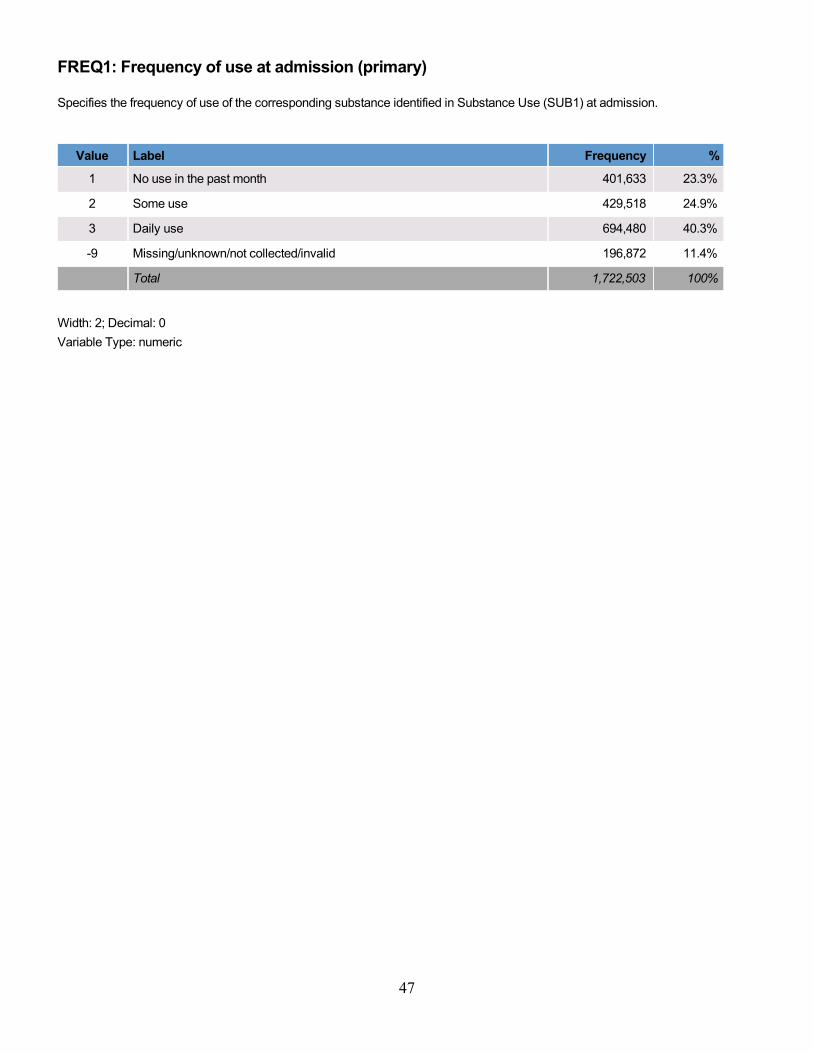
FREQ1: Frequency of use at admission (primary)
Specifies the frequency of use of the corresponding substance identified in Substance Use (SUB1) at admission.
Value Label Frequency %
1 No use in the past month 401,633 23.3%
2 Some use 429,518 24.9%
3 Daily use 694,480 40.3%
-9 Missing/unknown/not collected/invalid 196,872 11.4%
Total 1,722,503 100%
Width: 2; Decimal: 0
Variable Type: numeric
48
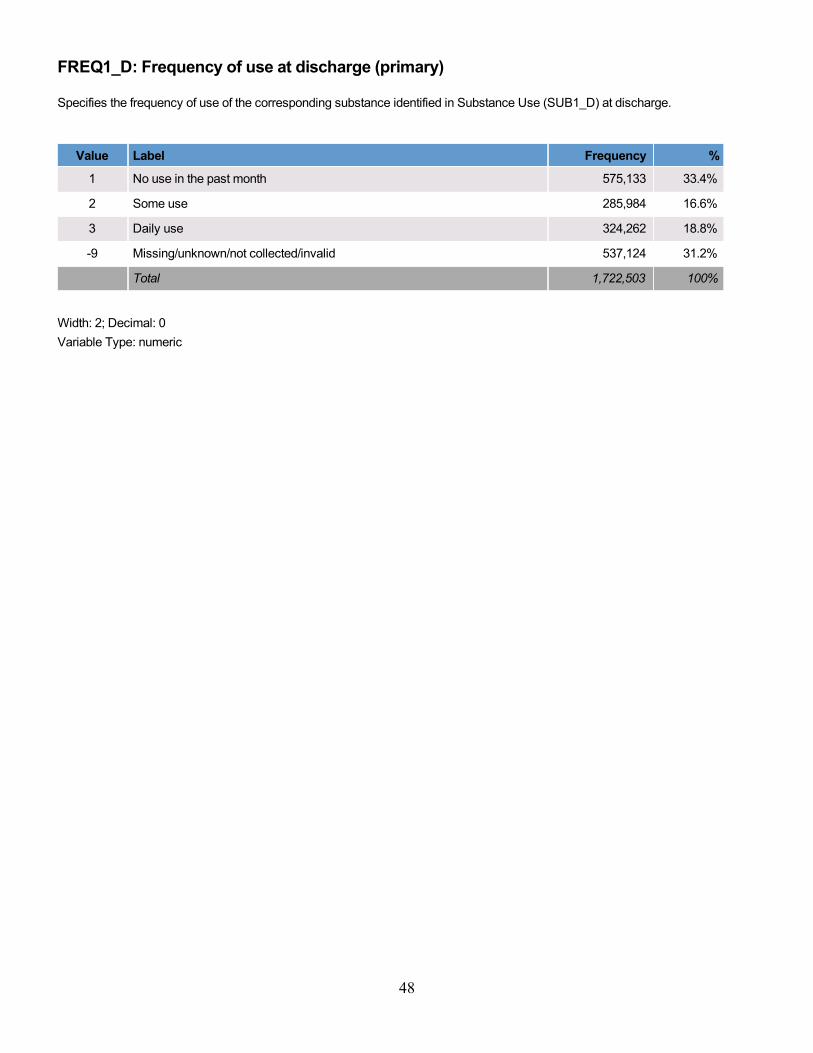
FREQ1_D: Frequency of use at discharge (primary)
Specifies the frequency of use of the corresponding substance identified in Substance Use (SUB1_D) at discharge.
Value Label Frequency %
1 No use in the past month 575,133 33.4%
2 Some use 285,984 16.6%
3 Daily use 324,262 18.8%
-9 Missing/unknown/not collected/invalid 537,124 31.2%
Total 1,722,503 100%
Width: 2; Decimal: 0
Variable Type: numeric
49
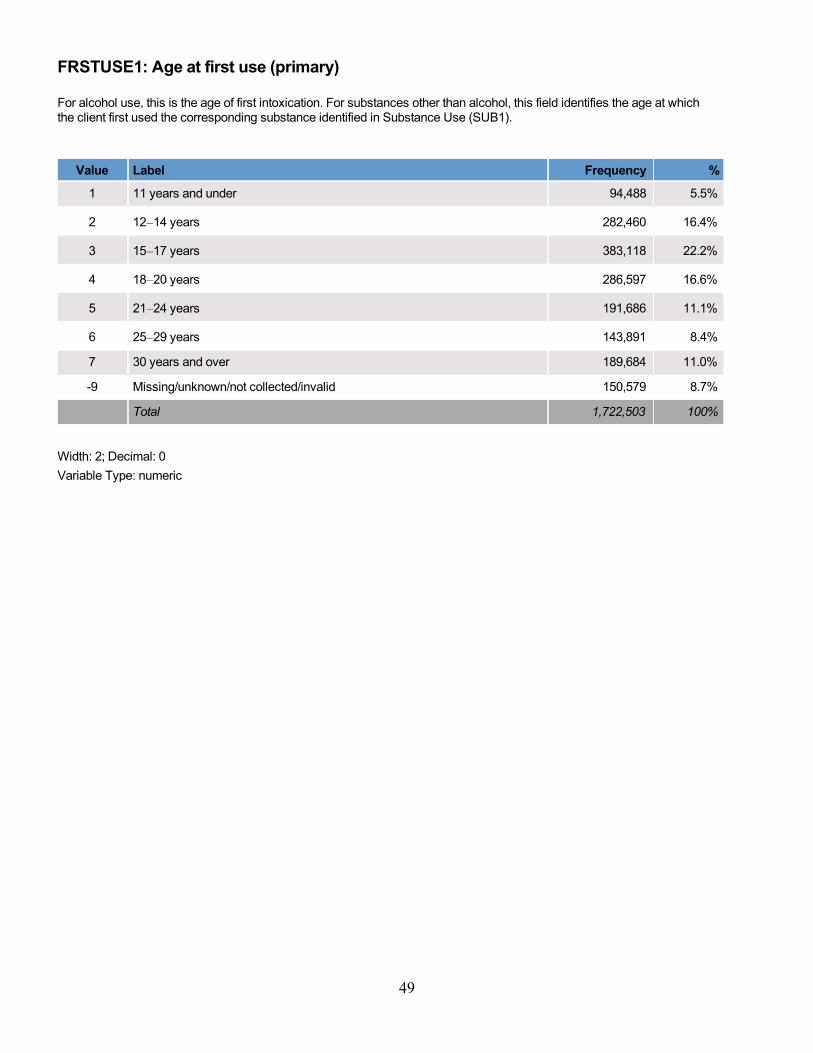
FRSTUSE1: Age at first use (primary)
For alcohol use, this is the age of first intoxication. For substances other than alcohol, this field identifies the age at whichthe client first used the corresponding substance identified in Substance Use (SUB1).
Value Label Frequency %
1 11 years and under 94,488 5.5%
2 12–14 years 282,460 16.4%
3 15–17 years 383,118 22.2%
4 18–20 years 286,597 16.6%
5 21–24 years 191,686 11.1%
6 25–29 years 143,891 8.4%
7 30 years and over 189,684 11.0%
-9 Missing/unknown/not collected/invalid 150,579 8.7%
Total 1,722,503 100%
Width: 2; Decimal: 0
Variable Type: numeric
50
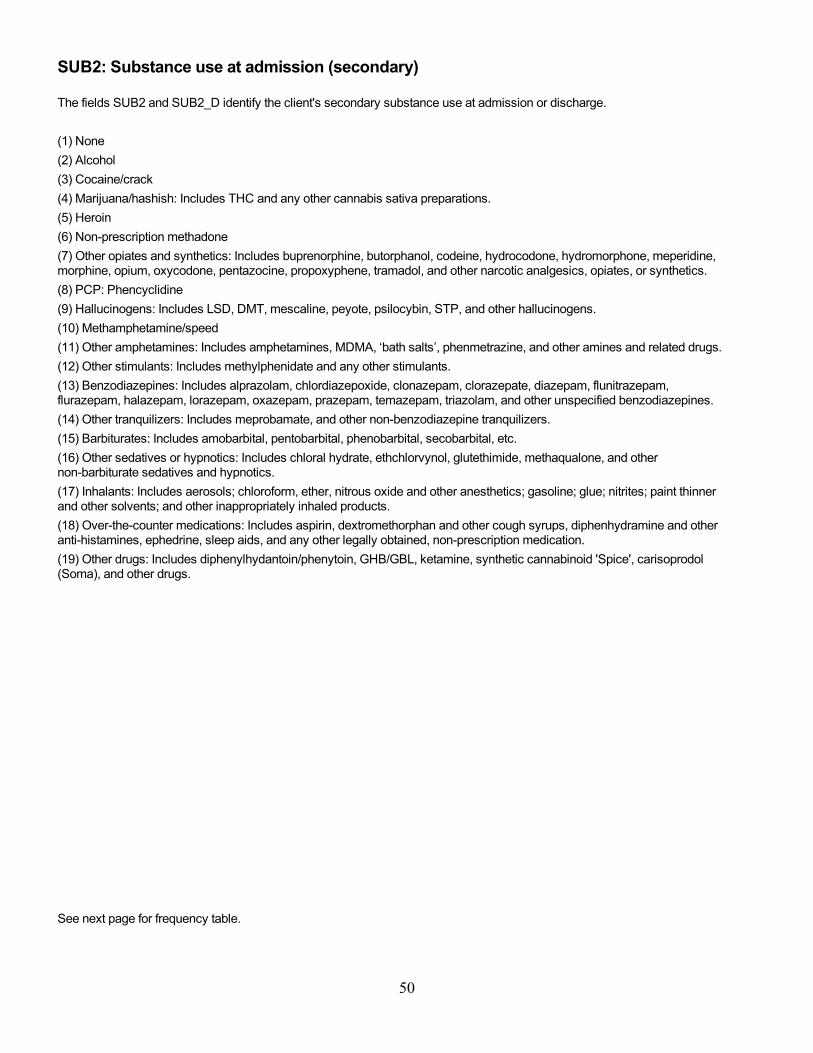
SUB2: Substance use at admission (secondary)
The fields SUB2 and SUB2_D identify the client's secondary substance use at admission or discharge.
(1) None
(2) Alcohol
(3) Cocaine/crack
(4) Marijuana/hashish: Includes THC and any other cannabis sativa preparations.
(5) Heroin
(6) Non-prescription methadone
(7) Other opiates and synthetics: Includes buprenorphine, butorphanol, codeine, hydrocodone, hydromorphone, meperidine,morphine, opium, oxycodone, pentazocine, propoxyphene, tramadol, and other narcotic analgesics, opiates, or synthetics.
(8) PCP: Phencyclidine
(9) Hallucinogens: Includes LSD, DMT, mescaline, peyote, psilocybin, STP, and other hallucinogens.
(10) Methamphetamine/speed
(11) Other amphetamines: Includes amphetamines, MDMA, ‘bath salts’, phenmetrazine, and other amines and related drugs.
(12) Other stimulants: Includes methylphenidate and any other stimulants.
(13) Benzodiazepines: Includes alprazolam, chlordiazepoxide, clonazepam, clorazepate, diazepam, flunitrazepam,flurazepam, halazepam, lorazepam, oxazepam, prazepam, temazepam, triazolam, and other unspecified benzodiazepines.
(14) Other tranquilizers: Includes meprobamate, and other non-benzodiazepine tranquilizers.
(15) Barbiturates: Includes amobarbital, pentobarbital, phenobarbital, secobarbital, etc.
(16) Other sedatives or hypnotics: Includes chloral hydrate, ethchlorvynol, glutethimide, methaqualone, and othernon-barbiturate sedatives and hypnotics.
(17) Inhalants: Includes aerosols; chloroform, ether, nitrous oxide and other anesthetics; gasoline; glue; nitrites; paint thinnerand other solvents; and other inappropriately inhaled products.
(18) Over-the-counter medications: Includes aspirin, dextromethorphan and other cough syrups, diphenhydramine and otheranti-histamines, ephedrine, sleep aids, and any other legally obtained, non-prescription medication.
(19) Other drugs: Includes diphenylhydantoin/phenytoin, GHB/GBL, ketamine, synthetic cannabinoid 'Spice', carisoprodol(Soma), and other drugs.
See next page for frequency table.
51
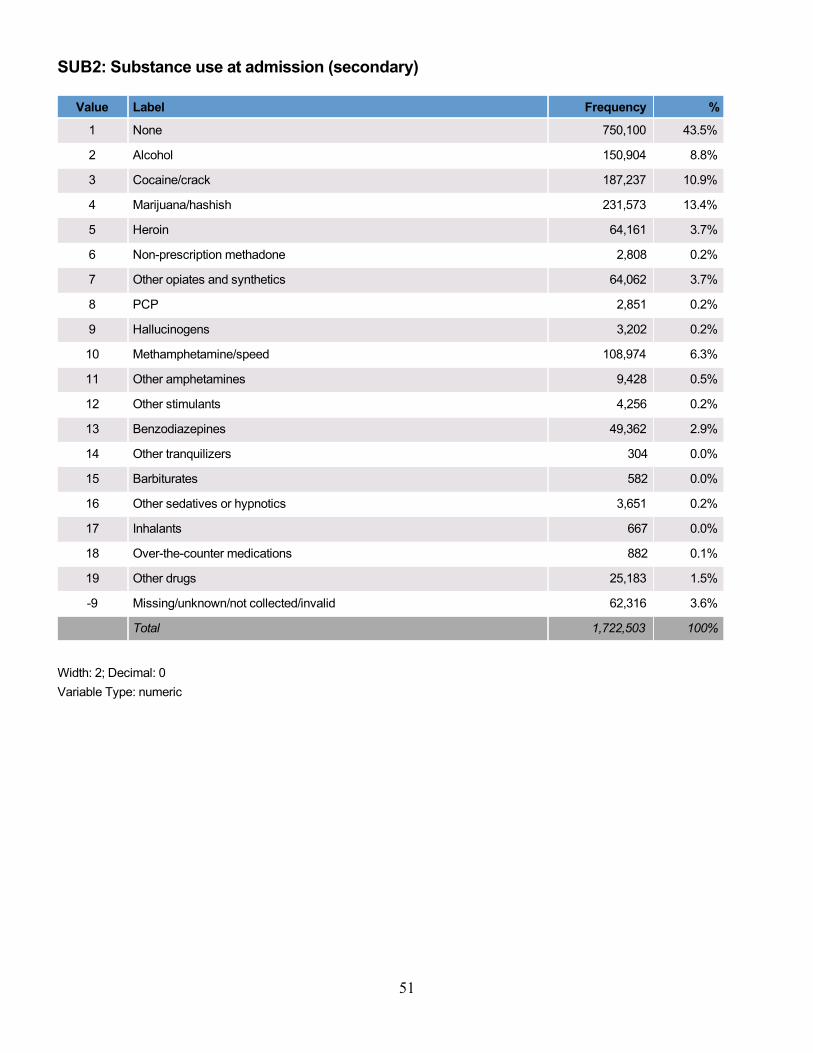
SUB2: Substance use at admission (secondary)
Value Label Frequency %
1 None 750,100 43.5%
2 Alcohol 150,904 8.8%
3 Cocaine/crack 187,237 10.9%
4 Marijuana/hashish 231,573 13.4%
5 Heroin 64,161 3.7%
6 Non-prescription methadone 2,808 0.2%
7 Other opiates and synthetics 64,062 3.7%
8 PCP 2,851 0.2%
9 Hallucinogens 3,202 0.2%
10 Methamphetamine/speed 108,974 6.3%
11 Other amphetamines 9,428 0.5%
12 Other stimulants 4,256 0.2%
13 Benzodiazepines 49,362 2.9%
14 Other tranquilizers 304 0.0%
15 Barbiturates 582 0.0%
16 Other sedatives or hypnotics 3,651 0.2%
17 Inhalants 667 0.0%
18 Over-the-counter medications 882 0.1%
19 Other drugs 25,183 1.5%
-9 Missing/unknown/not collected/invalid 62,316 3.6%
Total 1,722,503 100%
Width: 2; Decimal: 0
Variable Type: numeric
52
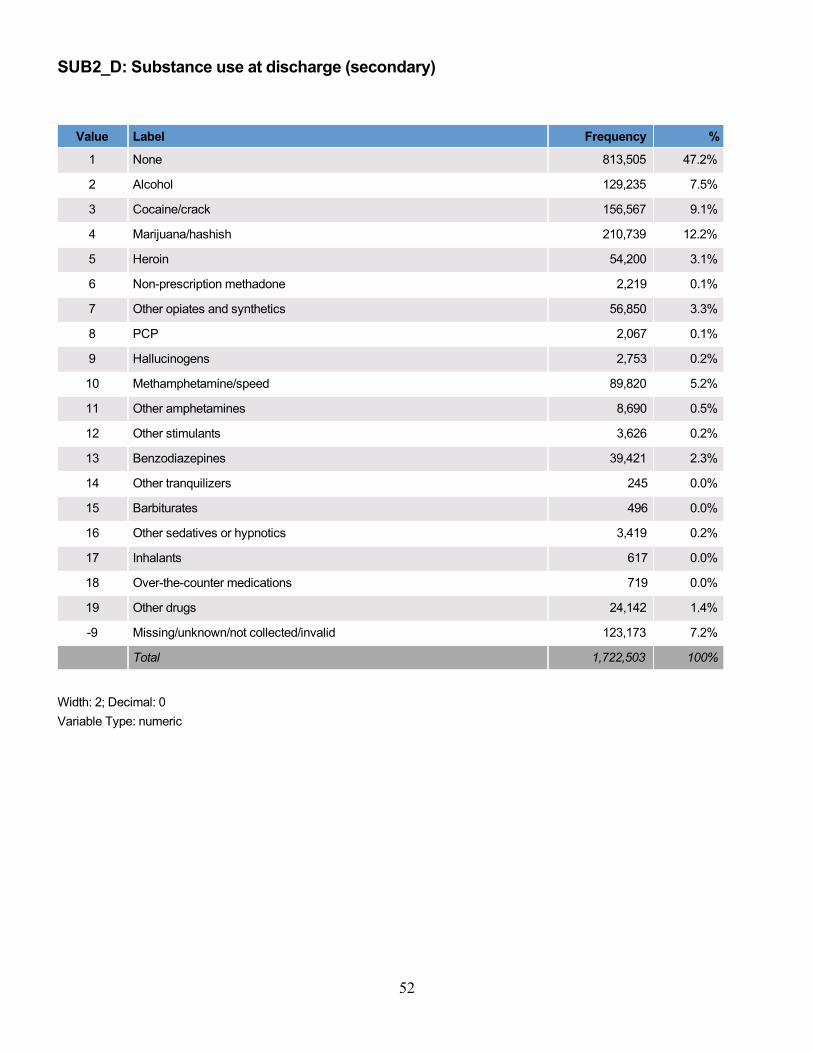
SUB2_D: Substance use at discharge (secondary)
Value Label Frequency %
1 None 813,505 47.2%
2 Alcohol 129,235 7.5%
3 Cocaine/crack 156,567 9.1%
4 Marijuana/hashish 210,739 12.2%
5 Heroin 54,200 3.1%
6 Non-prescription methadone 2,219 0.1%
7 Other opiates and synthetics 56,850 3.3%
8 PCP 2,067 0.1%
9 Hallucinogens 2,753 0.2%
10 Methamphetamine/speed 89,820 5.2%
11 Other amphetamines 8,690 0.5%
12 Other stimulants 3,626 0.2%
13 Benzodiazepines 39,421 2.3%
14 Other tranquilizers 245 0.0%
15 Barbiturates 496 0.0%
16 Other sedatives or hypnotics 3,419 0.2%
17 Inhalants 617 0.0%
18 Over-the-counter medications 719 0.0%
19 Other drugs 24,142 1.4%
-9 Missing/unknown/not collected/invalid 123,173 7.2%
Total 1,722,503 100%
Width: 2; Decimal: 0
Variable Type: numeric

53
ROUTE2: Route of administration (secondary)
This field identifies the usual route of administration of the corresponding substance identified in Substance Use (SUB2).
Value Label Frequency %
1 Oral 263,049 15.3%
2 Smoking 398,620 23.1%
3 Inhalation 120,011 7.0%
4 Injection (intravenous, intramuscular, intradermal, or subcutaneous) 116,855 6.8%
5 Other 6,747 0.4%
-9 Missing/unknown/not collected/invalid 817,221 47.4%
Total 1,722,503 100%
Width: 2; Decimal: 0
Variable Type: numeric
54
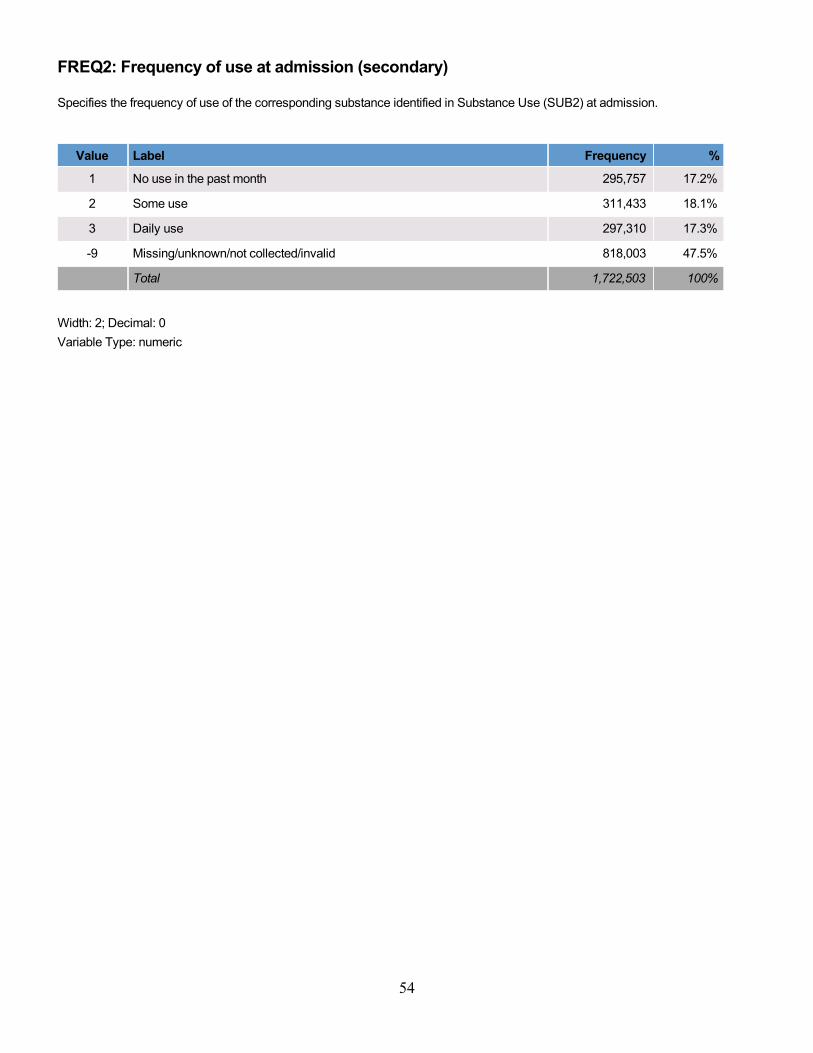
FREQ2: Frequency of use at admission (secondary)
Specifies the frequency of use of the corresponding substance identified in Substance Use (SUB2) at admission.
Value Label Frequency %
1 No use in the past month 295,757 17.2%
2 Some use 311,433 18.1%
3 Daily use 297,310 17.3%
-9 Missing/unknown/not collected/invalid 818,003 47.5%
Total 1,722,503 100%
Width: 2; Decimal: 0
Variable Type: numeric
55
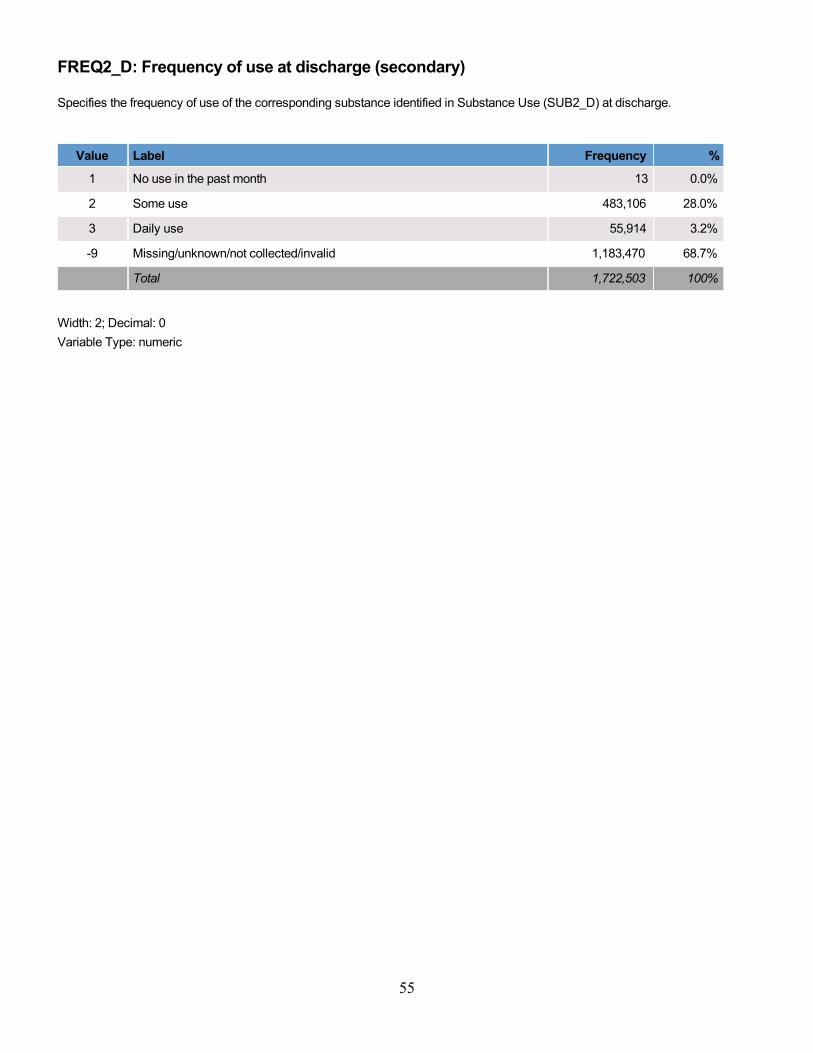
FREQ2_D: Frequency of use at discharge (secondary)
Specifies the frequency of use of the corresponding substance identified in Substance Use (SUB2_D) at discharge.
Value Label Frequency %
1 No use in the past month 13 0.0%
2 Some use 483,106 28.0%
3 Daily use 55,914 3.2%
-9 Missing/unknown/not collected/invalid 1,183,470 68.7%
Total 1,722,503 100%
Width: 2; Decimal: 0
Variable Type: numeric
56
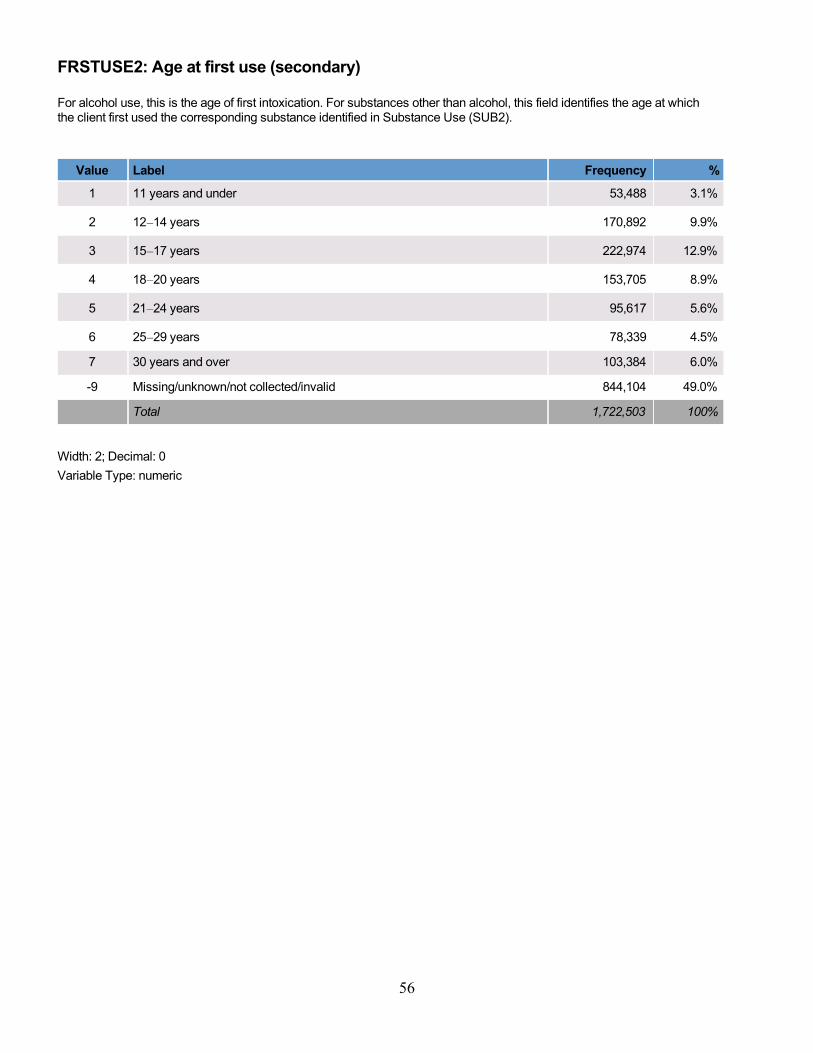
FRSTUSE2: Age at first use (secondary)
For alcohol use, this is the age of first intoxication. For substances other than alcohol, this field identifies the age at whichthe client first used the corresponding substance identified in Substance Use (SUB2).
Value Label Frequency %
1 11 years and under 53,488 3.1%
2 12–14 years 170,892 9.9%
3 15–17 years 222,974 12.9%
4 18–20 years 153,705 8.9%
5 21–24 years 95,617 5.6%
6 25–29 years 78,339 4.5%
7 30 years and over 103,384 6.0%
-9 Missing/unknown/not collected/invalid 844,104 49.0%
Total 1,722,503 100%
Width: 2; Decimal: 0
Variable Type: numeric

57
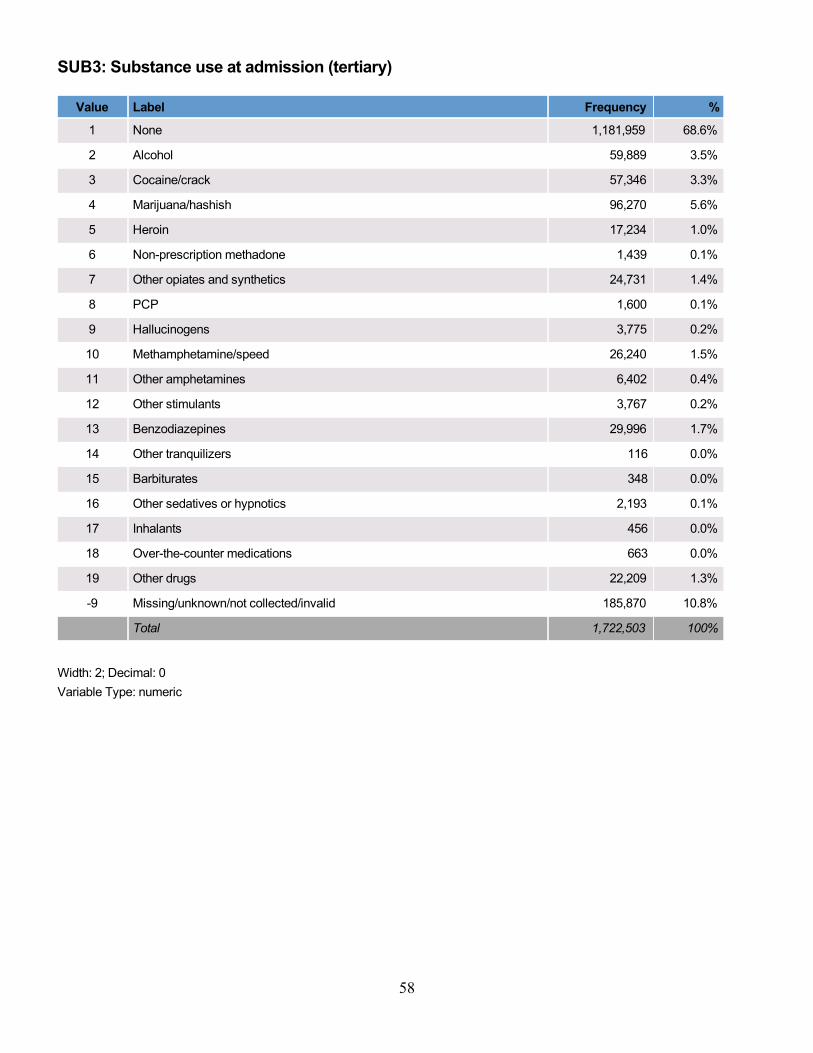
SUB3: Substance use at admission (tertiary)
The fields SUB3 and SUB3_D identify the client's tertiary substance use at admission or discharge.
(1) None
(2) Alcohol
(3) Cocaine/crack
(4) Marijuana/hashish: Includes THC and any other cannabis sativa preparations.
(5) Heroin
(6) Non-prescription methadone
(7) Other opiates and synthetics: Includes buprenorphine, butorphanol, codeine, hydrocodone, hydromorphone, meperidine,morphine, opium, oxycodone, pentazocine, propoxyphene, tramadol, and other narcotic analgesics, opiates, or synthetics.
(8) PCP: Phencyclidine
(9) Hallucinogens: Includes LSD, DMT, mescaline, peyote, psilocybin, STP, and other hallucinogens.
(10) Methamphetamine/speed
(11) Other amphetamines: Includes amphetamines, MDMA, ‘bath salts’, phenmetrazine, and other amines and related drugs.
(12) Other stimulants: Includes methylphenidate and any other stimulants.
(13) Benzodiazepines: Includes alprazolam, chlordiazepoxide, clonazepam, clorazepate, diazepam, flunitrazepam,flurazepam, halazepam, lorazepam, oxazepam, prazepam, temazepam, triazolam, and other unspecified benzodiazepines.
(14) Other tranquilizers: Includes meprobamate, and other non-benzodiazepine tranquilizers.
(15) Barbiturates: Includes amobarbital, pentobarbital, phenobarbital, secobarbital, etc.
(16) Other sedatives or hypnotics: Includes chloral hydrate, ethchlorvynol, glutethimide, methaqualone, and othernon-barbiturate sedatives and hypnotics.
(17) Inhalants: Includes aerosols; chloroform, ether, nitrous oxide and other anesthetics; gasoline; glue; nitrites; paint thinnerand other solvents; and other inappropriately inhaled products.
(18) Over-the-counter medications: Includes aspirin, dextromethorphan and other cough syrups, diphenhydramine and otheranti-histamines, ephedrine, sleep aids, and any other legally obtained, non-prescription medication.
(19) Other drugs: Includes diphenylhydantoin/phenytoin, GHB/GBL, ketamine, synthetic cannabinoid 'Spice', carisoprodol(Soma), and other drugs.
See next page for frequency table.
58
SUB3: Substance use at admission (tertiary)
Value Label Frequency %
1 None 1,181,959 68.6%
2 Alcohol 59,889 3.5%
3 Cocaine/crack 57,346 3.3%
4 Marijuana/hashish 96,270 5.6%
5 Heroin 17,234 1.0%
6 Non-prescription methadone 1,439 0.1%
7 Other opiates and synthetics 24,731 1.4%
8 PCP 1,600 0.1%
9 Hallucinogens 3,775 0.2%
10 Methamphetamine/speed 26,240 1.5%
11 Other amphetamines 6,402 0.4%
12 Other stimulants 3,767 0.2%
13 Benzodiazepines 29,996 1.7%
14 Other tranquilizers 116 0.0%
15 Barbiturates 348 0.0%
16 Other sedatives or hypnotics 2,193 0.1%
17 Inhalants 456 0.0%
18 Over-the-counter medications 663 0.0%
19 Other drugs 22,209 1.3%
-9 Missing/unknown/not collected/invalid 185,870 10.8%
Total 1,722,503 100%
Width: 2; Decimal: 0
Variable Type: numeric
59
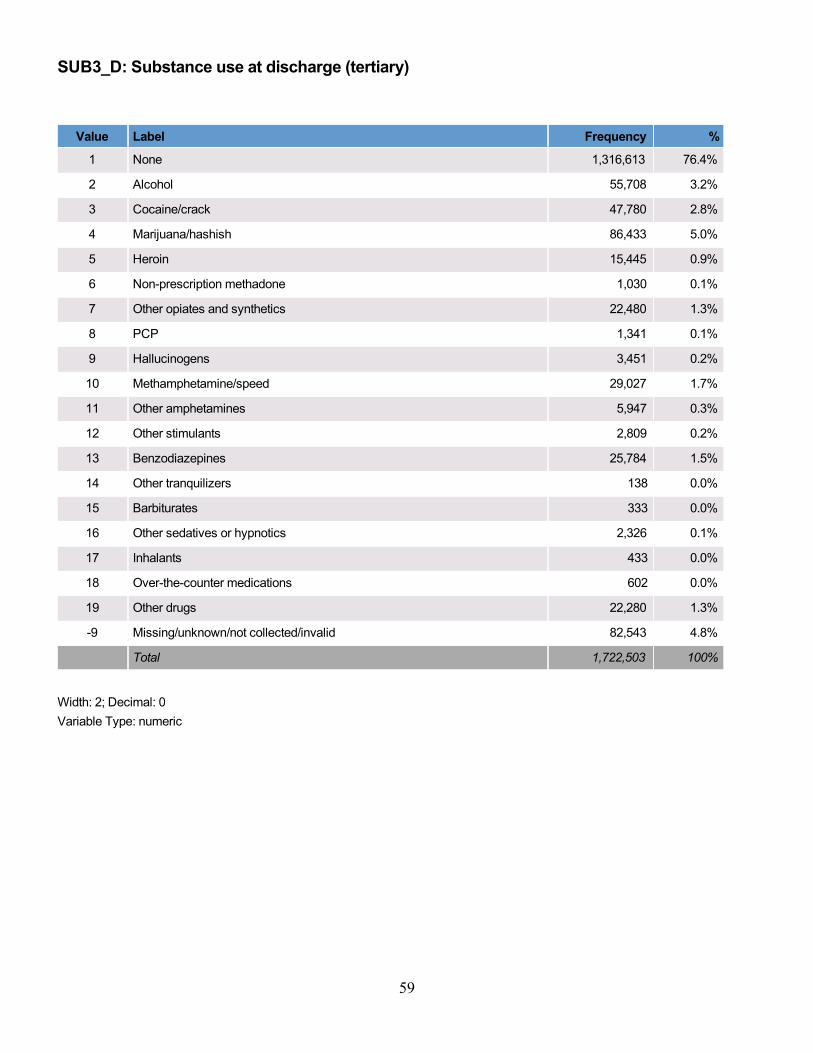
SUB3_D: Substance use at discharge (tertiary)
Value Label Frequency %
1 None 1,316,613 76.4%
2 Alcohol 55,708 3.2%
3 Cocaine/crack 47,780 2.8%
4 Marijuana/hashish 86,433 5.0%
5 Heroin 15,445 0.9%
6 Non-prescription methadone 1,030 0.1%
7 Other opiates and synthetics 22,480 1.3%
8 PCP 1,341 0.1%
9 Hallucinogens 3,451 0.2%
10 Methamphetamine/speed 29,027 1.7%
11 Other amphetamines 5,947 0.3%
12 Other stimulants 2,809 0.2%
13 Benzodiazepines 25,784 1.5%
14 Other tranquilizers 138 0.0%
15 Barbiturates 333 0.0%
16 Other sedatives or hypnotics 2,326 0.1%
17 Inhalants 433 0.0%
18 Over-the-counter medications 602 0.0%
19 Other drugs 22,280 1.3%
-9 Missing/unknown/not collected/invalid 82,543 4.8%
Total 1,722,503 100%
Width: 2; Decimal: 0
Variable Type: numeric

60
ROUTE3: Route of administration (tertiary)
This field identifies the usual route of administration of the corresponding substance identified in Substance Use (SUB3).
Value Label Frequency %
1 Oral 122,303 7.1%
2 Smoking 154,215 9.0%
3 Inhalation 48,044 2.8%
4 Injection (intravenous, intramuscular, intradermal, or subcutaneous) 31,983 1.9%
5 Other 3,439 0.2%
-9 Missing/unknown/not collected/invalid 1,362,519 79.1%
Total 1,722,503 100%
Width: 2; Decimal: 0
Variable Type: numeric
61
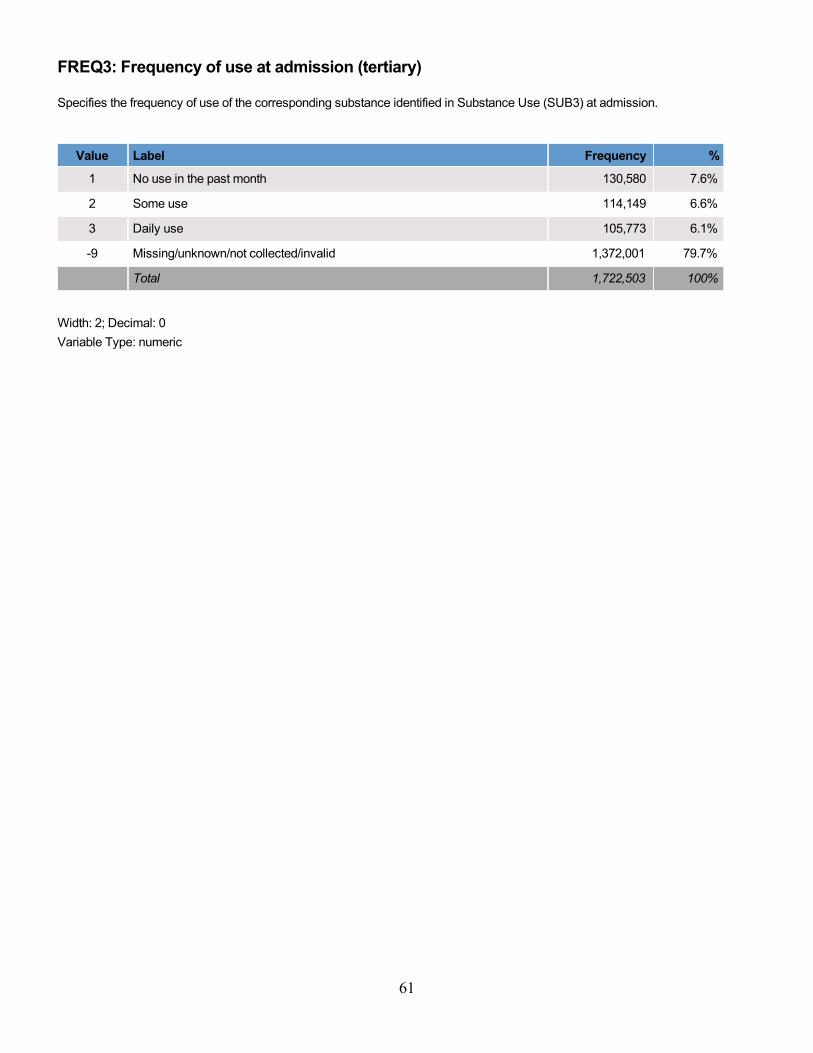
FREQ3: Frequency of use at admission (tertiary)
Specifies the frequency of use of the corresponding substance identified in Substance Use (SUB3) at admission.
Value Label Frequency %
1 No use in the past month 130,580 7.6%
2 Some use 114,149 6.6%
3 Daily use 105,773 6.1%
-9 Missing/unknown/not collected/invalid 1,372,001 79.7%
Total 1,722,503 100%
Width: 2; Decimal: 0
Variable Type: numeric
62
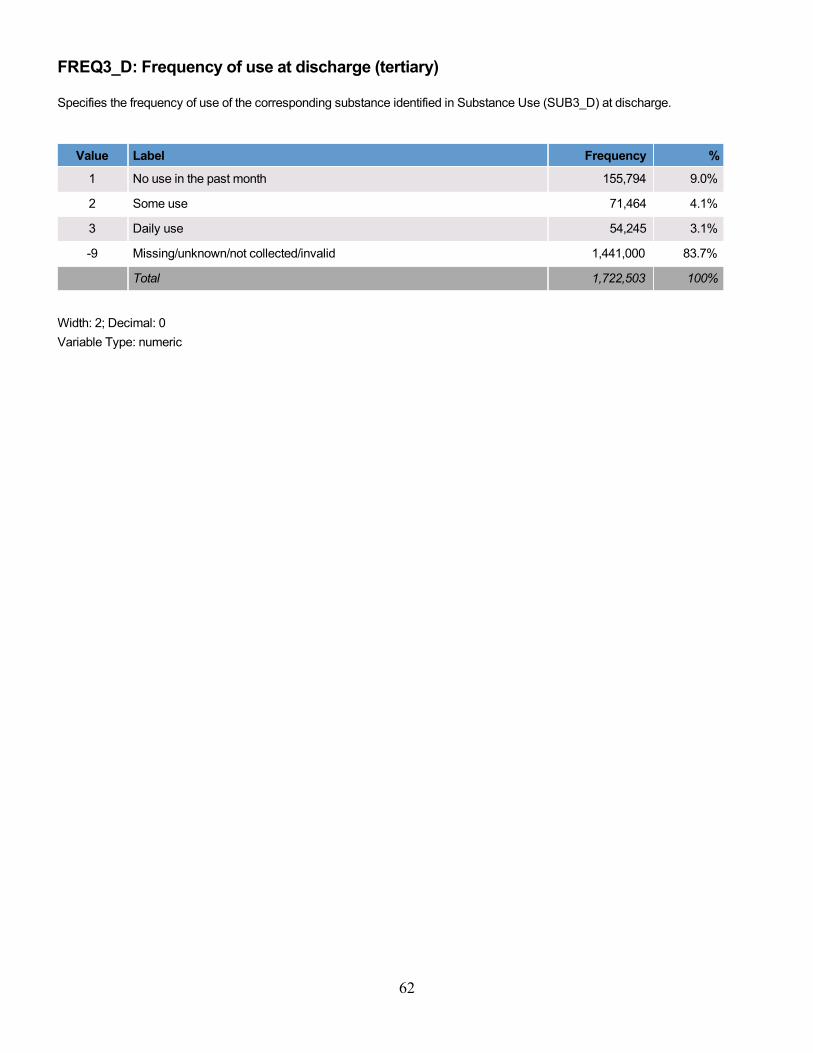
FREQ3_D: Frequency of use at discharge (tertiary)
Specifies the frequency of use of the corresponding substance identified in Substance Use (SUB3_D) at discharge.
Value Label Frequency %
1 No use in the past month 155,794 9.0%
2 Some use 71,464 4.1%
3 Daily use 54,245 3.1%
-9 Missing/unknown/not collected/invalid 1,441,000 83.7%
Total 1,722,503 100%
Width: 2; Decimal: 0
Variable Type: numeric
63
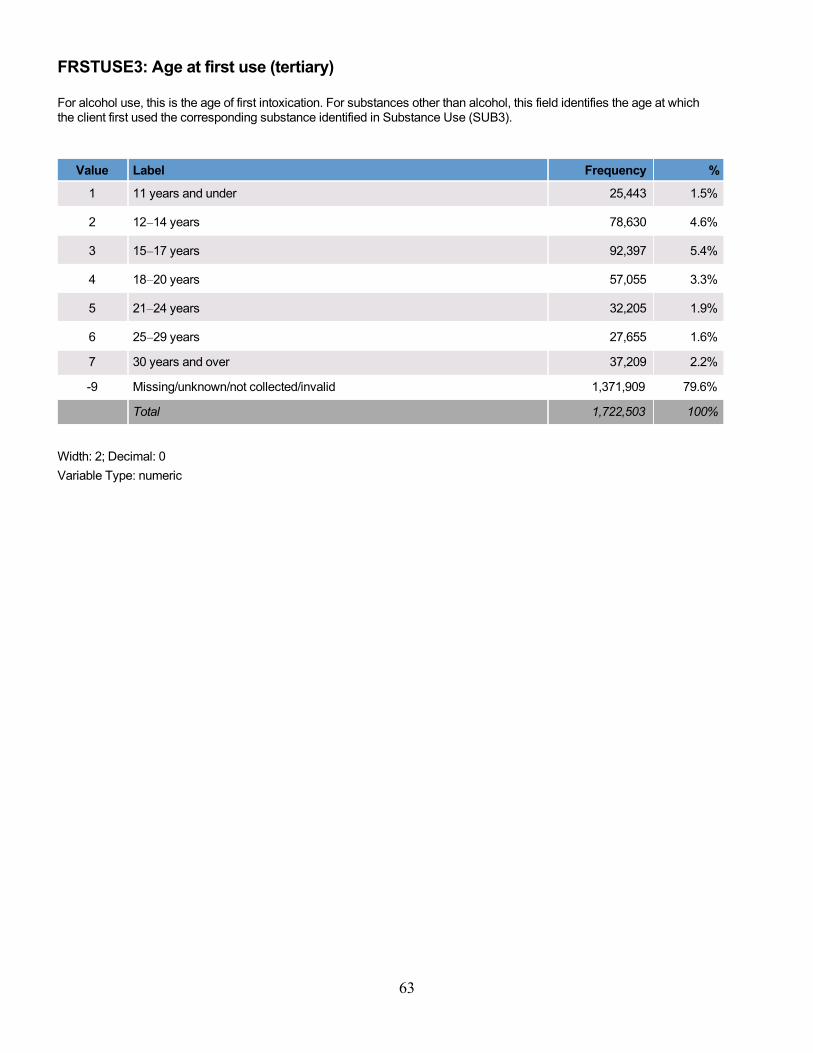
FRSTUSE3: Age at first use (tertiary)
For alcohol use, this is the age of first intoxication. For substances other than alcohol, this field identifies the age at whichthe client first used the corresponding substance identified in Substance Use (SUB3).
Value Label Frequency %
1 11 years and under 25,443 1.5%
2 12–14 years 78,630 4.6%
3 15–17 years 92,397 5.4%
4 18–20 years 57,055 3.3%
5 21–24 years 32,205 1.9%
6 25–29 years 27,655 1.6%
7 30 years and over 37,209 2.2%
-9 Missing/unknown/not collected/invalid 1,371,909 79.6%
Total 1,722,503 100%
Width: 2; Decimal: 0
Variable Type: numeric
64
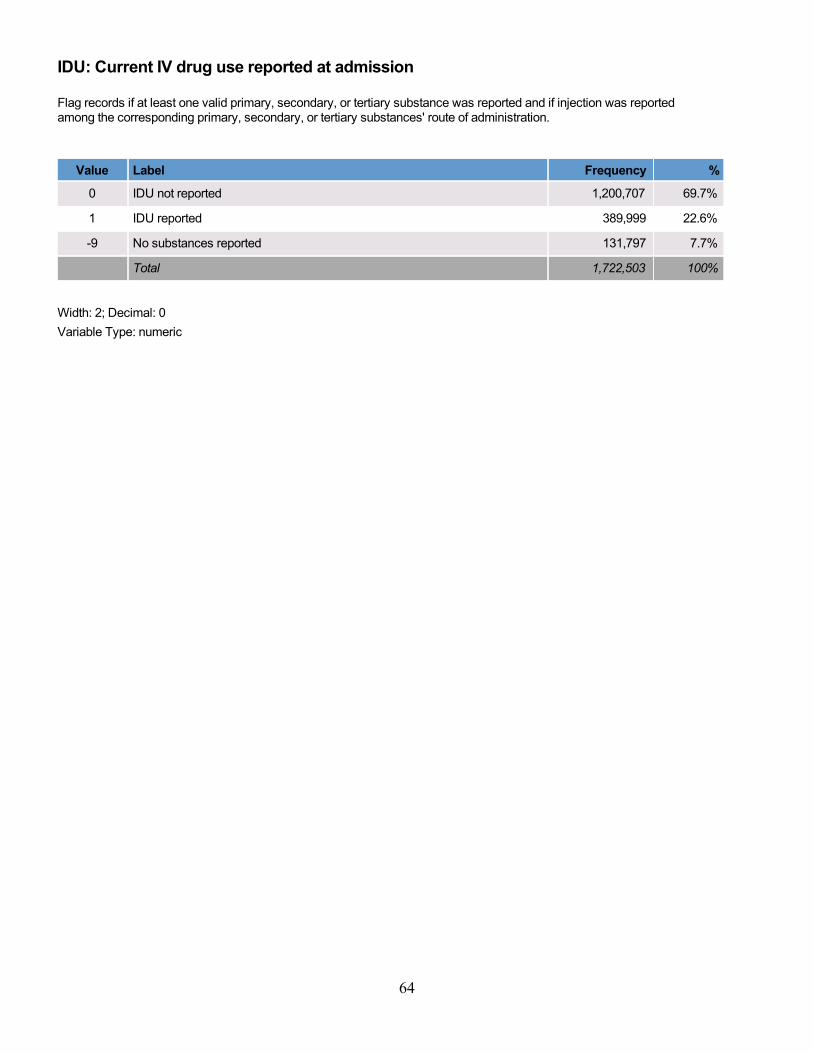
IDU: Current IV drug use reported at admission
Flag records if at least one valid primary, secondary, or tertiary substance was reported and if injection was reportedamong the corresponding primary, secondary, or tertiary substances' route of administration.
Value Label Frequency %
0 IDU not reported 1,200,707 69.7%
1 IDU reported 389,999 22.6%
-9 No substances reported 131,797 7.7%
Total 1,722,503 100%
Width: 2; Decimal: 0
Variable Type: numeric

65
ALCFLG: Alcohol reported at admission
Flag records if alcohol was reported as the primary, secondary, or tertiary substance at the time of admission.
Value Label Frequency %
0 Substance not reported 990,037 57.5%
1 Substance reported 732,466 42.5%
Total 1,722,503 100%
Width: 1; Decimal: 0
Variable Type: numeric
66
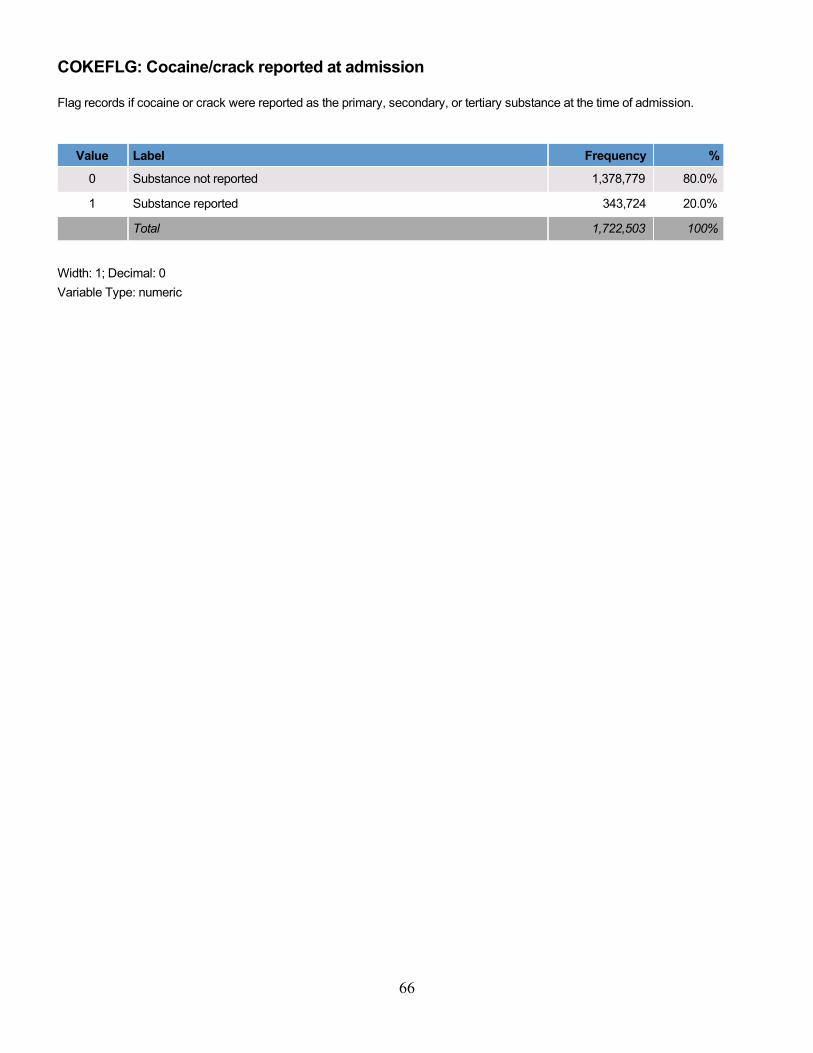
COKEFLG: Cocaine/crack reported at admission
Flag records if cocaine or crack were reported as the primary, secondary, or tertiary substance at the time of admission.
Value Label Frequency %
0 Substance not reported 1,378,779 80.0%
1 Substance reported 343,724 20.0%
Total 1,722,503 100%
Width: 1; Decimal: 0
Variable Type: numeric

67
MARFLG: Marijuana/hashish reported at admission
Flag records if marijuana or hashish were reported as the primary, secondary, or tertiary substance at the time of admission.
Value Label Frequency %
0 Substance not reported 1,206,914 70.1%
1 Substance reported 515,589 29.9%
Total 1,722,503 100%
Width: 1; Decimal: 0
Variable Type: numeric
68
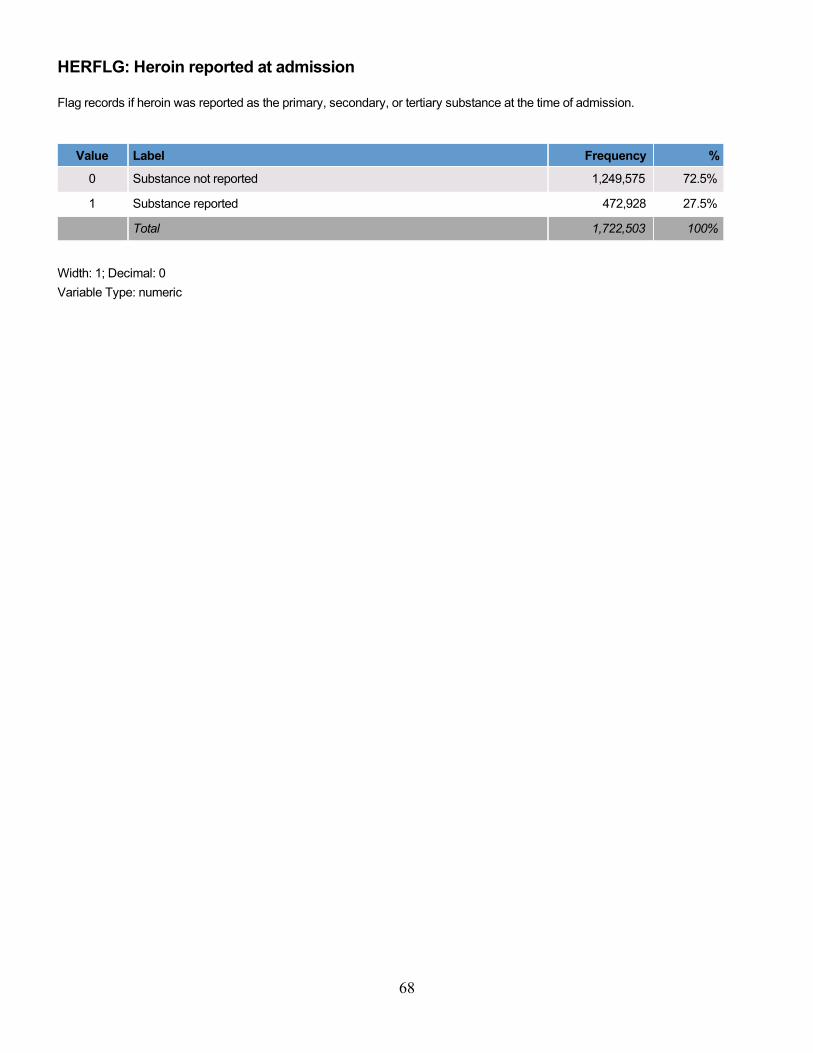
HERFLG: Heroin reported at admission
Flag records if heroin was reported as the primary, secondary, or tertiary substance at the time of admission.
Value Label Frequency %
0 Substance not reported 1,249,575 72.5%
1 Substance reported 472,928 27.5%
Total 1,722,503 100%
Width: 1; Decimal: 0
Variable Type: numeric
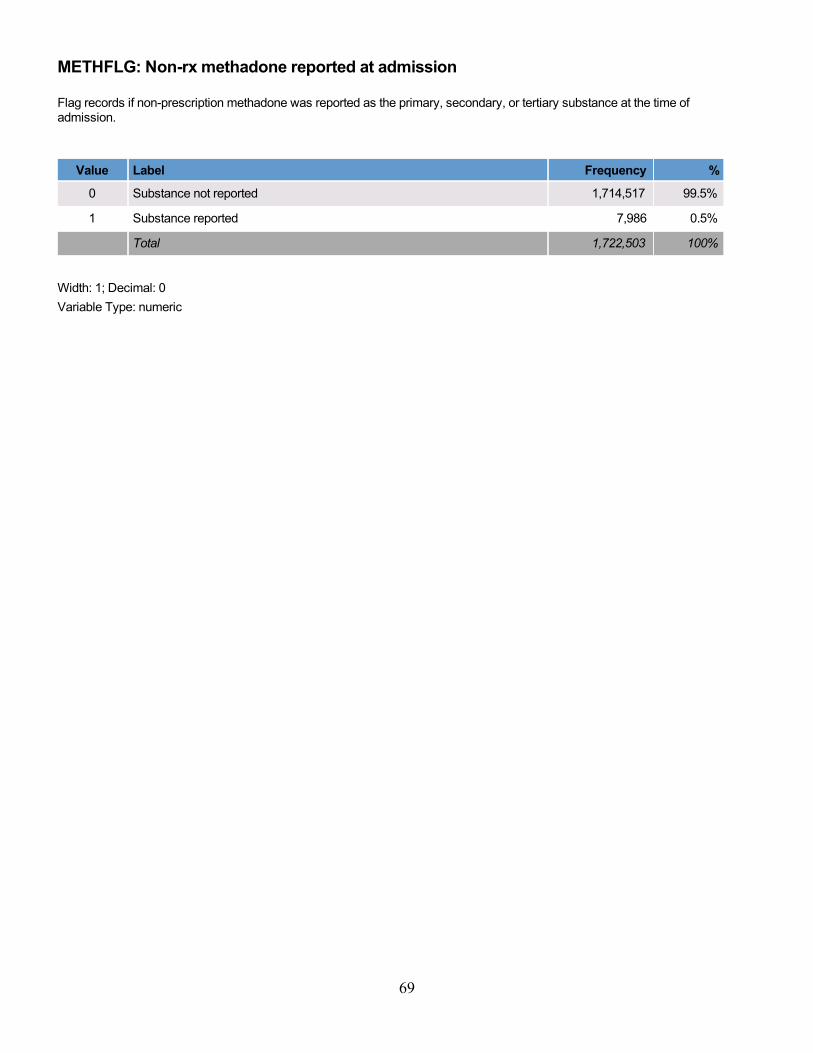
69
METHFLG: Non-rx methadone reported at admission
Flag records if non-prescription methadone was reported as the primary, secondary, or tertiary substance at the time ofadmission.
Value Label Frequency %
0 Substance not reported 1,714,517 99.5%
1 Substance reported 7,986 0.5%
Total 1,722,503 100%
Width: 1; Decimal: 0
Variable Type: numeric
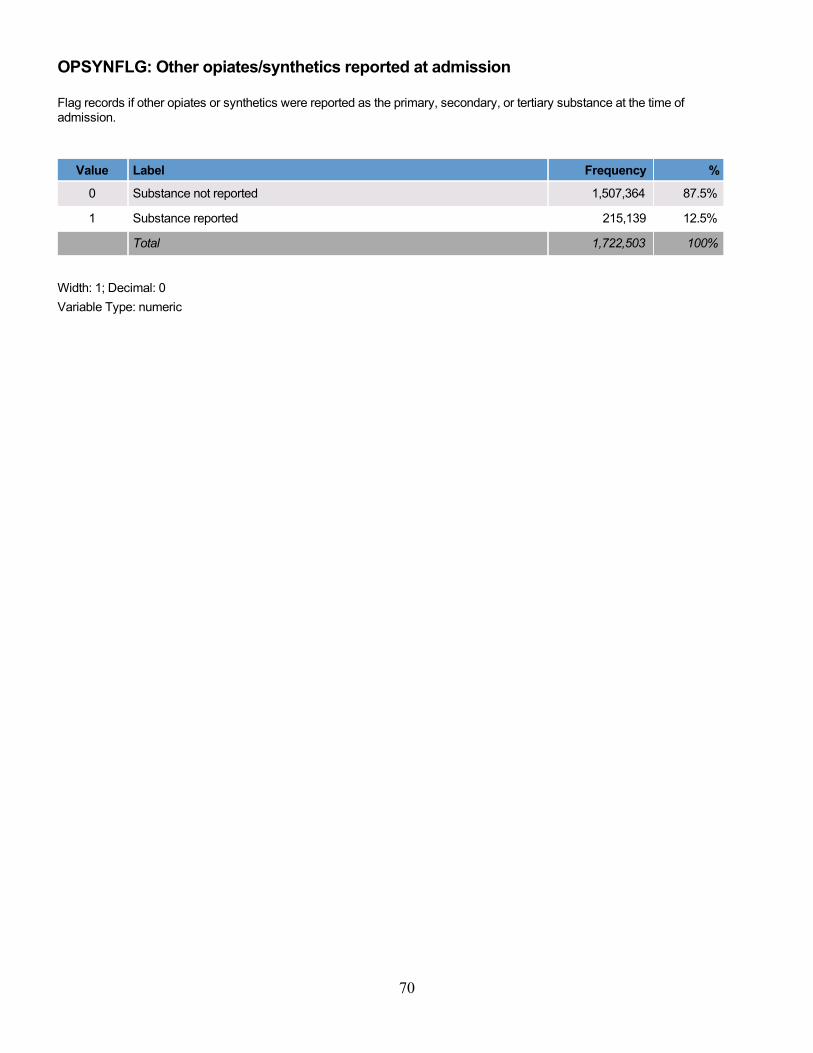
70
OPSYNFLG: Other opiates/synthetics reported at admission
Flag records if other opiates or synthetics were reported as the primary, secondary, or tertiary substance at the time ofadmission.
Value Label Frequency %
0 Substance not reported 1,507,364 87.5%
1 Substance reported 215,139 12.5%
Total 1,722,503 100%
Width: 1; Decimal: 0
Variable Type: numeric

71
PCPFLG: PCP reported at admission
Flag records if PCP was reported as the primary, secondary, or tertiary substance at the time of admission.
Value Label Frequency %
0 Substance not reported 1,713,859 99.5%
1 Substance reported 8,644 0.5%
Total 1,722,503 100%
Width: 1; Decimal: 0
Variable Type: numeric

72
HALLFLG: Hallucinogens reported at admission
Flag records if other hallucinogens were reported as the primary, secondary, or tertiary substance at the time of admission.
Value Label Frequency %
0 Substance not reported 1,713,675 99.5%
1 Substance reported 8,828 0.5%
Total 1,722,503 100%
Width: 1; Decimal: 0
Variable Type: numeric
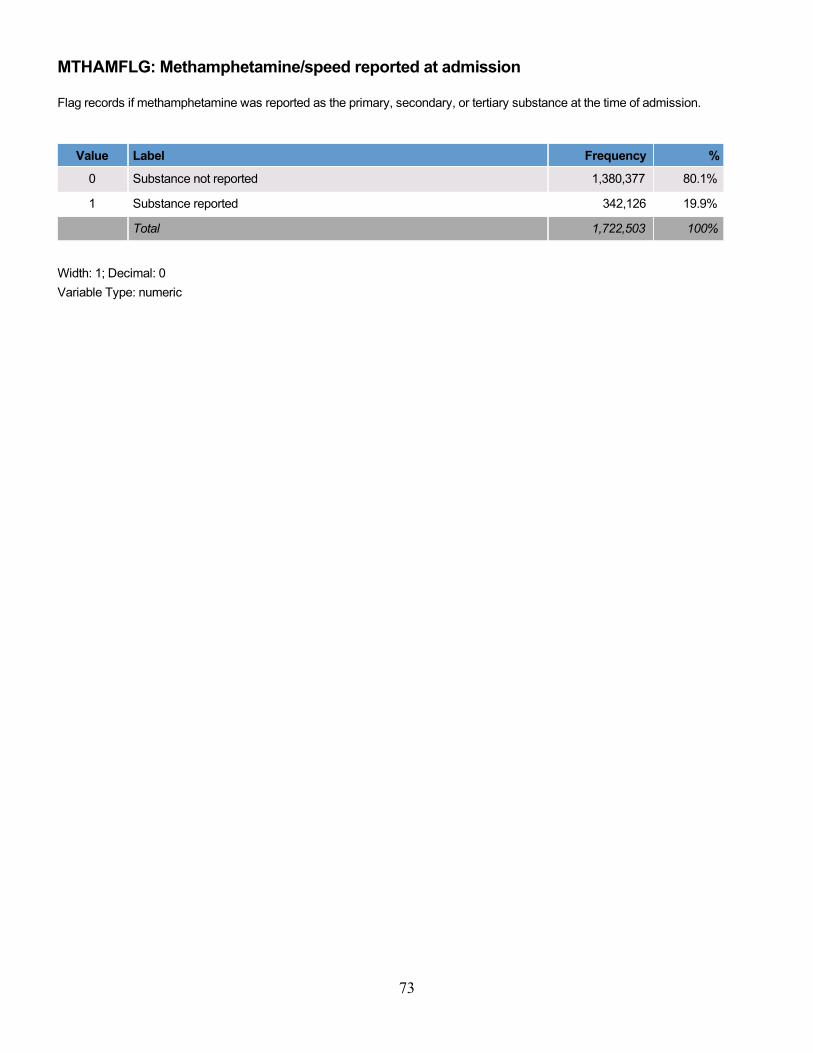
73
MTHAMFLG: Methamphetamine/speed reported at admission
Flag records if methamphetamine was reported as the primary, secondary, or tertiary substance at the time of admission.
Value Label Frequency %
0 Substance not reported 1,380,377 80.1%
1 Substance reported 342,126 19.9%
Total 1,722,503 100%
Width: 1; Decimal: 0
Variable Type: numeric

74
AMPHFLG: Other amphetamines reported at admission
Flag records if other amphetamines were reported as the primary, secondary, or tertiary substance at the time of admission.
Value Label Frequency %
0 Substance not reported 1,695,571 98.4%
1 Substance reported 26,932 1.6%
Total 1,722,503 100%
Width: 1; Decimal: 0
Variable Type: numeric

75
STIMFLG: Other stimulants reported at admission
Flag records if other stimulants were reported as the primary, secondary, or tertiary substance at the time of admission.
Value Label Frequency %
0 Substance not reported 1,712,047 99.4%
1 Substance reported 10,456 0.6%
Total 1,722,503 100%
Width: 1; Decimal: 0
Variable Type: numeric
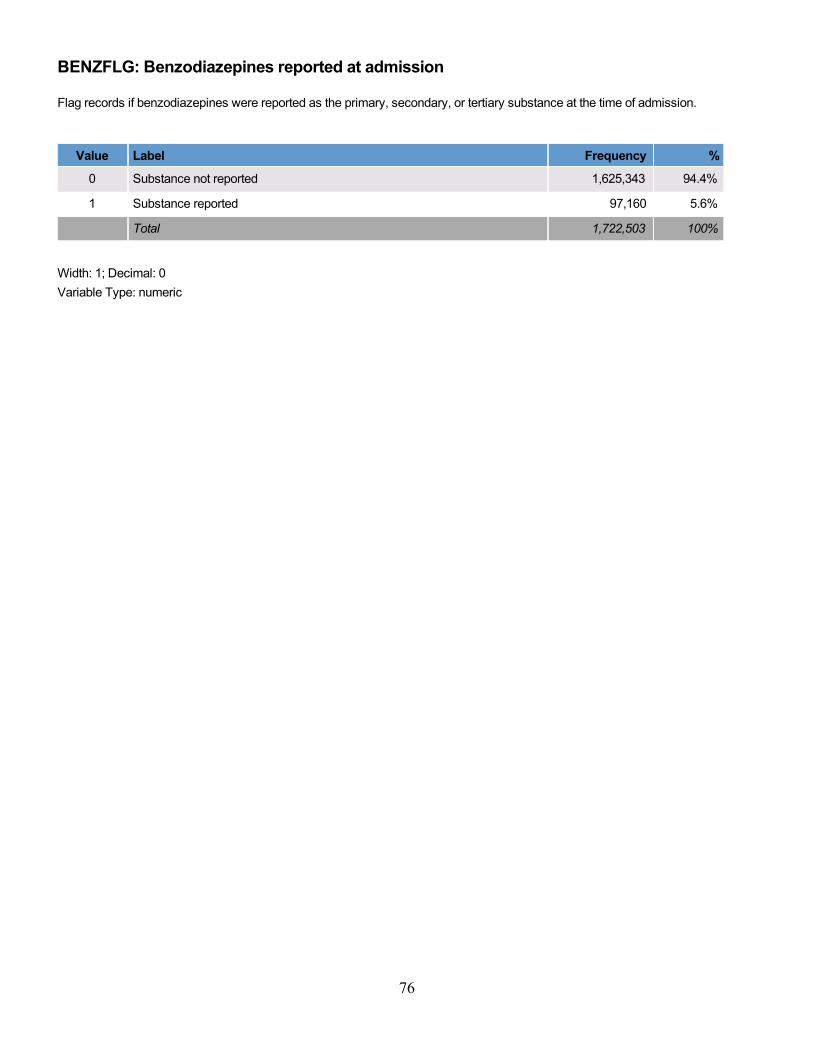
76
BENZFLG: Benzodiazepines reported at admission
Flag records if benzodiazepines were reported as the primary, secondary, or tertiary substance at the time of admission.
Value Label Frequency %
0 Substance not reported 1,625,343 94.4%
1 Substance reported 97,160 5.6%
Total 1,722,503 100%
Width: 1; Decimal: 0
Variable Type: numeric

77
TRNQFLG: Other tranquilizers reported at admission
Flag records if other tranquilizers were reported as the primary, secondary, or tertiary substance at the time of admission.
Value Label Frequency %
0 Substance not reported 1,721,961 100%
1 Substance reported 542 0.0%
Total 1,722,503 100%
Width: 1; Decimal: 0
Variable Type: numeric
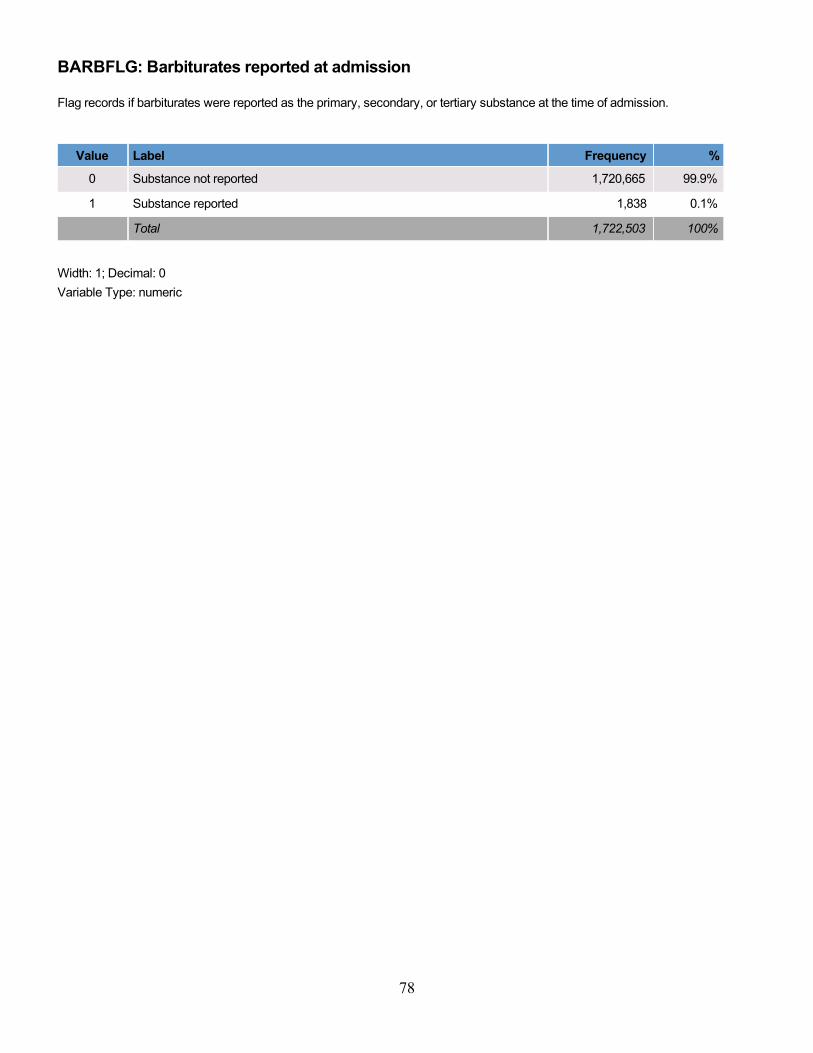
78
BARBFLG: Barbiturates reported at admission
Flag records if barbiturates were reported as the primary, secondary, or tertiary substance at the time of admission.
Value Label Frequency %
0 Substance not reported 1,720,665 99.9%
1 Substance reported 1,838 0.1%
Total 1,722,503 100%
Width: 1; Decimal: 0
Variable Type: numeric
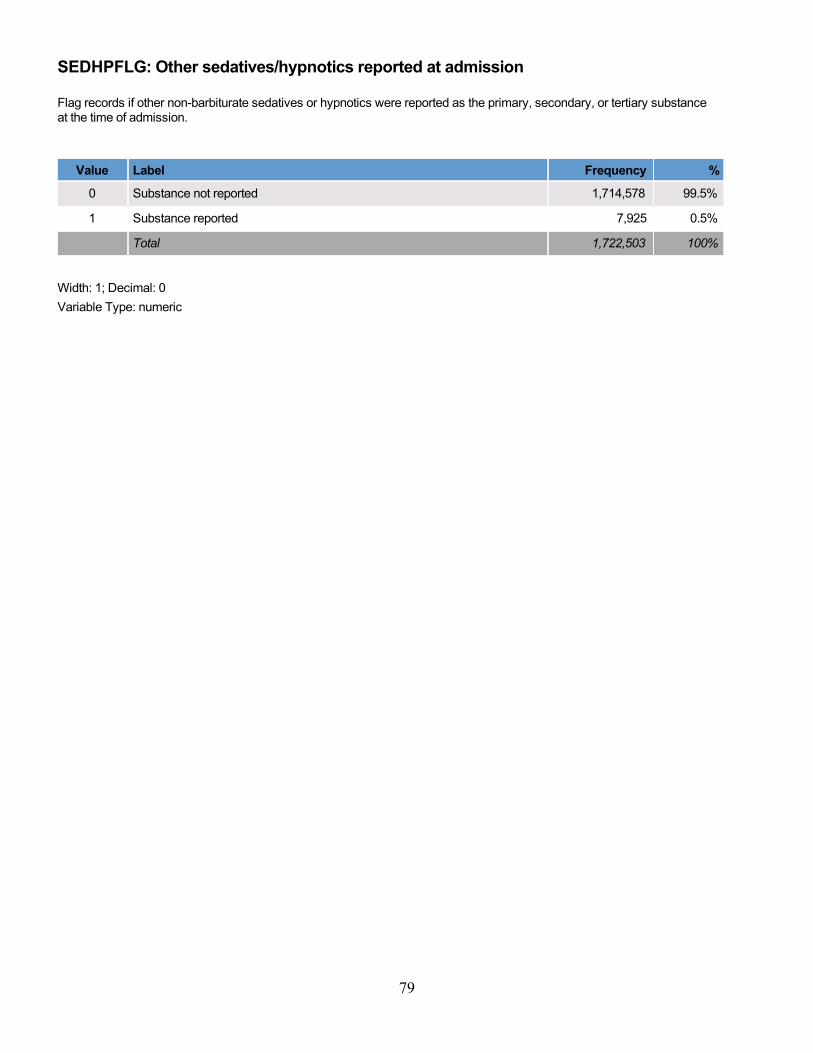
79
SEDHPFLG: Other sedatives/hypnotics reported at admission
Flag records if other non-barbiturate sedatives or hypnotics were reported as the primary, secondary, or tertiary substanceat the time of admission.
Value Label Frequency %
0 Substance not reported 1,714,578 99.5%
1 Substance reported 7,925 0.5%
Total 1,722,503 100%
Width: 1; Decimal: 0
Variable Type: numeric
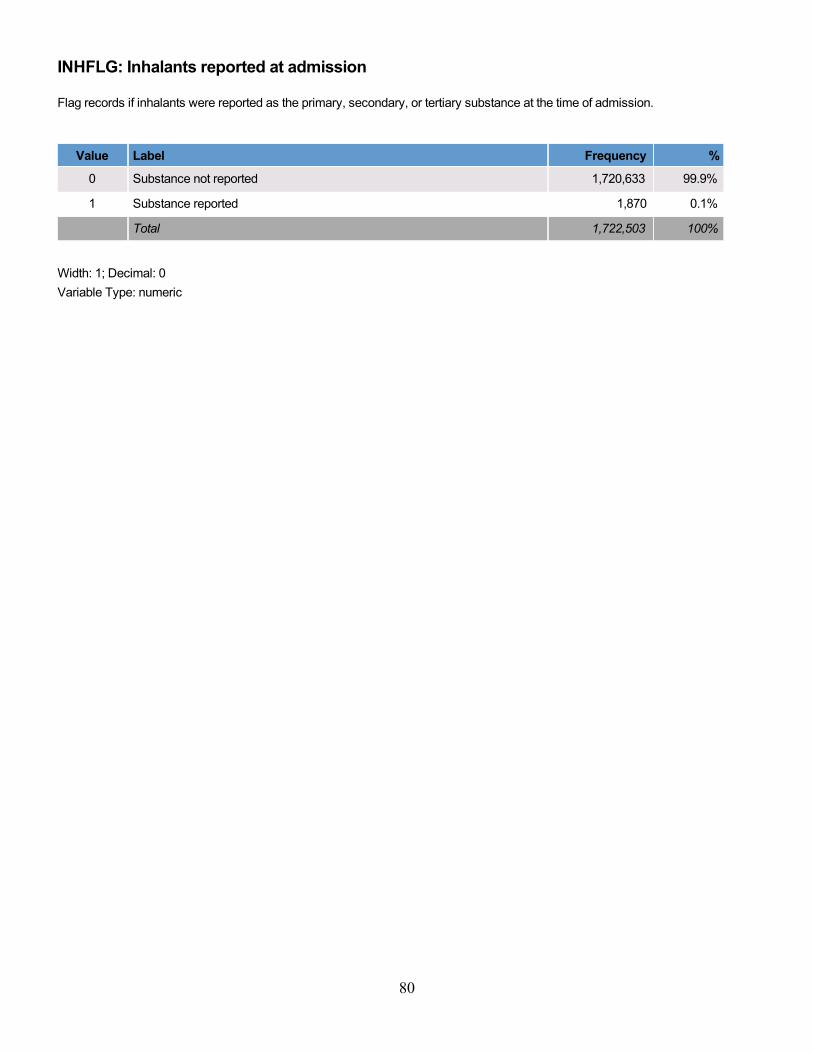
80
INHFLG: Inhalants reported at admission
Flag records if inhalants were reported as the primary, secondary, or tertiary substance at the time of admission.
Value Label Frequency %
0 Substance not reported 1,720,633 99.9%
1 Substance reported 1,870 0.1%
Total 1,722,503 100%
Width: 1; Decimal: 0
Variable Type: numeric
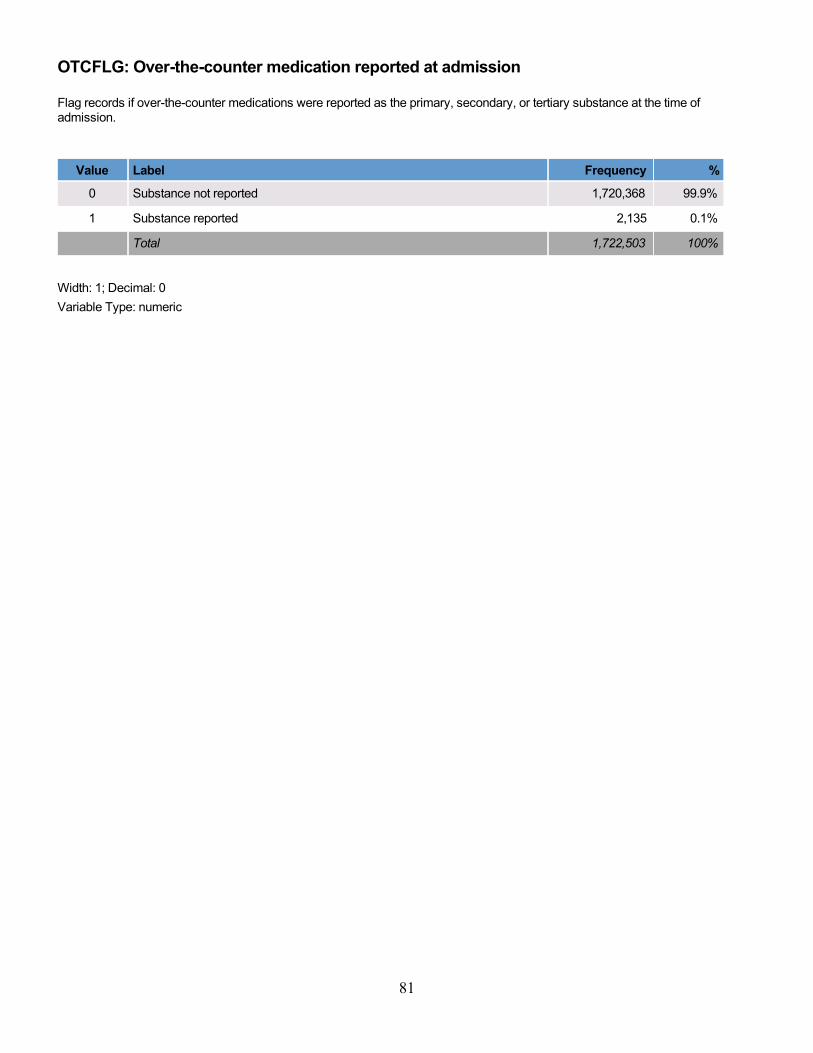
81
OTCFLG: Over-the-counter medication reported at admission
Flag records if over-the-counter medications were reported as the primary, secondary, or tertiary substance at the time ofadmission.
Value Label Frequency %
0 Substance not reported 1,720,368 99.9%
1 Substance reported 2,135 0.1%
Total 1,722,503 100%
Width: 1; Decimal: 0
Variable Type: numeric
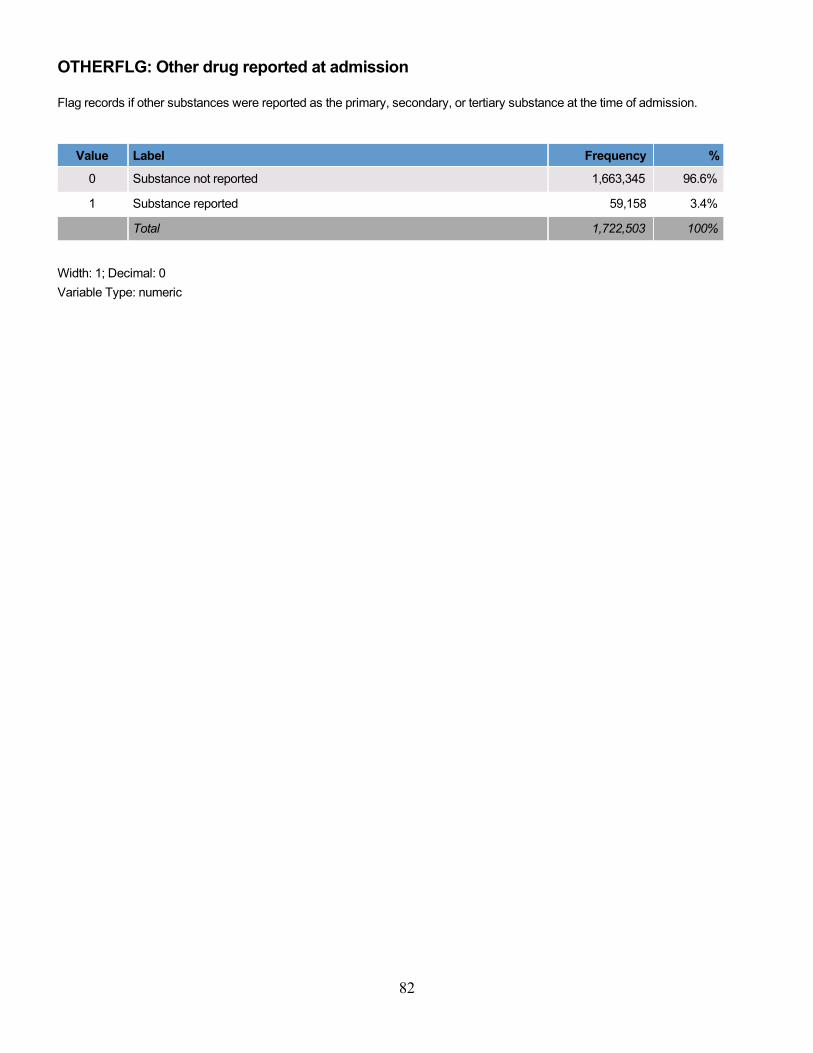
82
OTHERFLG: Other drug reported at admission
Flag records if other substances were reported as the primary, secondary, or tertiary substance at the time of admission.
Value Label Frequency %
0 Substance not reported 1,663,345 96.6%
1 Substance reported 59,158 3.4%
Total 1,722,503 100%
Width: 1; Decimal: 0
Variable Type: numeric
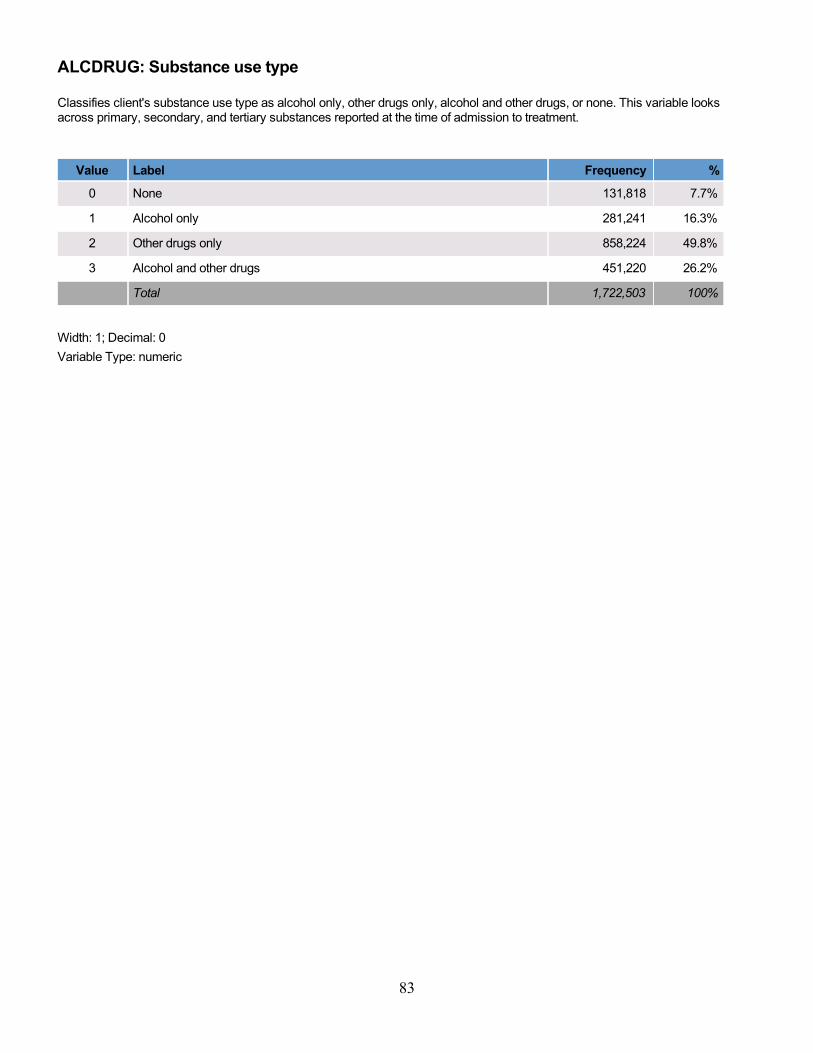
83
ALCDRUG: Substance use type
Classifies client's substance use type as alcohol only, other drugs only, alcohol and other drugs, or none. This variable looksacross primary, secondary, and tertiary substances reported at the time of admission to treatment.
Value Label Frequency %
0 None 131,818 7.7%
1 Alcohol only 281,241 16.3%
2 Other drugs only 858,224 49.8%
3 Alcohol and other drugs 451,220 26.2%
Total 1,722,503 100%
Width: 1; Decimal: 0
Variable Type: numeric
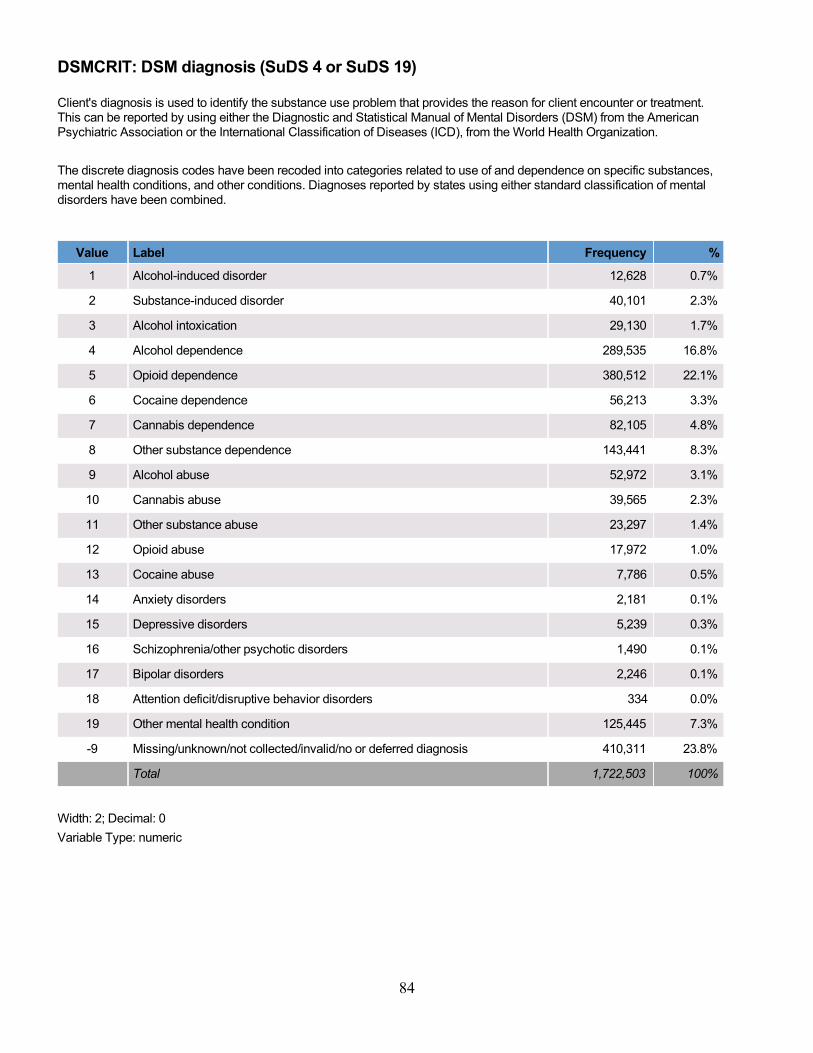
84
DSMCRIT: DSM diagnosis (SuDS 4 or SuDS 19)
Client's diagnosis is used to identify the substance use problem that provides the reason for client encounter or treatment.This can be reported by using either the Diagnostic and Statistical Manual of Mental Disorders (DSM) from the AmericanPsychiatric Association or the International Classification of Diseases (ICD), from the World Health Organization.
The discrete diagnosis codes have been recoded into categories related to use of and dependence on specific substances,mental health conditions, and other conditions. Diagnoses reported by states using either standard classification of mentaldisorders have been combined.
Value Label Frequency %
1 Alcohol-induced disorder 12,628 0.7%
2 Substance-induced disorder 40,101 2.3%
3 Alcohol intoxication 29,130 1.7%
4 Alcohol dependence 289,535 16.8%
5 Opioid dependence 380,512 22.1%
6 Cocaine dependence 56,213 3.3%
7 Cannabis dependence 82,105 4.8%
8 Other substance dependence 143,441 8.3%
9 Alcohol abuse 52,972 3.1%
10 Cannabis abuse 39,565 2.3%
11 Other substance abuse 23,297 1.4%
12 Opioid abuse 17,972 1.0%
13 Cocaine abuse 7,786 0.5%
14 Anxiety disorders 2,181 0.1%
15 Depressive disorders 5,239 0.3%
16 Schizophrenia/other psychotic disorders 1,490 0.1%
17 Bipolar disorders 2,246 0.1%
18 Attention deficit/disruptive behavior disorders 334 0.0%
19 Other mental health condition 125,445 7.3%
-9 Missing/unknown/not collected/invalid/no or deferred diagnosis 410,311 23.8%
Total 1,722,503 100%
Width: 2; Decimal: 0
Variable Type: numeric
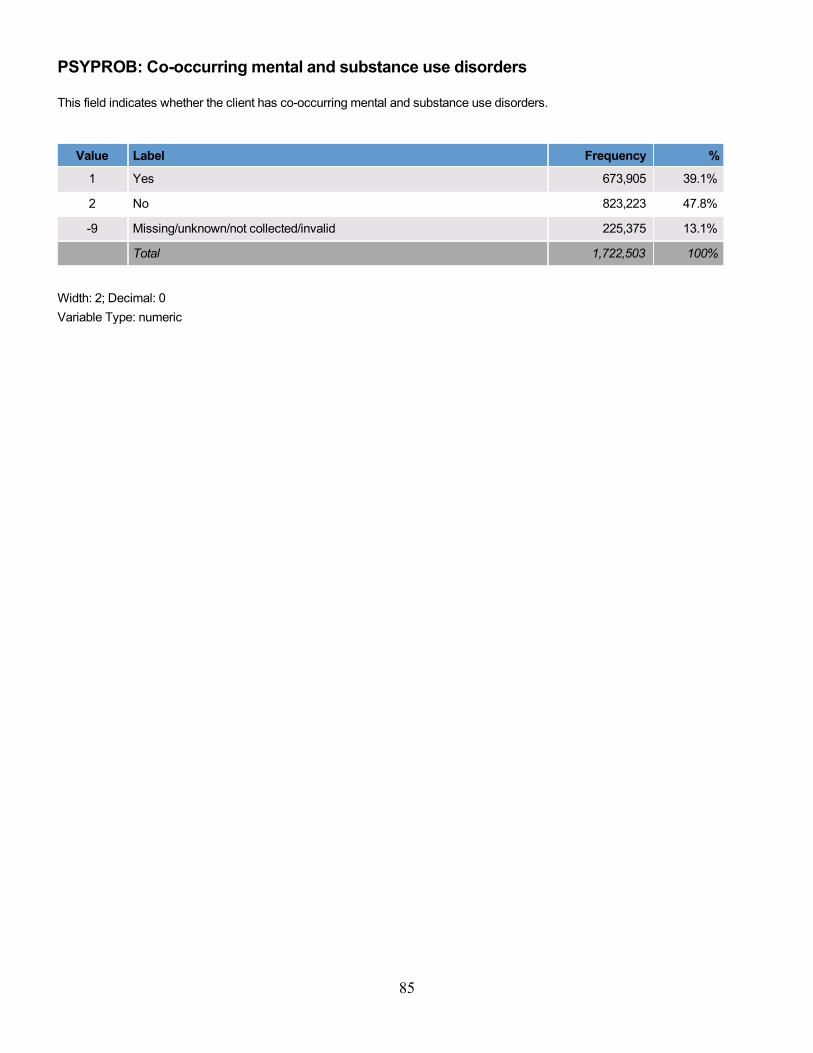
85
PSYPROB: Co-occurring mental and substance use disorders
This field indicates whether the client has co-occurring mental and substance use disorders.
Value Label Frequency %
1 Yes 673,905 39.1%
2 No 823,223 47.8%
-9 Missing/unknown/not collected/invalid 225,375 13.1%
Total 1,722,503 100%
Width: 2; Decimal: 0
Variable Type: numeric
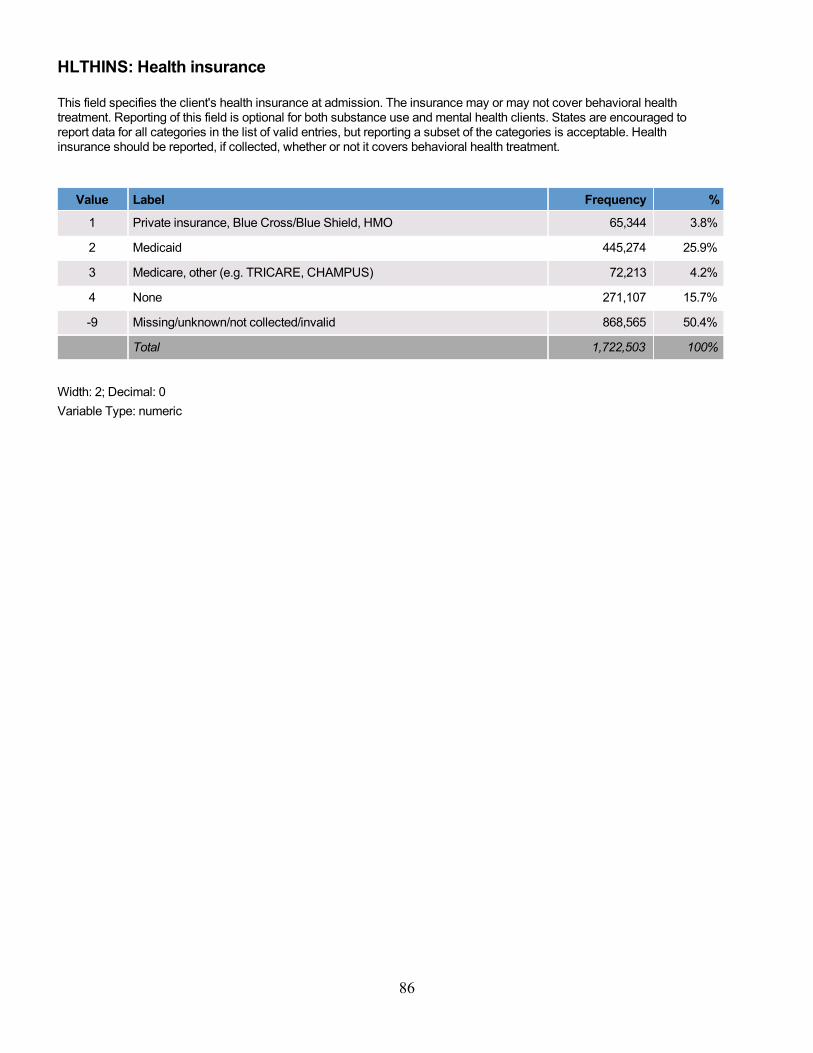
86
HLTHINS: Health insurance
This field specifies the client's health insurance at admission. The insurance may or may not cover behavioral healthtreatment. Reporting of this field is optional for both substance use and mental health clients. States are encouraged toreport data for all categories in the list of valid entries, but reporting a subset of the categories is acceptable. Healthinsurance should be reported, if collected, whether or not it covers behavioral health treatment.
Value Label Frequency %
1 Private insurance, Blue Cross/Blue Shield, HMO 65,344 3.8%
2 Medicaid 445,274 25.9%
3 Medicare, other (e.g. TRICARE, CHAMPUS) 72,213 4.2%
4 None 271,107 15.7%
-9 Missing/unknown/not collected/invalid 868,565 50.4%
Total 1,722,503 100%
Width: 2; Decimal: 0
Variable Type: numeric
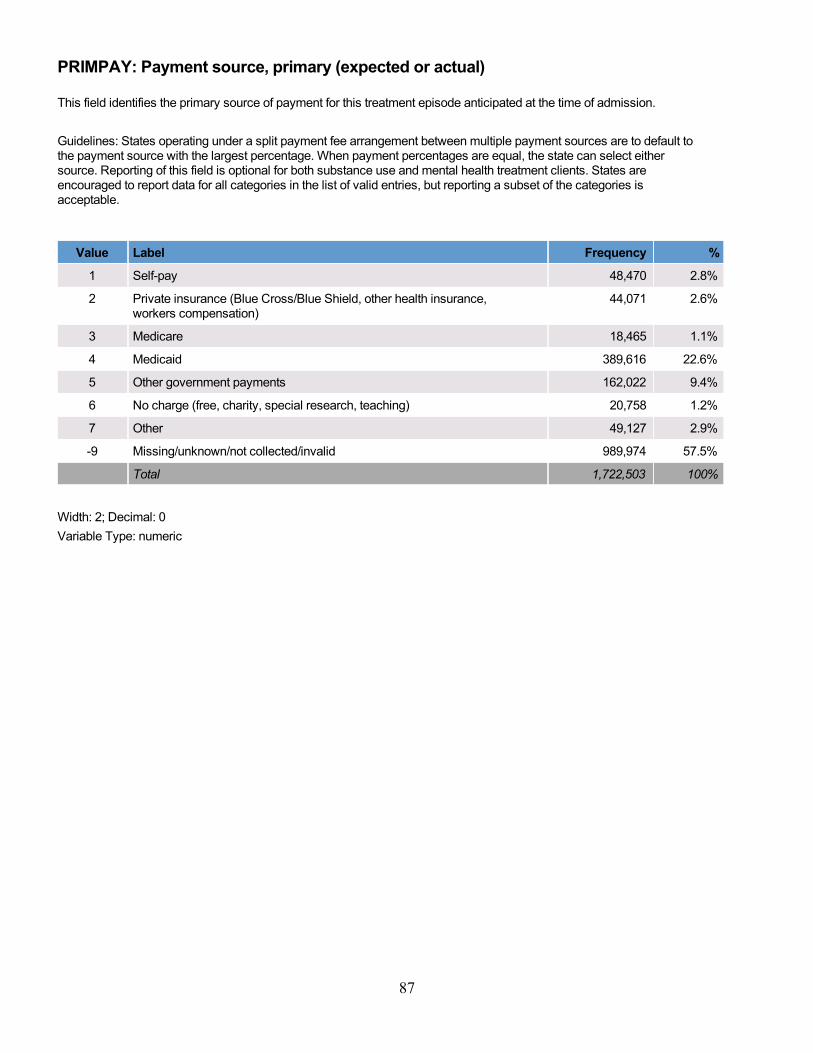
87
PRIMPAY: Payment source, primary (expected or actual)
This field identifies the primary source of payment for this treatment episode anticipated at the time of admission.
Guidelines: States operating under a split payment fee arrangement between multiple payment sources are to default tothe payment source with the largest percentage. When payment percentages are equal, the state can select eithersource. Reporting of this field is optional for both substance use and mental health treatment clients. States areencouraged to report data for all categories in the list of valid entries, but reporting a subset of the categories isacceptable.
Value Label Frequency %
1 Self-pay 48,470 2.8%
2 Private insurance (Blue Cross/Blue Shield, other health insurance,workers compensation)
44,071 2.6%
3 Medicare 18,465 1.1%
4 Medicaid 389,616 22.6%
5 Other government payments 162,022 9.4%
6 No charge (free, charity, special research, teaching) 20,758 1.2%
7 Other 49,127 2.9%
-9 Missing/unknown/not collected/invalid 989,974 57.5%
Total 1,722,503 100%
Width: 2; Decimal: 0
Variable Type: numeric
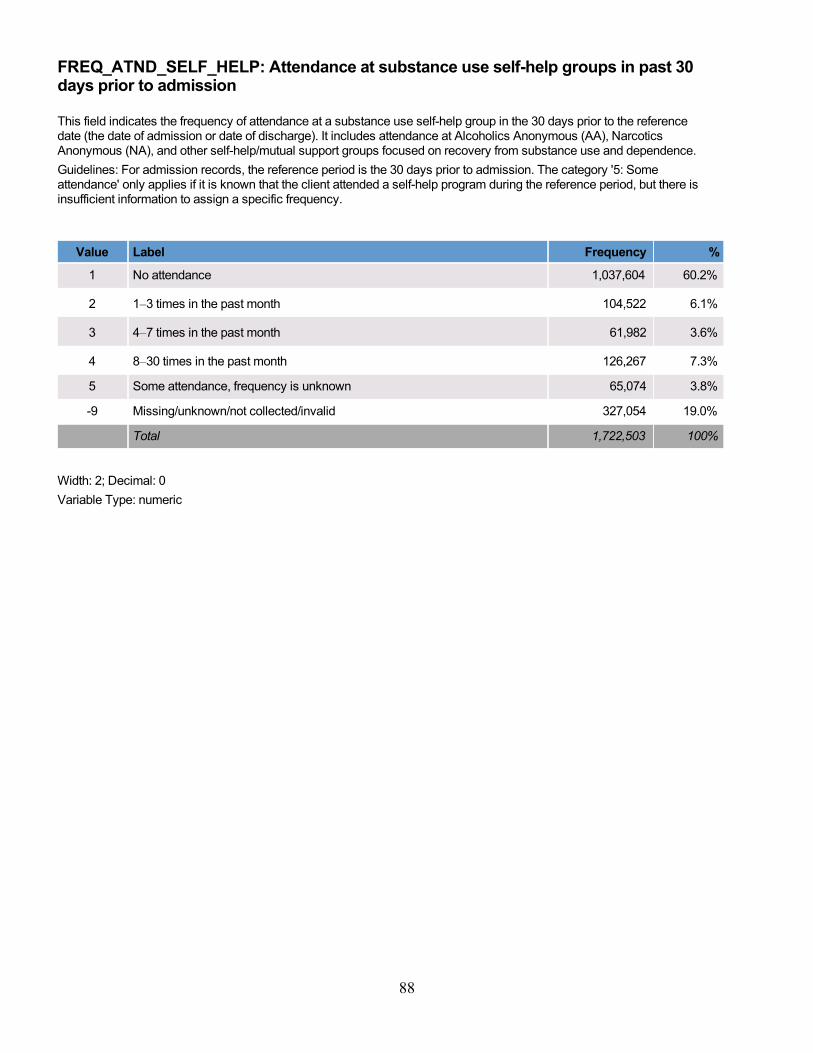
88
FREQ_ATND_SELF_HELP: Attendance at substance use self-help groups in past 30days prior to admission
This field indicates the frequency of attendance at a substance use self-help group in the 30 days prior to the referencedate (the date of admission or date of discharge). It includes attendance at Alcoholics Anonymous (AA), NarcoticsAnonymous (NA), and other self-help/mutual support groups focused on recovery from substance use and dependence.
Guidelines: For admission records, the reference period is the 30 days prior to admission. The category '5: Someattendance' only applies if it is known that the client attended a self-help program during the reference period, but there isinsufficient information to assign a specific frequency.
Value Label Frequency %
1 No attendance 1,037,604 60.2%
2 1–3 times in the past month 104,522 6.1%
3 4–7 times in the past month 61,982 3.6%
4 8–30 times in the past month 126,267 7.3%
5 Some attendance, frequency is unknown 65,074 3.8%
-9 Missing/unknown/not collected/invalid 327,054 19.0%
Total 1,722,503 100%
Width: 2; Decimal: 0
Variable Type: numeric
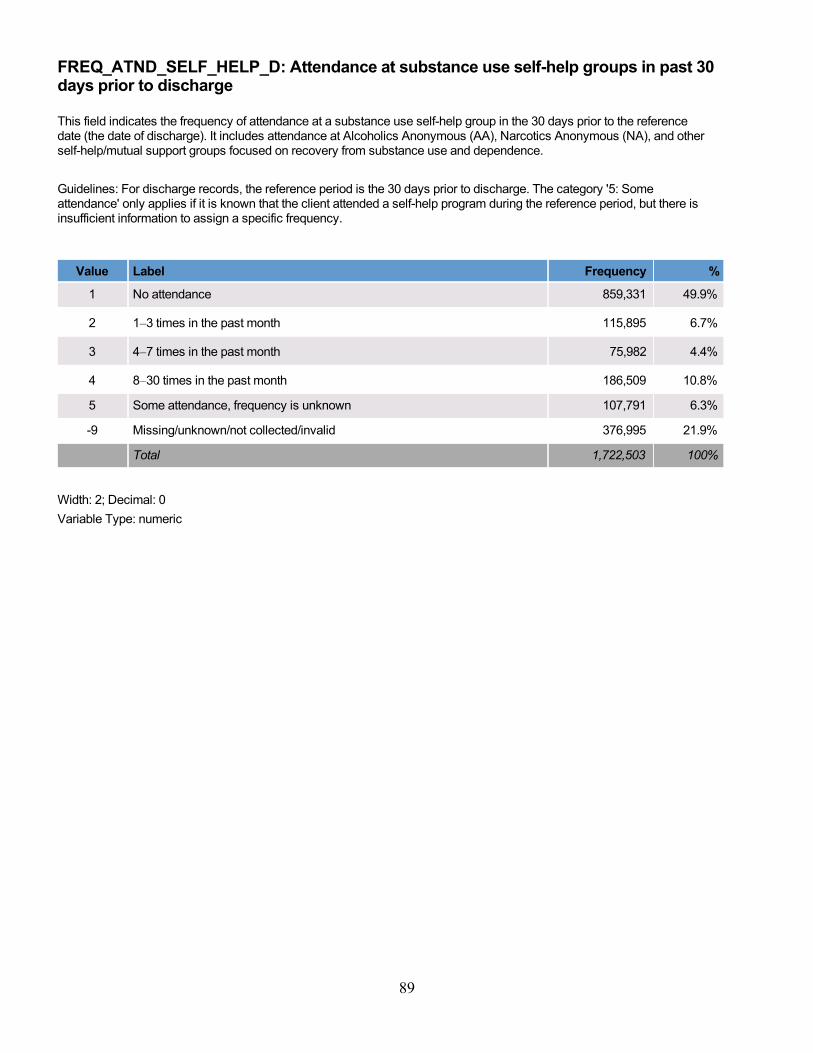
89
FREQ_ATND_SELF_HELP_D: Attendance at substance use self-help groups in past 30days prior to discharge
This field indicates the frequency of attendance at a substance use self-help group in the 30 days prior to the referencedate (the date of discharge). It includes attendance at Alcoholics Anonymous (AA), Narcotics Anonymous (NA), and otherself-help/mutual support groups focused on recovery from substance use and dependence.
Guidelines: For discharge records, the reference period is the 30 days prior to discharge. The category '5: Someattendance' only applies if it is known that the client attended a self-help program during the reference period, but there isinsufficient information to assign a specific frequency.
Value Label Frequency %
1 No attendance 859,331 49.9%
2 1–3 times in the past month 115,895 6.7%
3 4–7 times in the past month 75,982 4.4%
4 8–30 times in the past month 186,509 10.8%
5 Some attendance, frequency is unknown 107,791 6.3%
-9 Missing/unknown/not collected/invalid 376,995 21.9%
Total 1,722,503 100%
Width: 2; Decimal: 0
Variable Type: numeric
90
Appendices
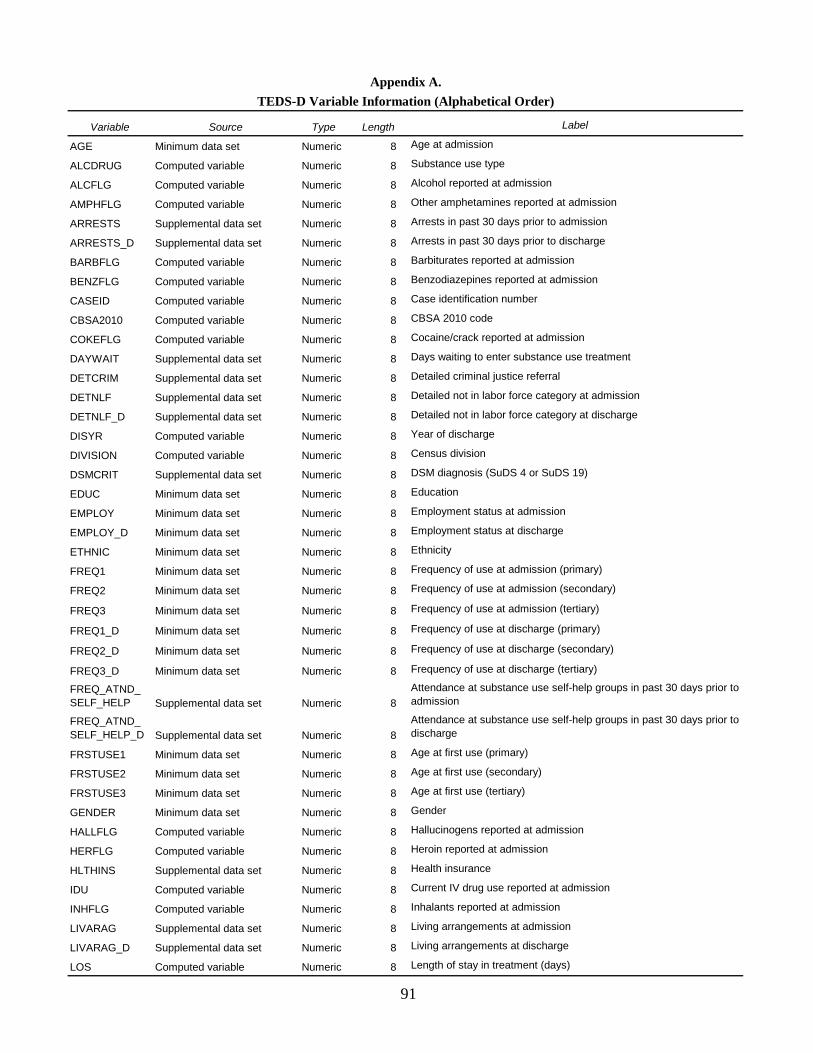
Variable Source Type Length Label
AGE Minimum data set Numeric 8 Age at admission
ALCDRUG Computed variable Numeric 8 Substance use type
ALCFLG Computed variable Numeric 8 Alcohol reported at admission
AMPHFLG Computed variable Numeric 8 Other amphetamines reported at admission
ARRESTS Supplemental data set Numeric 8 Arrests in past 30 days prior to admission
ARRESTS_D Supplemental data set Numeric 8 Arrests in past 30 days prior to discharge
BARBFLG Computed variable Numeric 8 Barbiturates reported at admission
BENZFLG Computed variable Numeric 8 Benzodiazepines reported at admission
CASEID Computed variable Numeric 8 Case identification number
CBSA2010 Computed variable Numeric 8 CBSA 2010 code
COKEFLG Computed variable Numeric 8 Cocaine/crack reported at admission
DAYWAIT Supplemental data set Numeric 8 Days waiting to enter substance use treatment
DETCRIM Supplemental data set Numeric 8 Detailed criminal justice referral
DETNLF Supplemental data set Numeric 8 Detailed not in labor force category at admission
DETNLF_D Supplemental data set Numeric 8 Detailed not in labor force category at discharge
DISYR Computed variable Numeric 8 Year of discharge
DIVISION Computed variable Numeric 8 Census division
DSMCRIT Supplemental data set Numeric 8 DSM diagnosis (SuDS 4 or SuDS 19)
EDUC Minimum data set Numeric 8 Education
EMPLOY Minimum data set Numeric 8 Employment status at admission
EMPLOY_D Minimum data set Numeric 8 Employment status at discharge
ETHNIC Minimum data set Numeric 8 Ethnicity
FREQ1 Minimum data set Numeric 8 Frequency of use at admission (primary)
FREQ2 Minimum data set Numeric 8 Frequency of use at admission (secondary)
FREQ3 Minimum data set Numeric 8 Frequency of use at admission (tertiary)
FREQ1_D Minimum data set Numeric 8 Frequency of use at discharge (primary)
FREQ2_D Minimum data set Numeric 8 Frequency of use at discharge (secondary)
FREQ3_D Minimum data set Numeric 8 Frequency of use at discharge (tertiary)
FREQ_ATND_SELF_HELP Supplemental data set Numeric 8
Attendance at substance use self-help groups in past 30 days prior to admission
FREQ_ATND_SELF_HELP_D Supplemental data set Numeric 8
Attendance at substance use self-help groups in past 30 days prior to discharge
FRSTUSE1 Minimum data set Numeric 8 Age at first use (primary)
FRSTUSE2 Minimum data set Numeric 8 Age at first use (secondary)
FRSTUSE3 Minimum data set Numeric 8 Age at first use (tertiary)
GENDER Minimum data set Numeric 8 Gender
HALLFLG Computed variable Numeric 8 Hallucinogens reported at admission
HERFLG Computed variable Numeric 8 Heroin reported at admission
HLTHINS Supplemental data set Numeric 8 Health insurance
IDU Computed variable Numeric 8 Current IV drug use reported at admission
INHFLG Computed variable Numeric 8 Inhalants reported at admission
LIVARAG Supplemental data set Numeric 8 Living arrangements at admission
LIVARAG_D Supplemental data set Numeric 8 Living arrangements at discharge
LOS Computed variable Numeric 8 Length of stay in treatment (days)
TEDS-D Variable Information (Alphabetical Order)
Appendix A.
91
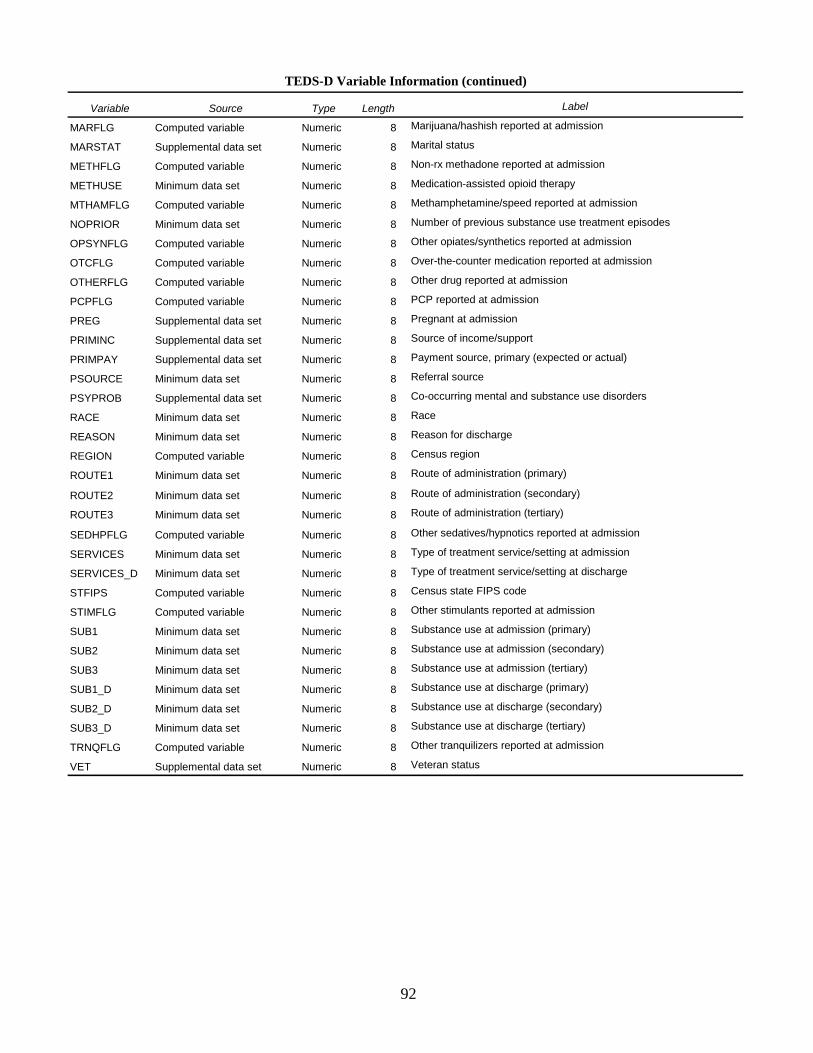
Variable Source Type Length Label
MARFLG Computed variable Numeric 8 Marijuana/hashish reported at admission
MARSTAT Supplemental data set Numeric 8 Marital status
METHFLG Computed variable Numeric 8 Non-rx methadone reported at admission
METHUSE Minimum data set Numeric 8 Medication-assisted opioid therapy
MTHAMFLG Computed variable Numeric 8 Methamphetamine/speed reported at admission
NOPRIOR Minimum data set Numeric 8 Number of previous substance use treatment episodes
OPSYNFLG Computed variable Numeric 8 Other opiates/synthetics reported at admission
OTCFLG Computed variable Numeric 8 Over-the-counter medication reported at admission
OTHERFLG Computed variable Numeric 8 Other drug reported at admission
PCPFLG Computed variable Numeric 8 PCP reported at admission
PREG Supplemental data set Numeric 8 Pregnant at admission
PRIMINC Supplemental data set Numeric 8 Source of income/support
PRIMPAY Supplemental data set Numeric 8 Payment source, primary (expected or actual)
PSOURCE Minimum data set Numeric 8 Referral source
PSYPROB Supplemental data set Numeric 8 Co-occurring mental and substance use disorders
RACE Minimum data set Numeric 8 Race
REASON Minimum data set Numeric 8 Reason for discharge
REGION Computed variable Numeric 8 Census region
ROUTE1 Minimum data set Numeric 8 Route of administration (primary)
ROUTE2 Minimum data set Numeric 8 Route of administration (secondary)
ROUTE3 Minimum data set Numeric 8 Route of administration (tertiary)
SEDHPFLG Computed variable Numeric 8 Other sedatives/hypnotics reported at admission
SERVICES Minimum data set Numeric 8 Type of treatment service/setting at admission
SERVICES_D Minimum data set Numeric 8 Type of treatment service/setting at discharge
STFIPS Computed variable Numeric 8 Census state FIPS code
STIMFLG Computed variable Numeric 8 Other stimulants reported at admission
SUB1 Minimum data set Numeric 8 Substance use at admission (primary)
SUB2 Minimum data set Numeric 8 Substance use at admission (secondary)
SUB3 Minimum data set Numeric 8 Substance use at admission (tertiary)
SUB1_D Minimum data set Numeric 8 Substance use at discharge (primary)
SUB2_D Minimum data set Numeric 8 Substance use at discharge (secondary)
SUB3_D Minimum data set Numeric 8 Substance use at discharge (tertiary)
TRNQFLG Computed variable Numeric 8 Other tranquilizers reported at admission
VET Supplemental data set Numeric 8 Veteran status
TEDS-D Variable Information (continued)
92
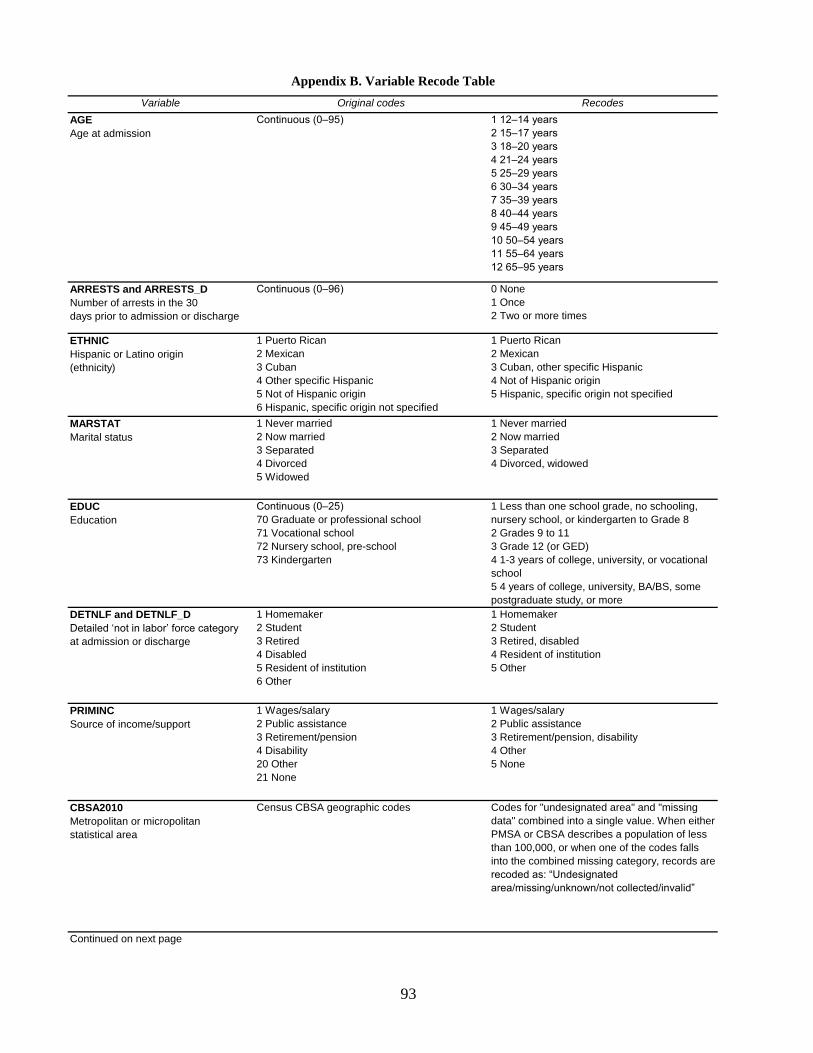
Variable Original codes Recodes
AGE
Age at admissionContinuous (0–95) 1 12–14 years
2 15–17 years
3 18–20 years
4 21–24 years
5 25–29 years
6 30–34 years
7 35–39 years
8 40–44 years
9 45–49 years
10 50–54 years
11 55–64 years
12 65–95 years
ARRESTS and ARRESTS_D
Number of arrests in the 30days prior to admission or discharge
Continuous (0–96) 0 None1 Once2 Two or more times
ETHNIC
Hispanic or Latino origin(ethnicity)
1 Puerto Rican2 Mexican3 Cuban4 Other specific Hispanic5 Not of Hispanic origin6 Hispanic, specific origin not specified
1 Puerto Rican2 Mexican3 Cuban, other specific Hispanic4 Not of Hispanic origin5 Hispanic, specific origin not specified
MARSTAT
Marital status1 Never married2 Now married3 Separated4 Divorced5 Widowed
1 Never married2 Now married3 Separated4 Divorced, widowed
EDUC
EducationContinuous (0–25)
70 Graduate or professional school71 Vocational school72 Nursery school, pre-school73 Kindergarten
1 Less than one school grade, no schooling, nursery school, or kindergarten to Grade 82 Grades 9 to 113 Grade 12 (or GED)4 1-3 years of college, university, or vocational school5 4 years of college, university, BA/BS, some postgraduate study, or more
DETNLF and DETNLF_D
Detailed ‘not in labor’ force category
at admission or discharge
1 Homemaker2 Student3 Retired4 Disabled5 Resident of institution 6 Other
1 Homemaker2 Student3 Retired, disabled4 Resident of institution 5 Other
PRIMINC
Source of income/support1 Wages/salary2 Public assistance3 Retirement/pension4 Disability20 Other21 None
1 Wages/salary2 Public assistance3 Retirement/pension, disability4 Other5 None
CBSA2010
Metropolitan or micropolitanstatistical area
Census CBSA geographic codes Codes for "undesignated area" and "missing data" combined into a single value. When either PMSA or CBSA describes a population of less than 100,000, or when one of the codes falls into the combined missing category, records are recoded as: “Undesignated
area/missing/unknown/not collected/invalid”
Continued on next page
Appendix B. Variable Recode Table
93
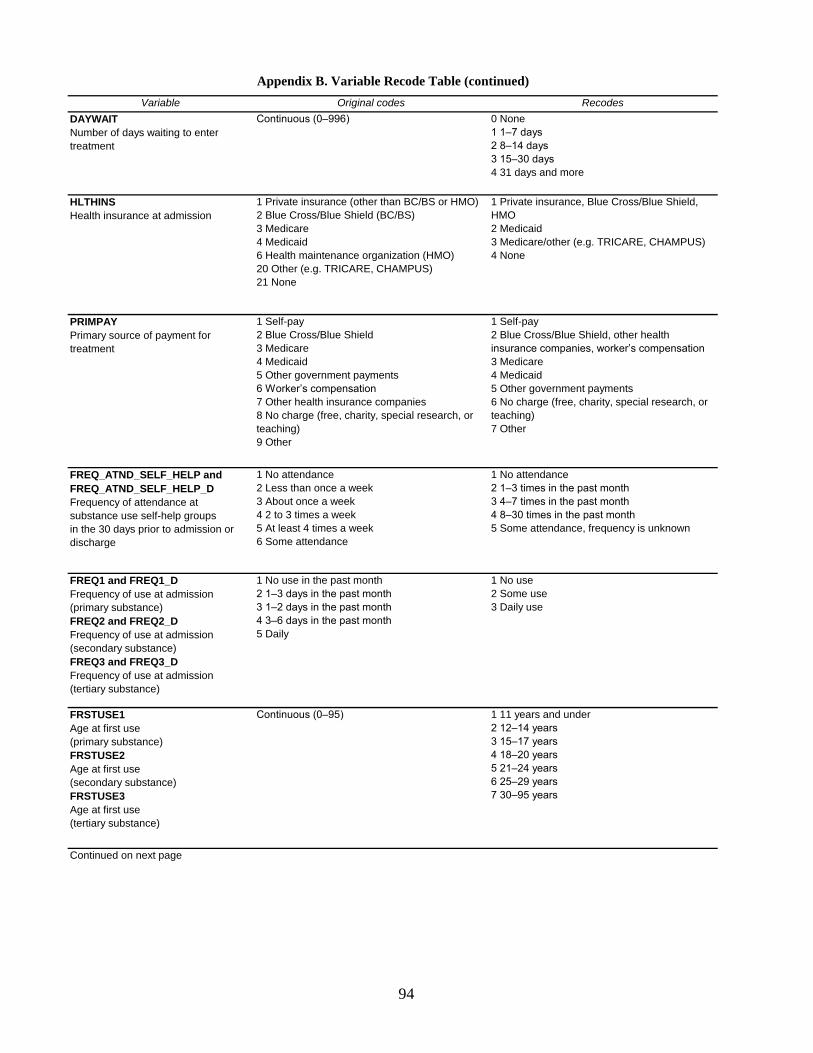
Variable Original codes Recodes
DAYWAIT
Number of days waiting to enter treatment
Continuous (0–996) 0 None1 1–7 days
2 8–14 days
3 15–30 days
4 31 days and more
HLTHINS
Health insurance at admission1 Private insurance (other than BC/BS or HMO)2 Blue Cross/Blue Shield (BC/BS)3 Medicare4 Medicaid6 Health maintenance organization (HMO)20 Other (e.g. TRICARE, CHAMPUS)21 None
1 Private insurance, Blue Cross/Blue Shield, HMO2 Medicaid3 Medicare/other (e.g. TRICARE, CHAMPUS) 4 None
PRIMPAY
Primary source of payment for treatment
1 Self-pay2 Blue Cross/Blue Shield3 Medicare4 Medicaid5 Other government payments6 Worker’s compensation
7 Other health insurance companies 8 No charge (free, charity, special research, or teaching) 9 Other
1 Self-pay2 Blue Cross/Blue Shield, other health insurance companies, worker’s compensation
3 Medicare4 Medicaid5 Other government payments6 No charge (free, charity, special research, or teaching)7 Other
FREQ_ATND_SELF_HELP and
FREQ_ATND_SELF_HELP_D
Frequency of attendance atsubstance use self-help groupsin the 30 days prior to admission or discharge
1 No attendance2 Less than once a week3 About once a week4 2 to 3 times a week5 At least 4 times a week6 Some attendance
1 No attendance2 1–3 times in the past month
3 4–7 times in the past month
4 8–30 times in the past month
5 Some attendance, frequency is unknown
FREQ1 and FREQ1_D
Frequency of use at admission (primary substance)FREQ2 and FREQ2_D
Frequency of use at admission (secondary substance)FREQ3 and FREQ3_D
Frequency of use at admission(tertiary substance)
1 No use in the past month2 1–3 days in the past month
3 1–2 days in the past month
4 3–6 days in the past month
5 Daily
1 No use2 Some use3 Daily use
FRSTUSE1
Age at first use (primary substance)FRSTUSE2
Age at first use (secondary substance)FRSTUSE3
Age at first use(tertiary substance)
Continuous (0–95) 1 11 years and under2 12–14 years
3 15–17 years
4 18–20 years
5 21–24 years
6 25–29 years
7 30–95 years
Continued on next page
Appendix B. Variable Recode Table (continued)
94
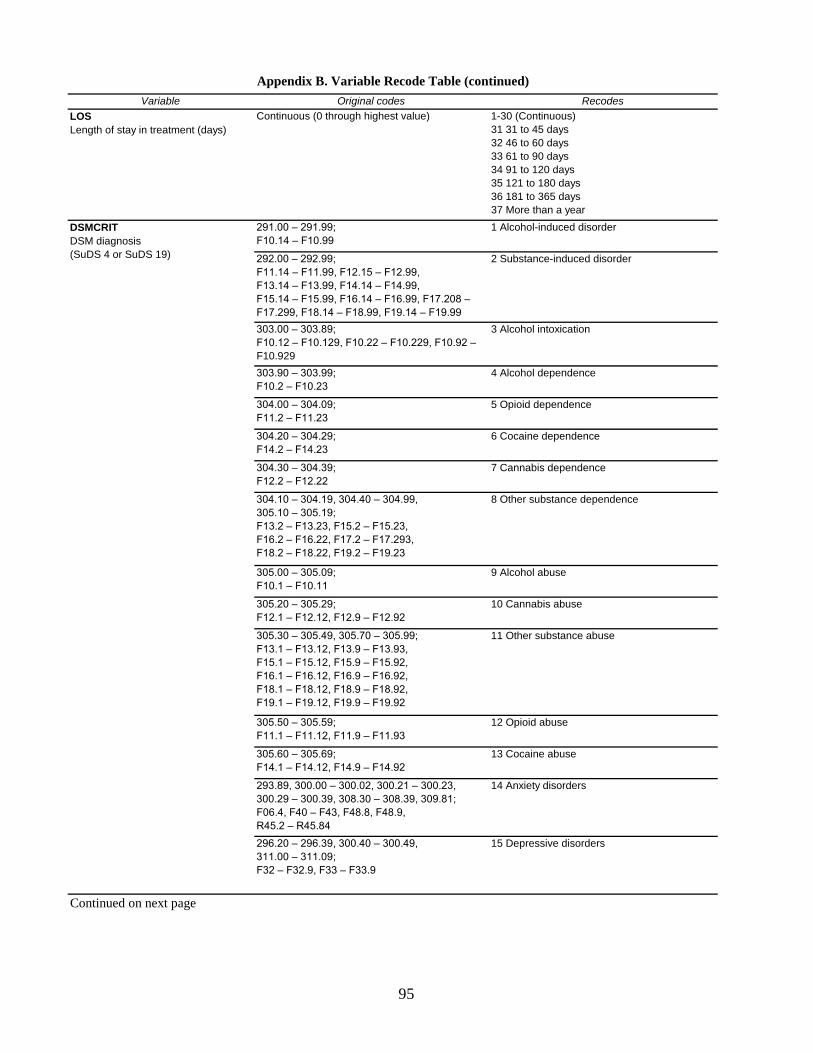
Variable Original codes Recodes
LOS
Length of stay in treatment (days)Continuous (0 through highest value) 1-30 (Continuous)
31 31 to 45 days32 46 to 60 days33 61 to 90 days34 91 to 120 days35 121 to 180 days36 181 to 365 days37 More than a year
291.00 – 291.99;
F10.14 – F10.99
1 Alcohol-induced disorder
292.00 – 292.99;
F11.14 – F11.99, F12.15 – F12.99,
F13.14 – F13.99, F14.14 – F14.99,
F15.14 – F15.99, F16.14 – F16.99, F17.208 –
F17.299, F18.14 – F18.99, F19.14 – F19.99
2 Substance-induced disorder
303.00 – 303.89;
F10.12 – F10.129, F10.22 – F10.229, F10.92 –
F10.929
3 Alcohol intoxication
303.90 – 303.99;
F10.2 – F10.23
4 Alcohol dependence
304.00 – 304.09;
F11.2 – F11.23
5 Opioid dependence
304.20 – 304.29;
F14.2 – F14.23
6 Cocaine dependence
304.30 – 304.39;
F12.2 – F12.22
7 Cannabis dependence
304.10 – 304.19, 304.40 – 304.99,
305.10 – 305.19;
F13.2 – F13.23, F15.2 – F15.23,
F16.2 – F16.22, F17.2 – F17.293,
F18.2 – F18.22, F19.2 – F19.23
8 Other substance dependence
305.00 – 305.09;
F10.1 – F10.11
9 Alcohol abuse
305.20 – 305.29;
F12.1 – F12.12, F12.9 – F12.92
10 Cannabis abuse
305.30 – 305.49, 305.70 – 305.99;
F13.1 – F13.12, F13.9 – F13.93,
F15.1 – F15.12, F15.9 – F15.92,
F16.1 – F16.12, F16.9 – F16.92,
F18.1 – F18.12, F18.9 – F18.92,
F19.1 – F19.12, F19.9 – F19.92
11 Other substance abuse
305.50 – 305.59;
F11.1 – F11.12, F11.9 – F11.93
12 Opioid abuse
305.60 – 305.69;
F14.1 – F14.12, F14.9 – F14.92
13 Cocaine abuse
293.89, 300.00 – 300.02, 300.21 – 300.23,
300.29 – 300.39, 308.30 – 308.39, 309.81;
F06.4, F40 – F43, F48.8, F48.9,
R45.2 – R45.84
14 Anxiety disorders
296.20 – 296.39, 300.40 – 300.49,
311.00 – 311.09;F32 – F32.9, F33 – F33.9
15 Depressive disorders
Continued on next page
DSMCRIT
DSM diagnosis(SuDS 4 or SuDS 19)
Appendix B. Variable Recode Table (continued)
95
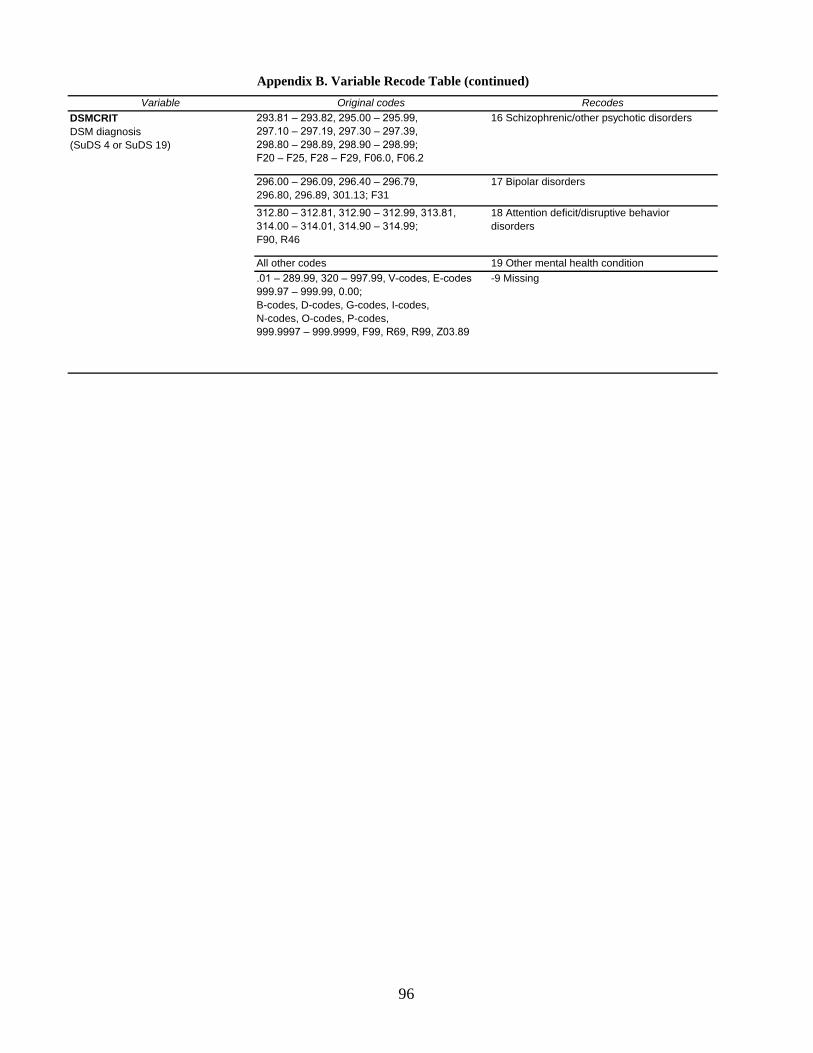
Variable Original codes Recodes
DSMCRIT
DSM diagnosis(SuDS 4 or SuDS 19)
293.81 – 293.82, 295.00 – 295.99,
297.10 – 297.19, 297.30 – 297.39,
298.80 – 298.89, 298.90 – 298.99;
F20 – F25, F28 – F29, F06.0, F06.2
16 Schizophrenic/other psychotic disorders
296.00 – 296.09, 296.40 – 296.79,
296.80, 296.89, 301.13; F3117 Bipolar disorders
312.80 – 312.81, 312.90 – 312.99, 313.81,
314.00 – 314.01, 314.90 – 314.99;F90, R46
18 Attention deficit/disruptive behavior disorders
All other codes 19 Other mental health condition.01 – 289.99, 320 – 997.99, V-codes, E-codes
999.97 – 999.99, 0.00;
B-codes, D-codes, G-codes, I-codes,N-codes, O-codes, P-codes,999.9997 – 999.9999, F99, R69, R99, Z03.89
-9 Missing
Appendix B. Variable Recode Table (continued)
96
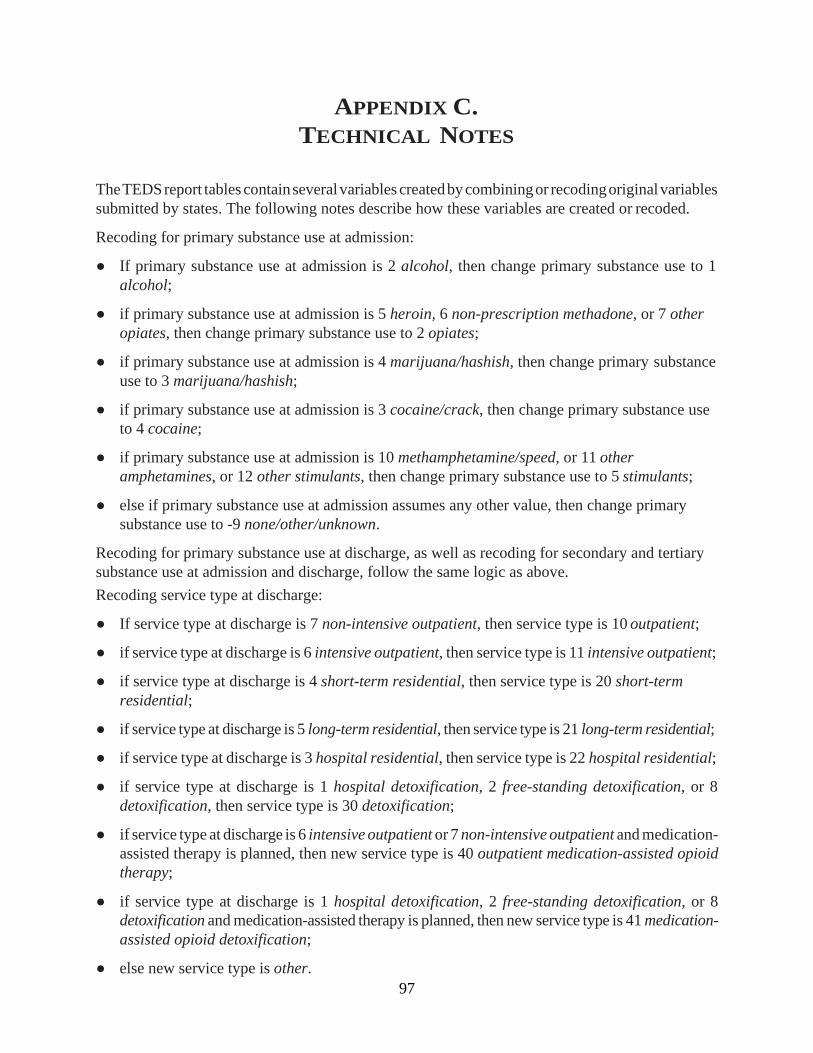
97
APPENDIX C. TECHNICAL NOTES
The TEDS report tables contain several variables created by combining or recoding original variables submitted by states. The following notes describe how these variables are created or recoded.
Recoding for primary substance use at admission:
● If primary substance use at admission is 2 alcohol, then change primary substance use to 1 alcohol;
● if primary substance use at admission is 5 heroin, 6 non-prescription methadone, or 7 other opiates, then change primary substance use to 2 opiates;
● if primary substance use at admission is 4 marijuana/hashish, then change primary substance use to 3 marijuana/hashish;
● if primary substance use at admission is 3 cocaine/crack, then change primary substance use to 4 cocaine;
● if primary substance use at admission is 10 methamphetamine/speed, or 11 other amphetamines, or 12 other stimulants, then change primary substance use to 5 stimulants;
● else if primary substance use at admission assumes any other value, then change primary substance use to -9 none/other/unknown.
Recoding for primary substance use at discharge, as well as recoding for secondary and tertiary substance use at admission and discharge, follow the same logic as above. Recoding service type at discharge:
● If service type at discharge is 7 non-intensive outpatient, then service type is 10 outpatient;
● if service type at discharge is 6 intensive outpatient, then service type is 11 intensive outpatient;
● if service type at discharge is 4 short-term residential, then service type is 20 short-term residential;
● if service type at discharge is 5 long-term residential, then service type is 21 long-term residential;
● if service type at discharge is 3 hospital residential, then service type is 22 hospital residential;
● if service type at discharge is 1 hospital detoxification, 2 free-standing detoxification, or 8 detoxification, then service type is 30 detoxification;
● if service type at discharge is 6 intensive outpatient or 7 non-intensive outpatient and medication- assisted therapy is planned, then new service type is 40 outpatient medication-assisted opioid therapy;
● if service type at discharge is 1 hospital detoxification, 2 free-standing detoxification, or 8 detoxification and medication-assisted therapy is planned, then new service type is 41 medication- assisted opioid detoxification;
● else new service type is other.