2019 Saskatchewan Labour Demand Outlook€¦ · diploma/cert./ apprenticeship training High school/...
9
Labour Demand Outlook | 2019 to 2023 Saskatchewan
Transcript of 2019 Saskatchewan Labour Demand Outlook€¦ · diploma/cert./ apprenticeship training High school/...

Labour Demand Outlook | 2019 to 2023 Saskatchewan
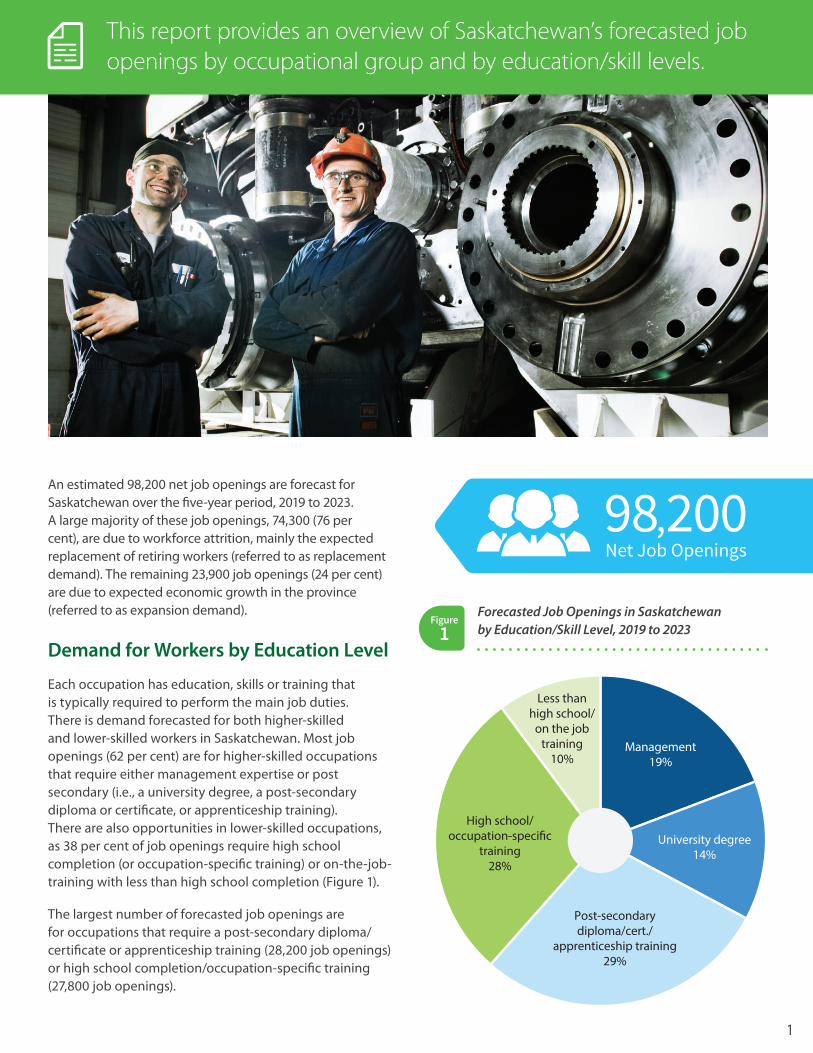
An estimated 98,200 net job openings are forecast for Saskatchewan over the five-year period, 2019 to 2023. A large majority of these job openings, 74,300 (76 per cent), are due to workforce attrition, mainly the expected replacement of retiring workers (referred to as replacement demand). The remaining 23,900 job openings (24 per cent) are due to expected economic growth in the province (referred to as expansion demand).
Demand for Workers by Education Level
Each occupation has education, skills or training that is typically required to perform the main job duties. There is demand forecasted for both higher-skilled and lower-skilled workers in Saskatchewan. Most job openings (62 per cent) are for higher-skilled occupations that require either management expertise or post secondary (i.e., a university degree, a post-secondary diploma or certificate, or apprenticeship training). There are also opportunities in lower-skilled occupations, as 38 per cent of job openings require high school completion (or occupation-specific training) or on-the-job-training with less than high school completion (Figure 1).
The largest number of forecasted job openings are for occupations that require a post-secondary diploma/certificate or apprenticeship training (28,200 job openings) or high school completion/occupation-specific training (27,800 job openings).
Management19%
Less thanhigh school/
on the jobtraining
10%
University degree14%
High school/occupation-speci�c
training28%
Post-secondarydiploma/cert./
apprenticeship training29%
1
This report provides an overview of Saskatchewan’s forecasted job openings by occupational group and by education/skill levels.
98,200Net Job Openings
Figure1
Forecasted Job Openings in Saskatchewan by Education/Skill Level, 2019 to 2023

Forecasted Job Openings Due to Expansion Demand and Replacement Demand by Education/Skill Level, 2019 to 2023
Replacement demand affects occupations of all educational and skill levels, but is more prevalent in higher-skilled job openings, accounting for 84 per cent of management-related job openings and 79 per cent of job openings that require a post-secondary diploma or certificate, or apprenticeship training. Out of the five skill levels, expansion demand plays a larger role in jobs that are lower-skilled. Figure 2 shows future job openings due to expansion demand and replacement demand for each educational or skill level.
18,900
13,300
28,200 27,800
10,000
6,300
3,700
Less than high school/on-the-job training
Management Universitydegree
Post-secondary diploma/cert./apprenticeship
training
High school/occupation-speci�c
training
Expansion Replacement
3,000
15,900
10,200
3,100 22,200
6,0008,100
19,700
2
Replacement demand accounts for of job openings76%
Figure2

Demand for Workers by Occupational Group
Three occupational groups – sales and service; trades, transport and equipment operators; and business, finance and administration – collectively account for 60 per cent of total job openings over the forecast period. Another 28 per cent of future openings are expected for occupations in education, law, social community and government; natural resources and agriculture; and health. Replacement of retiring workers is a key driver of demand, accounting for all of the future job openings in natural resources and agriculture (largely because of anticipated retiring farmers), 85 per cent of job openings in senior management, and 81 per cent of job openings in natural and applied sciences. Expansion demand has a greater impact on occupations in art, culture, recreation, and sport and occupations in sales and service – accounting for more than a third of their job openings. Figure 3 shows future job openings due to expansion demand and replacement demand for each occupational group.
8,900
4,300
3,500
3,300
-400
1,400
1,300
600
700
200
15,400
13,700
13,500
8,400
9,500
5,400
3,500
2,600
1,200
1,100
24,300
18,000
17,000
11,700
9,100
6,800
4,800
3,200
1,900
1,300
Sales & Service
Trades/Transport/Equipment Operators
Business/Finance/Administration
Education/Law & Social Community/Gov't
Natural Resources/Agriculture
Health
Natural & Applied Sciences
Manufacturing/Utilities
Art, Culture, Recreation & Sport
Senior Management
Net JobOpenings
Expansion
Replacement
3
Forecasted Job Openings Due to Expansion Demand and Replacement Demand by Occupational Group, Saskatchewan, 2019 to 2023
Figure3

4
Job Openings by Occupational Group and Education Level
Management related jobs account for 19 per cent of total job openings. These are higher-skilled jobs that have high levels of responsibility, accountability and subject matter expertise. A significant share of these job openings are for senior management positions, but most are
middle management job openings that are spread across the various occupational groups. In the natural resources and agriculture group, nearly three-quarters of job openings are for managers in agriculture (mainly farmers) who have considerable job knowledge, skills and work experience.
Middle management occupations also account for a larger share of job openings in the sales and services group and the manufacturing and utilities group, 21 per cent and 16 per cent respectively. Table 1 shows the number of future job openings by occupational group and educational/skill level.
Forecasted Net Job Openings by Occupational Group and Education/Skill Level, Saskatchewan, 2019 to 2023
Type Title Management University degree"
Post-secondary diploma/cert./ apprenticeship
training
High school/ occupation-
specific training
Less than high school/ on-the-job
training
Total
Sales & service 5,000 -- 4,600 7,100 7,600 24,300
Trades/Transport/Equipment Operators 1,800 -- 7,900 7,200 1,100 18,000
Business/Finance/Administration 1,700 2,200 7,000 6,000 -- 17,000
Education/law & social community/Gov't 900 5,500 2,600 2,700 -- 11,700
Natural resources/Agriculture 6,600 -- 400 1,600 500 9,100
Health 300 2,900 1,500 2,000 -- 6,800
Natural & Applied Sciences 400 1,900 2,500 -- -- 4,800
Manufacturing/Utilities 500 -- 800 1,200 700 3,200
Art, Culture, Recreation & Sport 200 800 1,000 -- -- 1,900
Senior Management 1,300 -- -- -- -- 1,300
Total 18,900 13,300 28,200 27,800 10,000 98,200
Notes: “--” represents not applicable or no data to report. Net job openings are the sum of openings due to expansion and replacement demand. Numbers may not always add up to totals due to rounding.
Table1

5
Most occupational groups have more higher-skilled job openings than lower-skilled job openings. In fact, all occupations categorized in the natural and applied sciences group and the art, culture, recreation and sport group are higher-skilled by definition. Higher-skilled jobs represent a larger share of the job openings in natural resources and agriculture (77 per cent), education, law and social, community and government services (77 per cent), health (70 per cent) and business, finance and administration (64 per cent). However, there is still significant demand for lower-skilled workers, more so for occupational groups such as sales and services; manufacturing and utilities; and trades, transport and equipment operators. Figure 4 shows the proportion of higher-skilled and lower-skilled job openings for each occupation group.
Proportion of Forecasted Job Openings that are Higher-Skilled and Lower-Skilled by Occupational Group, Saskatchewan, 2019 to 2023
100%
100%
100%
23%
23%
30%
36%
46%
59%
60%
77%
77%
70%
64%
54%
41%
40%
Natural & Applied Sciences
Art, Culture, Recreation & Sport
Senior Management
Natural resources/Agriculture
Education/law & social community/Gov't
Health
Business/Finance/Administration
Trades/Transport/Equipment Operators
Manufacturing/Utilities
Sales & Service
Higher-Skilled Jobs Lower-Skilled Jobs
Figure4

Expansion-driven and Replacement-driven Occupations
Future job openings can be driven more by expansion demand or by replacement demand. Table 2 shows the top 15 occupations with the highest number of job openings due to expansion demand (column A) and the top 15 replacement demand occupations (column B) over the forecast period. Nine of the occupations are common to both lists (indicated by √) such as transport truck drivers and elementary school and kindergarten teachers. Retail salespersons have the highest number of expansion-driven job openings and managers in agriculture (mainly farmers) have the highest number of replacement-driven job openings.
6
A. Expansion-driven Occupations B. Replacement-driven Occupations
√ Retail salespersons Managers in agriculture
√ Transport truck drivers √ Retail and wholesale trade managers
√ Retail and wholesale trade managers √ Transport truck drivers
Food counter attendants, kitchen helpers and related support occupations √ Retail salespersons
√ Elementary school and kindergarten teachers √ Registered nurses and registered psychiatric nurses
√ Light duty cleaners Administrative officers
Cashiers General farm workers
Carpenters √ Janitors, caretakers and building superintendents
Food and beverage servers √ Nurse aides, orderlies and patient service associates
√ Cooks Administrative assistants
√ Janitors, caretakers and building superintendents General office support workers
√ Nurse aides, orderlies and patient service associates √ Elementary school and kindergarten teachers
Early childhood educators and assistants √ Light duty cleaners
Store shelf stockers, clerks and order fillers Accounting technicians and bookkeepers
√ Registered nurses and registered psychiatric nurses √ Cooks
Top 15 Expansion-Driven and Replacement-Driven Occupations, 2019 to 2023 Table2

7
Summary of Job Openings, 2019 to 2023
Job Openings, 2019-2023% share of total
Expansion Demand Replacement Demand Total
By Skill Level
Management 3,000 15,900 18,900 19%
University Degree 3,100 10,200 13,300 14%
Post-Secondary Cert./Diploma/Apprenticeship Training 6,000 22,200 28,200 29%
High school/occupation-specific training 8,100 19,700 27,800 28%
Less than high school/on-the-job training 3,700 6,300 10,000 10%
Total 23,900 74,300 98,200 100%
By Occupational Group
Sales & Service 8,900 15,400 24,300 25%
Trades/Transport/Equipment Operators 4,300 13,700 18,000 18%
Business/Finance/Administration 3,500 13,500 17,000 17%
Education/law & social community/Gov't 3,300 8,400 11,700 12%
Natural resources/Agriculture -400 9,500 9,100 9%
Health 1,400 5,400 6,800 7%
Natural & Applied Sciences 1,300 3,500 4,800 5%
Manufacturing/Utilities 600 2,600 3,200 3%
Art, Culture, Recreation & Sport 700 1,200 1,900 2%
Senior Management 200 1,100 1,300 1%
Total 23,900 74,300 98,200 100%
Summary of Job Openings, 2019 to 2023
Note: Total job openings by skill type are sorted in descending order. Numbers may not add up to totals due to rounding.
Table3

8
Skill Levels Based on the NOC 2016 System
Skill Level Level of education or training usually required
Management • Management is characterized by high levels of responsibility, accountability and subject matter expertise. Expertise is acquired through either formal education or extensive occupational experience.
University degree • University degree (bachelor’s, master’s or doctorate)
Post-secondary diploma/certificate/ apprenticeship training
• Two to three years of post-secondary education at community college, institute of technology or CÉGEP; or
• Two to five years of apprenticeship training; or• Three to four years of secondary school and more than two years of on-the-job training,
occupation specific training courses or specific work experience• Occupations with supervisory responsibilities• Occupations with significant health and safety responsibilities
High school/occupation-specific training • Completion of secondary school and some short-duration courses or training specific to the occupation; or
• Some secondary school education, with up to two years of on-the-job training, training courses or specific work experience
Less than high school/on-the-job training • Short work demonstration or on-the-job training; or• No formal educational requirements
Assumptions, Definition and National Occupational Classification
The forecast is based on Saskatchewan Finance’s 2019/20 budget assumptions and output from the Saskatchewan Occupational Modelling System that is proprietary to Stokes Economic Consulting Inc. Forecast data reflects current and expected economic conditions at the time of the development of the forecast scenario (spring 2019). Changes in economic conditions, such as unforeseen fluctuations in commodity prices and changes in economic activity and productivity, may impact actual labour demand. The forecast does not reflect current job vacancies and does not distinguish between full-time and part-time jobs.
Job openings are defined as the sum of expansion demand (new jobs generated through economic activity) and replacement demand (existing jobs that have been vacated, mainly due to retirement, and require replacement).
The 2016 National Occupational Classification (NOC) system provides a standardized framework for organizing occupations according to skill level and occupational group. Skill level classifies occupations by the level of education or training that is usually required for a given occupation, and occupational group classifies occupations based
on the type of work performed. The following table provides a description of the skill levels used in this document. For more information regarding the classification of occupations by skill level and type, see http://noc.esdc.gc.ca/English/noc/welcome.aspx?ver=16
Skill Levels Based on the NOC 2016 System Table4