2019 - Pan American Health Organization
42
2019 Weekly / Semanal Influenza Report EW 5/ Reporte de Influenza SE 5 Regional Update: Influenza & Other Respiratory Viruses / Actualización Regional: Influenza y Otros virus respiratorios Data as of Februray 8, 2019/ Datos hasta 8 de febrero de 2019 Prepared by PHE/IHM/Influenza Team/ Realizado por PHE/IHM/Equipo de Influenza February 12, 2019 12 de febrero de 2019
Transcript of 2019 - Pan American Health Organization

2019 Weekly / Semanal
Influenza Report EW 5/
Reporte de Influenza SE 5
Regional Update: Influenza & Other Respiratory Viruses / Actualización Regional: Influenza y Otros virus respiratorios
Data as of Februray 8, 2019/ Datos hasta 8 de febrero de 2019
Prepared by PHE/IHM/Influenza Team/
Realizado por PHE/IHM/Equipo de Influenza
February 12, 2019 12 de febrero de 2019

PAHO/OPS | INFLUENZA REGIONAL UPDATE EW 5 /ACTUALIZACIÓN REGIONAL DE INFLUENZA SE 5 2
FluID
FluNet
Go to Index/ Ir al Índice
M a p Production /Producción del mapa : PAHO/WHO. OPS/OMS.
D a t a Source / Fuente de d atos: Ministries of Health and National Influenza Centers of Member States
Reports to the informatics global platforms FluNet and FluID /
Informe de los Ministerios de Salud y los Centros Nacionales de Influenza de los Estados Miembros a las plataformas informáticas
globales de FluNet y FluID

PAHO/OPS | INFLUENZA REGIONAL UPDATE EW 5 /ACTUALIZACIÓN REGIONAL DE INFLUENZA SE 5 3
WEEKLY REPORT DATA SOURCES
The information presented in this update is based on data provided by Ministries of Health and National Influenza Centers of Member States to the informatics global platforms
http://www.who.int/influenza/gisrs_laboratory/flunet/en/ and http://www.who.int/influenza/surveillance_monitoring/fluid/en/ ;
and reports/weekly bulletins that Ministries of Health published on its website or shared with PAHO/WHO.
La información presentada en esta actualización se obtiene a partir de los datos not ificados por los Ministerios de Salud y los Centros Nacionales de Influenza de los Estados Miembros a las plataformas informáticas globales de la
OPS/OMS: FluNet y FluID; y de los informes/boletines semanales que los Ministerios de Salud publican en sus páginas web o comparten con OPS/OMS.
PAHO INFLUENZA LINKS
PAHO interactive data / Datos interactivos de la OPS:
PAHO FluNet: http://ais.paho.org/phip/viz/ed_flu.asp
PAHO FluID: http://ais.paho.org/phip/viz/flumart2015.as
Influenza Regional Reports / Informes regionales de influenza:
In English: http://www.paho.org/influenzareport
En español: www.paho.org/reportesinfluenza
Severe acute respiratory infections network - SARInet
Red de las infecciones respiratorias agudas graves - SARInet:
http://www.sarinet.org
Go to Index/
Ir al Índice

PAHO/OPS | INFLUENZA REGIONAL UPDATE EW 5 /ACTUALIZACIÓN REGIONAL DE INFLUENZA SE 5 4
REPORT INDEX ÍNDICE DE LA ACTUALIZACIÓN
Section Content Page
1 Weekly Summary / Resumen Semanal 5
2 Overall Influenza and RSV circulation / Circulación general de los virus
influenza y VSR 6
3 Weekly and Cumulative numbers / Números semanales y acumulados 7
4 Epidemiological and Virologic update by country / Actualización
epidemiológica y virológica por país 8
5 Acronyms / Acrónimos 31
Rep
ort
In
dex
/ Í
nd
ice
de
la A
ctu
aliz
ació
n
PAHO/OPS | INFLUENZA REGIONAL UPDATE EW 5 /ACTUALIZACIÓN REGIONAL DE INFLUENZA SE 5 5
WEEKLY SUMMARY (ENGLISH)
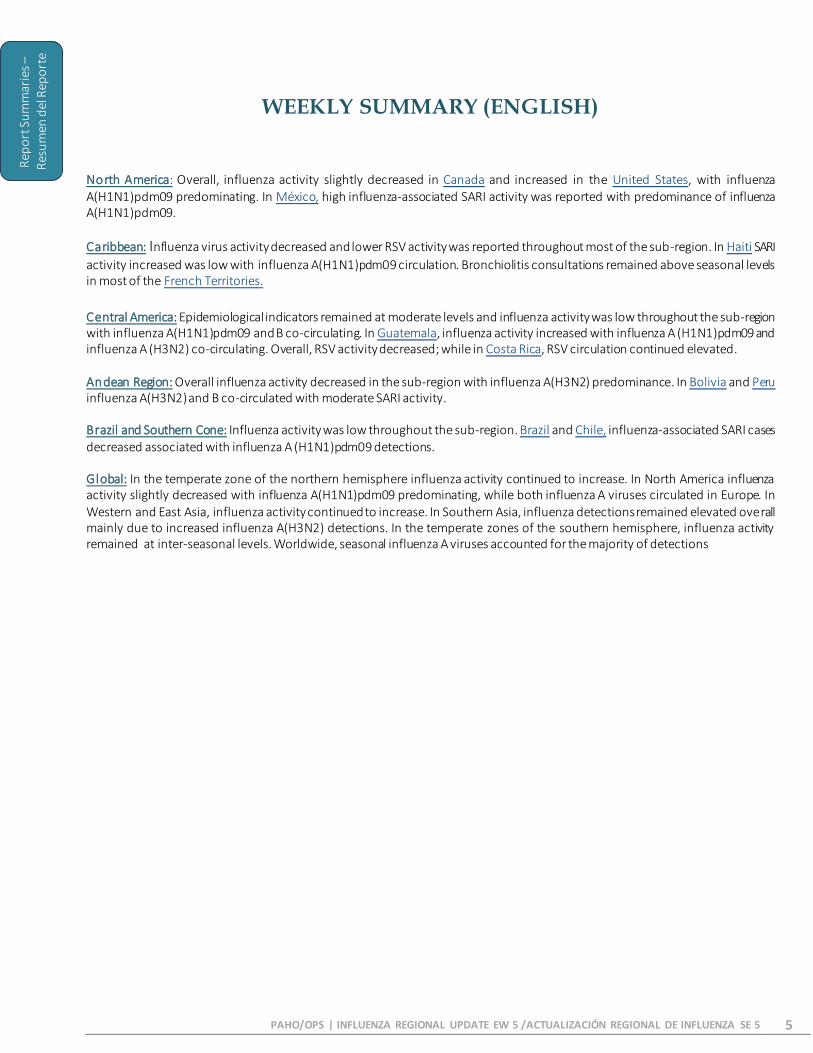
North America: Overall, influenza activity slightly decreased in Canada and increased in the United States, with influenza A(H1N1)pdm09 predominating. In México, high influenza-associated SARI activity was reported with predominance of influenza A(H1N1)pdm09.
Caribbean: Influenza virus activity decreased and lower RSV activity was reported throughout most of the sub-region. In Haiti SARI
activity increased was low with influenza A(H1N1)pdm09 circulation. Bronchiolitis consultations remained above seasonal levels in most of the French Territories.
Central America: Epidemiological indicators remained at moderate levels and influenza activity was low throughout the sub-region with influenza A(H1N1)pdm09 and B co-circulating. In Guatemala, influenza activity increased with influenza A (H1N1)pdm09 and influenza A (H3N2) co-circulating. Overall, RSV activity decreased; while in Costa Rica, RSV circulation continued elevated. Andean Region: Overall influenza activity decreased in the sub-region with influenza A(H3N2) predominance. In Bolivia and Peru influenza A(H3N2) and B co-circulated with moderate SARI activity. Brazil and Southern Cone: Influenza activity was low throughout the sub-region. Brazil and Chile, influenza-associated SARI cases decreased associated with influenza A (H1N1)pdm09 detections. Global: In the temperate zone of the northern hemisphere influenza activity continued to increase. In North America influenza activity slightly decreased with influenza A(H1N1)pdm09 predominating, while both influenza A viruses circulated in Europe. In Western and East Asia, influenza activity continued to increase. In Southern Asia, influenza detections remained elevated overall mainly due to increased influenza A(H3N2) detections. In the temperate zones of the southern hemisphere, influenza activity remained at inter-seasonal levels. Worldwide, seasonal influenza A viruses accounted for the majority of detections
Rep
ort
Su
mm
arie
s –
R
esu
men
del
Rep
ort
e

PAHO/OPS | INFLUENZA REGIONAL UPDATE EW 5 /ACTUALIZACIÓN REGIONAL DE INFLUENZA SE 5 6
RESUMEN SEMANAL (ESPAÑOL)
América del Norte: En general, la actividad de influenza disminuyó ligeramente en Canadá y aumentó en los Estados Unidos, con predominio de A(H1N1)pdm09. En México, se reportó elevada la actividad de IRAG asociada con la influenza con predominio de influenza A(H1N1)pdm09.
Caribe: La actividad de influenza disminuyó y se reportó menor actividad de VSR en la mayoría de la subregión. En Haití la actividad de IRAG fue baja con elevada circulación de influenza A(H1N1)pdm09. Las consultas por bronquiolitis permanecieron sobre los niveles estacionales en la mayoría de los Territorios Franceses. América Central: Los indicadores epidemiológicos permanecieron en niveles moderados y la actividad de influenza permaneció baja en la sub-región con circulación simultánea de influenza A(H1N1)pdm09 y B. En Guatemala la actividad de influenza comienza a aumentar con influenza (H1N1)pdm09 e influenza A (H3N2) en cocirculación. En general la actividad del VSR disminuyó mientras que en Costa Rica, la circulación de VSR continuó elevada. Sub-región Andina: En general la actividad de influenza disminuyó en la sub-región con predominio de influenza A(H3N2). En Bolivia y Perú circularon simultáneamente influenza A(H3N2) y B con moderada actividad de IRAG. Brasil y Cono Sur: Los niveles de influenza se ubicaron a niveles bajos en toda la sub-región. En Brasil y Chile, los casos de IRAG por influenza disminuyeron asociados con la detección de influenza (H1N1)pdm09. Global: En la zona templada del hemisferio norte la actividad deinfluenza continuó aumentando. En América del Norte, la actividad de influenza disminuyó ligeramente, predominando la influenza A (H1N1) pdm09, mientras que ambos virus de la influenza A circularon en Europa. En Asia occidental y oriental, la actividad de influenza siguió aumentando. En el sur de Asia, las detecciones de influenza se mantuvieron elevadas en general debido principalmente al aumento de las detecciones de influenza A (H3N2). En las zonas templadas del hemisferio sur, la actividad de influenza se mantuvo en niveles interestacionales. En todo el mundo, los virus influenza A estacionales representaron la mayoría de las detecciones
Rep
ort S
umm
arie
s –
R
esum
en d
el R
epor
te

PAHO/OPS | INFLUENZA REGIONAL UPDATE EW 5 /ACTUALIZACIÓN REGIONAL DE INFLUENZA SE 5 7
Influenza circulation by subregion, 2014-19 Circulación de virus influenza por subregión, 2014-19
Respiratory syncytial virus (RSV) circulation Circulación de virus sincicial respiratorio by subregion, 2014-19 (VSR) por subregión, 2014-19
*To view more lab data, view here. / Para ver más datos lab, vea aquí.
Rep
ort
Sum
mar
ies –
R
esum
en d
el R
epor
te
PAHO/OPS | INFLUENZA REGIONAL UPDATE EW 5 /ACTUALIZACIÓN REGIONAL DE INFLUENZA SE 5 8
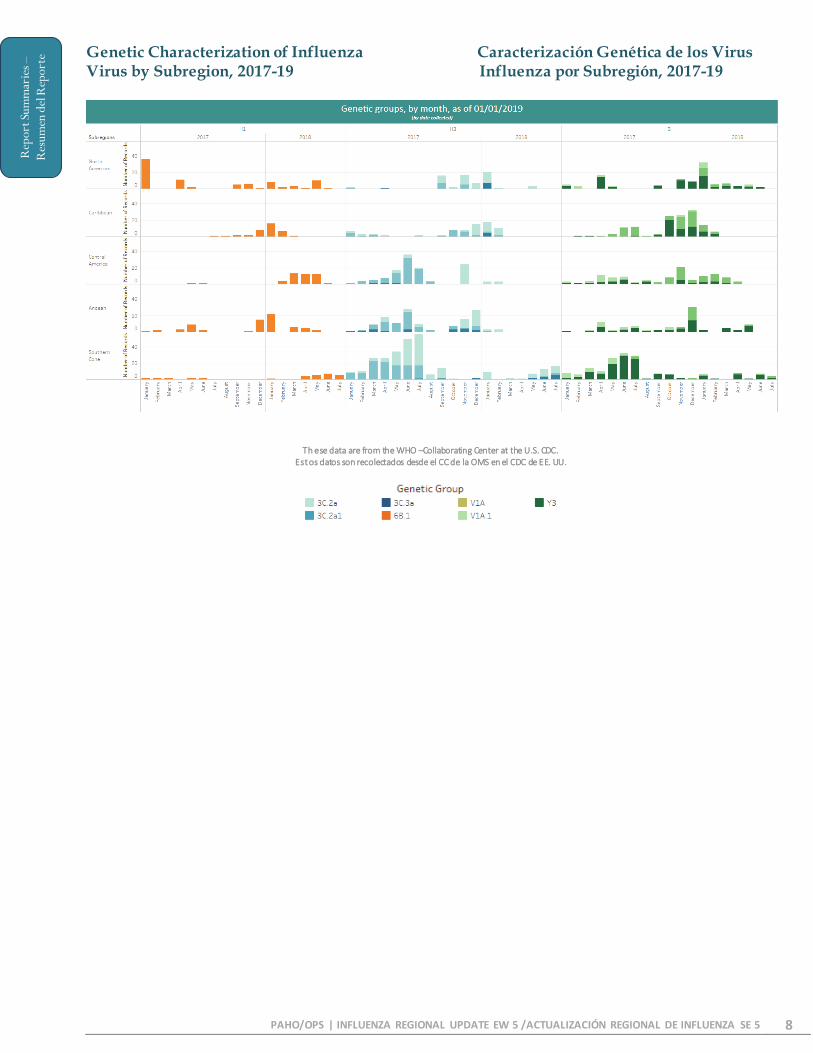
Genetic Characterization of Influenza Caracterización Genética de los Virus Virus by Subregion, 2017-19 Influenza por Subregión, 2017-19
Th ese data are from the WHO –Collaborating Center at the U.S. CDC. Est os datos son recolectados desde el CC de la OMS en el CDC de EE. UU.
Rep
ort S
umm
arie
s –
R
esum
en d
el R
epor
te

PAHO/OPS | INFLUENZA REGIONAL UPDATE EW 5 /ACTUALIZACIÓN REGIONAL DE INFLUENZA SE 5 9
Weekly and cumulative numbers of influenza and other respiratory virus, by country and EW, 20191
Números semanales y acumulados de influenza y otros virus respiratorios, por país y SE, 20192
* NIC laboratory data only / datos de laboratorio solo del NIC
1
The detection of respiratory viruses other than influenza depends on the diagnostic capacity of each country and monitoring system. The absence of report of other respiratory viruses does not indicate the absence of their circulation.
2 La detección de otros virus respiratorios diferentes a influenza depende de la capacidad diagnóstica de cada país y del sistema de vigilancia establecido. El que no se reporten otros virus respiratorios, no significa, ni indica la ausenc ia
de circulación viral.
Rep
ort
Su
mm
arie
s –
R
esu
men
del
Rep
ort
e

PAHO/OPS | INFLUENZA REGIONAL UPDATE EW 5 /ACTUALIZACIÓN REGIONAL DE INFLUENZA SE 5 10
No
rth
Am
eric
a-
Am
éric
a d
el N
ort
e
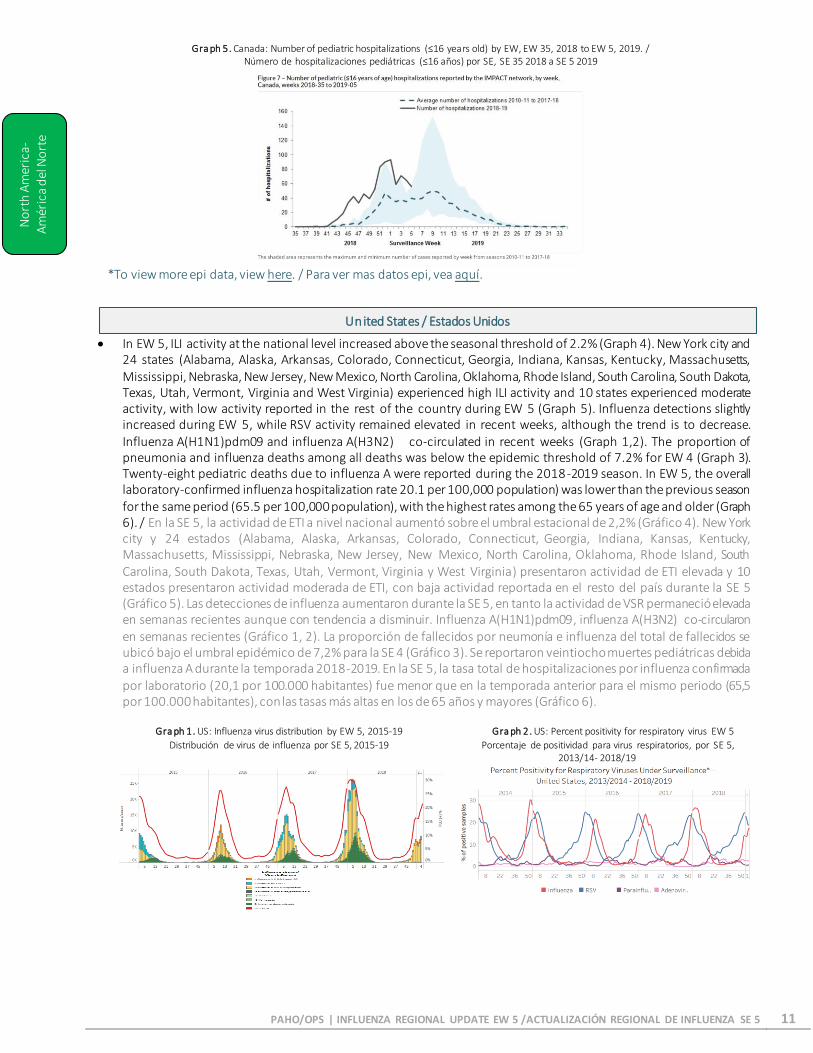
• In EW 5, the percent of ILI visits at the national level remain the same as previous week and was below the 5-year average for the same period (Graph 2). During EW 5, influenza activity declined: 17 regions reported localized activity: in Alta.(1), Ont.(6), Que.(3), N.L.(1), N.S.(3) and N.B.(3); most of the provinces and territories reported sporadic ILI activity and two regions in N.W.T. reported no activity (Graph 3). During EW 3, influenza detections decreased (Graph 1) and influenza A(H1N1)pdm09 predominated among the influenza detections. RSV positivity remained elevated in recent weeks, while coronavirus, enterovirus/rhinovirus predominated among the other respiratory viruses (Graph 4). In EW 5, the pediatric hospitalizations decreased above the average for 2010-2018 after a peak 4-6 weeks earlier than in recent seasons (Graph 5). A total of 802 pediatric hospitalizations were reported, with 99% of all cases associated with influenza A and mainly among the children under 5 years-of-age. From EW 35 to EW 5, 135 pediatric ICU admissions were reported, mainly among children under 5 years of age. The elderly was the most affected among influenza-associated adult hospitalizations. Ten pediatric deaths were registered during the 2018-19 season and all of them have been associated with influenza A. / En la SE 5, el porcentaje de consultas por ETI a nivel nacional permaneció igual con respecto a la semana anterior y estuvo por debajo del promedio de 5 años para el mismo período (Gráfico 2). Durante la SE 5, la actividad de influenza disminuyó: 17 regiones reportaron actividad localizada en: Alta.(1), Ont.(6), Que.(3), N.L.(1), N.S.(3) and N.B.(3); la mayoría de los territorios y provincias reportaron esporádica actividad de ETI y dos regiones en N.W.T. no reportaron actividad (Gráfico 3). Durante la SE 3, las detecciones de influenza disminuyeron (Gráfico 1) y los virus influenza A(H1N1)pdm09 predominaron entre las detecciones de influenza. La positividad de VSR permaneció elevada en semanas recientes, mientras que coronavirus, enterovirus/rinovirus predominaron entre los otros virus respiratorios (Gráfico 4). En la SE 5, las hospitalizaciones pediátricas disminuyeron permaneciendo por encima del promedio para 2010-2018 después de un pico de 4-6 semanas más temprano que en las temporadas previas (Gráfico 5). Se reportó un total de 802 hospitalizaciones pediátricas, con 99% de todos los casos asociados a la influenza A y mayoritariamente en niños menores de 5 años. Desde la SE 35 a la SE 5, se reportaron 135 admisiones pediátricas a la UCI, principalmente entre niños menores de 5 años. Los adultos mayores fueron los más afectados entre las hospitalizaciones de adultos asociadas con la influenza. Se registraron diez muertes pediátricas durante la temporada 2018-2019 y todas ellas estuvieron asociadas con la influenza.
Gra ph 1. Canada: Influenza virus distribution by EW, 2015-19, EW 3. / Distribución de virus de influenza por SE, 2015-19. SE 3.
Gra ph 2. Canada: Percentage of ILI visits by sentinel sites, EW 5, 2019 (in comparison to 2012-2017 seasons)
Porcentaje de casos de ETI por sitio centinela , SE 5, 2019 (en comparación con temporadas 2012-2017)
Gra ph 3. Canada: Influenza activity by provincial and territorial influenza
surveillance regions, 2017-2018, EW 5, 2019. Actvidad de influenza por regiones de vigilancia de influenza provinciales y
territoriales, 2017-2018, SE 5 2019.
Gra ph 4. Canada: RSV distribution by EW, EW 5, 2019. /
Distribución de VSR por SE, SE 5, 2019.
EPIDEMIOLOGIC AND VIROLOGIC UPDATE OF INFLUENZA & OTHER
RESPIRATORY VIRUS BY COUNTRY
ACTUALIZACIÓN EPIDEMIOLÓGICA Y VIROLÓGICA DE INFLUENZA Y OTROS VIRUS
RESPIRATORIOS DESAGREGADA POR PÁIS
North America / América del Norte
Canada / Canadá
PAHO/OPS | INFLUENZA REGIONAL UPDATE EW 5 /ACTUALIZACIÓN REGIONAL DE INFLUENZA SE 5 11
No
rth
Am
eric
a-
Am
éric
a d
el N
ort
e Gra ph 5. Canada: Number of pediatric hospitalizations (≤16 years old) by EW, EW 35, 2018 to EW 5, 2019. /
Número de hospitalizaciones pediátricas (≤16 años) por SE, SE 35 2018 a SE 5 2019
*To view more epi data, view here. / Para ver mas datos epi, vea aquí.
• In EW 5, ILI activity at the national level increased above the seasonal threshold of 2.2% (Graph 4). New York city and
24 states (Alabama, Alaska, Arkansas, Colorado, Connecticut, Georgia, Indiana, Kansas, Kentucky, Massachusetts, Mississippi, Nebraska, New Jersey, New Mexico, North Carolina, Oklahoma, Rhode Island, South Carolina, South Dakota, Texas, Utah, Vermont, Virginia and West Virginia) experienced high ILI activity and 10 states experienced moderate activity, with low activity reported in the rest of the country during EW 5 (Graph 5). Influenza detections slightly increased during EW 5, while RSV activity remained elevated in recent weeks, although the trend is to decrease. Influenza A(H1N1)pdm09 and influenza A(H3N2) co-circulated in recent weeks (Graph 1,2). The proportion of pneumonia and influenza deaths among all deaths was below the epidemic threshold of 7.2% for EW 4 (Graph 3). Twenty-eight pediatric deaths due to influenza A were reported during the 2018-2019 season. In EW 5, the overall laboratory-confirmed influenza hospitalization rate 20.1 per 100,000 population) was lower than the previous season for the same period (65.5 per 100,000 population), with the highest rates among the 65 years of age and older (Graph 6). / En la SE 5, la actividad de ETI a nivel nacional aumentó sobre el umbral estacional de 2,2% (Gráfico 4). New York city y 24 estados (Alabama, Alaska, Arkansas, Colorado, Connecticut, Georgia, Indiana, Kansas, Kentucky, Massachusetts, Mississippi, Nebraska, New Jersey, New Mexico, North Carolina, Oklahoma, Rhode Island, South Carolina, South Dakota, Texas, Utah, Vermont, Virginia y West Virginia) presentaron actividad de ETI elevada y 10 estados presentaron actividad moderada de ETI, con baja actividad reportada en el resto del país durante la SE 5 (Gráfico 5). Las detecciones de influenza aumentaron durante la SE 5, en tanto la actividad de VSR permaneció elevada en semanas recientes aunque con tendencia a disminuir. Influenza A(H1N1)pdm09, influenza A(H3N2) co-circularon en semanas recientes (Gráfico 1, 2). La proporción de fallecidos por neumonía e influenza del total de fallecidos se ubicó bajo el umbral epidémico de 7,2% para la SE 4 (Gráfico 3). Se reportaron veintiocho muertes pediátricas debida a influenza A durante la temporada 2018-2019. En la SE 5, la tasa total de hospitalizaciones por influenza confirmada por laboratorio (20,1 por 100.000 habitantes) fue menor que en la temporada anterior para el mismo periodo (65,5 por 100.000 habitantes), con las tasas más altas en los de 65 años y mayores (Gráfico 6).
Gra ph 1. US: Influenza virus distribution by EW 5, 2015-19 Distribución de virus de influenza por SE 5, 2015-19
Gra ph 2. US: Percent positivity for respiratory virus EW 5
Porcentaje de positividad para virus respiratorios, por SE 5, 2013/14- 2018/19
United States / Estados Unidos

PAHO/OPS | INFLUENZA REGIONAL UPDATE EW 5 /ACTUALIZACIÓN REGIONAL DE INFLUENZA SE 5 12
No
rth
Am
eric
a-
Am
eric
a d
el N
ort
e
Gra ph 3. US: Pneumonia and influenza mortality. EW 4, 2019 Mortalidad por neumonía e influenza. SE 4, 2019
Gra ph 4. US: Percentage of visits for ILI, 2018-2019. EW 5 Porcentaje de visitas por ETI, 2018-2019. SE 5.
Gra ph 5. US: ILI activity level indicator determined by state, EW 5,
2018-2019. Indicador de nivel de actividad de ETI por estado, SE 5, 2018-2019.
Gra ph 6. US: Laboratory-confirmed influenza hospitalizations rates (per 100000 population) by age group and W, EW 5,
2018-2019.
Tasas de hospitalizaciones (por 100000 habitantes) por influenza confirmadas por laboratorio por grupo de edad y SE,
SE 5, 2018-2019
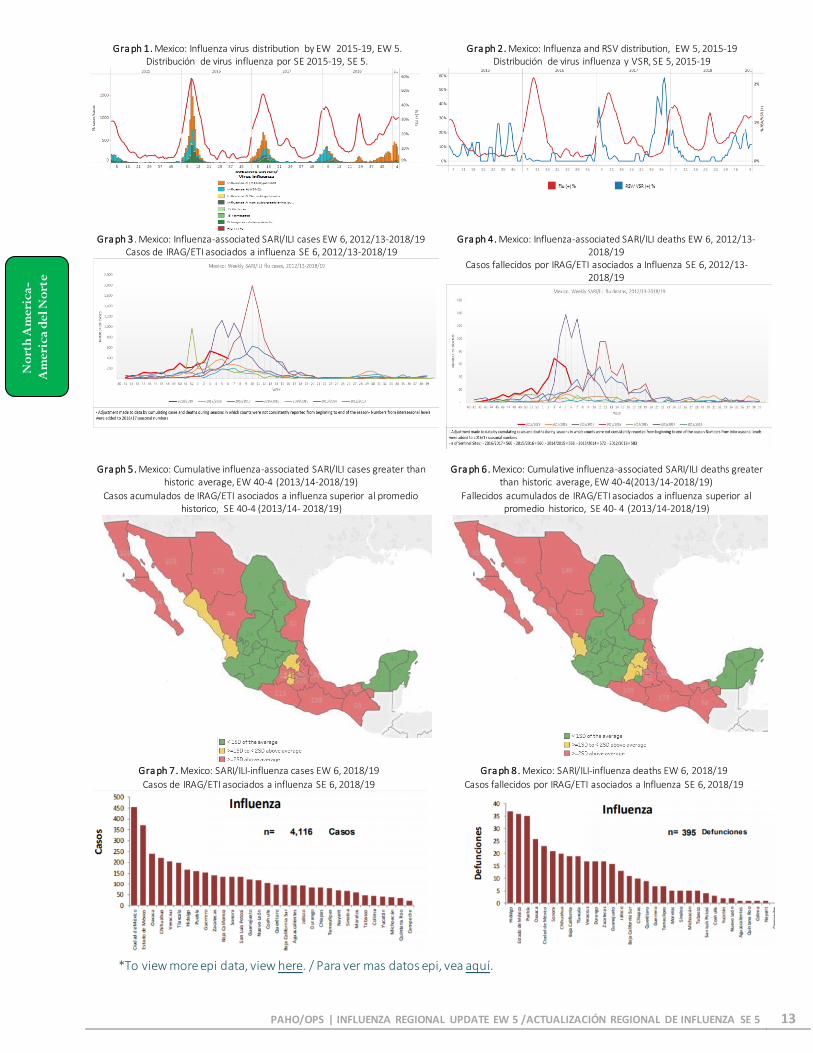
• During EW 5, influenza activity continued elevated with influenza A(H1N1)pdm09 predominating. RSV activity decreased, with co-circulation of rhinovirus, parainfluenza and metapneumovirus in the last month (Graph 1, 2). Up to EW 6, influenza-associated SARI/ILI counts slightly decreased compared with previous weeks but remain slightly higher compared with most other seasons (Graph 3) and 395 influenza-associated SARI/ILI deaths were reported as compared from previous seasons for the same period (Graph 4, 8). In EW 3, 14 states reported higher influenza-associated SARI/ILI counts than the historic average (≥ than 2 standard deviations above): Baja California, Baja California Sur, Chiapas, Chihuahua, Durango, Guerrero, Mexico, Oaxaca, Puebla, Sonora, Tabasco, Tamaulipas, Tlaxcala and Veracruz (Graph 5). In EW 3, 14 states reported higher influenza-associated SARI/ILI deaths counts than the historic average: Baja California, Baja California Sur, Chiapas, Chihuahua, Durango, Guerrero, Oaxaca, Puebla, Sinaloa, Sonora, Tabasco , Tamaulipas, Tlaxcala, and Veracruz (Graph 6). During EW 6, 4116 cumulative influenza-associated SARI/ILI cases were reported, with the highest counts in Ciudad de Mexico, Estado de Mexico, Oaxaca, Chihuahua, and Veracruz; and 395 influenza-associated SARI/ILI deaths predominating in Hidalgo, Estado de Mexico, Puebla, Oaxaca and Ciudad de Mexico (Graphs 7, 8). / Durante la SE 5, la actividad de influenza continuó elevada con predominio de influenza A(H1N1)pdm09. La actividad de VSR disminuyó, con co-circulación de rinovirus, parainfluenza y metapneumovirus en el último mes (Gráfico 1,2). Hasta la SE 6, los recuentos de IRAG/ETI asociados a influenza ligeramente disminuyeron comparados con los de semanas previas pero permanecieron superiores a los niveles observados durante la mayoría de las temporadas anteriores (Gráfico 3) y se reportaron 395 casos fallecidos de IRAG/ETI asociados a influenza con relación a las temporadas anteriores para el mismo período (Gráfico 4,8). En la SE 3, 14 estados reportaron mayores recuentos de IRAG/ETI asociados a influenza en comparación con el promedio histórico (≥ a 2 desvíos estándar): Baja California, Baja California Sur, Chiapas, Chihuahua, Durango, Guerrero, México, Oaxaca, Puebla, Sonora, Tabasco, Tamaulipas, Tlaxcala y Veracruz (Gráfico 5). En la SE 3, 14 estados reportaron mayor recuento de fallecidos por IRAG/ETI asociados a influenza en comparación con el promedio histórico: Baja California, Baja California Sur, Chiapas, Chihuahua, Durango, Guerrero, Oaxaca, Puebla, Sinaloa, Sonora, Tabasco, Tamaulipas, Tlaxcala, y Veracruz (Graph (Gráfico 6). Durante la SE 6, fue reportado un total acumulado de 4116 casos de IRAG/ETI asociados a influenza con el mayor recuento en Ciudad de Mexico, Estado de Mexico, Oaxaca, Chihuahua, and Veracruz; y 395 muertes por IRAG/ETI asociadas a influenza predominando en Hidalgo, Estado de Mexico, Puebla, Oaxaca and Ciudad de Mexico (Gráficos 7, 8).
Mexico
PAHO/OPS | INFLUENZA REGIONAL UPDATE EW 5 /ACTUALIZACIÓN REGIONAL DE INFLUENZA SE 5 13
No
rth
Am
eric
a-
Am
eric
a d
el N
ort
e
Gra ph 1. Mexico: Influenza virus distribution by EW 2015-19, EW 5. Distribución de virus influenza por SE 2015-19, SE 5.
Gra ph 2. Mexico: Influenza and RSV distribution, EW 5, 2015-19 Distribución de virus influenza y VSR, SE 5, 2015-19
Gra ph 3. Mexico: Influenza-associated SARI/ILI cases EW 6, 2012/13-2018/19 Casos de IRAG/ETI asociados a influenza SE 6, 2012/13-2018/19
Gra ph 4. Mexico: Influenza-associated SARI/ILI deaths EW 6, 2012/13- 2018/19
Casos fallecidos por IRAG/ETI asociados a Influenza SE 6, 2012/13-2018/19
Gra ph 5. Mexico: Cumulative influenza-associated SARI/ILI cases greater than historic average, EW 40-4 (2013/14-2018/19)
Casos acumulados de IRAG/ETI asociados a influenza superior al promedio historico, SE 40-4 (2013/14- 2018/19)
Gra ph 6. Mexico: Cumulative influenza-associated SARI/ILI deaths greater
than historic average, EW 40-4(2013/14-2018/19)
Fallecidos acumulados de IRAG/ETI asociados a influenza superior al promedio historico, SE 40- 4 (2013/14-2018/19)
Gra ph 7. Mexico: SARI/ILI-influenza cases EW 6, 2018/19
Casos de IRAG/ETI asociados a influenza SE 6, 2018/19
Gra ph 8. Mexico: SARI/ILI-influenza deaths EW 6, 2018/19
Casos fallecidos por IRAG/ETI asociados a Influenza SE 6, 2018/19
*To view more epi data, view here. / Para ver mas datos epi, vea aquí.
PAHO/OPS | INFLUENZA REGIONAL UPDATE EW 5 /ACTUALIZACIÓN REGIONAL DE INFLUENZA SE 5 14
Car
ibb
ean
- El
Car
ibe
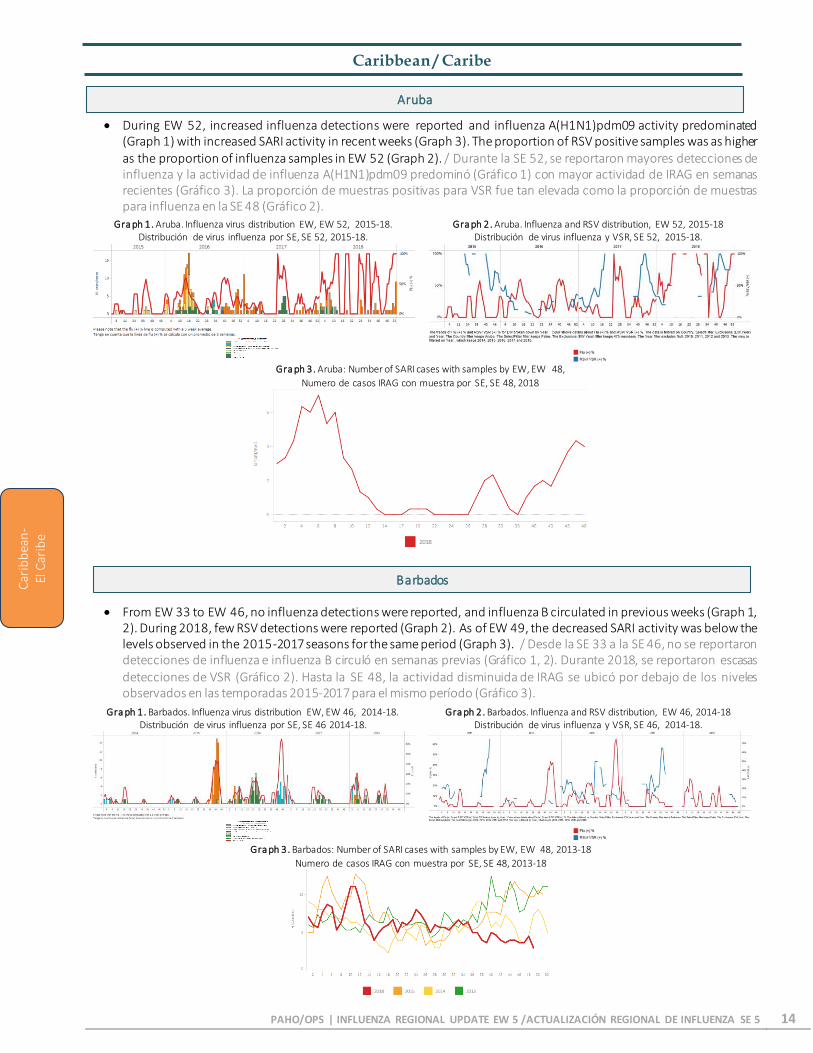
• During EW 52, increased influenza detections were reported and influenza A(H1N1)pdm09 activity predominated (Graph 1) with increased SARI activity in recent weeks (Graph 3). The proportion of RSV positive samples was as higher as the proportion of influenza samples in EW 52 (Graph 2). / Durante la SE 52, se reportaron mayores detecciones de influenza y la actividad de influenza A(H1N1)pdm09 predominó (Gráfico 1) con mayor actividad de IRAG en semanas recientes (Gráfico 3). La proporción de muestras positivas para VSR fue tan elevada como la proporción de muestras para influenza en la SE 48 (Gráfico 2).
• From EW 33 to EW 46, no influenza detections were reported, and influenza B circulated in previous weeks (Graph 1, 2). During 2018, few RSV detections were reported (Graph 2). As of EW 49, the decreased SARI activity was below the levels observed in the 2015-2017 seasons for the same period (Graph 3). / Desde la SE 33 a la SE 46, no se reportaron detecciones de influenza e influenza B circuló en semanas previas (Gráfico 1, 2). Durante 2018, se reportaron escasas detecciones de VSR (Gráfico 2). Hasta la SE 48, la actividad disminuida de IRAG se ubicó por debajo de los niveles observados en las temporadas 2015-2017 para el mismo período (Gráfico 3).
Gra ph 1. Aruba. Influenza virus distribution EW, EW 52, 2015-18. Distribución de virus influenza por SE, SE 52, 2015-18.
Gra ph 2. Aruba. Influenza and RSV distribution, EW 52, 2015-18 Distribución de virus influenza y VSR, SE 52, 2015-18.
Gra ph 3. Aruba: Number of SARI cases with samples by EW, EW 48,
Numero de casos IRAG con muestra por SE, SE 48, 2018
Gra ph 1. Barbados. Influenza virus distribution EW, EW 46, 2014-18. Distribución de virus influenza por SE, SE 46 2014-18.
Gra ph 2. Barbados. Influenza and RSV distribution, EW 46, 2014-18 Distribución de virus influenza y VSR, SE 46, 2014-18.
Gra ph 3. Barbados: Number of SARI cases with samples by EW, EW 48, 2013-18
Numero de casos IRAG con muestra por SE, SE 48, 2013-18
Caribbean / Caribe
Aruba
Barbados

PAHO/OPS | INFLUENZA REGIONAL UPDATE EW 5 /ACTUALIZACIÓN REGIONAL DE INFLUENZA SE 5 15
Car
ibb
ean
- El
Car
ibe
• During EW 3, decreased SARI activity was reported (Graph 1), as compared to the previous five seasons’ average. In EW
3, the ARI incidence rate among <5 years of age children was lower than the previous seasons for the same period (Graph 2). In EW 4, decreased influenza samples were detected with influenza B and A(H1N1)pdm09 circulating during the previous weeks (Graph 3). / Durante la SE 3, se reportó un descenso en la actividad de IRAG (Gráfico 1), en comparación con el promedio de las cinco temporadas previas. En la SE 3, la incidencia de IRA entre los niños <5 años fue menor que en las temporadas previas para el mismo período (Gráfico 2). En la SE 4, se detectaron menores muestras de influenza con circulación de influenza B y A(H1N1)pdm09 en semanas previas (Gráfico 3).
Gra ph 1. Belize: SARI incidence rate per 100,000, EW 3, 2019
Tasa de incidencia de IRAG por 100.000, SE 3, 2019
Gra ph 2. Belize: ARI incidence rate per 100,000, <5 years old, EW 3, 2019
Tasa de incidencia de IRA por 100.000, <5 años de edad, SE 3, 2019
Gra ph 3. Belize. Influenza virus distribution EW, EW 4, 2016-19.
Distribución de virus influenza por SE, SE 4, 2016-19.
• During EW 52, increased influenza detections were reported with influenza A(H1N1)pdm09 circulating (Graph 1). The proportion of influenza positive samples and the proportion of RSV positive samples increased from previous weeks (Graph 2). / Durante la SE 52, se reportaron mayores detecciones de influenza con circulación de influenza A(H1N1)pdm09 (Gráfico 1). La proporción de muestras positivas para influenza y la proporción de muestras positivas para VSR aumentaron en relación con semanas previas (Gráfico 2).
*To view more epi data, view here. / Para ver mas datos epi, vea aquí.
• From EW 23 to EW 44, SARI activity remained at low levels, with no cases reported in EW 44 (Graph 1). / Desde la SE 23 a SE 44, la actividad de IRAG permaneció a niveles bajos, sin casos reportados en la SE 44 (Gráfico 1).
Gra ph 1. CARPHA. Influenza virus distribution EW, EW 52, 2014-18. Distribución de virus influenza por SE, SE 52, 2014-18.
Gra ph 2. CARPHA. Influenza and RSV distribution, EW 52, 2014-18 Distribución de virus influenza y VSR, SE 52, 2014-18.
CARPHA
Belize/ Belice
Cayman Island / Islas Caiman

PAHO/OPS | INFLUENZA REGIONAL UPDATE EW 5 /ACTUALIZACIÓN REGIONAL DE INFLUENZA SE 5 16
Car
ibb
ean
- El
Car
ibe
Gra ph 1. Cayman Island/ Islas Caiman: Percentage of SARI cases by EW, EW 44, 2018.
Porcentaje de casos de IRAG por SE, SE 44, 2018
• During EW 3, increased influenza activity was reported with influenza A(H1N1)pdm09 and B co-circulating and overall few samples (Graph 1); while there was no RSV circulation during the 2018-19 season until EW 39 to EW 3, 2019 (Graph 2). The number of SARI cases decreased and were lower than in the 2018 season for the same period and were among the <5-years-old population, with influenza predominating (Graph 1,3). / Durante la SE 3, se report mayor actividad de influenza, con co-circulación de influenza A(H1N1)pdm09 y B y bajas muestras en general (Gráfico 1), en tanto no se reportó circulación de VSR durante la temporada 2018-19 hasta la SE 39 a SE 3 de 2019 (Gráfico 2). Los casos de IRAG disminuyeron y estuvieron por debajo de los niveles de la temporada 2018 para el mismo período y fueron entre la población de < 5 años de edad con predominio de influenza (Gráfico 1, 3).
Gra ph 1. Cuba: Influenza virus distribution by EW, EW 3, 2015-19
Distribución de virus influenza por SE, SE 3, 2015-19
Gra ph 2. Cuba Influenza and RSV distribution, EW 3, 2015-19
Distribución de virus influenza y VSR, SE 3, 2015-19
Gra ph 3. Cuba: Percent positivity for influenza and RSV among SARI cases by EW, EW 3, 2015-19
Porcentaje de positividad por influenza y VSR entre todos casos, por SE, SE 3, 2015-19
Gra ph 4. Cuba: Number of SARI cases with samples by EW, EW 3, 2019 Número de casos de IRAG con muestras, por SE, SE 3, 2019
*To view more epi data, view here. / Para ver mas datos epi, vea aquí.
• During EW 5, decreased influenza detections were reported, with influenza A(H1N1)pdm09 predominating in recent weeks (Graph 1); RSV detections increased from the prior week (Graph 2). Influenza positivity was below the alert threshold and the average epidemic curve (Graph 3). During EW 3, the number of SARI cases decreased from previous weeks (Graph 4), with a similar proportion of influenza and RSV positive samples. The SARI and influenza-associated SARI cases predominated among the <5 years old. / Durante la SE 5, disminuyó la detección del virus de la influenza, con predominio de influenza A(H1N1)pdm09 en semanas previas (Gráfico 1); las detecciones de VSR aumentaron en relación a la semana previa (Gráfico 2). La positividad para influenza se mantuvo bajo el umbral de alerta y del umbral epidémico (Gráfico 3). Durante la SE 3, el número de casos de IRAG disminuyó en relación a semanas previas (Gráfico 4), con una proporción similar de muestras positivas para influenza y VSR. Los casos de IRAG y los casos de IRAG asociados a influenza predominaron en los <5 años.
Dominican Republic / República Dominicana
Cuba

PAHO/OPS | INFLUENZA REGIONAL UPDATE EW 5 /ACTUALIZACIÓN REGIONAL DE INFLUENZA SE 5 17
Car
ibb
ean
- El
Car
ibe
Gra ph 1. Dominican Republic: Influenza virus distribution EW, 2015-19. EW
5. Distribución de virus influenza por SE, 2015-19.SE 5.
Gra ph 2. Dominican Republic Influenza and RSV distribution, EW 5, 2015-19
Distribución de virus influenza y VSR, SE 5, 2015-19
Gra ph 3. Dominican Republic: Percent positivity for influenza, EW 5, 2019 (in comparision to 2010-2018)
Porcentaje de positividad de influenza, SE 5, 2019 (en comparación a 2010-2018)
Gra ph 4. Dominican Republic: Number of SARI cases that were sampled, by EW, EW 3, 2019
Numero de casos de IRAG con muestra by EW, EW 3, 2019
*To view more epi data, view here. / Para ver mas datos epi, vea aquí.
• During EW 46, no influenza detections were reported, with influenza A(H3N2) circulating in recent weeks (Graph 1). Influenza positivity was below the seasonal threshold and the average epidemic curve. / Durante la SE 46, no se reportaron detecciones de influenza, con circulación de influenza A(H3N2) en semanas recientes (Gráfico 1). La actividad de influenza se ubicó bajo el umbral estacional y la curva epidémica.
Gra ph 1. French Guiana: Influenza virus distribution EW, 2014-18. EW 46.
Distribución de virus influenza por SE, 2014-18.SE 46.
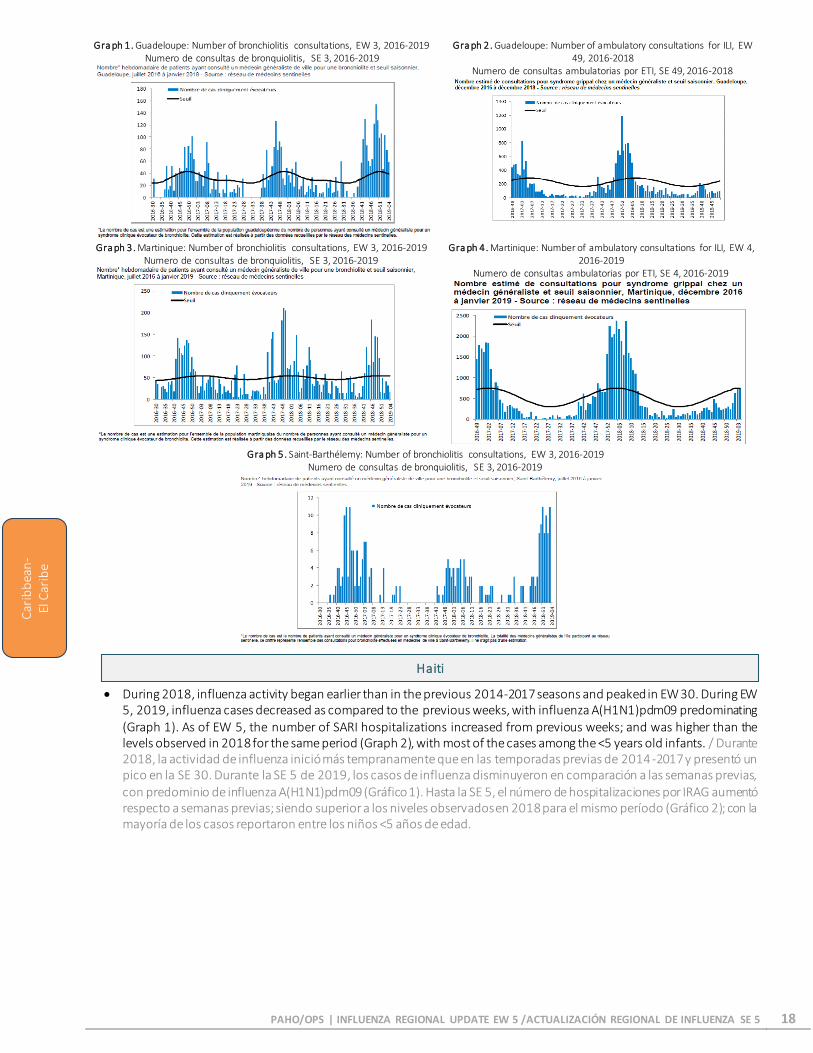
• During EW 3, 2019, bronchiolitis consultations decreased after a peak in EW 43 and were slightly higher than the seasonal average in Guadeloupe (Graph 1), while ILI activity remained at low levels in EW 1 (Graph 2). As of EW 3 and 4, in Martinique, bronchiolitis and ILI activities were below seasonal levels for the 2018 season (Graph 3, 4), while in Saint-Barthélemy, bronchiolitis activity remained high (Graph 5). / Durante la SE 3 de 2019, las consultas por bronquiolitis disminuyeron luego de un pico en la SE 43 y fueron ligeramente mayores que el promedio estacional en Guadalupe (Gráfico 1), en tanto la actividad de ETI se mantuvo a niveles bajos en la SE 1 (Grafico 2). Hasta la SE 3 y 4, en Martinica las actividades de bronquiolitis y de ETI permanecieron bajo los niveles estacionales para la temporada 2018 (Gráfico 3, 4), mientras que en Saint-Barthélemy, la actividad de bronquiolitis permaneció elevada (Gráfico 5).
French Territories / Territorios Franceses
French Guiana
PAHO/OPS | INFLUENZA REGIONAL UPDATE EW 5 /ACTUALIZACIÓN REGIONAL DE INFLUENZA SE 5 18
Car
ibb
ean
- El
Car
ibe
•
• During 2018, influenza activity began earlier than in the previous 2014-2017 seasons and peaked in EW 30. During EW 5, 2019, influenza cases decreased as compared to the previous weeks, with influenza A(H1N1)pdm09 predominating (Graph 1). As of EW 5, the number of SARI hospitalizations increased from previous weeks; and was higher than the levels observed in 2018 for the same period (Graph 2), with most of the cases among the <5 years old infants. / Durante 2018, la actividad de influenza inició más tempranamente que en las temporadas previas de 2014 -2017 y presentó un pico en la SE 30. Durante la SE 5 de 2019, los casos de influenza disminuyeron en comparación a las semanas previas, con predominio de influenza A(H1N1)pdm09 (Gráfico 1). Hasta la SE 5, el número de hospitalizaciones por IRAG aumentó respecto a semanas previas; siendo superior a los niveles observados en 2018 para el mismo período (Gráfico 2); con la mayoría de los casos reportaron entre los niños <5 años de edad.
Gra ph 1. Guadeloupe: Number of bronchiolitis consultations, EW 3, 2016-2019 Numero de consultas de bronquiolitis, SE 3, 2016-2019
Gra ph 2. Guadeloupe: Number of ambulatory consultations for ILI, EW 49, 2016-2018
Numero de consultas ambulatorias por ETI, SE 49, 2016-2018
Gra ph 3. Martinique: Number of bronchiolitis consultations, EW 3, 2016-2019 Numero de consultas de bronquiolitis, SE 3, 2016-2019
Gra ph 4. Martinique: Number of ambulatory consultations for ILI, EW 4, 2016-2019
Numero de consultas ambulatorias por ETI, SE 4, 2016-2019
Gra ph 5. Saint-Barthélemy: Number of bronchiolitis consultations, EW 3, 2016-2019
Numero de consultas de bronquiolitis, SE 3, 2016-2019
Haiti

PAHO/OPS | INFLUENZA REGIONAL UPDATE EW 5 /ACTUALIZACIÓN REGIONAL DE INFLUENZA SE 5 19
Car
ibb
ean
-
El C
arib
e
*To view more epi data, view here. / Para ver mas datos epi, vea aquí.
• During EW 5, influenza detection slightly decrease compared with previous week with influenza A H1N1pdm09 and
influenza A H3N2 co-circulating (Graph 1) although the percentage of influenza positivity remains above the average epidemic curve (Graph 3); RSV activity slightly increased compared with previous week. (Graph 2). The number of SARI hospitalizations decreased below previous seasons level (Graph 4). The number of ARI cases increased and remained above most of the previous seasons level (Graph 5)./ Durante la SE 5, la detección del virus de la influenza disminuyó ligeramente comparada con la semana previa, cocirculando influenza A H1N1pdm09 e influenza A H3N2 (Gráfico 1) aunque el porcentaje de positivos para influenza permanece por encima de la curva epidémica promedio (Gráfica 3); la actividad del VSR se incrementó ligeramente comparada con la de semanas anteriores (Gráfico 2). El número de hospitalizaciones por IRAG disminuyó por debajo del nivel de las temporadas previas. El número de casos de IRA aumentó ligeramente permaneciendo por encima del nivel de la mayoría de las temporadas anteriores (Gráfico 5 ).
Gra ph 1. Jamaica: Influenza virus distribution by EW, EW 5, 2015-19 Distribución de virus influenza por SE, SE 5, 2015-19
Gra ph 2. Jamaica: Influenza and RSV virus distribution by EW, EW 5, 2015-19
Distribución de virus influenza y VSR por SE, SE 5, 2015-19
Gra ph 3. Jamaica: Percent positivity for influenza, EW 5 2019 (in comparision to 2010-2018)
Porcentaje de positividad de influenza, SE 5, 2019 (en comparación a 2010-2018)
Gra ph 4. Jamaica: Number of SARI hospitalizations among total hospitalizations, EW 5, 2015-2019. /
Número de hospitalizaciones por IRAG entre total de hospitalizaciones, SE 5, 2015-2019.
Gra ph 1. Haiti: Influenza virus distribution EW, 2014-19. EW 5. Distribución de virus influenza por SE, 2014-19. SE 5.
Gra ph 2. Haiti: Number of SARI cases, EW 5, 2017-2019. / Número de casos de IRAG, SE 5, 2017-2019.
Jamaica

PAHO/OPS | INFLUENZA REGIONAL UPDATE EW 5 /ACTUALIZACIÓN REGIONAL DE INFLUENZA SE 5 20
Car
ibb
ean
- El
Car
ibe
Gra ph 5. Jamaica: Number of ARI cases (compared to 2014-2018), EW 5 2019
Número de casos de IRA, (en comparación a 2014-2018), SE 5 2019
*To view more epi data, view here. / Para ver mas datos epi, vea aquí.
• During EW 5, increased influenza cases detected remained above the seasonal threshold, with predominance of influenza A(H1N1)pdm09 (Graph 1). During EW 3, no ILI activity was reported, and it remained below the average epidemic curve up to EW 21, 2018 (Graph 2). / Durante la SE 5, continua el incremento de número de casos de influenza detectados y permanecen por encima del umbral estacional, con predominio de influenza A(H1N1)pdm09 (Gráfico 1). Durante la SE 5, no se reportó actividad de ETI, y la misma permaneció por debajo de la curva epidémica media hasta la SE 21 de 2018 (Gráfico 2).
Gra ph 1. Puerto Rico: Influenza-positive cases by EW 5, 2018-19 Casos positivos para influenza SE 5, 2018-19
Gra ph 2. Puerto Rico: ILI epidemic rates by EW 20, 2018 / Tasas de ETI por SE, SE 20, 2018.
• During EW 4, the number of cases with respiratory symptoms among children under 5 years of age was below the seasonal threshold (Graph 1). During EW 49, SARI activity decreased and was lower than the levels from the 2016 season for the same period (Graph 2), with SARI admissions predominating among the 1 to 4 years of age population. No influenza activity was reported since EW 35 (Graph 3) / Durante la SE 4, el número de casos con síntomas respiratorios en niños menores de 5 años de edad se ubicó bajo el umbral estacional (Gráfico 1). Durante la SE 49, la actividad de IRAG disminuyó y fue menor que los niveles de la temporada 2016 para el mismo período (Gráfico 2), con predominio de las admisiones por IRAG entre el grupo de 1 y 4 años de edad. No se reportó actividad de influenza desde la SE 35 (Gráfico 3).
Gra ph 1. Saint Lucia: ILI cases distribution by EW among the < 5 years of
age, EW 4, 2014-19 Distribución de ETI por SE entre los <5 años de edad, SE 4, 2014-19
Gra ph 2. Saint Lucia: Percent of SARI cases per total hospitalizations by year, 2016-2018, EW 49. /
Porcentaje de casos de IRAG por todos hospitalizaiones por año, 2016-2018, SE 49.
Puerto Rico
Saint Lucia

PAHO/OPS | INFLUENZA REGIONAL UPDATE EW 5 /ACTUALIZACIÓN REGIONAL DE INFLUENZA SE 5 21
Car
ibb
ean
- El
Car
ibe
Gra ph 3. St. Lucia: Influenza virus distribution by EW, EW 45, 2014-18
Distribución de virus influenza por SE, EW 45, 2014-18
*To view more epi data, view here. / Para ver mas datos epi, vea aquí.
• In EW 4, a decrease in ILI cases was reported with low activity in the last month; while SARI-related hospitalizations decreased in EW 4, 2019 and were similar to the 2016-2018 seasons for the same period (Graph 4,5). During EW 4, 2019 increased influenza activity was reported, with influenza A(H1N1)pdm09 circulating (Graph 1); RSV activity decreased (Graph 2). / Desde la SE 34 se reportó un descenso de casos de ETI con baja actividad en el último mes; en tanto las hospitalizaciones relacionadas con IRAG disminuyeron en la SE 4 de 2019 y fueron similares a las temporadas 2016-2018 para el mismo período (Gráfico 4,5). Durante la SE 4 de 2019, se reportó aumentada actividad de. influenza, con circulación de influenza A(H1N1)pdm09 (Gráfico 1); la actividad de VSR disminuyó (Gráfico 2). Gra ph 1. Suriname: Influenza virus distribution by EW 4, 2015-19
Distribución de virus influenza por SE 4, 2015-19
Gra ph 2. Suriname: Influenza and RSV distribution, EW 4, 2015-19 Distribución de virus influenza y VSR, SE 4, 2015-19
Gra ph 3. Suriname: Percent positivity for influenza, EW 4 2019 (in comparision to 2010-2018)
Porcentaje de positividad de influenza, SE 4, 2019 (en comparación a 2010-2018)
Gra ph 4. Suriname: Number of ILI cases, by age, by EW, 2019. EW 4 4Número de casos ETI, en grupo de edad, por SE, 2019, SE 4
Gra ph 5. Suriname: % SARI hospitalizations per total hospitalizations, by EW, 2013-2019. EW 4. Casos % de hospitalizaciones IRAG entre todas las hospitalizaciones, por SE, 2013-2019.SE 4.
Suriname

PAHO/OPS | INFLUENZA REGIONAL UPDATE EW 5 /ACTUALIZACIÓN REGIONAL DE INFLUENZA SE 5 22
Car
ibb
ean
- El
Car
ibe
*To view more epi data, view here. / Para ver mas datos epi, vea aquí.
• During EW 52, decreased influenza detections were reported, with influenza A(H1N1)pdm09 predominating in previous weeks (Graph 1). Rhinovirus and parainfluenza virus circulated in recent weeks, and there were no RSV detections reported (Graph 2). As of EW 45, SARI activity decreased from the previous week (Graph 3). / Durante la SE 52, se reportaron menores detecciones de influenza, con predominio de influenza A(H1N1)pdm09 en semanas previas (Gráfico 1). Rhinovirus y parainfluenza circularon en semanas recientes y no se reportaron detecciones de VSR (Gráfico 2). Hasta la SE 45, la actividad de IRAG disminuyó en relación a la semana previa (Gráfico 3).
Gra ph 1. Trinidad & Tobago: Influenza virus distribution by EW, EW 52,
2015-18 Distribución de virus influenza por SE, SE 52, 2015-18
Gra ph 2. Trinidad & Tobago. Other respiratory virus distribution, EW 52,
2015-18 Distribución de otros virus respiratorios, SE 52, 2015-18.
Gra ph 3. Trinidad & Tobago: Number of SARI cases by EW, EW 45, 2018 Numero de casos IRAG por SE, SE 45, 2018
Trinidad & Tobago

PAHO/OPS | INFLUENZA REGIONAL UPDATE EW 5 /ACTUALIZACIÓN REGIONAL DE INFLUENZA SE 5 23
• During EW 5, influenza activity slightly increased from the previous weeks with influenza A H1N1pdm09 predominating (Graph 1). Influenza activity during EW 4 decreased while RSV activity increased compared with 2018 season (Graph 1, 2). In EW 5, the proportion of SARI deaths and the proportion of cases with ICU admissions (18.5%) increased, while and SARI hospitalizations (3%) were lower as compared to the previous weeks (Graph 3). The percentage of positivity for influenza remained above the seasonal threshold but below the alert threshold compared with previous seasons level (Graph 4)/ Durante la SE 5, la actividad de influenza aumentó ligeramente con relación a las semanas previas con predominio de influenza A H1N1pdm09 (Gráfico 1). La actividad de influenza durante la SE 4 disminuyó mientras que la actividad de VSR aumentó con respecto a la temporada de 2018 (Gráficos 1, 2). En la SE 5, la proporción de fallecidos por IRAG y la proporción de casos con admisión a UCI (18,5%) aumentó, en tanto y de hospitalizados por IRAG (3%) fueron menores en comparación a las semanas previas (Gráfico 3). El porcentaje de positivos para influenza permaneció por encima del umbral de la temporada pero por debajo del umbral de alerta comparado con los niveles de temporadas anteriores (Gráfico 4).
Gra ph 1. Costa Rica: Influenza virus distribution, Laboratory confirmed
samples, by EW 5, 2015-19 Distribución de virus influenza, confirmados por laboratorio, hasta EW 5,
2015-19
5
Gra ph 2. Costa Rica: Influenza and RSV distribution, EW 5, 2015-19 Distribución de virus influenza y VSR, EW 5, 2015-19
Gra ph 3. Costa Rica: Proportion of SARI cases, ICU admissions and SARI deaths in reporting sentinel sites by year. Costa Rica, EW 4, 2015-2019 Proporción de casos de IRAG, admisiones a UCI y fallecidos por IRAG en
sitios centinela reportado por año. Costa Rica, SE 4, 2015-2019
Gra ph 4. Costa Rica: Percent positivity for influenza, EW 5, 2019 (in comparision to 2010-2018)
Porcentaje de positividad de influenza, SE 5, 2019 (en comparación a
2010-2018)
• During EW 5, influenza activity decreased below the average epidemic curve with influenza A(H1N1)pdm09 circulating
(Graphs 1). Decreased RSV detections were reported as compared to the previous season (Graph 2). During EW 4, the count of SARI cases decreased and was similar to levels observed in the previous seasons (Graph 4, 5); and pneumonia counts decreased from the previous weeks and were lower than during the 2016 season and similar to the levels of the 2017-8 season (Graph 5). The percentage of influenza positivity remained below the average epidemic curve compared to previous seasons (Graph 3)/ Durante la SE 5, la actividad de influenza disminuyó bajo la curva epidémica promedio con circulación de influenza A(H1N1)pdm09 (Gráfico 1). Se reportaron menores detecciones de VSR en relación a la temporada anterior (Gráfico 2). Durante la SE 4, el recuento de casos IRAG disminuyó y fue menor a los niveles registrados en las temporadas previas (Gráfico 4); y los recuentos de neumonía disminuyeron en relación a las semanas previas y fueron menores que durante la temporada 2016 y similares a los niveles de la temporada 2017-8 (Gráfico 5). El porcentaje de
0,0
5,0
10,0
15,0
20,0
25,0
30,0
35,0
40,0
45,0
1 5 9 13 17 21 25 29 33 37 41 45 49 1 5 9 13 17 21 25 29 33 37 41 45 49 1 5 9 13 17 21 25 29 33 37 41 45 49 1 5 9 13 17 21 25 29 33 37 41 45 49
2016 2017 2018 2019
Porc
enta
nje
Semana Epidemiologica
IRAG (%): Hospitalizaciones, admisiones a UCI y defunciones. Hospitales Centinela, CCSS. Costa Rica,
SE N°04 Período 2016 - 2018.
Año 2019
HOSPITALIZACIONES UCI FALLECIDOSFuente: Hospitales Centinela , CCSS
Central America / América Central
El Salvador
Cen
tral
Am
eric
a-
Am
éric
a C
entr
al
Costa Rica

PAHO/OPS | INFLUENZA REGIONAL UPDATE EW 5 /ACTUALIZACIÓN REGIONAL DE INFLUENZA SE 5 24
positivos para influenza permaneció por debajo de la curva epidémica promedio comparado con las temporadas anteriores (Gráfico 3)
*To view more epi data, view here. / Para ver mas datos epi, vea aquí.
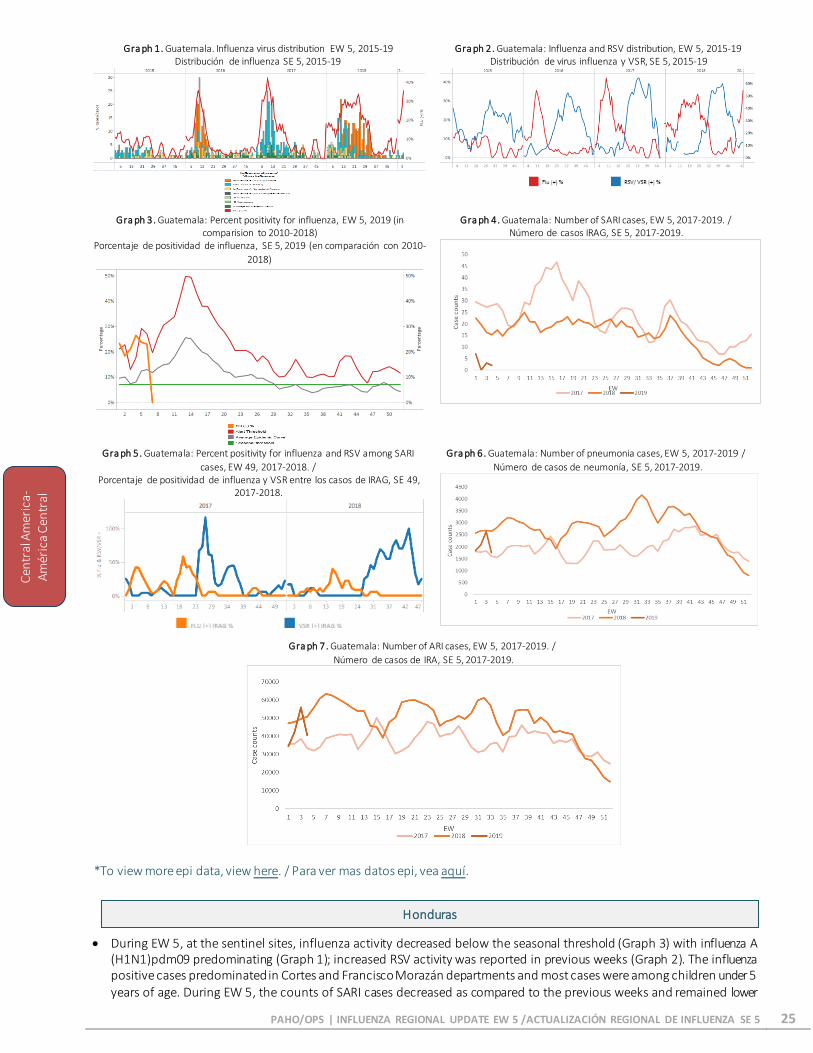
• During EW 5, influenza detections slightly increased with influenza A (H3N2) y A (H1N1)pdm09 co-circulating in recent weeks (Graph 1). Influenza positivity dropped down below the seasonal threshold, as compared to the 2010-2018 period (Graph 3); while the RSV activity slightly increased in the last weeks and was similar to the levels reported in the 2018 season (Graph 2). During EW 5, the percentage of SARI cases among all hospitalizations decreased and was lower than during the 2017-8 seasons (Graph 4). The highest proportion of SARI cases was among <5 years old population. During EW 5, pneumonia and ARI activity decreased and were slightly lower to the counts reported in the 2018 season (Graph 6, 7). / Durante la SE 5, las detecciones de influenza aumentaron ligeramente con cocirculación de influenza A(H3N2) y A (H1N1)pdm09 en las semanas previas (Gráfico 1). La positividad de influenza cayó por debajo del umbral de estacionalidad, en comparación con el período 2010-2018 (Gráfico 3); mientras que la actividad de VSR aumentó ligeramente en las últimas semanas y fue similar a los niveles de la temporada 2018 (Gráfico 2). Desde la SE 5 el porcentaje de casos de IRAG del total de hospitalizaciones disminuyó y fue menor que en las temporadas 2017-2018 (Gráfico 4). La mayor proporción de casos de IRAG fue entre la población de <5 años de edad (Gráfico 4). Durante la SE 5, el reporte de neumonías e IRA disminuyeron y fueron ligeramente menores que los recuentos reportados en la temporada 2018 (Gráficos 6, 7).
Gra ph 1. El Salvador: Influenza virus distribution, EW 5 2015-19 Distribución de virus influenza, SE 5, 2015-19
Gra ph 2. El Salvador: Influenza and RSV distribution, EW 5, 2015-19 Distribución de virus influenza y VSR, SE 5, 2015-19
Gra ph 3. El Salvador: Percent positivity for influenza, EW 5, 2019 (in comparision to 2010-2018)
Porcentaje de positividad de influenza, SE 5, 2019 (en comparación a 2010-2018)
Gra ph 4. El Salvador: SARI case counts out of total hospitalizations, by EW, 2019. EW 4 (in comparison with 2016-2018)
Número de casos por IRAG de todas las hospitalizaciones, por SE,- 2019, EW 4 (en comparación a 2016-2018)
Gra ph 5. El Salvador: Number of pneumonia cases by EW, 2016- 2019. EW 4. Recuento de casos de neumonía, por SE, 2016- 2019. SE 4.
Guatemala
Cen
tral
Am
eric
a-
Am
éric
a C
entr
al
Cen
tral
Am
eric
a-
Am
éric
a C
entr
al
PAHO/OPS | INFLUENZA REGIONAL UPDATE EW 5 /ACTUALIZACIÓN REGIONAL DE INFLUENZA SE 5 25
Gra ph 1. Guatemala. Influenza virus distribution EW 5, 2015-19 Distribución de influenza SE 5, 2015-19
Gra ph 2. Guatemala: Influenza and RSV distribution, EW 5, 2015-19 Distribución de virus influenza y VSR, SE 5, 2015-19
Gra ph 3. Guatemala: Percent positivity for influenza, EW 5, 2019 (in comparision to 2010-2018)
Porcentaje de positividad de influenza, SE 5, 2019 (en comparación con 2010-
2018)
Gra ph 4. Guatemala: Number of SARI cases, EW 5, 2017-2019. / Número de casos IRAG, SE 5, 2017-2019.
Gra ph 5. Guatemala: Percent positivity for influenza and RSV among SARI
cases, EW 49, 2017-2018. / Porcentaje de positividad de influenza y VSR entre los casos de IRAG, SE 49,
2017-2018.
Gra ph 6. Guatemala: Number of pneumonia cases, EW 5, 2017-2019 /
Número de casos de neumonía, SE 5, 2017-2019.
Gra ph 7. Guatemala: Number of ARI cases, EW 5, 2017-2019. /
Número de casos de IRA, SE 5, 2017-2019.
*To view more epi data, view here. / Para ver mas datos epi, vea aquí.
• During EW 5, at the sentinel sites, influenza activity decreased below the seasonal threshold (Graph 3) with influenza A (H1N1)pdm09 predominating (Graph 1); increased RSV activity was reported in previous weeks (Graph 2). The influenza positive cases predominated in Cortes and Francisco Morazán departments and most cases were among children under 5 years of age. During EW 5, the counts of SARI cases decreased as compared to the previous weeks and remained lower
Honduras
Cen
tral
Am
eric
a-
Am
éric
a C
entr
al

PAHO/OPS | INFLUENZA REGIONAL UPDATE EW 5 /ACTUALIZACIÓN REGIONAL DE INFLUENZA SE 5 26
than the levels of the 2012-2018 seasons (Graph 4). / Durante la SE 5, en los sitios centinela, la actividad de influenza disminuyó ligeramente bajo el umbral estacional (Gráfico 3) con predominio de influenza A(H1N1)pdm09 (Gráfico 1); se reportó menor actividad de VSR en las últimas semanas (Gráfico 2). Los casos positivos de influenza predominaron en los departamentos de Cortés y Francisco Morazán, y la mayoría de los casos fueron en niños menores de 5 años de edad. Durante la SE 5, los recuentos de casos de IRAG disminuyeron en comparación a las semanas previas y permanecieron menores a los niveles de las temporadas 2012-2018 (Gráfico 4).
Gra ph 1. Honduras. Influenza virus distribution from sentinel surveillance,
EW 5, 2015-19 Distribución de influenza de vigilancia centinela, SE 5, 2015-19
Gra ph 2. Honduras: Influenza and RSV distribution form sentinel
surveillance, EW 5, 2015-19 Distribución de virus influenza y VSR, SE 5, 2015-19
Gra ph 3. Honduras : Percent positivity for influenza,from sentinel surveillance, EW 5 2019 (in comparision to 2010-2018)
Porcentaje de positividad de influenza, de la vigilancia centinela, SE 5, 2019
(en comparación con 2010-2018)
Gra ph 4. Honduras: Number of SARI cases out of total hospitalizations, EW 5, 2019. /
Número de casos IRAG de todas hospitalizaciones, SE 5, 2019.
• During the 2018 season, high influenza activity was reported from EW 29, 2018 to EW 45, with a downward slope in EW 4, 2019. Influenza A(H1N1)pdm09 and later B activity remained elevated above the seasonal levels and the average epidemic curve (Graph 1, 3), and RSV activity slightly decreased in the last two months (Graph 2). Pneumonia case counts decreased in EW 5 of 2019 compared to previous seasons level (Graph 4). The SARI case counts from sentinel surveillance slightly decreased in EW 5 but remaine above previous seasons level and predominated among the <5 years of age group (Graph 5). / Durante la temporada 2018, se reportó actividad elevada de influenza desde la SE 29 de 2018 hasta la SE 45, con una pendiente decreciente en la SE 4, 2019. La actividad de influenza A(H1N1)pdm09 y posterior B permaneció elevada sobre los niveles estacionales y la curva epidémica promedio (Grafico 1), y la actividad de VSR disminuyó ligeramente en los últimos dos meses (Gráfico 2). El recuento de casos de neumonía disminuyó en la SE 5 de 2019 en comparación con las temporadas previas (Gráfico 4). Los recuentos de IRAG disminuyeron ligeramente en la SE 5 pero permanecen por encima de los niveles de temporadas anteriores y predominaron en el grupo de menores de 5 años (Gráfico 5).
Gra ph 1. Nicaragua. Influenza virus distribution EW 4, 2014-19 Distribución de influenza SE4, 2014-19
Gra ph 2. Nicaragua: Influenza and RSV distribution, EW 4, 2014-19 Distribución de virus influenza y VSR, SE 4, 2014-19
Nicaragua
Cen
tral
Am
eric
a-
Am
éric
a C
entr
al0

PAHO/OPS | INFLUENZA REGIONAL UPDATE EW 5 /ACTUALIZACIÓN REGIONAL DE INFLUENZA SE 5 27
Gra ph 3. Nicaragua : Percent positivity for influenza,from sentinel surveillance, EW 4, 2019 (in comparision to 2010-2018)
Porcentaje de positividad de influenza, de la vigilancia centinela, SE 4, 2019 (en comparación con 2010-2018)
Gra ph 4. Nicaragua : Number of pneumonia cases, EW 5, 2016-2019 / Número de casos de neumonía, SE 5, 2016-2019
Gra ph 5. Nicaragua : Number of SARI cases from sentinel surveillance, EW 5, 2016-2019 / Número de casos de IRAG de vigilancia centinela, EW 5, 2016-2019
• During the 2018 season, at the national level, influenza activity remained at low levels. In EW 5, 2019, decreased influenza percent of positivity was reported with influenza A(H3N2) predominance and below the seasonal threshold (Graph 1). RSV detections continue decreasing as compared to previous weeks (Graph 2). / Durante la temporada 2018, a nivel nacional, la actividad de influenza permaneció baja. En la SE 5 de 2019, se reportó disminución del porcentaje de positividad de influenza con predominio de influenza A(H3N2) y por debajo del umbral estacional (Gráfico 1). Las detecciones de VSR continúan disminuyendo con respecto a las semanas anteriores (Gráfico 2).
*To view more epi data, view here. / Para ver mas datos epi, vea aquí.
Gra ph 1. Panama. Influenza virus distribution EW 5, 2014-2019 Distribución de influenza EW 5, 2014-2019
Gra ph 2. Panama: Influenza and RSV distribution, EW 5, 2014-2019 Distribución de virus influenza y VSR, EW 5, 2014-2019
Gra ph 3. Panama : Percent positivity for influenza,from sentinel surveillance, EW 5, 2019 (in comparision to 2010-2018) Porcentaje de positividad de influenza, de la vigilancia centinela, SE 5, 2019 (en comparación con 2010-2018)
Cen
tral
Am
eric
a-
Am
éric
a C
entr
al Panama

PAHO/OPS | INFLUENZA REGIONAL UPDATE EW 5 /ACTUALIZACIÓN REGIONAL DE INFLUENZA SE 5 28
• During EW 5 and in recent weeks, at the national level, the percentage of SARI cases remained slightly higher and also was higher than the levels observed in the 2018 season for the same period (Graph 3); with RSV percent positivity among SARI cases slightly lower than the influenza positivity (Graph 4). Influenza activity slightly increase from the previous week and reached the seasonal threshold, with influenza A(H3N2) circulating (Graph 1, 5). In 2018, RSV activity peaked during EW 29 with a downward slope and low activity since EW 33 (Graph 2). In EW 5 2019, RSV activity increased steadily since EW 1, 2019. In La Paz and Santa Cruz, from EW1 through EW 5, the number of SARI cases increased above the seasonal levels from previous seasons, with influenza A(H3N2) circulating (Graph 1,3). / Durante la SE 5 y en semanas recientes, a nivel nacional, el porcentaje de IRAG permaneció ligeramente mayor que los niveles observados en la temporada 2018 para el mismo período (Grafico 3); con un porcentaje de positividad de VSR entre los casos de IRAG ligeramente menor que la positividad de influenza (Gráfico 4). La actividad de influenza ligeramente aumentó con respecto a la semana previa y alcanzó el umbral estacional, con circulación de influenza A(H3N2) (Gráfico 1). En 2018, la actividad del VSR llegó a su pico máximo en la SE 29 con una pendiente descendiente y baja actividad desde la SE 33 (Gráfico 2). En la SE 5 de 2019, la actividad de VSR aumento en forma sostenida desde la SE 1, 2019. En La Paz y en Santa Cruz, de la SE 1 a la SE 5, el recuento de casos de IRAG se incrementó por encima del nivel estacional con relación a las semanas previas, con la circulación de influenza A (H3N2) (Gráfico 3)
Gra ph 1. Bolivia. Influenza virus distribution EW 5, 2015-19 Distribución de influenza SE 5, 2015-19
Gra ph 2. Bolivia: Influenza and RSV distribution, EW 5, 2015-19 Distribución de virus influenza y VSR, SE 5, 2015-19
Gra ph 3. Bolivia: Percentage of SARI cases out of total hospitalizations, EW 1, 2018 – EW 5 2019
Porcentaje de casos IRAG de todas hospitalizaciones, SE 1, 2018 – SE 5, 2019
Gra ph 4. Bolivia: Influenza and RSV positive samples among SARI cases, EW 5, 2018-2019. /
Muestras positivas de influenza y VSR entre los casos de IRAG, SE 5, 2018-2019.
Gra ph 5. Bolivia: Percent positivity for influenza, EW 5, 2018-19 (in comparision to 2010-2018)
Porcentaje de positividad de influenza, EW 5, 2018-19 (in comparision to 2010-2018)
South America / América del Sur – Andean countries / Países andinos:
Bolivia
Sout
h A
mer
ica/
Am
éric
a de
l
Sur-
And
ean
Coun
trie
s/
País
es A
ndin
os

PAHO/OPS | INFLUENZA REGIONAL UPDATE EW 5 /ACTUALIZACIÓN REGIONAL DE INFLUENZA SE 5 29
*To view more epi data, view here. / Para ver más datos epi, vea aquí.
• During EW 5, at national level, SARI case counts remain low as compared to the previous seasons for the same period (Graph 4). In EW 4, influenza activity slightly increased as compared to the previous weeks with influenza A(H3N2) and A(H1N1)pdm09 co-circulating (Graphs 1, 3); while RSV percent positivity slightly decreased (Graph 2). During EW 5, pneumonia activity was below the seasonal levels for the period and ARI activity decreased compared with 2018 season (Graph 5, 6). / En la SE 5, a nivel nacional, el número de casos de IRAG permaneció bajo en comparación con las temporadas previas para el mismo período (Grafico 4). Durante la SE 4, la actividad de influenza aumentó ligeramente en comparación a las semanas anteriores con circulación de influenza A(H3N2) y A(H1N1)pdm09 (Gráficos 1, 3); en tanto la positividad de VSR disminuyó ligeramente (Gráfico 2). Durante la SE 5, la actividad de neumonía estuvo por debajo de los niveles estacionales para el período y la actividad de IRA disminuyó en comparación con los niveles alcanzados en la temporada de 2018 (Gráficos 5, 6).
Gra ph 1. Colombia. Influenza virus distribution EW 4, 2015-19 Distribución de virus influenza SE 4 2015-19
Gra ph 2. Colombia: Influenza and RSV distribution, EW 4, 2015-19 Distribución de virus influenza y VSR, SE 4, 2015-19
Gra ph 3. Colombia: Percent positivity for influenza, EW 4, 2018-19 (in
comparision to 2010-2018) Porcentaje de positividad de influenza, EW 4, 2018-19 (in comparision to
2010-2018)
Gra ph 4. Colombia: Number of SARI cases, EW 5,2019 (in comparison to
2013-2018) Número de casos de IRAG, SE 5,2019 (en comparación a 2013-2018)
Gra ph 5. Colombia: Number of pneumonia-related hospitalizations, by EW 5, 2019 (in comparison with 2013-18)
Número de hospitalizaciones asociadas a neumonía, por SE 5, 2019 (en
comparación con 2013-18)
Gra ph 6. Colombia: Number of ARI cases, EW 5 2019 (from all consultations), (in comparison with 2013-18)
Número de los casos IRA, SE 5 2019 (de todas consultas), (en
comparación con 2013-18)
*To view more epi data, view here. / Para ver mas datos epi, vea aquí.
Sout
h A
mer
ica/
Am
éric
a de
l
Sur-
And
ean
Coun
trie
s/
País
es A
ndin
os
Colombia

PAHO/OPS | INFLUENZA REGIONAL UPDATE EW 5 /ACTUALIZACIÓN REGIONAL DE INFLUENZA SE 5 30
• During EW 4, at national level, the proportion of SARI cases, the ICU admissions and deaths proportions among all hospitalizations decreased from previous weeks and remained slightly higher than the levels observed during the 2016 -2018 seasons for the same period (Graph 4). During EW 4, influenza activity decreased above the seasonal threshold, as compared to the previous weeks with influenza A(H3N2) predominating (Graph 2). Influenza percent positivity was higher than the levels reported during the prior season for the same period, with increased RSV activity in recent weeks (Graph 1, 2). / Durante la SE 4, a nivel nacional, la proporción de casos de IRAG, admisiones a UCI y fallecidos sobre el total de hospitalizaciones disminuyeron en relación con semanas previas y se mantuvieron ligeramente superior a los niveles observados durante 2016-2017 para el mismo período (Gráfico 4). En la SE 4, la actividad de influenza disminuyó sobre el umbral estacional, en comparación con las semanas previas sobre el umbral estacional, con predominio de influenza A(H3N2) (Gráfico 2). El porcentaje de positividad de influenza fue superior a los niveles registrados en la temporada previa para el mismo período, con mayor actividad de VSR en semanas recientes (Gráficos 1, 2).
Gra ph 1. Ecuador: Influenza virus distribution from SARI sentinel cases by EW 4, 2015-19
Distribución de virus influenza de casos de IRAG centinela SE 4, 2015-19
Gra ph 2. Ecuador: Influenza and RSV distribution from SARI sentinel cases, EW 4, 2015-19
Distribución de virus influenza y VSR de casos de IRAG centinela, SE 4,
2015-19
Gra ph 3. Ecuador: Percent positivity for influenza, EW 4, 2018-19 (in comparision to 2010-2018)
Porcentaje de positividad de influenza, EW 4, 2018-19 (in comparision to 2010-2018)
Gra ph 4. Ecuador: Proportion of SARI cases, ICU admissions and deaths by
EW, as of EW 4, 2019 (compared to 2012-2017) Proporción de casos de IRAG, admisiones a UCI y muertes por SE, hasta la
SE 4, 2019 (en comparacion a 2012-2017)
*To view more epi data, view here. / Para ver mas datos epi, vea aquí.
• During EW 5, at national level, SARI case counts among all hospitalizations decreased from previous weeks and remained lower than the 2015-2018 seasons for the same period (Graph 4). In EW 5, influenza activity increased above the alert threshold, with influenza A(H3N2) circulating and overall important detections (Graph 1,3). Few RSV detections were reported in EW 5, 2019 and the activity was lower than levels observed in 2018 for the same period (Graph 2). During SE 5, at the national level, ARI case counts among those aged under 5 years decreased and were slightly below the levels observed in 2016-2018 for the same period (Graph 5). Likewise, the pneumonia case counts in infants under 5 years of age slightly decreased and was lower than the counts reported in 2017-2018 for the same period (Graph 6)*./ En la SE 5, a nivel nacional, el número de casos de IRAG entre el total de hospitalizaciones disminuyó con respecto a los niveles de semanas previas y se mantuvo menor a lo observado en las temporadas 2015-2018 para el mismo período (Gráfico 4). Durante la SE 5, la actividad de influenza aumentó por encima del umbral de alerta, con circulación de influenza A(H3N2) y un número importante de muestras en general (Gráficos 1,3). Se reportaron escasas detecciones de VSR en la SE 5 de 2019, y la actividad fue menor a los niveles observados en 2018 para el mismo período (Gráfico 2). Durante la SE 5, a nivel nacional, el recuento de casos de IRA en la población de menores de 5 años disminuyó ligeramente y fue menor que los niveles observados en 2017-2018 para el mismo período (Gráfico 5). Así mismo, el recuento de casos de neumonía
Ecuador
Peru
So
uth
Am
eri
ca
/ A
mé
ric
a
de
l S
ur-
An
de
an
Co
un
trie
s/ P
aís
es
An
din
os

PAHO/OPS | INFLUENZA REGIONAL UPDATE EW 5 /ACTUALIZACIÓN REGIONAL DE INFLUENZA SE 5 31
en niños menores de 5 años disminuyó ligeramente y fue menor que los recuentos reportados en 2017-2018 para el mismo período (Gráfico 6)*.
*Online report/ informe de línea
Gra ph 1. Peru: Influenza virus distribution by EW 5, 2015-19 Distribución de virus influenza por SE 5, 2015-19
Gra ph 2. Peru: Influenza and RSV distribution, EW 5, 2015-19 Distribución de virus influenza y VSR, SE 5, 2015-19
Gra ph 3. Perú: Percent positivity for influenza, EW 5, 2019 (in comparision to 2010-2018)
Porcentaje de positividad de influenza, EW 5, 2019 (in comparision to 2010-2018)
Gra ph 4. Peru: Number of SARI cases, by EW 5, 2015-2019 Número de casos IRAG, SE 5, 2015-2019
Gra ph 5. Peru. ARI cases in children under 5 years, by EW 5, 2015-2019 Casos de IRA en niños menores de 5 años, por SE 5, 2015-2019.
Gra ph 6. Peru: Pneumonia cases in children under 5 years, by EW 5, 2015-2019
Casos de neumonía en niños menores de 5 años, por SE 5, 2015-2019
*To view more epi data, view here. / Para ver mas datos epi, vea aquí.
• During EW 4, influenza activity decreased with influenza A(H3N2) predominating in previous weeks (Graph 1, 2). From EW 42 to EW 52, RSV activity peaked and was higher than the levels reported in 2015 -2017 for the same period, with no detections during 2019 (Graph 2). / En la SE 4, la actividad de influenza disminuyó con predominio de influenza A(H3N2) (Gráficos 1, 2). Desde la SE 42 hasta la SE 52, la actividad de VSR llego a su pico y fue superior a los niveles reportados en 2015-2017 para el mismo periodo, sin detecciones durante 2019 (Gráfico 2).
Venezuela
Sout
h A
mer
ica/
Am
éric
a de
l Su
r- A
ndea
n Co
untr
ies/
País
es A
ndin
os
Sout
h A
mer
ica/
Am
éric
a de
l
Sur-
And
ean
Coun
trie
s/
País
es A
ndin
os

PAHO/OPS | INFLUENZA REGIONAL UPDATE EW 5 /ACTUALIZACIÓN REGIONAL DE INFLUENZA SE 5 32
Gra ph 1. Venezuela: Influenza virus distribution by EW 4, 2015-19 Distribución de virus influenza por SE 4, 2015-19
Gra ph 2. Venezuela: Influenza and RSV distribution, EW 4, 2015-19 Distribución de virus influenza y VSR, SE 4, 2015-19
Sout
h A
mer
ica/
Am
éric
a de
l Su
r- A
ndea
n Co
untr
ies/
País
es A
ndin
os

PAHO/OPS | INFLUENZA REGIONAL UPDATE EW 5 /ACTUALIZACIÓN REGIONAL DE INFLUENZA SE 5 33
• During EW 52, at national level, the counts of SARI and pneumonia cases decreased and were lower than the 2012-2017 seasons for the same period (Graph 2, 6). During EW 52, ILI activity was also low for the period (Graph 1). During EW 3, influenza activity decreased as compared with the previous weeks with overall few samples tested (Graphs 3, 5). RSV positivity decreased and was similar to the levels reported during the previous season for the same period (Graph 4). During 2018, 81 influenza-associated deaths were reported, lower than the levels observed during the 2017 season for the same period (114 influenza-associated deaths), mostly among the 60 years of age population and older and with risk factors (70%). / Durante la SE 52, a nivel nacional los recuentos de IRAG y neumonía disminuyeron y fueron menores que durante las temporadas 2012-2017 para el mismo período (Gráficos 2, 6). Durante la SE52, la actividad de ETI fue baja para el período (Gráfico 1). Durante la SE 3, la actividad de influenza disminuyó en comparación con semanas previas, con recuento bajo de muestras estudiadas (Gráficos 3, 5). El porcentaje de positividad para VSR disminuyó y fue similar a lo registrado en la temporada previa para el mismo período (Gráficos 4). Durante 2018, se reportaron 81 fallecidos asociados a influenza, menor a los niveles observados durante la temporada 2017 para el mismo período (114 muertes asociadas a influenza), en su mayoría entre la población de 60 años de edad y más, y con factores de riesgo (70%).
Gra ph 1. Argentina. Number of ILI cases from national surveillance by
EW, EW 1-52, 2018 (compared to 2012-2017) /
Número de casos de ETI de vigilancia nacional, SE 1- 52, 2018 (en comparación a 2012-2017)
Gra ph 2. Argentina. Number of SARI cases from national surveillance by EW, EW 1-52, 2018 (compared to 2012-2017) /
Número de casos de IRAG de vigilancia nacional, SE 1- 52, 2018 (en comparación a 2012-2017)
Gra ph 3. Argentina. Influenza virus distribution by EW 3, 2014-19 Distribución de virus influenza por SE 3, 2014-19
Gra ph 4. Argentina: Influenza and RSV distribution, EW 3, 2014-19 Distribución de virus influenza y VSR, SE 3, 2014-19
Gra ph 5. Argentina: Baseline for the percent positivity for influenza, EW 3,
2019 (in comparision to 2010-2018) Linea basal para el porcentaje de positividad de influenza, SE 3, 2019 (en
comparación a 2010-2018)
Gra ph 6. Argentina. Number of pneumonia cases from national surveillance by EW, EW 1-52, 2018 (compared to 2012-2017) /
Número de casos de neumonía de vigilancia nacional, SE 1- 52, 2018
(en comparación a 2012-2017)
Argentina
South America / América del Sur – South Cone and Brazil / Cono sur y Brasil
Sout
h A
mer
ica/
Am
éric
a de
l Su
r- S
outh
Con
e an
d Br
azil/
Cono
Sur
y B
rasi
l

PAHO/OPS | INFLUENZA REGIONAL UPDATE EW 5 /ACTUALIZACIÓN REGIONAL DE INFLUENZA SE 5 34
• In Brazil, during EW 52, cumulative SARI hospitalizations and deaths increased and were lower than in 2016 but higher than the other seasons for the same period (Graphs 1,2). During EW 52, the SARI case counts out of all hospitalizations were lower than in previous weeks and the 2015-2017 seasons (Graph 10). The cumulative number of influenza-associated SARI cases and SARI deaths were higher than the counts reported in 2017 and less than in 2016 (Graph 3, 4). During EW 5, a decrease in the detection of influenza positive cases was reported by the three NICs with influenza B predominating; while RSV detections increased in recent weeks (Graph 5-9). During EW 52, 8 states reported higher cumulative influenza-associated SARI/ILI case counts than the historic average 2014-2017 (≥2 standard deviation above): Bahia, Ceara, Maranhao, Pernambuco, Piaui, Rio Grande do Norte, Sergipe, and Tocantins (Graph 11). In EW 52, 8 states reported higher cumulative influenza-associated SARI/ILI deaths counts than the historic average 2014-2017 (>1 standard deviation above): Bahia, Ceará, Maranhao, Pernambuco, Piaui, Rio Grande do Norte, Sergipe and Tocantins (Graph 12). / En Brasil, en la SE 52, las hospitalizaciones y los casos fallecidos por IRAG acumulados aumentaron y fueron menores que en 2016 pero superiores a las restantes temporadas para el mismo período (Gráficos 1, 2). Durante la SE 52, el recuento de casos de IRAG sobre el total de hospitalizaciones fue menor que las semanas previas y las temporadas 2015-2017 para el mismo período (Gráfico 10). El número acumulado de casos de IRAG por influenza y de casos fallecidos asociados a influenza fueron superiores a los recuentos de 2017 y menores a los recuentos reportados en 2016 (Gráficos 3, 4). En la SE 5, se ha detectado un descenso de los casos positivos de influenza reportados por los tres NICs, con predominio de influenza B; en tanto las detecciones de VSR aumentaron en las últimas semanas (Gráficos 5-9). Durante la SE 52, 8 estados reportaron elevados recuentos acumulados de IRAG/ETI asociados a influenza en comparación al promedio histórico 2014-2017 (≥2 desviación estándar arriba): Bahia, Ceara, Maranhao, Pernambuco, Piaui, Rio Grande do Norte, Sergipe, y Tocantins (Gráfico 11). En la SE 52, 8 estados reportaron elevados recuentos acumulados de fallecidos por IRAG/ETI asociados a influenza en comparación al promedio histórico 2014-2017 (>1 desviación estándar arriba): Bahia, Ceará, Maranhao, Pernambuco, Piaui, Rio Grande do Norte, Sergipe y Tocantins (Gráfico 12).
Gra ph 1. Brazil. Distribution of cumulative SARI-related cases, by EW 52, 2014-2018
Distribución de casos acumulados de IRAG, SE 52, 2014-2018
Gra ph 2. Brazil. Distribution of cumulative SARI-related deaths, by EW 49, 2014-2018
Distribución de fallecidos acumulados de IRAG, SE 49, 2014-2018
Gra ph 3. Brazil. Distribution of cumulative influenza-associated SARI-related
cases, by EW 52, 2014-2018 Distribución de casos acumulados de IRAG asociados a influenza, SE 52, 2014-
2018
Gra ph 4. Brazil. Distribution of cumulative influenza-positive SARI-related deaths, by EW 52, 2014-2018
Distribución de fallecidos acumulados de IRAG positivos para influenza, SE 52, 2014-2018
Brazil
Sout
h A
mer
ica/
Am
éric
a de
l
Sur-
Sou
th C
one
and
Braz
il/
Cono
Sur
y B
rasi
l

PAHO/OPS | INFLUENZA REGIONAL UPDATE EW 5 /ACTUALIZACIÓN REGIONAL DE INFLUENZA SE 5 35
Gra ph 5. Brazil- All NICs. Influenza virus distribution by EW 5, 2015-2019 Distribución de virus influenza por SE 5, 2015-2019
Gra ph 6. Brazil – All NICs: Influenza and RSV distribution, EW 5, 2015-2019 Distribución de virus influenza y VSR, SE 5, 2015-2019
Gra ph 7. Brazil - NIC IEC. Influenza virus distribution by EW 5, 2015-2019 Distribución de virus influenza por SE 5, 2015-2019
Gra ph 8. Brazil- NIC FIOCRUZ. Influenza virus distribution by EW 51, 2014-2018 Distribución de virus influenza por SE 51, 2014-2018
Gra ph 9. Brazil- NIC Adolfo Lutz. Influenza virus distribution by EW 5, 2015-2019 Distribución de virus influenza por SE 5, 2015-2019
Gra ph 10. Brazil: Number of SARI cases out of all hospitalizations, by EW 52, 2018 (in comparison with 2015-17)
Número de casos IRAG de todas las hospitalizaciones, por SE 52, 2018 (en comparación con 2015-17)
Gra ph 11. Brazil: Cumulative counts of influenza-associated SARI cases greater than historic average, EW 52 (2014-2018)
Recuentos acumulados de casos de IRAG asociados a influenza mayor al promedio histórico, SE 52 (2014-2018)
Gra ph 12. Brazil: Cumulative count of influenza-associated SARI deaths greater than historic average, EW 52 (2014-2018)
Recuentos acumulados de fallecidos por IRAG asociados a influenza mayor al promedio histórico, SE 52 (2014-2018)
Sout
h A
mer
ica/
Am
éric
a de
l
Sur-
Sou
th C
one
and
Braz
il/
Cono
Sur
y B
rasi
l

PAHO/OPS | INFLUENZA REGIONAL UPDATE EW 5 /ACTUALIZACIÓN REGIONAL DE INFLUENZA SE 5 36
• During EW 5, at national level, the SARI cases slightly decreased from the previous weeks below the seasonal levels
observed during 2015-2018 for the same period (Graph 4); while ILI activity also decreased (Graph 5). In EW 5, 2019, influenza activity remained below the historic average, with influenza A (H1N1)pdm09 predominating (Graphs 1,3). RSV percent positivity remained at low levels and similar to the levels reported in 2015-18 for the same period (Graph 2). / Durante la SE 5, a nivel nacional, los casos de IRAG disminuyeron ligeramente con respecto a las semanas previas por debajo de los niveles estacionales observados durante 2015-2018 para el mismo período (Gráfico 4), mientras que la actividad de ETI disminuyó también (Gráfico 5). En la SE 5 de 2019, la actividad de influenza permaneció por debajo el promedio histórico, con predominio de influenza A (H1N1)pdm09 (Gráficos 1, 3). El porcentaje de positividad de VSR permaneció con niveles bajos y similar a los niveles reportados en 2015-18 para el mismo período (Gráfico 2). Gra ph 1. Chile: Influenza virus distribution by EW 5, 2015-19
Distribución de virus de influenza, por SE 5, 2015-19
Gra ph 2. Chile: Influenza and RSV distribution, EW 5, 2015-19 Distribución de virus influenza y VSR, SE 5, 2015-19
Gra ph 3. Chile: Baseline for the percent positivity for influenza, EW 5, 2019 (in comparision to 2010-2018)
Linea basal para el porcentaje de positividad de influenza, SE 5, 2019 (en comparación a 2010-2018)
Gra ph 4. Chile. Number of SARI cases from all hospitalizations, EW 5, 2017-19,
Número de casos IRAG por las hospitalizaciones totales, SE 5, 2017-2019
Gra ph 5. Chile. Number of ILI cases, EW 5, 2019, in comparison 2017-18 Número de casos ETI, SE 5, 2019, en comparación 2017-18
*To view more epi data, view here. / Para ver mas datos epi, vea aquí.
• During EW 4, at national level, the SARI case counts increased above the seasonal threshold (Graph 5), with a
predominance among the under 5 and above 60 years of age population. In EW 4, the number of SARI deaths out of total deaths increased from the prior week (Graph 6) mainly among the 60 years of age and older. ILI activity remained at seasonal levels after peaking later than in the previous 2016-2017 seasons. In EW 5, 2019, influenza increased above the alert threshold as compared to previous weeks with few influenza B detections (Graphs 1, 3); RSV positivity remain at low
Paraguay
Sout
h A
mer
ica/
Am
éric
a de
l
Sur-
Sou
th C
one
and
Braz
il/
Cono
Sur
y B
rasi
l Chile

PAHO/OPS | INFLUENZA REGIONAL UPDATE EW 5 /ACTUALIZACIÓN REGIONAL DE INFLUENZA SE 5 37
levels (Graph 2). / Durante la SE 4, a nivel nacional, el recuento de casos de IRAG disminuyeron por debajo del umbral estacional (Gráfico 5), con predominio entre la población menor de 5 años y mayor de 60 años. En la SE 4, el número de muertes por IRAG del total de muertes aumentó en relación a la semana previa, (Gráfico 6) principalmente entre los mayores de 60 años. La actividad de ETI permaneció bajo los niveles estacionales luego de un pico más tardío que en temporadas anteriores de 2016-2017. En la SE 5 de 2019, la actividad de influenza se incrementó en comparación con las semanas previas y sobrepasó el umbral de alerta con detecciones de influenza B (Gráficos 1, 3); la positividad de VSR permaneció en niveles bajos (Gráfico 2).
Gra ph 1. Paraguay: Influenza virus distribution EW 5, 2015-19 Distribución de virus de influenza, SE 5, 2015-19
Gra ph 2. Paraguay: Influenza and RSV distribution, EW 5, 2015-19 Distribución de virus influenza y VSR, SE 5, 2015-19
Gra ph 3. Paraguay SARI sentinel sites: Baseline for the percent positivity for influenza, EW 5, 2019 (in comparision to 2010-2018)
Linea basal para el porcentaje de positividad de influenza, SE 5, 2019 (en comparación a 2010-2018)
Gra ph 4. Paraguay: Number of SARI cases with samples, EW 4, 2019 (as compared to 2015-2018)/
Numero de casos con muestra, SE 4, 2019 (en comparación a 2015-2018)
Gra ph 5. Paraguay: Number of SARI cases per total hospitalizations, EW 4
2019 (as compared to 2016-2018) Número de casos IRAG por total hospitalizaciones, SE 4, 2019 (en
comparación con 2016-2018)
Gra ph 6. Paraguay: Number of SARI deaths per total deaths, EW 4, 2018-19.
Número de fallecidos por IRAG, SE 4, 2018-19
*To view more epi data, view here. / Para ver mas datos epi, vea aquí. • In EW 5, decreased influenza activity was reported with few samples overall (Graphs 3, 4); with low levels of RSV positivity
(Graph 2). During EW 6 of 2019, the proportion of SARI cases requiring ICU admission was slightly higher compared with the 5 previous weeks (Graph 1). / Durante la SE 5, se reportó menor actividad de influenza con escasas detecciones en general (Gráficos 3, 4); con una disminución de la positividad para el VSR (Gráfico 2). Durante la semana 6 de 2019, la proporción de casos de IRAG que fueron admitidos a la UCI fue ligeramente mayor comparada con las 5 semanas previas (Gráfico 1).
Uruguay
Sout
h A
mer
ica/
Am
éric
a de
l
Sur-
Sou
th C
one
and
Braz
il/
Cono
Sur
y B
rasi
l

PAHO/OPS | INFLUENZA REGIONAL UPDATE EW 5 /ACTUALIZACIÓN REGIONAL DE INFLUENZA SE 5 38
Gra ph 1. Uruguay: % SARI cases requiring ICU admission, EW 6, 2019; Porcentaje de casos de IRAG admitidos a UCI, SE 6, 2019
Gra ph 2. Uruguay: Influenza and RSV distribution, EW 5, 2015-19 Distribución de virus influenza y VSR, SE 5, 2015-19
Gra ph 3. Uruguay: Influenza virus distribution by EW 5, 2015-19 Distribución de virus de influenza, por SE 5, 2015-19
Gra ph 4. Uruguay: Percent positivity for influenza, EW 5, 2019 (in comparision to 2010-2018)
Porcentaje de positividad de influenza, SE 5, 2019 (en comparación a 2010-2018)
Gra ph 5. Uruguay: Percent of SARI cases per total hospitalizations, EW 52, 2017-2018
Porcentaje de casos IRAG por total hospitalizaciones, SE 52, 2017-2018
*To view more epi data, view here. / Para ver mas datos epi, vea aquí.
Sout
h A
mer
ica/
Am
éric
a de
l Su
r- S
outh
Con
e an
d Br
azil/
Cono
Sur
y B
rasi
l
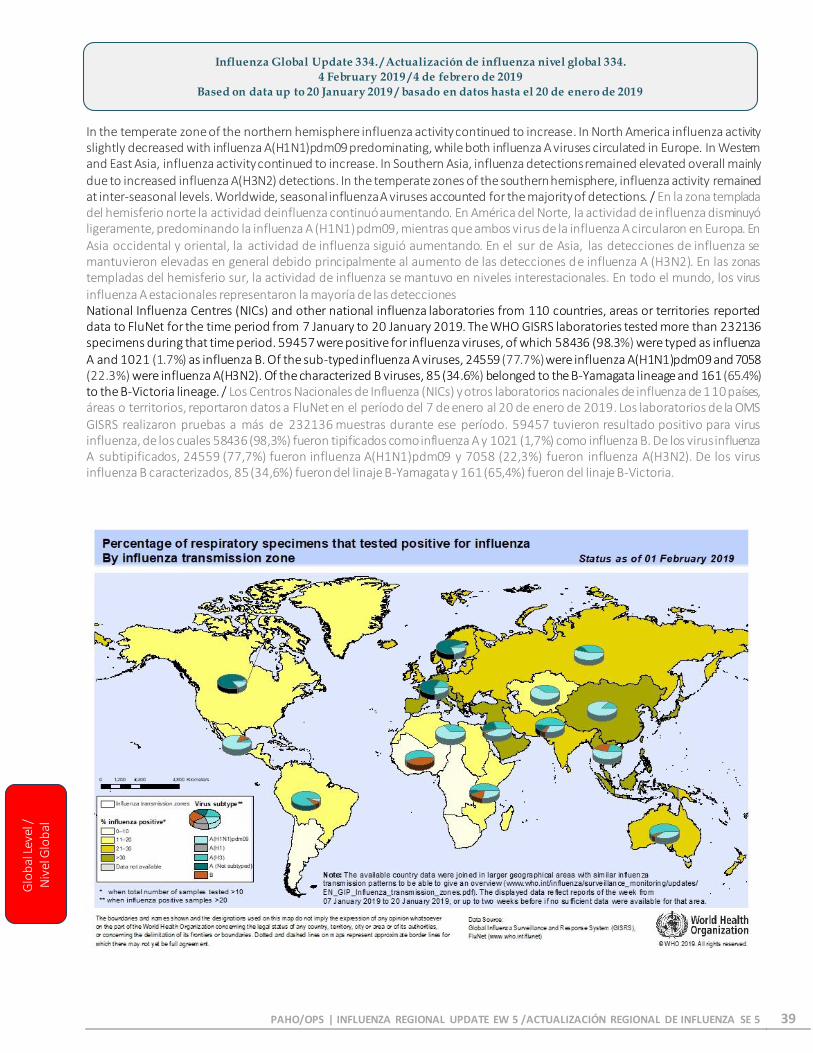
PAHO/OPS | INFLUENZA REGIONAL UPDATE EW 5 /ACTUALIZACIÓN REGIONAL DE INFLUENZA SE 5 39
In the temperate zone of the northern hemisphere influenza activity continued to increase. In North America influenza activity slightly decreased with influenza A(H1N1)pdm09 predominating, while both influenza A viruses circulated in Europe. In Western and East Asia, influenza activity continued to increase. In Southern Asia, influenza detections remained elevated overall mainly due to increased influenza A(H3N2) detections. In the temperate zones of the southern hemisphere, influenza activity remained at inter-seasonal levels. Worldwide, seasonal influenza A viruses accounted for the majority of detections. / En la zona templada del hemisferio norte la actividad deinfluenza continuó aumentando. En América del Norte, la actividad de influenza disminuyó ligeramente, predominando la influenza A (H1N1) pdm09, mientras que ambos virus de la influenza A circularon en Europa. En Asia occidental y oriental, la actividad de influenza siguió aumentando. En el sur de Asia, las detecciones de influenza se mantuvieron elevadas en general debido principalmente al aumento de las detecciones de influenza A (H3N2). En las zonas templadas del hemisferio sur, la actividad de influenza se mantuvo en niveles interestacionales. En todo el mundo, los virus influenza A estacionales representaron la mayoría de las detecciones National Influenza Centres (NICs) and other national influenza laboratories from 110 countries, areas or territories reported data to FluNet for the time period from 7 January to 20 January 2019. The WHO GISRS laboratories tested more than 232136 specimens during that time period. 59457 were positive for influenza viruses, of which 58436 (98.3%) were typed as influenza A and 1021 (1.7%) as influenza B. Of the sub-typed influenza A viruses, 24559 (77.7%) were influenza A(H1N1)pdm09 and 7058 (22.3%) were influenza A(H3N2). Of the characterized B viruses, 85 (34.6%) belonged to the B-Yamagata lineage and 161 (65.4%) to the B-Victoria lineage. / Los Centros Nacionales de Influenza (NICs) y otros laboratorios nacionales de influenza de 110 países, áreas o territorios, reportaron datos a FluNet en el período del 7 de enero al 20 de enero de 2019. Los laboratorios de la OMS GISRS realizaron pruebas a más de 232136 muestras durante ese período. 59457 tuvieron resultado positivo para virus influenza, de los cuales 58436 (98,3%) fueron tipificados como influenza A y 1021 (1,7%) como influenza B. De los virus influenza A subtipificados, 24559 (77,7%) fueron influenza A(H1N1)pdm09 y 7058 (22,3%) fueron influenza A(H3N2). De los virus influenza B caracterizados, 85 (34,6%) fueron del linaje B-Yamagata y 161 (65,4%) fueron del linaje B-Victoria.
Influenza Global Update 334. / Actualización de influenza nivel global 334.
4 February 2019 / 4 de febrero de 2019
Based on data up to 20 January 2019 / basado en datos hasta el 20 de enero de 2019
Glo
bal
Lev
el /
N
ivel
Glo
bal

PAHO/OPS | INFLUENZA REGIONAL UPDATE EW 5 /ACTUALIZACIÓN REGIONAL DE INFLUENZA SE 5 40
This report summarizes3 the epidemiological and virological features of the laboratory-confirmed human cases of infection with influenza viruses of animal origin from 14 December 2018 to 21 January 20194.
• New infections: One human infection with an avian influenza A(H9N2) virus was reported. • Risk assessment: The overall public health risk from currently known influenza viruses at the human-animal interface has
not changed, and the likelihood of sustained human-to-human transmission of these viruses remains low. Further human infectious with viruses of animal origin are expected.
• Risk management: Selection of new candidate vaccine viruses (CVVs) for zoonotic influenza for influenza pandemic preparedness purposes was done during a recent WHO consultation.
• IHR compliance: All human infections caused by a new influenza subtype are required to be reported under the International Health Regulations (IHR 2005). Information from these notifications is critical to inform risk assessments for influenza at the human-animal interface. /
Este reporte resume5 las características epidemiológicas y virológicas de los casos confirmados en laboratorio de infección por virus influenza de origen animal del 14 de diciembre de 2018 al 21 de enero de 20196.
• Nuevas infecciones: Una infección por virus influenza aviar A(H9N2) fue reportada. • Evaluación de riesgo: El riesgo general para la salud pública de los virus influenza conocidos en la interfaz entre humanos
y animales no ha cambiado, y la probabilidad de transmisión sostenida de estos virus sigue siendo baja. Se esperan más infecciones humanas con virus de origen animal.
• Gestión de riesgos: durante una reciente consulta de la OMS, se realizó la selección de nuevos virus de vacuna candidata (CVV) para la influenza zoonótica con fines de preparación para una pandemia de influenza.
• Cumplimiento del RSI: Todas las infecciones humanas causadas por un nuevo subtipo de influenza deben informarse según el Reglamento Sanitario Internacional (RSI 2005). La información de estas notificaciones es fundamental para informar las evaluaciones de riesgo para la influenza en la interfaz humano-animal.
Avian influenza viruses / Virus influenza aviar
Avian influenza A(H5) viruses / Virus influenza aviar A(H5) Since 13 December 2018, no new laboratory-confirmed human cases of influenza A(H5) virus infections were reported to WHO. Various influenza A(H5) subtypes continue to be detected in birds in Africa, Europe and Asia. Overall, the risk assessment has not changed. / Desde el 13 de diciembre de 2018, no se informó a la OMS de nuevos casos confirmados por laboratorio de infecciones por el virus influenza A(H5). Se siguen detectando varios subtipos de influenza A(H5) en aves de África, Europa y Asia. En general, la evaluación de riesgos no ha cambiado. Avian influenza A(H7N9) viruses / Virus influenza aviar A(H7N9) Since 13 December 2018, no new laboratory-confirmed human cases of influenza A(H7N9) virus infections were reported to WHO. There have been no publicly available reports from animal health authorities in China of influenza A(H7N9) virus detections in animals in recent months. Overall, the risk assessment has not changed. / Desde el 13 de diciembre de 2018, no se notificaron a la OMS casos nuevos confirmados por laboratorio de infecciones por el virus influenza A(H7N9). En los últimos meses, las autoridades de sanidad animal de China no han publicado informes públicos sobre la detección del virus influenza A(H7N9) en animales. En general, la evaluación de riesgos no ha cambiado.
3 For epidemiological and virological features of human infections with animal influenza viruses not reported in this assessment, see the yearly report on human cases of influenza at the human-animal interface published in the Weekly Epidemiological Record. www.who.int/wer/en/ 4 WHO (2018) Influenza at the human-animal interface Summary and assessment. Available at: http://www.who.int/influenza/human_animal_interface/HAI_Risk_Assessment/en/ 5 Para conocer las características epidemiológicas y virológicas de las infecciones humanas con virus de influenza animal no reportadas en esta evaluación, consulte el informe anual sobre casos humanos de influenza en la interfaz humano-animal publicado en el Reporte Epidemiológico Semanal. Disponible en: www.who.int/wer/en/ 6 OMS (2018) Influenza en la interfaz humano-animal Resumen y evaluación. Disponible en: http://www.who.int/influenza/human_animal_interface/HAI_Risk_Assessment/en/
Hum
an A
nim
al I
nter
face
/
Inte
rfas
e h
uman
o an
imal
Influenza Human-Animal Interface Update / Actualización de Influenza en la Interfase Humano-Animal 14 December 2018 to 21 January 2019 / 14 de diciembre de 2018 a 21 de enero de 2019
PAHO/OPS | INFLUENZA REGIONAL UPDATE EW 5 /ACTUALIZACIÓN REGIONAL DE INFLUENZA SE 5 41
Avian influenza A(H9N2) viruses / Virus influenza aviar A(H9N2) Since 13 December 2018, one new laboratory-confirmed human case of influenza A(H9N2) virus infection was reported to WHO. On 3 January 2019, China reported the detection of avian influenza A(H9N2) virus in a 32 -year-old woman from Guangdong, with an onset of i llness on 19 December 2018. The illness was reportedly mild, but she was hospitalized on 25 December 2018. The woman did not report exposure to l ive poultry. During epidemiological investigations, no further cases among family members were reported. Avian influenza A(H9N2) viruses are enzootic in poultry in China. / Desde el 13 de diciembre de 2018, se informó a la OMS un nuevo caso confirmado por laboratorio de infección por el virus influenza A(H9N2) en humanos. El 3 de enero de 2019, China informó s obre la detección del virus influenza aviar A(H9N2) en una mujer de 32 años de Guangdong, con inicio de síntomas el 19 de diciembre de 2018. La enfermedad fue leve, pero fue hospitalizada el 25 de diciembre de 2018. La mujer no reportó exposición a aves de corral vivas. Durante las investigaciones epidemiológicas, no se reportaron más casos entre familiares. Los virus influenza aviar A(H9N2) son enzoóticos en aves de corral en China.
Hum
an A
nim
al I
nter
face
/
Inte
rfas
e h
uman
o an
imal

PAHO/OPS | INFLUENZA REGIONAL UPDATE EW 5 /ACTUALIZACIÓN REGIONAL DE INFLUENZA SE 5 42
ACRONYMS
ARI Acute Respiratory Infection CARPHA Caribbean Public Health Agency
CENETROP Centro de Enfermedades Tropicales (Santa Cruz, Bolivia) EW Epidemiological Week ILI Influenza-like illness
INLASA Instituto Nacional de Laboratorios de Salud (La Paz, Bolivia) INS Instituto Nacional de Salud
O RV Other respiratory viruses SARI Severe acute respiratory infection
SEDES Servicio Departamental de Salud (Bolivia) ICU Intensive Care Unit RSV Respiratory Syncytial Virus
_________________________________________
ACRÓNIMOS
CARPHA Agencia de Salud Pública del Caribe/Caribbean Public Health Agency CENETROP Centro de Enfermedades Tropicales (Santa Cruz, Bolivia)
ETI Enfermedad Tipo influenza INLASA Instituto Nacional de Laboratorios de Salud (La Paz, Bolivia)
INS Instituto Nacional de Salud IRA Infección Respiratoria Aguda
IRAG Infección Respiratoria Aguda grave O VR Otros virus respiratorios SE Semana epidemiológica
SEDES Servicio Departamental de Salud (Bolivia) UCI Unidad de Cuidados Intensivos VSR Virus Sincitial Respiratorio
Acr
on
yms
/
Acr
ón
imo
s