2019 Member Informational Meeting
31
2019 Member Informational Meeting April 8 th 2019 Daniel Sovocool, Nixon Peabody Grant Heinitz, SISF Credit Risk Manager Jill Dulich, SISF Claims and Operations Manager 1
Transcript of 2019 Member Informational Meeting

2019 Member Informational Meeting
April 8th 2019
Daniel Sovocool, Nixon Peabody
Grant Heinitz, SISF Credit Risk Manager
Jill Dulich, SISF Claims and Operations Manager
1

Mission Statement:
"To provide continuity of workers' compensation benefits to injured workers of insolvent,
private self-insured companies at the lowest overall long-term cost, equitably distributed
to the self-insurance community."
2

Purpose: Ensure the timely payment of workers compensation claims to
injured workers in the event of default by a member
Founded:
Organization:
Authority:
July 6, 1984 by the State of California
501(c)(6) non-profit
CA Labor Code Sections 3740-3747
Governance: Board of Trustees
7 elected by member companies
1 ex-officio from CA Department of Industrial Relations
(“DIR”)
Membership: All non-public entity CA employers self-insured for WC
540 self-insured entities
$8.3 billion exposure
3

Board of Trustees
4
Tim East, Chairperson, The Walt Disney Company
Janice Murphy, Kaiser Permanente
Steve Tolan, Nordstrom, Inc.
Toni Allen, Monterey Mushrooms, Inc.
John Smolk, Southern California Edison Company
William Lyons, Recology, Inc.
Stacy Bratcher, University of Southern California
Lyn Asio-Booz, Chief, Self Insurance Plans (OSIP), DIR [ex officio]

Board of TrusteesTim East, The Walt Disney Co., Chairperson Janice Murphy, Kaiser Permanente
Steve Tolan, Nordstrom, Inc. Toni Allen, Monterey Mushrooms, Inc.
John Smolk, So Cal Edison Co. William Lyons, Recology, Inc.
Stacy Bratcher, University of Southern California Lyn Asio-Booz, Director Delegate, DIR/OSIP
Executive
CommitteeTim East, Chair
Finance CommitteeJohn Smolk, Chair
Tim East
Audit
CommitteeJanice Murphy, Chair
Bill Lyons
Credit
CommitteeTim East, Chair
Janice Murphy
Bill Lyons
Lyn Asio-Booz
Claims CommitteeSteve Tolan, Chair
Toni Allen
Board and Committees
5

CA Self-Insurance Overview
6
Entities 540 (including 25 SIG’s)
Payroll $95 billion
Employees 2.3 million (1 in 8 in state)
Source: Office of Self-Insurance Plans

ASP – Financial Strength
7
The ASP is operating as intended and both gross and net assets continue to grow
¹ SISF Monthly Financials 12/31/18 unaudited
Source: Audited SISF Financial Statements Jun 30. 2006-2018
100
142 155
103
144
58
112 117
208
245
285
372
435 436
153
191
216 218
315
379363
486 484
459
486508
543532
0
100
200
300
400
500
600
2006 2007 2008 2009 2010 2011 2012 2013 2014 2015 2016 2017 2018 2019¹
($ m
illio
ns)
Net Gross
Estates and Workers’ Compensation Claims
8
2019 2018 D
Estates 86 85 1
46 46 0
Claims 854 957 -103
(as of 2/28)
Claim Liability (net) $381,200,737 $386,302,296 -$5,101,559
$36,341,934 $45,111,000 -$8,769,066
$30,653,508 $39,432,000 -$8,778,492
$448,196,179 $470,845,296 -$22,649,117
$255,562,783 $251,051,000 $4,511,783
SISF total net assets (as of 12/31) $435,597,150 $428,668,257 $6,928,893
$11,000,000 $10,500,000 $500,000
$2,000,000 $2,500,000 -$500,000
$13,000,000 $13,000,000 $0
Projected annual costs - claims (net of excess)
- claims admin
- Total
Paid (1984-2018)
Open Case Reserves (EFL)
IBNR + ULAE (actuarial estimate as of 12/31)
OSIP Deposits turned over to Fund
Total (1968 to date)
Active (1984 to present)
Open

Investment Returns
9
23,388,361
44,101,825
9,097,129
6,195,831
27,616,614 27,855,285
-
5,000,000
10,000,000
15,000,000
20,000,000
25,000,000
30,000,000
35,000,000
40,000,000
45,000,000
50,000,000
2013 2014 2015 2016 2017 2018
IN $ DOLLARS
FISCAL YEAR
INVESTMENT RETURNS
6.1%
1.6%2.2%
10.5%
6.7% 6.1%
Last six fiscal years
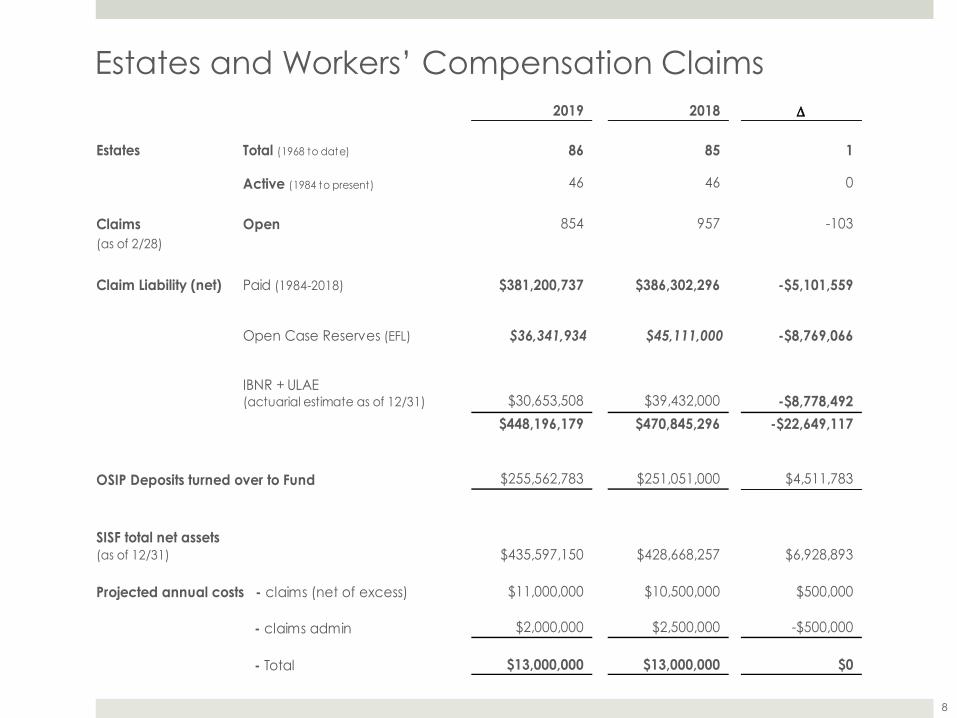
Total Spending and Investment Returns
10
Last six fiscal years
23,388,361
44,101,825
9,097,129 6,195,831
27,616,614 27,855,285
75,951,003
65,252,991 66,848,910
47,782,378
34,955,421
26,558,391
-
10,000,000
20,000,000
30,000,000
40,000,000
50,000,000
60,000,000
70,000,000
80,000,000
2013 2014 2015 2016 2017 2018
IN $ DOLLARS
FISCAL YEAR
INVESTMENT RETURNS
TOTAL SPENDING (CLAIMS & ULAE PAID, G&A, HEDGING)
6.1% 1.6%2.2%
10.5%6.7%
6.1%

% Net Assets / Gross Assets (ASP inception)
11
-4%
47%
66%
75%72%
49%
55%
16%
32%
24%
43%
53%
59%
73%
80%
-10%
0%
10%
20%
30%
40%
50%
60%
70%
80%
90%
2004 2005 2006 2007 2008 2009 2010 2011 2012 2013 2014 2015 2016 2017 2018
FISCAL YEARCAP MSB HISIP

Default History
12
Defaults as of 3/20/19, SISF fiscal years (example: 2019 = 7/1/18 to 6/30/19)
0
2
4
6
8
10N
um
ber
of
def
ault
s
Number of Defaults

Default History (cont’d)
13
Defaults generally in line with economic cycles
SISF Payments are from date of Default to 12/31/18 (net of recoveries), SISF fiscal years (example: 2019 = 7/1/18 to 6/30/19
0.0
10.0
20.0
30.0
40.0
50.0
60.0
70.0
80.0
90.0
100.0
90.7
1.6 0.8 1.2 0.7
5.5
16.011.6
41.3
0.2
77.5
0.24.0
0.0 0.83.7
184.5
2.80.9
5.3
0.3
4.2
34.0
13.9
82.3
2.9
105.5
5.63.5
0.05.4
Gross Outstanding w/IBNR
SISF Payments
Security Deposit

Members by Status
14
Last six fiscal years
2014 2015 2016 2017 2018 2019 YTD
Active 283 287 295 291 281 274
Revoked 265 260 259 260 267 266
Total 548 547 554 551 548 540
283
287
295
291
281
274
265
260259 260
267 266
250
260
270
280
290
300
Active
Revoked

Seven New Self-Insurers

Simplified Admission Requirements
16
• Expedited OSIP and SISF decision-making on entry into self-insurance
• Credit-based underwriting for new admission
• Credit-based, expedited decision-making for entry into ASP (no waiting period)
Credit level
Rating Equivalency
Member TypeDeposit
retained by SISF
Collateral posted with
OSIP
Expedited decision-making
for entry into ASPS&P Fitch Moody's
1 AAA AAA Aaa
Fully Participating
100% -
Immediate Entry
2 AA+ AA+ Aa1 100% -
3 AA AA Aa2 100% -
4 AA- AA- Aa3 100% -
5 A+ A+ A1 100% -
6 A A A2 100% -
7 A- A- A3 100% -
8 BBB+ BBB+ Baa1 100% -
9 BBB BBB Baa2 100% -
10 BBB- BBB- Baa3 100% -
11 BB+ BB+ Ba1 100% -Subject to Credit
Committee Approval
12 BB BB Ba2 100% -
13 BB- BB- Ba3
Partial Participating
90% 10%
14 B+ B+ B1 75% 25%
15 B B B2 50% 50% Not Admitted on midyear basis16 B- B- B3 25% 75%

17
Grant Heinitz
Credit Risk Manager
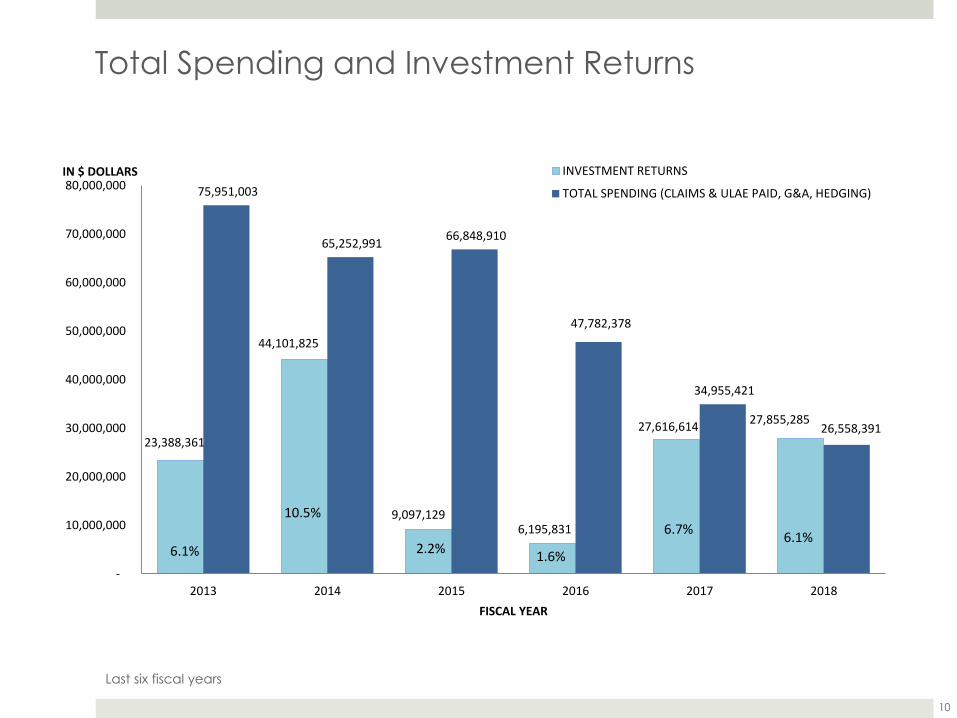
ASP – Overview
18
¹ SISF Monthly Financials 12/31/18 unaudited
• Successful implementation of 2018/19 Alternative Security Program
– 6th year post SB863
– ASP and Composite Deposit decreased slightly (-2.5%) and (-3.4%)
• Financial strength of Fund continues to improve¹
– net $436 mill
– gross $532 mill
• Overall portfolio credit rating stable – Baa1
• Assessment decreased 15.0% ($31.1mm vs. $36.6mm) from the prior year
• $10mm in Premium credit was returned to eligible members
• Actual assessment decreased 42% ($21.1mm net of Premium Credit)

ASP – Participation Summary
19
ASP liabilities have decreased consistently since the passage of SB863…
2018/19 2017/18 Δ
$ (mm) # $ (mm) # $ (mm) %
Fully 6,195 325 6,759 310 (564) -8.3%
Partial 697 54 375 49 322 85.9%
Composite Deposit 6,892 378 7,134 359 (242) -3.4%
Partial 609 54 488 49 121 24.7%
Excluded 770 161 862 189 (92) -10.7%
3701 Security 1,379 1,350 29 2.1%
Total 8,270 540 8,484 548 (213) -2.5%
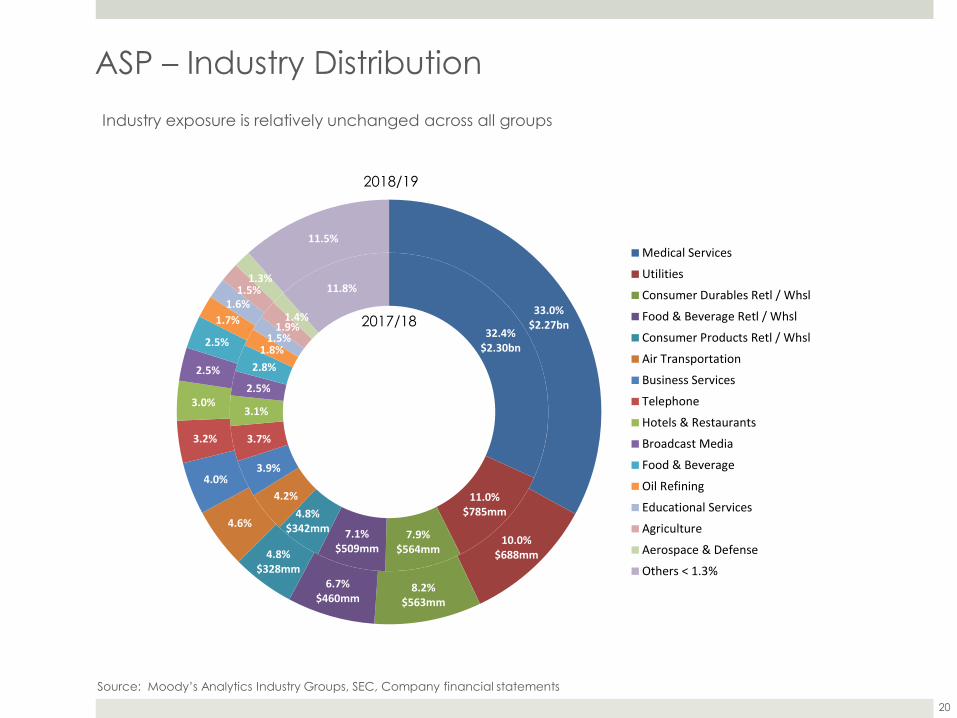
ASP – Industry Distribution
20
Industry exposure is relatively unchanged across all groups
Source: Moody’s Analytics Industry Groups, SEC, Company financial statements
2018/19
2017/1832.4%
$2.30bn
11.0%$785mm
7.9%$564mm
7.1%$509mm
4.8%$342mm
4.2%
3.9%
3.7%
3.1%
2.5%
2.8%
1.8%1.5%
1.9%1.4%
11.8%
33.0%$2.27bn
10.0%$688mm
8.2%$563mm
6.7%$460mm
4.8%$328mm
4.6%
4.0%
3.2%
3.0%
2.5%
2.5%
1.7%
1.6%1.5%
1.3%
11.5%Medical Services
Utilities
Consumer Durables Retl / Whsl
Food & Beverage Retl / Whsl
Consumer Products Retl / Whsl
Air Transportation
Business Services
Telephone
Hotels & Restaurants
Broadcast Media
Food & Beverage
Oil Refining
Educational Services
Agriculture
Aerospace & Defense
Others < 1.3%

ASP – Rating Distribution
21
Source: Moody’s, S&P, Fitch Ratings, Moody’s RiskCalc and CreditEdge
0.0%
5.0%
10.0%
15.0%
20.0%
25.0%
Aaa Aa1 Aa2 Aa3 A1 A2 A3 Baa1 Baa2 Baa3 Ba1 Ba2 Ba3 B1 B2 B3
% o
f A
SP L
iab
iliti
es
Rating Equivalent
2018/19
2017/18
Baa1
The overall portfolio credit rating was essentially unchanged with a generally improving portfolio…

ASP – Assessment Components
22
The total assessment comprised of two elements
ELP (Excess Liability Protection) fee - covers risk transfer expenses and partial admin costs
DLF (Default Loss Fund) fee - builds capital, covers partial admin costs,
and pays current claims
General administrative
ELP
Risk transfer
Placement
DLF
Capital
Claims
General administrative

ASP – Total Assessment
23
2003/04 2004/05 2005/06 2006/07 2007/08 2008/09 2009/10 2010/11 2011/12 2012/13 2013/14 2014/15 2015/16 2016/17 2017/18 2018/19
64.2 59.6 53.6 41.4 31.9 38.7 46.0 44.3 46.1 46.9 31.1 30.6 49.1 43.1 36.5 21.1
4,699.0 5,797.0 5,893.0 5,516.1 6,086.1 6,386.6 6,376.8 6,571.5 6,682.2 7,011.4 8,860.2 8,900.4 8,878.3 8,716.7 8,483.7 8,270.2
1.4 1.0 0.9 0.8 0.5 0.6 0.7 0.7 0.7 0.7 0.4 0.3 0.6 0.5 0.4 0.3
Aggregate fees
Total liabilities
%
Source: 2018/19 liabilities as of 4-1-2019
34.453%
35.249%
35.870% 31.4
76%
11.335%
18.047%
23.551%
19.444% 10.3
22%8.9
19%
17.356% 10.6
35%
30.863%
29.168% 22.2
61%18.259%
-10.0-32%
12.019%
9.616%
6.212%
17.728% 14.7
25% 11.618%
10.024%
20.665%
20.753%
22.549% 24.9
56% 35.978%
38.081% 13.8
44% 20.065%
18.237% 14.0
32%14.339% 12.9
41%
ELP
Pre-existing default shortfall - PEDSF
Premium Credit
DLF

ASP – Assessment Rates
24
Considering the capital needs of the Fund and the current credit environment, assessment rates
decreased across all levels
Index Rating 2018/19 2017/18 % Δ
1 Aaa / AAA+ 13 14 -7%
2 Aa1 / AA+ 16 17 -6%
3 Aa2 / AA 20 21 -7%
4 Aa3 / AA- 21 22 -6%
5 A1 / A+ 25 26 -6%
6 A2 / A 27 28 -7%
7 A3 / A- 31 33 -6%
8 Baa1 / BBB+ 39 41 -6%
9 Baa2 / BBB 47 50 -6%
10 Baa3 / BBB- 64 67 -5%
11 Ba1 / BB+ 100 106 -6%
12 Ba2 / BB 122 131 -6%
13 Ba3 / BB- 138 148 -6%
14 B1 / B+ 155 165 -6%
15 B2 / B 192 206 -6%
16 B3 / B- 221 236 -6%
0
100
200
300
400
500
600
1 2 3 4 5 6 7 8 9 10 11 12 13 14 15 16
Rat
e -
bas
is p
oin
ts
Credit Index
Assessment rates
2018/19
2017/18
2003/2004

ASP – Assessment vs. Surety Rates
25
A comparison between surety and 2018/19 ASP assessment rates
¹ Assessment rates 2018/19
² JLT Specialty – general market indications of available terms 2018-19
I Investment Grade I Non-Investment Grade I
-
50.0
100.0
150.0
200.0
250.0
300.0
350.0
400.0
1 2 3 4 5 6 7 8 9 10 11 12 13 14 15 16
Bp
s
Credit Levels
ASP vs. Surety Rates
ASP¹
Surety 2018-19²

26
Jill Dulich
Claims and Operations Manager
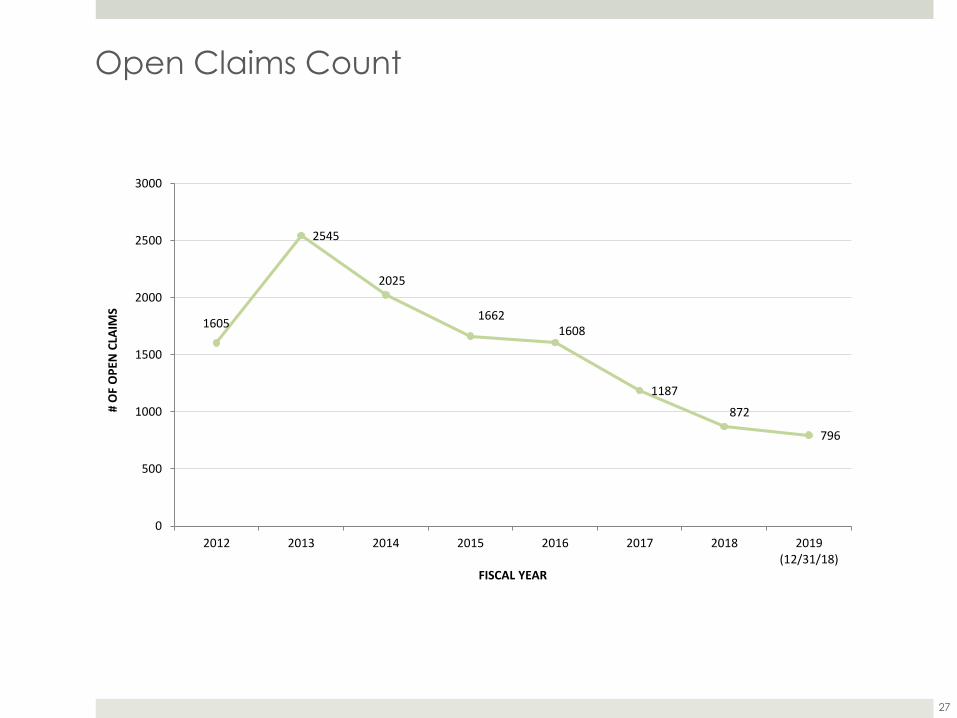
Open Claims Count
27
1605
2545
2025
16621608
1187
872
796
0
500
1000
1500
2000
2500
3000
2012 2013 2014 2015 2016 2017 2018 2019(12/31/18)
# O
F O
PEN
CLA
IMS
FISCAL YEAR

Claims Paid
28
Last six fiscal years
45,742,759
40,571,357
25,579,224
18,742,888
13,101,048
10,890,432
0
5,000,000
10,000,000
15,000,000
20,000,000
25,000,000
30,000,000
35,000,000
40,000,000
45,000,000
50,000,000
2014 2015 2016 2017 2018 2019 (Projected)
CLA
IMS
PA
ID I
N $
FISCAL YEAR

Total Claims and ULAE Expenses
29
Last six fiscal years
52,635,400
46,983,511
29,525,322
22,182,860
15,476,729
12,898,753
0
10,000,000
20,000,000
30,000,000
40,000,000
50,000,000
60,000,000
2014 2015 2016 2017 2018 2019 (Projected)
TOTA
L C
LAIM
S A
ND
ULA
E EX
PEN
SE I
N $
FISCAL YEAR

Estimated Future Liabilities for Claims and ULAE
30
Last six fiscal years
358,353,166
263,940,638
212,758,888
194,020,343
134,779,970
106,412,633
0
50,000,000
100,000,000
150,000,000
200,000,000
250,000,000
300,000,000
350,000,000
400,000,000
2013 2014 2015 2016 2017 2018
RES
ERV
E IN
$
FISCAL YEAR
31