2019 edition - ec.europa.eu
63
Quality report of European Union statistics on electricity and natural gas prices for the reporting semestrial periods of years 2017 and 2018 2019 edition
Transcript of 2019 edition - ec.europa.eu

Quality report of European Union statistics on electricity and natural gas
prices for the reporting semestrial periods of years 2017 and 2018
2019 edition

Table of Contents
Quality report of European Union statistics on electricity and natural gas prices 2
Table of contents
1. INTRODUCTION ....................................................................................................... 3
2. OVERVIEW ................................................................................................................ 4
2.1. Legal basis ......................................................................................................... 4
2.2. Coverage ............................................................................................................ 6
2.3. General description of the process and its outputs ............................................ 9
2.4. Confidentiality ................................................................................................. 11
3. RELEVANCE, ACCURACY AND RELIABILITY ............................................... 12
3.1. The users (Relevance) ..................................................................................... 12
3.2. Completeness ................................................................................................... 13
3.3. Accuracy .......................................................................................................... 15
3.4. Reliability ........................................................................................................ 16
4. TIMELINESS AND PUNCTUALITY ..................................................................... 19
4.1. Timeliness and punctuality .............................................................................. 19
4.2. Corrections ...................................................................................................... 20
5. ACCESSIBILITY,CLARITY, COHERENCE AND COMPARABILITY .............. 22
5.1. Accessibility .................................................................................................... 22
5.2. Clarity .............................................................................................................. 23
5.3. Coherence ........................................................................................................ 24
5.5. Comparability – over time ............................................................................... 24
8. SUMMARY .............................................................................................................. 26
9. CONCLUSIONS AND RECOMMENDATIONS .................................................... 27
ANNEXES ........................................................................................................................ 28
Introduction 1
Quality report of European Union statistics on electricity and natural gas prices 3
1. INTRODUCTION
This report contains summarised information for the first exercise on quality reporting in the field of natural gas and electricity prices in the European
Union. Its main objective is to analyse the main aspects of natural gas and electricity prices data quality and detect areas to improve it in the future. Its scope is analysing quality performance for the reference years 2017 and
2018. Eurostat compiled it using the information included in the quality reports sent
by the EU Member States in 2019 and the actual data sent by them in 2017 and 2018, which are available in Eurobase1. The scope of the report are the reference years 2017 and 2018. The quality reports we include in this
analysis are the following: - Energy statistics - Gas prices for domestic and industrial
consumers2 for the datasets: Gas prices for household consumers - bi-annual data Gas prices for non-household consumers - bi-annual data
Gas prices components for household consumers - annual data
Gas prices components for non-household consumers - annual data
- Energy statistics - electricity prices for domestic and industrial
consumers, price components3 for the datasets: Electricity prices for household consumers - bi-annual data
Electricity prices for non-household consumers - bi-annual data
Electricity prices components for household consumers -
annual data Electricity prices components for non-household consumers - annual dataThe
quality concept applied in this report is in conformity with the definition developed by the European Statistical System. In this definition, quality consists of the following components: relevance, accuracy, timeliness and
punctuality, accessibility and clarity, comparability and coherence. We briefly explain each of the quality components shortly at the start of each section in
the report4 before we analyse them for the needs of this exercise.
1 Eurobase :
https://ec.europa.eu/eurostat/data/database
2 Quality reports for nrg_pc_202:
https://ec.europa.eu/eurostat/cache/metadata/en/nrg_pc_202_esms.htm
3 Quality reports for nrg_pc_204:
https://ec.europa.eu/eurostat/cache/metadata/en/nrg_pc_204_esms.htm
4 Most of the introductory texts that shortly explaining each quality component are taken from the ESS
Handbook for Quality reports 2014', available at:
https://ec.europa.eu/eurostat/documents/3859598/6651706/KS-GQ-15-003-EN-N.pdf

Overview 2
Quality report of European Union statistics on electricity and natural gas prices 4
2. OVERVIEW
Eurostat initiated the collection of energy prices in 1990 with the objective of improving the transparency for gas and electricity prices charged to
industrial end-users. While the legal basis was amended several times, the main objective of improving price transparency remained the same and became increasingly important, especially in the context of the European
Energy Union. Transparency for gas and electricity prices encourages consumers to choose between different suppliers and energy sources and
hereby help the promotion of a fair competition. On European Union level, it provides a comparison between member states and facilitates the organisation of the internal market. This facilitates the process for the
European Union to become more efficient in its use of energy, and less dependent on fossil fuels.
Regarding the data collection process, Eurostat put to practise in 2007 a major change in methodology. EU started the process of energy market
liberalisation started in the 1990s and fully completed it by mid-2007. The new status quo necessitated the need to update the collection meeting the
emerging requirements of the liberalised market. Eurostat adapted the methodology for the collection of energy prices and the EU Member States agreed in December 2006 the following changes:
Collection of national prices instead of regional prices
Prices for electricity and natural gas provided by the companies based on the real prices paid by industrial customers averaged over a given period of six months
The definition of standard consumers replaced by consumption bands, including one for big industrial users
Collection of disaggregated electricity prices (separate component price data for production, network and taxes)
Initially, reporting countries provided price data for the household sector on a voluntary basis. This changed with the implementation of Regulation (EU)
2016/1952 who entered into force in 2016. Reporting natural gas and electricity price data for the household sector became obligatory. Eurostat changed the collection of data of industrial users to non-household
consumers, adopting a unique methodology for all reporting countries that include industrial, commercial and other users not included in the households
sector.
Furthermore, Regulation (EU) 2016/1952 implemented the obligation for Eurostat and countries to provide quality reports. At 2019, it was the first quality reporting cycle , with Member States submitting the first quality
reports to Eurostat by June 15. Each quality report should cover the full years elapsed since the date of the previous quality report. The first quality
reports cover reference years 2017 and 2018. 2.1. Legal basis
The main legal text in the area of European statistics on natural gas and
electricity prices is Regulation (EU) 2016/1952 of the European Parliament and of the Council of 26 October 2016 on European statistics on natural gas
Overview 2
Quality report of European Union statistics on electricity and natural gas prices 5
and electricity prices and repealing Directive 2008/92/EC. This regulation provides for quality assessment and quality reports according to article 7.
Paragraph 1 legislates the application of the standard quality criteria laid down in Article 12 (1) of Regulation (EC) No 223/2009, which states the
quality assessment dimensions that apply to the data: ‘relevance’, which refers to the degree to which statistics meet current
and potential needs of the users;
‘accuracy’, which refers to the closeness of estimates to the unknown true values;
‘timeliness’, which refers to the period between the availability of the information and the event or phenomenon it describes;
‘punctuality’, which refers to the delay between the date of the release
of the data and the target date (the date by which the data should have been delivered);
‘accessibility’ and ‘clarity’, which refer to the conditions and modalities by which users can obtain, use and interpret data;
‘comparability’, which refers to the measurement of the impact of
differences in applied statistical concepts, measurement tools and procedures where statistics are compared between geographical areas,
sectoral domains or over time; ‘coherence’, which refers to the adequacy of the data to be reliably
combined in different ways and for various uses.
Paragraph 3 of Regulation (EU) 2016/1952 states the obligation for countries
to transmit quality reports to Eurostat every three years:
‘Every three years, Member States shall provide the Commission
(Eurostat) with a standard quality report on the data in accordance with the quality criteria laid down in Article 12(1) of Regulation (EC)
No 223/2009. Those reports include information on the scope and collection of the data, the calculation criteria, the methodology and data sources used, and any changes thereto.’
Furthermore, paragraph 4 states the obligation for Eurostat to assess the
quality of the data provided and to prepare and publish a report on the quality of European statistics on natural gas and electricity prices:
‘The Commission (Eurostat) shall assess the quality of the data provided and shall use that assessment and an analysis of the quality
reports referred to in paragraph 3 in order to prepare and publish a report on the quality of the European statistics covered by this
Regulation.’ Three implementing acts supplement Regulation (EU) 2016/:
1. Commission Implementing Regulation (EU) 2017/2169 of 21 November 2017 concerning the format and arrangements for the
transmission of European Statistics on natural gas and electricity prices pursuant to Regulation (EU) 2016/1952 of the European Parliament and of the Council (Text with EEA relevance.)
2. Commission Implementing Decision (EU) 2018/1734 of 14 November 2018 granting derogations to the Federal Republic of Germany, the
Kingdom of Spain, the Italian Republic and the Republic of Cyprus as regards the provision of statistics pursuant to Regulation (EU)

Overview 2
Quality report of European Union statistics on electricity and natural gas prices 6
2016/1952 of the European Parliament and of the Council (notified under document C(2018) 7465) (Text with EEA relevance.)
3. Commission Implementing Regulation (EU) 2019/803 of 17 May 2019 concerning the technical requirements regarding the content of quality
reports on European statistics on natural gas and electricity prices pursuant to Regulation (EU) 2016/1952 of the European Parliament and of the Council (Text with EEA relevance.)
Regulation (EC) No 223/2009 of the European Parliament and of the Council
of 11 March 2009 on European Statistics strengthen the role of quality reporting. Article 12.3 of this Regulation states that European statistics shall be developed, produced and disseminated based on uniform standards and
harmonised methods.
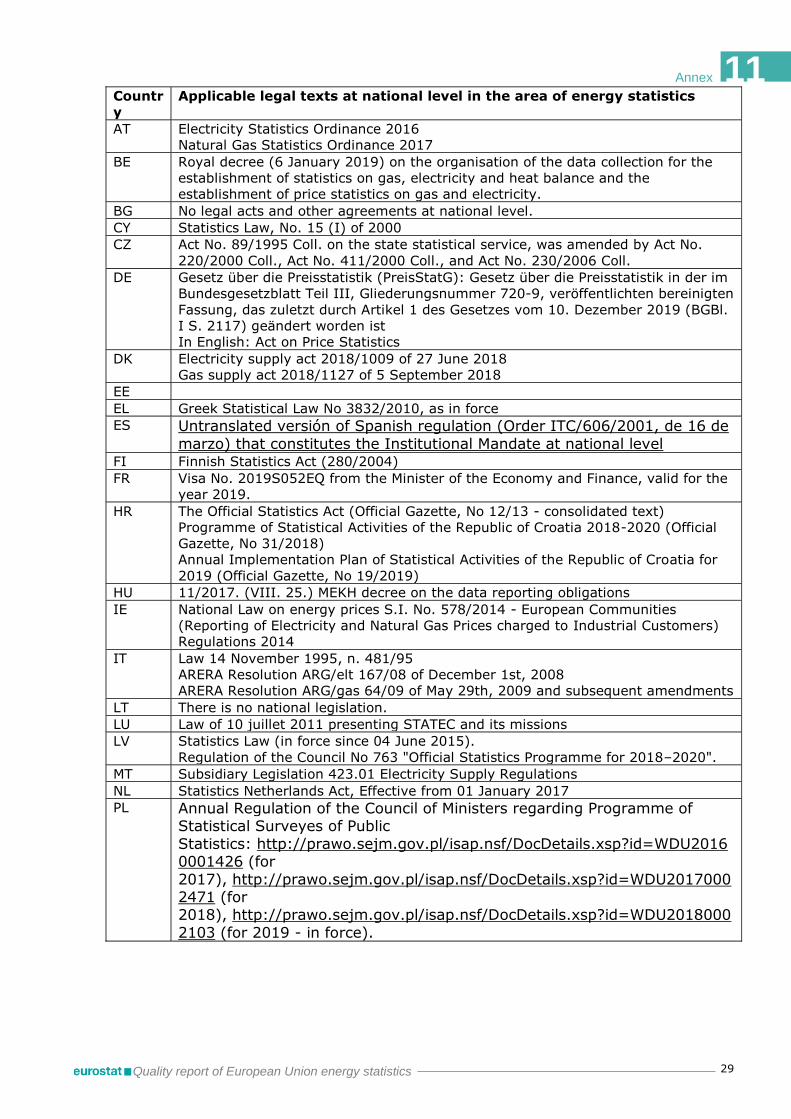
At national level: In addition to European regulations, many participating countries have their own national legislation. Annex 1 includes information on applicable national
laws or regulations. Only Bulgaria, Estonia and Lithuania do not report any national legislation. However, many legislations from the other countries are
not updated with the new requirements, not well defined, or do not specify deadlines or sanctions.
Although many countries have regulations or agreement in place, countries have often difficulties to enforce their data suppliers to submit the data on
time. It is advised to specify in the national regulations which data is mandatory and the deadline that need to be respected, including sanctions
in case of non-compliance.
2.2. Coverage
In total, the official data transmission consists of four questionnaires5, which address two products (natural gas and electricity) and two categories of end-
users (households and non-households).
For all questionnaires, there are two different levels of disaggregation: 1. Semestrial prices. Reporting countries provide data twice a year. The
reference periods are the semesters of the calendar year. These prices
are divided in 3 levels: Level 1 prices: prices excluding taxes and levies.
Level 2 prices: prices excluding VAT and other recoverable taxes and levies.
Level 3 prices: prices including all taxes and levies.
2. Annual prices. Reporting countries provide annual prices once a year together with the data for the second semester. The reference periods
are the calendar years. These prices are divided into the following components and taxes:
Energy and supply: generation, aggregation, balancing energy,
supplied energy costs, customer services, after-sales management and other supply costs.
5 The questionnaires are available here : https://ec.europa.eu/eurostat/web/energy/methodology/prices

Overview 2
Quality report of European Union statistics on electricity and natural gas prices 7
Network cost: transmission and distribution tariffs, transmission and distribution losses, network costs, after-sale service costs,
system service costs, and meter rental and metering costs. Value added taxes (VAT): as defined in Council Directive
2006/112/EC. Renewable taxes: taxes, fees, levies or charges relating to the
promotion of renewable energy sources, energy efficiency and
CHP generation. Capacity taxes: Taxes, fees, levies or charges relating to
capacity payments, energy security and generation adequacy; taxes on coal industry restructuring; taxes on electricity distribution; stranded costs and levies on financing energy
regulatory authorities or market and system operators. Environmental taxes: taxes, fees, levies or charges relating to
air quality and for other environmental purposes; taxes on emissions of CO2 or other greenhouse gases. This component includes the excise duties.
Nuclear taxes (only for the electricity questionnaires): taxes, fees, levies or charges relating to the nuclear sector, including
nuclear decommissioning, inspections and fees for nuclear installations.
All other taxes: taxes, fees, levies or charges not covered by
any of the previous five categories: support for district heating; local or regional fiscal charges; island compensation; concession
fees relating to licences and fees for the occupation of land and public or private property by networks or other devices.
In addition to these elements, the network cost includes the transmission and distribution. Countries report the relative share of consumption in the
different consumption bands. Eurostat uses it to calculate the single national prices (National weighted averages). Eurostat does not publish consumption in bands for confidentiality reasons.
Reporting countries provide prices in national currencies per kWh for
electricity and GJ for natural gas and according to different bands of consumption.
For the electricity of household sector, the bands are:
DA: consumption of less than 1000 kWh.
DB: consumption of 1000 kWh or more but less than 2500 kWh. DC: consumption of 2500 kWh or more but less than 5000 kWh.
DD: consumption of 5000 kWh or more but less than 15000 kWh. DE: consumption of 15000 kWh or more.
For the electricity of final non-household sector, the bands are: IA: consumption of less than 20 MWh.
IB: consumption of 20 MWh or more but less than 500 MWh. IC: consumption of 500 MWh or more but less than 2000 MWh. ID: consumption of 2000 MWh or more but less than 20000 MWh.
IE: consumption of 20000 MWh or more but less than 70000 MWh. IF: consumption of 70000 MWh or more but less than 150000 MWh.
IG: consumption of 150000 MWh or more.

Overview 2
Quality report of European Union statistics on electricity and natural gas prices 8
For the natural gas of households sector, the bands are: D1: consumption of less than 20 GJ.
D2: consumption of 20 GJ or more but less than 200 GJ. D3: consumption of 200 GJ or more.
For the natural gas of final non-households sector, the bands are:
I1: consumption of less than 1000 GJ.
I2: consumption of 1000 GJ or more but less than 10000 GJ. I3: consumption of 10000 GJ or more but less than 100000 GJ.
I4: consumption of 100000 GJ or more but less than 1000000 GJ. I5: consumption of 1000000 GJ or more but less than 4000000 GJ. I6: consumption of 4000000 GJ or more.
In addition to these bands of consumption, the questionnaires include an
automatic calculation of the single prices for the annual data. Eurostat received data from 41 countries:
All 27 EU Member States
3 EFTA countries 7 candidate or potential candidate countries
And 4 other countries
The regulation (EU) 2016/1952 applies only to EU member states and EEA
countries. However, Norway is the only non-EU country that submitted their national quality report. Therefore, this EU quality reports covers only the EU
Member States. Finally, the information provided in the national quality reports could only be
analysed in a summarised way, since it would not be possible to publish a synthetic EU quality report containing all the details of the information
transmitted by countries. However, the national quality reports are accessible at:
https://ec.europa.eu/eurostat/cache/metadata/en/nrg_pc_202_esms.
htm for natural gas quality reports https://ec.europa.eu/eurostat/cache/metadata/en/nrg_pc_204_esms.
htm for electricity quality reports
At national level: Four countries have asked for derogation from producing statistical data for the reference years 2017 and 2018.
1. Germany is exempted from sending data related to the highest bands of consumption of both questionnaires concerning non-households
sector. Germany is also exempted from sending data related to the sub-components on network prices and to the sub-components on taxes, fees, levies and charges.
2. Spain is exempted from sending data related to the sub-components on network prices and to the sub-components on taxes, fees, levies
and charges in addition to the consumption volumes. Spain is also exempted from sending the three-level breakdown of the electricity.
3. Italy is exempted from sending data related to the sub-components on
network prices and to the sub-components on taxes, fees, levies and charges.

Overview 2
Quality report of European Union statistics on electricity and natural gas prices 9
4. Cyprus is exempted from sending data related to the sub-components on network prices and to the sub-components on taxes, fees, levies
and charges for the electricity and for 2017 only.
Overseas dependencies are generally not included in the national data but Portugal includes the Azores Islands and Madeira.
2.3. General description of the process and its outputs
Eurostat collects, processes and publishes the natural gas and electricity
prices every 6 months. The deadline for the countries is 3 months after the reference periods.
First, all questionnaires sent by reporting countries are undergoing validations checks such as completeness, plausibility, coherence and time
series checks. Eurostat confirms the validity of the submitted data and publishes them. The data from the questionnaire are available into our internal database, the prices per kWh is calculated from the prices per GJ for
the natural gas data and the prices in EUR and PPS (purchasing power standard) are calculated using conversion rates. Many different PPS rates
using different types of goods are available but it has been decided to use the PPS rates based on the national GDP as the aim is to be able to compare the weight of the energy bill in different economies. Finally, the data is
disseminated on Eurostat’s public database into the following datasets: nrg_pc_202: Gas prices for household consumers - bi-annual data
nrg_pc_203: Gas prices for non-household consumers - bi-annual data nrg_pc_204: Electricity prices for household consumers - bi-annual
data
nrg_pc_205: Electricity prices for non-household consumers - bi-annual data
nrg_pc_202_c: Gas prices components for household consumers - annual data
nrg_pc_203_c: Gas prices components for non-household consumers -
annual data nrg_pc_204_c: Electricity prices components for household consumers
- annual data nrg_pc_205_c: Electricity prices components for non-household
consumers - annual data nrg_pc_206: Share for transmission and distribution in the network
cost for gas and electricity - annual data
When all EU countries are available, Eurostat calculates EU aggregates using
the average of the national prices weighted by the consumption of the countries.For the PPS prices, of the EU aggregates, two methods are possible. The EU aggregates PPS rates could be used. However, these rates
are weighted averages weighted on the GDP. Instead, Eurostat recalculates the average of the national PPS prices weighted by the countries’
consumption. EU aggregates were only calculated for bi-annual data (not for annual data)
as big EU member states were derogated from sending disaggregated prices for 2017 and 2018 (DE, IT, ES and CY). However, for 2019 data onwards,
they will be calculated.

Overview 2
Quality report of European Union statistics on electricity and natural gas prices 10
At national level:
From Annex 2, most of the countries collect all the data needed directly from their electricity or natural gas suppliers. However, twelve EU Member States
are not asking all the requested data to their suppliers and they thus have to find other data sources. These data sources can be the network operators (for the network prices) or administrative data for regulated prices or taxes.
The data of these other sources can be of higher quality but the compilation of the different prices is then more complicated as these countries have to do
extra calculations in order to be able to report all the disaggregated data points requested by the regulation.
If the suppliers have the data, we advise to request all the data needed from them. The other data sources can still be used to validate the data
reported by the suppliers.
Eight EU member states are collecting the prices on quarterly or monthly bases. This also implies extra calculations as after having done the national
aggregates, they now have to calculate a time aggregate possibly weighted on the consumption in each period.
While all Member states are using electronic questionnaires or even online surveys, countries like Germany or Luxembourg still accept questionnaires
filled in manually and sent by fax or land mail. While this might be very convenient for the data providers, it might complicate the processing of the data and might incur copying mistakes especially for countries like Germany
with many electricity and natural gas suppliers.
The validation checks done by the EU member states on the data from their provider varies a lot. Some countries did not report any other validation checks than the ones performed on their national aggregates but most of
them are validating every single transmission made to them. This task might seem easy for countries with few suppliers requested to fill in the survey but
it might get very complicated for countries like Italy with several hundreds of suppliers both for electricity and for natural gas.
The data compilation process is easy for the countries asking all the data needed directly from their electricity or natural gas suppliers: They just need
to calculate the averages weighted on the market share of each of these suppliers. The other countries also have to do this calculation but they also need to do extra calculations:
Some countries are getting the network prices from the network operators or from administrative sources (when it is a regulated
price). Thanks to this, they can calculate the energy and supply prices by deducting the network prices from the level 1 prices (prices without any taxes).
Other countries are using administrative data in order to calculate the disaggregated taxes.
It can be noted a different process for the prices for households in Czechia.
As the prices are regulated, the electricity and natural gas suppliers do not need to be surveyed for the prices. Only the market share and the number of customers are asked to them. The national prices are calculated directly from

Overview 2
Quality report of European Union statistics on electricity and natural gas prices 11
administrative sources and from public prices reported on the suppliers’ websites.
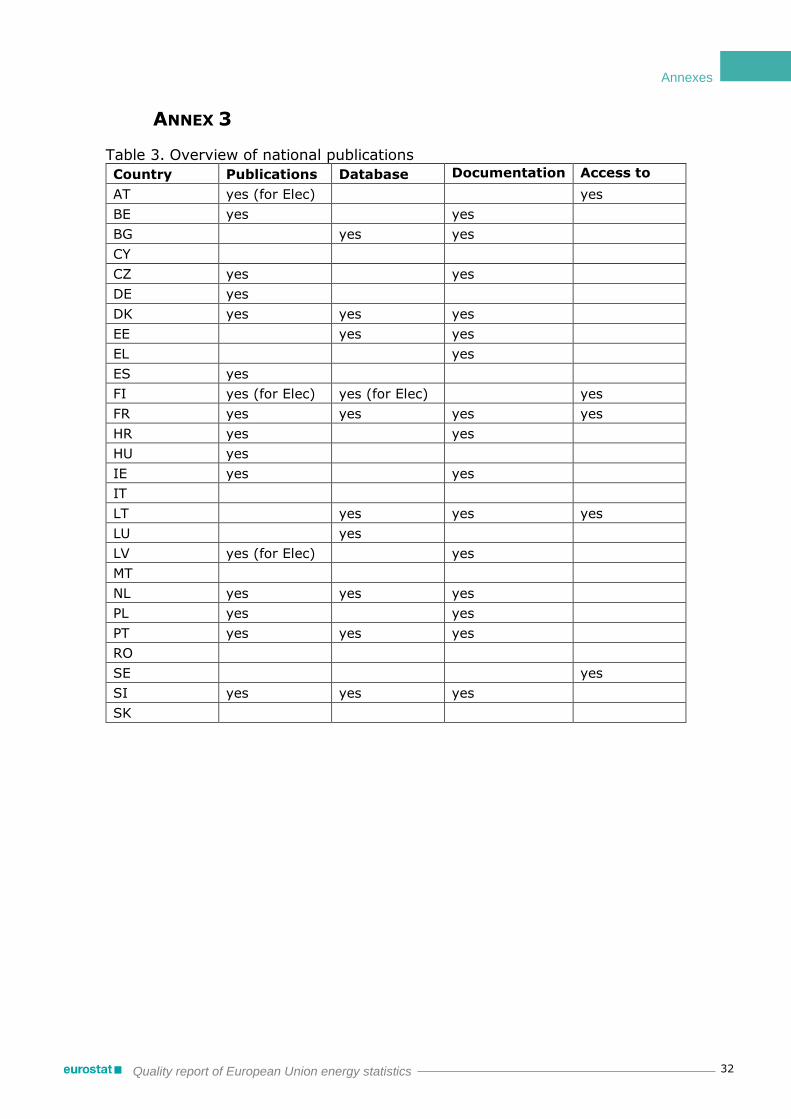
Concerning the outputs, all countries rely on Eurostat’s publications and
online database. However, in Annex 3, 16 EU member states have some sort of national publications (press releases or annual or bi-annual publications). Ten of them are also hosting an online database or excel spreadsheets on
their national servers. These member states with national publications generally do publish also documents on methodology. Only one country
mentioned that they have an online database but no documents on the methodology. Finally, only five member states mentioned that they have a procedure in place to give access to micro-data.
2.4. Confidentiality
The questionnaire provides for the possibility to specify confidential values. Reporting countries should flag the band as confidential but it can be on the semestrial prices, the annual prices, the consumption volumes or a
combination of these elements. The transmission and distribution shares of the network prices can also be confidential.
Our internal database is stored on a secure environment accessible by a restricted number of persons that have signed a declaration of
confidentiality. Eurostat does not publish in its public database the data flagged as confidential but the confidential data might be used to calculate
the aggregate only if it is not possible to recalculate the confidential data. An aggregate does not take into account the confidential data if there is only 1 or 2 data points that are confidential.
At national level:
It is possible that reporting countries are generally considering a band of consumption as confidential when less than three customers are present in that band. They are also sometimes reporting a band as confidential if less
than 3 suppliers provide data for that band. Finally, it might happen that there are more than 3 customers or 3 providers for a band but it is well
known that one of them represents a big share of that band (>80%). In such a case, reporting countries can also flag the band as confidential.

Relevance 3
Quality report of European Union energy statistics 12
3. RELEVANCE, ACCURACY AND RELIABILITY
Relevance is an attribute of statistics measuring the degree to which statistical information meets current and potential needs of the users
The accuracy of statistical outputs in the general statistical sense is the degree of closeness of computations or estimates to the exact or true values that the statistics were intended to measure.
Reliability refers to the closeness of the initial estimated value to the subsequent estimated value.
3.1. The users (Relevance)
We assess the relevance of the collection analysing its users. We inquire several aspects such as who they are, what needs they have, whether they are satisfied, what is done to meet their needs.
Eurostat compiles EU natural gas and electricity prices according to
regulations (see chapter “Legal basis”). The Directive contains a defined list of variables, which reflect in particular the most relevant institutional users'
needs. Eurostat’s users are
the public and organizations, for comparison Researchers, for analysis
Media, for publications Policy users, for forecasting and decision-making.
The public uses our data for comparison purposes. They access our information directly or through reading articles written by the media.
Therefore, it is important that our data are comparable across Europe. Eurostat and national reporting authorities clarify potential differences in their country reports, which are available at the metadata section of
Eurostat’s Eurobase.
Researchers use our data for conducting their scientific analysis. To facilitate them, we provide data tables and bulk download features in our database. We clarify the definitions for each statistical flow and we strive to maintain a
long time series, despite potential methodological changes that could lead to break of series.
Eurostat has regular meetings with the main policy users of natural gas and electricity prices statistics, and discuss the users’ needs in its bi-annual
Energy Statistics Working Group (ESWG) meetings. At EU level, Eurostat revises its collections based on the feedback it receives from the policy
makers and makes them more relevant to their needs. Apart from that, Eurostat also launches regular general user satisfaction
surveys. However, these surveys are on all the data collected by Eurostat and the natural gas and electricity prices datasets are a very small portion of
it. It is therefore not possible to know the satisfaction of the users of these datasets. However, from the last satisfaction survey done in 2017, the level
of satisfaction with the overall quality of European data remained steadily

Relevance 3
Quality report of European Union statistics on electricity and natural gas prices 13
high, with 59.6% of all users considering the quality to be “very good” or
“good” and 20.7% considering it as “adequate”.
At national level: Many countries at their data quality reports consider Eurostat as the main user of their data. Therefore, they align their collection efforts to Eurostat’s
needs. They generally confirm that Eurostat’s needs are fully satisfied or mention the derogation they got for not transmitting the data required by
the regulation. Countries reported how other users’ use our data. Estonia that the website to
collect users’ needs. We expect that Estonia will be able specify the feedback the country collected.
Netherlands, Ireland and United Kingdom explained the needs from their users:
Netherland specified that a national average price would be easier to understand for basic users. This information is available for the annual
prices data. Ireland mentioned that an EU average price would be interesting. We
calculate it since 2019. United Kingdom reported that their user would like to have some more
disaggregation in the type of end users for the non-households sector.
Estonia, Lithuania, Romania, Slovakia and Slovenia conduct satisfaction
surveys on regular basis. France have a users’ committee meeting every 2 years. Sweden accepts suggestions by e-mail. United Kingdom operates a log of user requests.
3.2. Completeness
The focus of this report is on the reference year 2017 and 2018. For this period, Lichtenstein was unable to submit the requested data for 2018 and the natural gas prices for the second semester of 2017. Iceland failed to
submit the non-households electricity prices for the second semesters of both 2017 and 2018. Apart from that, some countries were derogated from
sending some of the data required by the regulation: Italy was derogated from sending
o the annual, more disaggregated prices for both natural gas and
electricity o for the reference years 2017 and 2018
Spain was derogated from sending o the semestrial price data for electricity o the annual, more disaggregated prices for both natural gas and
electricity o the annual consumption share per band for electricity
o for the reference years 2017 and 2018 Germany was derogated from sending
o the price data for consumer band I6 and IG, the last bands for
non-households sector for both natural gas and electricity o the annual, more disaggregated prices for both natural gas and
electricity

Relevance 3
Quality report of European Union statistics on electricity and natural gas prices 14
o for the reference years 2017 and 2018
Cyprus was derogated from sending o the annual, more disaggregated prices for electricity
o for the reference years 2017 Although these countries were officially derogated, they still sent, on
voluntary basis, some of the data points for which they were derogated.
Another aspect, which is relevant to completeness, concerns data we cannot publish for confidentiality reasons. While respecting the possibility of countries to declare their data as confidential, we should receive a valid
justification for the unpublished data.

Accuracy and reliability 4
Quality report of European Union energy statistics 15
3.3. Accuracy
Statistics can be different from the true values because of random variability
(the statistics change from implementation to implementation of the survey due to random effects) and/or bias (the average of the possible values of the statistics from implementation to implementation is not equal to the true
value due to systematic effects).
Several types of error, stemming from all survey processes, contribute to the error of the statistics (their bias and variability). A certain typology of errors is widely adopted in statistics. Sampling errors affect only sample surveys;
they are because only a subset of the population, usually randomly selected, is surveyed. Non-sampling errors affect sample surveys and complete
enumerations alike and comprise: Coverage errors are due to divergences between the target population
and the sample used. Possible divergence types are under-coverage (i.e. the sample does not cover all type of units of the target population), over-coverage (i.e. the sample includes units which do
not belong to the target population) and misclassification (i.e. the sample includes units which belong to the target population but are
wrongly classified). These errors can be estimated by comparing the sample with the target population.
Measurement errors are errors that occur during data collection and
cause the recorded values of variables to be different from the true ones. Their causes are commonly categorized as:
o Survey instrument: the form, questionnaire or measuring device used for data collection may lead to the recording of wrong values.
o Respondent: respondents may consciously or unconsciously, give erroneous information.
o Interviewer: interviewers may influence the answers given by respondents.
Processing errors are introduced at the stage of processing the data
collected by the surveys : coding, data entry, data editing, imputation, aggregations, etc.
Non-response errors is the difference between the statistics computed from the collected data and those that would be computed if there were no missing values. Indeed Non-response is the failure of a survey
to collect data on all survey variables, from all the statistical population.
In several countries data provision by the suppliers companies is required by law. However, it is not always the case and for countries without national
legislations, or for which the national legislation has not been updated yet to match the requirements of the regulation (EU) 2016/1952, it can pose a
challenge as regards data accuracy due to multiplication of data sources and the calculations / estimations that need to be performed in order to get the requested data.
The accuracy of the data calculated by Eurostat fully depends on the quality
of the national statistical systems and may vary from country to country.
Accuracy and reliability 4
Quality report of European Union statistics on electricity and natural gas prices 16
Countries with low consumption has less impact on the result of the
calculations. There is therefore a special focus on the accuracy of the biggest countries.
At national level In the present quality reporting exercise most countries reported Statistical
populations representing a very big portion of the target populations (>60%) and thus no or negligible sampling errors. Countries also reported low non-
response rates and while some countries mention that coverage errors can happen, they estimate their impact as negligible as it would concern a very limited number of units.
The only exception is for Germany that have a statistical population of 26%
for households electricity, 15% for non-households electricity and 16% both for households and non-households natural gas. Germany also reported a quite high non-response rate bringing even lower the sample used. (10.7%
for non-households electricity). There might be some sampling error for this country but they reported that they are not calculating it. On the bright side,
they reported a good coverage, especially for the households sector.
For the measurement errors, as shown in Annex X, the main cause for measurement errors are mistakes by the reporting suppliers while encoding their data in the questionnaires. Most of these errors, especially when they
are of high magnitude, are detected during the validation of the data and discussed with the data suppliers for corrections.
For the processing errors, as shown in Annex X, the main causes for processing errors are due to human mistakes in countries where the
processing is not automated. In countries where the processing is automated, there might have been some errors when setting up the system
but the errors were probably corrected after a couple of cycles. The tables in Annex 4 show the statistical populations, the non-response
rates, the sample used and which part of the system is automated for the electricity and natural gas data collections.
It should be noted that only France and Netherland reported that the coverage error can be higher for the highest or smallest bands. In practice,
the samples for the highest bands are small and the impact of one unit not reported in the right band is therefore bigger. This is true for all countries
and especially for the non-households sector. This raise the issue of the quality for the highest bands of the non-households sector. For the smallest bands, there can be some connexions not qualifying as the proper end-user.
For example, there can be alarm systems or lifts in the households surveys or households in the non-households surveys.
3.4. Reliability
3.4.1. Data revision policy
In relation to reliability, it must be stated that sometimes, it is unavoidable to revise initial data, because e.g. data providers did not send their data in

Accuracy and reliability 4
Quality report of European Union statistics on electricity and natural gas prices 17
time and therefore initial data contained estimates or because an
improvement in the methodology is implemented following the availability of new information.
However, revisions are sent sometimes very late without any apparent reason. These situations must be prevented by establishing a common
‘revision policy’. In general, countries expressed their agreement for a harmonised framework on revisions in energy statistics which is common to
all Member States, in line with the European Statistics Code of Practice. A regular revision analysis was also welcomed and the publication of a revision/release calendar was highly supported.
According to the main ESS quality standards that deal with revisions (ESS
Code of Practice and the ESS guidelines on revision policy for Principal European Economic Indicators (PEEIs)), revisions have to follow a standardised way, including an appropriate communication. Pre-
announcement of revisions is considered as one of the core principles of a revision policy. It contributes to transparency, better information and a
better coordination of the workload.
For these reasons, the Energy Statistics Working Group approved in October 2015 a revision policy for energy statistics. This document is available here. However, as this revision policy was approved before the new regulation
(EU) 2016/1952 was enforced. Therefore, it still mentioned the previous Directive 2008/92/EC for natural gas and electricity prices.
At national level The presence of revision policies or well-established revision practices at
national level is an indicator for transparency and better information to the users.
As can be observed in Annex 5, many countries do not have any revision policies covering the data collections. However, they do explain the normal
practice which is that they correct the data when mistakes are detected. Some of them mention that semester 1 data is automatically revised when
processing the semester 2.
Some countries Bulgaria, Cyprus, Malta and Luxembourg have no revision policy at all. A clear recommendation for these countries is to develop their revision policy that should be consistent with the one adopted at European
level.
3.4.2. Data revision analysis
Eurostat revise the data as soon as a revision is sent by a country provided
that it is justified and correctly validated. At national level
For the purpose of the analysis, Eurostat prefilled the section 17.2.1 of the national quality reports with the datasets that have been revised and ask for
an explanation and an estimation of the magnitude. A dataset is considered as revised if a new transmission was made more than 5 months after the

Accuracy and reliability 4
Quality report of European Union statistics on electricity and natural gas prices 18
reference period. This correspond to the deadline that Eurostat have to
publish the data. If a transmission is done before that date, it is considered as a correction and most often triggered from the validation questions that
Eurostat send to the countries. As it can be seen in Annex 6, Revisions happen often for semester 1 when
the countries submit the more detailed data for semester 2 and the whole year. They also happen when the country receive updated data from one of
its data provider. Finally, in 2017 and 2018, there were also revisions due to the adjustments in the methodologies. This can happen in the first couple of years of reporting new data. These kind of revisions should appear less
frequently in the future.
If the need to revise data is recurrent, countries should analyse their data collections and decide on the need to adapt their national statistical systems
to provide data that are more accurate within the requested deadline.
3.4.3. Average size of revisions and data stability
In Eurostat, it is not possible to do a detailed revision analysis on the number of data points that have changed and the magnitude of the changes
as our internal databases is not storing each version of the data points received. However, from Eurostat’s experience, revisions that are not due to
adjustments in the methodologies or obvious errors are generally minor confirming the low sample errors at the country level and negligible on the EU aggregate level.
At national level
We requested the countries to comment on the magnitude of the changes but none provided such feedback. This is probably because they also don’t store each version of the data points in a dedicated database. The analysis
would then be manual and would require a huge amount of time that is not worth the benefit.

Timeliness and punctuality 5
Quality report of European Union energy statistics 19
4. TIMELINESS AND PUNCTUALITY
Timeliness describes the length of time between data availability and the
event or phenomenon they describe. Punctuality is the time lag between the actual delivery of data and the
target date on which they were scheduled for release as announced in an official release calendar, laid down by Regulations or previously agreed among partners.
4.1. Timeliness and punctuality
The legal deadline for Eurostat to publish the data is 5 months after the reference period.
For 2017 Semester 1, the data was published on the 22/11/2017. For 2017 Semester 2, the data was published on the 28/5/2018. However, due to IT issues, the more disaggregated annual data was
released only on the 1st of August (see explanation below). For 2018 Semester 1, the EU aggregates were published on the
17/10/2018. For 2018 Semester 2, the EU aggregates were published on the
25/4/2019.
For the second semester of 2017, Eurostat decided to change its internal
database and develop an automatic loading of the data from the questionnaires. Eurostat also changed the structure of the external database (Eurobase). For that, Eurostat had to develop new questionnaires, the whole
processing in the new internal database and agree on some mapping codes. Unfortunately, the IT system was not ready on time for the publication of the
annual data (submitted only with Semester 2). Starting in reference year 2018, thanks to the improvement of the new
internal database and the development of a validation tool, Eurostat publishes the country data as soon as their questionnaires are successfully
validated. This generally takes only few days after we receive a new transmission but can depend on the workload. However, the EU aggregates can be disseminated only when all countries have their data validated.
The second semesters of each year, includes much more disaggregated
annual data. These cycles are more complicated in term of data collection and validation and we expect these cycles to have a worse timeliness than
the first semesters of each year. Finally, it should be noted however that while Eurostat used to submit the
data very close to the deadline for 2017 (or even after the deadline for the annual data of 2017) and the years before, it submitted the data more than
a month before its deadline for 2018 and plans to improve even further its timeliness. However, this can be done only if the timeliness of the slowest country improve.
At national level
Countries have a deadline of 3 months after the reference period to submit their data. This means 92 days for the data of the first semesters (31 for July
Timeliness and punctuality 5
Quality report of European Union statistics on electricity and natural gas prices 20
+ 31 for August + 30 for September) and 90 days for the data of the second
semesters (31 for January + 28 for February + 31for March).
Annex 7 shows the timeliness of the countries. Questionnaires sent after the deadline are shown in red and the first questionnaire sent for each dataset are shown in green. As it can be seen, the timeliness has improved in most
of the countries. Only 68% of the questionnaires have been submitted on time for 2017 while it reaches 84% for 2018. In addition, for both semesters
of 2018, the deadlines happened on Sundays and several countries submitted their data only on the next Monday, 1 day after their deadline.
When a deadline is on a non-working day, the country should still ensure that the data is submitted before.
Since late submissions do not always come from the same countries,
Eurostat cannot target its efforts to improve punctuality on a reduced number of countries.
Similarly to the fact that Eurostat’s timeliness is highly dependent on the countries’ timeliness, the countries’ timeliness is also highly dependent on
the providers’ timeliness. The deadlines that the countries give to their provider can be shown in Annex 8. It is quite early in many countries but
they are often not enforced by a regulation and therefore, providers might send the data late.
Having well specified regulations with the required data and the deadline for sending the data is highly recommended.
Punctuality is the difference between the deadline and the actual date of
transmission.. Annex 9 is the same table as in Annex 7 but with the deadlines subtracted. It makes it easier to see the magnitude of the delay or
the advance.
4.2. Corrections
The timeliness and punctuality refers to the first transmission of the data. However, this first version of the data need to be validated by Eurostat and
this process often triggers validations questions that are sent to the countries. Countries have then the possibilities to give explanations and/or correct the data.
Eurostat consider as corrections, the new transmissions received shortly
after the first version of the data. Eurostat used a threshold of 5 months after the reference period corresponding to Eurostat’s deadline for the dissemination of the data. After that period, the new transmissions are
considered as revisions of the data and not corrections anymore.
As for the revisions, Eurostat correct the country data as soon as the new transmission is successfully validated.
At national level

Timeliness and punctuality 5
Quality report of European Union statistics on electricity and natural gas prices 21
Annex 10 show the number of corrections that the countries made for each
dataset.
The second semester of each year includes much more disaggregated annual data. Eurostat is then able to check the consistency between this annual data and the semestrial data leading to validation questions that are more
sophisticated. This explain the high amount of corrections for that semester. It is also during this consistency check that Eurostat discover issues in the
data of the first semester leading to revisions of that semester. It can also be noted that the data for 2017 had 89 corrections (for 74
different questionnaires) while for 2018, there were only 67 corrections (for 51 different questionnaires). The high number of corrections is expected
during the first cycles of a new data collection. Countries need to understand the rules and adapt their systems. The number of corrections should decrease further in the following years.
It should also be pointed out that only Lithuania and Slovakia had no
corrections at all. These 2 countries also submitted all their questionnaires on time. For Annex 6, it can be seen also that Lithuania also did not have
any revisions while Slovakia had to revise 3 of their submissions due to improved calculations
In order to decrease the number of corrections, clear instructions / procedures on the validation checks that are to be carried out at each level
(countries and Eurostat) should be created. It would allow to know whether a certain aspect of data quality needs to be improved before submitting the
questionnaires. Reporting instructions are available on Eurostat’s website but need to be updated with the latest developments done in Eurostat in term of methodology and validation checks.
Finally, Annex 11 shows the number of days between the first transmission
and the last correction of the data. The corrections that arrived after the countries’ deadline for transmission are shown in red. Unfortunately, as
many countries submit their questionnaires very close to the deadline, this does not allow any time for potential corrections.
For 2017, the average number of days between the first version and the last correction was 24.3 days while it decreased to 14.6 days for 2018 data. This
can be explained by Eurostat’s efforts to validate faster the transmissions received, thanks to the validation tool that have been developed, and maybe also by the countries’ efforts to answer our questions faster.
Recommendation for countries and Eurostat. The validation of the data
received should be done as soon as possible.

Accessibility and clarity 6
Quality report of European Union energy statistics 22
5. ACCESSIBILITY,CLARITY, COHERENCE AND COMPARABILITY
According to the European Statistics Code of Practice, European statistics
should be presented in a clear and understandable form, disseminated in a suitable and convenient manner, available and accessible on an impartial
basis with supporting metadata and guidance.
Accessibility and clarity refer to the simplicity and ease, the conditions and modalities by which users can access, use and interpret statistics, with the appropriate supporting information and assistance: a global context
which finally enables them to make optimum use of the statistics. Coherence measures the adequacy of the statistics to be combined in
different ways and for various uses. Comparability is a measurement of the impact of differences in applied statistical concepts, measurement tools and procedures where statistics are
compared between geographical areas or over time.
5.1. Accessibility
Accessibility is determined by the physical conditions by means of which
users obtain data: where to go, how to order, delivery time, pricing policy, marketing conditions (copyright, etc.), availability of micro or macro data, various formats (paper, files, CD-ROM, Internet, etc.).
It is important to highlight that all data published by Eurostat in the field of
energy statistics are available in the Eurostat website and are free for non-commercial and commercial purposes, as long as Eurostat is properly referenced.
For experienced and professional users, the whole output as regards energy
data collections can be accessed through the Internet, using the open access Eurostat database 6(Eurobase). This tool allows for customised downloads, where users can select the required indicators, countries, time series,
products and units. Through direct queries, customized tabulations of energy statistics results are available to users in electronic format.
For occasional users, articles with the most relevant information are published and kept up-to-date in electronic format in Statistics Explained
articles7. Press releases are also published when new relevant data becomes available. Additionally, the pocketbook "Energy, transport and environment
indicators", published on a yearly basis, is accessible free of charge via the Eurostat webpage and also contains information on the natural gas and electricity prices.
Furthermore, the prices of natural gas and electricity is now also accessible
through an interactive tool ENPRICES: https://ec.europa.eu/eurostat/cache/infographs/energy_prices/enprices.html
6 https://ec.europa.eu/eurostat/web/energy/data/database
7 Electricity: https://ec.europa.eu/eurostat/statistics-explained/index.php/Electricity_price_statistics
Natural gas: https://ec.europa.eu/eurostat/statistics-explained/index.php/Natural_gas_price_statistics

Accessibility and clarity 6
Quality report of European Union statistics on electricity and natural gas prices 23
At national level The way countries disseminate their data is already discussed in section 2.3
and shown in Annex 2.
5.2. Clarity
In addition to the legal act and its three implementing acts, Eurostat provides reporting instructions8. This manual has been created before the
new data collection started and should now be updated with the latest developments in the methodology and the validation checks.
Moreover, Eurostat also provide a complete metadata / quality report structure. This piece of information should also be updated with the
information provided by the countries in this quality report exercise.
Recommendation for Eurostat: update the reporting instructions and the metadata / quality report
At national level, As can be seen in Annex 13, apart from internal guidelines for the data
compilers or documentation provided by Eurostat, few countries have documentations on their data. This can be explained by the fact that few of
them are actually publishing the data themselves. However, as part of this quality reporting cycle, all EU member states have
submitted their quality reports. The new structure used for the quality reports (SIMS) regroups the information provided by the previous structures
ESMS (European Statistics Metadata Structure) and ESQRS (European Statistics Quality Report Structure). This means that this new structure is a much more complete structure. Eurostat have validated and published these
quality reports. At the time of writing, only two of them are still pending for validations questions.
8 https://ec.europa.eu/eurostat/web/products-manuals-and-guidelines/-/KS-GQ-16-106

Annexes
Quality report of European Union energy statistics 24
5.3. Coherence
There is no other domain comparable to natural gas and electricity prices, the coherence cross domain is therefore not applicable.
However, for the internal coherence (or the sub-annual and annual statistics coherence) Eurostat ensure that the semestrial prices are coherent with the annual prices.
At national level
Only France mention that there might be some incoherence between the annual and semestrial prices due to the fact that they do not allow their providers to revise the data for semester 1 when submitting the data for
semester 2. They however mention that they intend to allow the revision in the future.
In practice, however, Eurostat did not notice any problem for France but did notice issues for other countries. The justification given at that time was that
different suppliers were surveyed for the semester 1 data than for the semester 2 data.
It can be understood from the reports that the countries ask for the annual, more disaggregated data, only with the semester 2 cycle, as it need to be
reported only during this cycle. However, in order to construct the semestrial prices, the data providers need the disaggregated data. In order to avoid the
problem of coherence, it would be better to request the disaggregated data for both semesters and reconstruct the semestrial prices and annual prices from that data.
5.4. Comparability – geographical
There is no same statistical variable that are reported by different countries. Each country reports its own data that is reported by no other countries. The data from different countries can still be compared but there is no special
conclusion to get from this apart from the fact that some countries are cheaper than others.
At national level
The same applies. Generally, the data collected is representing the whole country and if a comparison between regions would be possible, it would only shows that some regions are cheaper than others.
5.5. Comparability – over time
Eurostat collects the electricity and natural gas prices in the format described in section 2.2 since 2007. However, it was only on voluntary bases for the households data. The households data became mandatory for the reference
year 2017. Before 2007, Eurostat also collected prices of electricity and natural gas but using different bands.
Comparability and coherence 7
Quality report of European Union statistics on electricity and natural gas prices 25
At national level Although households data was not mandatory prior to 2017, most member
states already provided their data (on voluntary basis) from 2007 semester 2. Some few member states also provided 2007 semester 1.
In their quality reports, Countries have mentioned even longer time series but previous transmission were in a different format using different
definitions for the bands.

Annexes
Quality report of European Union energy statistics 26
8. SUMMARY
From Annex 1, most of the reporting countries transferred EU legislation on
prices to national level. The exceptions are Bulgaria, Estonia and Lithuania. From Annex 2, national data collections are mostly bi-annual. Most of the countries use electronic means for their collections.
Countries disseminate their data on national level. However, publications, databases availability and documentation on methodology are not
everywhere available (Annex 3). Reporting countries apply a revision policy similar with Eurostat. Bulgaria, Cyprus, Malta and Luxembourg have no revision policy at all. (Annex 5).
Reporting countries were able to provide their data on time. We observed only minor delays. Annex 9 provides an overview of punctuality. The
numbers for each reporting country indicate the delays. Values below zero show earlier submissions.
We observe that punctuality improved in 2018. More countries were able to
deliver their data on time. It is a very good practise that Sweden and Czech Republic transmitted their data much in advance.

Annexes
Quality report of European Union energy statistics 27
9. CONCLUSIONS AND RECOMMENDATIONS
The various analyses carried out in this report allow us to draw some
conclusions and propose recommendations at different levels:
For Eurostat:
Recommendation for countries and Eurostat. The validation of the data received
should be done as soon as possible.
Recommendation for Eurostat: update the reporting instructions and the metadata /
quality report.
For countries:
Although many countries have regulations or agreement in place, countries have often
difficulties to enforce their data suppliers to submit the data on time. It is advised to
specify in the national regulations which data is mandatory and the deadline that need
to be respected, including sanctions in case of non-compliance.
If the suppliers have the data, we advise to request all the data needed from them. The
other data sources can still be used to validate the data reported by the suppliers.
Some countries Bulgaria, Cyprus, Malta and Luxembourg have no revision policy at
all. A clear recommendation for these countries is to develop their revision policy that
should be consistent with the one adopted at European level.
If the need to revise data is recurrent, countries should analyse their data collections
and decide on the need to adapt their national statistical systems to provide data that
are more accurate within the requested deadline.
When a deadline is on a non-working day, the country should still ensure that the data
is submitted before.
Having well specified regulations with the required data and the deadline for sending
the data is highly recommended.
In order to decrease the number of corrections, clear instructions / procedures on the
validation checks that are to be carried out at each level (countries and Eurostat) should
be created. It would allow to know whether a certain aspect of data quality needs to be
improved before submitting the questionnaires. Reporting instructions are available on
Eurostat’s website but need to be updated with the latest developments done in
Eurostat in term of methodology and validation checks.
Recommendation for countries and Eurostat. The validation of the data received
should be done as soon as possible.

Annexes
Quality report of European Union energy statistics 28
ANNEX 1
Table 1. Overview of national legal framework covering EU data requirements
Annex
11 Annex
Quality report of European Union energy statistics 29
Countr
y
Applicable legal texts at national level in the area of energy statistics
AT Electricity Statistics Ordinance 2016
Natural Gas Statistics Ordinance 2017
BE Royal decree (6 January 2019) on the organisation of the data collection for the
establishment of statistics on gas, electricity and heat balance and the
establishment of price statistics on gas and electricity.
BG No legal acts and other agreements at national level.
CY Statistics Law, No. 15 (I) of 2000
CZ Act No. 89/1995 Coll. on the state statistical service, was amended by Act No.
220/2000 Coll., Act No. 411/2000 Coll., and Act No. 230/2006 Coll.
DE Gesetz über die Preisstatistik (PreisStatG): Gesetz über die Preisstatistik in der im
Bundesgesetzblatt Teil III, Gliederungsnummer 720-9, veröffentlichten bereinigten
Fassung, das zuletzt durch Artikel 1 des Gesetzes vom 10. Dezember 2019 (BGBl.
I S. 2117) geändert worden ist
In English: Act on Price Statistics
DK Electricity supply act 2018/1009 of 27 June 2018
Gas supply act 2018/1127 of 5 September 2018
EE
EL Greek Statistical Law No 3832/2010, as in force
ES Untranslated versión of Spanish regulation (Order ITC/606/2001, de 16 de
marzo) that constitutes the Institutional Mandate at national level
FI Finnish Statistics Act (280/2004)
FR Visa No. 2019S052EQ from the Minister of the Economy and Finance, valid for the
year 2019.
HR The Official Statistics Act (Official Gazette, No 12/13 - consolidated text)
Programme of Statistical Activities of the Republic of Croatia 2018-2020 (Official
Gazette, No 31/2018)
Annual Implementation Plan of Statistical Activities of the Republic of Croatia for
2019 (Official Gazette, No 19/2019)
HU 11/2017. (VIII. 25.) MEKH decree on the data reporting obligations
IE National Law on energy prices S.I. No. 578/2014 - European Communities
(Reporting of Electricity and Natural Gas Prices charged to Industrial Customers)
Regulations 2014
IT Law 14 November 1995, n. 481/95
ARERA Resolution ARG/elt 167/08 of December 1st, 2008
ARERA Resolution ARG/gas 64/09 of May 29th, 2009 and subsequent amendments
LT There is no national legislation.
LU Law of 10 juillet 2011 presenting STATEC and its missions
LV Statistics Law (in force since 04 June 2015).
Regulation of the Council No 763 "Official Statistics Programme for 2018–2020".
MT Subsidiary Legislation 423.01 Electricity Supply Regulations
NL Statistics Netherlands Act, Effective from 01 January 2017
PL Annual Regulation of the Council of Ministers regarding Programme of Statistical Surveyes of Public
Statistics: http://prawo.sejm.gov.pl/isap.nsf/DocDetails.xsp?id=WDU20160001426 (for
2017), http://prawo.sejm.gov.pl/isap.nsf/DocDetails.xsp?id=WDU20170002471 (for 2018), http://prawo.sejm.gov.pl/isap.nsf/DocDetails.xsp?id=WDU2018000
2103 (for 2019 - in force).

Annexes
Quality report of European Union energy statistics 30
ANNEX 2
Table 2. Overview of national processing means
Country Data Sources Frequency Mean
AT
Suppliers and
network
operators
Bi-annual Excel questionnaire
BE
Suppliers and
administrative
data for taxes
Bi-annual Questionnaire
BG
Suppliers and
network
operators for
electricity
Bi-annual Excel questionnaire and e-
CY Supplier Bi-annual Excel questionnaire
CZ
Suppliers and
administrative
data for regulated
prices
Monthly for electricity, quarterly
natural gas and non-households
electricity, and yearly for number
of consumers
Excel, pdf and web
questionnaire + e-mail
DE Supplier Bi-annual
Excel questionnaire and e-
mail or paper version send
by post or fax
DK
Suppliers and
administrative
data
Bi-annual
Excel for households and
online platform for non-
households electricity
EE Supplier Bi-annual PDF questionnaires
EL Supplier Bi-annual and yearly for the
components Eurostat's questionnaire
ES Supplier Bi-annual for electricity and
quarterly for natural gas
XML questionnaire sent
through online system for
electricity and excel
questionnaire for natural gas
FI
Suppliers and
administrative
data for network
prices (regulated)
Monthly for electricity and bi-
annual for natural gas
Electronique questionnaire
similar to Eurostat's
FR
Suppliers and
administrative
data
Bi-annual Online survey
HR Supplier Bi-annual Questionnaire
HU
Suppliers and
network
operators
Monthly Excel questionnaires
IE Supplier Bi-annual Excel questionnaire via e-
IT Supplier Quarterly Web-based questionnaire (or
xml upload)
LT Supplier Bi-annual Questionnaire transmitted
via online system or e-mail
LU Supplier Bi-annual E-mail and postal format
LV
Suppliers and
network
operators
Bi-annual E-survey or report send by
MT Suppliers,
network Bi-annual
Questionnaire (only 1
suppliers, he does all the

Annex
11 Annex
Quality report of European Union energy statistics 31
operators and
administrative
data
job)
NL
Suppliers and
network
operators
Quarterly
Excel questionnaire from
suppliers and public data
from network companies
PL Supplier Bi-annual and quarterly Online survey
PT Supplier Bi-annual Eurostat's template and e-
RO Supplier Bi-annual for Electricity, Monthly
for natural gas Questionnaire uploaded
SE Supplier Bi-annual Online survey
SI Supplier Quarterly Online survey
SK
Suppliers and
administrative
data
Bi-annual PDF questionnaires
UK Supplier Quarterly
Excel questionnaire similar
to Eurostat's + email or
portal
Annexes
Quality report of European Union energy statistics 32
ANNEX 3
Table 3. Overview of national publications
Country Publications Database Documentation
on
methodology
Access to
microdata AT yes (for Elec) yes
BE yes yes
BG yes yes
CY
CZ yes yes
DE yes
DK yes yes yes
EE yes yes
EL yes
ES yes
FI yes (for Elec) yes (for Elec) yes
FR yes yes yes yes
HR yes yes
HU yes
IE yes yes
IT
LT yes yes yes
LU yes
LV yes (for Elec) yes
MT
NL yes yes yes
PL yes yes
PT yes yes yes
RO
SE yes
SI yes yes yes
SK

Annexes
Quality report of European Union energy statistics 33
ANNEX 4
Table 4. Overview of national population sample for the electricity datasets

Annex
11 Annex
Quality report of European Union energy statistics 34
Electricity
Households Non-households Co
un
trie
s
Su
pp
liers
inclu
ded
in
the s
urvey
Po
pu
latio
n
rep
resen
ted
Un
it no
n-
resp
on
se
rate
Sam
ple
siz
e
(%
ag
e o
f
the
po
pu
latio
n)
Su
pp
liers
inclu
ded
in
the s
urvey
Po
pu
latio
n
rep
resen
ted
Un
it no
n-
resp
on
se
rate
Sam
ple
siz
e
(%
ag
e o
f
the
po
pu
latio
n)
Au
tom
ate
d
A
T
155 /
158
99.9
% 0.0%
99.9
%
170 /
172
99.7
% 0.0%
99.7
%
B
E 8 / 60
90.0
% 0.0%
90.0
% 17 / 60
90.0
% 0.0%
90.0
%
B
G 33 / 56
100.0
% 0.0%
100.0
% 56 / 56
100.0
% 0.0%
100.0
%
Calculatio
ns
C
Y 1 / 1
100.0
% 0.0%
100.0
% 1 / 1
100.0
% 0.0%
100.0
%
C
Z 3 / 50
60.0
% 0.0%
60.0
% 8 / 100
80.0
% 0.0%
80.0
%
D
E
22 /
1100
26.0
% 29.0%
18.5
%
20 /
1100
15.0
% 29.0%
10.7
%
D
K 38 / 42
99.1
% 1.0%
98.1
% 40 / 42
99.0
% 1.0%
98.0
% Fully
E
E 25 / 25
100.0
% 1.0%
99.0
% 55 / 55
100.0
% 1.0%
99.0
%
EL 15 / 16 97.0
% 0.0%
97.0
% 16 / 15
97.0
% 0.0%
97.0
%
E
S
45 /
400
93.8
% 35.6%
60.4
%
37 /
400
70.0
% 37.8%
43.5
%
FI 25 / 72 56.0
% 5.0%
53.2
% 25 / 72
50.0
% 5.0%
47.5
%
F
R 24 / 25
99.0
% 0.0%
99.0
% 34 / 36
95.0
% 0.0%
95.0
% Fully
H
R 9 / 12
100.0
% 0.0%
100.0
% 9 / 12
100.0
% 0.0%
100.0
%
H
U 91 / 91
100.0
% 0.0%
100.0
% 91 / 91
100.0
% 0.0%
100.0
%
IE 6 / 9 91.0
% 0.0%
91.0
% 8 / 12
99.0
% 0.0%
99.0
%
IT 480 /
662
89.0
% 20.0%
71.2
%
529 /
662
88.0
% 20.0%
70.4
%
LT 2 / 2 100.0
% 0.0%
100.0
% 11 / 23
90.0
% 0.0%
90.0
%
L
U 4 / 4
100.0
%
not
estimat
ed
? 5 / 5 100.0
%
not
estimat
ed
?
L
V 5 / 24
94.0
% 0.0%
94.0
% 5 / 24
89.0
% 0.0%
89.0
%
M
T 1 / 1
100.0
% 0.0%
100.0
% 1 / 1
100.0
% 0.0%
100.0
%
N
L 4 / 36
70.0
% 5.0%
66.5
% 6 / 48
70.0
% 5.0%
66.5
%
Most
operation
s

Annex
11 Annex
Quality report of European Union energy statistics 35
Table 5. Overview of national population sample for the natural gas datasets
Disclaimer:
Cyprus and Malta do not use natural gas. Finland does not use natural gas for the households sector.
Italy and Portugal (for natural gas) reported the suppliers’ non-
response rate instead of the units’ non-response rate. Some countries reported these values only for 1 of the 4 cycles.
There is a high probability of miss-interpretation of these concepts in the countries. Also the instructions could have been better.
Natural gas
Households Non-households Co
un
trie
s
Su
pp
liers
inclu
ded
in th
e
su
rvey
Po
pu
latio
n
rep
resen
ted
Un
it no
n-
resp
on
se r
ate
Sam
ple
siz
e
(%
ag
e o
f the
po
pu
latio
n)
Su
pp
liers
inclu
ded
in th
e
su
rvey
Po
pu
latio
n
rep
resen
ted
Un
it no
n-
resp
on
se r
ate
Sam
ple
siz
e
(%
ag
e o
f the
po
pu
latio
n)
Au
tom
ate
d
AT 48 / 49 99.9% 0.0% 99.9% 63 / 64 99.8% 0.0% 99.8%
BE 7 / 50 90.0% 0.0% 90.0% 16 / 50 90.0% 0.0% 90.0%
BG 17 / 18 100.0% 0.0% 100.0% 18 / 18 100.0% 0.0% 100.0% Calculations
CZ 3 / 50 60.0% 0.0% 60.0% 12 / 50 79.0% 0.0% 79.0%
DE 15 / 900 16.7% 26.0% 12.3% 20 / 900 24.0% 26.0% 17.8%
DK 13 / 14 99.0% 0.0% 99.0% 13 / 14 95.0% 0.0% 95.0%
EE 23 / 28 100.0% 0.0% 100.0% 27 / 28 100.0% 0.0% 100.0%
EL 8 / 9 93.0% 0.0% 93.0% 12 / 13 98.0% 0.0% 98.0%
ES 60 / 60 100.0% 33.0% 67.0% 48 / 48 100.0% 35.0% 65.0%
FI 5 / 25 85.0% 0.0% 85.0%
FR 14 / 14 99.0% 0.0% 99.0% 31 / 33 97.0% 0.0% 97.0% Fully
HR 44 / 46 98.0% 0.0% 98.0% 44 / 46 98.0% 0.0% 98.0%
HU 60 / 60 100.0% 0.0% 100.0% 60 / 60 100.0% 0.0% 100.0%
IE 5 / 8 95.0% 0.0% 95.0% 7 / 10 100.0% 0.0% 100.0%
IT 413 / 510 94.0% 20.0% 75.2% 423 / 510 94.0% 20.0% 75.2% Fully
LT 1 / 2 95.0% 0.0% 95.0% 3 / 5 90.0% 0.0% 90.0%
LU 4 / 4 100.0% Not
estimated ? 6 / 6 100.0%
Not
estimated ?
LV 7 / 10 99.0% 0.0% 99.0% 7 / 10 94.0% 0.0% 94.0%
NL 4 / 36 70.0% 5.0% 66.5% 6 / 48 70.0% 5.0% 66.5% Most
operations
PL 75 / 90 97.8% 16.7% 81.5% 75 / 90 89.3% 16.7% 74.4%
PT 17 / 21 100.0% 10.0% 90.0% 20 / 26 100.0% 10.0% 90.0%
RO 66 / 66 100.0% 0.0% 100.0% 74 / 74 100.0% 0.0% 100.0%
SE 4 / 4 100.0% 0.0% 100.0% 4 / 4 100.0% 0.0% 100.0%
SI 19 / 19 100.0% 0.0% 100.0% 19 / 19 100.0% 0.0% 100.0%
SK 18 / ? 100.0% 0.0% 100.0% 24 / ? 100.0% 0.0% 100.0%
UK 6 / 73 60.0% 0.0% 60.0% 8 / 90 65.0% 0.0% 65.0%

Annexes
Quality report of European Union energy statistics 36
ANNEX 5
Table 6. Overview of national revision policies and practice for electricity Coun
try 17.1 Data revision - policy 17.2 Data revision - practice
AT
Usually the last period will be
revised, if companies have sent new
data for this period in the meantime.
Data are revised if suppliers are
sending the prices after the deadline
or they are revising the prices. In
this case the revision is sent with the
next data transmission.
BE
Revision policy
There are 3 types of revisions :
1. Revisions of provisional
figures: carried out, according to
a predefined scheme, following the
availability of new (more complete)
figures.
2. Revisions as a consequence of
changes in methodology. (much less
frequent) (generally result in a
rupture of timeseries. Such revisions
can be necessited by: changes of
concepts, definitions, classifications
or de international norms ;
modification of a legal base ;
modification of methodology or
approach ; new data sources;
technical or managerial changes ;
actualisation of a reference weight
scheme.
3. Corrections of errors (errors in
survey or administrative data, wrong
hypotheses, calculation errors,
etc...) are ad hoc revisions.
A planning of revisions is established
conform the European legislation
andd the annual work programme.
At the same tame that semester
statistics are compiled there is
a relatively high probability of
revising the statistics of the previous
semester. This is because of the fact
that the actual data will always be
compared with the data of the
previous 2 semesters. If there would
have been undetected errors or
"arbitrary quality decisions" that are
not upheld in the following semester,
then the figures of the previous
semesters will be revised. The clear
advantage of this process is that the
information relevance of the actual
statistics will be enhanced if they can
be compared with previous data in a
reliable way.
BG No revision policy established for the
organisation regarding these data.
No planned revisions of data.
Unplanned revisions are made in
case of detecting different types of
errors - technical errors,
discrepancies with previous periods.
CY There is no revision policy. There is no schedule for revisions.
CZ
For general revision policy, see Key
documents
Data are final when first released
and are not subject to revision.
Preliminary data are not published.
All figures are final when first
published.
Not applicable.
DE
There are no regular data revisions,
because the results are covered
100% by the survey. Revisions are
only made, if obvious implausibilities
become obvious after data
disemmination.
There are no regular data revisions,
because the results are covered
100% by the survey. Revisions are
only made, if obvious implausibilities
become obvious after data
disemmination.
DK The data for the first semester are Data is revised in case of errors or

Annex
11 Annex
Quality report of European Union energy statistics 37
revised when submitting the data for
the second semester in order to
ensure consistency between
semestrial and annual prices.
new information.
EE
The data revision policy and
notification of corrections are
described in the dissemination policy
of Statistics Estonia at
https://www.stat.ee/dissemination-
policy.
The published data may be revised if
the methodology is modified, errors
are discovered, new or better data
become available.
EL
Whenever data is submitted as
provisional, a revision follows as
soon as the final data is available. In
case one or more data providers
submitt a revision, prices are
recalculated and submitted as soon
as it is possible and no longer than a
month after the change occurs. If
the revision refers to more than 2
semesters backwards, a
preannouncement takes place. When
necessary, the semester 1 data is
revised when submitting the
semester 2 data for consistency
reason between semestrial and
annual prices.
Revision practice is described in
S.17.1.
ES
Data revision is done internally.
There are two phases in which data
is revised. The first phase takes
place when raw data is
received from suppliers.
The processes and checks carried
out during this phase are described
in point "18 Statistical processing" of
this report, in particular point "18.4
Data validation". They can be
generally described as:
Completeness and validity check of
the information uploaded by each
supplier in PRICE
Manual check for inconsistencies and
outlier values in the data reported.
Manual comparisons with wholesale
market price evolution and with data
from previous reference periods.
Semester 1 data are revised when
submitting semester 2 data for
consistency reasons, which also
helps validate annual prices.
The second phase is related to the
processed data. Any calculations
associated with data processing are
double-checked by someone
different from the person who carries
out the procedure. Thus the final
output is validated before its
remission to Eurostat and
its release in any other forum as
As stated in point "17.1 Data
revision - policy" a series of checks
on data and the methods used to
process it are carried out
before price information is sent to
Eurostat. There are not any fixed
dates for these revisions since
suppliers will not always report
following a calendar.
Furthermore, there is another type
of revision carried out whenever a
supplier informs the Ministry of
errors in the data it has previsouly
submitted. These errors can take
place before or after the period for
data reporting is closed. If the period
is still open, the supplier only has to
upload the correct data. However, if
the period is closed then it has to
inform the Ministry of the error and
provide the correct data.
This error could even be detecteed
after the Kingdom of Spain has
sent to Eurostat its price report, and
therefore any corrections that would
have to be made would also be sent
to Eurostat, even if it is outside
Spain's deadline in relation to
Eurostat.

Annex
11 Annex
Quality report of European Union energy statistics 38
desrcibed in points 8 to 10 of this
report.
FI
Revisions in statistical data primarily
aims to guarantee the use of correct
data and ensure that erroneous data
are corrected as efficiently as
possible. Information on errors in
the statistics is also given (and
changed data are retained
permanently). In addition,
transparent correction procedures
help maintain users' confidence in
the producer of the statistics.
Statistic Finland’s revision policy is
described in Release guidelines.
The revisions are done in case of
value or content corrections. Usually
the changes are due to the data
sources. Occasionally the survey
respondents send corrections to the
data. The erroneous data observed
are corrected as promptly as
possible.
FR
We have informed suppliers that it
will be possible to modify the data
for the first semester when entering
the data for the second semester
and the annual. This will promote
coherence between half-year prices
and annual prices. As a result, online
Semester 1 questionnaires will be
automatically opened for online
collection during the second
semester collection.
Suppliers will have to revalidate the
online questionnaire of the first
semester during the collection of the
second semester with modifications
or not.
See 17.2.1
HR
A revision policy is covering this data
collection at national level. In case of
revision, the revised data is sent to
Eurostat. The semester 1 data are
revised when submitting the
semester 2 data for consistency
reason between semestrial and
annual prices.
Preliminary data is not published in
this survey so there is no data
revision.
HU
There is no systematic revision, if
needed, data is updated with the
next upload cycle.
The HEA collects full-scale
administrative data from its
licensees, which provide high quality
outputs. There was a complete
methodology supervision in 2013,
since then the forms have guidelines
for completing. This guidelines were
discussed with the data suppliers.
In 2018 (parallel with the
improvement of the Eurostat
methodology) the HEA made some
corrections in the methodology,
clarified some remaining questions
and initiated an additive reporting
obligatory for the DSO’s to improve
its report’s quality. So, there are 3
time series, which are not
comparable:
- before 2013 (partially

Annex
11 Annex
Quality report of European Union energy statistics 39
validated data)
- 2013-2017 (fixed
methodology)
- 2018 onwards (different
methodology on network costs and
taxes)
The settlements between the
participants of the electricity market
can be done up to after two months
of the reference period, they can
initiate self-revision on their reports.
The provided data is used several
parts of HEA, more colleagues check
the data and that is why the
clarification takes time. In every
reporting period HEA check the
previous data sets if there is any
changes and updates the reports.
IE
Data may be revised if a supplier
submits data after the deadline or
revises historic data. If possible,
Eurostat are informed of these
revisions and pre-announcements
are made.
Provisional data might be sent to
Eurostat in case not all electricity
suppliers have sent their micro data.
Final data is submitted to Eurostat
as soon as the dataset is complete.
IT
Semester n data are checked
immediately after the delivery of the
data.
Semester n-1 data are also revised
when submitting the semester n
data for consistency reason between
semestrial and annual prices.
Revisions are requested to the
suppliers immediately after the
delivery of the data, when data are
inconsistent with those previously
submitted or when the values are
very distant from the average
values.
LT
Statistics Lithuania’s revision policy
is provided in the document General
Principles behind the Performance,
Analysis and Announcement of
Revisions of Statistical Indicators.
The results published are final and
not revised later.
LU no data revision policy Revisions are applied in case of
calculation errors
LV
If errors are found, the primary data
are verified by contacting the
respective respondent and, if error is
approved, the data are corrected.
Historical data are reviewed
regularly. In practice, the data and
calculations on the previous periods
are checked when producing price
statistics for the current period.
Availability of new source data or
measurement error are the main
reasons for revisions.
MT No revision policy covering this data
collection at national level.
Semester 1 data are revised when
submitting the semester 2 data for
consistency reason between
semestrial and annual prices.
NL
There are no planned revisions for
this statistic and there is no written
policy for it. Unplanned revisions
occur when new insights and better
data cause time series to be revised.
These are to be pre-announced
internally and externally.
In 2016 a revision was implemented,
resulting in a revised time series
from 2009 onwards. New insights in
methods for calculation of taxes and
network prices have led to higher
quality of the output.
PL The semester 1 data are revised 1. Revision data by comparing with

Annex
11 Annex
Quality report of European Union energy statistics 40
when submitting the semester 2
data for consistency reason between
semestrial and annual prices.
data from previous reference period,
2. Revision data to ensure
consistency of annual data with data
from both semesters,
3. Revision data in case of some
changes (in source data, in
methodology of calculation).
PT
The main revisons result of new
information or data correction
provided by the operators.
Every time a revision occurs, a new
document (with the last revision
date) replaces the old version.
We make revision when the
operators send new information
changing the data sent.
RO
Data revision policy follow the
Revision Policy of the NIS Romania,
which represent one of the key
documents of the office. The same
revision policy is applied to all the
data released nationally and
transmitted to Eurostat.
Not applicable. We do not plan any
revision .
SE
The data is revised during semester
2.
Statistics Sweden has a revision
policy (in Swedish): link
The main reasons for revisions are
manual errors.
SI
Data on electricity prices become
final 3 months after the national
publication date (which is T+65 days
after the reference period). In that
time, data can be revised, since the
administrative database is still
opened for reporting units if any
data corrections are needed. These
revisions are planned. Data for the
last reporting time-period are being
flagged as temporary and then as
final when reporting for the next
time-period takes place.
Standard procedures applied for
revisions are available online in
document Methodological
explanations - revision of statistical
data.
Revisions are planned. Since the
administrative database is opened
and corrections of already reported
data are possible, revisions may
apply. Data from the last
reporting time-period become final
with the next (semestrial) reporting
time-period. If there are no revisions
made, SURS only reports data for
the last reporting time-period.
In the case of data revision for the 1
semester of 2017 data, revision was
needed because of the late data
correction by reporting units in
administrative database.
SK
Revisions are described in decision
ROZ-3/2018 The Revision Policy of
the SOSR.
The primary source of revisions are
new data received from reporting
units.
UK
In the questionnaires, during each
collection, we allow companies to
review the information they had
submitted in previous quarters and
query any large revisions with an
aim to determine the factors driving
these changes. We would then then
transmit substantial revisions to
Eurostat to ensure the most up to
date and accurate data are received.
Additionally, in terms of publication
of the data through our own release,
the revisions policy we abide by is
Revisions can occur for many
reasons, for example when new data
become available and suppliers
review past data provided, new
suppliers added to the sample etc.
Suppliers provide the domestic and
non-domestic natural gas and
electricity volume and value data,
both quarterly and annually. To
ensure that the annual data are
consistent with the combined
quarters, BEIS is adamant that the
suppliers review all of their

Annex
11 Annex
Quality report of European Union energy statistics 41
informed by UK Code of Practice
standards for reporting revisions. We
also publish revisions as soon as
feasible following the identification of
the error. The Department for
Business, Energy and Industrial
Strategy's statistical revisions policy
is avaliable here:
https://www.gov.uk/government/pu
blications/beis-standards-for-official-
statistics/statistical-revisions-policy
previously provided quarterly data.
In some instances semestrial data is
revised when there are
inconsistencies with annual figures.
There were revisions to the semester
1 2018 prices which comprise of
quarter 1 and 2 of that year, for
households and non-households.

Annex
11 Annex
Quality report of European Union energy statistics 42
Table 7. Overview of national revision policies and practice for natural gas Count
ry 17.1 Data revision - policy 17.2 Data revision - practice
AT
Usually the last period will be
revised, if companies have sent new
data for this period in the meantime.
Data are revised if suppliers are
sending the prices after the deadline
or they are revising the prices. In
this case the revision is sent with the
next data transmission.
BE
There are 3 types of revisions :
1. Revisions of provisional
figures: carried out, according to
a predefinid scheme, following the
availability of new (more complete)
figures.
2. Revisions as a consequence of
changes in methodology. (much less
frequent) (generally result in a
rupture of timeseries. Such revisions
can be necessitaed by: changes of
concepts, definitions, classifications
or de international norms ;
modification of a legal base ;
modification of methodology or
approach ; new data sources;
technical or managerial changes ;
actualisation of a reference weight
scheme.
3. Corrections of errors (errors in
survey or administrative data, wrong
hypotheses, calculation errors,
etc...) are ad hoc revisions.
A planning of revisions is established
conform the European legislation
andd the annual work programme.
At the same time that semester
statistics are compiled there is
a relatively high probability of
revising the statistics of the previous
semester. This is because of the fact
that the actual data will always be
compared with the data of the
previous 2 semesters. If there would
have been undetected errors or
"arbitrary quality decisions" that are
not upheld in the following semester,
then the figures of the previous
semesters will be revised. The clear
advantage of this process is that the
information relevance of the actual
statistics will be enhanced if they
can be compared with previous data
in a reliable way.
BG No revision policy is established for
the organisation regarding this data.
No planned revisions of data.
Unplanned revisions are made in
case of detecting different types of
errors - tehnical errors,
discrepancies with previous periods.
CZ
For general revision policy, see Key
documents
Data are final when first released
and are not subject to revision.
Preliminary data are not published.
All figures are final when first
published.
Data for natural gas non-households
for the whole year 2017 were
corrected.
DE
There are no regular data revisions,
because the results are covered
100% by the survey. revisions are
only made, if obvious implausibilities
become obvious after data
disemmination.
There are no regular data revisions,
because the results are covered
100% by the survey. revisions are
only made, if obvious implausibilities
become obvious after data
disemmination.
DK
Data for the first half year are
revised when submitting the data for
the second half year in order to
ensure consistency between
semestrial and annual prices.
Data is revised in case of errors or
new information.
EE The data revision policy and The published data may be revised if

Annex
11 Annex
Quality report of European Union energy statistics 43
notification of corrections are
described in the dissemination policy
of Statistics Estonia at
https://www.stat.ee/dissemination-
policy.
the methodology is modified, errors
are discovered, new or better data
become available.
EL
Whenever data is submitted as
provisional, a revision follows as
soon as the final data is available. In
case one or more data providers
submitt a revision, prices are
recalculated and submitted as soon
as it is possible and no longer than a
month after the change occurs. If
the revision refers to more than 2
semesters backwards, a
preannouncement takes place. When
necessary, the semester 1 data is
revised when submitting the
semester 2 data for consistency
reason between semestrial and
annual prices.
Revision practice is described in
S.17.1.
ES
Data is revised only if new relevant
information is submitted by relevant
retailers after the submission
deadline with a sensible impact on
average price.
Version 3 of the natural gas price
questionnaire for non-households for
the 1st semester of 2017 was
sent 171 days after the reference
period. Revision affected gas prices
for I3, I4 and I6 bands due to new
prices received and corrected after
submission deadline.
FI
Revisions in statistical data primarily
aims to guarantee the use of correct
data and ensure that erroneous data
are corrected as efficiently as
possible. Information on errors in
the statistics is also given (and
changed data are retained
permanently). In addition,
transparent correction procedures
help maintain users' confidence in
the producer of the statistics.
Statistic Finland’s revision policy is
described in Release guidelines.
The revisions are done in case of
value or content corrections. Usually
the changes are due to the data
source. The erroneous data observed
are corrected as promptly as
possible. The most common reasons
for the correction are measurement
errors due to the specific reporting
unit (i.e. price data shall exclude use
in electricity and CHP generation of
power plants and use for non-energy
purposes).
FR
We have informed suppliers that it
will be possible to modify the data
for the first semester when entering
the data for the second semester
and the annual;
this will promote coherence between
half-year prices and annual prices.
As a result, online Semester 1
questionnaires will be automatically
opened for online collection during
the second semester collection.
Suppliers will have to revalidate the
online questionnaire of the first
semester during the collection of the
second semester with modifications
or not.
See 17.2.1

Annex
11 Annex
Quality report of European Union energy statistics 44
HR
A revision policy is covering this data
collection at national level. In case of
revision, the revised data is sent to
Eurostat. The semester 1 data are
revised when submitting the
semester 2 data for consistency
reason between semestrial and
annual prices.
Preliminary data is not published in
this survey so there is no data
revision.
HU
There is no systematic revision, if
needed, data is updated with the
next upload cycle.
The HEA collects full-scale
administrative data from its
licensees, which provide high quality
outputs. There was a complete
methodology supervision in 2013,
since then the forms have guidelines
for completing. This guidelines were
discussed with the data suppliers.
So, there are 2 time series, which
are partially comparable:
- before 2013 (not validated
data)
- 2013-2018 (fixed
methodology)
The settlements between the
participants of the electricity market
can be done up to after two months
of the reference period, they can
initiate self-revision on their reports.
The provided data is used several
parts of HEA, more colleagues check
the data and that is why the
clarification takes time. In every
reporting period HEA check the
previous data sets if there is any
changes and updates the reports.
IE
Data may be revised if a supplier
submits data after the deadline or
revises historic data. If possible,
Eurostat are informed of these
revisions and pre-announcements
are made.
Provisional data might be sent to
Eurostat in case not all natural gas
suppliers have sent their micro data.
Final data is submitted to Eurostat
as soon as the dataset is complete.
IT
Revisions are requested to the
suppliers immediately after the
delivery of the data, when data are
inconsistent with those previously
submitted or when the values
are very distant from the average
values.
Revisions are requested to the
suppliers immediately after the
delivery of the data, when data are
inconsistent with those previously
submitted or when the values
are very distant from the average
values.
LT
Statistics Lithuania’s revision policy
is provided in the documentGeneral
Principles behind the Performance,
Analysis and Announcement of
Revisions of Statistical Indicators.
The results published are final and
not revised later.
LU no data revision policy Revisions are applied in case of
calculation errors
LV
If errors are found, the primary data
are verified by contacting the
respective respondent and, if error is
approved, the data are corrected.
Historical data are reviewed
regularly. In practice, the data and
calculations on the previous periods
are checked when producing price
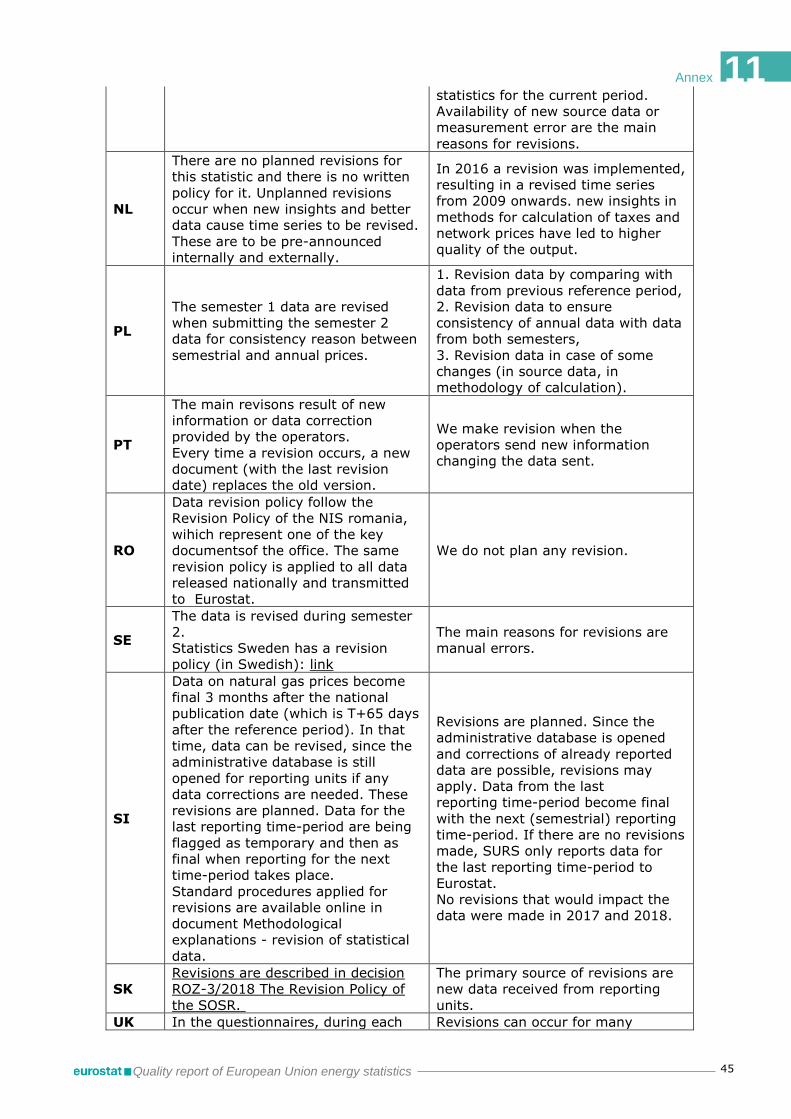
Annex
11 Annex
Quality report of European Union energy statistics 45
statistics for the current period.
Availability of new source data or
measurement error are the main
reasons for revisions.
NL
There are no planned revisions for
this statistic and there is no written
policy for it. Unplanned revisions
occur when new insights and better
data cause time series to be revised.
These are to be pre-announced
internally and externally.
In 2016 a revision was implemented,
resulting in a revised time series
from 2009 onwards. new insights in
methods for calculation of taxes and
network prices have led to higher
quality of the output.
PL
The semester 1 data are revised
when submitting the semester 2
data for consistency reason between
semestrial and annual prices.
1. Revision data by comparing with
data from previous reference period,
2. Revision data to ensure
consistency of annual data with data
from both semesters,
3. Revision data in case of some
changes (in source data, in
methodology of calculation).
PT
The main revisons result of new
information or data correction
provided by the operators.
Every time a revision occurs, a new
document (with the last revision
date) replaces the old version.
We make revision when the
operators send new information
changing the data sent.
RO
Data revision policy follow the
Revision Policy of the NIS romania,
wihich represent one of the key
documentsof the office. The same
revision policy is applied to all data
released nationally and transmitted
to Eurostat.
We do not plan any revision.
SE
The data is revised during semester
2.
Statistics Sweden has a revision
policy (in Swedish): link
The main reasons for revisions are
manual errors.
SI
Data on natural gas prices become
final 3 months after the national
publication date (which is T+65 days
after the reference period). In that
time, data can be revised, since the
administrative database is still
opened for reporting units if any
data corrections are needed. These
revisions are planned. Data for the
last reporting time-period are being
flagged as temporary and then as
final when reporting for the next
time-period takes place.
Standard procedures applied for
revisions are available online in
document Methodological
explanations - revision of statistical
data.
Revisions are planned. Since the
administrative database is opened
and corrections of already reported
data are possible, revisions may
apply. Data from the last
reporting time-period become final
with the next (semestrial) reporting
time-period. If there are no revisions
made, SURS only reports data for
the last reporting time-period to
Eurostat.
No revisions that would impact the
data were made in 2017 and 2018.
SK
Revisions are described in decision
ROZ-3/2018 The Revision Policy of
the SOSR.
The primary source of revisions are
new data received from reporting
units.
UK In the questionnaires, during each Revisions can occur for many

Annex
11 Annex
Quality report of European Union energy statistics 46
collection, we allow companies to
review the information they had
submitted in previous quarters and
query any large revisions with an
aim to determine the factors driving
these changes. We would then then
transmit substantial revisions to
Eurostat to ensure the most up to
date and accurate data are received.
Additionally, in terms of publication
of the data through our own release,
the revisions policy we abide by is
informed by UK Code of Practice
standards for reporting revisions. We
also publish revisions as soon as
feasible following the identification of
the error. The Department for
Business, Energy and Industrial
Strategy's statistical revisions policy
is avaliable here:
https://www.gov.uk/government/pu
blications/beis-standards-for-official-
statistics/statistical-revisions-policy
reasons, for example when new data
become available and suppliers
review past data provided, new
suppliers added to the sample etc.
Suppliers provide the domestic and
non-domestic natural gas and
electricity volume and value data,
both quarterly and annually. To
ensure that the annual data are
consistent with the combined
quarters, BEIS is adamant that the
suppliers review all of their
previously provided quarterly data.
In some instances semestrial data is
revised when there are
inconsistencies with annual figures.
Revisions to the semester 1 2018
prices which comprise of quarter 1
and 2 of that year, for households
and non-households. There were no
revisions to the household gas prices
for that semester.
Following contact with one company
in 2019 we found that there was a
misclassification between non-
domestic and domestic data that
prompted a revision to both the
semester 1, 2 and annual files.
Disclaimer: Cyprus and Malta do not use natural gas. Finland does not use natural
gas for the households sector.

Annexes
Quality report of European Union energy statistics 47
ANNEX 6
Table 8. Overview of national revisions for electricity
Country Number of revisions
revisions with reasons
17.2.1 Data revision - average size
AT 0/8
BE 4/8 4/4
Version 3 of the electricity price questionnaire for households for the 1st semester of 2017 was sent 318 days after the reference period. (random checking and validations) Version 2 of the electricity price questionnaire for households for the 1st semester of 2018 was sent 278 days after the reference period. (methodological adjustment) Version 3 of the electricity price questionnaire for non-households for the 1st semester of 2017 was sent 318 days after the reference period. (random checking and validations) Version 2 of the electricity price questionnaire for non-households for the 1st semester of 2018 was sent 278 days after the reference period. (methodological adjustment)
BG 2/8 2/2
Version 2 of the electricity price questionnaire for households for the 2nd semester of 2017 was sent 473 days after the reference period. Version 3 of the electricity price questionnaire for non-households for the 2nd semester of 2017 was sent 473 days after the reference period. The reason is that price ‘Obligations to society’ is a part of the price for energy. Its sub-components (Energy from renewable sources, Highly efficient CHP generation, Power Purchase agreements, Critical infrastructure, Revenue from the "Rescue System" Fund to reduce the cost of 'Obligations to society') are not legally defined as taxes or fees and for this reason they are moved from component ‘Taxes, fees, levies and charges’ to component “Energy and suply’. We define the revisions magnitude as small.
CY 0/8
CZ 0/8
DE 1/8 1/1
Version 2 of the electricity price questionnaire for households for the 1st semester of 2018 was sent 159 days after the reference period. Due to an internal mistake, VAT was not correctly calculated. Therefore, the price including all taxes and levies was not correctly shown.
DK 3/8 3/3
Version 3 of the electricity price questionnaire for households for the 1st semester of 2017 was sent 297 days after the reference period. Version 5 of the electricity price questionnaire for non-households for the 1st semester of 2017 was sent 452 days after the reference period. Version 5 of the electricity price questionnaire for non-households for the 2nd semester of 2017 was sent 277 days after the reference period. The reason for these revisions is that we found an error in our excel file with the calculation.
EE 0/8
EL 3/8 3/3 Version 2 of the electricity price questionnaire for households for the 1st semester of 2018 was sent 291 days after the reference

Annex
11 Annex
Quality report of European Union energy statistics 48
period. Version 4 of the electricity price questionnaire for non-households for the 2nd semester of 2017 was sent 247 days after the reference period. Version 2 of the electricity price questionnaire for non-households for the 1st semester of 2018 was sent 291 days after the reference period. Revisions take place when providers submit data either after deadline or revised.
ES 0/8
FI 0/8
FR 6/8 6/6
Version 2 of the electricity price questionnaire for households for the 1st semester of 2017 was sent 277 days after the reference period. Version 6 of the electricity price questionnaire for households for the 2nd semester of 2017 was sent 480 days after the reference period. Version 2 of the electricity price questionnaire for households for the 1st semester of 2018 was sent 293 days after the reference period. Version 2 of the electricity price questionnaire for non-households for the 1st semester of 2017 was sent 277 days after the reference period. Version 7 of the electricity price questionnaire for non-households for the 2nd semester of 2017 was sent 480 days after the reference period. Version 5 of the electricity price questionnaire for non-households for the 1st semester of 2018 was sent 299 days after the reference period. Providers sent corrections of their data. Thanks to a better knowledge of the suppliers' errors and a better communication with them, we improved the filters and the imputations on 2017 and 2018
HR 0/8
HU 1/8 1/1
Version 4 of the electricity price questionnaire for non-households for the 1st semester of 2017 was sent 297 days after the reference period. In 2018 (parallel with the improvement of the Eurostat methodology) the HEA made some corrections in the methodology, clarified some remaining questions and initiated an additive reporting obligatory for the DSO’s to improve its report’s quality. So, there are 3 time series, which are not comparable: - before 2013 (partially validated data) - 2013-2017 (fixed methodology) - 2018 onwards (different methodology on network costs and taxes) The settlements between the participants of the electricity market can be done up to after two months of the reference period, they can initiate self-revision on their reports. The provided data is used several parts of HEA, more colleagues check the data and that is why the clarification takes time. In every reporting period HEA check the previous data sets if there is any changes and updates the reports.
IE 1/8 1/1
Version 2 of the electricity price questionnaire for non-households for the 2nd semester of 2017 was sent 192 days after the reference period. The questionnaire was resubmitted with I4 and I5 bands combined

Annex
11 Annex
Quality report of European Union energy statistics 49
and displayed as weighted averages after discussions with Eurostat.
IT 1/8 1/1
Version 3 of the electricity price questionnaire for households for the 1st semester of 2017 was sent 286 days after the reference period. The revision is due to the correction of prices made by a supplier.
LT 0/8
LU 0/8
LV 3/8 2/3
Version 3 of the electricity price questionnaire for households for the 2nd semester of 2017 was sent 465 days after the reference period. Version 4 of the electricity price questionnaire for non-households for the 1st semester of 2017 was sent 312 days after the reference period. Version 3 of the electricity price questionnaire for non-households for the 2nd semester of 2017 was sent 465 days after the reference period. Annual prices of the second semester of 2017 in electricity price questionnaire for households/ non-households were recalculated as the weighted average of both semesters.
MT 6/8 6/6
Version 3 of the electricity price questionnaire for households for the 1st semester of 2017 was sent 638 days after the reference period. Version 3 of the electricity price questionnaire for households for the 2nd semester of 2017 was sent 454 days after the reference period. Version 2 of the electricity price questionnaire for households for the 1st semester of 2018 was sent 273 days after the reference period. Version 3 of the electricity price questionnaire for non-households for the 1st semester of 2017 was sent 638 days after the reference period. Version 3 of the electricity price questionnaire for non-households for the 2nd semester of 2017 was sent 454 days after the reference period. Version 2 of the electricity price questionnaire for non-households for the 1st semester of 2018 was sent 273 days after the reference period. Revisions were made for Semesters 1 of 2017 onwards. The only difference is the inclusion of the excise duties as a separate tax. In previous submissions the excise tax was aggregated with the total electricity prices. In the revised submissions, the excise tax was removed from the variable All taxes excluded in table 1 and in table 2 and was listed under the variable Environmental taxes. Although in the revised submissions updates were made, there was no break in series.
NL 0/8
PL 4/8 4/4
Version 3 of the electricity price questionnaire for households for the 1st semester of 2017 was sent 299 days after the reference period. Version 2 of the electricity price questionnaire for households for the 1st semester of 2018 was sent 289 days after the reference period. Version 3 of the electricity price questionnaire for non-households for the 1st semester of 2017 was sent 299 days after the reference period. Version 2 of the electricity price questionnaire for non-households

Annex
11 Annex
Quality report of European Union energy statistics 50
for the 1st semester of 2018 was sent 289 days after the reference period. Data of 1st semesters were revised due to changes in the source data. Respondents preparing the data for the second semester have corrected some data for the first semester.
PT 0/8
RO 2/8 2/2
Version 2 of the electricity price questionnaire for households for the 2nd semester of 2017 was sent 479 days after the reference period. Version 2 of the electricity price questionnaire for non-households for the 2nd semester of 2017 was sent 495 days after the reference period. These revisions were due to a special situation related to a misunderstanding where the excise duties should be reported, into environmental tax section or into all other taxes, fees, levies and changes section. With the support of the Eurostat representatives, this subject was clarified, so will be not further delays in this respect.
SE 0/8
SI 1/8 1/1
Version 2 of the electricity price questionnaire for households for the 1st semester of 2017 was sent 325 days after the reference period. The revision magnitude was low and did not effect final results significantly, but impacted only specific components (i.e. consumption band DA). The main reason for revision was late correction by reporting units in administraive database.
SK 3/8 3/3
Version 2 of the electricity price questionnaire for non-households for the 1st semester of 2017 was sent 271 days after the reference period. 6 items from 21; correction of data by reporting units. Version 2 of the electricity price questionnaire for households for the 2nd semester of 2017 was sent 454 days after the reference period. 2 items from 52; improvement of the calculation method. Version 2 of the electricity price questionnaire for non-households for the 2nd semester of 2017 was sent 454 days after the reference period. 2 items from 79; improvement of the calculation method.
UK 3/8 0/3
Version 5 of the electricity price questionnaire for households for the 1st semester of 2018 was sent 273 days after the reference period. Version 3 of the electricity price questionnaire for non-households for the 1st semester of 2017 was sent 285 days after the reference period. Version 5 of the electricity price questionnaire for non-households for the 1st semester of 2018 was sent 277 days after the reference period.
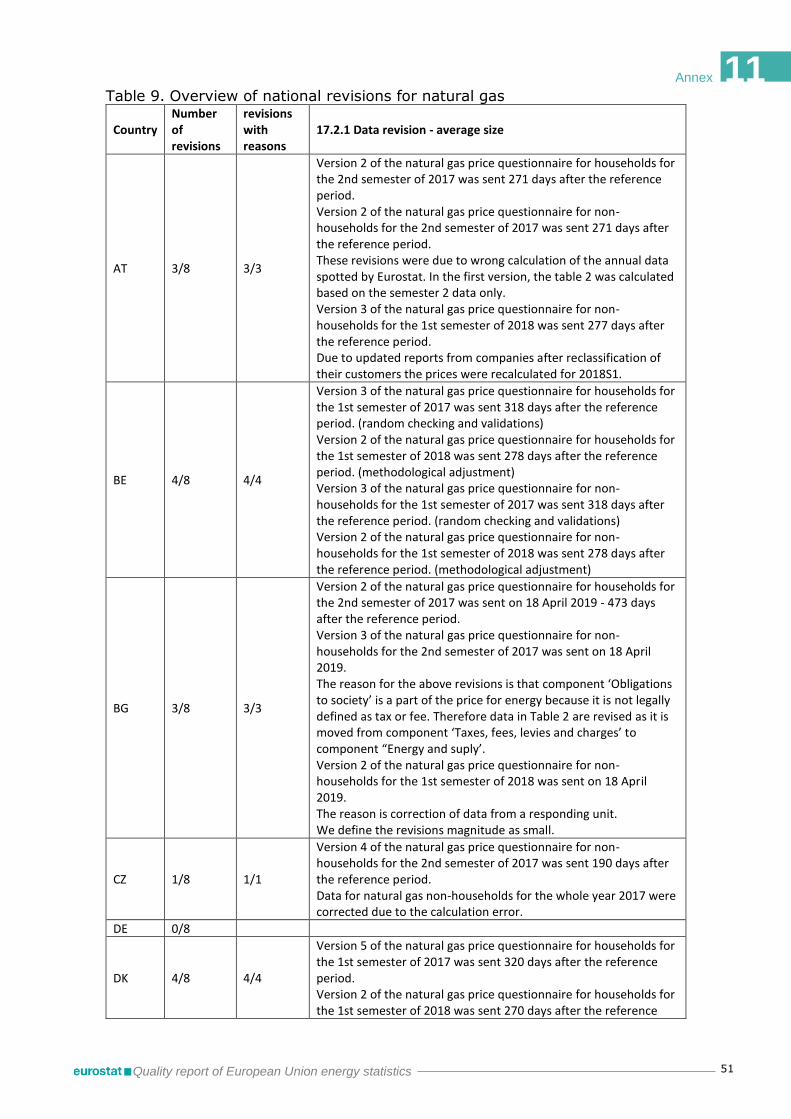
Annex
11 Annex
Quality report of European Union energy statistics 51
Table 9. Overview of national revisions for natural gas
Country Number of revisions
revisions with reasons
17.2.1 Data revision - average size
AT 3/8 3/3
Version 2 of the natural gas price questionnaire for households for the 2nd semester of 2017 was sent 271 days after the reference period. Version 2 of the natural gas price questionnaire for non-households for the 2nd semester of 2017 was sent 271 days after the reference period. These revisions were due to wrong calculation of the annual data spotted by Eurostat. In the first version, the table 2 was calculated based on the semester 2 data only. Version 3 of the natural gas price questionnaire for non-households for the 1st semester of 2018 was sent 277 days after the reference period. Due to updated reports from companies after reclassification of their customers the prices were recalculated for 2018S1.
BE 4/8 4/4
Version 3 of the natural gas price questionnaire for households for the 1st semester of 2017 was sent 318 days after the reference period. (random checking and validations) Version 2 of the natural gas price questionnaire for households for the 1st semester of 2018 was sent 278 days after the reference period. (methodological adjustment) Version 3 of the natural gas price questionnaire for non-households for the 1st semester of 2017 was sent 318 days after the reference period. (random checking and validations) Version 2 of the natural gas price questionnaire for non-households for the 1st semester of 2018 was sent 278 days after the reference period. (methodological adjustment)
BG 3/8 3/3
Version 2 of the natural gas price questionnaire for households for the 2nd semester of 2017 was sent on 18 April 2019 - 473 days after the reference period. Version 3 of the natural gas price questionnaire for non-households for the 2nd semester of 2017 was sent on 18 April 2019. The reason for the above revisions is that component ‘Obligations to society’ is a part of the price for energy because it is not legally defined as tax or fee. Therefore data in Table 2 are revised as it is moved from component ‘Taxes, fees, levies and charges’ to component “Energy and suply’. Version 2 of the natural gas price questionnaire for non-households for the 1st semester of 2018 was sent on 18 April 2019. The reason is correction of data from a responding unit. We define the revisions magnitude as small.
CZ 1/8 1/1
Version 4 of the natural gas price questionnaire for non-households for the 2nd semester of 2017 was sent 190 days after the reference period. Data for natural gas non-households for the whole year 2017 were corrected due to the calculation error.
DE 0/8
DK 4/8 4/4
Version 5 of the natural gas price questionnaire for households for the 1st semester of 2017 was sent 320 days after the reference period. Version 2 of the natural gas price questionnaire for households for the 1st semester of 2018 was sent 270 days after the reference

Annex
11 Annex
Quality report of European Union energy statistics 52
period. Version 3 of the natural gas price questionnaire for non-households for the 1st semester of 2017 was sent 297 days after the reference period. Version 2 of the natural gas price questionnaire for non-households for the 1st semester of 2018 was sent 270 days after the reference period. The reason for the revision is that we found an error in our excel file with the calculation.
EE 1/8 1/1
Version 2 of the natural gas price questionnaire for households for the 1st semester of 2017 was sent 157 days after the reference period. Changes were made due to changes in the data processing process. Magnitude has not been measured.
EL 5/8 5/5
Version 2 of the natural gas price questionnaire for households for the 2nd semester of 2017 was sent 316 days after the reference period. Version 2 of the natural gas price questionnaire for households for the 1st semester of 2018 was sent 167 days after the reference period. Version 3 of the natural gas price questionnaire for non-households for the 1st semester of 2017 was sent 357 days after the reference period. Version 2 of the natural gas price questionnaire for non-households for the 2nd semester of 2017 was sent 316 days after the reference period. Version 2 of the natural gas price questionnaire for non-households for the 1st semester of 2018 was sent 167 days after the reference period. Revisions take place when providers submit data either after deadline or revised.
ES 1/8 1/1
Version 3 of the natural gas price questionnaire for non-households for the 1st semester of 2017 was sent 171 days after the reference period. Revision affected gas prices for I3, I4 and I6 bands due to new prices received and corrected after submission deadline.
FI 2/4 2/2
Version 4 of the natural gas price questionnaire for non-households for the 1st semester of 2017 was sent 287 days after the reference period. Version 4 of the natural gas price questionnaire for non-households for the 1st semester of 2018 was sent 242 days after the reference period. The corrections were received from the data respondent. The revised price data was transmitted to Eurostat.
FR 6/8 6/6
Version 2 of the natural gas price questionnaire for households for the 1st semester of 2017 was sent 277 days after the reference period. Version 3 of the natural gas price questionnaire for households for the 2nd semester of 2017 was sent 467 days after the reference period. Version 2 of the natural gas price questionnaire for households for the 1st semester of 2018 was sent 286 days after the reference period. Version 4 of the natural gas price questionnaire for non-households for the 1st semester of 2017 was sent 277 days after the reference period.

Annex
11 Annex
Quality report of European Union energy statistics 53
Version 3 of the natural gas price questionnaire for non-households for the 2nd semester of 2017 was sent 467 days after the reference period. Version 3 of the natural gas price questionnaire for non-households for the 1st semester of 2018 was sent 286 days after the reference period. Providers sent corrections of their data. Thanks to a better knowledge of the suppliers' errors and a better communication with them, we improved the filters and the imputations on 2017 and 2018
HR 0/8
HU 0/8
The HEA collects full-scale administrative data from its licensees, which provide high quality outputs. There was a complete methodology supervision in 2013, since then the forms have guidelines for completing. This guidelines were discussed with the data suppliers. So, there are 2 time series, which are partially comparable: - before 2013 (not validated data) - 2013-2018 (fixed methodology) The settlements between the participants of the electricity market can be done up to after two months of the reference period, they can initiate self-revision on their reports. The provided data is used several parts of HEA, more colleagues check the data and that is why the clarification takes time. In every reporting period HEA check the previous data sets if there is any changes and updates the reports.
IE 2/8 2/2
Version 4 of the natural gas price questionnaire for households for the 2nd semester of 2017 was sent 467 days after the reference period. Version 7 of the natural gas price questionnaire for non-households for the 2nd semester of 2017 was sent 480 days after the reference period. This questionnaire was revised after errors were found in the data and suppliers were asked to resubmit.
IT 1/8 1/1
Version 4 of the natural gas price questionnaire for non-households for the 2nd semester of 2017 was sent 250 days after the reference period. The revision is due to the correction of prices made by a supplier.
LT 0/8
LU 0/8
LV 2/8 2/2
Version 3 of the natural gas price questionnaire for households for the 2nd semester of 2017 was sent 465 days after the reference period. Version 3 of the natural gas price questionnaire for non-households for the 2nd semester of 2017 was sent 465 days after the reference period. In the second semester of 2017, metadata (tax classification) in the natural gas price questionnaires for households and non-households were improved and annual prices of the second semester of 2017 in natural gas price questionnaire for households/ non-households were recalculated as the weighted average of both semesters.
NL 0/8
PL
Version 3 of the natural gas price questionnaire for non-households for the 1st semester of 2017 was sent 321 days after the reference period. Data for 1st semester 2017 was revised due to changes in source

Annex
11 Annex
Quality report of European Union energy statistics 54
data made by respondents while completing the survey report for 2018.
PT 0/8
RO 6/8 6/6
Version 2 of the natural gas price questionnaire for households for the 2nd semester of 2017 was sent 467 days after the reference period. Version 2 of the natural gas price questionnaire for non-households for the 2nd semester of 2017 was sent 467 days after the reference period. These 2-nd revisions were due to a special situation related to a misunderstanding where the excise duties should be reported, into environmental tax section or into all other taxes, fees, levies and changes section. With the support of the Eurostat representatives, this subject was clarified, so will be not further delays in this respect. Version 3 of the natural gas price questionnaire for households for the 1st semester of 2017 was sent 651 days after the reference period. Version 3 of the natural gas price questionnaire for households for the 1st semester of 2018 was sent 286 days after the reference period. Version 3 of the natural gas price questionnaire for non-households for the 1st semester of 2017 was sent 651 days after the reference period. Version 3 of the natural gas price questionnaire for non-households for the 1st semester of 2018 was sent 286 days after the reference period. When it was revised the data for Semester 2 - 2018, we realized that was an error of the software program related to the network cost calculation and also was a misinterpretation regarding where this network cost should be allocated (previously this cost was allocated to level 2 price). Meantime, during the new interrogation of the database, we realized that the natural gas suppliers had made some corrections of their data concerning sem. 1 – 2017&2018 and sem. 2 2017. Under these circumstances we have fixed all these aspects and sent the revised version for all the mentioned reports.
SE 0/8
SI 0/8
SK 1/8 1/1
Version 2 of the natural gas price questionnaire for non-households for the 1st semester of 2017 was sent 271 days after the reference period. 3 items from 18; correction of data by reporting units.
UK 1/8 0/1 Version 5 of the natural gas price questionnaire for non-households for the 1st semester of 2017 was sent 285 days after the reference period.
Disclaimer: Cyprus and Malta do not use natural gas. Finland does not use natural
gas for the households sector.

Annexes
Quality report of European Union energy statistics 55
ANNEX 7
Table 10. Overview of the timeliness
2017 2018
Semester 1 Semester 2 Semester 1 Semester 2
(Deadline=92) (Deadline = 90) (Deadline = 92) (Deadline = 90)
Ele HH
Ele nHH
Gas HH
Gas nHH
Ele HH
Ele nHH
Gas HH
Gas nHH
Ele HH
Ele nHH
Gas HH
Gas nHH
Ele HH
Ele nHH
Gas HH
Gas nHH
On time
61% 61% 64% 69% 75% 75% 72% 69% 82% 82% 92% 88% 82% 82% 80% 81%
Min 52 52 52 45 59 59 59 59 54 54 54 54 58 58 66 58
Max 112 112 131 131 101 101 143 143 100 100 96 96 101 101 105 105
AT 83 83 83 83 88 88 88 88 90 90 90 90 88 88 88 88
BE 94 94 94 94 93 93 94 94 89 89 89 89 89 89 89 89
BG 88 88 88 88 86 86 86 86 88 88 88 88 87 87 87 87
CY 61 61 N/A N/A 81 81 N/A N/A 73 73 N/A N/A 95 95 N/A N/A
CZ 52 52 52 52 72 72 72 72 54 54 54 54 73 73 73 73
DE 109 109 109 109 88 88 88 88 94 94 90 90 101 101 99 99
DK 102 102 96 96 96 96 96 96 96 96 96 96 86 86 86 86
EE 74 74 74 74 88 88 88 88 89 89 89 89 85 85 85 85
EL 102 102 119 45 89 89 143 143 83 83 90 90 89 89 105 105
ES 108 108 67 67 85 85 79 79 100 100 90 90 88 88 86 86
FI 89 89 N/A 89 90 90 N/A 90 93 93 N/A 93 58 58 N/A 58
FR 98 98 98 98 93 93 93 93 90 90 90 90 84 84 84 84
HR 88 88 88 88 87 87 87 87 88 88 88 88 85 85 85 85
HU 96 96 96 96 93 93 93 93 93 93 93 93 89 89 89 89
IE 91 91 91 91 88 88 88 95 90 90 90 90 89 89 89 89
IT 112 112 112 112 101 101 101 101 90 90 90 90 91 91 91 91
LT 91 91 91 91 89 89 89 89 90 90 90 90 88 88 88 88
LU 91 91 91 91 88 88 88 88 88 88 88 88 86 86 86 86
LV 91 91 91 91 88 88 88 88 90 90 90 90 91 91 91 91
MT 94 94 N/A N/A 93 93 N/A N/A 90 90 N/A N/A 89 89 N/A N/A
NL 90 90 90 90 89 89 89 89 90 90 90 90 88 88 88 88
PL 94 94 94 94 95 95 95 95 90 90 90 90 91 91 91 91
PT 91 91 91 91 87 87 87 87 89 89 89 89 89 89 89 89
RO 95 95 131 131 81 81 81 81 87 87 87 87 85 85 85 85
SE 62 62 62 62 59 59 59 59 80 80 80 80 66 66 66 66
SI 66 66 66 66 88 88 88 88 89 89 89 89 73 73 73 73
SK 89 89 89 89 87 87 87 87 86 86 86 86 89 89 89 89
UK 88 88 88 88 88 88 88 88 90 90 90 90 89 89 89 89

Annexes
Quality report of European Union energy statistics 56
ANNEX 8
Table 11. Overview of the national deadlines for national statistical institutes
data providers Country Electricity Natural gas
AT 51 days 51 51 days 51
BE 2 months 62 2 months 62
BG 1 month 31 1 month 31
CY 3 months 92
CZ ? 1 month 31
DE 2 months 62 2 months 62
DK 2 months 62 2 months 62
EE 1 month 31 1 month 31
EL 2 months 62 2 months 62
ES 1.5 months 46 1 month 31
FI 3 weeks 21 6 weeks 42
FR 2,5 months 77 2,5 months 77
HR 6 weeks 42 6 weeks 42
HU 25 days 25 30 days 30
IE 2 months 62 2 months 62
IT 45 days 45 45 days 45
LT 1.5 months 46 1.5 months 46
LU 3 months 92 3 months 92
LV 2 months 62 2 months 62
MT 3 months 92
NL 2 months 62 2 months 62
PL 3 weeks 21 3 weeks 21
PT 2 months 62 2 months 62
RO 6 weeks 42 6 weeks 42
SE 4 weeks 28 1 month 31
SI 1 months 45 days for administrative data
31 45
1 month 31
SK 1 month 31 1 months 31
UK 3 weeks 21 3 weeks 21
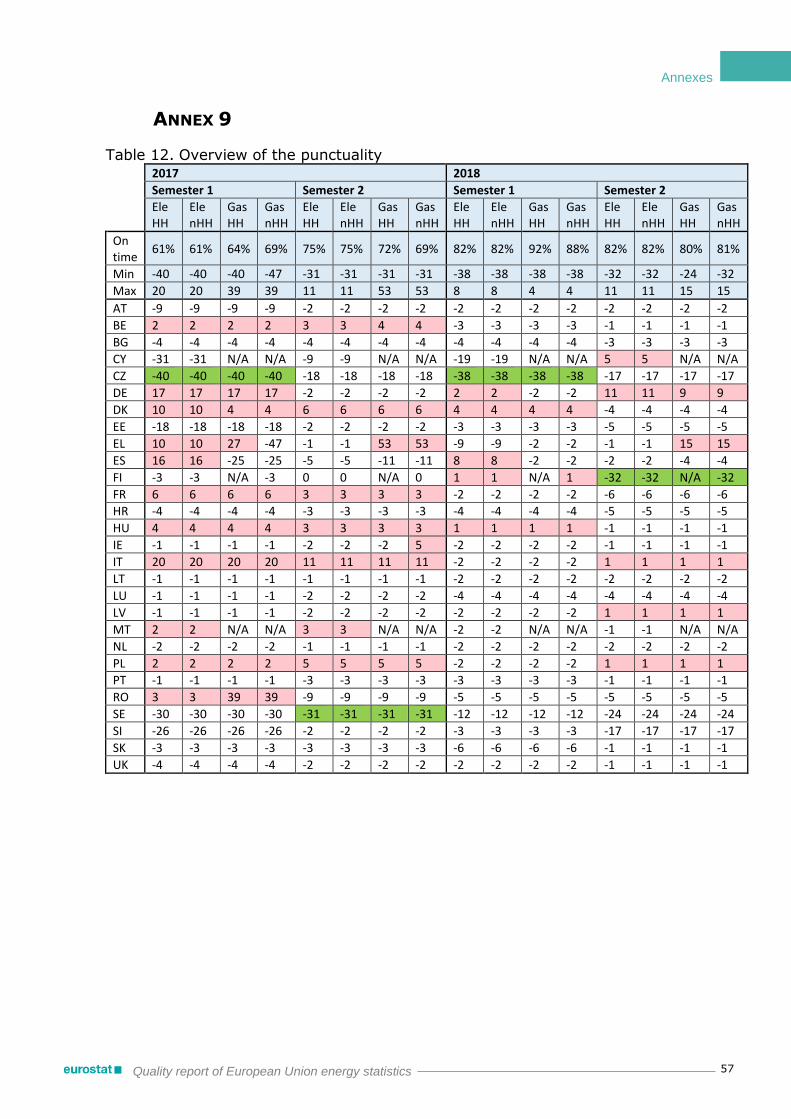
Annexes
Quality report of European Union energy statistics 57
ANNEX 9
Table 12. Overview of the punctuality
2017 2018
Semester 1 Semester 2 Semester 1 Semester 2
Ele HH
Ele nHH
Gas HH
Gas nHH
Ele HH
Ele nHH
Gas HH
Gas nHH
Ele HH
Ele nHH
Gas HH
Gas nHH
Ele HH
Ele nHH
Gas HH
Gas nHH
On time
61% 61% 64% 69% 75% 75% 72% 69% 82% 82% 92% 88% 82% 82% 80% 81%
Min -40 -40 -40 -47 -31 -31 -31 -31 -38 -38 -38 -38 -32 -32 -24 -32
Max 20 20 39 39 11 11 53 53 8 8 4 4 11 11 15 15
AT -9 -9 -9 -9 -2 -2 -2 -2 -2 -2 -2 -2 -2 -2 -2 -2
BE 2 2 2 2 3 3 4 4 -3 -3 -3 -3 -1 -1 -1 -1
BG -4 -4 -4 -4 -4 -4 -4 -4 -4 -4 -4 -4 -3 -3 -3 -3
CY -31 -31 N/A N/A -9 -9 N/A N/A -19 -19 N/A N/A 5 5 N/A N/A
CZ -40 -40 -40 -40 -18 -18 -18 -18 -38 -38 -38 -38 -17 -17 -17 -17
DE 17 17 17 17 -2 -2 -2 -2 2 2 -2 -2 11 11 9 9
DK 10 10 4 4 6 6 6 6 4 4 4 4 -4 -4 -4 -4
EE -18 -18 -18 -18 -2 -2 -2 -2 -3 -3 -3 -3 -5 -5 -5 -5
EL 10 10 27 -47 -1 -1 53 53 -9 -9 -2 -2 -1 -1 15 15
ES 16 16 -25 -25 -5 -5 -11 -11 8 8 -2 -2 -2 -2 -4 -4
FI -3 -3 N/A -3 0 0 N/A 0 1 1 N/A 1 -32 -32 N/A -32
FR 6 6 6 6 3 3 3 3 -2 -2 -2 -2 -6 -6 -6 -6
HR -4 -4 -4 -4 -3 -3 -3 -3 -4 -4 -4 -4 -5 -5 -5 -5
HU 4 4 4 4 3 3 3 3 1 1 1 1 -1 -1 -1 -1
IE -1 -1 -1 -1 -2 -2 -2 5 -2 -2 -2 -2 -1 -1 -1 -1
IT 20 20 20 20 11 11 11 11 -2 -2 -2 -2 1 1 1 1
LT -1 -1 -1 -1 -1 -1 -1 -1 -2 -2 -2 -2 -2 -2 -2 -2
LU -1 -1 -1 -1 -2 -2 -2 -2 -4 -4 -4 -4 -4 -4 -4 -4
LV -1 -1 -1 -1 -2 -2 -2 -2 -2 -2 -2 -2 1 1 1 1
MT 2 2 N/A N/A 3 3 N/A N/A -2 -2 N/A N/A -1 -1 N/A N/A
NL -2 -2 -2 -2 -1 -1 -1 -1 -2 -2 -2 -2 -2 -2 -2 -2
PL 2 2 2 2 5 5 5 5 -2 -2 -2 -2 1 1 1 1
PT -1 -1 -1 -1 -3 -3 -3 -3 -3 -3 -3 -3 -1 -1 -1 -1
RO 3 3 39 39 -9 -9 -9 -9 -5 -5 -5 -5 -5 -5 -5 -5
SE -30 -30 -30 -30 -31 -31 -31 -31 -12 -12 -12 -12 -24 -24 -24 -24
SI -26 -26 -26 -26 -2 -2 -2 -2 -3 -3 -3 -3 -17 -17 -17 -17
SK -3 -3 -3 -3 -3 -3 -3 -3 -6 -6 -6 -6 -1 -1 -1 -1
UK -4 -4 -4 -4 -2 -2 -2 -2 -2 -2 -2 -2 -1 -1 -1 -1

Annexes
Quality report of European Union energy statistics 58
ANNEX 10
Table 13. Overview of the number of corrections made
2017 2018
Semester 1 Semester 2 Semester 1 Semester 2
Ele HH
Ele nHH
Gas HH
Gas nHH
Ele HH
Ele nHH
Gas HH
Gas nHH
Ele HH
Ele nHH
Gas HH
Gas nHH
Ele HH
Ele nHH
Gas HH
Gas nHH
Total 1 1 1 6 20 22 17 21 2 4 0 3 15 21 10 12
Nbr countries
1 1 1 6 17 17 13 18 2 3 0 3 11 14 9 9
AT 1 1 1 1
BE 3 3 2 2 1 1 1 1
BG 1 1 1 1 2
CY 1 1 2 2
CZ 1
DE 1
DK 1 1 3 1
EE 1 1 1 1 1
EL 1 1 1 2 2
ES 1 1 1 1
FI 1 1 1
FR 2 2 1 1 1 1 1 3 1 1
HR 1 1
HU 1 1
IE 2 1 1 2
IT 1 1 1 2 1 1
LT
LU 1 1 1 1
LV 1 1 1 1 1 2 1 1
MT 1 2 1
NL 1 1 1 1 1
PL 1 1 1 1 1 1
PT 1 1 1 1 1
RO 1 1 2 2 1 1
SE 1 1 1 1 2 2 2 2
SI 1 2 2 2 1 1
SK
UK 1 1 1 1 1 1

Annexes
Quality report of European Union energy statistics 59
ANNEX 11
Table 14. Overview of the delay between the first version of a questionnaire
and its last correction.
2017 2018
Semester 1 Semester 2 Semester 1 Semester 2
Ele HH
Ele nHH
Gas HH
Gas nHH
Ele HH
Ele nHH
Gas HH
Gas nHH
Ele HH
Ele nHH
Gas HH
Gas nHH
Ele HH
Ele nHH
Gas HH
Gas nHH
Average 3 22 5 24 23 25 26 26 2 14 0 4 16 16 16 17
AT 5 5 5 5
BE 10 10 28 28 6 6 6 6
BG 31 21 21 21 21
CY 4 4 20 20
CZ 2
DE 10
DK 17 17 40 17
EE 25 25 25 25 1
EL 74 21 21 19 19
ES 58 58 1 1
FI 13 13 13
FR 7 7 2 2 33 7 16 31 18 18
HR 3 23
HU 33 10
IE 5 5 14 27
IT 1 1 1 47 2 2
LT
LU 39 39 39 39
LV 26 26 26 26 7 9 7 7
MT 22 35 3
NL 54 54 54 54 12
PL 2 42 14 14 18 18
PT 27 27 27 27 1
RO 5 5 30 30 17 17
SE 27 27 27 27 35 35 35 35
SI 25 53 53 53 4 4
SK
UK 22 22 13 13 13 13

Annexes
Quality report of European Union energy statistics 60
ANNEX 13
Table 14. Overview of the documentation on methodology available in the
countries for electricity. Country Documentation on methodology
AT No metadata available at national level.
BE The documentation on methodology is, at the current time, only available in a manual that has been written in Dutch. This manual will recaive an important update by the end of 2019. Thereafter we are planning translations in French and English (of the whole manual or of a summary version).
BG Methodology and metadata files are available at the NSI website, section Energy: http://www.nsi.bg/en/content/5035/electricity-prices-final-non-household-customers
CY No documentation is available.
CZ Electricity non-households: Description of methodology is a part of publication “Industrial Producer Price Indices”.
DE None
DK Documentation on the methodology is available on Statistics Denmark's website; https://www.dst.dk/en/Statistik/dokumentation/statistikdokumentation/el--og-naturgaspriser
EE
Price of electricity and natural gas (ESMS METADATA) https://www.stat.ee/esms-metadata?code=20409 Instructions on the questionnaire variables (in PDF format): EST | ENG Questionnaire for printing (in PDF format): EST | ENG https://www.stat.ee/?id=38932&lang=en
EL http://www.ypeka.gr/LinkClick.aspx?fileticket=CnlGIZVekpI%3d&tabid=299&language=el-GR
ES There is no documentation on methodology.
FI Documentation on methodology is internal.
FR
Description of the survey, Methodology, Data collection, Questionnaire, Results are described on the following web page: https://www.statistiques.developpement-durable.gouv.fr/enquete-semestrielle-sur-la-transparence-des-prix-du-gaz-et-de-lelectricite-en-europe?list-enquete=true A methodological notice is included in the publication : Datalab essential “Electricity prices in France and the European Union in 2017” A methodology is attached (in a separate file) to the publication Datalab essential “Electricity prices in France and the European Union in 2016”
HR Statistical standards for electricity prices survey is published on-line, here is the link to methodology documentation: https://www.dzs.hr/Hrv/important/Nomen/Standardi/Statisticki%20standardi%20za%20ERG-3E.pdf
HU
Internal national documenation: these documents contain the approved methodology for the reports, which is in line with EUROSTAT guidelines,as well as the approved explanatory texts for the actual reports, guiding the data providers. These documents did not change since 2014, as the changes of the EUROSTAT guidelines in 2017 only changed the compilaton methods of the Authority. Eurostat Guidelines.
IE
Methodology is published in Appendix 2 of the bi-annual publication. Electricity & Gas Prices in Ireland. Electricity & Gas Prices in Ireland - 1st Semester (January – June) 2018, Sustainable Energy Authority of Ireland, 2019.https://www.seai.ie/publications/Electricity_Gas_Prices_January_June_2017 Regulation (EU) 2016/1052 http://eur-lex.europa.eu/eli/reg/2016/1952/oj Eurostat Compiler guide http://ec.europa.eu/eurostat/web/products-manuals-and-guidelines/-/KS-GQ-16-106
IT
A handbook with instructions to fill in web questionnaires for submitting data is provided to suppliers. The handbook is available here: https://www.arera.it/allegati/operatori/raccolte_dati/manuali/2018/PrezziMediEE18.pdf
LT The statistical survey on electricity prices is based on theDirective 2008/92EC of the European Parliament and of the Council of 22 October 2008 concerning Community procedure to improve the transparency of gas and electricity prices charged to industrial end-users (recast).

Annex
11 Annex
Quality report of European Union energy statistics 61
A complete description of the methodology used to compile the Electricity prices is published on the Official Statistics Portal:Methodological documentation (only in Lithuanian).
LU no documentation
LV
Regulation (EU) 2016/1952, Annex II. Compilers guide on European statistics on natural gas and electricity (Eurostat, 2017) CSB website: https://www.csb.gov.lv/en/statistics/statistics-by-theme/environment-energy/energy/tables/metadata-electricity-prices
MT The definitions and methodology of Eurostat’s Compilers guide on European Statistics on natural gas and electricity prices have been followed. In-depth documentation on methodology used is being provided in various sections of this report.
NL Documentation on methodology for the electricity prices of Statistics Netherlands (Dutch) Regulation (EU) 2016/1052 Eurostat Compiler guide
PL
Public methodological instructions for statistical surveys have been developed and every year are updated and supplemented. Questionnaires and instructions are available on websites: https://www.are.waw.pl/images/badania-statystyczne/2007/g11e.pdf https://www.are.waw.pl/badania-statystyczne/formularze-na-rok-2007 https://www.are.waw.pl/images/badania-statystyczne/2018/g11e.pdf https://www.are.waw.pl/images/badania-statystyczne/2018/o11e.pdf and on the Statistics Poland website: http://form.stat.gov.pl/formaty/wersja-graficzna/2018/G_11e.pdf until 2017, questionnaires and instructions were included in the annex to the annual Regulations of the Council of Ministers.
PT
DGEG prepares (and updates) written methodological documents for each delegated statistical operation, based on standard methodological documents defined according to the National Statistical System. These documents present a detailed description of the statistical methodology (transmission, treatment, analysis and dissemination of data), applied regulation and legislation, concepts, definitions and classifications of each statistical operation. All documents, after approval by Statistics Portugal, are published on our webpage (DGEG). Webpage: www.dgeg.gov.pt - Planning and statistics - Statistics and prices - Methodological documents - Energy - Statistics on Prices Relative to Natural Gas and Electricity
RO No documentation regardig methodology for this statistical domain is available.
SE Metadata not available
SI Methodological explanation: https://www.stat.si/statweb/File/DocSysFile/8313/18-143-ME.pdf
SK Methodology is available in legal acts (see 6.1 Institutional Mandate) and in Statistical Questionnaire.
UK
Methodology notes are available covering each of the sections of the Quarterly Energy Prices. The International data methodology note is available online and available publicly here: https://www.gov.uk/government/publications/international-comparisons-data-sources-and-methodologies

Annex
11 Annex
Quality report of European Union energy statistics 62
Table 15. Overview of the documentation on methodology available in the countries for natural gas.
Country Documentation on methodology
AT No metadata available at national level.
BE The documentation on methodology is, at the current time, only available in a manual that has been written in Dutch. This manual will receive an important update by the end of 2019. Thereafter we are planning translations in French and English (of the whole manual or of a summary version).
BG Metadata and methodology files are available at the NSI website, section Energy: http://www.nsi.bg/en/content/5041/natural-gas-prices-final-non-household-customers
CZ Natural gas non-households: Description of methodology is a part of publication “Industrial Producer Price Indices”.
DE None
DK Documentation on the methodology is available on Statistics Denmark's website; https://www.dst.dk/en/Statistik/dokumentation/statistikdokumentation/el--og-naturgaspriser
EE
Price of electricity and natural gas (ESMS METADATA) https://www.stat.ee/esms-metadata?code=20409 Instructions on the questionnaire variables (in PDF format): EST | ENG Questionnaire for printing (in PDF format): EST | ENG https://www.stat.ee/?id=38932&lang=en
EL Not available.
ES No documentation on methdology apart from publicated by Eurostat.
FI Internal documentation exists.
FR
Description of the survey, Methodology, Data collection, Questionnaire, Results are described on the following web page: https://www.statistiques.developpement-durable.gouv.fr/enquete-semestrielle-sur-la-transparence-des-prix-du-gaz-et-de-lelectricite-en-europe?list-enquete=true A methodology is attached (in a separate file) to the publication Datalab essential “Electricity prices in France and the European Union in 2016”
HR Statistical standards for gas prices survey is published on-line, here is the link to methodology documentation: https://www.dzs.hr/Hrv/important/Nomen/Standardi/Statisticki%20standardi%20za%20ERG-3P.pdf
HU
Internal national documenation: these documents contain the approved methodology for the reports, which is in line with EUROSTAT guidelines,as well as the approved explanatory texts for the actual reports, guiding the data providers. These documents did not change since 2014, as the changes of the EUROSTAT guidelines in 2017 only changed the compilaton methods of the Authority. Eurostat Guidelines.
IE
Methodology is published in Appendix 2 of the bi-annual publication. Electricity & Gas Prices in Ireland. Electricity & Gas Prices in Ireland - 1st Semester (January – June) 2018, Sustainable Energy Authority of Ireland, 2019.https://www.seai.ie/publications/Electricity_Gas_Prices_January_June_2017 Regulation (EU) 2016/1052 http://eur-lex.europa.eu/eli/reg/2016/1952/oj Eurostat Compiler guide http://ec.europa.eu/eurostat/web/products-manuals-and-guidelines/-/KS-GQ-16-106
IT A handbook with instructions to fill in web questionnaires for submitting data is provided to suppliers. The handbook is available here: https://www.arera.it/allegati/operatori/raccolte_dati/manuali/2018/CondizioniMedieGAS18.pdf
LT
The statistical survey on gas prices is based on theDirective 2008/92EC of the European Parliament and of the Council of 22 October 2008 concerning Community procedure to improve the transparency of gas and electricity prices charged to industrial end-users (recast). A complete description of the methodology used to compile the Natural gas prices is published on the Official Statistics Portal:Methodological documentation (only in Lithuanian).
LU no documentation
LV
Regulation (EU) 2016/1952, Annex I. Compilers guide on European statistics on natural gas and electricity (Eurostat, 2017) CSB website:https: https://www.csb.gov.lv/en/statistics/statistics-by-theme/environment-energy/energy/tables/metadata-natural-gas-prices
NL Documentation on methodology for the electricity prices of Statistics Netherlands (Dutch)

Annex
11 Annex
Quality report of European Union energy statistics 63
Regulation (EU) 2016/1052 Eurostat Compiler guide
PL
Public methodological instructions for statistical surveys have been developed and are updated and suplemented every year. Questionnaires and instructions are available on websites: https://www.are.waw.pl/images/badania-statystyczne/2017/g11gv5.pdf https://www.are.waw.pl/images/badania-statystyczne/2017/o11gv4.pdf https://www.are.waw.pl/images/badania-statystyczne/2018/g11g.pdf https://www.are.waw.pl/images/badania-statystyczne/2018/o11g.pdf and on the Statistics Poland website: http://form.stat.gov.pl/formaty/wersja-graficzna/2018/G_11g.pdf Until 2017, questionnaires and instructions were included in the annex to the annual Regulations of the Council of Ministers.
PT
DGEG prepares (and updates) written methodological documents for each delegated statistical operation, based on standard methodological documents defined according to the National Statistical System. These documents present a detailed description of the statistical methodology (transmission, treatment, analysis and dissemination of data), applied regulation and legislation, concepts, definitions and classifications of each statistical operation. All documents, after approval by Statistics Portugal, are published on our webpage (DGEG). Webpage: www.dgeg.gov.pt - Planning and statistics - Statistics and prices - Methodological documents - Energy - Statistics on Prices Relative to Natural Gas and Electricity
RO Romania does not have public available documentation on methodology for this statistical domain.
SE No metadata available
SI Methodological explanation: https://www.stat.si/statweb/File/DocSysFile/8313/18-143-ME.pdf
SK Methodology is available in legal acts (see 6.1 Institutional Mandate) and in Statistical Questionnaire
UK
Methodology notes are available covering each of the sections of the Quarterly Energy Prices. The International data methodology note is available online and available publicly here: https://www.gov.uk/government/publications/international-comparisons-data-sources-and-methodologies