2019 CONTAINER SHIPPING OUTLOOK...Liner Carrier EBIT/Operating Profit 2010-2018 in Million USD...
43
TOC As i a – April 2019 © Sea-Intelligence Maritime Analysis 1 Alan Murphy CEO and Founder Sea-Intelligence April 9 th , 2019 TOC Asia 2019 CONTAINER SHIPPING OUTLOOK
Transcript of 2019 CONTAINER SHIPPING OUTLOOK...Liner Carrier EBIT/Operating Profit 2010-2018 in Million USD...

TOC As ia – April 2019© Sea-Intelligence Maritime Analysis
1
Alan MurphyCEO and Founder
Sea-Intelligence
April 9th, 2019TOC Asia
2019 CONTAINER SHIPPING OUTLOOK

TOC As ia – April 2019© Sea-Intelligence Maritime Analysis
Sea-Intelligence
2
Container Shipping Analysts
- Founded January 6th, 2011
- Fully independent, private company with no interests from brokers, banks or others.
- 10 Analysts, Developers & Consultants in Copenhagen, Bucharest and Singapore.
- 3-person Management Team with 60 years of experience in Container Shipping
Core values:
- Integrity
- Methodology
- Assumptions
- Data Quality
Major Milestones:
- 1,000+ Research & Analysis articles published since March 2011
- 5,000+ citations in Industry Press (Lloyd’s List, JoC, etc.)
- World’s most comprehensive database on Carrier Reliability
- Complete overview of all deep-sea networks and deployment
- Curriculum provider at the World Maritime University
- Curriculum provider at the Blue MBA at Copenhagen Business School
TOC As ia – April 2019© Sea-Intelligence Maritime Analysis
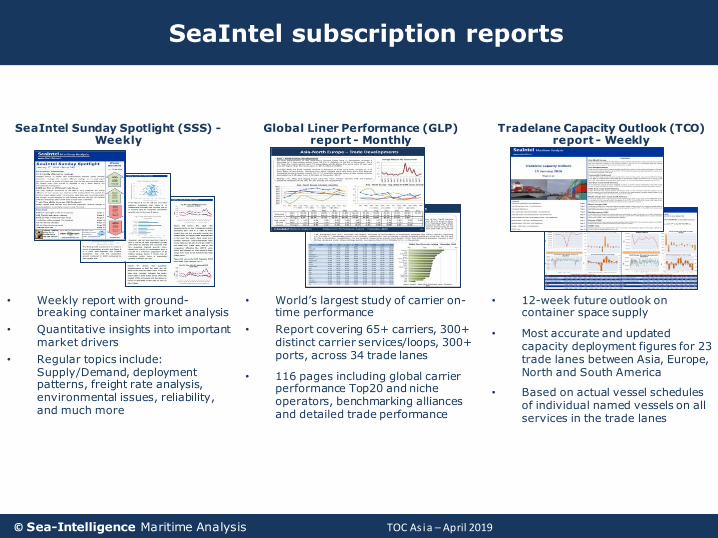
SeaIntel Sunday Spotlight (SSS) -Weekly
Global Liner Performance (GLP) report - Monthly
Tradelane Capacity Outlook (TCO) report - Weekly
• Weekly report with ground-breaking container market analysis
• Quantitative insights into important market drivers
• Regular topics include: Supply/Demand, deployment patterns, freight rate analysis, environmental issues, reliability, and much more
• World’s largest study of carrier on-time performance
• Report covering 65+ carriers, 300+ distinct carrier services/loops, 300+ ports, across 34 trade lanes
• 116 pages including global carrier performance Top20 and niche operators, benchmarking alliances and detailed trade performance
• 12-week future outlook on container space supply
• Most accurate and updated capacity deployment figures for 23 trade lanes between Asia, Europe, North and South America
• Based on actual vessel schedules of individual named vessels on all services in the trade lanes
SeaIntel subscription reports
3

TOC As ia – April 2019© Sea-Intelligence Maritime Analysis
Supply/Demand
4

TOC As ia – April 2019© Sea-Intelligence Maritime Analysis
Restrained ordering, but still 43 mega-vessels in orderbook
5
0%
1%
2%
3%
4%
5%
6%
7%
8%
0
200,000
400,000
600,000
800,000
1,000,000
1,200,000
1,400,000
1,600,000Deliveries and Supply growth
Delivered Orderbook
0
2
4
6
8
10
12
14
0
50,000
100,000
150,000
200,000
250,000
300,000
350,000VesselsTEU 16K+ Orderbook + Options

TOC As ia – April 2019© Sea-Intelligence Maritime Analysis
Weaker GDP/Goods ratio suggest 1-3% A-E demand growth
6
-15%
-10%
-5%
0%
5%
10%
15%
20%
25%
Asia-Europe Demand & EU economic growthAsia-Europe Demand Growth (TEU) EU Goods Imports (USD)
Average Demand growth: 12.5%Average Goods imp. growth: 5.2%Average GDP growth: 2.5%Demand/Goods imp. Ratio: 2.39Demand/Goods imp. Ratio: 5.19
Average Demand growth: 3.5%Average Goods imp. growth: 1.8%Average GDP growth: 0.9%Demand/Goods imp. Ratio: 1.91Demand/Goods imp. Ratio: 3.77
Average Demand growth: 2.4%Average Goods imp. growth: 3.3%Average GDP growth: 1.6%Demand/Goods imp. Ratio: 0.71Demand/Goods imp. Ratio: 1.45
Average Demand growth: 1.2%Average Goods imp. growth: 4.8%Average GDP growth: 2.3%Demand/Goods imp. Ratio: 0.25Demand/Goods imp. Ratio: 0.52

TOC As ia – April 2019© Sea-Intelligence Maritime Analysis
-20%
-15%
-10%
-5%
0%
5%
10%
15%
20%
Transpacific Demand & US economic growthTranspacific Demand Growth (TEU) US GDP growth (constant prices)
GDP/Goods models suggest TP demand heading to 2-3%
7
Average Demand growth: 7.9%Average Goods imp. growth: 4.7%Average GDP growth: 2.4%Demand/Goods imp. Ratio: 1.68Demand/GDP imp. Ratio: 3.29
Average Demand growth: 3.9%Average Goods imp. growth: 3.3%Average GDP growth: 4.1%Demand/Goods imp. Ratio: 1.18Demand/Goods imp. Ratio: 0.89
TOC As ia – April 2019© Sea-Intelligence Maritime Analysis
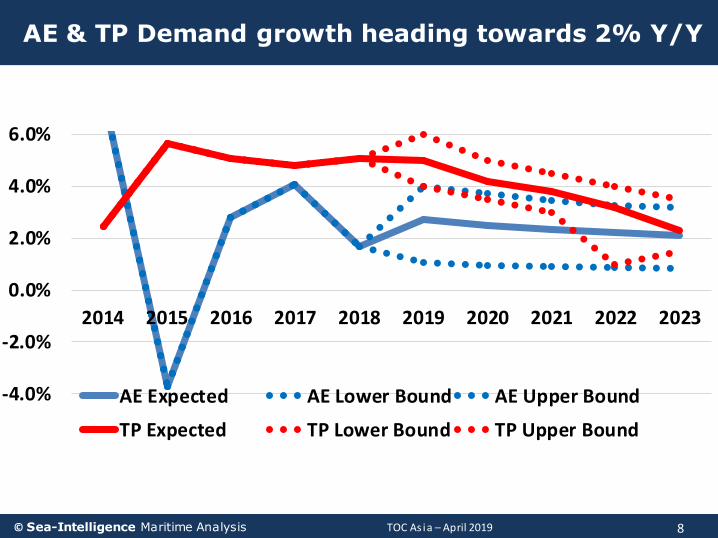
AE & TP Demand growth heading towards 2% Y/Y
8
-4.0%
-2.0%
0.0%
2.0%
4.0%
6.0%
2014 2015 2016 2017 2018 2019 2020 2021 2022 2023
AE Expected AE Lower Bound AE Upper Bound
TP Expected TP Lower Bound TP Upper Bound
TOC As ia – April 2019© Sea-Intelligence Maritime Analysis
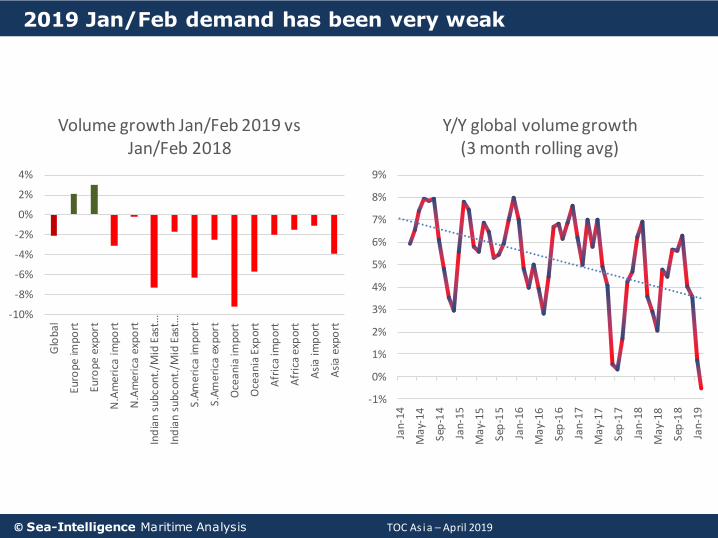
2019 Jan/Feb demand has been very weak
9
-10%
-8%
-6%
-4%
-2%
0%
2%
4%
Glo
bal
Euro
pe im
port
Euro
pe e
xpor
t
N.A
mer
ica
imp
ort
N.A
me
rica
exp
ort
Ind
ian
subc
ont.
/Mid
Eas
t…
Ind
ian
subc
ont.
/Mid
Eas
t…
S.A
me
rica
imp
ort
S.Am
eric
a ex
port
Oce
ani
a im
port
Oce
an
ia E
xpo
rt
Afr
ica
imp
ort
Afr
ica
exp
ort
Asi
a im
por
t
Asi
a ex
port
Volume growth Jan/Feb 2019 vs Jan/Feb 2018
-1%
0%
1%
2%
3%
4%
5%
6%
7%
8%
9%
Jan
-14
May
-14
Sep
-14
Jan
-15
May
-15
Sep
-15
Jan
-16
May
-16
Sep
-16
Jan
-17
May
-17
Sep
-17
Jan
-18
May
-18
Sep
-18
Jan
-19
Y/Y global volume growth (3 month rolling avg)
TOC As ia – April 2019© Sea-Intelligence Maritime Analysis
Impact on carrier returns
10

TOC As ia – April 2019© Sea-Intelligence Maritime Analysis
2018 carrier revenues have been strong
11
Liner Carrier Revenue 2010-2018 in Million USD Change Y/Y
2010 2011 2012 2013 2014 2015 2016 2017 2018 2018-9M* 2017 Y/Y
Maersk Line 26.038 25.108 27.117 26.196 27.351 23.729 20.715 22.023 28.366 21.556 28,8%
CMA CGM N/A 14.900 15.900 15.900 16.739 15.700 16.000 21.116 23.476 18.066 11,2%
COSCO** 7.015 6.497 7.700 7.896 8.183 8.047 9.586 13.336 N/A N/A N/A
Hapag Lloyd 8.222 7.964 9.044 8.997 8.309 10.029 8.138 11.966 13.192 9.966 10,2%
ONE N/A N/A N/A N/A N/A N/A N/A N/A N/A 8.055 N/A
Evergreen*** N/A N/A 4.837 4.622 4.545 4.148 3.839 5.069 5.534 4.263 9,2%
OOCL 6.033 6.012 6.459 6.232 6.522 5.953 5.298 5.425 5.963 4.585 9,9%
Yang Ming N/A N/A 4.508 3.947 4.246 3.954 3.559 4.412 4.638 3.567 5,1%
ZIM 3.717 3.784 3.960 3.682 3.409 2.991 2.539 2.978 3.248 2.497 9,1%
HMM 7.258 6.408 7.554 6.695 5.966 4.800 3.798 4.715 4.700 3.699 -0,3%
Wan Hai N/A N/A 2.159 1.982 2.110 1.980 1.769 2.046 2.184 1.669 6,8%
*Q2-Q4 as originally reported **COSCO SHIPPING Holdings Co., Ltd. ***Evergreen Marine Corp. (Taiwan) Ltd.
TOC As ia – April 2019© Sea-Intelligence Maritime Analysis
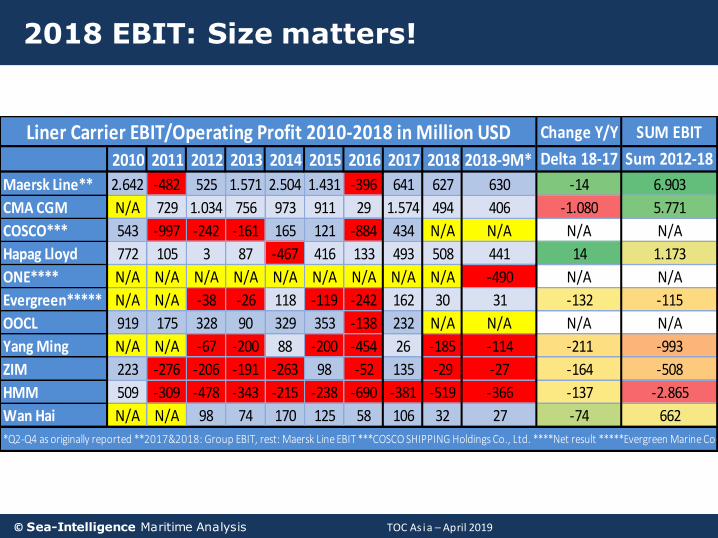
2018 EBIT: Size matters!
12
Change Y/Y SUM EBIT
2010 2011 2012 2013 2014 2015 2016 2017 2018 2018-9M* Delta 18-17 Sum 2012-18
Maersk Line** 2.642 -482 525 1.571 2.504 1.431 -396 641 627 630 -14 6.903
CMA CGM N/A 729 1.034 756 973 911 29 1.574 494 406 -1.080 5.771
COSCO*** 543 -997 -242 -161 165 121 -884 434 N/A N/A N/A N/A
Hapag Lloyd 772 105 3 87 -467 416 133 493 508 441 14 1.173
ONE**** N/A N/A N/A N/A N/A N/A N/A N/A N/A -490 N/A N/A
Evergreen***** N/A N/A -38 -26 118 -119 -242 162 30 31 -132 -115
OOCL 919 175 328 90 329 353 -138 232 N/A N/A N/A N/A
Yang Ming N/A N/A -67 -200 88 -200 -454 26 -185 -114 -211 -993
ZIM 223 -276 -206 -191 -263 98 -52 135 -29 -27 -164 -508
HMM 509 -309 -478 -343 -215 -238 -690 -381 -519 -366 -137 -2.865
Wan Hai N/A N/A 98 74 170 125 58 106 32 27 -74 662
Liner Carrier EBIT/Operating Profit 2010-2018 in Million USD
*Q2-Q4 as originally reported **2017&2018: Group EBIT, rest: Maersk Line EBIT ***COSCO SHIPPING Holdings Co., Ltd. ****Net result *****Evergreen Marine Corp. (Taiwan) Ltd.
TOC As ia – April 2019© Sea-Intelligence Maritime Analysis
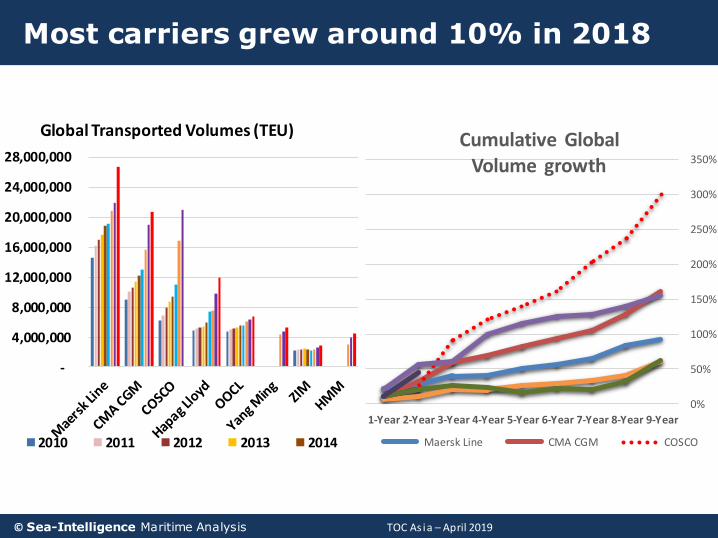
Most carriers grew around 10% in 2018
13
0%
50%
100%
150%
200%
250%
300%
350%
9-Year 8-Year 7-Year 6-Year 5-Year 4-Year 3-Year 2-Year 1-Year
Cumulative Global Volume growth
Maersk Line CMA CGM COSCO
-
4,000,000
8,000,000
12,000,000
16,000,000
20,000,000
24,000,000
28,000,000
Global Transported Volumes (TEU)
2010 2011 2012 2013 2014
TOC As ia – April 2019© Sea-Intelligence Maritime Analysis
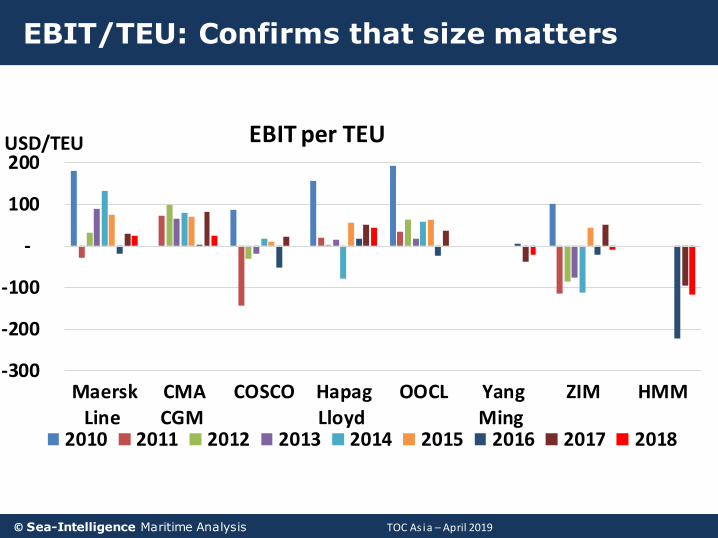
EBIT/TEU: Confirms that size matters
14
-300
-200
-100
-
100
200
MaerskLine
CMACGM
COSCO HapagLloyd
OOCL YangMing
ZIM HMM
USD/TEU EBIT per TEU
2010 2011 2012 2013 2014 2015 2016 2017 2018
TOC As ia – April 2019© Sea-Intelligence Maritime Analysis
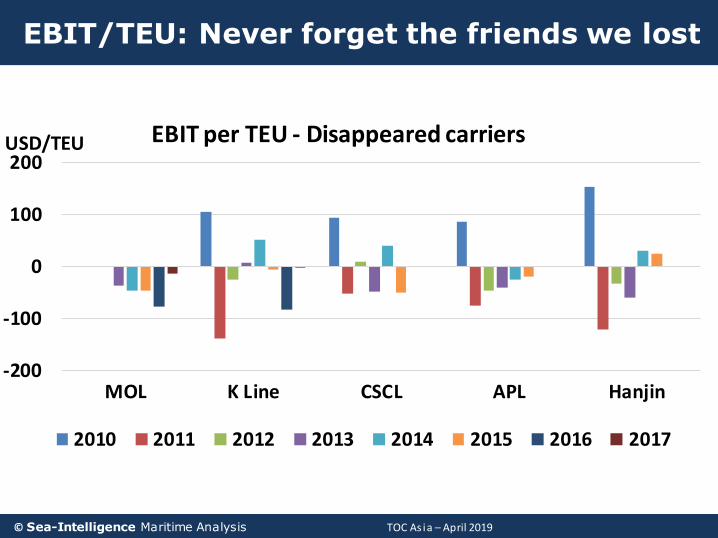
EBIT/TEU: Never forget the friends we lost
15
-200
-100
0
100
200
MOL K Line CSCL APL Hanjin
USD/TEU EBIT per TEU - Disappeared carriers
2010 2011 2012 2013 2014 2015 2016 2017
TOC As ia – April 2019© Sea-Intelligence Maritime Analysis
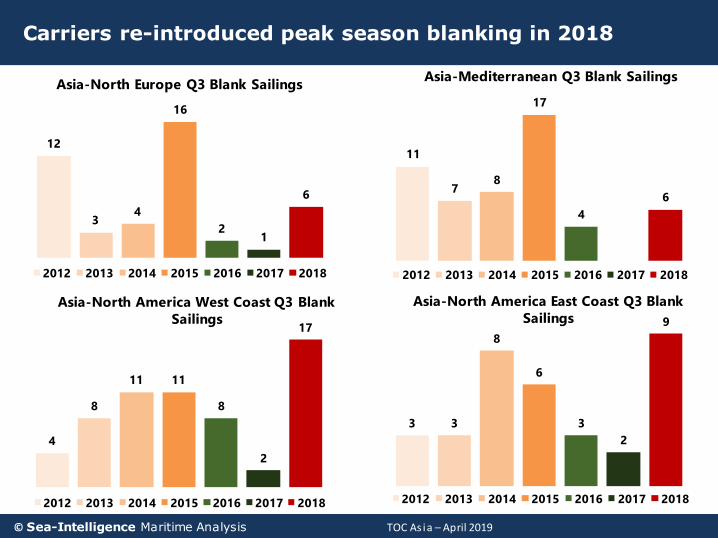
Carriers re-introduced peak season blanking in 2018
16
12
34
16
21
6
Asia-North Europe Q3 Blank Sailings
2012 2013 2014 2015 2016 2017 2018
11
78
17
4
6
Asia-Mediterranean Q3 Blank Sailings
2012 2013 2014 2015 2016 2017 2018
4
8
11 11
8
2
17
Asia-North America West Coast Q3 Blank
Sailings
2012 2013 2014 2015 2016 2017 2018
3 3
8
6
3
2
9
Asia-North America East Coast Q3 Blank
Sailings
2012 2013 2014 2015 2016 2017 2018
TOC As ia – April 2019© Sea-Intelligence Maritime Analysis
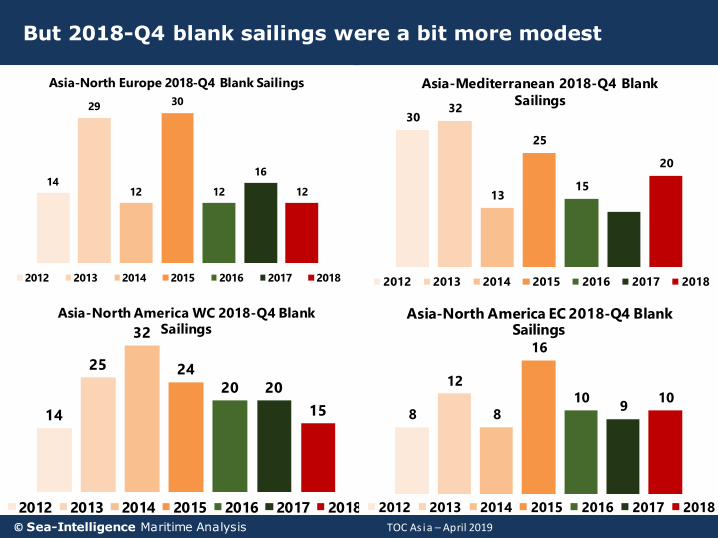
But 2018-Q4 blank sailings were a bit more modest
17
14
29
12
30
12
16
12
Asia-North Europe 2018-Q4 Blank Sailings
2012 2013 2014 2015 2016 2017 2018
3032
13
25
15
20
Asia-Mediterranean 2018-Q4 Blank
Sailings
2012 2013 2014 2015 2016 2017 2018
14
25
32
24
20 20
15
Asia-North America WC 2018-Q4 Blank Sailings
2012 2013 2014 2015 2016 2017 2018
8
12
8
16
109
10
Asia-North America EC 2018-Q4 Blank Sailings
2012 2013 2014 2015 2016 2017 2018

TOC As ia – April 2019© Sea-Intelligence Maritime Analysis
And 2019-Q1 blank sailings are in the higher end
18
26
17
22
26
29
13
21 20
Asia-North Europe 2018-Q4 Blank
Sailings
2012 2013 2014 2015 2016 2017 2018 2019
1820
1718
13
911
15
Asia-Mediterranean 2018-Q4 Blank Sailings
2012 2013 2014 2015 2016 2017 2018 2019
24
41 41
79
36
26
4552
Asia-North America West Coast 2019-Q1 Blank Sailings
2012 2013 2014 2015 2016 2017 2018 2019
8
23
13
9
23
9
22 21
Asia-North America East Coast 2019-Q1 Blank Sailings
2012 2013 2014 2015 2016 2017 2018 2019

TOC As ia – April 2019© Sea-Intelligence Maritime Analysis
Modeling TP contract rates on spot suggests a 20% increase
19
0
200
400
600
800
1000
1200
1400
Mar
-09
De
c-0
9Se
p-1
0Ju
n-1
1M
ar-1
2D
ec-
12
Sep
-13
Jun
-14
Mar
-15
De
c-1
5Se
p-1
6Ju
n-1
7M
ar-1
8D
ec-
18
CCFI versus model based on
spot rates (Asia-USWC)
CCFI-40%
-35%
-30%
-25%
-20%
-15%
-10%
-5%
0%
5%
10%
15%
Mar
-09
De
c-0
9Se
p-1
0Ju
n-1
1M
ar-1
2D
ec-
12
Sep
-13
Jun
-14
Mar
-15
De
c-1
5Se
p-1
6Ju
n-1
7M
ar-1
8D
ec-
18
Contract rate deviation from
spot model (Asia-USWC)

TOC As ia – April 2019© Sea-Intelligence Maritime Analysis
Impact on service levels
20
TOC As ia – April 2019© Sea-Intelligence Maritime Analysis
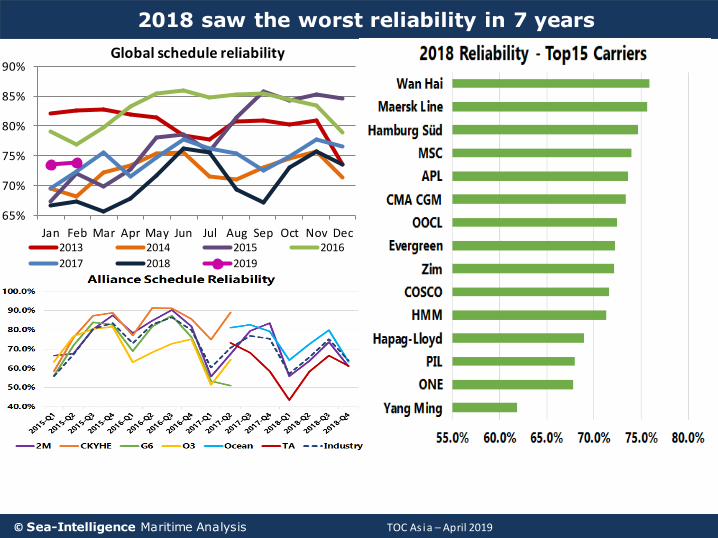
21
2018 saw the worst reliability in 7 years
65%
70%
75%
80%
85%
90%
Jan Feb Mar Apr May Jun Jul Aug Sep Oct Nov Dec
Global schedule reliability
2013 2014 2015 2016
2017 2018 2019

TOC As ia – April 2019© Sea-Intelligence Maritime Analysis
22
2018 reliability especially bad in Transpacific
30%35%40%45%50%55%60%65%70%75%80%85%
Asia-NAWC Alliance schedule reliability
2M Ocean TA
25%
35%
45%
55%
65%
75%
85%
Asia-NAEC Alliance schedule reliability
2M Ocean TA
10%20%30%40%50%60%70%80%90%
Asia - NAWC schedule reliability
2013 2014 2015 2016
30%35%40%45%50%55%60%65%70%75%80%85%90%
Asia - NAEC schedule reliability
2013 2014 2015 2016
TOC As ia – April 2019© Sea-Intelligence Maritime Analysis
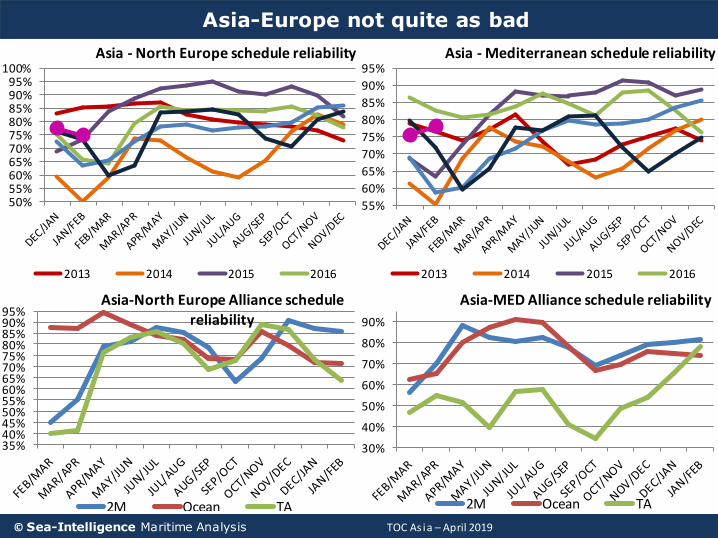
23
Asia-Europe not quite as bad
50%55%60%65%70%75%80%85%90%95%
100%Asia - North Europe schedule reliability
2013 2014 2015 2016
55%
60%
65%
70%
75%
80%
85%
90%
95%Asia - Mediterranean schedule reliability
2013 2014 2015 2016
35%40%45%50%55%60%65%70%75%80%85%90%95%
Asia-North Europe Alliance schedule reliability
2M Ocean TA
30%
40%
50%
60%
70%
80%
90%
Asia-MED Alliance schedule reliability
2M Ocean TA

TOC As ia – April 2019© Sea-Intelligence Maritime Analysis
Asia-NEUR service disruptions
24
TOC As ia – April 2019© Sea-Intelligence Maritime Analysis
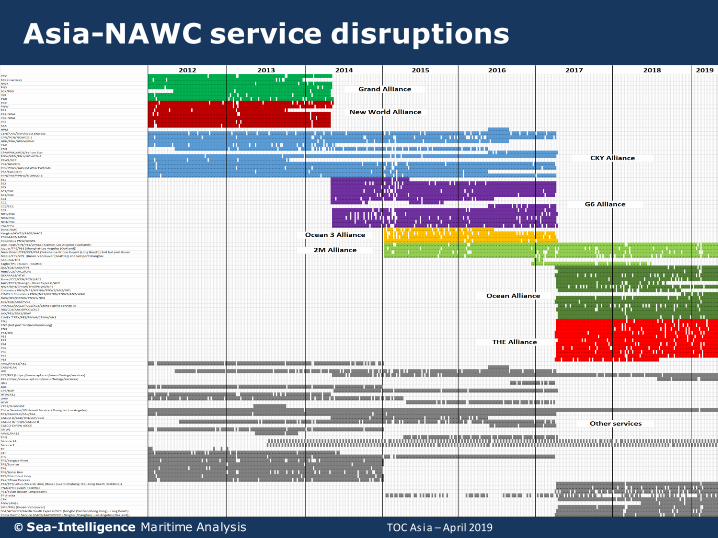
Asia-NAWC service disruptions
25

TOC As ia – April 2019© Sea-Intelligence Maritime Analysis
No. of direct ports has steadily declined
26
180
190
200
210
220
230
Asia-NEUR Distinct Port-Pairs
250
270
290
310
330
350
370
Asia-MED Distinct Port-Pairs
All Services Dedicated Asia-MED Services

TOC As ia – April 2019© Sea-Intelligence Maritime Analysis
Direct TP port-pairs see a sharp decline in 2018
27
140
150
160
170
180Asia-NAWC Distinct Port-Pairs
130
140
150
160
170Asia-NAEC Distinct Port-Pairs
TOC As ia – April 2019© Sea-Intelligence Maritime Analysis
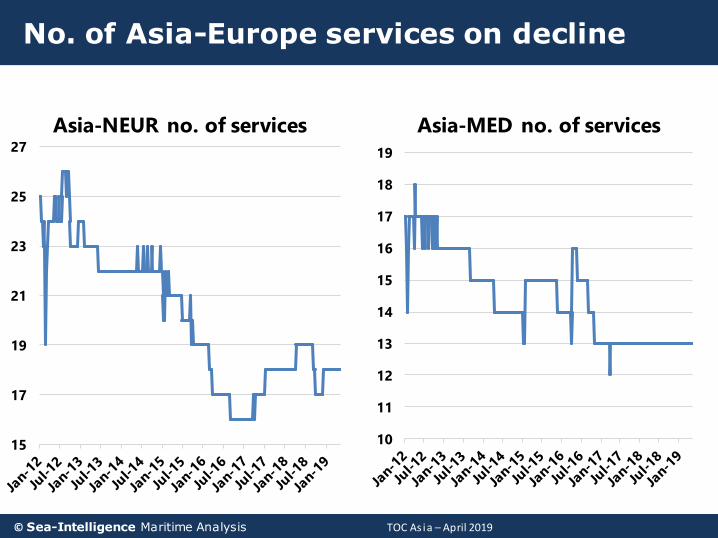
No. of Asia-Europe services on decline
28
15
17
19
21
23
25
27
Asia-NEUR no. of services
10
11
12
13
14
15
16
17
18
19
Asia-MED no. of services

TOC As ia – April 2019© Sea-Intelligence Maritime Analysis
No. of Transpac services seems to have stabilised
29
35
37
39
41
43
45
47
49
Jan
-12
Jul-
12
Jan
-13
Jul-
13
Jan
-14
Jul-
14
Jan
-15
Jul-
15
Jan
-16
Jul-
16
Jan
-17
Jul-
17
Jan
-18
Jul-
18
Jan
-19
Asia-NAWC no. of services
15
16
17
18
19
20
21
22
23
24
25
Jan
-12
Jul-
12
Jan
-13
Jul-
13
Jan
-14
Jul-
14
Jan
-15
Jul-
15
Jan
-16
Jul-
16
Jan
-17
Jul-
17
Jan
-18
Jul-
18
Jan
-19
Asia-NAEC no. of services

TOC As ia – April 2019© Sea-Intelligence Maritime Analysis
Concluding remarks
30
Things are gradually getting better for the shipping lines, but service levels are poor
• Supply/Demand balance slowly improving, with a pre-2009 balance possible by 2022-2023
• The market consolidation has mitigated the worst excesses of the past
• Service levels have been very poor in recent years
There are a number of major risks to this outlook
• If carriers fail to pass on the IMO 2020 bunker costs, they will be forced to lay up significant tonnage, with massive disruptions to service networks.
• Demand is slowing down to a long-term growth rate of 2-3% on the main East-West trades.
• The EU Commission may end the Block Exemption Regulation in 2020, making alliances and VSAs more difficult to set up, and more costly to run.
• Irrational vessel ordering (HMM?) could lead to a price war.
In the short term, expect carriers to fight for rate increase on TP
• Contract rates are 20% below comparable spot rates, and carriers showed in the 2018 peak season they are ready to cut capacity deep in order to get rates up.
• Service levels are likely to remain poor, at least to the turn of 2020.

TOC As ia – April 2019© Sea-Intelligence Maritime Analysis
Notes on the 2020 IMO Low-Sulphur requirement
31
TOC As ia – April 2019© Sea-Intelligence Maritime Analysis
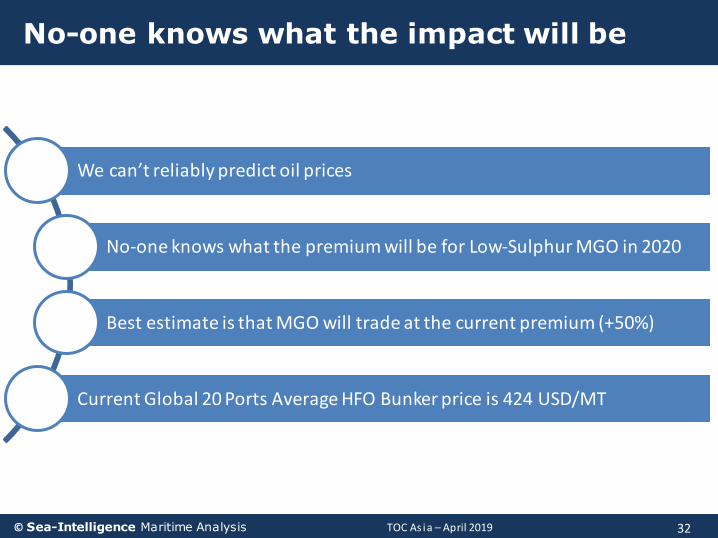
No-one knows what the impact will be
32
We can’t reliably predict oil prices
No-one knows what the premium will be for Low-Sulphur MGO in 2020
Best estimate is that MGO will trade at the current premium (+50%)
Current Global 20 Ports Average HFO Bunker price is 424 USD/MT
TOC As ia – April 2019© Sea-Intelligence Maritime Analysis
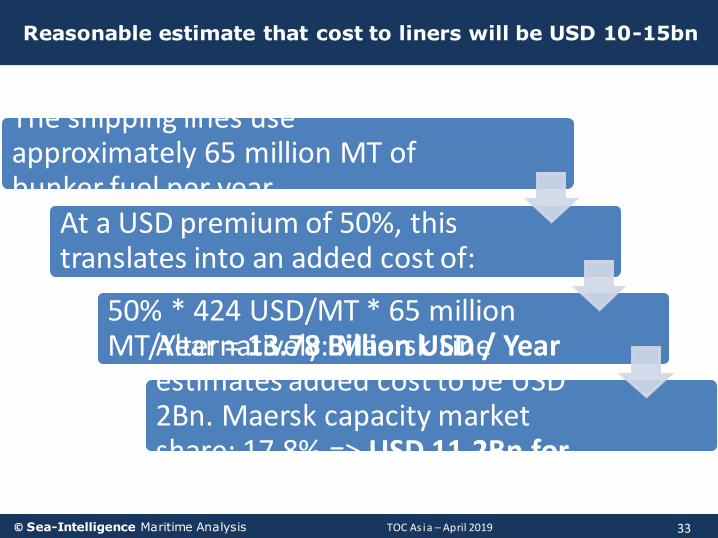
Reasonable estimate that cost to liners will be USD 10-15bn
33
The shipping lines use approximately 65 million MT of bunker fuel per year
At a USD premium of 50%, this translates into an added cost of:
50% * 424 USD/MT * 65 million MT/Year = 13.78 Billion USD / YearAlternatively: Maersk Line
estimates added cost to be USD 2Bn. Maersk capacity market share: 17.8% => USD 11.2Bn for Industry
TOC As ia – April 2019© Sea-Intelligence Maritime Analysis
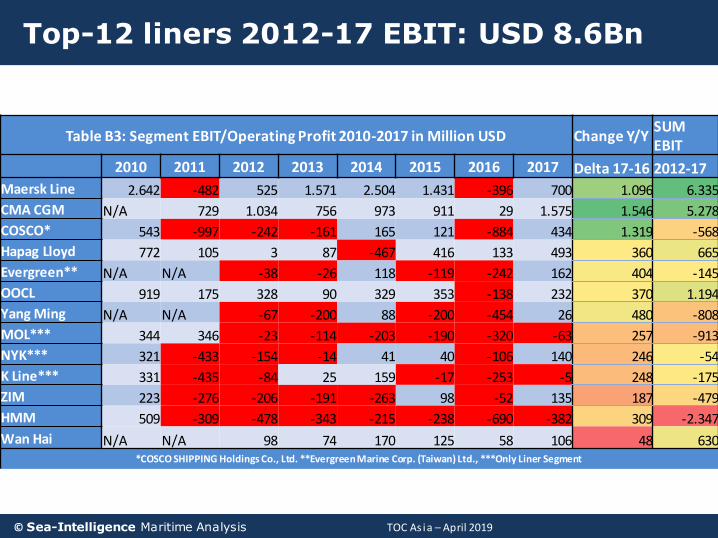
Top-12 liners 2012-17 EBIT: USD 8.6Bn
34
Table B3: Segment EBIT/Operating Profit 2010-2017 in Million USD Change Y/YSUM EBIT
2010 2011 2012 2013 2014 2015 2016 2017 Delta 17-16 2012-17
Maersk Line 2.642 -482 525 1.571 2.504 1.431 -396 700 1.096 6.335
CMA CGM N/A 729 1.034 756 973 911 29 1.575 1.546 5.278
COSCO* 543 -997 -242 -161 165 121 -884 434 1.319 -568
Hapag Lloyd 772 105 3 87 -467 416 133 493 360 665
Evergreen** N/A N/A -38 -26 118 -119 -242 162 404 -145
OOCL 919 175 328 90 329 353 -138 232 370 1.194
Yang Ming N/A N/A -67 -200 88 -200 -454 26 480 -808
MOL*** 344 346 -23 -114 -203 -190 -320 -63 257 -913
NYK*** 321 -433 -154 -14 41 40 -106 140 246 -54
K Line*** 331 -435 -84 25 159 -17 -253 -5 248 -175
ZIM 223 -276 -206 -191 -263 98 -52 135 187 -479
HMM 509 -309 -478 -343 -215 -238 -690 -382 309 -2.347
Wan Hai N/A N/A 98 74 170 125 58 106 48 630*COSCO SHIPPING Holdings Co., Ltd. **Evergreen Marine Corp. (Taiwan) Ltd., ***Only Liner Segment
TOC As ia – April 2019© Sea-Intelligence Maritime Analysis
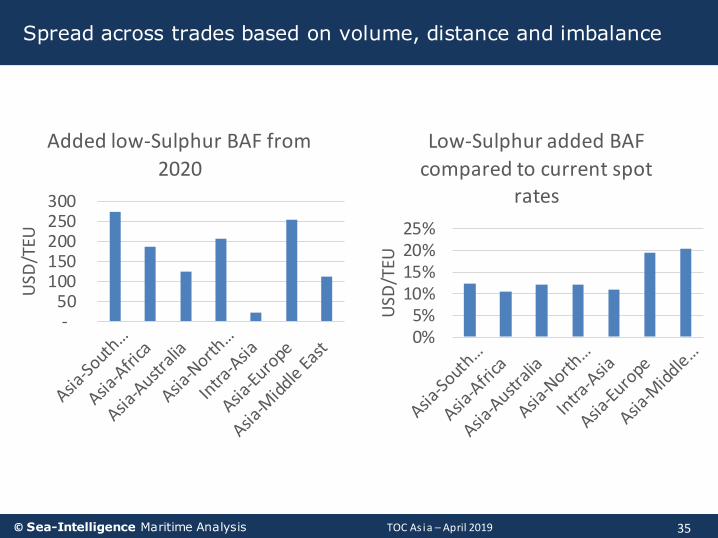
Spread across trades based on volume, distance and imbalance
35
- 50
100 150 200 250 300
USD
/TEU
Added low-Sulphur BAF from
2020
0%5%
10%15%20%25%
USD
/TEU
Low-Sulphur added BAF
compared to current spot rates
TOC As ia – April 2019© Sea-Intelligence Maritime Analysis
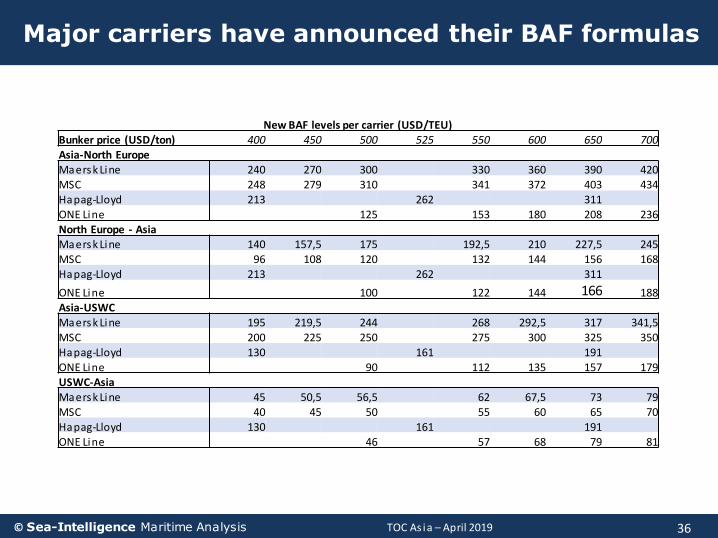
Major carriers have announced their BAF formulas
36
New BAF levels per carrier (USD/TEU)Bunker price (USD/ton) 400 450 500 525 550 600 650 700Asia-North EuropeMaersk Line 240 270 300 330 360 390 420MSC 248 279 310 341 372 403 434Hapag-Lloyd 213 262 311ONE Line 125 153 180 208 236North Europe - AsiaMaersk Line 140 157,5 175 192,5 210 227,5 245MSC 96 108 120 132 144 156 168Hapag-Lloyd 213 262 311
ONE Line 100 122 144 166 188Asia-USWCMaersk Line 195 219,5 244 268 292,5 317 341,5MSC 200 225 250 275 300 325 350Hapag-Lloyd 130 161 191ONE Line 90 112 135 157 179USWC-AsiaMaersk Line 45 50,5 56,5 62 67,5 73 79MSC 40 45 50 55 60 65 70Hapag-Lloyd 130 161 191ONE Line 46 57 68 79 81
TOC As ia – April 2019© Sea-Intelligence Maritime Analysis
Alliances and consolidation
37
TOC As ia – April 2019© Sea-Intelligence Maritime Analysis
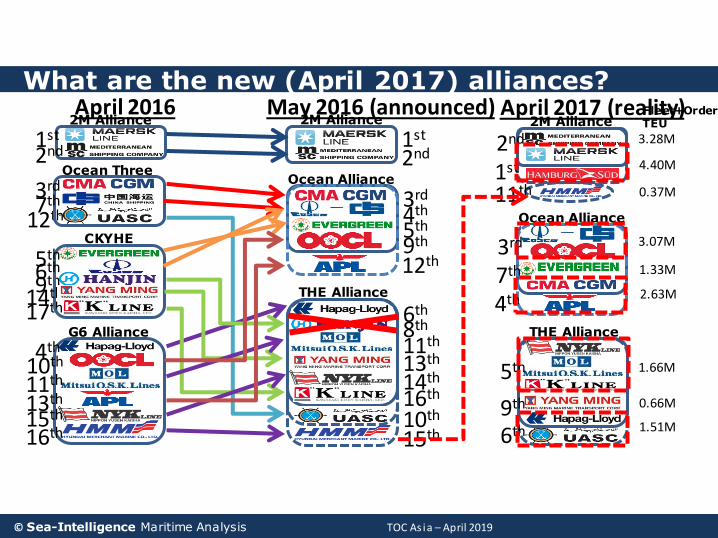
9th
17th
CKYHE
14th
5th6th
2M Alliance
1st
2nd
THE Alliance
14th
8th6th
13th11th
16th
15th
G6 Alliance
4th
10th
11th
13th
15th
16th
12th
Ocean Three
3rd
7th
Ocean Alliance
3rd
9th
4th
5th
12th
What are the new (April 2017) alliances?
38
2M Alliance
Ocean Alliance
THE Alliance
April 2017 (reality)
1st
2nd
7th
4th
11th
3rd
5th
9th
6th
4.40M
3.28M
1.33M
2.63M
0.37M
3.07M
1.66M
0.66M
1.51M
Fleet+OrderTEU
April 20162M Alliance
1st
2nd
May 2016 (announced)
10th
TOC As ia – April 2019© Sea-Intelligence Maritime Analysis
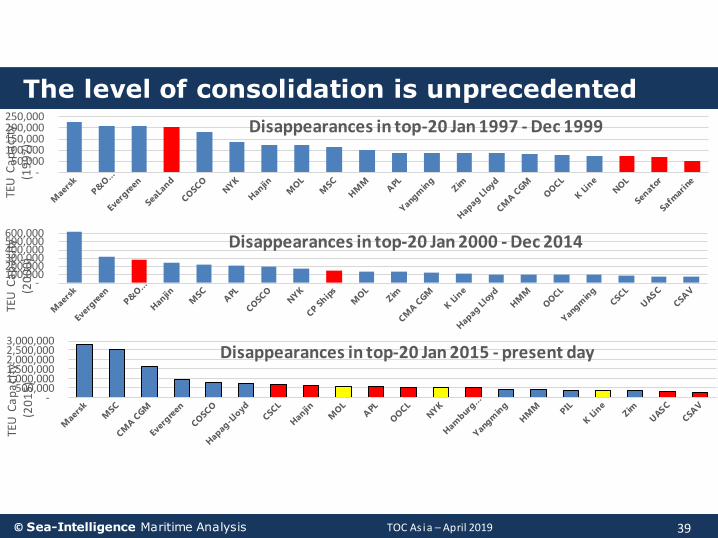
- 100,000 200,000 300,000 400,000 500,000 600,000
TEU
Ca
pa
city
(2
00
0)
Disappearances in top-20 Jan 2000 - Dec 2014
The level of consolidation is unprecedented
39
- 50,000
100,000 150,000 200,000 250,000
TEU
Ca
pa
city
(1
99
7)
Disappearances in top-20 Jan 1997 - Dec 1999
- 500,000
1,000,000 1,500,000 2,000,000 2,500,000 3,000,000
TEU
Ca
pa
city
(2
01
5)
Disappearances in top-20 Jan 2015 - present day
TOC As ia – April 2019© Sea-Intelligence Maritime Analysis
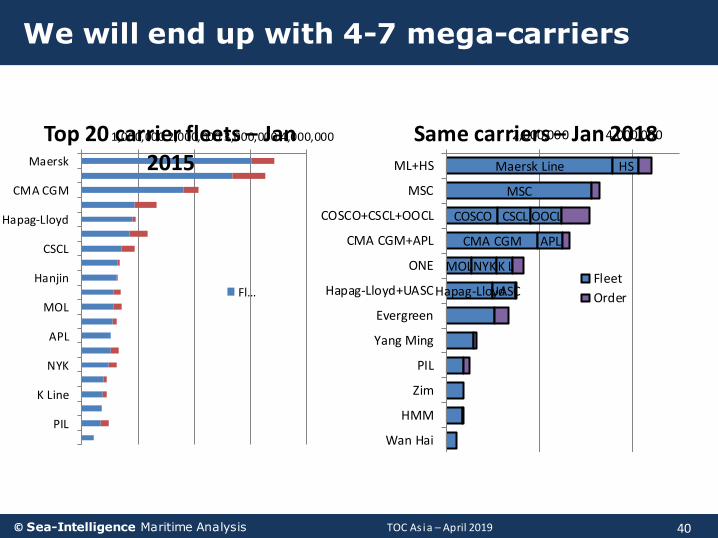
We will end up with 4-7 mega-carriers
40
1,000,000 2,000,000 3,000,000 4,000,000
Maersk
CMA CGM
Hapag-Lloyd
CSCL
Hanjin
MOL
APL
NYK
K Line
PIL
Top 20 carrier fleets – Jan 2015
Fl…
Maersk Line
MSC
COSCO
CMA CGM
MOL
Hapag-Lloyd
HS
CSCL
APL
NYK
UASC
OOCL
K L
2,000,000 4,000,000
ML+HS
MSC
COSCO+CSCL+OOCL
CMA CGM+APL
ONE
Hapag-Lloyd+UASC
Evergreen
Yang Ming
PIL
Zim
HMM
Wan Hai
Same carriers – Jan 2018
Fleet
Order
TOC As ia – April 2019© Sea-Intelligence Maritime Analysis
Front-loading of 2019-Q1 volumes due to US-China tariff hike
41

TOC As ia – April 2019© Sea-Intelligence Maritime Analysis
CTS data shows a loading surge in November
42
0.3
%
-5.1
%
20
.5%
5.2
%
5.0
%
0.6
%
-7.7
%
-4.9
%
1.9
%
6.9
%
3.5
%
-8.2
%
1.2
%
0.6
%
11
.7%
23
.0%
13
.1%
14
.2%
4.2
%
4.9
%
-0.8
%
1.0
%
7.6
%
3.8
%
3.5
%
3.0
%
6.6
%
4.0
%
9.6
%
19
.5%
4.5
%
6.0
%
OCT NOV DEC JAN
Oct-Jan Y/Y TP volume growth – NOTE: Time of loading
2012 2013 2014 2015 2016 2017 2012-17 Avg 2018

TOC As ia – April 2019© Sea-Intelligence Maritime Analysis
But limited imports surge, and only in NAWC
43
-6.4
%
-3.8
%
-9.0
% -2.2
%
-1.7
%
0.5
%7.3
% 13
.2%
2.7
%
10
.7%
9.4
%
10
.5%
2013 2014 2015 2016 2017 2018
North America East Coast
Q4 Laden Import Volumes
Q/Q
-7.4
%
-7.3
%
-10
.1% -2
.0%
-4.3
%
2.5
%
2.4
%
3.2
%
1.5
% 7.2
%
6.6
%
9.0
%
2013 2014 2015 2016 2017 2018
North America West Coast
Q4 Laden Import Volumes
Q/Q