2019 CITY COUNCIL FINANCIAL FORECAST STUDY SESSION …
19
2019 CITY COUNCIL FINANCIAL FORECAST STUDY SESSION GENERAL FUND FINANCIAL FORECAST 2019-2029
Transcript of 2019 CITY COUNCIL FINANCIAL FORECAST STUDY SESSION …

2019 CITY COUNCIL FINANCIAL FORECAST STUDY SESSION
GENERAL FUND FINANCIAL FORECAST
2019-2029

INTRODUCTION
The past year saw mostly positive economic indicators combined with fairly stable revenues. Most economic forecasts are predicting growth in the economy to continue through the end of 2019, but at a lesser pace than 2018. With unemployment levels remaining at historic lows, businesses face a shrinking pool of available workers which could potentially slow growth during the year. Investments in technology should increase worker productivity and offset any negative impacts of a labor shortage. Inflation remains key for economic growth as the Federal Reserve has held interest rates steady due to lower than expected inflation. Property assessed valuations have stabilized both nationwide and locally with increases in La Mesa's property values consistently outpacing the countywide average. Sales tax revenues have been mostly positive over the past few years but mostly flat over the past year as the trends in consumer purchases move from traditionally big-box physical locations to online, digital, and service and entertainment-oriented purchases. Most economic forecasts (both national and local) predict a positive economic growth through the end of 2019 although at a lesser pace than 2018.
La Mesa continues to benefit from the current economic environment with strong increases in property values and property tax revenues and continued growth in both sales and Proposition L transaction tax revenues. In 2008, the citizens of La Mesa approved the Proposition L Sales Tax Measure, a general% cent sales tax, in order to maintain "vital city services" while helping to rebuild depleted General Fund reserves. Since that time, the revenue received from the Proposition L Sales Tax has become an essential component of the General Fund revenues and has allowed the City to maintain operations without declines in service levels.
Beginning this year and at the Council's direction at the 2018 Strategic Workshop, the General Fund Financial Forecast takes a longer view by extending the forecast period to 2029-2030. The forecast reflects continued moderate increases to revenues throughout the forecast period, offset by increases in costs, primarily in pension costs. The forecast also includes the final year of Proposition L Sales Tax revenues (2028-2029) and the first year (2029-2030) without these vital revenues. As in previous . forecasts, rising pension obligation costs remain the single fastest increasing expenditure for the General Fund. Anticipated increases in pension contributions based on all information available from CalPERS are included in the forecast. Helping to offset to the rising pension obligation costs are recently negotiated cost sharing agreements begun in the current fiscal year and anticipated contributions from the Section 115 Retirement Trust Fund, included in the forecast to begin in 2024-2025. Finally, General Fund reserve balances reflecting the net effects of anticipated revenues and expenditures are projected through 2029-2030.
In addition to the base forecast presented in this report, additional scenarios are presented at the end of this forecast that illustrate the effects of increases in existing revenues on General Fund reserves.
Page 2
2019-2030 General Fund Financial Forecast
ECONOMY
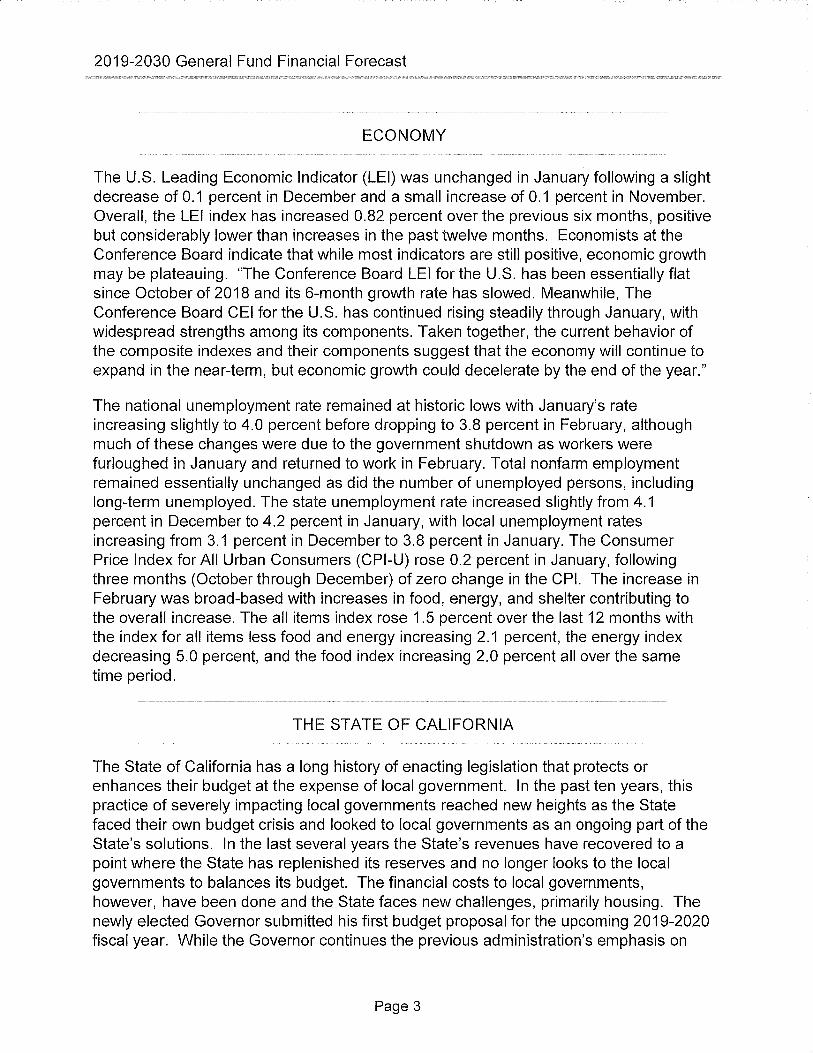
The U.S. Leading Economic Indicator (LEI) was unchanged in January following a slight decrease of 0.1 percent in December and a small increase of 0.1 percent in November. Overall, the LEI index has increased 0.82 percent over the previous six months, positive but considerably lower than increases in the past twelve months. Economists at the Conference Board indicate that while most indicators are still positive, economic growth may be plateauing. "The Conference Board LEI for the U.S. has been essentially flat since October of 2018 and its 6-month growth rate has slowed. Meanwhile, The Conference Board CEI for the U.S. has continued rising steadily through January, with widespread strengths among its components. Taken together, the current behavior of the composite indexes and their components suggest that the economy will continue to expand in the near-term, but economic growth could decelerate by the end of the year."
The national unemployment rate remained at historic lows with January's rate increasing slightly to 4.0 percent before dropping to 3.8 percent in February, although much of these changes were due to the government shutdown as workers were furloughed in January and returned to work in February. Total nonfarm employment remained essentially unchanged as did the number of unemployed persons, including long-term unemployed. The state unemployment rate increased slightly from 4.1 percent in December to 4.2 percent in January, with local unemployment rates increasing from 3.1 percent in December to 3.8 percent in January. The Consumer Price Index for All Urban Consumers (CPI-U) rose 0.2 percent in January, following three months (October through December) of zero change in the CPI. The increase in February was broad-based with increases in food, energy, and shelter contributing to the overall increase. The all items index rose 1.5 percent over the last 12 months with the index for all items less food and energy increasing 2.1 percent, the energy index decreasing 5.0 percent, and the food index increasing 2.0 percent all over the same time period.
THE STATE OF CALIFORNIA
The State of California has a long history of enacting legislation that protects or enhances their budget at the expense of local government. In the past ten years, this practice of severely impacting local governments reached new heights as the State faced their own budget crisis and looked to local governments as an ongoing part of the State's solutions. In the last several years the State's revenues have recovered to a point where the State has replenished its reserves and no longer looks to the local governments to balances its budget. The financial costs to local governments, however, have been done and the State faces new challenges, primarily housing. The newly elected Governor submitted his first budget proposal for the upcoming 2019-2020 fiscal year. While the Governor continues the previous administration's emphasis on
Page 3
2019-2030 General Fund Financial Forecast
paying down the state's liabilities, including pension liabilities and budgetary debts, the budget also reflects his priorities by funding early childhood education, affordable higher education, and steps to address the housing crisis. The following is a synopsis of two of the most significant State actions with financial implications in recent years.
DISSOLUTION OF REDEVELOPMENT
In 2012, the State Department of Finance began the process of the dissolution of Redevelopment. Since that time, the DOF has disallowed loan payments between the Agency and the City beginning with ongoing debt service payments of approximately $1 million per year on pre-existing loans between the Agency and the General Fund. In subsequent years, the State disallowed the ongoing debt service payments on the former Police Station land site and payment of the portion of the Certificates of Participation issued for the construction of the library and previously paid by Redevelopment Agency. In 2015, as part of the requirements of the Dissolution Act, the State Controller's Office (SCO) completed their Asset Transfer Review and issued their final report. In their report, the SCO found that $2.4 million transferred from the former redevelopment agency to the City was unallowable and has ordered the return of those funds. Appropriation of these funds was included in the forecast as a one-time expenditure of funds in 2016-2017 and remains reserved in the event of payment.
In 2017, the State Department of Finance approved the reinstatement and repayment of the former Redevelopment Agency's deferred housing set-aside funds in the amount of $3.1 million to the Housing Successor Agency and the debt service payments on the former Police Station land site. While this is very positive news, repayment of the deferred housing set-aside funds takes priority before the General Fund begins receiving repayment of the debt service. In addition, the recent legislation requires that 20% of the loan repayments for the Police Station land site be transferred to the Housing Successor Agency to be used for housing activities. Based on projections of future RPTTF and estimated repayment amounts, the General Fund may begin receiving repayment of the Police Station land as early as 2026-2027.
FUNDING OF THE CALPERS RETIREMENT SYSTEM
In recent years, the CalPERS Board has made significant changes in the retirement systems that have had a significant impact on benefits and employer contributions. These changes include:
• Reduction of the Discount Rate from 7.75 percent to 7.5 percent (2012) • Public Employees' Pension Reform Act of 2013 (PEPRA) • Changes to the amortization and smoothing policies of unfunded liabilities (2013) 111 Changes to the inflation factor and mortality assumptions (2014)
Page 4

2019-2030 General Fund Financial Forecast
e Conversion of unfunded liability contributions from percentage of current payroll to fixed amount (2016)
• Additional reduction of the discount rate from 7.5 percent to 7.0 percent (2016) • Change in the unfunded liability amortization policy from 30 to 20 years (2018)
The cumulative effect of these changes was a rapid increase to the City's required contributions beginning in 2009 and continuing through today. To address these increases, the City of La Mesa implemented various measures aimed at containing and ultimately reducing the future retirement costs, including:
• Implemented reduced Tier 2 retirement benefit plans (2011) • Established a Section 115 Retirement Trust Fund and made initial contribution of
$1.5 million (2016) • Authorized additional contributions to the Section 115 Retirement Trust Fund of
$600,000 (2017), and $3,170,391 (2018) @ Negotiated additional cost sharing agreements by City employees toward total
pension costs (2018)
Based on actuarial valuations, the payments towards the City's unfunded liability is expected to reach the highest point in roughly 2025 and remain at these high levels before beginning to decline in 2035. Setting aside these Section 115 Trust funds provides opportunities to help offset those costs with several years to determine the best course of action.
FINANCIAL FORECAST BACKGROUND
The General Fund Financial Forecast is a tool that focuses attention on the longer-term impacts of policy decisions on the City's primary operating fund. The General Fund is the City's largest fund and provides funding for the majority of the day-to-day services of the City to its citizens. The "forecast" is not intended to be a prediction of a particular outcome but rather to be used as a model to test reasonable scenarios we might expect in the coming years. These scenarios are intended to assist in setting realistic expectations in matching revenues with programs and projects that will meet Council objectives.
The Forecast Model is a spreadsheet-based model that projects the City's current mix of revenues and expenditures through ten years into the future. The forecasting model uses a variety of information and techniques, including historical trend analysis, projections from local and regional sources, and various economic data. The Financial Forecast builds off the actual prior fiscal years' revenues, expenditures, and ending reserves, projects the estimated 2018-2019 revenues, expenditures, and ending reserves, and incorporates known factors (such as the increase in pension costs) into
Page 5

2019-2030 General Fund Financial Forecast
the 2019-2030 projections. Revenues, expenditures, and ending reserves are then projected using the base assumptions as detailed below.
GENERAL FORECASTING ASSUMPTIONS
The Financial Forecast assumptions are based on the most current information available. Revenue assumptions are generally moderate with particular attention given to the top three revenues that represent almost 80 percent of total revenues. Expenditure assumptions are based on maintaining current service levels while containing cost increases. The Forecast assumes the continuation of Council adopted fee cost recovery policies.
BASE REVENUE ASSUMPTIONS
2019-2030 GENERAL FUND FINANCIAL FORECAST REVENUE PROJECTIONS
$60,000,000 ~-------------------------
n Ii sso,000,000 -1----------------r-1·
S4o,ooo,ooo +-------11 11, ;1- ~
111- ------ • - •1--1a-a--P1---r - - - ,__ ~ -
$30,000,000 - - - ~ - - - - -- o----tl!0--1• ---<• -
$20,000,000
$10,000,000 +-•r-••---<• - - 1- • 1-11---1ar-1•- 1- - - - - - -
Page 6
OTHER REVENUE
SERVICE CHARGES
REVENUE FROM OTHER AGENCY
• USE OF MONEY & PROPERTY
• FINES,FORFEIT&PENALTIES
a LICENSES AND PERMITS
SALES TAX (TRIPLE FLI P ADJ)
• PROPERTY TAX (TAX INC)
• OTHER TAXES
a PROP L SALES TAX
• BASE SALES TAX
• PROPERTY TAXES
NB0%of General Fund Revenue comes from Property Tax,Sales, Tax & Prop L Sa les Tax

2019-2030 General Fund Financial Forecast
PROPERTY TAX
2019-2030 GENERAL FUND FINANCIAL FORECAST PROPERTY TAXES
$25,000,000 -,---------------------------------
$20,000,000 +--------------------------------- • J-
$15,000,000 ----------------~~------·- - - ------ ·------ •1---• -
$10,000,000 -t-...----=--.--,---------1•-----11a---a---111-----•1--1------1--1a---- -·--1---------·- ----
$5,000,000 _,__.. ___,_
• PROPERTY TAXES
Property tax has traditionally been the General Fund's most stable and consistent revenue and accounts for roughly 30 percent of the total General Fund revenues. In recent years, property assessed values have increased_ between 5.0 to 7.0 percent each-year, slightly above the countywide average increase. This rise in assessed values has in turn helped property tax revenues received by the City increase by more than five percent in recent years. Future increases in both assessed values and property tax revenues will be impacted by the regional housing shortage that is causing additional upward pressure in market prices in the entire San Diego County and the state, increases in interest rates, and potential difficulties in the ability to afford housing in the future. Because of these factors, the forecast assumes a projected revenue growth of approximately 4.0 percent for 2019 through 2025 and then 3.5 percent annually for the remaining forecast period.
15- 16- 17- 18- 19- 20- 21- 22- 23- 24- 25- 26- 27- 28-16 17 18 19 20 21 22 23 24 25 26 27 28 29 ACT ACT ACT EST PROJ PROJ PROJ PROJ PROJ PROJ PROJ PROJ PROJ PROJ 6.2% 7.1% 5.9% 4.9% 4.2% 4.3% 3.5% 4.0% 4.6% 4.0% 3.5% 3.5% 3.5% 3.5%
Market sales, particularly commercial sales in the industrial area of the City, will help support this increase in property tax revenue. In addition, as total property tax revenues increase, its proportionate share of the total General Fund revenues also increases. Beginning in Fiscal Year 2018-2019 and continuing throughout the forecast period,
Page 7
29-30
PROJ
3.5%

2019-2030 General Fund Financial Forecast
property tax revenues replace base sales tax as the biggest revenue source and account for more than 30 percent of total General Fund revenues.
BASE SALES TAX
$18,000,000
$16,000,000
$14,000,000
$12,000,000 '
$10,000,000
$8,000,000
$6,000,000
$4,000,000
$2,000,000
2019-2030 GENERAL FUND FINANCIAL FORECAST BASE SALES TAX (WITHOUT PROP L)
111 BASE SALES TAX
At 26 percent of total General Fund revenues, the 1 % Base Sales Tax is the second ·, biggest General Fund revenue source behind property tax revenue. It is also the most volatile and economically sensitive revenue source. Further complicating the future of sales tax revenues is the rapidly changing nature of taxable transactions: not only is "what is purchased" changing, but "how it is purchased" is also changing. Consumers are spending more on non-taxable items such as services, social networking, and education and less on traditionally taxable items. In addition, more items that were traditionally taxable are now exempt from sales tax. Further contributing to the issue is that sales are increasingly shifting from traditional brick-and-mortar stores to online sales transactions and distributed via the County Pool. This has a potentially negative impact as the County Pool distributions are based a pro rata share of all taxable sales.
Because of these factors, the forecast assumes that revenues will be fairly flat through 2021 and then approximately 2.0 percent annually for the remaining forecast period.
15- 16- 17- 18- 19- 20- 21- 22- 23- 24- 25- 26- 27- 28-16 17 18 19 20 21 22 23 24 25 26 27 28 29 ACT ACT ACT EST PROJ PROJ PROJ PROJ PROJ PROJ PROJ PROJ PROJ PROJ 3.2% 3.1% 0.6% 0.1% (1.4%) 1.4% 2.0% 2.0% 2.0% 2.0% 2.0% 2.0% 2.0% 2.0%
Page 8
29-30
PROJ
2.0%

2019-2030 General Fund Financial Forecast
PROPOSITION L SALES TAX
$18,000,000
$16,000,000
$14,000,000
$12,000,000
$10,000,000
$8,000,000
$6,000,000
$4,000,000
$2,000,000
2019-2030 GENERAL FUND FINANCIAL FORECAST SALES TAX (BASE AND PROP L)
BASE SALES TAX PROP L SALES TAX
In November 2008, the voters of La Mesa approved the temporary% cent (0.75%) Proposition L transactions and use tax (commonly referred to as a sales tax) which became effective on April 1, 2009. The City began receiving payments from the State Board of Equalization in fourth quarter 2009.
Since 2009, Prop L Sales Tax revenue growth has consistently followed the Base Sales Tax growth trends and received at 65 percent of the Base Sales Tax receipts. Prop L tax revenues now account for roughly 17 percent of the total General Fund revenues and contribute approximately $9 million to funding General Fund operations annually. By 2027-2028, the last full fiscal year of Prop L revenues under the current proposition, Prop L Revenues are estimated to exceed $10 million. Proposition Lis set to sunset in 2028-2029, when the City will receive the remaining three quarters (roughly $7.7 million) of tax revenues and then absent any further action by the Council and voters, cease receiving any revenues. The forecast assumes the same factors as the Base Sales Tax through 2027-2028, before tapering off to zero in 2029-2030.
15- 16- 17- 18- 19- 20- 21- 22- 23- 24- 25- 26- 27- 28-16 17 18 19 EST 20 21 22 23 24 25 26 27 28 29 ACT ACT ACT PROJ PROJ PROJ PROJ PROJ PROJ PROJ PROJ PROJ PROJ 5.2% 1.3% 6.1% (1.4%) {1.3%) 1.4% 2.0% 2.0% 2.0% 2.0% 2.0% 2.0% 2.0% 2.0%
Page 9
29-30
PROJ
N/A

2019-2030 General Fund Financial Forecast
ALL OTHER REVENUES
2019-2030 GENERAL FUND FINANCIAL FORECAST
$60,000,000 REVENUE PROJECTIONS t\
~ I I
$50,000,000 - f--
' -j-$40,000,000 --~ ~ - ~ ~
,_ -- -
$30,000,000 ~ ~ ~ ~ - - ,_ - ,_
$20,000,000 ,_ - ~
$10,000,000
OTH ER REVENUE
SERVICE CHARGES
REVEN UE FROM OTH ER AGENCY USE OF MONEY & PROPERTY
• FINES,FORFEIT&PENALTIES
• LICENSES AND PERMITS
SALES TAX (TRI PLE FLI P ADJ)
• PROPERTY TAX (TAX IN C)
• OTH ER TAXES
• PROP L SALES TAX
• BASE SALES TAX
• PROPERTY TAXES
"'80% of General Fund Revenue ,- ,- ---.- -,-$ 0 comes from Property Tu, Sales,
"?-6 ~6 "?-(> 'I?-(;, "i'(> '9'-<) 'tt-6 "?-6 ~(;- 'v,4' R-0\ P.-0'\ P.-0\ ~0'\ ~0\ P,-0'\ ~0'\ ~O'i p_.0'\ f).-0'\ P.-0\ Tax &PropLSalesT;uc
~~~~$~~~~~ # ~ ~ ~~~#~~~# a ~ ~ ' ' ~ ' ~ ' ~ ~ ~ ~ ~ ~ ~ ~ ~ ~ ~ ~
-All other revenues combined constitute roughly 27 percent of total General Fund Revenues. The largest components of all other revenues include Other Taxes, Licenses & Permits, and Service Charges. Other sources include Property Tax (Tax Increment), Revenue from Other Governmental Agencies, and Use of Money & Property
With the approval of the Cannabis Business Tax in November 2018, All Other Taxes (also including Franchise, Property Transfer, and Transient Occupancy Tax), become a more significant component of the total General Fund revenues. Beginning with fiscal year 2020-2021, the total of All Other Taxes comprises roughly 9 percent of the total General Fund revenues, up from 6 to 7 percent in previous forecasts. Other Taxes are historically a stable source of revenue with most revenues increasing 1 to 2 percent overall over the past five years. Transient Occupancy Tax (TOT) has grown significantly since the end of the recession, while Gas & Electric and Refuse franchise taxes remain fairly stable. Cable Television franchise taxes have increased slightly, although this increase is due more to rate increases than an increase in subscribers. Finally the forecast includes the newly approved Cannabis Business Tax and phases in these revenues as more cannabis-related business begin operating and paying the tax. The forecast assumes $250,000 in 2019-2020 then gradually increasing through 21 -22 before reaching the full $1.5 million per year in business tax. For forecasting purposes, all other taxes are assumed to be fairly flat over the forecast period.
Page 10

2019-2030 General Fund Financial Forecast
$14,000,000
$12,000,000
$10,000,000
$8,000,000 11 n ____
$6,000,000 f-- f- - f-
$4,000,000
$2,000,000
$0
2019-2030 GENERAL FUND FINANCIAL FORECAST ALL OTHER REVENUES
ri - - n n_ - -r-- - - ~
-~rr _ r,_ - - - - - - - - ~ - - - -~ - - - - - - - - - -f-
IJ
OTHER REVENUE
SERVICE CHARGES
REVENUE FROM OTHER AGENCY
USE OF MONEY & PROPERTY
• FINES,FORFEIT&PENALTIES
• LICENSES AND PERMITS
SALES TAX (TRIPLE FLI P ADJ)
a PROPERTY TAX (TAX INC)
• OTHER TAXES
Beginning 2013, the General Fund began receiving property tax revenues in lieu of Redevelopment Tax Increment. This General Fund revenue is the City's share of tax increment previously received by the Redevelopment Agency. The General Fund received almost $690,000 in fiscal year 2012-2013, considerably higher than anticipated at that time. In the subsequent years, however, the revenue was considerably less and remained so through 2017. As the Successor Agency's obligations get paid off and property values rise, the city will see a gradual increase in its share of tax increment. For the forecast period , the City anticipates receiving between $330,000 and $460,000 each year throughout the forecast period.
Licenses and Permits represent roughly 3 percent of total General Fund revenues and are very sensitive to fluctuations in economic conditions. As the economic recovery from the Great Recession picked up steam through 2013-2014, License and Permit activity increased dramatically from the low of 2008-2009. Since then, activity has returned to more normal levels as the economy remains strong . Revenues from Licenses and Permits are assumed to remain fairly consistent through 2030.
Revenue from other agencies comprises roughly 2 percent of total General Fund revenues. During 2013-2014, the General Fund received several "one time" revenues that contributed to the Reserve balances. These revenues include a Vehicle License Fee refund from the State of California, and repayment of an advance of funds to the former Redevelopment Agency to cover the AB 1484 true up payment. Ongoing revenues from other agencies include reimbursements for costs related to the Heartland Fire JPA consolidation and funding to cover expenses incurred as a result of public
Page 11

2019-2030 General Fund Financial Forecast
safety realignment (AB109 R3 public safety realignment funds). The AB109 R3 public safety realignment funds and reimbursement for costs related to the Heartland JPA are now ongoing revenues and included in the future years forecast.
Service Charges represent roughly 4 percent of total General Fund revenues. Like Licenses & Permits, Service Charges, including Community Service fees for recreation classes and swimming pool admission, and Engineering and Zoning fees were negatively impacted by the recession but have since recovered beginning in 2012. Development related fees have increased significantly between since 2012 and reflect the both current and anticipated development activity that is expected to occur over the next several years. Recreation service fees are expected to recover to pre-2008 levels. For forecasting purposes, service charges are assumed to remain fairly consistent throughout the forecast period.
Use of Money & Property includes revenue to be received from the long-term land use lease at Briercrest Park. Beginning in 2019-2020, the City will receive ongoing revenues of approximately $415,000 per year as ground rent and park maintenance revenues to help offset the cost of maintaining Briercrest Park. These revenues will be received annually throughout the 55-year agreement.
BASE EXPENDITURE ASSUMPTIONS
When developing the expenditure assumptions, as with the revenue assumptions, historical data, projections from outside sources, and economic trends are all considered. Salaries and fringe benefits comprise the majority of General Fund expenditures at roughly 75 percent. Only merit increases are considered in the salary assumptions for future years beyond fiscal year 2019-2020. Fringe benefits include retirement contributions for both the normal cost and unfunded liability contributions, health insurance contributions, workers' compensation, social security, and other types of benefits. Materials, Services & Supplies and Personal Expenses are anticipated to increase slightly over 2018-2019 levels due to inflation.
Page 12

2019-2030 General Fund Financial Forecast
Included in the 2016-2017 actual amounts is the one-time appropriation for the repayment of the State Controller's Office Asset Transfer Review findings in the amount of $2.4 million. This amount is a one-time expenditure and is reflected as a reserved amount and not included in the Reserves as the City considers its options on payment of the finding.
2019-2030 GENERAL FUND FINANCIAL FORECAST ALL EXPENDITURES
$70,000,000 ~--------------------
$60,000,000 +----------------------$50,000,000 +---------------11--•1------·----------
$40,000,000 +-----------------l·----------,---------------·-.......... __..----$30,000,000 ......._ ______ __, ____ -----______ -a----l_l __ ,__ ____________ ,_____ ___ ___
$20,000,000 -t--11-----------,---------------------l·---------r-a------------·- 1-------------$10,000,000 -+-• -------__,. _,,.__..,. _ _________ ----l ___ ._,,., ______________ , ____ _
CALPERS RETIREMENT COSTS ANO OTHER BENEFITS
• SEC 115 TRU ST FUND
CONTRIB
• RDA PMTS {AB 1484 TRUE
UP/SCO CLAWBACK)
• CAPITAL EQUIPMENT
• MATERIALS,SVCS&SUPPLIES
• PERSONAL EXPENSES
• FRINGE BENEFITS
• SALARIES
As noted earlier, the fastest growing category of the General Fund's expenditures continues to be fringe benefits, specifically retirement costs. Based on the most recent CalPERS projections and the anticipated impacts of the recent changes including the reduced discount rate and fixed unfunded liability contributions, retirement costs are projected to increase overall by 10 to 15 percent each year. This increase began with the 2017-2018 fiscal year and continues through the forecast period and beyond. These increases reflect the cumulative changes enacted by the CalPERS Board in recent years to incorporate pension reform, change the smoothing method for the unfunded liability, adopt revised actuarial assumptions, and most recently reduce the discount rate and add a fixed amount contribution toward the unfunded liability. The future projections include estimated increases from the reduced discount rate on the "normal cost" rate (increase of 2 to 4 percent) and the Unfunded Liability fixed amount (15 percent increase in 2021 growing to 25 percent increase in 2023 with additional increases in 2024 and 2025).
Page 13
2019-2030 General Fund Financial Forecast
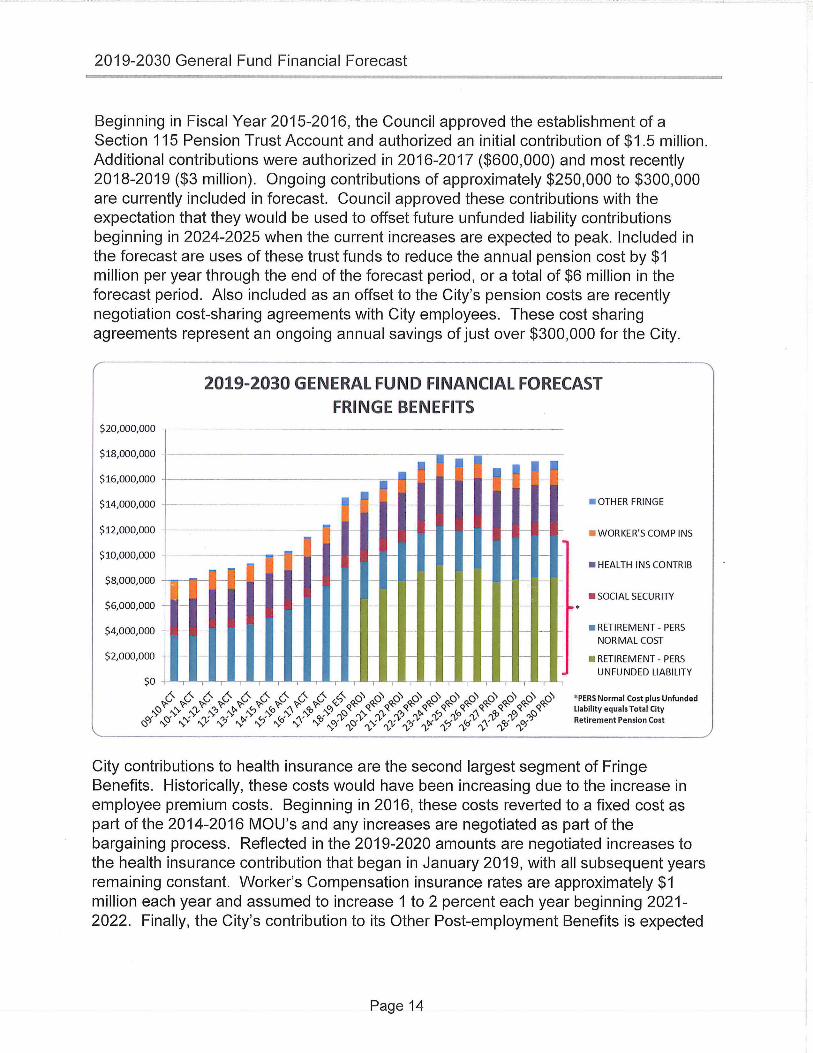
Beginning in Fisca l Year 2015-2016, the Counci l approved the establishment of a Section 115 Pension Trust Account and authorized an in itia l contribution of $1.5 million . Add itional contributions were authorized in 2016-2017 ($600,000) and most recently 2018-2019 ($3 mill ion). Ongoing contributions of approximately $250,000 to $300,000 are currently included in forecast. Counci l approved these contributions with the expectation that they wou ld be used to offset future unfunded liabil ity contributions beginn ing in 2024-2025 when the current increases are expected to peak. Included in the forecast are uses of these trust funds to reduce the annual pension cost by $1 mill ion per year through the end of the forecast period, or a total of $6 mill ion in the forecast period. Also included as an offset to the City's pension costs are recently negotiation cost-sharing agreements with City employees. These cost sharing agreements represent an ongoing annual savings of just over $300,000 for the City.
$20,000,000
$18,000,000
$16,000,000
$14,000,000
$12,000,000
$10,000,000
$8,000,000
$6,000,000
$4,000,000
$2,000,000
-
f--
2019-2030 GENERAL FUND FINANCIAL FORECAST FRINGE BENEFITS
I
I
. ~
,-... ,-... ,-... ~
- ,-... ,-...
~ ~ f-- ~ f--
,- ~ - ~ f--
~
~ f-- ,-. ~
~ ~
~ ~
5 ....
.
~
• OTHER FRIN GE
• WORKER'S COMP INS
• HEALTH INS CONTRIB
• SOCIAL SECURl1Y
• RETIREMENT - PERS NORMAL COST
• RETIREMENT - PERS UNFUNDED LIABILITY
City contributions to health insurance are the second largest segment of Fringe Benefits. Historically, these costs would have been increasing due to the increase in employee premium costs. Beginning in 2016, these costs reverted to a fixed cost as part of the 2014-2016 MOU's and any increases are negotiated as part of the bargaining process. Reflected in the 2019-2020 amounts are negotiated increases to the health insurance contribution that began in January 2019, with all subsequent years remaining constant. Worker's Compensation insurance rates are approximately $1 mill ion each year and assumed to increase 1 to 2 percent each year beginning 2021-2022. Finally, the City's contribution to its Other Post-employment Benefits is expected
Page 14
2019-2030 General Fund Financial Forecast
to increase beginning 2018-2019 by approximately 2.5 percent through 2024. All other fringe benefits are assumed to remain constant through 2023.
ALL OTHER NON-PERSONNEL OPERA TING COSTS
Other non-personnel operating costs include personal expenses such as memberships, training, conferences, and uniform/boot allowance as well as material, services, and supplies needed to maintain the city. As an ongoing cost-saving measure, permanent reductions totaling $179,000 in travel, training, memberships, and clothing & personal expenses are included beginning 2019-2020 and continue throughout the forecast period. Most materials, services & supplies are assumed to remain constant or increase slightly due to inflation. Consistent with prior years' forecasts, the exceptions to these assumptions are in Communications and Technology Maintenance, Maintenance of Buildings & Grounds, Contributions to Other Agencies, Equipment Replacement Expense, and all Utilities, including gas, electric and water. Increases in maintenance of buildings and grounds are estimated to increase 2 percent throughout the forecast period in order to maintain and replace as needed the City's public spaces. Communications and technology maintenance are anticipated to increase 5 percent in 2019-2021 and 2 percent through the end of the forecast period in order to maintain and operate the city's increasing technologies. Increases in Equipment Replacement Fund Expense are necessary to maintain the city's replacement of equipment, vehicles and technology. Increases in Utilities, specifically electric and water usage are assumed to increase 2Yz percent through 2024 as the City works to implement energy and water savings devices as outlined in the Climate Action Plan.
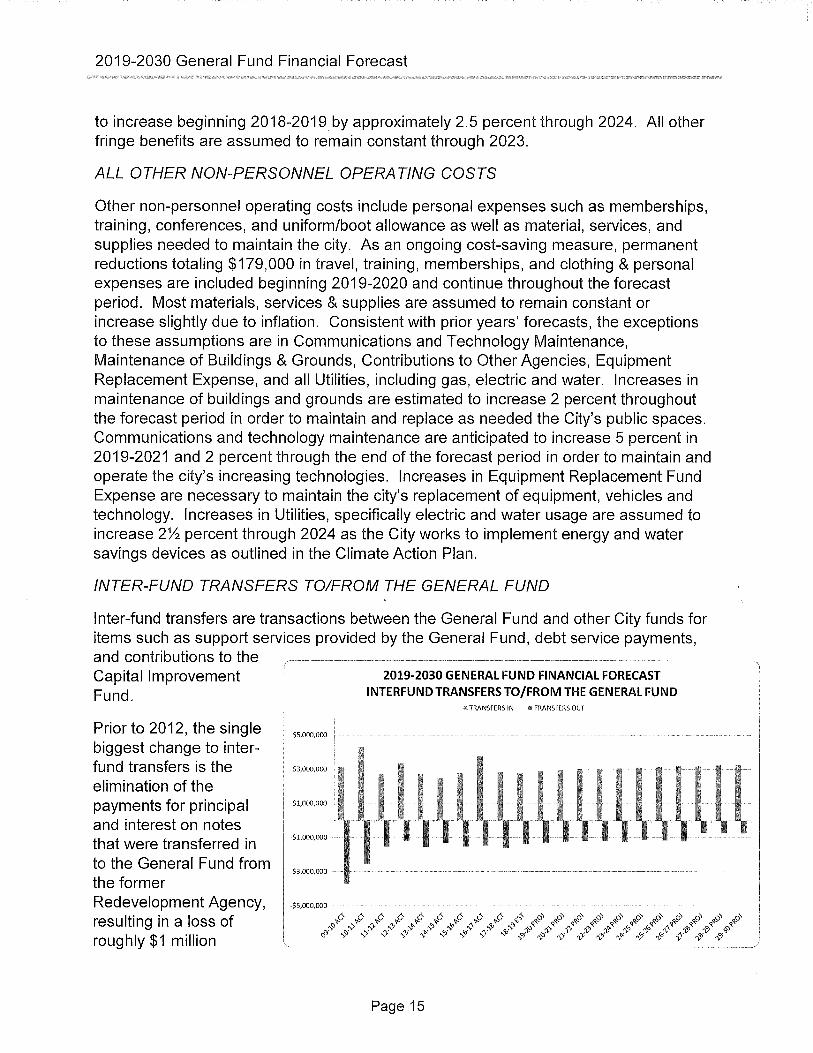
INTER-FUND TRANSFERS TO/FROM THE GENERAL FUND
Inter-fund transfers are transactions between the General Fund and other City funds for items such as support services provided by the General Fund, debt service payments, and contributions to the --- -- ----Capital Improvement Fund.
Prior to 2012, the single biggest change to interfund transfers is the elimination of the payments for principal and interest on notes that were transferred in to the General Fund from the former Redevelopment Agency, resulting in a loss of roughly $1 million
$S,OOO,OOO
$3,000,000
$1,000,000
-$1,000,000
-$3,000,000 ·
2019-2030 GENERAL FUND FINANCIAL FORECAST INTERFUND TRANSFERS TO/FROM THE GENERAL FUND
lll TRANSFERS IN I< TRANSFERS OUT
Page 15

2019-2030 General Fund Financial Forecast
annually to the General Fund . Since 2012, the remaining non-redevelopment re lated inter-fund transfers to and from the General Fund are primarily for support services and debt schedu les. Transfers in for support services are projected to increase as personnel costs increase. Transfers out for debt service payments are reduced as those debts, namely capita l equipment leases for the purchase of fire apparatus and Certificates of Participation for the construction of the Post Office and Library, are paid in fu ll. The forecast assumes no new long term liabilities are incurred . A nominal transfer of $62,500 per year from the General Fund to the City's Capital Improvement Parks Fund is included throughout the forecast period.
GENERAL FUND RESERVES
General Fund reserve levels have improved considerably since the low point in 2008 when reserves fell to $3.8 mill ion or 11 % of expenditures. Since then, the City has rece ived proceeds from the sale of two City-owned properties, "one-time" revenues from the Briercrest litigation, repayment of funds advanced to the Successor Agency for enforceable obl igations, repayment of Prop L Sales Tax revenues that were diverted to the City of Filmore, repayment of the "Triple Fl ip" Sales Tax revenues from the State of Cal ifornia, and significant increases in development-related permits and fees. These increased revenues, combined with expend iture budget savings, have resu lted in end ing reserves in excess of 50 percent beginning in Fiscal Year 2013-2014 through 2017-2018.
$70,000,000
$60,000,000
$50,000,000
$40,000,000
$30,000,000
$20,000,000
$10,000,000
$0
2019-2030 GENERAL FUND FINANCIAL FORECAST HISTORICAL REVENUES, EXPENDITURES AND RESERVES
~ - - - - - ~ - -
,. - ~ , ' 1- . - -,
' -' I'
-
~ . .. .... - ..... e- - - - 7 -i, . -- -I t - - - - - - - - - - - I r r
- -
n
-
-
' -
ttttttttt$ppppppppppp ~ ~ ~ ¢ ~ ~ ~ ~ ~ ~ ~ ~ ~ ~ ~ ~ ~ ~ ~ ~ ~ w ~ ~ ~ ~ w ~ ~ ~ ~ ~ ~ ~~ "~ ~ ~ Y 0 ~~OJ~ ~ ~ ~ ~ ~ ~ ~ ~ ~ ~ ~ V V V ~ ~, ~ ~ ~ ~
-
I-
,_
100%
90%
80%
70%
60%
50%
40%
30%
20%
10%
0%
* 2029-30: Firstfull
- REVENUES - EXPENDITURES - RESERVES - - % RESERVES fiscalyearwithouth Prop L Revenues
Page 16

2019-2030 General Fund Financial Forecast
The 2018-2019 Mid-Biennium Budget Update adopted in June 2018 projected a budget deficit of $2.8 mill ion with estimated ending reserves of $27.5 million or 54.9 percent. Subsequent to the adoption of the Mid-Biennium Budget Update, the City Counci l authorized additional contributions to the Section 115 Retirement Trust Fund in the amount of $3 mill ion and approved salary and benefit increases, resulting in a revised estimated ending reserve balance of $24.5 million or 47.9 percent.
The 2019-2030 General Fund Forecast further revises the estimated ending reserves upward to $25 .6 million or 48.1 percent. When comparing to the prior year's forecast, the ending reserves are slightly lower than projected; however, the prior year forecast did not include the additional $3 mill ion contribution to the Section 115 Retirement Trust Fund . When taking this into account, the projected ending reserves for fisca l year 2018-2019 are approximately $1.5 mi ll ion higher than previously forecasted.
The prior year General Fund Forecast projected budget deficits through 2023-2024. Based on the Counci l's direction at the 2018 Strategic Workshop, the forecast wil l now extend out an add itional six years in order to take a wider view of the financia l forecast.
60,000,000
~- 50.000,000
~ 40,000,000
~ "' ..: 15 30,000,000
I l2 ~ 20,000,000 0 C
10,000,000
FY 14-15 ACT
- Reserves (dollars) 24,345,022
- Revenues/Transfers 42,006,102
- Expenditures 37,975,231 - • % Reserves 59%
2018-2024 GENERAL FUND FINANCIAL FORECAST
BASE FORECAST
-B-1-1------------------------~-~ 100%
"1 1 90%
80%
70%
.... 60%
....
0% FY 15-16 FY 16-17 FY 17-18 FY 18-19 FY 19-20 FY 20-21 FY 21-22 FY 22-23 FY 23-24
ACT ACT EST PROJ PROJ PROJ PROJ PROJ PROJ
29,395,841 29,696,208 29,877,103 27,095,633 24,028,833 21,152,383 18,395,563 16,051,243 13,998,853 --
45,113,725 46,546,387 47,121,486 47,381,960 48,993,900 50,204,920 51,380,930 52,617,770 53,808,430
41,039,897 45,715, 107 46,940,591 50,163,430 52,060,700 53,081,370 54,137,750 54,962,090 55,860,820
63% 62% 64% 54% 46% 40% 34% 29% 25%
Page 17

;;;-~ ffi :3 "' ' Q. X w
>' w ~ 111
"' s 0 C
201 9-2030 General Fund Financial Forecast
2019-2030 GENERAL FUND FORECAST
The current forecast extends the view to 2029-2030. Based on revenue and expenditure projections, expenditures will exceed revenues in each fiscal year through 2024-2025 requiring the use of reserves to "balance the budget". Beginning 2025-2026 this trend reverses with revenues beginning to exceed expenditures and reserves beginning to increase through 2028-2029. However, this all changes in 2029-2030 with the sunset of Proposition Land the elimination of more than $10 million in General Fund Revenues.
The forecast includes the use of Section 115 Retirement Trust Funds beginning in fiscal year 2024-2025 following one of the several scenarios presented to Council in 2018. For this forecast , the City's retirement costs were offset with Trust Funds in the amount of $1 million annually between fiscal years 2024-2025 through 2029-2030, a total of $6 million over the six years . Also included in this forecast is the effect of the City's negotiated retirement cost sharing agreements with the City's employees.
70,000,000
60,000,000
50,000,000
40,000,000
30,000,000
20,000,000
10,000,000
--
~
2019-2030 GENERAL FUND FINANCIAL FORECAST BASE FORECAST
---- - - -
,,__ ---I
--:7' -~
' ' ....
-
-
f-- -- - .... -
' .... ~ - - - - - ..... .... ,,
' ,
~
" -
-
, -,., .... .. ' - - ~tt~ ~ - ,- - - - - >-- j- - f-- - -
~ ~ , - - - ,- ~- - -- ~- ~- ~- -FY 14- FY 15- FY 16- FY 17- FY 18- FY 19- FY20- FY 21- FY 22- FY23- FY24- FY 25- FY 26- FY27- FY28- FY29-
15 16 17 18 19 20 21 22 23 24 25 26 27 28 29 30 ACT ACT ACT ACT EST PROJ PROJ PROJ PROJ PROJ PROJ PROJ PROJ PROJ PROJ PROJ
100%
90%
80%
7(1'/o
6(1'/o
5(1'/o
40%
3(1'/o
2(1'/o
10%
0%
- Reserves (dollars) 24,345 29,395 29,696 31,578 25,606 21,751 18,004 15,162 12,969 11,255 10,923 11,392 13,777 17,415 19,242 14,091
- Revenues/Transfers 42,006 45,113 46,546 47,816 47,274 48,128 49,426 51,277 52,973 54,246 55,544 56,728 57,935 59,712 58,419 51,747
- Expenditures 37,975 41,039 45,715 45,647 53,246 51,982 53,173 54,120 55,165 55,961 55,876 56,259 55,550 56,074 56,592 56,898 - • % Reserves 59% 63% 62% 65% 48% 42% 34% 28% 24% 20% 20% 20% 25% 31% 34% 25% - -
CHART A: BASE FORECAST
The Council's current reserve policies are to establish a "Rainy Day Reserve" of 15 percent of budgeted expenditures and a "Cash Flow Reserve" of 25 percent of budgeted expenditures.
Page 18
...,_
" "' "' "' " ;;i 111

'v> ~ 0:: LU Ill LU 0:: ..... a.. X LU
~ LU
!:. Ill 0:: s 5 C
2019-2030 General Fund Financial Forecast
INCREASED PROPERTY TAX REVENUES
The current forecast projects fa irly conservative increases in property tax revenues . If slightly higher increases were projected beginning 2019-2020, the budget deficit would continue to be negative through 2023-2024 but recover one year sooner in 2024-2025 and help bui ld reserves at a slightly faster pace. This alternate forecast illustrates the cumulative positive impact of ongoing revenues.
70,000,000
60,000,000
50,000,000
40,000,000
30,000,000
20,000,000
10,000,000
-·-
2019-2030 GENERAL FUND FINANCIAL FORECAST INCREASED PROPERTY TAX REVENUES BEGINNING 2022
-- --- =-----, - ----- - --I
.,. ~ --~- ' .-
'-~
~ ~ -- I-- - - I- 1-- 1--... ~ ~ ... .. - ... --- - - -- ~- ~ ,- ,- ,- ·- ,- - - - - - - ~
- ~- ~- , __ ~- ~- -- ~- ~- -- -- ~- ~- -- ~-
..........
'
' ----..- -
- -
-- -FY 14- FY 15- FY 16- FY 17- FY 18- FY 19- FY20- FY21- FY22- FY 23- FY 24- FY25- FY 26- FY27- FY 28- FY 29-
15 16 17 18 19 20 21 22 23 24 25 26 27 28 29 30
ACT ACT ACT ACT EST PROJ PROJ PROJ PROJ PROJ PROJ PROJ PROJ PROJ PROJ PROJ
- Reserves (dolla rs) 24,345 29,395 29,696 31,578 25,606 21,856 18,321 15,923 14,345 13,178 13,416 14,474 17,469 21,739 24,220 19,745
- Revenues/Transfers 42,006 45,113 46,546 47,816 47,274 48,232 49,638 51,721 53,588 54,794 56,114 57,318 58,545 60,343 59,072 52,424
- Expenditures 37,975 41,039 45,715 45,647 53,246 51,982 53,173 54,120 55,165 55,961 55,876 56,259 55,550 56,074 56,592 56,898
- % Reserves (Revised) 59% 63% 62% 65% 48% 42% 34% 29% 26% 24% 24% 26% 31% 39% 43% 35%
- - % Res (Base Forecast) 59% 63% 62% 65% 48% 42% 3 4% 28% 24% 20% 20% 20% 25% 31% 34% 25%
100%
90%
80%
70%
60% l/1. ;r, m
50% VI m ;r, ;;i
40% VI
30%
20%
10%
0%
CHART B: STRONGER GROWTH IN PROPERTY TAX REVENUES
Revised property tax revenue factors:
15- 16- 17- 18- 19- 20- 21- 22- 23- 24- 25- 26- 27- 28- 29-16 17 18 19 20 21 22 23 24 25 26 27 28 29 30 ACT ACT ACT EST PROJ PROJ PROJ PROJ PROJ PROJ PROJ PROJ PROJ PROJ PROJ
6.2% 7.1% 5.9% 4.9% 4.2% 4.3% 3.5% 4.0% 4.6% 4.0% 3.5% 3.5% 3.5% 3.5% 3.5%
REVISED PROPERTY TAX REVENUE FACTORS
6.2% 7.1% 5.9% 4.9% 5.0% 5.0% 5.0% 5.0% 4.0% 4.0% 3.5% 3.5% 3.5% 3.5% 3.5%
Page 19