2019-2020 ANNUAL REPORT - City of Albany
67
2019-2020 ANNUAL REPORT
Transcript of 2019-2020 ANNUAL REPORT - City of Albany

2019-2020
ANNUAL
REPORT
102 NORTH ROAD, YAKAMIA
PO BOX 484, ALBANY, WA 6331
PHONE: (08) 6820 3000
FAX: (08) 9841 4099
EMAIL: [email protected]
WEB: WWW.ALBANY.WA.GOV.AU
AUTHORISATION
ALBANY CITY COUNCIL
CHIEF EXECUTIVE OFFICER
THE CITY OF ALBANY RESPECTFULLY
ACKNOWLEDGES THE MENANG
NOONGAR PEOPLE AS THE
TRADITIONAL CUSTODIANS OF THE
LAND ON WHICH THE CITY CONDUCTS
ITS BUSINESS, AND PAYS RESPECT
TO ELDERS PAST AND PRESENT.

1
C O N T E N T S
WELCOME TO ALBANY 1
YOUR CITY ID 2
MAYOR’S MESSAGE 3
CEO’S MESSAGE 4
YOUR COUNCIL 5
ELECTED MEMBER ATTENDANCE 8
EXECUTIVE TEAM 9
SERVICE DELIVERY STRUCTURE 10
GOVERNANCE + COMPLIANCE 12
OUR PEOPLE 16
FACILITIES 22
ALBANY HERITAGE PARK & NATIONAL ANZAC CENTRE 24
ALBANY REGIONAL AIRPORT 26
ALBANY LEISURE & AQUATIC CENTRE 28
ALBANY PUBLIC LIBRARY 30
ALBANY VISITOR CENTRE 32
VANCOUVER ARTS CENTRE 34
ALBANY REGIONAL DAYCARE 36
WASTE SERVICES 38
FIVE KEY THEMES 40
LEADERSHIP 41
SMART, PROSPEROUS AND GROWING 46
CLEAN, GREEN & SUSTAINABLE 50
COMMUNITY HEALTH & PARTICIPATION 54
CONNECTED & SAFE BUILT ENVIRONMENT 60
FINANCIAL REPORT 67
It’s where we spend our childhood, raise our family, run a business, retire and relax. It’s where we work and find some time to have fun.
Albany is a community where your neighbour is also a friend, we look out for each other and pitch in when we’re needed.
We’re passionate about many things, like preserving and protecting our pristine environment, supporting our local sporting team, volunteering on a community group like the school P&C, or lending a helping hand to someone in need.
Albany’s lifestyle is rich and rewarding. We enjoy the convenience and services a regional city provides in a part of the world that’s endless and diverse in natural beauty and a world biodiversity hotspot.
The City of Albany is part of this big picture and we play a big part in creating the community we all enjoy.
After all, Albany is like one big family. Our Councillors and staff are your friends, neighbours and customers.
We’re custodians of many parks and natural reserves, we keep your ovals and recreational spaces green and mown, we support volunteering, and we invest in programs and initiatives that help our community thrive.
Our vision is to be Western Australia’s most sought-after and unique regional city to work, live and visit. To achieve that takes a whole community.
And community is our priority, because Albany is our city, and Your City too.
ALBANY IS OUR HOME AND IT HOLDS A SPECIAL PLACE IN OUR LIVES.

IT HAS BEEN A STRANGE AND UNCERTAIN TIME FOR ALBANY AND THE WORLD WITH NORMALITY STOPPED IN ITS TRACKS BY A GLOBAL HEALTH PANDEMIC THAT HAS AFFECTED ALL OF US.
As the Covid-19 crisis unfolded in front of our eyes, we began distancing ourselves from others, buying things in quantities we didn’t need and washing our hands like never before.
The immediate response to the health emergency meant businesses closed and our town became eerily quiet as we all stayed indoors waiting for the storm to pass.
Reflecting on the last 12 months is an opportunity to reflect on life before Covid-19, our achievements and celebrations as a community and what we are working towards getting back to as restrictions further ease for WA.
Our City of Albany Council elections were held in October recording the third highest number of nominations ever for Albany with a total of 24 hopefuls throwing their hat in the ring for a place on the Council table.
We said goodbye to a couple of old friends, kept the door open for four more and welcomed two fresh faces to the Council team in Cr Thomson of Yakamia and Cr Benson-Lidholm of Kalgan.
It was also in October last year when more than 450 caravans from across Australia pulled up to Centennial Park’s sporting grounds for the Coromal Windsor 17th National Caravan Clubs Rally.
The rally was received wholeheartedly by both community and visitors where the event complimented the City’s Community Strategic Plan by brining events of significance to Albany.
For the first time ever, we granted the Key to the City to the 17 Construction Squadron Workshop Vietnam Association, an honour that symbolises free entry to the City of Albany.
Starting on York Street, the heavily attended march made its way to the Town Hall where the Commanding Officer of the Association was presented with the Key to the City and a symbolic scroll that marked this historic occasion.
But the last 4 months are also not without their successes, as a community we responded quickly to the Covid-19 crisis and together with the rest of WA, navigated our way out of the height of the pandemic.
As a Council we took an urgent look at our budget and uncovered ways we could financially support the community, balance our books and keep the lights on.
This included a freeze on fees and charges, 0% rate increase for the 20/21 financial year, Elected Members taking a 20% cut in wages and City staff also taking a 20% in hours for 6 months.
This annual report summarises the key achievements of the past year as well as highlighting the resilience, togetherness and positivity of the Council and community when faced with adversity.
M AY O R ’ S M E S S A G E
DENNIS WELLINGTON,
MAYOR
38,053
$2.14B 14.3%
19% 16,924 PEOPLE LIVING IN THE CITY OF ALBANY
RESIDENTS WERE BORN OVERSEAS
24%OF ALBANY’S POPULATION ARE VOLUNTEERS
DWELLINGS
SOCIAL
ECONOMIC
$1,205 IS THE MEDIAN WEEKLY HOUSEHOLD INCOME
24%RESIDENTS HAVE A TRADE QUALIFICATION
30%HOUSEHOLDS HAVE A MORTGAGE
5.2% UNEMPLOYMENT RATE
24,020 ELIGIBLE VOTERS 18+
2 3
Y O U R C I T Y ’ S I D
ALBANY IS THE THRIVING CULTURAL AND ADMINISTRATIVE HUB OF THE GREAT SOUTHERN REGION. IT HAS THE CONVENIENCE OF A MAJOR CITY WHILE BEING SURROUNDED BY AN AMAZING NATURAL ENVIRONMENT.
It’s reputation as a safe and friendly regional city with a strong sense of community makes it a popular place to raise a family and retire, or visit for a holiday.
Health care, agriculture, retail and tourism are the major players in Albany’s economy. Here is a snapshot of how Your City looks socially and economically.
GROSS REGIONAL PRODUCT
17,374 LOCAL JOBS IN THE CITY OF ALBANY
$135,043AVERAGE INCOME PER HOUSEHOLD BEFORE TAX
3,485 LOCAL BUSINESSES
$3,001AVERAGE HOUSEHOLD EXPENDITURE ON UTILITIES
RESIDENTS EMPLOYED IN HEALTH CARE & SOCIAL ASSISTANCE
19,276 PEOPLE ARE EMPLOYED IN ALBANY
43 IS THE MEDIAN AGE
$411,949 MEDIAN HOUSING VALUE
$432MAGRICULTURE, FORESTRY & FISHING EXPORTS
$223.5M TOURISM & HOSPITALITY SALES

ANDREW SHARPE
CHIEF EXECUTIVE OFFICER, CITY OF ALBANY
4 5
C E O ’ S M E S S A G E
Y O U R C O U N C I L
THE DISRUPTION OF COVID-19 TO OUR LIVES THIS YEAR HAS BEEN A CHALLENGE, SPECIFICALLY TO THE CITY OF ALBANY WHERE COMMUNITY SAFETY, HEALTH AND WELLBEING IS A TOP PRIORITY.
IN OCTOBER OF 2019 DENNIS WELLINGTON BECAME THE CITY OF ALBANY’S LONGEST SERVING MAYOR FOLLOWING HIS SUCCESS IN BEING ELECTED TO THE TOP JOB FOR HIS THIRD TERM.
The City forecast a loss in revenue of more than $7 million for the 2020 calendar year as a result of the pandemic forcing Council to endorse an action plan that addressed the deficit by reducing staff costs, cutting capital works and using reserve funds.
By working with stakeholders, community and government agencies we developed strategies to guide our response to the pandemic that were underpinned by good leadership and strong relationships within our Great Southern network.
The City of Albany brought community together quickly through a bespoke communications campaign #albanyinthistogether which encouraged us to remain connected.
#albanyinthistogether provided a platform for the City to engage with the community and support the economic, mental and physical health of residents, families and business through the Covid-19 pandemic.
With the WA government placing a hard border closure on the state, we have experienced and influx in local tourism, visitation and attraction to our Amazing South Coast.
Initial figures are outstanding with accommodation bookings in June experiencing a 222% increase compared to the previous year with room nights in particular up 205%.
These are encouraging numbers for our City and support what we are doing in a project space, with a number of key initiatives taking shape around our community.
Our iconic Albany Town Hall has been in redevelopment for most of 2020, with internal works taking place to bring the building up to modern day standards, build on the character and refresh its design.
We are into phase two of our Middleton Beach Foreshore Enhancement Project with a sea wall already installed to protect our coastline and works to the landscape currently in design.
The Albany History Collection is also returning to its home at the Albany Public Library with building works being planned to allow the housing of the City’s rich historic archives.
I am proud of the services we offer our residents, the volume of work that goes into maintaining our city and our positive culture and attitude to supporting our community.
We maintain our large road network, keep the street lights on, manage waste disposal, ensure our parks are looked after, coordinate air travel via the Albany Regional Airport and keep our community safe through our team of Rangers.
This annual report gives a snapshot of the what keeps the City busy day to day, but only scratches the surface to what our staff give back to our community.
Our Council has provided great leadership throughout this challenging year and I sincerely thank them for the good governance they have provided to our community and their support of our staff.
Thank you to our staff, who are committed to providing excellent services and facilities to the Albany Community. Everything we have achieved this year is a credit to their dedication to the City and upholding our values.
The City of Albany also has 12 Councillors across six wards – Frederickstown, Yakamia, Vancouver, West, Kalgan and Breaksea – with each represented by two Councillors.
Elected Members serve a 4-year term, with Local Government elections held every two years for half of the Council.
The 2019-2020 period was an election year and there were seven Council vacancies going into the 2019 Local Government elections, including the Mayoral position.
With 23 candidates vying to represent their community in the chamber for the next four years the results had a mix of incumbent councillors re-elected and some new faces joining the Council’s ranks.
Mayor of Albany
Dennis Wellington | re-elected with 71.87% of the vote (term expires 2023).
Frederickstown Ward
Greg Stocks – Deputy Mayor | re-elected with 57.45% of the vote (term expires 2023)
Rebecca Stephens – Councillor (term expires 2021)
Yakamia Ward
Chris Thomson – Councillor | elected with 32.64% of the vote (term expires 2023)
Robert Sutton – Councillor (term expires 2021)
West Ward
Sandie Smith – Councillor | re-elected with 46.04% of the vote (term expires 2023)
Alison Goode – Councillor (term expires 2021)
Vancouver Ward
John Shanhun – Councillor | re-elected with 38.64% of the vote (term expires 2023)
Tracy Sleeman – Councillor (term expires 2021)
Breaksea Ward
Paul Terry – Councillor | re-elected with 51.49% of the vote (term expires 2023)
Ray Hammond – Councillor (term expires 2021)
Kalgan Ward
Matt Benson-Lidholm – Councillor | elected with 37.99% of the vote (term expires 2023)
Emma Doughty – Councillor (term expires 2021)

6 7
C O U N C I L L O R
TERM EXPIRES 2021
C O U N C I L L O R
TERM EXPIRES 2023
D E P U T Y M A Y O R TERM EXPIRES 2023
G R E G S T O C K S
F R E D E R I C K S T O W N W A R D
C O U N C I L L O R TERM EXPIRES 2021
R E B E C C A S T E P H E N S
F R E D E R I C K S T O W N W A R D
C O U N C I L L O R TERM EXPIRES 2023
P A U L T E R R Y
B R E A K S E A W A R D
C O U N C I L L O R TERM EXPIRES 2021
R A Y H A M M O N D
B R E A K S E A W A R DA L B A N Y
M A Y O R TERM EXPIRES 2023
D E N N I SW E L L I N G T O N
S A N D I E S M I T H
W E S T W A R D
C O U N C I L L O R TERM EXPIRES 2023
C H R I S T H O M S O N
Y A K A M I A W A R D
C O U N C I L L O R TERM EXPIRES 2021
R O B E R T S U T T O N
Y A K A M I A W A R D
C O U N C I L L O R
TERM EXPIRES 2021
C O U N C I L L O R
TERM EXPIRES 2023
E M M A D O U G H T Y
K A L G A N W A R D
M A T T B E N S O N - L I D H O L M
K A L G A N W A R D
C O U N C I L L O R TERM EXPIRES 2021
T R A C Y S L E E M A N
V A N C O U V E R W A R D
C O U N C I L L O R TERM EXPIRES 2023
J O H N S H A N H U N
V A N C O U V E R W A R DA L I S O N G O O D E
W E S T W A R D
Y O U R C O U N C I L & W A R D S
98
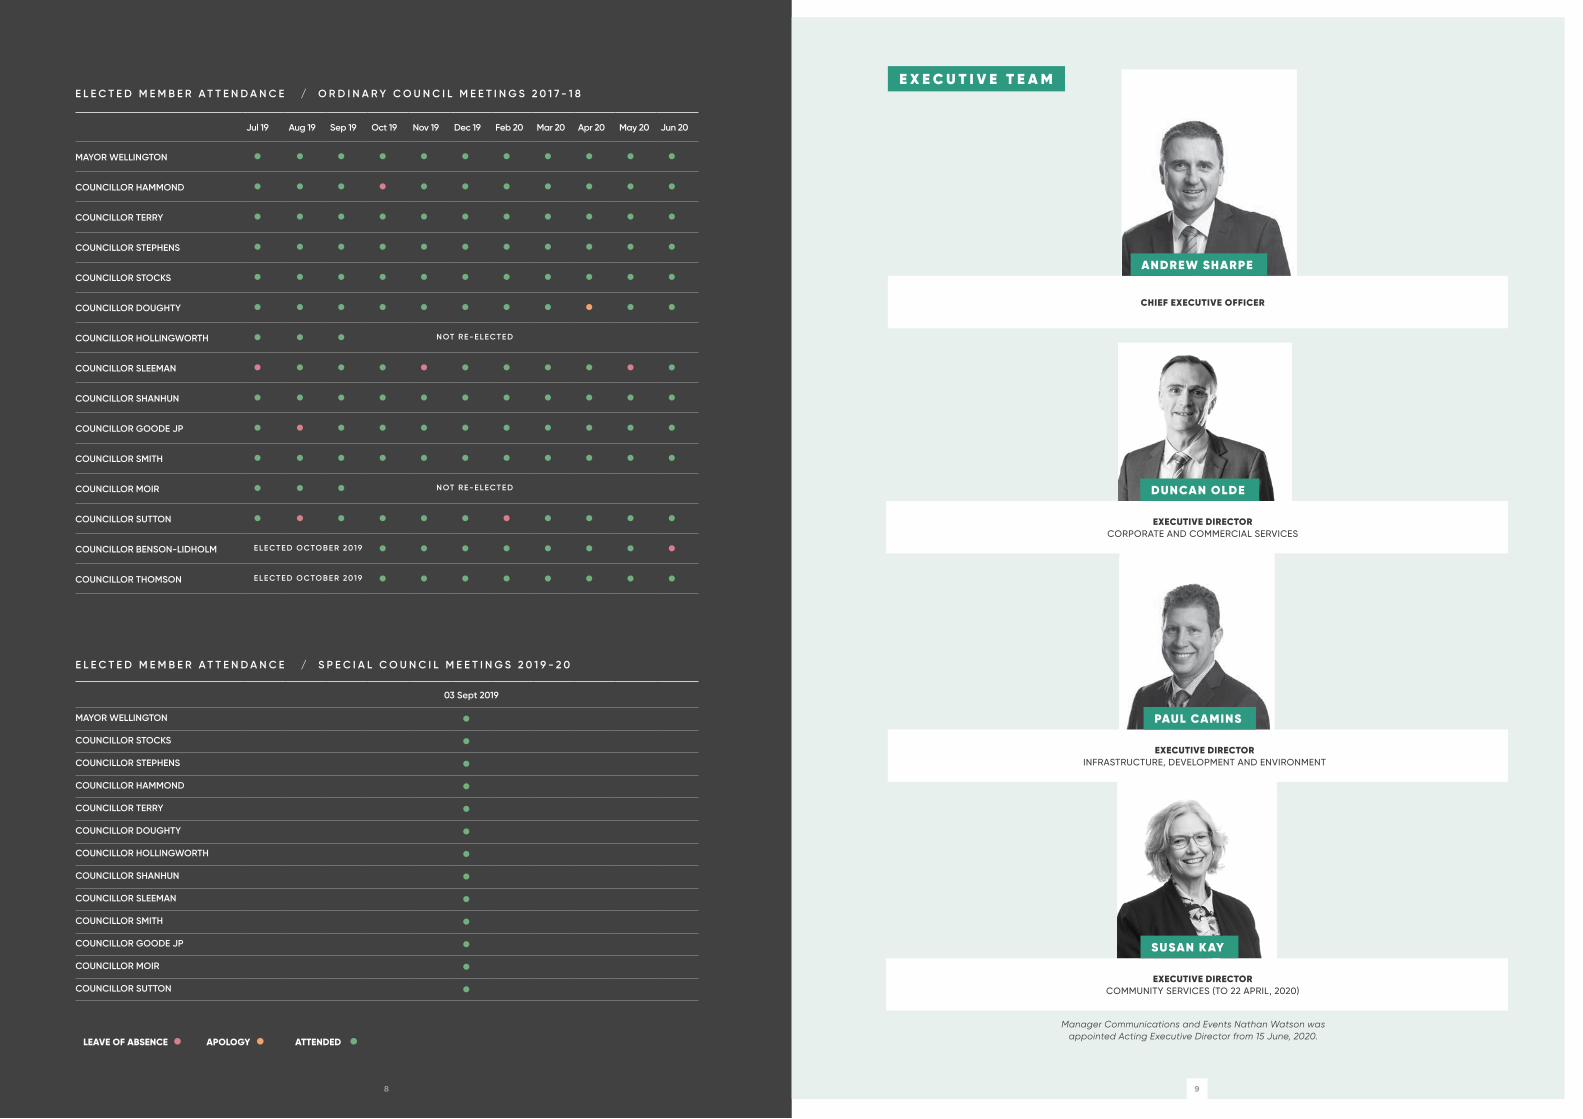
E L E C T E D M E M B E R A T T E N D A N C E / O R D I N A R Y C O U N C I L M E E T I N G S 2 0 1 7 - 1 8
Jul 19 Aug 19 Sep 19 Oct 19 Nov 19 Dec 19 Feb 20 Mar 20 Apr 20 May 20 Jun 20
MAYOR WELLINGTON • • • • • • • • • • •COUNCILLOR HAMMOND • • • • • • • • • • •COUNCILLOR TERRY • • • • • • • • • • •COUNCILLOR STEPHENS • • • • • • • • • • •COUNCILLOR STOCKS • • • • • • • • • • •COUNCILLOR DOUGHTY • • • • • • • • • • •COUNCILLOR HOLLINGWORTH • • • N OT R E-E L ECT E D
COUNCILLOR SLEEMAN • • • • • • • • • • •COUNCILLOR SHANHUN • • • • • • • • • • •COUNCILLOR GOODE JP • • • • • • • • • • •COUNCILLOR SMITH • • • • • • • • • • •COUNCILLOR MOIR • • • N OT R E-E L ECT E D
COUNCILLOR SUTTON • • • • • • • • • • •COUNCILLOR BENSON-LIDHOLM E L ECT E D O CTO B E R 2019 • • • • • • • •COUNCILLOR THOMSON E L ECT E D O CTO B E R 2019 • • • • • • • •
E L E C T E D M E M B E R A T T E N D A N C E / S P E C I A L C O U N C I L M E E T I N G S 2 0 1 9 - 2 0
03 Sept 2019
MAYOR WELLINGTON •COUNCILLOR STOCKS •COUNCILLOR STEPHENS •COUNCILLOR HAMMOND •COUNCILLOR TERRY •COUNCILLOR DOUGHTY •COUNCILLOR HOLLINGWORTH •COUNCILLOR SHANHUN •COUNCILLOR SLEEMAN •COUNCILLOR SMITH •COUNCILLOR GOODE JP •COUNCILLOR MOIR •COUNCILLOR SUTTON •
LEAVE OF ABSENCE • APOLOGY • ATTENDED •
PAUL CAMINS
EXECUTIVE DIRECTOR INFRASTRUCTURE, DEVELOPMENT AND ENVIRONMENT
DUNCAN OLDE
EXECUTIVE DIRECTOR CORPORATE AND COMMERCIAL SERVICES
ANDREW SHARPE
CHIEF EXECUTIVE OFFICER
E X E C U T I V E T E A M
SUSAN K AY
EXECUTIVE DIRECTOR COMMUNITY SERVICES (TO 22 APRIL, 2020)
Manager Communications and Events Nathan Watson was appointed Acting Executive Director from 15 June, 2020.

10 11
INFRASTRUCTURE, DEVELOPMENT & ENVIRONMENT
Recreation Services
Daycare
Arts & Culture
Library
National Anzac Centre
Albany Heritage Park
Community Development
Events
Engagement
Communications & Marketing
COMMUNITY SERVICES
S E R V I C E D E L I V E R Y S T R U C T U R E
CORPORATE AND COMMERCIAL SERVICES
MAYOR AND COUNCILLORS
CEO
Customer Services
Human Resources
Governance & Risk
Finance
Property & Leasing
Council Liaison
Records
Information Technology
Revenue Development
Economic Development
Strategy & Business Development
Airport Services
Occupational Health & Safety
Environmental Health
Rangers
Emergency Services
Major Projects
Maintenance & Construction
Plant & Heavy Fleet
Trades
Waste Management
Asset Management
Civil Infrastructure
Engineering
Environmental Sustainability
Reserves
Planning
Building
Development Compliance
12 13
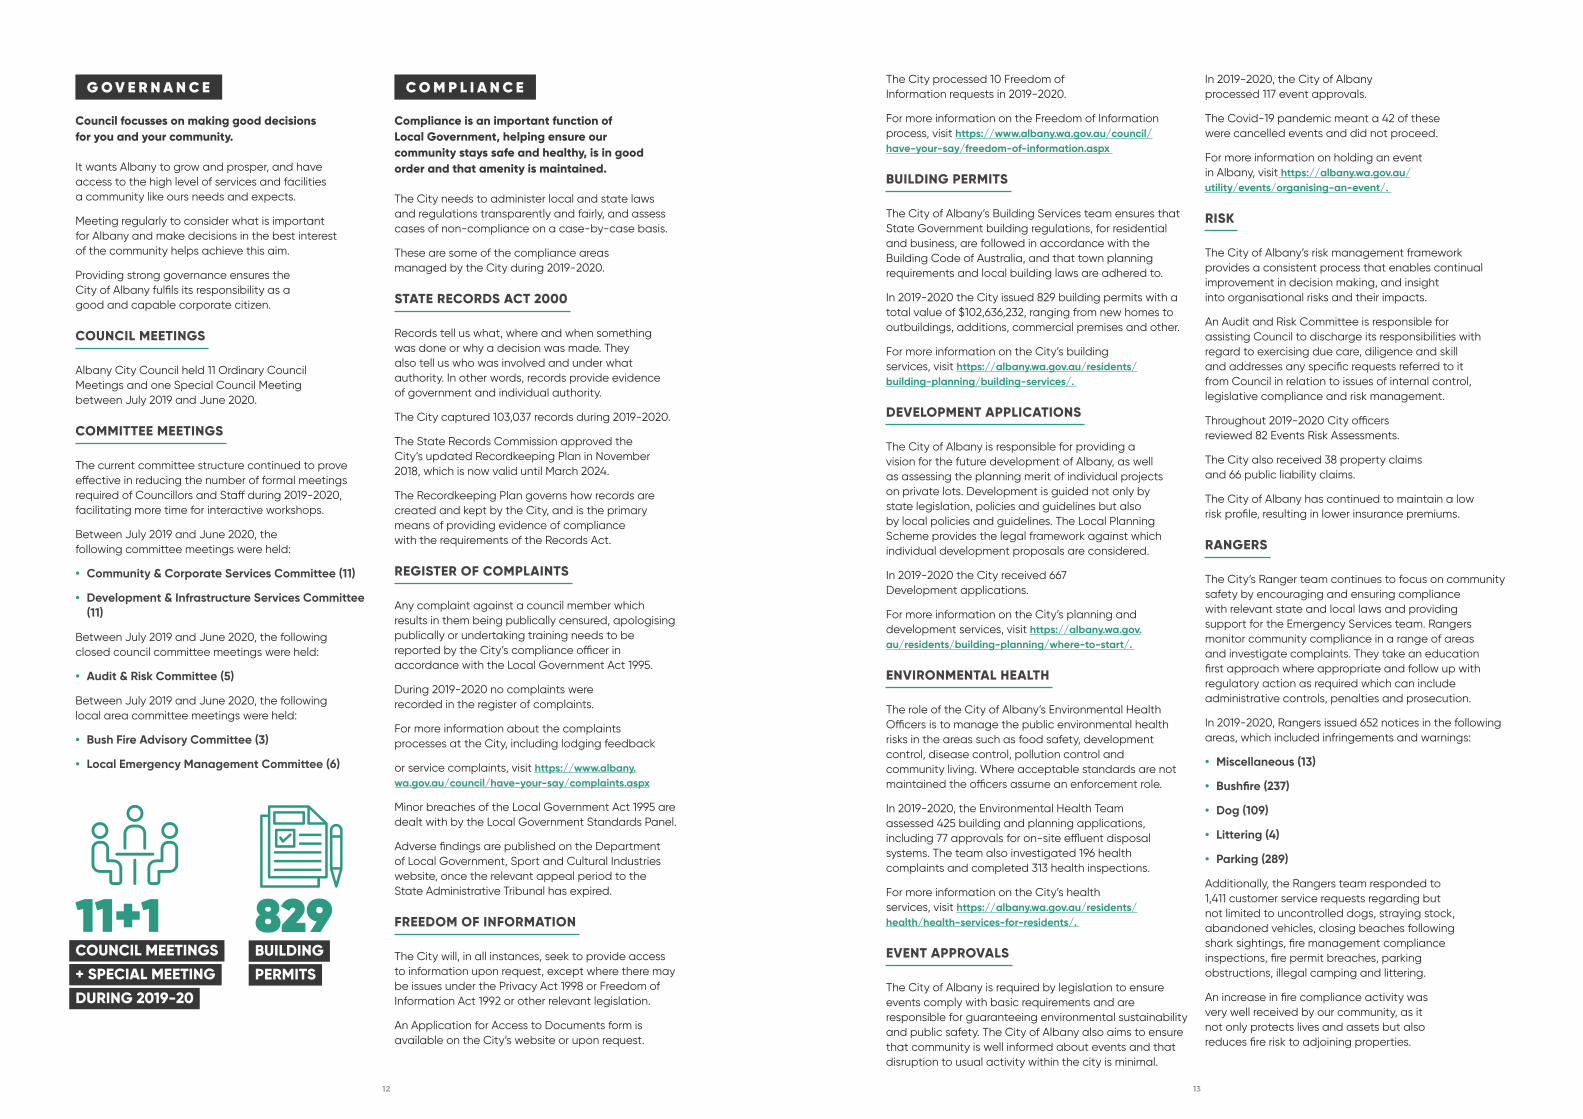
G O V E R N A N C E
Council focusses on making good decisions for you and your community.
It wants Albany to grow and prosper, and have access to the high level of services and facilities a community like ours needs and expects.
Meeting regularly to consider what is important for Albany and make decisions in the best interest of the community helps achieve this aim.
Providing strong governance ensures the City of Albany fulfils its responsibility as a good and capable corporate citizen.
COUNCIL MEETINGS
Albany City Council held 11 Ordinary Council Meetings and one Special Council Meeting between July 2019 and June 2020.
COMMITTEE MEETINGS
The current committee structure continued to prove effective in reducing the number of formal meetings required of Councillors and Staff during 2019-2020, facilitating more time for interactive workshops.
Between July 2019 and June 2020, the following committee meetings were held:
• Community & Corporate Services Committee (11)
• Development & Infrastructure Services Committee (11)
Between July 2019 and June 2020, the following closed council committee meetings were held:
• Audit & Risk Committee (5)
Between July 2019 and June 2020, the following local area committee meetings were held:
• Bush Fire Advisory Committee (3)
• Local Emergency Management Committee (6)
C O M P L I A N C E
Compliance is an important function of Local Government, helping ensure our community stays safe and healthy, is in good order and that amenity is maintained.
The City needs to administer local and state laws and regulations transparently and fairly, and assess cases of non-compliance on a case-by-case basis.
These are some of the compliance areas managed by the City during 2019-2020.
STATE RECORDS ACT 2000
Records tell us what, where and when something was done or why a decision was made. They also tell us who was involved and under what authority. In other words, records provide evidence of government and individual authority.
The City captured 103,037 records during 2019-2020.
The State Records Commission approved the City’s updated Recordkeeping Plan in November 2018, which is now valid until March 2024.
The Recordkeeping Plan governs how records are created and kept by the City, and is the primary means of providing evidence of compliance with the requirements of the Records Act.
REGISTER OF COMPLAINTS
Any complaint against a council member which results in them being publically censured, apologising publically or undertaking training needs to be reported by the City’s compliance officer in accordance with the Local Government Act 1995.
During 2019-2020 no complaints were recorded in the register of complaints.
For more information about the complaints processes at the City, including lodging feedback
or service complaints, visit https://www.albany.wa.gov.au/council/have-your-say/complaints.aspx
Minor breaches of the Local Government Act 1995 are dealt with by the Local Government Standards Panel.
Adverse findings are published on the Department of Local Government, Sport and Cultural Industries website, once the relevant appeal period to the State Administrative Tribunal has expired.
FREEDOM OF INFORMATION
The City will, in all instances, seek to provide access to information upon request, except where there may be issues under the Privacy Act 1998 or Freedom of Information Act 1992 or other relevant legislation.
An Application for Access to Documents form is available on the City’s website or upon request.
The City processed 10 Freedom of Information requests in 2019-2020.
For more information on the Freedom of Information process, visit https://www.albany.wa.gov.au/council/have-your-say/freedom-of-information.aspx
BUILDING PERMITS
The City of Albany’s Building Services team ensures that State Government building regulations, for residential and business, are followed in accordance with the Building Code of Australia, and that town planning requirements and local building laws are adhered to.
In 2019-2020 the City issued 829 building permits with a total value of $102,636,232, ranging from new homes to outbuildings, additions, commercial premises and other.
For more information on the City’s building services, visit https://albany.wa.gov.au/residents/building-planning/building-services/.
DEVELOPMENT APPLICATIONS
The City of Albany is responsible for providing a vision for the future development of Albany, as well as assessing the planning merit of individual projects on private lots. Development is guided not only by state legislation, policies and guidelines but also by local policies and guidelines. The Local Planning Scheme provides the legal framework against which individual development proposals are considered.
In 2019-2020 the City received 667 Development applications.
For more information on the City’s planning and development services, visit https://albany.wa.gov.au/residents/building-planning/where-to-start/.
ENVIRONMENTAL HEALTH
The role of the City of Albany’s Environmental Health Officers is to manage the public environmental health risks in the areas such as food safety, development control, disease control, pollution control and community living. Where acceptable standards are not maintained the officers assume an enforcement role.
In 2019-2020, the Environmental Health Team assessed 425 building and planning applications, including 77 approvals for on-site effluent disposal systems. The team also investigated 196 health complaints and completed 313 health inspections.
For more information on the City’s health services, visit https://albany.wa.gov.au/residents/health/health-services-for-residents/.
EVENT APPROVALS
The City of Albany is required by legislation to ensure events comply with basic requirements and are responsible for guaranteeing environmental sustainability and public safety. The City of Albany also aims to ensure that community is well informed about events and that disruption to usual activity within the city is minimal.
In 2019-2020, the City of Albany processed 117 event approvals.
The Covid-19 pandemic meant a 42 of these were cancelled events and did not proceed.
For more information on holding an event in Albany, visit https://albany.wa.gov.au/utility/events/organising-an-event/.
RISK
The City of Albany’s risk management framework provides a consistent process that enables continual improvement in decision making, and insight into organisational risks and their impacts.
An Audit and Risk Committee is responsible for assisting Council to discharge its responsibilities with regard to exercising due care, diligence and skill and addresses any specific requests referred to it from Council in relation to issues of internal control, legislative compliance and risk management.
Throughout 2019-2020 City officers reviewed 82 Events Risk Assessments.
The City also received 38 property claims and 66 public liability claims.
The City of Albany has continued to maintain a low risk profile, resulting in lower insurance premiums.
RANGERS
The City’s Ranger team continues to focus on community safety by encouraging and ensuring compliance with relevant state and local laws and providing support for the Emergency Services team. Rangers monitor community compliance in a range of areas and investigate complaints. They take an education first approach where appropriate and follow up with regulatory action as required which can include administrative controls, penalties and prosecution.
In 2019-2020, Rangers issued 652 notices in the following areas, which included infringements and warnings:
• Miscellaneous (13)
• Bushfire (237)
• Dog (109)
• Littering (4)
• Parking (289)
Additionally, the Rangers team responded to 1,411 customer service requests regarding but not limited to uncontrolled dogs, straying stock, abandoned vehicles, closing beaches following shark sightings, fire management compliance inspections, fire permit breaches, parking obstructions, illegal camping and littering.
An increase in fire compliance activity was very well received by our community, as it not only protects lives and assets but also reduces fire risk to adjoining properties.
829 BUILDING
PERMITS
11+1 COUNCIL MEETINGS
+ SPECIAL MEETING
DURING 2019-20

14 15
16 17
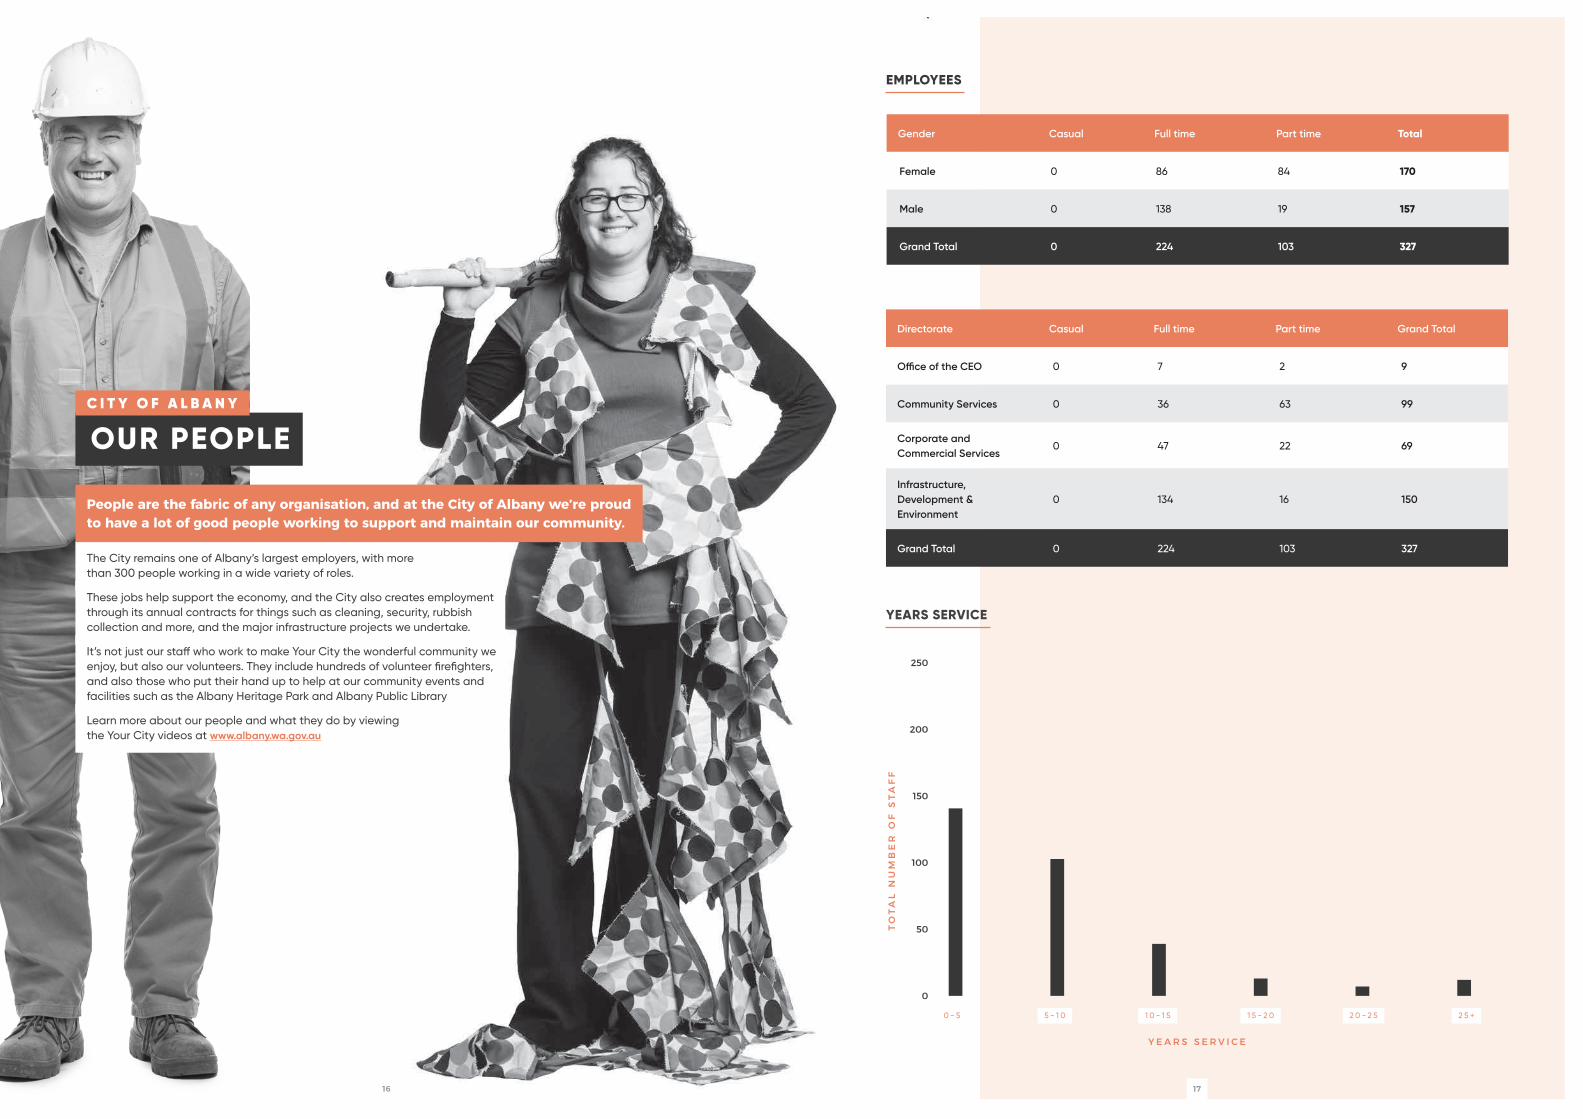
The City remains one of Albany’s largest employers, with more than 300 people working in a wide variety of roles.
These jobs help support the economy, and the City also creates employment through its annual contracts for things such as cleaning, security, rubbish collection and more, and the major infrastructure projects we undertake.
It’s not just our staff who work to make Your City the wonderful community we enjoy, but also our volunteers. They include hundreds of volunteer firefighters, and also those who put their hand up to help at our community events and facilities such as the Albany Heritage Park and Albany Public Library
Learn more about our people and what they do by viewing the Your City videos at www.albany.wa.gov.au
People are the fabric of any organisation, and at the City of Albany we’re proud to have a lot of good people working to support and maintain our community.
Directorate Casual Full time Part time Grand Total
Office of the CEO 0 7 2 9
Community Services 0 36 63 99
Corporate and Commercial Services
0 47 22 69
Infrastructure, Development & Environment
0 134 16 150
Grand Total 0 224 103 327
Gender Casual Full time Part time Total
Female 0 86 84 170
Male 0 138 19 157
Grand Total 0 224 103 327
OUR PEOPLEC I T Y O F A L B A N Y
EMPLOYEES
250
200
150
100
50
0
Y E A R S S E R V I C E
TO
TA
L N
UM
BE
R O
F S
TA
FF
0 - 5 5 - 1 0 1 0 - 1 5 1 5 - 2 0 2 0 - 2 5 2 5 +
YEARS SERVICE

18 19
O U R P E O P L E
EMPLOYEE REMUNERATION
In accordance with the Local Government (Administration) Regulations 19B, the City of Albany is required to disclose in bands of $10,000 the number of employees entitled to an annual salary package of $100,000 or more. The annual package reported here includes cash salary, superannuation and all employee entitlements.
Brackets Contract EmployeesEnterprise Agreement
EmployeesTotal Employees
100,000 - 109,999 1 14 15
110,000 - 119,999 2 11 13
120,000 - 129,999 3 7 10
130,000 - 139,999 2 0 2
140,000 - 149,999 0 0 0
150,000 - 159,999 3 0 3
160,000 - 169,999 0 0 0
170,000 - 179,999 3 0 3
180,000 - 189,999 0 0 0
190,000 - 199,999 0 0 0
200,000 - 209,999 0 0 0
210,000 - 279,999 1 0 1
Total 15 32 47
PEOPLE ARE THE FABRIC OF ANY ORGANISATION
EMPLOYEE AGE
A G E
TO
TA
L N
UM
BE
R O
F S
TA
FF
50
40
30
20
10
0
< 2 1 2 1 - 2 5 2 5 - 3 0 3 0 - 3 5 3 5 - 4 0 4 0 - 4 5 4 5 - 5 0 5 0 - 5 5 5 5 - 6 0 6 0 - 6 5 6 5 +
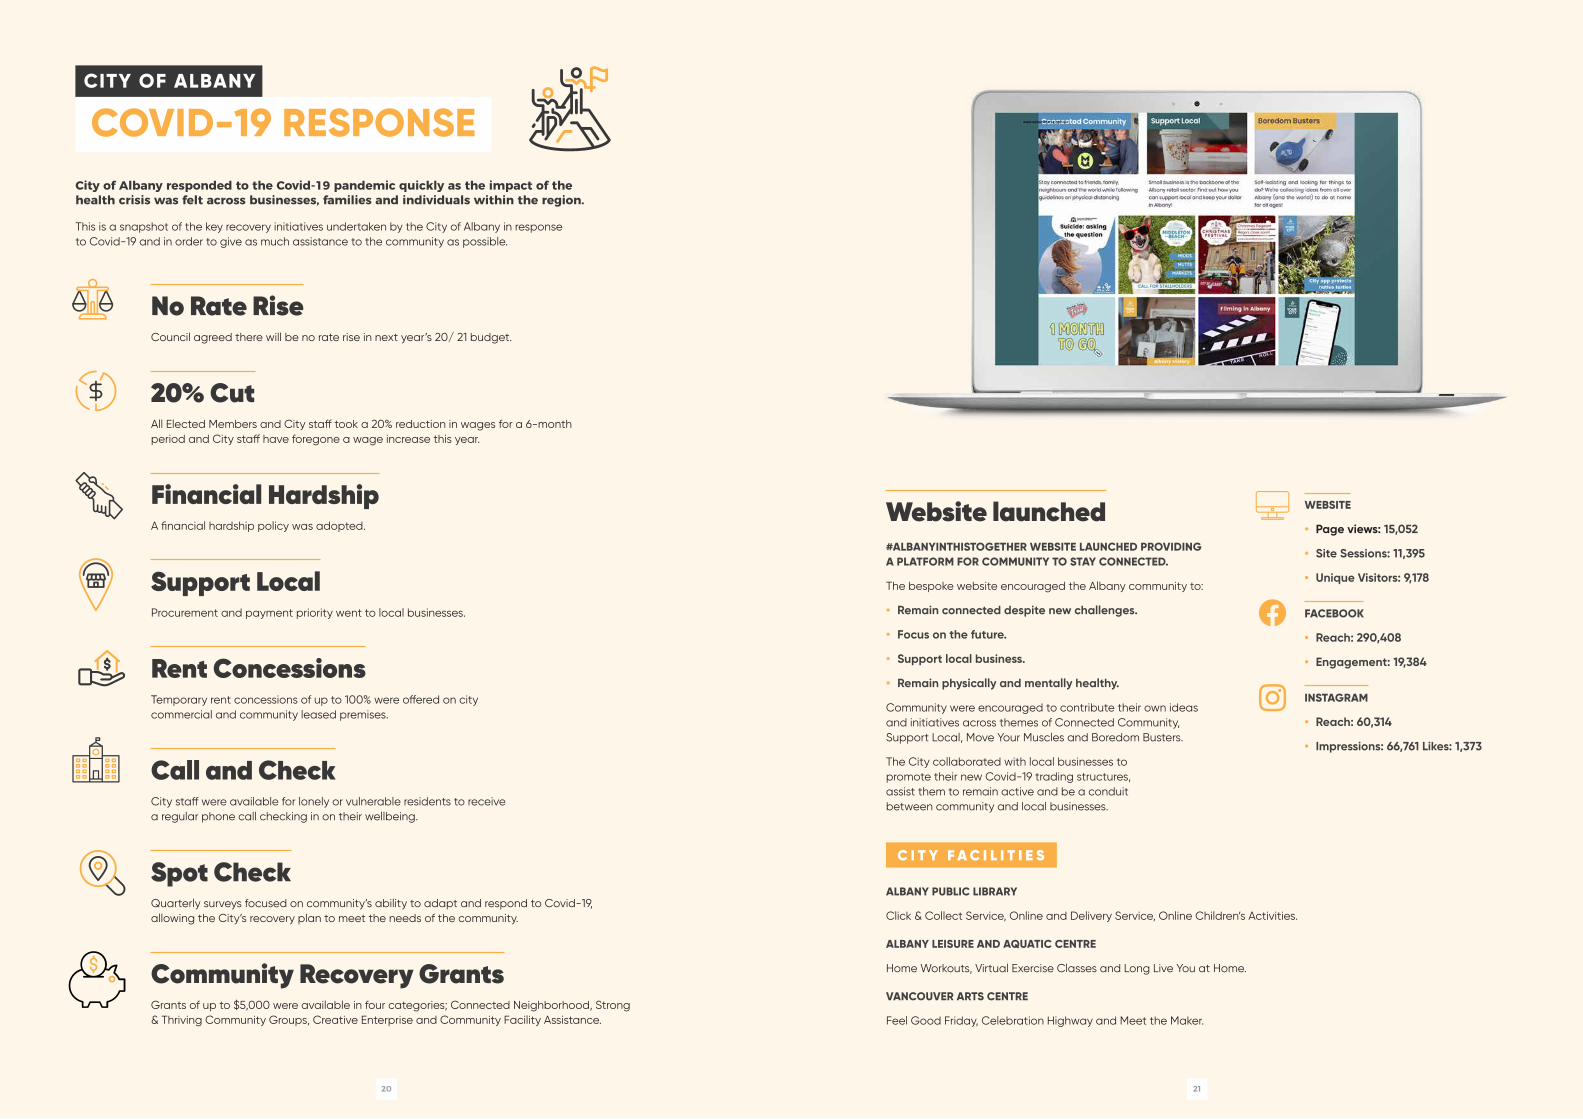
20 21
CITY OF ALBANY
City of Albany responded to the Covid-19 pandemic quickly as the impact of the health crisis was felt across businesses, families and individuals within the region.
This is a snapshot of the key recovery initiatives undertaken by the City of Albany in response to Covid-19 and in order to give as much assistance to the community as possible.
No Rate RiseCouncil agreed there will be no rate rise in next year’s 20/ 21 budget.
20% CutAll Elected Members and City staff took a 20% reduction in wages for a 6-month period and City staff have foregone a wage increase this year.
Financial HardshipA financial hardship policy was adopted.
Support LocalProcurement and payment priority went to local businesses.
Rent ConcessionsTemporary rent concessions of up to 100% were offered on city commercial and community leased premises.
Call and CheckCity staff were available for lonely or vulnerable residents to receive a regular phone call checking in on their wellbeing.
Spot CheckQuarterly surveys focused on community’s ability to adapt and respond to Covid-19, allowing the City’s recovery plan to meet the needs of the community.
Community Recovery Grants Grants of up to $5,000 were available in four categories; Connected Neighborhood, Strong & Thriving Community Groups, Creative Enterprise and Community Facility Assistance.
Website launched#ALBANYINTHISTOGETHER WEBSITE LAUNCHED PROVIDING A PLATFORM FOR COMMUNITY TO STAY CONNECTED.
The bespoke website encouraged the Albany community to:
• Remain connected despite new challenges.
• Focus on the future.
• Support local business.
• Remain physically and mentally healthy.
Community were encouraged to contribute their own ideas and initiatives across themes of Connected Community, Support Local, Move Your Muscles and Boredom Busters.
The City collaborated with local businesses to promote their new Covid-19 trading structures, assist them to remain active and be a conduit between community and local businesses.
COVID-19 RESPONSE
WEBSITE
• Page views: 15,052
• Site Sessions: 11,395
• Unique Visitors: 9,178
• Reach: 290,408
• Engagement: 19,384
• Reach: 60,314
• Impressions: 66,761 Likes: 1,373
C I T Y F A C I L I T I E S
ALBANY PUBLIC LIBRARY
Click & Collect Service, Online and Delivery Service, Online Children’s Activities.
ALBANY LEISURE AND AQUATIC CENTRE
Home Workouts, Virtual Exercise Classes and Long Live You at Home.
VANCOUVER ARTS CENTRE
Feel Good Friday, Celebration Highway and Meet the Maker.

22 23
CITY OF ALBANY
FACILITIES
ALBANYREGIONAL AIRPORT
ALBANY REGIONAL DAY CARE
ALBANYVISITOR CENTRE
VANCOUVERARTS CENTRE
HANRAHANWASTE DEPOT
ALBANY HERITAGE PARK & NATIONAL ANZAC CENTRE
ALBANY LEISURE & AQUATIC CENTRE
ALBANY PUBLIC LIBRARY
24 25
F A C I L I T I E S
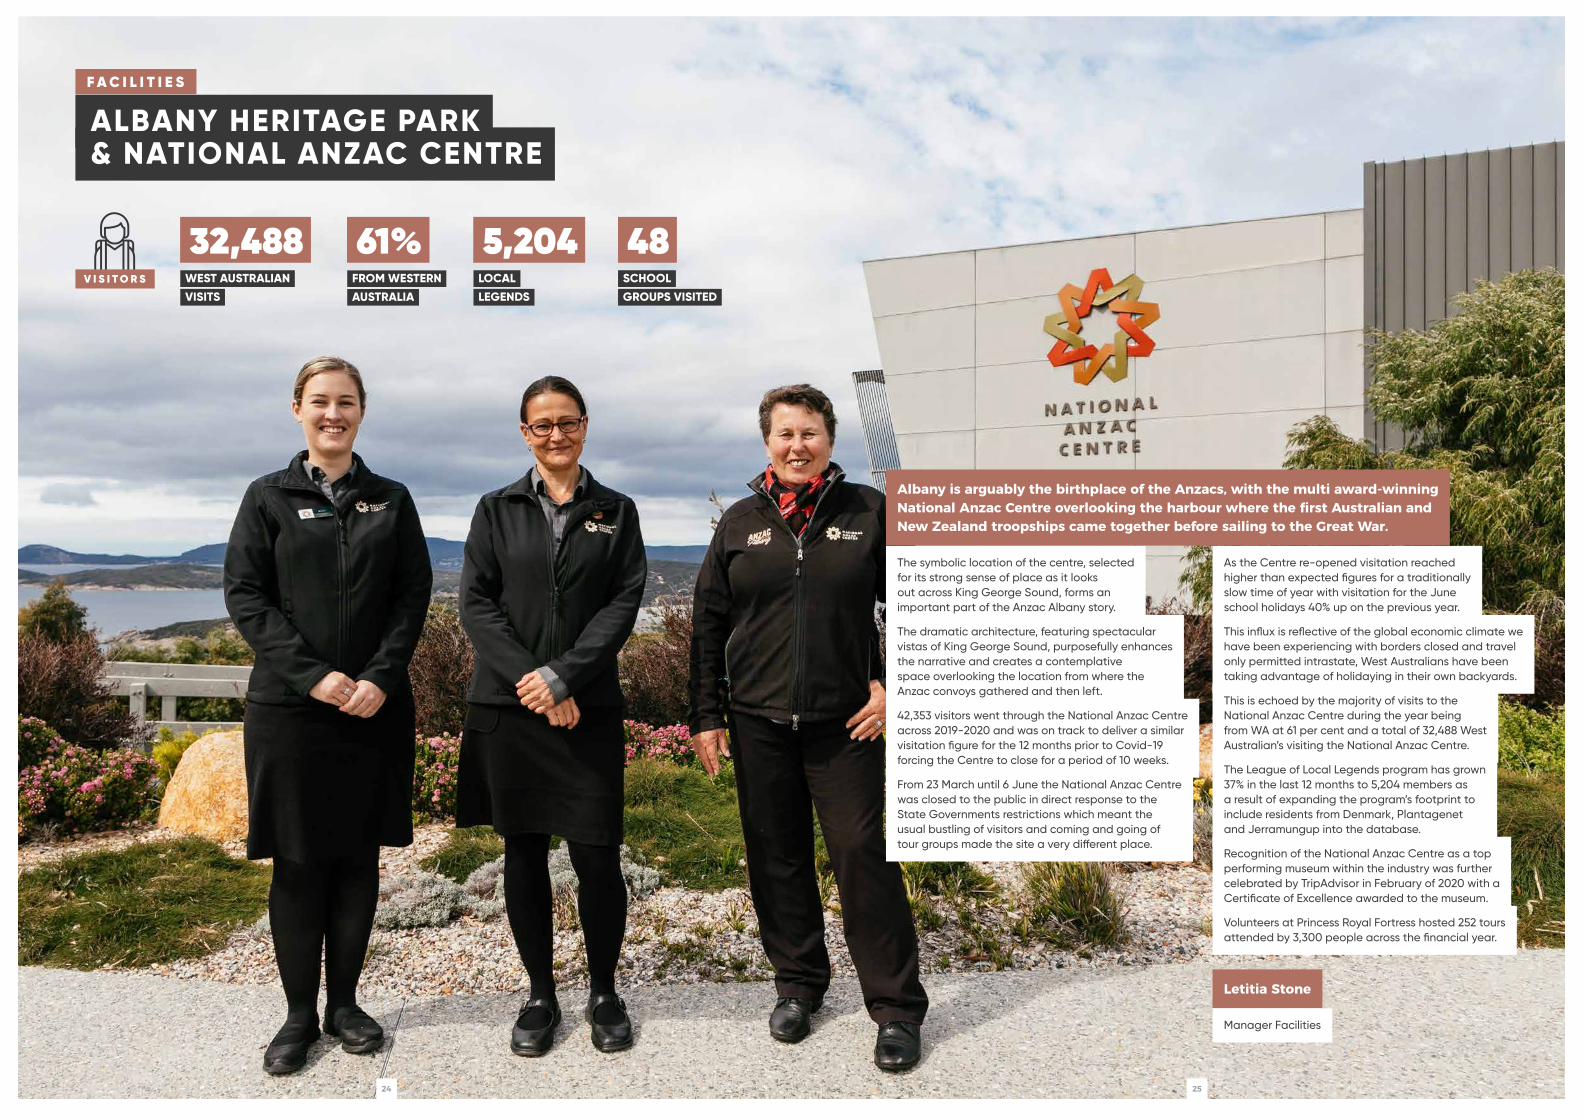
The symbolic location of the centre, selected for its strong sense of place as it looks out across King George Sound, forms an important part of the Anzac Albany story.
The dramatic architecture, featuring spectacular vistas of King George Sound, purposefully enhances the narrative and creates a contemplative space overlooking the location from where the Anzac convoys gathered and then left.
42,353 visitors went through the National Anzac Centre across 2019-2020 and was on track to deliver a similar visitation figure for the 12 months prior to Covid-19 forcing the Centre to close for a period of 10 weeks.
From 23 March until 6 June the National Anzac Centre was closed to the public in direct response to the State Governments restrictions which meant the usual bustling of visitors and coming and going of tour groups made the site a very different place.
As the Centre re-opened visitation reached higher than expected figures for a traditionally slow time of year with visitation for the June school holidays 40% up on the previous year.
This influx is reflective of the global economic climate we have been experiencing with borders closed and travel only permitted intrastate, West Australians have been taking advantage of holidaying in their own backyards.
This is echoed by the majority of visits to the National Anzac Centre during the year being from WA at 61 per cent and a total of 32,488 West Australian’s visiting the National Anzac Centre.
The League of Local Legends program has grown 37% in the last 12 months to 5,204 members as a result of expanding the program’s footprint to include residents from Denmark, Plantagenet and Jerramungup into the database.
Recognition of the National Anzac Centre as a top performing museum within the industry was further celebrated by TripAdvisor in February of 2020 with a Certificate of Excellence awarded to the museum.
Volunteers at Princess Royal Fortress hosted 252 tours attended by 3,300 people across the financial year.
Letitia Stone
Manager Facilities
ALBANY HERITAGE PARK & NATIONAL ANZAC CENTRE
V I S I T O R S
32,488WEST AUSTRALIAN
VISITS
61%FROM WESTERN
AUSTRALIA
5,204LOCAL
LEGENDS
48SCHOOL
GROUPS VISITED
Albany is arguably the birthplace of the Anzacs, with the multi award-winning National Anzac Centre overlooking the harbour where the first Australian and New Zealand troopships came together before sailing to the Great War.
26 27
F A C I L I T I E S
ALBANYREGIONAL AIRPORT
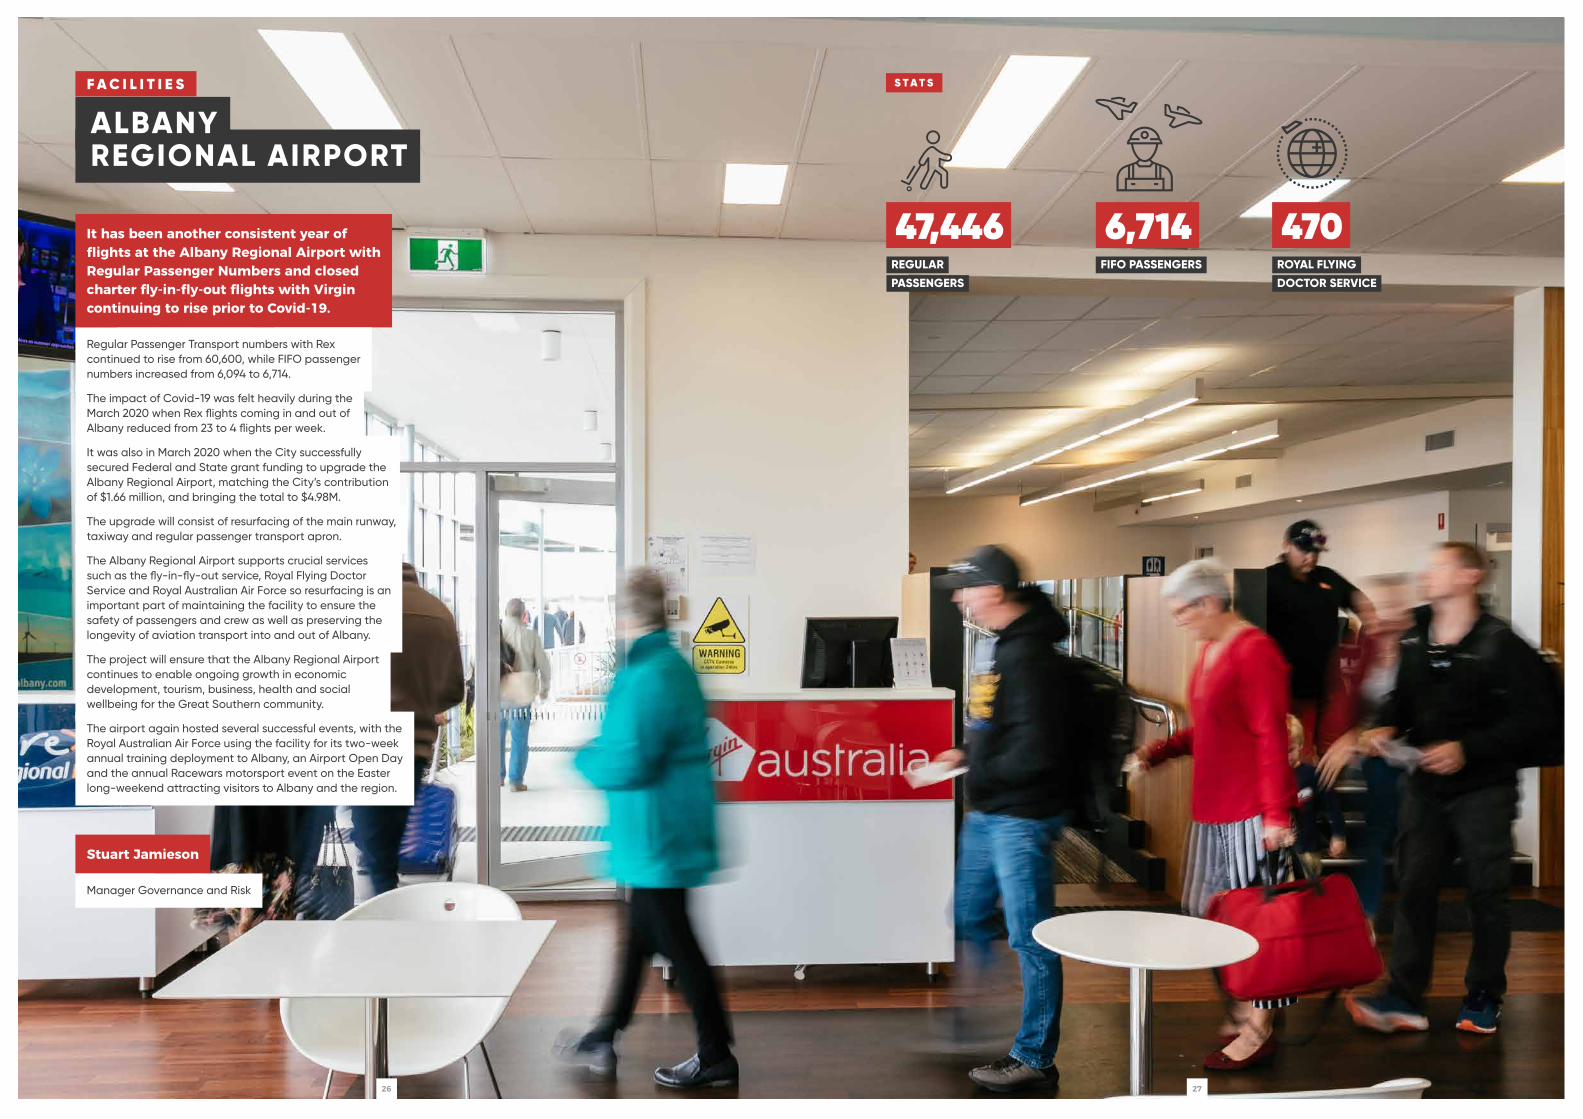
It has been another consistent year of flights at the Albany Regional Airport with Regular Passenger Numbers and closed charter fly-in-fly-out flights with Virgin continuing to rise prior to Covid-19.
Regular Passenger Transport numbers with Rex continued to rise from 60,600, while FIFO passenger numbers increased from 6,094 to 6,714.
The impact of Covid-19 was felt heavily during the March 2020 when Rex flights coming in and out of Albany reduced from 23 to 4 flights per week.
It was also in March 2020 when the City successfully secured Federal and State grant funding to upgrade the Albany Regional Airport, matching the City’s contribution of $1.66 million, and bringing the total to $4.98M.
The upgrade will consist of resurfacing of the main runway, taxiway and regular passenger transport apron.
The Albany Regional Airport supports crucial services such as the fly-in-fly-out service, Royal Flying Doctor Service and Royal Australian Air Force so resurfacing is an important part of maintaining the facility to ensure the safety of passengers and crew as well as preserving the longevity of aviation transport into and out of Albany.
The project will ensure that the Albany Regional Airport continues to enable ongoing growth in economic development, tourism, business, health and social wellbeing for the Great Southern community.
The airport again hosted several successful events, with the Royal Australian Air Force using the facility for its two-week annual training deployment to Albany, an Airport Open Day and the annual Racewars motorsport event on the Easter long-weekend attracting visitors to Albany and the region.
Stuart Jamieson
Manager Governance and Risk
S T A T S
47,446REGULAR
PASSENGERS
ROYAL FLYING
DOCTOR SERVICE
4706,714FIFO PASSENGERS
28 29
F A C I L I T I E S
ALBANY LEISURE & AQUATIC CENTRE
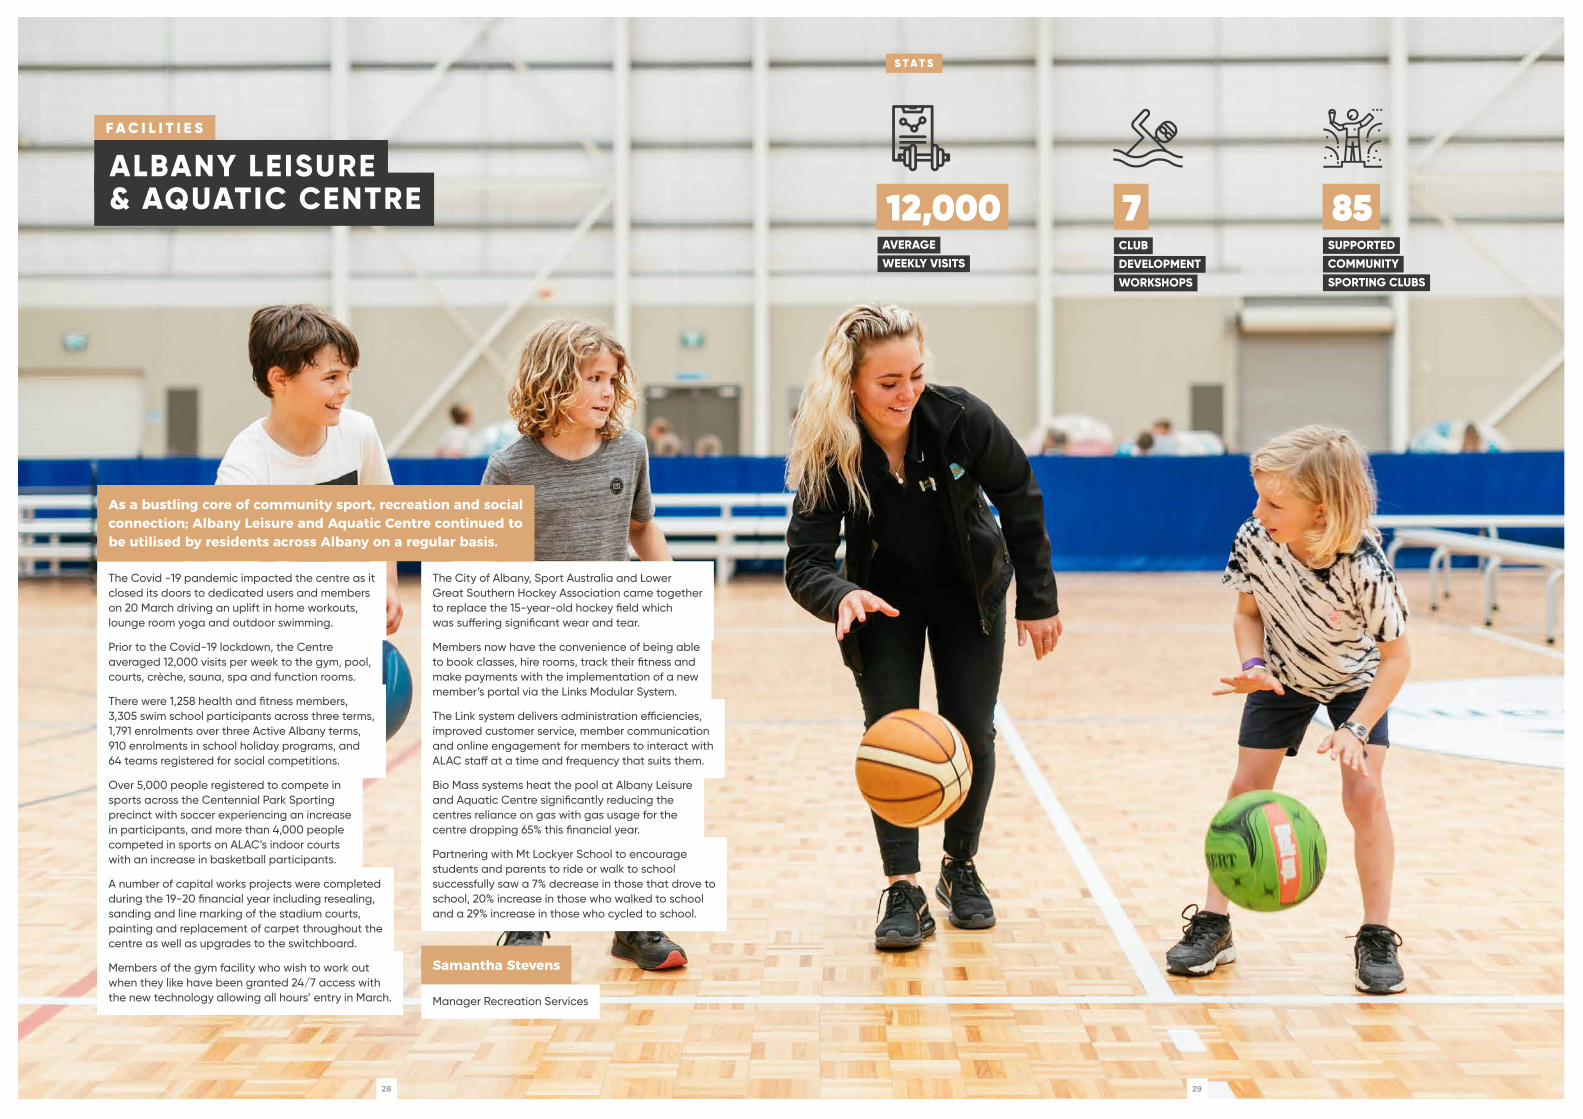
The Covid -19 pandemic impacted the centre as it closed its doors to dedicated users and members on 20 March driving an uplift in home workouts, lounge room yoga and outdoor swimming.
Prior to the Covid-19 lockdown, the Centre averaged 12,000 visits per week to the gym, pool, courts, crèche, sauna, spa and function rooms.
There were 1,258 health and fitness members, 3,305 swim school participants across three terms, 1,791 enrolments over three Active Albany terms, 910 enrolments in school holiday programs, and 64 teams registered for social competitions.
Over 5,000 people registered to compete in sports across the Centennial Park Sporting precinct with soccer experiencing an increase in participants, and more than 4,000 people competed in sports on ALAC’s indoor courts with an increase in basketball participants.
A number of capital works projects were completed during the 19-20 financial year including resealing, sanding and line marking of the stadium courts, painting and replacement of carpet throughout the centre as well as upgrades to the switchboard.
Members of the gym facility who wish to work out when they like have been granted 24/7 access with the new technology allowing all hours’ entry in March.
The City of Albany, Sport Australia and Lower Great Southern Hockey Association came together to replace the 15-year-old hockey field which was suffering significant wear and tear.
Members now have the convenience of being able to book classes, hire rooms, track their fitness and make payments with the implementation of a new member’s portal via the Links Modular System.
The Link system delivers administration efficiencies, improved customer service, member communication and online engagement for members to interact with ALAC staff at a time and frequency that suits them.
Bio Mass systems heat the pool at Albany Leisure and Aquatic Centre significantly reducing the centres reliance on gas with gas usage for the centre dropping 65% this financial year.
Partnering with Mt Lockyer School to encourage students and parents to ride or walk to school successfully saw a 7% decrease in those that drove to school, 20% increase in those who walked to school and a 29% increase in those who cycled to school.
Samantha Stevens
Manager Recreation Services
12,000AVERAGE
WEEKLY VISITS
S T A T S
85SUPPORTED
COMMUNITY
SPORTING CLUBS
7CLUB
DEVELOPMENT
WORKSHOPS
As a bustling core of community sport, recreation and social connection; Albany Leisure and Aquatic Centre continued to be utilised by residents across Albany on a regular basis.

30 31
F A C I L I T I E S
ALBANY PUBLIC LIBRARY
From July 2019 to March 2020 when the Covid-19 pandemic temporarily shut the doors, the library continued to be a dynamic centre of community activity and engagement.
Demand for the library’s meeting rooms rose in popularity, with an average of 60 bookings a month, balanced between library programs, community events, corporate meetings and City of Albany consultations.
Through Brandenburg Trust funding, the library introduced a Technology Lending Service for seniors, established a sub-branch library at the Beryl Grant Community Centre and developed an outreach Book Chat program at Hawthorne House.
The library was also successful in securing Be Connected funding through the Good Things Foundation that enabled trained Digital Mentors to deliver support to seniors in the digital space.
Junior and Young Adult activities and programs remained popular, with one-on-one tutoring sessions for year 12 students in high demand.
As a supporter of community events and activities, the library was involved in NAIDOC week, Youth Week, Mad Hatters Tea Party, Anti–Poverty Week and Pride Week activities.
In March the library closed due to Covid-19, and staff were quick to respond to the needs of the community by adapting services within the confines of the Covid-19 restrictions.
New initiatives included an expansion to the established Home Library Service including a Home Delivery Service for vulnerable patrons. Items were selected and delivered to those who were housebound or in the vulnerable category. 80 patrons over a recurring 4 week cycle received deliveries.
Other innovations introduced during the lock-down were online registrations for new memberships, Staff Select & Collect, junior bundles and a Click & Collect service.
A phone service was also introduced to contact patrons over the age of 70 who did not have email addresses, to ensure they knew services were still available for them to access. Through this process library staff were able to identify patrons who needed extra support as well as being a friendly voice on the end of the phone, during an unsettling period.
The library purchased additional eResources which saw a significant increase in usage during the lockdown.
Paul Nielsen
Manager Precinct
S T A T S
87,344E-BOOKS, E-AUDIOS AND
E-MAGAZINES BORROWED
216,569
1,387 22
BORROWED ITEMS
NEW MEMBERSHIPS LOANS
MOST BORROWED ITEM,
THE MIDNIGHT LINE
BY LEE CHILD

32 33
F A C I L I T I E S
ALBANYVISITOR CENTRE
March 2020 marked 2 successful years at the new central location on York Street for the Albany Visitor Centre where both staff, community and visitors have expressed support for the move.
From 24 March until 27 May the Albany Visitor Centre closed due to Covid-19 and with regional borders closed for most of this period, foot traffic into the Centre was scarce.
Despite a two-month setback, the Albany Visitor Centre was named a finalist in the 2019 Perth Airport WA Tourism Awards for Visitor Information Services and won silver at WA’s GWN7 Top Tourism Town Awards.
Albany Visitor Centre counted more than 120,000 visitors during the financial year, distributed more than 500 maps a week, made almost 2,000 accommodation bookings and received an average of 800 phone calls per week.
Once regional borders reopened to the state, the Albany Visitor Centre visitors flocked to Albany in droves with accommodation bookings for June alone up by 222% on the previous year and room nights for the same period were up 205%.
Albany Visitor Centre not only makes tour and accommodation bookings for visitors but also supports local producers of homemade jams, honey, relishes and crafts. They support and provide training to local operators, book flights, create itineraries for trips all around Australia and coordinate cruise ship support and related tours and activities.
Steve Williams
Albany Visitor Centre Coordinator
S T A T S
121,205VISITORS TO
THE CENTRE
26,000MAPS DISTRIBUTED
18,500CRUISE SHIPS
PASSENGERS
20,000HOLIDAY PLANNERS
12SUPPORTED
CRUISE SHIPS

34 35
F A C I L I T I E S
VANCOUVER ARTS CENTRE
2020 marks forty years of the Vancouver Arts Centre being a home for artists and community to come together to make art and experience exhibitions and performances and all things creative.
As we acknowledge the milestone, we look towards a period of transition, with the Arts & Culture team expanding to take on the redeveloped Town Hall from the end of 2020.
This period of opportunity will further strengthen the Vancouver Arts Centre’s role in the community as a hub for creativity, a place to be involved in making art, in sharing and learning new skills and as a place to gather and make new friends.
The past 12 months have welcomed a number of programs to the centre including Mama Stitch, a performance based project and installation by Whisky and Boots, drawn from local community members reminiscing about their mothers.
The Brandenburg Trust Resident Artist Program saw two successful projects in aged care facilities, where artists worked collaboratively with staff, residents and dementia sufferers on creative projects.
Vancouver Arts Centre supported the development and delivery of Chorus by Annette Carmichael Projects, a large scale contemporary dance performance calling for the end of Violence against women, involving over 200 women from across the Great Southern, Perth and Bunbury.
A rolling program of exhibitions were presented throughout the year supporting local artists and presenting a wide range of artforms; Kinjarling Studies by Tahlia Plamer, Unravelling by Jen Mitchell, Amongst Lilies by Lois Schenk, Waterways by Nari Lees and Walk a Mile in Their Shoes by Ash Wallrodt.
Through the Compassionate Communities Project, the VAC commissioned an exhibition for Dying to Know Day from local artists Ruth Maddren and James Gentle, which offered a different perspective on how we view death and grief at any age.
Despite being closed over the Covid-19 period shut down, the Vancouver Arts Centre team found ways to continue working with community and to support local artists;
Feel Good Fridays, a series of online concerts allowed local musicians to live stream a short performance over social media which the community could watch for free.
The Pandemic Poster Project encouraged budding artists and designers to create a poster that conveyed a public health message relating to Covid-19 and the Celebration Highway project encouraged people to make a row of bunting as an act of hope for a future time when we could all gather together again publicly.
The team also assisted local artists with accessing state and federal relief funding and specific creative industry grants to support them through this difficult period.
Amber Launay
Vancouver Arts Centre Team Leader
36 37
ALBANY REGIONAL DAY CARE
F A C I L I T I E S
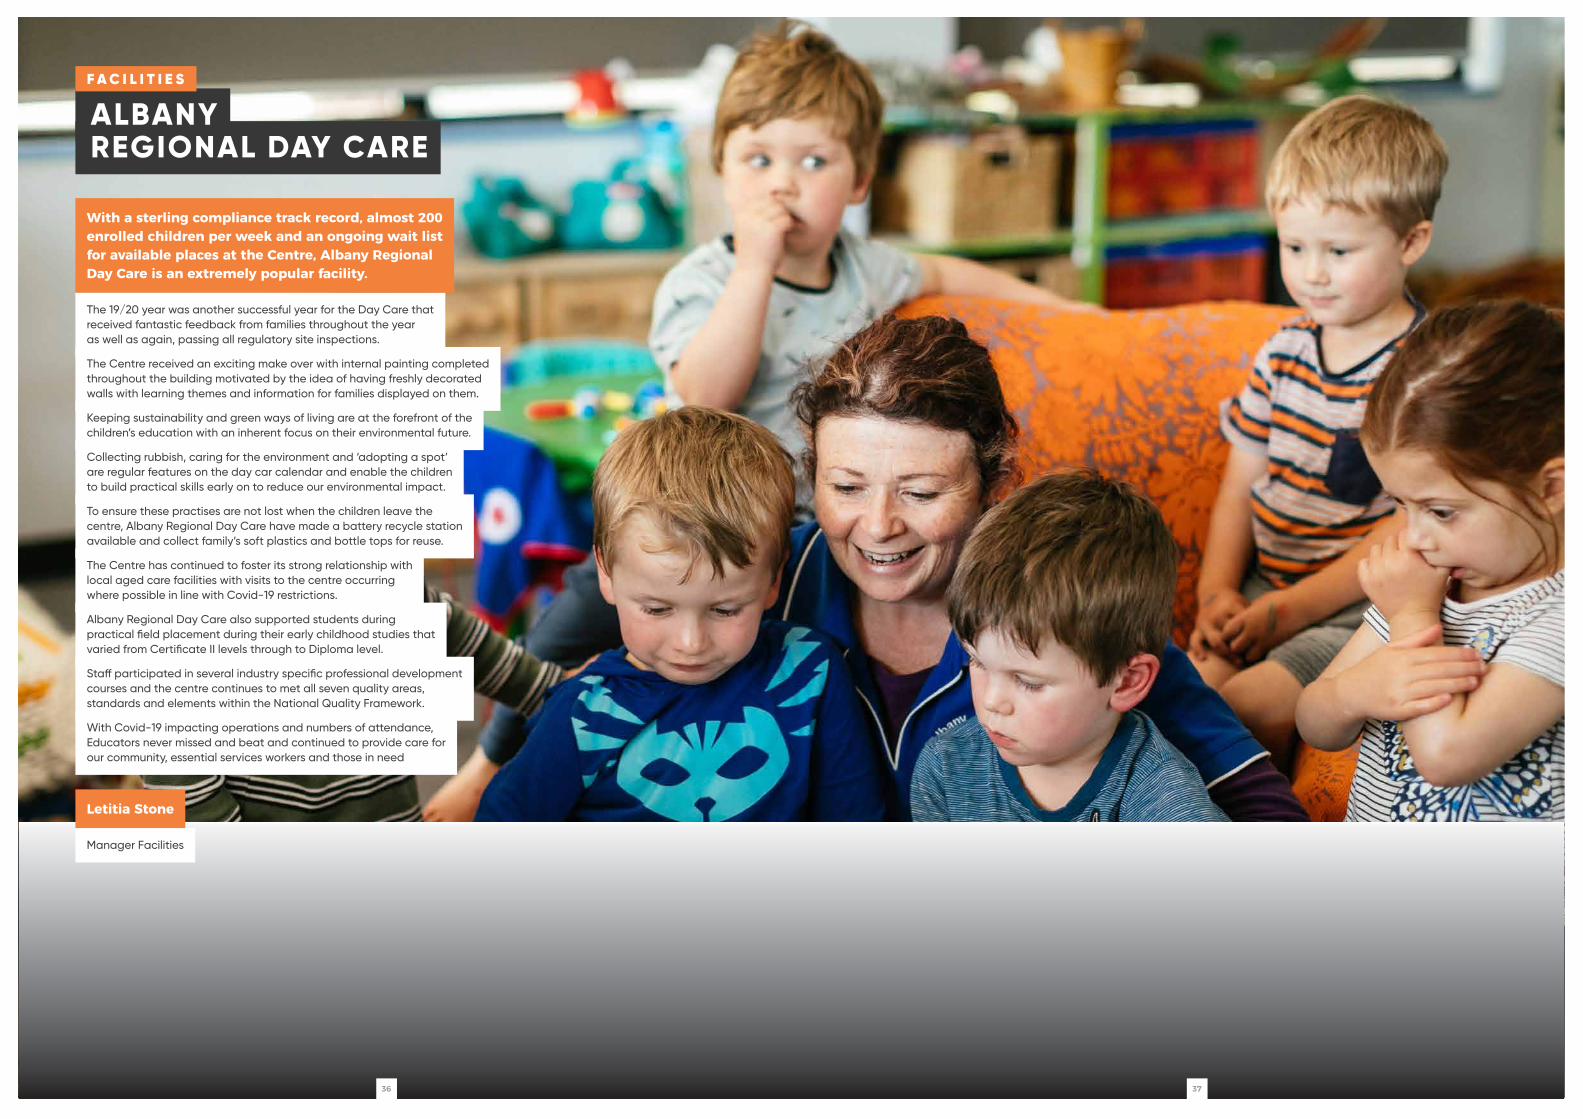
With a sterling compliance track record, almost 200 enrolled children per week and an ongoing wait list for available places at the Centre, Albany Regional Day Care is an extremely popular facility.
The 19/20 year was another successful year for the Day Care that received fantastic feedback from families throughout the year as well as again, passing all regulatory site inspections.
The Centre received an exciting make over with internal painting completed throughout the building motivated by the idea of having freshly decorated walls with learning themes and information for families displayed on them.
Keeping sustainability and green ways of living are at the forefront of the children’s education with an inherent focus on their environmental future.
Collecting rubbish, caring for the environment and ‘adopting a spot’ are regular features on the day car calendar and enable the children to build practical skills early on to reduce our environmental impact.
To ensure these practises are not lost when the children leave the centre, Albany Regional Day Care have made a battery recycle station available and collect family’s soft plastics and bottle tops for reuse.
The Centre has continued to foster its strong relationship with local aged care facilities with visits to the centre occurring where possible in line with Covid-19 restrictions.
Albany Regional Day Care also supported students during practical field placement during their early childhood studies that varied from Certificate II levels through to Diploma level.
Staff participated in several industry specific professional development courses and the centre continues to met all seven quality areas, standards and elements within the National Quality Framework.
With Covid-19 impacting operations and numbers of attendance, Educators never missed and beat and continued to provide care for our community, essential services workers and those in need
Letitia Stone
Manager Facilities

38 39
WASTE SERVICESF A C I L I T I E S
Albany’s three bin service was provided to 15,370 urban households who put an average of 14kg of garden waste, commingled recyclables and landfill waste in their bins each week.
Of this, we recovered 32% with 2,004 tonnes of material processed for recycling, 1,557 tonnes of green waste composted, and 7,691 tonnes sent to landfill.
During the year public litter bins were emptied more than 52,700 times and public recycle bins were emptied more than 2,400 times.
Urban residents were provided with a bulk green waste collection during May and June 2020 with 415 tonnes of garden prunings destined to become compost.
More than 57,000 tonnes (or 57 million kilograms) of material came through the Hanrahan Road Waste Facility weighbridge including 783 tonnes of scrap steel, 33.5 tonnes of non-ferrous metals and 20.9 tonnes of car batteries which were transported for recycling.
Complementary vouchers to dispose of waste at one of Albany’s five rural transfer stations or two waste facilities were provided to 1583 rural households, with more than 550 tonnes of waste deposited at the transfer stations.
Fossicker’s Tip Shop remained a firm favourite for Albany residents and, despite a period of closure followed by reduced hours of operation due to implications of the Covid-19 pandemic, 245 tonnes were saved from landfill through 32,122 transactions.
For the first time the City of Albany joined more than 140 local councils nationwide for Garage Sale Trail in October 2019, encouraging residents to discover the advantages of buying and selling second-hand. The City took out the Best Regional Campaign Award, recognising the way Garage Sale Trail was embraced by the council and supported by the community.
Our community embraced sustainability with more than 1,600 participants taking part in 34 tours and presentations at Hanrahan Road Waste Facility and incursions at schools and community groups run by Cleanaway’s Education Officer before these activities were put on hold due to Covid-19 restrictions.
The annual Green Fair on the Square returned in November 2019 with approximately 2,000 people enjoying the celebration of all things clean, green and sustainable
Ruth March
Manager City Engineering
S O L D A T F O S S I C K E R ’ S T I P S H O P
146SCOOTERS
76ESKIES
42WHEELBARROWS
35DOG KENNELS
Leadership
Smart, Prosperous & Growing
Clean, Green & Sustainable
Community Health & Participation
Connected & Safe Built Environment
40 41
1
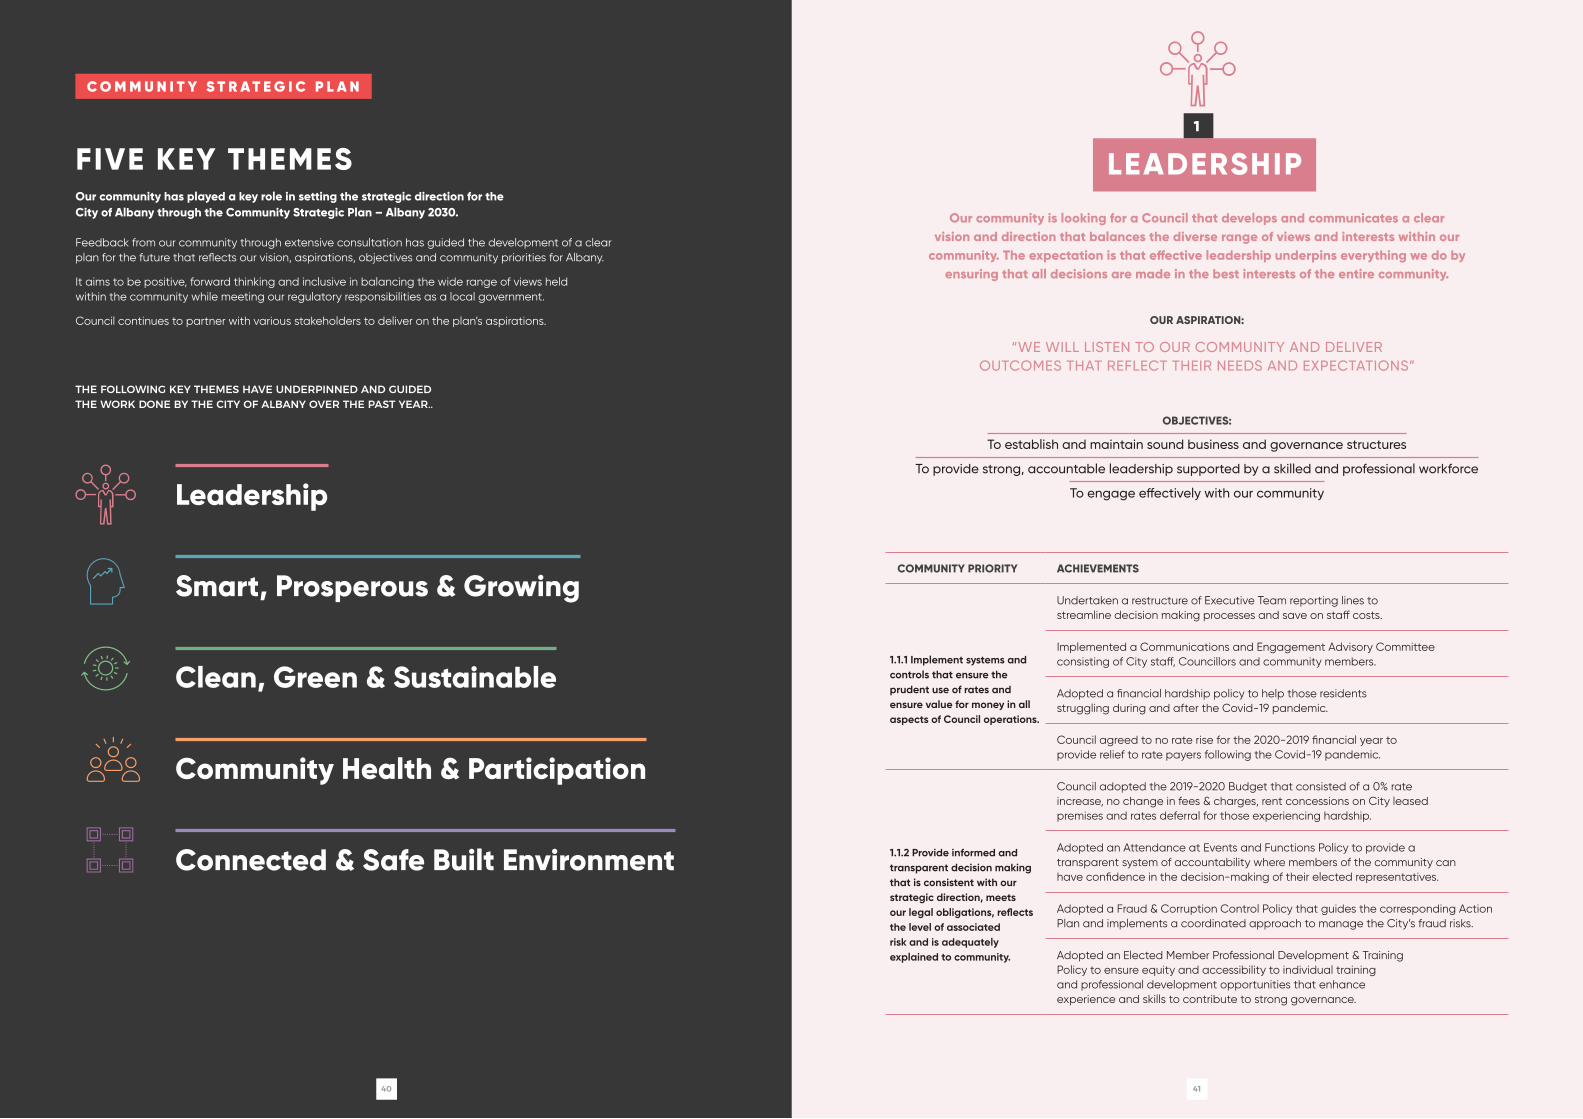
Our community has played a key role in setting the strategic direction for the City of Albany through the Community Strategic Plan – Albany 2030.
Feedback from our community through extensive consultation has guided the development of a clear plan for the future that reflects our vision, aspirations, objectives and community priorities for Albany.
It aims to be positive, forward thinking and inclusive in balancing the wide range of views held within the community while meeting our regulatory responsibilities as a local government.
Council continues to partner with various stakeholders to deliver on the plan’s aspirations.
THE FOLLOWING KEY THEMES HAVE UNDERPINNED AND GUIDED THE WORK DONE BY THE CITY OF ALBANY OVER THE PAST YEAR..
FIVE KEY THEMES
C O M M U N I T Y S T R A T E G I C P L A N
LEADERSHIP
Our community is looking for a Council that develops and communicates a clear vision and direction that balances the diverse range of views and interests within our
community. The expectation is that effective leadership underpins everything we do by ensuring that all decisions are made in the best interests of the entire community.
OBJECTIVES:
To establish and maintain sound business and governance structures
To provide strong, accountable leadership supported by a skilled and professional workforce
To engage effectively with our community
OUR ASPIRATION:
“WE WILL LISTEN TO OUR COMMUNITY AND DELIVER OUTCOMES THAT REFLECT THEIR NEEDS AND EXPECTATIONS”
COMMUNITY PRIORITY ACHIEVEMENTS
1.1.1 Implement systems and controls that ensure the prudent use of rates and ensure value for money in all aspects of Council operations.
Undertaken a restructure of Executive Team reporting lines to streamline decision making processes and save on staff costs.
Implemented a Communications and Engagement Advisory Committee consisting of City staff, Councillors and community members.
Adopted a financial hardship policy to help those residents struggling during and after the Covid-19 pandemic.
Council agreed to no rate rise for the 2020-2019 financial year to provide relief to rate payers following the Covid-19 pandemic.
1.1.2 Provide informed and transparent decision making that is consistent with our strategic direction, meets our legal obligations, reflects the level of associated risk and is adequately explained to community.
Council adopted the 2019-2020 Budget that consisted of a 0% rate increase, no change in fees & charges, rent concessions on City leased premises and rates deferral for those experiencing hardship.
Adopted an Attendance at Events and Functions Policy to provide a transparent system of accountability where members of the community can have confidence in the decision-making of their elected representatives.
Adopted a Fraud & Corruption Control Policy that guides the corresponding Action Plan and implements a coordinated approach to manage the City’s fraud risks.
Adopted an Elected Member Professional Development & Training Policy to ensure equity and accessibility to individual training and professional development opportunities that enhance experience and skills to contribute to strong governance.

42 43
Y O U T H A D V I S O R Y C O U N C I L
H A R O L D M A R T I N T R E E P L A N T I N G I N T E R N A T I O N A L D AY O F P E A C E
A L B A N Y S H A N T Y M E N A T G R E E N F A I R O N T H E S Q U A R E
M E E T U P A L B A N Y
D R F I O N A W O O D S P E A K E R S E R I E SK E Y S T O T H E C I T Y
1.2.1 Provide positive leadership that delivers community outcomes and gains a reputation for doing what is good for Albany and the surrounding region.
Supported the planning and development of two major retail/FMCG operators upsizing and injecting revenue into the city with Bunnings and McDonalds projects providing local jobs and economic development to the region.
Successfully advocated for State Government funding to replace the Ellen Cove Swimming Enclosure and assist in the construction of the landscape of the Middleton Beach Foreshore.
A Covid-19 community recovery plan was activated to support the community return to some normality following the pandemic.
Executed a Support Local marketing campaign aimed at encouraging locals to buy from an Albany owned business, particularly through the hardship of Covid-19.
1.2.2 Develop contemporary service delivery and staff development programs to ensure a professional and resilient workforce which is continually improving.
Held a Regional Local Government Conference over two days in November 2019. This was well attended by both staff and elected members from City of Albany and the Shires of Cranbrook, Denmark and Broomehill Tambellup.
Adopted a Customer Service Charter that addressed a review of the City’s customer service standards and provides a framework based on broad themes that support best practice customer service.
Safety training was provided to staff in first aid, handling an extinguisher, emergency warden, mental health, suicide prevention and risk management.
Staff continued to attend seminars, workshops and conferences in the first half of the financial year to improve their skills, build networks and bring back ideas to improve work processes and practices.
Operational teams continue to upskill and maintain currency with required tickets and licences.
Education around the Covid-19 pandemic both in-house and via online mediums.
1.3.1 Develop structures and processes that engage community and engender community confidence, and trust that their input is valued and used to inform decisions and priorities.
Sought community input into the Artificial Surf Reef project that is planned for Middleton Beach that will provide tourism, safer surfing location options and economic development to Albany.
Continued to hold Council Meet and Greet functions in specific areas of the community that allowed residents to engage with Council and the City on a direct level.
Developed frequent and efficient use of the Consultations module within the Spark technology that supports the City of Albany website.
1.3.2 Improve community engagement processes and platforms to provide our community with a variety of opportunities to be involved and contribute to decisions.
Communications and Engagement Strategy was adopted by Council that aims to get a better understanding of the community’s needs and wants through extensive community consultation.
Communications and Engagement Advisory Group was established that comprises of City staff, Councillors and residents that meet regularly.
Ran a free community workshop relating to how trails create jobs, grown regional economies and build communities.
Held a Customer Service Charter roundtable panel group open to the public in order to gain feedback, comments and ideas about the charter.
Ordinary Council Meetings continue to offer residents an opportunity to have their say each month with this platform being reinvented in 2019-2020 when the About Face Youth Choir performed a flash mob to successfully get their voice heard.
Hosted a Council City Chat that focused on communication and engagement with the community, giving residents the chance to chat to councillors informally.
Began development of a revised National Anzac Centre website and new Arts & Culture website that brought the platforms into current operational standards, increased usability and navigation.
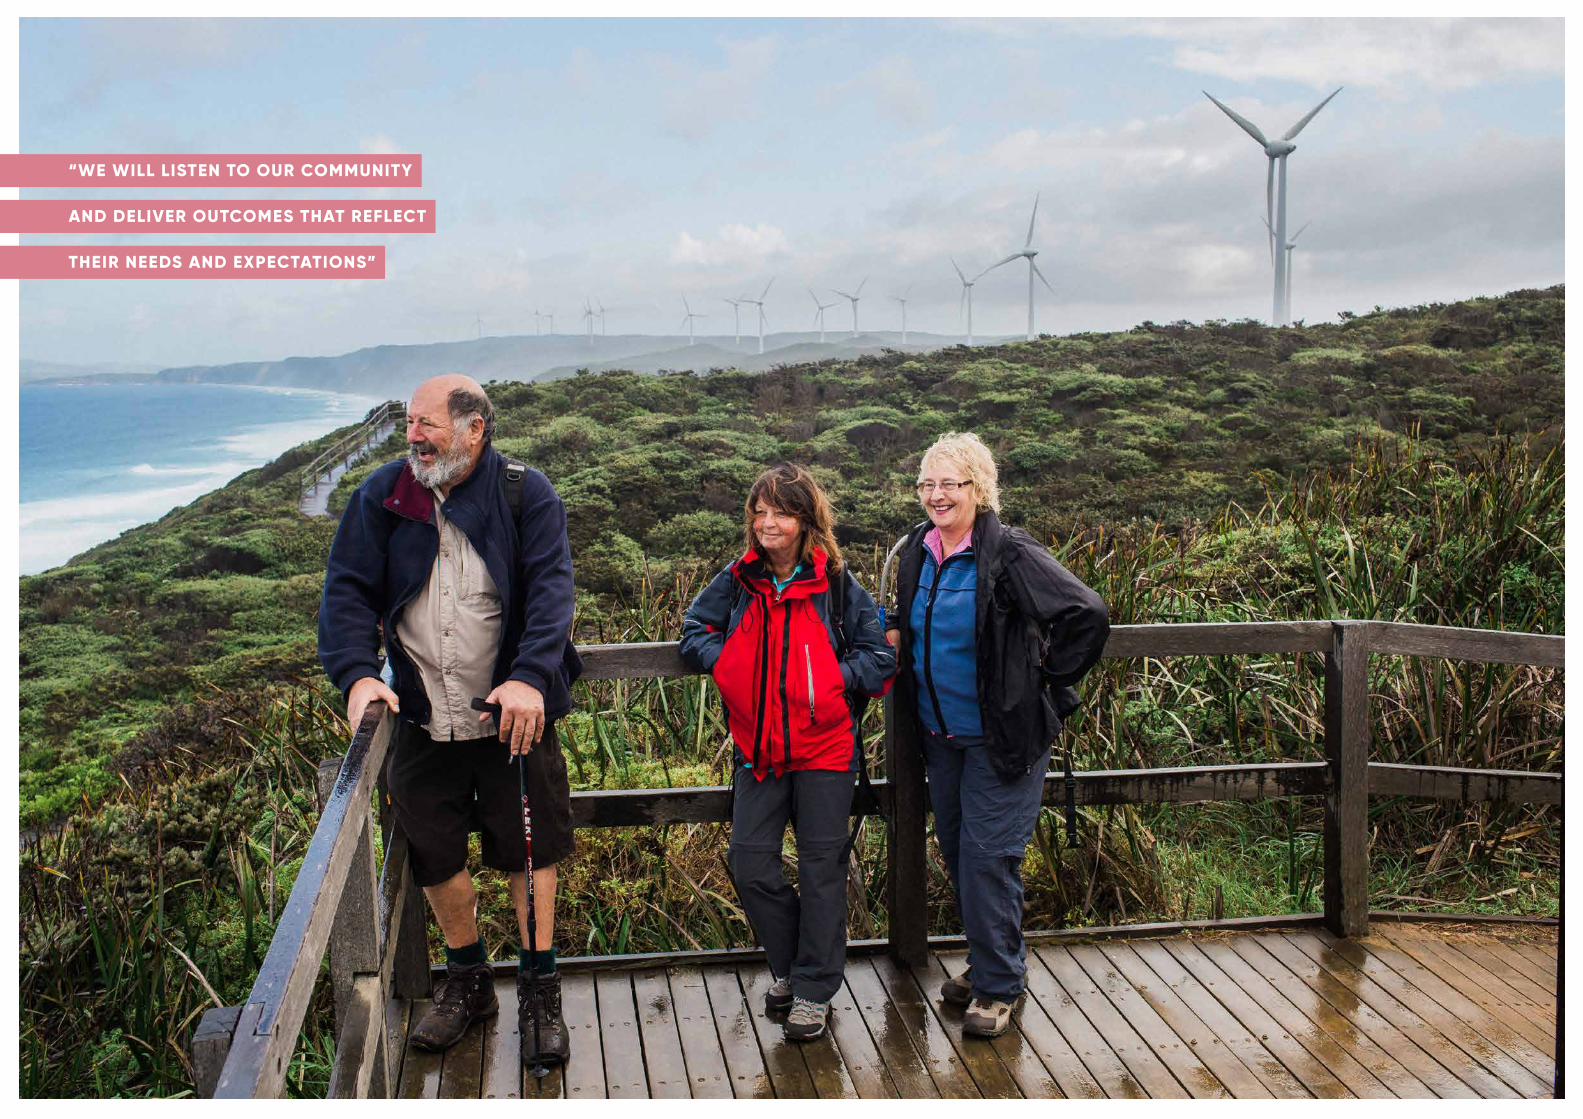
“WE WILL LISTEN TO OUR COMMUNITY
AND DELIVER OUTCOMES THAT REFLECT
THEIR NEEDS AND EXPECTATIONS”

C E N T E N N I A L P A R K S P O R T I N G P R E C I N C T
U S S U B M A R I N E R S
Y O U T H C H A L L E N G E P A R K F U N D I N G A N N O U N C E M E N T
V A N C O U V E R S T R E E T F E S T I V A L
R A C E W A R S
46 47
SMART, PROSPEROUSAND GROWING
Our community is looking for a Council that develops and communicates a clear vision and direction that balances the diverse range of views and interests within our
community. The expectation is that effective leadership underpins everything we do by ensuring that all decisions are made in the best interests of the entire community.
2
COMMUNITY PRIORITY ACHIEVEMENTS
2.1.1 Work with business and other stakeholders to attract investment; diversify the economy; create jobs and support small business growth.
Partnered with Fathom & Co to host ‘Gov Hack; Festival of Ideas’ with one Albany team taking out several awards.
Developed a Support Local marketing campaign aimed at encouraging residents to shop at a local business when they can. The campaign was seen across television, online and social media and featured local people and local operators.
Staff vacancies advertised in nationally and industry specific locations to encourage a pool of applicants with diverse and varied backgrounds.
Offered a discounted fee to approved charitable organisations to dispose of waste at Hanrahan Road Waste Facility.
Revised the Trading in Public Places Policy to allow more flexibility to mobile businesses, more opportunity to trade and a more harmonious relationship with brick and mortar operations.
OBJECTIVES:
To strengthen and grow our region’s economic base
To develop a smart city that supports economic growth
To develop and promote Albany as a unique and sought-after visitor location
OUR ASPIRATION:
“WE WILL PARTNER AND ADVOCATE WITH RELEVANT STAKEHOLDERS TO DIVERSIFY OUR ECONOMY AND ESTABLISH A CULTURE OF LIFE-LONG LEARNING TO SUPPORT AND GROW LOCAL EMPLOYMENT”
48 49
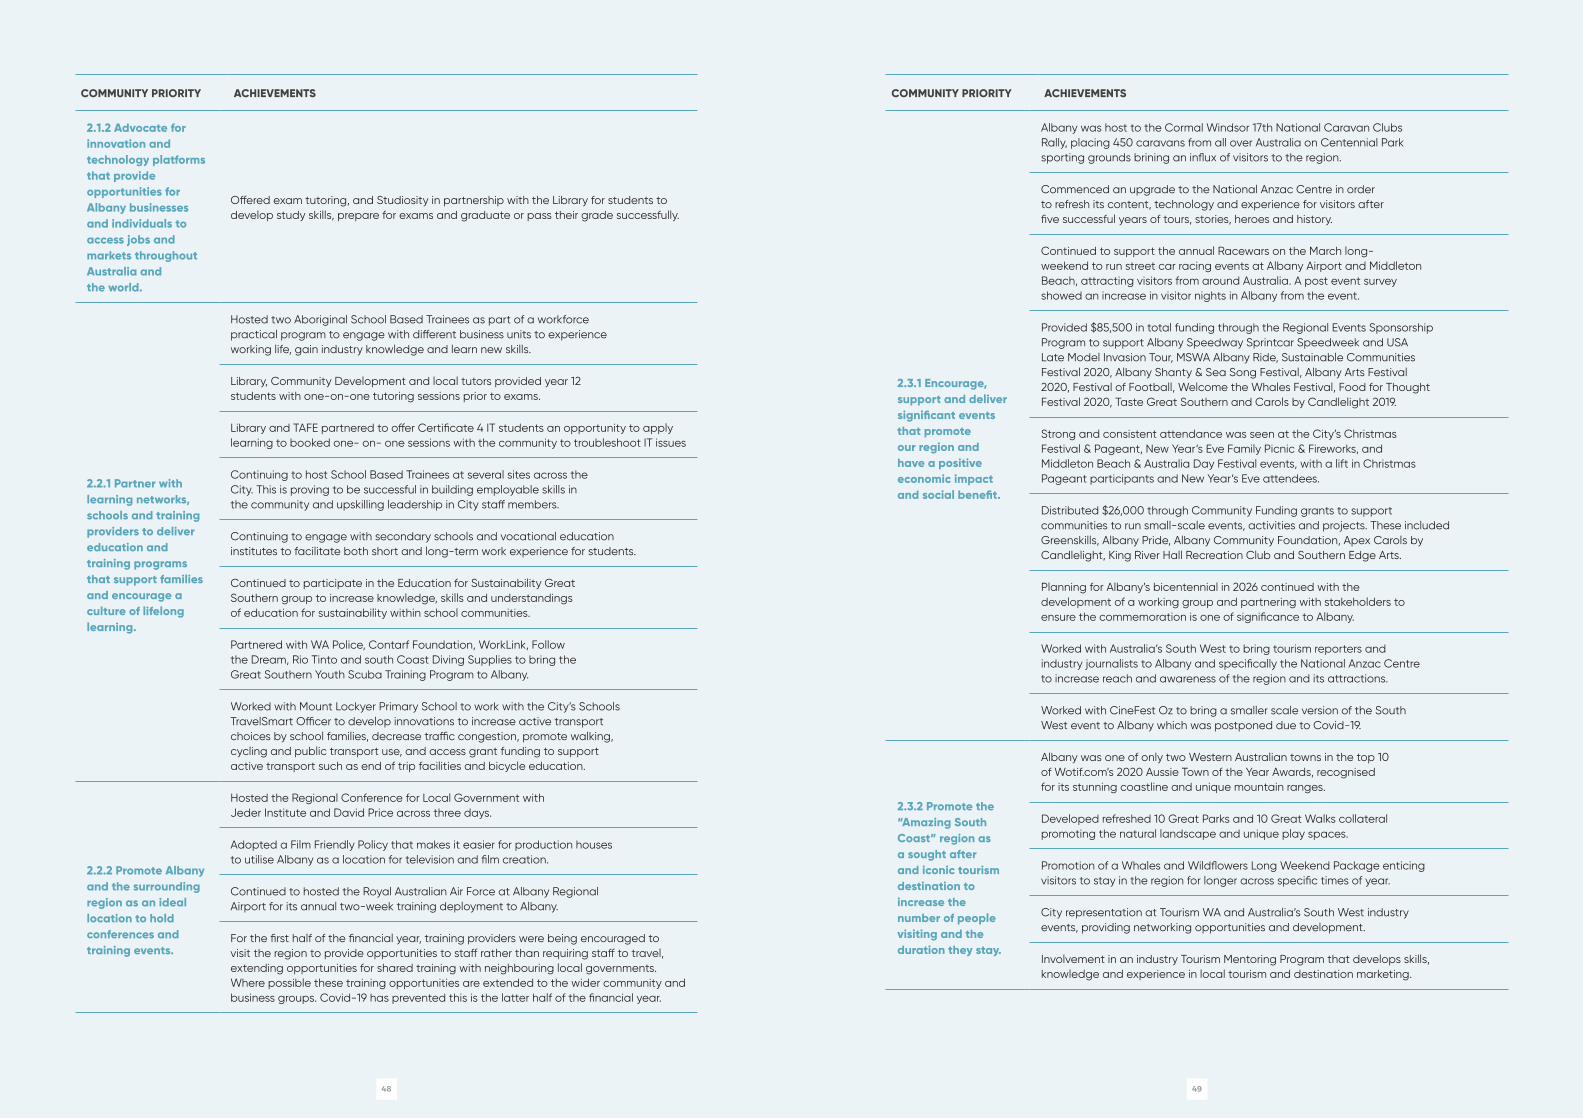
2.3.1 Encourage, support and deliver significant events that promote our region and have a positive economic impact and social benefit.
Albany was host to the Cormal Windsor 17th National Caravan Clubs Rally, placing 450 caravans from all over Australia on Centennial Park sporting grounds brining an influx of visitors to the region.
Commenced an upgrade to the National Anzac Centre in order to refresh its content, technology and experience for visitors after five successful years of tours, stories, heroes and history.
Continued to support the annual Racewars on the March long-weekend to run street car racing events at Albany Airport and Middleton Beach, attracting visitors from around Australia. A post event survey showed an increase in visitor nights in Albany from the event.
Provided $85,500 in total funding through the Regional Events Sponsorship Program to support Albany Speedway Sprintcar Speedweek and USA Late Model Invasion Tour, MSWA Albany Ride, Sustainable Communities Festival 2020, Albany Shanty & Sea Song Festival, Albany Arts Festival 2020, Festival of Football, Welcome the Whales Festival, Food for Thought Festival 2020, Taste Great Southern and Carols by Candlelight 2019.
Strong and consistent attendance was seen at the City’s Christmas Festival & Pageant, New Year’s Eve Family Picnic & Fireworks, and Middleton Beach & Australia Day Festival events, with a lift in Christmas Pageant participants and New Year’s Eve attendees.
Distributed $26,000 through Community Funding grants to support communities to run small-scale events, activities and projects. These included Greenskills, Albany Pride, Albany Community Foundation, Apex Carols by Candlelight, King River Hall Recreation Club and Southern Edge Arts.
Planning for Albany’s bicentennial in 2026 continued with the development of a working group and partnering with stakeholders to ensure the commemoration is one of significance to Albany.
Worked with Australia’s South West to bring tourism reporters and industry journalists to Albany and specifically the National Anzac Centre to increase reach and awareness of the region and its attractions.
Worked with CineFest Oz to bring a smaller scale version of the South West event to Albany which was postponed due to Covid-19.
2.3.2 Promote the “Amazing South Coast” region as a sought after and iconic tourism destination to increase the number of people visiting and the duration they stay.
Albany was one of only two Western Australian towns in the top 10 of Wotif.com’s 2020 Aussie Town of the Year Awards, recognised for its stunning coastline and unique mountain ranges.
Developed refreshed 10 Great Parks and 10 Great Walks collateral promoting the natural landscape and unique play spaces.
Promotion of a Whales and Wildflowers Long Weekend Package enticing visitors to stay in the region for longer across specific times of year.
City representation at Tourism WA and Australia’s South West industry events, providing networking opportunities and development.
Involvement in an industry Tourism Mentoring Program that develops skills, knowledge and experience in local tourism and destination marketing.
2.1.2 Advocate for innovation and technology platforms that provide opportunities for Albany businesses and individuals to access jobs and markets throughout Australia and the world.
Offered exam tutoring, and Studiosity in partnership with the Library for students to develop study skills, prepare for exams and graduate or pass their grade successfully.
2.2.1 Partner with learning networks, schools and training providers to deliver education and training programs that support families and encourage a culture of lifelong learning.
Hosted two Aboriginal School Based Trainees as part of a workforce practical program to engage with different business units to experience working life, gain industry knowledge and learn new skills.
Library, Community Development and local tutors provided year 12 students with one-on-one tutoring sessions prior to exams.
Library and TAFE partnered to offer Certificate 4 IT students an opportunity to apply learning to booked one- on- one sessions with the community to troubleshoot IT issues
Continuing to host School Based Trainees at several sites across the City. This is proving to be successful in building employable skills in the community and upskilling leadership in City staff members.
Continuing to engage with secondary schools and vocational education institutes to facilitate both short and long-term work experience for students.
Continued to participate in the Education for Sustainability Great Southern group to increase knowledge, skills and understandings of education for sustainability within school communities.
Partnered with WA Police, Contarf Foundation, WorkLink, Follow the Dream, Rio Tinto and south Coast Diving Supplies to bring the Great Southern Youth Scuba Training Program to Albany.
Worked with Mount Lockyer Primary School to work with the City’s Schools TravelSmart Officer to develop innovations to increase active transport choices by school families, decrease traffic congestion, promote walking, cycling and public transport use, and access grant funding to support active transport such as end of trip facilities and bicycle education.
2.2.2 Promote Albany and the surrounding region as an ideal location to hold conferences and training events.
Hosted the Regional Conference for Local Government with Jeder Institute and David Price across three days.
Adopted a Film Friendly Policy that makes it easier for production houses to utilise Albany as a location for television and film creation.
Continued to hosted the Royal Australian Air Force at Albany Regional Airport for its annual two-week training deployment to Albany.
For the first half of the financial year, training providers were being encouraged to visit the region to provide opportunities to staff rather than requiring staff to travel, extending opportunities for shared training with neighbouring local governments. Where possible these training opportunities are extended to the wider community and business groups. Covid-19 has prevented this is the latter half of the financial year.
COMMUNITY PRIORITY ACHIEVEMENTS COMMUNITY PRIORITY ACHIEVEMENTS
50 51
CLEAN, GREEN& SUSTAINABLE
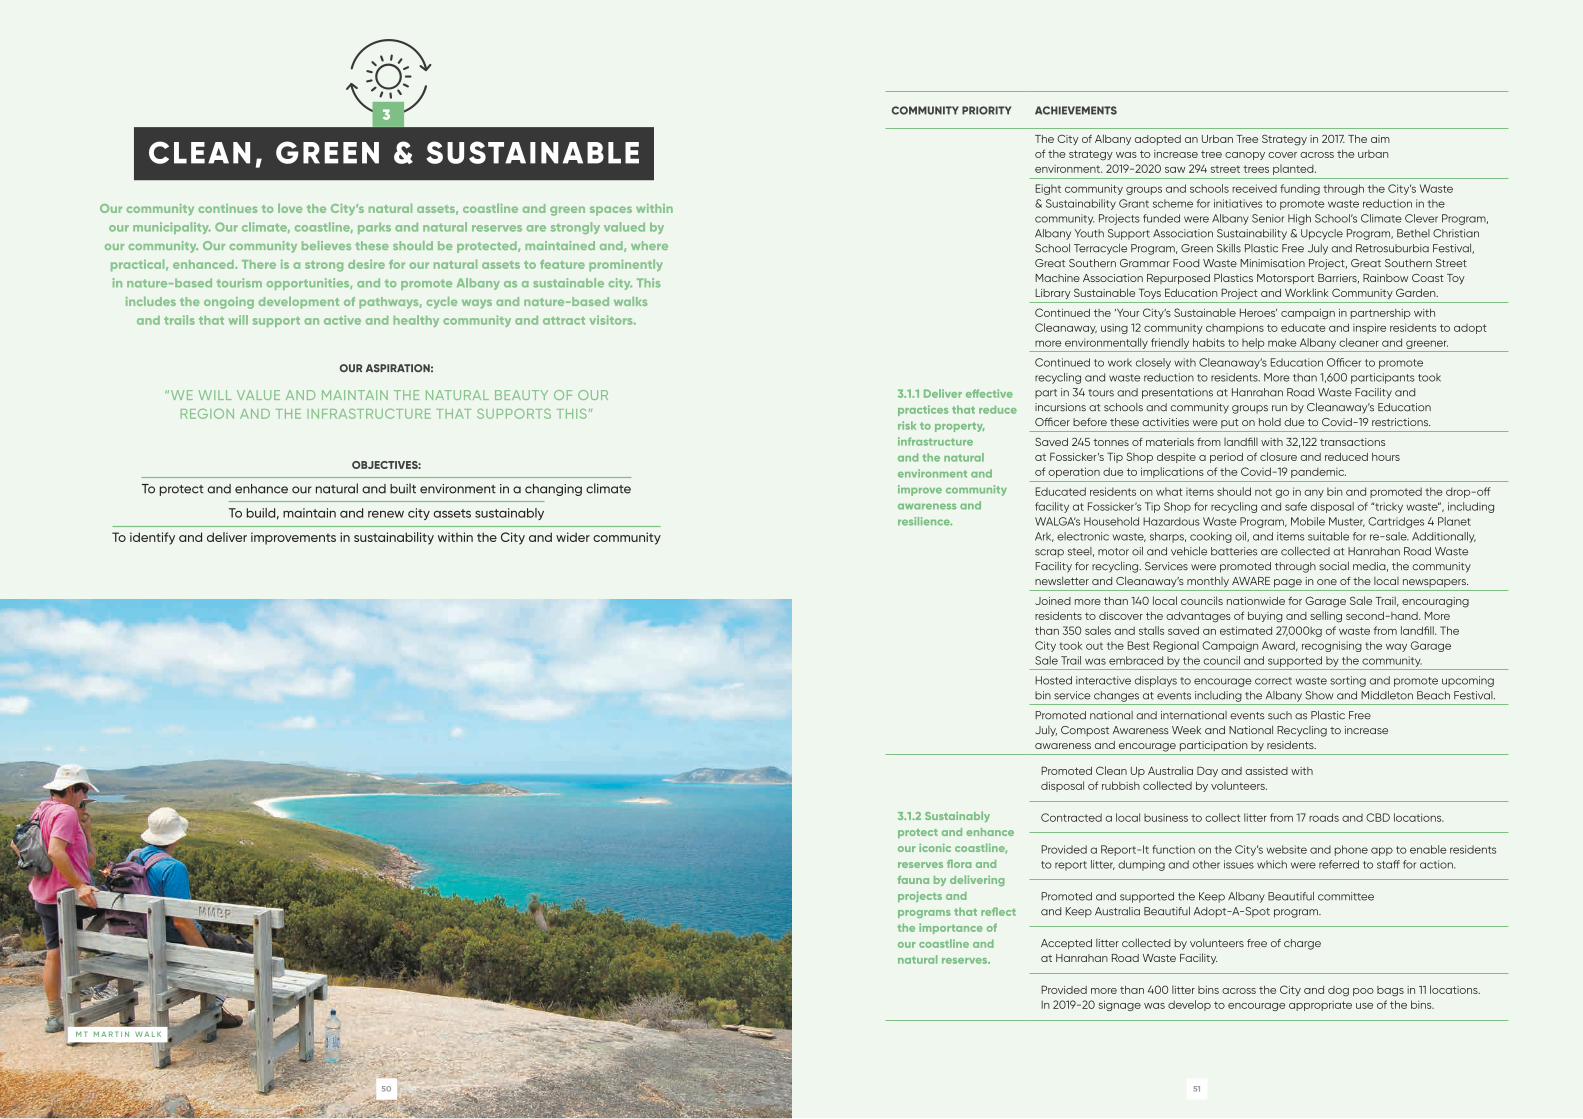
M T M A R T I N W A L K
COMMUNITY PRIORITY ACHIEVEMENTS
3.1.1 Deliver effective practices that reduce risk to property, infrastructure and the natural environment and improve community awareness and resilience.
The City of Albany adopted an Urban Tree Strategy in 2017. The aim of the strategy was to increase tree canopy cover across the urban environment. 2019-2020 saw 294 street trees planted.
Eight community groups and schools received funding through the City’s Waste & Sustainability Grant scheme for initiatives to promote waste reduction in the community. Projects funded were Albany Senior High School’s Climate Clever Program, Albany Youth Support Association Sustainability & Upcycle Program, Bethel Christian School Terracycle Program, Green Skills Plastic Free July and Retrosuburbia Festival, Great Southern Grammar Food Waste Minimisation Project, Great Southern Street Machine Association Repurposed Plastics Motorsport Barriers, Rainbow Coast Toy Library Sustainable Toys Education Project and Worklink Community Garden.
Continued the ‘Your City’s Sustainable Heroes’ campaign in partnership with Cleanaway, using 12 community champions to educate and inspire residents to adopt more environmentally friendly habits to help make Albany cleaner and greener.
Continued to work closely with Cleanaway’s Education Officer to promote recycling and waste reduction to residents. More than 1,600 participants took part in 34 tours and presentations at Hanrahan Road Waste Facility and incursions at schools and community groups run by Cleanaway’s Education Officer before these activities were put on hold due to Covid-19 restrictions.
Saved 245 tonnes of materials from landfill with 32,122 transactions at Fossicker’s Tip Shop despite a period of closure and reduced hours of operation due to implications of the Covid-19 pandemic.
Educated residents on what items should not go in any bin and promoted the drop-off facility at Fossicker’s Tip Shop for recycling and safe disposal of “tricky waste”, including WALGA’s Household Hazardous Waste Program, Mobile Muster, Cartridges 4 Planet Ark, electronic waste, sharps, cooking oil, and items suitable for re-sale. Additionally, scrap steel, motor oil and vehicle batteries are collected at Hanrahan Road Waste Facility for recycling. Services were promoted through social media, the community newsletter and Cleanaway’s monthly AWARE page in one of the local newspapers.
Joined more than 140 local councils nationwide for Garage Sale Trail, encouraging residents to discover the advantages of buying and selling second-hand. More than 350 sales and stalls saved an estimated 27,000kg of waste from landfill. The City took out the Best Regional Campaign Award, recognising the way Garage Sale Trail was embraced by the council and supported by the community.
Hosted interactive displays to encourage correct waste sorting and promote upcoming bin service changes at events including the Albany Show and Middleton Beach Festival.
Promoted national and international events such as Plastic Free July, Compost Awareness Week and National Recycling to increase awareness and encourage participation by residents.
3.1.2 Sustainably protect and enhance our iconic coastline, reserves flora and fauna by delivering projects and programs that reflect the importance of our coastline and natural reserves.
Promoted Clean Up Australia Day and assisted with disposal of rubbish collected by volunteers.
Contracted a local business to collect litter from 17 roads and CBD locations.
Provided a Report-It function on the City’s website and phone app to enable residents to report litter, dumping and other issues which were referred to staff for action.
Promoted and supported the Keep Albany Beautiful committee and Keep Australia Beautiful Adopt-A-Spot program.
Accepted litter collected by volunteers free of charge at Hanrahan Road Waste Facility.
Provided more than 400 litter bins across the City and dog poo bags in 11 locations. In 2019-20 signage was develop to encourage appropriate use of the bins.
CLEAN, GREEN & SUSTAINABLE
Our community continues to love the City’s natural assets, coastline and green spaces within our municipality. Our climate, coastline, parks and natural reserves are strongly valued by
our community. Our community believes these should be protected, maintained and, where practical, enhanced. There is a strong desire for our natural assets to feature prominently in nature-based tourism opportunities, and to promote Albany as a sustainable city. This
includes the ongoing development of pathways, cycle ways and nature-based walks and trails that will support an active and healthy community and attract visitors.
OBJECTIVES:
To protect and enhance our natural and built environment in a changing climate
To build, maintain and renew city assets sustainably
To identify and deliver improvements in sustainability within the City and wider community
OUR ASPIRATION:
“WE WILL VALUE AND MAINTAIN THE NATURAL BEAUTY OF OUR REGION AND THE INFRASTRUCTURE THAT SUPPORTS THIS”
3

52 53
Y O U T H A D V I S O R Y C O U N C I L W O R K S H O P
R I D E T O S C H O O L D AY
YA K A M I A C R E E K A U S T I N A N D S C O T T A L B A N Y W I N D F A R M
W O R L D W E T L A N D S D AY
COMMUNITY PRIORITY ACHIEVEMENTS
3.2.1 Deliver environmentally & financially sustainable long-term planning for infrastructure via a forward capital works program that meets the needs of our community.
Progressed a draft closure plan for the Albany Refuse Site at Hanrahan Road, to meet quality and standards for endorsement by the Department of Water and Environmental Regulations and provide direction for a staged closure that considers ongoing landfill gas, leachate and stormwater management requirements.
Completed upgrades to Torbay Inlet and Cosy Corner campgrounds including road maintenance, traffic calming, installation of new signage, redefinition of campsite boundaries and revegetation.
Commenced a review of Albany’s Heritage Survey and Heritage List that included places of significance such as trees, gardens, bridges, jetties, mine sites, wells, dams, public and private buildings.
Provided Great Southern Street Machine with a Community Waste and Sustainability Grant to enable them to use recycled plastic bales and race arresters.
Removed the damaged and worn Ellen Cove Swimming Enclosure and commenced the replacement process with City of Albany and State Government funding.
Continued to develop the Emu Point Foreshore Management Plan as part of the Emu Point to Middleton Beach Coastal Adaptation and Protection Strategy with the aim to guide the future development and management of the foreshore reserve.
Sought public comment on the Mounts Master Plan for Mt Adelaide and Mount Clarence to provide a long term vision and action plan for the Mounts which respects and enhances its significant natural, cultural and recreational assets.
3.2.2 Design, construct and maintain infrastructure cost effectively in a manner that maximises its life, capacity and function.
Relined and repolished the newest Albany Leisure and Aquatic Centre indoor court stadium surface and completed a major upgrade of the switchboard to the pump room servicing the lap pool area.
Following years of negotiation with The Heritage Council of WA, the City completed major works to replace the roof shingles with an alternative flat clay tile at the Vancouver Arts Centre.
Completed major works on Collingwood Road.
Reconstructed and widened Lower Denmark Road slk 0.8-1.45.
Reconstructed Townsend Street and installed a pathway along the length of Townsend and section of Clifton for connectivity.
Completed the Sanford Road holding treatment in anticipation of major reconstruction works in 2020/2021.
Completed major reconstruction works on McKail Street and Russell Court.
Completed Cockburn Road pathway extension from Bluff to Campbell.
Completed pathway school connection on Sydney Street / Kampong Road.
Major works completed at the Wellington Street basin.
Utilised recycled plastic products for community infrastructure, including the Centennial Stadium Amphitheatre and barrier bollards and Middleton Beach and Emu Point memorial seats.
Adopted a trial of the Community Facilities Assistance Fund (CFAF) that will provide up to $30,000 per financial year for three years to eligible community rural halls.

54 55
COMMUNITY PRIORITY ACHIEVEMENTS COMMUNITY PRIORITY ACHIEVEMENTS
Cont.
3.2.2 Design, construct and maintain infrastructure cost effectively in a manner that maximises its life, capacity and function.
Accepted and approved the design and construction of a new Grounds Maintenance Shed required for the ongoing storage of specialised maintenance equipment for Centennial Park Sporting Precinct.
Endorsed and supported via in-kind project management support; the design development for the Southern Trails Terminus within Alison Hartman Gardens from Department of Biodiversity, Conservation and Attractions.
Commenced the repurposing of the Albany Town Hall that includes important conservation works, structural repairs and much-needed upgrades to the roof, lighting, services, storage, timber floors, window treatments and main entry.
Opened Alison Hartman Gardens which was transformed into a regional and local community activity hub celebrating Albany’s heritage and culture.
Completed Black Spot funded road improvements at the St Emile Way roundabout
Successful in grant funding to undertake renewal works on the Emu Point Finger Jetty, construct a further boat ramp at Lower King and install a new floating pontoon at Lower King to replace the existing timber finger jetty.
Completed several footpath renewal and upgrade projects. These included replacing Sydney Street connection at Bethyl School, Cockburn Road from Bluff Street to Campbell Road and Albany Hwy median crossings.
Retained the City’s status as a Water Wise Council from the Water Corporation by completing a comprehensive Waterwise Council Annual Report and have zero breaches with the Department of Water and Environmental Regulation and Water Corporation.
Replaced the worn hockey field that was suffering from significant wear and tear and an inability for the ground to recover quickly from wet weather conditions, placing added risk on players
Enhanced the safety of the roundabout that intercepts North and Campbell Roads in Spencer Park.
3.3.1 Integrate and promote effective sustainability through resource conservation, management and education to continuously improve environmental outcomes.
The City of Albany joined the free Cities Power Partnership Program, the largest local government climate program aiming to accelerate emissions reduction and cleaner energy.
Two integrated renewable energy feasibility studies for 56 buildings were completed with the aim to transition corporate energy to renewable energy. The business case study and corporate energy plan are currently being developed to support energy efficiency and renewable energy adoption
The City of Albany has been successful in maintain waterwise council and waterwise aquatic centre status in partnership with the Water Corporation to reduce water usage across City of Albany facilities.
The 20 million trees revegetation project at Lake Seppings funded by the Department of the environment and Energy, has now been completed. Approximately 70,000 trees and shrubs have been planted to re-create and enhance urban biodiversity corridors which will provide important habitats for endangered Western Ringtail Possums, migratory birds and endemic long-neck turtles.
The City of Albany partnered with the ClimateClever program. As a partner, City of Albany residents are eligible to receive their ClimateClever home subscription for free. The ClimateClever program assist residents to calculate and reduce their carbon footprint, save money on their utility bills, and join a community taking action on climate change.
3.3.1 Integrate and promote effective sustainability through resource conservation, management and education to continuously improve environmental outcomes.
During the Covid-19 lockdown, the City coordinated a Sustainable Sunday Blog for community to learn innovative ways that they can contribute to positively helping the environment
Supported Green Skills Workshops with homemade face scrubs and beauty products (using products one can find in the pantry)
Hosted an upcycling workshop that encouraged community to relook at the textiles and materials they throw away that could be reused or donated.
Approximately 2,000 people attended the third annual Green Fair on the Square event in November 2019 to celebrate and promote waste reduction and sustainability, including the opportunity for promotion of local businesses and community groups.
Albany Regional Daycare kindy-aged children participate in an ‘Adopt a Spot’ program through Keep Australia Beautiful, collecting rubbish from the surrounding roads of the Daycare centre.
The City updated and distributed the Albany Your Move map, to help residents and visitors plan an active transport journey in their community.
3.3.2 Deliver a sustainable and progressive approach to waste management including collaboration with neighbouring local governments.
The Library has installed a bespoke recycling station which has the capacity to recycle a number of items and promote educational information in sustainable waste management..
Successfully applied for Better Bins funding from the State Waste Authority to implement changes to the City’s bin service to divert food waste from landfill to be composted instead and provide bin lids consistent with Australian Standard colours. The program will be implemented in 2020-21.
Provided 15,370 urban households with a three bin service separating garden organics, commingled recyclables and landfill waste.
Provided urban residents with a bulk green waste collection during May and June 2020 with 415 tonnes of garden prunings collected for composting.
Collected 783 tonnes of scrap steel, 33.5 tonnes of non-ferrous metals and 20.9 tonnes of car batteries for recycling.
Provided a Household Hazardous Waste collection facility for the collection of tricky waste from Albany, Denmark and Plantagenet residents. The HHW Program is facilitated by WALGA with funding from the Waste Authority.
Representation on WA Municipal Waste Advisory Council – Officers Advisory Group, and participation in Consistent Communications Collective and Waste Educators Network Group.
Provided 1583 rural households with complementary vouchers to dispose of waste at one of Albany’s five rural transfer stations or two waste facilities.

56 57
A C E C A M E R A C L U B
M A D H A T T E R T E A P A R T YE M E R G E N C Y S E R V I C E S
A P E X P A R K C I T I Z E N S H I P C E R E M O N Y
COMMUNITY HEALTH& PARTICIPATION
There is a strong desire to ensure a sense of belonging and a positive connection between our rural and urban communities. It is important that we know and respect
our neighbours, live in communities which support us, and have safe, accessible places to gather and meet. People want to feel welcome, valued and connected.
OBJECTIVES:
To build resilient and cohesive communities with a strong sense of community spirit
To create interesting places, spaces and events that reflect our community’s identity, diversity and heritage
To develop and support a healthy, inclusive and accessible community
OUR ASPIRATION:
“WE WILL LIVE IN COMMUNITIES WHERE PEOPLE FEEL THEY BELONG AND ARE SUPPORTED IN A MANNER THAT REFLECTS OUR RICH AND DIVERSE HERITAGE”
4

58 59
P R I N C E S S R O YA L S A I L I N G C L U B
S O R O P T I M I S T S C H R I S T M A S P A G E A N T
W A A C C I R A L LY
4.1.1 Facilitate and promote arts and cultural activities for all ages by providing a variety of arts and cultural activities that attract local and visiting patrons.
Screened the film ‘Parasite’ for Harmony Week.
Screened the film ‘Spear’ for NAIDOC Week.
Held Tie Dying workshops at Middleton Beach Festival.
Held a meet the artist talk during NAIDOC week.
In conjunction with the Great Southern Development Commission, local government authorities, creative organisations and the Department of Local Government, Sport and Cultural Industries secured funding to develop a Great Southern regional arts, culture and heritage strategy.
Developed a self-guided Public Art Trail map for the Albany CBD.
Demand for the library’s meeting rooms rose in popularity, with an average of 60 bookings a month, balanced between library programs, community events, corporate meetings and City of Albany consultations.
4.1.2 Promote and develop an authentic sense of community by developing programs and providing services that make people feel welcome, involved and connected to each other.
Supported Albany Pride Week through screening the film ‘Love Simon’.
Call & Check Program conducted for vulnerable community members during height of Covid-19 restrictions.
Daily ‘Cuppa & Chat’ zoom call for isolated residents during Covid-19 restrictions.
Hosted a Spencer Park Inclusive Community Celebration.
Continued to grow the Meet Up Albany initiative with both hosts and participants.
Hosted a NAIDOC week disco in partnership with PCYC.
Continue to support the Albany PCYC Safe Spaces Strike II Youth Drop in program.
The Albany Art Group took on an annual hire arrangement in the main visual arts workshop space at Vancouver Arts Centre to support their continued growth.
Developed a bespoke website during the Covid-19 pandemic that allowed all community members to contribute to supporting each other’s mental health throughout the period.
Vancouver Arts Centre Program Highlights included Mama Stitch, a Whiskey & Boots audio and musical performances of interviews of local people talking about their mothers. The Swing Club, swing dance workshops, practice sessions and live music events. Chorus, creative development / dance workshops for women by Annette Carmichael Projects.
As a proactive supporter and collaborator in community events and activities, the library was involved in NAIDOC week, Youth Week events, Mad Hatters Tea Party for mental health awareness, Anti –Poverty Week and Pride Week activities.
Here is a snapshot of some of the City’s achievements that have helped meet the community’s priorities for Community Health & Participation across 2018-2019.
COMMUNITY PRIORITY ACHIEVEMENTS
Y O U R L I F E C A F E

60 61
4.2.1 Deliver activities and programs that engage with the wider community and engender community spirit.
Neighbour cards developed to encourage neighbours to support each other during Covid-19 restrictions
Compassionate Communities Connector program implemented to support the ongoing delivery of Compassionate Communities
Hosted Voice Treaty Truth, an Albany History Collection featuring Tyndale Photos.
Exhibition/installation/ performance work with community, coordinated by Nari Lees called Waterways.
Ash Wallrodt displayed a ceramics exhibition called Walk a Mile in Their Shoes.
Ace Camera Club showcased their photography and handmade camera exhibition titled I am a Camera.
Unravelling was a popular painting exhibition by Jen Mitchell.
Amongst Lilies was a sculpture and installation exhibition by Lois Schenk.
Kinjarling Studies Tahlia Palmer (Video and Photography) too place at the Vancouver Arts Centre.
Supported the Art and Craft Trail exhibition with Albany Art Group, Little Grove Art Group and Botanical Art Group.
Hosted Permission to Die, a community arts workshops and exhibition as part of the Compassionate Communities Project.
The library’s junior programs encourage and support early literacy engagement and STEM outcomes through Rhymetime and Storytime sessions, LEGO Club, Children’s Book Week and Science Week activities adapted and delivered online.
4.2.2 Maintain infrastructure and deliver programs that promote Albany’s unique heritage, engender civic pride and leave a lasting memory.
Community Facilities Assistance Fund Pilot supported those in on City managed land to maintain their buildings.
Restoring Menang Noongar Place Names project commenced to increase the number of geographic locations that include the Noongar place name.
Transition planning for the future operations and management structure of the Vancouver Arts Centre and the Town Hall got underway in earnest.
Heating and Air Con installed throughout the main building, annex and pottery studio at Vancouver Arts Centre and the roof was replaced in the main building
Commenced plans to build room for the Albany History Collection to return to its home at the Albany Public Library.
Advocated and supported the replacement of the Ellen Cove Swimming Enclosure with success through the State Government.
Endorsed and supported via in-kind project management support; the design development for the Southern Trails Terminus within Alison Hartman Gardens from Department of Biodiversity, Conservation and Attractions.
4.3.1 Develop a range of activities and facilities that connect people, promote a healthy community and are appropriate for all ages.
Successfully ran school holiday programs that incorporated 3x3 Basketball and skate coaching clinics.
Engaged with sporting clubs to complete delivery of a comprehensive campaign to support the implementation of the Smoke-Free Outdoors policy across the Centennial Sporting Precinct.
Worked in partnership with Albany Leisure and Aquatic Centre users and café lessee to develop a Healthy Eating at Albany Leisure and Aquatic Centre campaign.
Albany Public Library ran cyber safety programs for new users to digital technology and vulnerable users to enhance their skills.
Aged Care Charter was developed and launched that optimises opportunities available for seniors to achieve quality of life through health, participation and security as they age.
Through funding received from the Brandenburg Trust, the library was able to introduce a Technology Lending Service for seniors, establish a branch library at the Beryl Grant Community Centre and develop an outreach Book Chat program at Hawthorn House.
The library was also successful in securing Be Connected funding through the Good Things Foundation to loan devices and train Digital Mentors in delivering support to seniors in the digital space.
Brandenburg Trust Resident Artist Program delivered two artist residencies in aged care facilities and with dementia patients.
Offered an Assisted Bin Service to residents unable to move their bins to the kerbside.
Executed a physical activity program called Long Live You that encourages the population of individuals living in the Great Southern that are over 60 years of age to stay active.
Partnered with Rio Tinto to deliver a range of youth-focussed events across the year.
Continued to grow the online platform My Community Directory that connects community groups, individuals and agencies and reaching a record number of users in February 2020, with Health Services the most prominent group through the Covid-19 pandemic.
4.3.2 Encourage and support volunteers and community groups to grow an active volunteer base that is supported and valued.
Hosted Share & Learn Workshops for community specific to attracting and retain members and hosting meetings in a time of Covid-19.
Continue to financially support Albany & Regional Volunteer Service
Coordinated the Albany Citizen of the Year Australia Day Awards at Centennial Stadium on Australia Day.
Provided ongoing support to Albany Regional Volunteer Services through a Service Agreement.
Continued supporting Albany PCYC’s successful Strike 11 program for at-risk youth in the community through a Service Agreement.
COMMUNITY PRIORITY ACHIEVEMENTS COMMUNITY PRIORITY ACHIEVEMENTS

62 63
R I D E T O W O R K D AY
W A L K I N G S C H O O L B U S
T R A I L D E V E L O P M E N T
CONNECTED & SAFE BUILTENVIRONMENT
Our community is looking to be connected by a built environment that meets their needs now and into the future. We want to live in precincts which are alive, thriving, built around the
amenities we use at all stages of our life, and which encourage and support healthy lifestyles.
OBJECTIVES:
To develop vibrant neighbourhoods which retain local character and heritage
To advocate, plan for and build friendly and connected communities
To promote and support community health and safety
OUR ASPIRATION:
“WE WILL DEVELOP INTEGRATED PRECINCTS AND NEIGHBOURHOODS THAT ALLOW FOR POPULATION GROWTH AND ENHANCE THE LIFESTYLE OF OUR RESIDENTS”
5
5.1.1 Develop and implement a contemporary Local Planning Strategy that reflects our identity and supports economic growth.
A new Local Planning Strategy promoting urban consolidation will guide development and growth within Albany over the next decade after it received a tick of approval from the WA Planning Commission.
5.1.2 Provide proactive planning and building services that support sustainable growth while reflecting our local character and heritage.
Commenced construction on a multi-use Youth Challenge Park behind PCYC and next to the current Albany Skate Park supported by Lotterywest.
Commenced the repurposing of the Albany Town Hall that includes important conservation works, structural repairs and much-needed upgrades to the roof, lighting, services, storage, timber floors, window treatments and main entry.
Moved building and planning approvals to be 100% online during the Covid-19 pandemic. This streamlined the process for applicants and assisted efficiency for the planning team.
COMMUNITY PRIORITY ACHIEVEMENTS
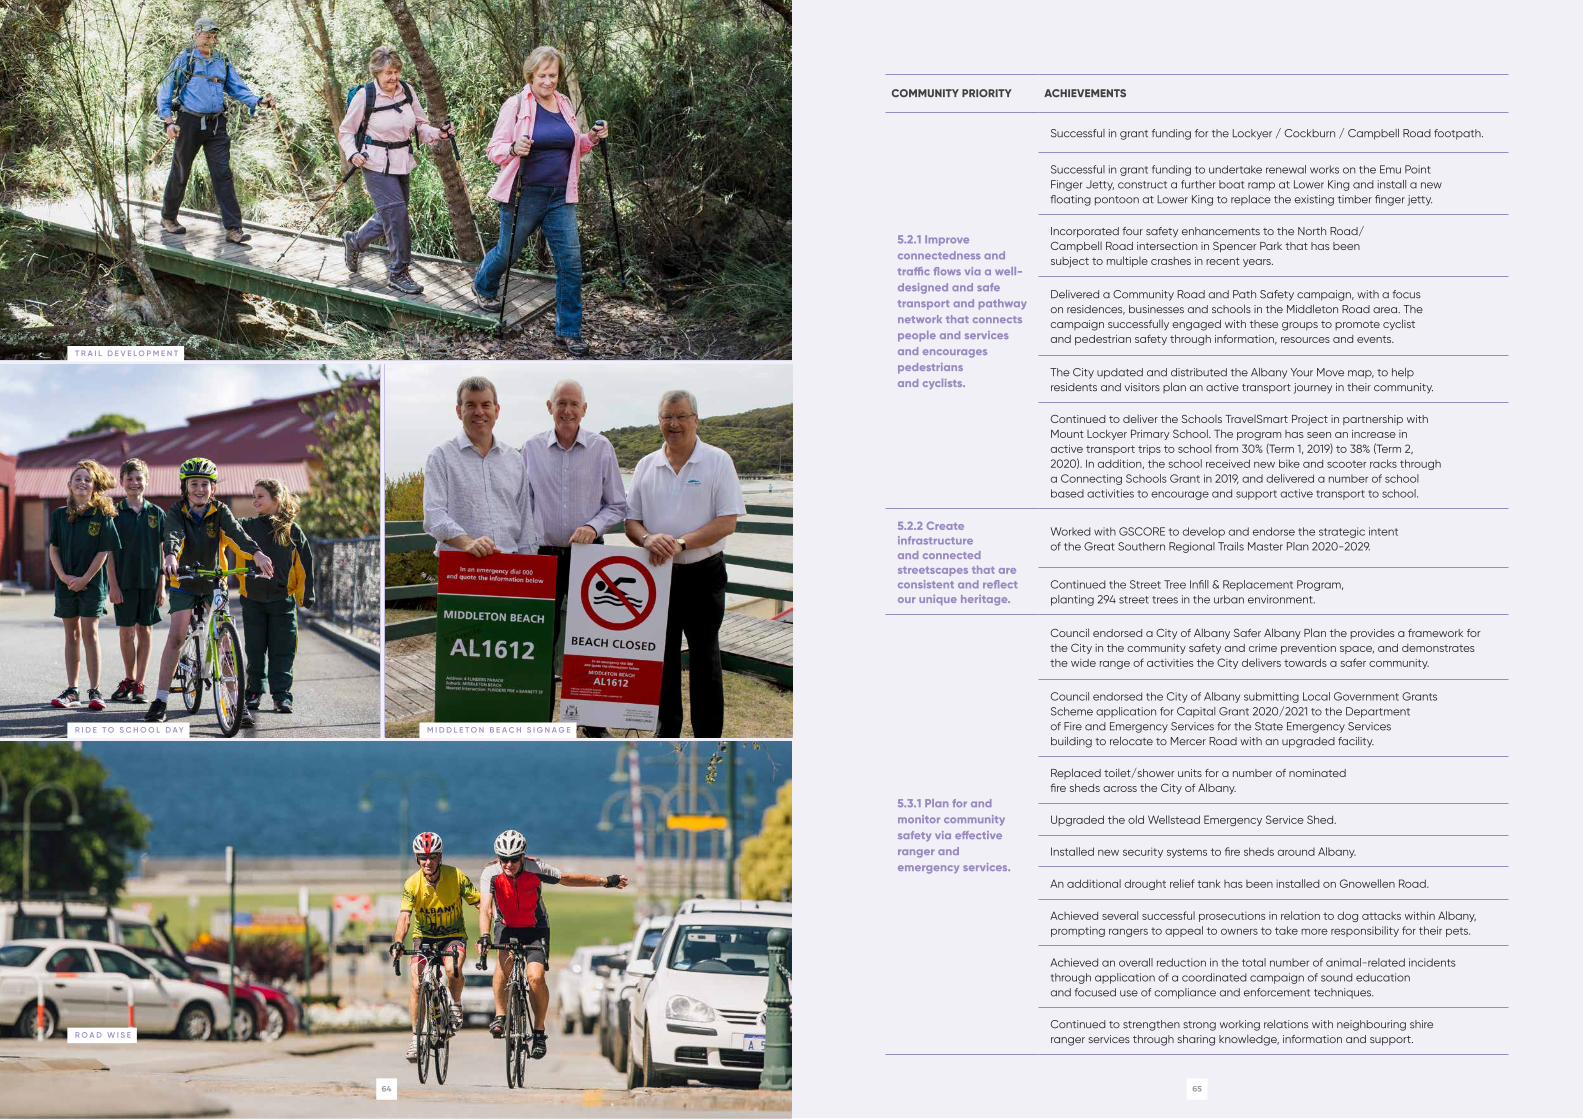
T R A I L D E V E L O P M E N T
R O A D W I S E
R I D E T O S C H O O L D AY M I D D L E T O N B E A C H S I G N A G E
64 65
5.2.1 Improve connectedness and traffic flows via a well-designed and safe transport and pathway network that connects people and services and encourages pedestrians and cyclists.
Successful in grant funding for the Lockyer / Cockburn / Campbell Road footpath.
Successful in grant funding to undertake renewal works on the Emu Point Finger Jetty, construct a further boat ramp at Lower King and install a new floating pontoon at Lower King to replace the existing timber finger jetty.
Incorporated four safety enhancements to the North Road/Campbell Road intersection in Spencer Park that has been subject to multiple crashes in recent years.
Delivered a Community Road and Path Safety campaign, with a focus on residences, businesses and schools in the Middleton Road area. The campaign successfully engaged with these groups to promote cyclist and pedestrian safety through information, resources and events.
The City updated and distributed the Albany Your Move map, to help residents and visitors plan an active transport journey in their community.
Continued to deliver the Schools TravelSmart Project in partnership with Mount Lockyer Primary School. The program has seen an increase in active transport trips to school from 30% (Term 1, 2019) to 38% (Term 2, 2020). In addition, the school received new bike and scooter racks through a Connecting Schools Grant in 2019, and delivered a number of school based activities to encourage and support active transport to school.
5.2.2 Create infrastructure and connected streetscapes that are consistent and reflect our unique heritage.
Worked with GSCORE to develop and endorse the strategic intent of the Great Southern Regional Trails Master Plan 2020-2029.
Continued the Street Tree Infill & Replacement Program, planting 294 street trees in the urban environment.
5.3.1 Plan for and monitor community safety via effective ranger and emergency services.
Council endorsed a City of Albany Safer Albany Plan the provides a framework for the City in the community safety and crime prevention space, and demonstrates the wide range of activities the City delivers towards a safer community.
Council endorsed the City of Albany submitting Local Government Grants Scheme application for Capital Grant 2020/2021 to the Department of Fire and Emergency Services for the State Emergency Services building to relocate to Mercer Road with an upgraded facility.
Replaced toilet/shower units for a number of nominated fire sheds across the City of Albany.
Upgraded the old Wellstead Emergency Service Shed.
Installed new security systems to fire sheds around Albany.
An additional drought relief tank has been installed on Gnowellen Road.
Achieved several successful prosecutions in relation to dog attacks within Albany, prompting rangers to appeal to owners to take more responsibility for their pets.
Achieved an overall reduction in the total number of animal-related incidents through application of a coordinated campaign of sound education and focused use of compliance and enforcement techniques.
Continued to strengthen strong working relations with neighbouring shire ranger services through sharing knowledge, information and support.
COMMUNITY PRIORITY ACHIEVEMENTS

S O U T H C O A S T F I R E B R I G A D E T R U C K
66 67
5.3.2 Deliver programs and advocate for specialist services that improve public health and wellbeing in-line with the Public Health Act 2016 and growing community expectations.
Council endorsed a City of Albany Safer Albany Plan the provides a framework for the City in the community safety and crime prevention space, and demonstrates the wide range of activities the City delivers towards a safer community.
Partnered with WA Primary Health Alliance to start to develop a Compassionate Communities Charter with local agencies, community groups and individuals.
The Compassionate Communities Project secured funding to deliver the Dying to Know Program in partnership with WA Primary Health Alliance, Albany Community Hospice, Alzheimer’s WA, Harvest Film Festival, The Brandenburg Foundation, and Soroptimist International Albany.
Council adopted the updated Community Development Strategy 2019-2022 with Strategic Focus Areas including; Safe Communities, Inclusive Communities, Connected Communities and Sustainable Communities.
City advocacy and support to the Great Southern Alcohol and Family Domestic Violence Group, Great Southern Homelessness Forum, and Great Southern Youth Suicide Prevention Group.
Continued to implement nutritional meal menu at Daycare and provide recipes and education to families to promote good health.
Council endorsed the participation of the City of Albany in the National Redress Scheme as a State Government institution as part of the State Government’s declaration.
COMMUNITY PRIORITY ACHIEVEMENTS

69
THIS IS YOUR 2019/2020 FINANCIAL REPORT.
2019/2020 Annual Financial Report
Certified as a True & Correct Copy CITY OF ALBANY ANNUAL FINANCIAL REPORT 2020
TABLE OF CONTENTS
Statement by Chief Executive Officer 3
Statement of Comprehensive Income by Nature or Type 4
Statement of Comprehensive Income by Program 5
Statement of Financial Position 6
Statement of Changes in Equity 7
Statement of Cash Flows 8
Rate Setting Statement 9
Notes to and forming part of the Financial Report 10
Independent Auditor's Report 56
Principal place of business:City of Albany102 North RoadYAKAMIA WA 6330
CITY OF ALBANY
FINANCIAL REPORT
FOR THE YEAR ENDED 30TH JUNE 2020
Page 2
Certified as a True & Correct Copy
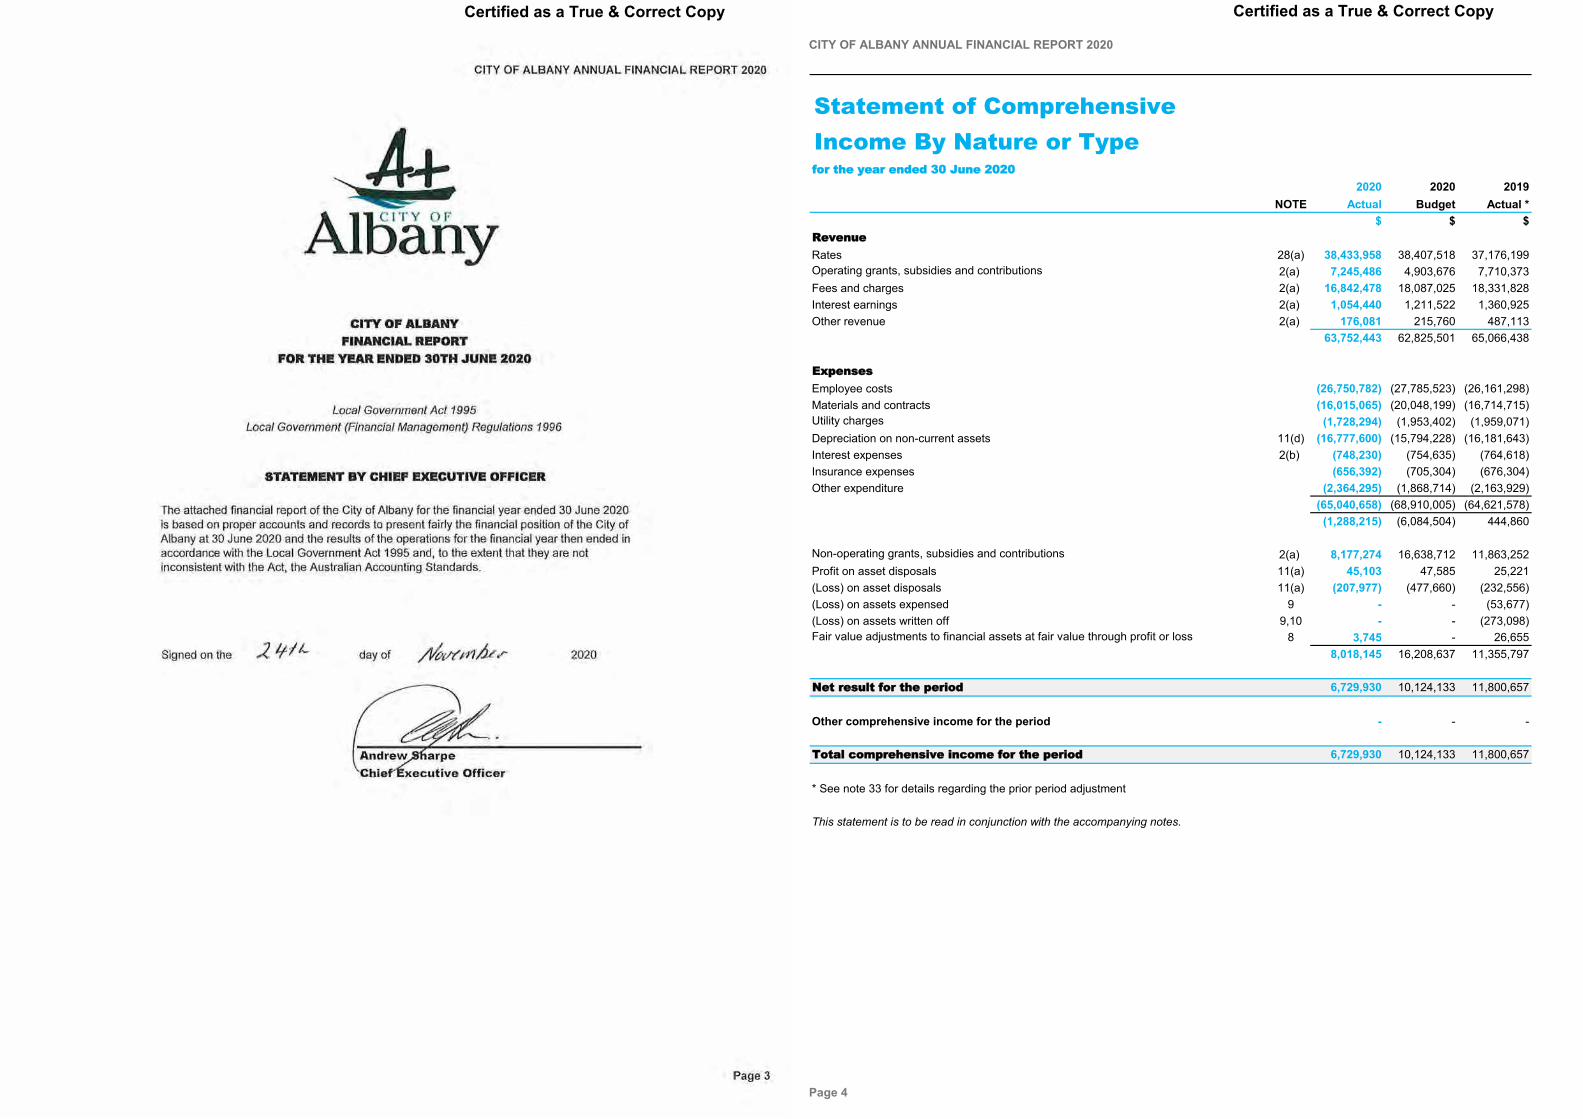
Certified as a True & Correct Copy
CITY OF ALBANY ANNUAL FINANCIAL REPORT 2020
Statement of Comprehensive Income By Nature or Typeffoorr tthhee yyeeaarr eennddeedd 3300 JJuunnee 22002200
2020 2020 2019NOTE Actual Budget Actual *
$ $ $RReevveennuueeRates 28(a) 38,433,958 38,407,518 37,176,199Operating grants, subsidies and contributions 2(a) 7,245,486 4,903,676 7,710,373Fees and charges 2(a) 16,842,478 18,087,025 18,331,828Interest earnings 2(a) 1,054,440 1,211,522 1,360,925Other revenue 2(a) 176,081 215,760 487,113
63,752,443 62,825,501 65,066,438
EExxppeennsseessEmployee costs (26,750,782) (27,785,523) (26,161,298)Materials and contracts (16,015,065) (20,048,199) (16,714,715)Utility charges (1,728,294) (1,953,402) (1,959,071)Depreciation on non-current assets 11(d) (16,777,600) (15,794,228) (16,181,643)Interest expenses 2(b) (748,230) (754,635) (764,618)Insurance expenses (656,392) (705,304) (676,304)Other expenditure (2,364,295) (1,868,714) (2,163,929)
(65,040,658) (68,910,005) (64,621,578)(1,288,215) (6,084,504) 444,860
Non-operating grants, subsidies and contributions 2(a) 8,177,274 16,638,712 11,863,252Profit on asset disposals 11(a) 45,103 47,585 25,221(Loss) on asset disposals 11(a) (207,977) (477,660) (232,556)(Loss) on assets expensed 9 - - (53,677)(Loss) on assets written off 9,10 - - (273,098)Fair value adjustments to financial assets at fair value through profit or loss 8 3,745 - 26,655
8,018,145 16,208,637 11,355,797
NNeett rreessuulltt ffoorr tthhee ppeerriioodd 6,729,930 10,124,133 11,800,657
Other comprehensive income for the period - - -
TToottaall ccoommpprreehheennssiivvee iinnccoommee ffoorr tthhee ppeerriioodd 6,729,930 10,124,133 11,800,657
* See note 33 for details regarding the prior period adjustment
This statement is to be read in conjunction with the accompanying notes.
Page 4
Certified as a True & Correct Copy
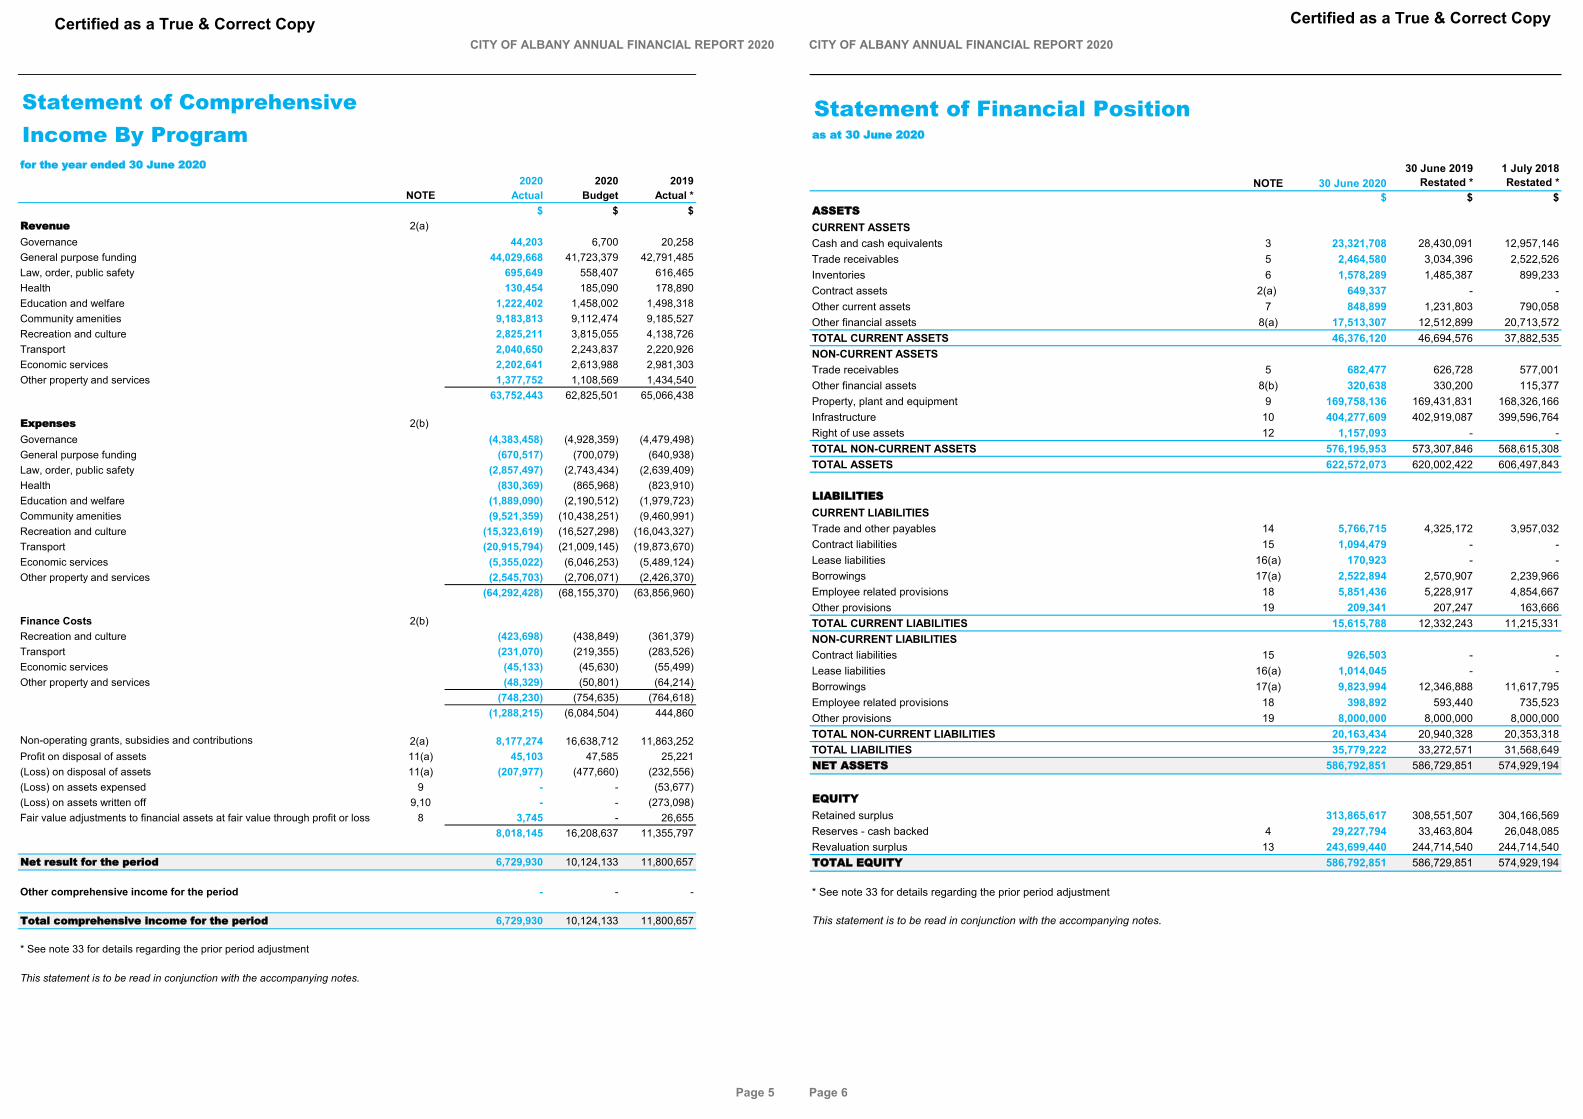
CITY OF ALBANY ANNUAL FINANCIAL REPORT 2020
Statement of Comprehensive Income By Programffoorr tthhee yyeeaarr eennddeedd 3300 JJuunnee 22002200
2020 2020 2019NOTE Actual Budget Actual *
$ $ $RReevveennuuee 2(a) Governance 44,203 6,700 20,258General purpose funding 44,029,668 41,723,379 42,791,485Law, order, public safety 695,649 558,407 616,465Health 130,454 185,090 178,890Education and welfare 1,222,402 1,458,002 1,498,318Community amenities 9,183,813 9,112,474 9,185,527Recreation and culture 2,825,211 3,815,055 4,138,726Transport 2,040,650 2,243,837 2,220,926Economic services 2,202,641 2,613,988 2,981,303Other property and services 1,377,752 1,108,569 1,434,540
63,752,443 62,825,501 65,066,438
EExxppeennsseess 2(b) Governance (4,383,458) (4,928,359) (4,479,498)General purpose funding (670,517) (700,079) (640,938)Law, order, public safety (2,857,497) (2,743,434) (2,639,409)Health (830,369) (865,968) (823,910)Education and welfare (1,889,090) (2,190,512) (1,979,723)Community amenities (9,521,359) (10,438,251) (9,460,991)Recreation and culture (15,323,619) (16,527,298) (16,043,327)Transport (20,915,794) (21,009,145) (19,873,670)Economic services (5,355,022) (6,046,253) (5,489,124)Other property and services (2,545,703) (2,706,071) (2,426,370)
(64,292,428) (68,155,370) (63,856,960)
Finance Costs 2(b) Recreation and culture (423,698) (438,849) (361,379)Transport (231,070) (219,355) (283,526)Economic services (45,133) (45,630) (55,499)Other property and services (48,329) (50,801) (64,214)
(748,230) (754,635) (764,618)(1,288,215) (6,084,504) 444,860
Non-operating grants, subsidies and contributions 2(a) 8,177,274 16,638,712 11,863,252Profit on disposal of assets 11(a) 45,103 47,585 25,221(Loss) on disposal of assets 11(a) (207,977) (477,660) (232,556)(Loss) on assets expensed 9 - - (53,677)(Loss) on assets written off 9,10 - - (273,098)Fair value adjustments to financial assets at fair value through profit or loss 8 3,745 - 26,655
8,018,145 16,208,637 11,355,797
NNeett rreessuulltt ffoorr tthhee ppeerriioodd 6,729,930 10,124,133 11,800,657
Other comprehensive income for the period - - -
TToottaall ccoommpprreehheennssiivvee iinnccoommee ffoorr tthhee ppeerriioodd 6,729,930 10,124,133 11,800,657
* See note 33 for details regarding the prior period adjustment
This statement is to be read in conjunction with the accompanying notes.
Page 5
Certified as a True & Correct CopyCITY OF ALBANY ANNUAL FINANCIAL REPORT 2020
Statement of Financial Positionaass aatt 3300 JJuunnee 22002200
NOTE 30 June 202030 June 2019
Restated *1 July 2018Restated *
$ $ $AASSSSEETTSSCURRENT ASSETSCash and cash equivalents 3 23,321,708 28,430,091 12,957,146Trade receivables 5 2,464,580 3,034,396 2,522,526Inventories 6 1,578,289 1,485,387 899,233Contract assets 2(a) 649,337 - -Other current assets 7 848,899 1,231,803 790,058Other financial assets 8(a) 17,513,307 12,512,899 20,713,572TOTAL CURRENT ASSETS 46,376,120 46,694,576 37,882,535NON-CURRENT ASSETSTrade receivables 5 682,477 626,728 577,001Other financial assets 8(b) 320,638 330,200 115,377Property, plant and equipment 9 169,758,136 169,431,831 168,326,166Infrastructure 10 404,277,609 402,919,087 399,596,764Right of use assets 12 1,157,093 - -TOTAL NON-CURRENT ASSETS 576,195,953 573,307,846 568,615,308TOTAL ASSETS 622,572,073 620,002,422 606,497,843
LLIIAABBIILLIITTIIEESSCURRENT LIABILITIESTrade and other payables 14 5,766,715 4,325,172 3,957,032Contract liabilities 15 1,094,479 - -Lease liabilities 16(a) 170,923 - -Borrowings 17(a) 2,522,894 2,570,907 2,239,966Employee related provisions 18 5,851,436 5,228,917 4,854,667Other provisions 19 209,341 207,247 163,666TOTAL CURRENT LIABILITIES 15,615,788 12,332,243 11,215,331NON-CURRENT LIABILITIESContract liabilities 15 926,503 - -Lease liabilities 16(a) 1,014,045 - -Borrowings 17(a) 9,823,994 12,346,888 11,617,795Employee related provisions 18 398,892 593,440 735,523Other provisions 19 8,000,000 8,000,000 8,000,000TOTAL NON-CURRENT LIABILITIES 20,163,434 20,940,328 20,353,318TOTAL LIABILITIES 35,779,222 33,272,571 31,568,649NNEETT AASSSSEETTSS 586,792,851 586,729,851 574,929,194
EEQQUUIITTYYRetained surplus 313,865,617 308,551,507 304,166,569Reserves - cash backed 4 29,227,794 33,463,804 26,048,085Revaluation surplus 13 243,699,440 244,714,540 244,714,540TTOOTTAALL EEQQUUIITTYY 586,792,851 586,729,851 574,929,194
* See note 33 for details regarding the prior period adjustment
This statement is to be read in conjunction with the accompanying notes.
Page 6
Certified as a True & Correct Copy

CIT
Y O
F A
LBA
NY
AN
NU
AL
FIN
AN
CIA
L R
EPO
RT
2020
Sta
tem
ent
of C
hang
es in
Equ
ity
ffoorr
tthhee
yyeeaarr
eenndd
eedd 33
00 JJuu
nnee 22
002200
RET
AIN
EDC
ASH
BAC
KED
REV
ALU
ATIO
NTO
TAL
NO
TESU
RPL
US
RES
ERVE
SSU
RPL
US
EQU
ITY
$$
$$
Bala
nce
as a
t 1 J
uly
2018
308,
022,
546
26,0
48,0
8524
4,71
4,54
057
8,78
5,17
1
Prio
r per
iod
adju
stm
ent
33(3
,855
,977
)-
-(3
,855
,977
)R
esta
ted
tota
l equ
ity a
t the
beg
inni
ng o
f the
fina
ncia
l yea
r30
4,16
6,56
926
,048
,085
244,
714,
540
574,
929,
194
Com
preh
ensi
ve in
com
eN
et re
sult
for t
he p
erio
d11
,800
,657
--
11,8
00,6
57O
ther
com
preh
ensi
ve in
com
e13
--
--
Tota
l com
preh
ensi
ve in
com
e11
,800
,657
--
11,8
00,6
57
Tran
sfer
s fro
m/(t
o) re
serv
es(7
,415
,719
)7,
415,
719
--
Bal
ance
as
at 3
0 Ju
ne 2
019
308,
551,
507
33,4
63,8
0424
4,71
4,54
058
6,72
9,85
1
Cha
nge
in a
ccou
ntin
g po
licie
s33
(c)
(5,6
51,8
30)
-(1
,015
,100
)(6
,666
,930
)R
esta
ted
tota
l equ
ity a
t 1 J
uly
2019
302,
899,
677
33,4
63,8
0424
3,69
9,44
058
0,06
2,92
1
Com
preh
ensi
ve in
com
eN
et re
sult
for t
he p
erio
d6,
729,
930
--
6,72
9,93
0O
ther
com
preh
ensi
ve in
com
e13
--
--
Tota
l com
preh
ensi
ve in
com
e6,
729,
930
--
6,72
9,93
0
Tran
sfer
s fro
m/(t
o) re
serv
es4,
236,
010
(4,2
36,0
10)
--
BBaall
aannccee
aass
aatt 33
00 JJuu
nnee 22
002200
313,
865,
617
29,2
27,7
9424
3,69
9,44
058
6,79
2,85
1
This
sta
tem
ent i
s to
be
read
in c
onju
nctio
n w
ith th
e ac
com
pany
ing
note
s.
Page
7
Cer
tifie
d as
a T
rue
& C
orre
ct C
opy
CITY OF ALBANY ANNUAL FINANCIAL REPORT 2020
Statement of Cash Flowsffoorr tthhee yyeeaarr eennddeedd 3300 JJuunnee 22002200
2020 2020 2019NOTE Actual Budget Actual
$ $ $CCAASSHH FFLLOOWWSS FFRROOMM OOPPEERRAATTIINNGG AACCTTIIVVIITTIIEESSReceiptsRates 38,176,717 38,342,952 36,873,485Operating grants, subsidies and contributions 7,486,886 4,980,969 7,235,161Fees and charges 16,842,478 18,099,752 18,331,828Interest received 1,054,440 1,211,522 1,360,925Goods and services tax received 2,561,298 400,000 2,003,927Other revenue 176,081 215,760 487,113
66,297,900 63,250,955 66,292,439PaymentsEmployee costs (27,054,691) (27,812,099) (25,900,312)Materials and contracts (17,249,811) (18,552,703) (17,355,712)Utility charges (1,728,294) (1,953,402) (1,959,071)Interest expenses (778,879) (754,635) (768,618)Insurance paid (656,392) (705,304) (676,304)Goods and services tax paid (2,559,432) (400,000) (1,787,598)Other expenditure (2,364,295) (2,814,184) (2,163,929)
(52,391,794) (52,992,327) (50,611,544)
Net cash provided by/(used in) operating activities 20 13,906,106 10,258,628 15,680,895
CCAASSHH FFLLOOWWSS FFRROOMM IINNVVEESSTTIINNGG AACCTTIIVVIITTIIEESSPayments for purchase of property, plant & equipment 9(a) (7,280,187) (13,036,582) (7,078,251)Payments for construction of infrastructure 10(a) (12,809,704) (24,420,449) (14,530,878)Net proceeds for financial assets at amortised cost 8 (5,000,000) - 8,000,000Non-operating grants, subsidies and contributions 2 8,177,274 13,098,222 11,863,252Proceeds from sale of property, plant & equipment 11(a) 624,327 858,500 465,388Net cash provided by/(used in) investment activities (16,288,290) (23,500,309) (1,280,489)
CCAASSHH FFLLOOWWSS FFRROOMM FFIINNAANNCCIINNGG AACCTTIIVVIITTIIEESSRepayment of borrowings 17(b) (2,570,907) (2,551,149) (2,239,966)Proceeds from new borrowings - - 3,300,000Proceeds from self supporting loans 8 12,899 12,899 12,505Repayment of leases 16(b) (168,191) - -Net cash provided by/(used in) financing activities (2,726,199) (2,538,250) 1,072,539
Net increase/(decrease) in cash held (5,108,383) (15,779,931) 15,472,945Cash at beginning of year 28,430,091 41,112,563 12,957,146CCaasshh aanndd ccaasshh eeqquuiivvaalleennttss aatt tthhee eenndd ooff tthhee yyeeaarr 20 23,321,708 25,332,632 28,430,091
This statement is to be read in conjunction with the accompanying notes.
Page 8
Certified as a True & Correct Copy

CITY OF ALBANY ANNUAL FINANCIAL REPORT 2020
Rate Setting Statementffoorr tthhee yyeeaarr eennddeedd 3300 JJuunnee 22002200
2020 2020 2019NOTE Actual Budget Actual
$ $ $OOPPEERRAATTIINNGG AACCTTIIVVIITTIIEESSNet current assets at start of financial year - surplus/(deficit) 29 (b) 2,377,413 (1,764,749) 2,487,513
2,377,413 (1,764,749) 2,487,513Revenue from operating activities (excluding rates)Rates (excluding general rates) 28(a) 113,578 110,000 246,998Operating grants, subsidies and contributions 7,245,486 4,903,676 7,710,373Fees and charges 16,842,478 18,087,025 18,331,828Profit on Asset Disposal 45,103 47,585 25,221Interest earnings 1,054,440 1,211,522 1,360,925Other revenue 176,081 215,760 487,113
25,477,166 24,575,568 28,162,458Expenditure from operating activitiesEmployee costs (26,750,782) (27,785,523) (26,161,298)Materials and contracts (16,015,065) (20,048,199) (16,714,715)Utility charges (1,728,294) (1,953,402) (1,959,071)Depreciation on non-current assets 11(d) (16,777,600) (15,794,228) (16,181,643)Interest expenses (748,230) (754,635) (764,618)Insurance expenses (656,392) (705,304) (676,304)Loss on sale of assets 11(a) (207,977) (477,660) (232,556)Loss on assets expensed 9 - - (53,677)Loss on assets written off 9,10 - - (273,098)Other expenditure (2,364,295) (1,868,714) (2,163,929)
(65,248,635) (69,387,665) (65,180,909)
Non-cash amounts excluded from operating activities 29(a) 11,330,508 16,224,303 16,523,943AAmmoouunntt aattttrriibbuuttaabbllee ttoo ooppeerraattiinngg aaccttiivviittiieess (26,063,548) (30,352,543) (18,006,995)
IINNVVEESSTTIINNGG AACCTTIIVVIITTIIEESSNon-operating grants, subsidies and contributions 2 8,177,274 16,638,712 11,863,252Proceeds from disposal of assets 11(a) 624,327 858,500 465,388Purchase of property, plant and equipment 9(a) (7,280,187) (13,036,582) (7,078,251)Purchase and construction of infrastructure 10(a) (12,809,704) (24,420,449) (14,530,878)AAmmoouunntt aattttrriibbuuttaabbllee ttoo iinnvveessttiinngg aaccttiivviittiieess (11,288,290) (19,959,819) (9,280,489)
FFIINNAANNCCIINNGG AACCTTIIVVIITTIIEESSRepayment of borrowings 17(b) (2,570,907) (2,551,149) (2,239,966)Proceeds from borrowings 17(b) - - 3,300,000Proceeds from self supporting loans 8 12,899 12,899 12,505Payments for principal portion of lease liabilities 16(b) (168,191) - -Restricted Cash Utilised 17(d) 1,576,695 1,595,589 -Transfers to reserves (restricted assets) 4 (16,424,612) (13,921,383) (23,621,582)Transfers from reserves (restricted assets) 4 20,660,622 26,878,888 16,205,863AAmmoouunntt aattttrriibbuuttaabbllee ttoo ffiinnaanncciinngg aaccttiivviittiieess 3,086,506 12,014,844 (6,343,180)
Deficit before imposition of general rates (34,265,332) (38,297,518) (33,630,664)TToottaall aammoouunntt rraaiisseedd ffrroomm ggeenneerraall rraatteess 28 38,320,380 38,297,518 36,929,201SSuurrpplluuss aafftteerr iimmppoossiittiioonn ooff ggeenneerraall rraatteess 29(b) 4,055,048 - 3,298,537
* See note 33 for details regarding the prior period adjustment
This statement is to be read in conjunction with the accompanying notes.
Page 9
Certified as a True & Correct Copy CITY OF ALBANY ANNUAL FINANCIAL REPORT 2020
Notes to the Financial Statementsffoorr tthhee yyeeaarr eennddeedd 3300 JJuunnee 22002200
11.. SSIIGGNNIIFFIICCAANNTT AACCCCOOUUNNTTIINNGG PPOOLLIICCIIEESS
BBaassiiss ooff PPrreeppaarraattiioonnThe financial report comprises general purpose financial statements which have been prepared in accordance with Australian AccountingStandards (as they apply to local governments and not-for-profit entities) and Interpretations of the Australian Accounting Standards Board, andthe Local Government Act 1995 and accompanying regulations.
AAmmeennddmmeennttss ttoo LLooccaall GGoovveerrnnmmeenntt ((FFiinnaanncciiaall MMaannaaggeemmeenntt)) RReegguullaattiioonnss 11999966The Local Government (Financial Management) Regulations 1996 take precedence over Australian Accounting Standards. Prior to 1 July 2019,Financial Management Regulation 16 arbitrarily prohibited a local government from recognising as assets Crown land that is a publicthoroughfare, i.e. land under roads, and land not owned by but under the control or management of the local government, unless it is a golfcourse, showground, racecourse or recreational facility of State or regional significance. Consequently, some assets pertaining to vested land,including land under roads acquired on or after 1 July 2008, were not recognised in previous financial reports of the City. This was not inaccordance with the requirements of AASB 1051 Land Under Roads paragraph 15 and AASB 116 Property, Plant and Equipment paragraph 7.
From 1 July 2019, the City has applied AASB 16 Leases which requires leases to be included by lessees in the statement of financial position.Also, the Local Government (Financial Management) Regulations 1996 have been amended to specify that vested land is a right-of-use asset tobe measured at cost. All right-of-use assets (other than vested improvements) under zero cost concessionary leases are measured at zero cost(i.e. not included in the statement of financial position) rather than at fair value. The exception is vested improvements on concessionary landleases such as roads, buildings or other infrastructure which continue to be reported at fair value, as opposed to the vested land which ismeasured at zero cost. The measurement of vested improvements at fair value is a departure from AASB 16 which would have required the Cityto measure any vested improvements at zero cost.
The City has accounted for the removal of the vested land values associated with vested land previously recognised by removing the land valueand associated revaluation reserve as at 1 July 2019. The comparative year amounts have been retained as AASB 16 does not requirecomparatives to be restated in the year of transition. Therefore the departure from AASB 1051 and AASB 16 in respect of the comparatives forthe year ended 30 June 2019 remains.
Accounting policies which have been adopted in the preparation of this financial report have been consistently applied unless stated otherwise.Except for cash flow and rate setting information, the report has been prepared on the accrual basis and is based on historical costs, modified,where applicable, by the measurement at fair value of selected non-current assets, financial assets and liabilities.
NNeeww AAccccoouunnttiinngg SSttaannddaarrddss ffoorr aapppplliiccaattiioonn iinn FFuuttuurree YYeeaarrssOn 1 July 2020 the following new accounting standards are to by adopted:
- AASB 1059 Service Concession Arrangements: Grantors- AASB 2018-7 Amendments to Australian Accounting Standards - Materiality
AASB 1059 Service Concession Arrangements: Grantors is not expected to impact the financial reportSpecific impacts of AASB 2018-7 Amendments to Australian Accounting Standards - Materiality , have not been identified
CCrriittiiccaall AAccccoouunnttiinngg EEssttiimmaatteessThe preparation of a financial report in conformity with Australian Accounting Standards requires management to make judgements, estimatesand assumptions that effect the application of policies and reported amounts of assets and liabilities, income and expenses. The estimates andassociated assumptions are based on historical experience and various other factors that are believed to be reasonable under thecircumstances; the results of which form the basis of making the judgements about carrying values of assets and liabilities that are not readilyapparent from other sources. Actual results may differ from these estimates.
TThhee LLooccaall GGoovveerrnnmmeenntt RReeppoorrttiinngg EEnnttiittyyAll funds through which the City controls resources to carry on its functions have been included in the financial statements forming part of thisfinancial report. In the process of reporting on the local government as a single unit, all transactions and balances between those funds (forexample, loans and transfers between funds) have been eliminated. All monies held in the Trust Fund are excluded from the financialstatements. A separate statement of those monies appears at Note 31 to these financial statements.
Page 10

CIT
Y O
F A
LBA
NY
AN
NU
AL
FIN
AN
CIA
L R
EPO
RT
2020
Not
es t
o th
e Fi
nanc
ial S
tate
men
tsffoo
rr tthh
ee yyee
aarr ee
nnddeedd
3300
JJuunnee
220022
00
22..RR
EEVV
EENN
UUEE
AANN
DD EE
XXPP
EENN
SSEE
SS
RReevv
eennuuee
RReecc
ooggnnii
ttiioonn
PPooll
iiccyy
Rec
ogni
tion
of re
venu
e is
dep
enda
nt o
n th
e so
urce
of r
even
ue a
nd th
e as
soci
ated
term
s an
d co
nditi
ons
asso
ciat
ed w
ith e
ach
sour
ce o
f rev
enue
and
reco
gnis
ed a
s fo
llow
s:
Rev
enue
Cat
egor
yN
atur
e of
goo
ds a
nd
serv
ices
Whe
n ob
ligat
ions
typi
cally
sa
tisfie
dPa
ymen
t ter
ms
Ret
urns
/Ref
unds
/ W
arra
ntie
sD
eter
min
atio
n of
tr
ansa
ctio
n pr
ice
Allo
catin
g tr
ansa
ctio
n pr
ice
Mea
surin
g ob
ligat
ions
for
retu
rns
Tim
ing
of re
venu
e re
cogn
ition
R
ates
- ge
nera
l rat
esG
ener
al ra
tes
Ove
r tim
ePa
ymen
t dat
es a
dopt
ed b
y co
unci
l dur
ing
the
year
Non
eAd
opte
d by
Cou
ncil
annu
ally
Whe
n ta
xabl
e ev
ent o
ccur
sN
ot a
pplic
able
Whe
n ra
tes
notic
e is
issu
ed
Gra
nt c
ontra
cts
with
cu
stom
ers
Com
mun
ity e
vent
s, m
inor
fa
cilit
ies,
rese
arch
, des
ign,
pl
anni
ng e
valu
atio
n an
d se
rvic
es
Ove
r tim
eFi
xed
term
tran
sfer
of f
unds
ba
sed
on a
gree
d m
ilest
ones
an
d re
porti
ng
Con
tract
obl
igat
ion
if pr
ojec
t no
t com
plet
eSe
t by
mut
ual a
gree
men
t with
cu
stom
erBa
sed
on th
e pr
ogre
ss o
f w
orks
to m
atch
per
form
ance
ob
ligat
ions
Ret
urns
lim
ited
to re
paym
ent
of tr
ansa
ctio
n pr
ice
of te
rms
Out
put m
etho
d ba
sed
on
proj
ect m
ilest
ones
and
/or
com
plet
ion
date
mat
ched
to
perfo
rman
ce o
blig
atio
ns a
s in
puts
are
sha
red
Gra
nts,
sub
sidi
es o
r co
ntrib
utio
ns fo
r the
co
nstru
ctio
n of
non
-fina
ncia
l as
sets
Con
stru
ctio
n or
acq
uisi
tion
of
reco
gnis
able
non
-fina
ncia
l as
sets
to b
e co
ntro
lled
by th
e lo
cal g
over
nmen
t
Ove
r tim
eFi
xed
term
tran
sfer
of f
unds
ba
sed
on a
gree
d m
ilest
ones
an
d re
porti
ng
Con
tract
obl
igat
ion
if pr
ojec
t no
t com
plet
eSe
t by
mut
ual a
gree
men
t with
cu
stom
erBa
sed
on th
e pr
ogre
ss o
f w
orks
to m
atch
per
form
ance
ob
ligat
ions
Ret
urns
lim
ited
to re
paym
ent
of tr
ansa
ctio
n pr
ice
of te
rms
Out
put m
etho
d ba
sed
on
proj
ect m
ilest
ones
and
/or
com
plet
ion
date
mat
ched
to
perfo
rman
ce o
blig
atio
ns
Gra
nts,
sub
sidi
es o
r co
ntrib
utio
ns w
ith n
o co
ntra
ctua
l com
mitm
ents
Gen
eral
app
ropr
iatio
ns a
nd
cont
ribut
ions
with
no
reci
proc
al c
omm
itmen
t
No
oblig
atio
nsN
ot a
pplic
able
Not
app
licab
leC
ash
rece
ived
On
rece
ipt o
f fun
dsN
ot a
pplic
able
Whe
n as
sets
are
con
trolle
d
Fees
and
cha
rges
- lic
ence
s,
regi
stra
tions
, app
rova
lsBu
ildin
g, p
lann
ing,
de
velo
pmen
t and
ani
mal
m
anag
emen
t, ha
ving
the
sam
e na
ture
as
a lic
ence
re
gard
less
of n
amin
g.
Sing
le p
oint
in ti
me
Full
paym
ent p
rior t
o is
sue
Non
eSe
t by
Stat
e le
gisl
atio
n or
lim
ited
by le
gisl
atio
n to
the
cost
of p
rovi
sion
Base
d on
tim
ing
of is
sue
of
the
asso
ciat
ed ri
ghts
No
refu
nds
On
paym
ent o
f the
lice
nce,
re
gist
ratio
n or
app
rova
l
Fees
and
cha
rges
- ot
her
insp
ectio
nsR
egul
ator
y fo
od, h
ealth
and
sa
fety
Sing
le p
oint
in ti
me
Full
paym
ent p
rior t
o in
spec
tion
Non
eSe
t by
Stat
e le
gisl
atio
n or
lim
ited
by le
gisl
atio
n to
the
cost
of p
rovi
sion
Appl
ied
fully
on
timin
g of
in
spec
tion
Not
app
licab
leR
even
ue re
cogn
ised
afte
r in
spec
tion
even
t occ
urs
Fees
and
cha
rges
- w
aste
m
anag
emen
t col
lect
ions
Kerb
side
col
lect
ion
serv
ice
Ove
r tim
ePa
ymen
t on
an a
nnua
l bas
is
in a
dvan
ceN
one
Adop
ted
by c
ounc
il an
nual
lyAp
porti
oned
equ
ally
acro
ss
the
colle
ctio
n pe
riod
Not
app
licab
leO
utpu
t met
hod
base
d on
re
gula
r wee
kly
and
fortn
ight
ly pe
riod
as p
ropo
rtion
ate
to
colle
ctio
n se
rvic
e
Fees
and
cha
rges
- w
aste
m
anag
emen
t ent
ry fe
esW
aste
trea
tmen
t, re
cycl
ing
and
disp
osal
ser
vice
at
disp
osal
site
s
Sing
le p
oint
in ti
me
Paym
ent i
n ad
vanc
e at
gat
e or
on
norm
al tr
adin
g te
rms
if cr
edit
prov
ided
Non
eAd
opte
d by
cou
ncil
annu
ally
Base
d on
tim
ing
of e
ntry
to
faci
lity
Not
app
licab
leO
n en
try to
faci
lity
Fees
and
cha
rges
- ai
rpor
t la
ndin
g ch
arge
sPe
rmis
sion
to u
se fa
cilit
ies
and
runw
aySi
ngle
poi
nt in
tim
eM
onth
ly in
arre
ars
Non
eAd
opte
d by
cou
ncil
annu
ally
Appl
ied
fully
on
timin
g of
la
ndin
g/ta
ke-o
ffN
ot a
pplic
able
On
land
ing/
depa
rture
eve
nt
Fees
and
cha
rges
- pr
oper
ty
hire
and
ent
ryU
se o
f hal
ls a
nd fa
cilit
ies
Sing
le p
oint
in ti
me
In fu
ll in
adv
ance
Ref
und
if ev
ent c
ance
lled
Adop
ted
by c
ounc
il an
nual
lyBa
sed
on ti
min
g of
ent
ry to
fa
cilit
yR
etur
ns li
mite
d to
repa
ymen
t of
tran
sact
ion
On
entry
or a
t con
clus
ion
of
hire
Fees
and
cha
rges
- m
embe
rshi
psG
ym a
nd p
ool m
embe
rshi
pO
ver t
ime
Paym
ent i
n fu
ll in
adv
ance
Ref
und
for u
nuse
d po
rtion
on
appl
icat
ion
Adop
ted
by c
ounc
il an
nual
lyAp
porti
oned
equ
ally
acro
ss
the
acce
ss p
erio
dR
etur
ns li
mite
d to
repa
ymen
t of
tran
sact
ion
Out
put m
etho
d ov
er 1
2 m
onth
s m
atch
ed to
acc
ess
right
Fees
and
cha
rges
for o
ther
go
ods
and
serv
ices
Libr
ary
fees
, rei
nsta
tem
ents
an
d pr
ivat
e w
orks
Sing
le p
oint
in ti
me
Paym
ent i
n fu
ll in
adv
ance
Non
eAd
opte
d by
cou
ncil
annu
ally
Appl
ied
fully
bas
ed o
n tim
ing
of p
rovi
sion
Not
app
licab
leO
utpu
t met
hod
base
d on
pr
ovis
ion
of s
ervi
ce o
r co
mpl
etio
n of
wor
ksFe
es a
nd c
harg
es -
sale
of
stoc
kFo
rts s
tore
, Lib
rary
, ALA
C
and
Visi
tor C
entre
sto
ckSi
ngle
poi
nt in
tim
ePa
ymen
t in
full
in a
dvan
ceR
efun
d fo
r fau
lty g
oods
Adop
ted
by c
ounc
il an
nual
ly,
set b
y m
utua
l agr
eem
ent
Appl
ied
fully
bas
ed o
n tim
ing
of p
rovi
sion
Ret
urns
lim
ited
to re
paym
ent
of tr
ansa
ctio
nO
utpu
t met
hod
base
d on
go
ods
Fees
and
cha
rges
- fin
esFi
nes
issu
ed fo
r bre
ache
s of
lo
cal l
aws
Sing
le p
oint
in ti
me
Paym
ent i
n fu
ll w
ithin
def
ined
tim
eN
one
Adop
ted
by c
ounc
il th
roug
h lo
cal l
awW
hen
taxa
ble
even
t occ
urs
Not
app
licab
leW
hen
fine
notic
e is
issu
ed
Oth
er re
venu
e - c
omm
issi
ons
Com
mis
sion
s on
lice
ncin
g,
acco
mm
odat
ion
and
ticke
t sa
les
Ove
r tim
ePa
ymen
t in
full
on s
ale
Non
eSe
t by
mut
ual a
gree
men
t with
th
e cu
stom
erO
n re
ceip
t of f
unds
Not
app
licab
leW
hen
asse
ts a
re c
ontro
lled
Oth
er re
venu
e -
reim
burs
emen
tsIn
sura
nce
clai
ms
Sing
le p
oint
in ti
me
Paym
ent i
n ar
rear
s fo
r cl
aim
able
eve
ntN
one
Set b
y m
utua
l agr
eem
ent w
ith
the
cust
omer
Whe
n cl
aim
is a
gree
dN
ot a
pplic
able
Whe
n cl
aim
is a
gree
d
Page
11
CITY OF ALBANY ANNUAL FINANCIAL REPORT 2020
Notes to the Financial Statementsffoorr tthhee yyeeaarr eennddeedd 3300 JJuunnee 22002200
22.. RREEVVEENNUUEE AANNDD EEXXPPEENNSSEESS
((aa)) RReevveennuuee
GGrraanntt RReevveennuueeGrants, subsidies and contributions are included as both operating and non-operating revenues in the Statement of Comprehensive Income:
2020 2020 2019Actual Budget Actual
$ $ $Operating grants, subsidies and contributionsGovernance 44,203 6,700 20,258General purpose funding 4,425,363 2,014,339 4,132,288Law, order, public safety 559,539 425,087 475,220Education and welfare 112,040 195,855 301,383Community amenities 54,308 1,551 97,229Recreation and culture 1,011,533 1,429,828 1,987,114Transport 85,819 86,959 77,428Economic services 468,088 580,788 317,292Other property and services 484,593 162,569 302,161
7,245,486 4,903,676 7,710,373Non-operating grants, subsidies and contributionsLaw, order, public safety 602,553 993,402 330,214Community amenities - - 27,273Recreation and culture 3,262,324 10,557,268 6,928,393Transport 4,084,029 4,859,674 4,249,254Economic services 228,368 228,368 328,118
8,177,274 16,638,712 11,863,252
TToottaall ggrraannttss,, ssuubbssiiddiieess aanndd ccoonnttrriibbuuttiioonnss 15,422,760 21,542,388 19,573,625
FFeeeess aanndd CChhaarrggeessGeneral purpose funding 115,907 90,000 122,072Law, order, public safety 136,110 133,320 141,245Health 130,454 185,090 178,890Education and welfare 1,110,363 1,262,147 1,196,935Community amenities 9,129,503 9,110,923 9,088,299Recreation and culture 1,813,630 2,382,467 2,149,101Transport 1,954,831 2,156,878 2,143,499Economic services 1,634,624 1,920,200 2,481,432Other property and services 817,056 846,000 830,355
16,842,478 18,087,025 18,331,828
SSIIGGNNIIFFIICCAANNTT AACCCCOOUUNNTTIINNGG PPOOLLIICCIIEESSGGrraannttss,, ddoonnaattiioonnss aanndd ootthheerr ccoonnttrriibbuuttiioonnss
FFeeeess && CChhaarrggeess
Operating grants, subsidies and contributions are grants, subsidies or contributions that are not non-operating in nature. Non-operating grants, subsidies and contributions are amounts received for the acquisition or construction of recognisable non-financial assets to be controlled by the local government.
Revenue (other than service charges) from the use of facilities and charges made for local government services, sewerage rates, rentals, hire charges, fee for service, photocopying charges, licences, sale of goods or information, fines, penalties and administration fees.
Page 12

CITY OF ALBANY ANNUAL FINANCIAL REPORT 2020
Notes to the Financial Statementsffoorr tthhee yyeeaarr eennddeedd 3300 JJuunnee 22002200
22.. RREEVVEENNUUEE AANNDD EEXXPPEENNSSEESS ((CCoonnttiinnuueedd))
2020 2020 2019((aa)) RReevveennuuee ((CCoonnttiinnuueedd)) Actual Budget Actual
$ $ $CCoonnttrraaccttss wwiitthh ccuussttoommeerrss aanndd ttrraannssffeerrss ffoorr rreeccooggnniissaabbllee nnoonn--ffiinnaanncciiaall aasssseettssRevenue from contracts with customers and transfers to enable the acquisition or construction of recognisable non-financial assets to be controlled by the Citywas recognised during the year for the following nature or types of goods or services:
Fees and charges 16,429,108 17,604,265 17,864,371Other revenue 81,403 105,760 311,565Non-operating grants, subsidies and contributions 8,177,274 16,638,712 11,863,252
24,687,785 34,348,737 30,039,188
Revenue from contracts with customers and transfers to enable the acquisition or construction of recognisable non-financial assets to be controlled by the Cityis comprised of:
Contracts with customers included as a contract liability at the start of the period 3,634,565 3,634,565 -Other revenue from contracts with customers recognised during the year 21,053,220 30,714,172 -
24,687,785 34,348,737 -
Information about receivables, contract assets and contract liabilities from contracts withcustomers along with financial assets and associated liabilities arising from transfersto enable the acquisition or construction of recognisable non financial assets is:
Trade and other receivables from contracts with customers 710,361 - -Contract assets 649,337 - -Contract liabilities from contracts with customers (2,020,982) - -
SSIIGGNNIIFFIICCAANNTT AACCCCOOUUNNTTIINNGG PPOOLLIICCIIEESSCCoonnttrraaccttss wwiitthh ccuussttoommeerrss aanndd ttrraannssffeerrss ffoorr rreeccooggnniissaabbllee nnoonn--ffiinnaanncciiaall aasssseettssContract assets primarily relate to the City's right to consideration for work completed but not billed at 30 June 2020. Assets associated with contracts with customers were not subject to an impairment charge. Impairment of assets associated with contracts with customers are detailed at note 2 (b) under 'Other expenditure'. Contract liabilities for contracts with customers primarily relate to grants with performance obligations received in advance, for which revenue is recognised over time as the performance obligations are met. Information is not provided about remaining performance obligations for contracts with customers that had an original expected duration of one year or less. Consideration from contracts with customers is included in the transaction price. Performance obligations in relation to contract liabilities from transfers for recognisable non financial assets are satisfied as project milestones are met or completion of construction or acquisition of the asset. All associated performance obligations are expected to be met over the next 12 months.
Page 13
CITY OF ALBANY ANNUAL FINANCIAL REPORT 2020
Notes to the Financial Statementsffoorr tthhee yyeeaarr eennddeedd 3300 JJuunnee 22002200
22.. RREEVVEENNUUEE AANNDD EEXXPPEENNSSEESS ((CCoonnttiinnuueedd))
2020 2020 2019((aa)) RReevveennuuee ((CCoonnttiinnuueedd)) Actual Budget Actual
$ $ $RReevveennuuee ffrroomm ssttaattuuttoorryy rreeqquuiirreemmeennttssRevenue from statutory requirements was recognised duringthe year for the following nature or types of goods or services:
General rates 38,320,380 38,297,518 36,929,201Statutory permits and licences 372,979 435,140 415,679Fines 40,391 47,620 51,778Developer contributions 215,897 - 375,639Public open space contributions 32,500 - 436,359
38,982,147 38,780,278 38,208,656
OOtthheerr rreevveennuueeReimbursements and recoveries 94,678 110,000 175,548Other 81,403 105,760 311,565
176,081 215,760 487,113
IInntteerreesstt eeaarrnniinnggssLoans receivable - clubs/institutions 3,455 3,522 3,853Reserve accounts interest 442,129 400,000 640,098Other interest earnings 202,106 473,000 341,989Rates instalment and penalty interest (refer Note 28(e)) 406,750 335,000 374,985
1,054,440 1,211,522 1,360,925
SSIIGGNNIIFFIICCAANNTT AACCCCOOUUNNTTIINNGG PPOOLLIICCIIEESSIInntteerreesstt eeaarrnniinnggss
((bb)) EExxppeennsseess
AAuuddiittoorrss rreemmuunneerraattiioonn- Audit of the Annual Financial Report 74,800 130,000 54,000- Other services 51,632 20,000 34,192
126,432 150,000 88,192IInntteerreesstt eexxppeennsseess ((ffiinnaannccee ccoossttss))Borrowings (refer Note 17(b)) 727,482 754,635 764,618Implicit Interest from ROU Assets (refer Note 16(b)) 20,748 - -
748,230 754,635 764,618
Interest income is calculated by applying the effective interest rate to the gross carrying amount of a financial asset except for financial assets that subsequently become credit-impaired. For credit-impaired financial assets the effective interest rate is applied to the net carrying amount of the financial asset (after deduction of the loss allowance). Interest income is presented as finance income where it is earned from financial assets that are held for cash management purposes.
Page 14
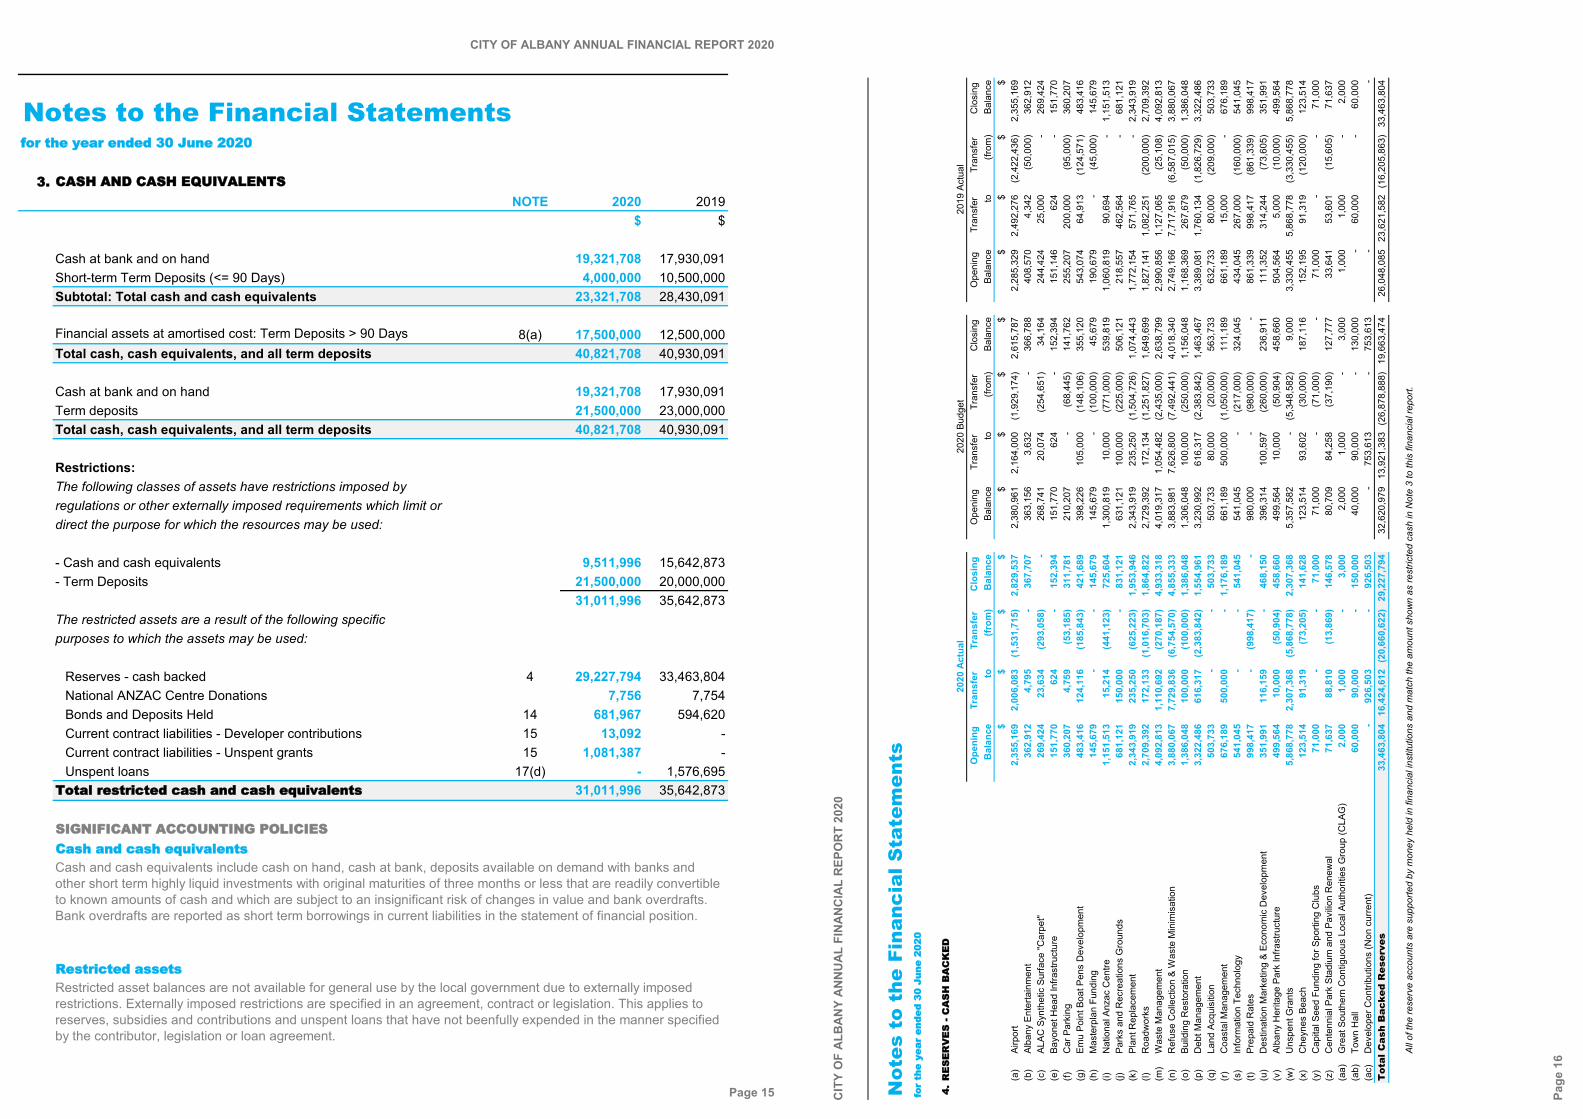
CITY OF ALBANY ANNUAL FINANCIAL REPORT 2020
Notes to the Financial Statementsffoorr tthhee yyeeaarr eennddeedd 3300 JJuunnee 22002200
33.. CCAASSHH AANNDD CCAASSHH EEQQUUIIVVAALLEENNTTSSNOTE 2020 2019
$ $
Cash at bank and on hand 19,321,708 17,930,091Short-term Term Deposits (<= 90 Days) 4,000,000 10,500,000Subtotal: Total cash and cash equivalents 23,321,708 28,430,091
Financial assets at amortised cost: Term Deposits > 90 Days 8(a) 17,500,000 12,500,000Total cash, cash equivalents, and all term deposits 40,821,708 40,930,091
Cash at bank and on hand 19,321,708 17,930,091Term deposits 21,500,000 23,000,000Total cash, cash equivalents, and all term deposits 40,821,708 40,930,091
Restrictions:The following classes of assets have restrictions imposed byregulations or other externally imposed requirements which limit ordirect the purpose for which the resources may be used:
- Cash and cash equivalents 9,511,996 15,642,873- Term Deposits 21,500,000 20,000,000
31,011,996 35,642,873The restricted assets are a result of the following specificpurposes to which the assets may be used:
Reserves - cash backed 4 29,227,794 33,463,804National ANZAC Centre Donations 7,756 7,754Bonds and Deposits Held 14 681,967 594,620Current contract liabilities - Developer contributions 15 13,092 -Current contract liabilities - Unspent grants 15 1,081,387 -Unspent loans 17(d) - 1,576,695
TToottaall rreessttrriicctteedd ccaasshh aanndd ccaasshh eeqquuiivvaalleennttss 31,011,996 35,642,873
SSIIGGNNIIFFIICCAANNTT AACCCCOOUUNNTTIINNGG PPOOLLIICCIIEESSCCaasshh aanndd ccaasshh eeqquuiivvaalleennttss
RReessttrriicctteedd aasssseettss
Cash and cash equivalents include cash on hand, cash at bank, deposits available on demand with banks and other short term highly liquid investments with original maturities of three months or less that are readily convertible to known amounts of cash and which are subject to an insignificant risk of changes in value and bank overdrafts. Bank overdrafts are reported as short term borrowings in current liabilities in the statement of financial position.
Restricted asset balances are not available for general use by the local government due to externally imposed restrictions. Externally imposed restrictions are specified in an agreement, contract or legislation. This applies to reserves, subsidies and contributions and unspent loans that have not beenfully expended in the manner specified by the contributor, legislation or loan agreement.
Page 15 CIT
Y O
F A
LBA
NY
AN
NU
AL
FIN
AN
CIA
L R
EPO
RT
2020
Not
es t
o th
e Fi
nanc
ial S
tate
men
tsffoo
rr tthh
ee yyee
aarr ee
nnddeedd
3300
JJuunnee
220022
00
44..RR
EESS
EERR
VVEE
SS --
CCAA
SSHH
BBAA
CCKK
EEDD
Ope
ning
Tr
ansf
er
Tran
sfer
C
losi
ng
Ope
ning
Tr
ansf
er
Tran
sfer
C
losi
ng
Ope
ning
Tr
ansf
er
Tran
sfer
C
losi
ng
Bal
ance
to(fr
om)
Bal
ance
Bala
nce
to(fr
om)
Bala
nce
Bala
nce
to(fr
om)
Bala
nce
$$
$$
$$
$$
$$
$$
(a)
Airp
ort
2,35
5,16
92,
006,
083
(1,5
31,7
15)
2,82
9,53
72,
380,
961
2,16
4,00
0(1
,929
,174
)2,
615,
787
2,28
5,32
92,
492,
276
(2,4
22,4
36)
2,35
5,16
9(b
)Al
bany
Ent
erta
inm
ent
362,
912
4,79
5-
367,
707
363,
156
3,63
2-
366,
788
408,
570
4,34
2(5
0,00
0)36
2,91
2(c
)AL
AC S
ynth
etic
Sur
face
"Car
pet"
269,
424
23,6
34(2
93,0
58)
-26
8,74
120
,074
(254
,651
)34
,164
244,
424
25,0
00-
269,
424
(e)
Bayo
net H
ead
Infra
stru
ctur
e15
1,77
062
4-
152,
394
151,
770
624
-15
2,39
415
1,14
662
4-
151,
770
(f)C
ar P
arki
ng36
0,20
74,
759
(53,
185)
311,
781
210,
207
-(6
8,44
5)14
1,76
225
5,20
720
0,00
0(9
5,00
0)36
0,20
7(g
)Em
u Po
int B
oat P
ens
Dev
elop
men
t48
3,41
612
4,11
6(1
85,8
43)
421,
689
398,
226
105,
000
(148
,106
)35
5,12
054
3,07
464
,913
(124
,571
)48
3,41
6(h
)M
aste
rpla
n Fu
ndin
g14
5,67
9-
-14
5,67
914
5,67
9-
(100
,000
)45
,679
190,
679
-(4
5,00
0)14
5,67
9(i)
Nat
iona
l Anz
ac C
entre
1,15
1,51
315
,214
(441
,123
)72
5,60
41,
300,
819
10,0
00(7
71,0
00)
539,
819
1,06
0,81
990
,694
-1,
151,
513
(j)Pa
rks
and
Rec
reat
ions
Gro
unds
681,
121
150,
000
-83
1,12
163
1,12
110
0,00
0(2
25,0
00)
506,
121
218,
557
462,
564
-68
1,12
1(k
)Pl
ant R
epla
cem
ent
2,34
3,91
923
5,25
0(6
25,2
23)
1,95
3,94
62,
343,
919
235,
250
(1,5
04,7
26)
1,07
4,44
31,
772,
154
571,
765
-2,
343,
919
(l)R
oadw
orks
2,70
9,39
217
2,13
3(1
,016
,703
)1,
864,
822
2,72
9,39
217
2,13
4(1
,251
,827
)1,
649,
699
1,82
7,14
11,
082,
251
(200
,000
)2,
709,
392
(m)
Was
te M
anag
emen
t4,
092,
813
1,11
0,69
2(2
70,1
87)
4,93
3,31
84,
019,
317
1,05
4,48
2(2
,435
,000
)2,
638,
799
2,99
0,85
61,
127,
065
(25,
108)
4,09
2,81
3(n
)R
efus
e C
olle
ctio
n &
Was
te M
inim
isat
ion
3,88
0,06
77,
729,
836
(6,7
54,5
70)
4,85
5,33
33,
883,
981
7,62
6,80
0(7
,492
,441
)4,
018,
340
2,74
9,16
67,
717,
916
(6,5
87,0
15)
3,88
0,06
7(o
)Bu
ildin
g R
esto
ratio
n 1,
386,
048
100,
000
(100
,000
)1,
386,
048
1,30
6,04
810
0,00
0(2
50,0
00)
1,15
6,04
81,
168,
369
267,
679
(50,
000)
1,38
6,04
8(p
)D
ebt M
anag
emen
t 3,
322,
486
616,
317
(2,3
83,8
42)
1,55
4,96
13,
230,
992
616,
317
(2,3
83,8
42)
1,46
3,46
73,
389,
081
1,76
0,13
4(1
,826
,729
)3,
322,
486
(q)
Land
Acq
uisi
tion
503,
733
--
503,
733
503,
733
80,0
00(2
0,00
0)56
3,73
363
2,73
380
,000
(209
,000
)50
3,73
3(r)
Coa
stal
Man
agem
ent
676,
189
500,
000
-1,
176,
189
661,
189
500,
000
(1,0
50,0
00)
111,
189
661,
189
15,0
00-
676,
189
(s)
Info
rmat
ion
Tech
nolo
gy
541,
045
--
541,
045
541,
045
-(2
17,0
00)
324,
045
434,
045
267,
000
(160
,000
)54
1,04
5(t)
Prep
aid
Rat
es99
8,41
7-
(998
,417
)-
980,
000
-(9
80,0
00)
-86
1,33
999
8,41
7(8
61,3
39)
998,
417
(u)
Des
tinat
ion
Mar
ketin
g &
Econ
omic
Dev
elop
men
t35
1,99
111
6,15
9-
468,
150
396,
314
100,
597
(260
,000
)23
6,91
111
1,35
231
4,24
4(7
3,60
5)35
1,99
1(v
)Al
bany
Her
itage
Par
k In
frast
ruct
ure
499,
564
10,0
00(5
0,90
4)45
8,66
049
9,56
410
,000
(50,
904)
458,
660
504,
564
5,00
0(1
0,00
0)49
9,56
4(w
)U
nspe
nt G
rant
s 5,
868,
778
2,30
7,36
8(5
,868
,778
)2,
307,
368
5,35
7,58
2-
(5,3
48,5
82)
9,00
03,
330,
455
5,86
8,77
8(3
,330
,455
)5,
868,
778
(x)
Che
ynes
Bea
ch12
3,51
491
,319
(73,
205)
141,
628
123,
514
93,6
02(3
0,00
0)18
7,11
615
2,19
591
,319
(120
,000
)12
3,51
4(y
)C
apita
l See
d Fu
ndin
g fo
r Spo
rting
Clu
bs71
,000
--
71,0
0071
,000
-(7
1,00
0)-
71,0
00-
-71
,000
(z)
Cen
tenn
ial P
ark
Stad
ium
and
Pav
ilion
Ren
ewal
71,6
3788
,810
(13,
869)
146,
578
80,7
0984
,258
(37,
190)
127,
777
33,6
4153
,601
(15,
605)
71,6
37(a
a)G
reat
Sou
ther
n C
ontig
uous
Loc
al A
utho
ritie
s G
roup
(CLA
G)
2,00
01,
000
-3,
000
2,00
01,
000
-3,
000
1,00
01,
000
-2,
000
(ab)
Tow
n H
all
60,0
0090
,000
-15
0,00
040
,000
90,0
00-
130,
000
-60
,000
-60
,000
(ac)
Dev
elop
er C
ontri
butio
ns (N
on c
urre
nt)
-92
6,50
3-
926,
503
-75
3,61
3-
753,
613
--
Tot
al C
ash
Bac
ked
Res
erve
s33
,463
,804
16,4
24,6
12(2
0,66
0,62
2)29
,227
,794
32,6
20,9
7913
,921
,383
(26,
878,
888)
19,6
63,4
7426
,048
,085
23,6
21,5
82(1
6,20
5,86
3)33
,463
,804
All o
f the
rese
rve
acco
unts
are
sup
porte
d by
mon
ey h
eld
in fi
nanc
ial i
nstit
utio
ns a
nd m
atch
the
amou
nt s
how
n as
rest
ricte
d ca
sh in
Not
e 3
to th
is fi
nanc
ial r
epor
t.
2020
Act
ual
2020
Bud
get
2019
Act
ual
Page
16
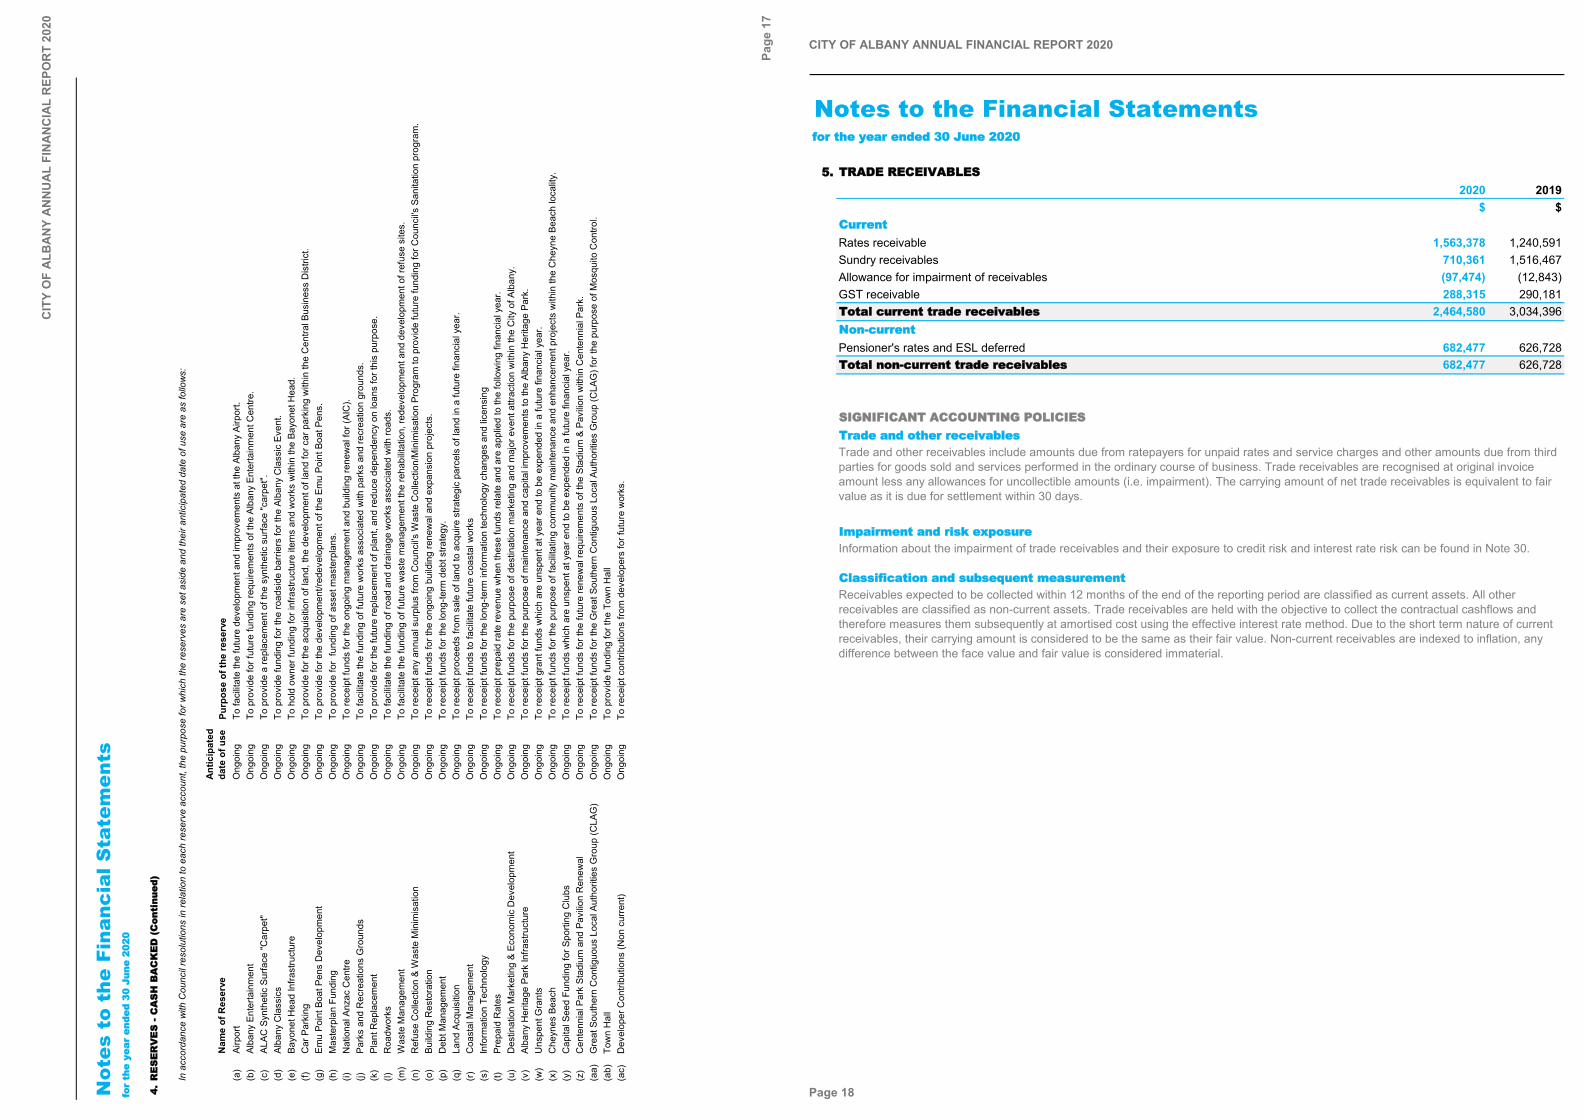
CIT
Y O
F A
LBA
NY
AN
NU
AL
FIN
AN
CIA
L R
EPO
RT
2020
Not
es t
o th
e Fi
nanc
ial S
tate
men
tsffoo
rr tthh
ee yyee
aarr ee
nnddeedd
3300
JJuunnee
220022
00
44..RR
EESS
EERR
VVEE
SS --
CCAA
SSHH
BBAA
CCKK
EEDD
((CC
oonnttii
nnuueedd
))
In a
ccor
danc
e w
ith C
ounc
il re
solu
tions
in re
latio
n to
eac
h re
serv
e ac
coun
t, th
e pu
rpos
e fo
r whi
ch th
e re
serv
es a
re s
et a
side
and
thei
r ant
icip
ated
dat
e of
use
are
as
follo
ws:
Nam
e of
Res
erve
Ant
icip
ated
da
te o
f use
Purp
ose
of th
e re
serv
e(a
)Ai
rpor
tO
ngoi
ngTo
faci
litat
e th
e fu
ture
dev
elop
men
t and
impr
ovem
ents
at t
he A
lban
y Ai
rpor
t.(b
)Al
bany
Ent
erta
inm
ent
Ong
oing
To p
rovi
de fo
r fut
ure
fund
ing
requ
irem
ents
of t
he A
lban
y En
terta
inm
ent C
entre
.(c
)AL
AC S
ynth
etic
Sur
face
"Car
pet"
Ong
oing
To p
rovi
de a
repl
acem
ent o
f the
syn
thet
ic s
urfa
ce "c
arpe
t".(d
)Al
bany
Cla
ssic
sO
ngoi
ngTo
pro
vide
fund
ing
for t
he ro
adsi
de b
arrie
rs fo
r the
Alb
any
Cla
ssic
Eve
nt.
(e)
Bayo
net H
ead
Infra
stru
ctur
eO
ngoi
ngTo
hol
d ow
ner f
undi
ng fo
r inf
rast
ruct
ure
item
s an
d w
orks
with
in th
e Ba
yone
t Hea
d.(f)
Car
Par
king
Ong
oing
To p
rovi
de fo
r the
acq
uisi
tion
of la
nd, t
he d
evel
opm
ent o
f lan
d fo
r car
par
king
with
in th
e C
entra
l Bus
ines
s D
istri
ct.
(g)
Emu
Poin
t Boa
t Pen
s D
evel
opm
ent
Ong
oing
To p
rovi
de fo
r the
dev
elop
men
t/red
evel
opm
ent o
f the
Em
u Po
int B
oat P
ens.
(h)
Mas
terp
lan
Fund
ing
Ong
oing
To p
rovi
de fo
r fu
ndin
g of
ass
et m
aste
rpla
ns.
(i)N
atio
nal A
nzac
Cen
treO
ngoi
ngTo
rece
ipt f
unds
for t
he o
ngoi
ng m
anag
emen
t and
bui
ldin
g re
new
al fo
r (AI
C).
(j)Pa
rks
and
Rec
reat
ions
Gro
unds
Ong
oing
To fa
cilit
ate
the
fund
ing
of fu
ture
wor
ks a
ssoc
iate
d w
ith p
arks
and
recr
eatio
n gr
ound
s.(k
)Pl
ant R
epla
cem
ent
Ong
oing
To p
rovi
de fo
r the
futu
re re
plac
emen
t of p
lant
, and
redu
ce d
epen
denc
y on
loan
s fo
r thi
s pu
rpos
e.(l)
Roa
dwor
ksO
ngoi
ngTo
faci
litat
e th
e fu
ndin
g of
road
and
dra
inag
e w
orks
ass
ocia
ted
with
road
s.(m
)W
aste
Man
agem
ent
Ong
oing
To fa
cilit
ate
the
fund
ing
of fu
ture
was
te m
anag
emen
t the
reha
bilit
atio
n, re
deve
lopm
ent a
nd d
evel
opm
ent o
f ref
use
site
s.(n
)R
efus
e C
olle
ctio
n &
Was
te M
inim
isat
ion
Ong
oing
To re
ceip
t any
ann
ual s
urpl
us fr
om C
ounc
il's W
aste
Col
lect
ion/
Min
imis
atio
n Pr
ogra
m to
pro
vide
futu
re fu
ndin
g fo
r Cou
ncil's
San
itatio
n pr
ogra
m.
(o)
Build
ing
Res
tora
tion
Ong
oing
To re
ceip
t fun
ds fo
r the
ong
oing
bui
ldin
g re
new
al a
nd e
xpan
sion
pro
ject
s.(p
)D
ebt M
anag
emen
t O
ngoi
ngTo
rece
ipt f
unds
for t
he lo
ng-te
rm d
ebt s
trate
gy.
(q)
Land
Acq
uisi
tion
Ong
oing
To re
ceip
t pro
ceed
s fro
m s
ale
of la
nd to
acq
uire
stra
tegi
c pa
rcel
s of
land
in a
futu
re fi
nanc
ial y
ear.
(r)C
oast
al M
anag
emen
t O
ngoi
ngTo
rece
ipt f
unds
to fa
cilit
ate
futu
re c
oast
al w
orks
(s)
Info
rmat
ion
Tech
nolo
gy
Ong
oing
To re
ceip
t fun
ds fo
r the
long
-term
info
rmat
ion
tech
nolo
gy c
hang
es a
nd li
cens
ing
(t)Pr
epai
d R
ates
Ong
oing
To re
ceip
t pre
paid
rate
reve
nue
whe
n th
ese
fund
s re
late
and
are
app
lied
to th
e fo
llow
ing
finan
cial
yea
r.(u
)D
estin
atio
n M
arke
ting
& Ec
onom
ic D
evel
opm
ent
Ong
oing
To re
ceip
t fun
ds fo
r the
pur
pose
of d
estin
atio
n m
arke
ting
and
maj
or e
vent
attr
actio
n w
ithin
the
City
of A
lban
y.(v
)Al
bany
Her
itage
Par
k In
frast
ruct
ure
Ong
oing
To re
ceip
t fun
ds fo
r the
pur
pose
of m
aint
enan
ce a
nd c
apita
l im
prov
emen
ts to
the
Alba
ny H
erita
ge P
ark.
(w)
Uns
pent
Gra
nts
Ong
oing
To re
ceip
t gra
nt fu
nds
whi
ch a
re u
nspe
nt a
t yea
r end
to b
e ex
pend
ed in
a fu
ture
fina
ncia
l yea
r.(x
)C
heyn
es B
each
Ong
oing
To re
ceip
t fun
ds fo
r the
pur
pose
of f
acilit
atin
g co
mm
unity
mai
nten
ance
and
enh
ance
men
t pro
ject
s w
ithin
the
Che
yne
Beac
h lo
calit
y.(y
)C
apita
l See
d Fu
ndin
g fo
r Spo
rting
Clu
bsO
ngoi
ngTo
rece
ipt f
unds
whi
ch a
re u
nspe
nt a
t yea
r end
to b
e ex
pend
ed in
a fu
ture
fina
ncia
l yea
r.(z
)C
ente
nnia
l Par
k St
adiu
m a
nd P
avilio
n R
enew
alO
ngoi
ngTo
rece
ipt f
unds
for t
he fu
ture
rene
wal
requ
irem
ents
of t
he S
tadi
um &
Pav
ilion
with
in C
ente
nnia
l Par
k.(a
a)G
reat
Sou
ther
n C
ontig
uous
Loc
al A
utho
ritie
s G
roup
(CLA
G)
Ong
oing
To re
ceip
t fun
ds fo
r the
Gre
at S
outh
ern
Con
tiguo
us L
ocal
Aut
horit
ies
Gro
up (C
LAG
) for
the
purp
ose
of M
osqu
ito C
ontro
l.(a
b)To
wn
Hal
lO
ngoi
ngTo
pro
vide
fund
ing
for t
he T
own
Hal
l(a
c)D
evel
oper
Con
tribu
tions
(Non
cur
rent
)O
ngoi
ngTo
rece
ipt c
ontri
butio
ns fr
om d
evel
oper
s fo
r fut
ure
wor
ks.
Page
17
CITY OF ALBANY ANNUAL FINANCIAL REPORT 2020
Notes to the Financial Statementsffoorr tthhee yyeeaarr eennddeedd 3300 JJuunnee 22002200
55.. TTRRAADDEE RREECCEEIIVVAABBLLEESS2020 2019
$ $CCuurrrreennttRates receivable 1,563,378 1,240,591Sundry receivables 710,361 1,516,467Allowance for impairment of receivables (97,474) (12,843)GST receivable 288,315 290,181TToottaall ccuurrrreenntt ttrraaddee rreecceeiivvaabblleess 2,464,580 3,034,396NNoonn--ccuurrrreennttPensioner's rates and ESL deferred 682,477 626,728TToottaall nnoonn--ccuurrrreenntt ttrraaddee rreecceeiivvaabblleess 682,477 626,728
SSIIGGNNIIFFIICCAANNTT AACCCCOOUUNNTTIINNGG PPOOLLIICCIIEESSTTrraaddee aanndd ootthheerr rreecceeiivvaabblleess
IImmppaaiirrmmeenntt aanndd rriisskk eexxppoossuurree
CCllaassssiiffiiccaattiioonn aanndd ssuubbsseeqquueenntt mmeeaassuurreemmeenntt
Trade and other receivables include amounts due from ratepayers for unpaid rates and service charges and other amounts due from third parties for goods sold and services performed in the ordinary course of business. Trade receivables are recognised at original invoice amount less any allowances for uncollectible amounts (i.e. impairment). The carrying amount of net trade receivables is equivalent to fair value as it is due for settlement within 30 days.
Information about the impairment of trade receivables and their exposure to credit risk and interest rate risk can be found in Note 30.
Receivables expected to be collected within 12 months of the end of the reporting period are classified as current assets. All other receivables are classified as non-current assets. Trade receivables are held with the objective to collect the contractual cashflows and therefore measures them subsequently at amortised cost using the effective interest rate method. Due to the short term nature of current receivables, their carrying amount is considered to be the same as their fair value. Non-current receivables are indexed to inflation, any difference between the face value and fair value is considered immaterial.
Page 18
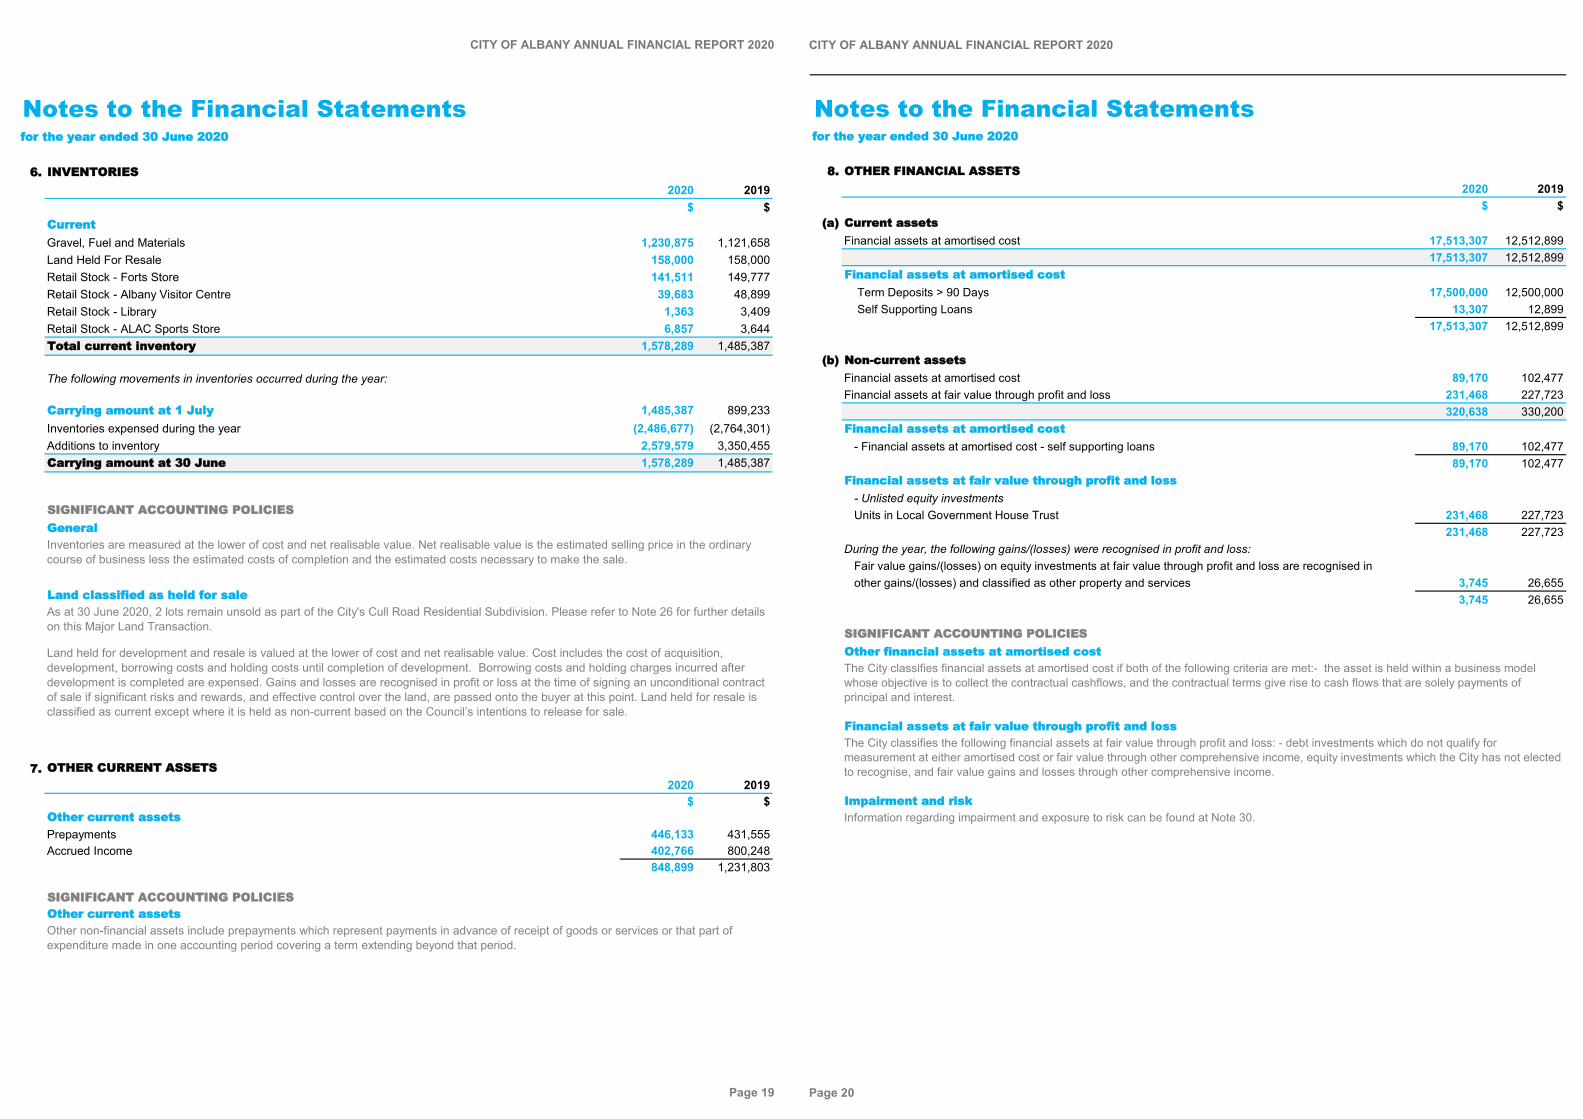
CITY OF ALBANY ANNUAL FINANCIAL REPORT 2020
Notes to the Financial Statementsffoorr tthhee yyeeaarr eennddeedd 3300 JJuunnee 22002200
66.. IINNVVEENNTTOORRIIEESS2020 2019
$ $CCuurrrreennttGravel, Fuel and Materials 1,230,875 1,121,658Land Held For Resale 158,000 158,000Retail Stock - Forts Store 141,511 149,777Retail Stock - Albany Visitor Centre 39,683 48,899Retail Stock - Library 1,363 3,409Retail Stock - ALAC Sports Store 6,857 3,644TToottaall ccuurrrreenntt iinnvveennttoorryy 1,578,289 1,485,387
The following movements in inventories occurred during the year:
CCaarrrryyiinngg aammoouunntt aatt 11 JJuullyy 1,485,387 899,233Inventories expensed during the year (2,486,677) (2,764,301)Additions to inventory 2,579,579 3,350,455CCaarrrryyiinngg aammoouunntt aatt 3300 JJuunnee 1,578,289 1,485,387
SSIIGGNNIIFFIICCAANNTT AACCCCOOUUNNTTIINNGG PPOOLLIICCIIEESSGGeenneerraall
LLaanndd ccllaassssiiffiieedd aass hheelldd ffoorr ssaallee
77.. OOTTHHEERR CCUURRRREENNTT AASSSSEETTSS2020 2019
$ $OOtthheerr ccuurrrreenntt aasssseettssPrepayments 446,133 431,555Accrued Income 402,766 800,248
848,899 1,231,803
SSIIGGNNIIFFIICCAANNTT AACCCCOOUUNNTTIINNGG PPOOLLIICCIIEESSOOtthheerr ccuurrrreenntt aasssseettssOther non-financial assets include prepayments which represent payments in advance of receipt of goods or services or that part of expenditure made in one accounting period covering a term extending beyond that period.
Inventories are measured at the lower of cost and net realisable value. Net realisable value is the estimated selling price in the ordinary course of business less the estimated costs of completion and the estimated costs necessary to make the sale.
Land held for development and resale is valued at the lower of cost and net realisable value. Cost includes the cost of acquisition, development, borrowing costs and holding costs until completion of development. Borrowing costs and holding charges incurred after development is completed are expensed. Gains and losses are recognised in profit or loss at the time of signing an unconditional contract of sale if significant risks and rewards, and effective control over the land, are passed onto the buyer at this point. Land held for resale is classified as current except where it is held as non-current based on the Council’s intentions to release for sale.
As at 30 June 2020, 2 lots remain unsold as part of the City's Cull Road Residential Subdivision. Please refer to Note 26 for further details on this Major Land Transaction.
Page 19
CITY OF ALBANY ANNUAL FINANCIAL REPORT 2020
Notes to the Financial Statementsffoorr tthhee yyeeaarr eennddeedd 3300 JJuunnee 22002200
88.. OOTTHHEERR FFIINNAANNCCIIAALL AASSSSEETTSS2020 2019
$ $((aa)) CCuurrrreenntt aasssseettss
Financial assets at amortised cost 17,513,307 12,512,89917,513,307 12,512,899
FFiinnaanncciiaall aasssseettss aatt aammoorrttiisseedd ccoosstt Term Deposits > 90 Days 17,500,000 12,500,000 Self Supporting Loans 13,307 12,899
17,513,307 12,512,899
((bb)) NNoonn--ccuurrrreenntt aasssseettssFinancial assets at amortised cost 89,170 102,477Financial assets at fair value through profit and loss 231,468 227,723
320,638 330,200FFiinnaanncciiaall aasssseettss aatt aammoorrttiisseedd ccoosstt
- Financial assets at amortised cost - self supporting loans 89,170 102,47789,170 102,477
FFiinnaanncciiaall aasssseettss aatt ffaaiirr vvaalluuee tthhrroouugghh pprrooffiitt aanndd lloossss- Unlisted equity investmentsUnits in Local Government House Trust 231,468 227,723
231,468 227,723During the year, the following gains/(losses) were recognised in profit and loss:
Fair value gains/(losses) on equity investments at fair value through profit and loss are recognised inother gains/(losses) and classified as other property and services 3,745 26,655
3,745 26,655
SSIIGGNNIIFFIICCAANNTT AACCCCOOUUNNTTIINNGG PPOOLLIICCIIEESSOOtthheerr ffiinnaanncciiaall aasssseettss aatt aammoorrttiisseedd ccoosstt
FFiinnaanncciiaall aasssseettss aatt ffaaiirr vvaalluuee tthhrroouugghh pprrooffiitt aanndd lloossss
IImmppaaiirrmmeenntt aanndd rriisskk
The City classifies financial assets at amortised cost if both of the following criteria are met:- the asset is held within a business model whose objective is to collect the contractual cashflows, and the contractual terms give rise to cash flows that are solely payments of principal and interest.
The City classifies the following financial assets at fair value through profit and loss: - debt investments which do not qualify for measurement at either amortised cost or fair value through other comprehensive income, equity investments which the City has not elected to recognise, and fair value gains and losses through other comprehensive income.
Information regarding impairment and exposure to risk can be found at Note 30.
Page 20

CIT
Y O
F A
LBA
NY
AN
NU
AL
FIN
AN
CIA
L R
EPO
RT
2020
Not
es t
o th
e Fi
nanc
ial S
tate
men
tsffoo
rr tthh
ee yyee
aarr ee
nnddeedd
3300
JJuunnee
220022
00
99..PP
RROO
PPEE
RRTT
YY,, PP
LLAANN
TT AA
NNDD
EEQQ
UUIIPP
MMEE
NNTT
((aa))
MMoovv
eemmeenn
ttss iinn
CCaarr
rryyiinn
gg AA
mmoouu
nnttss
Land
- fr
eeho
ld la
nd
Land
- ve
sted
in
and
unde
r the
co
ntro
l of
Cou
ncil
Land
- To
tal
Bui
ldin
gsTo
tal
build
ings
Tota
l lan
d an
d bu
ildin
gsFu
rnitu
re a
nd
equi
pmen
tPl
ant a
nd
equi
pmen
tPa
intin
gsW
ork
in
prog
ress
at c
ost
Tota
l pro
pert
y, p
lant
an
d eq
uipm
ent
$$
$$
$$
$$
$$
$
BBaall
aannccee
aatt
11 JJuu
llyy 22
001188
63,3
77,3
001,
015,
100
64,3
92,4
0082
,657
,389
82,6
57,3
8914
7,04
9,78
93,
801,
843
15,3
23,4
6574
0,38
21,
410,
687
168,
326,
166
Addi
tions
994,
313
-99
4,31
32,
400,
278
2,40
0,27
83,
394,
591
502,
421
1,09
5,79
2-
2,08
5,44
77,
078,
251
(Dis
posa
ls)
--
--
--
-(6
72,7
23)
--
(672
,723
)
(Los
s) o
n as
sets
exp
ense
d-
--
--
-(8
,639
)(4
5,03
8)-
-(5
3,67
7)
(Los
s) o
n as
sets
writ
ten
off
--
--
--
--
-(1
0,96
9)(1
0,96
9)
Dep
reci
atio
n (e
xpen
se)
--
-(2
,606
,778
)(2
,606
,778
)(2
,606
,778
)(9
93,3
64)
(1,6
35,0
75)
--
(5,2
35,2
17)
Tran
sfer
s-
--
278,
480
278,
480
278,
480
-82
,341
-(3
60,8
21)
-CC
aarrrryy
iinngg
aammoouu
nntt aa
tt 3300
JJuunn
ee 2200
119964
,371
,613
1,01
5,10
065
,386
,713
82,7
29,3
6982
,729
,369
148,
116,
082
3,30
2,26
114
,148
,762
740,
382
3,12
4,34
416
9,43
1,83
1
CCoomm
pprriiss
eess::
Gro
ss c
arry
ing
amou
nt a
t 30
June
201
964
,371
,613
1,01
5,10
065
,386
,713
143,
168,
682
143,
168,
682
208,
555,
395
6,42
8,25
918
,711
,037
740,
382
3,12
4,34
423
7,55
9,41
7Ac
cum
ulat
ed d
epre
ciat
ion
at 3
0 Ju
ne 2
019
--
-(6
0,43
9,31
3)(6
0,43
9,31
3)(6
0,43
9,31
3)(3
,125
,998
)(4
,562
,275
)-
-(6
8,12
7,58
6)CC
aarrrryy
iinngg
aammoouu
nntt aa
tt 3300
JJuunn
ee 2200
119964
,371
,613
1,01
5,10
065
,386
,713
82,7
29,3
6982
,729
,369
148,
116,
082
3,30
2,26
114
,148
,762
740,
382
3,12
4,34
416
9,43
1,83
1
Cha
nge
in a
ccou
ntin
g po
licy
-(1
,015
,100
)(1
,015
,100
)-
-(1
,015
,100
)-
--
-(1
,015
,100
)CC
aarrrryy
iinngg
aammoouu
nntt aa
tt 11
JJuullyy
220011
9964
,371
,613
-64
,371
,613
82,7
29,3
6982
,729
,369
147,
100,
982
3,30
2,26
114
,148
,762
740,
382
3,12
4,34
416
8,41
6,73
1
Addi
tions
1,81
8-
1,81
81,
591,
955
1,59
1,95
51,
593,
773
988,
898
2,63
5,62
7-
2,06
1,88
97,
280,
187
(Dis
posa
ls)
--
--
--
-(7
87,2
01)
--
(787
,201
)
Dep
reci
atio
n (e
xpen
se)
--
-(2
,657
,396
)(2
,657
,396
)(2
,657
,396
)(9
18,4
48)
(1,5
75,7
37)
--
(5,1
51,5
81)
Tran
sfer
s-
--
2,67
2,97
32,
672,
973
2,67
2,97
329
,255
118,
436
-(2
,820
,664
)-
CCaarr
rryyiinn
gg aamm
oouunntt
aatt
3300 JJ
uunnee
22002200
64,3
73,4
31-
64,3
73,4
3184
,336
,901
84,3
36,9
0114
8,71
0,33
23,
401,
966
14,5
39,8
8774
0,38
22,
365,
569
169,
758,
136
CCoomm
pprriiss
eess::
Gro
ss c
arry
ing
amou
nt a
t 30
June
202
064
,373
,431
-64
,373
,431
147,
433,
610
147,
433,
610
211,
807,
041
7,44
6,41
320
,128
,668
740,
382
2,36
5,56
924
2,48
8,07
3Ac
cum
ulat
ed d
epre
ciat
ion
at 3
0 Ju
ne 2
020
--
-(6
3,09
6,70
9)(6
3,09
6,70
9)(6
3,09
6,70
9)(4
,044
,447
)(5
,588
,781
)-
-(7
2,72
9,93
7)CC
aarrrryy
iinngg
aammoouu
nntt aa
tt 3300
JJuunn
ee 2200
220064
,373
,431
-64
,373
,431
84,3
36,9
0184
,336
,901
148,
710,
332
3,40
1,96
614
,539
,887
740,
382
2,36
5,56
916
9,75
8,13
6
Mov
emen
t in
the
carr
ying
am
ount
s of
eac
h cl
ass
of p
rope
rty, p
lant
and
equ
ipm
ent b
etw
een
the
begi
nnin
g an
d th
e en
d of
the
curr
ent f
inan
cial
yea
r:
Page
21
CIT
Y O
F A
LBA
NY
AN
NU
AL
FIN
AN
CIA
L R
EPO
RT
2020
Not
es t
o th
e Fi
nanc
ial S
tate
men
tsffoo
rr tthh
ee yyee
aarr ee
nnddeedd
3300
JJuunnee
220022
00
99..PP
RROO
PPEE
RRTT
YY,, PP
LLAANN
TT AA
NNDD
EEQQ
UUIIPP
MMEE
NNTT
((CC
oonnttii
nnuueedd
))
((bb))
FFaaiirr
VVaall
uuee MM
eeaassuu
rreemm
eennttss
Asse
t Cla
ssFa
ir Va
lue
Hie
rarc
hyVa
luat
ion
Tech
niqu
eB
asis
of V
alua
tion
Dat
e of
Las
t Va
luat
ion
Inpu
ts U
sed
LLaanndd
aanndd
bbuuii
llddiinn
ggss
Land
- fre
ehol
d la
nd2
& 3
Mar
ket A
ppro
ach
usin
g re
cent
ob
serv
able
or e
stim
ated
mar
ket d
ata
for s
imila
r pro
perti
es
Inde
pend
ent R
egis
tere
d Va
luer
s &
Man
agem
ent V
alua
tion
30 J
une
2017
Pric
e pe
r hec
tare
, with
refe
renc
e to
cur
rent
zo
ning
of l
and.
Mar
ket v
alue
s w
ere
used
unl
ess
ther
e w
ere
som
e re
stric
tions
or o
ther
fact
ors
asso
ciat
ed w
ith th
e la
nd.
BBuuii
llddiinn
ggss2
& 3
Mar
ket A
ppro
ach
usin
g re
cent
mar
ket
data
for s
imila
r pro
perti
es. C
ost
Appr
oach
usi
ng d
epre
ciat
ed
repl
acem
ent c
ost
Inde
pend
ent R
egis
tere
d Va
luer
s &
Man
agem
ent V
alua
tion
30 J
une
2017
Dire
ct m
arke
t com
paris
ons
/ pric
e pe
r squ
are
Met
re (L
evel
2) -
rem
aini
ng u
sefu
l life
as
sess
men
ts &
act
ive
mar
ket i
nput
s (L
evel
3)
F Fuurrnn
iittuurr
ee aann
dd eeqq
uuiippmm
eenntt
3C
ost A
ppro
ach
usin
g de
prec
iate
d re
plac
emen
t cos
tIn
depe
nden
t Reg
iste
red
Valu
ers
& M
anag
emen
t Val
uatio
n30
Jun
e 20
16Pu
rcha
se c
osts
of s
imila
r ass
ets
adju
sted
for
curre
nt c
ondi
tion
and
com
para
bilit
y, re
sidu
al
valu
es a
nd re
mai
ning
use
ful l
ife a
sses
smen
ts.
P Pllaa
nntt aa
nndd ee
qquuiipp
mmeenn
tt2
& 3
Mar
ket A
ppro
ach
usin
g re
cent
ob
serv
able
mar
ket d
ata
for s
imila
r as
sets
. Cos
t App
roac
h us
ing
depr
ecia
ted
repl
acem
ent c
ost
Inde
pend
ent R
egis
tere
d Va
luer
s &
Man
agem
ent V
alua
tion
30 J
une
2016
Mar
ket p
rice
per i
tem
, pur
chas
e co
sts
of s
imila
r as
sets
adj
uste
d fo
r con
ditio
n an
d co
mpa
rabi
lity,
re
sidu
al v
alue
s, a
nd re
mai
ning
use
ful l
ife
asse
ssm
ents
.
PPaaii
nnttiinn
ggss3
Mar
ket A
ppro
ach
usin
g re
cent
auc
tion
info
rmat
ion
for s
imila
r pie
ces
of a
rtwor
kIn
depe
nden
t Reg
iste
red
Valu
ers
& M
anag
emen
t Val
uatio
n30
Jun
e 20
18R
ecen
t Auc
tion
Sale
s
Leve
l 3 in
puts
are
bas
ed o
n as
sum
ptio
ns w
ith re
gard
s to
futu
re v
alue
s an
d pa
ttern
s of
con
sum
ptio
n ut
ilisin
g cu
rren
t inf
orm
atio
n. If
the
basi
s of
thes
e as
sum
ptio
ns w
ere
varie
d,
they
hav
e th
e po
tent
ial t
o re
sult
in a
sig
nific
antly
hig
her o
r low
er fa
ir va
lue
mea
sure
men
t.
Dur
ing
the
perio
d th
ere
wer
e no
cha
nges
in th
e va
luat
ion
tech
niqu
es u
sed
by th
e lo
cal g
over
nmen
t to
dete
rmin
e th
e fa
ir va
lue
of p
rope
rty, p
lant
and
equ
ipm
ent u
sing
eith
er
leve
l 2 o
r lev
el 3
inpu
ts.
Follo
win
g a
chan
ge to
Loc
al G
over
nmen
t (Fi
nanc
ial M
anag
emen
t) R
egul
atio
n 17
A, p
lant
and
equ
ipm
ent t
ype
asse
ts (b
eing
pla
nt a
nd e
quip
men
t and
furn
iture
and
equ
ipm
ent)
are
to b
e m
easu
red
unde
r the
cos
t mod
el, r
athe
r tha
n at
fair
valu
e. T
his
chan
ge is
effe
ctiv
e fro
m 1
Jul
y 20
19 a
nd re
pres
ents
a c
hang
e in
acc
ount
ing
polic
y.R
eval
uatio
ns c
arrie
d ou
t pre
viou
sly
wer
e no
t rev
erse
d as
it w
as d
eem
ed fa
ir va
lue
appr
oxim
ates
cos
t at t
he d
ate
of c
hang
e.
Page
22

CIT
Y O
F A
LBA
NY
AN
NU
AL
FIN
AN
CIA
L R
EPO
RT
2020
Not
es t
o th
e Fi
nanc
ial S
tate
men
tsffoo
rr tthh
ee yyee
aarr ee
nnddeedd
3300
JJuunnee
220022
00
1100..
IINNFFRR
AASS
TTRR
UUCC
TTUU
RREE
((aa))
MMoovv
eemmeenn
ttss iinn
CCaarr
rryyiinn
gg AA
mmoouu
nnttss
Mov
emen
t in
the
carr
ying
am
ount
s of
eac
h cl
ass
of in
frast
ruct
ure
betw
een
the
begi
nnin
g an
d th
e en
d of
the
curr
ent f
inan
cial
yea
r.
Roa
dsFo
otpa
ths
Dra
inag
ePa
rks,
Gar
dens
&
Res
erve
sO
ther
Wor
k in
pro
gres
s at
cos
tTo
tal
Infr
astr
uctu
re$
$$
$$
$$
BBaall
aannccee
aatt
11 JJuu
llyy 22
001188
220,
376,
187
23,5
80,4
2551
,094
,012
31,3
82,3
0668
,786
,694
4,37
7,14
039
9,59
6,76
4
Addi
tions
5,34
6,85
029
7,24
21,
495,
518
476,
085
2,39
5,26
64,
519,
917
14,5
30,8
78
(Los
s) o
n as
sets
writ
ten
off
--
--
-(2
62,1
29)
(262
,129
)
Dep
reci
atio
n (e
xpen
se)
(5,8
27,1
90)
(613
,266
)(1
,067
,531
)(1
,431
,541
)(2
,006
,898
)-
(10,
946,
426)
Tran
sfer
s2,
179,
023
511,
668
-56
,687
117,
731
(2,8
65,1
09)
-CC
aarrrryy
iinngg
aammoouu
nntt aa
tt 3300
JJuunn
ee 2200
119922
2,07
4,87
023
,776
,069
51,5
21,9
9930
,483
,537
69,2
92,7
935,
769,
819
402,
919,
087
CCoomm
pprriiss
eess::
Gro
ss c
arry
ing
amou
nt a
t 30
June
201
936
6,95
7,44
131
,724
,380
86,0
65,1
5751
,132
,060
104,
316,
027
5,76
9,81
964
5,96
4,88
4Ac
cum
ulat
ed d
epre
ciat
ion
at 3
0 Ju
ne 2
019
(144
,882
,571
)(7
,948
,311
)(3
4,54
3,15
8)(2
0,64
8,52
3)(3
5,02
3,23
4)-
(243
,045
,797
)CC
aarrrryy
iinngg
aammoouu
nntt aa
tt 3300
JJuunn
ee 2200
119922
2,07
4,87
023
,776
,069
51,5
21,9
9930
,483
,537
69,2
92,7
935,
769,
819
402,
919,
087
Addi
tions
5,47
8,69
358
9,00
418
6,45
61,
517,
787
1,01
7,38
34,
020,
381
12,8
09,7
04
Dep
reci
atio
n (e
xpen
se)
(6,1
60,0
55)
(635
,653
)(1
,095
,753
)(1
,469
,630
)(2
,090
,091
)-
(11,
451,
182)
Tran
sfer
s(1
74,7
35)
(60,
982)
794,
121
3,84
2,32
119
7,52
5(4
,598
,250
)-
CCaarr
rryyiinn
gg aamm
oouunntt
aatt
3300 JJ
uunnee
22002200
221,
218,
773
23,6
68,4
3851
,406
,823
34,3
74,0
1568
,417
,610
5,19
1,95
040
4,27
7,60
9
CCoomm
pprriiss
eess::
Gro
ss c
arry
ing
amou
nt a
t 30
June
202
037
2,26
1,39
932
,252
,402
87,0
45,7
3456
,492
,168
105,
530,
935
5,19
1,95
065
8,77
4,58
8Ac
cum
ulat
ed d
epre
ciat
ion
at 3
0 Ju
ne 2
020
(151
,042
,626
)(8
,583
,964
)(3
5,63
8,91
1)(2
2,11
8,15
3)(3
7,11
3,32
5)-
(254
,496
,979
)CC
aarrrryy
iinngg
aammoouu
nntt aa
tt 3300
JJuunn
ee 2200
220022
1,21
8,77
323
,668
,438
51,4
06,8
2334
,374
,015
68,4
17,6
105,
191,
950
404,
277,
609
Page
23
CIT
Y O
F A
LBA
NY
AN
NU
AL
FIN
AN
CIA
L R
EPO
RT
2020
Not
es t
o th
e Fi
nanc
ial S
tate
men
tsffoo
rr tthh
ee yyee
aarr ee
nnddeedd
3300
JJuunnee
220022
00
1100..
IINNFFRR
AASS
TTRR
UUCC
TTUU
RREE
((CC
oonnttii
nnuueedd
))
((bb))
FFaaiirr
VVaall
uuee MM
eeaassuu
rreemm
eennttss
Ass
et C
lass
Fair
Valu
e H
iera
rchy
Valu
atio
n Te
chni
que
Bas
is o
f Val
uatio
nD
ate
of L
ast
Valu
atio
nIn
puts
Use
d
RRooaa
ddss3
Cos
t App
roac
h us
ing
depr
ecia
ted
repl
acem
ent c
ost
Man
agem
ent V
alua
tion
30 J
une
2018
Con
stru
ctio
n C
osts
And
Cur
rent
Con
ditio
n,
Res
idua
l Val
ues
And
Rem
aini
ng U
sefu
l Life
As
sess
men
ts In
puts
.
F Foooott
ppaatthh
ss3
Cos
t App
roac
h us
ing
depr
ecia
ted
repl
acem
ent c
ost
Man
agem
ent V
alua
tion
30 J
une
2018
Con
stru
ctio
n C
osts
And
Cur
rent
Con
ditio
n,
Res
idua
l Val
ues
And
Rem
aini
ng U
sefu
l Life
As
sess
men
ts In
puts
.
DDrraa
iinnaagg
ee3
Cos
t App
roac
h us
ing
depr
ecia
ted
repl
acem
ent c
ost
Man
agem
ent V
alua
tion
30 J
une
2018
Con
stru
ctio
n C
osts
And
Cur
rent
Con
ditio
n,
Res
idua
l Val
ues
And
Rem
aini
ng U
sefu
l Life
As
sess
men
ts In
puts
.
PPaarr
kkss,, GG
aarrddee
nnss &&
RReess
eerrvvee
ss3
Cos
t App
roac
h us
ing
depr
ecia
ted
repl
acem
ent c
ost
Man
agem
ent V
alua
tion
30 J
une
2018
Con
stru
ctio
n C
osts
And
Cur
rent
Con
ditio
n,
Res
idua
l Val
ues
And
Rem
aini
ng U
sefu
l Life
As
sess
men
ts In
puts
.
OOtthh
eerr3
Cos
t App
roac
h us
ing
depr
ecia
ted
repl
acem
ent c
ost
Man
agem
ent V
alua
tion
30 J
une
2018
Con
stru
ctio
n C
osts
And
Cur
rent
Con
ditio
n,
Res
idua
l Val
ues
And
Rem
aini
ng U
sefu
l Life
As
sess
men
ts In
puts
.
Leve
l 3 in
puts
are
bas
ed o
n as
sum
ptio
ns w
ith re
gard
s to
futu
re v
alue
s an
d pa
ttern
s of
con
sum
ptio
n ut
ilisin
g cu
rren
t inf
orm
atio
n. If
the
basi
s of
thes
e as
sum
ptio
ns w
ere
varie
d, th
eyha
ve th
e po
tent
ial t
o re
sult
in a
sig
nific
antly
hig
her o
r low
er fa
ir va
lue
mea
sure
men
t.
Dur
ing
the
perio
d th
ere
wer
e no
cha
nges
in th
e va
luat
ion
tech
niqu
es u
sed
to d
eter
min
e th
e fa
ir va
lue
of in
frast
ruct
ure
usin
g le
vel 3
inpu
ts.
Page
24
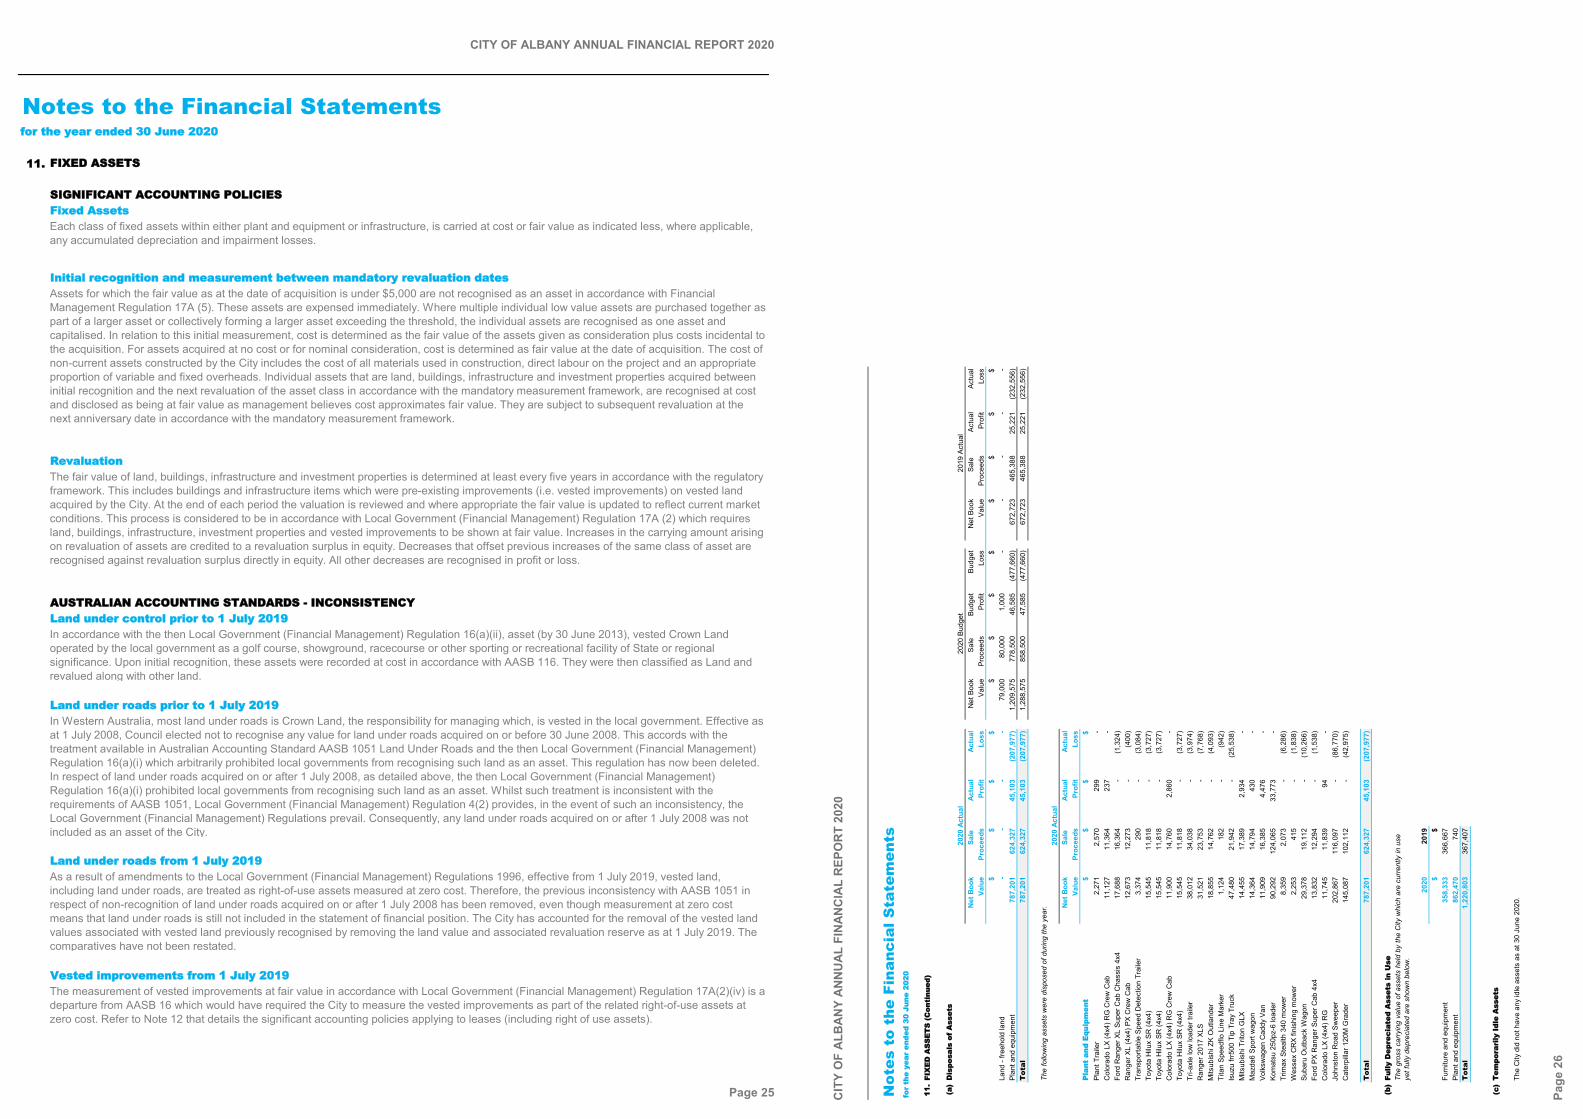
CITY OF ALBANY ANNUAL FINANCIAL REPORT 2020
Notes to the Financial Statementsffoorr tthhee yyeeaarr eennddeedd 3300 JJuunnee 22002200
1111.. FFIIXXEEDD AASSSSEETTSS
SSIIGGNNIIFFIICCAANNTT AACCCCOOUUNNTTIINNGG PPOOLLIICCIIEESSFFiixxeedd AAsssseettssEach class of fixed assets within either plant and equipment or infrastructure, is carried at cost or fair value as indicated less, where applicable, any accumulated depreciation and impairment losses.
IInniittiiaall rreeccooggnniittiioonn aanndd mmeeaassuurreemmeenntt bbeettwweeeenn mmaannddaattoorryy rreevvaalluuaattiioonn ddaatteessAssets for which the fair value as at the date of acquisition is under $5,000 are not recognised as an asset in accordance with Financial Management Regulation 17A (5). These assets are expensed immediately. Where multiple individual low value assets are purchased together as part of a larger asset or collectively forming a larger asset exceeding the threshold, the individual assets are recognised as one asset and capitalised. In relation to this initial measurement, cost is determined as the fair value of the assets given as consideration plus costs incidental to the acquisition. For assets acquired at no cost or for nominal consideration, cost is determined as fair value at the date of acquisition. The cost of non-current assets constructed by the City includes the cost of all materials used in construction, direct labour on the project and an appropriate proportion of variable and fixed overheads. Individual assets that are land, buildings, infrastructure and investment properties acquired between initial recognition and the next revaluation of the asset class in accordance with the mandatory measurement framework, are recognised at cost and disclosed as being at fair value as management believes cost approximates fair value. They are subject to subsequent revaluation at the next anniversary date in accordance with the mandatory measurement framework.
RReevvaalluuaattiioonnThe fair value of land, buildings, infrastructure and investment properties is determined at least every five years in accordance with the regulatory framework. This includes buildings and infrastructure items which were pre-existing improvements (i.e. vested improvements) on vested land acquired by the City. At the end of each period the valuation is reviewed and where appropriate the fair value is updated to reflect current market conditions. This process is considered to be in accordance with Local Government (Financial Management) Regulation 17A (2) which requires land, buildings, infrastructure, investment properties and vested improvements to be shown at fair value. Increases in the carrying amount arising on revaluation of assets are credited to a revaluation surplus in equity. Decreases that offset previous increases of the same class of asset are recognised against revaluation surplus directly in equity. All other decreases are recognised in profit or loss.
AAUUSSTTRRAALLIIAANN AACCCCOOUUNNTTIINNGG SSTTAANNDDAARRDDSS -- IINNCCOONNSSIISSTTEENNCCYYLLaanndd uunnddeerr ccoonnttrrooll pprriioorr ttoo 11 JJuullyy 22001199In accordance with the then Local Government (Financial Management) Regulation 16(a)(ii), asset (by 30 June 2013), vested Crown Land operated by the local government as a golf course, showground, racecourse or other sporting or recreational facility of State or regional significance. Upon initial recognition, these assets were recorded at cost in accordance with AASB 116. They were then classified as Land and revalued along with other land.
LLaanndd uunnddeerr rrooaaddss pprriioorr ttoo 11 JJuullyy 22001199In Western Australia, most land under roads is Crown Land, the responsibility for managing which, is vested in the local government. Effective as at 1 July 2008, Council elected not to recognise any value for land under roads acquired on or before 30 June 2008. This accords with the treatment available in Australian Accounting Standard AASB 1051 Land Under Roads and the then Local Government (Financial Management) Regulation 16(a)(i) which arbitrarily prohibited local governments from recognising such land as an asset. This regulation has now been deleted. In respect of land under roads acquired on or after 1 July 2008, as detailed above, the then Local Government (Financial Management) Regulation 16(a)(i) prohibited local governments from recognising such land as an asset. Whilst such treatment is inconsistent with the requirements of AASB 1051, Local Government (Financial Management) Regulation 4(2) provides, in the event of such an inconsistency, the Local Government (Financial Management) Regulations prevail. Consequently, any land under roads acquired on or after 1 July 2008 was not included as an asset of the City.
LLaanndd uunnddeerr rrooaaddss ffrroomm 11 JJuullyy 22001199As a result of amendments to the Local Government (Financial Management) Regulations 1996, effective from 1 July 2019, vested land, including land under roads, are treated as right-of-use assets measured at zero cost. Therefore, the previous inconsistency with AASB 1051 in respect of non-recognition of land under roads acquired on or after 1 July 2008 has been removed, even though measurement at zero cost means that land under roads is still not included in the statement of financial position. The City has accounted for the removal of the vested land values associated with vested land previously recognised by removing the land value and associated revaluation reserve as at 1 July 2019. The comparatives have not been restated.
VVeesstteedd iimmpprroovveemmeennttss ffrroomm 11 JJuullyy 22001199The measurement of vested improvements at fair value in accordance with Local Government (Financial Management) Regulation 17A(2)(iv) is a departure from AASB 16 which would have required the City to measure the vested improvements as part of the related right-of-use assets at zero cost. Refer to Note 12 that details the significant accounting policies applying to leases (including right of use assets).
Page 25 CIT
Y O
F A
LBA
NY
AN
NU
AL
FIN
AN
CIA
L R
EPO
RT
2020
Not
es t
o th
e Fi
nanc
ial S
tate
men
tsffoo
rr tthh
ee yyee
aarr ee
nnddeedd
3300
JJuunnee
220022
00
1111..
FFIIXX
EEDD
AASS
SSEE
TTSS
((CC
oonnttii
nnuueedd
))
((aa))
DDiiss
ppoossaa
llss oo
ff AA
sssseett
ss
Net
Boo
kSa
le
Actu
alAc
tual
Net
Boo
kSa
le
Budg
etBu
dget
Net
Boo
kSa
le
Actu
alAc
tual
Valu
ePr
ocee
dsPr
ofit
Loss
Valu
ePr
ocee
dsPr
ofit
Loss
Valu
ePr
ocee
dsPr
ofit
Loss
$$
$$
$$
$$
$$
$$
Land
- fre
ehol
d la
nd-
--
-79
,000
80,0
001,
000
--
--
-Pl
ant a
nd e
quip
men
t78
7,20
162
4,32
745
,103
(207
,977
)1,
209,
575
778,
500
46,5
85(4
77,6
60)
672,
723
465,
388
25,2
21(2
32,5
56)
Tot
al78
7,20
162
4,32
745
,103
(207
,977
)1,
288,
575
858,
500
47,5
85(4
77,6
60)
672,
723
465,
388
25,2
21(2
32,5
56)
The
follo
win
g as
sets
wer
e di
spos
ed o
f dur
ing
the
year
. Net
Boo
kSa
le
Actu
alAc
tual
Valu
ePr
ocee
dsPr
ofit
Loss
PPllaa
nntt aa
nndd EE
qquuiipp
mmeenn
tt$
$$
$Pl
ant T
raile
r2,
271
2,57
029
9-
Col
orad
o LX
(4x4
) RG
Cre
w C
ab11
,127
11,3
6423
7-
Ford
Ran
ger X
L Su
per C
ab C
hass
is 4
x417
,688
16,3
64-
(1,3
24)
Ran
ger X
L (4
x4) P
X C
rew
Cab
12,6
7312
,273
-(4
00)
Tran
spor
tabl
e Sp
eed
Det
ectio
n Tr
aile
r3,
374
290
-(3
,084
)To
yota
Hilu
x SR
(4x4
)15
,545
11,8
18-
(3,7
27)
Toyo
ta H
ilux
SR (4
x4)
15,5
4511
,818
-(3
,727
)C
olor
ado
LX (4
x4) R
G C
rew
Cab
11,9
0014
,760
2,86
0-
Toyo
ta H
ilux
SR (4
x4)
15,5
4511
,818
-(3
,727
)Tr
i-axl
e lo
w lo
ader
trai
ler
38,0
1234
,038
-(3
,974
)R
ange
r 201
7 XL
S31
,521
23,7
53-
(7,7
68)
Mits
ubis
hi Z
K O
utla
nder
18,8
5514
,762
-(4
,093
)Ti
tan
Spee
dflo
Lin
e M
arke
r1,
124
182
-(9
42)
Isuz
u frr
500
Tip
Tray
Tru
ck47
,480
21,9
42-
(25,
538)
Mits
ubis
hi T
riton
GLX
14,4
5517
,389
2,93
4-
Maz
da6
Spor
t wag
on14
,364
14,7
9443
0-
Volk
swag
en C
addy
Van
11,9
0916
,385
4,47
6-
Kom
atsu
250
pz-6
load
er90
,292
124,
065
33,7
73-
Trim
ax S
teal
th 3
40 m
ower
8,35
92,
073
-(6
,286
)W
esse
x C
RX
finis
hing
mow
er2,
253
415
-(1
,838
)Su
baru
Out
back
Wag
on29
,378
19,1
12-
(10,
266)
Ford
PX
Ran
ger S
uper
Cab
4x4
13,8
3212
,294
-(1
,538
)C
olor
ado
LX (4
x4) R
G11
,745
11,8
3994
-Jo
hnst
on R
oad
Swee
per
202,
867
116,
097
-(8
6,77
0)C
ater
pilla
r 120
M G
rade
r14
5,08
710
2,11
2-
(42,
975)
Tot
al78
7,20
162
4,32
745
,103
(207
,977
)
((bb))
FFuullllyy
DDeepp
rreeccii
aatteedd
AAssss
eettss
iinn UU
ssee
2020
2019
$$
Furn
iture
and
equ
ipm
ent
358,
333
366,
667
Plan
t and
equ
ipm
ent
862,
470
740
Tot
al1,
220,
803
367,
407
((cc))
TTeemm
ppoorraa
rriillyy
IIddll
ee AA
sssseett
ss
The
City
did
not
hav
e an
y id
le a
sset
s as
at 3
0 Ju
ne 2
020.
2020
Act
ual
2020
Bud
get
2019
Act
ual
2020
Act
ual
The
gros
s ca
rryi
ng v
alue
of a
sset
s he
ld b
y th
e C
ity w
hich
are
cur
rent
ly in
use
ye
t ful
ly d
epre
ciat
ed a
re s
how
n be
low
.
Page
26

CITY OF ALBANY ANNUAL FINANCIAL REPORT 2020
Notes to the Financial Statementsffoorr tthhee yyeeaarr eennddeedd 3300 JJuunnee 22002200
1111.. FFIIXXEEDD AASSSSEETTSS ((CCoonnttiinnuueedd))
((dd)) DDeepprreecciiaattiioonn 2020 2020 2019Actual Budget Actual
$ $ $Buildings 2,657,396 2,623,661 2,606,778Furniture and equipment 918,448 986,513 993,364Plant and equipment 1,575,737 1,653,446 1,635,075Right of use assets 174,837 - -Infrastructure - Roads 6,160,055 5,664,841 5,827,190Infrastructure - Footpaths 635,653 584,552 613,266Infrastructure - Drainage 1,095,753 1,007,664 1,067,531Infrastructure - Parks, Gardens & Reserves 1,469,630 1,351,485 1,431,541Infrastructure - Other 2,090,091 1,922,066 2,006,898TToottaall DDeepprreecciiaattiioonn 16,777,600 15,794,228 16,181,643
SSIIGGNNIIFFIICCAANNTT AACCCCOOUUNNTTIINNGG PPOOLLIICCIIEESSDDeepprreecciiaattiioonn
DDeepprreecciiaattiioonn rraatteess
Asset Class Useful lifeBuildings: - Heritage Buildings 60 to 145 years - Contemporary Buildings 40 to 145 years - Sheds/Minor Structures/Public Toilets 40 to 60 yearsFurniture and equipment 2 to 10 yearsPlant and equipment 2 to 15 yearsSealed roads and streets: - formation not depreciated - pavement 60 to 90 years - surface: single chip seal 8 to 10 years - surface: double chip seal 20 to 30 years - surface: asphalt 30 to 40 yearsKerbing 30 to 60 yearsGravel roads: - formation not depreciated - pavement 60 to 90 yearsFormed roads (unsealed): - formation not depreciated - pavement 60 to 90 yearsFootpaths 30 to 80 yearsMajor Bridges 70 to 100 yearsDrainage 60 to 100 yearsInfrastructure - Parks, Gardens & Reserves 5 to 45 yearsInfrastructure - Other 10 to 70 yearsRight of use based on the remaining lease
The depreciable amount of all fixed assets including buildings but excluding freehold land and vested land, are depreciated on a straight-line basis over the individual asset’s useful life from the time the asset is held ready for use. Leasehold improvements are depreciated over the shorter of either the unexpired period of the lease or the estimated useful life of the improvements. The assets residual values and useful lives are reviewed, and adjusted if appropriate, at the end of each reporting period. An asset's carrying amount is written down immediately to its recoverable amount if the asset's carrying amount is greater than its estimated recoverable amount. Gains and losses on disposals are determined by comparing proceeds with the carrying amount. These gains and losses are included in the statement of comprehensive income in the period in which they arise.
When an asset class is revalued, any accumulated depreciation at the date of the revaluation is treated in one of the following ways:
(a) The gross carrying amount is adjusted in a manner that is consistent with the revaluation of the carrying amount of the asset. For example, the gross carrying amount may be restated by reference to observable market data or it may be restated proportionately to the change in the carrying amount. The accumulated depreciation at the date of the revaluation is adjusted to equal the difference between the gross carrying amount and the carrying amount of the asset after taking into account accumulated impairment losses; or
(b) Eliminated against the gross carrying amount of the asset and the net amount restated to the revalued amount of the asset.
Typical estimated useful lives for the different asset classes for the current and prior years are included in the table below:
Page 27
CITY OF ALBANY ANNUAL FINANCIAL REPORT 2020
Notes to the Financial Statementsffoorr tthhee yyeeaarr eennddeedd 3300 JJuunnee 22002200
1122.. LLEEAASSEESS
((aa)) RRiigghhtt ooff UUssee AAsssseettss
Right of use assets - plant
and equipment
Right of use assets Total
$ $Carrying amount at 30 June 2019 - -
Recognised on initial application of AASB 16 (1 July 2019) 1,331,930 1,331,930Restated total equity at the beginning of the financial year 1,331,930 1,331,930
-Depreciation (expense) (174,837) (174,837)Carrying amount at 30 June 2020 1,157,093 1,157,093
((bb)) CCaasshh oouuttffllooww ffrroomm RRiigghhtt ooff UUssee AAsssseettss lleeaasseessInterest expense on lease liabilities (20,748) (20,748)Lease principal expense (168,191) (168,191)Total cash outflow from Right of Use Asset leases (188,939) (188,939)
SSIIGGNNIIFFIICCAANNTT AACCCCOOUUNNTTIINNGG PPOOLLIICCIIEESSLLeeaasseess
RRiigghhtt--ooff--uussee aasssseettss -- vvaalluuaattiioonn
RRiigghhtt--ooff--uussee aasssseettss -- ddeepprreecciiaattiioonn
Movement in the carrying amounts of each class of right of use asset between the beginning and the end of the current financial year.
Right of use assets are depreciated over the lease term or useful life of the underlying asset, whichever is the shortest. Where a lease transfers ownership of the underlying asset, or the cost of the right of use asset reflects that the City anticipates to exercise a purchase option, the specific asset is amortised over the useful life of the underlying asset.
All contracts that are classified as short-term leases (i.e. a lease with a remaining term of 12 months or less) and leases of low value assets are recognised as an operating expense on a straight-line basis over the term of the lease.
Leases for right of use assets are secured over the asset being leased.
The City has two plant and equipment leases that have been recognised as lease liabilities. The term for one of these leases is two years, while the term for the other lease is ten years. One of the leases has a minimum lease payment commitment, with a variable payment component based on cosumption over and above the minimum commitment.
The measurement of lease liabilities does not include any future cash outflows associated with leases not yet commenced to which the City is committed.
The City has not revalued the right of use assets relating to leased plant and equipment as the difference between the fair value and carrying amount is immaterial.
At inception of a contract, the City assesses if the contract contains or is a lease. A contract is, or contains, a lease if the contract conveys the right to control the use of an identified asset for a period of time in exchange for consideration.
At the commencement date, a right of use asset is recognised at cost and lease liability at the present value of the lease payments that are not paid at that date. The lease payments are discounted using the interest rate implicit in the lease, if that rate can be readily determined. If that rate cannot be readily determined, the City uses its incremental borrowing rate.
Right-of-use assets are measured at cost. This means that all right-of-use assets (other than vested improvements) under zero costconcessionary leases are measured at zero cost (i.e. not included in the statement of financialposition). The exception is vested improvements on concessionary land leases such as roads, buildingsor other infrastructure which are reported at fair value. Refer to Note 11 for details on the significant accounting policies applying to vested improvements.
Page 28
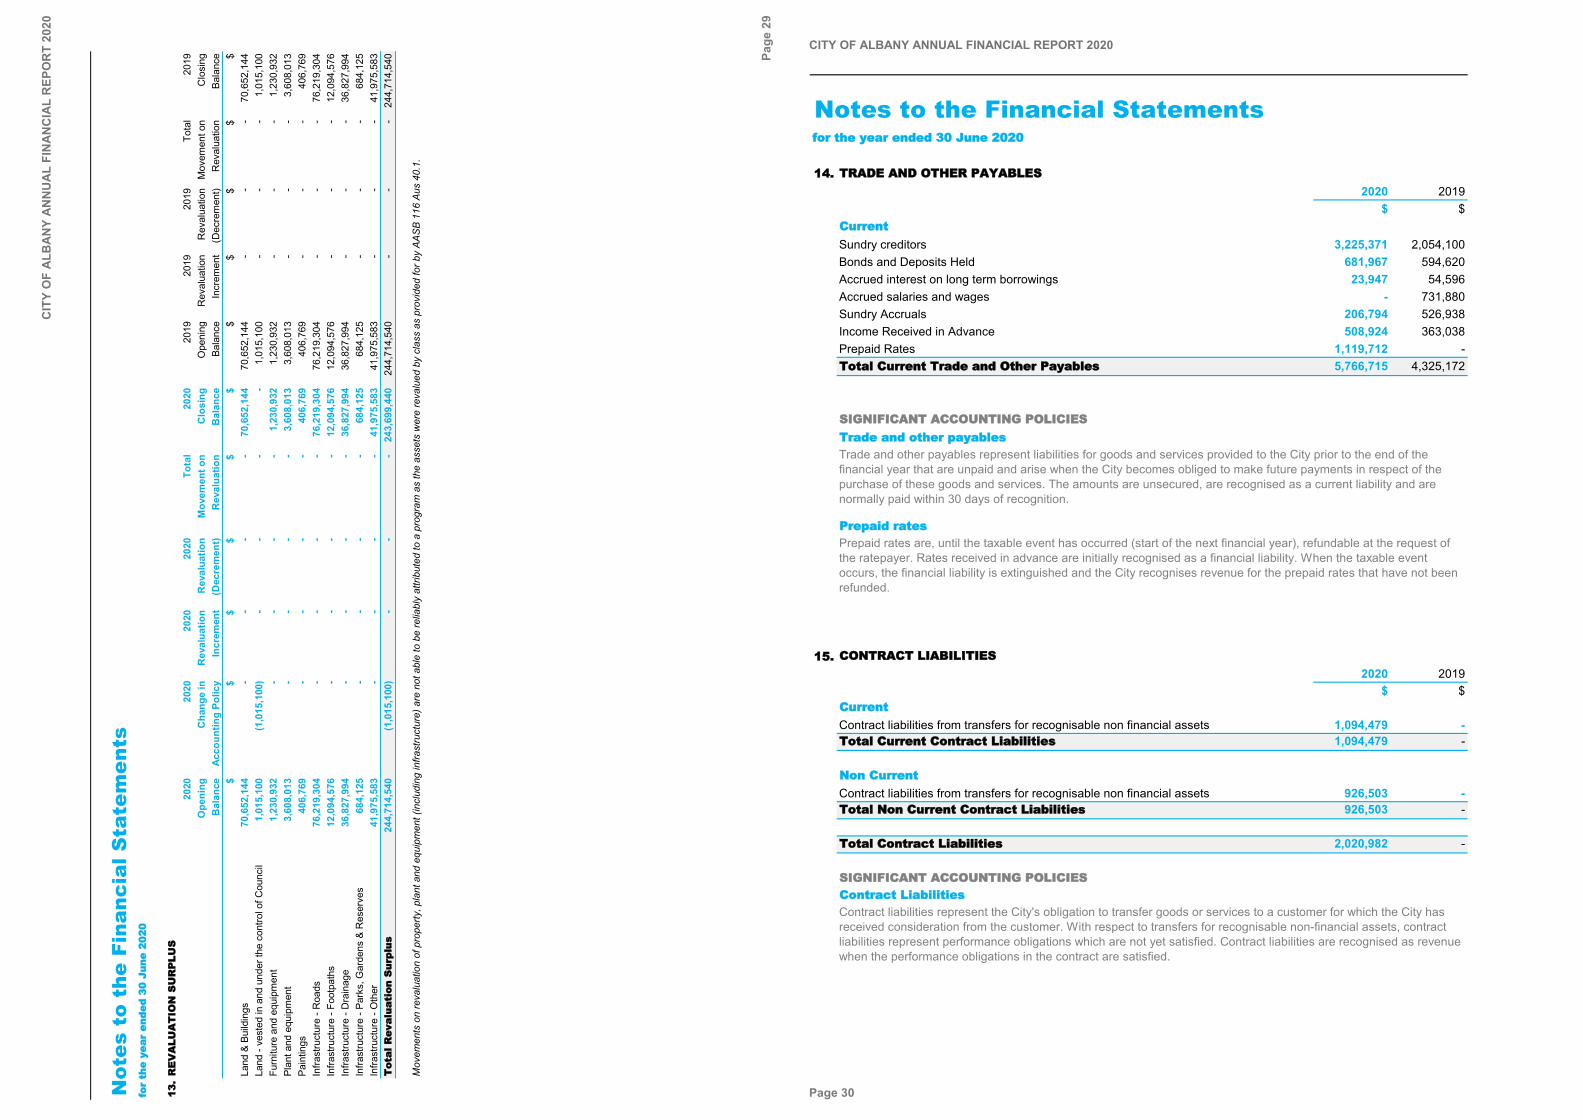
CIT
Y O
F A
LBA
NY
AN
NU
AL
FIN
AN
CIA
L R
EPO
RT
2020
Not
es t
o th
e Fi
nanc
ial S
tate
men
tsffoo
rr tthh
ee yyee
aarr ee
nnddeedd
3300
JJuunnee
220022
00
1133..
RREE
VVAA
LLUUAA
TTIIOO
NN SS
UURR
PPLLUU
SS20
2020
2020
2020
20To
tal
2020
2019
2019
2019
Tota
l20
19O
peni
ngC
hang
e in
Rev
alua
tion
Rev
alua
tion
Mov
emen
t on
Clo
sing
Ope
ning
Rev
alua
tion
Rev
alua
tion
Mov
emen
t on
Clo
sing
Bal
ance
Acc
ount
ing
Polic
yIn
crem
ent
(Dec
rem
ent)
Rev
alua
tion
Bal
ance
Bala
nce
Incr
emen
t(D
ecre
men
t)R
eval
uatio
nBa
lanc
e$
$$
$$
$$
$$
$$
Land
& B
uild
ings
70,6
52,1
44-
--
-70
,652
,144
70,6
52,1
44-
--
70,6
52,1
44La
nd -
vest
ed in
and
und
er th
e co
ntro
l of C
ounc
il1,
015,
100
(1,0
15,1
00)
--
--
1,01
5,10
0-
--
1,01
5,10
0Fu
rnitu
re a
nd e
quip
men
t1,
230,
932
--
--
1,23
0,93
21,
230,
932
--
-1,
230,
932
Plan
t and
equ
ipm
ent
3,60
8,01
3-
--
-3,
608,
013
3,60
8,01
3-
--
3,60
8,01
3Pa
intin
gs40
6,76
9-
--
-40
6,76
940
6,76
9-
--
406,
769
Infra
stru
ctur
e - R
oads
76,2
19,3
04-
--
-76
,219
,304
76,2
19,3
04-
--
76,2
19,3
04In
frast
ruct
ure
- Foo
tpat
hs12
,094
,576
--
--
12,0
94,5
7612
,094
,576
--
-12
,094
,576
Infra
stru
ctur
e - D
rain
age
36,8
27,9
94-
--
-36
,827
,994
36,8
27,9
94-
--
36,8
27,9
94In
frast
ruct
ure
- Par
ks, G
arde
ns &
Res
erve
s68
4,12
5-
--
-68
4,12
568
4,12
5-
--
684,
125
Infra
stru
ctur
e - O
ther
41,9
75,5
83-
--
-41
,975
,583
41,9
75,5
83-
--
41,9
75,5
83TT
oottaall
RReevv
aalluuaa
ttiioonn
SSuurr
pplluuss
244,
714,
540
(1,0
15,1
00)
--
-24
3,69
9,44
024
4,71
4,54
0-
--
244,
714,
540
Mov
emen
ts o
n re
valu
atio
n of
pro
perty
, pla
nt a
nd e
quip
men
t (in
clud
ing
infra
stru
ctur
e) a
re n
ot a
ble
to b
e re
liabl
y at
tribu
ted
to a
pro
gram
as
the
asse
ts w
ere
reva
lued
by
clas
s as
pro
vide
d fo
r by
AASB
116
Aus
40.
1.
Page
29
CITY OF ALBANY ANNUAL FINANCIAL REPORT 2020
Notes to the Financial Statementsffoorr tthhee yyeeaarr eennddeedd 3300 JJuunnee 22002200
1144.. TTRRAADDEE AANNDD OOTTHHEERR PPAAYYAABBLLEESS2020 2019
$ $CCuurrrreennttSundry creditors 3,225,371 2,054,100Bonds and Deposits Held 681,967 594,620Accrued interest on long term borrowings 23,947 54,596Accrued salaries and wages - 731,880Sundry Accruals 206,794 526,938Income Received in Advance 508,924 363,038Prepaid Rates 1,119,712 -TToottaall CCuurrrreenntt TTrraaddee aanndd OOtthheerr PPaayyaabblleess 5,766,715 4,325,172
SSIIGGNNIIFFIICCAANNTT AACCCCOOUUNNTTIINNGG PPOOLLIICCIIEESSTTrraaddee aanndd ootthheerr ppaayyaabblleess
PPrreeppaaiidd rraatteess
1155.. CCOONNTTRRAACCTT LLIIAABBIILLIITTIIEESS2020 2019
$ $CCuurrrreennttContract liabilities from transfers for recognisable non financial assets 1,094,479 -TToottaall CCuurrrreenntt CCoonnttrraacctt LLiiaabbiilliittiieess 1,094,479 -
NNoonn CCuurrrreennttContract liabilities from transfers for recognisable non financial assets 926,503 -TToottaall NNoonn CCuurrrreenntt CCoonnttrraacctt LLiiaabbiilliittiieess 926,503 -
TToottaall CCoonnttrraacctt LLiiaabbiilliittiieess 2,020,982 -
SSIIGGNNIIFFIICCAANNTT AACCCCOOUUNNTTIINNGG PPOOLLIICCIIEESSCCoonnttrraacctt LLiiaabbiilliittiieess
Trade and other payables represent liabilities for goods and services provided to the City prior to the end of the financial year that are unpaid and arise when the City becomes obliged to make future payments in respect of the purchase of these goods and services. The amounts are unsecured, are recognised as a current liability and are normally paid within 30 days of recognition.
Prepaid rates are, until the taxable event has occurred (start of the next financial year), refundable at the request of the ratepayer. Rates received in advance are initially recognised as a financial liability. When the taxable event occurs, the financial liability is extinguished and the City recognises revenue for the prepaid rates that have not been refunded.
Contract liabilities represent the City's obligation to transfer goods or services to a customer for which the City has received consideration from the customer. With respect to transfers for recognisable non-financial assets, contract liabilities represent performance obligations which are not yet satisfied. Contract liabilities are recognised as revenue when the performance obligations in the contract are satisfied.
Page 30
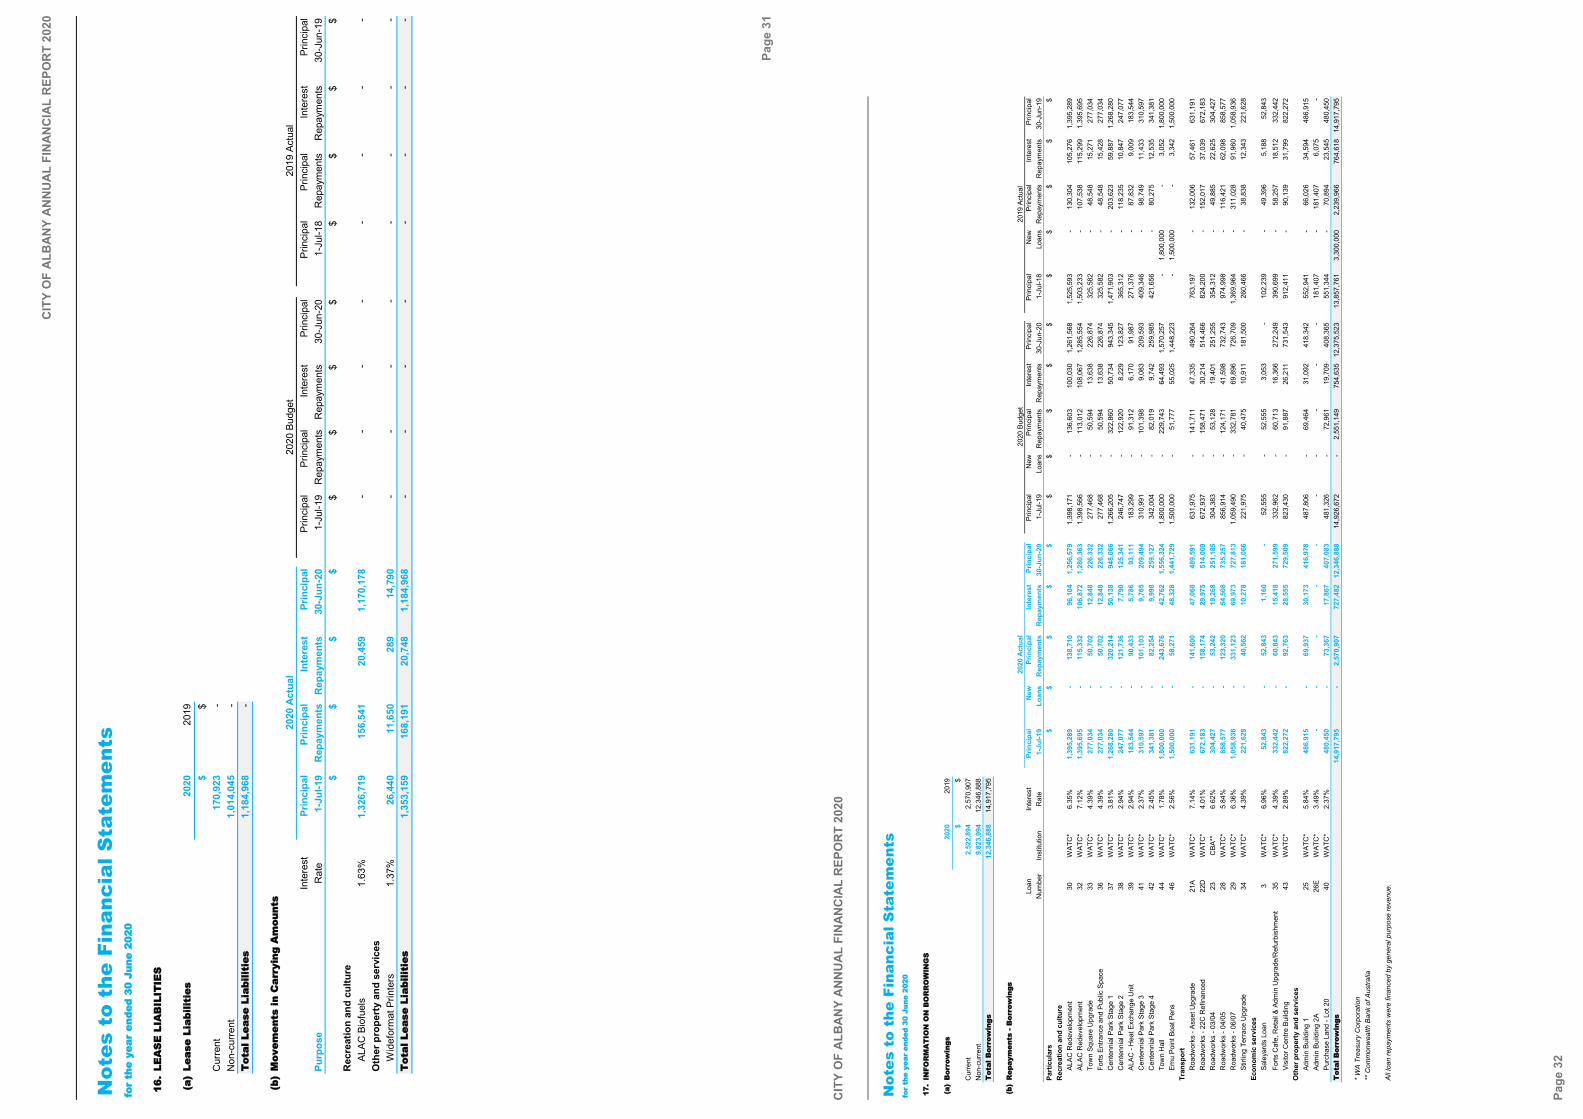
CIT
Y O
F A
LBA
NY
AN
NU
AL
FIN
AN
CIA
L R
EPO
RT
2020
Not
es t
o th
e Fi
nanc
ial S
tate
men
tsffoo
rr tthh
ee yyee
aarr ee
nnddeedd
3300
JJuunnee
220022
00
1166..
LLEEAA
SSEE
LLIIAA
BBIILL
IITTIIEE
SS
((aa))
LLeeaass
ee LLii
aabbiillii
ttiieess
2020
2019
$$
Cur
rent
170,
923
-N
on-c
urre
nt1,
014,
045
-TT
oottaall
LLeeaa
ssee LL
iiaabbii
lliittiiee
ss1,
184,
968
-
((bb))
MMoovv
eemmeenn
ttss iinn
CCaarr
rryyiinn
gg AA
mmoouu
nnttss
In
tere
stPr
inci
pal
Prin
cipa
lIn
tere
stPr
inci
pal
Prin
cipa
lPr
inci
pal
Inte
rest
Prin
cipa
lPr
inci
pal
Prin
cipa
lIn
tere
stPr
inci
pal
Purp
ose
Rat
e1-
Jul-1
9R
epay
men
tsR
epay
men
ts30
-Jun
-20
1-Ju
l-19
Rep
aym
ents
Rep
aym
ents
30-J
un-2
01-
Jul-1
8R
epay
men
tsR
epay
men
ts30
-Jun
-19
$$
$$
$$
$$
$$
$$
Rec
reat
ion
and
cultu
reAL
AC B
iofu
els
1.63
%1,
326,
719
156,
541
20,4
591,
170,
178
--
--
--
--
Oth
er p
rope
rty
and
serv
ices
Wid
efor
mat
Prin
ters
1.37
%26
,440
11,6
5028
914
,790
--
--
--
--
TToott
aall LL
eeaassee
LLiiaa
bbiilliitt
iieess
1,35
3,15
916
8,19
120
,748
1,18
4,96
8-
--
--
--
-
2020
Bud
get
2019
Act
ual
2020
Act
ual
Page
31
CIT
Y O
F A
LBA
NY
AN
NU
AL
FIN
AN
CIA
L R
EPO
RT
2020
Not
es t
o th
e Fi
nanc
ial S
tate
men
tsffoo
rr tthh
ee yyee
aarr ee
nnddeedd
3300
JJuunnee
220022
00
1177..
IINNFFOO
RRMM
AATT
IIOONN
OONN
BBOO
RRRR
OOWW
IINNGG
SS
((aa))
BBoorr
rrooww
iinnggss
2020
2019
$$
Cur
rent
2,52
2,89
42,
570,
907
Non
-cur
rent
9,82
3,99
412
,346
,888
TToott
aall BB
oorrrroo
wwiinn
ggss12
,346
,888
14,9
17,7
95
((bb))
RReepp
aayymm
eennttss
-- BB
oorrrroo
wwiinn
ggss
Loan
Inte
rest
Prin
cipa
lN
ewPr
inci
pal
Inte
rest
Prin
cipa
lPr
inci
pal
New
Prin
cipa
lIn
tere
stPr
inci
pal
Prin
cipa
lN
ewPr
inci
pal
Inte
rest
Prin
cipa
lN
umbe
rIn
stitu
tion
Rat
e1-
Jul-1
9Lo
ans
Rep
aym
ents
Rep
aym
ents
30-J
un-2
01-
Jul-1
9Lo
ans
Rep
aym
ents
Rep
aym
ents
30-J
un-2
01-
Jul-1
8Lo
ans
Rep
aym
ents
Rep
aym
ents
30-J
un-1
9Pa
rtic
ular
s$
$$
$$
$$
$$
$$
$$
$$
Rec
reat
ion
and
cultu
reAL
AC R
edev
elop
men
t30
WAT
C*
6.35
%1,
395,
289
-13
8,71
096
,104
1,25
6,57
91,
398,
171
-13
6,60
310
0,03
01,
261,
568
1,52
5,59
3-
130,
304
105,
276
1,39
5,28
9AL
AC R
edev
elop
men
t32
WAT
C*
7.12
%1,
395,
695
-11
5,33
210
6,87
21,
280,
363
1,39
8,56
6-
113,
012
108,
067
1,28
5,55
41,
503,
233
-10
7,53
811
5,29
91,
395,
695
Tow
n Sq
uare
Upg
rade
33W
ATC
*4.
39%
277,
034
-50
,702
12,8
4822
6,33
227
7,46
8-
50,5
9413
,638
226,
874
325,
582
-48
,548
15,2
7127
7,03
4Fo
rts E
ntra
nce
and
Publ
ic S
pace
36
WAT
C*
4.39
%27
7,03
4-
50,7
0212
,848
226,
332
277,
468
-50
,594
13,6
3822
6,87
432
5,58
2-
48,5
4815
,428
277,
034
Cen
tenn
ial P
ark
Stag
e 1
37W
ATC
*3.
81%
1,26
8,28
0-
320,
214
50,1
3894
8,06
61,
266,
205
-32
2,86
050
,734
943,
345
1,47
1,90
3-
203,
623
59,8
871,
268,
280
Cen
tenn
ial P
ark
Stag
e 2
38W
ATC
*2.
94%
247,
077
-12
1,73
67,
790
125,
341
246,
747
-12
2,92
08,
229
123,
827
365,
312
-11
8,23
510
,847
247,
077
ALAC
- H
eat E
xcha
nge
Uni
t39
WAT
C*
2.94
%18
3,54
4-
90,4
335,
786
93,1
1118
3,29
9-
91,3
126,
170
91,9
8727
1,37
6-
87,8
329,
009
183,
544
Cen
tenn
ial P
ark
Stag
e 3
41W
ATC
*2.
37%
310,
597
-10
1,10
39,
765
209,
494
310,
991
-10
1,39
89,
083
209,
593
409,
346
-98
,749
11,4
3331
0,59
7C
ente
nnia
l Par
k St
age
442
WAT
C*
2.45
%34
1,38
1-
82,2
549,
998
259,
127
342,
004
-82
,019
9,74
225
9,98
542
1,65
6-
80,2
7512
,535
341,
381
Tow
n H
all
44W
ATC
*1.
78%
1,80
0,00
0-
243,
676
42,7
621,
556,
324
1,80
0,00
0-
229,
743
64,4
931,
570,
257
-1,
800,
000
-3,
052
1,80
0,00
0Em
u Po
int B
oat P
ens
46W
ATC
*2.
56%
1,50
0,00
0-
58,2
7148
,328
1,44
1,72
91,
500,
000
-51
,777
55,0
251,
448,
223
-1,
500,
000
-3,
342
1,50
0,00
0Tr
ansp
ort
Roa
dwor
ks -
Asse
t Upg
rade
21A
WAT
C*
7.14
%63
1,19
1-
141,
600
47,0
6848
9,59
163
1,97
5-
141,
711
47,3
3549
0,26
476
3,19
7-
132,
006
57,4
6163
1,19
1R
oadw
orks
- 22
C R
efin
ance
d22
DW
ATC
*4.
01%
672,
183
-15
8,17
429
,975
514,
009
672,
937
-15
8,47
130
,214
514,
466
824,
200
-15
2,01
737
,039
672,
183
Roa
dwor
ks -
03/0
423
CBA
**6.
62%
304,
427
-53
,242
19,2
6825
1,18
530
4,38
3-
53,1
2819
,401
251,
255
354,
312
-49
,885
22,6
2530
4,42
7R
oadw
orks
- 04
/05
28W
ATC
*5.
84%
858,
577
-12
3,32
054
,508
735,
257
856,
914
-12
4,17
141
,598
732,
743
974,
998
-11
6,42
162
,098
858,
577
Roa
dwor
ks -
06/0
729
WAT
C*
6.36
%1,
058,
936
-33
1,12
369
,973
727,
813
1,05
9,49
0-
332,
781
69,8
9672
6,70
91,
369,
964
-31
1,02
891
,960
1,05
8,93
6St
irlin
g Te
rrace
Upg
rade
34W
ATC
*4.
39%
221,
628
-40
,562
10,2
7818
1,06
622
1,97
5-
40,4
7510
,911
181,
500
260,
466
-38
,838
12,3
4322
1,62
8Ec
onom
ic s
ervi
ces
Sale
yard
s Lo
an
3W
ATC
*6.
96%
52,8
43-
52,8
431,
160
-52
,555
-52
,555
3,05
3-
102,
239
-49
,396
5,18
852
,843
Forts
Caf
e, R
etai
l & A
dmin
Upg
rade
/Ref
urbi
shm
ent
35W
ATC
*4.
39%
332,
442
-60
,843
15,4
1827
1,59
933
2,96
2-
60,7
1316
,366
272,
249
390,
699
-58
,257
18,5
1233
2,44
2Vi
sito
r Cen
tre B
uild
ing
43W
ATC
*2.
89%
822,
272
-92
,763
28,5
5572
9,50
982
3,43
0-
91,8
8726
,211
731,
543
912,
411
-90
,139
31,7
9982
2,27
2O
ther
pro
pert
y an
d se
rvic
esAd
min
Bui
ldin
g 1
25W
ATC
*5.
84%
486,
915
-69
,937
30,1
7341
6,97
848
7,80
6-
69,4
6431
,092
418,
342
552,
941
-66
,026
34,5
9448
6,91
5Ad
min
Bui
ldin
g 2A
26
EW
ATC
*3.
49%
--
--
--
--
--
181,
407
-18
1,40
76,
075
-Pu
rcha
se L
and
- Lot
20
40W
ATC
*2.
37%
480,
450
-73
,367
17,8
6740
7,08
348
1,32
6-
72,9
6119
,709
408,
365
551,
344
-70
,894
23,5
4548
0,45
0TT
oottaall
BBoorr
rrooww
iinnggss
14,9
17,7
95-
2,57
0,90
772
7,48
212
,346
,888
14,9
26,6
72-
2,55
1,14
975
4,63
512
,375
,523
13,8
57,7
613,
300,
000
2,23
9,96
676
4,61
814
,917
,795
* WA
Trea
sury
Cor
pora
tion
** C
omm
onw
ealth
Ban
k of
Aus
tralia
All l
oan
repa
ymen
ts w
ere
finan
ced
by g
ener
al p
urpo
se re
venu
e.
2020
Act
ual
2020
Bud
get
2019
Act
ual
Page
32
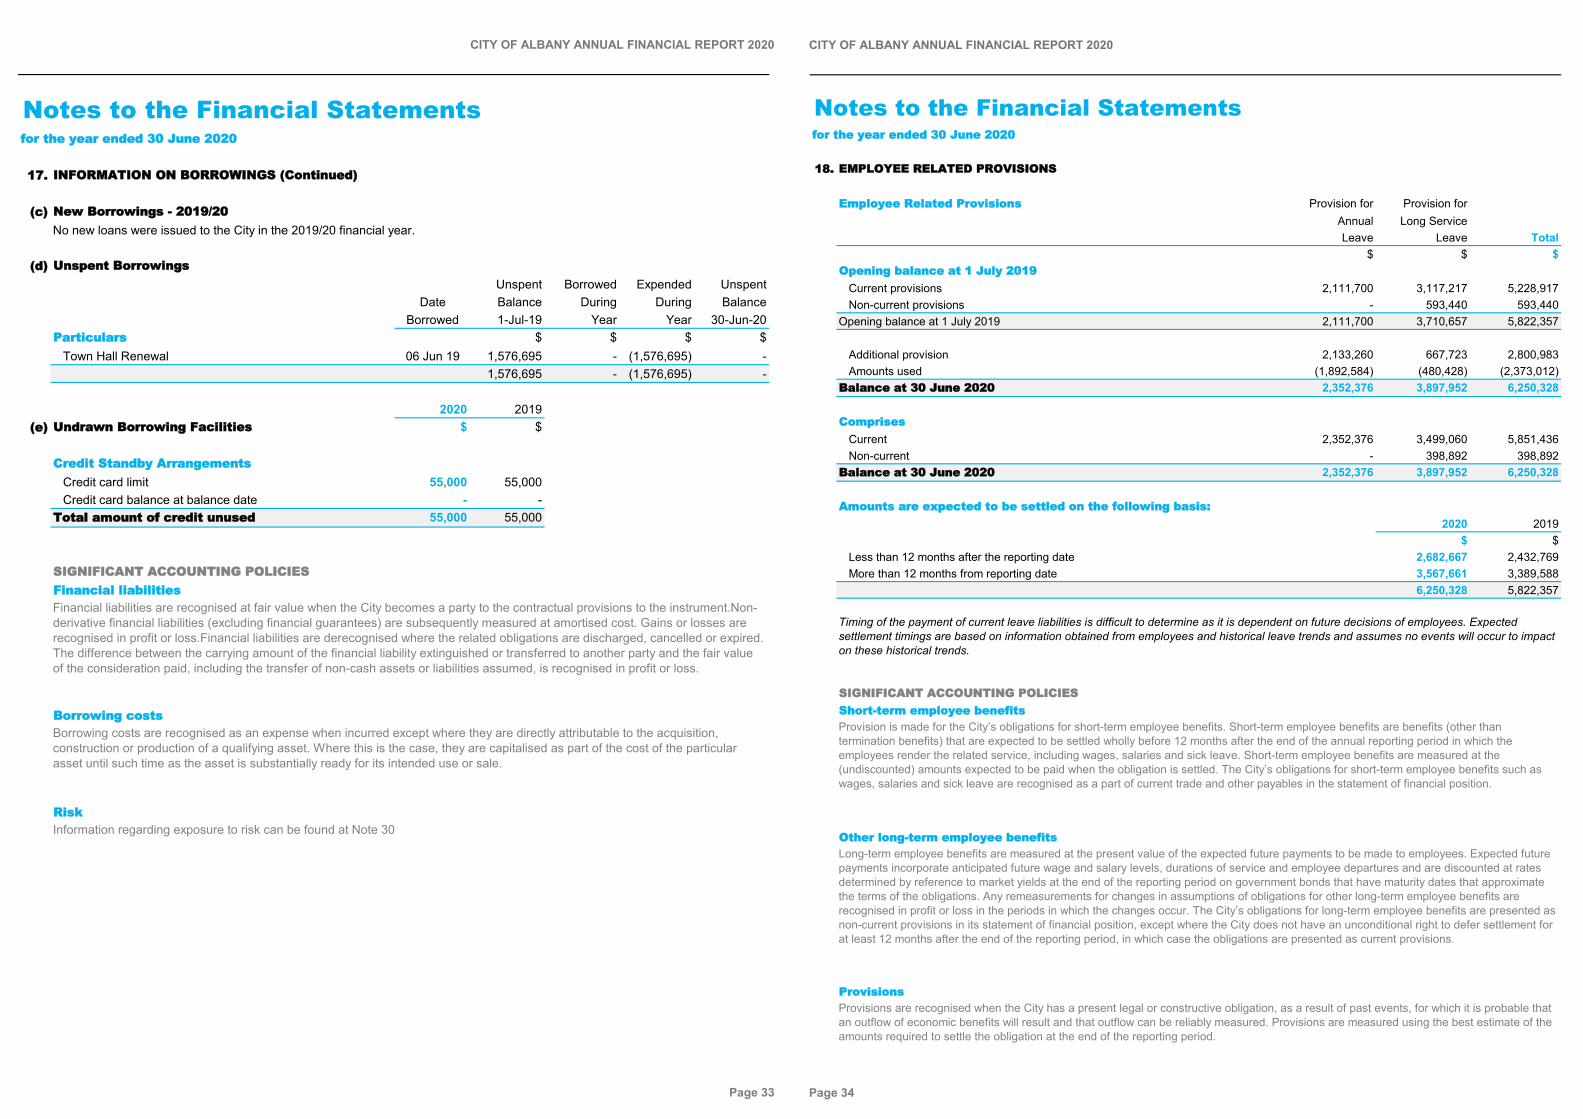
CITY OF ALBANY ANNUAL FINANCIAL REPORT 2020
Notes to the Financial Statementsffoorr tthhee yyeeaarr eennddeedd 3300 JJuunnee 22002200
1177.. IINNFFOORRMMAATTIIOONN OONN BBOORRRROOWWIINNGGSS ((CCoonnttiinnuueedd))
((cc)) NNeeww BBoorrrroowwiinnggss -- 22001199//2200No new loans were issued to the City in the 2019/20 financial year.
((dd)) UUnnssppeenntt BBoorrrroowwiinnggssUnspent Borrowed Expended Unspent
Date Balance During During BalanceBorrowed 1-Jul-19 Year Year 30-Jun-20
PPaarrttiiccuullaarrss $ $ $ $Town Hall Renewal 06 Jun 19 1,576,695 - (1,576,695) -
1,576,695 - (1,576,695) -
2020 2019((ee)) UUnnddrraawwnn BBoorrrroowwiinngg FFaacciilliittiieess $ $
CCrreeddiitt SSttaannddbbyy AArrrraannggeemmeennttssCredit card limit 55,000 55,000Credit card balance at balance date - -
TToottaall aammoouunntt ooff ccrreeddiitt uunnuusseedd 55,000 55,000
SSIIGGNNIIFFIICCAANNTT AACCCCOOUUNNTTIINNGG PPOOLLIICCIIEESSFFiinnaanncciiaall lliiaabbiilliittiieess
BBoorrrroowwiinngg ccoossttss
RRiisskkInformation regarding exposure to risk can be found at Note 30
Financial liabilities are recognised at fair value when the City becomes a party to the contractual provisions to the instrument.Non-derivative financial liabilities (excluding financial guarantees) are subsequently measured at amortised cost. Gains or losses are recognised in profit or loss.Financial liabilities are derecognised where the related obligations are discharged, cancelled or expired. The difference between the carrying amount of the financial liability extinguished or transferred to another party and the fair value of the consideration paid, including the transfer of non-cash assets or liabilities assumed, is recognised in profit or loss.
Borrowing costs are recognised as an expense when incurred except where they are directly attributable to the acquisition, construction or production of a qualifying asset. Where this is the case, they are capitalised as part of the cost of the particular asset until such time as the asset is substantially ready for its intended use or sale.
Page 33
CITY OF ALBANY ANNUAL FINANCIAL REPORT 2020
Notes to the Financial Statementsffoorr tthhee yyeeaarr eennddeedd 3300 JJuunnee 22002200
1188.. EEMMPPLLOOYYEEEE RREELLAATTEEDD PPRROOVVIISSIIOONNSS
EEmmppllooyyeeee RReellaatteedd PPrroovviissiioonnss Provision for Provision forAnnual Long ServiceLeave Leave Total
$ $ $OOppeenniinngg bbaallaannccee aatt 11 JJuullyy 22001199
Current provisions 2,111,700 3,117,217 5,228,917Non-current provisions - 593,440 593,440
Opening balance at 1 July 2019 2,111,700 3,710,657 5,822,357
Additional provision 2,133,260 667,723 2,800,983Amounts used (1,892,584) (480,428) (2,373,012)
BBaallaannccee aatt 3300 JJuunnee 22002200 2,352,376 3,897,952 6,250,328
CCoommpprriisseessCurrent 2,352,376 3,499,060 5,851,436Non-current - 398,892 398,892
BBaallaannccee aatt 3300 JJuunnee 22002200 2,352,376 3,897,952 6,250,328
AAmmoouunnttss aarree eexxppeecctteedd ttoo bbee sseettttlleedd oonn tthhee ffoolllloowwiinngg bbaassiiss::2020 2019
$ $Less than 12 months after the reporting date 2,682,667 2,432,769More than 12 months from reporting date 3,567,661 3,389,588
6,250,328 5,822,357
SSIIGGNNIIFFIICCAANNTT AACCCCOOUUNNTTIINNGG PPOOLLIICCIIEESSSShhoorrtt--tteerrmm eemmppllooyyeeee bbeenneeffiittss
OOtthheerr lloonngg--tteerrmm eemmppllooyyeeee bbeenneeffiittss
PPrroovviissiioonnss
Long-term employee benefits are measured at the present value of the expected future payments to be made to employees. Expected future payments incorporate anticipated future wage and salary levels, durations of service and employee departures and are discounted at rates determined by reference to market yields at the end of the reporting period on government bonds that have maturity dates that approximate the terms of the obligations. Any remeasurements for changes in assumptions of obligations for other long-term employee benefits are recognised in profit or loss in the periods in which the changes occur. The City’s obligations for long-term employee benefits are presented as non-current provisions in its statement of financial position, except where the City does not have an unconditional right to defer settlement for at least 12 months after the end of the reporting period, in which case the obligations are presented as current provisions.
Provisions are recognised when the City has a present legal or constructive obligation, as a result of past events, for which it is probable that an outflow of economic benefits will result and that outflow can be reliably measured. Provisions are measured using the best estimate of the amounts required to settle the obligation at the end of the reporting period.
Timing of the payment of current leave liabilities is difficult to determine as it is dependent on future decisions of employees. Expected settlement timings are based on information obtained from employees and historical leave trends and assumes no events will occur to impact on these historical trends.
Provision is made for the City’s obligations for short-term employee benefits. Short-term employee benefits are benefits (other than termination benefits) that are expected to be settled wholly before 12 months after the end of the annual reporting period in which the employees render the related service, including wages, salaries and sick leave. Short-term employee benefits are measured at the (undiscounted) amounts expected to be paid when the obligation is settled. The City’s obligations for short-term employee benefits such as wages, salaries and sick leave are recognised as a part of current trade and other payables in the statement of financial position.
Page 34

CITY OF ALBANY ANNUAL FINANCIAL REPORT 2020
Notes to the Financial Statementsffoorr tthhee yyeeaarr eennddeedd 3300 JJuunnee 22002200
1199.. OOTTHHEERR PPRROOVVIISSIIOONNSSProvision forRemediation
Costs$
Opening balance as at 1 July 2018 8,163,666Additional provision 94,453Amounts used (50,872)
BBaallaannccee aatt 3300 JJuunnee 22001199 8,207,247
Additional provision 82,807Amounts used (80,713)
BBaallaannccee aatt 3300 JJuunnee 22002200 8,209,341
CCoommpprriisseessCurrent 209,341Non-current 8,000,000
BBaallaannccee aatt 3300 JJuunnee 22002200 8,209,341
PPrroovviissiioonn ffoorr rreemmeeddiiaattiioonn ccoossttss
- there is a present obligation as a result of activities undertaken; - it is probable that an outflow of economic benefits will be required to settle the obligation; and - the amount of the provision can be measured reliably
The estimated future obligations include the costs of restoring the affected areas and continued monitoring of the site. The provision for future remediation costs is the best estimate of the present value of the expenditure required to settle the remediation obligation at the reporting date. Future remediation costs are reviewed annually and any changes in the estimate are reflected in the present value of the remediation provision at each reporting date. Amounts which are reliably expected to be paid out within 12 months of the reporting date are classified as current. Exact timing of payment of non-current obligations is unable to be reliably estimated as it is dependent on the remaining life of the gravel pits and waste facilities.
Under the agreements for the City's gravel pits and waste facilities, the City has a legal obligation to restore the sites. A provision for remediation is recognised when:
Page 35
CITY OF ALBANY ANNUAL FINANCIAL REPORT 2020
Notes to the Financial Statementsffoorr tthhee yyeeaarr eennddeedd 3300 JJuunnee 22002200
2200.. NNOOTTEESS TTOO TTHHEE SSTTAATTEEMMEENNTT OOFF CCAASSHH FFLLOOWWSS
RReeccoonncciilliiaattiioonn ooff CCaasshh
2020 2020 2019Actual Budget Actual
$ $ $
Cash and cash equivalents 23,321,708 25,332,632 28,430,091
RReeccoonncciilliiaattiioonn ooff NNeett CCaasshh PPrroovviiddeedd BByy OOppeerraattiinngg AAccttiivviittiieess ttoo NNeett RReessuulltt
Net result 6,729,930 10,124,133 11,800,657Non-cash flows in Net result:
Depreciation 16,777,600 15,794,228 16,181,643Loss on sale of assets 162,874 430,075 207,335Loss on assets expensed - - 53,677Loss on assets written off - - 273,098Fair value adjustments to financial assets at fair value through profit or loss (3,745) - (26,655)
Changes in assets and liabilities:(Increase)/decrease in receivables (135,270) 25,454 (561,597)(Increase)/decrease in other assets 382,904 (77,293) (441,745)(Increase)/decrease in inventories (92,902) 200,000 (586,154)Increase/(decrease) in contract liabilities (2,611,202) 3,540,490 -Increase/(decrease) in payables 443,126 1,330,025 368,140Increase/(decrease) in provisions 430,065 (26,576) 275,748Change in Accounting Policies transferred to retained surplus - (4,443,197) -
Grants contributions for the development of assets (8,177,274) (16,638,711) (11,863,252)Net cash from operating activities 13,906,106 10,258,628 15,680,895
2211.. TTOOTTAALL AASSSSEETTSS CCLLAASSSSIIFFIIEEDD BBYY FFUUNNCCTTIIOONN && AACCTTIIVVIITTYY2020 2019
Actual Actual$ $
Governance 17,807,200 17,915,583General purpose funding 877,813 886,967Law, order, public safety 3,959,245 4,109,337Health 131,517 141,054Education and welfare 257,076 293,255Community amenities 33,746,127 34,334,599Recreation and culture 105,333,141 98,160,775Transport 360,342,186 362,268,827Economic services 17,841,477 17,647,876Other property and services 70,093,854 69,557,055Unallocated 12,182,437 14,687,094Total assets classified by function and activity 622,572,073 620,002,422
2222.. CCOONNTTIINNGGEENNTT LLIIAABBIILLIITTIIEESSThe City, together with the Water Corporation, is part of a joint venture agreement which owns a liquid waste facility. This facility is currently not in operation. Indications from the Water Corporation is that this will not be used in the future. The City may be liable for some costs with the unwinding of this joint venture and the decommissioning of the facility. The facility is currently in care and maintenance, which could continue under the current agreement until 2022.
For the purposes of the Statement of Cash Flows, cash includes cash and cash equivalents, net of outstanding bank overdrafts. Cash at the end of the reporting period is reconciled to the related items in the Statement of Financial Position as follows:
Page 36
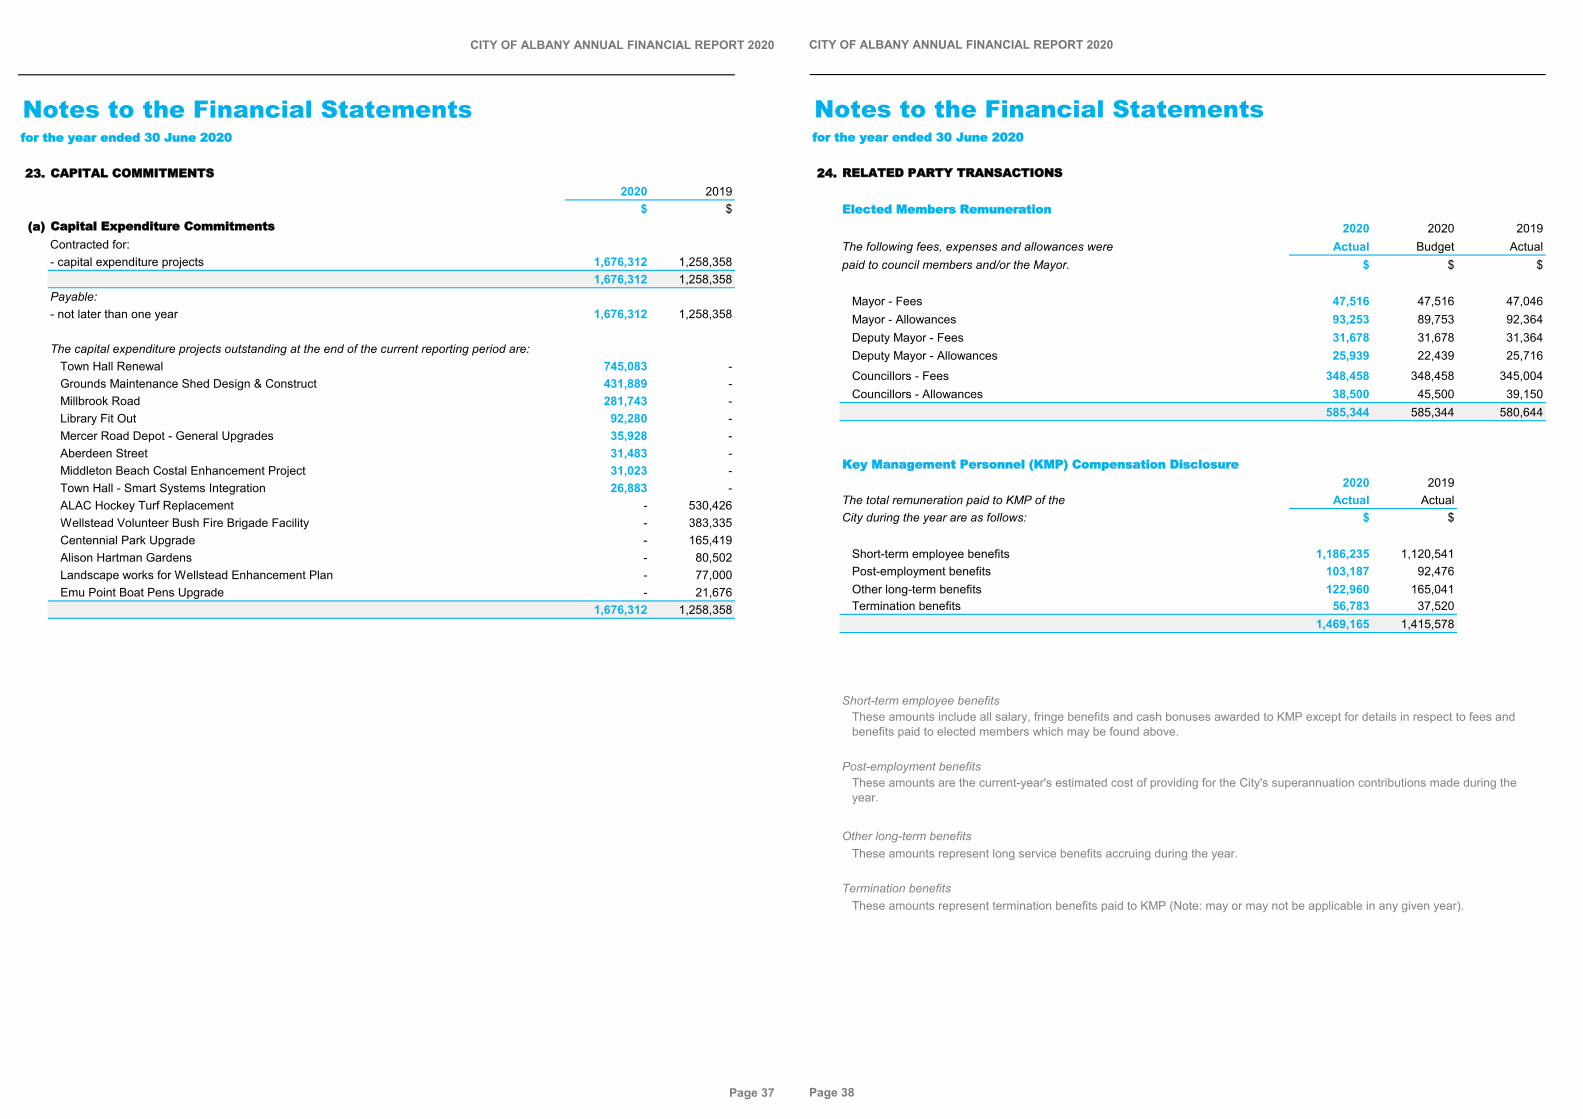
CITY OF ALBANY ANNUAL FINANCIAL REPORT 2020
Notes to the Financial Statementsffoorr tthhee yyeeaarr eennddeedd 3300 JJuunnee 22002200
2233.. CCAAPPIITTAALL CCOOMMMMIITTMMEENNTTSS2020 2019
$ $((aa)) CCaappiittaall EExxppeennddiittuurree CCoommmmiittmmeennttss
Contracted for:- capital expenditure projects 1,676,312 1,258,358
1,676,312 1,258,358Payable:- not later than one year 1,676,312 1,258,358
The capital expenditure projects outstanding at the end of the current reporting period are:Town Hall Renewal 745,083 -Grounds Maintenance Shed Design & Construct 431,889 -Millbrook Road 281,743 -Library Fit Out 92,280 -Mercer Road Depot - General Upgrades 35,928 -Aberdeen Street 31,483 -Middleton Beach Costal Enhancement Project 31,023 -Town Hall - Smart Systems Integration 26,883 -ALAC Hockey Turf Replacement - 530,426Wellstead Volunteer Bush Fire Brigade Facility - 383,335Centennial Park Upgrade - 165,419Alison Hartman Gardens - 80,502Landscape works for Wellstead Enhancement Plan - 77,000Emu Point Boat Pens Upgrade - 21,676
1,676,312 1,258,358
Page 37
CITY OF ALBANY ANNUAL FINANCIAL REPORT 2020
Notes to the Financial Statementsffoorr tthhee yyeeaarr eennddeedd 3300 JJuunnee 22002200
2244.. RREELLAATTEEDD PPAARRTTYY TTRRAANNSSAACCTTIIOONNSS
EElleecctteedd MMeemmbbeerrss RReemmuunneerraattiioonn2020 2020 2019
The following fees, expenses and allowances were Actual Budget Actualpaid to council members and/or the Mayor. $ $ $
Mayor - Fees 47,516 47,516 47,046Mayor - Allowances 93,253 89,753 92,364Deputy Mayor - Fees 31,678 31,678 31,364Deputy Mayor - Allowances 25,939 22,439 25,716Councillors - Fees 348,458 348,458 345,004Councillors - Allowances 38,500 45,500 39,150
585,344 585,344 580,644
KKeeyy MMaannaaggeemmeenntt PPeerrssoonnnneell ((KKMMPP)) CCoommppeennssaattiioonn DDiisscclloossuurree2020 2019
The total remuneration paid to KMP of the Actual ActualCity during the year are as follows: $ $
Short-term employee benefits 1,186,235 1,120,541Post-employment benefits 103,187 92,476Other long-term benefits 122,960 165,041Termination benefits 56,783 37,520
1,469,165 1,415,578
Short-term employee benefits
Post-employment benefits
Other long-term benefitsThese amounts represent long service benefits accruing during the year.
Termination benefitsThese amounts represent termination benefits paid to KMP (Note: may or may not be applicable in any given year).
These amounts include all salary, fringe benefits and cash bonuses awarded to KMP except for details in respect to fees and benefits paid to elected members which may be found above.
These amounts are the current-year's estimated cost of providing for the City's superannuation contributions made during the year.
Page 38

CITY OF ALBANY ANNUAL FINANCIAL REPORT 2020
Notes to the Financial Statementsffoorr tthhee yyeeaarr eennddeedd 3300 JJuunnee 22002200
2244.. RREELLAATTEEDD PPAARRTTYY TTRRAANNSSAACCTTIIOONNSS ((CCoonnttiinnuueedd))
TTrraannssaaccttiioonnss wwiitthh rreellaatteedd ppaarrttiieess
No outstanding balances or provisions for doubtful debts or guaranties exist in relation to related parties at year end.
The following transactions occurred with related parties:2020 2019
Actual Actual$ $
Sale of goods and servicesPurchase of goods and services - Elected Members 11,330 336,354Purchase of goods and services - Key Management Personnel - 800
11,330 337,154
Amounts outstanding from related parties:Trade and other receivables - Elected Members - 130Trade and other receivables - Key Management Personnel - 2,909
- 3,039
Amounts payable to related parties:Trade and other payables - 7,898
- 7,898
RReellaatteedd PPaarrttiieess
The City's main related parties are as follows:
i. Key management personnel
ii. Other Related PartiesThe associate person of KMP was employed by the City under normal employment terms and conditions.
iii. Entities subject to significant influence by the City
2255.. JJOOIINNTT AARRRRAANNGGEEMMEENNTTSS
The City, together with the Water Corporation has a joint venture arrangement with regard to the processing of liquid waste. The assets consist of liquid waste processing equipment. These assets are not currently in operation. Indication from the Water Corporation is that these assets will not be used in the future. As a result they have been written down to $nil.
Transactions between related parties and the City are on normal commercial terms and conditions, no more favourable than those available to other parties, unless otherwise stated.
Any person(s) having authority and responsibility for planning, directing and controlling the activities of the entity, directly or indirectly, including any elected member, are considered key management personnel.
An entity that has the power to participate in the financial and operating policy decisions of an entity, but does not have control over those policies, is an entity which holds significant influence. Significant influence may be gained by share ownership, statute or agreement.
Page 39
CITY OF ALBANY ANNUAL FINANCIAL REPORT 2020
Notes to the Financial Statementsffoorr tthhee yyeeaarr eennddeedd 3300 JJuunnee 22002200
2266.. MMAAJJOORR LLAANNDD TTRRAANNSSAACCTTIIOONNSS
TThhee RRiiddggee'' CCuullll RRooaadd RReessiiddeennttiiaall SSuubbddiivviissiioonn
((aa)) DDeettaaiillss
As at 30 June 2020, 2 lots remain unsold.No further development costs are anticipated to be spent on this development
2020 2020 2019Actual Budget Actual
((bb)) CCuurrrreenntt yyeeaarr ttrraannssaaccttiioonnss $ $ $
Proceeds on Sales - 80,000 -(Less): Cost of Blocks Sold - (79,000) -(Less): Selling Costs - (20,000) -PPrrooffiitt//((LLoossss)) oonn SSaallee ooff IInnvveessttmmeenntt LLaanndd - (19,000) -
((cc)) EExxppeecctteedd ffuuttuurree ccaasshh fflloowwss2020/21 2021/22 2022/23 2023/24 Total
$ $ $ $ $CCaasshh oouuttfflloowwss- Selling costs (20,000) (20,000) - - (40,000)
(20,000) (20,000) - - (40,000)CCaasshh iinnfflloowwss- Sale proceeds 80,000 80,000 - - 160,000
80,000 80,000 - - 160,000
NNeett ccaasshh fflloowwss 60,000 60,000 - - 120,000
2020 2019Actual Actual
((dd)) AAsssseettss aanndd lliiaabbiilliittiieess $ $
Land held for resale, per Note 6 158,000 158,000TToottaall llaanndd hheelldd ffoorr rreessaallee 158,000 158,000
2277.. TTRRAADDIINNGG UUNNDDEERRTTAAKKIINNGGSS AANNDD MMAAJJOORR TTRRAADDIINNGG UUNNDDEERRTTAAKKIINNGGSS
The City did not participate in any trading undertakings or major trading undertakings during the 2019/20financial year.
The Cull Road Subdivision Project was initiated in 2006, with the primary purpose to provide necessary funding for the Albany Leisure and Aquatic Centre (ALAC) Redevelopment Project. The rationale behind the Subdivision, at the time, was to provide much needed residential lots within the urban area of the City, as well as increase the student numbers at the Mt Lockyer Primary School and provide rationale to extend sewerage mains into the southern portion of Lockyer and into Gledhow.
Page 40
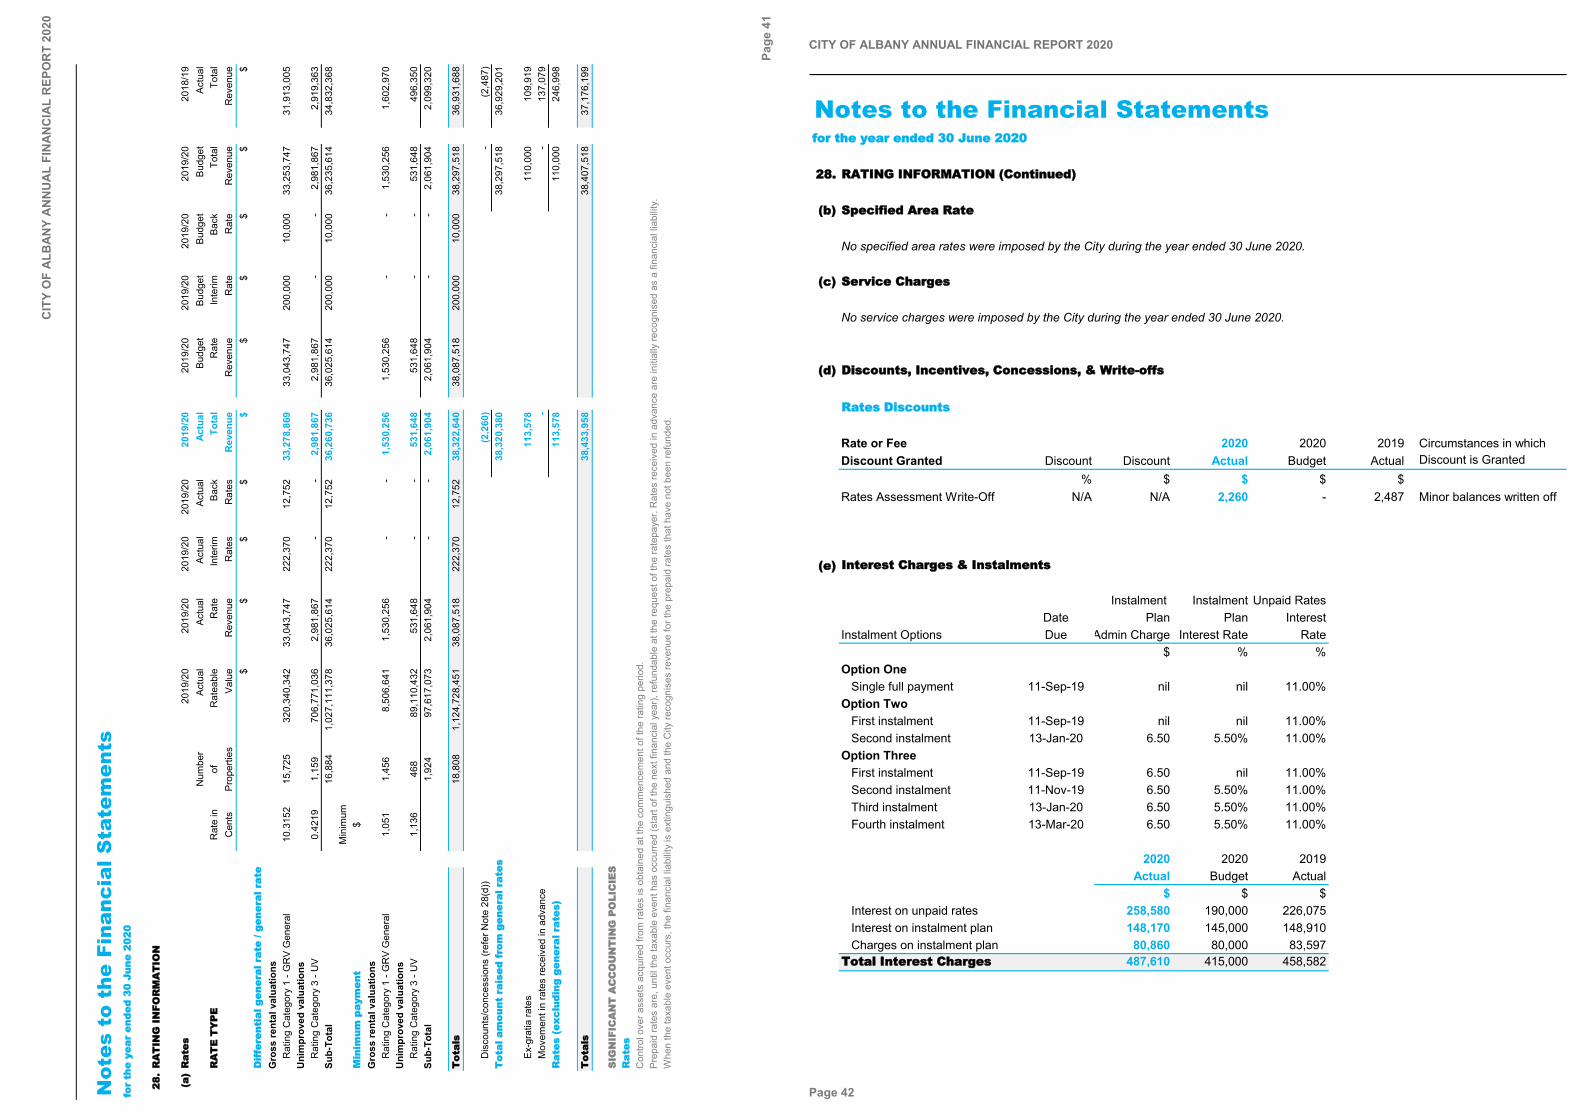
CIT
Y O
F A
LBA
NY
AN
NU
AL
FIN
AN
CIA
L R
EPO
RT
2020
Not
es t
o th
e Fi
nanc
ial S
tate
men
tsffoo
rr tthh
ee yyee
aarr ee
nnddeedd
3300
JJuunnee
220022
00
2288..
RRAA
TTIINN
GG II
NNFFOO
RRMM
AATT
IIOONN
((aa))
RRaatt
eess20
19/2
020
19/2
020
19/2
020
19/2
020
19/2
020
19/2
020
19/2
020
19/2
020
19/2
020
18/1
9N
umbe
rAc
tual
Actu
alAc
tual
Actu
alAc
tual
Budg
etBu
dget
Budg
etBu
dget
Actu
alRR
AATT
EE TT
YYPP
EER
ate
inof
Rat
eabl
eR
ate
Inte
rimBa
ckTo
tal
Rat
eIn
terim
Back
Tota
lTo
tal
Cen
tsPr
oper
ties
Valu
eR
even
ueR
ates
Rat
esR
even
ueR
even
ueR
ate
Rat
eR
even
ueR
even
ue$
$$
$$
$$
$$
$DD
iiffffee
rreenntt
iiaall gg
eenneerr
aall rr
aattee
// ggeenn
eerraall
rraatt
ee
10.3
152
15,7
2532
0,34
0,34
233
,043
,747
222,
370
12,7
5233
,278
,869
33,0
43,7
4720
0,00
010
,000
33,2
53,7
4731
,913
,005
Uni
mpr
oved
val
uatio
ns0.
4219
1,15
970
6,77
1,03
62,
981,
867
--
2,98
1,86
72,
981,
867
--
2,98
1,86
72,
919,
363
Sub-
Tota
l16
,884
1,02
7,11
1,37
836
,025
,614
222,
370
12,7
5236
,260
,736
36,0
25,6
1420
0,00
010
,000
36,2
35,6
1434
,832
,368
Min
imum
MMiinn
iimmuumm
ppaayy
mmeenn
tt$
1,05
11,
456
8,50
6,64
11,
530,
256
--
1,53
0,25
61,
530,
256
--
1,53
0,25
61,
602,
970
Uni
mpr
oved
val
uatio
ns1,
136
468
89,1
10,4
3253
1,64
8-
-53
1,64
853
1,64
8-
-53
1,64
849
6,35
0Su
b-To
tal
1,92
497
,617
,073
2,06
1,90
4-
-2,
061,
904
2,06
1,90
4-
-2,
061,
904
2,09
9,32
0
TToott
aallss
18,8
081,
124,
728,
451
38,0
87,5
1822
2,37
012
,752
38,3
22,6
4038
,087
,518
200,
000
10,0
0038
,297
,518
36,9
31,6
88
Dis
coun
ts/c
once
ssio
ns (r
efer
Not
e 28
(d))
(2,2
60)
-(2
,487
)TT
oottaall
aamm
oouunntt
rraaii
sseedd
ffrroomm
ggeenn
eerraall
rraatt
eess38
,320
,380
38,2
97,5
1836
,929
,201
113,
578
110,
000
109,
919
Mov
emen
t in
rate
s re
ceiv
ed in
adv
ance
--
137,
079
RRaatt
eess ((
eexxccll
uuddiinn
gg ggee
nneerraa
ll rraatt
eess))
113,
578
110,
000
246,
998
TToott
aallss
38,4
33,9
5838
,407
,518
37,1
76,1
99
SSIIGG
NNIIFF
IICCAA
NNTT
AACC
CCOO
UUNN
TTIINN
GG PP
OOLLII
CCIIEE
SSRR
aatteess
Con
trol o
ver a
sset
s ac
quire
d fro
m ra
tes
is o
btai
ned
at th
e co
mm
ence
men
t of t
he ra
ting
perio
d.Pr
epai
d ra
tes
are,
unt
il th
e ta
xabl
e ev
ent h
as o
ccur
red
(sta
rt of
the
next
fina
ncia
l yea
r), re
fund
able
at t
he re
ques
t of t
he ra
tepa
yer.
Rat
es re
ceiv
ed in
adv
ance
are
initi
ally
reco
gnis
ed a
s a
finan
cial
liab
ility
. W
hen
the
taxa
ble
even
t occ
urs,
the
finan
cial
liab
ility
is e
xtin
guis
hed
and
the
City
reco
gnis
es re
venu
e fo
r the
pre
paid
rate
s th
at h
ave
not b
een
refu
nded
.
Gro
ss re
ntal
val
uatio
ns
Gro
ss re
ntal
val
uatio
ns
Rat
ing
Cat
egor
y 3
- UV
Rat
ing
Cat
egor
y 1
- GR
V G
ener
al
Ex-g
ratia
rate
s
Rat
ing
Cat
egor
y 1
- GR
V G
ener
al
Rat
ing
Cat
egor
y 3
- UV
Page
41
CITY OF ALBANY ANNUAL FINANCIAL REPORT 2020
Notes to the Financial Statementsffoorr tthhee yyeeaarr eennddeedd 3300 JJuunnee 22002200
2288.. RRAATTIINNGG IINNFFOORRMMAATTIIOONN ((CCoonnttiinnuueedd))
((bb)) SSppeecciiffiieedd AArreeaa RRaattee
No specified area rates were imposed by the City during the year ended 30 June 2020.
((cc)) SSeerrvviiccee CChhaarrggeess
No service charges were imposed by the City during the year ended 30 June 2020.
((dd)) DDiissccoouunnttss,, IInncceennttiivveess,, CCoonncceessssiioonnss,, && WWrriittee--ooffffss
RRaatteess DDiissccoouunnttss
Rate or Fee 2020 2020 2019 Circumstances in which Discount Granted Discount Discount Actual Budget Actual Discount is Granted
% $ $ $ $N/A N/A 2,260 - 2,487 Minor balances written off
((ee)) IInntteerreesstt CChhaarrggeess && IInnssttaallmmeennttss
Instalment Instalment Unpaid RatesDate Plan Plan Interest
Instalment Options Due Admin Charge Interest Rate Rate $ % %
Option OneSingle full payment 11-Sep-19 nil nil 11.00%
Option TwoFirst instalment 11-Sep-19 nil nil 11.00%Second instalment 13-Jan-20 6.50 5.50% 11.00%
Option ThreeFirst instalment 11-Sep-19 6.50 nil 11.00%Second instalment 11-Nov-19 6.50 5.50% 11.00%Third instalment 13-Jan-20 6.50 5.50% 11.00%Fourth instalment 13-Mar-20 6.50 5.50% 11.00%
2020 2020 2019Actual Budget Actual
$ $ $Interest on unpaid rates 258,580 190,000 226,075Interest on instalment plan 148,170 145,000 148,910Charges on instalment plan 80,860 80,000 83,597
TToottaall IInntteerreesstt CChhaarrggeess 487,610 415,000 458,582
Rates Assessment Write-Off
Page 42

CITY OF ALBANY ANNUAL FINANCIAL REPORT 2020
Notes to the Financial Statementsffoorr tthhee yyeeaarr eennddeedd 3300 JJuunnee 22002200
2299.. RRAATTEE SSEETTTTIINNGG SSTTAATTEEMMEENNTT IINNFFOORRMMAATTIIOONN2019/20
2019/20 Budget 2019/20 2019/20(30 June 2020 (30 June 2020 (1 July 2019 (30 June 2019
Carried Carried Brought BroughtNote Forward) Forward) Forward) Forward)
$ $ $ $((aa)) NNoonn--ccaasshh aammoouunnttss eexxcclluuddeedd ffrroomm ooppeerraattiinngg aaccttiivviittiieess
The following non-cash revenue or expenditure has been excluded from amounts attributable to operating activities within the Rate SettingStatement in accordance with Financial Management Regulation 32.
AAddjjuussttmmeennttss ttoo ooppeerraattiinngg aaccttiivviittiieessLess: Profit on asset disposals 11(a) (45,103) (47,585) (25,221) (25,221)Add: Loss on disposal of assets 11(a) 207,977 417,660 232,556 232,556Less: Movement in liabilities associated with restricted cash (5,359,669) - - -Carrying Value of Investment Land Sold - 79,000 - -Less: Loss on Sale of Investment Land - (19,000) - -Movement in pensioner deferred rates (non-current) (55,749) - (49,727) (49,727)Movement in employee benefit provisions (non-current) (194,548) - (142,083) (142,083)Add: Assets expensed 9 - - 53,677 53,677Add: Assets written off 9,10 - - 273,098 273,098Add: Depreciation on assets 11(d) 16,777,600 15,794,228 16,181,643 16,181,643
NNoonn ccaasshh aammoouunnttss eexxcclluuddeedd ffrroomm ooppeerraattiinngg aaccttiivviittiieess 11,330,508 16,224,303 16,523,943 16,523,943
((bb)) SSuurrpplluuss//((ddeeffiicciitt)) aafftteerr iimmppoossiittiioonn ooff ggeenneerraall rraatteess
The following current assets and liabilities have been excludedfrom the net current assets used in the Rate Setting Statementin accordance with Financial Management Regulation 32 to agree to the surplus/(deficit) after imposition of general rates.
AAddjjuussttmmeennttss ttoo nneett ccuurrrreenntt aasssseettssLess: Reserves - restricted cash 3 (29,227,794) (19,663,474) (33,463,804) (33,463,804)Less: Financial assets at amortised cost - self supporting loans 8(a) (13,307) (12,899) (12,899) (12,899)Less: Financial assets held for resale - (201,067) - -Less: Land held for resale (158,000) - (158,000) (158,000)Add: Borrowings 2,522,894 2,552,104 2,570,907 2,570,907Add: Lease Liability 170,923 - - -Add: Current portion of contract liability held in reserves - - 4,087,497 -
TToottaall aaddjjuussttmmeennttss ttoo nneett ccuurrrreenntt aasssseettss (26,705,284) (17,325,336) (26,976,299) (31,063,796)
NNeett ccuurrrreenntt aasssseettss uusseedd iinn tthhee RRaattee SSeettttiinngg SSttaatteemmeennttTotal current assets 46,376,120 30,090,406 46,771,869 46,694,576Less: Total current liabilities (15,615,788) (12,765,070) (17,418,157) (12,332,243)Less: Total adjustments to net current assets (26,705,284) (17,325,336) (26,976,299) (31,063,796)NNeett ccuurrrreenntt aasssseettss uusseedd iinn tthhee RRaattee SSeettttiinngg SSttaatteemmeenntt 4,055,048 - 2,377,413 3,298,537
((cc)) AAddjjuussttmmeennttss ttoo ccuurrrreenntt aasssseettss aanndd lliiaabbiilliittiieess aatt 11 JJuullyy 22001199oonn aapppplliiccaattiioonn ooff nneeww aaccccoouunnttiinngg ssttaannddaarrddss
TToottaall ccuurrrreenntt aasssseettss aatt 3300 JJuunnee 22001199 46,694,576- Contract assets 77,293
TToottaall ccuurrrreenntt aasssseettss aatt 11 JJuullyy 22001199 46,771,869
TToottaall ccuurrrreenntt lliiaabbiilliittiieess aatt 3300 JJuunnee 22001199 (12,332,243)- Contract liabilities from contracts with customers (4,087,497)- Rates paid in advance (998,417)
TToottaall ccuurrrreenntt lliiaabbiilliittiieess aatt 11 JJuullyy 22001199 (17,418,157)
Page 43
CITY OF ALBANY ANNUAL FINANCIAL REPORT 2020
Notes to the Financial Statementsffoorr tthhee yyeeaarr eennddeedd 3300 JJuunnee 22002200
3300.. FFIINNAANNCCIIAALL RRIISSKK MMAANNAAGGEEMMEENNTT
This note explains the City’s exposure to financial risks and how these risks could affect the City’s future financial performance.
Risk Measurement
Market risk - interest rate Sensitivity analysis
Credit risk Aging analysisCredit analysis
Liquidity risk Rolling cash flow forecasts
The City does not engage in transactions expressed in foreign currencies and is therefore not subject to foreign currency risk.
Financial risk management is carried out by the finance area under policies approved by the Council. The financearea identifies, evaluates and manages financial risks in close co-operation with the operating divisions. Council have approved the overall risk management policy and provide policies on specific areas such as investment policy.
((aa)) IInntteerreesstt rraattee rriisskk
CCaasshh aanndd ccaasshh eeqquuiivvaalleennttssThe City's main interest rate risk arises from cash and cash equivalents with variable interest rates, which exposes the City to cash flow interest rate risk.
Cash and cash equivalents are invested in fixed interest rate term deposits which do not expose the City to cash flow interest rate risk. Cash and cash equivalents required for working capital are held in variable interest rate accounts.Carrying amounts of cash and cash equivalents at 30 June and the weighted average interest rate across all cash and cash equivalents and term deposits held disclosed as financial assets at amortised cost are reflected in the table below.
WeightedAverage Carrying Fixed Variable Non Interest
Interest Rate Amounts Interest Rate Interest Rate Bearing% $ $ $ $
2020Cash and cash equivalents 0.11% 23,321,708 4,000,000 19,321,708 -Financial assets at amortised cost - term deposits 1.11% 17,500,000 17,500,000 - -
2019Cash and cash equivalents 1.69% 28,430,091 10,500,000 17,930,091 -Financial assets at amortised cost 2.45% 12,500,000 12,500,000 - -
SSeennssiittiivviittyyProfit or loss is sensitive to higher/lower interest income from cash and cash equivalents as a result of changes in interest rates. 2020 2019
$ $Impact of a 1% movement in interest rates on profit and loss and equity* 193,217 179,301* Holding all other variables constant
BBoorrrroowwiinnggssBorrowings are subject to interest rate risk - the risk that movements in interest rates could adversely affect funding costs. The City manages this risk by borrowing long term and fixing the interest rate to the situation considered the most advantageous at the time of negotiation. The City does not consider there to be any interest rate risk in relation to borrowings. Details of interest rates applicable to each borrowing may be found at Note 17(b).
Borrowings and other liabilities Availability of commited credit lines and borrowing facilities
ManagementLong term borrowings at variable rates
Exposure arising from
Cash and cash equivalents, trade receivables, financial assets and debt investments
Diversification of bank deposits, credit limits. Investment policy
Utilise fixed interest rate borrowings
Page 44
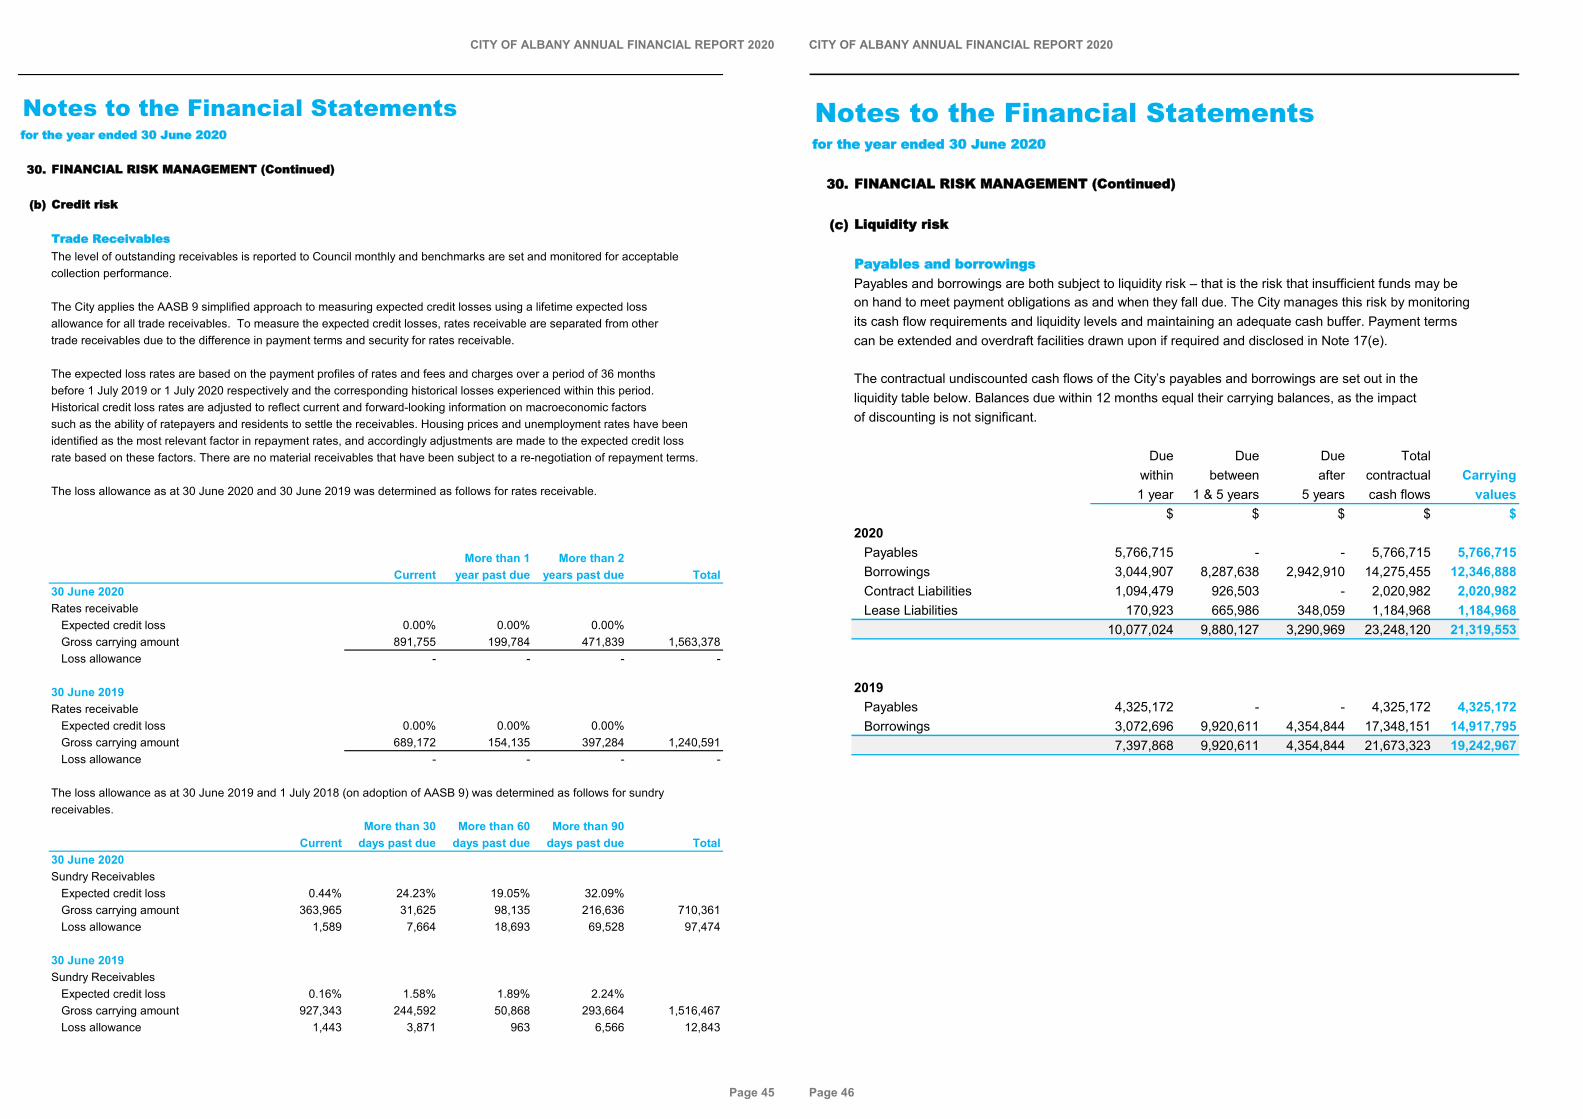
CITY OF ALBANY ANNUAL FINANCIAL REPORT 2020
Notes to the Financial Statementsffoorr tthhee yyeeaarr eennddeedd 3300 JJuunnee 22002200
3300.. FFIINNAANNCCIIAALL RRIISSKK MMAANNAAGGEEMMEENNTT ((CCoonnttiinnuueedd))
((bb)) CCrreeddiitt rriisskk
TTrraaddee RReecceeiivvaabblleessThe level of outstanding receivables is reported to Council monthly and benchmarks are set and monitored for acceptable collection performance.
The City applies the AASB 9 simplified approach to measuring expected credit losses using a lifetime expected loss allowance for all trade receivables. To measure the expected credit losses, rates receivable are separated from other trade receivables due to the difference in payment terms and security for rates receivable.
The expected loss rates are based on the payment profiles of rates and fees and charges over a period of 36 months before 1 July 2019 or 1 July 2020 respectively and the corresponding historical losses experienced within this period. Historical credit loss rates are adjusted to reflect current and forward-looking information on macroeconomic factors such as the ability of ratepayers and residents to settle the receivables. Housing prices and unemployment rates have been identified as the most relevant factor in repayment rates, and accordingly adjustments are made to the expected credit loss rate based on these factors. There are no material receivables that have been subject to a re-negotiation of repayment terms.
The loss allowance as at 30 June 2020 and 30 June 2019 was determined as follows for rates receivable.
More than 1 More than 2Current year past due years past due Total
30 June 2020Rates receivable
Expected credit loss 0.00% 0.00% 0.00%Gross carrying amount 891,755 199,784 471,839 1,563,378Loss allowance - - - -
30 June 2019Rates receivable
Expected credit loss 0.00% 0.00% 0.00%Gross carrying amount 689,172 154,135 397,284 1,240,591Loss allowance - - - -
The loss allowance as at 30 June 2019 and 1 July 2018 (on adoption of AASB 9) was determined as follows for sundryreceivables.
More than 30 More than 60 More than 90Current days past due days past due days past due Total
30 June 2020Sundry Receivables
Expected credit loss 0.44% 24.23% 19.05% 32.09%Gross carrying amount 363,965 31,625 98,135 216,636 710,361Loss allowance 1,589 7,664 18,693 69,528 97,474
30 June 2019Sundry Receivables
Expected credit loss 0.16% 1.58% 1.89% 2.24%Gross carrying amount 927,343 244,592 50,868 293,664 1,516,467Loss allowance 1,443 3,871 963 6,566 12,843
Page 45
CITY OF ALBANY ANNUAL FINANCIAL REPORT 2020
Notes to the Financial Statementsffoorr tthhee yyeeaarr eennddeedd 3300 JJuunnee 22002200
3300.. FFIINNAANNCCIIAALL RRIISSKK MMAANNAAGGEEMMEENNTT ((CCoonnttiinnuueedd))
((cc)) LLiiqquuiiddiittyy rriisskk
PPaayyaabblleess aanndd bboorrrroowwiinnggssPayables and borrowings are both subject to liquidity risk – that is the risk that insufficient funds may be on hand to meet payment obligations as and when they fall due. The City manages this risk by monitoring its cash flow requirements and liquidity levels and maintaining an adequate cash buffer. Payment terms can be extended and overdraft facilities drawn upon if required and disclosed in Note 17(e).
The contractual undiscounted cash flows of the City’s payables and borrowings are set out in the liquidity table below. Balances due within 12 months equal their carrying balances, as the impact of discounting is not significant.
Due Due Due Totalwithin between after contractual Carrying1 year 1 & 5 years 5 years cash flows values
$ $ $ $ $2020
Payables 5,766,715 - - 5,766,715 5,766,715Borrowings 3,044,907 8,287,638 2,942,910 14,275,455 12,346,888Contract Liabilities 1,094,479 926,503 - 2,020,982 2,020,982Lease Liabilities 170,923 665,986 348,059 1,184,968 1,184,968
10,077,024 9,880,127 3,290,969 23,248,120 21,319,553
2019Payables 4,325,172 - - 4,325,172 4,325,172Borrowings 3,072,696 9,920,611 4,354,844 17,348,151 14,917,795
7,397,868 9,920,611 4,354,844 21,673,323 19,242,967
Page 46
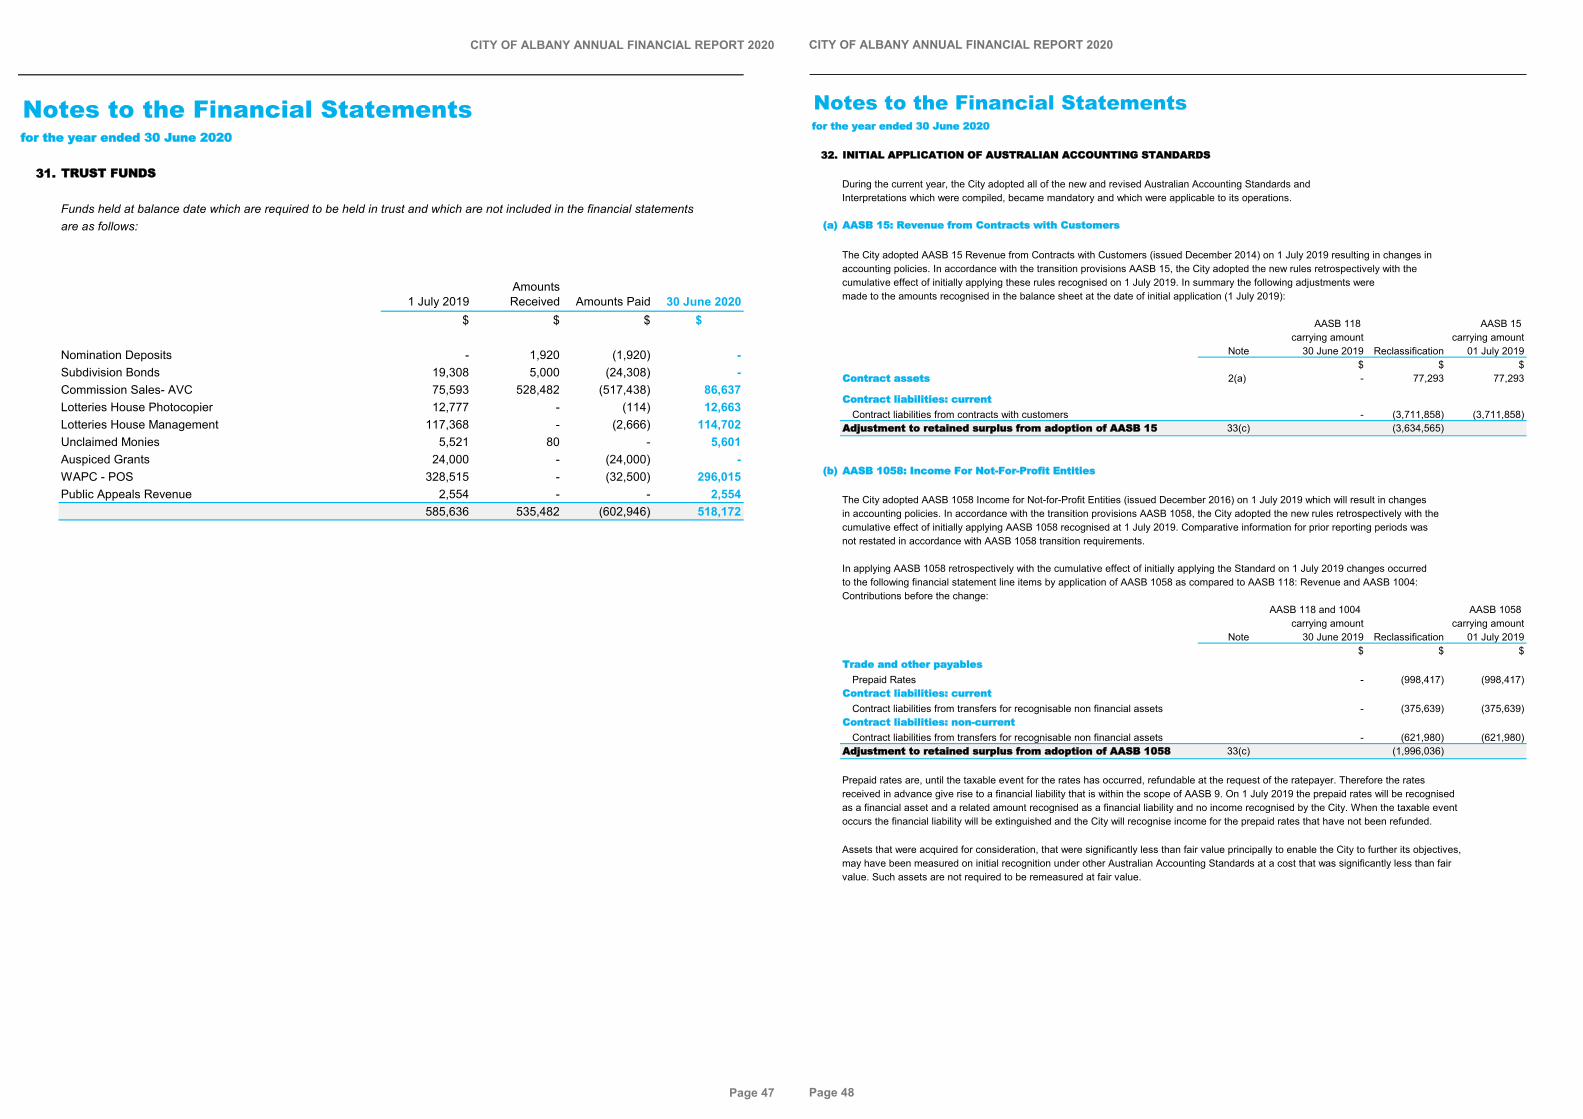
CITY OF ALBANY ANNUAL FINANCIAL REPORT 2020
Notes to the Financial Statementsffoorr tthhee yyeeaarr eennddeedd 3300 JJuunnee 22002200
3311.. TTRRUUSSTT FFUUNNDDSS
Funds held at balance date which are required to be held in trust and which are not included in the financial statementsare as follows:
1 July 2019Amounts Received Amounts Paid 30 June 2020
$ $ $ $
Nomination Deposits - 1,920 (1,920) -Subdivision Bonds 19,308 5,000 (24,308) -Commission Sales- AVC 75,593 528,482 (517,438) 86,637Lotteries House Photocopier 12,777 - (114) 12,663Lotteries House Management 117,368 - (2,666) 114,702Unclaimed Monies 5,521 80 - 5,601Auspiced Grants 24,000 - (24,000) -WAPC - POS 328,515 - (32,500) 296,015Public Appeals Revenue 2,554 - - 2,554
585,636 535,482 (602,946) 518,172
Page 47
CITY OF ALBANY ANNUAL FINANCIAL REPORT 2020
Notes to the Financial Statementsffoorr tthhee yyeeaarr eennddeedd 3300 JJuunnee 22002200
3322.. IINNIITTIIAALL AAPPPPLLIICCAATTIIOONN OOFF AAUUSSTTRRAALLIIAANN AACCCCOOUUNNTTIINNGG SSTTAANNDDAARRDDSS
During the current year, the City adopted all of the new and revised Australian Accounting Standards and Interpretations which were compiled, became mandatory and which were applicable to its operations.
((aa)) AAAASSBB 1155:: RReevveennuuee ffrroomm CCoonnttrraaccttss wwiitthh CCuussttoommeerrss
The City adopted AASB 15 Revenue from Contracts with Customers (issued December 2014) on 1 July 2019 resulting in changes inaccounting policies. In accordance with the transition provisions AASB 15, the City adopted the new rules retrospectively with the cumulative effect of initially applying these rules recognised on 1 July 2019. In summary the following adjustments were made to the amounts recognised in the balance sheet at the date of initial application (1 July 2019):
AASB 118 AASB 15 carrying amount carrying amount
Note 30 June 2019 Reclassification 01 July 2019$ $ $
CCoonnttrraacctt aasssseettss 2(a) - 77,293 77,293
CCoonnttrraacctt lliiaabbiilliittiieess:: ccuurrrreennttContract liabilities from contracts with customers - (3,711,858) (3,711,858)
AAddjjuussttmmeenntt ttoo rreettaaiinneedd ssuurrpplluuss ffrroomm aaddooppttiioonn ooff AAAASSBB 1155 33(c) (3,634,565)
((bb)) AAAASSBB 11005588:: IInnccoommee FFoorr NNoott--FFoorr--PPrrooffiitt EEnnttiittiieess
The City adopted AASB 1058 Income for Not-for-Profit Entities (issued December 2016) on 1 July 2019 which will result in changesin accounting policies. In accordance with the transition provisions AASB 1058, the City adopted the new rules retrospectively with the cumulative effect of initially applying AASB 1058 recognised at 1 July 2019. Comparative information for prior reporting periods wasnot restated in accordance with AASB 1058 transition requirements.
In applying AASB 1058 retrospectively with the cumulative effect of initially applying the Standard on 1 July 2019 changes occurredto the following financial statement line items by application of AASB 1058 as compared to AASB 118: Revenue and AASB 1004: Contributions before the change:
AASB 118 and 1004 AASB 1058 carrying amount carrying amount
Note 30 June 2019 Reclassification 01 July 2019$ $ $
TTrraaddee aanndd ootthheerr ppaayyaabblleessPrepaid Rates - (998,417) (998,417)
CCoonnttrraacctt lliiaabbiilliittiieess:: ccuurrrreennttContract liabilities from transfers for recognisable non financial assets - (375,639) (375,639)
CCoonnttrraacctt lliiaabbiilliittiieess:: nnoonn--ccuurrrreennttContract liabilities from transfers for recognisable non financial assets - (621,980) (621,980)
AAddjjuussttmmeenntt ttoo rreettaaiinneedd ssuurrpplluuss ffrroomm aaddooppttiioonn ooff AAAASSBB 11005588 33(c) (1,996,036)
Prepaid rates are, until the taxable event for the rates has occurred, refundable at the request of the ratepayer. Therefore the ratesreceived in advance give rise to a financial liability that is within the scope of AASB 9. On 1 July 2019 the prepaid rates will be recognised as a financial asset and a related amount recognised as a financial liability and no income recognised by the City. When the taxable event occurs the financial liability will be extinguished and the City will recognise income for the prepaid rates that have not been refunded.
Assets that were acquired for consideration, that were significantly less than fair value principally to enable the City to further its objectives, may have been measured on initial recognition under other Australian Accounting Standards at a cost that was significantly less than fair value. Such assets are not required to be remeasured at fair value.
Page 48

CITY OF ALBANY ANNUAL FINANCIAL REPORT 2020
Notes to the Financial Statementsffoorr tthhee yyeeaarr eennddeedd 3300 JJuunnee 22002200
3322.. IINNIITTIIAALL AAPPPPLLIICCAATTIIOONN OOFF AAUUSSTTRRAALLIIAANN AACCCCOOUUNNTTIINNGG SSTTAANNDDAARRDDSS ((CCoonnttiinnuueedd))
The table below provides details of the amount by which each financial statement line item is affected in the current reporting period by the application of this Standard as compared to AASB 118 and 1004 and related Interpretations that were in effect before the change.
As reported under AASB 15 and
AASB 1058
Adjustment due to application of
AASB 15 and AASB 1058
Compared to AASB 118 and
AASB 1004
Note 30 June 2020 Reclassification 30 June 2020$ $
SSttaatteemmeenntt ooff CCoommpprreehheennssiivvee IInnccoommee
RReevveennuueeRates 28 38,433,958 1,119,712 39,553,670Non-operating grants, subsidies and contributions 2(a) 8,177,274 1,371,645 9,548,919
Net result 6,729,930 2,491,357 9,221,287
SSttaatteemmeenntt ooff FFiinnaanncciiaall PPoossiittiioonnContract assets 2(a) 649,337 (649,337) -Trade and other payables 14 5,766,715 (1,119,712) 4,647,003Contract liabilities 15 2,020,982 (2,020,982) -
Net assets 586,792,851 2,491,357 589,284,208
SSttaatteemmeenntt ooff CChhaannggeess iinn EEqquuiittyyNet result 6,729,930 2,491,357 9,221,287Retained surplus 313,865,617 2,491,357 316,356,974
Refer to Note 2(a) for new revenue recognition accounting policies as a result of the application of AASB 15 and AASB 1058.
((cc)) AAAASSBB 1166:: LLeeaasseessThe City adopted AASB 16 retrospectively from 1 July 2019 which will result in a change to accounting policies. In accordance with the transition provisions of AASB 16, the City will apply this Standard to its leases retrospectively, with the cumulative effect of initially applying AASB16 recognised on 1 July 2019. In applying the AASB 16 under the specific transition provisions chosen, the City will not restate comparatives for prior reporting periods.
On adoption of AASB 16, the City recognised lease liabilties in relation to leases which had previously been classified as an 'operating lease' applying AASB 117 (excluding short term and low value leases). These lease liabilities were measured at the present value of the AASB 108.31(e) the remaining lease payments, discounted using the lessee's incremental borrowing rate on 1 July 2019. The weighted average lessee's incremental borrowing rate applied to the lease liabilities on 1 July 2019 was 1.62%.
Note 2019$
Operating lease commitments disclosed as at 30 June 2019 applying AAS 117 1,680,359Lease liability recognised as at 1 July 2019 1,442,865Discounted using the City's incremental borrowing rate of 1.62% 1,353,159
Lease Liability - Current 16(b) (168,191)Lease Liability - Non Current 16(a) (1,184,968)Right-of-use asset recognised at at 1 July 2019 1,331,930AAddjjuussttmmeenntt ttoo rreettaaiinneedd ssuurrpplluuss ffrroomm aaddooppttiioonn ooff AAAASSBB 1166 33(c) (21,229)
On adoption of AASB 16, the City recognised a right-of-use asset in relation to leases which had previously been classified as an 'operating lease' applying AASB 117. This right-of-use asset is deemed to be equal to the lease liability adjusted by the amount of any prepaid or accrued lease payments. Property, plant and equipment and lease liabilities increased by $1,331,930 and $1,353,159 respectively on 1 July 2019, resulting in a $21,229 impact on retained surplus.
On adoption of AASB 16 Leases (issued February 2016), for leases which had previously been classified as an 'operating lease' when applying AASB 117, the City is not required to make any adjustments on transition for leases for which the underlying asset is of low value. Assets for which the fair value as at the date of acquisition is under $5,000 are not recognised as an asset in accordance with Financial Management Regulation 17A (5).
In applying AASB 16 for the first time, the City will use the following practical expedient permitted by the standard. - The exclusion of initial direct costs from the measurement of the right-of-use asset at the date of initial application.
Page 49
CITY OF ALBANY ANNUAL FINANCIAL REPORT 2020
Notes to the Financial Statementsffoorr tthhee yyeeaarr eennddeedd 3300 JJuunnee 22002200
3333.. CCHHAANNGGEE IINN AACCCCOOUUNNTTIINNGG PPOOLLIICCYY
((aa)) UUnnrreeccooggnniisseedd pprroovviissiioonn ffoorr ffuuttuurree llaannddffiillll cclloossuurree aanndd rreehhaabbiilliittaattiioonnDuring the year a provision for the closure of the Albany Refuse Facility was recognised.As recognition of this should have been at the inception of the landfill activity, the provision is being recognised as a prior period adjustment.
An adjustment has been made, restating each of the affected financial statement line items for the prior periods as follows:
3300 JJUUNNEE 22001188 IIMMPPAACCTT
30 June 2018OriginalBalance
Amount of Adjustment
1 July 2018Restated
$ $ $SSttaatteemmeenntt ooff FFiinnaanncciiaall PPoossiittiioonnNNoonn--ccuurrrreenntt AAsssseettssInfrastructure 395,452,741 4,144,023 399,596,764NNoonn--ccuurrrreenntt LLiiaabbiilliittiieessOther Provisions - (8,000,000) (8,000,000)EEqquuiittyyRetained Surplus 308,022,546 (3,855,977) 304,166,569
3300 JJUUNNEE 22001199 IIMMPPAACCTT
30 June 2019OriginalBalance
Amount of Adjustment
30 June 2019Restated
$ $ $SSttaatteemmeenntt ooff CCoommpprreehheennssiivvee IInnccoommeeBByy NNaattuurree oorr TTyyppeeDepreciation (15,883,869) (297,774) (16,181,643)
BByy pprrooggrraammEExxppeennsseessCommunity amenities (9,163,217) (297,774) (9,460,991)
SSttaatteemmeenntt ooff FFiinnaanncciiaall PPoossiittiioonnNNoonn--ccuurrrreenntt AAsssseettssInfrastructure 399,072,838 3,846,249 402,919,087NNoonn--ccuurrrreenntt LLiiaabbiilliittiieessOther Provisions (207,247) (8,000,000) (8,207,247)EEqquuiittyyRetained Surplus 312,705,258 (4,153,751) 308,551,507
RRaattee SSeettttiinngg SSttaatteemmeennttEExxppeennddiittuurree ffrroomm ooppeerraattiinngg aaccttiivviittiieessDepreciation on non-current assets (15,883,869) (297,774) (16,181,643)
Non-cash amounts excluded from operating activities (16,226,169) (297,774) (16,523,943)
IInnffrraassttrruuccttuurreeIInnffrraassttrruuccttuurree -- OOtthheerrGross carrying amount 98,658,319 5,657,708 104,316,027Accumulated depreciation (33,211,775) (1,811,459) (35,023,234)Carrying Amount 65,446,544 3,846,249 69,292,793
DDeepprreecciiaattiioonnInfrastructure - Other (1,709,124) (297,774) (2,006,898)
Page 50
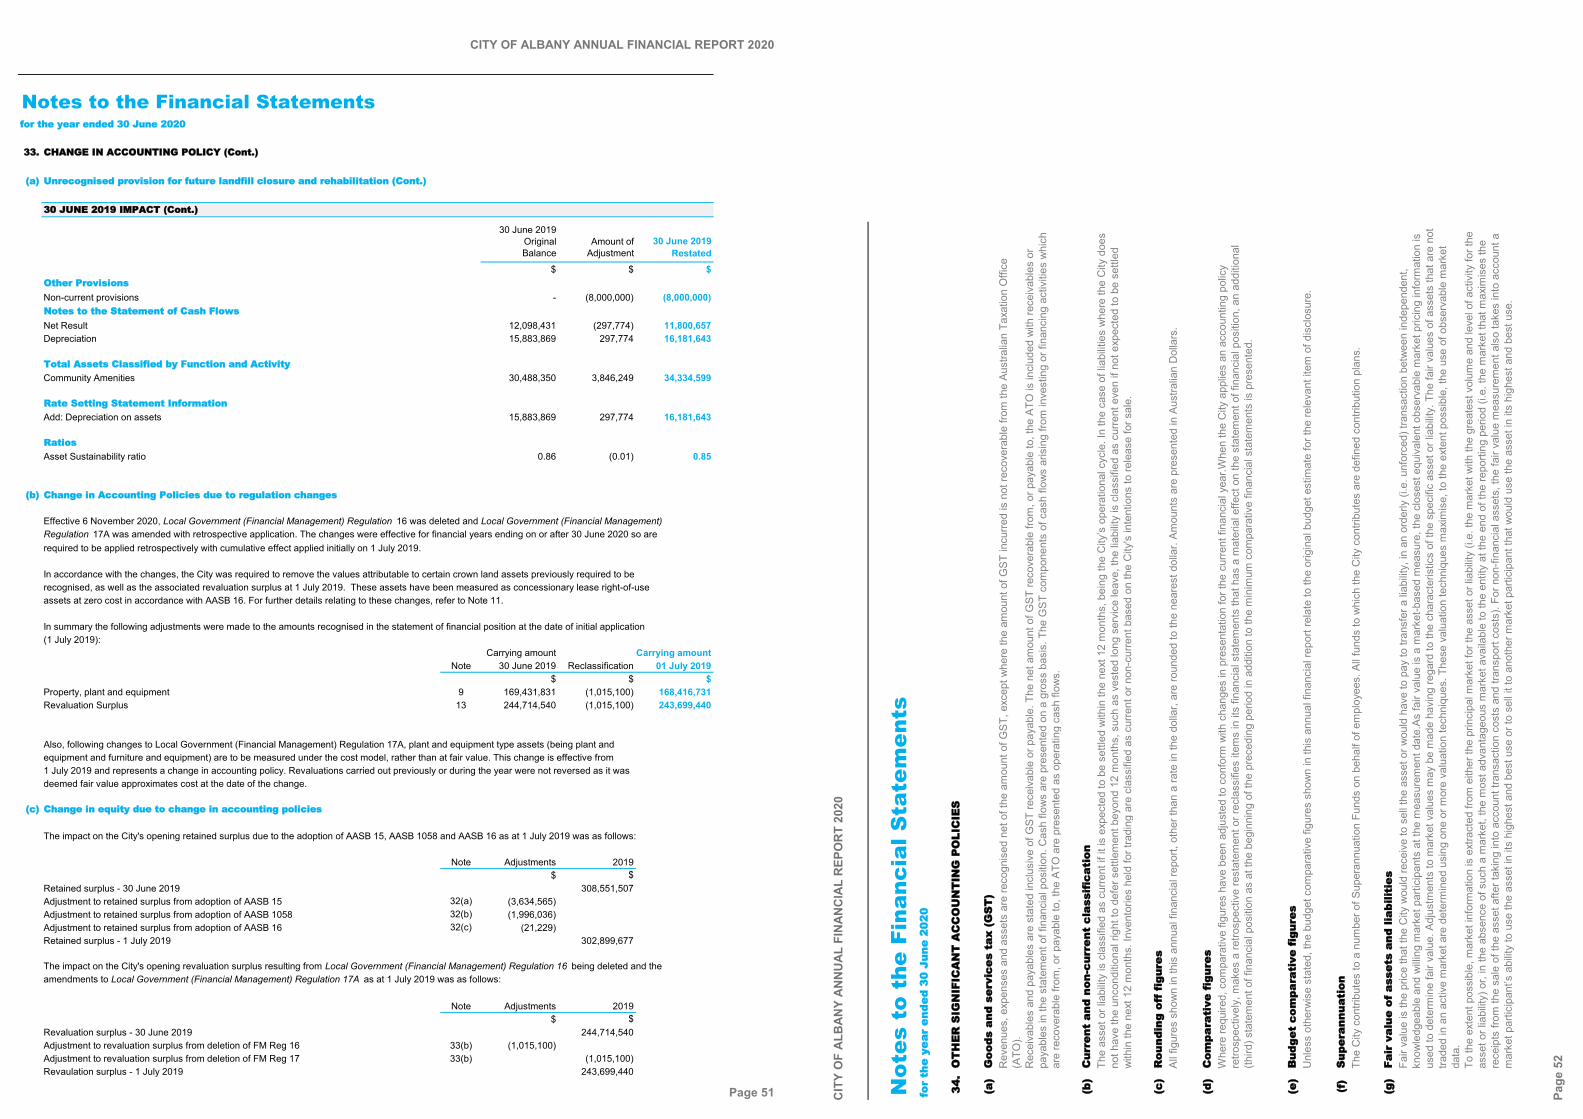
CITY OF ALBANY ANNUAL FINANCIAL REPORT 2020
Notes to the Financial Statementsffoorr tthhee yyeeaarr eennddeedd 3300 JJuunnee 22002200
3333.. CCHHAANNGGEE IINN AACCCCOOUUNNTTIINNGG PPOOLLIICCYY ((CCoonntt..))
((aa)) UUnnrreeccooggnniisseedd pprroovviissiioonn ffoorr ffuuttuurree llaannddffiillll cclloossuurree aanndd rreehhaabbiilliittaattiioonn ((CCoonntt..))
3300 JJUUNNEE 22001199 IIMMPPAACCTT ((CCoonntt..))
30 June 2019OriginalBalance
Amount of Adjustment
30 June 2019Restated
$ $ $OOtthheerr PPrroovviissiioonnssNon-current provisions - (8,000,000) (8,000,000)NNootteess ttoo tthhee SSttaatteemmeenntt ooff CCaasshh FFlloowwssNet Result 12,098,431 (297,774) 11,800,657Depreciation 15,883,869 297,774 16,181,643
TToottaall AAsssseettss CCllaassssiiffiieedd bbyy FFuunnccttiioonn aanndd AAccttiivviittyyCommunity Amenities 30,488,350 3,846,249 34,334,599
RRaattee SSeettttiinngg SSttaatteemmeenntt IInnffoorrmmaattiioonnAdd: Depreciation on assets 15,883,869 297,774 16,181,643
RRaattiioossAsset Sustainability ratio 0.86 (0.01) 0.85
((bb)) CChhaannggee iinn AAccccoouunnttiinngg PPoolliicciieess dduuee ttoo rreegguullaattiioonn cchhaannggeess
Effective 6 November 2020, Local Government (Financial Management) Regulation 16 was deleted and Local Government (Financial Management) Regulation 17A was amended with retrospective application. The changes were effective for financial years ending on or after 30 June 2020 so arerequired to be applied retrospectively with cumulative effect applied initially on 1 July 2019.
In accordance with the changes, the City was required to remove the values attributable to certain crown land assets previously required to berecognised, as well as the associated revaluation surplus at 1 July 2019. These assets have been measured as concessionary lease right-of-useassets at zero cost in accordance with AASB 16. For further details relating to these changes, refer to Note 11.
In summary the following adjustments were made to the amounts recognised in the statement of financial position at the date of initial application(1 July 2019):
Carrying amount Carrying amountNote 30 June 2019 Reclassification 01 July 2019
$ $ $Property, plant and equipment 9 169,431,831 (1,015,100) 168,416,731Revaluation Surplus 13 244,714,540 (1,015,100) 243,699,440
Also, following changes to Local Government (Financial Management) Regulation 17A, plant and equipment type assets (being plant andequipment and furniture and equipment) are to be measured under the cost model, rather than at fair value. This change is effective from1 July 2019 and represents a change in accounting policy. Revaluations carried out previously or during the year were not reversed as it was deemed fair value approximates cost at the date of the change.
((cc)) CChhaannggee iinn eeqquuiittyy dduuee ttoo cchhaannggee iinn aaccccoouunnttiinngg ppoolliicciieess
The impact on the City's opening retained surplus due to the adoption of AASB 15, AASB 1058 and AASB 16 as at 1 July 2019 was as follows:
Note Adjustments 2019$ $
Retained surplus - 30 June 2019 308,551,507Adjustment to retained surplus from adoption of AASB 15 32(a) (3,634,565)Adjustment to retained surplus from adoption of AASB 1058 32(b) (1,996,036)Adjustment to retained surplus from adoption of AASB 16 32(c) (21,229)Retained surplus - 1 July 2019 302,899,677
The impact on the City's opening revaluation surplus resulting from Local Government (Financial Management) Regulation 16 being deleted and the amendments to Local Government (Financial Management) Regulation 17A as at 1 July 2019 was as follows:
Note Adjustments 2019$ $
Revaluation surplus - 30 June 2019 244,714,540Adjustment to revaluation surplus from deletion of FM Reg 16 33(b) (1,015,100)Adjustment to revaluation surplus from deletion of FM Reg 17 33(b) (1,015,100)Revaulation surplus - 1 July 2019 243,699,440
Page 51 CIT
Y O
F A
LBA
NY
AN
NU
AL
FIN
AN
CIA
L R
EPO
RT
2020
Not
es t
o th
e Fi
nanc
ial S
tate
men
tsffoo
rr tthh
ee yyee
aarr ee
nnddeedd
3300
JJuunnee
220022
00
3344..
OOTT
HHEE
RR SS
IIGGNN
IIFFIICC
AANN
TT AA
CCCC
OOUU
NNTT
IINNGG
PPOO
LLIICC
IIEESS
((aa))
GGoooo
ddss aa
nndd ss
eerrvvii
cceess
ttaaxx
((GGSS
TT))
Rev
enue
s, e
xpen
ses
and
asse
ts a
re re
cogn
ised
net
of t
he a
mou
nt o
f GST
, exc
ept w
here
the
amou
nt o
f GST
incu
rred
is n
ot re
cove
rabl
e fro
m th
e Au
stra
lian
Taxa
tion
Offi
ce
(ATO
).R
ecei
vabl
es a
nd p
ayab
les
are
stat
ed in
clus
ive
of G
ST re
ceiv
able
or p
ayab
le. T
he n
et a
mou
nt o
f GST
reco
vera
ble
from
, or p
ayab
le to
, the
ATO
is in
clud
ed w
ith re
ceiv
able
s or
pa
yabl
es in
the
stat
emen
t of f
inan
cial
pos
ition
. Cas
h flo
ws
are
pres
ente
d on
a g
ross
bas
is. T
he G
ST c
ompo
nent
s of
cas
h flo
ws
aris
ing
from
inve
stin
g or
fina
ncin
g ac
tiviti
es w
hich
ar
e re
cove
rabl
e fro
m, o
r pay
able
to, t
he A
TO a
re p
rese
nted
as
oper
atin
g ca
sh fl
ows.
((bb))
CCuurr
rreenntt
aanndd
nnoonn
--ccuurr
rreenntt
ccllaa
ssssiiff
iiccaatt
iioonn
The
asse
t or l
iabi
lity
is c
lass
ified
as
curre
nt if
it is
exp
ecte
d to
be
settl
ed w
ithin
the
next
12
mon
ths,
bei
ng th
e C
ity’s
ope
ratio
nal c
ycle
. In
the
case
of l
iabi
litie
s w
here
the
City
doe
s no
t hav
e th
e un
cond
ition
al ri
ght t
o de
fer s
ettle
men
t bey
ond
12 m
onth
s, s
uch
as v
este
d lo
ng s
ervi
ce le
ave,
the
liabi
lity
is c
lass
ified
as
curre
nt e
ven
if no
t exp
ecte
d to
be
settl
ed
with
in th
e ne
xt 1
2 m
onth
s. In
vent
orie
s he
ld fo
r tra
ding
are
cla
ssifi
ed a
s cu
rrent
or n
on-c
urre
nt b
ased
on
the
City
's in
tent
ions
to re
leas
e fo
r sal
e.
((cc))
RRoouu
nnddiinn
gg ooff
ff ffii
gguurree
ssAl
l fig
ures
sho
wn
in th
is a
nnua
l fin
anci
al re
port,
oth
er th
an a
rate
in th
e do
llar,
are
roun
ded
to th
e ne
ares
t dol
lar.
Amou
nts
are
pres
ente
d in
Aus
tralia
n D
olla
rs.
((dd))
CCoomm
ppaarraa
ttiivvee
ffiigg
uurreess
Whe
re re
quire
d, c
ompa
rativ
e fig
ures
hav
e be
en a
djus
ted
to c
onfo
rm w
ith c
hang
es in
pre
sent
atio
n fo
r the
cur
rent
fina
ncia
l yea
r.Whe
n th
e C
ity a
pplie
s an
acc
ount
ing
polic
y re
trosp
ectiv
ely,
mak
es a
retro
spec
tive
rest
atem
ent o
r rec
lass
ifies
item
s in
its
finan
cial
sta
tem
ents
that
has
a m
ater
ial e
ffect
on
the
stat
emen
t of f
inan
cial
pos
ition
, an
addi
tiona
l (th
ird) s
tate
men
t of f
inan
cial
pos
ition
as
at th
e be
ginn
ing
of th
e pr
eced
ing
perio
d in
add
ition
to th
e m
inim
um c
ompa
rativ
e fin
anci
al s
tate
men
ts is
pre
sent
ed.
((ee))
BBuudd
ggeett
ccoomm
ppaarraa
ttiivvee
ffiigg
uurreess
Unl
ess
othe
rwis
e st
ated
, the
bud
get c
ompa
rativ
e fig
ures
sho
wn
in th
is a
nnua
l fin
anci
al re
port
rela
te to
the
orig
inal
bud
get e
stim
ate
for t
he re
leva
nt it
em o
f dis
clos
ure.
((ff))
SSuupp
eerraann
nnuuaatt
iioonn
The
City
con
tribu
tes
to a
num
ber o
f Sup
eran
nuat
ion
Fund
s on
beh
alf o
f em
ploy
ees.
All
fund
s to
whi
ch th
e C
ity c
ontri
bute
s ar
e de
fined
con
tribu
tion
plan
s.
((gg))
FFaaiirr
vvaall
uuee oo
ff aass
sseettss
aanndd
lliiaabb
iilliittii
eessFa
ir va
lue
is th
e pr
ice
that
the
City
wou
ld re
ceiv
e to
sel
l the
ass
et o
r wou
ld h
ave
to p
ay to
tran
sfer
a li
abilit
y, in
an
orde
rly (i
.e. u
nfor
ced)
tran
sact
ion
betw
een
inde
pend
ent,
know
ledg
eabl
e an
d w
illing
mar
ket p
artic
ipan
ts a
t the
mea
sure
men
t dat
e.As
fair
valu
e is
a m
arke
t-bas
ed m
easu
re, t
he c
lose
st e
quiv
alen
t obs
erva
ble
mar
ket p
ricin
g in
form
atio
n is
us
ed to
det
erm
ine
fair
valu
e. A
djus
tmen
ts to
mar
ket v
alue
s m
ay b
e m
ade
havi
ng re
gard
to th
e ch
arac
teris
tics
of th
e sp
ecifi
c as
set o
r lia
bilit
y. T
he fa
ir va
lues
of a
sset
s th
at a
re n
ot
trade
d in
an
activ
e m
arke
t are
det
erm
ined
usi
ng o
ne o
r mor
e va
luat
ion
tech
niqu
es. T
hese
val
uatio
n te
chni
ques
max
imis
e, to
the
exte
nt p
ossi
ble,
the
use
of o
bser
vabl
e m
arke
t da
ta.
To th
e ex
tent
pos
sibl
e, m
arke
t inf
orm
atio
n is
ext
ract
ed fr
om e
ither
the
prin
cipa
l mar
ket f
or th
e as
set o
r lia
bilit
y (i.
e. th
e m
arke
t with
the
grea
test
vol
ume
and
leve
l of a
ctiv
ity fo
r the
as
set o
r lia
bilit
y) o
r, in
the
abse
nce
of s
uch
a m
arke
t, th
e m
ost a
dvan
tage
ous
mar
ket a
vaila
ble
to th
e en
tity
at th
e en
d of
the
repo
rting
per
iod
(i.e.
the
mar
ket t
hat m
axim
ises
the
rece
ipts
from
the
sale
of t
he a
sset
afte
r tak
ing
into
acc
ount
tran
sact
ion
cost
s an
d tra
nspo
rt co
sts)
. For
non
-fina
ncia
l ass
ets,
the
fair
valu
e m
easu
rem
ent a
lso
take
s in
to a
ccou
nt a
m
arke
t par
ticip
ant’s
abi
lity
to u
se th
e as
set i
n its
hig
hest
and
bes
t use
or t
o se
ll it
to a
noth
er m
arke
t par
ticip
ant t
hat w
ould
use
the
asse
t in
its h
ighe
st a
nd b
est u
se.
Page
52

CIT
Y O
F A
LBA
NY
AN
NU
AL
FIN
AN
CIA
L R
EPO
RT
2020
Not
es t
o th
e Fi
nanc
ial S
tate
men
tsffoo
rr tthh
ee yyee
aarr ee
nnddeedd
3300
JJuunnee
220022
00
3344..
OOTT
HHEE
RR SS
IIGGNN
IIFFIICC
AANN
TT AA
CCCC
OOUU
NNTT
IINNGG
PPOO
LLIICC
IIEESS
((CC
oonnttii
nnuueedd
))
((hh))
FFaaiirr
vvaall
uuee hh
iieerraa
rrcchhyy
AASB
13
requ
ires
the
disc
losu
re o
f fai
r val
ue in
form
atio
n by
leve
l of t
he fa
ir va
lue
hier
arch
y, w
hich
cat
egor
ises
fair
valu
e m
easu
rem
ent i
nto
one
of th
ree
poss
ible
leve
ls b
ased
on
the
low
est l
evel
that
an
inpu
t tha
t is
sign
ifica
nt to
the
mea
sure
men
t can
be
cate
goris
ed in
to a
s fo
llow
s:Le
vel 1
Mea
sure
men
ts b
ased
on
quot
ed p
rices
(una
djus
ted)
in a
ctiv
e m
arke
ts fo
r ide
ntic
al a
sset
s or
liab
ilitie
s th
at th
e en
tity
can
acce
ss a
t the
mea
sure
men
t dat
e.Le
vel 2
Mea
sure
men
ts b
ased
on
inpu
ts o
ther
than
quo
ted
pric
es in
clud
ed in
Lev
el 1
that
are
obs
erva
ble
for t
he a
sset
or l
iabi
lity,
eith
er d
irect
ly o
r ind
irect
ly.
Leve
l 3M
easu
rem
ents
bas
ed o
n un
obse
rvab
le in
puts
for t
he a
sset
or l
iabi
lity.
The
fair
valu
es o
f ass
ets
and
liabi
litie
s th
at a
re n
ot tr
aded
in a
n ac
tive
mar
ket a
re d
eter
min
ed u
sing
one
or m
ore
valu
atio
n te
chni
ques
. The
se v
alua
tion
tech
niqu
es m
axim
ise,
to
the
exte
nt p
ossi
ble,
the
use
of o
bser
vabl
e m
arke
t dat
a. If
all
sign
ifica
nt in
puts
requ
ired
to m
easu
re fa
ir va
lue
are
obse
rvab
le, t
he a
sset
or l
iabi
lity
is in
clud
ed in
Lev
el 2
. If o
ne o
r m
ore
sign
ifica
nt in
puts
are
not
bas
ed o
n ob
serv
able
mar
ket d
ata,
the
asse
t or l
iabi
lity
is in
clud
ed in
Lev
el 3
.Va
luat
ion
tech
niqu
esTh
e C
ity s
elec
ts a
val
uatio
n te
chni
que
that
is a
ppro
pria
te in
the
circ
umst
ance
s an
d fo
r whi
ch s
uffic
ient
dat
a is
ava
ilabl
e to
mea
sure
fair
valu
e. T
he a
vaila
bilit
y of
suf
ficie
nt a
nd
rele
vant
dat
a pr
imar
ily d
epen
ds o
n th
e sp
ecifi
c ch
arac
teris
tics
of th
e as
set o
r lia
bilit
y be
ing
mea
sure
d. T
he v
alua
tion
tech
niqu
es s
elec
ted
by th
e C
ity a
re c
onsi
sten
t with
one
or
mor
e of
the
follo
win
g va
luat
ion
appr
oach
es:
Mar
ket a
ppro
ach
Valu
atio
n te
chni
ques
that
use
pric
es a
nd o
ther
rele
vant
info
rmat
ion
gene
rate
d by
mar
ket t
rans
actio
ns fo
r ide
ntic
al o
r sim
ilar a
sset
s or
liab
ilitie
s.In
com
e ap
proa
chVa
luat
ion
tech
niqu
es th
at c
onve
rt es
timat
ed fu
ture
cas
h flo
ws
or in
com
e an
d ex
pens
es in
to a
sin
gle
disc
ount
ed p
rese
nt v
alue
.C
ost a
ppro
ach
Valu
atio
n te
chni
ques
that
refle
ct th
e cu
rrent
repl
acem
ent c
ost o
f the
ser
vice
cap
acity
of a
n as
set.
Each
val
uatio
n te
chni
que
requ
ires
inpu
ts th
at re
flect
the
assu
mpt
ions
that
buy
ers
and
selle
rs w
ould
use
whe
n pr
icin
g th
e as
set o
r lia
bilit
y, in
clud
ing
assu
mpt
ions
abo
ut ri
sks.
W
hen
sele
ctin
g a
valu
atio
n te
chni
que,
the
City
giv
es p
riorit
y to
thos
e te
chni
ques
that
max
imis
e th
e us
e of
obs
erva
ble
inpu
ts a
nd m
inim
ise
the
use
of u
nobs
erva
ble
inpu
ts. I
nput
s th
at a
re d
evel
oped
usi
ng m
arke
t dat
a (s
uch
as p
ublic
ly a
vaila
ble
info
rmat
ion
on a
ctua
l tra
nsac
tions
) and
refle
ct th
e as
sum
ptio
ns th
at b
uyer
s an
d se
llers
wou
ld g
ener
ally
use
whe
n pr
icin
g th
e as
set o
r lia
bilit
y ar
e co
nsid
ered
obs
erva
ble,
whe
reas
inpu
ts fo
r whi
ch m
arke
t dat
a is
not
ava
ilabl
e an
d th
eref
ore
are
deve
lope
d us
ing
the
best
info
rmat
ion
avai
labl
e ab
out s
uch
assu
mpt
ions
are
con
side
red
unob
serv
able
.
((ii))
IImmppaa
iirrmm
eenntt
ooff aa
sssseett
ssIn
acc
orda
nce
with
Aus
tralia
n Ac
coun
ting
Stan
dard
s th
e C
ity's
cas
h ge
nera
ting
non-
spec
ialis
ed a
sset
s, o
ther
than
inve
ntor
ies,
are
ass
esse
d at
eac
h re
porti
ng d
ate
to d
eter
min
e w
heth
er th
ere
is a
ny in
dica
tion
they
may
be
impa
ired.
Whe
re s
uch
an in
dica
tion
exis
ts, a
n im
pairm
ent t
est i
s ca
rried
out
on
the
asse
t by
com
parin
g th
e re
cove
rabl
e am
ount
of t
he
asse
t, be
ing
the
high
er o
f the
ass
et's
fair
valu
e le
ss c
osts
to s
ell a
nd v
alue
in u
se, t
o th
e as
set's
car
ryin
g am
ount
.Any
exc
ess
of th
e as
set's
car
ryin
g am
ount
ove
r its
reco
vera
ble
amou
nt is
reco
gnis
ed im
med
iate
ly in
pro
fit o
r los
s, u
nles
s th
e as
set i
s ca
rried
at a
reva
lued
am
ount
in a
ccor
danc
e w
ith a
noth
er S
tand
ard
(e.g
. AAS
B 11
6) w
here
by a
ny
impa
irmen
t los
s of
a re
valu
ed a
sset
is tr
eate
d as
a re
valu
atio
n de
crea
se in
acc
orda
nce
with
that
oth
er S
tand
ard.
For n
on-c
ash
gene
ratin
g sp
ecia
lised
ass
ets
that
are
mea
sure
d un
der t
he re
valu
atio
n m
odel
,suc
h as
road
s, d
rain
s, p
ublic
bui
ldin
gs a
nd th
e lik
e, n
o an
nual
ass
essm
ent o
f im
pairm
ent i
s re
quire
d. R
athe
r AAS
B 11
6.31
app
lies
and
reva
luat
ions
ne
ed o
nly
be m
ade
with
suf
ficie
nt re
gula
tory
to e
nsur
e th
e ca
rryin
g va
lue
does
not
diff
er m
ater
ially
from
that
whi
ch w
ould
be
dete
rmin
ed u
sing
fair
valu
e at
the
ends
of t
he
repo
rting
per
iod.
Page
53
CIT
Y O
F A
LBA
NY
AN
NU
AL
FIN
AN
CIA
L R
EPO
RT
2020
Not
es t
o th
e Fi
nanc
ial S
tate
men
tsffoo
rr tthh
ee yyee
aarr ee
nnddeedd
3300
JJuunnee
220022
00
3355..
AACC
TTIIVV
IITTIIEE
SS//PP
RROO
GGRR
AAMM
SS
The
City
's o
pera
tions
as
disc
lose
d in
thes
e fin
anci
al s
tate
men
ts e
ncom
pass
the
follo
win
g se
rvic
e or
ient
ated
act
iviti
es/p
rogr
ams.
PRO
GR
AM N
AME
OB
JEC
TIVE
SAC
TIVI
TIES
G GOO
VVEE
RRNN
AANN
CCEE
To p
rovi
de a
dec
isio
n m
akin
g pr
oces
s fo
r the
ef
ficie
nt a
lloca
tion
of s
carc
e re
sour
ces.
Incl
udes
the
activ
ities
of m
embe
rs o
f the
cou
ncil
and
the
adm
inis
trativ
e su
ppor
t ava
ilabl
e to
the
coun
cil f
or
the
prov
isio
n of
gov
erna
nce
of th
e di
stric
t. O
ther
cos
ts re
late
to th
e ta
sk o
f ass
istin
g el
ecte
d m
embe
rs a
nd
rate
paye
rs o
n m
atte
rs w
hich
do
not c
once
rn s
peci
fic c
ounc
il se
rvic
es.
GGEE
NNEE
RRAA
LL PP
UURR
PPOO
SSEE
FFUU
NNDD
IINNGG
To c
olle
ct re
venu
e to
allo
w fo
r the
pro
visi
on o
f se
rvic
es.
Rat
es, g
ener
al p
urpo
se g
over
nmen
t gra
nts
and
inte
rest
reve
nue.
LLAAWW
,, OORR
DDEE
RR,, PP
UUBB
LLIICC
SSAA
FFEETT
YYTo
pro
vide
ser
vice
s to
hel
p en
sure
a s
afer
and
en
viro
nmen
tally
con
scio
us c
omm
unity
.Su
perv
isio
n an
d en
forc
emen
t of v
ario
us lo
cal l
aws
rela
ting
to fi
re p
reve
ntio
n, a
nim
al c
ontro
l and
oth
er
aspe
cts
of p
ublic
saf
ety
incl
udin
g em
erge
ncy
serv
ices
.
HHEE
AALLTT
HHTo
pro
vide
an
oper
atio
nal f
ram
ewor
k fo
r en
viro
nmen
tal a
nd c
omm
unity
hea
lth.
Insp
ectio
n of
food
out
lets
and
thei
r con
trol,
prov
isio
n of
mea
t ins
pect
ion
serv
ices
, noi
se c
ontro
l and
was
te
disp
osal
com
plia
nce.
EEDD
UUCC
AATT
IIOONN
AANN
DD WW
EELLFF
AARR
EETo
pro
vide
ser
vice
s to
dis
adva
ntag
ed p
erso
ns,
the
elde
rly, c
hild
ren
and
yout
h.El
derly
per
son’
s ac
tiviti
es a
nd s
uppo
rt, c
omm
unity
ser
vice
s pl
anni
ng, d
isab
led
pers
ons,
you
th s
ervi
ces,
ab
orig
inal
issu
es, p
layg
roup
, pre
-sch
ools
and
oth
er w
elfa
re a
nd v
olun
tary
per
sons
.
CCOO
MMMM
UUNN
IITTYY
AAMM
EENN
IITTIIEE
SSTo
pro
vide
ser
vice
s re
quire
d by
the
com
mun
ity.
Ref
use
colle
ctio
n se
rvic
es, i
nclu
ding
recy
clin
g, g
reen
was
te a
nd h
ardw
aste
. Ope
ratio
n of
tip
faci
litie
s,
adm
inis
tratio
n of
the
Tow
n Pl
anni
ng S
chem
e, p
ublic
am
eniti
es a
nd u
rban
sto
rmw
ater
dra
inag
e w
orks
. Pr
otec
tion
of th
e en
viro
nmen
t, co
astli
ne a
nd w
ater
way
s. E
nviro
nmen
tal p
lann
ing.
RREE
CCRR
EEAA
TTIIOO
NN AA
NNDD
CCUU
LLTTUU
RREE
To e
stab
lish
and
effe
ctiv
ely
man
age
infra
stru
ctur
e an
d re
sour
ce w
hich
will
help
the
soci
al w
ell b
eing
of
the
com
mun
ity
Mai
nten
ance
of h
alls
, rec
reat
ion
and
cultu
ral f
acilit
ies,
incl
udin
g sp
orts
grou
nds,
par
ks, g
arde
ns, r
eser
ves,
pl
aygr
ound
s an
d fo
resh
ore
amen
ities
. Mai
nten
ance
of b
oat r
amps
and
jetti
es. T
owns
cape
wor
ks.
Ope
ratio
n of
the
Libr
ary,
Alb
any
Leis
ure
Cen
tre, V
anco
uver
, Art
Cen
tre, a
nd o
ther
cul
tura
l act
iviti
es.
TTRR
AANN
SSPP
OORR
TTTo
pro
vide
saf
e, e
ffect
ive
and
effic
ient
tran
spor
t se
rvic
es to
the
com
mun
ity.
Con
stru
ctio
n &
mai
nten
ance
of r
oads
, dra
inag
e, fo
otpa
ths,
brid
ges,
and
traf
fic s
igns
. Mai
nten
ance
of p
ump
stat
ions
and
road
ver
ges.
Stra
tegi
c pl
anni
ng fo
r tra
nspo
rt an
d tra
ffic
flow
s. S
treet
ligh
ting
and
stre
et c
lean
ing.
Ai
rpor
t ope
ratio
n. P
arki
ng c
ontro
l and
car
par
k m
aint
enan
ce.
EECC
OONN
OOMM
IICC SS
EERR
VVIICC
EESS
To h
elp
prom
ote
the
city
and
its
econ
omic
wel
l be
ing.
To
uris
m a
nd a
rea
prom
otio
n, o
pera
tion
of th
e Vi
sito
r Cen
tre, S
iste
r City
exp
ense
s, C
ity m
arke
ting
and
econ
omic
dev
elop
men
t, im
plem
enta
tion
of b
uild
ing
cont
rol,
oper
atio
n of
pla
nt n
urse
ry.
OOTT
HHEE
RR PP
RROO
PPEE
RRTT
YY AA
NNDD
SSEE
RRVV
IICCEE
SSTo
mon
itor a
nd c
ontro
l cou
ncil’s
ove
rhea
ds
oper
atin
g ac
coun
ts.
Priv
ate
wor
ks o
pera
tion,
pla
nt re
pair,
Pub
lic w
orks
ove
rhea
d, la
nd a
cqui
sitio
n (in
clud
ing
tow
n pl
anni
ng
sche
mes
) and
sub
divi
sion
dev
elop
men
t and
sal
es.
Page
54

CITY OF ALBANY ANNUAL FINANCIAL REPORT 2020
Notes to the Financial Statementsffoorr tthhee yyeeaarr eennddeedd 3300 JJuunnee 22002200
3366.. FFIINNAANNCCIIAALL RRAATTIIOOSS 2020 2019 2018Actual Actual Actual
Current ratio 1.11 0.94 1.06
Asset consumption ratio 0.60 0.60 0.61
Asset renewal funding ratio 0.95 1.09 0.94
Asset sustainability ratio 0.77 0.85 0.78
Debt service cover ratio 4.88 5.62 3.89
Operating surplus ratio (0.03) 0.00 (0.13)
Own source revenue coverage ratio 0.87 0.88 0.80
The above ratios are calculated as follows:
Current ratio current assets minus restricted assetscurrent liabilities minus liabilities associated
with restricted assets
Asset consumption ratio
Asset renewal funding ratio
Asset sustainability ratiodepreciation
Debt service cover ratio annual operating surplus before interest and depreciationprincipal and interest
Operating surplus ratio operating revenue minus operating expensesown source operating revenue
Own source revenue coverage ratio own source operating revenueoperating expense
depreciated replacement costs of depreciable assetscurrent replacement cost of depreciable assets
NPV of planned capital renewal over 10 yearsNPV of required capital expenditure over 10 years
capital renewal and replacement expenditure
Page 55
Auditor General
Page 1 of 2
7th Floor Albert Facey House 469 Wellington Street Perth MAIL TO: Perth BC PO Box 8489 Perth WA 6849 TEL: 08 6557 7500 FAX: 08 6557 7600
INDEPENDENT AUDITOR’S REPORT
To the Councillors of the City of Albany
Report on the Audit of the Financial Report
OpinionI have audited the annual financial report of the City of Albany which comprises the Statement of Financial Position as at 30 June 2020, the Statement of Comprehensive Income by Nature or Type, Statement of Comprehensive Income by Program, Statement of Changes in Equity, Statement of Cash Flows and Rate Setting Statement for the year then ended, and notes comprising a summary of significant accounting policies and other explanatory information, and the Statement by the Chief Executive Officer.
In my opinion the annual financial report of the City of Albany:(i) is based on proper accounts and records; and(ii) fairly represents, in all material respects, the results of the operations of the City for the year
ended 30 June 2020 and its financial position at the end of that period in accordance with the Local Government Act 1995 (the Act) and, to the extent that they are not inconsistent with the Act, Australian Accounting Standards.
Basis for OpinionI conducted my audit in accordance with Australian Auditing Standards. My responsibilities under those standards are further described in the Auditor’s Responsibilities for the Audit of the Financial Report section of my report. I am independent of the City in accordance with the Auditor General Act 2006 and the relevant ethical requirements of the Accounting Professional and Ethical Standards Board’s APES 110 Code of Ethics for Professional Accountants (the Code) that are relevant to my audit of the annual financial report. I have also fulfilled my other ethical responsibilities in accordance with the Code. I believe that the audit evidence I have obtained is sufficient and appropriate to provide a basis for my opinion.
Emphasis of Matter – Basis of AccountingI draw attention to Notes 1 and 11 to the annual financial report, which describe the basis of accounting. The annual financial report has been prepared for the purpose of fulfilling the City’s financial reporting responsibilities under the Act, including the Local Government (Financial Management) Regulations 1996 (Regulations). My opinion is not modified in respect of these matters:
(i) Regulation 17A of the Regulations, requires a local government to measure vested improvements at fair value and the associated vested land at zero cost. This is a departure from AASB 16 Leases which would have required the entity to measure the vested improvements also at zero cost.
(ii) In respect of the comparatives for the previous year ended 30 June 2019, Regulation 16 of the Regulations, did not allow a local government to recognise some categories of land, including land under roads, as assets in the annual financial report.
Page 2 of 2
Responsibilities of the Chief Executive Officer and Council for the Financial ReportThe Chief Executive Officer (CEO) of the City is responsible for the preparation and fair presentation of the annual financial report in accordance with the requirements of the Act, the Regulations and, to the extent that they are not inconsistent with the Act, Australian Accounting Standards. The CEO is also responsible for such internal control as the CEO determines is necessary to enable the preparation of the annual financial report that is free from material misstatement, whether due to fraud or error
In preparing the annual financial report, the CEO is responsible for assessing the City’s ability to continue as a going concern, disclosing, as applicable, matters related to going concern and using the going concern basis of accounting unless the State Government has made decisions affecting the continued existence of the City.
The Council is responsible for overseeing the City’s financial reporting process.
Auditor’s Responsibility for the Audit of the Financial ReportThe objectives of my audit are to obtain reasonable assurance about whether the annual financial report as a whole is free from material misstatement, whether due to fraud or error, and to issue an auditor’s report that includes my opinion. Reasonable assurance is a high level of assurance, but is not a guarantee that an audit conducted in accordance with Australian Auditing Standards will always detect a material misstatement when it exists. Misstatements can arise from fraud or error and are considered material if, individually or in the aggregate, they could reasonably be expectedto influence the economic decisions of users taken on the basis of the annual financial report.
A further description of my responsibilities for the audit of the annual financial report is located on the Auditing and Assurance Standards Board website at https://www.auasb.gov.au/auditors_responsibilities/ar4.pdf. This includes the identification and assessment of the risk of material misstatement due to fraud arising from management override of controls. This description forms part of my auditor’s report.
Report on Other Legal and Regulatory Requirements(i) All required information and explanations were obtained by me.(ii) All audit procedures were satisfactorily completed.(iii) In my opinion, the Asset Consumption Ratio and the Asset Renewal Funding Ratio included
in the annual financial report were supported by verifiable information and reasonable assumptions.
Other MatterThe financial ratios for 2018 in Note 36 of the annual financial report were audited by another auditor when performing their audit of the City for the year ending 30 June 2018. The auditor expressed an unmodified opinion on the annual financial report for that year.
Matters Relating to the Electronic Publication of the Audited Financial ReportThis auditor’s report relates to the annual financial report of the City of Albany for the year ended 30 June 2020 included on the City’s website. The City’s management is responsible for the integrity of the City’s website. This audit does not provide assurance on the integrity of the City’s website. The auditor’s report refers only to the annual financial report described above. It does not provide an opinion on any other information which may have been hyperlinked to/from this annual financial report. If users of the annual financial report are concerned with the inherent risks arising from publication on a website, they are advised to refer to the hard copy of the audited annual financial report to confirm the information contained in this website version of the annual financial report.
SANDRA LABUSCHAGNEDEPUTY AUDITOR GENERALDelegate of the Auditor General for Western AustraliaPerth, Western Australia3 December 2020
128
CITY OF ALBANY
102 NORTH ROAD YAKAMIA | PO BOX 484, ALBANY, WA 6331 | TEL: (08) 6820 3000 | FAX: (08) 9841 4099 | WWW.ALBANY.WA.GOV.AU