studentsrepo.um.edu.mystudentsrepo.um.edu.my/3073/2/ABSTRAK.pdf · Created Date: 2/27/2006 6:03:15 PM

i
ENCAPSULATION OF ORGANIC PHASE CHANGE MATERIALS
WITHIN METAL OXIDES FOR THERMAL ENERGY STORAGE
SYSTEMS
SARA TAHAN LATIBARI
THESIS SUBMITTED IN FULFILMENT OF
THE REQUIREMENT FOR THE DEGREE OF
DOCTOR OF PHILOSOPHY
FACULTY OF ENGINEERING
UNIVERSITY OF MALAYA
KUALA LUMPUR
2016
Univers
ity of
Mala
ya
ii
UNIVERSITI MALAYA
ORIGINAL LITERARY WORK DECLARATION
Name of Candidate: SARA TAHAN LATIBARI
Registration/Matric No: KHA120084
Name of Degree: DOCTOR OF PHILOSOPHY
Title of Project Paper/Research Report/Dissertation/Thesis (―this Work‖):
ENCAPSULATION OF ORGANIC PHASE CHANGE MATERIALS WITHIN
METAL OXIDES FOR THERMAL ENERGY STORAGE SYSTEMS
Field of Study: ADVANCE MATERIALS / NANOMATERIALS
I do solemnly and sincerely declare that:
(1) I am the sole author/writer of this Work;
(2) This Work is original;
(3) Any use of any work in which copyright exists was done by way of fair
dealing and for permitted purposes and any excerpt or extract from, or
reference to or reproduction of any copyright work has been disclosed
expressly and sufficiently and the title of the Work and its authorship have
been acknowledged in this Work;
(4) I do not have any actual knowledge nor do I ought reasonably to know that
the making of this work constitutes an infringement of any copyright work;
(5) I hereby assign all and every rights in the copyright to this Work to the
University of Malaya (―UM‖), who henceforth shall be owner of the
copyright in this Work and that any reproduction or use in any form or by any
means whatsoever is prohibited without the written consent of UM having
been first had and obtained;
(6) I am fully aware that if in the course of making this Work I have infringed
any copyright whether intentionally or otherwise, I may be subject to legal
action or any other action as may be determined by UM.
Candidate’s Signature Date:
Subscribed and solemnly declared before,
Witness’s Signature Date:
Name:
Designation:
Univers
ity of
Malaya

iii
ABSTRACT
Solar energy is receiving a lot of attention nowadays since it is a clean,
renewable, and sustainable energy. A major limitation of solar energy is that it is
available for only about 2000 hours a year in many places. Thermal energy storage is a
major contributor to bridge the gap between energy demand (consumption) and energy
production (supply) by solar power. The utilization of high latent heat storage capability
of phase change materials is one of the keys to an efficient way to store thermal energy.
Several kinds of organic PCMs like fatty acids have been applied recently as they have
a high latent heat and appropriate thermal properties. However, direct use of such PCMs
in practical thermal applications is not easy due to their low thermal conductivity,
flammability, instability, and leakage problems. To overcome these problems, PCMs
have been encapsulated in various organic and inorganic shell materials. An inorganic
shell material with high thermal conductivity and superior strength not only enhances
the thermal transfer performance of the PCM system but also improves the durability
and working reliability of them.
This study presents state of the art of nano/microencapsulated PCMs
(NE/MEPCMs) for thermal energy storage applications and provides an insight into our
efforts to develop novel nano/microencapsulated phase change materials with enhanced
performance and safety. Specific attention was given to the encapsulation process of
some inorganic materials for the first time and the improvement of thermal conductivity
and thermal stability of the prepared materials. In addition, the thermal energy storage
properties and performance are discussed for thermal energy applications.
In this research three types of nano/microcapsules were prepared with organic
fatty acids as the core phase change material and SiO2 (silica), TiO2 (titania), and Al2O3
(aluminum oxide) as the inorganic shell materials through a sol-gel method. The
structural, morphological and thermal features of the newly developed NE/MEPCMs
Univers
ity of
Mala
ya

iv
were evaluated by a series of modern instruments and characterization technologies,
including DSC, TGA, FT-IR, TEM, SEM and XRD. The thermal reliability of prepared
nano/microcapsules was investigated using a thermal cycler for a large number of
heating and cooling processes.
In this research the influences of several types of parameters during the
preparation method on the morphology, thermal performance and thermal conductivity
of the prepared materials have been studied. The experimental results indicate that the
fatty acids were successfully encapsulated in the shell materials in spherical shapes.
Encapsulated fatty acids confirmed the outstanding phase-change performance with
specific heat and thermal stability enhancement. The thermal conductivities of the
encapsulated PCMs are significantly improved compared to pure PCMs. In conclusion,
the outstanding latent heat, high thermal conductivity, thermal stability and reliability of
the prepared nano/microcapsules make these materials appropriate phase change
materials for thermal energy storage applications like slurry systems.
Univers
ity of
Mala
ya

v
ABSTRAK
Tenaga solar menerima banyak perhatian sekarang kerana ia ialah tenaga yang
bersih, dapat diperbaharui, dan mampan. Satu had utama tenaga solar adalah bahawa ia
hanya berfungsi kira-kira 2000 jam setahun dan didapati di banyak tempat.
Penyimpanan tenaga haba merupakan penyumbang utama untuk merapatkan jurang
antara keperluan tenaga (penggunaan) dan pengeluaran tenaga (bekalan) yang
dihasilkan oleh kuasa solar. Penggunaan keupayaan penyimpanan haba pendam tinggi
dalam bahan-bahan perubahan fasa adalah salah satu cara yang berkesan untuk
menyimpan tenaga haba. Beberapa jenis PCMS organik seperti asid lemak telah
digunakan baru-baru ini kerana mereka mempunyai haba pendam yang tinggi dan sifat
terma yang sesuai. Walau bagaimanapun, penggunaan PCMS secara langsung dalam
aplikasi terma yang praktikal tidak mudah kerana masalah kekonduksian terma,
kemudahbakaran, ketidakstabilan, dan kebocoran. Untuk mengatasi masalah ini, PCMS
telah dicampurkan dalam pelbagai bahan shell organik dan bukan organik. Bahan shell
bukan organik dengan kekonduksian terma yang tinggi dan kekuatan unggul bukan
sahaja meningkatkan prestasi pemindahan terma sistem PCM tetapi juga meningkatkan
ketahanan dan kebolehpercayaan kerja mereka.
Kajian ini membentangkan kesenian nano/microencapsulated PCMs untuk
aplikasi penyimpanan tenaga haba dan memberi pandangan dalam usaha kita untuk
membangunkan nano/microencapsulated bahan perubahan fasa (NE/MEPCMs) yang
baru dengan prestasi dan keselamatan yang dipertingkatkan. Perhatian khusus diberikan
kepada proses pengkapsulan sesetengah bahan bukan organik untuk kali pertama serta
kepda peningkatan kekonduksian terma dan kestabilan terma bagi bahan-bahan yang
disediakan. Di samping itu, ciri-ciri penyimpanan tenaga haba dan prestasi
dibincangkan untuk aplikasi tenaga haba.
Univers
ity of
Mala
ya

vi
Dalam kajian ini tiga jenis nano/microcapsules disediakan dengan asid lemak
organik sebagai bahan perubahan fasa teras dan SiO2 (silika), TiO2 (Titania), dan Al2O3
(aluminium oksida) sebagai bahan shell bukan organik melalui kaedah sol-gel. Ciri-ciri
struktur, morfologi dan terma NE/MEPCMs yang baru dibangunkan dinilaikan oleh satu
siri instrumen moden dan alat teknologi pencirian, termasuk DSC, TGA, FT-IR, TEM,
SEM dan XRD. Kebolehpercayaan terma nano/microcapsules yang disediakan telah
disiasat dengan menggunakan cycler terma untuk sejumlah besar proses pemanasan dan
penyejukan.
Dalam kajian ini pengaruh beberapa jenis parameter dalam kaedah penyediaan
terhadap morfologi, prestasi terma dan kekonduksian terma bahan-bahan spesimen
kajian telah dikaji. Keputusan eksperimen menunjukkan bahawa asid lemak telah
berjaya dikurungkan dalam bahan shell dalam bentuk sfera. Asid lemak yang terkurung
mengesahkan prestasi fasa perubahan yang luar biasa dengan haba tentu dan
peningkatan kestabilan terma. Kekonduksian terma PCMS yang terkandung adalah
jauh lebih baik berbandingkan PCMS tulen. Kesimpulannya, haba pendam yang
cemerlang, kekonduksian terma yang tinggi, kestabilan terma dan kebolehpercayaan
nano/microcapsules yang dihasilkan menjadikan mereka sebagai bahan-bahan
perubahan fasa yang sesuai untuk aplikasi penyimpanan tenaga haba seperti sistem
sluri.
Univers
ity of
Mala
ya

vii
ACKNOWLEDGEMENT
I give all praise and thanks to Allah, the most merciful, who has given me the
inspiration, patience, strength and health for completing this thesis. I have experienced
His guidance day by day.
I would like to express my special appreciation to my supervisor Associate Prof.
Dr. Hendrik Simon Cornelis Metselaar, who has been a tremendous advisor for me. I
would like to thank him for encouraging my research and for allowing me to grow as a
research scientist. His advices and supports have been invaluable. I also appreciate my
other supervisor Dr Amalina Binti Muhamad Affifi for her kindness and helpful advices
and support.
I would like to thank my best colleague and compassionate beloved husband Dr.
Mohammad Mehrali, not only for his encourage and support but also for all the valuable
discussions, suggestions and helps during my study. I also like to acknowledge Dr.
Mehdi Mehrali for his useful advices.
I would like to convey thanks to the University of Malaya and the Ministry of
Higher Education (MOHE) of Malaysia, Grant number UM.C/HIR/MOHE/ENG/21, for
providing the financial support and laboratory facilities.
Lastly but not the least, I would like to dedicate my love and deepest
appreciation to my family, specifically my parents for allowing me to realize my own
potential. All the support, encouragement and advices they have provided for me over
the years were the greatest gifts anyone has ever given me. I am greatly indebted to
them and without them I may never have gotten to where I am today.
Univers
ity of
Mala
ya

viii
TABLE OF CONTENTS
ABSTRACT ....................................................................................................................... iii
ABSTRAK ........................................................................................................................... v
ACKNOWLEDGEMENT ................................................................................................ vii
LIST OF FIGURES ......................................................................................................... xiii
LIST OF TABLES .......................................................................................................... xvii
LIST OF SYMBOLS AND ABBREVIATIONS ............................................................. xix
CHAPTER 1 INTRODUCTION ......................................................................................... 1
1.1 Background ........................................................................................................... 1
1.2 Importance of the Study........................................................................................ 2
1.3 Research Problem Statement ................................................................................ 3
1.4 Objective of Present Work.................................................................................... 4
1.5 Thesis Structure .................................................................................................... 6
CHAPTER 2 LITERATURE REVIEW .............................................................................. 7
2.1 Introduction........................................................................................................... 7
2.2 Energy Storage...................................................................................................... 8
2.2.1 Mechanical Energy Storage ........................................................................ 9
2.2.2 Electrical Energy Storage ......................................................................... 10
2.2.3 Thermal Energy Storage ........................................................................... 10
2.2.3.2 Sensible Heat Storage .................................................................... 12
2.2.3.3 Latent Heat Storage ....................................................................... 13
2.3 Phase Change Materials ...................................................................................... 15
2.4 Classifications of PCMs ..................................................................................... 17
Univers
ity of
Mala
ya

ix
2.4.1 Organic PCMs .......................................................................................... 18
2.4.1.1 Paraffins ......................................................................................... 18
2.4.1.2 Non-paraffins ................................................................................. 20
2.4.2 Inorganic PCMs ........................................................................................ 21
2.4.2.1 Salt hydrates ................................................................................... 22
2.4.2.2 Metallics......................................................................................... 23
2.4.3 Eutectic PCMs .......................................................................................... 23
2.5 Limitations of PCMs in Applications and their Obviation Methods .................. 24
2.6 Phase Change Materials Encapsulation .............................................................. 26
2.6.1 Shell Materials .......................................................................................... 30
2.6.1.1 Polymers Used as Shell Materials ................................................. 31
2.6.1.2 Inorganic Materials as the Shell Materials .................................... 32
2.6.2 Applications of Nano/Microencapsulated PCMs ..................................... 33
2.6.2.1 Textile Applications ....................................................................... 33
2.6.2.2 Building Applications .................................................................... 33
2.6.2.3 Nano/Microencapsulated PCM Slurries ........................................ 34
2.7 Summary ............................................................................................................. 34
CHAPTER 3 MATERIALS AND METHODS ................................................................. 36
3.1 Introduction......................................................................................................... 36
3.2 The Selection of Appropriate PCMs as the Core Material ................................. 37
3.2.1 Palmitic Acid ............................................................................................. 38
3.2.2 Stearic Acid .............................................................................................. 39
Univers
ity of
Mala
ya

x
3.3 The Selection of Shell Materials......................................................................... 41
3.3.1 Sol-Gel Method ........................................................................................ 42
3.3.2 Silicon Dioxide (SiO2) .............................................................................. 46
3.3.2.1 Preparation of Palmitic Acid/Silicon Dioxide NE/MEPCMs ........ 47
3.3.3 Titanium Dioxide (TiO2) .......................................................................... 48
3.3.3.1 Preparation of Stearic Acid/TiO2 NE/MEPCMs ........................... 50
3.3.4 Aluminium Oxide (Al2O3) ........................................................................ 51
3.3.4.1 Preparation of Palmitic Acid/Aluminium Oxide NE/MEPCMs .... 53
3.3.5 Core Material-Shell Material Detach ....................................................... 54
3.3.6 Synthesis Process of NE/MEPCMs .......................................................... 55
3.4 Properties Characterization Methods .................................................................. 57
3.4.1 Fourier-Transform Infrared Spectroscopy (FTIR) ................................... 59
3.4.2 X-Ray Diffractometry (XRD) .................................................................. 60
3.4.3 Scanning Electron Microscopy (SEM) ..................................................... 61
3.4.4 Transmission Electron Microscopy (TEM) .............................................. 62
3.4.5 Differential Scanning Calorimetry (DSC) ................................................ 63
3.4.6 Thermal Gravimetry and Derivative Thermogravimetric (TGA and
DTG) .................................................................................................................................. 69
3.4.7 Thermal Conductivity ............................................................................... 70
3.4.7.1 Transient Hot-Wire Method (THW) .............................................. 70
3.4.7.2 Laser Flash Technique (LFA) ........................................................ 72
3.4.8 Thermal Cycler ......................................................................................... 73
3.5 Summary ............................................................................................................. 75
Univers
ity of
Mala
ya

xi
CHAPTER 4 RESULTS AND DISCUSSION .................................................................. 76
4.1 Introduction......................................................................................................... 76
4.2 Palmitic Acid/Silica Nanocapsules ..................................................................... 76
4.2.1 FTIR Spectra of PA/SiO2 NEPCMs ......................................................... 76
4.2.2 XRD Patterns of PA/SiO2 NEPCMs ........................................................ 78
4.2.3 Microstructure Analysis of PA/SiO2 NEPCMs ........................................ 78
4.2.4 Phase Change Properties of the PA/SiO2 NEPCMs ................................. 83
4.2.5 Thermal Stability of PA/SiO2 NEPCMs ................................................... 86
4.2.6 Thermal Reliability of PA/SiO2 NEPCMs ............................................... 87
4.2.7 Thermal Conductivity of PA/SiO2 NEPCMs ........................................... 90
4.3 Stearic acid/Titania Nanocapsules ...................................................................... 90
4.3.1 FTIR Spectra of SA/TiO2 NEPCMs ......................................................... 91
4.3.2 XRD Crystallography of SA/TiO2 NEPCMs ........................................... 93
4.3.3 Surface Morphology and Elemental Analysis of SA/TiO2 NEPCMs ...... 94
4.3.4 Thermal Performance of SA/TiO2 NEPCMs ........................................... 96
4.3.5 Thermal Stability of SA/TiO2 NEPCMs .................................................. 99
4.3.6 Thermal Conductivity of SA/TiO2 NEPCMs ......................................... 100
4.3.7 Thermal Reliability of SA/TiO2 NEPCMs ............................................. 101
4.4 Palmitic Acid/Alumina MEPCMs .................................................................... 103
4.4.1 Chemical Composition of PA/Al2O3 MEPCMs ..................................... 103
4.4.2 Crystallography of the PA/Al2O3 MEPCMs .......................................... 105
4.4.3 Surface Morphology and Surface Element Analysis of PA/Al2O3
MEPCMs .......................................................................................................................... 106
Univers
ity of
Mala
ya

xii
4.4.4 Thermal Energy Storage Properties of PA/Al2O3 MEPCMs ................. 109
4.4.5 Thermal Conductivity of PA/Al2O3 MEPCMs ....................................... 112
4.4.6 Thermal Stability of PA/Al2O3 MEPCMs .............................................. 113
4.4.7 Thermal Effusivity of PA/Al2O3 MEPCMs ........................................... 115
4.4.8 Thermal Reliability and Durability of PA/Al2O3 MEPCMs .................. 116
4.5 Comparison of Properties of Prepared NE/MEPCMs ...................................... 117
4.6 Summary ........................................................................................................... 121
CHAPTER 5 CONCLUSION AND RECOMMENDATION ......................................... 123
5.1 Conclusion ........................................................................................................ 123
5.2 Recommendations............................................................................................. 125
APPENDIX ........................................................................ Error! Bookmark not defined.
REFERENCES ................................................................................................................. 128
Univers
ity of
Mala
ya

xiii
LIST OF FIGURES
Figure 2-1: Thermal energy storage classifications ............................................. 11
Figure 2-2: Comparison between the heat storage as a sensible heat and the latent
heat .................................................................................................................................. 14
Figure 2-3: The melting and solidifying process of the PCMs ............................ 15
Figure 2-4: Heat transfer enhancement methods employed for PCMs (Salunkhe
& Shembekar, 2012) ....................................................................................................... 26
Figure 2-5: Encapsulated PCM melting/solidifying process ............................... 27
Figure 2-6: Morphology of different types of microcapsules .............................. 30
Figure 3-1: NE/MEPCMs preparation and characterization process................... 37
Figure 3-2: Chemical structure of saturated palmitic acid and unsaturated
palmitic acid .................................................................................................................... 39
Figure 3-3: Chemical structure of saturated stearic acid ..................................... 40
Figure 3-4: the sol-gel process schematic of preparing metal oxides (Samiey et
al., 2014).......................................................................................................................... 44
Figure 3-5: The structural formula of TEOS ....................................................... 47
Figure 3-6: The structural formula of TTIP ......................................................... 50
Figure 3-7: The structural formula of AIP ........................................................... 53
Figure 3-8: Schematic of the encapsulation of metal oxide shell with the PCM
cores ................................................................................................................................ 57
Figure 3-9: Differential scanning calorimeter (Memon, 2014) ........................... 64
Figure 3-10: Typical DSC curve .......................................................................... 65
Figure 3-11: Accelerated thermal cycler ............................................................. 74
Figure 4-1: FTIR spectra of the (a) SiO2, (b) PA, (c) PA/SiO2 nanocapsules ..... 77
Figure 4-2: XRD pattern of (a) SiO2, (b) PA, (c) PA/SiO2 nanocapsules ........... 78
Figure 4-3: SEM of the PA/SiO2 nanocapsules: (a) SI1, (b) SI2, (c) SI3 ............ 80
Univers
ity of
Mala
ya

xiv
Figure 4-4: The particles size distributions of: (a) SI1, (b) SI2, (c) SI3 .............. 81
Figure 4-5: The EDS analysis of nanoencapsulated PA/SiO2 of sample SI3 ...... 82
Figure 4-6: TEM images of nanoencapsulated PA/SiO2 (a) SI1, (b) SI2, (c) SI3
......................................................................................................................................... 83
Figure 4-7: DSC curve of (a) melting, (b) solidifying processes of nanocapsules
in samples: SI1, SI2, SI3 and pure PA ............................................................................ 85
Figure 4-8: (a) TGA, (b) DTG curves of the nanocapsules of SI1, SI2, SI3 and
pure PA ........................................................................................................................... 87
Figure 4-9: DSC curves for SI3 before and after thermal cycling ....................... 88
Figure 4-10: SEM image of encapsulated PCM of SI3 after thermal cycling ..... 89
Figure 4-11: FT-IR spectra of encapsulated PCM before and after thermal
cycling ............................................................................................................................. 89
Figure 4-12: FTIR spectra of TiO2, pure SA, and NEPCMs synthesised at (a) pH
10, (b) pH 10.8, and (c) pH 11.5 ..................................................................................... 92
Figure 4-13: XRD patterns of the TiO2, pure SA and SA/TiO2 NEPCMs ......... 93
Figure 4-14: SEM images for SA/TiO2 nanocapsules for (a) ST1, (b) ST2, (c)
ST3 and (d) ST4 and (e) particles size distributions of the prepared samples ................ 95
Figure 4-15: (a) TEM images and (b) EDS analysis of ST1 ............................... 96
Figure 4-16: DSC thermograms of the (a) heating and (b) cooling of pure SA and
the NEPCMs ................................................................................................................... 97
Figure 4-17: TGA curves for SA/TiO2 nanocapsules ........................................ 100
Figure 4-18: (a) DSC curves and (b) FT-IR spectra for ST4 before and after
thermal cycling .............................................................................................................. 102
Figure 4-19: FTIR spectra of (a) Al2O3, (b) pure PA, (c) S4, (d) S3, (e) S2, and
(f) S1 ............................................................................................................................. 104
Univers
ity of
Mala
ya

xv
Figure 4-20: XRD patterns of (a) Al2O3, (b) pure PA, (c) S4, (d) S3, (e) S2, and
(f) S1 ............................................................................................................................. 105
Figure 4-21: SEM micrographs of the microcapsules of samples (a) S1, (b) S2,
(c) S3, (d) S4 (e) The EDS analysis of MEPCMs in sample S1 ................................... 107
Figure 4-22: SEM images of sample numbers (a) S1, (b) S4, the size distribution
graphs of microcapsules in sample (c) S1, (d) S4 and (e) the TEM image of sample S2
....................................................................................................................................... 108
Figure 4-23: DSC thermograms of the (a) heating and (b) cooling of pure PA and
MEPCMs ....................................................................................................................... 109
Figure 4-24: Specific heat curves of PA and encapsulated PA ......................... 112
Figure 4-25: TGA thermograms of the pure PA and MEPCMs ........................ 114
Figure 4-26: The latent heat values of the MEPCMs before and after thermal
cycling ........................................................................................................................... 117
Figure 4-27: Encapsulation features of encapsulated PA/SiO2, SA/TiO2 and
PA/Al2O3 ....................................................................................................................... 118
Figure 4-28: Thermal conductivity and decomposition temperature enhancement
of encapsulated PA/SiO2, SA/TiO2 and PA/Al2O3 ....................................................... 119
Univers
ity of
Mala
ya

xvi
Univers
ity of
Mala
ya

xvii
LIST OF TABLES
Table 2-1: Thermo-physical properties of some paraffins ................................... 20
Table 2-2: Thermo-physical Properties of Fatty Acids ....................................... 21
Table 2-3: Thermo-physical Properties of salt hydrates ...................................... 22
Table 2-4: Thermo-physical properties of metallics ............................................ 23
Table 2-5: Thermo-physical properties of some selected eutectics ..................... 24
Table 3-1: Thermo-physical properties of the palmitic acid ................................ 39
Table 3-2: Thermo-physical properties of stearic acid ........................................ 40
Table 3-3: The properties of silica ....................................................................... 46
Table 3-4: Specifications of prepared materials .................................................. 48
Table 3-5: Properties of titania ............................................................................ 49
Table 3-6: Chemical composition of the O/W emulsion and precursor solution
used for the fabrication of NEPCMs ............................................................................... 51
Table 3-7: General properties of alumina ............................................................ 52
Table 3-8: The compositions of the O/W emulsion and the solution of the AIP 54
Table 3-9: The instruments utilized for the characterization of the prepared
NE/MEPCMs .................................................................................................................. 58
Table 4-1: Mean particle sizes and range of diameter sizes of PA/SiO2 capsulated
PCMs ............................................................................................................................... 81
Table 4-2: The thermal properties of the nanocapsules synthesized under
different conditions ......................................................................................................... 83
Table 4-3: Thermal conductivity of PA encapsulated within SiO2 shell ............. 90
Table 4-4: Phase-change properties of SA and NEPCMs ................................... 98
Table 4-5: Thermal conductivity of encapsulated PCMs and pure SA ............. 101
Table 4-6: The phase-change properties of the PA and MEPCMs .................... 110
Table 4-7: Thermal conductivity of encapsulated PCMs and Pure PA ............. 113
Univers
ity of
Mala
ya

xviii
Table 4-8: Decomposition temperatures of the PA and MEPCMs .................... 114
Table 4-9: Thermal effusivity of the PA and MEPCMs .................................... 116
Table 4-10: Mean diameter size of encapsulated PA/SiO2, SA/TiO2 and
PA/Al2O3 ....................................................................................................................... 120
Univers
ity of
Mala
ya
xix
LIST OF SYMBOLS AND ABBREVIATIONS
Nomenclature
∆H Latent heat
∆T Temperature difference
ΔE Energy difference
A Cross sectional area
am Fraction melted
C Specific heat capacity
d Distance
dm/dt Rate of change in weight
Er Encapsulation ratio
Ee Encapsulation efficiency
e Thermal effusivity
g Gram
hr Hour
h Planck`s constant
Js Jules second
Kα Radiation
k Thermal conductivity
kV Voltage
K Kelvin
L Length
m Mass
mL Milliliters
min Minutes
Univers
ity of
Mala
ya

xx
mg Milligrams
nm Nano meter
n Diffraction order
Q Amount of stored heat
q Magnitude of heat transmission
rpm Round per minute
R Capsule radius
RPCM Core PCM radius
RShell Shell thickness
T Temperature
v Classical frequency
wt.% Weight ratio
Greek symbols
μ Micro
θ Angle
φ Thermal storage capability
α Thermal diffusivity
ρ Density
λ Wave length
Subscripts
c Crystallization
ef Extrapolated end
ei Extrapolated peak onset
f End peak
Univers
ity of
Mala
ya
xxi
i Initial peak
m Melting
P,s Solid PCM
P,l Liquid PCM
p peak
t Total
Acronyms
AA/AG Agar-agar/arabic gum
CAES Compressed air energy storage
DSC Differential Scanning Calorimetry
DTG Derivative Thermogravimetric
EPCM Encapsulated PCM
FTIR Fourier-Transform Infrared Spectroscopy
FESEM Field Emission Scanning Electron Microscopy
LFA Laser Flash Technique
LHTES Latent heat thermal energy storage systems
MEPCMS Microencapsulated phase change slurry
NEPCM Nano encapsulated PCM
NE/MEPCM Nano/microencapsulated PCM
O/W Oil/water
PCM Phase change material
PHPS Pumped hydropower storage
PA Palmitic acid
PSD Particle size distribution
SEM Scanning Electron Microscopy
Univers
ity of
Mala
ya

xxii
SHTES Sensible heat thermal energy storage
SMES Superconducting magnetic energy storage
SG/AG Sterilized gelatine/arabic gum
SA Stearic acid
SDS Sodium dodecyl sulfate
TEM Transmission Electron Microscopy
TGA Thermal Gravimetry
THW Transient Hot-Wire Method
TES Thermal energy storage
TEOS Tetraethoxysilane
TTIP Titanium tetraisopropoxide
XRD X-Ray Diffractometry
Univers
ity of
Mala
ya
1
CHAPTER 1 INTRODUCTION
INTRODUCTION
1.1 Background
The economic and technological development worldwide leads to an increasing
energy demand. Fossil fuels are combusted to generate electricity, fuel transportation
and for heating and cooling purposes. Fossil fuels are a significant energy source, but
conventional fossil energy sources are limited, and their use results in the emission of
harmful gases, which are responsible for climate change and environmental pollution.
Experts around the world have warned that greenhouse gases have to be reduced
globally, up to 50% in the next 50-100 years (Sorensen, 2015) (Tatsidjodoung et al.,
2013). These drawbacks generated an increased interest in renewable energy from
natural sources, like wind, sunlight, hydropower as well as alternatives such as nuclear
and geothermal energy. Renewable energy has been used over the last two decades to
save cost and prevent adverse environmental pollution effects of fossil fuel. Solar
energy is an essentially inexhaustible source potentially capable of meeting a significant
portion of the world’s future energy needs with a minimum of adverse environmental
consequences (Frankl & Nowak, 2010). However, there are numerous problems that
have to be resolved to successfully utilize solar energy. Solar radiation is intermittent by
its nature. It varies as a factor of time, weather condition such as cloud cover; location
and season. Therefore, solar energy is not widely used at present. According to U.S.
Energy Information Administration 2012 annual energy outlook, the supplies for U.S.
electricity generation were 70% fossil fuels, 20% nuclear, and only 10% renewable
energy in 2010 (Khatib, 2012). Therefore, scientists investigated technically to solve
these problems. They found that energy storage is one of the possible solutions for
energy conservation and leveling of energy demand patterns, and improving the
performance of energy systems and increasing the reliability. Energy storage not only
Univers
ity of
Mala
ya

2
reduces the mismatch between supply and demand but plays an important role in
conserving the energy. It leads to saving of premium fuels which are limited and
contribute to a green environment. The excess heat from solar radiation during the
daytime can be collected and stored for use during the night time. This is convenient in
the areas of heat recovery systems and electricity generation (Farid et al., 2004). Solar
energy can be stored in various forms such as hydrogen energy storage, electrochemical
storage and thermal energy storage (TES). Among various energy storage techniques,
thermal energy storage can be considered as one of the effective ones (Goswami et al.,
2000). TES system can store part of the solar energy captured during times of high
incidence of solar radiation to use during cloudy or night periods. Therefore; TES leads
to a more efficient power distribution. Apart from the utility applications, TES also has
its usages in active and passive solar heating, water heating and building heating and
cooling.
1.2 Importance of the Study
TES can be classified as latent, sensible and thermochemical energy storage.
Latent heat refers to the heat released or absorbed when a material changes its phase at
constant temperature. Latent heat energy storage contains PCMs and possesses
advantages like high energy storage density and small temperature difference between
charging and discharging (Sari & Kaygusuz, 2002). This facilitates reducing the
impression of the system and the cost. Storage of thermal energy using latent heat is
potentially an attractive method to store solar thermal energy as it can provide near
isothermal and high exergy storage conditions. These latent heat storage materials are
known as phase change materials (PCMs). Due to this inherent property of PCMs, they
are recognized as promising candidates for storage materials in solar applications and
are been researched extensively throughout the world. Some of the desirable properties
of PCMs include that the thermal heat storage is not obligatorily considered in the
Univers
ity of
Mala
ya
3
design because the heat storage is over a narrow range of temperature and their
isothermal nature make them the proper choice in passive storage and they store higher
amount of energy per unit volume in a slight temperature difference as compared to
sensible and thermochemical heat storage materials (Dincer & Dost, 1996).
There is a wide variety of PCMs available which melt and solidify at a broad
range of temperatures and are utilized in various applications. The PCMs are
categorized into three main groups: organic, inorganic, and eutectic materials. Organic
PCMs include mainly paraffin waxes, fatty acids, and sugar alcohols (Pielichowska &
Pielichowski, 2014). They have been used in several developmental studies and have
been commercially functioned recently. Organic PCMs, specifically fatty acids, have a
high heat of fusion and usually do not suffer segregation and high supercooling
problems during melt-solidify cycling, which can be a severe issue for some inorganic
ones like salt hydrates. Among the organic PCMs studied, fatty acids have desirable
characteristics including a suitable melting temperature, negligible supercooling through
a phase change, outstanding phase transition performance, and non-toxicity nature.
1.3 Research Problem Statement
The direct employment of the organic PCMs for heat storage has several
limitations because of their low thermal conductivity, which leads to low charging and
discharging rates, leakage through the solid-liquid phase transition and their
flammability and instability (Salunkhe & Shembekar, 2012). Several studies have been
conducted to overcome these disadvantages. In recent years, there has been considerable
interest in employment of supporting materials, such as polymers or porous materials,
for shape stabilizing the composite PCMs (Mehrali et al., 2013a; Mehrali et al., 2013b).
However, due to large differences between solid inclusions and organic matrix, PCM
composites usually show poor stability. To conquer these obstacles encapsulation of
PCMs into inert materials is the most potential and beneficial method indeed.
Univers
ity of
Mala
ya

4
The most profitable objective for PCM encapsulation would be to not only make
PCMs easier and safer to use with higher stability but also decrease the reactivity of
PCMs and enhance their thermal properties by increasing their heat transfer area
(Konuklu et al., 2014; Qiu et al., 2012). Therefore, NE/MEPCMs
(nano/microencapsulated PCMs) have numerous benefits, such as preventing the
leakage of melted PCMs, control of the volume change during a phase transition, and
protection from damaging environmental interactions. These characteristics make
NE/MEPCMs much more practical for energy storage applications, such as heat
transfer, solar energy storage, building materials, and thermally regulated fibres and
textiles (Li et al., 2012).
The traditional encapsulated PCMs were fabricated using polymeric shell
materials, such as melamine−formaldehyde resin, urea−formaldehyde resin,
polyurethane, polystyrene, styrene−butadiene−styrene copolymer, or poly-(methyl
methacrylate) (PMMA), through in situ polymerization or interfacial polymerization in
an emulsion system (Tumirah et al., 2014; Zhang et al., 2011). There are several defects,
such as flammability, toxicity, inadequate thermal and chemical stability, and low
thermal conductivity, for these encapsulated PCMs because of the polymeric shells
(Zhou & Zhao, 2011). Likewise encapsulated PCMs with more rigid shells must be
produced to prevent the leakage of core material over numerous thermal cycles.
Furthermore; since the functional group of fatty acids makes the
nano/microencapsulation process more difficult to control than for paraffins, few
research studies have been conducted on the nano/microencapsulation of fatty acids
(Jamekhorshid et al., 2014).
1.4 Objective of Present Work
According to the previous literatures there is a lack of experimental work on
encapsulation of fatty acids, solving the disadvantages of the encapsulated PCMs within
Univers
ity of
Mala
ya

5
polymeric shell materials and also on investigation of the thermal cycles test on
NE/MEPCMs. The overall objective of this study is to synthesize medium temperature
(50°C–80°C) encapsulated phase change material with different types of inorganic shell
material specifically metal oxides via sol-gel method. The present work is concerned
with encapsulation efficiency, the improvement of core and coating materials, energy
storage and release capacities, surface morphology and inner structure for prepared
materials. A comprehensive knowledge of thermal reliability of the nano/micro-
encapsulated PCM as functions of repeated heating and cooling cycles is essential for
assurance the long-term performance and economic feasibility of a latent heat storage
system. In this regard, this study aims at determining the change of energy
storage/release capacities, melting temperature and specific heat capacities of all
prepared materials after large number of melt/solidify cycles.
The emphasis of this research is to develop a systematic scientific understanding
of the new NE/MEPCMs based on inorganic materials. This is fundamental and
substantial for the establishment of knowledge for the development of practical
applications in various industries.
The objectives encompass the following aspects of work:
Preparation of nano/microencapsulated fatty acids as the phase change materials
with different types of inorganic shell materials.
Structural characteristic evaluation of nano/micro-encapsulated phase change
material within different types of inorganic shell materials.
Investigating and optimizing the encapsulation properties of the prepared
NE/MEPCMs.
Univers
ity of
Mala
ya

6
Investigating the thermal behavior of NE/MEPCMs in terms of latent heat
enthalpy, melting features, thermal conductivity, thermal stability and etc.
Studying the relationship between physical properties such as diameter size or
the shell structure of the NE/MEPCMs and thermal properties involved.
Testing thermal reliability and chemical stability of the prepared NE/MEPCMs.
1.5 Thesis Structure
The entire work of this project is presented in this report in five chapters
described briefly as follows. In CHAPTER 1 an introduction is provided which portrays
the importance of solar energy and gives a general overview of the research work.
CHAPTER 2 includes a literature review on the thermal energy storage, performance
enhancement techniques, PCMs and encapsulation of PCMs for latent heat thermal
energy storage systems (LHTES). In CHAPTER 3, preparation procedure of
NE/MEPCMs and various characterization methods adopted for evaluation of prepared
materials are described. CHAPTER 4 explicates the experimental results and
discussions on the prepared encapsulated PCMs. CHAPTER 5 gives a summary and
conclusion of the current study and recommendations for future work.
Univers
ity of
Mala
ya
7
CHAPTER 2 LITERATURE REVIEW
LITERATURE REVIEW
2.1 Introduction
In recent years, renewable energy sources, such as solar energy, have emerged as
suitable solutions to many environmental issues. These energy sources are intermittent
by nature and require a storage system. One of the most significant storage systems is
the TES system, of which there are two types, sensible heat thermal energy storage
(SHTES) and latent heat thermal energy storage (LHTES). PCMs are among the latent
heat storage system. PCMs are attractive materials for thermal energy storage due to
their large latent heat and their characteristic of constant temperature in the course of
absorbing or releasing energy. They are utilized in applications such as solar energy,
smart textiles, heat transfer media, and intelligent buildings (Agyenim et al., 2010; Ling
& Poon, 2013; Pielichowska & Pielichowski, 2014). There is a wide variety of PCMs
available which melt and solidify at a broad range of temperatures and are utilized in
many applications. PCMs should meet some essential characterizations such as, an
appropriate phase change temperature, a superior melting enthalpy at the temperature
under consideration, and a high density. PCMs must also be non-toxic, non-polluting
and inexpensive (Esen et al., 1998; He et al., 2004). PCMs are generally classified into
three major types: organics (e.g., paraffins, fatty acids and esters), inorganics (e.g., salt
hydrates and metallic alloys), and eutectics (mixtures of inorganics and/or organics).
Among all types of PCMs organic PCMs have desirable characteristics including a
suitable melting temperature, negligible supercooling through a phase change,
outstanding phase transition performance, and non-toxicity. However, the direct
employment of these organic PCMs for heat storage has several limitations because of
the flammability and instability, low thermal conductivity which leads to low charging
and discharging rates and problems with leakage through the solid-liquid phase
Univers
ity of
Mala
ya
8
transition(Kenisarin & Mahkamov, 2007; Sari & Kaygusuz, 2002). Several studies have
been conducted to overcome these disadvantages. In recent years, there has been
considerable interest in shape-stable composite PCMs (Kenisarin & Kenisarina, 2012;
Zhang et al., 2012) and encapsulation of PCMs within a solid shell (Hawlader et al.,
2003; Qiu et al., 2012). Encapsulation of PCMs is a practical solution for these kinds of
problems. The most beneficial objective for PCM encapsulation would be to not only
make PCMs easier and safer to use but also to decrease the reactivity of PCMs and
enhance their thermal properties by increasing their heat transfer area (Salunkhe &
Shembekar, 2012). Therefore, NE/MEPCMs have numerous benefits, such as
preventing the leakage of melted PCMs, control of the volume change during a phase
transition, protection from damaging environmental interactions, etc. These
characteristics make NE/MEPCMs more practical for energy storage applications, such
as heat transfer, solar energy storage, and etc (Sarier & Onder, 2007).
This study reviews the present state of the art of phase change materials for
thermal energy storage applications and provides a deep insight into recent efforts to
develop new PCMs showing enhanced performance and safety. Specific attention is
given to the improvement of disadvantages of PCMs and PCMs encapsulation
procedures. The broad range of PCM applications in the industries is presented and
future research directions are outlined.
2.2 Energy Storage
The continuous increase in the level of greenhouse gas emissions and the climb
in fuel prices are the main issues these days, therefore generating energy and
transmitting it are the forces behind efforts to more effectively utilize various sources of
renewable energy (wind and solar energy) (Nema et al., 2012). For instance, solar
energy is abundant, cheap and easy to implement with the help of renewable
technology, but it is hard to utilize the energy during the scarcity of sunlight. Solar
Univers
ity of
Mala
ya

9
energy is available only during the day, and hence, its application requires efficient
thermal energy storage so that the excess heat collected during sunshine hours may be
stored for later use during the night. Here, energy storage system technology could be
the only option to store this energy for instant or further implementation of such energy
(Waqas & Kumar, 2012). Similar problems arise in heat recovery systems where the
waste heat availability and utilization periods are different, requiring some thermal
energy storage. Also, electrical energy consumption varies significantly during the day
and night, especially in extremely cold and hot climate countries where the major part
of the variation is due to domestic space heating and air conditioning. Such variation
leads to an off peak period, usually after midnight until early morning (Jin et al., 2013).
Short and long term storage of a few hours or months is sufficient in most applications.
Energy storage not only reduces the mismatch between supply and demand but also
improves the performance and reliability of energy systems and plays an important role
in conserving energy and improving its utilization, since many energy sources are
intermittent in nature. The fundamental idea of energy storage is to transfer the excess
of power (energy) produced by the power plant during the weak load periods to the peak
periods. Three different forms of energy that can be stored are mechanical, electrical
and thermal energy (Anisur et al., 2013).
2.2.1 Mechanical Energy Storage
Mechanical energy storage systems include gravitational energy storage or
pumped hydropower storage (PHPS), compressed air energy storage (CAES) and
flywheels. The PHPS and CAES technologies can be used for large-scale utility energy
storage while flywheels are more suitable for intermediate storage. Storage is carried
out when inexpensive off-peak power is available, e.g., at night or weekends. The
storage is discharged when extra power is needed because of insufficient supply from
the base-load plant (Huggins, 2010).
Univers
ity of
Mala
ya
10
2.2.2 Electrical Energy Storage
Energy storage through batteries and capacitors and supercapacitors, and
superconducting magnetic energy storage are options for storing the electrical energy. A
battery is charged, by connecting it to a source of direct electric current and when it is
discharged, it converts stored chemical energy into electrical energy (Chen et al., 2009).
Capacitors and supercapacitors (double-layer capacitors) both are electrical components
that are used to store electric charge. Capacitors are typically used as short-term backup
power, while supercapacitors can also be used to power large engines including
vehicles. Superconducting magnetic energy storage (SMES) refers to a relatively new
technology which stores electricity from the grid within a magnetic field that is created
by the flow of current in a coil (Baker & Collinson, 1999).
2.2.3 Thermal Energy Storage
One very popular form of conversion and storage of variable renewable energy,
such as solar energy, is the thermal energy. Thermal energy storage (TES) is a
technology that provides the potential to attain energy savings, which in turn reduces the
environmental impact related to energy use (Hasnain, 1998). TES systems store thermal
energy by heating a storage medium when the solar energy is most available during the
daytime, so that the stored energy can be used hours, days or many months later (Gil et
al., 2010). Thermal energy storage has various heating applications and power
generation in the areas of building heating/cooling systems, solar energy collectors,
power and industrial waste heat recovery, auto battery thermal management system and
so on (Baylin & Institute, 1979).
The thermal energy storage system can use different techniques to store energy.
As it is mentioned in Figure 2-1, TES is divided into three major classifications on the
basis of storage mechanism; sensible heat storage by sensible heating or cooling a liquid
or solid storage medium such as water, sand, molten salts, rocks, etc., latent heat storage
Univers
ity of
Mala
ya

11
utilizing the latent heat of the phase change material at its transition temperature, and
chemical storage using endothermal and exothermal chemical reaction to store and
release thermal energy (Abhat, 1983; Dincer & Rosen, 2002).
Figure 2-1: Thermal energy storage classifications
2.2.3.1 Chemical Energy Storage
The storage of thermal energy when chemicals either form bonds or break bonds
during a chemical reaction is essentially the theory behind chemical energy storage. In
thermochemical heat storage systems, heat is stored or released by using reversible
endothermic chemical reactions (Khartchenko & Kharchenko, 2013). When a chemical
reaction takes places, there is a difference between the enthalpy of the substances
present at the end of the reaction and the enthalpy of the substances at the start of the
Univers
ity of
Mala
ya
12
reaction. This enthalpy difference is known as the heat of reaction. If the reaction is
endothermic, it will absorb heat when reaction takes place; if the reaction is exothermic,
it will release heat. Therefore, a chemical reaction with a high heat of reaction can be
used for thermal energy storage. However, although thermo-chemical heat storage can
store large quantities of thermal energy, the use of chemical storage is highly limited.
Drawbacks include complexity, uncertainties in the thermodynamic properties of the
reaction components and the reaction kinetics under a wide range of operating
conditions, high cost, toxicity, and flammability (Aho et al., 2012; Ibrahim et al., 2008).
2.2.3.2 Sensible Heat Storage
The most common way of thermal energy storage is as sensible heat storage.
Sensible heat is the amount of heat released or absorbed by a liquid medium (water, oil-
based liquids, certain inorganic molten salts etc.) or a solid medium (like rocks, metals,
pebbles, and refractory etc.) during a change of temperature. Gases are not good
candidates for sensible heat storage due to their low volumetric heat capacity
(Demirbas, 2006). The choice of the substances used largely depends upon the
temperature level of the application. The amount of heat stored is a function of the
mass, specific heat of the medium, and the temperature change which is given by (Zalba
et al., 2003):
Q = mCp dT = mCp
Tf
Ti
(Tf − Ti)
(2-1)
Where Q is the amount of stored heat, m is the mass of heat storage material, Cp is
specific heat of storage material, Tf is final temperature, and Ti is initial temperature
(Kuznik et al., 2011).
The sensible heat storage systems require a large volume of material and also a larger
temperature difference occurs between storing and retrieval energy process for storing
Univers
ity of
Mala
ya

13
relatively small quantities of thermal energy which makes the systems thermo
dynamically inefficient. These kinds of drawbacks limit the utilization of the sensible
heat storage materials. Compared to sensible heat storage, latent heat storage can store
larger quantities of thermal energy with smaller temperature difference. Therefore, to
decrease the volume of material required, latent heat of phase change could be utilized
(Lane, 1983; Sharma et al., 2009).
2.2.3.3 Latent Heat Storage
Of all the thermal heat storage techniques, latent heat storage shows the most
promising method due to its capability of storing a large amount of energy with small
temperature deviation from storage to retrieval (Hawes et al., 1993). Latent heat storage
uses phase change materials (PCM) to store or release thermal energy by changing its
phase at a constant temperature. Latent heat materials can store about three to four times
more heat per volume than is stored as sensible heat in solids or liquids in a temperature
interval of 20℃ (Mehling & Cabeza, 2008). Therefore, as latent heat storage has a
higher storage density and it can greatly minimize the volume of the materials and thus
reduce the size of the storage system, it seems to be a better method to store heat than
sensible and chemical storages. Figure 2-2 shows the difference between sensible and
latent heat storage.
Univers
ity of
Mala
ya

14
Figure 2-2: Comparison between the heat storage as a sensible heat and the latent heat
Latent heat materials not only store latent energy but also store the sensible heat
energy gained from its increase in temperature before and after the phase change. If the
melting is completed, further transfer of heat results again in sensible heat storage. The
amount of energy that is stored over the phase change temperature range is thus the sum
of the latent heat and the sensible heat over this temperature range according to the
(Zalba et al., 2003):
Qt = mCp
Tm
Ti
. dT + mam∆Hm + mCp
Tf
Tm
. dT (2-2)
Where 𝑎𝑚 is the fraction melted and ∆𝐻𝑚 is the heat of melting per unit mass
(J/kg). The storage of the heat of melting cannot be detected from the temperature,
because the melting proceeds at a constant temperature. The latent heat stored during
the phase change process, is then calculated from the enthalpy difference (∆H) between
the solid and the liquid phase. Therefore, the heat storage capacity of the material
depends on its specific heat and latent heat values. Thus, it is preferable for the storage
material to have high specific heat capacity and latent heat values (Jegadheeswaran &
Pohekar, 2009).
Univers
ity of
Mala
ya

15
2.3 Phase Change Materials
Using phase change materials (PCMs) as the latent heat material is an effective
way of storing thermal energy. Phase change materials act as thermal storage and they
release and absorb relatively large amounts of heat during phase change at constant
temperature. PCMs have been widely used in textile, building, solar systems, heat
pumps, and spacecraft thermal control applications (Christensen, 1983;
Ghahremanzadeh et al., 2010; Stritih & Butala, 2010). The PCMs operate by absorbing
heat (charging) and increasing in temperature until phase change temperature. During
the phase change stage, it is able to continue to store additional energy by transitioning
phases at almost constant temperature and once the temperature begins to cool, the same
process repeats with release of heat during the solidification (discharging) process
(Kenisarin & Mahkamov, 2007). The latent heat, or heat of fusion, is the energy
required for the entire melting of the material. It signifies the variation in thermal
energy levels concerning the material’s liquid and solid states. PCMs are materials that
are known to have a high heat of fusion. This can all be seen in Figure 2-3.
Figure 2-3: The melting and solidifying process of the PCMs
Univers
ity of
Mala
ya
16
For employment of the PCMs as latent heat storage materials they should meet
the following criteria (Humphries et al., 1977).
High latent heat of fusion and specific heat on a volumetric basis.
The latent heat per volume must be as high as possible to store a large amount of
thermal energy in a minimum physical size of the heat store. The high specific heat
provides additional significant sensible heat storage.
High thermal conductivity of both solid and liquid states.
The high thermal conductivity could accelerate the charging and discharging of
the energy storage and cause faster heat transfer overall so that the PCM can reach
thermal equilibrium (Zhang et al., 2010).
Suitable phase-transition temperature.
For a specific TES system the transition temperature of the PCM should be in the
required operating temperature range of the application.
High nucleation rate.
To avoid supercooling of the liquid phase during the solidification the nucleation
rate must be high. Supercooling which is also known as sub-cooling represents the
cooling of the liquid phase to a temperature below its solidification point without it
becoming a solid. During the supercooling there is no latent heat release due to the fact
that the material remains in the liquid state and no phase transition happens. This
phenomenon will decrease the transfer efficiency of this material (Abhat, 1983).
High rate of crystal growth.
Univers
ity of
Mala
ya

17
Usually a high rate of crystal growth is required to achieve solidification at a
satisfactory rate which assists the system to meet demands of heat recovery from the
storage system.
High density.
The higher density would reduces the mass of the required PCM and maximize
the heat storage per unit.
Small volume change on phase transformation and low vapor pressure at
operating temperature.
Desired chemical properties such as: chemical stability, no thermal
decomposition after a large number of freeze/melt cycles, compatibility with
other used materials, non-corrosiveness, no toxicity and non flammability.
Availability and cost effectiveness.
2.4 Classifications of PCMs
Phase change materials can be classified according to some aspects. PCMs could
be categorized depending on the temperature ranges over which their phase change
happens including: the low temperature PCMs (with the phase change temperature
below 15℃, which can be utilized in food industry or air conditioning), mid temperature
PCMs (with the phase change temperature in the range of 15–90℃, which can be used
in the solar, medical, textile, electronic and energy-saving applications in building
design), and the high temperature PCMs (with the phase change above 90℃ for
industrial and aerospace applications) (Agyenim et al., 2010). From the other aspect of
view PCMs could be listed in their mode of phase change: gas–liquid, solid–gas, solid–
liquid and solid–solid systems. In solid–solid transitions, heat is stored as the material is
transformed from a low symmetry crystal structure to a high symmetry one. This type of
Univers
ity of
Mala
ya
18
solid-solid phase change materials has advantages such as the small change in volume
over the heating process, no leakage, a low level of corrosion, and a long life span.
However the disadvantages are the lower latent heat and the higher phase change
temperature compared to the other two types (Sharma & Sagara, 2005). On the other
hand, a liquid to gas latent heat material, has a very large phase change enthalpy, but
any phase change to gas is impractical for a closed system due to the large volume
expansion of the material that requires either a large storage tank to minimize the
increases in pressure or a fixed volume container strong enough to withstand the
pressure increase without rupturing. Therefore, using a liquid gas transition is a poor
choice for TES (Banaszek et al., 1999). By contrast, solid-liquid phase change is more
favorable practically due to the fact that during a solid-liquid transformation about 10%
of volumetric expansion occurs which is less than the expansion that occurs during
vaporization, although, the latent heat of solid – liquid is high compared to the solid –
solid transition (Farid et al., 2004). The solid-liquid PCMs could be categorized into
three major categories: organic, inorganic, and eutectic PCMs (Farid et al., 2004) based
on their components.
2.4.1 Organic PCMs
Organic PCMs typically have a lower latent heat capacity and melting
temperature making them less beneficial as latent heat storage materials. However, they
are the safest PCMs to use and they do not segregate, which is a common problem for
PCMs over time. They can also be used with metals. Organic materials are further
classified as paraffins and non-paraffins (fatty acids, esters, alcohols and glycols)
(Mehling & Cabeza, 2007).
2.4.1.1 Paraffins
Paraffins contain alkanes with the general formula CnH2n+2. The n-alkane content
in paraffin waxes usually exceeds 75% and may reach 100%. Pure paraffins contain
Univers
ity of
Mala
ya

19
only alkanes in them, such as the paraffin octadecane C18H38. Paraffins possess high
latent heat storage capacities and are suitable candidates for PCMs because of their very
broad range of melting temperature. For example, the melting points of C10H22, C30H62,
and C40H82 are 29.7oC, 65.4
oC, and 81.5
oC, respectively. In these materials, the melting
point increases with increasing average molecular weight (Finke et al., 1954; Parks et
al., 1946).
Pure paraffin waxes are very expensive, therefore only commercial paraffin
waxes may be used as PCMs in latent heat storage systems. Commercial paraffin waxes,
which melt around 55℃, have been studied most. Farid et al. (1990) have employed
three commercial waxes having melting temperatures of 44, 53 and 64℃ with latent
heats of 167, 200 and 210kJ/kg, respectively, in the storage unit to improve its
performance. Normal or straight chain and symmetrically branched chain paraffin
waxes are the most stable. Paraffins are safe, non-reactive, nontoxic, less expensive and
non-corrosive. They do not undergo phase segregation and do not significantly degrade
with thermal cycling.
However, they have some inherent disadvantages like their low thermal
conductivity and flammability, and supercooling which might limit their efficient use
(Oró et al., 2012). They have also relatively lower thermal storage capacity compared to
the other PCMs, which is the result of their lower density and lower latent heat of
fusion. Thermo-physical properties of some paraffins are given in Table 2-1 (Babich et
al., 1994; Nagano et al., 2003; Paris et al., 1993).
Univers
ity of
Mala
ya
20
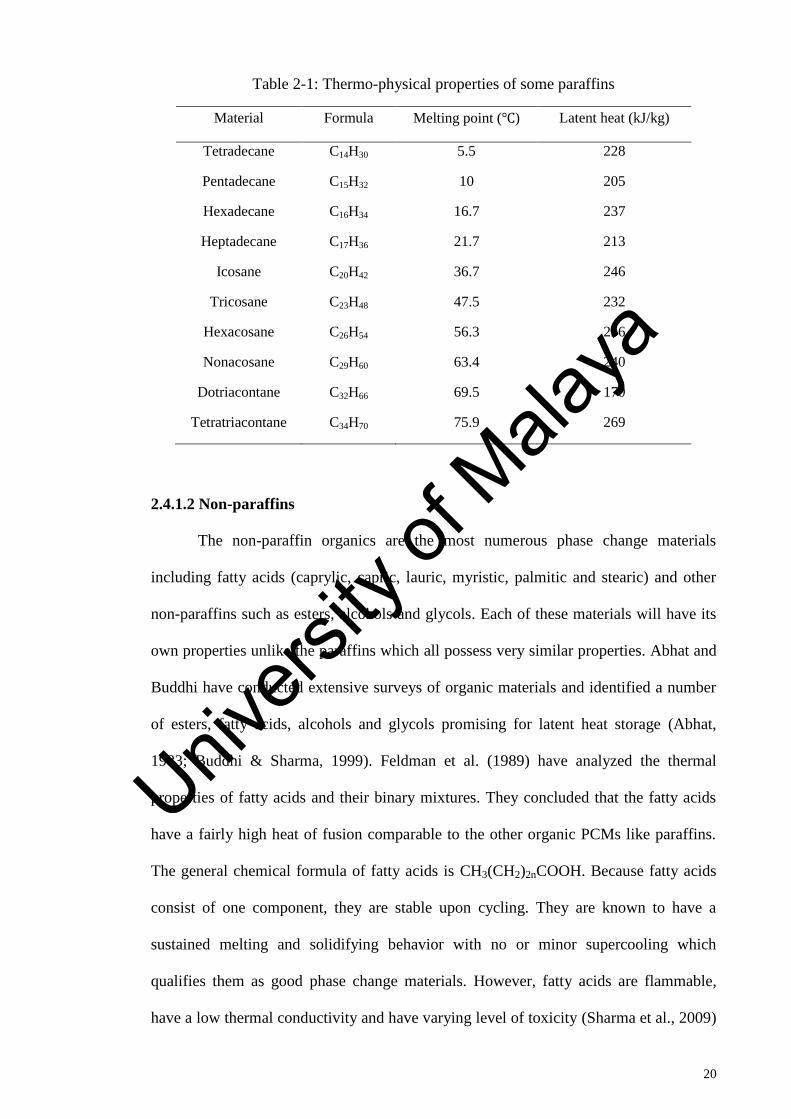
Table 2-1: Thermo-physical properties of some paraffins
Material Formula Melting point (℃) Latent heat (kJ/kg)
Tetradecane C14H30 5.5 228
Pentadecane C15H32 10 205
Hexadecane C16H34 16.7 237
Heptadecane C17H36 21.7 213
Icosane C20H42 36.7 246
Tricosane C23H48 47.5 232
Hexacosane C26H54 56.3 256
Nonacosane C29H60 63.4 240
Dotriacontane C32H66 69.5 170
Tetratriacontane C34H70 75.9 269
2.4.1.2 Non-paraffins
The non-paraffin organics are the most numerous phase change materials
including fatty acids (caprylic, capric, lauric, myristic, palmitic and stearic) and other
non-paraffins such as esters, alcohols and glycols. Each of these materials will have its
own properties unlike the paraffins which all possess very similar properties. Abhat and
Buddhi have conducted extensive surveys of organic materials and identified a number
of esters, fatty acids, alcohols and glycols promising for latent heat storage (Abhat,
1983; Buddhi & Sharma, 1999). Feldman et al. (1989) have analyzed the thermal
properties of fatty acids and their binary mixtures. They concluded that the fatty acids
have a fairly high heat of fusion comparable to the other organic PCMs like paraffins.
The general chemical formula of fatty acids is CH3(CH2)2nCOOH. Because fatty acids
consist of one component, they are stable upon cycling. They are known to have a
sustained melting and solidifying behavior with no or minor supercooling which
qualifies them as good phase change materials. However, fatty acids are flammable,
have a low thermal conductivity and have varying level of toxicity (Sharma et al., 2009)
Univers
ity of
Mala
ya
21
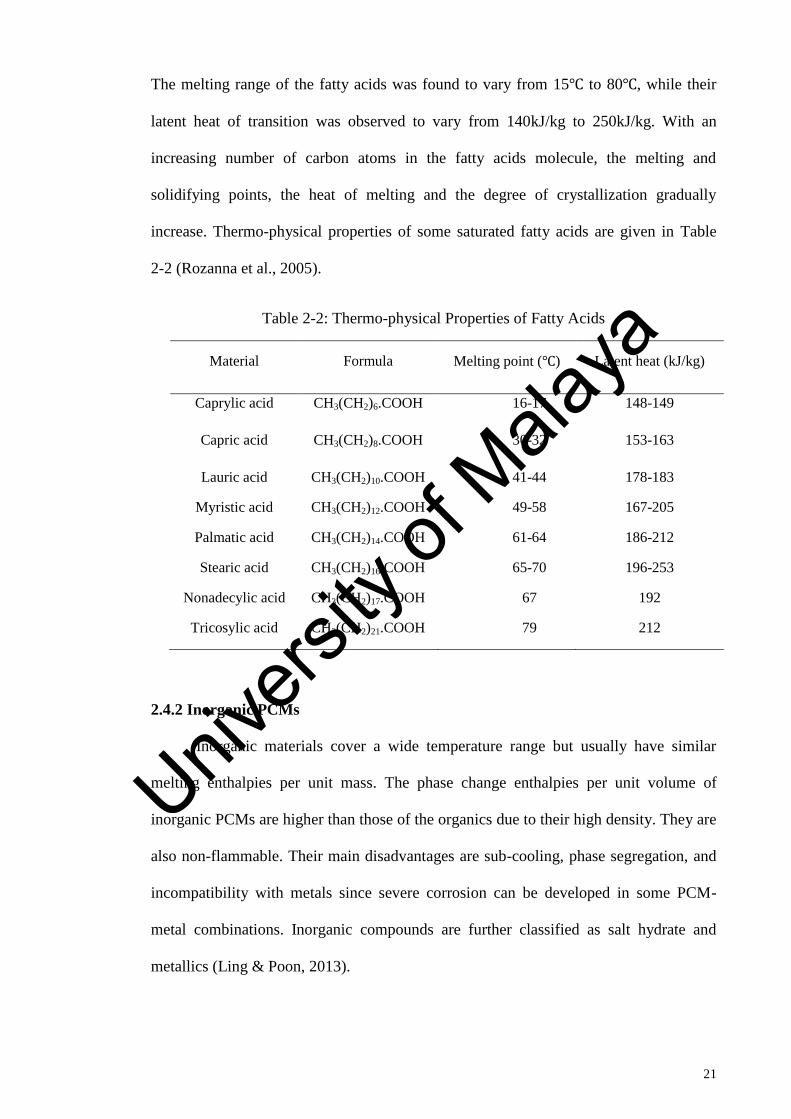
The melting range of the fatty acids was found to vary from 15℃ to 80℃, while their
latent heat of transition was observed to vary from 140kJ/kg to 250kJ/kg. With an
increasing number of carbon atoms in the fatty acids molecule, the melting and
solidifying points, the heat of melting and the degree of crystallization gradually
increase. Thermo-physical properties of some saturated fatty acids are given in Table
2-2 (Rozanna et al., 2005).
Table 2-2: Thermo-physical Properties of Fatty Acids
Material Formula Melting point (℃) Latent heat (kJ/kg)
Caprylic acid CH3(CH2)6.COOH 16-17 148-149
Capric acid CH3(CH2)8.COOH 30-32 153-163
Lauric acid CH3(CH2)10.COOH 41-44 178-183
Myristic acid CH3(CH2)12.COOH 49-58 167-205
Palmatic acid CH3(CH2)14.COOH 61-64 186-212
Stearic acid CH3(CH2)16.COOH 65-70 196-253
Nonadecylic acid CH3(CH2)17.COOH 67 192
Tricosylic acid CH3(CH2)21.COOH 79 212
2.4.2 Inorganic PCMs
Inorganic materials cover a wide temperature range but usually have similar
melting enthalpies per unit mass. The phase change enthalpies per unit volume of
inorganic PCMs are higher than those of the organics due to their high density. They are
also non-flammable. Their main disadvantages are sub-cooling, phase segregation, and
incompatibility with metals since severe corrosion can be developed in some PCM-
metal combinations. Inorganic compounds are further classified as salt hydrate and
metallics (Ling & Poon, 2013).
Univers
ity of
Mala
ya

22
2.4.2.1 Salt hydrates
Salt hydrates are inorganic salts consisting of salts and water which combine in a
crystalline matrix of general formula AB.nH2O. Hydrated salts are attractive materials
for application in thermal energy storage due to their appropriate properties such as;
high latent heat of fusion per unit volume, relatively high thermal conductivity (almost
double of the paraffin’s) and moderate costs compared to organic PCMs, with few
exceptions. They are the best options for low temperature ranging from 0℃ to 99℃,
based on their thermal properties. However, they are corrosive and not very compatible
with most metallic materials. Additionally some of the salt hydrates have the major
problem of incongruent melting which is caused by the fact that the released water of
crystallization is not sufficient to dissolve all the solid phase present and subcooling
before crystallization which is due to their poor nucleating properties. Thermo-physical
properties of some salt hydrates are shown in Table 2-3 (Regin et al., 2008; Zhou et al.,
2012).
Table 2-3: Thermo-physical Properties of salt hydrates
Material Melting point (℃) Latent heat (kJ/kg)
K2HO4.6H2O 14 109
FeBr3.6H2O 27 105
LiNO3.3H2O 30 189
Na2SO4.10H2O 32.4 241
KF.2H2O 42 162
Ca(NO3).4H2O 47 153
MgCl2.4H2O 58 151
Al(NO3)2.9H2O 72 155
Ba(OH)2.8H2O 78 265
Univers
ity of
Mala
ya
23
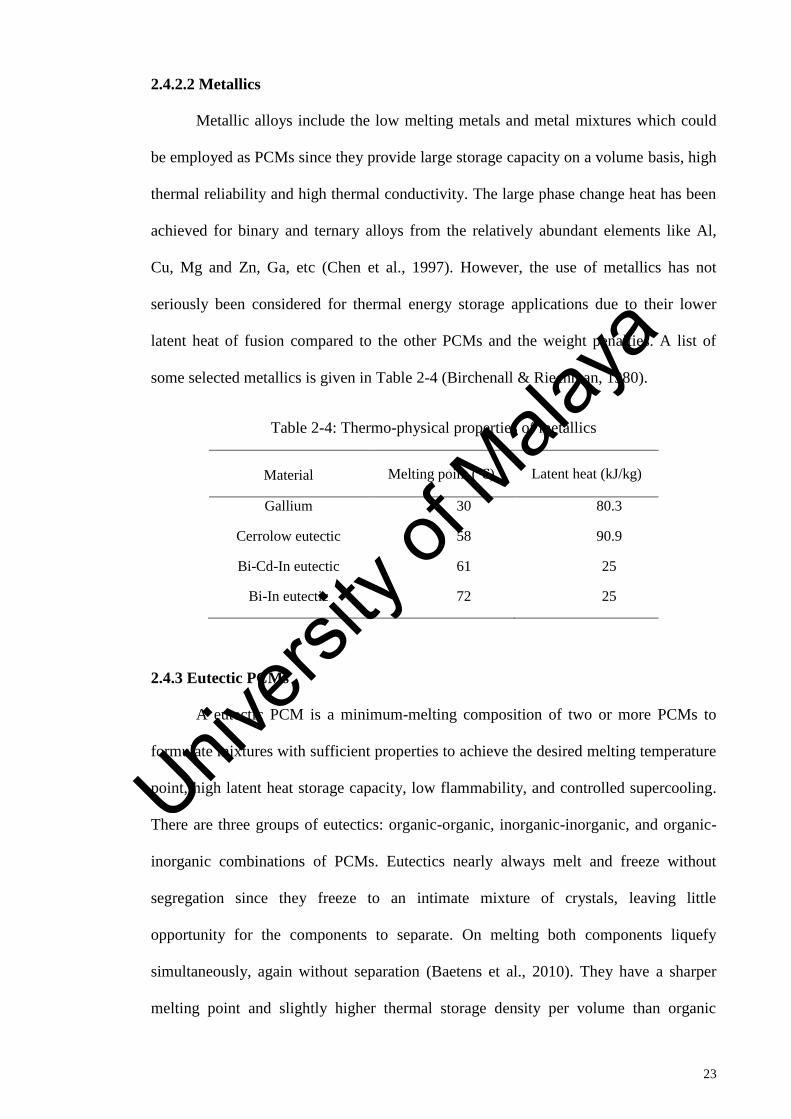
2.4.2.2 Metallics
Metallic alloys include the low melting metals and metal mixtures which could
be employed as PCMs since they provide large storage capacity on a volume basis, high
thermal reliability and high thermal conductivity. The large phase change heat has been
achieved for binary and ternary alloys from the relatively abundant elements like Al,
Cu, Mg and Zn, Ga, etc (Chen et al., 1997). However, the use of metallics has not
seriously been considered for thermal energy storage applications due to their lower
latent heat of fusion compared to the other PCMs and the weight penalties. A list of
some selected metallics is given in Table 2-4 (Birchenall & Riechman, 1980).
Table 2-4: Thermo-physical properties of metallics
Material Melting point (℃) Latent heat (kJ/kg)
Gallium 30 80.3
Cerrolow eutectic 58 90.9
Bi-Cd-In eutectic 61 25
Bi-In eutectic 72 25
2.4.3 Eutectic PCMs
A eutectic PCM is a minimum-melting composition of two or more PCMs to
formulate mixtures with sufficient properties to achieve the desired melting temperature
point, high latent heat storage capacity, low flammability, and controlled supercooling.
There are three groups of eutectics: organic-organic, inorganic-inorganic, and organic-
inorganic combinations of PCMs. Eutectics nearly always melt and freeze without
segregation since they freeze to an intimate mixture of crystals, leaving little
opportunity for the components to separate. On melting both components liquefy
simultaneously, again without separation (Baetens et al., 2010). They have a sharper
melting point and slightly higher thermal storage density per volume than organic
Univers
ity of
Mala
ya

24
compounds. However, they are relatively new to thermal storage applications therefore
there is limited research focused on the thermo-physical properties of eutectics such as
chemical composition, latent heat, and thermal stability. In Table 2-5 the thermo-
physical properties of some selected eutectics are given (Baran & Sari, 2003; Sharma et
al., 2009).
Table 2-5: Thermo-physical properties of some selected eutectics
Material Composition
(wt.%)
Melting point
(℃)
Latent heat
(kJ/kg)
CaCl2.6H2O+CaBr2.6H2O 45+55 14.7 140
C14H28O2+C10H20O2 34+66 24 147.7
Triethylolethane+urea 62.5+37.5 29.8 218
Mg(NO3)3.6H2O+NH4NO3 53+47 46 95
Napthalene+benzoic acid 67.1+32.9 67 123.4
2.5 Limitations of PCMs in Applications and their Obviation Methods
Advantages of PCMs in general are their availability in a large temperature range
for different working requirements, their high thermal energy storage density and quasi-
constant phase change temperature (Zhang et al., 2010). Organic PCMs have a number
of important specifications including, the wide variety to choose from, low volumetric
latent heat storage capacity, chemically and thermally stability, compatibility with
various materials, high heat of fusion (ranging from 45kJ/kg to 210kJ/kg), low or no
subcooling, small phase segregation, and non toxicity. Despite the obstacles of
inorganic PCMs like the large volume change in the melting process, corrosion, poor
thermal stability, and phase separation, the main advantages of them in comparison to
organic PCMs are their greater phase change enthalpy, higher thermal conductivity,
Univers
ity of
Mala
ya
25
easy availability and inflammability (Kuznik et al., 2011; Zalba et al., 2003). Eutectics
are presented as a parallel category for comprehensibility; they are mixtures of organic
and/or inorganic materials at specific composition providing a sharp phase change
temperature (Cabeza et al., 2011). In spite of all the desirable properties of PCMs
mentioned earlier, there are some major problems associated with the applications. The
major obstacle to the wide application of PCMs is the leakage of the molten PCM after
they absorb enough energy to complete the phase change to a liquid. This leakage of the
PCM causes failure in its application value, therefore; preventing this leakage is one of
the major requirements for widespread use of PCMs in the thermal energy storage
applications (Dincer & Rosen, 2002). The leakage of PCMs may be an issue over the
lifetime of many years. The other most important disadvantage of the PCMs is their low
thermal conductivity which leads to slow charging and discharging rates and causes low
heat transfer performance. Although inorganic PCMs exhibit higher thermal
conductivity, it rarely surpasses 0.7W/m.K (Pasupathy et al., 2008; Zalba et al., 2003).
As reported by (Bugaje, 1997) the phase change process (charging and discharging)
time is the most important design parameter in latent heat storage systems. Several
studies have been conducted to overcome these disadvantages. Typical solutions like
adding materials with high thermal conductivity to the pure PCM (Ding & Yin, 2004;
Wen & Ding, 2004), using extended surfaces by addition of fins (Ettouney et al., 2004;
Solomon et al., 2013), shape stabilized PCMs and impregnation of PCMs to highly
conductive matrices (Mesalhy et al., 2006; Siahpush et al., 2008) and encapsulation of
PCMs (Qiu et al., 2012; Zheng et al., 2013).
Univers
ity of
Mala
ya

26
Figure 2-4: Heat transfer enhancement methods employed for PCMs (Salunkhe &
Shembekar, 2012)
Other properties, such as flammability, volume change, and corrosion issues also
limit the use of PCMs in building structures, and impose constraints on the storage
containers as well as on the heat exchanger materials. These issues can however be
overcome with adequate choice of storage container and heat exchanger material (Tyagi
et al., 2012). Among these solutions encapsulation is an effective process in which small
particles of PCMs are coated by some shell material (Salunkhe & Shembekar, 2012).
Hawlader et al. (2003) concluded that the encapsulated paraffin wax shows an
impressive potential for solar thermal-energy storage applications.
2.6 Phase Change Materials Encapsulation
Phase change material encapsulation is one of the most practical solutions for
overcoming the problems due to the disadvantages of PCMs. Encapsulation is defined
as the process of covering the PCM as the core material within another substance as the
shell material (Hawlader et al., 2002). The functioning process of the encapsulated PCM
(EPCM) can be explained as follows. In solid state, the supplied heat to the PCM
increases its temperature until it reaches the melting point. As the shell resides the PCM
Univers
ity of
Mala
ya

27
in a solid state, when the melting point is reached, the shell transfer the heat from the
surrounding to the PCM. The PCM melts into a liquid state at a constant temperature
while remaining inside the shell. Through this phase transition process significant
volume of heat is stashed. The molten PCM transforms to solid when the surrounding
has a temperature lower than its melting point through the same procedure as the
melting process. The phase change accomplish through discharge of thermal energy
throughout sensible cooling and the phase change procedure from the liquid to solid
(Figure 2-5).
Figure 2-5: Encapsulated PCM melting/solidifying process
A major aim of encapsulation is retaining the liquid and/or solid phase of the
PCM and holding it separated from the surrounding. This assures proper composition of
the PCM that might have otherwise changed because of mixing of the PCM with the
surrounding materials. Additional benefits of encapsulation include decrease in reaction
PCM with all the surrounding, flexibility in frequent phase change processes, increase
in the heat transfer area which causes increase in heat transfer coefficient of the system
and improvement in thermal and mechanical stability of the PCM. It may also enhance
the compatibility of hazardous PCMs that cannot be directly utilized or immersed in
some applications like food storage, building cooling/ heating, etc. A significant issue
Univers
ity of
Mala
ya

28
for the encapsulation of inorganic PCMs is their corrosion with metals and complete
solubility in water. In comparison, organic PCMs are non-corrosive and display
negligible or incomplete solubility in water (Li et al., 2007; Su et al., 2015).
However, most of the organic PCMs are flammable. The flammability can be
reduced by encapsulating the PCM with an inorganic material. The shell should be
strong enough to sustain the stresses that are generated due to volumetric changes
during the phase change process of the PCM. Encapsulations are usually classified by
their size as macro (larger than 1mm), micro (1 μm to 1 mm) and nano (smaller than 1
μm) encapsulated PCMs (Yamagishi et al., 1999).
Macroencapsulation, is comprising the PCMs which are encapsulated in a
container in some form of package such as tubes, spheres, panels or other receptacles.
These containers usually are larger than 1mm and made of metal or plastics.
Macroencapsulation is very common in long thin heat pipes, PVC panels, heat
exchangers or in building products because such containers or bags are available in a
large variety (Chen et al., 2000). However, large macro encapsulation has not performed
well in earlier studies due to the poor thermal conductivity of the PCM, and also
because in the phase change process the edge remains solid, whereas, core part may still
remain in the liquid form, thus this prevent the effective heat transfer (Cho & Choi,
2000).
Manufacturing of nano/microencapsulated PCM (NE/MEPCM) is more complex
than macroencapsulated but nano/microencapsulation is more efficient and applicable in
the thermal storage applications. Nano/microcapsules have higher heat transfer rates
than macrocapsules attributed to a substantially higher surface area to volume ratio,
ability to withstand the change in volume during phase change process and less
chemical reactivity of PCM with the shell material. A higher heat transfer rate results in
Univers
ity of
Mala
ya
29
rapid melting and solidification of the NE/MEPCMs (Khudhair & Farid, 2004).
Nano/microencapsulating PCM has several considerable benefits such as providing a
larger surface area for heat transfer to the surroundings because of the large surface-to-
volume ratio of the capsules, and the leakage preventing of the molten core material.
Furthermore, it is also possible to integrate microencapsulated PCM into other
materials, such as building insulations, or food containers (Fang et al., 2009). However,
in some fields, especially in latent functionally thermal fluids, microencapsulated PCMs
are not appropriate for repeated cycling, because the large size particles of the PCM
microcapsules increase the fluid’s viscosity; thus it is obligatory to develop PCM
nanocapsules with smaller particle sizes as compared with microcapsules (Fang et al.,
2008). In recent years, several kinds of nanoencapsulated PCMs were synthesized by
different methods. Nanocapsules of n-octacosane with PMMA (poly (methyl
methacrylate)) shells were investigated by Sarı et al. (2009a) . The nanocapsules had
energy storage and release capacity of 86.4-88.5 kJ/kg during their phase change.
Kwon et al. (2010) also prepared nanocapsules of n-octacosane. Nanocapsules of n-
hexadecane with the shell of poly (alkyl methacrylate) were fabricated by Black et al.
(2010) while Alay et al. (2010) synthesized PMMA/n-hexadecane nanocapsules as a
fiber additive in textile application.
Depending on the physico-chemical properties of the core, the wall composition,
and the used microencapsulation techniques, nano/microcapsules may be shaped in
different types as shown in Figure 2-6: simple sphere with a continuous wall
surrounding the core; particle containing an irregular shape core; smaller droplets of
core material embedded throughout the capsule; several distinct cores within the same
capsule and multi-walled capsules (Gharsallaoui et al., 2007). Among all of them,
simple sphere particle is the most common one being fabricated and utilized.
Univers
ity of
Mala
ya
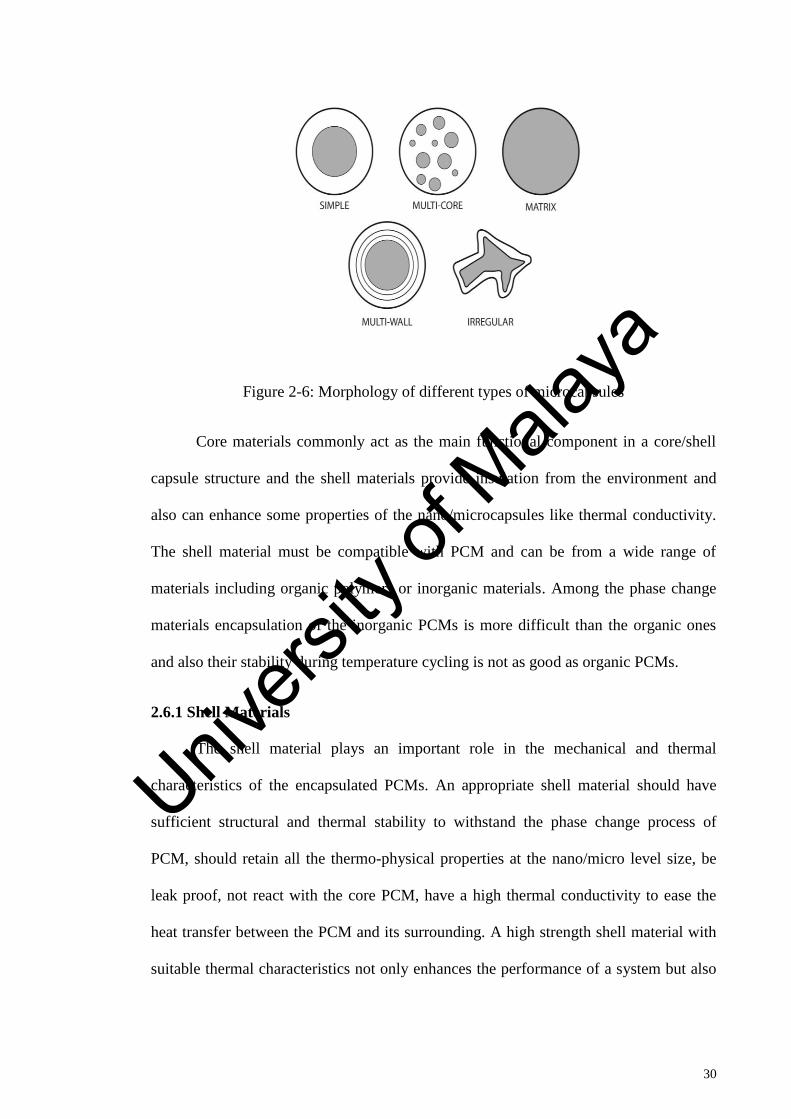
30
Figure 2-6: Morphology of different types of microcapsules
Core materials commonly act as the main functional component in a core/shell
capsule structure and the shell materials provide insulation from the environment and
also can enhance some properties of the nano/microcapsules like thermal conductivity.
The shell material must be compatible with PCM and can be from a wide range of
materials including organic polymers or inorganic materials. Among the phase change
materials encapsulation of the inorganic PCMs is more difficult than the organic ones
and also their stability during temperature cycling is not as good as organic PCMs.
2.6.1 Shell Materials
The shell material plays an important role in the mechanical and thermal
characteristics of the encapsulated PCMs. An appropriate shell material should have
sufficient structural and thermal stability to withstand the phase change process of
PCM, should retain all the thermo-physical properties at the nano/micro level size, be
leak proof, not react with the core PCM, have a high thermal conductivity to ease the
heat transfer between the PCM and its surrounding. A high strength shell material with
suitable thermal characteristics not only enhances the performance of a system but also
Univers
ity of
Mala
ya

31
allows the PCM nano/microcapsules to withstand the large number of thermal cycles
(Khodadadi & Hosseinizadeh, 2007; Mettawee & Assassa, 2007).
2.6.1.1 Polymers Used as Shell Materials
Common materials that have been selected as the shell materials for the
traditional nano/microencapsulated PCMs are organic polymers or macromolecules
(Zhao & Zhang, 2011). Zhang and Wang (2009) synthesized microencapsulated n-
octadecane with polyurea shells. Polyurea was considered as an optimal shell material
because it has good physical properties and chemical stabilities, and it also does not
cause environmental and health problems like melamine–formaldehyde resin and urea–
formaldehyde resin do. Fan et al. (2004) synthesized n-alkane microcapsules using 70
wt.%. n-octadecane with melamine formaldehyde shell by in situ polymerization. They
studied the stirrer rate and the dosage of emulsifier in the process. Sun and Zhang
(2002) investigated effect of different coating materials, namely, melamine–
formaldehyde, urea–formaldehyde and gelatin on the mechanical strength of the
microcapsule. It was observed that melamine–formaldehyde and urea–formaldehyde
ruptured under the compression test, whereas, gelatin was found to be structurally
stable. In another survey, Shin et al. (2005) prepared melamine–formaldehyde
microcapsules containing eicosane. They concluded that the prepared materials had heat
storage capacities of 0.91–4.44kJ/kg. Alkan et al. (2009) investigated preparation,
characterization and thermal analysis of the microcapsules with docosane as the core
material and PMMA as the coating material. The microcapsules had a smooth and
compact surface with an average diameter of 0.16μm. After 1000, 3000 and 5000
thermal cycles, a substantially improved thermal reliability was observed in terms of
change in temperature and enthalpy. Bayés-García et al. (2010) assessed thermal
stability of microcapsules synthesized by different shell compositions, namely,
sterilized gelatine/arabic gum (SG/AG) and agar-agar/arabic gum (AA/AG). Onder et
Univers
ity of
Mala
ya
32
al. (2008) also used a gum arabic–gelatin mixture as the shell material with different
types of paraffin waxes, namely n-hexadecane, n-octadecane and n-nonadecane as the
core materials. The microcapsules with n-octadecane gave the highest enthalpy value of
166kJ/kg. Sánchez et al. (2008) investigated the influence of reaction temperature,
stirring rate, and the mass ratio of paraffin wax to styrene on the thermal properties of
microcapsules.
The organic polymeric wall materials play an important role in improving the
structural flexibility, permeability, and controlled release with easier processing toward
the nano/microencapsulated PCMs, it is no doubt that these NE/MEPCMs with
polymeric shells also have some disadvantages including poor thermal and chemical
stabilities, flammability and low thermal conductivity (Cai et al., 2009; Fang et al.,
2010a).
2.6.1.2 Inorganic Materials as the Shell Materials
Regarding to the obstacles of the organic polymers as the shell material, it is
necessary to find other types of materials which can overcome the limitations of the
polymers. Compared to the organic polymer materials the thermal conductivity, the
chemical and thermal stabilities, mechanical strength, and flame retardancy of inorganic
materials are always significantly higher. So employing an appropriate inorganic
material as shell for the NE/MEPCMs is a promising idea to improve their phase-
change performance, whereas few studies report on the nano/microencapsulation
technologies for PCMs with inorganic shell (Salunkhe & Shembekar, 2012). Use of
inorganic shell materials has gained growing interest recently and just some attempts
have been accomplished to encapsulate PCMs within the silica shell. Silica materials are
nontoxic; in addition, they have a high surface area and tunable pore sizes. Their
structures are stable and their surface properties well-defined. Silica spheres have a
desirable thermal conductivity (Pan et al., 2009). In a survey Jin et al. (2010) developed
Univers
ity of
Mala
ya

33
a one-step synthetic technique for the microencapsulated PCMs with the silica wall
under a surfactant or dispersant free condition. Moreover, Li et al. (2013) and Fang et
al. (2010a) reported the preparation and phase change properties of the PCM
microcapsules based on paraffin core and silica wall through in-situ polycondensation.
The sol-gel process as one of the applicable methods enables the encapsulation
of different compounds by metal oxides in very mild conditions like room temperature
and atmospheric pressure. The sol-gel process usually is combined with emulsion
technology to obtain the metal oxide encapsulated compounds (Livage et al., 1988).
2.6.2 Applications of Nano/Microencapsulated PCMs
Nano/microencapsulated phase change materials are very attractive in improving
the thermal performance in some application such as textile fabrics, building, slurry
applications and solar water heating (Griffiths & Eames, 2007) (Shin et al., 2005)
(Tyagi et al., 2012; Zhang et al., 2010).
2.6.2.1 Textile Applications
Many studies have been done on NE/MEPCM textile materials. Sarier and Onder
(2007) used four types of polyurea–formaldehyde microcapsules containing different
waxes for the design of thermally enhanced fabrics. They demonstrated that a
combination of microcapsule containing different types of PCMs were better than those
including a mixture of them.
2.6.2.2 Building Applications
By encapsulating suitable PCMs within the surfaces of walls, ceilings and floors
of buildings, energy storage in those surfaces can be increased which can accumulate
solar energy in the daytime to be used for heating at nights or during cloudy periods.
(Tyagi et al., 2012). Su et al. (2005) prepared a double shell MEPCM with a melting
point of 24℃ and a heat of fusion of 225.5kJ/kg for building application. They
Univers
ity of
Mala
ya
34
concluded that the double shell microcapsules were better than single shell ones in
terms of avoiding penetration, and the average diameter of 5μm were better than 1μm.
Hawlader et al. (2003) investigated the microencapsulation of paraffin wax in polymeric
films. Results from differential scanning calorimeter tests showed that the paraffin
microcapsules had high heat storage and release capacities and were suitable for
building energy storage applications.
2.6.2.3 Nano/Microencapsulated PCM Slurries
The concept of a carrier fluid for encapsulated particles of phase change
materials was first introduced by Mehalick and Tweedie (1975). When the NE/MEPCM
is dispersed into the carrier fluid like water, a kind of suspension named as
nano/microencapsulated phase change slurry (NE/MEPCMS) is formed. Due to its
special properties such as high energy storage density, low pumping power
requirements, and high heat transfer rates between the wall and the suspension a lot of
research work has been conducted on the PCM suspension flow. NE/MEPCMS can
serve as both the energy storage and heat transfer media because of the relatively large
surface area to volume of NE/MEPCM, in addition, the agglomeration of NE/MEPCM
can be avoided due to the encapsulation (Chen et al., 2014). Roy and Sengupta (1991)
used n-eicosane and stearic acid as phase change material for MEPCMS, the
microcapsules were manufactured with two different wall thickness; they found that the
microcapsules with thicker walls were able to withstand repeated thermal cycling past
the melting point. In another study Wang et al. (2007) demonstrated that the heat
transfer coefficients measured for MEPCM slurry are significantly higher than for those
of single-phase fluid flow.
2.7 Summary
The concept of solid-liquid phase change materials as the latent heat materials
for thermal energy storage was introduced in this chapter. The important aspect of high
Univers
ity of
Mala
ya

35
heat content at narrow ranges of temperature supports the use of PCM in solar
applications, but various other thermo-physicals, kinetic and chemical properties have
also been identified as essential to the proper utilization of PCMs. The lack of certain
desired properties can be overcome through appropriate system design. The
classification of PCMs into organic, inorganic and eutectics has been presented.
Solid-liquid PCMs are found to have poor heat transfer properties and hence are
not used directly as a heat transfer medium. Encapsulation of PCMs was introduced as
one of the most significant methods to overcome the hindrances of PCMs. The concept
and classification of EPCMs were presented by introducing previous researches that
have been done. The importance of choosing an appropriate shell material was
discussed. The majority of PCM systems encountered in the literature have been studied
for the encapsulated PCMs in the organic polymer shell materials. The difficulties of
using polymer materials as the shell material like low thermal conductivity,
flammability and complex synthesis process, etc were discussed.
The following chapters describe the novel materials and NE/MEPCMs with
inorganic shell materials employed in this study to enhance the performance of
NE/MEPCMs.
Univers
ity of
Mala
ya
36
CHAPTER 3 MATERIALS AND METHODS
MATERIALS AND METHODS
3.1 Introduction
In this chapter the theory of fundamentals and technologies of manufacturing the
NE/MEPCMs within three different kinds of metal oxides is brought up. The processing
techniques including material selection, determination of specific parameters and
material pretreatment are thoroughly discussed. A full factorial experimental design and
its principals are determined.
Characterization of the materials and their preparation methods are addressed in
this chapter. A number of modern characterization techniques were adopted to study the
structure and morphology features of novel NE/MEPCMs. These techniques including
Field Emission Scanning Electron Microscopy (FESEM) and Transmission Electron
Microscopy (TEM) for surface and inner structure observation; Fourier Transmittance
Infrared Spectra (FT-IR), X-ray Diffractometry (XRD), Differential Scanning
Calorimetry (DSC), Thermal Gravimetry (TGA). These instruments were applied to the
objective evaluation of chemistry and identification of physical structure. The thermal
cycling test was also introduced to investigate the thermal performance of the prepared
NE/MEPCMs. The thermal conductivity of the prepared PCMs were measured by two
methods and explained in this chapter. The materials research for TES applications and
some fundamental aspects that should be considered was followed in this research
which is shown in Figure 3-1.
Univers
ity of
Mala
ya
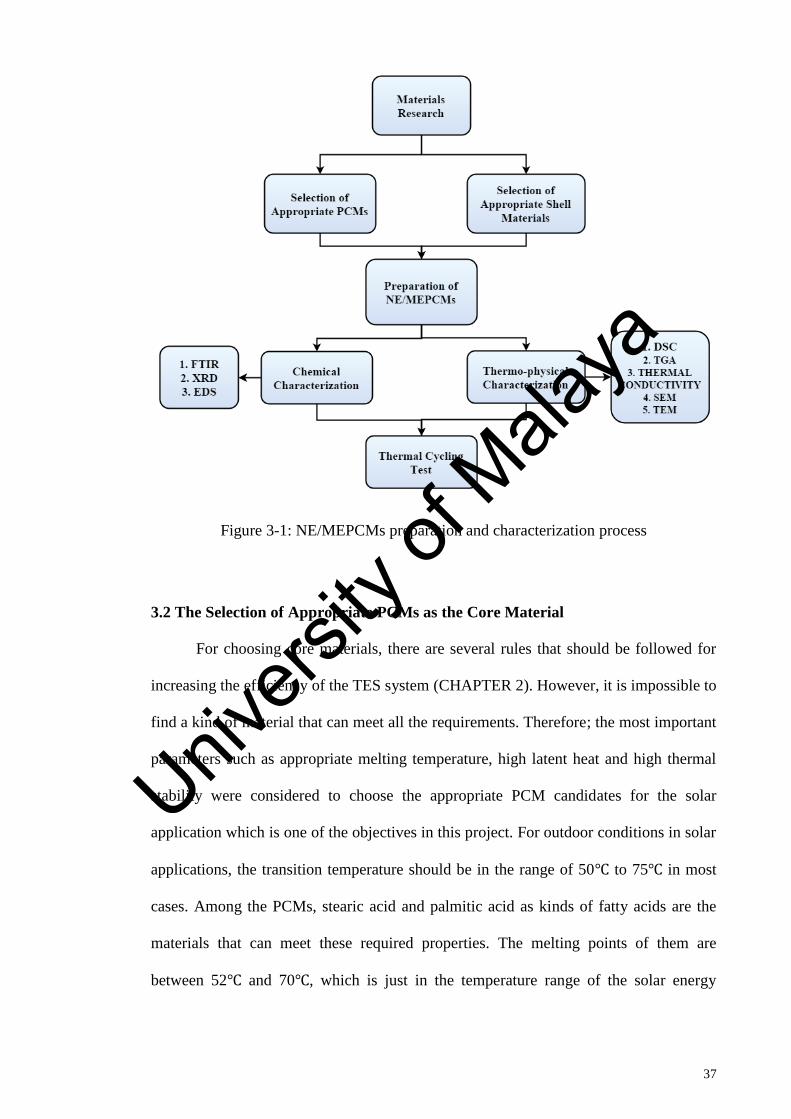
37
Figure 3-1: NE/MEPCMs preparation and characterization process
3.2 The Selection of Appropriate PCMs as the Core Material
For choosing core materials, there are several rules that should be followed for
increasing the efficiency of the TES system (CHAPTER 2). However, it is impossible to
find a kind of material that can meet all the requirements. Therefore; the most important
parameters such as appropriate melting temperature, high latent heat and high thermal
stability were considered to choose the appropriate PCM candidates for the solar
application which is one of the objectives in this project. For outdoor conditions in solar
applications, the transition temperature should be in the range of 50℃ to 75℃ in most
cases. Among the PCMs, stearic acid and palmitic acid as kinds of fatty acids are the
materials that can meet these required properties. The melting points of them are
between 52℃ and 70℃, which is just in the temperature range of the solar energy
Univers
ity of
Mala
ya
38
systems. The required materials for our experiments were procured from Fisher
Scientific, Inc.
3.2.1 Palmitic Acid
Renewed interest in the use of fats and oils for sustainable chemistry has led to
the growing importance of materials prepared from them. Animal and plant based fats
and oils are typically hydrolyzed to obtain mixtures of fatty acids that are purified and
subsequently separated. The fatty acids are easily producible from common vegetable
and animal oils. Thus it provides an assurance of continuous supply despite the shortage
of fuel sources. Fatty acids have high heat of fusion values comparable to those of
paraffin’s. They also show reproducible melting and freezing behavior and freeze with
negligible supercooling.
Generally, fatty acids are aliphatic carboxylic acid consists of a straight chain of
an even number of carbon atoms, with hydrogen atoms along the length of the chain and
at one end of the chain joined to terminal carboxyl (−COOH) group at the other end.
That carboxyl group makes it an acid (carboxylic acid). If the carbon-to-carbon bonds
are all single, the acid is saturated; if any of the bonds is double or triple, the acid is
unsaturated and is more reactive. The saturated fatty acids are white, waxy, natural fatty
acids which are fairly insoluble in water but can be somewhat soluble in alcohol.
Palmitic acid (also called n-hexadecanoic acid; 1-pentadecanecarboxylic acid;
cetylic acid; hexadecylic acid) is a saturated fatty acid that is commonly found in both
animals and plants. As its name indicates, it is a major component of the oils from palm
trees, such as palm oil, palm kernel oil and coconut oil, but can also be found in meat
and dairy products. Its chemical formula is CH3(CH2)14COOH. The chemical structure
of palmitic acid (PA) as an example of saturated fatty acid and also the unsaturated PA
Univers
ity of
Mala
ya

39
as an unsaturated fatty acid are shown in Figure 3-2. The thermo physical properties of
the used palmitic acid are listed in Table 3-1.
Figure 3-2: Chemical structure of saturated palmitic acid and unsaturated palmitic acid
Table 3-1: Thermo-physical properties of the palmitic acid
Name Palmitic acid
Purity 98%
Molecular weight (g/mol) 256
Density (g/cm3) at 20℃ 0.852
at 62℃ 0.852
Solubility
insoluble in water, soluble in amyl
acetate, alcohol, CCl4, C6H6
and very soluble in CHCl3
Melting Point (℃) 59-63
Boiling point (℃) 351
Thermal conductivity (W/m.K) 0.21-0.30
Thermal capacity ΔH (J/g) 180-208
Specific heat capacity C (J/mol.K) at 25℃ 1.8069
3.2.2 Stearic Acid
Stearic acid (also called octadecanoic acid, 1-heptadecanecarboxylic acid,
cetylacetic acid, stearophanic acid) is a white, waxy, natural acid and is one of the most
common long-chain saturated fatty acids, found in animal and vegetable fats. It is much
more abundant in animal fat than in vegetable fat. The chemical formula of stearic acid
Univers
ity of
Mala
ya

40
is CH3(CH2)16COOH. The chemical structure of stearic acid (SA) is demonstrated in
Figure 3-3.
Figure 3-3: Chemical structure of saturated stearic acid
Apart from PCMs in thermal energy storage applications, stearic acid is also
used as a lubricant, softener, accelerator activator and as an additive in industrial
preparations such as the manufacture of metallic stearates, pharmaceuticals, soaps,
cosmetics, and food packaging. Thermo physical properties of the used stearic acid are
listed in Table 3-2.
Table 3-2: Thermo-physical properties of stearic acid
Name Stearic acid
Purity 99%
Molecular weight (g/mol) 284
Density (g/cm3) at 25℃ 0.940
at 70℃ 0.847
Solubility
insoluble in water, Soluble in
alkyl acetates,alcohols, HCOOCH3,
phenyls, CCl4
Melting Point (℃) 54-58
Boiling point (℃) 350
Thermal conductivity (W/m.K) 0.17-0.25
Thermal capacity ΔH (J/g) 170-195
Specific heat capacity C (J/mol.K) at 25℃ 1.765
Univers
ity of
Mala
ya

41
3.3 The Selection of Shell Materials
The coating materials used in the encapsulation of PCMs have an important
effect on the efficiency of the prepared materials, therefore there are also some
characteristic that should be considered in choosing the shell material. According to the
required properties of the shell material and the disadvantages of using polymeric
organic materials which is noted in CHAPTER 2, inorganic materials were chosen as
the shell material. Among the inorganic materials, metal oxides have high thermal
conductivity, thermal stability and mechanical strength. So silicon dioxide, titanium
dioxide and aluminium oxide were chosen for use as shell material in the encapsulated
PCMs.
There are several methods to fabricate NE/MEPCMs, which can be divided into
three categories:
1. Physical methods: pan coating, spray drying, air-suspension coating, centrifugal
extrusion, vibrational nozzle, solvent evaporation, etc.
2. Chemical methods: interfacial polymerization, suspension polymerization,
emulsion polymerization, etc.
3. Physico-chemical method: ionic gelation, coacervation, sol-gel method, etc.
Chemical methods can cause environmental and health problems but physical
methods have little negative influence on the environment. However, they are not
capable of producing MEPCMs smaller than 100 µm. The other disadvantages of these
methods are that the temperature of their reaction should be controlled and the produced
NE/MEPCMs have poor stability and have non uniform particle size distribution (Chen
et al., 2014). Physico-chemical techniques are based on phase separation in a colloidal
system, wherein a soluble shell material aggregates around the core material to form a
solid wall. The produced nano/microcapsules via physico-chemical methods have a
small size, uniform size distribution, tight shell and good stability (Fang et al., 2014).
Univers
ity of
Mala
ya

42
Among the physico-chemical methods, nano/microcapsules within high thermal
conductivity inorganic shell materials can be produced with the sol-gel method
(Jamekhorshid et al., 2014). The sol-gel method has some advantages compared to other
methods such as providing high purity homogeneous materials; offering an easy way for
the introduction of trace elements; allowing the use of chemical techniques for reaction
control; allowing the formation of a ―pre‖- inorganic network in solution and also
allowing the densification to inorganic solids at comparatively low temperatures (due to
the ―pre‖-inorganic network). Therefore; in this project a sol-gel method was utilized to
prepare the NE/MEPCMs.
3.3.1 Sol-Gel Method
The sol-gel process has become known as the most practical method in recent
years for preparing chemically homogeneous coatings and powders (typically a metal
oxide) with a variety of useful applications such as coating and ceramic engineering
(Brinker & Scherer, 2013; Hayat et al., 2011; Tredwin et al., 2013). The sol-gel method
was developed in the 1960s mainly due to the need of new synthesis methods in the
nuclear industry. The term ―sol–gel‖ is an abbreviation for ―solution-gelling‖ and
denotes a cheap and low-temperature technique which involves the controlled
hydrolysis and condensation of molecular precursors such as a metal alkoxide, or metal
salt.
The sol-gel processes can be classified into two different routes depending on the
nature of the precursors. The precursor is a solution of: a) an inorganic salt or b) a metal
alkoxide. The chemistry of transition metal ions can be rather complicated because of
the formation of a large number of oligomeric species, depending on the oxidation state,
the pH or the concentration (Klein, 2013). In this route the counter anions, which are
able to coordinate the metal ion giving rise to a new molecular precursor with different
chemical reactivity. These ions can influence the morphology, the structure and even the
Univers
ity of
Mala
ya
43
chemical composition of the resulting solid phase. Also the removal of these anions
from the final metal oxide product is often a problem. Many of these issues can be
avoided by using metal alkoxides as precursors. They are often soluble in organic
solvents, providing high homogeneity, and can easily be converted to the corresponding
oxide. Some alkoxides, which are widely used in industry, are commercially available at
low cost (Si, Ti, Al, Zr, etc), whereas others are hardly available, or only at very high
cost (Mn, Fe, Co, Ni, Cu, Y, Nb, Ta, etc). In this project the low cost alkoxides of
silicon, titanium and aluminium were utilized to prepare the NE/MEPCMs. The sol-gel
conversion of metal alkoxides involves main processes as follows (Brinker & Scherer,
2013):
a) The hydrolysis:
In this step, metal alkoxide as the precursor mixes uniformly with the solvent to
form a homogeneous sol. The reaction is called hydrolysis, because a hydroxyl ion
becomes attached to the metal atom as follows:
M(OR)n + xH2O → M(OR)n−x OH x + xROH
(≡ M − OR + H2O →≡ M − OH + ROH)
R = i − Pr = isopropyl group (CH(CH3)2)
Et = Ethyl group (C2H5)
M = metals like (Si, Al, Ti, Zr, Nb, K, … )
(3-1)
Through the hydrolysis reaction, the alkoxide groups (−OR) are replaced via the
nucleophilic attack of the oxygen atom of a water molecule under release of alcohol and
the formation of a metal hydroxide. In this project tetraethoxysilane (SiC8H20O4-TEOS),
titanium tetraisopropoxide (C12H28O4Ti, TTIP) and aluminium isopropoxide
(C9H21O3Al-AIP) were used as the alkoxide for preparing SiO2, TiO2 and Al2O3,
respectively.
Univers
ity of
Mala
ya

44
Figure 3-4: the sol-gel process schematic of preparing metal oxides (Samiey et al.,
2014)
b) The polycondensation:
Hydrolysis leads to a sol, a dispersion of colloidal particles in a liquid, and
further condensation results in a gel, an interconnected and rigid inorganic network
enclosing a continuous liquid phase. Condensation reactions between two hydroxylated
metal species lead to M−O−M bonds under release of water (oxolation), whereas the
reaction between a hydroxide and an alkoxide leads to M−O−M bonds under release of
an alcohol (alkoxolation). The main reactions of this step are as the reactions below
(Brinker & Scherer, 2013):
Univers
ity of
Mala
ya
45
(OR)n−1M − OH + HO − M(OR)n−1 → (OR)n−1M − O − M OR n−1 + H2O
m OR n−2M(OH)2 → (OR)n−2M − O m + mH2O
m OR n−3M(OH)3 → (OR)n−3M − O m + mH2O + mH+
(≡ M − OH + HO − M ≡→≡ M − O − M ≡ +H2O)
(3-2)
OR n−x(HO)x−1M − OH + ROM(OR)n−x−1(OH)x
→ (OR)n−x(OH)x−1M − O − M(OR)n−x−1(OH)x + R − OH
(≡ M − OR + HO − M ≡→≡ M − O − M ≡ +ROH)
(3-3)
c) Drying step:
Then the gel with three-dimensional network structure formed the final oxide
structure after aging and drying of the sol.
Figure 3-4 illustrates the sol-gel process to produce different structure types of
metal oxides. The sol-gel process is dynamic, and may be steered in the desired
direction by adjusting the proper parameters. Parameters which influence the sol-gel
process are such as: type of precursor, type of catalyst used, type of solvent,
temperature, pH value, relative and absolute concentrations of the reactants. Aqueous
sol–gel chemistry is rather complex, mainly due to the high reactivity of the metal oxide
precursors and the double role of water as ligand and solvent. Therefore; slight changes
in experimental conditions cause the final oxide material to have changes in structural
and morphological aspects. One possibility to decrease and to adjust the reactivity of the
precursors is the use of organic additives like carboxylic acids, β-diketones or functional
alcohols, which act as chelating ligands and modify the reactivity of the precursors. In
the synthesis process of this project absolute ethanol was used as the organic solvent.
Another alternative strategy involves the slow release of water by chemical or physical
processes, allowing control over the local water concentration and thus over the
hydrolysis of the metal oxide precursors. Additionally, because the ratio of hydrolysis
and condensation determines the stability of the sol-gel formulation and both of these
Univers
ity of
Mala
ya

46
processes are strongly dependent on the pH value, addition of bases typically causes a
destabilization of the formulation and therefore a significant reduction of its lifetime.
Bases are known to catalyze the post-condensation step of a sol-gel process and thereby
also allow a reduction of the curing temperature (Jamekhorshid et al., 2014; Kaneko et
al., 2002; Macwan et al., 2011).
3.3.2 Silicon Dioxide (SiO2)
Silicon dioxide (SiO2) also called silica, is recognized for its wide applications
and advantages. SiO2 can be considered as a good inorganic supporting material
candidate because of its non-toxicity, excellent thermal stability, good mechanical
properties, low thermal expansion coefficient, desirable thermal conductivity, high
melting point and specific surface area and fire resistance. The physical forms of silica
can be grouped as crystalline, amorphous, synthetic amorphous and impure forms (as in
quartz, opal, and sand) (Joo et al., 2009; Libor & Zhang, 2009). The properties of silica
are noted in Table 3-3.
Table 3-3: The properties of silica
Property Value
Molar mass (g/mol) 60.08
Density (g/cm3) 2.17-2.65
Melting Point (℃) 1600
Boling Point (℃) 2300
Specific Heat (J/kg.K) 680-730
Thermal Expansion (10-6
/K) 0.55
Thermal Conductivity (W/m.K) 1.3-3
At present, there are quite a few methods for preparing nano scale silicon
dioxide, such as precipitation, sol-gel, micro-emulsification, as well as vacuum
Univers
ity of
Mala
ya

47
distillation and condensation. However, sol-gel is easy to control, and the obtained
particles are evenly distributed (Gao & Yang, 2010; Zhang et al., 2004a). The best
known silicate ester to produce silicon dioxide is tetraethyl orthosilicate (TEOS) which
was used in this project. Tetraethyl orthosilicate (TEOS; Si(OC2H5)4) is a colorless
liquid with a sharp, alcohol-like odor. The substance is classified as flammable on the
basis of its flash point of 45°C. It is not explosive and not oxidizing. TEOS is also
called Tetraethoxysilane, Tetraethyl silicate or Silicon tetraethoxide and has a molecular
weight of 208.3275 g/mol and a density of 0.94 g/cm3 (Choi et al., 2003; Glaser &
Pantano, 1984; Nakamura & Matsui, 1995). The structural formula of TEOS is
presented in Figure 3-5.
Figure 3-5: The structural formula of TEOS
3.3.2.1 Preparation of Palmitic Acid/Silicon Dioxide NE/MEPCMs
Preparation of palmitic acid emulsion: 0.4 g sodium dodecyl sulfate
(NaC12H25SO4) (SDS) as surfactant was dissolved in 200 mL distilled water at 70℃
(more than the melting point temperature of PA); 20 g PA was then added into this
solution which was stirred continuously with a magnetic stirrer at a rate of 1000 rpm for
2 hr.
Univers
ity of
Mala
ya

48
Preparation of silica nanoparticles: 20 g TEOS and 180 mL absolute ethanol
(C2H6O) (99.9%) as the solvent were mixed with 54 mL distilled water and the pH of
the solvent was controlled by adding ammonium hydroxide (NH4OH). The mixture was
stirred with a magnetic stirrer at a rate of 500 rpm for 30 min. The pH of the solution
was controlled at 11(SI1), 11.5(SI2) and 12(SI3) in three different beakers. When the
hydrolysis reaction of the silica was completed, the resultant sol was used as the
encapsulation precursor.
Preparation of nanocapsules: The sol was added drop wise into the PA emulsion
which was stirred at a rate of 500 rpm for 4 hr. The temperature of the emulsion was
controlled at 70℃. Then the emulsion was cooled to room temperature, washed with
distilled water and centrifuged at a rate of 6000 rpm. The formed white powder was
collected and dried at 50℃ for 10 hr; then it was washed with toluene to remove the
residual PA which may not have been encapsulated. Finally, the toluene solution was
centrifuged again and the white powder was collected and dried at 50℃ for 24 hr. The
prepared samples are listed in Table 3-4.
Table 3-4: Specifications of prepared materials
Sample code pH value
SI1 11
SI2 11.5
SI3 12
3.3.3 Titanium Dioxide (TiO2)
Titanium dioxide (TiO2), titania is a white solid inorganic substance which
occurs naturally in several kinds of rock and mineral sands. It is well known that titania
occurs in different forms such as amorphous form, brookite, tetragonal phases, anatase
and rutile. Titanium dioxide is one of the most widely studied transition metal oxides
Univers
ity of
Mala
ya
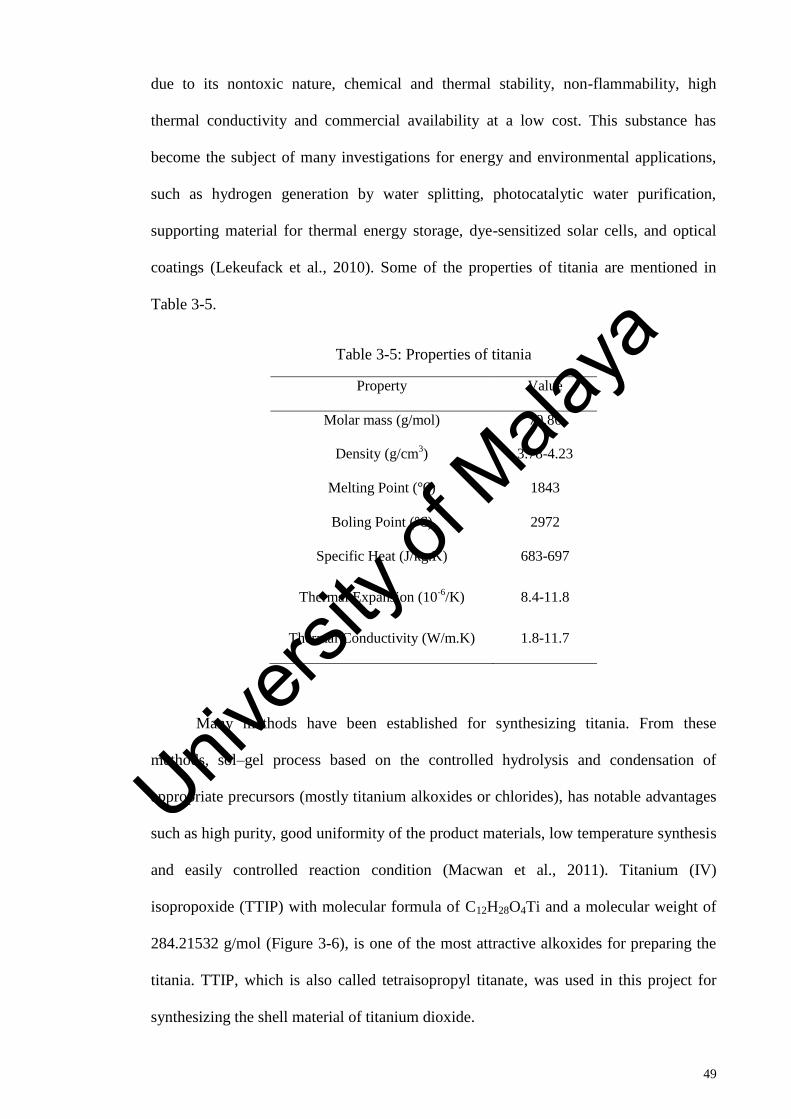
49
due to its nontoxic nature, chemical and thermal stability, non-flammability, high
thermal conductivity and commercial availability at a low cost. This substance has
become the subject of many investigations for energy and environmental applications,
such as hydrogen generation by water splitting, photocatalytic water purification,
supporting material for thermal energy storage, dye-sensitized solar cells, and optical
coatings (Lekeufack et al., 2010). Some of the properties of titania are mentioned in
Table 3-5.
Table 3-5: Properties of titania
Property Value
Molar mass (g/mol) 79.86
Density (g/cm3) 3.78-4.23
Melting Point (℃) 1843
Boling Point (℃) 2972
Specific Heat (J/kg.K) 683-697
Thermal Expansion (10-6
/K) 8.4-11.8
Thermal Conductivity (W/m.K) 1.8-11.7
Many methods have been established for synthesizing titania. From these
methods, sol–gel process based on the controlled hydrolysis and condensation of
appropriate precursors (mostly titanium alkoxides or chlorides), has notable advantages
such as high purity, good uniformity of the product materials, low temperature synthesis
and easily controlled reaction condition (Macwan et al., 2011). Titanium (IV)
isopropoxide (TTIP) with molecular formula of C12H28O4Ti and a molecular weight of
284.21532 g/mol (Figure 3-6), is one of the most attractive alkoxides for preparing the
titania. TTIP, which is also called tetraisopropyl titanate, was used in this project for
synthesizing the shell material of titanium dioxide.
Univers
ity of
Mala
ya
50
Figure 3-6: The structural formula of TTIP
3.3.3.1 Preparation of Stearic Acid/TiO2 NE/MEPCMs
In this part the following method was followed to prepare the stearic acid/TiO2
nanocapsules. In the synthesis procedure, an oil/water (O/W) emulsion was prepared by
mixing 0.3 g of SDS and 50 mL of distilled water using a magnetic stirrer at the rate of
1000 rpm. Once the temperature of the mixture stabilized at 70℃, 3 g of SA was added
to the mixture, and the emulsion was stirred for 1 hr at a constant temperature of 70°C.
After the SA was uniformly dispersed in the emulsion, 15mL of absolute ethanol was
added to the mixture. Due to the high hydrolysis rate of TTIP compared to the TEOS,
the ethanol was added as the solvent in both steps to control the hydrolysis rate.
The precursor solution was prepared in a separate beaker by mixing 15mL of
anhydrous ethanol with TTIP in the ratios listed in Table 3-6 for 15 min. Afterward,
ammonium hydroxide (28%) was used to adjust the pH to 10, 10.8, and 11.5.
Nanocapsule formation was achieved in the last phase by adding the precursor
solution dropwise into the SA emulsion while the emulsion was stirred continuously at a
rate of 750 rpm and a temperature of 70℃. After 2 hr, the mixture was cooled to room
temperature and washed with distilled water several times, and the twelve different
white powder samples were collected and dried in an oven at 50℃.
Univers
ity of
Mala
ya

51
Table 3-6: Chemical composition of the O/W emulsion and precursor solution used for
the fabrication of NEPCMs
Precursor solution
Sample
number
SA/TTIP ratio
(wt/wt) TTIP (g) Volume of absolute
ethanol added (mL)
pH
ST1 50/50 3.00 15 10.0
ST2 60/40 2.00 15 10.0
ST3 70/30 1.28 15 10.0
ST4 80/20 0.75 15 10.0
ST5 50/50 3.00 15 10.8
ST6 60/40 2.00 15 10.8
ST7 70/30 1.28 15 10.8
ST8 80/20 0.75 15 10.8
ST9 50/50 3.00 15 11.5
ST10 60/40 2.00 15 11.5
ST11 70/30 1.28 15 11.5
ST12 80/20 0.75 15 11.5
3.3.4 Aluminium Oxide (Al2O3)
Aluminium oxide is a chemical compound of aluminium and oxygen specifically
identified as aluminium (III) oxide called alumina and is very commonly occurring. The
aluminium oxides, oxide hydroxides, and hydroxides can be summarized as follows
(Wefers & Misra, 1987):
- Aluminium oxides: corundum (α-Al2O3)
Univers
ity of
Mala
ya
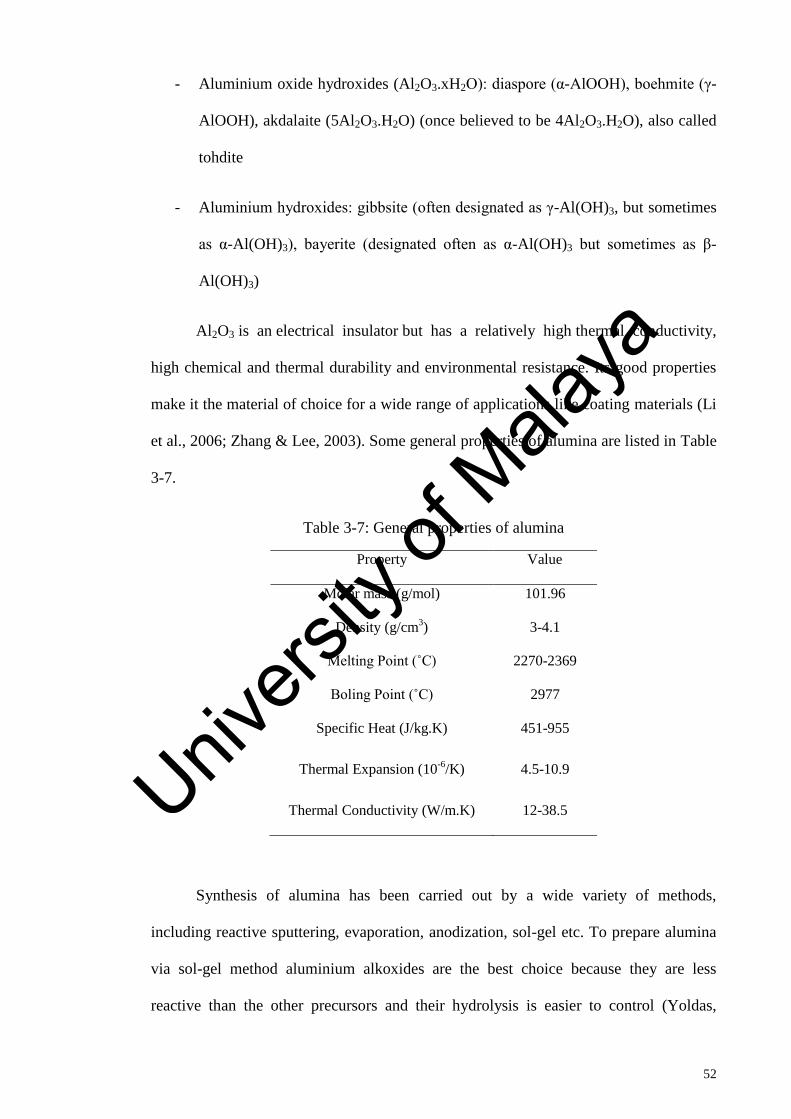
52
- Aluminium oxide hydroxides (Al2O3.xH2O): diaspore (α-AlOOH), boehmite (γ-
AlOOH), akdalaite (5Al2O3.H2O) (once believed to be 4Al2O3.H2O), also called
tohdite
- Aluminium hydroxides: gibbsite (often designated as γ-Al(OH)3, but sometimes
as α-Al(OH)3), bayerite (designated often as α-Al(OH)3 but sometimes as β-
Al(OH)3)
Al2O3 is an electrical insulator but has a relatively high thermal conductivity,
high chemical and thermal durability and environmental resistance. Its good properties
make it the material of choice for a wide range of applications like coating materials (Li
et al., 2006; Zhang & Lee, 2003). Some general properties of alumina are listed in Table
3-7.
Table 3-7: General properties of alumina
Property Value
Molar mass (g/mol) 101.96
Density (g/cm3) 3-4.1
Melting Point (˚C) 2270-2369
Boling Point (˚C) 2977
Specific Heat (J/kg.K) 451-955
Thermal Expansion (10-6
/K) 4.5-10.9
Thermal Conductivity (W/m.K) 12-38.5
Synthesis of alumina has been carried out by a wide variety of methods,
including reactive sputtering, evaporation, anodization, sol-gel etc. To prepare alumina
via sol-gel method aluminium alkoxides are the best choice because they are less
reactive than the other precursors and their hydrolysis is easier to control (Yoldas,
Univers
ity of
Mala
ya

53
1975). Aluminium alkoxides are solid or liquid compounds of covalent character. They
are readily soluble in hydrocarbons, but sparingly soluble in alcohols. Hydrolysis with
water occurs readily, giving aluminum hydroxide and the corresponding alcohol.
Industrially, only the isopropoxide (isopropylate) and sec-butoxide (sec-butylate) are
important (Kureti & Weisweiler, 2002; Vinogradov et al., 2010). Aluminium
isopropoxide (AIP) is the chemical compound usually described with the formula Al(O-
i-Pr)3, where i-Pr is the isopropyl group (CH(CH3)2) (Lepot et al., 2008; Vinogradov et
al., 2013). The AIP, with molar mass of 204.25 g/mol and density of 1.035 g/cm³, was
used to synthesize the alumina in this project (Figure 3-7).
Figure 3-7: The structural formula of AIP
3.3.4.1 Preparation of Palmitic Acid/Aluminium Oxide NE/MEPCMs
PA was dissolved in preheated distilled water at 80℃ on a magnetic stirrer at
1000 rpm and SDS was added to obtain a clear emulsion. The oil/water emulsion was
stirred continuously for 2 hr.
4 g AIP was separately dispersed in 40 mL of preheated distilled water at 75℃
and at 750 rpm on a magnetic stirrer. Afterwards, ammonia solution was added to obtain
the desired pH value under stirring at 85℃. Different pH values were examined in
preparing the precursor solution. Based on preliminary experiments which were done,
Univers
ity of
Mala
ya

54
the pH value was adjusted to 10.5 to obtain properly produced materials. The sol was
stirred for an additional 10 min to complete the hydrolysis and release the formed
alcohol. Subsequently, 10 ml of the AIP/water homogenous sol was added dropwise to
the oil/water emulsion throughout 3 hr at 80℃ and 500 rpm. Finally, white precipitates
were collected and washed several times with distilled water and ethanol. The white
powder was dried at 55℃ for 24 hr. Four samples were synthesized according to the
specifications listed in Table 3-8.
Table 3-8: The compositions of the O/W emulsion and the solution of the AIP
Sample
code
PA/AIP weight
ratio (wt/wt)
PCM solution Solution of AIP
PA(g) SDS(g) Distilled
water(ml) AIP(g)
Distilled
water(ml)
S1 50/50 1 0.4 300 1 10
S2 60/40 1.5 0.6 450 1 10
S3 70/30 2.3 0.9 600 1 10
S4 80/20 4 1.6 750 1 10
3.3.5 Core Material-Shell Material Detach
The wall materials were recovered from the produced encapsulated PCMs for
further evaluations and analyses by extraction of PCM core material with toluene. The
dried, encapsulated material was treated briefly with toluene to dissolve any uncoated or
partially coated particles. The washed and dried capsules were extracted with toluene
for at least 3 h. Forty milliliters of toluene was used for each gram of NE/MEPCM
capsules. This treatment completely extracted and dissolved fatty acids, leaving not
dissolved wall material. After separation by filtration and further washing with toluene,
the wall material was dried and weighed. As a check on completeness of extraction, the
Univers
ity of
Mala
ya

55
weight of the fatty acid extracted was determined after evaporation of the toluene
washing and filtrate.
3.3.6 Synthesis Process of NE/MEPCMs
The NE/MEPCMs were synthesized via polycondensation using a sol-gel route.
According to the method described in 3.3.1, in the first step, the oily fatty acid was
dispersed in an aqueous solution containing SDS as the surfactant. A typical O/W
emulsion was obtained. In this case, the hydrophobic segments of the SDS were
intermittently collocated with the hydrophilic segments of the oil molecules, and water
molecules attached to the hydrophilic segments of the oil molecules. Thus, the
hydrophobic SDS segments covered the surface of the fatty acid droplets. After
formation of the oil micelles, absolute ethanol was added as an assistant emulsifier,
which decreased the hydrolysis and condensation rate of the precursors in a subsequent
step for optimizing NE/MEPCMs formation. A transparent solution of metal alkoxide
and absolute ethanol was formed and used to modify the alkoxide. Ammonium
hydroxide (which contained water molecules) was added as a catalyst to initiate the
hydrolysis reaction, and a transparent sol formed. In the final phase, a transparent sol of
metal oxide was added dropwise to the O/W emulsion, and the metal oxide precursors
were attracted to the surface of the fatty acid micelles via the hydrogen bonding
interaction between the metal oxide precursors and hydrophilic sections of the SDS.
Polycondensation of the M–OH bonds then occurred in the presence of water molecules
under alkaline conditions, and a metal hydroxide gel was formed around the SA micelle.
Polycondensation of the metal hydroxide resulted in the fabrication of compact metal
oxide shells over the surface of the SA droplets. Figure 3-8 is a schematic of the entire
NE/MEPCMs formation process generally for the prepared materials.
Univers
ity of
Mala
ya

56
Univers
ity of
Mala
ya

57
Figure 3-8: Schematic of the encapsulation of metal oxide shell with the PCM cores
3.4 Properties Characterization Methods
When using encapsulated PCMs for designing a TES system it is important to
ensure that the encapsulation or containment of PCM meets some requirements
including: thermal and structural stability, suitable thermo-physical properties such as
appropriate melting temperature, high latent heat of fusion, provide sufficient surface
and high thermal conductivity for heat transfer, and high encapsulation efficiency
(Yinping & Yi, 1999). There are a lot of analytical techniques and standard instruments
for evaluating the properties of NE/MEPCMs. In this project after preparing the
NE/MEPCMs properly through the above mentioned procedures the objective
Univers
ity of
Mala
ya

58
characterizations of the prepared materials, which are all in powder form, were
accomplished by using a series of modern instruments for materials analysis. The
characterization instruments which were utilized in this project are noted in Table 3-9.
Table 3-9: The instruments utilized for the characterization of the prepared
NE/MEPCMs
Instruments Name Abbreviation Instrument Details Measured Features
Fourier Transmittance
Infrared Spectra FT-IR
PERKIN ELMER SYSTEM
2000 Chemical Structure
X-Ray Diffraction And
Scattering XRD
EMPYREAN-
PANALYTICAL
System Physical
Structures
Energy Dispersive X-
ray Spectrometry EDS
CARL ZEISS-AURIGA 60
and
FEI QUANTA 200F
Surface Elemental
Composition
(Field Emission)
Scanning Electron
Microscope
FESEM and
SEM
CARL ZEISS-AURIGA 60
and
FEI QUANTA 200F
Surface Morphology
Transmission Electron
Microscopy
TEM
CARL ZEISS-LIBRA120 Inner Morphology
Differential Scanning
Calorimetry DSC METTLER TOLEDO 820C Thermal Features
Thermal Gravimetry TGA/DTG METTLER TOLEDO SDTA
851 Thermal Stability
Thermal Conductivity KD2-PRO DECAGON DEVICES
Thermal Features LFA NETZSCH LFA 447
Thermal Cycling - IN HOUSE Reliability
After drying the prepared materials the morphology was observed to ensure a
core-shell structure was obtained. The morphology characteristics and the elemental
analysis of the prepared materials were observed and analyzed by a high-resolution
Scanning Electron Microscope, Transmission Electron Microscope and Energy
Dispersive X-ray Spectrometry. The chemical structure and the crystallography of the
capsules were analyzed by a Fourier Transformation Infrared spectrometer and an X-ray
Univers
ity of
Mala
ya

59
Diffractometer. Followed by the chemical and physical characterization of the material,
the thermo-physical properties of the capsules-which are the main objective properties
of the PCMs-were investigated by the Differential Scanning Calorimeter and
Thermogravimetric Analyzer. Ultimately, a thermal cycling test was designed to study
the thermal reliability of the prepared NE/MEPCM capsules. The characterization
methods are introduced below, concisely.
3.4.1 Fourier-Transform Infrared Spectroscopy (FTIR)
Chemical interaction between the core PCM and the supporting shell material
were studied by observing the changes in Fourier Transform Infrared spectrum of the
materials. FTIR spectroscopy is closely related to dispersive spectroscopy, but the
actual technique used is different. In dispersive spectroscopy, a monochromatic beam of
light is shone at a sample in different wavelengths and the absorption of light is
measured each time. In FTIR spectroscopy, a beam of light is passed through a series of
mirrors that cause the beam’s individual wavelengths to hit each other in a way that
allows a sample to absorb some wavelengths, while others are blocked. When IR
radiation is passed through a sample molecule bonds absorb energy and vibrate at a
certain frequency. When molecules undergo transitions between quantum states
corresponding to two different internal energies, spectra emission or absorption will
take place. The energy difference ΔE, is related to the frequency of radiation emitted or
absorbed by the quantum state as given by Bohr Equation:
ΔE=hv (3-4)
where h is Planck`s constant, h=6.6262×10⁻³⁴
Js, and v is the frequency. Infrared
frequencies in the wavelength range of 1~50μm (10000cm-1
~200cm-1
) are associated
with molecule group vibration and vibration-rotation spectra. Each bond present in a
molecule group is capable of performing a number of different modes of vibration, such
as stretching and bending, scissoring, rocking, wagging and twisting. A transmittance or
Univers
ity of
Mala
ya

60
absorbance is measured and a computer infers the transmission and absorption rate of
each wavelength within the beam. The resulting spectrum represents the molecular
absorption and transmission, creating a molecular fingerprint of the sample. This
fingerprint of the sample with absorption peaks corresponds to the frequencies of
vibrations between the bonds of the atoms making up the material. Because each
different material is a unique combination of atoms, no two compounds produce the
exact same infrared spectrum. Therefore, infrared spectroscopy can result in a positive
identification (qualitative analysis) of every different kind of material. In addition, the
size of the peaks in the spectrum is a direct indication of the amount of material present
(Pasquini, 2003).
The FT-IR transmittance of the prepared and the precursor materials were
obtained by using the instrument of Perkin Elmer Spectrum 100 in a wave number range
of 400~4000 cm-1
at a resolution of 4 cm-1
at room temperature.
3.4.2 X-Ray Diffractometry (XRD)
Typically X-ray is an electromagnetic radiation having a wave length of around
1Å (in between ultraviolet and gamma-rays) which is of the same order as the distance
between the atoms in the materials. Therefore; X-rays are an ideal probe capable of
investigating the crystalline structures of the materials. XRD can also be used to show
the crystallization properties of the encapsulated PCMs (Fan et al., 2004; Fang et al.,
2010b; Fang et al., 2008) which is very important because of the ability to prove
whether PCMs have been embedded within the layer of the shell materials or not
especially in the synthesis process performed in this project. The interaction of X-ray
beam with a crystal results in a diffraction pattern that identifies the material and
corresponding phase. The information obtained from the diffraction pattern includes the
material properties such as crystalline phase composition, stress, strain and growth
orientation, etc. The phenomenon behind the generation of diffraction pattern can be
Univers
ity of
Mala
ya

61
described as below. When an X-ray beam having wave length λ strikes the solid crystal
with an angle θ, the resulted scattered radiation can be determined by Bragg’s law (Will,
2006):
nλ = 2dsinθ (3-5)
Where n is called the diffraction order and d denotes the distance between the
parallel planes inside the crystallites. It is remarkable that the set of d-planes is unique
for each and every material. In this work the dried samples were put into a holder in a
dense and plate state. The X-ray diffraction data were taken by the EMPYREAN-
PANALYTICAL XRD system diffractometer equipped with Cu, Kα radiation (Kα
=1.54178 Å) having a generator voltage of 40 kV and a current of 10 mA. The XRD
patterns were obtained in the range of 2θ=5~70º and a scanning speed of 0.02º/second.
3.4.3 Scanning Electron Microscopy (SEM)
Scanning electron microscopy is the most widely used versatile instrument to
evaluate the morphological characteristics of NE/MEPCMs such as shape, particle size
and outer structure. SEM belongs to the family of microscopes, but it uses a beam of
electrons in lieu of light in order to make an image. The beam of electrons passes
through electromagnetic lenses and strikes the surface of the sample. The bombardment
of electrons does not cause any damage to the samples but generate signals. These
signals include secondary and backscatter electrons (that produce SEM images) and
photons (characteristic X-rays that are used for elemental analysis-EDS). SEMs always
have at least one detector (usually a secondary electron detector), and most have
additional detectors. The detector collects the secondary/backscattered electrons ejected
from the sample and converts them into a signal. Finally this signal is displayed on a
screen. SEM has the ability to capture images from visible to a few nanometers
(Goldstein et al., 2012; Zhou et al., 2007). In SEM the nature of the sample determines
the necessary preparation of the sample. Unfortunately, some materials such as some
Univers
ity of
Mala
ya

62
polymers present specific problems making them inappropriate. Therefore proper
sample preparation is necessary. These kinds of samples are coated with a thin layer of
conducting material, commonly carbon, gold, or some other metal or alloy. While metal
coatings are the most effective materials for high resolution electron imaging, the gold
coating was done for just some prepared samples in this project according to their
unsuitability nature for SEM imagining. To study the morphology and surface
appearance of microcapsules in this project, a high-resolution FEI Quanta 200F SEM
and a CARL ZEISS-AURIGA 60 FESEM (Field Emission Scanning Electron
Microscopy) were used at room temperature.
The size of PCM capsules affects the heat transfer characteristics of the PCM.
The prepared capsules size analysis was also performed by SEM image observation and
image analyzer software (DIGIMIZER software-Version 4.1.1.0). The mean diameter
and standard deviation were determined from the data set of measurements for each
specimen. Histograms were plotted by the statistical analysis of the data in MINITAB-
16.2.2 software.
3.4.4 Transmission Electron Microscopy (TEM)
The SEM has limitations in the visualization of the internal structure of
nano/microcapsules; therefore Transmission Electron Microscopy (TEM) as an imaging
technique was also used. TEM is also an imaging technique using a beam of electrons
transmitting through a specimen, and then an image is formed. The maximal penetration
thickness of an electron beam for TEM test is about 100 to 500nm depends on the
nature of the sample material.
This core-shell structure of nano/microcapsules were observed using TEM
(CARL ZEISS-LIBRA120) with an accelerating voltage of 120kV and a vacuum ratio
Univers
ity of
Mala
ya

63
of 10-7
Torr. The samples used for TEM were prepared by drying a drop of aqueous
suspension placed on a carbon coated copper grid.
3.4.5 Differential Scanning Calorimetry (DSC)
Differential Scanning Calorimetry (DSC) is one of the most widely used
indicators reflecting the heat storage properties such as melting temperature and the
latent heat capacity of the NE/MEPCMs. Rudd (Rudd, 1993) indicates that DSC can
adequately predict the thermal performance of PCMs by carrying out large scale and
small scale tests of PCMs. He recommended DSC test as standard for the measurements
of PCM thermal performance.
In DSC analysis, a weighed small amount of sample is placed in a small
aluminium crucible to put in an insulated chamber. The sample and a reference (which
is usually an empty small crucible) are maintained at nearly the same temperature
throughout the measurement process. When the sample and the reference are heated at a
constant heating rate a physical transformation such as phase transitions occurs in the
sample but not in the empty reference pan, therefore the heat flow required to keep the
temperature constant between the sample and the reference is measured as a function of
the temperature (Figure 3-9).
Univers
ity of
Mala
ya

64
Figure 3-9: Differential scanning calorimeter (Memon, 2014)
The differential heat flows are plotted against temperature, which is called the
DSC curve. The heat flow has a unit of energy per unit time per unit mass, usually in
units of Wg−1
. Figure 3-10 demonstrates typical DSC curves of the melting and
crystallization transitions. Changes in the sample are associated with absorption or
evolution of heat cause a change in the differential heat flow which is then recorded as a
peak. An endothermal or exothermal peak in the DSC thermogram denotes the melting
or crystallization temperature of the tested material. The characteristic temperatures
from DSC measurements are: initial peak temperature (Ti), the extrapolated peak onset
temperature (Tei), the extrapolated end temperature (Tef), the peak temperature (Tp) and
the end peak temperature (Tf) (Hatakeyama & Quinn, 1999). The extrapolated peak
onset temperature is defined as the intersection between the tangent to the maximum
rising slope of the peak and the extrapolated sample baseline (He et al., 2004). It is
noteworthy that the user can choose different types of baseline such as linear, sigmoidal
horizontal, sigmoidal tangent and extrapolated to calculate the thermal energy stored in
the unit weight of PCM. Enthalpy or the thermal heat stored in the capsules which is the
Univers
ity of
Mala
ya

65
latent heat of the core PCM of phase change is also usually tested by DSC. The enthalpy
represents the thermal capacity of a material in which the higher the enthalpy of a
material, the better the thermal storage capacity and thermal regulating property that can
be provide. The thermal heat stored in the unit weight of PCM is derived by calculating
the area under the peak by the software automatically (Rady, 2009; Song et al., 2008).
Figure 3-10: Typical DSC curve
The sample mass and the rate of scanning through a temperature range are
important in the DSC analysis. The scanning rate commonly varies from 0.1 to
40℃/min, above which the effects of non-linearity becomes dominant and the
calibration parameters are no longer applicable. The processes of material change, such
as melting or solidifying, require time for heat transfer and atom or molecule diffusion.
Increase of scanning rate will result in an increase of temperature gradient in the sample
and the instrument, thus making it difficult for the sample to reach equilibrium therefore
better resolution and more accurate measurement can be obtained at lower temperature
rates (Verdonck et al., 1999). The mass of the sample should also be considered before
choosing a rate. Low-mass samples (<10-30 mg) are also preferred because a low-mass
sample can quickly reach temperature equilibrium throughout its volume but a large-
mass sample will have an undesirable internal temperature gradient and this will affect
Univers
ity of
Mala
ya

66
the accuracy of the curve. However; small samples can have faster rates, while heavier
samples should have a slower rate in order to allow for uniformity of temperature
distribution in the sample and improved resolution (Bershteĭn & Egorov, 1994).
In the present study, the thermal properties for each prepared sample of
NE/MEPCMs, including the core PCMs and shell material, were measured using a
METTLER TOLEDO 820C (Error ± 0.25-1℃) at a heating rate of 5℃ /min in a purified
nitrogen atmosphere. The nitrogen atmosphere is used to remove any corrosive gases
from the sample and to minimize the risk of condensation inside the DSC instrument
when the temperature gets below the air dew point. The samples with 5-10 mg in weight
were put in an aluminium vessel; then sample and reference vessels were hermetically
sealed and were heated from 30 to 100℃. The temperature was maintained at 100℃ for
5 minutes and then cooled down to 30℃ to finish one measurement cycle.
Super-cooling is one of the physical properties of phase change materials. It
refers to the phenomenon that a material crystallizes at a temperature below its melting
point. Since super-cooling leads to reduced crystallization temperature; the latent heat
will be released at a lower temperature or in a wider temperature range. This limits the
application of PCM capsules in thermal regulation functions. The super-cooling
phenomenon should be understood and controlled effectively.
The degree of super-cooling (∆T), can be derived from the DSC outcomes by
using the following equation (Cao & Yang, 2014):
∆T = Tm − Tc (3-6)
Where Tm and Tc are the melting and crystallization peak temperatures,
respectively.
Univers
ity of
Mala
ya
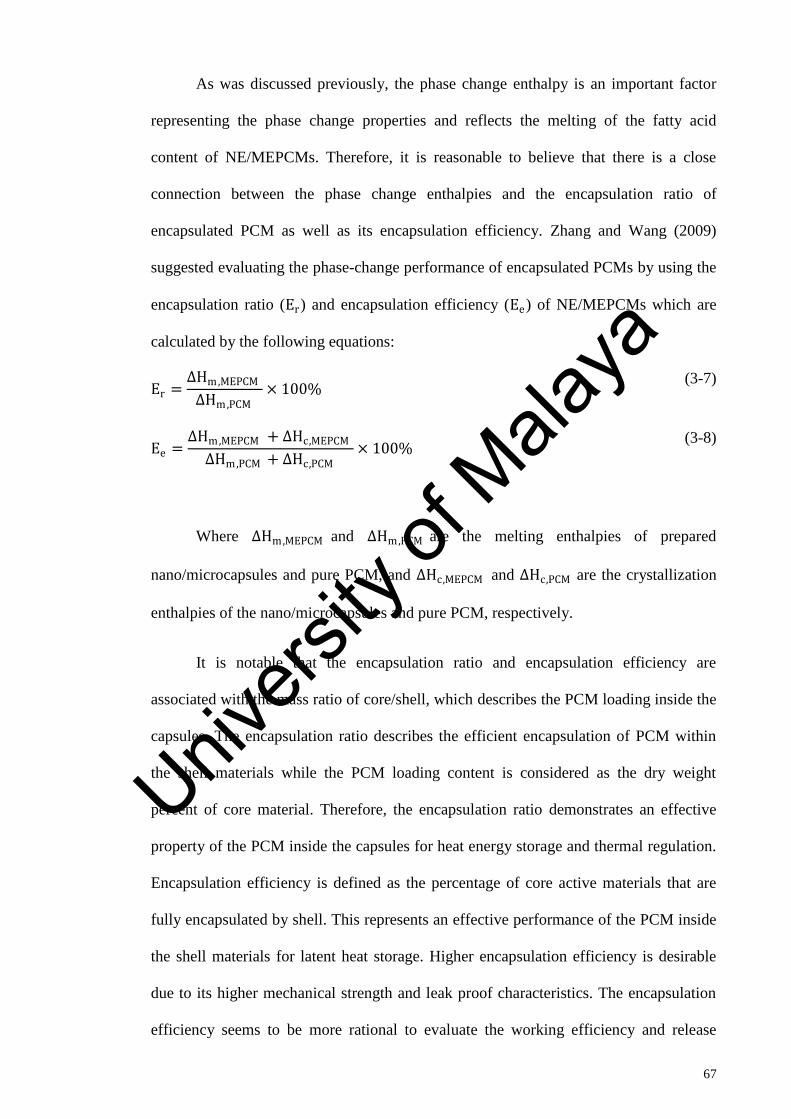
67
As was discussed previously, the phase change enthalpy is an important factor
representing the phase change properties and reflects the melting of the fatty acid
content of NE/MEPCMs. Therefore, it is reasonable to believe that there is a close
connection between the phase change enthalpies and the encapsulation ratio of
encapsulated PCM as well as its encapsulation efficiency. Zhang and Wang (2009)
suggested evaluating the phase-change performance of encapsulated PCMs by using the
encapsulation ratio (Er) and encapsulation efficiency (Ee) of NE/MEPCMs which are
calculated by the following equations:
Er =∆Hm,MEPCM
∆Hm,PCM× 100%
(3-7)
Ee =∆Hm,MEPCM + ∆Hc,MEPCM
∆Hm,PCM + ∆Hc,PCM× 100%
(3-8)
Where ∆Hm,MEPCM and ∆Hm,PCM are the melting enthalpies of prepared
nano/microcapsules and pure PCM, and ∆Hc,MEPCM and ∆Hc,PCM are the crystallization
enthalpies of the nano/microcapsules and pure PCM, respectively.
It is notable that the encapsulation ratio and encapsulation efficiency are
associated with the mass ratio of core/shell, which describes the PCM loading inside the
capsules. The encapsulation ratio describes the efficient encapsulation of PCM within
the shell materials while the PCM loading content is considered as the dry weight
percent of core material. Therefore, the encapsulation ratio demonstrates an effective
property of the PCM inside the capsules for heat energy storage and thermal regulation.
Encapsulation efficiency is defined as the percentage of core active materials that are
fully encapsulated by shell. This represents an effective performance of the PCM inside
the shell materials for latent heat storage. Higher encapsulation efficiency is desirable
due to its higher mechanical strength and leak proof characteristics. The encapsulation
efficiency seems to be more rational to evaluate the working efficiency and release
Univers
ity of
Mala
ya

68
capabilities of encapsulated PCM than the encapsulation ratio, because it is derived
from the phase-change enthalpies involved in both crystallization and melting processes
(Zhang et al., 2004b).
Moreover, the thermal storage capability (φ) of the prepared encapsulated PCMs
also were evaluated by using subsequent equation:
φ =Ee
Er× 100%
(3-9)
Where Ee and Er are the encapsulation ratio and encapsulation efficiency of
NE/MEPCMs, respectively, that are calculated from equations (3-7) and (3-8). It is
important to mention that the high thermal storage capabilities of the NE/MEPCMs
indicated that nearly all of the capsules stored latent heat effectively through the phase
change.
There are not many studies on the estimation and calculation of the shell
thickness of the NE/MEPCMs. However; as the structure of the capsules could be
thought to be a core/shell type structure and the encapsulation ratio presents the
percentage amount of the core PCM content in the shell material, the shell thickness of
the NE/MEPCMs can be calculated from (Tseng et al., 2005):
mPCM
mPCM + mShell= Er =
4 3 π. RPCM3 . ρPCM
4 3 π. RPCM .3 ρPCM + (4 3)π R3 − RPCM
3 . ρShell
=1
1 + (R RPCM) 3− 1 (ρ
Shellρ
PCM)
RPCM = R (1
Er− 1) ×
ρPCM
ρShell+ 1
3
(3-10)
RShell = R − RPCM
Univers
ity of
Mala
ya
69
Equation (3-10) shows that the weight ratio of core PCM to the whole capsule is
related to the sizes, where capsule radius R (that is obtained from SEM/TEM analysis)
is the sum of core PCM radius (RPCM) and the shell thickness (RShell ).
3.4.6 Thermal Gravimetry and Derivative Thermogravimetric (TGA and DTG)
Thermogravimetric analysis (TGA) is a powerful technique for characterization
of decomposition or weight loss properties and thermal stability of materials under
different conditions, and to examine the kinetics of physical-chemical processes
occurring in the materials. In the thermal gravimetry analysis the change in the sample
mass is analyzed while the sample is subjected to a temperature programme.
In the TGA analysis, a sensitive balance is used to measure the changing in
weight of a sample as a function of temperature. Typical applications in material
characterization of thermal gravimetry (TG) include the assessment of thermal
degradation properties and thermal stability, decomposition temperature, material
composition, oxidative degradation characteristics, quantitative weight losses, chemistry
reaction kinetics and purity determination etc. Derivative thermogravimetric (DTG)
analyses can be calculated by the differential of change in sample weight over time.
DTG data denotes the rate of change in weight (dm/dt) of a sample which is heated in a
controlled manner.
In the present study, the samples were heated from the ambient temperature (20-
30℃) to 600℃ in nitrogen atmosphere with a gas flow rate of 50mL/min at the heating
rate of 10℃/min. The weight of different samples was 8~15 mg in all cases. During the
heating period, both the weight loss and temperature data were recorded. METTLER
TOLEDO-SDTA 851 equipment was used in the test with the testing range of 25 to
1300℃.
Univers
ity of
Mala
ya

70
3.4.7 Thermal Conductivity
It is well-known that the low thermal conductivity of PCM increases its thermal
response time for storage and release of latent heat. Thus, enhancing the thermal
conductivity of PCMs is a major aim in designing a nano/microencapsulated material
which attracts a vast attention. Measuring these thermo-physical properties was a
challenge for a long time since different methods and techniques presented different
results. Thus, the method which is going to be used is significant to lower the
measurement error and uncertainty as much as possible. In this study, two thermal
conductivity measurement methods were employed including Transient hot-wire
techniques and laser flash method.
Generally, Fourier’s law for conduction heat transfer can be utilized to measure
thermal conductivity of a material. A temperature difference can cause heat transfer
through materials which is known as conductive heat transfer. Thermal conductivity is
the property of the material which relates heat flux to temperature gradient and can
differ from one material to another. It can be calculated from the following equation:
k = (q A ) (∆T L ) (3-11)
Where, k is thermal conductivity, q is magnitude of heat transmission, ∆T is
temperature difference, A is cross sectional area and L is the length (Ehsan Bitaraf et al.,
2012). To simplify calculations, a one-dimensional temperature field and steady state
flow are considered.
3.4.7.1 Transient Hot-Wire Method (THW)
This is the most regular and the oldest method of measuring thermal
conductivity. This technique has been well developed and widely used for
measurements of the thermal conductivity of solids, and in some cases, the thermal
diffusivity of fluids with a high degree of accuracy. Comparing other methods, the most
Univers
ity of
Mala
ya
71
attractive advantage of the technique is its very fast measurement with high accuracy
and the simplicity of the conceptual design of the apparatus of it as well. The transient
hot-wire technique was first introduced by (Carslaw & Jaeger, 1986). It has been used to
measure thermal conductivity of powders at the beginning. However, it has been
improved by many researchers. The THW method is based upon using a long, thin
platinum wire as a dual line heat source and temperature sensor. This is possible due to
the relatively unique relationship between the temperature and thermal characteristics of
platinum. The platinum filament is fully placed within the material for which the
thermal conductivity is to be determined, and a step increase in the electrical power
supplied to the wire is introduced. This allows the platinum wire to heat up due to
resistive heating. The excess heat from the hot filament is rejected to the surrounding
material through conduction. Simultaneously, while this heating occurs, the relative
change in resistivity of the wire is being measured through a two or four wire resistive
measurement system. The surface temperature of the hot wire and therefore the
temperature of the immediate surrounding can be calculated based upon this approach.
The measured value of total input power, and power lost to the surrounding, combined
with the overall change in resistivity of the platinum wire due to electrical heating are
collected; these values, in conjunction with the measured experimental time and
dimensional parameters of the hot wire setup, can be used to back calculate the thermal
conductivity of the material of interest.
In this study a KD2-Pro system was used to measure the thermal conductivity of
some NE/MEPCMs. The KD2 Pro resolves to 0.001℃ in temperature by utilizing
special algorithms to analyze measurements made during a heating and a cooling
interval. Algorithms also separate out the effects of the heat pulse from ambient
temperature changes. The prepared samples were placed in a proper container in a
Univers
ity of
Mala
ya

72
circulating bath while the temperature was controlled and a dual needle apparatus was
used to measure the thermal conductivity of the samples.
3.4.7.2 Laser Flash Technique (LFA)
For the precise and reliable measurement of thermophysical properties like the
thermal diffusivity and thermal conductivity, the Laser Flash technique (LFA) has
proven itself as a fast, versatile and precise absolute method. The Laser Flash technique
is based on the measurement of the thermal transient of the rear surface of the sample
when a pulsed laser illuminates the front and it avoids interferences between the thermal
sensor and the heat source. The physical model of the Laser Flash measurement
supposes to have a single pulsed heat source (delta like), for example a laser shot, on the
sample front surface. The study of the thermal transient of the rear surface provides the
desired thermal information. The temperature of the rear face is measured with an
infrared detector and it can be expressed mathematically as a function of several
variables that are grouped into dimensionless parameters. These variables include
sample geometry, thermal diffusivity and heat loss from the sample (Mirmohammadi &
Behi, 2012).
The laser flash technique (Netzsch LFA 447 NanoFlash) was used to measure the
thermal diffusivity of samples at 35 and 80℃. The thermal conductivity may also be
derived from the thermal diffusivity when the specific heat and the sample bulk density
are known as shown in equation (3-12):
k = α. ρ. Cp (3-12)
Where k is the thermal conductivity (W/ (m.K)), α is thermal diffusivity (m2/s), ρ
is density (kg/m³) and Cp is specific heat capacity (J/(kg.K)).
Univers
ity of
Mala
ya

73
3.4.8 Thermal Cycler
The most common application for PCM-based energy storage unit is solar
applications. A solar thermal system with latent heat storage undergoes at least one
melt/solidify thermal cycle per day. This can be considered as a normal cycle. Therefore
an important parameter to consider while designing the encapsulated PCM based
thermal system is the thermal, chemical and physical stability of the NE/MEPCMs after
a number of repeated thermal cycles. A comprehensive knowledge of thermal reliability
of the encapsulated PCMs is essential to ensure the long-term performance of the
encapsulated PCMs as TES materials and its economic feasibility. Thermal cycling tests
conducted under controlled conditions in the laboratory are called accelerated thermal
cycling tests. A small amount of material is withdrawn after each prescribed number of
thermal cycles for obtaining the thermo-physical properties of PCMs. A PCM is
thermally stable for latent heat storage applications if it undergoes negligible changes in
the melting point and latent heat of fusion after repeated operative thermal cycles.
To determine the thermal stability and reliability of the NE/MEPCMs during
melting and solidifying, a thermal cycling test was done using a thermal cycling system
of in-house design (university of Malaya). The thermal cycling system was designed to
operate between 30 and 80℃. The schematic and picture of the thermal cycling system
are shown in Figure 3-11. The tests were done using fan and heater as cooling and
heating parts, digital Indicating Controller (Brian Child-P41) for controlling of melting
and solidifying process, communication converter (Autonics-SCM-US48I) to transfer
data to PC and controller program, relay (ANV) to control heater and power supplies for
fans and heater. The cartridge heater was located behind the PCM container and a
thermocouple was placed inside the PCM to check the temperature and transfer data to
the digital Indicating Controller. First, the specified amount of PCMs was placed inside
the container and the thermocouple was carefully placed inside the PCM to measure
Univers
ity of
Mala
ya

74
temperature and send data to the communication converter. Second, by operating the
program in PC cycling started and melting was done by heating up to 80℃ and then
immediately freezing was started by switching off the heater and starting the fan till
30℃. The temperature variations of NE/MEPCMs were automatically recorded in a PC
with an accuracy of ±0.1℃. The characterization analysis, including SEM, DCS and
FTIR, etc were done before and after the thermal cycling and the outcomes were
compared to investigate the thermal and chemical stability of the materials.
Figure 3-11: Accelerated thermal cycler
Univers
ity of
Mala
ya

75
3.5 Summary
According to the benefits and superiority of sol-gel method, the NE/MEPCMs
incorporated with metal oxides as the shell materials were prepared through the sol-gel
method. Furthermore, experimental parameters have been determined according to the
previous experience and the preliminary studies.
The prepared NE/MEPCMs were characterized by a series of modern analysis
techniques and instruments. The chemical and the crystal structure of the NE/MEPCMs
were analyzed using FTIR and XRD, respectively. SEM was used to observe the surface
morphology and the diameter size of the NE/MEPCMs. EDS was employed for surface
elemental analysis. The core/shell structure of the capsules was observed using a TEM.
DSC was used to measure the thermal capacity and properties, super-cooling and
melting enthalpy of the NE/MEPCMs. The thermal stability of capsules was determined
using TGA. The thermal conductivity of the prepared NE/MEPCMs was measured by
two methods (hot wire & laser flash) to investigate the effects of shell materials and
encapsulation on thermal conductivity of the pure PCMs. The thermal cycling test was
introduced to investigate thermal performance of the prepared encapsulated PCMs.
Univers
ity of
Mala
ya

76
CHAPTER 4 RESULTS AND DISCUSSION
RESULTS AND DISCUSSION
4.1 Introduction
In this chapter the chemical and thermo-physical properties of the prepared
NE/MEPCMs are evaluated. The characteristics of the materials were appraised by
some advanced analysis instruments and characterization technologies including FTIR,
XRD, SEM, TEM, DSC, TGA, LFA, and THW. A thermal cycling test were also
designed and applied to investigate the thermal reliability of the prepared NE/MEPCMs
in a large number of heating-cooling processes.
4.2 Palmitic Acid/Silica Nanocapsules
In this research the sol-gel method was used to prepare the encapsulated palmitic
acid as a phase change material in silica shell. The TEOS which is one of the best
precursors was used to synthesize the silica shell. The influence of the pH on the
properties of the materials as one of the most important parameters in sol-gel process is
studied by changing the pH value during the preparation process for three different
samples. The characteristics and the capability of prepared capsules were investigated
by several characterization methods and the results will be described in the following
sections.
4.2.1 FTIR Spectra of PA/SiO2 NEPCMs
The FTIR spectra of all three samples were essentially similar. Figure 4-1 shows
the FTIR results for palmitic acid, SiO2 and PA/SiO2 nanocapsules of sample SI3.
Figure 4-1a represents the FTIR spectra of SiO2. The peaks at 1044.5, 788.39 and 450.5
cm-1
signify the bending vibration of the Si–O functional group and the peak at 940.37
cm-1
is assigned to the Si–OH functional group. The absorption bands at 2600-3400 cm-
1 and 1400-1700 cm
-1 characterize the stretching and bending vibrations of the –OH
Univers
ity of
Mala
ya

77
functional group of H2O. Figure 4-1b displays the spectrum of the pure palmitic acid.
The peaks at 2915.02 cm-1
and 2849 cm-1
include the symmetrical stretching vibration
peaks of –CH3 and –CH2 in PA. The absorption peak at 1691 cm-1
is assigned to the
C=O stretching vibration. The peak at 1293 cm-1
refers to the in-plane bending vibration
of the –OH group of palmitic acid, the peak at 937.99 cm-1
corresponds to the out-of-
plane bending vibration of the –OH functional group and the peak at 720.10 cm-1
shows
the in-plane swinging vibration of the –OH functional group . Figure 4-1c indicates that
the absorption peaks of the SiO2 at 1044.5, 788.39 and 450.5 cm-1
can also be found in
the nanocapsules spectra. Because the SiO2 can only be formed on the interface of
palmitic acid O/W emulsion, the FTIR results imply that the SiO2 shell was formed on
the surface of the palmitic acid droplet. The absorption peaks from the palmitic acid at
2915.02, 2849, 1691, 1293, 937.99 and 720.10 cm-1
are not changed within the
nanocapsule spectra. These results show that there is absolutely no chemical interaction
relating to the molecules of palmitic acid and SiO2. The palmitic acid was encapsulated
easily inside the shells of SiO2 through the condensation and polymerization processes
of the obtained SiO2 precursors from the hydrolysis of the tetraethoxysilane.
Figure 4-1: FTIR spectra of the (a) SiO2, (b) PA, (c) PA/SiO2 nanocapsules
Univers
ity of
Mala
ya

78
4.2.2 XRD Patterns of PA/SiO2 NEPCMs
Figure 4-2 shows the XRD patterns of the Palmitic acid, SiO2 and nanocapsules
of PA/SiO2. As shown in Figure 4-2a, SiO2 has a smooth peak at about 20°-25°. This
indicates that the SiO2 is non-crystalline with amorphous structure. Figure 4-2b implies
that the XRD peaks at 21.8° and 24.3° are caused by palmitic acid due to its normal
crystallization and Figure 4-2c shows that the XRD peaks of the palmitic acid in
nanocapsules of PA/SiO2 are also stated on the basis of the SiO2 smooth peak. This
indicates that the SiO2 cannot be shaped inside the palmitic droplet; hence the palmitic
acid was encapsulated within the SiO2 shells (Zhang et al., 2004a).
Figure 4-2: XRD pattern of (a) SiO2, (b) PA, (c) PA/SiO2 nanocapsules
4.2.3 Microstructure Analysis of PA/SiO2 NEPCMs
The SEM photographs of three different samples of nanoencapsulated PCMs are
shown in Figure 4-3. Figure 4-4 displays the particle size distributions. The SEM
photographs of all three samples illustrate the spherical structure of nanocapsules and
also their smooth surfaces. The homogeneous and uniform size distributions of
nanocapsules are obvious. A comparison of the particle sizes of these three samples
shows that increasing the pH value causes the diameter size of nanocapsules to be
increased; this is confirmed by Figure 4-4. These graphs display the particle size
distributions in the three different samples. As shown in Figure 4-4a, the mean diameter
Univers
ity of
Mala
ya

79
size of PA/SiO2 nanocapsules which are prepared in an environment with pH at 11 is
183.7 nm. The obtained mean diameter sizes of other samples are mentioned in Table
4-1. From Figure 4-4 and Figure 4-5 it can also be seen that there is a uniform size
distribution for these nanocapsules at adjusted pH at 11 with a narrow size distribution
and a small mean diameter. The ranges of diameter size of these three samples are also
indicated in Table 4-1.
Univers
ity of
Mala
ya

80
Figure 4-3: SEM of the PA/SiO2 nanocapsules: (a) SI1, (b) SI2, (c) SI3
Univers
ity of
Mala
ya
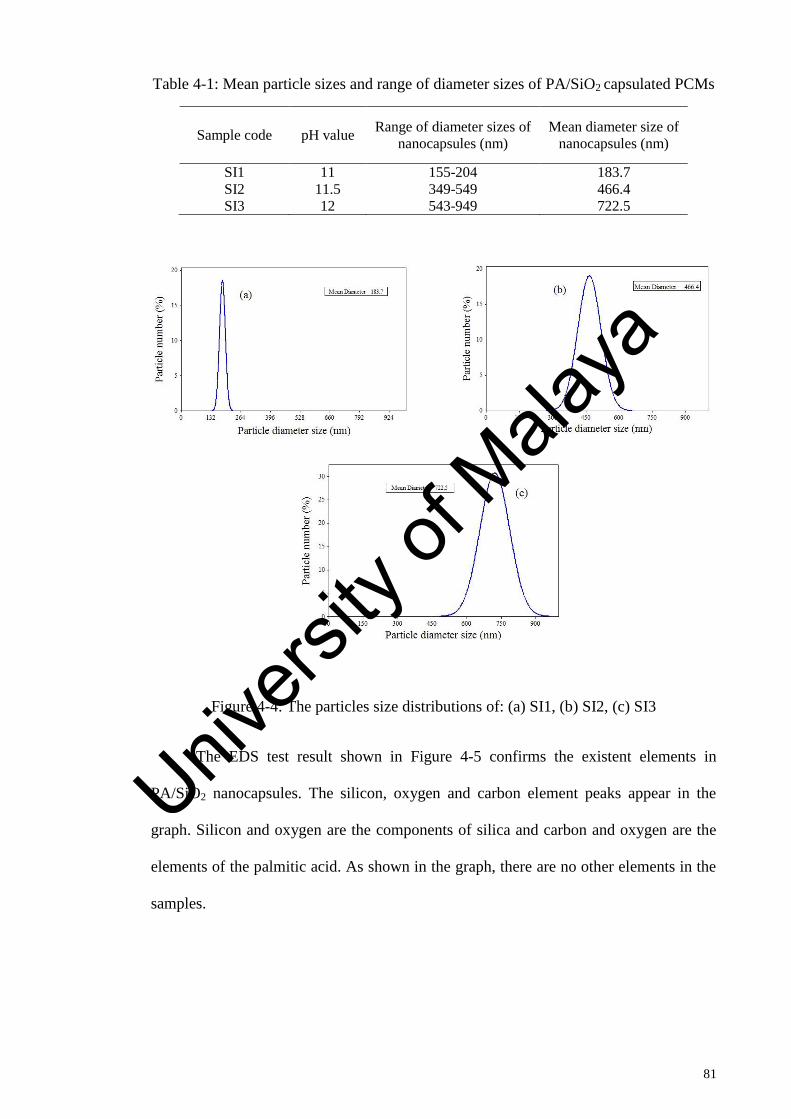
81
Table 4-1: Mean particle sizes and range of diameter sizes of PA/SiO2 capsulated PCMs
Sample code pH value Range of diameter sizes of
nanocapsules (nm)
Mean diameter size of
nanocapsules (nm)
SI1 11 155-204 183.7 SI2 11.5 349-549 466.4 SI3 12 543-949 722.5
Figure 4-4: The particles size distributions of: (a) SI1, (b) SI2, (c) SI3
The EDS test result shown in Figure 4-5 confirms the existent elements in
PA/SiO2 nanocapsules. The silicon, oxygen and carbon element peaks appear in the
graph. Silicon and oxygen are the components of silica and carbon and oxygen are the
elements of the palmitic acid. As shown in the graph, there are no other elements in the
samples.
Univers
ity of
Mala
ya
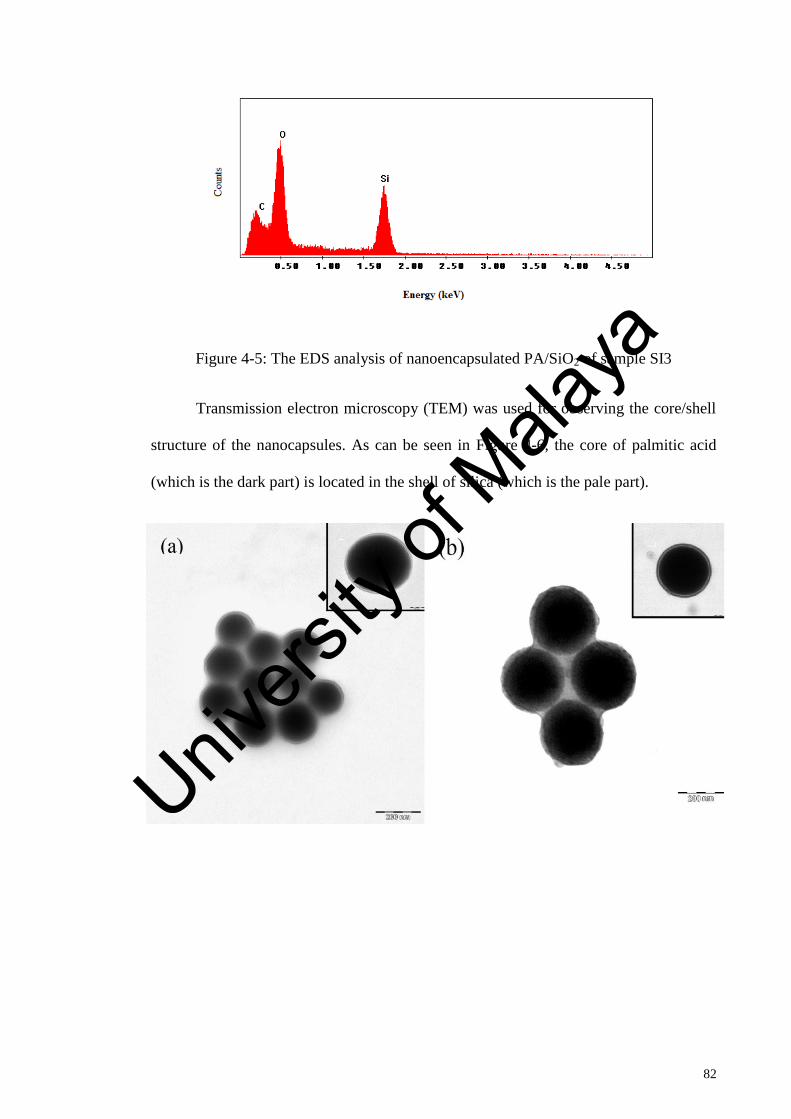
82
Figure 4-5: The EDS analysis of nanoencapsulated PA/SiO2 of sample SI3
Transmission electron microscopy (TEM) was used for observing the core/shell
structure of the nanocapsules. As can be seen in Figure 4-6, the core of palmitic acid
(which is the dark part) is located in the shell of silica (which is the pale part).
Univ
ersity
of M
alaya

83
Figure 4-6: TEM images of nanoencapsulated PA/SiO2 (a) SI1, (b) SI2, (c) SI3
4.2.4 Phase Change Properties of the PA/SiO2 NEPCMs
The DSC curves of melting and solidifying of nanoencapsulated PA/SiO2 in all
three samples and pure PA are presented in Figure 4-7. The thermal properties based on
the curves show that nanocapsules of SI1, SI2 and SI3 samples melt at 61.06, 60.92 and
61.6℃ and freeze at 62.91, 62.83 and 62.74℃, respectively, while pure PA melts at
62.2℃ and solidifies at 62.41℃. The melting and freezing latent heats of SI1, SI2, SI3
and pure PA are noted in Table 4-2.
Table 4-2: The thermal properties of the nanocapsules synthesized under different
conditions
Melting Solidifying
Sample
Tonset
(℃)
Tpeak
(℃)
∆Hm (kJ kg )
Tonset
(℃)
Tpeak
(℃)
∆HC(kJ kg ) Er
(%)
Ee
(%)
φ
(%)
SI1 61.06 64.30 168.165 62.91 60.30 170.23 83.25 82.53 99.13
SI2 60.92 64.63 172.16 62.83 58.90 173.40 85.22 84.28 98.89
SI3 61.60 66.12 180.91 62.74 59.60 181.22 89.55 88.32 98.62
Pure PA 62.20 65.30 202.00 62.41 56.65 208.00 - - -
Univers
ity of
Mala
ya

84
As noted in Table 4-2, nanocapsules in SI3 have higher latent heat value than the
other samples in the melting and solidifying processes. For nanocapsule materials,
absorbing/releasing thermal energy through phase change is only done by the core
material. This indicates that with greater amount of core material, a higher latent heat
storage capacity is achieved. According to this case, because of the larger mean
diameter size of nanocapsules in SI3, the latent heat of melting and solidifying is higher
than those in other samples.
The encapsulation ratio and encapsulation efficiency of nanocapsules in all three
samples were calculated using equations (3-7) and (3-8) and are listed in Table 4-2. The
encapsulation ratio reflects the effective content of fatty acid in the composite so by
increasing the encapsulation ratio, the mechanical strength and leak proof characteristics
of nanocapsules decrease. The great thermal storage capabilities of all three samples
affirm the high thermal storage performance of the PCM core materials.
Univers
ity of
Mala
ya

85
Figure 4-7: DSC curve of (a) melting, (b) solidifying processes of nanocapsules in
samples: SI1, SI2, SI3 and pure PA
As is explained in CHAPTER 2 and CHAPTER 3 the supercooling of PCMs is
one of their drawbacks. Therefore minimizing supercooling is one of the purposes of
synthesizing the NE/MEPCMs. The supecooling of the three samples and pure palmitic
acid are calculated by the DSC outcomes and by using the equation (3-6). The
difference between the melting and solidification temperature of pure PA, SI1, SI2 and
SI3 were 8.65, 4, 5.73, and 6.52℃, respectively which shows that supercooling degree
of the NE/MEPCMs are smaller than pure PA during solidification process. The
decrease of supercooling of capsules of sample SI1 compared to the other samples
indicates that the decrease in the pH value of the shell material synthesis process
according to the decrease in the particle size will positively affect the degree of
supercooling in NEPCMs. This occurs because the contact surface area and the heat
transfer rate of the capsules increase.
The mean shell thickness of the NEPCMs is also calculated by equation (3-10)
by using the mean diameter size of the capsules from the SEM images. The density of
the shell material found by Archimedes method is 2.1 g/cm3. The estimated shell
Univers
ity of
Mala
ya

86
thickness of the samples SI1, SI2 and SI3 are 3.95, 10.30 and 11.05 nm, respectively.
The increment of the pH results in a higher silica shell thickness. The higher pH
increases the hydrolysis and condensation rate, therefore a larger amount of shell
growth in the synthesis period.
4.2.5 Thermal Stability of PA/SiO2 NEPCMs
The TGA and DTG curves show the thermal stability which is one of the most
important factors in thermal properties of PCM encapsulation. Figure 4-8 displays the
TGA and DTG of SiO2/PA nanocapsules. According to Figure 4-8a, pure palmitic acid
and the other three samples degrade in one stage. Pure palmitic acid onset degradation is
around 208℃ and the weight loss of the SI3 is larger than the other two samples, thus
nanocapsules of sample SI3 are encapsulated in greater ratios. In addition, the
degradation step of sample SI1 occurs at a higher temperature (around 236℃) than the
other samples (around 220 and 230℃ for SI2 and SI3, respectively) which confirms that
in lower diameter sizes of nanocapsules the thermal stability is superior. According to
the DTG curves in Figure 4-8b, there is a little weight loss below 100℃; this is mainly
due to the incomplete removal of water when drying the samples.
Univers
ity of
Mala
ya
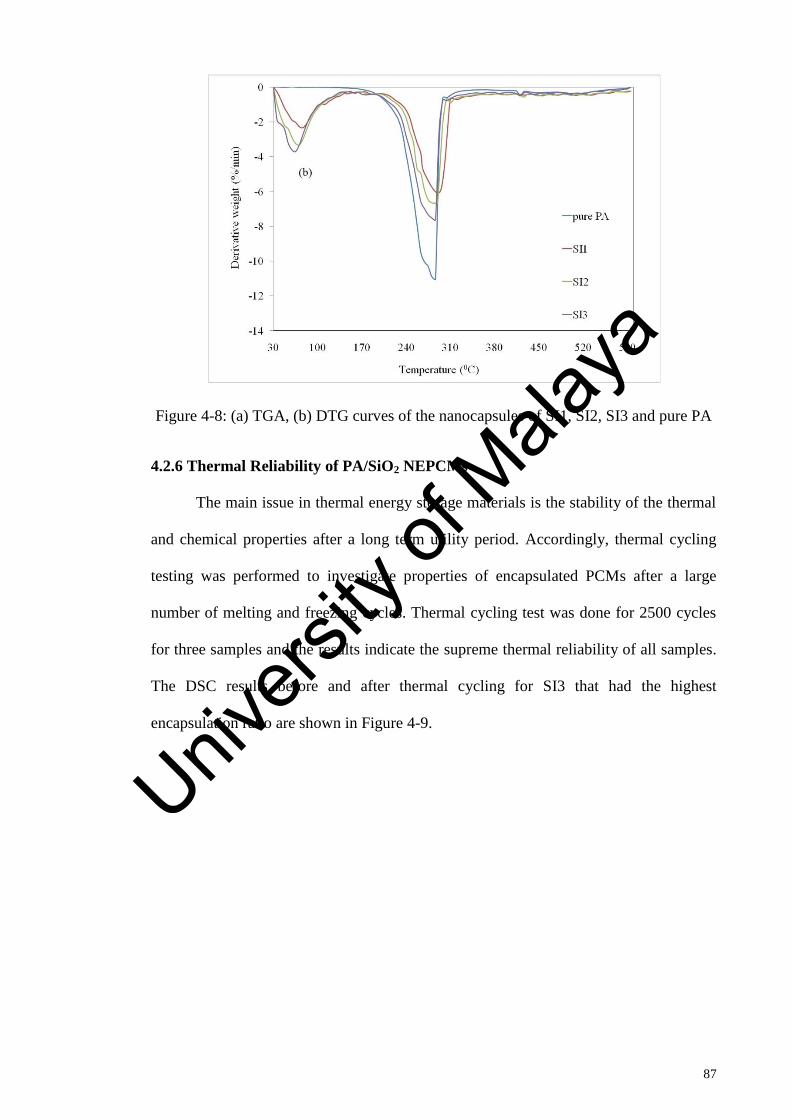
87
Figure 4-8: (a) TGA, (b) DTG curves of the nanocapsules of SI1, SI2, SI3 and pure PA
4.2.6 Thermal Reliability of PA/SiO2 NEPCMs
The main issue in thermal energy storage materials is the stability of the thermal
and chemical properties after a long term utility period. Accordingly, thermal cycling
testing was performed to investigate properties of encapsulated PCMs after a large
number of melting and freezing cycles. Thermal cycling test was done for 2500 cycles
for three samples and the results indicate the supreme thermal reliability of all samples.
The DSC results before and after thermal cycling for SI3 that had the highest
encapsulation ratio are shown in Figure 4-9.
Univers
ity of
Mala
ya

88
Figure 4-9: DSC curves for SI3 before and after thermal cycling
The melting and solidifying temperatures of encapsulated PCMs were changed
from 61.6℃ to 60.1℃ and 62.74℃ to 61.63℃ after 2500 thermal cycling, respectively.
Also, the latent heats of melting and freezing of encapsulated PCM were measured as
177.3 kJ/kg and 178.6 kJ/kg after 2500 thermal cycles, respectively. These results imply
that there were no significant changes in temperatures and latent heats of encapsulated
PCMs after a high number of thermal cycles. An SEM image of encapsulated PCMs of
sample SI3 was also taken after thermal cycles to prove that the maintained its shape of
capsules was stable during thermal cycling. Figure 4-10 shows that encapsulated PCMs
have a perennial shape during thermal cycling.
Univers
ity of
Mala
ya

89
Figure 4-10: SEM image of encapsulated PCM of SI3 after thermal cycling
Figure 4-11 shows the FTIR spectra of encapsulated PCMs of SI3 before and
after thermal cycling. It can be seen that there are no changes in the shape and
frequency values of major peaks after the process, indicating that the chemical
formation of the capsules was not affected after a high number of repeated
melting/solidifying cycles.
Figure 4-11: FT-IR spectra of encapsulated PCM before and after thermal cycling
Univers
ity of
Mala
ya
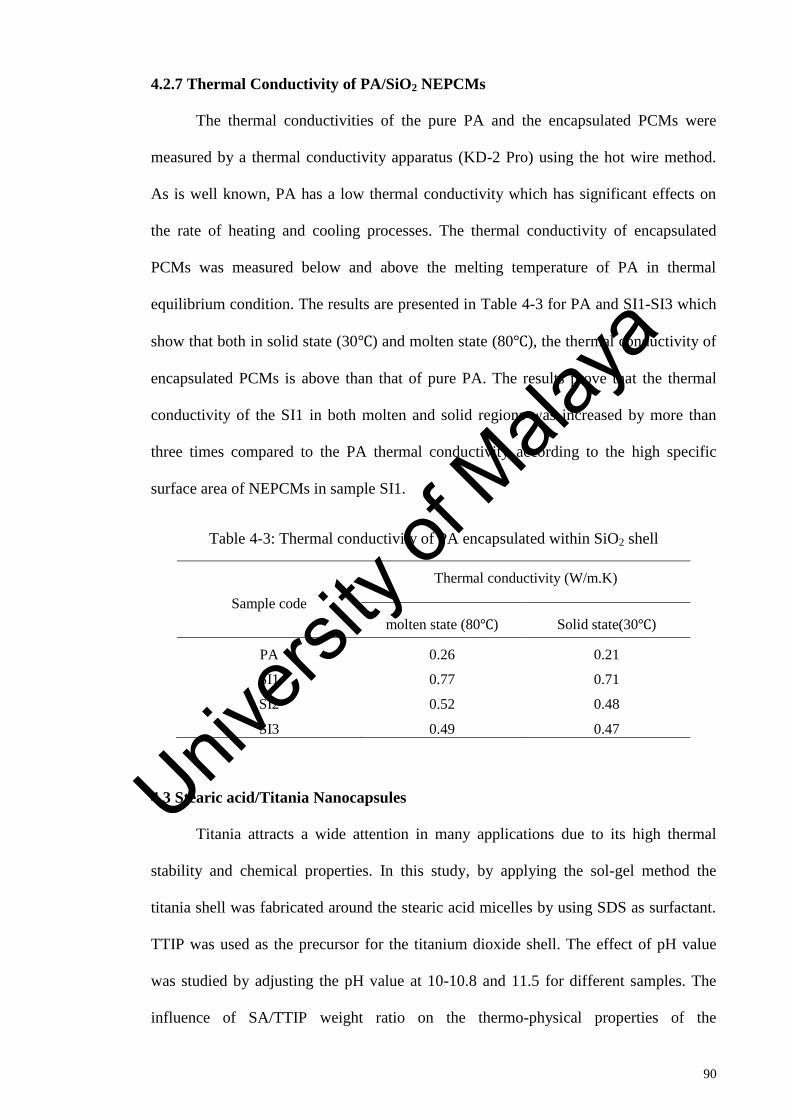
90
4.2.7 Thermal Conductivity of PA/SiO2 NEPCMs
The thermal conductivities of the pure PA and the encapsulated PCMs were
measured by a thermal conductivity apparatus (KD-2 Pro) using the hot wire method.
As is well known, PA has a low thermal conductivity which has significant effects on
the rate of heating and cooling processes. The thermal conductivity of encapsulated
PCMs was measured below and above the melting temperature of PA in thermal
equilibrium condition. The results are presented in Table 4-3 for PA and SI1-SI3 which
show that both in solid state (30℃) and molten state (80℃), the thermal conductivity of
encapsulated PCMs is above than that of pure PA. The results prove that the thermal
conductivity of the SI1 in both molten and solid regions was increased by more than
three times compared to the PA thermal conductivity according to the high specific
surface area of NEPCMs in sample SI1.
Table 4-3: Thermal conductivity of PA encapsulated within SiO2 shell
Sample code
Thermal conductivity (W/m.K)
molten state (80℃) Solid state(30℃)
PA 0.26 0.21
SI1 0.77 0.71
SI2 0.52 0.48
SI3 0.49 0.47
4.3 Stearic acid/Titania Nanocapsules
Titania attracts a wide attention in many applications due to its high thermal
stability and chemical properties. In this study, by applying the sol-gel method the
titania shell was fabricated around the stearic acid micelles by using SDS as surfactant.
TTIP was used as the precursor for the titanium dioxide shell. The effect of pH value
was studied by adjusting the pH value at 10-10.8 and 11.5 for different samples. The
influence of SA/TTIP weight ratio on the thermo-physical properties of the
Univers
ity of
Mala
ya
91
NE/MEPCMs is also investigated. The consequences of the characterization are
demonstrated in subsequent sections.
4.3.1 FTIR Spectra of SA/TiO2 NEPCMs
Chemical interaction between SA and TiO2 would affect the latent heat storage
performance of the NEPCMs; thus, chemical, structural and stability analyses are
important in evaluating the performance of NEPCMs. FT-IR spectroscopy was used to
investigate the interaction between SA and TiO2, as shown in Figure 4-12. Figure 4-12a
shows the spectrum of SA plus the prepared TiO2 sol. In the pure SA spectrum, the
registered peak at 2915 cm-1
corresponds to the symmetrical stretching vibration of the
C–H3 group, and the peak at 2848 cm-1
corresponds to the symmetrical stretching
vibration of the C–H2 group. The stretching vibration of the C=O group produces a
strong absorption peak at 1692 cm-1
. The peaks at 1461 and 1290 cm-1
are allocated to
the in-plane bending vibration of the functional O–H group in SA, and the peak at 926
cm-1
corresponds to the out-of-plane bending vibration of the O–H functional group.
The peak at 719 cm-1
corresponds to the in-plane swinging vibration of the O–H
functional group (Sarı et al., 2009b). In the TiO2 spectrum, the absorption broad bands
from approximately 2670 to 3800 cm-1
corresponds to the stretching and deformation
vibrations of the –OH functional group in H2O that are associated with absorbed water.
The other peak at 1651 cm-1
corresponds to the stretching of titanium carboxylate that
formed from the TTIP and ethanol precursors (Lee et al., 1998). Univers
ity of
Mala
ya

92
Figure 4-12: FTIR spectra of TiO2, pure SA, and NEPCMs synthesised at (a) pH 10, (b)
pH 10.8, and (c) pH 11.5
Figure 4-12a shows the spectra for the ST1-ST4 samples that were prepared at
pH 10 for different SA/TTIP weight ratios: the characteristic peaks of SA and TiO2
were clearly distinguishable in the spectra of nanocapsules, and no peak shifts were
observed. Furthermore, the absorption peak at 1539 cm-1
in the spectra of the NEPCMs
corresponded to the stretching vibration of the C=O from the small amount of titanium
stearate that formed in the NEPCMs. The spectra of ST1-ST4 confirmed the successful
encapsulation of SA by the titania shells. However, the characteristic peaks of SA did
not appear in the spectra for the ST8 and ST10-ST12 samples (Figure 4-12b, c), which
were synthesized at pH values of 10.8 and 11.5. This result indicated that the SA
encapsulation was not successful for the conditions under which these samples were
prepared. The SEM images of these samples also confirmed this result. This outcome
may have occurred because of an accelerated hydrolysis rate at higher pH that did not
Univers
ity of
Mala
ya
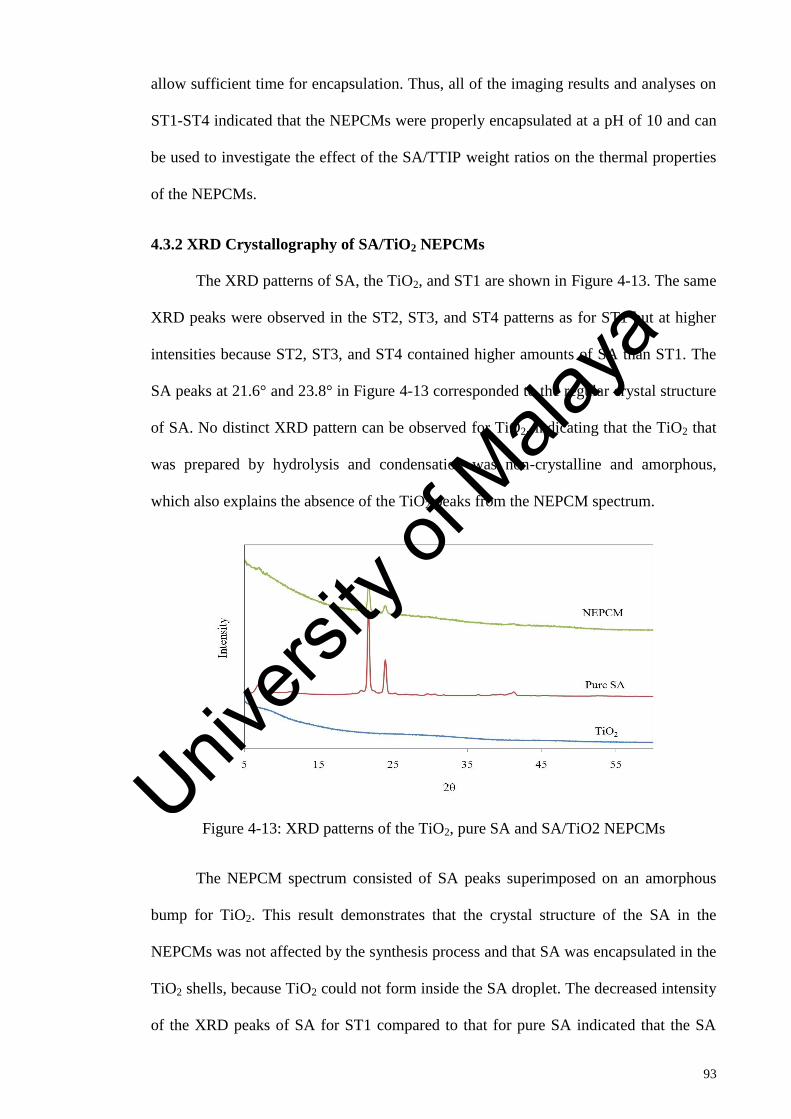
93
allow sufficient time for encapsulation. Thus, all of the imaging results and analyses on
ST1-ST4 indicated that the NEPCMs were properly encapsulated at a pH of 10 and can
be used to investigate the effect of the SA/TTIP weight ratios on the thermal properties
of the NEPCMs.
4.3.2 XRD Crystallography of SA/TiO2 NEPCMs
The XRD patterns of SA, the TiO2, and ST1 are shown in Figure 4-13. The same
XRD peaks were observed in the ST2, ST3, and ST4 patterns as for ST1 but at higher
intensities because ST2, ST3, and ST4 contained higher amounts of SA than ST1. The
SA peaks at 21.6° and 23.8° in Figure 4-13 corresponded to the regular crystal structure
of SA. No distinct XRD pattern can be observed for TiO2, indicating that the TiO2 that
was prepared by hydrolysis and condensation was non-crystalline and amorphous,
which also explains the absence of the TiO2 peaks from the NEPCM spectrum.
Figure 4-13: XRD patterns of the TiO2, pure SA and SA/TiO2 NEPCMs
The NEPCM spectrum consisted of SA peaks superimposed on an amorphous
bump for TiO2. This result demonstrates that the crystal structure of the SA in the
NEPCMs was not affected by the synthesis process and that SA was encapsulated in the
TiO2 shells, because TiO2 could not form inside the SA droplet. The decreased intensity
of the XRD peaks of SA for ST1 compared to that for pure SA indicated that the SA
Univers
ity of
Mala
ya
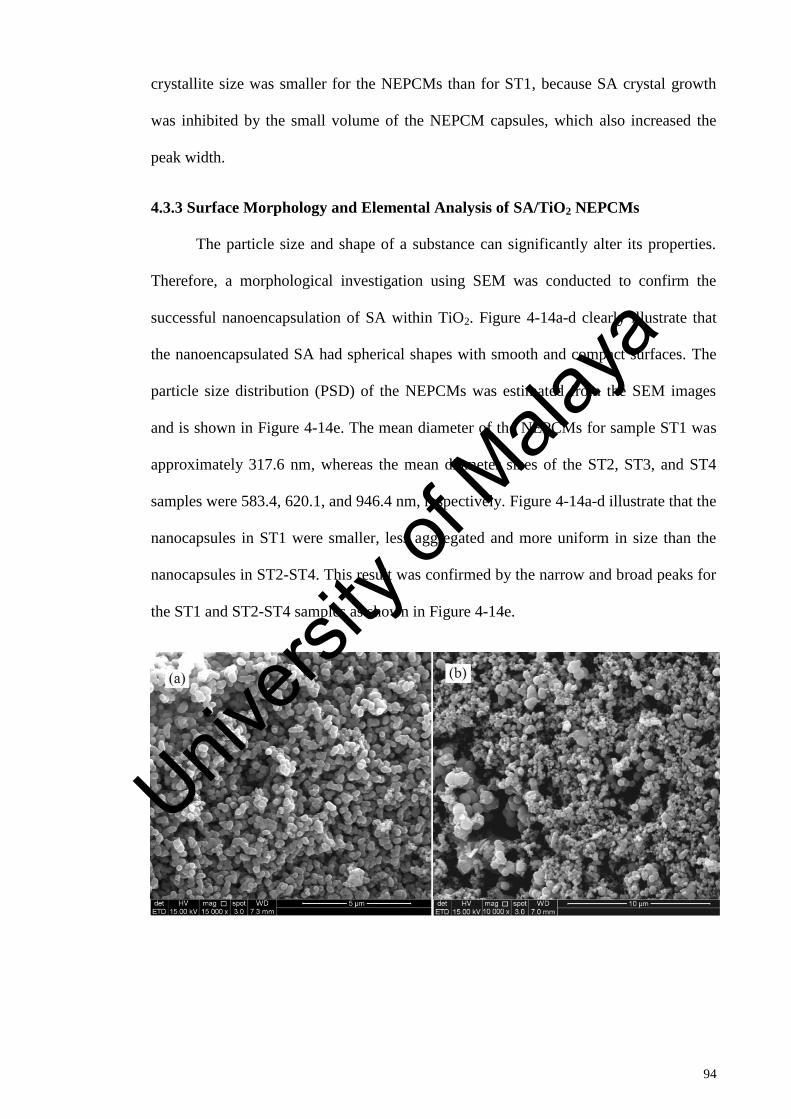
94
crystallite size was smaller for the NEPCMs than for ST1, because SA crystal growth
was inhibited by the small volume of the NEPCM capsules, which also increased the
peak width.
4.3.3 Surface Morphology and Elemental Analysis of SA/TiO2 NEPCMs
The particle size and shape of a substance can significantly alter its properties.
Therefore, a morphological investigation using SEM was conducted to confirm the
successful nanoencapsulation of SA within TiO2. Figure 4-14a-d clearly illustrate that
the nanoencapsulated SA had spherical shapes with smooth and compact surfaces. The
particle size distribution (PSD) of the NEPCMs was estimated from the SEM images
and is shown in Figure 4-14e. The mean diameter of the NEPCMs for sample ST1 was
approximately 317.6 nm, whereas the mean diameter sizes of the ST2, ST3, and ST4
samples were 583.4, 620.1, and 946.4 nm, respectively. Figure 4-14a-d illustrate that the
nanocapsules in ST1 were smaller, less aggregated and more uniform in size than the
nanocapsules in ST2-ST4. This result was confirmed by the narrow and broad peaks for
the ST1 and ST2-ST4 samples as shown in Figure 4-14e.
Univers
ity of
Mala
ya

95
*MD= Mean Diameter
Figure 4-14: SEM images for SA/TiO2 nanocapsules for (a) ST1, (b) ST2, (c) ST3 and
(d) ST4 and (e) particles size distributions of the prepared samples
In the sol-gel encapsulation method, the stirring rate and emulsifier amount are
considered to be the two parameters that control the particle size distribution of the
NEPCM products (Qiu et al., 2012). However, in our preparation scheme, all of the
parameters were held constant except for the SA/TiO2 ratio. The PSD in Figure 4-14e
shows that this ratio was a major factor in determining the particle size and particle size
distribution of the prepared samples.
Univers
ity of
Mala
ya
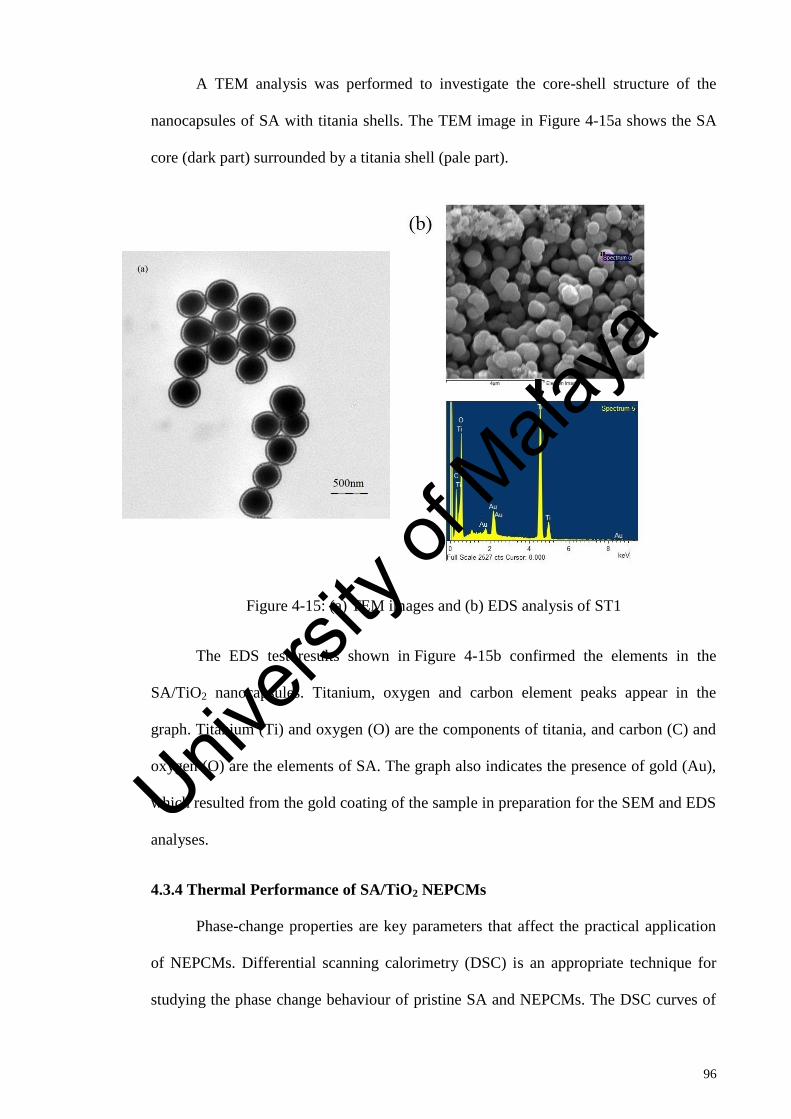
96
A TEM analysis was performed to investigate the core-shell structure of the
nanocapsules of SA with titania shells. The TEM image in Figure 4-15a shows the SA
core (dark part) surrounded by a titania shell (pale part).
Figure 4-15: (a) TEM images and (b) EDS analysis of ST1
The EDS test results shown in Figure 4-15b confirmed the elements in the
SA/TiO2 nanocapsules. Titanium, oxygen and carbon element peaks appear in the
graph. Titanium (Ti) and oxygen (O) are the components of titania, and carbon (C) and
oxygen (O) are the elements of SA. The graph also indicates the presence of gold (Au),
which resulted from the gold coating of the sample in preparation for the SEM and EDS
analyses.
4.3.4 Thermal Performance of SA/TiO2 NEPCMs
Phase-change properties are key parameters that affect the practical application
of NEPCMs. Differential scanning calorimetry (DSC) is an appropriate technique for
studying the phase change behaviour of pristine SA and NEPCMs. The DSC curves of
Univers
ity of
Mala
ya
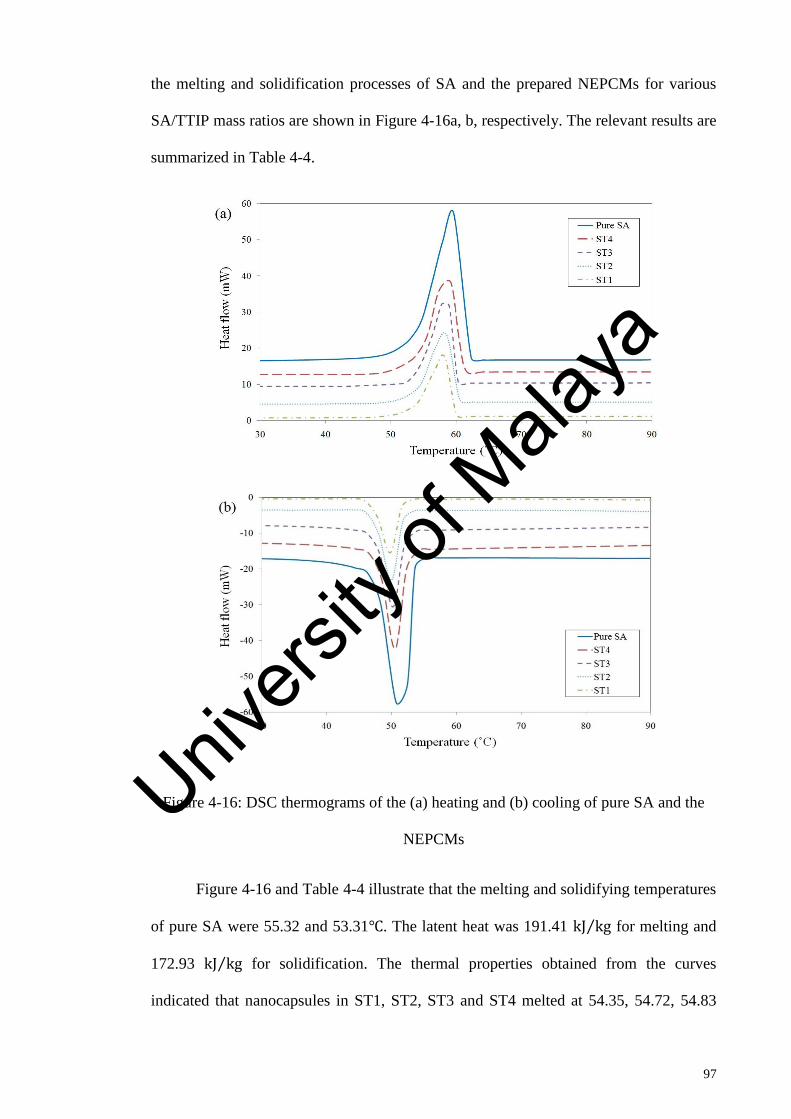
97
the melting and solidification processes of SA and the prepared NEPCMs for various
SA/TTIP mass ratios are shown in Figure 4-16a, b, respectively. The relevant results are
summarized in Table 4-4.
Figure 4-16: DSC thermograms of the (a) heating and (b) cooling of pure SA and the
NEPCMs
Figure 4-16 and Table 4-4 illustrate that the melting and solidifying temperatures
of pure SA were 55.32 and 53.31℃. The latent heat was 191.41 kJ kg for melting and
172.93 kJ kg for solidification. The thermal properties obtained from the curves
indicated that nanocapsules in ST1, ST2, ST3 and ST4 melted at 54.35, 54.72, 54.83
Univers
ity of
Mala
ya
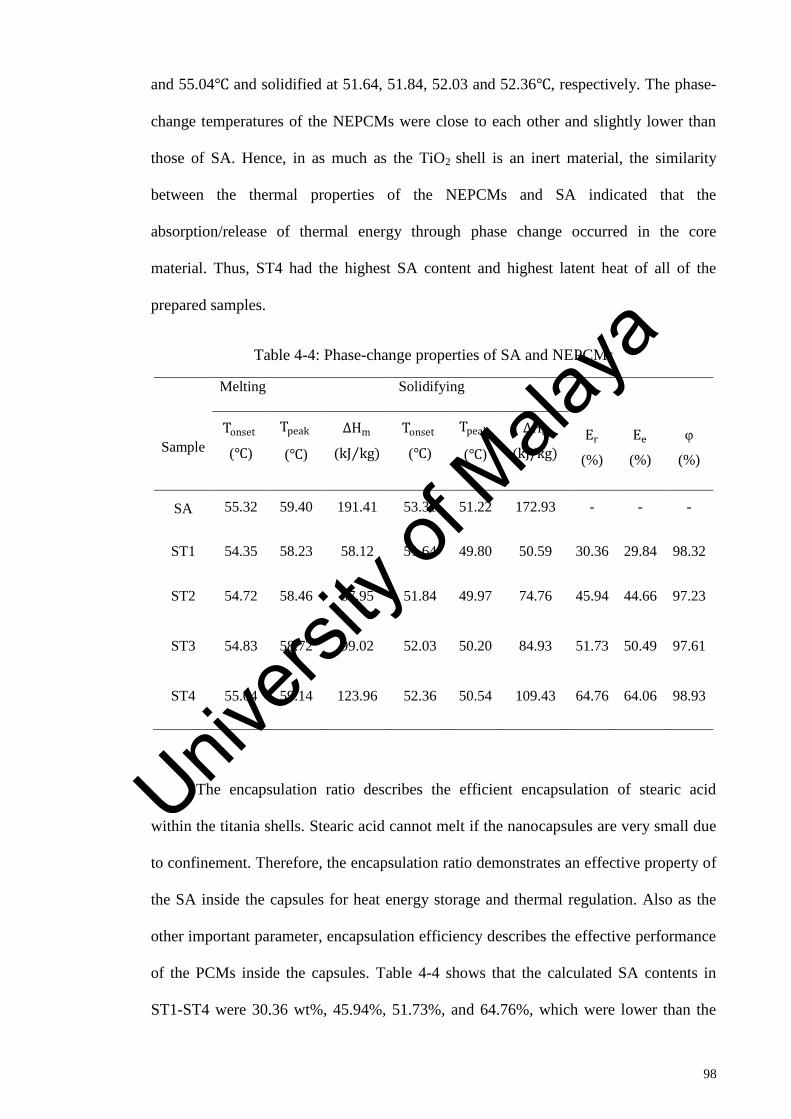
98
and 55.04℃ and solidified at 51.64, 51.84, 52.03 and 52.36℃, respectively. The phase-
change temperatures of the NEPCMs were close to each other and slightly lower than
those of SA. Hence, in as much as the TiO2 shell is an inert material, the similarity
between the thermal properties of the NEPCMs and SA indicated that the
absorption/release of thermal energy through phase change occurred in the core
material. Thus, ST4 had the highest SA content and highest latent heat of all of the
prepared samples.
Table 4-4: Phase-change properties of SA and NEPCMs
Melting Solidifying
Sample
Tonset
(℃)
Tpeak
(℃)
∆Hm
(kJ kg )
Tonset
(℃)
Tpeak
(℃)
∆Hc
(kJ/kg)
Er
(%)
Ee
(%)
φ
(%)
SA 55.32 59.40 191.41 53.31 51.22 172.93 - - -
ST1 54.35 58.23 58.12 51.64 49.80 50.59 30.36 29.84 98.32
ST2 54.72 58.46 87.95 51.84 49.97 74.76 45.94 44.66 97.23
ST3 54.83 58.72 99.02 52.03 50.20 84.93 51.73 50.49 97.61
ST4 55.04 59.14 123.96 52.36 50.54 109.43 64.76 64.06 98.93
The encapsulation ratio describes the efficient encapsulation of stearic acid
within the titania shells. Stearic acid cannot melt if the nanocapsules are very small due
to confinement. Therefore, the encapsulation ratio demonstrates an effective property of
the SA inside the capsules for heat energy storage and thermal regulation. Also as the
other important parameter, encapsulation efficiency describes the effective performance
of the PCMs inside the capsules. Table 4-4 shows that the calculated SA contents in
ST1-ST4 were 30.36 wt%, 45.94%, 51.73%, and 64.76%, which were lower than the
Univers
ity of
Mala
ya
99
mass ratio during synthesis. This result indicates that a small amount of the SA was not
encapsulated in the TiO2 shell and was washed away in the preparation process. The
encapsulation ratio and encapsulation efficiency are associated with the SA/TTIP
weight ratio. A higher core/shell weight ratio was obtained because of the higher
SA/TTIP weight ratio; therefore, the encapsulation ratio and encapsulation efficiency
can be increased by increasing the SA/TTIP weight ratio. However, the high thermal
storage capabilities of the NEPCMs indicated that nearly all of the nanocapsules stored
latent heat effectively through the phase change. Additionally; the calculated mean shell
thickness of prepared samples by using the obtained density of 2.9 g/cm3 for titania
shell material in equation (3-10), are 26.8, 59.6, 52.25 and 49.34nm for ST1, ST2, ST3
and ST4, respectively.
From Figure 4-16, we realize that the degree of supercooling in pure SA was
slightly compared to that in the NEPCMs. However; the supercooling of all samples are
in the appropriate range for TES applications.
4.3.5 Thermal Stability of SA/TiO2 NEPCMs
Thermal stability is a significant factor for the practical application of NEPCMs.
The thermal degradation temperature of NEPCMs was determined using TGA analysis.
Figure 4-17 shows the thermogravimetry curves for pure SA and the prepared
NEPCMs. The curves illustrate that the SA degraded in a single step over a temperature
range of 150-250°C. The SA/TiO2 nanocapsules exhibited two thermal degradation
stages. The first stage occurred over a temperature range of 160-320°C and was
associated with the evaporation of the SA content of the NEPCMs, whereas the second
weight loss was observed between the temperatures of 320-450°C and was attributed to
the removal of chemisorbed water molecules from inside the shell.
Univers
ity of
Mala
ya

100
Figure 4-17: TGA curves for SA/TiO2 nanocapsules
Figure 4-17 shows that all of the nanocapsule samples exhibited a maximum
weight loss at higher temperatures than pure SA. However, the initial temperature of the
first degradation step of the NEPCMs was reasonably above their working temperature
or the melting temperature of them.
These results show that the titania shell increased the thermal stability of the
nanoencapsulated SA and prevented leakage of the melted SA.
4.3.6 Thermal Conductivity of SA/TiO2 NEPCMs
The low thermal conductivity of SA delays the thermal response during the
storage and release of latent heat. Thus, the thermal conductivity of the prepared
NEPCMs must be increased. The thermal diffusivity was measured by a laser flash
method, and was calculated as described in CHAPTER 3.
The calculated thermal conductivities of the microcapsules and pure SA in the
solid state (35°C) are shown in Table 4-5. The data in Table 4-5 indicate that the
thermal conductivities of the SA/TiO2 NEPCMs (ST1-ST4) were clearly greater than
that of pure SA because of the high thermal conductivity of the TiO2 shell.
Univers
ity of
Mala
ya
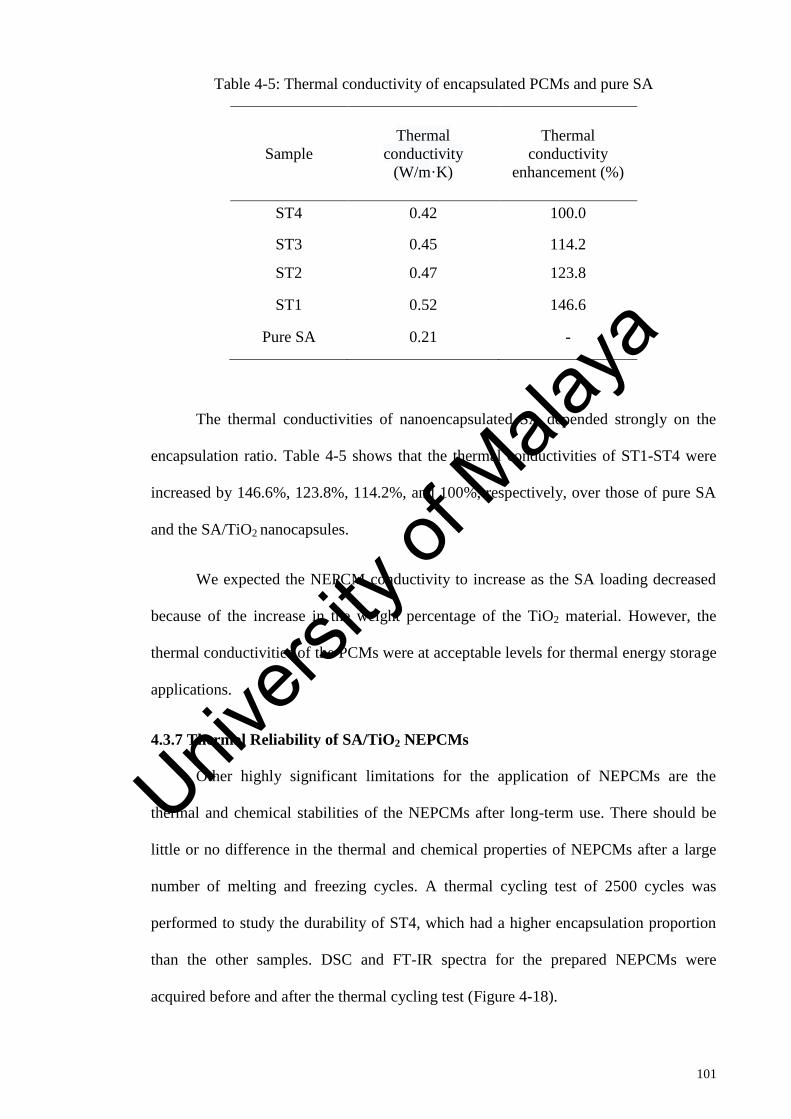
101
Table 4-5: Thermal conductivity of encapsulated PCMs and pure SA
Sample
Thermal
conductivity
(W/m·K)
Thermal
conductivity
enhancement (%)
ST4 0.42 100.0
ST3 0.45 114.2
ST2 0.47 123.8
ST1 0.52 146.6
Pure SA 0.21 -
The thermal conductivities of nanoencapsulated SA depended strongly on the
encapsulation ratio. Table 4-5 shows that the thermal conductivities of ST1-ST4 were
increased by 146.6%, 123.8%, 114.2%, and 100%, respectively, over those of pure SA
and the SA/TiO2 nanocapsules.
We expected the NEPCM conductivity to increase as the SA loading decreased
because of the increase in the weight percentage of the TiO2 material. However, the
thermal conductivities of the PCMs were at acceptable levels for thermal energy storage
applications.
4.3.7 Thermal Reliability of SA/TiO2 NEPCMs
Other highly significant limitations for the application of NEPCMs are the
thermal and chemical stabilities of the NEPCMs after long-term use. There should be
little or no difference in the thermal and chemical properties of NEPCMs after a large
number of melting and freezing cycles. A thermal cycling test of 2500 cycles was
performed to study the durability of ST4, which had a higher encapsulation proportion
than the other samples. DSC and FT-IR spectra for the prepared NEPCMs were
acquired before and after the thermal cycling test (Figure 4-18).
Univers
ity of
Mala
ya
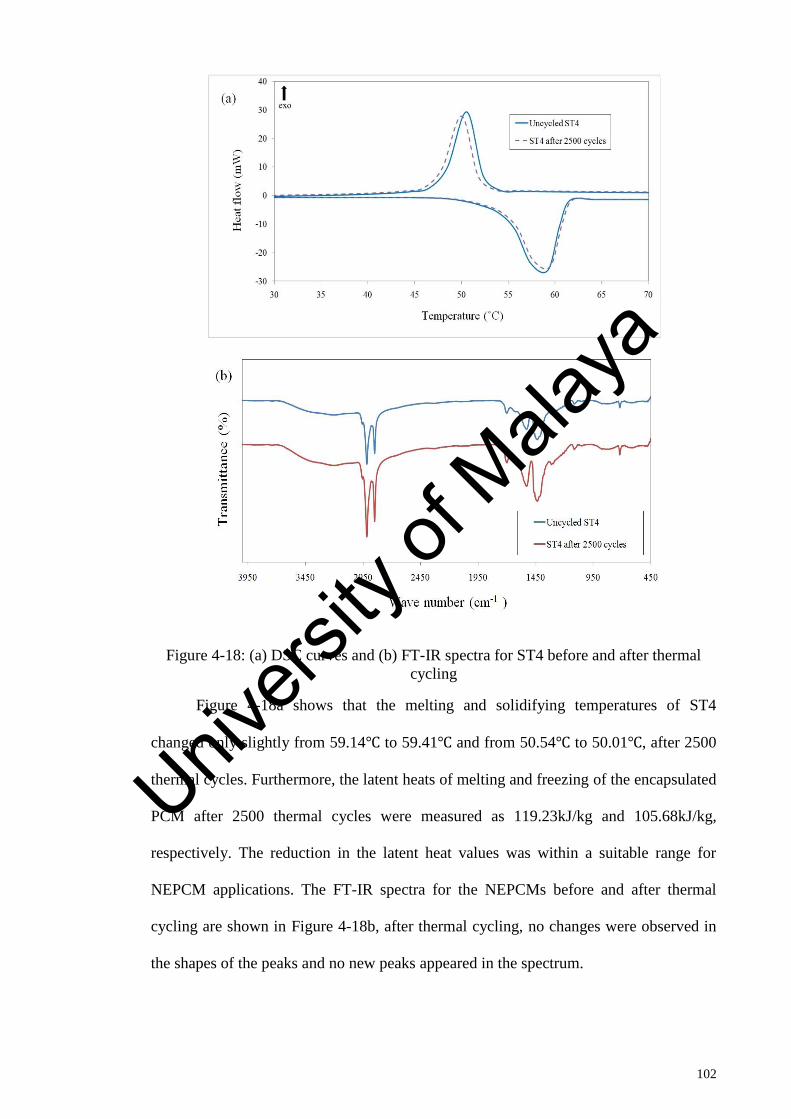
102
Figure 4-18: (a) DSC curves and (b) FT-IR spectra for ST4 before and after thermal
cycling
Figure 4-18a shows that the melting and solidifying temperatures of ST4
changed only slightly from 59.14℃ to 59.41℃ and from 50.54℃ to 50.01℃, after 2500
thermal cycles. Furthermore, the latent heats of melting and freezing of the encapsulated
PCM after 2500 thermal cycles were measured as 119.23kJ/kg and 105.68kJ/kg,
respectively. The reduction in the latent heat values was within a suitable range for
NEPCM applications. The FT-IR spectra for the NEPCMs before and after thermal
cycling are shown in Figure 4-18b, after thermal cycling, no changes were observed in
the shapes of the peaks and no new peaks appeared in the spectrum.
Univers
ity of
Mala
ya
103
The properties of the NEPCMs after 2500 cycles indicate that the prepared
NEPCMs exhibited good thermal and chemical stability for retaining a reversible phase
change without any deterioration in the phase-change properties; thus, the NEPCMs can
be repeatedly used for thermal storage.
4.4 Palmitic Acid/Alumina MEPCMs
The high thermal conductivity of alumina makes it a suitable candidate for
encapsulating the PCMs. The AIP as one of the best alkoxides for preparing the alumina
was used in this project to prepare PA/Alumina capsules. Different pH values were
adjusted in the preparation process, but only at a pH of 10.5 microcapsules could be
formed. The influence of the PA/AIP weight ratio on the properties of the MEPCMs
were studied by characterizing the properties of four different samples with different
PA/AIP weight ratios of 50/50,60/40,70/30 and 80/20. The characteristic descriptions
are explained in the following sections.
4.4.1 Chemical Composition of PA/Al2O3 MEPCMs
The FTIR spectra of the prepared Al2O3 shell, pure PA, and prepared MEPCMs
are displayed in Figure 4-19. Figure 4-19(a) shows broad absorption peaks at 3100–
3700 cm-1
due to the O–H stretching of the absorbed water. The peaks at 450-700 cm-1
are allocated to the Al–O vibrations. The stretching modes of Al–O–Al linkages are
observed at 624 and 700 cm-1
. The peak at 1080 cm-1
is due to the Al–O–H vibration
modes of Al2O3. Univers
ity of
Mala
ya

104
Figure 4-19: FTIR spectra of (a) Al2O3, (b) pure PA, (c) S4, (d) S3, (e) S2, and (f) S1
Figure 4-19(b) exhibits the spectrum of the pure PA. The peaks at 2912 cm-1
and
2846 cm-1
correspond to the symmetrical stretching vibration peaks of –CH3 and –CH2
in the PA. The absorption peak at 1691 cm-1
is associated with the C=O stretching
vibration. The peak at 1293 cm-1
refers to the in-plane bending vibration of the –OH
group of the PA, the peak at 937 cm-1
corresponds to the out-of-plane bending vibration
of the –OH functional group and the peak at 720 cm-1
demonstrates the in-plane
swinging vibration of the –OH functional group (Sari & Kaygusuz, 2002).
Figure 4-19(c)-(f) reveal that the absorption peaks in the PA at 2912, 2846, 1293,
937 and 720 cm-1
are essentially unchanged in the microcapsules. The effect of the
absorption peaks of the Al2O3 shell at 480, 624, and 1080 cm-1
can also be found within
the microcapsules spectra. The interaction between PA and Al2O3 crystals has been
confirmed through the reduction of the intensity as well as the shifting of C=O
stretching band of the PA initially at 1691 cm-1
to the lower frequency of 1595 cm-1
in
the FTIR spectra of microcapsules. This shift proved that there were interface
interactions between the COOH group of the PA and alkaline area in Al2O3, which can
change the thermo-physical properties of encapsulated PA (Tang et al., 2014). The
FTIR results confirmed that the Al2O3 shell was formed on the surface of the PA droplet
Univers
ity of
Mala
ya

105
by considering that the Al2O3 can only be shaped around the interface of the PA in O/W
emulsion.
4.4.2 Crystallography of the PA/Al2O3 MEPCMs
Figure 4-20 shows the XRD patterns of the Al2O3, pure PA and MEPCMs which
reveal the crystalline structures. The broad peaks in Figure 4-20(a) at 28˚, 38˚, and
49˚could be assigned to the formation of boehmite phase while the weak and broad
diffraction lines indicate the poor crystallinity.
Figure 4-20(b) shows that the peaks at 21.8° and 24.3° belong to the normal
crystallization of the PA and Figure 4-20(c)-(f) show that the XRD peaks of the PA in
microcapsules also contain the boehmite smooth peaks.
Figure 4-20(c)-(f) indicated that the strong and sharp diffraction peaks of the
pure PA become weak and broad peaks due to the formation of microcapsules. The
XRD analysis further proved that the PA in the core of Al2O3 microcapsules became a
short-range order compared to the high-melting-point pure PA crystals, therefore some
changes in the thermal properties of the MEPCMs might be expected.
Figure 4-20: XRD patterns of (a) Al2O3, (b) pure PA, (c) S4, (d) S3, (e) S2, and (f) S1
Univers
ity of
Mala
ya

106
4.4.3 Surface Morphology and Surface Element Analysis of PA/Al2O3 MEPCMs
Figure 4-21 and Figure 4-22 present the morphologies of the microcapsules
synthesized with four different weight ratios of PA/AIP and it can be seen that the
microcapsules were spherical. It can be seen in Figure 4-21a-d that the weight ratio of
PA/AIP influences the diameter and surface morphology of the MEPCMs. The images
indicated that S1and S2 have a smooth and compact surface without any porosity on the
shell. Additionally, Figure 4-22a, b confirmed that the size distribution of the
microcapsules in S4 was not homogeneous and uniform compared to the size
distribution of the microcapsules in S1.
Univers
ity of
Mala
ya
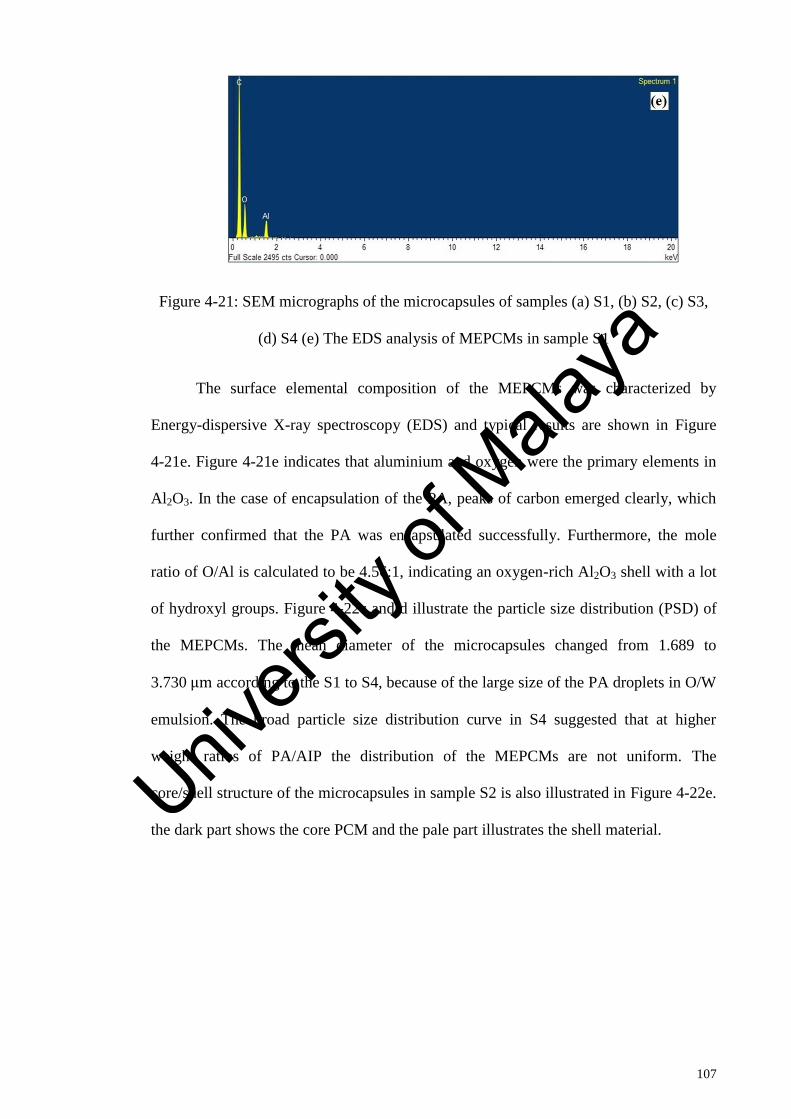
107
Figure 4-21: SEM micrographs of the microcapsules of samples (a) S1, (b) S2, (c) S3,
(d) S4 (e) The EDS analysis of MEPCMs in sample S1
The surface elemental composition of the MEPCMs was characterized by
Energy-dispersive X-ray spectroscopy (EDS) and typical results are shown in Figure
4-21e. Figure 4-21e indicates that aluminium and oxygen were the primary elements in
Al2O3. In the case of encapsulation of the PA, peaks of carbon emerged clearly, which
further confirmed that the PA was encapsulated successfully. Furthermore, the mole
ratio of O/Al is calculated to be 4.56:1, indicating an oxygen-rich Al2O3 shell with a lot
of hydroxyl groups. Figure 4-22c and d illustrate the particle size distribution (PSD) of
the MEPCMs. The mean diameter of the microcapsules changed from 1.689 to
3.730 μm according to the S1 to S4, because of the large size of the PA droplets in O/W
emulsion. The broad particle size distribution curve in S4 suggested that at higher
weight ratios of PA/AIP the distribution of the MEPCMs are not uniform. The
core/shell structure of the microcapsules in sample S2 is also illustrated in Figure 4-22e.
the dark part shows the core PCM and the pale part illustrates the shell material. Univ
ersity
of M
alaya
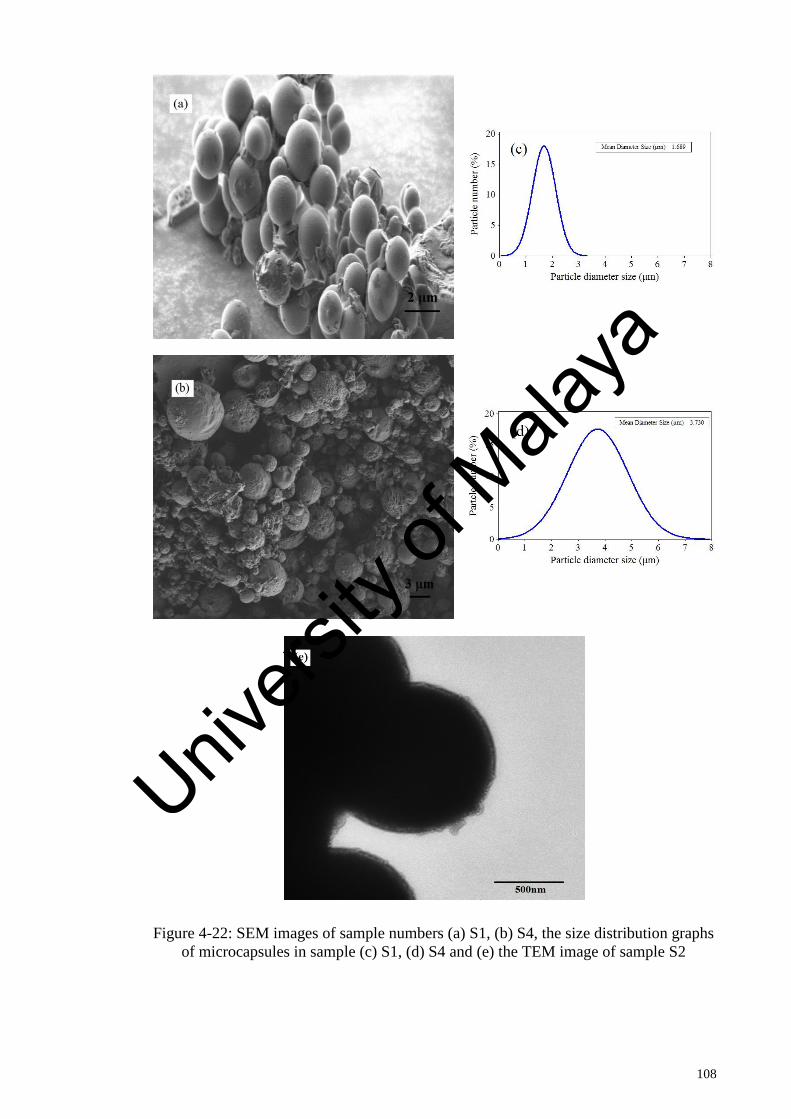
108
Figure 4-22: SEM images of sample numbers (a) S1, (b) S4, the size distribution graphs
of microcapsules in sample (c) S1, (d) S4 and (e) the TEM image of sample S2
Univers
ity of
Mala
ya

109
4.4.4 Thermal Energy Storage Properties of PA/Al2O3 MEPCMs
The heating and cooling DSC scans were carried out at the scanning rate of
5℃/min to investigate the effects of Al2O3 shell on the phase-change characteristics of
the PA microcapsules with different weight ratios of PA/AIP. The DSC results are
exhibited in Figure 4-23 and the phase change characterizations obtained via DSC
analysis are listed in Table 4-6.
Figure 4-23: DSC thermograms of the (a) heating and (b) cooling of pure PA and
MEPCMs
All DSC curves in Figure 4-23a exhibit one endothermic peak with Tpeak located
in the temperature range of 62–66℃, which is ascribed to the melting of the PA. The
Univers
ity of
Mala
ya

110
melting points of the MEPCMs were lower than the melting temperature of the PA due
to the confinement effect by shell–PA interactions. As is shown in Figure 4-23, the
melting and solidification temperatures of the MEPCMs were close to each other so
there is little supercooling. It is found that the theoretical core loadings for all of the
MEPCMs were different because of the different PA/AIP weight ratio. Samples S1-S4
show lower actual core loading which are noted in Table 4-6 compared to their
theoretical core loading of 50-80%. This indicates that not all of the reactants could be
incorporated within the shell materials. Some of the Al2O3 was not assembled on the
surfaces of PA micelles but directly precipitated as solid particles during the synthesis
process and also not all of the PA particles can be encapsulated within the shell
materials which were removed during the washing process, accordingly resulting in a
decrease in actual core loading. However, the latent heat of the prepared microcapsules
is still sufficient for being relevant in thermal energy storage.
Table 4-6: The phase-change properties of the PA and MEPCMs
Melting Solidifying
sample
Tonset
(℃)
Tpeak
(℃)
Tend
(℃)
Tonset
(℃)
Tpeak
(℃)
Tend
(℃)
∆Hm
(kJ kg )
∆Hc
(kJ/kg)
Er
(%)
Ee
(%)
Φ
(%)
S1 56.75 62.2 66.25 55.44 49.78 45.83 55.58 55.37 30.46 30.11 98.78
S2 55.7 62.2 65.25 55.4 49.76 45.73 77.09 77.13 42.26 41.86 99.06
S3 55.16 62.09 65.98 55.12 49.68 45.52 97.31 97.71 53.34 52.9 99.24
S4 55.37 62.03 66.25 55.05 51.33 45.22 121.97 123.93 66.86 66.75 99.83
PA 60.58 65.22 72.08 61.94 57.47 51.44 182.42 185.96 - - -
The encapsulation ratio and encapsulation efficiency illustrate the efficient
encapsulation of the PA and the working effectiveness of the PCMs within
microcapsules, respectively. Normally, the higher the actual core loading, the higher the
encapsulation ratio, which was confirmed by the results. The small internal space of
Univers
ity of
Mala
ya
111
some produced nano-sized microcapsules may lead to a confinement effect on the
crystallization of the PA. In this case, a small amount of the encapsulated PA cannot
change phase and does not contribute to heat storage. As shown in Table 4-6, the
thermal storage capability of the MEPCMs synthesized at different concentrations of
AIP exhibits the thermal storage capabilities higher than 98%, which indicates that the
PA in suitable sizes was encapsulated by Al2O3 shell, and thus, most of the encapsulated
PA could effectively store and release the latent heat through the phase change process.
The shell thickness of the prepared microcapsules was also calculated by using
the outcomes of the DSC analysis. The density of the shell material was measured
3.1g/cm3. The mean shell thickness of the MEPCMs is in the range of 0.07-0.12 μm for
S4-S1. The lower shell thickness of microcapsules in sample S4 could be evidence to
the porosity and non compact shell material in these capsules.
Latent heat is particularly attractive due to its ability to provide high-energy
storage density in a quasi-isothermal process. But the energy storage density can be
further increased using PCM having a large sensible heat within the temperature range
of the storage while the total heat stored in a PCM can be calculated as follows:
Qt = Cp,s
Tm
T1
. dT + ∆HL + Cp,1. dTT2
Tm
(4-1)
Where Qt is the total heat stored per mass, Cp,s and Cp,l are the specific heat of
solid and liquid PCM, respectively. ∆HL is the heat of fusion at the phase change
temperature Tm . It can be seen that the specific heat also affects the total heat storage.
The specific heat of the pure PA and encapsulated PA was measured by the multiple
curves method for temperatures between 35℃ and 45℃ and the results are shown in
Figure 4-24.
Univers
ity of
Mala
ya

112
Figure 4-24: Specific heat curves of PA and encapsulated PA
The results show that the specific heat of the capsules was higher than that of the
pure PA. It can be seen clearly that at higher weight amount of the shell material the
specific heat values increases which partly makes up for the lower latent heat of these
capsules.
4.4.5 Thermal Conductivity of PA/Al2O3 MEPCMs
It is well known that the low thermal conductivity of the PA increases its thermal
response time for storage and release of latent heat. Thus, enhancing the thermal
conductivity of PCMs is a major aim in designing a microencapsulated material. The
thermal diffusivity was measured by the laser flash method and the thermal conductivity
was calculated as described in CHAPTER 3. The calculated thermal conductivities of
the microcapsules and the pure PA in solid state (35℃) are given in Table 4-7.
Univers
ity of
Mala
ya

113
Table 4-7: Thermal conductivity of encapsulated PCMs and Pure PA
Sample Thermal conductivity
(W mK ) Thermal conductivity
enhancement (%)
Pure PA 0.282 -
S1 0.530 87.94
S2 0.449 59.21
S3 0.410 45.39
S4 0.352 24.82
The thermal conductivity of all encapsulated PCMs was higher than that of PA,
due to the high thermal conductivity of Al2O3 as the shell material. Additionally, it is
notable that the thermal conductivities of microencapsulated PA samples are
considerably related to the encapsulation ratio. The lower thermal conductivity
enhancements were achieved at higher encapsulation ratios. This suggests that the Al2O3
shell performs an important function in improving the heat transfer of
microencapsulated PA.
In samples S1 and S2 the Al2O3 creates an entirely continuous and compact shell
around the PA, this can be considered as a virtual heat transfer network. So, this can
enhance the heat transfer rate over the entire microcapsules and so attain a significantly
improved thermal conductivity.
4.4.6 Thermal Stability of PA/Al2O3 MEPCMs
Thermal stability is a significant factor in evaluating the microencapsulated
PCMs for the applications of heat energy storage or thermal regulation. The thermal
degradation behaviours of the microcapsule samples synthesized in different weight
ratios were investigated by the TGA. The TGA thermograms in Figure 4-25 show the
weight loss of the microcapsules (S1, S2, S3, and S4) and that of pure PA. Figure 4-25
Univers
ity of
Mala
ya

114
demonstrates that pure PA loses weight at approximately 200-520℃ with only one step,
which corresponds to the volatilization of PA.
Figure 4-25: TGA thermograms of the pure PA and MEPCMs
According to Figure 4-25 microcapsules of the four samples (S1-S4) degrade in
one step as well as the pure PA. It is believed that the increase of AIP proportion could
lead to a thicker alumina shell for the microcapsules and thus generates a better barrier
to prevent the encapsulated PA from decomposing. Moreover, the microencapsulated
PA samples produced a considerable amount of residual char to be associated with the
theoretical PA loading in the microcapsules.
Table 4-8: Decomposition temperatures of the PA and MEPCMs
Sample
code Onset decomposition
temperature (℃) Maximum weight loss
temperature (℃)
Pure PA 183.25 277.33
S1 212.48 355.68
S2 206.69 323.48
S3 203.45 306.81
S4 194.80 286.16
Univers
ity of
Mala
ya

115
Additionally, the onset temperatures of degradation for all are higher than that of
pure PA (Table 4-8), which indicates that the thermal stability of phase change material
increases after being encapsulated. Moreover the microcapsule samples show a
maximum weight loss at higher temperatures compared to the pure PA which indicates
that the Al2O3 wall can prevent the encapsulated PA from evaporating at the normal
boiling point and improve the degradation temperature of the microcapsules. On the
other hand the degradation temperature of sample S1 and S2 compared to the other two
samples are higher, which proves that the thick and non-porous Al2O3 shell in the
microcapsules of these two samples may favor the improvement in thermal stability of
the microcapsules.
It is significant that the weight loss of the microcapsules strongly depends on the
encapsulation ratios of PA to the microcapsules and on the PA/AIP weight ratio,
therefore sample S4 which was synthesized with the weight ratio of 80/20 achieved the
highest weight loss. The occurrence of a small weight loss before 130°C is mainly due
to the incomplete removal of water.
4.4.7 Thermal Effusivity of PA/Al2O3 MEPCMs
The thermal effusivity is a measure of a material’s ability to exchange thermal
energy with its surroundings. The thermal effusivity is considered to be a critical
physical quantity to depict the unsteady state heat transfer in a LHTES system. The
effusivity of a material is the square root of the product of the thermal conductivity,
density and heat capacity:
e = ρKCp (4-2)
Where e (kJ/(K.m2.s
0.5)) is thermal effusivity, k is thermal conductivity
(W/(m·K)), ρ is density (kg/m³) and Cp is specific heat capacity (kJ/(kg·K)). The
thermal effusivity of the PA and MEPCMs are evaluated at 35℃ and listed in Table 4-9.
Univers
ity of
Mala
ya

116
Table 4-9: Thermal effusivity of the PA and MEPCMs
Sample Thermal effusivity (kJ/(K.m2.s
0.5 ))
Pure PA 0.640
S1 0.877
S2 0.803
S3 0.770
S4 0.711
The thermal effusivity of all MEPCMs is larger than that of pure PA, which is
beneficial for the LHTES systems.
4.4.8 Thermal Reliability and Durability of PA/Al2O3 MEPCMs
Thermal reliability of the MEPCMs is critical to evaluate the possibility of their
long term use of TES systems. A PCM needs to maintain its TES attributes even when it
is put through a prolonged thermal cycling process. For the prepared materials the
thermal reliability of the composite PCMs was examined after the exposure to 1500
melting-freezing cycles. The changes of latent heat in composite PCMs after thermal
cycling were evaluated to determine whether they are thermally reliable.
Univers
ity of
Mala
ya

117
Figure 4-26: The latent heat values of the MEPCMs before and after thermal cycling
After 1500 cycles the MEPCMs still showed a single phase transition curve with
onset temperature as before the cycling. In other words, there were no extra peaks
related to chemical decomposition or phase segregation within the MEPCMs. Through
comparing the latent heat values in Figure 4-26, the maximum change in latent heat
capacity was determined as 3.84% for S4 and the minimum was 0.39% for S1. These
results suggested that the changes in the latent heat capacity of the composites after
thermal cycling were less than 1% for S1 and S2 demonstrating their good thermal
reliability. The results indicate that S3 and S4 may have had some leakage during
cycling that caused effects on the latent heat capacity of the MEPCMs.
4.5 Comparison of Properties of Prepared NE/MEPCMs
Choosing an ideal PCM is extremely important and crucial for thermal energy
storage. The proper PCM should have sufficient properties according to the suggested
application. The major specifications any PCM should have are including adequate
melting temperature, desirable heat of fusion, thermal conductivity, thermal stability
and reliability and negligible corrosion effects on the surrounding materials.
Univers
ity of
Mala
ya

118
In addition; in some applications for encapsulated PCMs, especially in slurry
systems, the size and the size distribution of the NE/MEPCMs are substantial
parameters. In this study three different metal oxides were utilized to prepare different
novel NE/MEPCMs for thermal energy storage applications. Due to the various
properties of the shell materials, to compare the characteristics of the prepared
materials, the extents of the enhancement of the major features are considered. For the
comparison, the results are reported based on the 50/50 weight ratio of the core PCM
material to the precursor of the shell material and are displayed in Figure 4-27, Figure
4-28 and Table 4-10.
Figure 4-27: Encapsulation features of encapsulated PA/SiO2, SA/TiO2 and PA/Al2O3
Univers
ity of
Mala
ya

119
Figure 4-28: Thermal conductivity and decomposition temperature enhancement of
encapsulated PA/SiO2, SA/TiO2 and PA/Al2O3
Figure 4-27 demonstrates that the encapsulation ratio and encapsulation
efficiency of SiO2 encapsulated PCMs is significantly superior to those of the TiO2 and
Al2O3. This arises due to the hydrolysis and condensation rates of the precursors
throughout the preparation method. The lower hydrolysis rate of the TEOS in silica
preparation compare to TTIP and AIP provides a more controllable synthesis process of
NEPCMs, therefore; the most homogenous size distribution of produced capsules as
compared to the other two materials. However; in all three types of prepared materials
the high thermal storage capability that indicates the output efficiency of the PCMs
which enclosed within shell materials in storage process, make the prepared capsules
suitable for thermal storage applications. In some fields, specifically in latent
functionally thermal fluids, because the large size of particles of the PCM
microcapsules increase the fluid's viscosity, microencapsulated PCMs are not
appropriate for repeated cycling, thus it is essential to develop encapsulated PCMs with
smaller particle sizes as compared with microcapsules. It is noticeable that the prepared
SA/TiO2 and PA/SiO2 nanocapsules have large latent heat and thermal conductivity
despite of their small particle size. Therefore the prepared nanocapsules are adequate for
Univers
ity of
Mala
ya

120
utilizing in thermal energy storage applications specifically in thermal fluids heat
transfer.
Comparison of the thermal conductivity and thermal stability enhancements for
the three types of samples in 50/50 weight ratio of PCM to the precursor of shell
material are illustrated in Figure 4-28. As shown in Figure 4-28 the thermal conductivity
of capsules are all improved remarkably compared to the pure PCMs. The results
suggest that the highest thermal conductivity enhancement (238.09%) was achieved by
using SiO2 as a shell material with 50/50 weight ratio of the core PCM to the precursor
of the shell material. The thermal conductivity of capsules with silica and titania as the
shell supporting materials are enhanced more than the alumina due to the mean diameter
size of those samples (Table 4-10). The smaller diameter sizes of silica and titania
encapsulated PCMs increase the contact surface area of the capsules that affect the
thermal conductivity substantially. Additionally; the onset decomposition temperatures
of the capsules are all improved compared to the pure PCMs but the prepared capsules
by alumina shell materials have higher enhancement than the other two ones which
demonstrates that the ability of the alumina to improve the thermal stability is much
more higher than that of the other materials.
Table 4-10: Mean diameter size of encapsulated PA/SiO2, SA/TiO2 and PA/Al2O3
Sample Mean diameter size
PA/SiO2 (SI1) 183.7 nm
SA/TiO2 (ST1) 317.6 nm
PA/Al2O3 (S1) 1.68 µm
Totally for existing applications specially in slurry and nanofluid heat transfer
systems the proposed metal oxides (SiO2, TiO2 and Al2O3) in this project will help to
Univers
ity of
Mala
ya

121
conquer and reduce the obstacles of the PCMs. With encapsulation of the metal oxides
mostly at low loading contents of the shell material (as evident from the small shell
thickness of the prepared materials), thermal conductivity and thermal stability
enhancement can be simultaneously accomplished while high latent heat is retained. In
addition, thermal reliability of the all prepared materials makes them appropriate for
utilizing in numerous melting-solidifying cycles in many thermal energy storage
applications. The compatibility of these materials with most materials makes them
convenient for using in applications of thermal storage specially heat transfer slurries,
however choosing the beneficial NE/MEPCM to apply depends on the application
parameters like the region of used temperature, the properties and demeanor of the
surrounding materials and etc.
4.6 Summary
The fabrication and structural features of the novel NE/MEPCMs with inorganic
shell materials and the relationships between the thermo-physical properties of PCMs
coated by the three kinds of metal oxides have been examined systematically in this
study. The effectiveness of the processing parameters like adjusted pH value and the
weight ratio of core to precursor of coating material on the morphology, chemical
characteristics, melting and solidifying temperatures, thermal stability, thermal
conductivity, thermal reliability, etc have been examined. The NE/MEPCMs in all
samples were spherically shaped with no or negligible interactions between the core and
shell material. The SEM and TEM images of all materials display the spherical and
core/shell structures of the prepared materials. All the coating surfaces are compact and
smooth excluding the PA/Al2O3 samples prepared with weight ratios of 70/30 and 80/20
of PA/AIP which had some porosity in the shell surface of MEPCMs due to the higher
diameter size of the capsules.
Univers
ity of
Mala
ya

122
The melting/solidifying enthalpies have been found to reduce as a result of
encapsulation of the fatty acids and some variations occurred with weight ratio and
adjusted pH value. The melting/solidification temperatures were slightly changed
because of the shell reduction of steric hindrance of the PCM core materials. The
encapsulation ratio and efficiency of all samples are in a satisfactory range for
employing in thermal storage applications. Additionally the high thermal storage
capabilities of all samples are in the range of 97% to 99% that approve the high
efficiency of the PCMs in the shell materials.
The thermal conductivity of the NE/MEPCMs improves using metal oxides as
shell material while silica and titania show a greater thermal conductivity improvement
than alumina due to the smaller mean particle diameter. From the results, we have found
the maximum thermal conductivity enhancement of 238.09% for PA/SiO2 NEPCMs
with a mean diameter of 183.7nm at PA/TEOS weight ratio of 50/50 while the
minimum enhancement was found for PA/Al2O3 MEPCMs (24.82%) with 80/20 weight
ratio of PA/AIP. The thermal stability of all prepared materials was also improved
compared to the pure PCMs core materials. The thermal reliability after 1500-2500
melting/solidifying cycles reveals the adequacy of the materials in thermal cycling
systems. All outcomes inclusively suggested that the prepared materials can be
considered as potential and favorable candidates for thermal storage applications
specifically in thermal storage and heat transfer slurry systems.
Univers
ity of
Mala
ya

123
CHAPTER 5 CONCLUSION AND RECOMMENDATION
CONCLUSION AND RECOMMENDATION
This chapter elucidates the conclusions deduced from the experimental results
and some suggestions for further procedure and experiments which could have been
done if limitations in experimental instruments and time were not a factor to accomplish
further investigations.
5.1 Conclusion
With respect to the identified research difficulties as presented in the CHAPTER
1, like, the low thermal conductivity, the leakage of PCMs throughout the utilization,
the low thermal stability, and etc, the main objectives of this thesis were focused on the
improving the PCMs by encapsulation of the PCMs within compact inorganic shell
materials. Specifically, encapsulation of low cost PCMs such as palmitic acid and
stearic acid with three different types of metal oxides (SiO2, TiO2, and Al2O3) for a
storage system in a temperature range of 50-80℃ has been studied. NE/MEPCMs were
successfully prepared using the sol-gel method. The effects of the weight ratio of
PCMs/precursor of the shell materials (TEOS, TTIP and AIP for the SiO2, TiO2 and
Al2O3, respectively) and the adjusted pH value throughout the synthesis process on the
phase transition properties of the PCM capsules have been investigated. The
understanding of the synthesis process, extent of accomplishment and the full
experimental design that has been carried out to investigate physical, chemical and
thermal properties of the prepared NE/MEPCMs were reported. To highlight our
research results some characterization conclusions are summarized for the prepared
materials as presented in sequence:
The SEM and TEM images confirmed that all of the presented samples were
successfully shaped with relatively spherical profiles and core/shell structures with
Univers
ity of
Mala
ya

124
different mean diameter sizes and size distributions. The mean diameter sizes are 183.7
nm for PA/SiO2 (SI1), 317.6 nm for SA/TiO2 (ST1) and 1.68 µm for PA/Al2O3 (S1).
The results indicated that the mean diameter size of the capsules not only strongly
related to the type of shell material, the preparation circumstances (such as pH value)
and the demeanor of the precursor shell material but also, the amount of the PCM core
to the amount of the precursor of the shell material weight ratio. In some fields,
specifically in latent functionally thermal fluids, because the large size of particles of
the PCM microcapsules increase the fluid's viscosity, microencapsulated PCMs are not
appropriate for repeated cycling, thus it is essential to develop encapsulated PCMs with
smaller particle sizes as compared with microcapsules. It is noticeable that the prepared
SA/TiO2 and PA/SiO2 nanocapsules have large latent heat and thermal conductivity
despite their small particle size. Therefore the prepared nanocapsules are adequate for
utilizing in thermal energy storage applications specifically in thermal fluids heat
transfer. The FTIR outcomes signified that no chemical reactions occurred between the
core and shell materials of the prepared NE/MEPCMs. The XRD results indicated that
the NE/MEPCMs retained good crystallinity. All characteristic peaks of PCMs and shell
materials were also observed in the FTIR spectra.
The thermal characteristics of the prepared NE/MEPCMs as one of the main
objectives of this research were also studied. The DSC results demonstrated that at
higher pH value of synthesis process and also for samples prepared with higher weight
ratio amount of core to the amount of the precursor of shell material, the encapsulation
ratio and encapsulation efficiency were increased. Therefore, latent heats of the capsules
were enhanced by increasing their diameter size. The melting/solidifying temperatures
of the prepared capsules were slightly changed due to the shell reduction of steric
hindrance of the PCM core materials. The thermal stability analysis (TGA) implied that
the thermal stability and decomposition temperature of PCMs increased after being
Univers
ity of
Mala
ya

125
encapsulated by the enhancement percentage range of 6.6% to 15.9%. The thermal
conductivity as one of the most important parameters in thermal energy storage
applications was also measured. The thermal conductivity of all the prepared
NE/MEPCMs ascertained the improvement of 87.9% to 238% compared to the pure
PCMs. Moreover, the prepared NE/MEPCMs exhibited good thermal reliability and
chemical stability even after being subjected to 2500 melting/solidification cycles.
Conforming to all the discussed results; the improved thermal properties, thermal
and chemical reliability, thermal conductivity and compatible morphology and
enhanced heat storage characteristics of the NE/MEPCMs facilitate the prepared
materials to be considered as potential candidates for thermal storage applications
specifically in slurry systems.
5.2 Recommendations
A facile technology has been developed to encapsulate some low cost PCMs
with metal oxides. Three high thermal conductive metal oxides were utilized according
to this aim. The thermal performance and the cyclic stability of these metal oxide
encapsulated PCMs were studied. However; the thermal features can be improved by
optimizing the quality of the metal oxide coatings. Also there is a wide variety of
different inorganic materials as well as the metal oxides which can have the sufficient
properties to be applied as the coating materials for the PCMs.
Another potential concept which can be investigated in future is the application
of the encapsulated PCMs exclusively in thermal storage slurries. Moreover in the
NE/MEPCMs heat transfer employment, dispersion of NE/MEPCMs in polar solvents
should be further studied. The preliminary issue to be addressed is the dispersion and
stability of the NE/MEPCMs in the surrounding fluids in such functions. In order to
understand the validity of the proposed approaches, numerical analyses that are based
Univers
ity of
Mala
ya
126
on those approaches are useful. At present, numerical studies in the literature about this
issue are not sufficient to reach a conclusion about the accuracy of the approaches.
Detailed experimental investigation of the effects of most of the organic within
inorganic NE/MEPCMs parameters on heat transfer has not been performed yet.
Systematic studies about these aspects of NE/MEPCMs on heat transfer will provide
profitable information for the optimization of heat transfer enhancement obtained with
NE/MEPCMs. In the case of product engineering several improvements and suitable
developments can be wished, first of all the test of the NE/MEPCMs by a test rig or by
some field tests. Concisely; more attempts must be conducted to both fundamental and
applied investigations of different types of NE/MEPCMs with the aid of advanced
experimental and numerical techniques.
Univers
ity of
Mala
ya
127
LIST OF PUBLICATIONS AND PAPERS PRESENTED
1. Tahan Latibari, S., Mehrali, M., Mehrali, M., Indra Mahlia, T. M., & Cornelis
Metselaar, H. S. (2013). Synthesis, characterization and thermal properties of
nanoencapsulated phase change materials via sol–gel method. Energy, 61(0), 664-
672. Impact factor 4.844 (Q1)
2. Tahan Latibari, S., Mehrali, M., Mehrali, M., Afifi, A. B. M., Mahlia, T. M. I.,
Akhiani, A. R., & Metselaar, H. S. C. (2015). Facile synthesis and thermal
performances of stearic acid/titania core/shell nanocapsules by sol–gel method.
Energy, 85(0), 635-644. Impact factor 4.844 (Q1)
3. Tahan Latibari, S., Mehrali, M., Mehrali, M., Mahlia, T. M. I., & Metselaar, H. S. C.
(2015). Fabrication and Performances of Microencapsulated Palmitic Acid with
Enhanced Thermal Properties. Energy & Fuels, 29(2), 1010-1018. Impact factor
2.790 (Q1)
The conference proceeding:
1. 5th International Conference for Colloids and Interfaces 2015. 21 - 24 June 2015,
Amsterdam, Netherlands. ―Microencapsulation of Palmitic Acid phase change
material with enhancement of thermal performance‖
Univers
ity of
Mala
ya

128
REFERENCES
Abhat, A. (1983). Low temperature latent heat thermal energy storage: Heat
storage materials. Solar Energy, 30(4), 313-332.
Agyenim, F., Hewitt, N., Eames, P., & Smyth, M. (2010). A review of materials,
heat transfer and phase change problem formulation for latent heat thermal energy
storage systems (LHTESS). Renewable and Sustainable Energy Reviews, 14(2), 615-
628.
Aho, A., Antonietti, M., Arndt, S., Behrens, M., Bill, E., Brandner, A., Centi, G.,
Claus, P., Cox, N., & DeBeer, S. (2012). Chemical Energy Storage: De Gruyter.
Alay, S., Göde, F., & Alkan, C. (2010). Preparation and characterization of
poly(methylmethacrylate-coglycidyl methacrylate)/n-hexadecane nanocapsules as a
fiber additive for thermal energy storage. Fibers and Polymers, 11(8), 1089-1093.
Alkan, C., Sarı, A., Karaipekli, A., & Uzun, O. (2009). Preparation,
characterization, and thermal properties of microencapsulated phase change material for
thermal energy storage. Solar Energy Materials and Solar Cells, 93(1), 143-147.
Anisur, M. R., Mahfuz, M. H., Kibria, M. A., Saidur, R., Metselaar, I. H. S. C.,
& Mahlia, T. M. I. (2013). Curbing global warming with phase change materials for
energy storage. Renewable and Sustainable Energy Reviews, 18(0), 23-30.
Babich, M. W., Benrashid, R., & Mounts, R. D. (1994). DSC studies of new
energy storage materials. Part 3. Thermal and flammability studies. Thermochimica
Acta, 243(2), 193-200.
Baetens, R., Jelle, B. P., & Gustavsen, A. (2010). Phase change materials for
building applications: A state-of-the-art review. Energy and Buildings, 42(9), 1361-
1368.
Baker, J. N., & Collinson, A. (1999). Electrical energy storage at the turn of the
Millennium. Power Engineering Journal, 13(3), 107-112.
Banaszek, J., Domañski, R., Rebow, M., & El-Sagier, F. (1999). Experimental
study of solid–liquid phase change in a spiral thermal energy storage unit. Applied
Thermal Engineering, 19(12), 1253-1277.
Baran, G., & Sari, A. (2003). Phase change and heat transfer characteristics of a
eutectic mixture of palmitic and stearic acids as PCM in a latent heat storage system.
Energy Conversion and Management, 44(20), 3227-3246.
Bayés-García, L., Ventolà, L., Cordobilla, R., Benages, R., Calvet, T., & Cuevas-
Diarte, M. A. (2010). Phase Change Materials (PCM) microcapsules with different shell
compositions: Preparation, characterization and thermal stability. Solar Energy
Materials and Solar Cells, 94(7), 1235-1240.
Univers
ity of
Mala
ya

129
Baylin, F., & Institute, S. E. R. (1979). Low Temperature Thermal Energy
Storage: A State-of-the-art Survey: Department of Energy, [Office of Energy
Technology], Solar Energy Research Institute.
Bershteĭn, V. A., & Egorov, V. M. (1994). Differential Scanning Calorimetry of
Polymers: Physics, Chemistry, Analysis, Technology: Ellis Horwood.
Birchenall, C. E., & Riechman, A. (1980). Heat storage in eutectic alloys.
Metallurgical Transactions A, 11(8), 1415-1420.
Black, J. K., Tracy, L. E., Roche, C. P., Henry, P. J., Pesavento, J. B., &
Adalsteinsson, T. (2010). Phase transitions of hexadecane in poly(alkyl methacrylate)
core - shell microcapsules. Journal of Physical Chemistry B, 114(12), 4130-4137.
Brinker, C. J., & Scherer, G. W. (2013). Sol-Gel Science: The Physics and
Chemistry of Sol-Gel Processing: Elsevier Science.
Buddhi, D., & Sharma, S. D. (1999). Measurements of transmittance of solar
radiation through stearic acid: a latent heat storage material. Energy Conversion and
Management, 40(18), 1979-1984.
Bugaje, I. M. (1997). Enhancing the thermal response of latent heat storage
systems. International Journal of Energy Research, 21(9), 759-766.
Cabeza, L. F., Castell, A., Barreneche, C., de Gracia, A., & Fernández, A. I.
(2011). Materials used as PCM in thermal energy storage in buildings: A review.
Renewable and Sustainable Energy Reviews, 15(3), 1675-1695.
Cai, Y., Wei, Q., Huang, F., Lin, S., Chen, F., & Gao, W. (2009). Thermal
stability, latent heat and flame retardant properties of the thermal energy storage phase
change materials based on paraffin/high density polyethylene composites. Renewable
Energy, 34(10), 2117-2123.
Cao, F., & Yang, B. (2014). Supercooling suppression of microencapsulated
phase change materials by optimizing shell composition and structure. Applied Energy,
113, 1512-1518.
Carslaw, H. S., & Jaeger, J. C. (1986). Conduction of Heat in Solids: Clarendon
Press.
Chen, H., Cong, T. N., Yang, W., Tan, C., Li, Y., & Ding, Y. (2009). Progress in
electrical energy storage system: A critical review. Progress in Natural Science, 19(3),
291-312.
Chen, L., Wang, T., Zhao, Y., & Zhang, X.-R. (2014). Characterization of
thermal and hydrodynamic properties for microencapsulated phase change slurry
(MPCS). Energy Conversion and Management, 79(0), 317-333.
Univers
ity of
Mala
ya

130
Chen, S.-L., Chen, C.-L., Tin, C.-C., Lee, T.-S., & Ke, M.-C. (2000). An
experimental investigation of cold storage in an encapsulated thermal storage tank.
Experimental Thermal and Fluid Science, 23(3–4), 133-144.
Chen, S. L., Zuo, Y., Liang, H., & Chang, Y. A. (1997). A thermodynamic
description for the ternary Al-Mg-Cu system. Metallurgical and Materials Transactions
A, 28(2), 435-446.
Cho, K., & Choi, S. H. (2000). Thermal characteristics of paraffin in a spherical
capsule during freezing and melting processes. International Journal of Heat and Mass
Transfer, 43(17), 3183-3196.
Choi, S.-S., Lee, S., Im, S., Kim, S., & Joo, Y. (2003). Silica nanofibers from
electrospinning/sol-gel process. Journal of Materials Science Letters, 22(12), 891-893.
Christensen, C. (1983). Advanced phase-change storage: analysis of materials
and configurations.
Demirbas, M. F. (2006). Thermal Energy Storage and Phase Change Materials:
An Overview. Energy Sources, Part B: Economics, Planning, and Policy, 1(1), 85-95.
Dincer, I., & Dost, S. (1996). A perspective on thermal energy storage systems
for solar energy applications. International Journal of Energy Research, 20(6), 547-557.
Dincer, I., & Rosen, M. (2002). Thermal Energy Storage: Systems and
Applications: John Wiley & Sons.
Ding, W.-X., & Yin, X.-M. (2004). Dissection of the multiple mechanisms of
TNF-α-induced apoptosis in liver injury. Journal of Cellular and Molecular Medicine,
8(4), 445-454.
Ehsan Bitaraf, H., Zahid, A., Itziar, L., Seyed Aliakbar, M., Mohammadreza, B.,
Rahmatollah, K., & Björn, P. (2012). Screening Single Phase Laminar Convective Heat
Transfer of Nanofluids in a Micro-tube. Journal of Physics: Conference Series, 395(1),
012036.
Esen, M., Durmuş, A., & Durmuş, A. (1998). Geometric design of solar-aided
latent heat store depending on various parameters and phase change materials. Solar
Energy, 62(1), 19-28.
Ettouney, H. M., Alatiqi, I., Al-Sahali, M., & Ahmad Al-Ali, S. (2004). Heat
transfer enhancement by metal screens and metal spheres in phase change energy
storage systems. Renewable Energy, 29(6), 841-860.
Fan, Y. F., Zhang, X. X., Wang, X. C., Li, J., & Zhu, Q. B. (2004). Super-
cooling prevention of microencapsulated phase change material. Thermochimica Acta,
413(1–2), 1-6.
Univers
ity of
Mala
ya

131
Fang, G., Chen, Z., & Li, H. (2010a). Synthesis and properties of
microencapsulated paraffin composites with SiO2 shell as thermal energy storage
materials. Chemical Engineering Journal, 163(1–2), 154-159.
Fang, G., Li, H., Chen, Z., & Liu, X. (2010b). Preparation and characterization
of stearic acid/expanded graphite composites as thermal energy storage materials.
Energy, 35(12), 4622-4626.
Fang, G., Li, H., Yang, F., Liu, X., & Wu, S. (2009). Preparation and
characterization of nano-encapsulated n-tetradecane as phase change material for
thermal energy storage. Chemical Engineering Journal, 153(1–3), 217-221.
Fang, G., Tang, F., & Cao, L. (2014). Preparation, thermal properties and
applications of shape-stabilized thermal energy storage materials. Renewable and
Sustainable Energy Reviews, 40, 237-259.
Fang, Y., Kuang, S., Gao, X., & Zhang, Z. (2008). Preparation and
characterization of novel nanoencapsulated phase change materials. Energy Conversion
and Management, 49(12), 3704-3707.
Farid, M. M., Khudhair, A. M., Razack, S. A. K., & Al-Hallaj, S. (2004). A
review on phase change energy storage: materials and applications. Energy Conversion
and Management, 45(9–10), 1597-1615.
Farid, M. M., Kim, Y., & Kansawa, A. (1990). Thermal Performance of a Heat
Storage Module Using PCM’s With Different Melting Temperature: Experimental.
Journal of Solar Energy Engineering, 112(2), 125-131.
Feldman, D., Shapiro, M. M., Banu, D., & Fuks, C. J. (1989). Fatty acids and
their mixtures as phase-change materials for thermal energy storage. Solar Energy
Materials, 18(3–4), 201-216.
Finke, H. L., Gross, M. E., Waddington, G., & Huffman, H. M. (1954). Low-
temperature Thermal Data for the Nine Normal Paraffin Hydrocarbons from Octane to
Hexadecane. Journal of the American Chemical Society, 76(2), 333-341.
Frankl, P., & Nowak, S. (2010). Technology roadmap: solar photovoltaic
energy: OECD/IEA.
Gao, H., & Yang, J. (2010). Nanoscale silicon dioxide prepared by sol-gel
process. Modern Applied Science, 4(9), p152.
Ghahremanzadeh, F., Khoddami, A., & Carr, C. M. (2010). Improvement in
fastness properties of phase-change material applied on surface modified wool fabrics.
Fibers and Polymers, 11(8), 1170-1180.
Gharsallaoui, A., Roudaut, G., Chambin, O., Voilley, A., & Saurel, R. (2007).
Applications of spray-drying in microencapsulation of food ingredients: An overview.
Food Research International, 40(9), 1107-1121.
Univers
ity of
Mala
ya

132
Gil, A., Medrano, M., Martorell, I., Lázaro, A., Dolado, P., Zalba, B., & Cabeza,
L. F. (2010). State of the art on high temperature thermal energy storage for power
generation. Part 1—Concepts, materials and modellization. Renewable and Sustainable
Energy Reviews, 14(1), 31-55.
Glaser, P. M., & Pantano, C. G. (1984). Effect of the H2O/TEOS ratio upon the
preparation and nitridation of silica sol/gel films. Journal of Non-Crystalline Solids,
63(1–2), 209-221.
Goldstein, J., Newbury, D. E., Echlin, P., Joy, D. C., Romig, A. D., Lyman, C.
E., Fiori, C., & Lifshin, E. (2012). Scanning Electron Microscopy and X-Ray
Microanalysis: A Text for Biologists, Materials Scientists, and Geologists: Springer US.
Goswami, D. Y., Kreith, F., & Kreider, J. F. (2000). Principles of Solar
Engineering, Second Edition: Taylor & Francis.
Griffiths, P. W., & Eames, P. C. (2007). Performance of chilled ceiling panels
using phase change material slurries as the heat transport medium. Applied Thermal
Engineering, 27(10), 1756-1760.
Hasnain, S. M. (1998). Review on sustainable thermal energy storage
technologies, Part I: heat storage materials and techniques. Energy Conversion and
Management, 39(11), 1127-1138.
Hatakeyama, T., & Quinn, F. X. (1999). Thermal analysis: fundamentals and
applications to polymer science: Wiley.
Hawes, D. W., Feldman, D., & Banu, D. (1993). Latent heat storage in building
materials. Energy and Buildings, 20(1), 77-86.
Hawlader, M. N. A., Uddin, M. S., & Khin, M. M. (2003). Microencapsulated
PCM thermal-energy storage system. Applied Energy, 74(1–2), 195-202.
Hawlader, M. N. A., Uddin, M. S., & Zhu, H. J. (2002). Encapsulated phase
change materials for thermal energy storage: Experiments and simulation. International
Journal of Energy Research, 26(2), 159-171.
Hayat, K., Gondal, M. A., Khaled, M. M., Ahmed, S., & Shemsi, A. M. (2011).
Nano ZnO synthesis by modified sol gel method and its application in heterogeneous
photocatalytic removal of phenol from water. Applied Catalysis A: General, 393(1–2),
122-129.
He, B., Martin, V., & Setterwall, F. (2004). Phase transition temperature ranges
and storage density of paraffin wax phase change materials. Energy, 29(11), 1785-1804.
Huggins, R. (2010). Mechanical Energy Storage Energy Storage (pp. 55-68):
Springer US.
Univers
ity of
Mala
ya
133
Humphries, W. R., Griggs, E. I., United, S., National, A., Space, A., Scientific,
& Technical Information, O. (1977). A design handbook for phase change thermal
control and energy storage devices. Washington; Springfield, Va.: National Aeronautics
and Space Administration, Scientific and Technical Information Office ; For sale by the
National Technical Information Service.
Ibrahim, H., Ilinca, A., & Perron, J. (2008). Energy storage systems—
Characteristics and comparisons. Renewable and Sustainable Energy Reviews, 12(5),
1221-1250.
Jamekhorshid, A., Sadrameli, S. M., & Farid, M. (2014). A review of
microencapsulation methods of phase change materials (PCMs) as a thermal energy
storage (TES) medium. Renewable and Sustainable Energy Reviews, 31, 531-542.
Jegadheeswaran, S., & Pohekar, S. D. (2009). Performance enhancement in
latent heat thermal storage system: A review. Renewable and Sustainable Energy
Reviews, 13(9), 2225-2244.
Jin, X., Medina, M. A., & Zhang, X. (2013). On the importance of the location of
PCMs in building walls for enhanced thermal performance. Applied Energy, 106(0), 72-
78.
Jin, Y., Lee, W., Musina, Z., & Ding, Y. (2010). A one-step method for
producing microencapsulated phase change materials. Particuology, 8(6), 588-590.
Joo, S. H., Park, J. Y., Tsung, C.-K., Yamada, Y., Yang, P., & Somorjai, G. A.
(2009). Thermally stable Pt/mesoporous silica core-shell nanocatalysts for high-
temperature reactions. Nat Mater, 8(2), 126-131.
Kaneko, R., Suzuki, E., Jikei, M., & Kakimoto, M.-A. (2002). Preparation and
properties of hyperbranched aromatic polyamide-silica composites by sol-gel method.
High Performance Polymers, 14(2), 105-114.
Kenisarin, M., & Mahkamov, K. (2007). Solar energy storage using phase
change materials. Renewable and Sustainable Energy Reviews, 11(9), 1913-1965.
Kenisarin, M. M., & Kenisarina, K. M. (2012). Form-stable phase change
materials for thermal energy storage. Renewable and Sustainable Energy Reviews,
16(4), 1999-2040.
Khartchenko, N. V., & Kharchenko, V. M. (2013). Advanced Energy Systems,
Second Edition: Taylor & Francis.
Khatib, H. (2012). IEA World Energy Outlook 2011—A comment. Energy
policy, 48, 737-743.
Khodadadi, J. M., & Hosseinizadeh, S. F. (2007). Nanoparticle-enhanced phase
change materials (NEPCM) with great potential for improved thermal energy storage.
International Communications in Heat and Mass Transfer, 34(5), 534-543.
Univers
ity of
Mala
ya
134
Khudhair, A. M., & Farid, M. M. (2004). A review on energy conservation in
building applications with thermal storage by latent heat using phase change materials.
Energy Conversion and Management, 45(2), 263-275.
Klein, L. C. (2013). Sol-Gel Optics: Processing and Applications: Springer US.
Konuklu, Y., Unal, M., & Paksoy, H. O. (2014). Microencapsulation of caprylic
acid with different wall materials as phase change material for thermal energy storage.
Solar Energy Materials and Solar Cells, 120, Part B, 536-542.
Kureti, S., & Weisweiler, W. (2002). A novel sol–gel method for the synthesis of
γ-aluminium oxide: development of the sol–gel transformation and characterization of
the xerogel. Journal of Non-Crystalline Solids, 303(2), 253-261.
Kuznik, F., David, D., Johannes, K., & Roux, J.-J. (2011). A review on phase
change materials integrated in building walls. Renewable and Sustainable Energy
Reviews, 15(1), 379-391.
Kwon, H., Cheong, I., & Kim, J. (2010). Preparation of n-octadecane
nanocapsules by using interfacial redox initiation in miniemulsion polymerization.
Macromolecular Research, 18(9), 923-926.
Lane, G. A. (1983). Solar heat storage: Latent heat materials.
Lee, S.-W., Ichinose, I., & Kunitake, T. (1998). Molecular Imprinting of
Azobenzene Carboxylic Acid on a TiO2 Ultrathin Film by the Surface Sol-Gel Process.
Langmuir, 14(10), 2857-2863.
Lekeufack, D. D., Brioude, A., Mouti, A., Alauzun, J. G., Stadelmann, P.,
Coleman, A. W., & Miele, P. (2010). Core-shell Au@(TiO2, SiO2) nanoparticles with
tunable morphology. Chemical Communications, 46(25), 4544-4546.
Lepot, N., Van Bael, M. K., Van den Rul, H., D’Haen, J., Peeters, R., Franco, D.,
& Mullens, J. (2008). Synthesis of platelet-shaped boehmite and γ-alumina
nanoparticles via an aqueous route. Ceramics International, 34(8), 1971-1974.
Li, B., Liu, T., Hu, L., Wang, Y., & Gao, L. (2013). Fabrication and Properties
of Microencapsulated Paraffin@SiO2 Phase Change Composite for Thermal Energy
Storage. ACS Sustainable Chemistry & Engineering, 1(3), 374-380.
Li, J., Pan, Y., Xiang, C., Ge, Q., & Guo, J. (2006). Low temperature synthesis
of ultrafine α-Al2O3 powder by a simple aqueous sol–gel process. Ceramics
International, 32(5), 587-591.
Li, W., Zhang, X.-X., Wang, X.-C., & Niu, J.-J. (2007). Preparation and
characterization of microencapsulated phase change material with low remnant
formaldehyde content. Materials Chemistry and Physics, 106(2–3), 437-442.
Univers
ity of
Mala
ya
135
Li, W., Zhang, X.-x., Wang, X.-c., Tang, G.-y., & Shi, H.-f. (2012). Fabrication
and morphological characterization of microencapsulated phase change materials
(MicroPCMs) and macrocapsules containing MicroPCMs for thermal energy storage.
Energy, 38(1), 249-254.
Libor, Z., & Zhang, Q. (2009). The synthesis of nickel nanoparticles with
controlled morphology and SiO2/Ni core-shell structures. Materials Chemistry and
Physics, 114(2–3), 902-907.
Ling, T.-C., & Poon, C.-S. (2013). Use of phase change materials for thermal
energy storage in concrete: An overview. Construction and Building Materials, 46(0),
55-62.
Livage, J., Henry, M., & Sanchez, C. (1988). Sol-gel chemistry of transition
metal oxides. Progress in Solid State Chemistry, 18(4), 259-341.
Macwan, D. P., Dave, P., & Chaturvedi, S. (2011). A review on nano-
TiO2 sol–gel type syntheses and its applications. Journal of Materials Science, 46(11),
3669-3686.
Mehalick, E. M., & Tweedie, A. T. (1975). Two component thermal energy
storage material. Final report (pp. Medium: X; Size: Pages: 45).
Mehling, H., & Cabeza, L. (2007). PHASE CHANGE MATERIALS AND
THEIR BASIC PROPERTIES. In: H. Paksoy (Ed.), Thermal Energy Storage for
Sustainable Energy Consumption (Vol. 234, pp. 257-277): Springer Netherlands.
Mehling, H., & Cabeza, L. F. (2008). Heat and cold storage with PCM: An up to
date introduction into basics and applications: Springer Berlin Heidelberg.
Mehrali, M., Latibari, S. T., Mehrali, M., Indra Mahlia, T. M., & Cornelis
Metselaar, H. S. (2013a). Preparation and properties of highly conductive palmitic
acid/graphene oxide composites as thermal energy storage materials. Energy, 58, 628-
634.
Mehrali, M., Latibari, S. T., Mehrali, M., Indra Mahlia, T. M., Cornelis
Metselaar, H. S., Naghavi, M. S., Sadeghinezhad, E., & Akhiani, A. R. (2013b).
Preparation and characterization of palmitic acid/graphene nanoplatelets composite with
remarkable thermal conductivity as a novel shape-stabilized phase change material.
Applied Thermal Engineering, 61(2), 633-640.
Memon, S. A. (2014). Phase change materials integrated in building walls: A
state of the art review. Renewable and Sustainable Energy Reviews, 31, 870-906.
Mesalhy, O., Lafdi, K., & Elgafy, A. (2006). Carbon foam matrices saturated
with PCM for thermal protection purposes. Carbon, 44(10), 2080-2088.
Mettawee, E.-B. S., & Assassa, G. M. R. (2007). Thermal conductivity
enhancement in a latent heat storage system. Solar Energy, 81(7), 839-845.
Univers
ity of
Mala
ya

136
Mirmohammadi, S. A., & Behi, M. (2012). Investigation on Thermal
Conductivity, Viscosity and Stability of Nanofluids.
Nagano, K., Mochida, T., Takeda, S., Domański, R., & Rebow, M. (2003).
Thermal characteristics of manganese (II) nitrate hexahydrate as a phase change
material for cooling systems. Applied Thermal Engineering, 23(2), 229-241.
Nakamura, H., & Matsui, Y. (1995). Silica Gel Nanotubes Obtained by the Sol-
Gel Method. Journal of the American Chemical Society, 117(9), 2651-2652.
Nema, P., Nema, S., & Roy, P. (2012). An overview of global climate changing
in current scenario and mitigation action. Renewable and Sustainable Energy Reviews,
16(4), 2329-2336.
Onder, E., Sarier, N., & Cimen, E. (2008). Encapsulation of phase change
materials by complex coacervation to improve thermal performances of woven fabrics.
Thermochimica Acta, 467(1–2), 63-72.
Oró, E., de Gracia, A., Castell, A., Farid, M. M., & Cabeza, L. F. (2012). Review
on phase change materials (PCMs) for cold thermal energy storage applications. Applied
Energy, 99(0), 513-533.
Pan, W., Ye, J., Ning, G., Lin, Y., & Wang, J. (2009). A novel synthesis of
micrometer silica hollow sphere. Materials Research Bulletin, 44(2), 280-283.
Paris, J., Falardeau, M., & Villeneuve, C. (1993). Thermal Storage by Latent
Heat: A Viable Option for Energy Conservation in Buildings. Energy Sources, 15(1),
85-93.
Parks, G. S., West, T. J., Naylor, B. F., Fujii, P. S., & McClaine, L. A. (1946).
Thermal Data on Organic Compounds. XXIII. Modern Combustion Data for Fourteen
Hydrocarbons and Five Polyhydroxy Alcohols. Journal of the American Chemical
Society, 68(12), 2524-2527.
Pasquini, C. (2003). Near Infrared Spectroscopy: fundamentals, practical aspects
and analytical applications. Journal of the Brazilian Chemical Society, 14, 198-219.
Pasupathy, A., Velraj, R., & Seeniraj, R. V. (2008). Phase change material-based
building architecture for thermal management in residential and commercial
establishments. Renewable and Sustainable Energy Reviews, 12(1), 39-64.
Pielichowska, K., & Pielichowski, K. (2014). Phase change materials for thermal
energy storage. Progress in Materials Science, 65, 67-123.
Qiu, X., Li, W., Song, G., Chu, X., & Tang, G. (2012). Microencapsulated n-
octadecane with different methylmethacrylate-based copolymer shells as phase change
materials for thermal energy storage. Energy, 46(1), 188-199.
Univers
ity of
Mala
ya

137
Rady, M. (2009). Study of phase changing characteristics of granular composites
using differential scanning calorimetry. Energy Conversion and Management, 50(5),
1210-1217.
Regin, A. F., Solanki, S. C., & Saini, J. S. (2008). Heat transfer characteristics of
thermal energy storage system using PCM capsules: A review. Renewable and
Sustainable Energy Reviews, 12(9), 2438-2458.
Roy, S. K., & Sengupta, S. (1991). An evaluation of phase change microcapsules
for use in enhanced heat transfer fluids. International Communications in Heat and
Mass Transfer, 18(4), 495-507.
Rozanna, D., Chuah, T. G., Salmiah, A., Choong, T. S. Y., & Sa'ari, M. (2005).
Fatty Acids as Phase Change Materials (PCMs) for Thermal Energy Storage: A Review.
International Journal of Green Energy, 1(4), 495-513.
Rudd, A. F. (1993). Phase-change material wallboard for distributed thermal
storage in buildings. Proceedings of ASHRAE Transactions (pp. 339-346).
Salunkhe, P. B., & Shembekar, P. S. (2012). A review on effect of phase change
material encapsulation on the thermal performance of a system. Renewable and
Sustainable Energy Reviews, 16(8), 5603-5616.
Samiey, B., Cheng, C.-H., & Wu, J. (2014). Organic-Inorganic Hybrid Polymers
as Adsorbents for Removal of Heavy Metal Ions from Solutions: A Review. Materials,
7(2), 673.
Sánchez, L., Sánchez, P., Carmona, M., de Lucas, A., & Rodríguez, J. (2008).
Influence of operation conditions on the microencapsulation of PCMs by means of
suspension-like polymerization. Colloid and Polymer Science, 286(8-9), 1019-1027.
Sarı, A., Alkan, C., Karaipekli, A., & Uzun, O. (2009a). Microencapsulated n-
octacosane as phase change material for thermal energy storage. Solar Energy, 83(10),
1757-1763.
Sarı, A., Biçer, A., & Karaipekli, A. (2009b). Synthesis, characterization,
thermal properties of a series of stearic acid esters as novel solid–liquid phase change
materials. Materials Letters, 63(13–14), 1213-1216.
Sari, A., & Kaygusuz, K. (2002). Thermal performance of palmitic acid as a
phase change energy storage material. Energy Conversion and Management, 43(6),
863-876.
Sarier, N., & Onder, E. (2007). The manufacture of microencapsulated phase
change materials suitable for the design of thermally enhanced fabrics. Thermochimica
Acta, 452(2), 149-160.
Univers
ity of
Mala
ya
138
Sharma, A., Tyagi, V. V., Chen, C. R., & Buddhi, D. (2009). Review on thermal
energy storage with phase change materials and applications. Renewable and
Sustainable Energy Reviews, 13(2), 318-345.
Sharma, S. D., & Sagara, K. (2005). Latent Heat Storage Materials and Systems:
A Review. International Journal of Green Energy, 2(1), 1-56.
Shin, Y., Yoo, D.-I., & Son, K. (2005). Development of thermoregulating textile
materials with microencapsulated phase change materials (PCM). IV. Performance
properties and hand of fabrics treated with PCM microcapsules. Journal of Applied
Polymer Science, 97(3), 910-915.
Siahpush, A., O’Brien, J., & Crepeau, J. (2008). Phase Change Heat Transfer
Enhancement Using Copper Porous Foam. Journal of Heat Transfer, 130(8), 082301-
082301.
Solomon, G. R., Karthikeyan, S., & Velraj, R. (2013). Sub cooling of PCM due
to various effects during solidification in a vertical concentric tube thermal storage unit.
Applied Thermal Engineering, 52(2), 505-511.
Song, X., Jiang, N., Li, Y., Xu, D., & Qiu, G. (2008). Synthesis of CeO2-coated
SiO2 nanoparticle and dispersion stability of its suspension. Materials Chemistry and
Physics, 110(1), 128-135.
Sorensen, B. (2015). Solar Energy Storage: Elsevier Science.
Stritih, U., & Butala, V. (2010). Experimental investigation of energy saving in
buildings with PCM cold storage. International Journal of Refrigeration, 33(8), 1676-
1683.
Su, J.-F., Wang, L.-X., & Ren, L. (2005). Preparation and characterization of
double-MF shell microPCMs used in building materials. Journal of Applied Polymer
Science, 97(5), 1755-1762.
Su, W., Darkwa, J., & Kokogiannakis, G. (2015). Review of solid–liquid phase
change materials and their encapsulation technologies. Renewable and Sustainable
Energy Reviews, 48(0), 373-391.
Sun, G., & Zhang, Z. (2002). Mechanical strength of microcapsules made of
different wall materials. International Journal of Pharmaceutics, 242(1–2), 307-311.
Tang, B., Wu, C., Qiu, M., Zhang, X., & Zhang, S. (2014). PEG/SiO2–Al2O3
hybrid form-stable phase change materials with enhanced thermal conductivity.
Materials Chemistry and Physics, 144(1–2), 162-167.
Tatsidjodoung, P., Le Pierrès, N., & Luo, L. (2013). A review of potential
materials for thermal energy storage in building applications. Renewable and
Sustainable Energy Reviews, 18, 327-349.
Univers
ity of
Mala
ya

139
Tredwin, C. J., Georgiou, G., Kim, H.-W., & Knowles, J. C. (2013).
Hydroxyapatite, fluor-hydroxyapatite and fluorapatite produced via the sol–gel method:
Bonding to titanium and scanning electron microscopy. Dental Materials, 29(5), 521-
529.
Tseng, Y. H., Fang, M. H., Tsai, P. S., & Yang, Y. M. (2005). Preparation of
microencapsulated phase-change materials (MCPCMs) by means of interfacial
polycondensation. J Microencapsul, 22(1), 37-46.
Tumirah, K., Hussein, M. Z., Zulkarnain, Z., & Rafeadah, R. (2014). Nano-
encapsulated organic phase change material based on copolymer nanocomposites for
thermal energy storage. Energy, 66, 881-890.
Tyagi, V. V., Buddhi, D., Kothari, R., & Tyagi, S. K. (2012). Phase change
material (PCM) based thermal management system for cool energy storage application
in building: An experimental study. Energy and Buildings, 51(0), 248-254.
Verdonck, E., Schaap, K., & Thomas, L. C. (1999). A discussion of the
principles and applications of Modulated Temperature DSC (MTDSC). Int J Pharm,
192(1), 3-20.
Vinogradov, V., Vinogradov, A., Kraev, A., Agafonov, A., & Kessler, V. (2013).
Sol–gel synthesis, characterization and catalytic activity of γ-alumina with bimodal
mesopore distribution. Journal of Sol-Gel Science and Technology, 68(2), 155-161.
Vinogradov, V. V., Agafonov, A. V., Vinogradov, A. V., Gulyaeva, T. I.,
Drozdov, V. A., & Likholobov, V. A. (2010). Sol–gel synthesis, characterization and
catalytic activity of mesoporous γ-alumina prepared from boehmite sol by different
methods. Journal of Sol-Gel Science and Technology, 56(3), 333-339.
Wang, X., Niu, J., Li, Y., Wang, X., Chen, B., Zeng, R., Song, Q., & Zhang, Y.
(2007). Flow and heat transfer behaviors of phase change material slurries in a
horizontal circular tube. International Journal of Heat and Mass Transfer, 50(13–14),
2480-2491.
Waqas, A., & Kumar, S. (2012). Phase Change Material (Pcm)-Based Solar Air
Heating System For Residential Space Heating In Winter. International Journal of
Green Energy, 10(4), 402-426.
Wefers, K., & Misra, C. (1987). Oxides and Hydroxides of Aluminum: Alcoa
Research Laboratories.
Wen, D., & Ding, Y. (2004). Experimental investigation into convective heat
transfer of nanofluids at the entrance region under laminar flow conditions.
International Journal of Heat and Mass Transfer, 47(24), 5181-5188.
Will, G. (2006). Powder Diffraction: The Rietveld Method and the Two Stage
Method to Determine and Refine Crystal Structures from Powder Diffraction Data:
Springer.
Univers
ity of
Mala
ya
140
Yamagishi, Y., Takeuchi, H., Pyatenko, A. T., & Kayukawa, N. (1999).
Characteristics of microencapsulated PCM slurry as a heat-transfer fluid. American
Institute of Chemical Engineers. AIChE Journal, 45(4), 696.
Yinping, Z., & Yi, J. (1999). A simple method, the-history method, of
determining the heat of fusion, specific heat and thermal conductivity of phase-change
materials. Measurement Science and Technology, 10(3), 201.
Yoldas, B. (1975). Alumina sol preparation from alkoxides. Am Ceram Soc Bull,
54, 289-290.
Zalba, B., Marı́n, J. M., Cabeza, L. F., & Mehling, H. (2003). Review on thermal
energy storage with phase change: materials, heat transfer analysis and applications.
Applied Thermal Engineering, 23(3), 251-283.
Zhang, H., & Wang, X. (2009). Synthesis and properties of microencapsulated n-
octadecane with polyurea shells containing different soft segments for heat energy
storage and thermal regulation. Solar Energy Materials and Solar Cells, 93(8), 1366-
1376.
Zhang, L., Zhu, J., Zhou, W., Wang, J., & Wang, Y. (2012). Thermal and
electrical conductivity enhancement of graphite nanoplatelets on form-stable
polyethylene glycol/polymethyl methacrylate composite phase change materials.
Energy, 39(1), 294-302.
Zhang, M.-L., Ding, L.-G., Jing, X.-Y., & Hou, X.-Q. (2004a). Preparation,
modification and application of nanoscale SiO_2 [J]. Applied Science and Technology,
6, 023.
Zhang, P., Ma, Z. W., & Wang, R. Z. (2010). An overview of phase change
material slurries: MPCS and CHS. Renewable and Sustainable Energy Reviews, 14(2),
598-614.
Zhang, S., & Lee, W. E. (2003). Improving the water-wettability and oxidation
resistance of graphite using Al2O3/SiO2 sol-gel coatings. Journal of the European
Ceramic Society, 23(8), 1215-1221.
Zhang, X. X., Fan, Y. F., Tao, X. M., & Yick, K. L. (2004b). Fabrication and
properties of microcapsules and nanocapsules containing n-octadecane. Materials
Chemistry and Physics, 88(2–3), 300-307.
Zhang, Y., Wang, S., Rao, Z., & Xie, J. (2011). Experiment on heat storage
characteristic of microencapsulated phase change material slurry. Solar Energy
Materials and Solar Cells, 95(10), 2726-2733.
Zhao, C. Y., & Zhang, G. H. (2011). Review on microencapsulated phase change
materials (MEPCMs): Fabrication, characterization and applications. Renewable and
Sustainable Energy Reviews, 15(8), 3813-3832.
Univers
ity of
Mala
ya

141
Zheng, Y., Zhao, W., Sabol, J. C., Tuzla, K., Neti, S., Oztekin, A., & Chen, J. C.
(2013). Encapsulated phase change materials for energy storage – Characterization by
calorimetry. Solar Energy, 87(0), 117-126.
Zhou, D., & Zhao, C. Y. (2011). Experimental investigations on heat transfer in
phase change materials (PCMs) embedded in porous materials. Applied Thermal
Engineering, 31(5), 970-977.
Zhou, D., Zhao, C. Y., & Tian, Y. (2012). Review on thermal energy storage
with phase change materials (PCMs) in building applications. Applied Energy, 92(0),
593-605.
Zhou, W., Apkarian, R., Wang, Z., & Joy, D. (2007). Fundamentals of Scanning
Electron Microscopy (SEM). In: W. Zhou & Z. Wang (Eds.), Scanning Microscopy for
Nanotechnology (pp. 1-40): Springer New York.
Univers
ity of
Mala
ya