
cfotalks.com · 2019-05-29 · Nomura | Asia Economic Monthly 10 May 2019 Forecast table Research...
77
Nomura | Asia Economic Monthly 10 May 2019 Research analysts Asia Economics Rob Subbaraman - NSL [email protected] +65 6433 6548 Ting Lu - NIHK [email protected] +852 2252 1306 Sonal Varma - NSL [email protected] +65 6433 6527 Euben Paracuelles - NSL [email protected] +65 6433 6956 What do you think? Results from our last survey Where is Asia headed over the next three months? 46.2% 28.2% 25.6% UP: Economic recovery and market rally DOWN: Weak economies and markets correct FLAT: Weak economies amid buoyand assets Forecast table 2 Asia letter 3 Trade tensions threaten Asia’s dawn 3 Asia views 5 US/China: Trade tensions escalate 5 China monthly: Beijing can’t afford to stop easing yet, as double… 13 China: The Politburo turns more cautious, but it cannot afford to… 15 China: The NDRC plans a new round of consumption stimulus 17 China’s delicate policy balancing act 21 India Election Watch #8: In opinion polls we somewhat trust 24 India: Global headwinds, Indian sails 28 Korea: April data for exports and inflation suggest weak… 36 Malaysia: BNM kickstarts monetary easing in ASEAN 38 Philippines: One-notch upgrade by S&P to BBB+ 39 Indonesia: A clear win for Jokowi 41 Thailand: Gauging the drought impact 44 What if oil prices keep rising? 48 Chart alerts 51 Asia stockpiles look larger than in 2015-16 51 Nomura’s leading index of Asian exports 51 China: Excavator operating hours improved in March 52 India: Glass half empty on GST collections 52 India’s two-speed manufacturing cycle 53 India: Core matter 53 Philippines: Slowing money supply growth… 54 Philippines: The president's popularity rebounds further ahead of… 54 Thailand: Condominium price index growth fell sharply in Q1 55 Thailand: Evidence of further slowdown in tourism 55 Calendar 56 The month ahead 56 Outlooks 2019-20 57 Australia: Underwhelming; RBA to cut 57 China: A full recovery yet to come 58 India: All eyes on the election verdict 59 Indonesia: A clear Jokowi win 60 Japan: Signs of stabilization 61 Malaysia: BNM kick-starts monetary easing 62 Philippines: Temporary fiscal tightening 63 Singapore: A dovish turn 64 South Korea: A negative shadow on exports 65 Thailand: Political risks weigh on growth 66 Asia in charts 67 Recent articles 74 Asia Economic Monthly ECONOMICS Trade tensions threaten Asia’s dawn The outcome of US-China trade negotiations will determine Asia’s path ahead. Global Markets Research 10 May 2019 See Appendix A-1 for analyst certification, important disclosures and the status of non-US analysts. Visit Nomura Connects for our global thought leadership. Please participate in our anonymous real-time survey. Click an option below to see a current tally of results. If the US hikes tariffs, how will China respond? • Tariff hikes • Allow RMB depreciation • Sell US Treasurys • Boycott US products Production Complete: 2019-05-09 22:54 UTC
Transcript of cfotalks.com · 2019-05-29 · Nomura | Asia Economic Monthly 10 May 2019 Forecast table Research...

Nomura | Asia Economic Monthly 10 May 2019
Research analysts
Asia Economics
Rob Subbaraman - NSL [email protected] +65 6433 6548
Ting Lu - NIHK [email protected] +852 2252 1306
Sonal Varma - NSL [email protected] +65 6433 6527
Euben Paracuelles - NSL [email protected] +65 6433 6956
What do you think?
Results from our last survey
Where is Asia headed over the next
three months?
46.2%
28.2%
25.6%
UP: Economic recovery and market rally
DOWN: Weak economies and markets correct
FLAT: Weak economies amid buoyand assets
Forecast table 2 Asia letter 3
Trade tensions threaten Asia’s dawn 3
Asia views 5 US/China: Trade tensions escalate 5 China monthly: Beijing can’t afford to stop easing yet, as double… 13 China: The Politburo turns more cautious, but it cannot afford to… 15 China: The NDRC plans a new round of consumption stimulus 17 China’s delicate policy balancing act 21 India Election Watch #8: In opinion polls we somewhat trust 24 India: Global headwinds, Indian sails 28 Korea: April data for exports and inflation suggest weak… 36 Malaysia: BNM kickstarts monetary easing in ASEAN 38 Philippines: One-notch upgrade by S&P to BBB+ 39 Indonesia: A clear win for Jokowi 41 Thailand: Gauging the drought impact 44 What if oil prices keep rising? 48
Chart alerts 51 Asia stockpiles look larger than in 2015-16 51 Nomura’s leading index of Asian exports 51 China: Excavator operating hours improved in March 52 India: Glass half empty on GST collections 52 India’s two-speed manufacturing cycle 53 India: Core matter 53 Philippines: Slowing money supply growth… 54 Philippines: The president's popularity rebounds further ahead of… 54 Thailand: Condominium price index growth fell sharply in Q1 55 Thailand: Evidence of further slowdown in tourism 55
Calendar 56 The month ahead 56
Outlooks 2019-20 57 Australia: Underwhelming; RBA to cut 57 China: A full recovery yet to come 58 India: All eyes on the election verdict 59 Indonesia: A clear Jokowi win 60 Japan: Signs of stabilization 61 Malaysia: BNM kick-starts monetary easing 62 Philippines: Temporary fiscal tightening 63 Singapore: A dovish turn 64 South Korea: A negative shadow on exports 65 Thailand: Political risks weigh on growth 66
Asia in charts 67 Recent articles 74
Asia Economic Monthly
ECONOMICS
Trade tensions threaten Asia’s dawn
The outcome of US-China trade negotiations will determine Asia’s path ahead.
Global Markets Research
10 May 2019
See Appendix A-1 for analyst certification, important disclosures and the status of non-US analysts.
Visit Nomura Connects for our global
thought leadership.
Please participate in our anonymous
real-time survey. Click an option below
to see a current tally of results.
If the US hikes tariffs, how will China
respond?
• Tariff hikes
• Allow RMB depreciation
• Sell US Treasurys
• Boycott US products
Production Complete: 2019-05-09 22:54 UTC

Nomura | Asia Economic Monthly 10 May 2019
2
Forecast table
Fig. 1: Forecast table
2018 2019 2020 2018 2019 2020
Japan 0.8 0.1 0.6 1.0 0.6 0.6
Australia 2.8 2.1 ↓ 2.0 2.6 1.9 1.6 ↑ 1.7 2.0
China 6.6 6.0 ↑ 6.1 6.0 2.1 2.5 2.3
Hong Kong 3.0 2.7 3.0 2.4 2.4 2.5
India 7.4 6.6 7.1 3.9 3.1 4.1
Indonesia 5.2 5.4 5.7 3.2 2.9 3.3
Malaysia 4.7 4.0 4.2 1.0 0.5 1.3
Philippines 6.2 6.8 6.6 5.2 3.0 ↓ 2.9 3.1
Singapore 3.2 2.5 2.2 0.4 0.3 0.5
South Korea 2.7 2.4 ↓ 1.8 2.1 1.5 0.8 1.4
Taiwan 2.6 2.5 2.5 1.3 1.1 1.2
Thailand 4.1 3.4 3.0 1.1 0.7 1.0
Asia ex-Japan, Aus. 6.2 5.6 ↑ 5.7 5.8 2.5 2.4 2.6 ↑ 2.7
Asia 5.5 5.0 5.2 2.4 2.2 2.4
2018 2019 2020 2018 2019 2020
Japan 3.5 2.8 2.8 -6.6 -6.7 -6.7
Australia -2.2 -2.1 -2.4 -0.4 0.1 0.4
China 0.4 -0.1 -0.2 -4.2 -4.0 -4.0
Hong Kong 4.3 3.2 3.4 2.0 1.3 1.6
India -2.4 -1.9 -2.2 -3.4 -3.4 -3.2
Indonesia -3.0 -2.7 -2.6 -1.8 -2.1 -2.5
Malaysia 2.3 2.0 2.0 -3.7 -3.7 -3.4
Philippines -2.4 -2.9 -3.1 -3.2 -3.3 -3.2
Singapore 17.7 15.8 14.6 0.4 -0.7 -1.0
South Korea 4.7 4.5 ↑ 4.9 4.0 ↑ 4.3 1.7 0.6 0.0
Taiwan 11.5 11.4 10.7 -1.9 -1.9 -1.9
Thailand 6.9 5.9 6.0 -2.4 -2.6 -3.0
Asia ex-Japan, Aus. 0.4 0.2 0.0 -3.3 -3.3 -3.3
Asia 0.7 0.4 0.2 -3.6 -3.6 -3.6
2018 2019 2020 2018 2019 2020
Japan -0.10 -0.10 -0.10 109.7 115.0 112.0
Australia 1.50 1.00 1.00 0.70 0.71 0.70
China 2.55 2.55 2.55 6.88 6.90 7.25
Hong Kong 7.83 7.83 7.80
India 6.50 5.75 5.75 69.8 67.5 67.0
Indonesia 6.00 6.00 ↓ 5.50 5.00 14481 13600 12700
Malaysia 3.25 3.00 3.00 4.14 4.08 4.00
Philippines 4.75 4.25 4.25 52.6 52.5 51.5
Singapore 1.89 1.90 1.90 1.36 1.33 1.30
South Korea 1.75 1.50 1.25 1111 1100 1060
Taiwan 30.5 30.3 29.2
Thailand 1.75 1.75 1.75 32.4 31.3 30.2
Official Policy Rate Currency per US Dollar
Note: All figures relate to the modal forecast, ie, the "most likely" outcome. The policy rate for Singapore refers to the 3-month SIBOR, for China the
7-day reverse repo rate. Fiscal balances are for the central government and do not include off-budget. They are calculated for fiscal years for India
(Apr-Mar), Singapore (Apr-Mar) and Thailand (Oct-Sep). Bolded values are actual. Forecasts for Hong Kong and Taiwan's real gdp, consumer
prices, current account, and fiscal balance are from the IMF World Economic Outlook, and fiscal balance for them refers to the general government
balance. Source: IMF, CEIC, Bloomberg, Nomura.
Real GDP Consumer Prices
Current Account (% of GDP) Fiscal Balance (% of GDP)

Nomura | Asia Economic Monthly 10 May 2019
3
Asia Economics
Sonal Varma - NSL [email protected] +65 6433 6527
Rob Subbaraman - NSL [email protected] +65 6433 6548
Michael Loo - NSL [email protected] +65 6433 6296
Asia letter
Trade tensions threaten Asia’s dawn If trade tensions fade quickly, then our base case of Asia’s ‘dawn’ is within reach; else,
expect a prolonged slowdown and frontloaded policy easing across the region.
The recent escalation of US-China trade tensions come at a time when Asian economies
are weakening and business confidence is fragile. Weak global capex, the slump in the
tech cycle and sluggish China demand have already sapped growth. In our base case,
Q2 will mark the trough and a ‘dawn’ will emerge in H2 2019 and into 2020, as Asian
economies recover with support from China stimulus, easier financial conditions and an
upturn in the tech cycle. A trade shock at this vulnerable moment could derail this scenario.
Why Asia is more vulnerable
An escalation of US-China trade tensions is more damaging for Asia’s export-oriented
economies than for China itself, because many of the smaller Asian economies are big
suppliers of high value-added parts and components to China, which are then
assembled and re-exported, with the US being the largest final destination. We find that
six of the top ten largest contributors of value-added to China’s exports are Asian (see
The impact of US trade protectionism, centring on China, 23 March 2017).
Trade tensions can hurt Asia through direct and indirect channels. Directly, they disrupt
the supply chain and weaken exports. Indirectly, the high policy uncertainty hurts
business confidence and results in companies delaying investment and cutting jobs.
Tighter financial conditions can accentuate the weakness in investment demand.
Two points are worth highlighting: (1) China’s growth is more vulnerable than US growth;
and (2) the indirect effects can dominate the direct effects. For instance, in a scenario of
mutual 25% tariffs on all US and Chinese exports, a 25% tariff on all US imported cars,
and including second-round effects on investment, the IMF’s model estimates a loss of
0.8% in world GDP, 1.6% in China’s GDP and 0.9% for the US, relative to baseline.
Four possible scenarios
The outcome of US-China trade negotiations, therefore, is critical in determining where
Asia is headed. As outlined in US/China: Trade tensions escalate, we present four
possible scenarios (Figure 1).
Fig. 2: US-China trade negotiation scenarios and their likely impact on Asia ex-Japan’s economic outlook
Note: Black = Positive/higher impact; Grey = Neutral; Red = Negative/lower. Source: Nomura Global Economics estimates.
Scenario 1: Deal reached – 10% probability
In this best-case scenario, even though Asian growth would remain weak in Q2, reduced
policy uncertainty, China stimulus and a major easing in financial conditions should set
the stage for both exports and the investment cycle to gradually recover in H2 2019 and
into 2020. Given benign inflation, we still expect policy easing. We currently expect rate
cuts in India (25bp in Q3), Indonesia (50bp in Q4 and 50bp in 2020), Philippines (50bp in
H2) and South Korea (25bp in Q4 and 25bp in 2020).
Scenario 2: Negotiations continue without new tariffs – 40% probability
This scenario is closer to our current base case for Asia’s economic outlook. Prevailing
policy uncertainty could delay investment until a deal is finalised in the next few
weeks/months. However, with no implementation of additional tariffs and easier financial
conditions after a deal, we would expect Asia’s growth to pick up around mid-Q3 and into
Direct
Trade
channel
Policy
uncertainty
Financial
conditions
Confidence
channel
Monetary/
fiscal policy
(vs. baseline)
Commodity
prices
Successful deal
10% No No
Positive for exports and investment. Growth to bottom in Q2;
recovery in H2 and 2020. Policy easing as per our baseline.
Asia to attract large capital inflows.
Continued
negotiation; no
retaliation
40% No No
Uncertainty to continue for a few weeks/months, but no
retaliation a positive. Growth bottoming out process to last
longer with a recovery from mid-Q3 onwards. Policy easing as
per our baseline
Delayed negotiation;
retaliation45% Yes No
Tit-for-tat retaliation to delay exports/investment recovery.
Slowdown to extend to Q3 and recovery likely only from Q4
2019 onwards. Frontloaded rate cuts likely
Deal breakdown 5% Yes Yes
Risk of consumption slowdown, on top of investment/export
slowdown. No recovery in 2019. Rate cuts to be larger in
quantum and also frontloaded. Fiscal easing, where possible.
Recovery in 2020.
Indirect Positive offsets
CommentProbability
Trade negotiation
scenarios
(Best to worse)
Will tariffs on
USD200bn be
increased
from 10% to
Will new tariffs
on USD325bn of
imports be
proposed?

Nomura | Asia Economic Monthly 10 May 2019
4
2020, setting the stage for the region to attract large capital inflows as the growth
differentials widen in its favour.
Scenario 3: New tariffs go into effect but negotiations continue – 45% probability
Initial tit-for-tat retaliation will amplify the indirect effects and extend the ongoing slump in
exports and investment into Q3. Policy uncertainty is already at a record high and bodes
poorly for investment (Figure 2). However, weaker-than-expected growth should result in
front-loaded rate cuts across Asia (versus our current baseline) which, along with
sustained easing from China, lower commodity prices and an eventual conclusion of a
trade deal will likely support an economic recovery from Q4 2019 onwards.
Scenario 4: Negotiations completely break down – 5% probability
In the worst case scenario of a deal breakdown and ongoing tit-for-tat retaliation, Asia’s
current growth slowdown would likely deepen through end-2019. Beyond the hit to
investment and exports, a bigger risk is the slowdown spills over into consumption
demand, due to lower consumer confidence and job cuts. China will step up its easing
measures and policymakers across Asia will respond with bigger stimulus in an attempt to
offset the major tightening in financial conditions. Rate cuts are likely to be both frontloaded
and larger in size than our base case. The significant easing in fiscal and monetary policies
should support a recovery in Asian export growth, but only in 2020 (Figure 3).
Winners versus losers
Nobody wins in a trade war, but trade tensions can result in more differentiation.
• Most exposed: Countries with a higher value-added component in China’s exports are
more vulnerable: Taiwan (6.3% of its GDP), Malaysia (4.1%), Korea and Hong Kong
(3.2%) and Singapore (3.1%) stand out.
• Import substitution relative winners: If companies decide to substitute production
away from China, then Malaysia would stands out as the biggest beneficiary from
import substitution, followed by Japan, Pakistan, Thailand and the Philippines (see A
US-Sino trade war is not all lose-lose: We assess the potential beneficiaries in Asia, 20
November 2018).
• Production relocation relative winners: If MNCs decide to relocate production and
FDI away from China, then we estimate that the biggest medium-term beneficiaries
would be Vietnam, followed by Malaysia, Singapore and India.
Fig. 3: Policy uncertainty and investment growth
Note: AEJ ex-China GFCF refers to the real gross fixed capital formation of Hong Kong, India, Indonesia, Malaysia, Philippines, Singapore, Korea, Taiwan and Thailand, weighted by each country’s 2018 nominal GDP. The global policy uncertainty index is published by Economic Policy Uncertainty, and is a GDP-weighted average of 20 nations’ national uncertainty indices calculating the relative frequency of news articles containing terms pertaining to economy, policy and uncertainty. See www.policyuncertainty.com. Source: Economic Policy Uncertainty, CEIC and Nomura Global Economics.
Fig. 4: China’s credit impulse versus Asian export growth
Note: China’s credit impulse is calculated by taking the 12-month change in the ratio of the 12-month change in outstanding augmented aggregate financing to the 4-quarter rolling sum of nominal GDP, after augmenting official aggregate financing outstanding by including the outstanding value of local government bonds, asset backed securities and loan writeoff. Asia ex-Japan’s exports are the aggregate exports of China, India, Indonesia, Malaysia, Philippines, Korea, Taiwan, Thailand; domestic exports of Hong Kong, and non-oil domestic exports of Singapore. Source: CEIC and Nomura Global Economics.
20
70
120
170
220
270-15
-9
-3
3
9
15
Mar-99 Mar-03 Mar-07 Mar-11 Mar-15 Mar-19
Index, 3mma% y-o-y AEJ ex-China GFCF, lhs
Global policy uncertainty (axis reversed), rhs
Higher uncertainty
-15
-10
-5
0
5
10
15
20
25
-30
-20
-10
0
10
20
30
40
50
Apr-05 Oct-08 Apr-12 Oct-15 Apr-19
% y-o-y, 3mmaPercentage points
Asia ex-Japan's exports (lagged 6 months), rhs
China's credit impulse, lhs

Nomura | Asia Economic Monthly 10 May 2019
North America Economics
Lewis Alexander - NSI [email protected] +1 212 667 9665
Aichi Amemiya - NSI [email protected] +1 212 667 9347
Robert Dent - NSI [email protected] +1 212 667 9514
Kenny Lee - NSI [email protected] +1 212 436 8146
Asia Economics
Ting Lu - NIHK [email protected] +852 2252 1306
Lisheng Wang - NIHK [email protected] +852 2252 2057
Jing Wang - NIHK [email protected] +852 2252 1011
Global FX Strategy
Craig Chan - NSL [email protected] +65 6433 6106
Wee Choon Teo - NSL [email protected] +65 6433 6107
Dushyant Padmanabhan - NSL [email protected] +65 6433 6526
Asia views
US/China: Trade tensions escalate
Assessing scenarios, economic impacts and FX strategy.
President Trump’s sudden shift in tone highlights trade risk in 2019
Over the weekend, in an abrupt departure from recent rhetoric, President Trump
threatened to raise the current tariff rate on roughly $200bn of imports from China from
10% to 25% on Friday and to apply a 25% tariff to another $325bn of imports “shortly”.
Late on Monday, USTR Lighthizer and Treasury Secretary Mnuchin confirmed that the
US is planning to impose additional tariffs on China later this week.
Chinese Vice Premier Liu He will travel to Washington on Thursday for another round of
talks that are scheduled to run through Friday.
This sudden shift highlights the continued threat that US protectionism poses to the
global economy despite the recent lull in aggressive action from the Trump
administration (see Implications from the Trump-Xi Meeting: We’ve only just begun, 2
December 2018). Trump’s pivot over the weekend likely reflects a number of factors,
including a pickup in Q1 real GDP growth, an improvement in financial markets and
strong bipartisan support in Congress. A similar dynamic may be at work for President
Xi. China’s economy is showing nascent signs of recovery, which may have encouraged
the Chinese government to take a tougher stance in its negotiations with the US.
US-China negotiations, while making progress, have slowed in recent weeks and press
reports suggest that some US negotiators view recent proposals from China as backing
away from previous commitments. Trump’s aggressive stance makes it costly, in
domestic political terms, for President Xi to offer quick concessions. The fact that
Lighthizer and Mnuchin have set a tight deadline may make it difficult to avoid another
round of US tariff increases, even if the US and China can find a way to keep talking and
ultimately reach an agreement. On the other hand, both sides are no doubt cognizant of
the high stakes of not bringing negotiations back on track. President Trump’s threatened
tariff hike, worth USD30bn (0.15xUSD200bn) would be the largest so far, and at a time
when business sentiment is fragile. Finally, the sudden turn in events over the weekend
also underscores the domestic political pressure facing both Trump and Xi.
Scenario analysis
Figure 5 lays out four possible scenarios for how US-China trade negotiations could play
out from here. We believe that there is an essentially equal likelihood that either the
Trump administration raises the tariffs on $200bn by 15pp at 12:01am EDT on Friday or
they back down after managing to quickly get back on track during the negotiations on
Thursday, consistent with the considerable uncertainty around a fluid situation.
Scenario 1: Deal reached – 10%
It is possible that the US and China will be able to reach agreement on the key elements
of a comprehensive trade deal this week. Given all of the previous negotiations this
certainly seemed possible before Trump’s tweets on Sunday. That said, this outcome
would require either the US or China to back down in a significant and very public way.
That does not seem likely in such a short period of time.
Scenario 2: Negotiations continue without new tariffs – 40%
If the negotiations make significant progress this week, it is possible that President
Trump will postpone the imposition of any new tariffs as final negotiations continue, with
the aim of both presidents signing a deal late this month or next. This is only likely if the
two sides can get very close to a deal. Again, given the preparation to date, this seems
possible, and a little extra time could reduce the negative domestic political
consequences of the concessions on both sides that will be necessary to reach an
agreement. So this seems significantly more likely that a quick agreement.
Scenario 3: New tariffs go into effect but negotiations continue – 45%
At this point, we think that both the Trump administration and the Chinese government
will have a hard timing backing down from the negotiating positions they have laid out in
the last few days. Given the solid bipartisan support Trump has received for his “tough”

Nomura | Asia Economic Monthly 10 May 2019
6
stance in these negotiations, it will be hard for Trump to back down without major
concessions from China. But Xi will not want to be seen as giving in to foreign pressure.
Consequently, we think it is likely that the Trump administration will raise tariffs by 15pp
on $200bn of US imports from China on Friday. In this case, we expect China to
implement a proportionate response essentially immediately. There is a possibility that
the Trump administration partially follows through on its threat, raising tariffs on the
USD200bn but not by the full 15pp.
That said, we believe that both sides will want to continue negotiations. The two sides
may step back for a short time but, as the negative impacts on financial markets and the
economies become more clear, we think they will have a strong incentive to keep talking
and ultimately reach an agreement. We think this is the most likely outcome.
Scenario 4: Negotiations completely break down – 5%
If the Trump administration imposes new tariffs, and China responds, it is possible that
there could be a more substantial breach. The Trump administration could start the
process of expanding US tariffs to cover essentially all US imports from China, as Trump
threatened in his tweets last Sunday. China could decide that it is not worth negotiating
with the Trump administration. This would be the most disruptive outcome to which we
assign the lowest probability.
Fig. 5: Alternative scenarios for US-China trade negotiations
Source: Nomura
Implications for the US outlook
Trump’s threat is likely an effort to gain leverage, but a quick response from China
resulting in a deal this week seems unlikely. At this point, we do not expect China to offer
material concessions before the Friday deadline for raising tariffs. It seems likely that
Trump will have to choose between imposing the tariffs he proposed or backing down.
Incoming data have strengthened in the US. US real GDP grew 3.2% q-o-q saar in Q1
and the labor market has remained solid (see Q1 GDP Growth Surprises to the Upside,
26 April 2019 and April Employment Recap, 3 May 2019). In addition, financial
conditions have eased substantially since early January. Trump’s inclination to pursue an
aggressive trade agenda has always depended on the strength of the domestic economy
and financial markets. Trump has tended to announce new tariffs during periods of
strong US growth (Figure 6).
Despite the upside surprise in Q1, US economic growth has slowed since mid-2018 and
increased business uncertainty around US trade policy, via weaker business investment,
likely contributed to some of the deceleration. Several analyses suggests that, if the
US-China trade negotiation outcome Most positive for Growth Most Negative for Growth
Scenario: 1 2 3 4
Successful deal Negotiations continue Negotiations continue Breakdown
Will a deal be announced this week? Deal No deal No deal No deal
Do negotiations continue? Concluded Yes Temporary delay Prolonged delay
Will tariffs on USD200bn be increased from
10% to 25%?No No Yes Yes
Will new tariffs on USD325bn of imports be
proposed?No No No Yes
China retaliation? No NoModerate, proportional to 15pp
US tariff hike
Strong, proportional to 15pp US
hike and 25% on $325bn
Will there be any indications of partial
suspension of exisiting tariffs?Yes No No No
Comments
It will be difficult for China to
make the concessions
necessary to reach a deal this
week.
If they make progress this week
and and are close to a deal
Trump may delay tariff
increases while negotiations
continue.
Without substantial progress
we expect tariffs on $200bn to
go up from 10% to 25%. We
expect China to respond to the
increase in tariffs but we think
both sides will want talks to
continue. The US could soften
its action by raising tariffs less
than 15pp.
If there is little prospect of
progress both side may accept
a suspension of talks. In this
case Trump could widen the
tariff increase beyond the
$200bn which would result in
stronger retaliation from China.
Probability 10% 40% 45% 5%

Nomura | Asia Economic Monthly 10 May 2019
7
current negotiations with China, or any of other the major trade developments highlighted
above, break down, the direct impact on the economy would likely be noticeable but not
overwhelming (see Incorporating Additional Trade Uncertainty into our Outlook, 19
August 2018 and Figure 11, “Estimated economic implications,” US Trade Policy
Monitor, 18 August 2018). Such developments would, however, heighten uncertainty
substantially, would would likely drag on business confidence and investment. Moreover,
financial conditions are likely to tighten in response. The deterioration in equity markets
since Trump’s tweet over the weekend highlights that vulnerability.
Trump’s actions also highlight the risk around a number of other trade policy challenges
including: (1) USMCA ratification and (2) ongoing negotiations with the EU and Japan.
For the latter, Trump faces a 18 May deadline for determining whether to impose auto
tariffs under national security grounds with the highest risk likely facing the EU. Trade
talks with Japan have generally shown progress and we believe a narrow agreement
could be reached over the next few months.
Developments between the US and China show how a sudden decision to impose
broad-based auto tariffs or to withdraw from NAFTA remain distinct possibilities.
We remain cautious on other aspect of the US trade outlook. We expect:
• The administration will remain in NAFTA in an effort to ensure that Congress ratifies the
USMCA, a key legislative priority ahead of the 2020 presidential election (see Setting
the Table for the USMCA in 2019, 9 April 2019).
• President Trump will grant the EU and Japan exemptions from any auto tariffs as talks
continue. With steady US-Japan progress we think the risk is higher for the EU.
However, concern around the economic impact and congressional anger will keep auto
tariffs at bay, for now.
Higher tariffs on imports from China will likely exert modest upward pressure on
consumer prices. Raising the tariff rate from 10% to 25% on USD200bn of imports would
add roughly 12bp on US consumer prices on a 12-month basis and 16bp on core prices
(see Update on the CPI Tariff Impact, 8 February 2019). We think higher tariffs are likely
to have an only modest direct effect on US real GDP growth, likely less than 0.1pp from
2019 y-o-y. However, as has been the case with other tariff-related uncertainty, the more
important effect will likely come from decreased business confidence impacting business
investment and tighter financial conditions.
Fig. 6: US-China trade tensions: Key dates in the context of Nomura’s GDP tracking and equity markets
Note: GDP tracking estimates from Nomura’s daily real GDP growth tracking model based on incoming data. All values for GDP shown on the left hand axis (lhs). Source: BEA, Bloomberg, Nomura
A more confident Beijing might be less accommodative on trade talks
In our view, China’s growth recovery in March and booming stock markets since late
2018 make Beijing less dovish on policy easing (see China: The Politburo turns more
cautious, but it cannot afford to stop easing yet, 22 April 2019) and less accommodative
in the China-US trade negotiations.
17000
18000
19000
20000
21000
22000
23000
24000
25000
26000
27000
0.0
0.5
1.0
1.5
2.0
2.5
3.0
3.5
4.0
4.5
5.0
Aug-16 Nov-16 Feb-17 May-17 Aug-17 Nov-17 Feb-18 May-18 Aug-18 Nov-18 Feb-19 May-19
Q4 2016 Q1 2017 Q2 2017 Q3 2017 Q4 2017 Q1 2018Q2 2018 Q3 2018 Q4 2018 Q1 2019 Q2 2019 DJIA (rhs)
% q-o-q, ar Index
2016election
US initiates Section301 China investigation
Section 301report released
Trump-Xi
summit
5 MayTweet
Tariff rounds (1), (2) and (3)March tariff
delay

Nomura | Asia Economic Monthly 10 May 2019
8
On the growth recovery, real GDP growth stabilized at 6.4% y-o-y in Q1, higher than
expected. The official manufacturing PMI jumped to 50.5 in March from 49.2 in February.
Industrial production growth shocked markets by surging to 8.5% y-o-y in March from
5.3% in January-February, while export growth, albeit volatile, is showing signs of
bottoming out (from -4.6% y-o-y in January-February to 5.2% in March-April). Regarding
the property sector, growth of new home sales by floor space improved to 1.8% y-o-y in
March from -3.6% in January-February (Q4 2018: -2.0%) and property investment
growth improved further to 12.0% in March from 11.6% in January-February (Q4 2018:
8.4%). Stock market sentiment turned much more bullish before May this year, with the
Shanghai Composite Index and offshore H-share index having rebounded by 23.4% and
14.0%, respectively, in the first four months this year. These big improvements in both
the economy and stock markets stand in sharp contrast to the situations last year.
The impact of additional US tariffs on China’s growth
The 10-25% additional tariff on the USD250bn worth of China’s exports to the US has
already significantly impaired China’s US-bound exports and may have already shaved
China’s year-on-year GDP growth by ~0.2 percentage points (pp) from Q2 2018 to the
period of Q3 2018 - Q1 2019. If the Trump administration raises the additional tariff on the
USD200bn worth of Chinese exports from 10% to 25% and imposes an additional 25%
tariff on the remaining USD325bn of exports, this could shave 0.6pp y-o-y from China’s
nominal GDP growth in the four quarters following the tariff hikes, based on our estimates
(only short-term direct impact is counted; see more details below). This calculation does
not include the indirect impacts from swooning financial markets and sagging business
confidence, and we may see a more severe longer-term impact if exporters, including
multinationals, shift their factories to other countries to avert the tariff hikes.
The existing tariffs significantly weighed on China’s US-bound exports…
Growth of China’s export to the US slowed sharply from 12.9% y-o-y in Q3 2018 to 6.3%
in Q4 and -9.0% in Q1 2019. As export growth was distorted by the front-loading ahead
of tariff hikes and payback afterwards, we compare the average export growth between
Q3 2018 and Q1 2019 to that of Q2 2018 to estimate the impact of the additional tariff
imposed on Chinese exports to the US. In this regard, growth of China’s exports to the
US slumped by 7.7pp from 12.2% in Q2 2018 to 4.5% y-o-y in Q3 2018-Q1 2019.
… and lowered China’s GDP growth by 0.2pp in the past three quarters
As the share of domestic value-added in total exports is ~70% and the US-bound
exports account for 3.5% of China’s nominal GDP based on 2017 data (we use 2017
data for estimates as the 2018 data may have been affected by tariff hikes), the sharp
slowdown in the US-bound exports may have shaved ~0.2pp y-o-y (=70%*3.5%*7.7pp)
off of nominal GDP growth from Q2 2018 to Q3 2018-Q1 2019. This is close to our
earlier estimate of 0.28pp on impact of tariff hikes (see China-US trade conflict: Tit-for-tat
2.0, 20 September 2018).
We estimate the impact of tariff hikes using a bottom-up approach
Our estimates rely on sectoral value-added shares of gross exports and consider the
weighted-average impact of four situations: 1) Chinese exporters are forced to cut all
exports to the US; 2) Chinese exporters wholly absorb the additional tariff costs; 3)
additional tariff costs are borne evenly between exporters and importers; and 4) US
importers fully bear the additional tariff costs. To gauge the overall impact of tariffs for
each tariff list, we assign a probability distribution to the above-mentioned four situations
(i.e., the likelihoods of the four situations are 20%, 30%, 30%, and 20%, respectively,
with situations 2 and 3 being more likely to occur) . We then estimate the weighted
average impact based on these assumptions.
Threatened additional tariffs may lower China’s GDP growth by 0.6pp
We estimate the short-term direct impact of the threatened additional tariffs on China’s
year-on-year GDP growth as follows:
• If the existing 10% tariff on the USD200bn worth of Chinese exports to the US are
raised to 25%, this could shave 0.2pp annually from China’s year-on-year GDP growth;
• If additional tariffs of 25% are imposed on the remaining USD325bn of Chinese exports
to the US, this could additionally shave 0.4pp annually from China’s year-on-year GDP
growth;
• If the above two tariff hikes are enacted at the same time, the overall negative impact
on China’s year-on-year GDP growth may reach 0.6pp (=0.2pp+0.4pp) annually.

Nomura | Asia Economic Monthly 10 May 2019
9
The longer-term impact could be more severe
It is important to note that our above-mentioned estimates for China only focus on the
short-term direct impact of tariffs and are silent on the longer-term impact, which we
believe could be much more severe. Specifically, there could be bigger indirect impacts
through rising uncertainty, especially when considering mounting domestic challenges
(more credit defaults, a problematic property sector and overloaded debt). Moreover,
rising trade tensions may seep into investment, as exporters, including multinationals,
could shift their factories to other countries to avoid the tariff. Consequently, in the
medium-to-long term, if China-US trade tensions sustain, China’s growth would likely be
hit beyond the scale indicated by these estimates.
How will China respond if the US increases tariffs?
If the US announces tariffs hikes on USD200bn of China’s exports to the US, China will
almost surely retaliate with tit-for-tat tariff hikes. In addition to tariff hikes, we believe
there is an increasing likelihood that some non-tariff measures will be used. Below, we
list some measures that could be employed, as well as those that seem very unlikely to
be taken. In our view, a number of recent signs indicate that Beijing has started to rethink
its strategy and stance in positioning itself in the global economy. In our opinion, rationality
and practicality will dominate Beijing’s policymaking circle, and Beijing is very unlikely to
turn to populist approaches to boycott US products and harass US business in China.
A list of possible retaliatory measures
• There is high likelihood of tit-for-tat tariff hikes. In the worst case, China could impose
an additional 25% tariff on most of its imports from the US (except those for mere
intermediate goods). Between July and December 2018, China has imposed three
rounds of retaliatory tariff hikes, ranging from 5% to 25%, on the USD110bn worth of
imports from the US. Based on 2017 data, the targeted imports from the US with
additional tariff account for 71.4% (=USD110bn/ USD154bn) of total imports from the
US. Among the USD110bn worth of imports, USD50bn imports are subject to tariff
hikes of 25%, while the remaining USD60bn are exposed to tariff hikes of either 5% or
10%, according to different tariff lists. However, the 5-25% tariff hikes on imported auto
and auto parts from the US were suspended on 1 January 2019, following the Trump-Xi
summit last December.
• Non-tariff barriers such as setting import quotas, raising barriers of entry into the
Chinese market for US companies and products, and/or complicating customs
processing for US imports. The Chinese government can even directly order importers,
especially those owned by the state, to slash or stop importing goods and services from
the US.
• Last year, Beijing allowed RMB to depreciate against the USD right after the US
initiated the trade war. In the past six months, despite a strong USD, RMB first
appreciated against USD and then was pegged at around 6.7. Based on our estimates,
RMB appreciated by around 3.7% against its trading partners between November 2018
and April 2019. If the US hikes tariffs on its USD200bn of imports from China, China
would likely allow RMB to depreciate against the USD towards 7.0, in our view.
• Limits/restrictions on Chinese nationals travelling or receiving education in the US:
despite its merchandise trade surplus with the US, China has a consistent deficit on
service trade. Chinese nationals’ overseas spending has been welcomed by many
countries, and has helped to boost growth of recipient economies. A ban on traveling
and receiving higher education in the US would be negative for the US economy,
though the impact may not be as significant as the ban on tourism to South Korea.
• Subsidies to those Chinese enterprises affected by additional US tariff hikes: industrial
subsidies have been a frequently and widely cited example of unfair trade treatment
when countries apply for trade sanctions or other protectionist measures. So we view
the likelihood of this measure as rather slim.
Measures unlikely to be employed
• Heavy selling of US treasuries. We think this is very unlikely, as falling prices of US
treasury securities would also be a loss for China, as it is the largest foreign holder of
US treasury bonds. In addition, we believe it would be very difficult for China to re-
invest its US dollar holdings in a sensible way after selling US Treasuries. That said,
another less aggressive option for China might be to cease purchasing additional US
Treasuries.
• Instigating a boycott of US products by Chinese nationals. This also seems very
unlikely, since US products are sold all over China, including chips in almost all

Nomura | Asia Economic Monthly 10 May 2019
10
computers. Based on our observations, Chinese nationals overall do not seem to be
unduly prejudiced against the US, as evidenced by the soaring number of Chinese
students studying in the US. According to the Institute of International Education, for
the past eight years, China has been the largest source of foreign students in the US,
and, in mid-2017, Chinese students comprised 32.5% of the total 1.08mn foreign
students in the US.
• Harassing US business based in the China. We believe this is unlikely, as it is in
China’s interest to woo US businesses to support domestic growth and improve the
economic structure. China may even take advantage of its significant domestic market
and the US trade tariff by attracting US firms to produce in China to bypass the tariff.
Beijing may keep and even sustain its easing measures
How would China ease the pain if the trade war with the US escalates? Despite our
much more cautious stance on policy stimulus, we believe Beijing cannot afford to stop
easing yet. Also, if the trade war escalates, Beijing could very likely step up its easing
measures. On this point, we note that right after Trump’s tariff threats on 5 May, the
People’s Bank of China (PBoC) announced a targeted reserve requirement ratio cut,
effective 15 May, to inject ~RMB280bn to small banks to favor the financing of small and
medium-sized enterprises and private enterprises (see China: The PBoC announces a
targeted RRR cut after Trump’s tariff threat, 6 May 2019).
We expect the PBoC to continue adding liquidity to the banking system, with a
combination of high-profile RRR cuts (we expect a total of 100bp RRR cuts through the
rest of this year) and low-profile lending facilities such as medium-term lending facility
(MLF), targeted MLF (TMLF), pledged supplementary lending (PSL), re-lending and re-
discounting. If China’s stock markets drift lower due to a worsening trade conflict, the
PBoC would likely use high-profile RRR cuts again to add liquidity. We maintain our call
for 100bp in total RRR cuts over the remainder of this year.
On the fiscal side, with the value-added tax cuts and social security tax cuts coming into
effect on 1 April and 1 May, respectively, we expect fiscal stimulus to continue in coming
quarters. However, if China’s export growth is hit significantly by the escalation of the
trade conflict, China may have to rely more on infrastructure to stabilize growth. As such,
Beijing may have to give local governments more flexibility on funding via off-budget
channels, including local government special bond issuance, local government financing
vehicles and public-private partnership programmers (see China: Infrastructure not a
quick fix; Beijing could be bolder on fiscal deficit, 18 January 2019).
On consumption stimulus, Beijing could speed up the introduction of its stimulus plan for
the auto sector if there is a further escalation of trade war (see China: The NDRC plans a
new round of consumption stimulus, 17 April 2019).
On the property sector, the Chinese government now is in a wait-and-see mode after
allowing some easing measures in the past couple of months (see China’s property
sector: A recovery is in the making thanks to policy easing, 3 April 2019). We believe
that, if the trade war worsens, Beijing will step up its easing measures in the property
sector. Since late 2018 Beijing has shifted its stance on the property sectors in large
cities, from a broad-based tightening to “one policy for one city” and “city-specific polices
based on local situations”, which essentially granted local governments more discretion
in formulating their own property policies. Against this backdrop, we have seen a couple
of cities start to ease their local property-related policies in recent months and, thanks to
recent policy easing, we have seen a recovery in the property sector, especially in large
cities (see China’s property sector: A recovery is in the making thanks to policy easing, 3
April 2019).

Nomura | Asia Economic Monthly 10 May 2019
11
RMB: Strategy views around the upcoming US-China talks
The near-term risks around US-China trade negotiations are substantial in that they
could lead to significant moves in USD/RMB (possibly to/test 7.0 or fall below 6.70) and
impact on other global markets. As we highlight in US/China trade: Trump adds
uncertainty to trade talks, 6 May 2019, given growing uncertainties and the risk of sharp
RMB depreciation, we decided to buy a short-dated 2W 6.83 USD/CNH calls (expiry 20
May 2019; 31.2bp) as a partial hedge to our overall long CNH position. We further add to
this position through buying a 1W 6.835/6.73 risk reversal (notional: USD10m; expiry: 15
May 2019).
We believe the next risk before US-China trade talks begin (9-10 May) is the USTR
through the Federal Register formalizing the tariff increase to 25% (from 10%) on
USD200bn of imports from China (12:01am EDT; 10 May). This could emerge soon to
further pressure China, which would add further to the uncertainty in the market, even
though the tariff increase could still be rescinded before the proposed start time/date
despite this formalization.
A close call on tariffs; we assign a 50% aggregate likelihood…
Overall, even though the probabilities suggested by our four scenarios indicate the US
raising tariffs on USD200bn of China imports to 25% this Friday is an extremely close
call (total 50% probability), the scenario to which the global research team assigns the
highest probability (45%) is scenario 3 (Figure 5). In this scenario, the US raises tariffs to
25% on USD200bn of imports from China on Friday, China retaliates, and negotiations
are temporarily delayed.
… but scenario 3 – where additional tariffs are imposed – is the single most likely
scenario…
We expect that, if the tariff hike is recorded in the Federal Register to become effective
(could be anytime), then the market will increasingly shift its view towards this negative
scenario 3 (45%) amid a lack of public statements indicating a further delay or a
rescinding by Thursday earlier afternoon (EDT). This could lead spot USD/CNH higher
by around 50bp initially and, once the tariffs become effecting, we would expect
USD/CNH to rise above 6.90 soon thereafter (100bp above current levels). However,
given we would expect China to eventually retaliate and China/global markets to face
notable selling pressure, we believe USD/CNH rising back to and potentially testing
7.0 would become the consensus view. Indeed, even if the PBoC were to intervene to
prevent a further sharp sell-off, the depreciation forces would likely be significant and the
PBoC would likely end up allowing for some sporadic depreciation in part to avoid a
sharp draining of FX reserves. Authorities could also allow for greater RMB flexibility (as
seen in the 5.6% CFETS depreciation from mid-June 2018-end July 2018) to offset the
negative impact from the additional tariffs.
We would see a setback in foreign portfolio inflows (likely net outflows worse than those
experienced at the end of 2018), local corporates hoarding foreign currency (especially
exporters), and increased risk of a pickup in local diversification into foreign assets (E&O
outflows, tourism spending, FDI outflows etc.), all of which would imply a further
clamping down on channels of local capital flight (see Asia Insights - The major drivers of
RMB, 15 April 2019).
… with scenario 2 of no additional tariffs and continued negotiations being the
next highest probability…
Scenario 2 (40%) is one where the US and China are able to pick up discussions from
the previous agreements, leading to no additional tariffs, but there is a delay in the timing
of a deal. Although the risk of Trump ordering a tariff hike remains, it becomes less likely
as talks get back on track (US Treasury Secretary Mnuchin comments; CNBC and NYT;
6 May). This scenario of no imminent tariffs and an extension to the timing of a trade
deal (assuming continuous progress/trade delegation meetings) would likely provide
some relief to RMB/broad risk markets, but we do not believe there would be any sharp
CNH appreciation momentum, even if USD/CNH is likely to fall back to around 6.75.
… and the best outcome and worst outcomes are tail events
We believe the best case for risk markets/RMB (scenario 1; 10%) is if the US-China
trade delegation are able to strike a trade deal this week that leads to US President
Trump stepping away from his threat to hike tariffs. We assigned a 10% probability to
this, but such an outcome would lead to relatively sharp near-term appreciation with
USD/CNH likely to fall back towards and test 6.70-levels. The details of the deal

Nomura | Asia Economic Monthly 10 May 2019
12
would be the next focus, with a roll back in some of the tariffs, FX agreements and
liberalization likely to add to the rationale for likely more favourable overall flow conditions.
That said, we also assigned a 5% probability to scenario 4, which is the most negative
outcome with tariffs rising to 25% on the USD200bn of China imports, a risk of tariffs
imposed on the remaining USD325bn of imports from China (highlighted by Trump),
retaliation from China and a prolonged delay in trade talks. This scenario would likely
result in a more sustained break of USD/CNH through 7.0, even if there are periods of
sporadic FX USD selling intervention and other actions to stabilize RMB.
Trade details:
Buy 1W 6.835/6.73 USD/CNH RR (notional: USD10mn; i.e., buy 1W 6.835 USD/CNH
call, sell 6.73 USD/CNH put; expiry: 15 May 2019; premium: 8.7bp or USD8.7k; spot ref:
6.7884).
Please see FX Portfolio Update - FX Portfolio Performance (2 May 2019) for a full list of
our recommendations.
This report was originally published on 8 May 2019.

Nomura | Asia Economic Monthly 10 May 2019
13
Asia Economics
Ting Lu - NIHK [email protected] +852 2252 1306
Lisheng Wang - NIHK [email protected] +852 2252 2057
Jing Wang - NIHK [email protected] +852 2252 1011
China monthly: Beijing can’t afford to stop easing yet, as double dip is a real risk
Even room for credit easing seems much smaller.
In the past month there seems to have been a big shift in markets’ perceptions on
China’s growth momentum and Beijing’s policy stance. China’s economy staged a major
comeback in March with the official manufacturing PMI jumping to 50.5 in March from
49.2 in February and industrial production growth spiking to 8.5% y-o-y in March from
just 5.3% in the first two months. Having been encouraged by the rebound, Beijing
surprised markets by swiftly fine-tuning its monetary easing stance through re-
mentioning “deleveraging” and “keeping money supply under control”. For most
investors, the euphoria of surging stock prices, falling bond yields, a recovering economy
and accommodative policies seems to be too short. In our view, investors are
questioning whether the growth recovery is sustainable, whether Beijing is en route to
scaling back its policy easing, and if China’s economy will dip again if Beijing’s ending of
easing measures turns out to be premature.
In our view, the surprisingly big rebound in March activity data is unsustainable, growth
has yet to truly bottom, and the actual slowdown since mid-2018 could be significantly
worse than what official statistics have indicated. The dash of stimulus played a key role
in pushing up the data in March, which is the first month following the Lunar New Year
(LNY) holiday, but the rapid improvement in March data were also a result of some
temporary special distortions: 1) the moving LNY holidays; 2) the front-loading as a result
of the value-added tax (VAT) cut that was announced on 15 March to take effect on 1
April and 3) the anti-smog campaign from November 2017 and March 2018. For April,
some data such as PMI could continue to rise, but we expect some important data such
as industrial production growth and export growth to drop again.
Re-examining our views: What we got right and wrong
Before March this year, our views could be summarized as: 1) China’s growth slowdown
could be worse in H1 2019 due to synchronised demand shocks; 2) Beijing has less
scope for policy easing; 3) the growth slowdown could last longer; 4) credit easing is
necessary, but alone is not sufficient to drive a growth recovery and 5) deregulation of
the property sector is needed to deliver a full recovery of the economy (see China:
Economic growth needs more than money and credit to recover, 26 February 2019). In
hindsight, we were correct on being bearish on growth in 2018 and the first two months
in 2019, but too pessimistic on March activity data as we underestimated the dash of
stimulus. The property easing, which played a key role in bolstering growth in Q1 and
March, was implemented earlier than we had projected, but we were correct in
emphasising that the room of policy easing is more limited in this cycle than before. We
also correctly flagged that policymakers may have learned from the stock market crash
in 2015, thus they are keen in adjusting policy measures to avert another bubble and
crash in stock markets.
Beijing’s constraints: Limited room for monetary/credit easing
In our opinion, the key to understanding Beijing’s recent change in policy stance is to
acknowledge its constraints (see China: Deja vu? This time the easing cycle might be a
bit different, 15 August 2018). Compared with previous easing cycles, there seems to be
much less room for easing and stimulus this time around because of surging debt, a
much smaller current account surplus and falling FX reserves, while the decision-making
process is longer owing to the lack of consensus on direction and strategy. Another key
factor that may have been easily dismissed is that Beijing’s last significant stimulus
campaign was introduced only four years ago after the stock market crash in 2015.
Having spent significant monetary and fiscal easing capacity just a few years ago,
authorities may find that they have more limited room to launch another stimulus/easing
campaign in this cycle.
Some strong headwinds still exist
Other than those short-term distortions, we believe activity data could face some
downward pressure in coming months from the following headwinds:

Nomura | Asia Economic Monthly 10 May 2019
14
• A very high debt repayment pressure in 2019 due to the credit easing in 2015-16. Due
to a limited room of monetary easing, a rebound in financing costs could weigh on
growth recovery very soon.
• Exports could be still under strong downward pressure as the global economy is
slowing, the RMB could be increasingly overvalued with a new round of monetary
easing, and there may still be some payback after the front-loading of exports in
previous quarters.
• The stimulus-driven boom of small city property markets is coming to an end (see
China’s property sector: Winter is coming, 15 November 2018).
• The replacement cycle of durable goods such as construction machinery is over, while
the sharp slowdown of auto sales could also extend into coming months.
Beijing can’t afford to stop easing yet
Despite our much more cautious stance on policy stimulus, we believe Beijing can’t
afford to stop easing yet. The Chinese Communist Party’s Politburo, the country’s de
facto top decision-making body, convened on 19 April and issued a briefing after its
meeting. The slight change in the Politburo’s tone on monetary easing confirms our long-
held view that the room for monetary easing is much more limited in this easing cycle,
and Beijing may need to rely more on other policy measures to bolster growth. However,
we believe the growth recovery is as yet not solid despite the rebound in March data,
and there could be a double dip in the next few months. We believe the pace of
monetary easing will slow, but it still seems too early to withdraw monetary easing
measures despite the limited monetary policy scope.
More specifically, we expect the People’s Bank of China (PBoC) to continue to add
liquidity to the banking system, though it might replace those high-profile tools such as
reserve requirement ratio (RRR) cuts with low-profile tools such as medium-term lending
facility (MLF), targeted MLF (TMLF), pledged supplementary lending (PSL), re-lending or
other facilities (see China: The PBoC injects cheaper base money via targeted MLF, 24
April 2019). It’s still quite likely that Beijing could stimulate demand on other fronts,
especially on the severely hit auto sector (see China: The NDRC plans a new round of
consumption stimulus, 17 April 2019).
This is an excerpt from China monthly: Beijing can't afford to stop easing yet, as double
dip is a real risk, originally published on 26 April 2019.

Nomura | Asia Economic Monthly 10 May 2019
15
Asia Economics
Ting Lu - NIHK [email protected] +852 2252 1306
Lisheng Wang - NIHK [email protected] +852 2252 2057
Jing Wang - NIHK [email protected] +852 2252 1011
China: The Politburo turns more cautious, but it cannot afford to stop easing yet
The Chinese Communist Party’s Politburo, the de facto top decision-making body in
China, convened on 19 April and issued a briefing after its meeting. In line with the
briefing of the PBoC’s Q1 Monetary Policy Committee meeting (see China: The PBoC
sounded a cautious tone at its quarterly MPC meeting, 16 April 2019), the Politburo has
turned more bullish on the economy and less dovish on monetary easing. It has called
for more focus on improving efficiency of fiscal stimulus and pushing forward structural
reforms. Markets could interpret this Politburo briefing as the end of Beijing’s monetary
easing and may turn significantly bearish on asset prices. We beg to differ.
The slight change in the Politburo’s tone on monetary easing confirms our long-held view
that the room for monetary easing is much more limited in this easing cycle, and Beijing
has to rely on other policy measures to bolster growth (see China: Economic growth
needs more than money and credit to recover, 26 February 2019). The slight change in
tone is understandable due to the rapid build-up of debt and a potential irrational
exuberance in stock markets and big cities’ property markets. However, we believe the
growth recovery is not solid yet despite the rebound in March data, and there could be a
double dip in the next few months. We believe the pace of monetary easing will slow, but it
is still too early to withdraw monetary easing measures despite the limited monetary
policy scope. More specifically, we expect liquidity injections through a targeted RRR cut
or other facilities, as we believe Beijing cannot afford to let financing costs rise at the
pace of the past two weeks (see China: A targeted RRR cut is in the making, 18 April
2019).
Highlights of the Politburo’s briefing
• The briefing said that the economy is off to a good start and is better than expectations.
While acknowledging the growth headwinds, the Politburo claimed those are more
structural than cyclical, and required more structural reforms and market liberalisation.
• Compared with its previous briefing, the Politburo removed the call for “stabilising
employment, financial markets, foreign trade, investment, foreign capital and market
expectations”, suggesting so far it is satisfied with the stability in growth and financial
markets.
• On policy, compared with the last briefing, the Politburo further qualified its prudent
monetary policy “with an appropriate degree of intensity” (in line with the PBoC’s Q1
MPC meeting’s briefing). It reiterated a proactive fiscal policy but highlighted the need
for higher efficiency.
• The Politburo brought back the requirement of “structural deleveraging” after dropping it
in its October 2018 briefing.
• After finding no mention since the October 2018 meeting, property markets were re-
emphasised by the Politburo this time. In the briefing, the Politburo added back the line
“homes should be for living in, not for speculation”.
Beijing is right to be cautious, but too premature a withdrawal is not good
We have long argued that Beijing’s monetary easing room is quite limited this time
around due to the too rapid build-up of debt, a rise in foreign debt, a fall in FX reserves,
an expected current account deficit this year, a sharp decline in return on investment and
the need to stabilise RMB (see China: Deja vu? This time the easing cycle might be a bit
different, 15 August 2018). However, too premature a stop after an all-out campaign to
push up credit growth could do unnecessary harm to both growth and financial markets.
In our view, Beijing cannot afford to slam on the brakes regarding monetary easing, and
the Politburo merely strikes a cautious tone, partially because: (1) it has taken lessons
from 2015 when its credit easing instigated stock market mania and a crash, as well as a
surge in property prices; (2) it is really concerned about too rapid debt growth and
realises all the constraints that it faces.
The recovery is not solid, and a double dip is likely
Despite the Politburo’s more sanguine growth outlook, we see China’s economy still in a
tug-of-war between headwinds and policy easing. While it is true that some parts of the
economy are recovering and we have seen evidence of green shoots, we also need to
keep in mind that the global economy is slowing, property markets in lower-tier cities

Nomura | Asia Economic Monthly 10 May 2019
16
could continue to fall, exports may weaken further and sales of some durable goods –
such as cars, construction machinery and even mobile phones – are under heavy
pressure. In our view, it is still too early to say whether growth has fully recovered and
policymakers can remove policy easing measures.
The jump in industrial production (IP) growth in March was partly due to a low base
related to the anti-smog campaign (see China: The anti-smog campaign likely less in
force this winter, 19 September 2018) and more export-oriented production boosted by
value-added tax (VAT) cuts, as exporters likely sped up custom clearing in March to
avoid a reduction in VAT rebates in April (see China: Export growth surged while import
growth slumped in March, 12 April 2019). As the effects of these factors are likely to be
one-offs and reverse in coming months, headline year-on-year IP growth should
moderate in April and May.
Despite these policy-related distortions which boosted March activity growth, we are still
seeing a raft of bad readings such as: (1) growth of auto sales in volume terms slowed to
-11.7% y-o-y in March from -9.7% in January-February (Q1 2019: -10.4%; Q4 2018: -
16.9%; full-year 2018: -5.8%); (2) import growth in USD terms dropped to a worse-than-
expected -7.6% y-o-y in March from -3.2% in January-February (Q1 2019: -4.8%; Q4
2018: 4.4%; full-year 2018: 15.8%), reflecting still-weak domestic demand; (3) land sales
(by volume) continued to contract in March, with growth remaining sluggish at -31.5%
y-o-y in March, despite an uptick from -34.1% in January-February (Q1 2019: -33.1%;
Q4 2018: 11.4%; full-year 2018: 14.2%); and (4) the monthly average operating ratio of
blast furnaces moderated to 63.8% in March from 65.3% in January-February (Q1 2019:
64.8%; Q4 2018: 67.0%; full-year 2018: 67.2%).
We believe the economy has yet to fully recover, the credit easing cycle is shorter and
smaller than before and the incoming growth recovery should also be shorter and
smaller. We also believe the PBoC will continue to ease, but the intensity and the pace
of policy easing measures will be quite data dependent, and the PBoC will struggle with
worsening data quality when assessing and predicting economic conditions. The PBoC
has to balance policy easing with the need to control financial risks, given the rapid rise
of debt and very volatile stock markets, but we believe it is too early for it to withdraw
policy easing measures. We expect credit growth, defined as year-on-year outstanding
augmented aggregate financing (AAF) growth, to slightly tick up further and stay in an
11.0-11.5% range this year.
The Politburo on the property sector
Compared with the July 2018 meeting, where it had vowed to prevent too rapid a rise in
property prices, the Politburo this time did not mention property prices. Instead, it called
for more forceful implementation of the “one policy for one city (一城一策)” and “city-
specific polices based on local situations (因城施策)” pilot programs. Also, it highlighted
the municipal governments’ responsibilities in managing the local markets to prevent
speculation. As “one policy for one city” grants local governments more discretion to
formulate their own property policies, we view this as an easing signal (see China’s
property sector: A recovery is in the making thanks to policy easing, 3 April 2019).
More policy support for SMEs and private enterprises, more market reforms
The Politburo recognised the need for more policy support to private enterprises and
small- and medium-size enterprises (SMEs), in line with the tones of recent policy
meetings (see China: President pledges to better support the private sector, 2 November
2018). Moreover, it emphasised some key points related to reforms and market
liberalisation, including 1) a stabilisation of growth should be more reliant on high-quality
growth of the manufacturing sector; 2) a truly registration-based IPO system should be
implemented at the science and technology innovation board; 3) the liberalisation of
domestic markets and the lowering of entry barriers to foreign investments should
continue, to deepen reforms; and 4) more efforts should be made for poverty alleviation
and production safety.
This report was originally published on 22 April 2019.

Nomura | Asia Economic Monthly 10 May 2019
17
Asia Economics
Ting Lu - NIHK [email protected] +852 2252 1306
Lisheng Wang - NIHK [email protected] +852 2252 2057
Jing Wang - NIHK [email protected] +852 2252 1011
China: The NDRC plans a new round of consumption stimulus
Targeting auto, home appliance and electronics.
On 11 April, the National Development and Reform Commission (NDRC), China’s top
planning agency, distributed a draft to seek feedback on its proposed stimulus measures
for auto, home appliance and consumer electronic products. These proposed measures,
if implemented, will officially kick off a new round of consumption stimulus. Unlike some
informal talks over the past few months (see China: Policies targeting auto and home
appliance sales may have limited impact, 15 January 2019), the proposed stimulus by
the NDRC is material, as it would cut the purchase tax by half for rural residents and
double the quota for new vehicle licences in some major cities. The NDRC’s draft itself
suggests Beijing is still quite concerned about the growth slowdown, despite GDP growth
seemingly stabilising in Q1 and the jump in activity data in March (see China: Growth
stabilised in Q1, March activity data displayed a recovery, 17 April 2019).
Assessing the potential impact of this consumption stimulus
The proposed stimulus might be smaller in scale than the previous two consumption
stimuli (one started in January 2009 amid the global financial crisis, and the other started
in October 2015 after the stock markets crash amid a severe growth slowdown). We
expect sales of auto and home appliances to benefit from the stimulus in 2019 and 2020,
and a rebound in auto and home appliance sales growth should help to deliver a real and
more sustainable growth recovery. Acknowledging the previous stimulus for auto
purchases was implemented as recently as 2015-17, we believe the impact of the
incoming stimulus on auto sales could be smaller, as those that bought cars in 2015-17
may not need to buy new ones. However, a frontloading of some consumption demand
of durable goods in 2019-20 will inevitably result in a payback in 2021.
The NDRC’s proposed measures for boosting auto purchases
In the NDRC’s draft plan, we see a few policy measures worthy of additional attention:
• Local governments are prohibited to roll out new restrictions on auto purchases.
Existing restrictions are required to be relaxed in a gradual manner. Specifically for
those cities imposing quotas on vehicle licenses, these quotas should be raised by
50% and 100%, respectively, in 2019 and 2020, from the level in 2018.
• For rural citizens, the vehicle purchase tax is cut by half until end-2020 for the
purchases on small-engine cars (1.6L or below) and the replacement of motorized
rickshaw for small trucks (3.5 tons or below).
• No purchase bans should be imposed for households without car ownership.
• For cities imposing restrictions for vehicle licenses, these restrictions should be lifted for
non-congestion areas.
• No restrictions should be imposed for the use and purchase of new energy cars.
• To support the use of new energy cars, state-owned enterprises and state entities are
required to install a minimum number of charging stations, which accounts for 10% of
the number of parking lots.
• Local governments are encouraged to lower the toll fees by half for new energy cars.
• Removal of entry bans on used non-local autos.
The NDRC’s proposed measures for supporting sales of home appliances
There are many details in the NDRC draft, but we found the following most relevant: A
maximum of 13% discount off the prices will be subsidised for the purchases of new eco-
friendly and intelligent home appliances, which are backed by the China Compulsory
Certification (CCC) and above the grade II energy efficiency. The subsidy for each unit of
home appliance is capped at RMB800.
A short history of auto-related stimulus in the past decade
The sector is already one of the country’s pillar industries. Auto production involves a
variety of inputs from other sectors, including steel, metals, fuels, plastics, rubber, glass
and electronics. In 2017, the gross industrial output of the auto sector was RMB3.6trn.
Netting out the value of imported auto parts at RMB250bn, the auto sector contributed
~4.0% (=RMB3.3trn/RMB82.7trn) to nominal GDP.

Nomura | Asia Economic Monthly 10 May 2019
18
As the auto sector is becoming increasingly important, it has been a recipient of Beijing’s
largesse when forced to boost growth. During the 2008 Global Financial Crisis (GFC),
passenger car sales in volume terms plunged to 0.5% y-o-y in Q3 2008 from 10.6% in
Q2. In January 2009, the State Council lowered the purchase tax on small-engine cars
(1.6L or below) from 10% to 5% for 2009 and to 7.5% for 2010. Auto sales growth
instantly spiked to 54.7% y-o-y in 2009, from 7.7% in 2008, before moderating to 32.0%
in 2010 and to 6.2% in 2011.
In 2015, this stimulus was essentially repeated after stock markets crashed in late June
amid a severe growth slowdown. With auto sales growth plunging to 2.4% y-o-y in Q3
from 17.8% in Q1 2015, the State Council in September that year adopted the same tax
cut scheme as in 2009: the purchase tax on small-engine cars was reduced to 5% from
10% for the period October 2015-December 2016, and to 7.5% in 2017, before being
raised back to 10% in 2018. Auto sales growth surged to 16.3% y-o-y in Q4 2015 and to
18.5% for 2016.
The ongoing slowdown of auto sales
According to the China Passenger Car Association (CPCA), growth of passenger car
sales in volume terms slowed to -11.7% y-o-y in March from -9.7% in January-February
(Figure 7), taking Q1 growth to -10.4% y-o-y from -16.9% in Q4 2018 and -9.2% in Q3
2018. To smooth out some distortions, the average growth of auto sales in Q1 2019 and
Q4 2018 was -14.1% y-o-y, much lower than -9.2% in Q3 and 3.3% in Q2 2018
(2018: -5.8%). Based on the weekly sales data from 1-12 April reported by the CPCA,
our estimate of the April auto sales growth (by volume) is tracked at -33.8% y-o-y, much
weaker than the -11.7% reading in March.
The ongoing slowdown was due mainly to the stimulus in 2015-17. A decade ago, when
the car ownership penetration ratio was so much lower, this stimulus had a much larger
and longer-lasting impact. With an ever-increasing penetration ratio, as is typical of
consumer durables, high sales in the past are negative for sales in the immediate future.
The 2016-17 tax cut front-loaded sales, with the payback seen, and expected, in 2018-
19. According to the CPCA, growth of passenger car sales in volume terms tumbled
to -19.2% y-o-y in December 2018, taking annual growth to -5.8% in 2018 from 2.0% in
2017 and 18.6% in 2016, the first annual auto sales contraction in two decades. Other
factors may also have contributed to the slump. The collapse of auto financing through
P2P lending (see China monthly: The dramatic rise and fall of online peer-to-peer
lending, 30 August 2018) could also have had an impact on car sales.
How big is the impact of the proposed stimulus?
Given the limited information, it’s hard to quantify the impact of the incoming stimulus on
auto purchases. Compared with the two previous stimuli, the incoming stimulus is
weaker on the following fronts:
• The incoming purchase tax cut is limited to rural citizens. Note 57.6% of China’s
1.395bn population are rural citizens based on the Hukou system. Also, according to
the National Bureau of Statistics (NBS), the average disposable income of rural
residents in 2018 was just RMB14617, way below the RMB39251 disposable income of
urban residents.
• The 50% purchase tax cut is effective in coming quarters until end-2020, which is likely
longer than the 15 months in the 2015-2017 stimulus and 12 months in the 2009-10
stimulus. The longer the stimulus period, the smaller the impact for the current year.
• The previous stimulus was just as recent as in 2015-2017. The durable goods
characteristics of cars suggest the impact of another purchase tax cut could be much
smaller.
• China’s car penetration ratio is now 175 per 1000, from 118 back in 2015 when the
purchase tax was last cut. The higher penetration ratio also suggests that a new round
stimulus would have smaller impact.
However, other proposed measures could deliver bigger impact than the previous two
stimuli. Since 2014, eight cities or regions in China (Shanghai, Beijing, Guiyang,
Guangzhou, Tianjin, Hangzhou, Shenzhen and Hainan province) imposed quotas on
vehicle licenses. As the proposed stimulus will raise quotas in those cities by 50% and
100%, respectively, in 2019 and 2020, from the levels in 2018, there should be pent up
demand for passenger cars.

Nomura | Asia Economic Monthly 10 May 2019
19
The proposed stimulus will raise the quota for new car licenses by 974,000 in total
We estimate the number of additional quota of car license plates created by this stimulus
plan to be ~974,000, following four steps.
• First, due to the limited data available, we calculate the total annual quota of car license
plates approved by local municipal commission of transport in Beijing, Tianjin,
Guangzhou, Hangzhou and Shenzhen, which was 498,000 in 2018, down from
558,000 in 2017 due to the tightening of quota approvals in Beijing (down to 97,000 in
2018 from 152,000 in 2017).
• Second, we assume the total quota of car license plates in Shanghai, Guiyang and
Hainan province in 2018 to be ~150,000, close to the level for Beijing in 2017 before
the tightening of quota approvals. Thus, based on our assumptions and estimates, the
total annual quota of car license plates in cities and regions with restrictions on vehicle
license approvals was 648,000 in 2018.
• Third, we assume in a counter-factual scenario without this policy stimulus, the total
annual quota of car license plates in these cities and regions would remain unchanged
from its 2018 level (i.e., 648,000) in both 2019 and 2020.
• Fourth, as proposed in the draft guidelines, for those cities with quota restrictions on
new vehicle licenses, their quotas should be raised by 50% and 100%, respectively, in
2019 and 2020, from the 2018 level. Therefore, we estimate the quota in these cities
will be raised from 648,000 to 973,000 in 2019 and to 1,297,000 in 2020. Compared
with the counter-factual scenario, the additional quota of car license plates created by
this stimulus plan, once launched, will be 325,000 in 2019 and 649,000 in 2020,
totalling 974,000 in these two years. Based on our estimates, this will boost China’s
auto sales (in volume terms) by 1.5 percentage points (pp) and 2.9pp, respectively in
2019 and 2020.
A short history of stimulus on home appliances
The “home appliances to the countryside” programme was initiated in December 2007 as
a pilot project in a few provinces and cities (including Shandong, Henan and Sichuan
provinces, plus Qingdao city) to boost rural demand and improve the living conditions of
rural residents through fiscal subsidies.
In response to the 2008 GFC, this programme was leveraged by the central government
to stimulate final demand and domestic growth, together with the RMB4trn stimulus
package. The programme was extended to 14 provinces and cities in October 2008, and
then further promoted to the whole country in February 2009, with the list of qualifying
home appliances expanded from four categories to eight categories. In March 2010,
some additional categories of home appliances were added to the list. This programme
ended in January 2013.
Regarding the “old for new” program, in May 2009, Beijing rolled out such a program to
encourage consumers to replace their old home appliances with new ones, with the help
of fiscal subsidies. Back then, of the RMB5bn fiscal subsidy given, RMB3bn was
allocated to subsidise the trading in of mid-sized and small trucks, as well as some types
of mid-sized passenger cars, with the other RMB2bn allocated to provide 10% discounts
on new TV sets, refrigerators, washing machines, air conditioners and computers. Other
policy measures that have been used by the government to spur home appliance sales
include subsidising purchases in rural areas and of energy-saving products. The
programme was phased out in December 2011. Moreover, in May 2012, the State
Council launched a new subsidy programme for the purchase of energy-saving home
appliances, such as eligible air conditioners and TVs.
The current slowdown of new home sales and the impact of potential stimulus
Despite the March rebound, sales growth of property-related products remained broadly
weak on a quarterly basis, led by furniture and home-use electronics sales, growth of
which declined to 5.0% y-o-y and 7.8% (Figure 8), respectively, in Q1 2019 from 10.1%
and 10.4% in Q4 2018 (2018: 10.1% and 8.9%). Over the same period, sales growth of
construction & decoration materials moderated to 8.1% in Q1 2019 from 9.0% in Q4
2018 (2018: 8.1%).
Regarding the impact, it is almost impossible to quantify at this stage. Even with
hindsight, the impact of the stimulus in 2009-11 on home appliance is still quite difficult to
calculate as one cannot separate the impact of this specific stimulus from other, more
general stimulus plans (the 4trn stimulus plan). That said, the stimulus will have some
positive impact, and will surely boost sentiment.

Nomura | Asia Economic Monthly 10 May 2019
20
Fig. 7: Auto sales (by volume) at different data frequencies
Source: CPCA, WIND and Nomura Global Economics.
Fig. 8: Retail sales for property-related products
Source: WIND and Nomura Global Economics.
This report was originally published on 18 April 2019.
-40
-30
-20
-10
0
10
20
30
40
50
% y-o-y Daily average auto sales implied by reportedweekly sales
Reported monthly auto sales
0
4
8
12
16
20
24
28
% y-o-y Home-use electronics
Furniture
Construction and decoration materials

Nomura | Asia Economic Monthly 10 May 2019
21
Asia Economics
Rob Subbaraman - NSL [email protected] +65 6433 6548
Michael Loo - NSL [email protected] +65 6433 6296
China’s delicate policy balancing act
Our estimates of China’s credit and fiscal impulses show that both are now imparting
increasing stimulus on the economy (Figure 9; see notes for calculation). The credit
impulse has been the main driver, and we find that it alone is a better predictor of
China’s economic cycle than the combined credit and fiscal impulse, so henceforth we
will focus only on the credit impulse. After our estimate of the credit impulse jumped from
-7.5 percentage points (pp) in December 2018 to -4.6pp in January, we cautioned
against overreacting to only one month of credit stimulus data (see Asia Insights: China’s
apparent credit surge in January: putting it in perspective, 19 February 2019). But after a
slight dip in February, our credit impulse surged again to -2.3pp in March.
Our analysis of the last three upcycles (see Figures 10-17) finds that our credit impulse
estimate is a useful leading indicator of China’s manufacturing PMI, industrial output and
nominal (but not real) GDP growth, though the credit intensity impact (see Figure 17) has
mostly declined over time. Interestingly we find property prices to be the most responsive
to our credit impulse measure, with the credit intensity impact getting stronger over time.
China’s policymakers now face a delicate balancing act. If our credit impulse measure
keeps rising at its current rate it will rise by a total of 20.9pp by December 2019, marking
the strongest upcycle since 2009 (Figure 10; Path A). With China’s high debt and slowing
growth potential, such a strong credit upcycle may end up doing more harm than good
by fuelling a property price bubble. If, by contrast, the government adheres to its goal of
keeping credit growth in line with nominal GDP growth, then our credit impulse will be
little changed by year-end and China’s economic recovery could falter (Figure 10; path B).
From this vantage point, it is unsurprising that policymakers are starting to sound more
cautious on stimulus (see Asia Insights - China: The Politburo turns more cautious, but it
cannot afford to stop easing yet, 22 April 2019). But given the still large uncertainties and
headwinds facing China’s economy, we suspect that their bark will be bigger than their
bite. Fiscal stimulus will continue to be doled out, and while we doubt our credit impulse
will be as strong as path A, it likely will rise into the +5-10pp range by December.
Fig. 9: Nomura’s gauges of China’s credit and fiscal impulse
Note: We augment the official aggregate financing outstanding by including the outstanding value of local government bonds, asset backed securities and loan write-off. Our credit impulse is then calculated by taking the 12-month change in the ratio of the 12-month change in outstanding augmented aggregate financing to the 4-quarter rolling sum of nominal GDP. Our fiscal impulse is calculated by taking the 12-month change in the ratio of the 12-month rolling sum of the general government fiscal deficit to the 4-quarter rolling sum of nominal GDP. Source: CEIC and Nomura.
Fig. 10: Two extrapolations of China’s credit impulse
Note: Path A is the extrapolation of the average monthly increase in the credit impulse in the current upcycle (December 2018 to March 2019) to December 2019. Path B assumes that going forward the growth in credit, which was 11.2% y-o-y in March, matches the growth in nominal GDP (we assume 9% y-o-y in Q2, Q3 and Q4, up from 7.8% in Q1). This results in a sharp, initial downshift in the credit impulse before it starts rising toward the equilibrium level of zero. Source: CEIC and Nomura.
-15
-10
-5
0
5
10
15
20
25
30
Percentage pointsFiscal impulse
Credit impulse
China's credit + fiscal impulse
48
49
50
51
52
53
54
55
56
-15
-10
-5
0
5
10
15
20
25
Percentage points
Path A: Continues at the same average pace of Dec 18 to Mar 19
Path B: Credit growth = 9.0% = nominal GDP growth

Nomura | Asia Economic Monthly 10 May 2019
22
Fig. 11: China's credit impulse vs. official Manuf. PMI
Note: See Fig 7 note for the definition of credit impulse. Shaded areas are periods of credit upcycles. Source: CEIC and Nomura.
Fig. 12: China's credit impulse vs. industrial production
Note: See Fig 7 note for the definition of credit impulse. Shaded areas are periods of credit upcycles. Source: CEIC and Nomura.
Fig. 13: China's credit impulse vs. real GDP growth
Note: See Fig 7 note for the definition of credit impulse. Shaded areas are periods of credit upcycles. Source: CEIC and Nomura.
Fig. 14: China's credit impulse vs. nominal GDP growth
Note: See Fig 7 note for the definition of credit impulse. Shaded areas are periods of credit upcycles. Source: CEIC and Nomura.
Fig. 15: China's credit impulse vs. property price index
Note: See Fig 7 note for the definition of credit impulse. Shaded areas are periods of credit upcycles. The property price index is constructed by the NBS from the average growth in residential property prices in 70 cities. Source: CEIC and Nomura.
Fig. 16: China's credit impulse vs. Shanghai Composite Index
Note: See Fig 7 note for the definition of credit impulse. Shaded areas are periods of credit upcycles. Source: CEIC and Nomura.
44
46
48
50
52
54
56
58
60
-15
-10
-5
0
5
10
15
20
25
IndexPercentage points Credit impulse, lhs
China's official mfg PMI, rhs
0
2
4
6
8
10
12
14
16
18
20
22
-15
-10
-5
0
5
10
15
20
25
% y-o-yPercentage points
Credit impulse, lhs
Value added of industry, rhs
4
6
8
10
12
14
16
-15
-10
-5
0
5
10
15
20
25
% y-o-yPercentage points Credit impulse, lhs
Real GDP growth, rhs
5
10
15
20
25
-15
-10
-5
0
5
10
15
20
25
% y-o-yPercentage points Credit impulse, lhsNominal GDP growth, rhs
-8
-4
0
4
8
12
16
-15
-10
-5
0
5
10
15
20
25
% y-o-yPercentage points Credit impulse, lhs
70-city property price index, rhs
-100
-50
0
50
100
150
200
250
-15
-10
-5
0
5
10
15
20
25
% y-o-yPercentage points Credit impulse, lhs
Shanghai Composite Index, rhs

Nomura | Asia Economic Monthly 10 May 2019
23
Fig. 17: Gauging the lead-time and effectiveness of China’s last three credit upcycles against the current upcycle
Note: As in Figure 10, Path A in credit upcycle IV assumes China’s credit impulse continues growing at the current rate of 5.2 percentage points every 3 months until December 2019. Path B in credit upcycle IV has China’s augmented aggregate financing growing at the same rate as China’s nominal GDP, which we assume at 9.0% y-o-y in Q2, Q3 and Q4 2019, up from 7.8% in Q1. The property price index is the 70-city residential property price index compiled by the National Bureau of Statistics. The equity price index is the end-month of Shanghai composite index.
Source: WIND, Bloomberg, CEIC and Nomura.
This report was originally published on 23 April 2019.
Trough
to peak
duration,
months
Trough
to peak
increase,
pp (1)
Credit
lead,
months
Trough
to peak
duration,
months
Trough
to peak
increase,
pp (2)
Credit
intensity
[(2)/(1)]
Credit
lead,
months
Trough
to peak
duration,
months
Trough
to peak
increase,
pp (2)
Credit
intensity
[(2)/(1)]
Credit
lead,
months
Trough
to peak
duration,
months
Trough
to peak
increase,
pp (2)
Credit
intensity
[(2)/(1)]
Credit upcycle I
Duration: January 2009 to
December 2009
12 30.2 0 12 15.4 0.51 2 9 15 0.51 3 12 6 0.19
Credit upcycle II
Duration: January 2012 to May
2013
17 18.7 0 4 3.0 0.16 8 4 1.4 0.07 9 3 0.6 0.03
Credit upcycle III
Duration: August 2015 to May
2016
10 12.6 1 1 1.1 0.10 4 1 1.4 0.11
Credit upcycle IV - Current
Duration: January 2019 to
March 2019
3 5.2 0 3 1.1 0.21 3 2 3.2 0.62
Credit upcycle IV - Path A
Duration: January 2019 to
December 2019
12 20.9
Credit upcycle IV - Path B
Duration: January 2019 to
December 2019
12 5.1
Credit impulse,
percentage points
No recovery
No recovery
Official manufacturing PMI, index Value added of industry growth, % y-o-y Real GDP growth, % y-o-y
Trough
to peak
duration,
months
Trough
to peak
increase,
pp (1)
Credit
lead,
months
Trough
to peak
duration,
months
Trough
to peak
increase,
pp (2)
Credit
intensity
[(2)/(1)]
Credit
lead,
months
Trough
to peak
duration,
months
Trough
to peak
increase,
pp (2)
Credit
intensity
[(2)/(1)]
Credit
lead,
months
Trough
to peak
duration,
months
Trough
to peak
increase,
pp (2)
Credit
intensity
[(2)/(1)]
Credit upcycle I
Duration: January 2009 to
December 2009
12 30.2 6 12 12 0.40 3 13 17 0.57 0 12 145 4.8
Credit upcycle II
Duration: January 2012 to May
2013
17 18.7 9 6 1.2 0.06 6 18 11.1 0.59 0 10 26.8 1.4
Credit upcycle III
Duration: August 2015 to May
2016
10 12.6 7 15 5.1 0.40 5 15 14.1 1.12
Credit upcycle IV - Current
Duration: January 2019 to
March 2019
3 5.2 0 3 0.7 0.14 0 3 22.1 4.3
Credit upcycle IV - Path A
Duration: January 2019 to
December 2019
12 20.9
Credit upcycle IV - Path B
Duration: January 2019 to
December 2019
12 5.1
No recovery
Credit impulse,
percentage points
No recovery
Nominal GDP growth, % y-o-y Property price index, % y-o-y Equity price index, % y-o-y

Nomura | Asia Economic Monthly 10 May 2019
24
Asia Economics
Sonal Varma - NSL [email protected] +65 6433 6527
Aurodeep Nandi - NFASL [email protected] +91 22 4037 4087
India Election Watch #8: In opinion polls we somewhat trust
Pollsters’ records suggest taking their predictions with a generous pinch of salt.
Opinion polls that suggested there was a surge in support for the coalition of incumbent
Bharatiya Janata Party (BJP), the National Democratic Alliance (NDA), between
February and March now show a loss of momentum in April on the margin. But polls still
point to the NDA remaining in pole position to form a government. However, pollsters’
records (opinion and exit) suggest that their ability to predict the outcome is patchy.
While they got the momentum correct in 2009 and 2014, they were entirely wrong on the
results in 2004. We continue to expect a fractured mandate leading to a BJP-led
coalition. On policy, expect continuity and a general bias towards more rural reflation and
social welfare irrespective of the government in power.
Elections have begun and there is now a blackout period until exit polls on 19 May,
followed by final results on 23 May (Figure 18). In the opinion polls in the run-up to the
elections, the incumbent BJP’s popularity has changed significantly. It started off in a
weaker position, hit by anti-incumbent sentiment and distress on farm and
unemployment, and opinion polls predicted a hung parliament. However, tensions with
Pakistan in February changed this and the ruling coalition, the NDA, surged in the polls
in March. A key question at the time was whether the NDA would maintain its lead, and
whether national security concerns remain a key electoral issue.
The last set of polls released earlier this week suggest the NDA may have lost some
momentum at the margin since February, but it remains in pole position to form the next
government (Figure 19). This is evident when we compare the same pollsters across
time. For example, Times Now-VMR predicted 252 seats for the NDA in January (a
simple majority is 272 seats), which spiked to 283 in March, and has settled at 279 in
April. Similarly, in the case of India TV-CNX polls, the NDA’s seat projection has
increased from 245 in January to 285 in March, and 275 currently.
Fig. 18: Election timelines
Source: EIC and Nomura Global Economics
Event DateTotal constituencies
under polling
Phase 1 11-Apr-2019 91
Phase 2 18-Apr-2019 97
Phase 3 23-Apr-2019 115
Phase 4 29-Apr-2019 71
Phase 5 6-May-2019 51
Phase 6 12-May-2019 59
Phase 7 19-May-2019 59
Exit polls 19-May-2019 (5:00 p.m. IST onwards)
Final results 23-May-2019

Nomura | Asia Economic Monthly 10 May 2019
25
Fig. 19: Evolution of opinion polls
Note: Simple majority mark = 272 seats. Source: India Today, India TV, ABP News, Twitter, ABP News, Wikipedia, Times Now News and Nomura Global Economics.
Can we trust opinion polls? A key question is to what extent can we trust opinion polls? Opinion and exit polls have a
patchy record in predicting the Indian elections. In the previous general election in 2014,
both exit and opinion polls got the direction right, but missed the exceptional surge in
support for the BJP (Figure 20). Interestingly, exit polls then seemed to realise that
opinion polls had grossly underestimated the NDA’s prospects – evidenced by the sharp
pickup in the NDA’s seat count subsequently. Nevertheless, they grossly underestimated
the margin of victory for the BJP. In particular, polls by Times Now and India Today were
widest off the mark, while News24-Chanakya was the only exit poll to predict an outright
victory for the NDA.
Fig. 20: 2014 elections: Opinion and exit polls versus actual
Source: India Today, Economic Times, Wikipedia, NDTV, India TV, and Nomura Global Economics
Fig. 21: 2009 elections: Opinion and exit polls versus actual
Note: *Third Front was a coalition led by Communist Party of India (Marxist); **Fourth Front comprised of Samajwadi Party, Rashtriya Janata Dal, and Lok Janshakti Dal. Fourth Front+ includes other remaining parties; ***UPA+ comprises of UPA and the parties that provided outside support to it. Source: NDTV, The Hindu, The Times of India, Wikipedia, and Nomura Global Economics
Month Polling agency NDA UPA Others Verdict
Apr-19 Times Now-VMR 279 149 115 NDA
Apr-19 India TV-CNX 275 126 142 NDA
Apr-19 Jan Ki Baat 304-316 117-126 110-113 NDA
Mar-19 Times Now-VMR 283 135 125 NDA
Mar-19 News Nation 270 134 139 Hung
Mar-19 ABP News-Cvoter 264 141 138 Hung
Mar-19 India TV-CNX 285 126 132 NDA
Mar-19 Zee 24 Taas 264 165 114 Hung
Feb-19 VDP Associates 242 148 153 Hung
Jan-19 ABP News-Cvoter 233 167 143 Hung
Jan-19 India Today-Karvy 237 166 140 Hung
Jan-19 Times Now-VMR 252 147 144 Hung
Jan-19 India TV-CNX 245 146 152 Hung
Jan-19 ABP News-C Voter 233 167 143 Hung
Jan-19 VDP Associates 225 167 150 Hung
Dec-18 ABP News-C Voter* 247 171 125 Hung
Dec-18 India TV-CNX 281 124 138 NDA
India-Pakistan skirmishes
Polling agency NDA UPA Others Verdict
Final Result 336 59 148 NDA
Times Now-ORG 249 148 146 Hung -87
India Today-Cicero 183-261 110-120 150-162 Hung -114
CNN IBN-CSDS-Lokniti 270-282 92-102 150-160 NDA -60
India TV-Cvoter 289 107 147 NDA -47
News 24-Chanakya 340 70 133 NDA 4
ABP News-Nielsen 281 97 165 NDA -55
NDTV-Hansa Research 275 111 157 NDA -61
CNN-IBN-Lokniti-CSDS 234-246 111-123 174-198 Hung -96
ABP News-Nielsen 236 92 215 Hung -100
Times Now-India TV-Cvoter 227 101 215 Hung -109
Exit polls
Opinion polls
Error margin in
predicting NDA
Polling agency NDA UPA Third Front* Fourth Front+** Verdict
Final Result 159 262 79 43 UPA+***
CNN-IBN-Dainik Bhaskar 165-185 185-205 110-130 45-65 Hung -67
Headlines Today 180 191 38 134 Hung -71
India TV-Cvoter 183-195 189-201 105-121 26-66 Hung -67
Star-Nielsen 196 199 100 48 Hung -63
Cvoter-The Week 186 234 112 11 Hung -28
Star-Nielsen 191 203 104 45 Hung -59
Times of India 195 201 82 65 Hung -61
Opinion polls
Error margin in
predicting UPA
Exit polls

Nomura | Asia Economic Monthly 10 May 2019
26
Fig. 22: 2004 elections: Opinion and exit polls versus actual
*UPA+ comprises of UPA and the parties that provided outside support to it. Source: Rai, Praveen (2014), “Status of Opinion Polls”, Economic & Political Weekly, Vol. 49, Issue No. 16, 19 Apr, 2014; and Nomura Global Economics
The same happened in the 2009 elections, albeit with the Indian National Congress
(INC) led coalition, the United Progressive Alliance (UPA). Exit polls in 2009 failed to
predict the continued popularity of the UPA government, getting it wrong by a higher
margin than the opinion polls (Figure 21). Almost all pollsters were off by a similar margin
of 60-70 seats, with Cvoter’s opinion closest to the final result. The 2004 general
elections were also poorly predicted (Figure 22). Most opinion and exit polls were
significantly off the mark – predicting an NDA majority, while the vote swung in favour of
the UPA.
Bottom line Pollsters’ records suggest opinion polls should be taken with a generous pinch of salt.
We remain cautious about predictions of an outright victory for the incumbent party.
While skirmishes with Pakistan have refocused voters’ minds on national security, the
BJP remains vulnerable to economic issues such as unemployment and farm distress
(see Postcard from India, 18 March 2019). Second, despite the popularity of Prime
Minister Modi, there could be anti-incumbent sentiment against local members of
parliament at the constituency level. We continue to believe the elections will most likely
result in a more fractured mandate with the BJP emerging as the single-largest party,
enabling it to form the ruling coalition.
Fig. 23: Electoral scenarios
Source: Nomura Global Economics
Will this materially change the economics agenda?
Looking at the BJP and INC’s manifestos in detail we believe their economic agendas
remain broadly similar – with an increased impetus on alleviating farm distress and
poverty, with the focus on health, education, infrastructure and GST rationalisation (see
India Election Watch #7: BJP’s manifesto refrains from one-upmanship of populism, 8
April 2019). The contrast is primarily on their attitudes towards revenue expenditure – the
INC’s manifesto has a stronger bias towards social sector spending and entitlement
economics (Figure 24).
Polling agency NDA UPA Others Verdict
Final Result 181 218 144 UPA+*
Aajtak ORG -MARG 248 190 105 Hung -28
NDTV-AC Nielsen 230-250 190-205 100-120 Hung -21
Star News-C-Voter 263-275 174-186 86-98 Hung/NDA -38
Zee-Taleem 249 176 117 Hung -42
Sahara-DRS 263-278 171-181 92-102 Hung/NDA -42
Outlook-MDRA 280-290 159-169 89-99 NDA -54
Opinion and exit polls
Error margin in
predicting UPA
Scenario A Scenario B Scenario C Scenario D
Political outcomeNDA wins, BJP wins
over 272 seats
NDA wins, but BJP
loses absolute majority
INC led non-BJP
coalition
Third Front of non-
BJP parties
Probability
(Nomura)10% 60% 25% 5%
Who forms the
government?
BJP with few coalition
partners; Modi as the
PM
NDA with a few more
coalition partners;
Modi as PM
INC with crucial
support from coalition
partners. Rahul
Gandhi potential PM
candidate
A coalition of regional
parties with the
outside support of INC
Economic outlookNear term: Positive
Medium term: Positive
Near term: Neutral
Medium term: Positive
Near term: Negative
Medium term: Neutral
Near term: Negative
Medium term:
Negative
Reform outlook
Policy continuity.
Faster execution;
fiscal consolidation;
focus on infrastructure
& rural; reforms on
land, labour & banking
possible
Executive decisions
and focus on stable
macro policy-making
likely to continue.
Lesser centralised
decision-making as
checks and balances
likely from coalition
partners.
Administrative reforms
on slow burner.
Increase in populism;
prioritisation of
revenue over capital
expenditure;
rationalisation of GST
tax slabs; more farm-
friendly populist
policies.
Populism; lack of
coherent policy
framework;
heightened political
uncertainty as risk of a
short-lived coalition
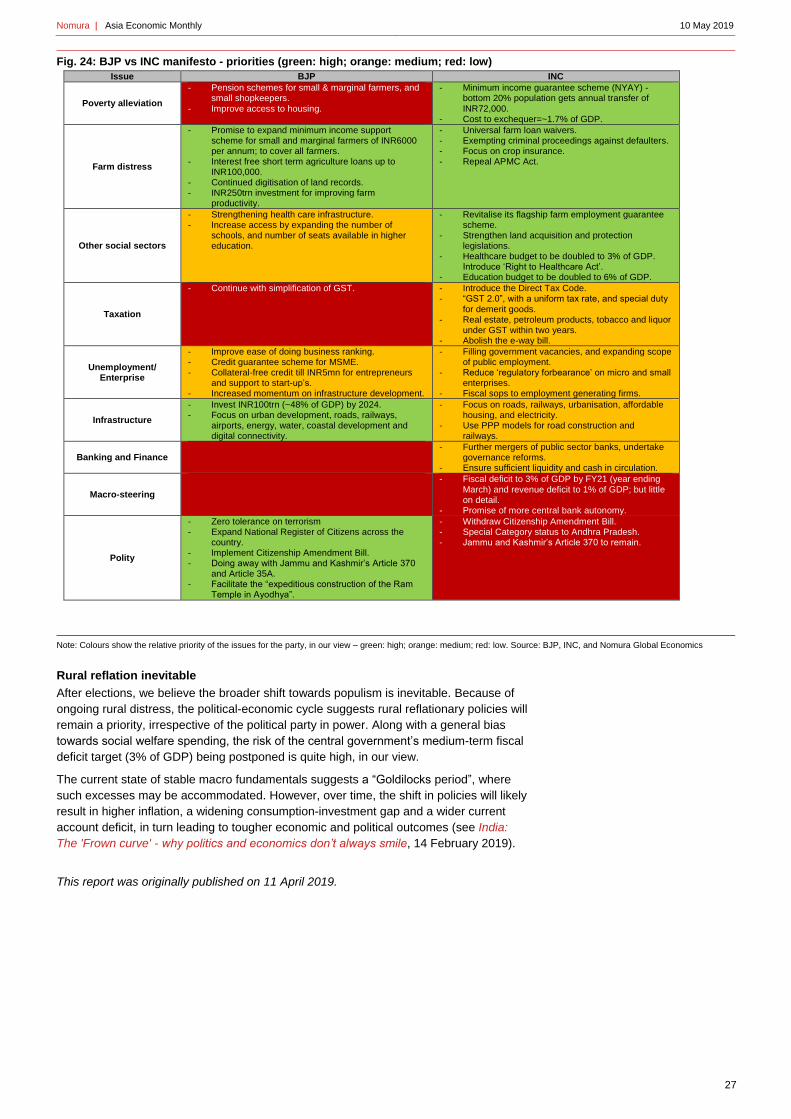
Nomura | Asia Economic Monthly 10 May 2019
27
Fig. 24: BJP vs INC manifesto - priorities (green: high; orange: medium; red: low)
Note: Colours show the relative priority of the issues for the party, in our view – green: high; orange: medium; red: low. Source: BJP, INC, and Nomura Global Economics
Rural reflation inevitable
After elections, we believe the broader shift towards populism is inevitable. Because of
ongoing rural distress, the political-economic cycle suggests rural reflationary policies will
remain a priority, irrespective of the political party in power. Along with a general bias
towards social welfare spending, the risk of the central government’s medium-term fiscal
deficit target (3% of GDP) being postponed is quite high, in our view.
The current state of stable macro fundamentals suggests a “Goldilocks period”, where
such excesses may be accommodated. However, over time, the shift in policies will likely
result in higher inflation, a widening consumption-investment gap and a wider current
account deficit, in turn leading to tougher economic and political outcomes (see India:
The 'Frown curve' - why politics and economics don’t always smile, 14 February 2019).
This report was originally published on 11 April 2019.
Issue BJP INC
Poverty alleviation
- Pension schemes for small & marginal farmers, and small shopkeepers.
- Improve access to housing.
- Minimum income guarantee scheme (NYAY) - bottom 20% population gets annual transfer of INR72,000.
- Cost to exchequer=~1.7% of GDP.
Farm distress
- Promise to expand minimum income support scheme for small and marginal farmers of INR6000 per annum; to cover all farmers.
- Interest free short term agriculture loans up to INR100,000.
- Continued digitisation of land records. - INR250trn investment for improving farm
productivity.
- Universal farm loan waivers. - Exempting criminal proceedings against defaulters. - Focus on crop insurance. - Repeal APMC Act.
Other social sectors
- Strengthening health care infrastructure. - Increase access by expanding the number of
schools, and number of seats available in higher education.
- Revitalise its flagship farm employment guarantee scheme.
- Strengthen land acquisition and protection legislations.
- Healthcare budget to be doubled to 3% of GDP. Introduce ‘Right to Healthcare Act’.
- Education budget to be doubled to 6% of GDP.
Taxation
- Continue with simplification of GST. - Introduce the Direct Tax Code. - “GST 2.0”, with a uniform tax rate, and special duty
for demerit goods. - Real estate, petroleum products, tobacco and liquor
under GST within two years. - Abolish the e-way bill.
Unemployment/ Enterprise
- Improve ease of doing business ranking. - Credit guarantee scheme for MSME. - Collateral-free credit till INR5mn for entrepreneurs
and support to start-up’s. - Increased momentum on infrastructure development.
- Filling government vacancies, and expanding scope of public employment.
- Reduce ‘regulatory forbearance’ on micro and small enterprises.
- Fiscal sops to employment generating firms.
Infrastructure
- Invest INR100trn (~48% of GDP) by 2024. - Focus on urban development, roads, railways,
airports, energy, water, coastal development and digital connectivity.
- Focus on roads, railways, urbanisation, affordable housing, and electricity.
- Use PPP models for road construction and railways.
Banking and Finance - Further mergers of public sector banks, undertake
governance reforms. - Ensure sufficient liquidity and cash in circulation.
Macro-steering
- Fiscal deficit to 3% of GDP by FY21 (year ending March) and revenue deficit to 1% of GDP; but little on detail.
- Promise of more central bank autonomy.
Polity
- Zero tolerance on terrorism - Expand National Register of Citizens across the
country. - Implement Citizenship Amendment Bill. - Doing away with Jammu and Kashmir’s Article 370
and Article 35A. - Facilitate the “expeditious construction of the Ram
Temple in Ayodhya”.
- Withdraw Citizenship Amendment Bill. - Special Category status to Andhra Pradesh. - Jammu and Kashmir’s Article 370 to remain.

Nomura | Asia Economic Monthly 10 May 2019
28
Asia Economics
Aurodeep Nandi - NFASL [email protected] +91 22 4037 4087
Sonal Varma - NSL [email protected] +65 6433 6527
India: Global headwinds, Indian sails
Expect a ~20-25bp drag on GDP growth in FY20.
• Our below-consensus projection of sub-7% GDP growth in FY20 (year ending March
2020) reflects our cautious outlook on global growth and the lagged effects of tight
domestic financial conditions. In this note, we detail the various transmission
mechanisms through which a global shock could affect India.
• There are three key channels through which a global growth shock can be transmitted:
the trade channel (export demand), the terms-of-trade channel (through commodity
prices), and the financial flows channel (balance of payment funding). Currently, we
believe the trade and terms-of-trade channels are drags on India’s growth, while the
financial flows channel has turned positive.
• Trade channel (negative): The slowdown in India’s major export destinations may
have a spill-over effect on manufacturing and the investment cycle.
• Terms of trade channel (negative): Weak global demand should have lowered
commodity prices, but oil prices have risen on supply concerns. This negative supply-
side shock should be a drag on growth.
• Financial flows channel (positive): Widespread expectations of easier policies
globally have revived capital inflows into India, particularly through the global
confidence channel. This should ease financial conditions at the margin and support
growth.
• Impact on India’s growth: On balance, we expect a ~20-25bp drag on GDP growth
from global factors, with the strongest impacts on fixed capital investment and exports
on the demand side, and the manufacturing, construction and “trade, hotels, transport
& communication” sectors on the supply side. Much of the global spill-over should be
evident over the next two quarters. We expect GDP growth to slow to 6.2-6.3% in H1
2019, from 6.6% in Q4 2018, as the (negative) trade and terms-of-trade channels weigh
on GDP growth in the near term, before the (positive) financial flows channel lifts
growth back towards 7% by end-2019.
The crux of the issue
A key distinction of our macro outlook from others in the market is our view of GDP
growth. We expect GDP growth to slow to 6.8% in FY20 (year ending March) from 7% in
FY19, in contrast to the more optimistic consensus. The Reserve Bank of India (RBI) and
consensus1 expect GDP growth to accelerate to 7.2% in FY20; while the IMF expects
growth to be a shade higher at 7.3%2.
Why do we have this out-of-consensus call on growth? As we elaborated in our
recent note (see India: Are we too pessimistic on growth? 6 March 2019), we see two
near-term challenges: (1) weak global demand, which will likely hurt exports and the
investment cycle; and (2) the lagged effects of tight domestic financial conditions from
2018, exacerbated by the shadow banking crisis. In our view, these are likely to
overshadow policy easing tailwinds, owing to near-term transmission challenges (Figure
24). In our view, global growth will be an important determinant of the quarterly profile of
domestic growth (Figure 25), which we expect to pick up pace in H2 2019.
1 Based on Consensus Economics, April 2019.
2 “What the IMF says about the outlook for the Indian economy”, Moneycontrol, 10 April, 2019.
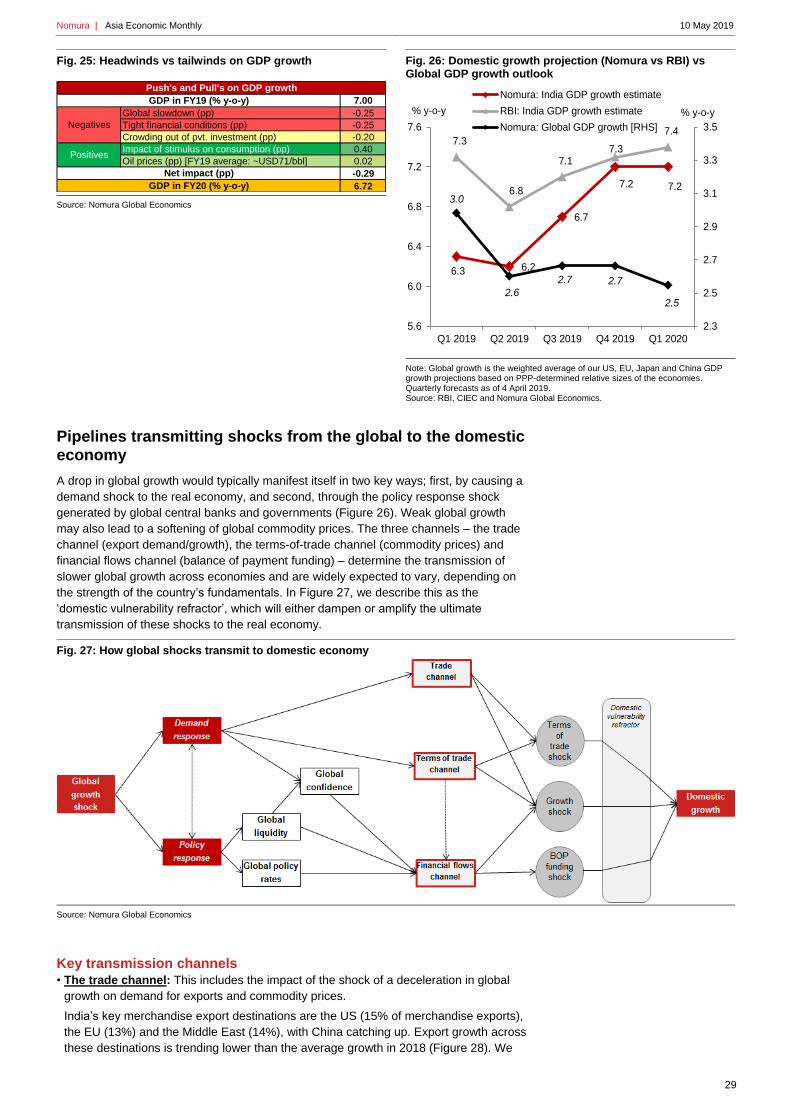
Nomura | Asia Economic Monthly 10 May 2019
29
Fig. 25: Headwinds vs tailwinds on GDP growth
Source: Nomura Global Economics
Fig. 26: Domestic growth projection (Nomura vs RBI) vs Global GDP growth outlook
Note: Global growth is the weighted average of our US, EU, Japan and China GDP growth projections based on PPP-determined relative sizes of the economies. Quarterly forecasts as of 4 April 2019. Source: RBI, CIEC and Nomura Global Economics.
Pipelines transmitting shocks from the global to the domestic economy
A drop in global growth would typically manifest itself in two key ways; first, by causing a
demand shock to the real economy, and second, through the policy response shock
generated by global central banks and governments (Figure 26). Weak global growth
may also lead to a softening of global commodity prices. The three channels – the trade
channel (export demand/growth), the terms-of-trade channel (commodity prices) and
financial flows channel (balance of payment funding) – determine the transmission of
slower global growth across economies and are widely expected to vary, depending on
the strength of the country’s fundamentals. In Figure 27, we describe this as the
‘domestic vulnerability refractor’, which will either dampen or amplify the ultimate
transmission of these shocks to the real economy.
Fig. 27: How global shocks transmit to domestic economy
Source: Nomura Global Economics
Key transmission channels • The trade channel: This includes the impact of the shock of a deceleration in global
growth on demand for exports and commodity prices.
India’s key merchandise export destinations are the US (15% of merchandise exports),
the EU (13%) and the Middle East (14%), with China catching up. Export growth across
these destinations is trending lower than the average growth in 2018 (Figure 28). We
7.00
Global slowdown (pp) -0.25
Tight financial conditions (pp) -0.25
Crowding out of pvt. investment (pp) -0.20
Impact of stimulus on consumption (pp) 0.40
Oil prices (pp) [FY19 average: ~USD71/bbl] 0.02
-0.29
6.72
Push's and Pull's on GDP growth
GDP in FY19 (% y-o-y)
Net impact (pp)
GDP in FY20 (% y-o-y)
Negatives
Positives
6.3 6.2
6.7
7.2 7.2
7.3
6.8
7.17.3
7.4
3.0
2.6
2.7 2.7
2.5
2.3
2.5
2.7
2.9
3.1
3.3
3.5
5.6
6.0
6.4
6.8
7.2
7.6
Q1 2019 Q2 2019 Q3 2019 Q4 2019 Q1 2020
% y-o-y% y-o-y
Nomura: India GDP growth estimate
RBI: India GDP growth estimate
Nomura: Global GDP growth [RHS]

Nomura | Asia Economic Monthly 10 May 2019
30
find that peaks and troughs in the global growth cycle broadly coincide with that of the
export cycle, with India accounting for ~1.7% of global exports3. Kapur and Mohan
(2014)4 estimate that for every 1pp reduction in global GDP growth, Indian export
growth falls by 2.6-3.6pp. Consequently, with exports accounting for ~20% of GDP, a
1pp fall in global growth leads to a first-round impact of ~0.5-0.7pp on domestic GDP
growth.
Second-round impact: Merchandise exports account for ~14% of total manufacturing
production, while manufacturing gross capital formation makes up ~8.5% of GDP5. In
Figure 30, we construct de-trended cyclical indices of exports (merchandise and
services) and investment. While the investment cycle is a function of various domestic
factors (business sentiment, public capex, real interest rates etc.), we find phases of
co-movement between export and investment cycles. Our back-of-the-envelope
calculation suggests that every 10pp fall in merchandise export growth leads to a
~0.1% of GDP reduction of manufacturing investment.
Fig. 28: Performance across export destinations
Source: CEIC and Nomura Global Economics
Fig. 29: Merchandise exports vs global GDP growth
Note: Global growth is the weighted average of our US, EU, Japan and China GDP growth projections based on relative size of the economies according to PPP. Quarterly forecasts as of 4 April 2019. Source: CEIC and Nomura Global Economics
3 World Trade Organisation.
4 Kapur, Muneesh and Mohan, Rakesh (2014), “India’s Recent Macroeconomic Performance: An Assessment and
Way Forward”, IMF Working Paper No. 14/68. 5 Gupta, Isha (2019), “India’s Faltering Demand Conditions”, Economic and Political Weekly, Vol. 54, Issue No. 5,
2 February 2019.
EU
(13%)
US
(15%)
China
(4%)
AeJ-ex
China
(16%)
Japan
(1%)
ME
(14%)Others
Feb-18 13.3 19.5 19.3 (12.7) (5.2) (3.8) 9.4
Mar-18 (1.6) 14.7 30.8 (18.6) 11.4 (15.3) 4.7
Apr-18 6.8 12.5 31.9 (11.1) 16.1 (0.6) 9.8
May-18 39.3 11.5 77.4 6.8 3.9 9.3 28.1
Jun-18 29.5 8.7 82.3 23.8 14.7 1.8 18.0
Jul-18 16.5 13.6 38.2 1.8 (18.4) 32.1 17.6
Aug-18 24.8 23.6 32.4 18.9 5.6 8.4 18.4
Sep-18 (4.3) (1.0) 21.9 4.4 (8.3) (20.9) (0.8)
Oct-18 9.1 25.4 14.4 24.0 26.8 25.5 9.1
Nov-18 1.9 (3.9) 22.4 5.7 (27.9) (1.4) (3.4)
Dec-18 2.8 4.2 21.9 (3.4) 18.6 4.5 (5.8)
Jan-19 (2.1) 9.1 9.2 (13.2) (0.0) 32.7 7.0
Feb-19 0.1 6.7 6.3 (6.0) 22.8 10.7 2.2
2017 15.6 10.4 41.3 4.5 25.3 17.2 0.4
2018 12.4 12.0 30.4 9.4 2.1 5.5 1.2
-3.0
-2.0
-1.0
0.0
1.0
2.0
3.0
4.0
5.0
6.0
-40
-30
-20
-10
0
10
20
30
40
50
60
70
% y-o-y% y-o-y
Merchandise exports (% y-o-y)
Global GDP growth (% y-o-y) [RHS]
F

Nomura | Asia Economic Monthly 10 May 2019
31
Fig. 30: Export cycle vs investment cycle
Note: The indices are derived by de-trending and de-seasonalising the series and then extracting the cyclical component, and finally smoothing it across a rolling 3-month average. Source: CEIC and Nomura Global Economics estimates.
Fig. 31: Commodity prices versus terms of trade
Note:𝐶𝑜𝑟𝑒 𝑇𝑒𝑟𝑚𝑠 𝑜𝑓 𝑡𝑟𝑎𝑑𝑒 =𝑁𝑜𝑛−𝑜𝑖𝑙 𝑒𝑥𝑝𝑜𝑟𝑡 𝑝𝑟𝑖𝑐𝑒 𝑖𝑛𝑑𝑒𝑥
𝑁𝑜𝑛−𝑜𝑖𝑙 & 𝑔𝑜𝑙𝑑 𝑖𝑚𝑝𝑜𝑟𝑡 𝑝𝑟𝑖𝑐𝑒 𝑖𝑛𝑑𝑒𝑥× 100 Source: CEIC,
Bloomberg, Nomura Global Economics
• The terms of trade channel: The global economic slowdown is generally
accompanied by less demand for commodities. China’s growth outlook has become
increasingly relevant, accounting for ~23% of energy consumption and ~50% of metals’
consumption6. As India remains a net importer of commodities, the price trajectory
affects India’s terms of trade. We estimate a negative correlation of 0.60 between the
core terms of trade (ratio of non-oil export price index to non-oil and gold import price
index) and the Bloomberg Commodity Index (Figure 31). The sharp correction in
commodity prices in 2016 led to an equivalent steep improvement in the terms of trade.
However, since then, it has deteriorated considerably even though the uptrend in
commodity prices has been largely secular.
• Financial flows channel: The outlook for global growth affects financial flows to
emerging markets, in turn affecting domestic growth and the financing of the current
account. Some of these flows may be driven by the yield differential between global
and domestic rates, while others remain contingent on the tightness of global liquidity
and the extent of risk aversion. On the surface, increased risk-taking, ample global
liquidity and high yield differentials should encourage inflows.
Does the yield differential matter? Not always. Peaks and troughs in the
trajectory of the real yield differential between India and the US have been
associated in the past with similar foreign institutional investment (FII) inflow
dynamics, notably in 2015 and 2017 (Figure 32). However, it is not the only factor
that affects FII inflows, as is evident in the trends since 2018 which have seen a
clear divergence between the two.
Does global sentiment matter? The strong FII inflows into India in 2014 occurred
despite elevated risk sentiment in the global market, as evidenced by the elevated
levels of the VIX index (Figure 33). However, since 2017, there has been a more
direct co-movement between the two. Inflows in 2017 and outflows in 2018 have
coincided with increased risk-on and risk-off, respectively. It seems that global
sentiment plays a more important role than the yield differentials in driving foreign
investment inflows.
What about the state of global liquidity? Capital flows into India have risen
sharply with the outset of unconventional monetary policy by central banks in the
advanced economies (Figure 34). In fact, there have been phases of seasonal
drawdowns of quantitative easing (QE) that have not translated into a
commensurate reduction in flows for India. Nevertheless, gross foreign inflows have
peaked since Q1 2018, in tandem with the definitive shift from QE to quantitative
tightening.
6 “Commodity Markets Outlook – The Changing of the Guard: Shifts in Commodity Demand”, World Bank Group,
October 2018.
-2.0
-1.5
-1.0
-0.5
0.0
0.5
1.0
1.5
2.0
Dec-06 Dec-08 Dec-10 Dec-12 Dec-14 Dec-16 Dec-18
Export cycle index (3 month moving average)
Investment cycle index (3 month moving average)
60
70
80
90
100
110
120
130
140
150
95
100
105
110
115
120
125
130
Mar-14 Mar-15 Mar-16 Mar-17 Mar-18 Mar-19
Core Terms of trade
Bloomberg Commodity index [RHS]

Nomura | Asia Economic Monthly 10 May 2019
32
Fig. 32: US-India real interest rate differential vs FII inflows
Source: Bloomberg, CEIC and Nomura Global Economics
Fig. 33: Global sentiment (VIX index) vs FII inflows
Source: Bloomberg, CEIC and Nomura Global Economics
Fig. 34: Change in total G4 central bank assets and EM FX reserves versus capital inflows to India
Note: G4 central banks assets = assets on the balance sheet of the Fed, ECB, BoE and BOJ. EM FX reserves = total FX reserves (adjusted for exchange rate valuation and coupon effects) for 20 large EM economies. Total gross inflows into India = net increase in liabilities of FDI, portfolio investment, other investment and financial derivatives. Forecast is based on the Fed’s forward guidance (increasing the roll off of its UST and MBS holdings each quarter), assuming the ECB tapers its asset purchases in October to EUR15bn and ceases its asset purchases in November, the BOJ continues buying JGBs at a de facto annualised rate of JPY40trn in 2018, JPY35trn in 2019 and JPY30 in 2020, and the BoE continues to hold its balance sheet constant, We assume EM FX reserves are constant. Source: Macrobond, Bloomberg, CEIC and Nomura.
Which sectors will be affected? We construct a heat-map of the cross-correlation between various components of GDP
growth and global GDP growth across various lags (Figure 35). We find that there is a
strong concurrent correlation between global GDP growth and domestic GDP growth up
to two quarters. Interestingly, the sub-component with the strongest correlation is fixed
capital investment, with the global growth impulse influencing it for up to 2-3 quarters,
before subsequently fading. The concurrent impact on exports is limited, but the impact
peaks with a 1-2 quarter lag. Interestingly, there is a negative, albeit weak, correlation
between government spending and global GDP growth, suggesting a mild element of
counter-cyclicality in fiscal policy.
On the supply side, we see manufacturing GVA reacting strongly concurrently with global
GDP growth and, to some extent, construction. The latter could possibly reflect the spill-
over impact of global growth on FDI inflows in the sector. Within services, we observe a
maximum short-term impact in the “trade, hotels, transport & communication” segment.
Finally, in line with the observations on the demand side, “community, social and
personal services”, which are proxies for government spending, show a negative
correlation with global growth.
(6.0)
(4.0)
(2.0)
0.0
2.0
4.0
6.0
8.0
(5.0)
(4.0)
(3.0)
(2.0)
(1.0)
0.0
1.0
2.0
3.0
4.0
5.0
Mar-13 Mar-14 Mar-15 Mar-16 Mar-17 Mar-18 Mar-19
Net FII flows (USD bn; 3 month MA) [RHS]
India-US 10 year real rate differential (pp) [LHS]
-6.0
-4.0
-2.0
0.0
2.0
4.0
6.0
8.0
6.0
6.5
7.0
7.5
8.0
8.5
9.0
Mar-13 Mar-14 Mar-15 Mar-16 Mar-17 Mar-18 Mar-19
Net FII flows (USD bn; 3 month MA) [RHS]
VIX index (3 month MA) [LHS]
0
10
20
30
40
50
-1500
-1000
-500
0
500
1000
1500
2000
2500
3000
3500
4000
Mar-02 Mar-04 Mar-06 Mar-08 Mar-10 Mar-12 Mar-14 Mar-16 Mar-18 Mar-20
USD bn, 4q rolling sumUSD bn, 4q rolling sum Change in EM FX reserves
Change in G4 central bank assets
Total gross inflows into India [RHS]
F

Nomura | Asia Economic Monthly 10 May 2019
33
Fig. 35: Impact of global GDP growth on domestic GDP components' growth
Note: *Global growth= weighted average of US, EU, Japan and China GDP growth based on relative PPP values. Source: CEIC and Nomura Global Economics
What does this mean for the outlook?
Having explored the transmission channels and vulnerable sectors, we move to our
outlook for the global economy and what that means for India.
Outlook for global growth
Globally, we believe there are clear signals of a synchronised cyclical slowdown, with the
speed and quantum of recovery contingent on the extent of policy support available. We
think it will be a story of two halves, and the recovery through 2019 and 2020 will be
largely driven by emerging markets (Figure 36; see Asia in 2019: Always darkest before
the dawn, 10 December 2018). We expect developed market (DM) growth to remain low
at 1.6% in 2019 and 1.5% in 2020 and emerging market (EM) growth to slow temporarily
to 4.5% before recovering to 5.0% in 2020. Overall, we expect global growth7 to bottom
out in Q2 at 2.6% before mildly recovering in H2 to 2.7% (Figure 37).
Outlook for global policy
The grim outlook for global growth has set the stage for a neutral policy setting. We
expect the Federal Reserve to stay on hold through 2020 and, the balance sheet roll-off
to end in Q4 2019. In the case of the ECB, although we expect the first hike in March
2020, markets are pricing in an exceptionally flat curve (with the risk of a loosening). In
the case of Japan, we expect an unchanged policy status quo. Overall, we believe that
global liquidity appears set to shift towards neutral in 2019 from tightening in 2018. As
EM growth prospects look brighter than in the DM, we think the conditions are perfect for
capital flows to once again favour EM markets.
7 Weighted average of GDP growth of US, EU, Japan, and China based on relative PPP values as of 2016.
GDP/GVA components 0 1 2 3 4
GDP 0.75 0.53 0.25 0.02 -0.20
Private Consumption 0.24 0.23 0.23 0.22 0.17
Govt. Consumption -0.17 -0.11 -0.13 -0.11 0.00
Fixed Investment 0.72 0.62 0.42 0.25 0.10
Exports 0.46 0.56 0.53 0.42 0.24
Imports 0.39 0.49 0.45 0.34 0.21
GVA 0.62 0.47 0.27 0.13 0.01
Manufacturing 0.56 0.38 0.16 0.01 -0.10
Construction 0.47 0.39 0.35 0.34 0.33
Trade, Hotels, Transport &
Communication0.58 0.41 0.17 -0.06 -0.23
Financing, Insurance, Real
Estate & Business Service0.04 0.13 0.25 0.34 0.37
Community, Social and
Personal Services-0.43 -0.38 -0.30 -0.16 0.05
Quarterly lags of global GDP growth*
Correlation of global GDP growth on domestic GDP components' growth

Nomura | Asia Economic Monthly 10 May 2019
34
Fig. 36: Nomura global GDP growth projections
Note: Global GDP growth based on PPP adjusted shares covering ~84% of the global economy. Forecasts as of 3 May 2019. Source: IMF and Nomura Global Economics
Fig. 37: Nomura global versus India growth projection
Global growth is the weighted average of our US, EU, Japan and China GDP growth projections based on PPP-determined relative size of the economies. Quarterly forecasts as of 4 April 2019. Source: CEIC and Nomura Global Economics
Implications for domestic outlook On the negative side, most of India’s exports go to DM, and the extended slowdown will
inevitably lead to a slowdown in export growth (Figure 29). This, in turn, should have
spill-over effects on the investment cycle (Figure 30), especially as private investment
demand remains weak, and the fiscally stretched public sector can offer less support.
Our correlation heat-map (Figure 35) suggests the spill-over effects will extend to the
manufacturing, construction and “trade, hotels, transport & communication” segments.
On the positive side, the combination of weak growth, the global policy pivot towards
easing and the divergence between EM and DM should encourage foreign inflows into
India, particularly through the global confidence channel (Figure 33). Rising capital
inflows should ease financial conditions at the margin and be growth positive over time.
However, with commodity prices, especially oil, already higher owing to supply-side
concerns, the part of the positive financial flow channel effect will be offset by the
negative terms-of-trade shock.
Which of these forces will be more dominant? We believe the headwinds from the
export-investment channel and higher oil prices will dampen the positive effects from
higher capital flows, especially in the near term. The RBI estimates that a 50bp fall in
global growth below baseline leads to a 15-20bp fall in domestic growth. Given our
assessment of global growth, we project a ~20-25bp drag on domestic growth.
How does this fit the overall growth story? As we had alluded to earlier in this note, the global growth slowdown has been one of
the drags on India’s growth momentum. The full effects of tight domestic financial
conditions from last year are still playing out. While the shadow banking crisis (see India:
Shadow banks overshadow growth, 4 October 2018) appears contained on the surface,
subsurface cracks have formed. Banks have stepped up credit expansion, but much of
this has been redirected towards retail lending or pumped back into rescue lending to
better-rated shadow banks. This, in turn, is creating an inevitable liquidity crunch on
segments that had become reliant on shadow banks over the past few years, and we are
already observing pain among small and medium-sized enterprises and the commercial
real estate sector (see NBFC/HFC liquidity: CRE funding at risk, 16 February 2019).
In addition to this, the escalation in crude oil prices may lead to another headwind. We
estimate every USD10/bbl increase leads to a slowdown in real GDP growth by ~15bp,
and so far prices have already escalated by ~USD16/bbl (albeit from a very low base).
Not surprisingly, the Nomura Composite Leading Index, which has a one-quarter lead
over non-agricultural GDP growth, has been consistently falling from its peak in mid-
2018 (Figure 38). It presently points to the slowdown continuing well into Q2 2019,
reinforcing our view that the slowdown in Q4 2018 wasn’t a blip (see India: Cyclical
2018 2019f 2020f
Global 3.9 3.3 3.5
DM 2.2 1.7 1.5
EM 5.2 4.5 5.0
US 2.9 2.6 1.7
Euro Area 1.8 1.2 1.4
Germany 1.5 0.7 1.3
France 1.6 1.2 1.2
Italy 0.8 0.1 0.6
Spain 2.6 2.4 1.6
UK 1.4 1.2 1.4
Japan 0.8 0.1 0.6
Australia 2.8 2.1 2.6
Canada 1.8 1.5 1.9
0.0
2.0
4.0
6.0
8.0
10.0
12.0
1.0
1.5
2.0
2.5
3.0
3.5
4.0
4.5
5.0
Dec-09 Dec-11 Dec-13 Dec-15 Dec-17 Dec-19
Global GDP growth
India (non-agri GDP) 2Qmoving average, rhs
% y-o-y
F
% y-o-y

Nomura | Asia Economic Monthly 10 May 2019
35
slowdown becomes entrenched, 28 February 2019), and the sub-7% growth phase is
likely to last until Q3 2019.
Bottom-line: We expect a ~20-25bp drag on GDP growth from global factors, with the
strongest impact on fixed capital investment and exports on the demand side, and
manufacturing, construction and “trade, hotels, transport & communication” sectors on
the supply side. We believe much of the global spill-over will be evident in the next two
quarters. We expect GDP growth in India to slow to 6.2-6.3% in H1 2019, from 6.6% in
Q4 2018, as the (negative) trade and terms-of-trade channels weigh in the near term
before the (positive) financial flows channel lifts growth back towards 7% by end-2019.
Fig. 38: Leading index suggests further slowdown
Nomura Composite Leading Index (CLI)
Source: CEIC and Nomura Global Economics estimates.
This report was originally published on 6 May 2019.
2
3
4
5
6
7
8
9
10
11
12
96
97
98
99
100
101
102
103
Jun-03 Jun-07 Jun-11 Jun-15 Jun-19
%, y-o-yIndex Non-agriculture GDP growth (2qma), rhs
Nomura CLI, lhs

Nomura | Asia Economic Monthly 10 May 2019
36
Asia Economics
Minoru Nogimori - NIHK [email protected] +852 2252 6462
Asia Rates Strategy
Albert Leung - NIHK [email protected] +852 2252 1401
Korea: April data for exports and inflation suggest weak underlying trend
We maintain our below-consensus outlook as economic headwinds should intensify.
• Exports declined by 2.0% y-o-y in April (Consensus: -5.9%) after an 8.2% fall in
February. Working-day-adjusted exports fell by 6.1% in April after a 4.1% fall in March.
• Headline CPI inflation rose to 0.6% y-o-y in April (Consensus: 0.4%) from 0.4% in
March due to higher energy prices.
• Does this change our economic view? No. Although better-than-expected April data
showed slightly positive signs, their underlying trend likely remain weak, and we believe
intensifying economic headwinds should weigh on the economy and inflation for 2019.
We maintain our below-consensus 2019 GDP growth (1.8%) and CPI inflation (0.8%)
forecasts. We continue to expect the BOK to cut the policy rate by 25bp to 1.50% in Q4
2019 and again to 1.25% Q1 2020.
• Strategy implications? Korea rates retraced back higher with some steepening after
the April exports and inflation data turned out slightly better than expected. We
currently recommend steepener (mainly 1s4s and 3s10s) alongside small extra receive
1y. We look to increase front-end receive on bounces, as we believe economic
headwinds will remain strong in upcoming months.
The contraction of exports (USD value) moderated to -2.0% y-o-y in April from -8.2% in
March. However, strong exports growth of vessels, which rose by 53.6%, contributed
significantly, which boosted April export growth by 2.0pp (Figure 39). Also, according
to Korea Customs Service, working-day-adjusted exports declined further to -6.1%
from -4.1%, suggesting the underlying trend for exports remains sluggish (Figure 40).
Indeed, our China economics team believes China’s growth has yet to truly bottom out
(see Asia Insights - China: The official manufacturing PMI falls in April, 30 April 2019).
Our tech analyst expects memory maker earnings to weaken before bottoming in Q3
2019 (see Korea memory - Back to the pre-DRAM consolidation era?, 12 April 2019).
Along with weaker external demand, the still-high inventory burden should continue to
curb production activity (see Asia Insights - Korea: Improved March activity data, 30 April
2019). Also, we believe the stimulus measures will be insufficient to fully offset
intensifying economic headwinds. We expect restructurings in some manufacturing
sectors, the minimum wage hike shock, and a housing market correction alongside
household debt deleveraging to likely weigh on local economic activity and the job
market. We therefore maintain our view that 2019 GDP growth will slow to 1.8% from
2.7% in 2018, below the BOK’s forecast of 2.5% and market consensus of 2.4% (see
Asia Insights - Korea: Lowering our 2019 GDP forecast, 25 April 2019).
Separately, April CPI inflation rose slightly due to a smaller contraction in energy prices
(Figure 41). However, core inflation stayed low at 0.9% y-o-y in April, and inflation
expectation declined further to 2.1% in April from 2.3%, suggesting further downside
pressure on underlying inflation (Figures 42).
Higher oil prices and the expiration of the temporary fuel tax cut (by 15%; effective from
16 November to 6 May 2019) should add some cost-push inflation in H2 2019. But lower
housing rental prices, muted nominal wage growth amid sluggish private sector job
creation/restructuring in some manufacturing sectors, digital disinflation (i.e., intensifying
price competition from the online retail sector) and stable agricultural prices will limit
inflation pressures substantially, in our view. We expect CPI inflation to slow to 0.8% in
2019 from 1.5% in 2018 (see Asia Insights - Korea: Low inflation for longer, 2 April
2019).
Our 2019 GDP growth (1.8%) and CPI inflation (0.8%) forecasts are below potential
GDP growth (Nomura estimate: 2.6%) and the BOK’s 2% target, respectively. We
continue to expect the BOK to cut the policy rate by 25bp to 1.50% in Q4 2019 and again
to 1.25% Q1 2020, while we see a risk of the earlier rate cut has receded somewhat as
the FOMC delivered more balanced message (see Policy Watch - May FOMC Recap, 2
May 2019).

Nomura | Asia Economic Monthly 10 May 2019
37
Fig. 39: Korea’s exports (USD custom basis)
Source: CEIC and Nomura Global Economics.
Fig. 40: Korea’s exports
Source: Korea Customs Service and Nomura Global Economics.
Fig. 41: Korea’s inflation
Source: CEIC and Nomura Global Economics.
Fig. 42: Korea’s inflation and expected inflation
Source: CEIC and Nomura Global Economics.
This report was originally published on 2 May 2019.
Share (%)
By destination 20182019
Apr
2019
Mar
2019
Jan-Apr
2018
Jan-Dec
China 26.8 -4.5 -15.6 -14.1 14.1USA 12.0 3.9 4.0 10.4 6.0EU 9.5 -2.0 -10.9 -3.3 6.7Vietnam 8.0 12.7 -2.5 0.4 1.8Japan 5.0 -8.2 -12.9 -6.6 13.8Middle East 3.6 -24.8 -25.6 -26.0 -11.3India 2.6 4.9 13.3 9.9 3.7
By product
Semiconductor 20.9 -13.5 -16.7 -19.4 29.4General Machinery 8.9 0.3 -1.4 0.5 10.2Petrochemistry 8.3 -5.7 -10.8 -8.9 11.9Petroleum Products 7.7 -2.6 -0.9 -4.2 32.3Automobile 6.8 5.8 -1.3 5.0 -1.9Steel Products 5.6 -7.7 -4.6 -3.3 -0.7Flat Panel Displays 4.1 -9.2 -16.4 -11.0 -9.9Automotive Parts 3.8 0.0 -0.8 2.2 -0.1Vessel 3.5 53.6 5.4 -8.7 -49.6Wireless Comm. Device 2.8 -4.0 -32.3 -21.9 -22.7
Total 100.0 -2.0 -8.2 -6.8 5.4
Growth (% y-o-y)
-25
-15
-5
5
15
25
35
Apr-15 Apr-16 Apr-17 Apr-18 Apr-19
Working-day adjusted exports: full-month
Exports: full-month
% y-o-y
-1.0
-0.5
0.0
0.5
1.0
1.5
2.0
2.5
3.0
Apr-17 Oct-17 Apr-18 Oct-18 Apr-19
Core CPI
Agricultural Products & Oils
CPI
%y-o-y
0.0
0.5
1.0
1.5
2.0
2.5
3.0
3.5
4.0
4.5
5.0
CPI
Core CPI
Consumer Survey Index-Expected Inflation
%y-o-y

Nomura | Asia Economic Monthly 10 May 2019
38
Asia Economics
Euben Paracuelles - NSL [email protected] +65 6433 6956
Malaysia: BNM kickstarts monetary easing in ASEAN
After today's 25bp cut to the policy rate, we see a rising likelihood BNM could do more this year
Bank Negara Malaysia (BNM) cut its overnight policy rate by 25bp to 3%, in line with our
long-held forecast and consensus expectations (which was nearly split; the Bloomberg
survey showed that 14 respondents called for a cut while 9 expected no change). This is
the first policy rate cut by BNM since July 2016.
In its policy statement, BNM cited “some signs of tightening financial conditions” and thus
the decision to cut its policy rate was “intended to preserve the degree of monetary
accommodativeness”. This is consistent with our analysis arguing that monetary
conditions have tightened more significantly in Malaysia than in other countries in the
region (except Thailand) and therefore this warranted a response (see Asia Chart Alert -
ASEAN: Sharply tightening monetary conditions in Thailand and Malaysia, 13 February
2019).
We also note that, in its Annual Report in March, BNM was explicit in signalling that the
priority of the monetary policy committee (MPC) was “to ensure that the stance of
monetary policy remains accommodative and supportive of real economic activity amid
relatively contained risks to inflation”. Therefore, we see today's decision as a credible
follow-through from previous signals, considering the growth-inflation mix.
Indeed, BNM appears to have emphasized some growth concerns, acknowledging that
the latest data point to "moderate economic activity” in Q1 and that, further out, “slowing
global demand conditions and subdued growth of key trading partners will continue to
weigh on the external sector”. BNM also continues to see downside risks to its 2019
GDP growth forecast of 4.3-4.8%.
In terms of inflation, BNM's assessment was left unchanged, and thus supports policy
easing. Despite recent increases in international crude oil prices, BNM reiterated that,
for this year, “average headline inflation is expected to be broadly stable compared to
2018,” and that underlying inflation is also “expected to remain stable”.
Overall, we think BNM has left the door open for further policy easing, which would likely
be prompted by a continued slowing of economic activity that ultimately disappoints BNM
forecasts amid a likely persistence of low and stable inflation. The MPC reiterated the
closing line in its statement that it “will continue to monitor and assess the balance of
risks surrounding the outlook for domestic growth and inflation”.
Taking this, our 2019 forecast for 4% GDP growth (which implies a further slowdown
after Q1) and 0.5% inflation (below BNM's forecast range of 0.7-1.7%) into account, we
see a rising likelihood of a further policy rate cut within the year, although our current
base case is one in which BNM leaves it at 3% throughout 2019. At 3%, we believe BNM
has scope to respond to a worse-than-expected growth downturn at a time when fiscal
policy is more constrained.
This report was originally published on 7 May 2019.
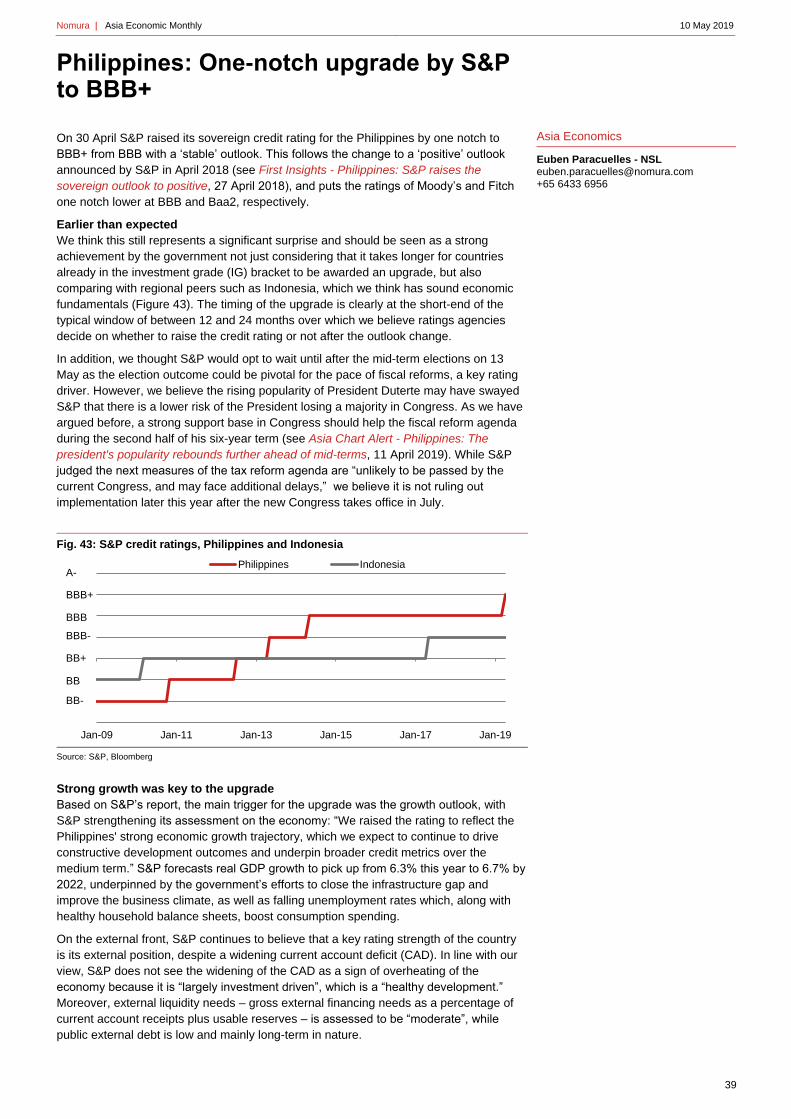
Nomura | Asia Economic Monthly 10 May 2019
39
Asia Economics
Euben Paracuelles - NSL [email protected] +65 6433 6956
Philippines: One-notch upgrade by S&P to BBB+
On 30 April S&P raised its sovereign credit rating for the Philippines by one notch to
BBB+ from BBB with a ‘stable’ outlook. This follows the change to a ‘positive’ outlook
announced by S&P in April 2018 (see First Insights - Philippines: S&P raises the
sovereign outlook to positive, 27 April 2018), and puts the ratings of Moody’s and Fitch
one notch lower at BBB and Baa2, respectively.
Earlier than expected
We think this still represents a significant surprise and should be seen as a strong
achievement by the government not just considering that it takes longer for countries
already in the investment grade (IG) bracket to be awarded an upgrade, but also
comparing with regional peers such as Indonesia, which we think has sound economic
fundamentals (Figure 43). The timing of the upgrade is clearly at the short-end of the
typical window of between 12 and 24 months over which we believe ratings agencies
decide on whether to raise the credit rating or not after the outlook change.
In addition, we thought S&P would opt to wait until after the mid-term elections on 13
May as the election outcome could be pivotal for the pace of fiscal reforms, a key rating
driver. However, we believe the rising popularity of President Duterte may have swayed
S&P that there is a lower risk of the President losing a majority in Congress. As we have
argued before, a strong support base in Congress should help the fiscal reform agenda
during the second half of his six-year term (see Asia Chart Alert - Philippines: The
president's popularity rebounds further ahead of mid-terms, 11 April 2019). While S&P
judged the next measures of the tax reform agenda are “unlikely to be passed by the
current Congress, and may face additional delays,” we believe it is not ruling out
implementation later this year after the new Congress takes office in July.
Fig. 43: S&P credit ratings, Philippines and Indonesia
Source: S&P, Bloomberg
Strong growth was key to the upgrade
Based on S&P’s report, the main trigger for the upgrade was the growth outlook, with
S&P strengthening its assessment on the economy: “We raised the rating to reflect the
Philippines' strong economic growth trajectory, which we expect to continue to drive
constructive development outcomes and underpin broader credit metrics over the
medium term.” S&P forecasts real GDP growth to pick up from 6.3% this year to 6.7% by
2022, underpinned by the government’s efforts to close the infrastructure gap and
improve the business climate, as well as falling unemployment rates which, along with
healthy household balance sheets, boost consumption spending.
On the external front, S&P continues to believe that a key rating strength of the country
is its external position, despite a widening current account deficit (CAD). In line with our
view, S&P does not see the widening of the CAD as a sign of overheating of the
economy because it is “largely investment driven”, which is a “healthy development.”
Moreover, external liquidity needs – gross external financing needs as a percentage of
current account receipts plus usable reserves – is assessed to be “moderate”, while
public external debt is low and mainly long-term in nature.
Jan-09 Jan-11 Jan-13 Jan-15 Jan-17 Jan-19
Philippines Indonesia
BB+
BB-
BBB-
BBB
BB
BBB+
A-

Nomura | Asia Economic Monthly 10 May 2019
40
Validating sound fundamentals…
Overall, while its timing was earlier than we expected the S&P upgrade is consistent with
our positive view on fiscal fundamentals as a result of tax reforms (see Asia Insights -
Philippines: TRAIN arrives, 4 January 2019), and the strong growth outlook, which is
increasingly driven by investment spending and hence lifting the country’s long-term
growth potential (see Asia Special Report - Philippines: Beyond words, 20 October
2016). As such, we believe the case for Fitch and Moody’s to follow suit this year with at
least a change to a ‘positive’ from ‘stable’ outlook is also strengthening.
…and providing room for near-term monetary policy easing
In terms of monetary policy, the positive reaction of domestic financial markets (the stock
market index was up 0.6% on 2 May) and the currency, in our view, would give Bangko
Sentral ng Pilipinas (BSP) more room to consider policy easing sooner rather than later.
We therefore reiterate our forecast that reserve requirement ratios (RRR) will be cut by
200bp within Q2. The case for RRR cuts in the near term is strengthened further by more
signs of tightening domestic liquidity conditions – BSP’s latest data release shows M3
money supply growth easing significantly to 4.2% y-o-y at end-March from 9.5% at end-
2018, well below nominal GDP growth (which we estimate at still double-digit rates in
Q1).
Beyond the RRR, we also continue to forecast 50bp in policy rate cuts in H2 2019,
starting in Q3. However, because of a benign inflation outlook, we see a rising likelihood
of an earlier cut, with BSP having scope to signal a more dovish shift at its next monetary
board meeting on 9 May, which would eventually pave the way for a policy rate cut at its
subsequent meeting on 20 June (see Asia Insights - Philippines: Evaluating double
inflation risks from oil prices and El Niño, 10 April 2019).
Limited implications for other peers particularly Indonesia
Based on S&P’s ratings, the Philippines is now two notches above its closest regional
peer, Indonesia, which is currently rated at BBB- with a ‘stable’ outlook. We do not
expect S&P’s upgrade on the Philippines to necessarily cast a more positive light on
other peers such as Indonesia. Historically, this two-notch differential between the two
countries is not new and was in place for example throughout 2014-17 (Figure 43).
However, we believe on its own merit Indonesia’s rating trajectory remains on an
uptrend. Following the recently concluded peaceful elections on 17 April, in which
President Jokowi won according to unofficial quick counts, we see a clear mandate,
which bodes well for policy continuity and reform prospects in Jokowi’s second and final
five-year term (see Asia Insights - Indonesia: A clear win for Jokowi , 17 April 2019).
Fiscal policy remains prudent and monetary policy credible. Coordinated policy efforts to
reduce pressure from the CAD are beginning to take effect and hence, unlike in the
Philippines, we are forecasting a narrowing of the CAD to 2.7% of GDP this year from
3% of GDP in 2018, reducing a key vulnerability (see Asia Insights - Indonesia: Another
surprise trade surplus in March, 15 April 2019).
This report was originally published on 2 May 2019.

Nomura | Asia Economic Monthly 10 May 2019
41
Asia Economics
Euben Paracuelles - NSL [email protected] +65 6433 6956
Asia FX Strategy
Craig Chan - NSL [email protected] +65 6433 6106
Asia Rates Strategy
Dushyant Padmanabhan - NSL [email protected] +65 6433 6526
Asia Ex-Japan Equity Strategy
Chetan Seth, CFA - NSL [email protected] +65 6433 6986
Indonesia: A clear win for Jokowi
The margin was smaller than polls suggested but it is still a strong mandate for a second term.
• According to unofficial quick counts, the Jokowi-Amin ticket has won the presidential
election by a 9.6 percentage point (pp) margin of victory. This is a smaller margin than
what was predicted by most recent pre-election surveys.
• Nonetheless, we think this is a decisive win that gives Jokowi a clear mandate and
bodes well for policy continuity and reform prospects. In the near term, it limits the risk
of the losing side disputing the result and questioning the credibility of the election. We
also now pencil in policy rate cuts by BI this year worth 50bp, delivered in Q4 2019.
• FX strategy: A victory for Jokowi – once confirmed – would be positive for policy
continuity and credibility and, in addition to an improving external environment, support
our medium-term bullish view on IDR.
• Rates strategy: Uncertainty from the elections could have been a factor behind the
recent slowing in bond inflows. A Jokowi victory could lead to a resumption of inflows,
adding to favourable local and global factors. We remain long 15y IndoGBs.
• Equity strategy: Jokowi’s victory, although largely expected, is likely to be well
received by the market, as locals had become a bit more concerned about a tight
margin of victory as the election approached. This win will ensure policy continuity and
increase hope for further reforms, which would be positive for the market. Meanwhile,
as valuations remain supportive, we maintain our Overweight Indonesian equities.
A clear win by Jokowi…
According to unofficial quick counts, President Joko Widodo (Jokowi) and his running
mate Maruf Amin won the presidential election. The various quick counts – which have in
the past been a good guide to the actual official election outcome – have been consistent
in showing the Jokowi-Amin ticket beating the Prabowo-Uno ticket with a margin of
victory of around 9.6pp on average (Figure 44). This is a smaller margin than what the
latest surveys before the election had shown (18-20pp; see Asia Insights - Indonesia:
Why a landslide Jokowi win is not that far-fetched, 13 March 2019).
However, assuming the quick count is validated by the official results in coming weeks,
we would still consider this a relatively decisive win. The margin is larger than in the
2014 election, when Jokowi-Kalla won by 6.3pp over Prabowo-Rajasa. As a result,
Jokowi will remain in office for a second (and final) five-year term with a clearer mandate,
garnering 54.8% of the popular vote, up from 53.2% in 2014.
Fig. 44: Quick count results
Note: Most of these polls account for above 90% of the total sample. Source: Kompas, The Jakarta Post, Metro TV, Bloomberg.
… limits the near-term risks of protest
In the near term, the margin of victory larger than in 2014 reduces the risk of Prabowo
contesting the result, which would have generated some concerns and uncertainty.
Nonetheless, similar to 2014, Prabowo is unlikely to concede quickly and instead opt to
wait for the official results. According to the timeline of the KPU (the General Election
Jokowi-Amin Prabowo-Uno Margin
Kompas 54.2 45.8 8.4
Indo Barometer 53.6 46.4 7.2
Charta Politika 54.3 45.7 8.6
Poltracking 55.0 45.0 9.9
Indikator 54.0 46.0 8.0
CSIS - Cyrus 55.6 44.4 11.2
LSI 55.3 44.7 10.7
SMRC 54.9 45.1 9.8
Voxpol 56.2 43.8 12.3
Average 54.8 45.2 9.6

Nomura | Asia Economic Monthly 10 May 2019
42
Commission), the official vote count will be performed from now until 22 May, but no date
has been set for the official announcement of the result.
In 2014, the official results were announced on 22 July (less than two weeks after the
election on 9 July). Prabowo rejected the official result, filing a protest with the
Constitutional Court (CC). A month later, the CC, however, ruled against Prabowo’s
protest (see First Insights - Indonesia: Constitutional Court ruling to come earlier than
scheduled, 19 August 2014). In our view, if Prabowo files a similar protest at the CC, we
would view its success as unlikely, assuming the margin is more decisive than in 2014.
Also, similar to 2014, we do not see a high risk of Prabowo mobilizing his supporters to
launch street protests. Prabowo called for calm among his supporters after a good
portion of the quick counts had been accounted for.
Watch the parliamentary results next
We will next watch the result of the parliamentary elections, as the quick counts for these
elections are being compiled more slowly. According to a quick count by Kompas,
Jokowi’s PDI-P has received 22.3% of the vote, while it currently occupies 19.5% of the
seats in Parliament, although this is still only based on a sample size of 30%. Given
Jokowi’s win, we think the parties in Jokowi’s coalition – namely PDI-P, Golkar, PKB,
PPP, Nasdem and Hanura (which collectively hold around a 60% majority in Parliament)
– could also perform well, further bolstering reform prospects. The key reforms in the
agenda require legislative changes, such as the labor law and an income tax/VAT law.
In addition, we will watch how Jokowi assembles his cabinet over coming months, and
particularly whether Finance Minister Sri Mulyani remains at her post. This will be
important in determining the priorities of the second Jokowi administration among the
various policies outlined during the campaign, and their likelihood of implementation.
Policy continuity is welcome
In the interim, we expect no major policy announcements, as the second term of the
president does not officially commence until October. If anything, we would expect
continued implementation of government programs and infrastructure projects, as
outgoing ministers try to make a good impression.
That said, we will also be watching closely any changes to fuel subsidy policies, which
we currently expect the government to change gradually to a more market-driven pricing
mechanism by Q3 2019. We think this subsidy reform should remain on-track, given
Jokowi will likely continue to prioritise infrastructure spending and create the fiscal space
to fund it by minimizing inefficient subsidy spending.
The scope for rate cuts this year has increased
In the near term, we do not expect this election result to lead to any policy action by
Bank Indonesia (BI) at its board of governors meeting next week, as BI digests the
implications of the election. BI has been clear in previous meetings this year that it
maintains a top priority on its external stability objective despite low inflation. In addition,
we believe BI will look through the goods trade balance, which posted a surplus in both
February and March, cognisant of the fact that the overall current account deficit (CAD)
tends to deteriorate significantly in Q2 (see Asia Insights - Indonesia: Another surprise
trade surplus in March, 15 April 2019).
However, after flagging risks that BI may move the rate cuts we forecast in 2020 to this
year, we now pencil in 50bp in policy rate cuts in Q4, taking the policy rate to 5.5% by
year-end. This is supported by our FX team’s view that this election outcome is positive
for the currency beyond any near-term reaction (more below), in addition to our view of a
more dovish Fed and supportive external backdrop for EM (see Asia Insights - Seven
reasons why EM Asia could be in a goldilocks period, 16 April 2019). We also expect
the CAD to narrow meaningfully after the seasonal deterioration in Q2, supporting our
full-year 2019 forecast for the CAD to decline to 2.7% of GDP from 3% in 2018. Finally,
we do not think any inflationary consequences of the government’s adjustment in fuel
prices will put at risk BI’s 2.5-3.5% inflation target, given we expect fuel price
adjustments to be gradual, while the starting point for headline inflation is low.
FX and rates strategy
We believe global market conditions have turned more favourable for Asia FX and select
rates markets, due to low inflation and stable global monetary policy, stabilising growth
(especially in China), more reasonable pricing of Fed policy and the prospect of a

Nomura | Asia Economic Monthly 10 May 2019
43
US/China trade deal (see Asia Insights - Thoughts on Asia FX and rates, 17 April 2019).
These factors are also supportive of IDR; however in the near term, markets may wait for
confirmation of the election results and whether they are contested by the opposition.
Indeed, this uncertainty could have been a factor behind the rather lacklustre reaction by
USD/IDR to the “quick count” results. Once confirmed, the prospect of policy continuity
and credibility can drive continued gains in IDR, also supported by efforts by BI and the
government to narrow the current account deficit, as well as BI FX policy: BI has
highlighted that IDR has space to appreciate and is undervalued, consistent with our
analysis.
The election results are also positive for Indonesian bonds, which benefit from potentially
reduced supply (see Asia Insights - Indonesia: A weaker auction result but not a cause
for concern, 10 April 2019) and could spur an acceleration of foreign inflows, supported
by favourable external conditions. The prospect of a shift in BI policy (as mentioned
above) is certainly positive for Indonesian bonds; however, the steepening of the curve
this year could have been on expectations of policy easing. We remain bullish on the
longer end of the curve, which benefits from combination of foreign inflows as well as
monetary policy easing.
Equity strategy
While a Jokowi victory was widely anticipated, the encouraging results of the quick count
are positive, as we think locals had become somewhat more cautious on the market,
guarding against the off-chance the opposition won. The fact that quick counts by
different pollsters uniformly proclaim a decisive win for Jokowi this time is also a positive,
as it spares the market from uncertainties over the waiting period until 22 May for the
official count as scheduled by KPU, and the subsequent period between 23 May and 15
June for resolving any disputes, even though there is always a chance that the losing
party will challenge the official election results. However, the results of the election
appear unlikely to change.
We reiterate our positive stance on the market, as we can now expect policy continuity,
while also expecting infrastructure investment, which is one of Jokowi’s pet programs, to
make more progress. At this point, while it remains to be seen whether Jokowi will return
to his more reformist tendencies in his last term, we are hopeful this will be the case,
especially since he will unlikely be as beholden to the parties supporting him as he was
during his first term. The next test for him will be the formation of his next cabinet, as
mentioned above.
We believe the beneficiaries of Jokowi’s win will be the infrastructure-related sectors
such as SOE banks, SOE contractors and perhaps by association some of cement
stocks, even though the major driver will remain the property sector, which had suffered
from the wait-and-see stance taken by investors. However, given we have seen the end
of a monetary tightening, and indeed we now expect earlier rate cuts this year by BI, we
believe it is a good start for the property sector. We also believe IDR could appreciate on
the removal of the uncertainties, in addition to a more benign external outlook.
We maintain an Overweight on Indonesian equities in an ASEAN context. While market
valuations are slightly higher than the post-GFC average – with MSCI Indonesia
currently trading at a 12-month forward PER of 15.2x (7% higher than post-GFC
average) versus the MSCI ASEAN at 14.4x (3% higher than post-GFC average) – we
believe there is still some room for multiples to expand in anticipation of continuity of
government and especially important reforms, which are likely to lead to improvements in
long-term productivity dynamics and thus GDP growth rates. We also note that, in the
past, market multiples reached as high as ~17x (January 2018). Although we do not
necessarily expect significant multiple expansion, there clearly does appear to be some
room for further multiple expansion, given prospects of rate cuts later in the year and
benign external liquidity (a dovish Fed and anchored USD and US 10-year yields). At the
same time, we also like Indonesia’s strong earnings growth potential (consensus expects
2019E EPSg to be ~10% versus ASEAN’s ~6.5%). Recent earnings revisions for
Indonesia are still trending better than the region with recently concluded earnings
season suggesting 2018P earnings growth is ~10%, one of the highest in the region.
This report was originally published on 17 April 2019.

Nomura | Asia Economic Monthly 10 May 2019
44
Asia Economics
Charnon Boonnuch - NSL [email protected] +65 6433 6189
Euben Paracuelles - NSL [email protected] +65 6433 6956
Thailand: Gauging the drought impact
Lower likelihood of further BOT rate hikes.
• Drought conditions have returned, with water levels at the country’s largest dams falling
sharply in Q1 2019 from Q4 2018 levels. We estimate the impact under moderate and
severe drought scenarios, and find that the drought poses downside risks to our 2019
GDP growth forecast of as much as 0.2 percentage points (pp) and also upside risks of
up to 0.2pp to our headline inflation forecast.
• We believe that the drought has further reduced the likelihood of the Bank of Thailand
(BOT) raising its policy rate again in 2019, although they have remained hawkish. We
note that the BOT cut its policy rates twice by 25bp each in 2015 when growth was
affected by both a slowing global economy and the drought. Because of the BOT’s
rising concerns about financial stability risks and limited policy space, we believe that
the potential for rate cuts is still limited.
Moderate drought conditions in Q1 2019
We have reviewed the water level data for Srinakarin, Bhumibol and Sirikit dams – the
country’s three largest dams – and for Ubonrat and Sirindhorn – the two largest dams in
the Northeast. On average, the water level in these dams fell to 57.0% in Q1 2019, after
seasonal adjustment, representing a sharp decline from 65.6% in 2018 (Figure 45). It
was also below 61.9% in 2009, arguably a normal year in which the El Niño Southern
Oscillation (ENSO) index was relatively flat, and also an average of 62.6% in 2005-18.
This suggests that Q1 2019 was already hit by a drought, although it was less severe
than in 2015 when the water level averaged 50.0%.
Fig. 45: Water level in five major dams and ENSO index
Source: Australia Bureau of Meteorology, Hydro and Agro Informatics Institute, Nomura Global Economics.
Fig. 46: Water level in two major Northeast dams
Source: Hydro and Agro Informatics Institute, Nomura Global Economics.
The situation bodes poorly for the economy, in which the agricultural sector accounted
for 7.5% of GDP (not including fishing) and a disproportionally high 31.7% of
employment in 2018. The situation is particularly worrying in the Northeast region, where
the economy is more reliant on the agricultural sector, as the water retention rate in
Ubonrat and Sirindhon dams was even lower than during the severe drought period in
2015 (Figure 46). If the situation does not improve, it will affect the seasonal jasmine and
glutinous rice crops in Q3, which are the region’s major farm products.
Gauging the drought impact on the economy
We estimate the impact of drought on GDP growth and inflation under two scenarios:
moderate and severe conditions. We define a ‘moderate’ scenario as a period in which
the water level is between 50.8-58.7% (within 0.5x and 1.5x standard deviation (SD)
below the 2005-18 historical average of 62.6%) and a ‘severe’ scenario as a period in
which the water level is below 50.8%, or 1.5x SD below the mean, as reflected by the
-40
-30
-20
-10
0
10
20
30
40
40
45
50
55
60
65
70
75
80
85
Mar-
05
Mar-
06
Mar-
07
Mar-
08
Mar-
09
Mar-
10
Mar-
11
Mar-
12
Mar-
13
Mar-
14
Mar-
15
Mar-
16
Mar-
17
Mar-
18
Mar-
19
point%, sa
Water level in five major dams2005-18 averageENSO (RHS)
30
40
50
60
70
80
Jan Feb Mar Apr May Jun Jul Aug Sep Oct Nov Dec
%, sa
2010 2015 2018 2019 Average

Nomura | Asia Economic Monthly 10 May 2019
45
light and dark red shade areas in Figure 47, respectively. We find that the growth impact
is clear, but the impact on inflation is only clearly present if drought conditions are severe.
Fig. 47: Water level in five major dams and drought intensity
Note: Light red shade areas reflect moderate drought conditions and dark area reflect a severe drought. Source: Hydro and Agro Informatics Institute, Nomura Global Economics.
Fig. 48: Impact of drought on GDP growth
Source: Nomura Global Economics.
Drought may trim up to 0.2pp from 2019 GDP growth
To estimate the impact of a drought on farm output, we construct a simple production
equation, with farm output growth being a function of labour growth and y-o-y change in
the water level based on the data from Q1 2014, or after the end of the large-scale rice
pledging scheme which started in 2011 and may distort farm output data, to Q4 2018.
The simple ordinary least square (OLS) model suggests that a 1pp drop in the water
level leads to a 0.27pp drop in agricultural GDP growth, ceteris paribus (Figure 48).
Fig. 49: OLS regression of agricultural GDP growth against change in water level
Note: Change in the water level is based on the five dams in our study. Source: BOT, NESDB, Hydro and Agro Informatics Institute, Nomura Global Economics.
Based on the estimates derived from the equation, we compare the water level during
each drought episode to the normal level in 2009 (61.9%) to derive the marginal impact
on agricultural and overall GDP growth. We find that the drought reduced overall GDP
growth by 0.1pp in Q1 2019 (Figure 48). If the drought conditions remain unchanged in
the remaining quarters of 2019, it will shave off 0.1pp of our full-year GDP growth
forecast of 3.4%. However, if the drought conditions worsen to severe as in 2015, the
downside risks from drought may rise further to 0.2pp of GDP growth.
Inflation pressure will rise if drought conditions intensify
Turning to its impact on inflation, we construct a simple OLS model to explain food price
inflation as a function of demand, supply and production costs. The variables we use as
their proxies are core inflation, agricultural output, and domestic fuel inflation,
respectively. The model includes a dummy variable to estimate the drought impact in
moderate and severe scenarios, as defined above. The estimation reveals that, for a
40
45
50
55
60
65
70
75
80
Mar-05 Mar-08 Mar-11 Mar-14 Mar-17
% y-o-y
Water level in major dams (RHS)
Drought
condition
Water
level (%)
Deviation
from 2009
(pp)
Impact on
agri GDP
growth
(pp)
Impact on
GDP
growth
(pp)
Q1 2019 57.0 -4.9 -1.33 -0.10
Severe
(2015)50.0 -11.9 -3.21 -0.24
Dependent variable: Agricultural GDP growth, % y-o-y
Sample: Q1 2014 - Q4 2018
Variable Coefficient Standard error t-Statistic Probability
Constant 0.9894 0.8001 1.2367 0.2330
Labor growth in agriculture,
% y-o-y1.1416 0.2082 5.4843 0.0000
Change in water level,
pp y-o-y0.2702 0.0813 3.3225 0.0040
Adjusted R-squared 0.6945 3.4548
F-statistic 22.5952 0.0000
S.E. of regression
Prob(F-statistic)
Method: Ordinary Least Squares

Nomura | Asia Economic Monthly 10 May 2019
46
moderate drought scenario, the inflationary pressure is neither strong (0.07pp lower than
normal condition) nor statistically significant, as reflected by a very high p-value of 0.9
(Figure 50). However, in the severe drought condition where the water level is below
50.8%, the drought impact is both inflationary and statistically significant. Relative to
normal condition, food price inflation is on average 1.5pp higher in a severe drought
condition, ceteris paribus. This translates into a 0.24pp increase in headline inflation
(food inflation accounts for 15.7% of headline inflation).
Fig. 50: OLS regression of food inflation in moderate and severe drought scenarios
Source: MOC, NESDB, Hydro and Agro Informatics Institute, Nomura Global Economics.
In our estimate, if drought conditions worsen to severe in the remaining three quarters of
2019, headline inflation will average 0.9% in 2019 from our baseline forecast of 0.7%,
assuming full-year average Brent crude oil price of USD62.0/bbl (Figure 51). The price of
Brent crude oil, however, increased above USD70.0/bbl in early April, posing additional
upside risks to our headline inflation forecast. If this results in an average of USD70.0/bbl
in 2019, it would add 0.3pp to our headline inflation forecast in each drought condition.
Fig. 51: Inflation forecasts for 2019 under different oil prices and drought scenarios
Source: CEIC, MOC, Nomura Global Economics.
Fig. 52: Headline inflation, policy rate and GDP growth
Note: Light red shade areas reflect moderate drought conditions and dark area reflect a severe drought. Source: BOT, MOC, NESDB, Nomura Global Economics.
Rising downside risks to growth and upside risks to inflation
In sum, in addition to a slowdown in exports and political uncertainty (see Asia Insights -
Thailand: Election results remain inconclusive, 29 March 2019), the drought adds up to
Dependent variable: Food price inflation, % y-o-y
Sample: Q1 2014 - Q4 2018
Variable Coefficient Standard error t-Statistic Probability
Constant -2.2981 0.5674 -4.0505 0.0012
Agricultural GDP growth,
% y-o-y-0.0072 0.0384 -0.1870 0.8544
Core inflation,
% y-o-y3.7463 0.5979 6.2659 0.0000
Fuel price inflation,
% y-o-y0.0467 0.0254 1.8382 0.0873
Dummy varible
(=1 if water level is between
50.8% and 58.7%, and 0
otherwise)
-0.0697 0.6171 -0.1130 0.9117
Dummy varible
(=1 if water level is below
50.8%, and 0 otherwise)
1.5104 0.8057 1.8745 0.0819
Adjusted R-squared 0.7359 0.7771
F-statistic 11.5876 0.0001
S.E. of regression
Prob(F-statistic)
Method: Ordinary Least Squares
0.7
1.0
0.7
1.0
0.9
1.2
0.4
0.5
0.6
0.7
0.8
0.9
1.0
1.1
1.2
1.3
62 70
Brent crude oil price
% y-o-y
Normal condition Moderate drought Severe drought
-10
-5
0
5
10
15
20
-4
-2
0
2
4
6
8
Mar-07 Mar-10 Mar-13 Mar-16 Mar-19
% y-o-y% y-o-y
Headline inflation Policy rate GDP growth (RHS)

Nomura | Asia Economic Monthly 10 May 2019
47
0.2pp downside risk to our 2019 GDP growth forecast of 3.4%, which is already below
the consensus forecast of 3.6% and the BOT’s forecast of 3.8%. The drought has
already affected growth in Q1, in our view. The Office of Agricultural Economics
estimates agricultural GDP growth fell to 0.5% y-o-y in Q1 2019 from 1.4% in Q4 2018.
In addition, our estimates show GDP growth was tracking at 2.7% y-o-y in Q1 2019 (Q4
2018: 3.7%), below our forecast of 3.0%, but also partly because of the downturn in
exports weighing on manufacturing production growth, and slowing tourist arrival growth
(see Asia Insights - Singapore and Thailand: Electronics continue to weigh on production
activities, 27 March 2019).
Nonetheless, the inflationary impact of drought depends on how severe the drought
conditions will be further out. If the conditions remain broadly unchanged, we believe that
the upside risks from drought will be limited. In addition, the upside risks from drought
and oil are likely offset, to some extent, by weak demand-pull pressures, as evident in
stubbornly weak core inflation, which fell to 0.6% y-o-y in Q1 2019 from 0.7% in Q4 2018
(see Asia Insights - Thailand: More signs of a slowdown in Q1, 1 April 2019). We
maintain our headline inflation forecast of 0.7% in 2019, owing to sluggish demand-pull
pressure and still-moderate drought conditions, although the risk is tilted to the upside,
mainly from higher oil prices.
Drought further reduces the chance of rate hike
In terms of monetary policy implications, we believe that the BOT will put more weight on
downside risks to growth than on upside risks to inflation as a result of the drought. We
highlight that 2019 appears similar to 2015, in that growth was hit by both a slowing
global economy and a drought, and headline inflation was also below target. In 2015, the
BOT also delivered surprise back-to-back policy rate cuts in Q1 (Figure 52). However, in
2019, the BOT has been more concerned about rising financial-stability risks and limited
policy space. It struck a still-hawkish tone after delivering a policy rate hike in December
(see Asia Insights - Thailand: MPC minutes suggest a 5-2 vote but with a hawkish tone,
20 February 2019). As a result, we believe that it is unlikely that BOT will cut policy rates;
nevertheless, rising downside risks to growth and below-target headline inflation will also
likely prevent the BOT from hiking the policy rate again this year. We reiterate our view
that the BOT will leave its policy rate unchanged at 1.75% in 2019.
This report was originally published on 16 April 2019.

Nomura | Asia Economic Monthly 10 May 2019
48
Asia Economics
Rob Subbaraman - NSL [email protected] +65 6433 6548
Craig Chan - NSL [email protected] +65 6433 6106
Michael Loo - NSL [email protected] +65 6433 6296
What if oil prices keep rising?
We assess potential winners and losers.
In previous research (see Anchor Report: Oil price moves: A big EM differentiator, 9
November 2017) we found that a sustained rise in oil prices 1) affects EM more than DM;
and 2) can drive major differentiation in EM economic performance. We have updated
our analysis and consider the potential winners and losers should oil prices keep rising.
What drives the oil price rise matters. For a demand-driven rise in oil prices, the
macroeconomic cost to net oil importers – especially in small, open economies – can be
cushioned by stronger exports. But if the rise in oil prices is driven more by supply-side
factors – which we think is currently the situation because of the synchronous slowdown
in global industrial activity and disruptions in several oil exporters (Venezuela, Algeria,
Libya and now, Iran) – it tends to be more damaging to large net oil importers. This is
because, in the absence of a strong pick up in exports, the higher import cost of oil could
sharply worsen current account positions, compress profit margins and, to the extent that
firms pass on higher production costs, raise CPI inflation. Fiscal positions can worsen if
governments increase fuel subsidies to help contain inflation and ease the burden on
low-income households. And all this has a negative impact on economic growth for large
net oil importers, and vice versa for large net oil exporters.
Our base case is that the price of Brent crude will soon retrace back below USD70/bbl,
as the US and key OPEC members increase supply and because of still-subdued global
growth. But the price of oil is notoriously difficult to forecast, and so it is worth asking the
question: what if oil prices keep rising?
Net imports of crude and refined petroleum scaled by GDP are a useful metric for
assessing the trade exposure to large changes in oil prices, while the weighting of
energy-related items in the CPI basket can provide an indication of inflation exposure.
Figure 53 presents a scatter plot of these two variables, using the latest available data,
and the results drive home the two points mentioned earlier:
Fig. 53: 2017 net oil imports vs weight of energy in CPI basket
Note: For CPI weights, energy represents the direct weights of utilities in the form of electricity, gas and other fuels as well as indirect weights in the form of fuel and lubrication in transport. Net oil imports represent imports minus exports of petroleum and petroleum-related products. Developed economies are in black, while emerging and developing countries are in red. China's CPI weights are not released to the public - Nomura estimates are used. Net oil imports are 2017 for all countries except Cambodia (2016) and Venezuela (2013). Source: UN Comtrade, CEIC and Nomura.
1. The economic impact is felt much more in EM than DM. In Figure 53, the red
diamonds denote EM, and the black diamonds denote DM. The position of the red
diamonds shows that the economies in EM are much more exposed than those in DM to
a large move, up or down, in oil prices. This is because the EM economies are: 1) home
to the bulk of the world’s largest net exporters and importers of oil (once scaled by the
size of a country’s economy); 2) more energy intensive; 3) less energy efficient.
2. Within EM economies, there are likely to be clear-cut winners and losers. This is
because of the risk of non-linear economic effects, or vicious spirals, to large net oil
Ukraine
Cambodia
IndiaSri Lanka
Romania
Phil
Thailand
Pakistan
Peru
Malaysia
Argentina
Poland
Turkey
Indo
Brazil
Hungary
China
Mexico
Singapore ChileS.Africa
KoreaHong KongTaiwan
ColombiaEcuador
Viet
Egypt EstoniaGreece SlovakiaJapan
Slovenia Czech
Spain
Portugal
BelgiumNZ
Italy
Iceland
France
AustraliaGermany
Israel
Denmark
Canada
Austria
UK USSwitz
-5
-4
-3
-2
-1
0
1
2
3
4
5
2 4 6 8 10 12 14 16 18 20Weight of energy in CPI (%), latest available
Net oil imports in 2017, % GDP
Benefits most from higher oil prices
Suffers most from higher oil prices
Norway (weight 6.1, imports -6.9) Nigeria (weight 8.5, imports -7.3)Saudi (weight 2.7, imports -24.5) Venezuela (weight 5.0, imports -23.0) Russia (weight 10.3, imports -9.5)

Nomura | Asia Economic Monthly 10 May 2019
49
importers that have weak economic fundamental starting positions. The prospect of even
larger twin current account and fiscal deficits could trigger sizeable net capital outflows
and currency depreciation which, in turn, may add further upward pressure to inflation.
This narrows the choice of policy responses to unsavoury options: 1) hiking interest rates
at the cost of even weaker growth; 2) stepping aside and letting net capital outflows
depreciate the currency at the cost of higher inflation; or in the more extreme 3) imposing
capital controls at the cost of likely sovereign credit rating downgrades, shutting
themselves off from global capital markets and lowering longer-term potential growth. By
contrast, for large net oil exporters the improvement in current account and fiscal
positions, along with increased profits in the energy sector, could lead to strong capital
inflows, currency appreciation and sovereign credit rating upgrades. To the extent that
currencies appreciate or revenue-rich governments subsidise the local retail price of oil,
the inflationary impact would generally be more muted than for net oil importers. In
contrast with large net oil importers, there may even be room for central banks to allow
real interest rates to decline, providing a further impetus to GDP growth.
Against this backdrop, in an attempt to gauge which of the economies in Figure 53 could
be a winner or loser should oil prices keep rising, we ranked them by applying a crude
but simple weighting scheme: we assume that the trade exposure (net imports of crude
and refined petroleum scaled by GDP) is twice as significant (i.e. has twice the weight)
as the inflation exposure (share of energy-related items in the CPI basket). The rankings
are shown in Figure 54 which we present in the form of a heat-map to also show their
economic fundamental starting positions in terms of latest GDP growth, CPI inflation and
IMF projections of current account and fiscal positions in 2019. If oil prices keep rising,
our assessment of the results is as follows:
The economies that could suffer the most: Cambodia, Romania, Turkey, Sri Lanka,
Ukraine, India and Pakistan. The economies that could benefit the most: Saudi
Arabia, Russia, Norway, Nigeria and Ecuador.
Asia strategy implications
The risk from a supply-side driven rise in oil prices is negative for Asia markets and
especially for India, the Philippines, and Thailand. On FX, we are currently long
USD/PHP, USD/THB, but short USD/INR (optionalised with some offset through short
EUR/USD) and on rates, we continue to hold onto our 1s4s INR NDOIS curve steepener.
For India, the negative implications of higher oil prices through fiscal, current account
and inflation channels raise the vulnerability of both local rates and FX. As the current
spike in oil prices seems to be more supply led, we believe this is even more negative
than if it was demand led – which could see rising foreign equity inflows and help to
finance a potentially wider current account deficit. That said, we are still long INR through
options (end May 2019 expiry), as we believe that if oil prices stabilise, the market will
focus back on improving global/local growth prospects in part from the neutral and
possibly more stimulatory global monetary policy and local policy stimulus. The other
focus will be on India’s general elections (results on 23 May; exit polls on 19 May) that
should see PM Modi re-elected and provide a significant positive catalyst for INR
appreciation. On India rates, we continue to expect rate cuts to support the front end of
our 1s4s steepener recommendation, while we remain less positive on longer tenors
because of concerns over supply and reduced Reserve Bank of India OMOs.
A further rise in oil prices will also provide more support to our long USD/THB and
USD/PHP positions given the significant dependence on oil. For the Philippines, we see
additional risk to PHP from the new BSP governor’s pro-growth bias (bias to cut rates
and limited concerns over PHP weakness) and some signs that the recent stabilisation in
capital flows is starting to deteriorate again (evident from foreign portfolio outflows). For
THB, local political risks are likely to remain elevated (possible opposition member/party
disqualifications) at least until 9 May (possibly 23 May) when the Election Commission is
expected to make a formal announcement on the election outcome.

Nomura | Asia Economic Monthly 10 May 2019
50
Fig. 54: Heatmap of winners and losers from high oil prices
Note: Economies are ranked on the combined value of their 2017 net oil imports as a percent of GDP (given a weight of 2) and the weight of energy in their CPI basket (given a weight of 1), with a higher combined value indicating that the economy suffers more from higher oil prices. 2019 fiscal and current account balances are IMF forecasts. Real GDP growth for all economies refer to Q4 2018 except for Pakistan (Q3 2017-Q2 2018), Cambodia and Venezuela (IMF estimates for 2018). CPI inflation for all economies refer to March 2019 except for Cambodia (October 2018) and Venezuela (IMF estimate for 2018). Source: IMF, Bloomberg, CEIC and Nomura.
This report was originally published on 24 April 2019.
Q4 2018 real GDP
growth, % y-o-y
March 2019 CPI
inflation, % y-o-y
2019 current account
balance, % GDP
2019 fiscal balance,
% GDP
1 Cambodia 7.3 3.1 -9.1 -2.0
2 Poland 4.9 1.7 -1.2 -2.2
3 Romania 4.1 4.0 -5.2 -3.8
4 Thailand 3.7 1.2 7.1 -0.1
5 Portugal 1.7 0.8 -0.4 -0.6
6 Slovakia 3.6 2.7 -1.0 0.0
7 Hungary 5.1 3.7 0.5 -1.9
8 Czech Republic 2.6 3.0 -0.6 1.1
9 Estonia 4.2 2.3 1.5 0.2
10 Turkey -3.0 19.7 0.7 -3.1
11 Slovenia 4.1 1.6 4.4 0.5
12 Greece 1.6 0.9 -2.7 -0.2
13 Sri Lanka 1.8 2.9 -2.8 -4.6
14 Ukraine 3.5 8.6 -2.5 -2.3
15 Spain 2.6 1.3 0.8 -2.3
16 The Philippines 6.3 3.3 -2.2 -1.2
17 India 6.6 2.9 -2.5 -6.9
18 Pakistan 5.4 9.4 -5.2 -7.2
19 Belgium 1.1 2.3 0.3 -1.2
20 Germany 0.9 1.3 7.1 1.1
21 Iceland 4.0 2.9 0.8 0.7
22 Vietnam -8.9 2.7 3.1 -4.5
23 Chile 3.6 2.0 -3.2 -1.8
24 Korea 3.1 0.4 4.6 2.1
25 Italy 0.5 1.0 2.9 -2.7
26 Taiwan 1.8 0.6 11.4 -1.9
27 South Africa 1.1 4.5 -3.4 -5.1
28 New Zealand 2.5 1.5 -4.4 0.1
29 France 1.0 1.1 -0.4 -3.3
30 Argentina -6.2 54.7 -2.0 -2.7
1 Saudi Arabia 3.6 -2.1 3.5 -7.9
2 Venezuela -18.0 929790 1.4 29.8
3 Russia 2.7 5.3 5.7 1.0
4 Norway 1.7 2.9 7.4 7.5
5 Nigeria 2.4 11.3 -0.4 -5.1
6 Ecuador 0.8 -0.1 0.4 0.0
7 Canada 2.0 1.9 -3.1 -0.6
8 Colombia 2.8 0.4 -3.9 -2.6
9 Egypt 5.4 11.1 -2.4 -8.6
10 United Kingdom 0.5 1.9 -4.2 -1.3
Top 10
economies with
highest positive
exposure to high
oil prices (1=
Highest)
Top 30
economies with
highest negative
exposure to high
oil prices (1=
Highest)

Nomura | Asia Economic Monthly 10 May 2019
Chart alerts
Asia stockpiles look larger than in 2015-16 This does not bode well for production in the coming months, even if exports recover.
Fig. 55: Inventory to shipment ratios, seasonally adjusted.
• Asia’s export slump this year is similar in magnitude to the last one in 2015-16, but the important difference is a more pronounced inventory cycle. For the four Asian countries that release timely data on the ratio of inventories to shipments, in three of them – Thailand, Korea and Taiwan – there has been a sharp rise in this ratio.
• We believe the rise in these ratios could reflect an unintended inventory build-up by producers that were caught off guard by the quite sudden export slump and a deeper tech downcycle than expected by most analysts. Taiwan’s ratio in March matched the previous high in August 2015; Korea’s rose to a two-decade high in February; and Thailand’s has surged to almost the same level in late 2011, when the Tsunami in Japan led to major disruptions to the global motor vehicle supply chain.
• Even if Asian exports recover in the coming months, the inventory build-up suggests that production will take longer to recover.
Note: We seasonally adjust inventory to shipment ratios for Taiwan and Thailand manually. Source: CEIC and Nomura.
Authors: Rob Subbaraman and Michael Loo; originally published on 29 April 2019.
Nomura’s leading index of Asian exports Out to May, it is still not signalling a turn in Asian exports.
Fig. 56: Nomura’s leading index of Asia ex-Japan’s exports
• We updated our proprietary leading index of Asian exports, which is made up of eight forward-looking components and has a three-month lead over Asia ex-Japan’s aggregate exports. In mid-2018, our index correctly warned of the slowdown in Asia’s export growth. Now, our index is signaling Asia’s export downturn will continue to deepen until at least May. The drop in May was the largest fall since November 2015, and was led down by US semiconductor companies’ global sales, China’s imports and manufacturing PMI surveys for China, the rest of EM and the Eurozone.
• Asia’s total export growth fell very sharply in February (the latest month in which all countries have reported trade data) to -12.7% y-o-y (red line), but was distorted downward by the lunar new year holidays (China’s exports fell by -20.8%). A better gauge of underlying exports is to average the January and February data; this shows -4.4% y-o-y growth (red dash).
• So far, three Asian countries have released March exports data and they broadly show some improvement: Korea (-8.7% y-o-y in January-February to -8.2%), Taiwan (-4.1% to -4.4%) and China (-4.6% to 14.2%). However, our chief China economist, Ting Lu, warns (see here) that China’s export rebound was exaggerated by base effects, this time from the Lantern Festival. Overall, our leading index is warning that those expecting a strong rebound in Asian export growth in coming months could be in for disappointment.
Note: Nomura’s export leading index can be found on Bloomberg <NMEIXLI Index>. Asia ex-Japan’s aggregate (nominal) exports include those of China, Hong Kong, India, Indonesia, Korea, Malaysia, the Philippines, Singapore, Taiwan and Thailand. China’s exports to Hong Kong are excluded due to distortions caused by over-invoicing. Nomura’s export leading index is a weighted (inverse of mean-squared errors) sum of the following Z-score standardised variables: Emerging markets manufacturing PMI, China’s manufacturing PMI, ‘Major 5 Asia’ leading economic index, US semiconductor global sales, the new orders component of China’s PMI, China import growth, Eurozone manufacturing PMI and the OECD’s leading economic index for China (for more details on its construction, see “Retooling our Asia export leading index”, Asia Economic Monthly, 5 February 2015). Source: Markit, OECD, CEIC and Nomura.
Authors: Rob Subbaraman and Michael Loo; originally published on 15 April 2019.
0.7
0.8
0.9
1.0
1.1
1.2
1.3
1.4
Ratio Korea Taiwan
Thailand Japan
43
49
55
61
67
73
79
85
91
-21
-14
-7
0
7
14
21
28
35
May-11 May-13 May-15 May-17 May-19
Aug 2004 = 100% y-o-y Asia ex-Japan's total exports, lhs
Nomura's export leading index, rhs
Jan-Feb average = - 4.4%

Nomura | Asia Economic Monthly 10 May 2019
52
China: Excavator operating hours improved in March This bodes well for March investments amid growth downturns.
Fig. 57: Komatsu hydraulic excavator sales and operating hours in China
• We highlighted at the start of 2019 that excavator sales data usually lead property and infrastructure investments (see China: Construction machinery downcycle may continue despite infrastructure stimulus, 21 January 2019) and have tracked these data closely since then. We focused particularly on the usage data for existing excavators, as they are less affected by construction machinery replacement cycles than inventory data.
• According to usage data reported by Komatsu – a leading global manufacturer of construction machinery – monthly operating hours per machine it sold to China jumped to 136 in March from an average of 74 in January-February, taking the year-on-year growth to 6.5% from -8.9%. On a quarterly basis, growth of operating hours per machine ticked up to -2.1% in Q1 from -6.8% in Q4 2018, albeit still in a negative territory. Similarly, growth of both headline and Komatsu’s China-bound excavator sales (in volume terms) rebounded in January-February from Q4 2018.
• In our view, the improvement in excavator operating hours and sales signals a likely rebound of infrastructure investment and still-solid property construction in March, as the positive effects from ongoing policy easing/stimulus measures gradually kicked in. However, our growth slowdown story remained intact, given still-looming headwinds, and we believe the deregulation of the property sector will be key to unlocking an economic recovery.
Note: For Q1 2019, the headline and Komatsu’s excavator sales in volume terms refer to January-February average due to lack of data availability. Source: WIND, Komatsu and Nomura Global Economics.
Authors: Lu Ting, Lisheng Wang and Jing Wang; originally published on 8 April 2019.
India: Glass half empty on GST collections Record-high April collections, but meeting the budgeted target needs an even higher run-rate
Fig. 58: GST collections
• GST collections in April (for transactions in March) reached a record high of INR1.14trn, versus an average of INR981bn in FY19 (year ending March 2019). Collections in April are generally high given that businesses tend to clear arrears at the end of the fiscal year.
• Inadequate GST collections have been a matter of concern since GST implementation. Despite lowering its FY19 GST estimate to INR6.4trn (vs. INR7.4trn earlier), the government is set to miss the lowered estimate by ~INR400bn, in our view.
• In its budget, the central government pencilled in a GST target of INR7.6trn for FY20. We believe achieving this target will also be a challenge for two reasons.
• First, the budget assumes ~25% y-o-y growth in GST collections for the centre. Note that even in April, aggregate GST collections (centre + states) rose 10.1% y-o-y, closer to nominal GDP growth, so the FY20 GST growth assumes very high tax buoyancy. Second, tax returns filed appear to be peaking, which suggests stabilization of the tax net after its rapid expansion throughout FY19.
• Put differently, we estimate that the government has budgeted a monthly GST run-rate of over INR1200bn in FY20 (FY19 = INR981bn; FY18 = INR897bn). We believe the run-rate will be closer to INR1,100bn and so expect FY20 to be another year of disappointing GST collections, despite the better April data.
Source: PIB and Nomura Global Economics estimates.
Authors: Sonal Varma and Aurodeep Nandi; originally published on 3 May 2019.
-20
-15
-10
-5
0
5
10
15
-80
-60
-40
-20
0
20
40
60
80
100
120
140
% y-o-y% y-o-y Headline total excavator sales volume
Komatsu: hydraulic excavator sales inChina (volume)Komatsu: operating hours in China (rhs)
976
947
1025
972
1066
1139
6.0
6.2
6.4
6.6
6.8
7.0
7.2
7.4
7.6
800
900
1000
1100
1200
1300
Apr-18 Jul-18 Oct-18 Jan-19 Apr-19
GST collections, lhs
Tax returns filed, rhs
INR bn mn
FY18 avg: INR897bn
FY19 avg: INR981bn
FY20 avgbudgeted
FY20 expected avg:INR1080bn

Nomura | Asia Economic Monthly 10 May 2019
53
India’s two-speed manufacturing cycle Although the broader cycle has turned down, there are still winners and losers.
Fig. 59: Manufacturing sector: Output growth versus WPI inflation
• India’s manufacturing cycle has slowed. On a three-month moving average (3mma) basis, manufacturing output growth eased to 1.2% y-o-y in February from 6.1% last October, while manufacturing inflation (WPI) eased to 2.3% from 4.6%. But, looking beyond the headline number, there are divergences.
• We find that 59% of the manufacturing sub-sectors remain in an expansion phase (positive output growth and positive inflation), and these include heavyweight sectors such as food products, chemicals, cement, basic metals and electrical equipment. A combination of higher volumes and price growth bodes well for these sectors.
• On the other hand, output growth of a large 40% of sub-sectors is contracting alongside higher inflation (a stagflationary outcome). If demand stays weak, price cuts to boost demand could result in margin pressures. Textiles, pharmaceuticals, machinery & motor vehicles segments lie in this quadrant.
• The only sector with rising output growth and falling inflation is tobacco products; but, if demand stays strong, then this sector could also move into the expansion zone in coming months, as prices will likely be raised.
• Overall, India’s manufacturing cycle remains dichotomous, with headline numbers hiding the growing divergence between winners and losers.
Note: X-axis measures WPI inflation (3mma, % y-o-y), while the Y-axis measures manufacturing output growth (3mma, % y-o-y). Both data are as of February 2019. In the chart, NNMP refers to Other non-metallic mineral products and consists of mainly glass & cement. Source: CEIC and Nomura Global Economics.
Authors: Sonal Varma and Aurodeep Nandi; originally published on 16 April 2019.
India: Core matter Services inflation is higher than goods inflation, but both move in sync and should sync lower
Fig. 60: Core CPI inflation: Goods versus services
• Core CPI inflation (CPI ex-food & beverages, fuel) is making a slow descent having fallen from 6.3% y-o-y in October 2018 to 5.1% in March 2019. Our split of the core basket into goods and services shows that recent moderation is driven by both the categories, albeit led more by services.
• Services (core) inflation is higher than goods (core) inflation (by ~0.5 percentage points on average), but both have directionally moved in sync (ups and downs), despite one being tradable (goods) and the other non-tradable (services).
• This is because even though health & education components of services are less demand-sensitive, other services such as spending on recreation and personal care are discretionary in nature and hence growth-sensitive, similar to core goods.
• We expect the ongoing cyclical slowdown to moderate core inflation further to ~4.5% y-o-y by mid-2019 and to 4.0-4.5% by Q4 2019. Our analysis suggests that the moderation in core should, once again, be driven by both goods and services inflation.
Note: Core inflation = CPI ex-food & beverages and fuel. For our estimate of core goods inflation, we have excluded petrol and diesel prices, which form a part of transport and communication. Otherwise, the split into goods and services is based on the classification by Ministry of Statistics and Programme Implementation (MOSPI). Core services includes house rent, which had risen after the pay commission-related hikes in July 2017, but the analysis does not change even if we exclude house rent from services. Source: MOSPI, CEIC and Nomura Global Economics estimates.
Authors: Sonal Varma and Aurodeep Nandi; originally published on 24 April 2019.
(15)
(10)
(5)
0
5
10
15
20
25
(4) (2) 0 2 4 6 8
Expansion
Stagflation
Goldilocks?
Slowdown
WPI inflation
IP g
row
th
Tobacco
Wearing apparel
Paper
Fabricated metal
Textiles
Wood
Food products
Furniture
Leather
Other transport equipment
ComputerNMMP
Electrical equipment
Basic metalChemicals
Beverages
Pharma
Rubber & plastic
Motor Vehicles
Machinery
3.0
3.5
4.0
4.5
5.0
5.5
6.0
6.5
7.0
Mar-15 Mar-16 Mar-17 Mar-18 Mar-19
% y-o-y Core services Inflation
Core goods Inflation
Core inflation

Nomura | Asia Economic Monthly 10 May 2019
54
Philippines: Slowing money supply growth… …further strengthens the case for a near-term cut in the RRR.
Fig. 61: Nominal GDP growth versus M3 money supply growth.
• Since Bangko Sentral ng Pilipinas (BSP) embarked on a number of monetary policy reforms including the adoption of the interest rate corridor framework (see Asia Insights - Philippines: A new monetary policy corridor , 17 May 2019) the relationship between money supply growth and nominal GDP growth seemed to have stabilised, with M3 money supply growth about 1.5x nominal GDP growth from 2014.
• This relationship appears to have broken down recently. BSP reported that M3 growth fell further to just 4.2% y-o-y in March from 9.5% at end-2018, well below Q1 nominal GDP growth, which we estimate to have remained in double-digits in Q1.
• We think this is yet another clear sign of tightening domestic liquidity conditions, along with rising interbank rates. Indeed, the fall in M3 growth has been led by deposit growth. We expect this to continue in Q2 due to the tax payment season and the mid-term elections, which tend to boost spending.
• The case for cuts in the reserve requirement ratio (RRR) in the near term has therefore become more urgent, in our view. We reiterate our forecast of 200bp in RRR cuts within Q2, possibly starting shortly after BSP’s next policy meeting on 9 May. Beyond that, we expect 50bp in policy rate cuts in H2 2019 with a rising risk these could be delivered earlier.
Source: CEIC and Nomura Global Economics.
Author: Euben Paracuelles; originally published on 3 May 2019.
Philippines: The president's popularity rebounds further ahead of mid-terms ASEAN election-watch #14
Fig. 62: Presidential net satisfaction ratings
• Q1 marks the third straight quarter in which President Rodrigo Duterte's popularity has increased after hitting a low in mid-2018, according to the latest survey by Social Weather Stations (SWS). In fact, at 66%, this is Duterte’s highest net satisfaction rating since he took office in 2016.
• As we argued in our 2019 year-ahead report, his popularity is key to watch in the run-up to the mid-term elections on 13 May. An improvement in his popularity has been sustained, and we think it could boost his support base in Congress. This implies a rising likelihood of his allies retaining a strong majority in Congress, which, in turn, should support the fiscal reform agenda during the second half his six-year term.
• The SWS survey showed the improvement in popularity was broad-based, rising across major geographic areas and across income classes. We think an important driver to this is declining inflation, which we expect to continue despite some risks (see Asia Insights - Philippines: Evaluating double inflation risks from oil prices and El Niño, 10 April 2019).
Note: The net rating is the percentage of respondents satisfied of the president’s performance minus the percentage of respondents not satisfied.
Source:SWS
Author: Euben Paracuelles; originally published on 11 April 2019.
0
2
4
6
8
10
12
14
16
Mar-15 Dec-15 Sep-16 Jun-17 Mar-18 Dec-18
Nominal GDP
M3 money supply
% y-o-y
45
66
-60
-40
-20
0
20
40
60
80
1989 1992 1995 1998 2001 2004 2007 2010 2013 2016 2019
%
C. Aquino
Ramos Estrada
Arroyo
B. Aquino Duterte
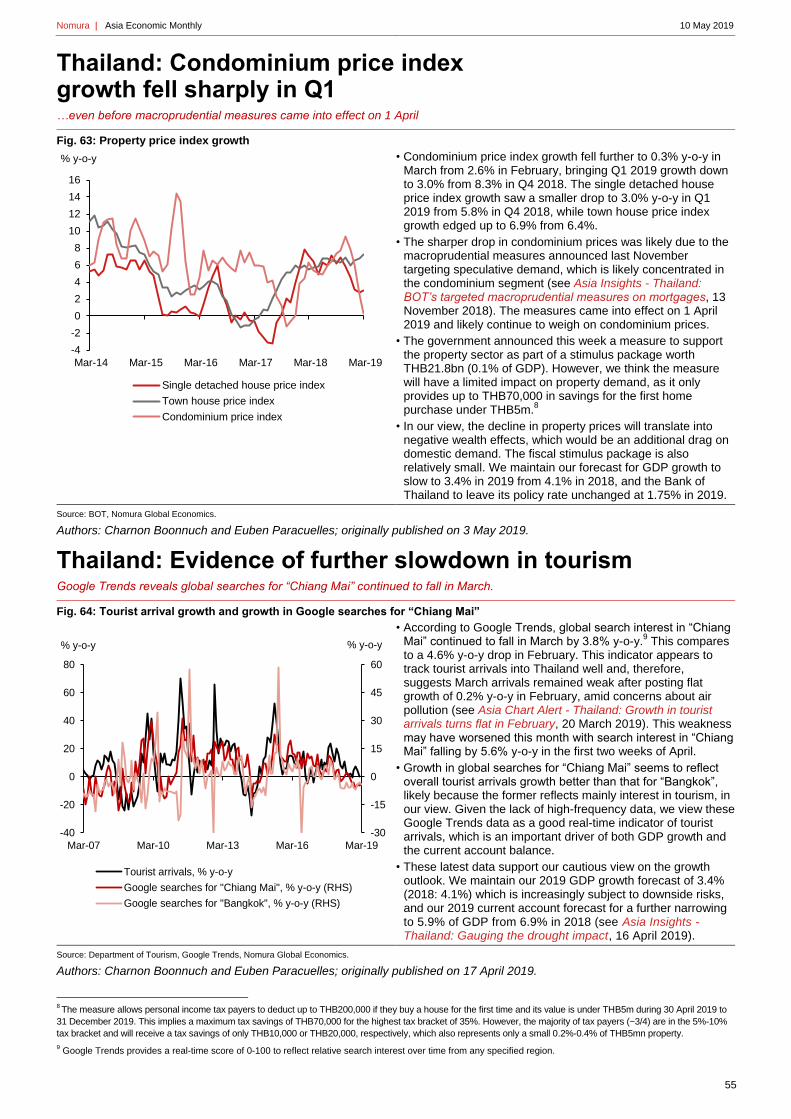
Nomura | Asia Economic Monthly 10 May 2019
55
Thailand: Condominium price index growth fell sharply in Q1 …even before macroprudential measures came into effect on 1 April
Fig. 63: Property price index growth
• Condominium price index growth fell further to 0.3% y-o-y in March from 2.6% in February, bringing Q1 2019 growth down to 3.0% from 8.3% in Q4 2018. The single detached house price index growth saw a smaller drop to 3.0% y-o-y in Q1 2019 from 5.8% in Q4 2018, while town house price index growth edged up to 6.9% from 6.4%.
• The sharper drop in condominium prices was likely due to the macroprudential measures announced last November targeting speculative demand, which is likely concentrated in the condominium segment (see Asia Insights - Thailand: BOT’s targeted macroprudential measures on mortgages, 13 November 2018). The measures came into effect on 1 April 2019 and likely continue to weigh on condominium prices.
• The government announced this week a measure to support the property sector as part of a stimulus package worth THB21.8bn (0.1% of GDP). However, we think the measure will have a limited impact on property demand, as it only provides up to THB70,000 in savings for the first home purchase under THB5m.
8
• In our view, the decline in property prices will translate into negative wealth effects, which would be an additional drag on domestic demand. The fiscal stimulus package is also relatively small. We maintain our forecast for GDP growth to slow to 3.4% in 2019 from 4.1% in 2018, and the Bank of Thailand to leave its policy rate unchanged at 1.75% in 2019.
Source: BOT, Nomura Global Economics.
Authors: Charnon Boonnuch and Euben Paracuelles; originally published on 3 May 2019.
Thailand: Evidence of further slowdown in tourism Google Trends reveals global searches for “Chiang Mai” continued to fall in March.
Fig. 64: Tourist arrival growth and growth in Google searches for “Chiang Mai”
• According to Google Trends, global search interest in “Chiang Mai” continued to fall in March by 3.8% y-o-y.
9 This compares
to a 4.6% y-o-y drop in February. This indicator appears to track tourist arrivals into Thailand well and, therefore, suggests March arrivals remained weak after posting flat growth of 0.2% y-o-y in February, amid concerns about air pollution (see Asia Chart Alert - Thailand: Growth in tourist arrivals turns flat in February, 20 March 2019). This weakness may have worsened this month with search interest in “Chiang Mai” falling by 5.6% y-o-y in the first two weeks of April.
• Growth in global searches for “Chiang Mai” seems to reflect overall tourist arrivals growth better than that for “Bangkok”, likely because the former reflects mainly interest in tourism, in our view. Given the lack of high-frequency data, we view these Google Trends data as a good real-time indicator of tourist arrivals, which is an important driver of both GDP growth and the current account balance.
• These latest data support our cautious view on the growth outlook. We maintain our 2019 GDP growth forecast of 3.4% (2018: 4.1%) which is increasingly subject to downside risks, and our 2019 current account forecast for a further narrowing to 5.9% of GDP from 6.9% in 2018 (see Asia Insights - Thailand: Gauging the drought impact, 16 April 2019).
Source: Department of Tourism, Google Trends, Nomura Global Economics.
Authors: Charnon Boonnuch and Euben Paracuelles; originally published on 17 April 2019.
8 The measure allows personal income tax payers to deduct up to THB200,000 if they buy a house for the first time and its value is under THB5m during 30 April 2019 to
31 December 2019. This implies a maximum tax savings of THB70,000 for the highest tax bracket of 35%. However, the majority of tax payers (~3/4) are in the 5%-10%
tax bracket and will receive a tax savings of only THB10,000 or THB20,000, respectively, which also represents only a small 0.2%-0.4% of THB5mn property.
9 Google Trends provides a real-time score of 0-100 to reflect relative search interest over time from any specified region.
-4
-2
0
2
4
6
8
10
12
14
16
Mar-14 Mar-15 Mar-16 Mar-17 Mar-18 Mar-19
% y-o-y
Single detached house price index
Town house price index
Condominium price index
-30
-15
0
15
30
45
60
-40
-20
0
20
40
60
80
Mar-07 Mar-10 Mar-13 Mar-16 Mar-19
% y-o-y% y-o-y
Tourist arrivals, % y-o-y
Google searches for "Chiang Mai", % y-o-y (RHS)
Google searches for "Bangkok", % y-o-y (RHS)

Nomura | Asia Economic Monthly 10 May 2019
56
Calendar
The month ahead
Note: Hong Kong times.
Source: Bloomberg and Nomura.
Units Period Prev 2 Prev 1 Last Nomura
Singapore GDP (final) % q-o-q, saar 1Q 1.4 1.4 2.0 3.4
Singapore CPI % y-o-y Apr 0.4 0.5 0.6 0.3
Singapore Industrial production % y-o-y Apr 1.2 2.6 -4.8 0.6
India Current account balance USD bn 1Q -15.9 -19.1 -16.9 -6.1
20:00 India CPI % y-o-y Apr 2.0 2.6 2.9 3.0
14:30 India WPI % y-o-y Apr 2.8 2.9 3.2 2.8
Philippines Remittance from abroad % y-o-y Mar 3.9 4.4 1.5 5.3
10:00 China Retail sales % y-o-y Apr 8.1 8.2 8.7 8.6
10:00 China Industrial production % y-o-y Apr 5.4 5.7 8.5 6.6
10:00 China Urban fixed-asset investment (ytd) % y-o-y Apr 5.9 6.1 6.3 6.4
12:00 Indonesia Trade balance USD bn Apr -1.1 0.3 0.5 -0.7
Indonesia BI policy meeting (7d reverse repo) % May 6.00 6.00 6.00 6.00
12:00 Malaysia GDP % y-o-y 1Q 4.5 4.4 4.7 4.2
8:30 Singapore NODX % y-o-y Apr -10.1 4.8 -11.7 -6.0
10:30 Thailand GDP % y-o-y 1Q 4.7 3.2 3.7 2.7
Thailand Custom trade balance USD bn Apr -4.0 4.0 2.0 -1.3
Philippines Fiscal balance PHP bn Apr 44.5 -76.4 -58.4 65.9
12:00 Malaysia CPI % y-o-y Apr -0.7 -0.4 0.2 0.1
S. Korea BOK policy meeting % May 1.75 1.75 1.75 1.75
7:00 S. Korea Industrial production % y-o-y Apr -0.2 -3.4 -2.8 -3.4
9:00 China Official manufacturing PMI Index May 49.2 50.5 50.1 50.0
20:00 India GDP % y-o-y 1Q 8.0 7.0 6.6 6.3
8:00 S. Korea Exports % y-o-y May -11.4 -8.2 -2.0 -5.0
12:00 Thailand CPI % y-o-y May 0.7 1.2 1.2 0.8
7:00 S. Korea CPI % y-o-y May 0.5 0.4 0.6 0.7
7:00 S. Korea GDP (final) % q-o-q, sa 1Q 0.6 1.0 -0.3 -0.3
7:00 S. Korea GDP (final) % y-o-y 1Q 2.0 3.1 1.8 1.8
12:30 Australia RBA policy meeting % Jun 1.50 1.50 1.50 1.50
9:30 Australia GDP % y-o-y, sa 1Q 3.1 2.7 2.3 1.7
9:00 Philippines CPI % y-o-y May 3.8 3.3 3.0 2.8
14:15 India RBI policy meeting, repo rate % Jun 6.50 6.25 6.00 6.00
Tuesday 21 May
Sometime in the month
Monday 13 May
Tuesday 14 May
Wednesday 15 May
Thursday 16 May
Friday 17 May
Wednesday 22 May
Friday 24 May
Friday 31 May
Saturday 1 June
Monday 3 June
Tuesday 4 June
Wednesday 5 June
Thursday 6 June

Nomura | Asia Economic Monthly 10 May 2019
57
Australia Economics
Andrew Ticehurst - NAL [email protected] +61 2 8062 8611
Outlooks 2019-20
Australia: Underwhelming; RBA to cut We expect sub-trend growth and below-target inflation – reflecting regional and local
themes – leading to two 25bp rate cuts this year.
Forecast revisions: We have trimmed our growth and inflation forecasts a fraction,
following Q1 CPI inflation and recent March activity data.
Activity: Softer global and regional momentum has been ill-timed for Australia, given the
local dynamics of a leveraged consumer with low savings and a deteriorating housing
market. We expect further declines in house prices – already down 10% from the peak in
late 2017 – and in dwelling construction as the housing cycle unwinds. Political and
related policy uncertainty could also weigh on sentiment, with an election on 18 May. We
have also reduced our Q1 GDP tracking estimate from 0.6% q-o-q to 0.4% following
more poor retail sales data, and trade data implying a slightly smaller contribution to
growth from net exports than we had previously estimated. Expected monetary and fiscal
support – albeit with the recent budget no more stimulatory than we had forecast –
should also help cushion the downside, but we nevertheless see below-trend growth this
year and the unemployment rate rising over coming quarters.
Inflation: Q1 CPI inflation materially undershot consensus and Reserve Bank of
Australia (RBA) expectations. Food prices did rise in Q1, reflecting weather-related
influences, and higher global oil prices should be reflected in the Q2 headline CPI rate.
However, aside from these items, we were struck by the broad-based absence of price
pressures across a range of goods and services. With sub-trend growth implying more
spare capacity and ongoing structural forces from globalisation and technological
change, we expect inflation to remain below the 2-3% target band for some time yet.
Policy: The RBA left its cash rate unchanged on 7 May, but further softened its tone. It
suggested there would need to be “further improvement” in the labour market for inflation
to be consistent with the 2-3% target band and indicated it would be paying close
attention to labour market developments “at upcoming meetings”. With sub-trend growth
through H2 of last year appearing to continue in Q1, we expect the labour market to
weaken, not strengthen. Together with expected further falls in house prices and inflation
remaining below target, we see a strong case for rate cuts and have pencilled in 25bp
moves in August and November.
Risks: Sharper easing in Chinese growth, a global market set-back – perhaps revolving
around US/China trade tensions – and a deep downturn in the local housing market –
hitting stretched consumers – are the key downside risks. Under these scenarios we
would expect AUD to trade lower, providing support, and we do see modest downside
risk around our near-term AUD forecasts.
Fig. 65: Australia: Details of the forecast
Numbers in bold are actual values; others forecasts. Interest rates and currency forecasts are end of period; other measures are period average. All forecasts are modal forecasts (i.e., the single most likely outcome). Table reflects data available as of 9 May 2019. Source: Nomura Global Economics.
% q-o-q 1Q18 2Q18 3Q18 4Q18 1Q19 2Q19 3Q19 4Q19 1Q20 2Q20 3Q20 4Q20 2017 2018 2019 2020
Real GDP (% y-o-y) 3.1 3.1 2.7 2.3 1.7 1.6 2.1 2.6 2.8 2.7 2.6 2.5 2.4 2.8 2.0 2.6
Real GDP (%q-o-q) 1.1 0.8 0.3 0.2 0.4 0.8 0.7 0.7 0.6 0.6 0.6 0.6
Personal consumption 0.4 0.9 0.3 0.4 0.3 0.6 0.6 0.6 0.6 0.6 0.6 0.6 2.4 2.6 2.0 2.5
Private investment 2.6 0.0 -0.4 -0.9 -0.3 0.5 0.5 0.5 0.7 0.7 0.7 0.7 0.0 4.1 -0.4 2.5
Business investment 2.3 -1.0 -0.8 0.4 1.0 1.4 1.4 1.4 1.4 1.4 1.4 1.4 3.2 3.9 2.7 5.7
Dw elling investment 3.4 2.2 0.5 -3.4 -3.0 -1.5 -1.5 -1.5 -1.0 -1.0 -1.0 -1.0 -2.4 4.4 -6.9 -4.7
Government expenditures 0.9 0.8 2.1 1.5 0.9 0.9 0.9 0.9 0.9 0.9 0.9 0.9 5.0 4.0 4.7 3.6
Exports 4.1 1.3 -0.1 -0.7 0.2 2.0 1.3 1.0 1.0 1.0 1.0 1.0 3.4 5.0 2.4 4.5
Imports 1.8 0.6 -1.0 0.1 -1.0 1.5 1.0 1.0 1.3 1.3 1.3 1.3 7.7 4.1 0.6 4.8
Unemployment rate 5.5 5.3 5.0 5.0 5.0 5.1 5.2 5.3 5.3 5.2 5.2 5.2 5.6 5.2 5.2 5.2
Employment, 000 41 91 54 89 71 60 50 40 50 50 60 60 310 320 258 220
Consumer prices 1.9 2.1 1.9 1.8 1.3 1.8 1.8 1.7 2.2 1.9 1.9 2.0 1.9 1.9 1.7 2.0
Trimmed mean 1.8 1.7 1.7 1.8 1.6 1.5 1.7 1.6 1.8 1.8 1.8 1.9 1.8 1.8 1.6 1.8
Weighted median 2.0 1.8 1.8 1.6 1.2 1.2 1.3 1.4 1.7 1.8 1.8 1.9 2.0 1.8 1.3 1.8
Fiscal balance (% GDP) -1.3 -0.4 0.1 0.4
Current account balance (% GDP) -2.6 -2.2 -2.1 -2.4
RBA cash rate target 1.50 1.50 1.50 1.50 1.50 1.50 1.25 1.00 1.00 1.00 1.00 1.00 1.50 1.50 1.00 1.00
3-month bank bill 2.04 2.11 1.94 2.09 1.77 1.65 1.30 1.30 1.30 1.40 1.30 1.40 1.80 2.09 1.30 1.40
2-year government bond 2.00 1.99 2.03 1.90 1.46 1.45 1.25 1.25 1.25 1.25 1.30 1.40 2.00 1.90 1.25 1.40
5-year government bond 2.31 2.27 2.23 1.91 1.44 1.50 1.35 1.35 1.40 1.45 1.50 1.60 2.34 1.91 1.35 1.60
10-year government bond 2.60 2.63 2.67 2.32 1.78 1.85 1.80 1.80 1.85 1.90 1.95 2.00 2.63 2.32 1.80 2.00
AUD/USD 0.77 0.74 0.72 0.70 0.71 0.70 0.71 0.71 0.71 0.71 0.70 0.70 0.78 0.70 0.71 0.70
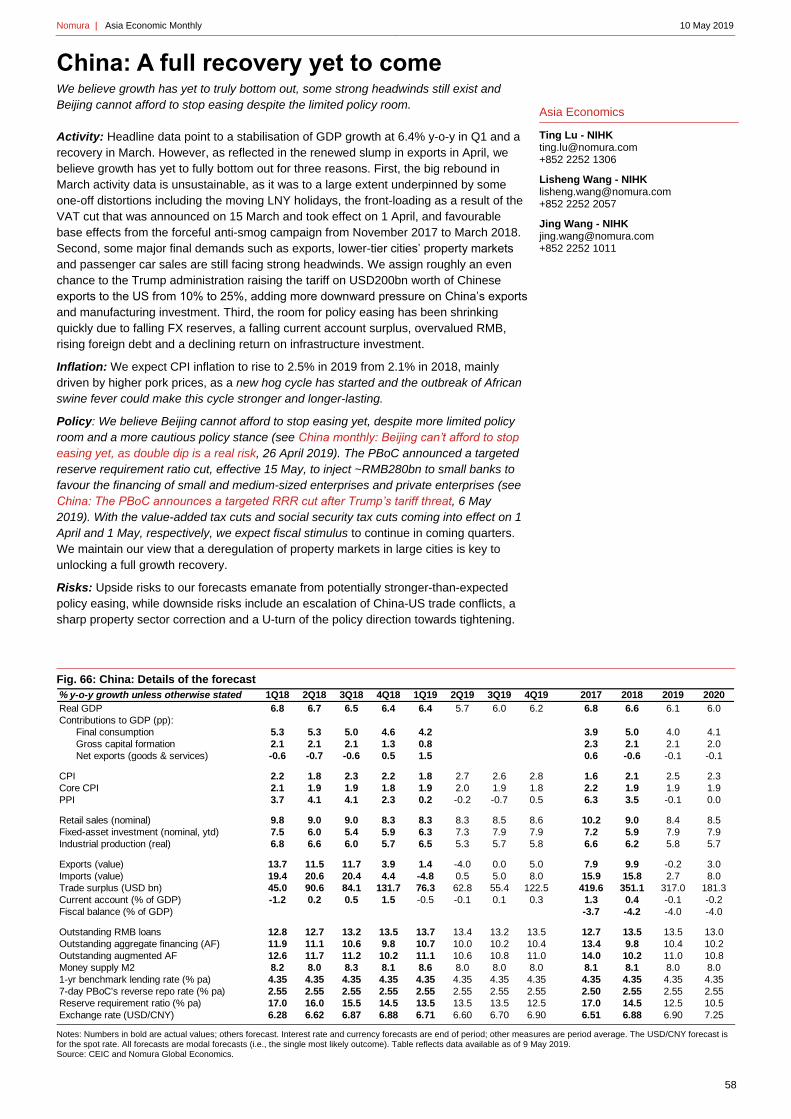
Nomura | Asia Economic Monthly 10 May 2019
58
Asia Economics
Ting Lu - NIHK [email protected] +852 2252 1306
Lisheng Wang - NIHK [email protected] +852 2252 2057
Jing Wang - NIHK [email protected] +852 2252 1011
China: A full recovery yet to come We believe growth has yet to truly bottom out, some strong headwinds still exist and
Beijing cannot afford to stop easing despite the limited policy room.
Activity: Headline data point to a stabilisation of GDP growth at 6.4% y-o-y in Q1 and a
recovery in March. However, as reflected in the renewed slump in exports in April, we
believe growth has yet to fully bottom out for three reasons. First, the big rebound in
March activity data is unsustainable, as it was to a large extent underpinned by some
one-off distortions including the moving LNY holidays, the front-loading as a result of the
VAT cut that was announced on 15 March and took effect on 1 April, and favourable
base effects from the forceful anti-smog campaign from November 2017 to March 2018.
Second, some major final demands such as exports, lower-tier cities’ property markets
and passenger car sales are still facing strong headwinds. We assign roughly an even
chance to the Trump administration raising the tariff on USD200bn worth of Chinese
exports to the US from 10% to 25%, adding more downward pressure on China’s exports
and manufacturing investment. Third, the room for policy easing has been shrinking
quickly due to falling FX reserves, a falling current account surplus, overvalued RMB,
rising foreign debt and a declining return on infrastructure investment.
Inflation: We expect CPI inflation to rise to 2.5% in 2019 from 2.1% in 2018, mainly
driven by higher pork prices, as a new hog cycle has started and the outbreak of African
swine fever could make this cycle stronger and longer-lasting.
Policy: We believe Beijing cannot afford to stop easing yet, despite more limited policy
room and a more cautious policy stance (see China monthly: Beijing can’t afford to stop
easing yet, as double dip is a real risk, 26 April 2019). The PBoC announced a targeted
reserve requirement ratio cut, effective 15 May, to inject ~RMB280bn to small banks to
favour the financing of small and medium-sized enterprises and private enterprises (see
China: The PBoC announces a targeted RRR cut after Trump’s tariff threat, 6 May
2019). With the value-added tax cuts and social security tax cuts coming into effect on 1
April and 1 May, respectively, we expect fiscal stimulus to continue in coming quarters.
We maintain our view that a deregulation of property markets in large cities is key to
unlocking a full growth recovery.
Risks: Upside risks to our forecasts emanate from potentially stronger-than-expected
policy easing, while downside risks include an escalation of China-US trade conflicts, a
sharp property sector correction and a U-turn of the policy direction towards tightening.
Fig. 66: China: Details of the forecast
Notes: Numbers in bold are actual values; others forecast. Interest rate and currency forecasts are end of period; other measures are period average. The USD/CNY forecast is for the spot rate. All forecasts are modal forecasts (i.e., the single most likely outcome). Table reflects data available as of 9 May 2019. Source: CEIC and Nomura Global Economics.
% y-o-y growth unless otherwise stated 1Q18 2Q18 3Q18 4Q18 1Q19 2Q19 3Q19 4Q19 2017 2018 2019 2020
Real GDP 6.8 6.7 6.5 6.4 6.4 5.7 6.0 6.2 6.8 6.6 6.1 6.0
Contributions to GDP (pp):
Final consumption 5.3 5.3 5.0 4.6 4.2 3.9 5.0 4.0 4.1
Gross capital formation 2.1 2.1 2.1 1.3 0.8 2.3 2.1 2.1 2.0
Net exports (goods & services) -0.6 -0.7 -0.6 0.5 1.5 0.6 -0.6 -0.1 -0.1
CPI 2.2 1.8 2.3 2.2 1.8 2.7 2.6 2.8 1.6 2.1 2.5 2.3
Core CPI 2.1 1.9 1.9 1.8 1.9 2.0 1.9 1.8 2.2 1.9 1.9 1.9
PPI 3.7 4.1 4.1 2.3 0.2 -0.2 -0.7 0.5 6.3 3.5 -0.1 0.0
Retail sales (nominal) 9.8 9.0 9.0 8.3 8.3 8.3 8.5 8.6 10.2 9.0 8.4 8.5
Fixed-asset investment (nominal, ytd) 7.5 6.0 5.4 5.9 6.3 7.3 7.9 7.9 7.2 5.9 7.9 7.9
Industrial production (real) 6.8 6.6 6.0 5.7 6.5 5.3 5.7 5.8 6.6 6.2 5.8 5.7
Exports (value) 13.7 11.5 11.7 3.9 1.4 -4.0 0.0 5.0 7.9 9.9 -0.2 3.0
Imports (value) 19.4 20.6 20.4 4.4 -4.8 0.5 5.0 8.0 15.9 15.8 2.7 8.0
Trade surplus (USD bn) 45.0 90.6 84.1 131.7 76.3 62.8 55.4 122.5 419.6 351.1 317.0 181.3
Current account (% of GDP) -1.2 0.2 0.5 1.5 -0.5 -0.1 0.1 0.3 1.3 0.4 -0.1 -0.2
Fiscal balance (% of GDP) -3.7 -4.2 -4.0 -4.0
Outstanding RMB loans 12.8 12.7 13.2 13.5 13.7 13.4 13.2 13.5 12.7 13.5 13.5 13.0
Outstanding aggregate financing (AF) 11.9 11.1 10.6 9.8 10.7 10.0 10.2 10.4 13.4 9.8 10.4 10.2
Outstanding augmented AF 12.6 11.7 11.2 10.2 11.1 10.6 10.8 11.0 14.0 10.2 11.0 10.8
Money supply M2 8.2 8.0 8.3 8.1 8.6 8.0 8.0 8.0 8.1 8.1 8.0 8.0
1-yr benchmark lending rate (% pa) 4.35 4.35 4.35 4.35 4.35 4.35 4.35 4.35 4.35 4.35 4.35 4.35
7-day PBoC's reverse repo rate (% pa) 2.55 2.55 2.55 2.55 2.55 2.55 2.55 2.55 2.50 2.55 2.55 2.55
Reserve requirement ratio (% pa) 17.0 16.0 15.5 14.5 13.5 13.5 13.5 12.5 17.0 14.5 12.5 10.5
Exchange rate (USD/CNY) 6.28 6.62 6.87 6.88 6.71 6.60 6.70 6.90 6.51 6.88 6.90 7.25

Nomura | Asia Economic Monthly 10 May 2019
59
Asia Economics
Sonal Varma - NSL [email protected] +65 6433 6527
Aurodeep Nandi - NFASL [email protected] +91 22 4037 4087
India: All eyes on the election verdict We expect the BJP-government to return to power with a reduced majority. Meanwhile,
weak growth and contained inflation remain the core themes.
Activity: We believe that the worst is yet to come. Consistent with our outlook, the
slowdown in both urban and rural consumption continues to intensify. We observe this in
sagging sales of passenger cars, two-wheelers and tractors, and diesel consumption.
Other growth dominoes are also starting to fall – with the slowdown spreading to
investment, and on the supply side, into services, and to a lesser extent, industry. Weak
income growth, tight financial conditions, slowing global growth, and a drawdown of
public capex to meet fiscal targets are largely to blame. We believe that GDP growth will
average 6.2-6.3% in H1 before recovering to ~7% by Q4, as the lagged transmission of
fiscal and monetary policy easing kicks in.
Inflation: We believe two key trends are likely to dominate inflation dynamics in the near
future. First, food inflation is likely to pick up, driven by the ebbing of deflationary
pressures from end-2018, as the glut in production slowly corrects. Second, we expect
the growth slowdown to eventually erode stickiness in core inflation. Given the
predominance of non-tradeable, growth sensitive services (see India: Core matter, 24
April 2019), we expect core inflation to moderate to ~4.5% in Q2 and Q3 from 5.2% in
Q1. Overall, although headline inflation is likely to increase on the back of higher food
prices, we expect it to remain firmly below the RBI’s target level of 4% through 2019.
Policy: With 50bp of rate cuts already delivered, we believe that the RBI’s easing cycle
is nearing its end. We expect another 25bp rate cut in Q3, given the policy space offered
by the mix of softening growth and low inflation; before the RBI takes a breather. Given
the nervousness over sub-normal monsoons, we expect the third rate cut in August (55%
probability), although June is also a close call (45% probability).
Politics: General election results due on 23 May will be crucial – our base case is the
incumbent Bharatiya Janata Party (BJP) will return, albeit with a smaller majority. While
this will ensure policy continuity, the ongoing climate of rural distress is likely to pivot the
trajectory towards rural reflationary policy, putting fiscal finances at risk.
Risks: Political risks are likely to spike if there is a hung parliament and opposition parties
stitch up a potentially weak coalition government. Other downside risks include weak
global growth, below-normal monsoons, higher oil prices and contagion from the shadow
banking liquidity crisis.
Fig. 67: India outlook at a glance
Note: Numbers in bold are actual values; others forecast. The ‘inventories’ component in contribution to GDP also includes statistical discrepancy and valuables. Interest rate and currency forecasts are end of period; other measures are period average. For Fiscal balance (% GDP), calendar year values refer to forthcoming fiscal year. Table reflects data available as of 9 May 2019. Source: CEIC and Nomura Global Economics.
% y-o-y growth unless otherwise stated 1Q18 2Q18 3Q18 4Q18 1Q19 2Q19 3Q19 4Q19 2017 2018 2019 2020
Real GDP 8.1 8.0 7.0 6.6 6.3 6.2 6.7 7.2 6.9 7.4 6.6 7.1
Private consumption 6.7 6.7 6.7 6.7 7.2 6.3 6.8 7.5 6.6 6.7 7.0 7.4
Government consumption 16.9 16.9 16.9 16.9 4.0 4.0 7.0 10.0 13.7 16.9 6.2 7.9
Fixed investment 14.4 14.4 14.4 14.4 6.0 4.5 5.5 8.0 7.7 14.4 6.0 6.3
Exports (goods & services) 3.6 3.6 3.6 3.6 3.5 4.0 4.0 5.0 5.8 3.6 4.1 4.8
Imports (goods & services) 10.9 10.9 10.9 10.9 8.0 5.0 6.0 5.0 15.5 10.9 5.9 5.9
Contributions to GDP (% points)
Domestic final sales 9.5 9.5 9.5 9.5 6.3 5.4 6.4 8.0 7.4 9.5 6.5 7.1
Inventories -0.3 -0.3 -0.3 -0.3 1.1 1.2 1.1 -0.6 1.6 -0.3 0.7 0.5
Net trade (goods & services) -1.5 -1.5 -1.5 -1.5 -1.1 -0.4 -0.7 -0.2 -2.1 -1.5 -0.6 -0.5
Wholesale price index 2.8 4.7 5.0 4.5 3.0 4.2 4.2 4.0 3.4 4.3 3.8 4.5
Consumer price index 4.6 4.8 3.9 2.6 2.5 3.1 3.4 3.4 3.3 3.9 3.1 4.1
Current account balance (% GDP) -1.9 -2.4 -2.9 -2.5 -1.6 -2.0 -2.1 -2.0 -1.6 -2.4 -1.9 -2.2
Fiscal balance (% GDP) -3.5 -3.4 -3.4 -3.2
Repo rate (%) 6.00 6.25 6.50 6.50 6.25 5.75 5.75 5.75 6.00 6.50 5.75 5.75
Reverse repo rate (%) 5.75 6.00 6.25 6.25 6.00 5.50 5.50 5.50 5.75 6.25 5.50 5.50
Cash reserve ratio (%) 4.00 4.00 4.00 4.00 4.00 4.00 4.00 4.00 4.00 4.00 4.00 4.00
10-year bond yield (%) 7.40 7.90 8.02 7.37 7.35 7.30 7.20 7.00 7.32 7.37 7.00 7.10
Exchange rate (USD/INR) 65.2 68.5 72.5 69.8 69.1 68.5 68.0 67.5 63.9 69.8 67.5 67.0

Nomura | Asia Economic Monthly 10 May 2019
60
Asia Economics
Euben Paracuelles - NSL [email protected] +65 6433 6956
Indonesia: A clear Jokowi win According to quick counts, President Jokowi likely won a second term with a smaller
margin than pre-election polls suggested but still a larger mandate than in 2014.
Activity: GDP growth moderated slightly to 5.1% y-o-y in Q1 from 5.2% in Q4, a resilient
outcome compared to sharper slowdowns in most other Asian countries. The slowdown
was also not broad-based, with signs of infrastructure investment still picking up and
private consumption recovering, in line with our view of a domestic-led recovery. We
reiterate our 2019 GDP growth forecast of 5.4%, up from 5.2% in 2018. We still expect
the acceleration to be led by a pick-up in private investment which, in turn, is supported
by (1) policy continuity following the likely re-election of President Jokowi (more below);
(2) improving reform prospects, particularly on the business climate; (3) targeted fiscal
incentives to develop the manufacturing base; and (4) more progress on infrastructure.
Monetary policy and inflation: We forecast Bank Indonesia (BI) to cut its policy rate by
50bp to 5.50% this year, but only in Q4. We expect headline CPI inflation to average
2.9% in 2019, with a trajectory that, after averaging 2.7% in January-April, gradually
picks up to 3% by December, which is still at the low end of BI’s 2.5-4.5% target. Despite
on-target inflation, BI remains cautious of the risk of cutting its policy rate too early, in our
view. BI’s primary objective is to maintain financial market stability amid a widening
current account deficit (CAD). Our policy rate forecast is therefore premised more on our
expectation for the CAD to narrow meaningfully by Q4, after its seasonal deterioration in
Q2. We forecast the 2019 CAD to narrow to 2.7% of GDP from 3% last year, as the
government’s import-substitution policies are starting to take effect.
Politics and fiscal policy: Unofficial quick counts – which have in the past been a good
guide to the actual official outcome – show that President Jokowi won the presidential
election by an average 10 percentage points (pp). This is lower than the victory margin
suggested by pre-election polls but is a decisive win nonetheless, giving Jokowi a clear
mandate that bodes well for policy continuity as well as reform prospects. As expected,
his opponent, Prabowo Subianto, has not conceded and looks likely to dispute the
results. Given the larger margin than in the last election, these efforts appear unlikely to
succeed. In terms of fiscal policy, Jokowi’s re-election implies continued fiscal prudence,
but ample fiscal space – public debt is only 28.7% of GDP – provides the government with
some flexibility. To reflect some election-related spending, we forecast a fiscal deficit of
2.1% of GDP in 2019 against the budgeted 1.8% but still below the 3% legal limit.
Risks: Key downside risks to growth emanate from US-China trade tensions and a
sharp global growth slowdown; domestically, politics could pose a risk if Jokowi, in
appointing his cabinet, prioritizes gaining political support over choosing technocrats.
Fig. 68: Indonesia: Details of the forecast
Notes: Numbers in bold are actual values; others forecast and inventories under the GDP components also includes statistical discrepancies. Interest rate and currency forecasts are end of period; other measures are period average. All forecasts are modal forecasts (i.e., the single most likely outcome). Table reflects data available as of 9 May 2019. Source: CEIC and Nomura Global Economics.
% y-o-y growth unless otherwise stated 1Q18 2Q18 3Q18 4Q18 1Q19 2Q19 3Q19 4Q19 2017 2018 2019 2020
Real GDP (sa, % q-o-q, annualized) 4.3 5.9 4.7 5.8 3.9 6.7 4.3 8.1
Real GDP 5.1 5.3 5.2 5.2 5.1 5.3 5.4 5.7 5.1 5.2 5.4 5.7
Private consumption 5.0 5.2 5.1 5.2 5.3 5.2 5.7 5.7 5.0 5.1 5.5 5.6
Government consumption 2.7 5.2 6.3 4.6 5.2 4.3 3.9 4.3 2.1 4.8 4.4 4.6
Gross fixed capital formation 7.9 5.9 7.0 6.0 5.0 6.0 7.4 9.0 6.2 6.7 6.9 14.3
Exports (goods & services) 5.9 7.6 8.1 4.3 -2.1 0.8 -3.8 3.7 8.9 6.5 -0.4 0.7
Imports (goods & services) 12.6 15.2 14.0 7.1 -7.8 -0.2 -6.3 1.8 8.1 12.0 -3.1 10.6
Contributions to GDP (% points)
Domestic final sales 5.5 5.1 5.5 5.5 4.9 5.1 5.9 6.7 4.9 5.4 5.7 8.3
Inventories 0.7 1.4 0.6 0.3 -1.0 0.0 -1.0 -1.4 -0.2 0.8 -0.9 -0.7
Net trade (goods & services) -1.2 -1.2 -1.0 -0.6 1.2 0.2 0.5 0.4 0.3 -1.0 0.6 -1.9
Unemployment rate (% nsa) 5.1 5.3 5.3 5.0 5.0 4.8 4.8 4.8 5.4 5.2 4.9 4.7
Consumer prices 3.3 3.3 3.1 3.2 2.6 2.5 3.1 3.2 3.8 3.2 2.9 3.3
Exports (BOP basis) 8.9 11.7 9.9 -1.4 0.5 6.1 -3.5 8.4 16.9 7.0 2.8 2.9
Imports (BOP basis) 19.7 26.6 26.3 11.8 9.4 10.5 -1.1 5.0 16.2 20.7 5.7 4.4
Trade balance (US$bn, BOP basis) 2.3 0.3 -0.5 -2.6 -1.4 -1.6 -1.6 -1.2 18.8 -0.4 -5.8 -9.0
Current account balance (US$bn) -5.3 -7.9 -8.6 -9.1 -8.2 -8.9 -7.6 -6.7 -16.2 -31.1 -31.4 -31.9
Current account balance (% of GDP) -1.9 -2.2 -2.6 -3.0 -3.2 -3.2 -3.1 -2.7 -1.6 -3.0 -2.7 -2.6
Fiscal Balance (% of GDP) -2.5 -1.8 -2.1 -2.5
Policy rate, 7 day reverse repo rate (%) 4.25 5.25 5.75 6.00 6.00 6.00 6.00 5.50 4.25 6.00 5.50 5.00
Exchange rate (USD/IDR) 13756 14404 14929 14481 14244 14000 13800 13600 13548 14481 13600 12700
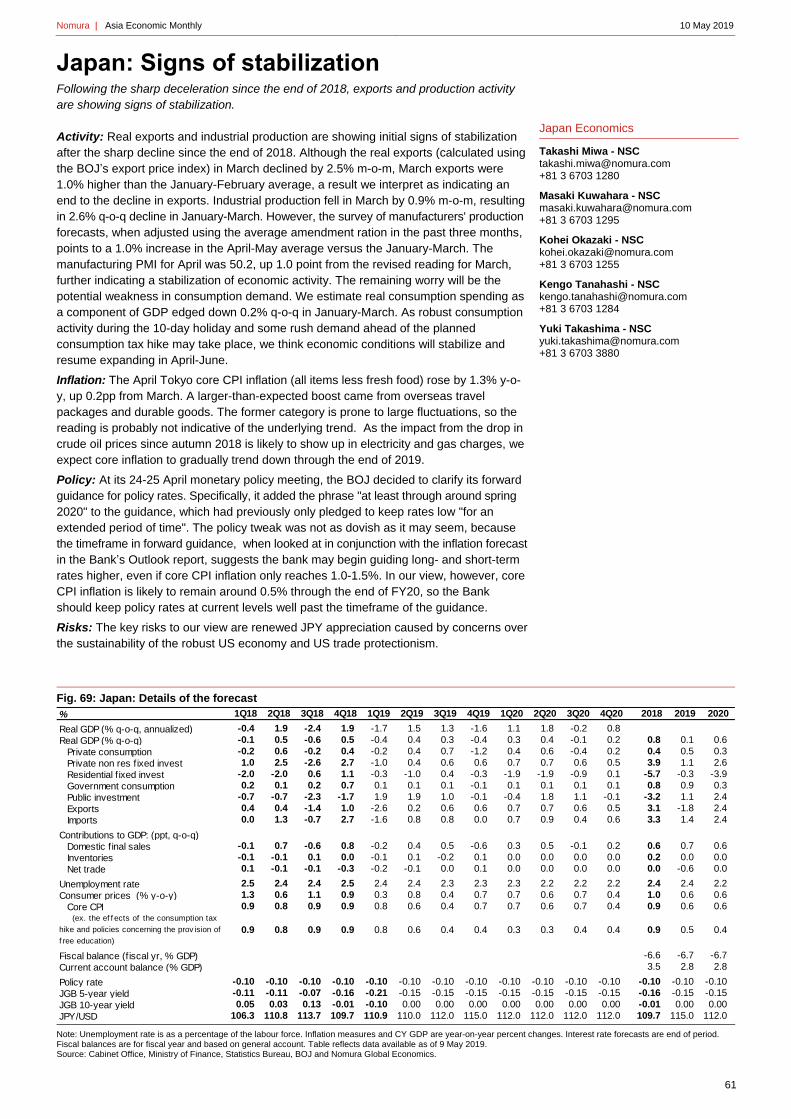
Nomura | Asia Economic Monthly 10 May 2019
61
Japan Economics
Takashi Miwa - NSC [email protected] +81 3 6703 1280
Masaki Kuwahara - NSC [email protected] +81 3 6703 1295
Kohei Okazaki - NSC [email protected] +81 3 6703 1255
Kengo Tanahashi - NSC [email protected] +81 3 6703 1284
Yuki Takashima - NSC [email protected] +81 3 6703 3880
Japan: Signs of stabilization Following the sharp deceleration since the end of 2018, exports and production activity
are showing signs of stabilization.
Activity: Real exports and industrial production are showing initial signs of stabilization
after the sharp decline since the end of 2018. Although the real exports (calculated using
the BOJ’s export price index) in March declined by 2.5% m-o-m, March exports were
1.0% higher than the January-February average, a result we interpret as indicating an
end to the decline in exports. Industrial production fell in March by 0.9% m-o-m, resulting
in 2.6% q-o-q decline in January-March. However, the survey of manufacturers' production
forecasts, when adjusted using the average amendment ration in the past three months,
points to a 1.0% increase in the April-May average versus the January-March. The
manufacturing PMI for April was 50.2, up 1.0 point from the revised reading for March,
further indicating a stabilization of economic activity. The remaining worry will be the
potential weakness in consumption demand. We estimate real consumption spending as
a component of GDP edged down 0.2% q-o-q in January-March. As robust consumption
activity during the 10-day holiday and some rush demand ahead of the planned
consumption tax hike may take place, we think economic conditions will stabilize and
resume expanding in April-June.
Inflation: The April Tokyo core CPI inflation (all items less fresh food) rose by 1.3% y-o-
y, up 0.2pp from March. A larger-than-expected boost came from overseas travel
packages and durable goods. The former category is prone to large fluctuations, so the
reading is probably not indicative of the underlying trend. As the impact from the drop in
crude oil prices since autumn 2018 is likely to show up in electricity and gas charges, we
expect core inflation to gradually trend down through the end of 2019.
Policy: At its 24-25 April monetary policy meeting, the BOJ decided to clarify its forward
guidance for policy rates. Specifically, it added the phrase "at least through around spring
2020" to the guidance, which had previously only pledged to keep rates low "for an
extended period of time". The policy tweak was not as dovish as it may seem, because
the timeframe in forward guidance, when looked at in conjunction with the inflation forecast
in the Bank’s Outlook report, suggests the bank may begin guiding long- and short-term
rates higher, even if core CPI inflation only reaches 1.0-1.5%. In our view, however, core
CPI inflation is likely to remain around 0.5% through the end of FY20, so the Bank
should keep policy rates at current levels well past the timeframe of the guidance.
Risks: The key risks to our view are renewed JPY appreciation caused by concerns over
the sustainability of the robust US economy and US trade protectionism.
Fig. 69: Japan: Details of the forecast
Note: Unemployment rate is as a percentage of the labour force. Inflation measures and CY GDP are year-on-year percent changes. Interest rate forecasts are end of period. Fiscal balances are for fiscal year and based on general account. Table reflects data available as of 9 May 2019. Source: Cabinet Office, Ministry of Finance, Statistics Bureau, BOJ and Nomura Global Economics.
% 1Q18 2Q18 3Q18 4Q18 1Q19 2Q19 3Q19 4Q19 1Q20 2Q20 3Q20 4Q20 2018 2019 2020
Real GDP (% q-o-q, annualized) -0.4 1.9 -2.4 1.9 -1.7 1.5 1.3 -1.6 1.1 1.8 -0.2 0.8
Real GDP (% q-o-q) -0.1 0.5 -0.6 0.5 -0.4 0.4 0.3 -0.4 0.3 0.4 -0.1 0.2 0.8 0.1 0.6
Private consumption -0.2 0.6 -0.2 0.4 -0.2 0.4 0.7 -1.2 0.4 0.6 -0.4 0.2 0.4 0.5 0.3
Private non res f ixed invest 1.0 2.5 -2.6 2.7 -1.0 0.4 0.6 0.6 0.7 0.7 0.6 0.5 3.9 1.1 2.6
Residential f ixed invest -2.0 -2.0 0.6 1.1 -0.3 -1.0 0.4 -0.3 -1.9 -1.9 -0.9 0.1 -5.7 -0.3 -3.9
Government consumption 0.2 0.1 0.2 0.7 0.1 0.1 0.1 -0.1 0.1 0.1 0.1 0.1 0.8 0.9 0.3
Public investment -0.7 -0.7 -2.3 -1.7 1.9 1.9 1.0 -0.1 -0.4 1.8 1.1 -0.1 -3.2 1.1 2.4
Exports 0.4 0.4 -1.4 1.0 -2.6 0.2 0.6 0.6 0.7 0.7 0.6 0.5 3.1 -1.8 2.4
Imports 0.0 1.3 -0.7 2.7 -1.6 0.8 0.8 0.0 0.7 0.9 0.4 0.6 3.3 1.4 2.4
Contributions to GDP: (ppt, q-o-q)
Domestic f inal sales -0.1 0.7 -0.6 0.8 -0.2 0.4 0.5 -0.6 0.3 0.5 -0.1 0.2 0.6 0.7 0.6
Inventories -0.1 -0.1 0.1 0.0 -0.1 0.1 -0.2 0.1 0.0 0.0 0.0 0.0 0.2 0.0 0.0
Net trade 0.1 -0.1 -0.1 -0.3 -0.2 -0.1 0.0 0.1 0.0 0.0 0.0 0.0 0.0 -0.6 0.0
Unemployment rate 2.5 2.4 2.4 2.5 2.4 2.4 2.3 2.3 2.3 2.2 2.2 2.2 2.4 2.4 2.2
Consumer prices (% y-o-y) 1.3 0.6 1.1 0.9 0.3 0.8 0.4 0.7 0.7 0.6 0.7 0.4 1.0 0.6 0.6
Core CPI 0.9 0.8 0.9 0.9 0.8 0.6 0.4 0.7 0.7 0.6 0.7 0.4 0.9 0.6 0.6
(ex. the ef f ects of the consumption tax
hike and policies concerning the prov ision of
f ree education)
0.9 0.8 0.9 0.9 0.8 0.6 0.4 0.4 0.3 0.3 0.4 0.4 0.9 0.5 0.4
Fiscal balance (f iscal yr, % GDP) -6.6 -6.7 -6.7
Current account balance (% GDP) 3.5 2.8 2.8
Policy rate -0.10 -0.10 -0.10 -0.10 -0.10 -0.10 -0.10 -0.10 -0.10 -0.10 -0.10 -0.10 -0.10 -0.10 -0.10
JGB 5-year yield -0.11 -0.11 -0.07 -0.16 -0.21 -0.15 -0.15 -0.15 -0.15 -0.15 -0.15 -0.15 -0.16 -0.15 -0.15
JGB 10-year yield 0.05 0.03 0.13 -0.01 -0.10 0.00 0.00 0.00 0.00 0.00 0.00 0.00 -0.01 0.00 0.00
JPY/USD 106.3 110.8 113.7 109.7 110.9 110.0 112.0 115.0 112.0 112.0 112.0 112.0 109.7 115.0 112.0

Nomura | Asia Economic Monthly 10 May 2019
62
Asia Economics
Euben Paracuelles - NSL [email protected] +65 6433 6956
Malaysia: BNM kick-starts monetary easing After citing downside risks to growth, the central bank cut its policy rate by 25bp in May;
the statement was dovish, leaving the door open for further easing.
Activity: Growth is off to a weak start this year – we estimate Q1 GDP growth is tracking
4.2% y-o-y, down from 4.7% in Q4 2018. Goods export growth slowed sharply to -0.7%
y-o-y in Q1 from 8.1% in Q4 2018. We expect further export weakness in coming
months, due to cooling foreign demand and the deepening tech downcycle. Given how
exposed Malaysia is to trade, a continued weakening export sector is likely to have
negative spill-over effects on domestic demand via its impact on capex and job creation.
Indeed, manufacturing wage growth has already eased to 7.2% y-o-y in February from
10.1% at the end of 2018, while domestic-oriented industrial output growth fell to 2.8% y-
o-y in January-February versus 5.8% in Q4. Thus, we continue to forecast a slowing of
GDP growth to 4.0% in 2019 from 4.7% in 2018. We also expect the current account
surplus to narrow further to 2% of GDP in 2019 from 2.3% in 2018 given the export
downturn and negative terms of trade from further weakness in LNG and palm oil prices.
Monetary policy and inflation: Bank Negara Malaysia (BNM) delivered a 25bp cut in its
policy rate on 7 May, citing tighter financial conditions amid downside risks to growth. We
believe BNM has left the door open for further policy easing, with the statement assuring
that BNM will monitor balance of risks to growth and inflation. Taking this into account,
along with our 2019 forecasts for 4% GDP growth (which implies a further slowdown
after Q1) and 0.5% inflation (below BNM's forecast range of 0.7-1.7%), we see a 30-40%
likelihood of another policy rate cut before the end of this year, versus our current base
case in which BNM leaves it at 3% throughout 2019. At 3%, we believe BNM has scope
to respond to a worse-than-expected growth downturn at a time when fiscal policy is
more constrained.
Fiscal policy: In Budget 2019, the government projected a fiscal deficit of 3.4% of GDP –
lower than the 3.7% deficit in 2018 – helped by dividends from government-linked
companies, particularly Petronas, which will pay MYR54bn (3% of GDP). The recent rise in
oil prices is a positive for fiscal revenues. However, in our view, the zero-rating of the
goods and services tax leaves a larger fiscal hole that will be only partially filled by the
reinstatement of the sales & services tax, some new measures and spending cuts. We
forecast a higher deficit of 3.7% in 2019, which is a slower pace of fiscal consolidation
than previously planned and consistent with an export-led economic slowdown.
Risks: They are mostly on the downside, notably a sharper downturn in electronics
exports, more trade protectionism, and capital outflows if fiscal concerns rise.
Fig. 70: Malaysia: Details of the forecast
Notes: Numbers in bold are actual values; others forecast. “Inventories” component contribution to GDP also includes statistical discrepancies. Interest rate and currency forecasts are end of period; other measures are period average. All forecasts are modal forecasts (i.e., the single most likely outcome). Table reflects data available as of 9 May 2019. Source: Nomura Global Economics.
% y-o-y growth unless otherwise stated 1Q18 2Q18 3Q18 4Q18 1Q19 2Q19 3Q19 4Q19 2017 2018 2019 2020
Real GDP (sa, % q-o-q, annualized) 5.6 1.2 6.7 5.7 3.2 0.4 5.2 7.5
Real GDP 5.4 4.5 4.4 4.7 4.2 4.0 3.6 4.1 5.9 4.7 4.0 4.2
Private consumption 6.9 8.0 9.0 8.5 6.0 5.5 5.0 5.0 7.0 8.1 5.4 5.8
Government consumption 0.4 3.1 5.2 4.0 -0.5 -0.5 -0.5 -0.5 5.4 3.3 -0.5 -1.0
Gross fixed capital formation 0.1 2.2 3.2 0.3 1.0 2.0 2.2 3.0 6.2 1.4 2.0 2.4
Exports (goods & services) 3.7 2.0 -0.8 1.3 0.2 0.0 0.6 2.8 9.4 1.5 0.9 3.6
Imports (goods & services) -2.0 2.1 0.1 0.2 1.0 0.4 2.0 2.7 10.9 0.1 1.5 3.7
Contributions to GDP (% points)
Domestic final sales 3.8 5.2 6.4 5.1 3.5 3.5 3.4 3.3 6.0 5.2 3.4 3.7
Inventories -2.5 -0.9 -1.4 -1.2 1.2 0.7 1.1 0.5 0.1 -1.5 0.9 0.3
Net trade (goods & services) 4.0 0.1 -0.7 0.8 -0.5 -0.3 -0.8 0.3 -0.2 1.0 -0.3 0.2
Unemployment rate (% sa) 3.3 3.3 3.4 3.3 3.4 3.5 3.6 3.6 3.4 3.3 3.5 3.5
Consumer prices 1.8 1.3 0.5 0.3 -0.3 0.4 1.1 0.7 3.7 1.0 0.5 1.3
Exports (BOP basis) 18.1 14.0 6.7 3.8 -2.4 -6.9 -0.9 3.4 13.5 10.3 -1.6 5.5
Imports (BOP basis) 11.6 14.7 10.2 5.2 -1.8 -8.0 -2.4 2.5 13.9 10.3 -2.4 6.2
Trade balance (US$bn, BOP basis) 9.1 6.6 6.5 7.9 8.6 6.6 7.2 8.6 27.2 30.1 31.1 31.6
Current account balance (US$bn) 3.8 1.0 0.9 2.6 1.9 1.3 1.7 2.5 9.4 8.3 7.3 7.3
Current account balance (% of GDP) 3.7 3.3 2.6 2.3 1.8 1.9 2.1 2.0 3.0 2.3 2.0 2.0
Fiscal Balance (% of GDP) -3.3 -5.6 -3.0 -3.7 -3.7 -3.4
Overnight policy rate (%) 3.25 3.25 3.25 3.25 3.25 3.00 3.00 3.00 3.00 3.25 3.00 3.00
Exchange rate (USD/MYR) 3.86 4.04 4.14 4.14 4.08 4.10 4.09 4.08 4.06 4.14 4.08 4.00

Nomura | Asia Economic Monthly 10 May 2019
63
Asia Economics
Euben Paracuelles - NSL [email protected] +65 6433 6956
Philippines: Temporary fiscal tightening The slowdown in Q1 was due to the budget delay and not broadly based. Yet the central
bank has already cut its policy rate and more monetary easing is likely.
Activity: GDP growth slowed to a disappointing 5.6% y-o-y in Q1 from 6.3% in Q4 2018.
This indicates downside risks to our full-year GDP growth forecast of 6.8% (2018: 6.2%).
However, we view this slowdown as temporary and mainly due to public sector spending,
which rose by a much slower 5.1% y-o-y after a 12.5% rise in Q4, because the approval
of the budget was delayed. The budget was signed in April and, in our view, the
government is acting on catch-up spending plans. Infrastructure implementation remains
its top priority and we expect this to gain more traction, crowding-in private capex.
Private consumption growth rose sharply to 6.3% y-o-y in Q1 from 5.3%, in line with our
expectations, and we think it will continue to recover as inflation is declining which, along
with the impact of TRAIN tax reforms, is boosting real disposable incomes.
Inflation and monetary policy: Headline CPI inflation fell further to 3.0% y-o-y in April
from 3.3% in March. This takes the year-to-date average to 3.6%, which is within the 2-
4% target of the Bangko Sentral ng Pilipinas (BSP). Core inflation was more stable, down
slightly to 3.4% from 3.5%, consistent with robust domestic demand. We expect headline
inflation to average 3% this year, which implies a further decline in H2. On 9 May, BSP
cut its policy rate by 25bp to 4.5%, in line with consensus but against our expectations of
no change. No announcement was made on the reserve requirement ratio (RRR), but
the governor hinted that it is on the agenda “next week”, consistent with our view of a
need to address tightening liquidity conditions in the near term. Our base case remains
200bp in RRR cuts within Q2, of which 100bp will be delivered next week and another
100bp in June in inter-meeting announcements. As for the policy rate, we still forecast a
total of 50bp in cuts this year, taking it to 4.25%, although we acknowledge the risk BSP
could deliver more. In our base case, BSP performs another 25bp policy rate cut in Q3,
which is when we expect headline inflation to average at the low end of BSP’s 2-4% target.
Fiscal policy and politics: President Duterte’s approval ratings climbed in Q1. With the
13 May mid-term elections just around the corner, this implies a rising likelihood of his
allies retaining a strong majority in Congress. This, in turn, should support the fiscal
reform agenda to help fund the medium-term goal to raise infrastructure spending to 7%
of GDP from around 4.5% last year. We still forecast an increase in the fiscal deficit to
3.3% of GDP in 2019 from 3.2% in 2018 as public sector spending accelerates.
Risks: A more prolonged downturn in the tech cycle would hurt exports while political
noise could rise and delay tax reforms further if Duterte’s support base in Congress is
eroded after the mid-term elections.
Fig. 71: Philippines: Details of the forecast
Notes: Numbers in bold are actual values; others forecast. Interest rate and currency forecasts are end of period; other measures are period average. All forecasts are modal forecasts (i.e., the single most likely outcome). Table reflects data available as of 9 May 2019. Source: CEIC and Nomura Global Economics.
% y-o-y growth unless otherwise stated 1Q18 2Q18 3Q18 4Q18 1Q19 2Q19 3Q19 4Q19 2017 2018 2019 2020
Real GDP (sa, % q-o-q, annualized) 6.3 5.7 5.9 7.3 10.3 9.7 4.8 6.6
Real GDP 6.5 6.2 6.0 6.3 5.6 6.8 7.0 7.5 6.7 6.2 6.8 6.6
Private consumption 5.6 6.0 5.3 5.3 6.3 6.5 6.6 7.1 5.9 5.6 6.6 6.5
Government consumption 13.6 11.9 14.3 12.6 7.4 10.4 19.4 18.3 6.2 13.0 13.7 10.6
Gross fixed capital formation 8.2 19.3 16.6 8.5 5.7 7.4 11.5 17.2 9.4 12.9 10.6 18.8
Exports (goods & services) 10.3 14.7 14.2 14.4 5.8 2.5 2.0 1.1 19.7 13.4 2.8 6.3
Imports (goods & services) 11.3 21.0 19.1 12.4 8.3 3.7 6.0 8.8 18.1 16.0 6.6 12.0
Contribution to GDP growth (% points)
Domestic final sales 7.9 10.4 9.9 7.5 6.9 7.8 10.2 12.0 7.4 8.9 9.3 11.6
Inventories 0.6 0.2 0.4 -0.6 1.2 0.1 0.1 0.5 0.0 0.1 0.5 0.1
Net trade (goods & services) -1.9 -4.4 -4.3 -0.6 -2.6 -1.1 -3.4 -5.0 -0.7 -2.8 -3.0 -4.9
Unemployment rate (nsa, %) 5.3 5.5 5.4 5.1 5.2 5.2 5.2 5.2 5.7 5.3 5.2 5.0
Consumer prices (2012=100) 3.9 4.8 6.3 5.9 3.8 2.9 2.5 2.6 2.9 5.2 3.0 3.1
Exports (BOP basis) -2.9 -0.5 2.6 -0.8 -0.6 -1.8 1.6 5.5 21.4 -0.4 1.2 6.3
Imports (BOP basis) 4.9 15.7 14.8 1.6 10.7 6.0 8.0 8.0 18.0 9.0 8.1 10.5
Trade balance (US$bn, BOP basis) -10.6 -12.7 -12.5 -13.3 -13.1 -14.4 -14.4 -14.7 -40.5 -49.0 -56.6 -64.7
Current account balance (US$bn) -0.3 -3.5 -1.6 -2.4 -2.4 -3.8 -2.2 -2.2 -2.2 -7.9 -10.6 -12.7
Current account balance (% of GDP) -0.7 -1.8 -2.6 -2.4 -3.0 -3.0 -3.1 -2.9 -0.7 -2.4 -2.9 -3.1
Fiscal balance (% of GDP) -2.2 -3.2 -3.3 -3.2
Reverse repo rate (%) 3.00 3.50 4.50 4.75 4.75 4.50 4.25 4.25 3.00 4.75 4.25 4.25
Exchange rate (USD/PHP) 52.2 53.5 54.3 52.6 52.8 53.5 53.0 52.5 49.9 52.6 52.5 51.5

Nomura | Asia Economic Monthly 10 May 2019
64
Asia Economics
Euben Paracuelles - NSL [email protected] +65 6433 6956
Charnon Boonnuch - NSL [email protected] +65 6433 6189
Singapore: A dovish turn Reflecting the economy’s vulnerability to a downturn in exports, GDP growth slowed to a
post-GFC low of 1.3% y-o-y in Q1, supporting the case for no further FX policy tightening.
Activity: Industrial production growth fell to -0.5% y-o-y in Q1 2019 from 4.6% in Q4
2018, reflecting a sharp decline in external demand, especially in electronics. That said,
Q1 IP growth came in well above the government’s advance estimate of -1.9% y-o-y,
posing an upside risk of about 0.3 percentage points to the advance estimate of headline
GDP growth slowing to 1.3% in Q1 from 1.9% in Q4 2018. We maintain our forecast for
GDP growth to slow to 2.5% in 2019, notably lower than the 3.2% expansion in 2018, as
the export-orientated economy remains vulnerable to weakening foreign demand and a
deepening tech downcycle, which we do not expect to hit bottom until Q3 (see Nomura
Tech Monthly: April 2019, 2 May 2019). The economy also faces structural issues – high
debt, deteriorating demographics and a rigid labour market – which pose additional growth
constraints (see Asia Special Report - Singapore: What lies beneath, 3 November 2017).
Inflation and monetary policy: Headline CPI inflation rose to 0.6% y-o-y in March from
0.5% in February due to higher oil prices, while core inflation fell surprisingly to 1.4%
from 1.5%. The Monetary Authority of Singapore (MAS) revised down its 2019 core
inflation forecast to 1.0-2.0% from 1.5-2.5%, owing to the impact of the Open Electricity
Market on electricity tariffs, consistent with our long-held forecast of 1.5%. This, when
combined with weakening GDP growth, justifies the MAS decision to leave its FX policy
stance unchanged at its April announcement after back-to-back tightenings. The
statement also sounded more dovish than expectations (see Asia Insights - Singapore: A
dovish outlook by MAS, 12 April 2019). Craig Chan, our head of FX strategy, expects the
MAS to leave policy unchanged again in its October announcement. We maintain our
headline inflation forecast of 0.3% in 2019, below the MAS forecast range of 0.5-1.5%,
but the risks remained tilted to the upside from higher oil prices and a faster-than-
expected pickup in certificate of entitlement (COE) premium.
Fiscal policy: The government is budgeting a fiscal deficit of 0.7% of GDP in FY19 after
a surplus of 0.4% in FY18. However, the fiscal stance is much less stimulative than this
suggests, as the basic balance points to a fiscal impulse of only 0.1% of GDP for
FY2019, which is below our estimate of FY2018’s 1.4% impulse (see Asia Insights -
Singapore: Budget 2019 likely marks a shift to fiscal deficits, 19 February 2019).
Risks: The island state remains highly dependent upon external factors outside of its
control. Downside risks to growth stem from a deeper-than-expected electronics
downcycle, a China slowdown, financial market volatility and increased global trade
protectionism. The upside risk is if these external headwinds fade faster than expected.
Fig. 72: Singapore: Details of the forecast
Notes: Numbers in bold are actual values; others forecast. The contribution to GDP from the “inventories” component also includes statistical discrepancies. Interest rate and currency forecasts are end of period; other measures are period average. All forecasts are modal forecasts (i.e., the single most likely outcome). MAS core inflation excludes accommodation and private road transport costs. The table reflects data available as of 9 May 2019. Source: Nomura Global Economics.
% y-o-y growth unless otherwise stated 1Q18 2Q18 3Q18 4Q18 1Q19 2Q19 3Q19 4Q19 2017 2018 2019 2020Real GDP (sa, % q-o-q, annualized) 4.7 0.0 1.4 1.4 2.0 1.6 6.5 3.1Real GDP 4.7 4.2 2.4 1.9 1.3 1.9 3.1 3.6 3.9 3.2 2.5 2.2
Private consumption 3.4 2.7 2.7 1.1 2.8 2.8 2.8 2.8 3.2 2.4 2.8 2.4Government consumption 8.4 1.9 2.3 0.7 5.8 5.8 5.8 5.8 4.2 3.6 5.8 6.0Gross fixed capital formation -1.8 -2.0 -7.0 -3.1 0.4 0.1 0.4 -0.1 5.3 -3.4 0.2 0.2Exports (goods & services) 5.2 7.0 5.6 3.0 3.0 1.9 2.6 3.5 5.4 5.2 2.7 3.5Imports (goods & services) 4.5 6.3 5.5 1.9 4.2 4.1 3.5 4.8 7.0 4.5 4.1 4.0
Contributions to GDP (% points)Domestic final sales 1.7 0.5 -0.7 -0.4 1.8 1.4 1.6 1.6 3.0 0.3 1.6 1.5Inventories 0.4 0.3 1.3 -0.5 1.0 3.7 2.3 3.1 1.9 0.4 2.6 0.6Net trade (goods & services) 2.6 3.3 1.8 2.7 -1.3 -3.3 -0.8 -1.2 -0.9 2.6 -1.6 0.0
Unemployment rate (sa, %) 2.0 2.1 2.1 2.2 2.2 2.2 2.2 2.2 2.2 2.1 2.2 2.2Headline CPI inflation 0.2 0.3 0.7 0.5 0.5 0.1 0.2 0.5 0.6 0.4 0.3 0.5MAS core inflation 1.5 1.5 1.9 1.8 1.6 1.6 1.4 1.5 1.5 1.7 1.5 1.5Exports (BOP basis) 12.9 18.6 14.1 5.5 2.3 -0.6 -0.8 5.3 9.8 12.6 1.5 4.7Imports (BOP basis) 15.2 20.0 17.2 5.7 10.5 2.7 -2.7 -3.2 11.2 14.2 1.6 4.9Trade balance (US$bn, BOP basis) 23.1 25.9 25.0 23.6 16.0 20.2 25.0 25.9 91.1 97.6 87.2 90.4Current account balance (% of GDP) 16.0 16.8 17.5 17.7 15.2 13.9 14.0 15.8 16.0 17.7 15.8 14.6Fiscal Balance (% of GDP) 2.3 0.4 -0.7 -1.03 month SIBOR (%) 1.45 1.52 1.64 1.89 1.94 1.90 1.90 1.90 1.50 1.89 1.90 1.90Exchange rate (USD/SGD) 1.31 1.37 1.37 1.36 1.36 1.35 1.34 1.33 1.34 1.36 1.33 1.30

Nomura | Asia Economic Monthly 10 May 2019
65
Asia Economics
Minoru Nogimori - NIHK [email protected] +852 2252 6462
South Korea: A negative shadow on exports Given our below-consensus 2019 GDP (1.8%) and CPI (0.8%) forecasts, we expect the
Bank of Korea (BOK) to deliver two 25bp rate cuts to 1.25% before end-Q1 2020.
Forecast changes: To reflect the weaker Q1 GDP print and recent weaker export data,
we lowered our forecasts for GDP growth to 1.8% from 2.4% in 2019.
Activity: Real GDP fell unexpectedly by 0.3% (sa) q-o-q in Q1 after a rise of 1.0% in Q4
2018, led by a further decline in exports and a slump in private investment. Korea’s export
growth remains weak, as working-day-adjusted exports declined further by 6.1% y-o-y in
April after a 4.1% fall in March. Along with the deepening tech down-cycle, the escalation
of the US-China trade dispute could pose further downside risks to export growth (see
US/China: Trade tensions escalate, 8 May 2019). Also, the still-high inventory burden
should continue to curb production activity. We therefore expect 2019 GDP growth to
slow sharply to 1.8% from 2.7% in 2018, far below the BOK’s forecast of 2.5% and the
market consensus of 2.4% (see Asia Insights - Korea: Lowering our 2019 GDP forecast,
25 April 2019).
Inflation: Headline CPI inflation rose to 0.6% y-o-y in April from 0.4% in March due to
higher energy prices. However, it is still far below the BOK’s 2% inflation target, and
lower inflation expectations, which declined further to 2.1% in April from 2.3% in March,
suggest further downside pressure on core inflation. Higher oil prices and the expiration
of the temporary fuel tax cut (by 15%; effective 16 November to 6 May 2019) should add
some cost-push inflation in H2 2019. However, lower housing rental prices, muted
nominal wage growth amid sluggish private sector job creation, digital disinflation and
stable agricultural prices will substantially limit inflation pressures.
Policy: The government announced the FY19 extra budget of KRW6.7trn (0.4% of
GDP) to address fine dust pollution problems and respond to weak external demand and
the sluggish job market (see Asia Insights - Korea: FY19 extra budget is unveiled, 24
April 2019). However, we believe this will be insufficient to fully offset economic
headwinds, including weaker external demand, the minimum wage hike shock and a
housing market correction alongside household debt deleveraging. We expect the BOK
to cut the policy rate by 25bp to 1.50% in Q4 2019 and again to 1.25% Q1 2020.
Risks: A major upside risk emanates from a potential improvement in global business
sentiment and an earlier-than-expected rebound in the global tech sector. By contrast, a
disorderly housing market correction is a major downside risk given the highly leveraged
household sector. Failure of the US-North Korea talks could reignite geopolitical tensions,
as North Korea on 4 May conducted a missile test for the first time since November 2017.
Fig. 73: South Korea: Details of the forecast
Notes: Numbers in bold are actual values; others forecast. The “Inventories” component contribution to GDP also includes statistical discrepancy. Interest rate, currency and credit to household forecasts are end of period; other measures are period average. All forecasts are modal forecasts (i.e., the single most likely outcome). Table reflects data as of 9 May 2019. Source: Bank of Korea, CEIC and Nomura Global Economics.
% y-o-y growth unless otherwise stated 1Q18 2Q18 3Q18 4Q18 1Q19 2Q19 3Q19 4Q19 2017 2018 2019 2020
Real GDP (sa, % q-o-q, annualized) 4.1 2.4 2.3 3.9 -1.4 1.9 2.7 4.1
Real GDP (sa, % q-o-q) 1.0 0.6 0.6 1.0 -0.3 0.5 0.7 1.0
Real GDP 2.8 2.8 2.0 3.1 1.8 1.7 1.8 1.8 3.1 2.7 1.8 2.1
Private consumption 3.5 2.8 2.5 2.5 1.9 2.0 2.0 2.0 2.6 2.8 2.0 1.9
Government consumption 5.8 4.8 4.6 7.1 5.2 8.0 8.1 6.5 3.4 5.6 7.0 4.6
Construction investment 1.8 -1.5 -8.9 -5.9 -7.4 -6.9 -1.3 -3.0 7.6 -4.0 -4.6 -2.5
Business investment 7.3 -3.0 -7.4 -2.7 -16.1 -0.7 4.4 0.5 14.6 -1.6 -3.2 2.3
R & D investment 3.5 2.2 1.6 0.6 1.8 3.0 2.6 3.5 3.0 1.9 2.8 3.3
Exports (goods & services) 1.6 4.8 3.1 7.2 0.2 0.7 0.7 1.5 1.9 4.2 0.8 2.5
Imports (goods & services) 4.2 2.0 -1.8 2.5 -5.4 0.4 3.0 2.0 7.0 1.7 0.0 2.3
Contributions to GDP growth (% points)
Domestic final sales 4.1 1.3 -1.1 0.6 -1.7 1.1 2.5 1.8 5.0 1.2 1.0 1.7
Inventories 0.2 0.0 0.4 0.0 0.3 0.4 0.4 0.2 0.5 0.1 0.3 0.2
Net trade (goods & services) -1.4 1.5 2.6 2.5 3.1 0.2 -1.1 -0.2 -2.5 1.4 0.5 0.2
Unemployment rate (sa, %) 3.7 3.8 4.0 3.8 4.0 4.1 4.1 4.1 3.7 3.8 4.0 3.9
Consumer prices 1.1 1.5 1.6 1.8 0.5 0.6 0.8 1.1 1.9 1.5 0.8 1.4
Current account balance (USDbn) 11.7 17.2 28.1 19.4 11.2 17.7 28.6 22.5 75.2 76.4 80.0 75.0
Current account balance (% of GDP) 3.0 4.2 6.9 4.8 3.0 4.4 6.8 5.3 4.9 4.7 4.9 4.3
Fiscal balance (% of GDP) 1.4 1.7 0.6 0.0
Fiscal balance ex-social security (% of GDP) -1.1 -0.6 -1.8 -2.3
BOK official base rate (%) 1.50 1.50 1.50 1.75 1.75 1.75 1.75 1.50 1.50 1.75 1.50 1.25
Exchange rate (USD/KRW) 1064 1115 1109 1111 1135 1115 1110 1100 1067 1111 1100 1060

Nomura | Asia Economic Monthly 10 May 2019
66
Asia Economics
Charnon Boonnuch - NSL [email protected] +65 6433 6189
Euben Paracuelles - NSL [email protected] +65 6433 6956
Thailand: Political risks weigh on growth Our base case remains a pro-military coalition forming the new government, but a highly
fragmented parliament will keep political uncertainty high and weigh on growth.
Activity: Economic activity weakened in Q1, mainly on the slowdown in external demand,
which caused the manufacturing production index to fall by 1.1% y-o-y, representing a
marked drop from 2.5% in Q4 2018 (see Asia Insights - Thailand: Weaker economic
activity in Q1, 2 May 2019). Tourist arrivals growth also slowed to 1.5% y-o-y from 4.3% in
Q4 2018. Overall, we lowered our Q1 2019 GDP growth forecast to 2.7% y-o-y from 3.0%,
which is down from 3.7% in Q4 2018. We expect continued high political uncertainty (see
below) and weak exports, which continue to pose downside risks to our full-year GDP
growth forecast of 3.4% (Consensus: 3.6%; 2018: 4.1%). We forecast a narrowing of the
current account surplus to 5.9% of GDP in 2019 from 6.9% in 2018.
Monetary policy and inflation: Headline CPI inflation was 1.2% y-o-y in April,
unchanged from March, with higher oil prices offsetting a high base effect, while core
inflation remained sticky at 0.6%. The inflationary pressure from the drought impact was
limited. We forecast for headline inflation to decline to 0.7% in 2019, undershooting the
Bank of Thailand’s (BOT) 1-4% target range. The BOT maintained its policy rate at
1.75% this week in a unanimous 7-0 vote, in line with weakening growth and as headline
inflation may have already peaked (see Asia Insights - Thailand: BOT leaves its policy
rate unchanged as growth disappoints, 8 May 2019). Despite below-target inflation, we
maintain our view that the BOT will leave policy rates unchanged throughout 2019, given
rates are already very low and as the BOT remains focussed on financial stability risks.
Politics and fiscal policy: The Election Commission announced the official results for
498 of the 500 seats that were broadly in line with our estimates based on the preliminary
result; the only changes were: 1) the pro-Thaksin Pheu Thai Party (PT) lost one seat (to
136), due to vote buying allegations against its candidate, which calls for a re-run on 26
May; and 2) due to this re-run, the party-list allocations are incomplete and thus the pro-
military Phalang Pracharat Party (PP) has one less seat (now 115; see Thailand: Official
election results hint at a fragmented parliament, 9 May 2019). Overall, the result supports
our base case of a PP-led coalition, for which we assign a 60% probability (against a
40% likelihood of a PT-led coalition). The formation of the coalition government should
be achieved by June, but it is likely to be a very fragmented parliament, which will sustain
political uncertainty, hinder reforms and continue to weigh on the investment and growth
outlook.
Risks: Risks to the growth outlook are tilted to the downside, from both slowing global
growth and elevated political uncertainty, while global oil prices are still higher than our
assumption, which pose an upside risk to our headline inflation forecast.
Fig. 74: Thailand: Details of the forecast
Notes: Numbers in bold are actual values; others forecast. The contribution to GDP from the “inventories” component also includes statistical discrepancies. Fiscal balance refers to overall cash balance. Interest rate and currency forecasts are end of period; other measures period average. All forecasts are modal forecasts (i.e., the single most likely outcome). Table reflects data available as of 9 May 2019. Source: CEIC, Nomura Global Economics.
% y-o-y growth unless otherwise stated 1Q18 2Q18 3Q18 4Q18 1Q19 2Q19 3Q19 4Q19 2017 2018 2019 2020Real GDP (sa, % q-o-q, annualized) 8.6 4.5 -1.3 3.3 4.5 4.9 3.2 3.2Real GDP 5.0 4.7 3.2 3.7 2.7 2.8 4.0 4.0 4.0 4.1 3.4 3.0
Private consumption 3.8 4.1 5.2 5.3 4.6 3.9 3.1 2.9 3.0 4.6 3.6 3.1Government consumption 1.8 2.3 1.9 1.4 2.6 2.8 3.4 2.0 0.1 1.8 2.7 2.6Gross fixed capital formation 3.3 3.6 3.9 4.2 2.2 3.2 2.6 1.7 1.8 3.8 2.4 2.0Exports (goods & services) 8.0 9.6 -0.9 0.6 -2.2 -1.6 2.2 4.8 5.4 4.2 0.8 6.4Imports (goods & services) 9.1 8.8 11.0 5.6 -2.2 5.0 2.5 6.0 6.2 8.6 2.9 4.3
Contributions to GDP (% points)Domestic final sales 2.9 3.3 3.8 3.7 3.0 3.2 2.7 2.1 1.9 3.4 2.8 2.4Inventories 1.4 -0.2 6.0 2.7 0.0 3.6 1.3 2.1 1.7 2.5 1.7 -1.3Net trade (goods & services) 0.7 1.5 -6.6 -2.7 -0.3 -3.9 0.0 -0.3 0.4 -1.8 -1.1 1.9
Unemployment rate (% nsa) 1.2 1.1 1.0 0.9 0.8 0.8 0.8 0.8 1.2 1.1 0.8 0.8Consumer prices 0.6 1.3 1.5 0.8 0.7 0.7 0.7 0.8 0.7 1.1 0.7 1.0Exports (BOP basis) 11.1 13.4 2.8 2.3 -3.6 -3.9 -0.1 3.6 9.8 7.2 -1.0 4.1Imports (BOP basis) 17.5 15.8 17.0 7.5 -2.9 3.7 0.9 7.5 13.2 14.3 2.4 4.4Trade balance (US$bn, BOP basis) 6.6 6.8 3.6 4.4 6.8 2.2 3.0 2.3 34.2 22.3 14.4 14.3Current account balance (US$bn) 15.9 7.6 4.5 7.1 14.6 5.3 5.5 6.3 50.2 35.2 31.6 34.8Current account balance (% of GDP) 10.7 10.4 8.1 6.9 6.6 6.1 6.2 5.9 11.0 6.9 5.9 6.0Fiscal balance (% of GDP, fiscal year) -3.1 -2.4 -2.6 -3.0Overnight repo rate (%) 1.50 1.50 1.50 1.75 1.75 1.75 1.75 1.75 1.50 1.75 1.75 1.75Exchange rate (USD/THB) 31.2 33.2 32.4 32.4 31.8 32.0 31.8 31.3 32.7 32.4 31.3 30.2

Nomura | Asia Economic Monthly 10 May 2019
67
Asia in charts
Fig. 75: Gross domestic product (quarterly)
Note: Aggregate Asia ex-Japan is calculated using purchasing power parity (PPP) adjusted share of world GDP. Source: CEIC and Nomura.
Fig. 76: Consumer price index (monthly)
Note: Aggregate Asia ex-Japan is calculated using purchasing power parity (PPP) adjusted share of world GDP. Source: CEIC and Nomura.
Fig. 77: Current account balance (quarterly)
Note: Aggregate Asia ex-Japan is calculated using purchasing power parity (PPP) adjusted share of world GDP. Source: CEIC and Nomura.
Fig. 78: Asia export leading index (monthly)
Note: Aggregate Asia ex-Japan is calculated using purchasing power parity (PPP) adjusted share of world GDP. Source: Bloomberg; OECD; Semiconductor Industry Association; CEIC and Nomura.
Fig. 79: Foreign exchange (against USD, monthly)
Note: Aggregate Asia ex-Japan is calculated using purchasing power parity (PPP) adjusted share of world GDP. Last data point is 9 May 2019. Source: Bloomberg and Nomura.
Fig. 80: Policy rate (monthly)
Note: Aggregate Asia ex-Japan is calculated using purchasing power parity (PPP)
adjusted share of world GDP. Last data point is 9 May 2019.
Source: CEIC and Nomura.
-2
-1
0
1
2
3
4
5
6
7
8
Mar-14 Mar-15 Mar-16 Mar-17 Mar-18 Mar-19
% y-o-y Asia ex-Japan Japan
EU US
-1
0
1
2
3
4
Apr-15 Apr-16 Apr-17 Apr-18 Apr-19
% y-o-y JapanUnited StatesEUAsia-ex Japan
-150
-100
-50
0
50
100
150
200
Dec-13 Dec-14 Dec-15 Dec-16 Dec-17 Dec-18
USD bn Asia ex-Japan Japan
EU US
11
24
37
50
63
76
89
102
115
-48
-36
-24
-12
0
12
24
36
48
May-09 May-11 May-13 May-15 May-17 May-19
Aug 2004 = 100% y-o-y Asia ex-Japan's total exports, lhs
Nomura's export leading index, rhs
80
90
100
110
120
130
May-14 May-15 May-16 May-17 May-18 May-19
Asia ex-Japan
Japan
Europe
Index (Jan 2007 = 100)
0
1
2
3
4
5
May-14 May-15 May-16 May-17 May-18 May-19
Asia ex-Japan Japan
Europe US
%

Nomura | Asia Economic Monthly 10 May 2019
68
Fig. 81: Gross domestic product (quarterly)
Source: CEIC and Nomura.
Fig. 82: Industrial production (monthly)
Source: CEIC and Nomura.
Fig. 83: Gross domestic product (quarterly)
Source: CEIC and Nomura.
Fig. 84: Industrial production (monthly)
Source: CEIC and Nomura.
Fig. 85: Gross domestic product (quarterly)
Source: CEIC and Nomura.
Fig. 86: Industrial production (monthly)
Source: CEIC and Nomura.
3
4
5
6
7
8
9
10
Mar-14 Mar-15 Mar-16 Mar-17 Mar-18 Mar-19
% y-o-y
China India Indonesia
-5
-3
-1
1
3
5
7
9
11
Mar-14 Mar-15 Mar-16 Mar-17 Mar-18 Mar-19
% y-o-y China
India
Indonesia
-1
0
1
2
3
4
5
6
7
8
Mar-14 Mar-15 Mar-16 Mar-17 Mar-18 Mar-19
% y-o-y
Thailand
Malaysia
Philippines
-15
-10
-5
0
5
10
15
20
25
Mar-14 Mar-15 Mar-16 Mar-17 Mar-18 Mar-19
% y-o-yMalaysia
Philippines
Thailand
-1
0
1
2
3
4
5
6
Mar-14 Mar-15 Mar-16 Mar-17 Mar-18 Mar-19
% y-o-y Hong Kong Singapore
Korea Taiwan
-15
-10
-5
0
5
10
15
20
25
Mar-14 Mar-15 Mar-16 Mar-17 Mar-18 Mar-19
% y-o-ySingapore
Korea
Taiwan
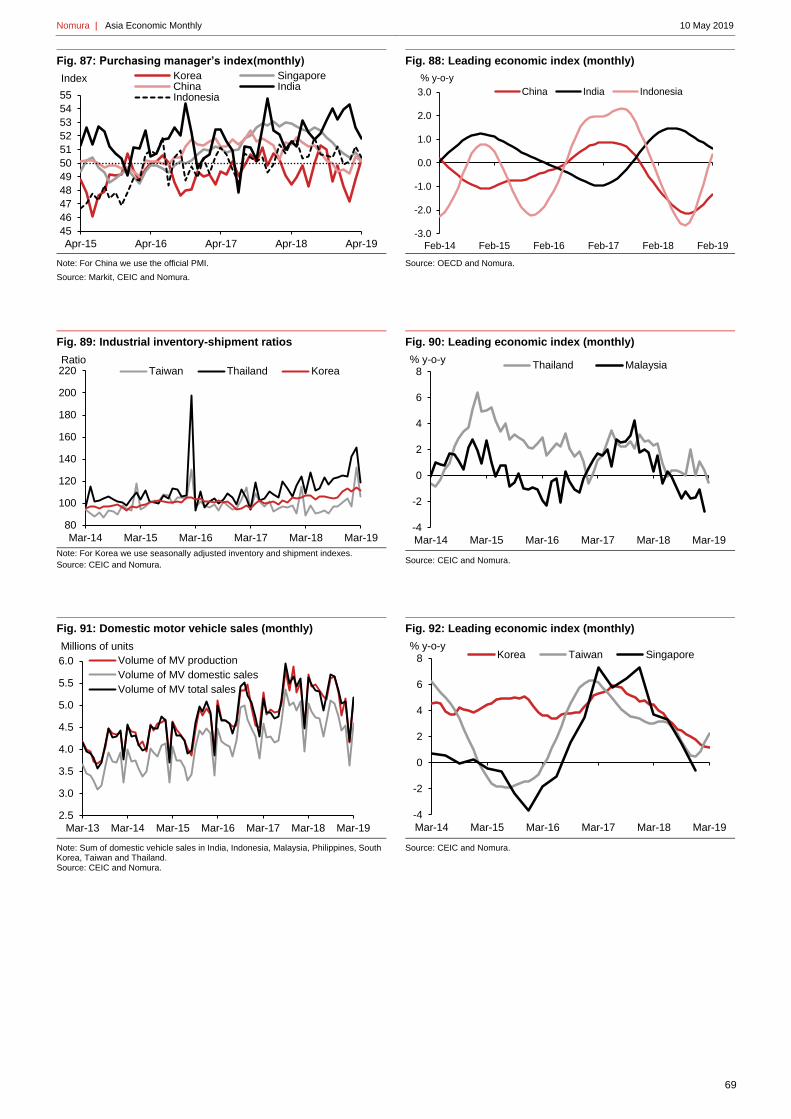
Nomura | Asia Economic Monthly 10 May 2019
69
Fig. 87: Purchasing manager’s index(monthly)
Note: For China we use the official PMI.
Source: Markit, CEIC and Nomura.
Fig. 88: Leading economic index (monthly)
Source: OECD and Nomura.
Fig. 89: Industrial inventory-shipment ratios
Note: For Korea we use seasonally adjusted inventory and shipment indexes.
Source: CEIC and Nomura.
Fig. 90: Leading economic index (monthly)
Source: CEIC and Nomura.
Fig. 91: Domestic motor vehicle sales (monthly)
Note: Sum of domestic vehicle sales in India, Indonesia, Malaysia, Philippines, South Korea, Taiwan and Thailand. Source: CEIC and Nomura.
Fig. 92: Leading economic index (monthly)
Source: CEIC and Nomura.
45
46
47
48
49
50
51
52
53
54
55
Apr-15 Apr-16 Apr-17 Apr-18 Apr-19
Index Korea SingaporeChina IndiaIndonesia
-3.0
-2.0
-1.0
0.0
1.0
2.0
3.0
Feb-14 Feb-15 Feb-16 Feb-17 Feb-18 Feb-19
% y-o-y
China India Indonesia
80
100
120
140
160
180
200
220
Mar-14 Mar-15 Mar-16 Mar-17 Mar-18 Mar-19
RatioTaiwan Thailand Korea
-4
-2
0
2
4
6
8
Mar-14 Mar-15 Mar-16 Mar-17 Mar-18 Mar-19
% y-o-yThailand Malaysia
2.5
3.0
3.5
4.0
4.5
5.0
5.5
6.0
Mar-13 Mar-14 Mar-15 Mar-16 Mar-17 Mar-18 Mar-19
Millions of units
Volume of MV production
Volume of MV domestic sales
Volume of MV total sales
-4
-2
0
2
4
6
8
Mar-14 Mar-15 Mar-16 Mar-17 Mar-18 Mar-19
% y-o-yKorea Taiwan Singapore
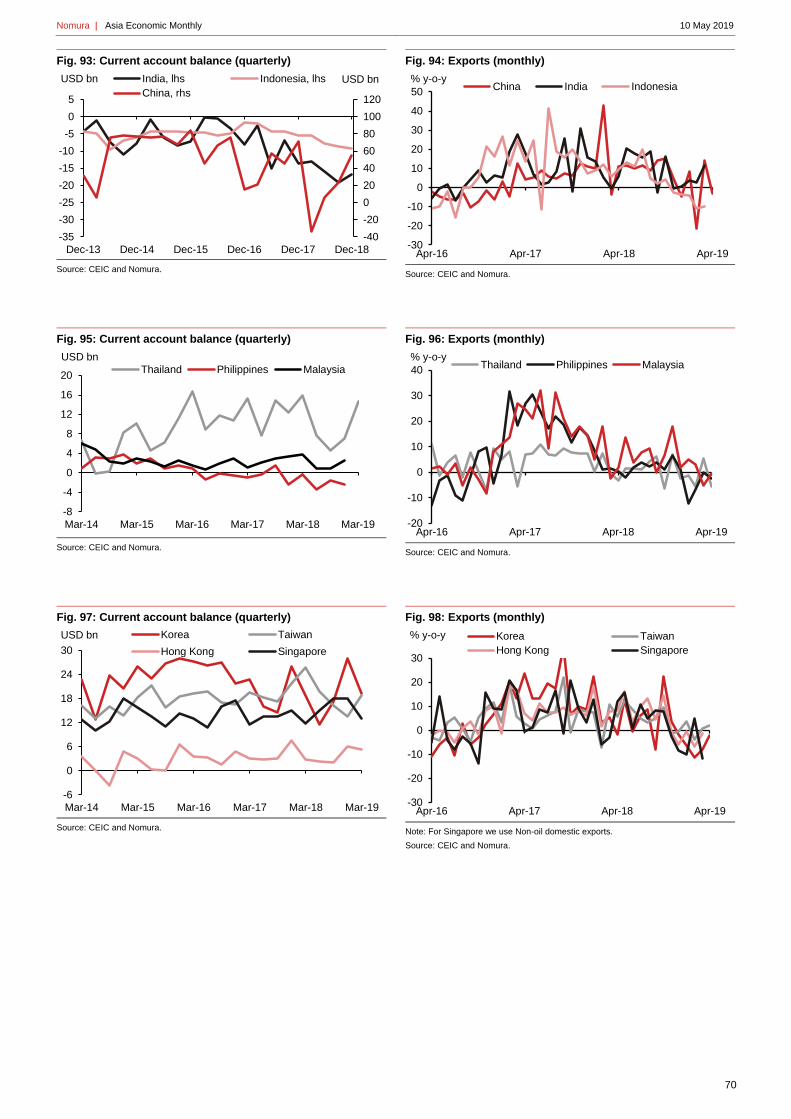
Nomura | Asia Economic Monthly 10 May 2019
70
Fig. 93: Current account balance (quarterly)
Source: CEIC and Nomura.
Fig. 94: Exports (monthly)
Source: CEIC and Nomura.
Fig. 95: Current account balance (quarterly)
Source: CEIC and Nomura.
Fig. 96: Exports (monthly)
Source: CEIC and Nomura.
Fig. 97: Current account balance (quarterly)
Source: CEIC and Nomura.
Fig. 98: Exports (monthly)
Note: For Singapore we use Non-oil domestic exports.
Source: CEIC and Nomura.
-40
-20
0
20
40
60
80
100
120
-35
-30
-25
-20
-15
-10
-5
0
5
Dec-13 Dec-14 Dec-15 Dec-16 Dec-17 Dec-18
USD bnUSD bn India, lhs Indonesia, lhs
China, rhs
-30
-20
-10
0
10
20
30
40
50
Apr-16 Apr-17 Apr-18 Apr-19
% y-o-y China India Indonesia
-8
-4
0
4
8
12
16
20
Mar-14 Mar-15 Mar-16 Mar-17 Mar-18 Mar-19
USD bn
Thailand Philippines Malaysia
-20
-10
0
10
20
30
40
Apr-16 Apr-17 Apr-18 Apr-19
% y-o-y Thailand Philippines Malaysia
-6
0
6
12
18
24
30
Mar-14 Mar-15 Mar-16 Mar-17 Mar-18 Mar-19
USD bn Korea Taiwan
Hong Kong Singapore
-30
-20
-10
0
10
20
30
Apr-16 Apr-17 Apr-18 Apr-19
% y-o-y Korea Taiwan
Hong Kong Singapore
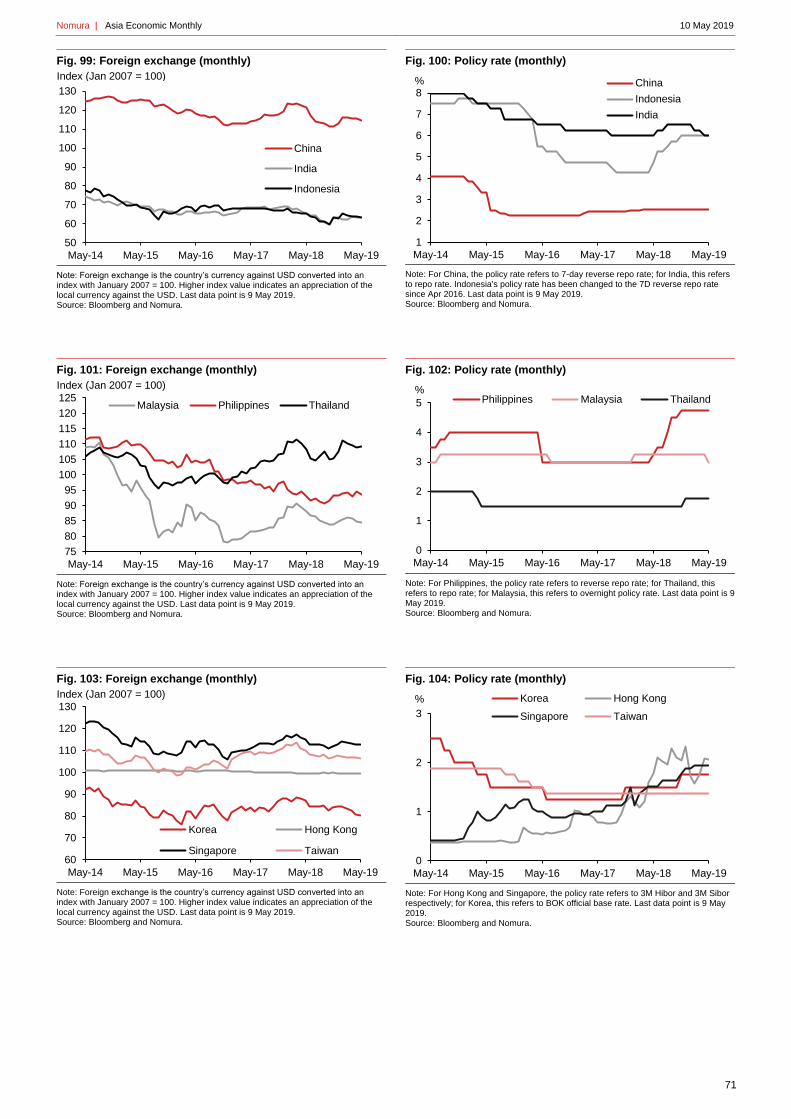
Nomura | Asia Economic Monthly 10 May 2019
71
Fig. 99: Foreign exchange (monthly)
Note: Foreign exchange is the country’s currency against USD converted into an index with January 2007 = 100. Higher index value indicates an appreciation of the local currency against the USD. Last data point is 9 May 2019. Source: Bloomberg and Nomura.
Fig. 100: Policy rate (monthly)
Note: For China, the policy rate refers to 7-day reverse repo rate; for India, this refers to repo rate. Indonesia's policy rate has been changed to the 7D reverse repo rate since Apr 2016. Last data point is 9 May 2019. Source: Bloomberg and Nomura.
Fig. 101: Foreign exchange (monthly)
Note: Foreign exchange is the country’s currency against USD converted into an index with January 2007 = 100. Higher index value indicates an appreciation of the local currency against the USD. Last data point is 9 May 2019. Source: Bloomberg and Nomura.
Fig. 102: Policy rate (monthly)
Note: For Philippines, the policy rate refers to reverse repo rate; for Thailand, this refers to repo rate; for Malaysia, this refers to overnight policy rate. Last data point is 9 May 2019. Source: Bloomberg and Nomura.
Fig. 103: Foreign exchange (monthly)
Note: Foreign exchange is the country’s currency against USD converted into an index with January 2007 = 100. Higher index value indicates an appreciation of the local currency against the USD. Last data point is 9 May 2019. Source: Bloomberg and Nomura.
Fig. 104: Policy rate (monthly)
Note: For Hong Kong and Singapore, the policy rate refers to 3M Hibor and 3M Sibor respectively; for Korea, this refers to BOK official base rate. Last data point is 9 May 2019. Source: Bloomberg and Nomura.
50
60
70
80
90
100
110
120
130
May-14 May-15 May-16 May-17 May-18 May-19
China
India
Indonesia
Index (Jan 2007 = 100)
1
2
3
4
5
6
7
8
May-14 May-15 May-16 May-17 May-18 May-19
China
Indonesia
India
%
75
80
85
90
95
100
105
110
115
120
125
May-14 May-15 May-16 May-17 May-18 May-19
Malaysia Philippines Thailand
Index (Jan 2007 = 100)
0
1
2
3
4
5
May-14 May-15 May-16 May-17 May-18 May-19
Philippines Malaysia Thailand%
60
70
80
90
100
110
120
130
May-14 May-15 May-16 May-17 May-18 May-19
Korea Hong Kong
Singapore Taiwan
Index (Jan 2007 = 100)
0
1
2
3
May-14 May-15 May-16 May-17 May-18 May-19
Korea Hong Kong
Singapore Taiwan
%

Nomura | Asia Economic Monthly 10 May 2019
72
Fig. 105: Consumer price index (monthly)
Source: CEIC and Nomura.
Fig. 106: Unemployment (non s.a.)
Source: CEIC and Nomura.
Fig. 107: Consumer price index (monthly)
Source: CEIC and Nomura.
Fig. 108: Unemployment (non s.a.)
Source: CEIC and Nomura.
Fig. 109: Consumer price index (monthly)
Source: CEIC and Nomura.
Fig. 110: Unemployment (s.a.)
Source: CEIC and Nomura.
0
3
6
9
Apr-15 Apr-16 Apr-17 Apr-18 Apr-19
% y-o-y
India China Indonesia
3
4
5
6
7
Apr-15 Apr-16 Apr-17 Apr-18 Apr-19
Indonesia
China
%
-2
-1
0
1
2
3
4
5
6
7
Apr-15 Apr-16 Apr-17 Apr-18 Apr-19
% y-o-yThailand Philippines
Malaysia
0
1
2
3
4
5
6
7
Apr-15 Apr-16 Apr-17 Apr-18 Apr-19
Philippines
Thailand
%
-2
-1
0
1
2
3
4
5
6
Apr-15 Apr-16 Apr-17 Apr-18 Apr-19
% y-o-y Korea
Singapore
Hong Kong
Taiwan
1
2
2
3
3
4
4
5
5
Apr-15 Apr-16 Apr-17 Apr-18 Apr-19
Hong Kong Malaysia
Singapore Korea
Taiwan
%

Nomura | Asia Economic Monthly 10 May 2019
73
Fig. 111: Stock price index (monthly)
Note: Stock price index for each country is rebased with 100 as the index value in January 2007. Last data point is 9 May 2019. Source: Shanghai Composite (China); SENSEX (India), Jakarta Composite (Indonesia) and Nomura.
Fig. 112: House price index (monthly)
Note: House price index for each country is rebased with 100 as the index value in January 2009. For China, Average Residential Building Selling Price is used to calculate the House price index. Source: CEIC and Nomura.
Fig. 113: Stock price index (monthly)
Note: Stock price index for each country is rebased with 100 as the index value in January 2007. Last data point is 9 May 2019. Source: FTSE Bursa Malaysia Composite (Malaysia); PSEi (Philippines); SET (Thailand) and Nomura.
Fig. 114: House price index (monthly)
Note: House price index for each country is rebased with 100 as the index value in January 2009. Source: CEIC and Nomura.
Fig. 115: Stock price index (monthly)
Note: Stock price index for each country is rebased with 100 as the index value in January 2007. Last data point is 9 May 2019. Source: TWSE (Taiwan), KOSPI (Korea); Hang Seng (Hong Kong); FTSE Strait Times (Singapore) and Nomura.
Fig. 116: House price index (monthly)
Note: House price index for each country is rebased with 100 as the index value in January 2009. Source: CEIC and Nomura.
50
100
150
200
250
300
350
400
May-15 May-16 May-17 May-18 May-19
China India Indonesia
Index (Jan 2007 = 100)
90
110
130
150
170
190
210
230
Mar-13 Mar-14 Mar-15 Mar-16 Mar-17 Mar-18 Mar-19
China
Indonesia
Index (Mar 2009 = 100)
100
150
200
250
300
May-15 May-16 May-17 May-18 May-19
Philippines Thailand Malaysia
Index (Jan 2007 = 100)
90
110
130
150
170
190
210
230
Mar-13 Mar-14 Mar-15 Mar-16 Mar-17 Mar-18 Mar-19
Malaysia
Thailand
Index (Mar 2009 = 100)
80
100
120
140
160
180
200
May-15 May-16 May-17 May-18 May-19
Korea Taiwan
Hong Kong Singapore
Index (Jan 2007 = 100)
100
140
180
220
260
300
340
380
Apr-13 Apr-14 Apr-15 Apr-16 Apr-17 Apr-18 Apr-19
Korea Hong Kong
Taiwan Singapore
Index (Mar 2009 = 100)

Nomura | Asia Economic Monthly 10 May 2019
74
Recent articles
Date Article Title
4-Apr-19 Asia: Asia's current account myths
8-Mar-19 Asia: Asia's coming to a fork in the road
15-Feb-19 Asia: Fiscal policy easing is safer for Asia
1-Feb-19 Damocles: Update #1
11-Jan-19 Asia: The widening growth gulf in Asia
10-Dec-18 Asia in 2019: Always darkest before the dawn
19-Nov-18 A US-Sino trade war is not all lose-lose: We assess the potential beneficiaries in Asia
9-Nov-18 Gauging how Asia's central banks set policy
9-Nov-18 Asia: Asia's changing pressure points
5-Oct-18 Asia: What drives the current account matters
10-Sep-18 Damocles: Our early warning indicator of exchange rate crises
7-Sep-18 Asia: Fiscal policy diverges across Asia
5-Sep-18 Thailand: A fragile investment cycle
9-Aug-18 Asia: Asia's macro policies
5-Jul-18 Asia: Caution: Asia growth slowdown
8-Jun-18 Asia: Painful snapback risk is highest in Q3
11-May-18 Asia: One step at a time
16-Apr-18 The Belt and Road Initiative: Globalisation, China style
13-Apr-18 Asia: Diverging housing market outlooks
23-Mar-18 In an EM snapback, where do the risks lie?
9-Mar-18 Asia: Fiscal activism
22-Feb-18 China: Beyond falling M2 growth
9-Feb-18 Export engine still chugging along
23-Jan-18 Korea: Time for the National Pension Service to escape "home bias"
19-Jan-18 Global EM 2018 outlook: Enjoy the party but stay close to the door
12-Jan-18 Asia: Cruise control
7-Dec-17 Asia in 2018: Stretching the sweet spot
9-Nov-17 Oil price moves: a big EM differentiator
3-Nov-17 Singapore: What lies beneath
6-Oct-17 Asia: What's on investors' minds
8-Sep-17 Asia: ASEAN’s improving external resilience
1-Sep-17 China: Coming out of the shadows
18-Aug-17 Brinkmanship on the Korean peninsula
11-Aug-17 Calling time on Asia's sweet spot
1-Aug-17 India and ASEAN: Asia's next FDI magnets
25-Jul-17 The tranquil path of Asian inflation
14-Jul-17 Hong Kong: Flush liquidity to ebb
7-Jul-17 Asia: Twenty years on from the Asian crisis
9-Jun-17 Asia: China's risks are under control for now
4-May-17 Asia's temporary sweet spot
Nomura | Asia Economic Monthly 10 May 2019
75
Appendix A-1
Analyst Certification
We, Robert Nemmara Subbaraman, Ting Lu, Sonal Varma and Euben Paracuelles, hereby certify (1) that the views expressed
in this Research report accurately reflect our personal views about any or all of the subject securities or issuers referred to in
this Research report, (2) no part of our compensation was, is or will be directly or indirectly related to the specific
recommendations or views expressed in this Research report and (3) no part of our compensation is tied to any specific
investment banking transactions performed by Nomura Securities International, Inc., Nomura International plc or any other
Nomura Group company.
Issuer Specific Regulatory Disclosures
The terms "Nomura" and "Nomura Group" used herein refers to Nomura Holdings, Inc. and its affiliates and subsidiaries, including Nomura
Securities International, Inc. ('NSI') and Instinet, LLC('ILLC'), U. S. registered broker dealers and members of SIPC.
Issuer Disclosures
KINGDOM OF THAILAND A1,A2
REPUBLIC OF KOREA A1,A2,A3,A13
REPUBLIC OF THE PHILIPPINES A1,A2,A4,A5,A6,A7
A1 The Nomura Group has received compensation for non-investment banking products or services from the subject company in the past 12 months.
A2 The Nomura Group has had a non-investment banking securities related services client relationship with the subject company during the past 12 months.
A3 The Nomura Group has had a non-securities related services client relationship with the subject company during the past 12 months.
A4 The Nomura Group has had an investment banking services client relationship with the subject company during the past 12 months.
A5 The Nomura Group has received compensation for investment banking services from the subject company in the past 12 months.
A6 The Nomura Group expects to receive or intends to seek compensation for investment banking services from the subject company in the next three months.
A7 The Nomura Group has managed or co-managed a public or private offering of the subject company's securities in the past 12 months.
A13 The Nomura Group has a significant financial interest (non-equity) in the issuer.
Important Disclosures Online availability of research and conflict-of-interest disclosures Nomura Group research is available on www.nomuranow.com/research, Bloomberg, Capital IQ, Factset, Reuters and ThomsonOne. Important disclosures may be read at http://go.nomuranow.com/research/globalresearchportal/pages/disclosures/disclosures.aspx or requested from Nomura Securities International, Inc., or Instinet, LLC on 1-877-865-5752. If you have any difficulties with the website, please email [email protected] for help. The analysts responsible for preparing this report have received compensation based upon various factors including the firm's total revenues, a portion of which is generated by Investment Banking activities. Unless otherwise noted, the non-US analysts listed at the front of this report are not registered/qualified as research analysts under FINRA rules, may not be associated persons of NSI or ILLC, and may not be subject to FINRA Rule 2241 restrictions on communications with covered companies, public appearances, and trading securities held by a research analyst account.
Nomura Global Financial Products Inc. (“NGFP”) Nomura Derivative Products Inc. (“NDPI”) and Nomura International plc. (“NIplc”) are registered with the Commodities Futures Trading Commission and the National Futures Association (NFA) as swap dealers. NGFP, NDPI, and NIplc are generally engaged in the trading of swaps and other derivative products, any of which may be the subject of this report. Disclaimers This publication contains material that has been prepared by the Nomura Group entity identified on page 1 and, if applicable, with the contributions of one or more Nomura Group entities whose employees and their respective affiliations are specified on page 1 or identified elsewhere in the publication. The term "Nomura Group" used herein refers to Nomura Holdings, Inc. and its affiliates and subsidiaries including: Nomura Securities Co., Ltd. ('NSC') Tokyo, Japan; Nomura Financial Products Europe GmbH (‘NFPE’), Germany; Nomura International plc ('NIplc'), UK; Nomura Securities International, Inc. ('NSI'), New York, US; Instinet, LLC ('ILLC'); Nomura International (Hong Kong) Ltd. (‘NIHK’), Hong Kong; Nomura Financial Investment (Korea) Co., Ltd. (‘NFIK’), Korea (Information on Nomura analysts registered with the Korea Financial Investment Association ('KOFIA') can be found on the KOFIA Intranet at http://dis.kofia.or.kr); Nomura Singapore Ltd. (‘NSL’), Singapore (Registration number 197201440E, regulated by the Monetary Authority of Singapore); Nomura Australia Ltd. (‘NAL’), Australia (ABN 48 003 032 513), regulated by the Australian Securities and Investment Commission ('ASIC') and holder of an Australian financial services licence number 246412; PT Nomura Sekuritas Indonesia (‘PTNSI’); Nomura Securities Malaysia Sdn. Bhd. (‘NSM’), Malaysia; NIHK, Taipei Branch (‘NITB’), Taiwan; Nomura Financial Advisory and Securities (India) Private Limited (‘NFASL’), Mumbai, India (Registered Address: Ceejay

Nomura | Asia Economic Monthly 10 May 2019
76
House, Level 11, Plot F, Shivsagar Estate, Dr. Annie Besant Road, Worli, Mumbai- 400 018, India; Tel: +91 22 4037 4037, Fax: +91 22 4037 4111; CIN No: U74140MH2007PTC169116, SEBI Registration No. for Stock Broking activities : BSE INB011299030, NSE INB231299034, INF231299034, INE 231299034, MCX: INE261299034; SEBI Registration No. for Merchant Banking : INM000011419; SEBI Registration No. for Research: INH000001014. ‘CNS Thailand’ next to an analyst’s name on the front page of a research report indicates that the analyst is employed by Capital Nomura Securities Public Company Limited (‘CNS’) to provide research assistance services to NSL under an agreement between CNS and NSL. ‘NSFSPL’ next to an employee’s name on the front page of a research report indicates that the individual is employed by Nomura Structured Finance Services Private Limited to provide assistance to certain Nomura entities under inter-company agreements. The "BDO-NS" (which stands for "BDO Nomura Securities, Inc.") placed next to an analyst’s name on the front page of a research report indicates that the analyst is employed by BDO Unibank Inc. ("BDO Unibank") who has been seconded to BDO-NS, to provide research assistance services to NSL under an agreement between BDO Unibank, NSL and BDO-NS. BDO-NS is a Philippines securities dealer, which is a joint venture between BDO Unibank and the Nomura Group.
THIS MATERIAL IS: (I) FOR YOUR PRIVATE INFORMATION, AND WE ARE NOT SOLICITING ANY ACTION BASED UPON IT; (II) NOT TO BE CONSTRUED AS AN OFFER TO SELL OR A SOLICITATION OF AN OFFER TO BUY ANY SECURITY IN ANY JURISDICTION WHERE SUCH OFFER OR SOLICITATION WOULD BE ILLEGAL; AND (III) OTHER THAN DISCLOSURES RELATING TO THE NOMURA GROUP, BASED UPON INFORMATION FROM SOURCES THAT WE CONSIDER RELIABLE, BUT HAS NOT BEEN INDEPENDENTLY VERIFIED BY NOMURA GROUP. Other than disclosures relating to the Nomura Group, the Nomura Group does not warrant or represent that the document is accurate, complete, reliable, fit for any particular purpose or merchantable and does not accept liability for any act (or decision not to act) resulting from use of this document and related data. To the maximum extent permissible all warranties and other assurances by the Nomura Group are hereby excluded and the Nomura Group shall have no liability for the use, misuse, or distribution of this information. Opinions or estimates expressed are current opinions as of the original publication date appearing on this material and the information, including the opinions and estimates contained herein, are subject to change without notice. The Nomura Group is under no duty to update this document. Any comments or statements made herein are those of the author(s) and may differ from views held by other parties within Nomura Group. Clients should consider whether any advice or recommendation in this report is suitable for their particular circumstances and, if appropriate, seek professional advice, including tax advice. The Nomura Group does not provide tax advice. The Nomura Group, and/or its officers, directors and employees, may, to the extent permitted by applicable law and/or regulation, deal as principal, agent, or otherwise, or have long or short positions in, or buy or sell, the securities, commodities or instruments, or options or other derivative instruments based thereon, of issuers or securities mentioned herein. The Nomura Group companies may also act as market maker or liquidity provider (within the meaning of applicable regulations in the UK) in the financial instruments of the issuer. Where the activity of market maker is carried out in accordance with the definition given to it by specific laws and regulations of the US or other jurisdictions, this will be separately disclosed within the specific issuer disclosures. This document may contain information obtained from third parties, including ratings from credit ratings agencies such as Standard & Poor’s. Reproduction and distribution of third-party content in any form is prohibited except with the prior written permission of the related third-party. Third-party content providers do not guarantee the accuracy, completeness, timeliness or availability of any information, including ratings, and are not responsible for any errors or omissions (negligent or otherwise), regardless of the cause, or for the results obtained from the use of such content. Third-party content providers give no express or implied warranties, including, but not limited to, any warranties of merchantability or fitness for a particular purpose or use. Third-party content providers shall not be liable for any direct, indirect, incidental, exemplary, compensatory, punitive, special or consequential damages, costs, expenses, legal fees, or losses (including lost income or profits and opportunity costs) in connection with any use of their content, including ratings. Credit ratings are statements of opinions and are not statements of fact or recommendations to purchase hold or sell securities. They do not address the suitability of securities or the suitability of securities for investment purposes, and should not be relied on as investment advice. Any MSCI sourced information in this document is the exclusive property of MSCI Inc. (‘MSCI’). Without prior written permission of MSCI, this information and any other MSCI intellectual property may not be reproduced, re-disseminated or used to create any financial products, including any indices. This information is provided on an "as is" basis. The user assumes the entire risk of any use made of this information. MSCI, its affiliates and any third party involved in, or related to, computing or compiling the information hereby expressly disclaim all warranties of originality, accuracy, completeness, merchantability or fitness for a particular purpose with respect to any of this information. Without limiting any of the foregoing, in no event shall MSCI, any of its affiliates or any third party involved in, or related to, computing or compiling the information have any liability for any damages of any kind. MSCI and the MSCI indexes are services marks of MSCI and its affiliates. The intellectual property rights and any other rights, in Russell/Nomura Japan Equity Index belong to Nomura Securities Co., Ltd. ("Nomura") and Frank Russell Company ("Russell"). Nomura and Russell do not guarantee accuracy, completeness, reliability, usefulness, marketability, merchantability or fitness of the Index, and do not account for business activities or services that any index user and/or its affiliates undertakes with the use of the Index. Investors should consider this document as only a single factor in making their investment decision and, as such, the report should not be viewed as identifying or suggesting all risks, direct or indirect, that may be associated with any investment decision. Nomura Group produces a number of different types of research product including, among others, fundamental analysis and quantitative analysis; recommendations contained in one type of research product may differ from recommendations contained in other types of research product, whether as a result of differing time horizons, methodologies or otherwise. The Nomura Group publishes research product in a number of different ways including the posting of product on the Nomura Group portals and/or distribution directly to clients. Different groups of clients may receive different products and services from the research department depending on their individual requirements. Figures presented herein may refer to past performance or simulations based on past performance which are not reliable indicators of future performance. Where the information contains an indication of future performance, such forecasts may not be a reliable indicator of future performance. Moreover, simulations are based on models and simplifying assumptions which may oversimplify and not reflect the future distribution of returns. Any figure, strategy or index created and published for illustrative purposes within this document is not intended for “use” as a “benchmark” as defined by the European Benchmark Regulation. Certain securities are subject to fluctuations in exchange rates that could have an adverse effect on the value or price of, or income derived from, the investment. With respect to Fixed Income Research: Recommendations fall into two categories: tactical, which typically last up to three months; or strategic, which typically last from 6-12 months. However, trade recommendations may be reviewed at any time as circumstances change. ‘Stop loss’ levels for trades are also provided; which, if hit, closes the trade recommendation automatically. Prices and yields shown in recommendations are taken at the time of submission for publication and are based on either indicative Bloomberg, Reuters or Nomura prices and yields at that time. The prices and yields shown are not necessarily those at which the trade recommendation can be implemented. The securities described herein may not have been registered under the US Securities Act of 1933 (the ‘1933 Act’), and, in such case, may not be offered or sold in the US or to US persons unless they have been registered under the 1933 Act, or except in compliance with an exemption from the registration requirements of the 1933 Act. Unless governing law permits otherwise, any transaction should be executed via a Nomura entity in your home jurisdiction.

Nomura | Asia Economic Monthly 10 May 2019
77
This document has been approved for distribution in the UK as investment research by NIplc. NIplc is authorised by the Prudential Regulation Authority and regulated by the Financial Conduct Authority and the Prudential Regulation Authority. NIplc is a member of the London Stock Exchange. This document does not constitute a personal recommendation within the meaning of applicable regulations in the UK, or take into account the particular investment objectives, financial situations, or needs of individual investors. This document is intended only for investors who are 'eligible counterparties' or 'professional clients' for the purposes of applicable regulations in the UK, and may not, therefore, be redistributed to persons who are 'retail clients' for such purposes. This document has been approved for distribution in the European Economic Area as investment research by Nomura Financial Products Europe GmbH (“NFPE”). NFPE is a company organized as a limited liability company under German law registered in the Commercial Register of the Court of Frankfurt/Main under HRB 110223. NFPE is authorized and regulated by the German Federal Financial Supervisory Authority (BaFin). This document has been approved by NIHK, which is regulated by the Hong Kong Securities and Futures Commission, for distribution in Hong Kong by NIHK. This document has been approved for distribution in Australia by NAL, which is authorized and regulated in Australia by the ASIC. This document has also been approved for distribution in Malaysia by NSM. In Singapore, this document has been distributed by NSL. NSL accepts legal responsibility for the content of this document, where it concerns securities, futures and foreign exchange, issued by their foreign affiliates in respect of recipients who are not accredited, expert or institutional investors as defined by the Securities and Futures Act (Chapter 289). Recipients of this document in Singapore should contact NSL in respect of matters arising from, or in connection with, this document. Unless prohibited by the provisions of Regulation S of the 1933 Act, this material is distributed in the US, by NSI, a US-registered broker-dealer, which accepts responsibility for its contents in accordance with the provisions of Rule 15a-6, under the US Securities Exchange Act of 1934. The entity that prepared this document permits its separately operated affiliates within the Nomura Group to make copies of such documents available to their clients. This document has not been approved for distribution to persons other than ‘Authorised Persons’, ‘Exempt Persons’ or ‘Institutions’ (as defined by the Capital Markets Authority) in the Kingdom of Saudi Arabia (‘Saudi Arabia’) or a ’Market Counterparty’ or a 'Professional Client' (as defined by the Dubai Financial Services Authority) in the United Arab Emirates (‘UAE’) or a ‘Market Counterparty’ or a ‘Business Customer’ (as defined by the Qatar Financial Centre Regulatory Authority) in the State of Qatar (‘Qatar’) by Nomura Saudi Arabia, NIplc or any other member of the Nomura Group, as the case may be. Neither this document nor any copy thereof may be taken or transmitted or distributed, directly or indirectly, by any person other than those authorised to do so into Saudi Arabia or in the UAE or in Qatar or to any person other than ‘Authorised Persons’, ‘Exempt Persons’ or ‘Institutions’ located in Saudi Arabia or a ’Market Counterparty’ or a 'Professional Client' in the UAE or a ‘Market Counterparty’ or a ‘Business Customer’ in Qatar. Any failure to comply with these restrictions may constitute a violation of the laws of the UAE or Saudi Arabia or Qatar. For Canadian Investors: This research report was approved for distribution to Canadian investors by Instinet Canada Limited ("ICL"), member of the Investment Industry Regulatory Organization of Canada ("IIROC") and member of the Canadian Investor Protection Fund. An affiliate of ICL prepared the research report (an "Affiliate Research Report") in accordance with the regulatory requirements applicable to research in the affiliate's local jurisdiction, which include conflict of interest disclosure. ICL reviewed this Affiliate Research Report for the purpose of ensuring Canadian disclosures required by IIROC are included. ICL does not receive compensation in respect of the distribution of Affiliate Research Reports. Pursuant to ICL's policies and procedures regarding the dissemination of research, ICL makes available Affiliate Research Reports to ICL clients and prospective clients only, in electronic and/or in printed form. ICL endeavours to make available and/or distribute Affiliate Research Reports to all intended recipients at the same time. This Affiliate Research Report is not a recommendation and does not take into account the investment objectives, financial situation or particular needs of any particular account. For report with reference of TAIWAN public companies or authored by Taiwan based research analyst: THIS DOCUMENT IS SOLELY FOR REFERENCE ONLY. You should independently evaluate the investment risks and are solely responsible for your investment decisions. NO PORTION OF THE REPORT MAY BE REPRODUCED OR QUOTED BY THE PRESS OR ANY OTHER PERSON WITHOUT WRITTEN AUTHORIZATION FROM NOMURA GROUP. Pursuant to Operational Regulations Governing Securities Firms Recommending Trades in Securities to Customers and/or other applicable laws or regulations in Taiwan, you are prohibited to provide the reports to others (including but not limited to related parties, affiliated companies and any other third parties) or engage in any activities in connection with the reports which may involve conflicts of interests. INFORMATION ON SECURITIES / INSTRUMENTS NOT EXECUTABLE BY NOMURA INTERNATIONAL (HONG KONG) LTD., TAIPEI BRANCH IS FOR INFORMATIONAL PURPOSES ONLY AND IS NOT BE CONSTRUED AS A RECOMMENDATION OR A SOLICITATION TO TRADE IN SUCH SECURITIES / INSTRUMENTS. NO PART OF THIS MATERIAL MAY BE (I) COPIED, PHOTOCOPIED, OR DUPLICATED IN ANY FORM, BY ANY MEANS; OR (II) REDISTRIBUTED WITHOUT THE PRIOR WRITTEN CONSENT OF A MEMBER OF THE NOMURA GROUP. If this document has been distributed by electronic transmission, such as e-mail, then such transmission cannot be guaranteed to be secure or error-free as information could be intercepted, corrupted, lost, destroyed, arrive late or incomplete, or contain viruses. The sender therefore does not accept liability for any errors or omissions in the contents of this document, which may arise as a result of electronic transmission. If verification is required, please request a hard-copy version. Nomura Securities Co., Ltd. Financial instruments firm registered with the Kanto Local Finance Bureau (registration No. 142) Member associations: Japan Securities Dealers Association; Japan Investment Advisers Association; The Financial Futures Association of Japan; and Type II Financial Instruments Firms Association.
The Nomura Group manages conflicts with respect to the production of research through its compliance policies and procedures (including, but not limited to, Conflicts of Interest, Chinese Wall and Confidentiality policies) as well as through the maintenance of Chinese Walls and employee training. Additional information regarding the methodologies or models used in the production of any investment recommendations contained within this document is available upon request by contacting the Research Analysts listed on the front page. Disclosures information is available upon request and disclosure information is available at the Nomura Disclosure web page: http://go.nomuranow.com/research/globalresearchportal/pages/disclosures/disclosures.aspx Copyright © 2019 Nomura International (Hong Kong) Ltd. All rights reserved.