2018.04.26 Jamaica in the Arabica Coffee Global Value ... · 2.2 Global Trade in the Arabica Coffee...
59
Jamaica in the Arabica Coffee Global Value Chain April 2018 Prepared by Jack Daly, Danny Hamrick, Penny Bamber and Karina Fernandez-Stark Duke Global Value Chains Center, Duke University Global Value Chains Center
-
Upload
nguyenhanh -
Category
Documents
-
view
215 -
download
1
Transcript of 2018.04.26 Jamaica in the Arabica Coffee Global Value ... · 2.2 Global Trade in the Arabica Coffee...
Jamaica in the Arabica Coffee Global Value Chain
April 2018
Prepared by Jack Daly, Danny Hamrick, Penny Bamber and Karina Fernandez-Stark Duke Global Value Chains Center, Duke University
Global Value Chains Center
ii
This research was prepared by the Duke University Global Value Chains Center on behalf of the Organization of American States (OAS). This study is part of the establishment of Small Business Development Centers in the Caribbean. The report is based on both primary and secondary information sources. In addition to interviews with firms operating in the sector and supporting institutions, the report draws on secondary research and information sources. The project report is available at www.gvcc.duke.edu. Acknowledgements The Duke University Global Value Chains Center would like to thank all of the interviewees, who gave generously of their time and expertise, as well as Renee Penco of the Organization of American States (OAS) for her extensive support. The Duke University Global Value Chain Center undertakes client-sponsored research that addresses economic and social development issues for governments, foundations and international organizations. We do this principally by utilizing the global value chain (GVC) framework, created by Founding Director Gary Gereffi, and supplemented by other analytical tools. As a university-based research center, we address clients’ real-world questions with transparency and rigor. www.gvcc.duke.edu. Duke Global Value Chain Center, Duke University © April 2018
iii
Jamaica in the Arabica Coffee Global Value Chain Jamaica in the Arabica Coffee Global Value Chain................................................................................... iii
Acronyms ........................................................................................................................................................... v
Executive Summary ......................................................................................................................................... vi
1 Introduction .............................................................................................................................................. 1
2 The Global Arabica Coffee Industry .................................................................................................... 2 2.1 The Arabica Coffee Global Value Chain ................................................................................................... 5
Sources: Areté, 2013; DeSoucey, 2010; Taste of Europe, 2015; WIPO, 2015 .................................. 8 2.2 Global Trade in the Arabica Coffee Global Value Chain ...................................................................... 8
2.2.1 Global Supply .............................................................................................................................................. 8 2.2.2 Global Demand ........................................................................................................................................ 11
2.3 Governance and Lead Firms...................................................................................................................... 12 2.3.1 Standards and Institutions ..................................................................................................................... 14
3 Jamaica in the Arabica Coffee Global Value Chain ........................................................................ 17 3.1 Jamaica’s Current Participation in the Arabica Coffee Global Value Chain .................................. 18 3.2 Governance and Industry Organization ................................................................................................. 23 3.3 Upgrading and Industry Evolution in Jamaica’s Arabica Coffee Global Value Chain ................... 28 3.4 Advantages and Constraints ...................................................................................................................... 29
3.4.1 Advantages ................................................................................................................................................ 29 3.4.2 Challenges ................................................................................................................................................. 30
4 Lessons for Jamaica Upgrading in Arabica Coffee from Global Experiences .......................... 33 4.1 Case Studies .................................................................................................................................................. 34 4.2 Colombia........................................................................................................................................................ 34 4.3 Costa Rica ...................................................................................................................................................... 39 4.4 Lesson Learned for Jamaica ....................................................................................................................... 42
5 Recommended Upgrading Trajectories for Jamaica ...................................................................... 44
6 Bibliography ............................................................................................................................................ 46 Figures Figure 1. NYSE Prices for Coffee Beans and Total Volume, 1995-2016 ................................. 2 Figure 2. The Arabica Coffee Global Value Chain ........................................................................... 5 Figure 3. Leading Arabica Coffee Producers, 2011-2018 (60 lb. bags, ‘000s) ........................ 9 Figure 4. Leading Producers of Arabica and Robusta Coffee Beans, 2015/16 .....................10 Figure 5. Select Leading Exporters Unit Value for Exports, 2005 and 2015 .......................11 Figure 6. Leading Green Coffee Importers 2006-2015 (US$, million) ...................................12 Figure 7. Jamaica’s Coffee Unit Price and Production Volume, 2006-2015 .........................19 Figure 8. Jamaica’s Participation in the Arabica GVC..................................................................20 Figure 9. Jamaica's Coffee Production by Type, 2007-16 ............................................................21 Figure 10. Export Destinations for Jamaican Green Coffee, 2006-2015 ................................22 Figure 11. Significant Actors in the Arabica Coffee Value Chain in Jamaica ......................24 Figure 12. Jamaica Coffee Export Volume and Price, 2007-2016 ............................................26 Figure 13. Jamaica's Arabica Coffee Production, 2005-2014 .....................................................31 Figure 14. Unit Value of Colombian Coffee Exports against Regional, 2000-16 ................38 Figure 15. Unit Price of Costa Rican Coffee Exports, 2005-15 .................................................40

iv
Tables Table 1. Prominent Characteristics of First, Second and Third Wave Coffee ..................... 3 Table 2. Sourcing Strategies of Lead Roasters by Market Segment ......................................14 Table 3. Select Private and Civil Society Standards in the Coffee GVC ...............................15 Table 4. Details Required by Starbucks Suppliers by Receiving Region ................................16 Table 5. Key Industry Stakeholders in the Arabica Coffee GVC .............................................27 Table 6. SWOT of Jamaica’s Arabica Coffee Industry .................................................................29 Table 7. Selected Upgrading Trajectories in the Arabica Coffee GVC .................................33 Table 8. Columbia Trade in Coffee Value Chain, 2007-16..........................................................35 Table 9. Organization and Responsibilities of the FNC ...............................................................36 Boxes Box 1. Geographic Indications ................................................................................................................. 8 Box 2. Jamaica’s Coffee Industry Board (CIB) .............................................................................................17 Box 3. Jamaica Blue Mountain Coffee .................................................................................................18
v
Acronyms
ACE Association of Coffee Excellence AIIL AIC International Investment Limited ANACAFE Guatemalan Coffee Growers Association BoS Bureau of Standards C.A.F.E. Starbucks’ Coffee and Farmer Equity Practices CASE College of Agricultural Science and Education CIB Coffee Industry Board of Jamaica COE Cups of Excellence CP Coffee Competitiveness Program CQI Coffee Quality Institute FDI Foreign Direct Investments FLO Fair Trade Labeling Organization FNC Colombia Coffee Growers Federation FONECAFE National Fund for Coffee Stabilization GAPs Good Agriculture Practices GI Geographic Indication GIS Geographic Information System GVC Global Value Chains ICAFE Instituto del Café de Costa Rica (Coffee Institute of Costa Rica) IFOAM International Federation of Organic Agriculture Movements JACRA Jamaica Agricultural Commodities Regulatory Authority JAS Jamaican Agricultural Service JBM Jamaica Blue Mountain Coffee JCGA Jamaica Coffee Growers Association JCEA Jamaica Coffee Exporter Association JHM Jamaica High Mountain Coffee JIPO Jamaica Intellectual Property Office MICAF Ministry of Industry, Commerce, Agriculture and Fisheries NGOs Non-governmental Organizations NYSE New York Stock Exchange PGI Protected Geographic Indication PDO Protected Denomination of Origin QIA Quality Improvement Agreement RA Rainforest Alliance SCA Specialty Coffee Association SCAA Specialty Coffee Association of America SCAE Specialty Coffee Association of Europe SCI Specialty Coffee Investments Company Limited SME Small-Medium Enterprises SRC Scientific Research Council TSG Traditional Specialty Guarantees
vi
Executive Summary This report uses the Global Value Chain (GVC) framework to examine Jamaica’s position in the global coffee industry and identify opportunities for local business to improve their position in the sector. While the country is a relative small player in terms of overall production volume, its Jamaica Blue Mountain (JBM) coffee has a distinguished history, developing a reputation for premier quality before specialty coffee became a prominent niche in the global industry. The low levels of supply combined with consistent demand from developed markets has allowed the Jamaican coffee industry to earn the highest unit value for its exports of anywhere in the world. There are, however, country-wide constraints that threaten Jamaica’s competitiveness moving forward. Overall productivity is low yet the costs of production are high, infrastructure is mediocre and the country is to somewhat dependent on one export market: Japan. Furthermore, the Coffee Industry Board’s (CIB) shrinking capacity means the institutions active in the sector generally only represent interests at one stage of the value chain, leaving critical supportive activities unattended. Many of these challenges are surmountable; however, they will require a concentrated effort by domestic and regional stakeholders. The Coffee Global Value Chain The global coffee industry is characterized by production concentrated in developing countries in the so-called ‘coffee belt’ around the equator, while consumption is concentrated in northern regions. The coffee GVC can be divided into five categories: production, processing, trade, roasting and marketing. The lowest value captured is in the production stage of the chain, carried out by those countries in the coffee belt, while the highest value captured is in the marketing stage of the chain, which continues to be concentrated in developed countries by global firms. The main coffee species are Arabica and Robusta. Of the two, Arabica is considered to impart a superior taste and earns a higher market price. Partially as result, Arabica continues to account for a slightly larger share of global production, with 55-60% of the world’s supply from 2011 to 2017. While the broad features of the global industry have supported steady growth, there have been important structural evolutions in recent years. These include the following:
• The de-commoditization of the coffee sector in the last two decades. Although coffee is still traded on commodity markets, marketing has raised consumer awareness of not just the quality of the coffee, but also its specific origin, type and flavor profile as well as the social and environmental conditions under which it is produced. This has been driven in part by the rise of specialty coffee stores.
• Traceability and sustainability has become increasingly important. This is
particularly true in two product categories: specialty coffee and certified coffee. In specialty coffee, the product is sold based on its specific origin and the quality characteristics afforded to it by production in that location. In certified coffee, the product’s value is in reassuring the consumer that it has been produced according to a specific set of economic, social and environmentally sustainable norms. This has led to the restructuring of the supply chain, with roasters purchasing directly from farmers in producing regions (i.e., “direct trade”).
• The rise of specialty coffee. “Specialty coffee” describes the emphasis on quality that is a defining feature of third-wave coffee. These coffees usually command higher market prices
vii
due to the superiority of the beans, the majority of which are Arabica, although it is important to note that not all Arabicas are specialty coffees (JBM is an Arabica). While both ‘specialty’ and ‘certified’ designations allow producers to gain access to higher-value market niches, there are pros and cons to each approach. Certification is often expensive, but certifying agencies may offer technical assistance. Specialty coffee does not require costly certifications; however, it does require a certain level of human capital so that growers can produce high-quality beans and effectively access specialty markets. Overall, estimates of the total size of the specialty market in the US range from 5% of the market for green coffee to 38%, depending on the definition of “specialty.”
Jamaica in the Coffee Value Chain A defining characteristic of the Jamaican coffee industry is the high prices it receives on the export market. Over the last decade, Jamaica continued to earn the highest unit prices for its exports—in 2015, the price importers paid for Jamaican coffee was US$21.03/kg, nearly five times higher than the average global export price for Arabica beans (US$4.42/kg). The high price Jamaica receives is in some ways reflective of a second defining characteristic of the industry: its tiny production volume and low productivity. The country generated less than 0.02% of international supply and accounted for only 0.15% of green bean coffee trade by value in 2015. During the last decade, Jamaica’s annual production volume has steadily decreased from its 2007 apex of 15,000 MT to 5,000 MT in 2014. Jamaica’s participation in the coffee GVC is in the production and initial processing stages of the chain. Power is concentrated in three centers: 1) Japanese trading companies; 2) the CIB; and 3) a small cluster of Jamaican firms that process the majority of the country’s JBM coffee. At the other end of the spectrum are the producers, who have minimal organization and control. While these characteristics have in some ways defined the Jamaican industry for years, there has been recent industry evolution. The most significant of these features includes the following:
• Production is fragmented. The major processors and exporters have limited capabilities in the production segment of the chain, instead relying on approximately 7,000 farmers who generally work land smaller than four hectares. While there are exceptions, processors and farmers generally do not have formal contracts or strong relationships, with market transactions characterizing the relationship.
• The CIB has seen its role contract in recent years. Formerly an organization that had expansive extension capabilities as well as commercial operations, the CIB’s focus has narrowed to regulatory matters. While it still evaluates and exports beans from licensed dealers, it currently does not engage with farmers on a large scale and offers only limited technical assistance.
• Amidst consolidation, the major domestic companies remain focused on core activities. The industry has a high degree of integration in the downstream segments of the chain, with processors also acting as leading exporters. Together, Mavis Bank Coffee Factory, Wallenford and Coffee Traders control 80-90% of the export market for JBM beans. While all three of the major processors have varying downstream capabilities, each relies on the export of green beans as its primary source of revenue. At a country level, the export of green beans is more profitable in Jamaica than the trading of roasted coffee.
viii
• Demand from Japanese buyers is weakening. Six Japanese trading companies are the primary buyers of Jamaican coffee. While the relationship between businesses in both countries has been durable, there has been recent turbulence, with the Japanese companies reducing their overall demand and demanding lower prices.
Aggregated, these characteristics lead to strengths for Jamaica as it pursues upgrading trajectories in the coffee GVC. The advantages include:
1. Highest global unit value for coffee exports. Jamaica earns the highest unit price in the world for its coffee exports, a trend that has persisted for decades. The other top five nations for highest unit value for exports in 2015 all received at least 63% lower prices than Jamaica.
2. Favorable reputation for JBM coffee. The high unit price Jamaica earns on the export market is due largely to JBM’s high-quality reputation. The CIB’s long history of monitoring for quality along with a favorable climate and soil conditions led specialty consumers to see JBM coffee as a luxury product.
3. Strong regulatory system to ensure quality. The CIB has been instrumental in Jamaica maintaining its reputation for quality. Its exacting standards and its long history have afforded Jamaica a prominent niche in the specialty market and are prominent assets for the domestic industry.
4. Integrated production and established processors and exporters. Jamaican coffee is relatively integrated, with several processors also acting as traders and some having their own production sites. Many of these actors have long histories in the coffee industry and are expanding activities across value chain.
Despite these strengths, there are multiple challenges, some of which have become particularly pronounced in recent years. The most prominent include:
1. Reliance on single export market. Dependence on the Japanese market subjects Jamaican actors to shocks on the demand side. The result, for example, of Japan’s reluctance to purchase coffee in 2017 is that farmers might see the prices they receive dropped from US$93 per 60-pound box to US$46.
2. Low productivity. Coffee production and yields are both falling dramatically in Jamaica, with aging trees and the lack of tree maintenance both major contributing factors. Many farmers do not have access to training or finance to afford the necessary inputs to modernize their farm.
3. High production costs. The low productivity is further reinforced by high costs of production. Due to the steep terrain associated with the Blue Mountains, only limited mechanization is possibly, and JBM is mostly harvested by hand.
4. Poor infrastructure in coffee production areas. The Blue Mountain region features dramatic elevation gains, with roads only providing limited access. This issue is further complicated by periodic hurricanes that wash out roads, which sometimes forces farms to
ix
be abandoned after producers cannot access the property for extended periods of time.
5. Limited coordination among stakeholders, including on extension services. The CIB has played an important historical role as the preeminent coordinating actor in the chain. However, as the CIB scaled back its focus to concentrate almost exclusively on regulation and monitoring, other actors have not responded by expanding their activities. The issue is especially pronounced with the provision of extension services. Following the privatization of the commercial arm of the CIB, funding was reduced, reducing the board’s ability to offer training and services to farmers. As a result, services are limited—large processors have sporadically offered technical assistance to growers, but these efforts have not persisted over time because of concerns growers will sell to other processors.
6. Inability of many producers to sell into supply chains of major coffee retailers. The global coffee industry places a premium on third-party verifications of sustainability and environmental considerations. Many actors in Jamaica either are not in compliance with industry standards or cannot generate documents to prove they are. Furthermore, large aggregators and processors do not differentiate their supply, limiting their ability to sell into the supply chain of lead firms.
7. Insufficient marketing of Jamaican coffee. Jamaica has relied on Japanese demand for many years and has not invested in extensive marketing efforts to build the brand. Campaigns to expand export partnerships in the United States, Europe, and other potential markets are limited, further hindering the ability to diversify end markets. Additionally, joint efforts with other Jamaican industries to capitalize on the country brand are also underdeveloped, reducing opportunities to build international awareness.
Other coffee-exporting countries have utilized different strategies for overcoming similar impediments. Colombia’s Colombia Coffee Growers Federation (FNC) provides a strong example of a farmer-led organization acting as a representative body and helping drive process upgrading. The FNC spearheads research and extension services through Cenicafé, providing farmers with access to best practices while also working with local institutions to create appropriate financial support mechanisms. Costa Rica’s ICAFE has assisted product upgrading into specialty coffee through a variety of process upgrades. ICAFE instituted a Quality Improvement Agreement with coffee-producing regions and disseminated information about “best practices” to all stakeholders while also working with the government to create minimum floors for coffee prices through the National Fund for Coffee Stabilization Fund. This support allowed Costa Rica to expand its capacity in sustainable, organic and single-origin product lines. There are other lessons for marketing and diversification. The FNC retains control of the Juan Valdez brand, thereby providing farmers with more direct access to market signals communicated by foreign buyers. In more recent years, the FNC has sought to expand its retail presence and allow consumers to purchase Colombian coffee. It has also assisted efforts to support chain upgrading by facilitating the growth of coffee tourism in some regions of the country. ICAFE, meanwhile, targeted foreign tourists for increasing demand for Costa Rican coffee by training local baristas in domestic coffee shops. This attentiveness to the Costa Rican brand has allowed companies such as Café Britt to expand their retail presence in regional markets.
x
Jamaica’s potential upgrading can employ similar strategies while addressing the country’s location-specific challenges. Specifically, Jamaica can attempt to implement the following trajectories:
1. Short-term process upgrading to improve both the productivity of Jamaican Blue Mountain coffee and expand planting of trees. The inefficient agricultural practices that are impairing productivity in Jamaica mirror broader global challenges. Significant attention to tree rejuvenation and the implementation of GAPs is necessary for the Jamaican industry to continue to thrive. Colombia’s tree rehabilitation effort, facilitated by its farmer-led association, provides an example of how to help smallholders replant trees while also spreading disease-resistant varieties.
2. Short-to-medium term functional upgrading to improve branding and marketing efforts with ultimate goal of end market diversification. Known for high quality coffee, Jamaican coffee exports are highly concentrated; end market diversification is needed for continued competitiveness. JBM coffee should be the focus for branding efforts since JHM faces an uncompetitive production environment. To aid end market diversification, improved branding and marketing efforts are required. Strategies should include steps such as organizing trade missions for buyers to the Blue Mountain region, hosting of Cup of Excellence competitions and developing a “compelling story” to engage socially and environmentally conscious buyers. Those compelling stories should include profiles of coffee growers in Jamaica.
3. Long-term functional upgrading to move into new segments of the value chain, primarily retail operations. Once Jamaica has increased production and has sufficient supplies, it can move into new segments of the value chain with higher economic returns, including retail. Coffee Traders and Café Blue have a limited presence in retail, but there has not been a widespread country move in this direction.
4. Transversal efforts around improving the institutionalization of the industry and investing in modern infrastructure. To move the domestic industry forward, Jamaican stakeholders will have to address underlying systematic issues that threaten the sector’s competitiveness. These include: • Institutionalization: Jamaican coffee has a strong foundation in the CIB. However, the
board serves primarily as a regulatory body and has limited role in extension services or branding. In the absence of organized outreach to farmers, sector-wide efforts are undertaken by individual processors to limited degrees and successes. Stronger coordination of all support roles, including knowledge transfer of best practices, input provisions and branding and marketing at the country level is needed to help better position the industry. Institutionalization should involve all value chain actors, including farmers, processors, and exporters as well as provide for a clear strategy for the nation.
• Infrastructure: The Blue Mountain terrain is difficult to traverse with sloping mountain sides and frequent weather issues. As a result, many growers face difficulty moving product for processing or export. Some farms are no longer active because it is too difficult to access them on the existing roads.
1
1 Introduction Coffee is a highly traded product and significant economic crop for many developing nations. With global exports close to US$67 billion and an annual growth rate of 2%, coffee represents an opportunity for many nations in coffee growing regions (UNComtrade, 2017). This is especially true for growers of Arabica beans, a higher value yet more fragile variety of coffee. Arabica coffee frequently earns higher prices on global markets. In 2015, Arabica beans exported at an average of US$4.42/kg compared to Robusta beans which are more resilient but whose export price averaged US$2.22 the same year (World Bank, 2016). Arabica beans also accounts for a slightly larger share of global production, with 55-62% of the world’s supply 2011/12-2017/18 (USDA, 2017) Despite low export volumes (0.15% of globally traded green coffee), Jamaica has the highest unit export price globally, US$21.03/kg in 2015 (UNComtrade, 2017). The high unit value is due to a long history of strong regulatory environment by national coffee institutions and a close relationship with Japan, the primary buyer of Jamaican coffee exports. There are, however, indications Jamaica’s position is at risk. As a medium-sized Caribbean island, the country has limited production areas for coffee. Existing farms are characterized by low productivity rates and aging trees, with growers often lacking access to training, finance as well as internal coordination. Insufficient infrastructure, reduced demand from Japan and high costs of production as well as underdeveloped marketing and branding initiatives pose a threat to future competitiveness. While strong headwinds exist, the reputation and expertise associated with the domestic industry provide opportunities. Stakeholders such as the Jamaica Coffee Industry Board (CIB)1 and the country’s large processors have experience delivering quality product to discerning palates. As specialty coffee occupies an expanding niche in the global industry, international buyers can be expected to continue to engage with the local coffee growers, especially if the domestic industry engages in the necessary upgrades to increase participation in the global market. Specifically, Jamaica should invest in process upgrades to improve production of coffee as well as functional upgrades to increase the marketing and branding of the Jamaican brand, similar to Colombian efforts with the Juan Valdez brand. Long term functional upgrading should also include expansion into retail operations similar to the path taken by Costa Rica. This paper uses the Duke Global Value Chain Center framework to assist local and regional stakeholders’ efforts to boost the Jamaican coffee sector. The Global Value Chain (GVC) framework helps policymakers better understand how the global Arabica coffee industry is evolving and assess Jamaica’s current position in the chain with the goal of identify opportunities for economic upgrading to provide returns for small and medium-sized enterprises (SMEs) in the country. The report is structured as follows: It first provides an overview of the Arabica coffee value chain to present a clear understanding of the scope of the industry, how markets are structured and how changing distribution of demand and supply destinations alter structural dynamics. It then analyzes the domestic industry within Jamaica, first detailing the country’s position in the chain as well as recent export trends. After examining Jamaica’s position in the chain, it outlines the organization and governance found in the local landscape. 1 During the course of this project, the mandates of the CIB were transferred to a new agency, Jamaica Agricultural Commodities Regulatory Authority (JACRA), which oversees multiple commodities in Jamaica. However, because CIB was still active during our research and the role and impact of JACRA remained undefined, this project focuses on the CIB unless otherwise noted. Many of the CIB activities remain ongoing under JACRA.
2
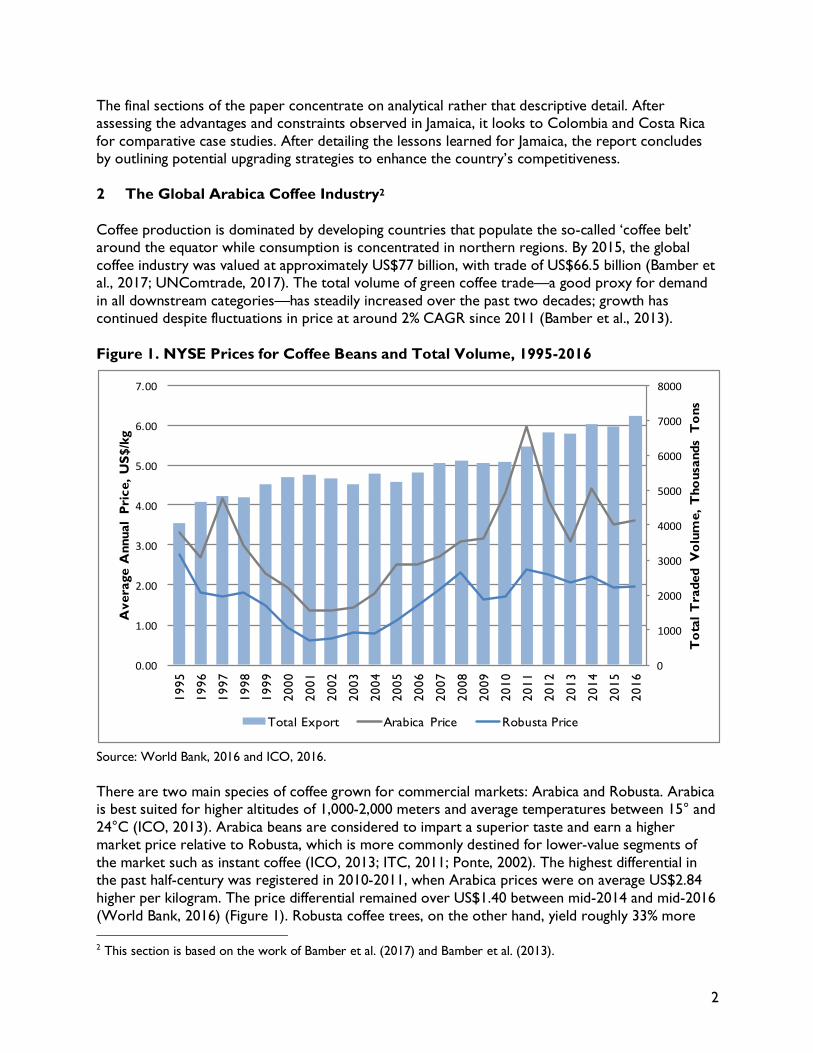
The final sections of the paper concentrate on analytical rather that descriptive detail. After assessing the advantages and constraints observed in Jamaica, it looks to Colombia and Costa Rica for comparative case studies. After detailing the lessons learned for Jamaica, the report concludes by outlining potential upgrading strategies to enhance the country’s competitiveness. 2 The Global Arabica Coffee Industry2 Coffee production is dominated by developing countries that populate the so-called ‘coffee belt’ around the equator while consumption is concentrated in northern regions. By 2015, the global coffee industry was valued at approximately US$77 billion, with trade of US$66.5 billion (Bamber et al., 2017; UNComtrade, 2017). The total volume of green coffee trade—a good proxy for demand in all downstream categories—has steadily increased over the past two decades; growth has continued despite fluctuations in price at around 2% CAGR since 2011 (Bamber et al., 2013). Figure 1. NYSE Prices for Coffee Beans and Total Volume, 1995-2016
Source: World Bank, 2016 and ICO, 2016. There are two main species of coffee grown for commercial markets: Arabica and Robusta. Arabica is best suited for higher altitudes of 1,000-2,000 meters and average temperatures between 15° and 24°C (ICO, 2013). Arabica beans are considered to impart a superior taste and earn a higher market price relative to Robusta, which is more commonly destined for lower-value segments of the market such as instant coffee (ICO, 2013; ITC, 2011; Ponte, 2002). The highest differential in the past half-century was registered in 2010-2011, when Arabica prices were on average US$2.84 higher per kilogram. The price differential remained over US$1.40 between mid-2014 and mid-2016 (World Bank, 2016) (Figure 1). Robusta coffee trees, on the other hand, yield roughly 33% more 2 This section is based on the work of Bamber et al. (2017) and Bamber et al. (2013).
0
1000
2000
3000
4000
5000
6000
7000
8000
0.00
1.00
2.00
3.00
4.00
5.00
6.00
7.00
1995
1996
1997
1998
1999
2000
2001
2002
2003
2004
2005
2006
2007
2008
2009
2010
2011
2012
2013
2014
2015
2016
Tot
al T
rade
d V
olum
e, T
hous
ands
Ton
s
Ave
rage
Ann
ual
Pric
e, U
S$/k
g
Total Export Arabica Price Robusta Price
3
beans per hectare compared to Arabica (ICO, 2013). Quality and marketing are thus key factors in Arabica profitability, while high productivity and farm efficiency are the key factors in Robusta profitability. While Arabica beans receive higher market prices in a broad sense, there is variance in its end market segments. By itself, Arabica is not necessarily a premium product—while it can earn specialty coffee designation or be featured in single-origin product lines, commodity traders and roasters also use Arabica beans for conventional brands with lower market prices. Some of the more pronounced recent trends involving Arabica beans that have helped give the global coffee industry its shape are outlined below.
1. The last two decades have seen the “de-commoditization” of the coffee sector. Although coffee is still traded on commodity markets, marketing has raised consumer awareness of critical characteristics that influence quality. These features include origin, varieties and flavor profiles as well as the social and environmental conditions under which it is produced (Potts et al., 2014; Wilson & Wilson, 2013). The trend is especially pronounced in developed countries and has been driven by the rise of specialty coffee stores. This trend has accelerated in recent years; today, coffee is no longer seen as simply Arabica or Robusta but is segmented into numerous different products from a basic commodity coffee through to luxury coffee (Euromonitor, 2016).
2. Traceability and sustainability has become increasingly important. The terms
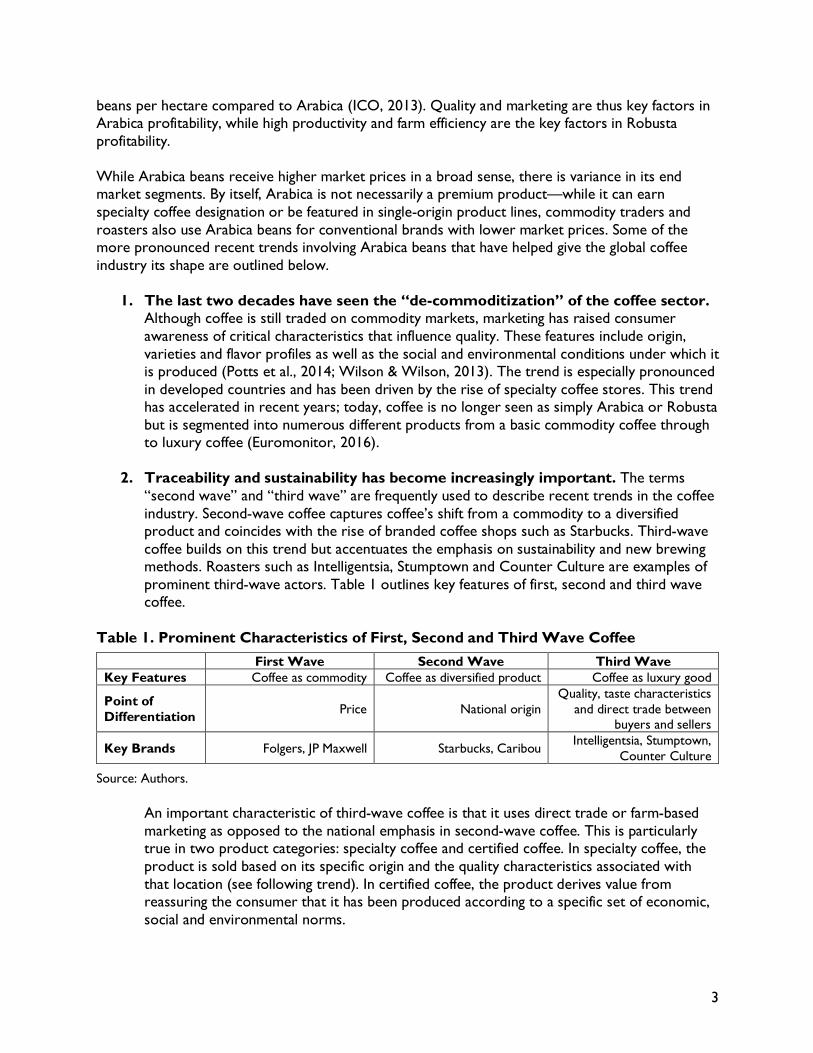
“second wave” and “third wave” are frequently used to describe recent trends in the coffee industry. Second-wave coffee captures coffee’s shift from a commodity to a diversified product and coincides with the rise of branded coffee shops such as Starbucks. Third-wave coffee builds on this trend but accentuates the emphasis on sustainability and new brewing methods. Roasters such as Intelligentsia, Stumptown and Counter Culture are examples of prominent third-wave actors. Table 1 outlines key features of first, second and third wave coffee.
Table 1. Prominent Characteristics of First, Second and Third Wave Coffee
First Wave Second Wave Third Wave Key Features Coffee as commodity Coffee as diversified product Coffee as luxury good
Point of Differentiation Price National origin
Quality, taste characteristics and direct trade between
buyers and sellers
Key Brands Folgers, JP Maxwell Starbucks, Caribou Intelligentsia, Stumptown, Counter Culture
Source: Authors.
An important characteristic of third-wave coffee is that it uses direct trade or farm-based marketing as opposed to the national emphasis in second-wave coffee. This is particularly true in two product categories: specialty coffee and certified coffee. In specialty coffee, the product is sold based on its specific origin and the quality characteristics associated with that location (see following trend). In certified coffee, the product derives value from reassuring the consumer that it has been produced according to a specific set of economic, social and environmental norms.
4
Together, these two trends are becoming pre-requisites for participation in the industry. This, in turn, has led to the restructuring of the supply chain, with roasters purchasing coffee directly from farmers in producing regions (i.e., “direct trade”). In the past, the industry had relied primarily on large coffee traders to source their beans; however, traders’ business model was based on aggregation, rather than differentiation. This has created new opportunities for competitive producers to gain direct access to their markets.
3. The rise of specialty coffee. “Specialty coffee” describes the emphasis on quality that is a
defining feature of third-wave coffee. These coffees usually command higher market prices due to the superiority of the beans, the majority of which are Arabica. While there are different organizations that define and certify specialty coffee (SCAA, 2015a), the term is distinguished from certified coffee, which is based on process certifications (i.e. organic or shade-grown farming practices).3 While both ‘specialty’ and ‘certified’ designations allow producers to gain access to higher-value market niches, there are pros and cons to each approach. Certification is often expensive, but certifying agencies may offer technical assistance. Specialty coffee does not require costly certifications; however, it does require a certain level of human capital and production expertise so that growers can produce high-quality beans and effectively access specialty markets. Third-wave companies such as Intelligentsia, Counter Culture and Stumptown market themselves as specialty roasters and place a priority on the cupping scores that define the specialty segment (SCAA, 2015a).4 Counter Culture publishes the cupping scores of its suppliers. In 2014, the average score was 87.5 and none of its suppliers received a grade lower than 84.5; the lowest score in 2015 was 84 (Counter Culture, 2017). Overall, estimates of the total size of the specialty market in the US range from 5% to 38% of the green coffee market, depending on the definition of “specialty” (see ITC, 2011, p. 38-43). Applying the Specialty Coffee Association (SCA) standards, the ITC estimates that only 5-8% of the coffee consumed (by volume) in the US is of specialty grade. However, the SCA reports that 48% of the coffee consumed in the country is perceived by the consumer as specialty (SCAA, 2015b). This higher figure likely includes slightly lower-quality “premium” coffees (which face less exacting standards) as well as certified and flavored coffees.
3 Prominent specialty coffee organizations include the Specialty Coffee Association of America (SCAA), Specialty Coffee Association of Europe (SCAE) and Coffee Quality Institute (CQI). The SCAA and the SCAE merged in 2017 to form the Specialty Coffee Association (SCA). 4 Highly skilled buyers or testers—also known as cuppers—assess the coffee to determine ‘specialty’ status. These cuppers have trained palates, similar to a sommelier. Cuppers rate quality along two key dimensions: grading the green coffee beans and coffee sampling. When grading green coffee beans, cuppers assess a sample of beans for defects, color, and odor. Specialty beans do not exhibit any major defects and have no more than five minor defects. For sampling, the coffee is tested 15 times in a uniform three step process: step 1—fragrance/aroma; step 2—flavor, aftertaste, acidity, body, and balance; and step 3: sweetness, uniformity and cleanliness. The coffee is scored from 0-100. A score of at least 80 is required across all 15 tests to be graded as ‘specialty’ (SCAA, 2015b). Higher scores equate to higher quality and therefore generate higher market values.
5
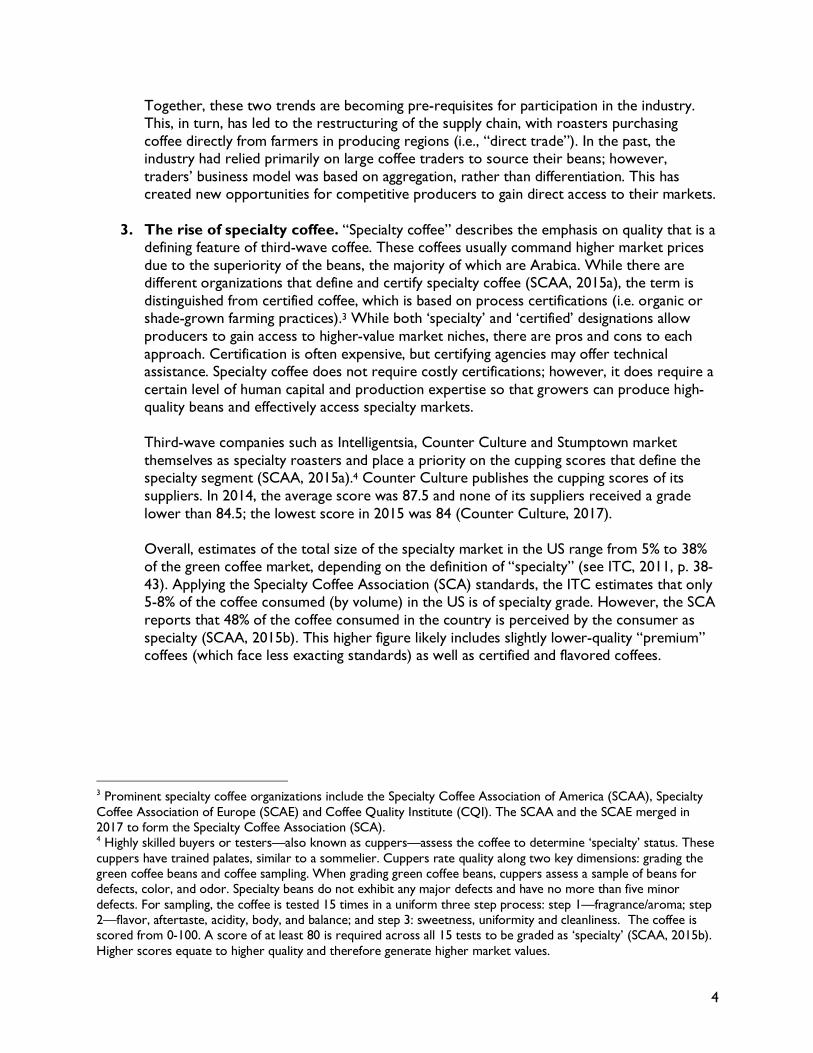
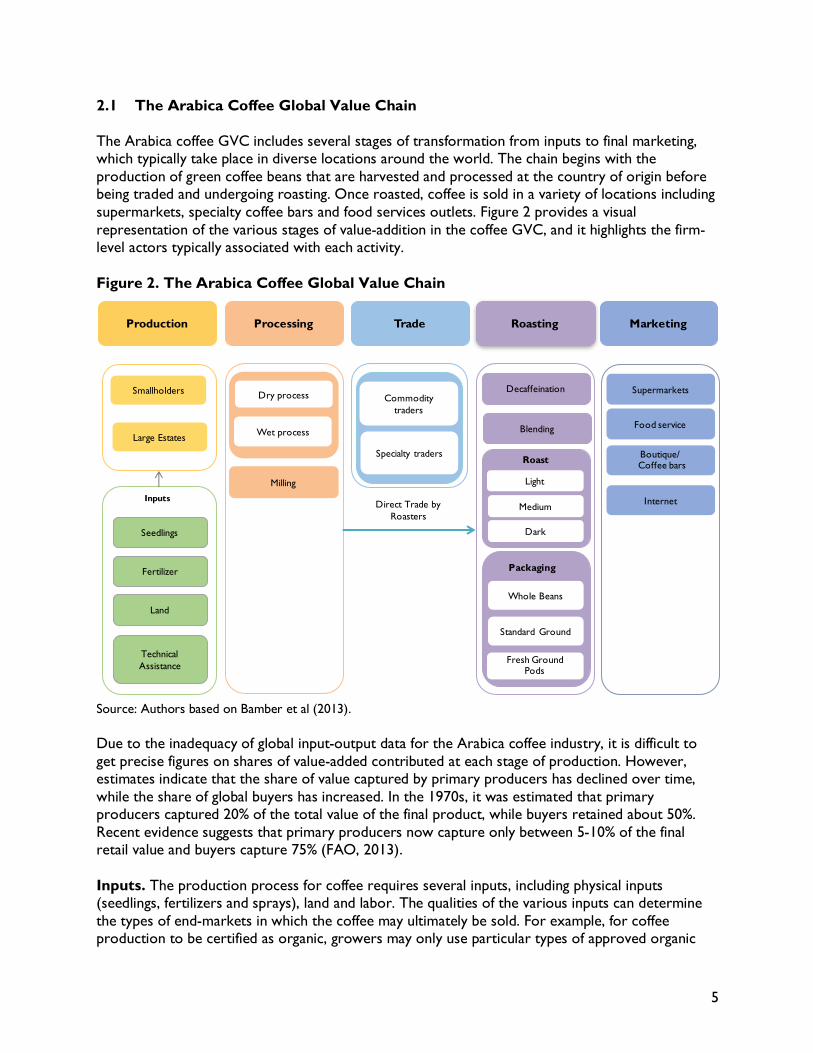
2.1 The Arabica Coffee Global Value Chain The Arabica coffee GVC includes several stages of transformation from inputs to final marketing, which typically take place in diverse locations around the world. The chain begins with the production of green coffee beans that are harvested and processed at the country of origin before being traded and undergoing roasting. Once roasted, coffee is sold in a variety of locations including supermarkets, specialty coffee bars and food services outlets. Figure 2 provides a visual representation of the various stages of value-addition in the coffee GVC, and it highlights the firm-level actors typically associated with each activity. Figure 2. The Arabica Coffee Global Value Chain
Source: Authors based on Bamber et al (2013). Due to the inadequacy of global input-output data for the Arabica coffee industry, it is difficult to get precise figures on shares of value-added contributed at each stage of production. However, estimates indicate that the share of value captured by primary producers has declined over time, while the share of global buyers has increased. In the 1970s, it was estimated that primary producers captured 20% of the total value of the final product, while buyers retained about 50%. Recent evidence suggests that primary producers now capture only between 5-10% of the final retail value and buyers capture 75% (FAO, 2013). Inputs. The production process for coffee requires several inputs, including physical inputs (seedlings, fertilizers and sprays), land and labor. The qualities of the various inputs can determine the types of end-markets in which the coffee may ultimately be sold. For example, for coffee production to be certified as organic, growers may only use particular types of approved organic
Seedlings
Wet process
SupermarketsDry process
Milling
Decaffeination
Food service
Fertilizer
Land
Technical Assistance
Smallholders
Light
Commodity traders
Specialty traders Boutique/Coffee bars
Internet
Standard Ground
Fresh Ground Pods
Whole Beans
Direct Trade by Roasters
Packaging
Roast
Production Processing Trade Marketing
Inputs
Large Estates
Medium
Dark
Blending
Roasting

6
fertilizers and sprays (TCC, 2012). These inputs are typically sourced directly by smallholders or estates; however, traders, non-governmental organizations (NGOs) and government actors may provide assistance to finance the purchase of inputs. Frequently, technical assistance in the form of workforce development and agronomy services are also required for growers to increase their productivity and the value of their products (Murray et al., 2006). Production. During the production stage, coffee trees are cultivated on large estates or on small farms and it takes approximately 3-4 years to for a tree to become productive. Nearly 70% of the global coffee supply is produced on small coffee farms of 1-5 hectares, often involving family labor, although additional labor is sometimes hired during harvesting periods (TCC, 2012). As mentioned earlier, Arabica coffee trees thrive only in particular geographic conditions, such as an altitude of 1,000-2,000 meters and average temperatures between 15° and 24°C (ICO, 2013). They are also more prone to pest and disease and therefore require additional care for growth. Processing. During this stage, the coffee cherry is cured and milled to remove the fruit from the bean. Curing occurs either through dry or wet processing. Dry processing involves exposing the coffee cherries to the sun to dry for one month, at which point the fruit becomes brittle and can be easily removed from the bean. Under wet processing, the cherry is immersed in water in order to soften the outer layer, and the fruit is removed. Wet processing is typically seen to impart a better flavor to the coffee, which often translates into a higher price. Despite the preference for wet processing, Brazil uses dry processing for the majority of its Arabica beans. Other countries that frequently use dry processing include Ethiopia, Haiti, Paraguay, India and Ecuador (ISIC, 2017). After curing (dry or wet), the bean must be milled and washed in order to remove any remaining layers of skin or husk; the resulting product is green coffee. Actors involved in processing can vary (ITC, 2011). In some cases, smallholders process the cherries themselves, especially with dry processing. Small farmers frequently participate in cooperatives or associations to achieve efficiency gains at the processing stage. Large estates usually process their beans on-site. In some cases, trading companies are integrated into the processing stage to ensure a steady supply of coffee with desired characteristics (Akiyama, 2001; Ponte, 2002). Green coffee can be stored for over 10 years in an adequately controlled environment before being roasted, and therefore, is best suited for intercontinental shipping (Daviron & Ponte, 2005; Ribeiro et al., 2011). Trade. More than 80% of green coffee beans are traded internationally, and trading companies play an important role in coffee GVCs (TCC, 2012). Traders purchase green coffee from growers and grower associations and ship the beans to the end-market. Large roasters rarely source beans directly from producers. This segment is highly concentrated with the six largest coffee traders controlling roughly half of the volume of coffee traded internationally (ITC, 2011; Ponte, 2002). The official coffee price is based on the New York Stock Exchange (NYSE) and is influenced by numerous other factors; thus, the price fluctuates on a daily basis. As consumer preferences in mature end markets grow more discerning, two major niche markets have grown considerably, especially for Arabica coffee beans. Each of these niche markets involves a more intensive role for traders to ensure certain production requirements are met, and they also command higher prices than the NYSE price for regular coffee. The first expanding niche is for specialty coffees, which describes those coffees that are of exceptional quality as measured by
7
cupping scores.5 The supply chain for specialty coffee involves complex, relational linkages between roasters, traders, processors and growers. Certified coffee is the second largest niche, which involves a more complex compliance regime that aims to increase environmental or fair-trade standards in the GVC. However, although traders frequently play a role in assisting producers to meet certification requirements (TCC, 2012), the additional costs imposed on producers and processors can mean that pursuing certifications is not always cost-effective for producers and processors. Roasting. Roasting impacts the taste of the coffee with light roast maintaining much of the original flavor characteristic and darker roasts obscure the flavors of the green bean. Roasters produce roast coffee beans from single origins as well as blended varieties. Arabica beans are commonly found in both the whole bean and ground segment as well as increasingly in coffee pods. If the coffee is to be decaffeinated, this process takes place just before roasting and is accomplished by passing the green coffee through a steam bath or submersing it in a prepared water solution. Roasted coffee loses quality within a matter of weeks, even with high-quality packaging, so roasting activities are typically concentrated within the major end-markets of Europe, North America and, increasingly, East Asia. The high perishability of roasted coffee makes it unsuitable for shipping long distances or where logistics and customs processes lack predictability and can cause unforeseen delays. The roasting segment of the coffee GVC is highly concentrated (ITC, 2011; TCC, 2012). In many cases, these actors will also control the marketing of their product, selling roast coffee through in-house retail operations or exclusive distribution arrangements with supermarkets. Marketing. The three main channels through which coffee is marketed are retail, the food service industry, and specialty coffee bars. The retail channel makes up 70-80% of coffee consumption. Retail outlets sell commodity, specialty and certified coffee sourced from large specialty roasters as well as from smaller local and regional niche roasters. In recent years, supermarket chains have also begun roasting and marketing their own brands of coffee. Specialty coffee bars gained prominence in the US, Europe and East Asia in the 2000s (Daviron & Ponte, 2005). These specialty coffee bars—Starbucks being the most well-known—sell both prepared coffee and roasted coffee beans, which are roasted in-house or by relatively small-scale niche roasters. Specialty coffee bars compete on the basis of quality, through prominently displayed certifications and the weaving of “compelling stories” about the conditions under which the coffee was produced (Golding & Peattie, 2005; Ponte, 2002). Arabica coffee is branded to highlight both the roast (light vs. dark) as well as the specific area of production. Increasingly, branding is shifting away from national level brands to focus on specific coffee producing regions of a nation, or even specific farms. One branding strategy that also seeks to protect producers from imitations and to safeguard the specific places of production are Geographic Indicators (see Box 1 below). These types of certifications and branding are increasingly common among geographically contained niche producers, such as Kona Coffee in Hawaii or Antigua Coffee in Guatemala (ITC, 2009).
5 See recent trend 3 in the Introduction to this section for an extended discussion of specialty coffee and how cupping scores are determined.
8
Box 1. Geographic Indications
Geographic Indication labels are collectively shared labels that showcase the unique value derived by having one or all aspects of production in a specific place while also protecting the product from imitations. These labels are growing in popularity and are increasingly being used by developing nations as a strategy to develop rural areas. Three primary sub-types of GIs exist, with varying degrees of protection and regulation:
Protected Denomination of Origin (PDO): The most stringent version of GIs and requires that all stages of processes and production occur in a given geographic region and follow set guidelines. Examples of PDO products include: La Mancha wine in Spain; Roquefort Cheese in France; Tequila in Mexico; and Pomme du Limousin apples from France.
Protected Geographic Indication (PGI): Similar protections and requirements to PDOs but requires only one stage of production occur within the region. Examples of PGI products include: Scotch beef in the UK; Lammefjordsgulerod carrots in Denmark; and Jamaican Blue Mountain Coffee.
Traditional Specialty Guarantees (TSG): The more flexible of GI labels used for products that employ traditional production methods. These designations focus exclusively on production techniques employed and do not account for the geographic spaces where a product is made. Examples of TSG products include: Trójniak, an alcoholic beverage from Poland; Mozzerella Cheese from Italy, and Jamon Serrano ham from Spain.
PDO labels account for 57% of GI marks obtained before 2007 compared to 41% for PGI and only 2% for TSG. Similarly, research shows PDO products typically receive a higher price premium compared to the other subsets of GIs. Sources: Areté, 2013; DeSoucey, 2010; Taste of Europe, 2015; WIPO, 2015
2.2 Global Trade in the Arabica Coffee Global Value Chain This section of the report examines how demand and supply are changing in the coffee GVC, using export and production data. In 2015, total world trade of coffee reached US$60 billion. The total volume of imports of green beans—valued at US$20 billion in 2015 (UNComtrade, 2017)—have increased by an average CAGR of approximately 2% over the past decade. Green beans are destined primarily to developed countries, while trade flows of processed products are typically from developed countries to a broader range of countries, with developing countries slowly increasing their participation as consumers develop a taste for coffee. This section of the report examines how demand and supply are changing in the coffee GVC, using production and export data to situate Jamaica in the overall context of industry change. 2.2.1 Global Supply Production is highly concentrated in developing countries along the coffee belt. The top three countries (Brazil, Colombia and Ethiopia) produce approximately 68% of all Arabica coffee by volume (USDA, 2017). Arabica production is concentrated in Latin America (see Figures 3 and 4). Brazil is by far the largest producer of coffee in the world. The country specializes in Arabica, producing nearly one half of global supply (USDA, 2017).6
6 Total Brazilian production reached 3.36 million MT (81% of which was Arabica, 19% Robusta) during the 2016/2017 growing season (USDA, 2017).
9
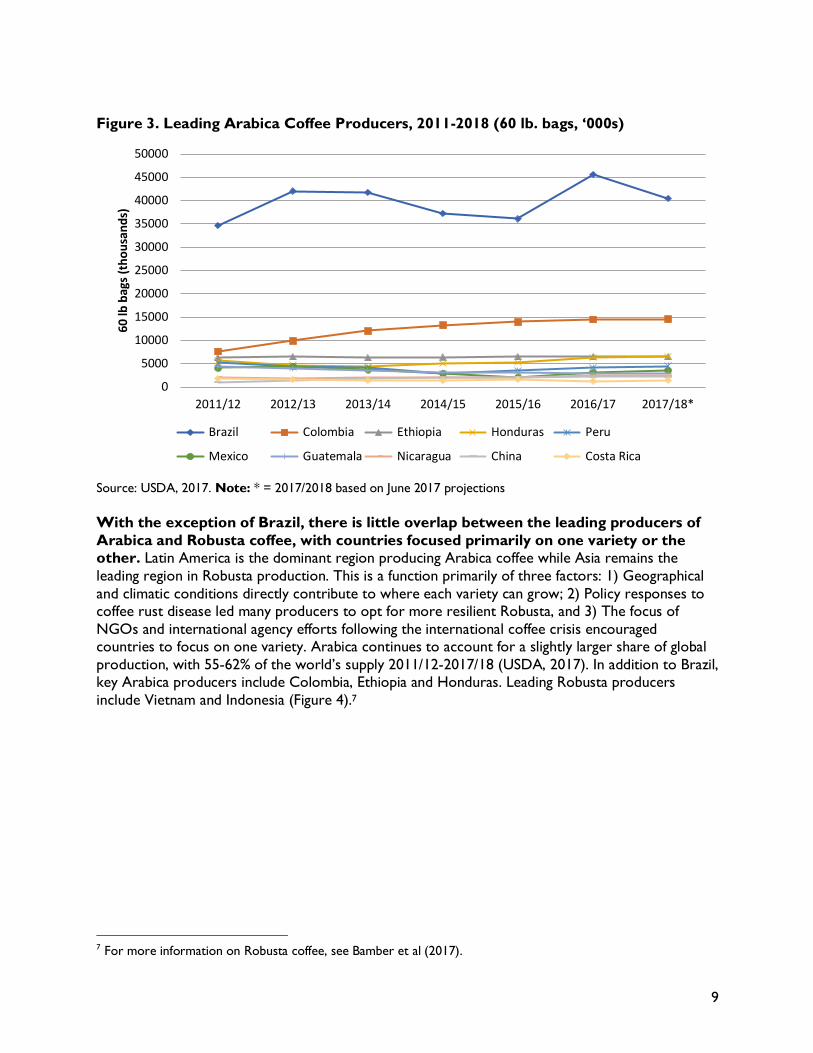
Figure 3. Leading Arabica Coffee Producers, 2011-2018 (60 lb. bags, ‘000s)
Source: USDA, 2017. Note: * = 2017/2018 based on June 2017 projections With the exception of Brazil, there is little overlap between the leading producers of Arabica and Robusta coffee, with countries focused primarily on one variety or the other. Latin America is the dominant region producing Arabica coffee while Asia remains the leading region in Robusta production. This is a function primarily of three factors: 1) Geographical and climatic conditions directly contribute to where each variety can grow; 2) Policy responses to coffee rust disease led many producers to opt for more resilient Robusta, and 3) The focus of NGOs and international agency efforts following the international coffee crisis encouraged countries to focus on one variety. Arabica continues to account for a slightly larger share of global production, with 55-62% of the world’s supply 2011/12-2017/18 (USDA, 2017). In addition to Brazil, key Arabica producers include Colombia, Ethiopia and Honduras. Leading Robusta producers include Vietnam and Indonesia (Figure 4).7
7 For more information on Robusta coffee, see Bamber et al (2017).
0
5000
10000
15000
20000
25000
30000
35000
40000
45000
50000
2011/12 2012/13 2013/14 2014/15 2015/16 2016/17 2017/18*
60 lb
bag
s (th
ousa
nds)
Brazil Colombia Ethiopia Honduras Peru
Mexico Guatemala Nicaragua China Costa Rica
10
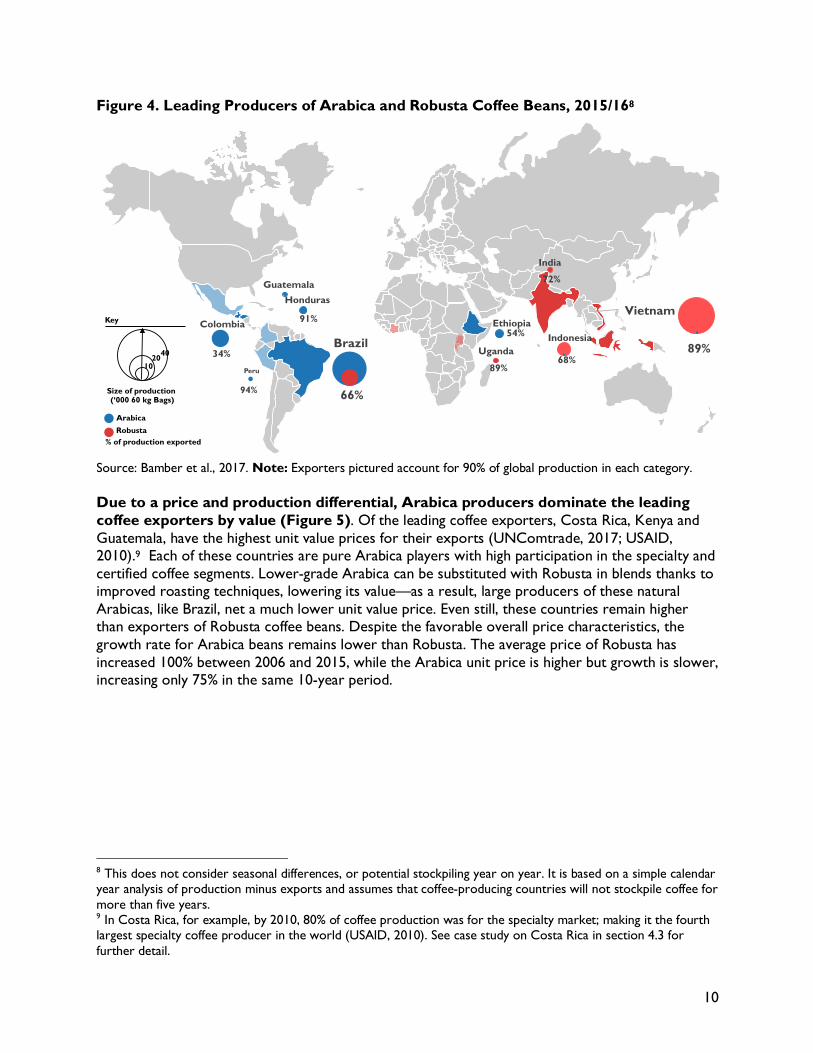
Figure 4. Leading Producers of Arabica and Robusta Coffee Beans, 2015/168
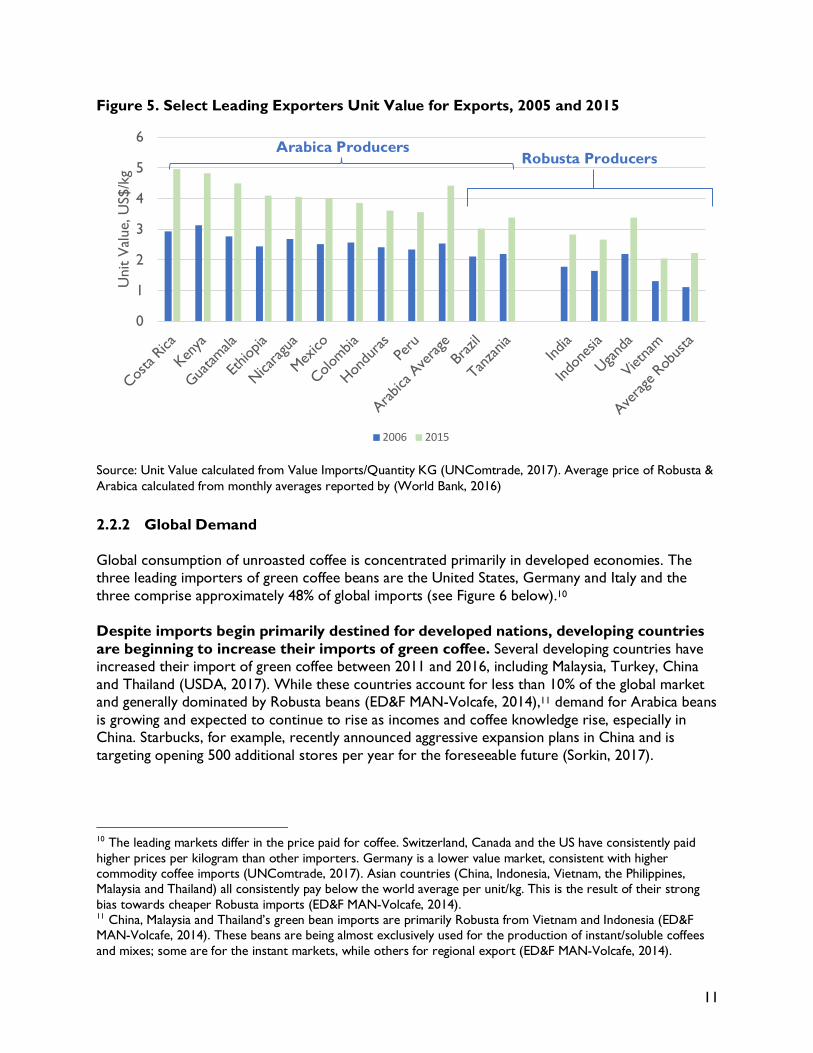
Source: Bamber et al., 2017. Note: Exporters pictured account for 90% of global production in each category. Due to a price and production differential, Arabica producers dominate the leading coffee exporters by value (Figure 5). Of the leading coffee exporters, Costa Rica, Kenya and Guatemala, have the highest unit value prices for their exports (UNComtrade, 2017; USAID, 2010).9 Each of these countries are pure Arabica players with high participation in the specialty and certified coffee segments. Lower-grade Arabica can be substituted with Robusta in blends thanks to improved roasting techniques, lowering its value—as a result, large producers of these natural Arabicas, like Brazil, net a much lower unit value price. Even still, these countries remain higher than exporters of Robusta coffee beans. Despite the favorable overall price characteristics, the growth rate for Arabica beans remains lower than Robusta. The average price of Robusta has increased 100% between 2006 and 2015, while the Arabica unit price is higher but growth is slower, increasing only 75% in the same 10-year period.
8 This does not consider seasonal differences, or potential stockpiling year on year. It is based on a simple calendar year analysis of production minus exports and assumes that coffee-producing countries will not stockpile coffee for more than five years. 9 In Costa Rica, for example, by 2010, 80% of coffee production was for the specialty market; making it the fourth largest specialty coffee producer in the world (USAID, 2010). See case study on Costa Rica in section 4.3 for further detail.
Brazil
66% 34%
Colombia Vietnam
Ethiopia
Honduras
India
Uganda 89% 68%
89%
54%
72%
91%
Guatemala
Peru
94%
Indonesia
Size of production (‘000 60 kg Bags)
40 20 10
Key
Arabica Robusta
% of production exported
11
Figure 5. Select Leading Exporters Unit Value for Exports, 2005 and 2015
Source: Unit Value calculated from Value Imports/Quantity KG (UNComtrade, 2017). Average price of Robusta & Arabica calculated from monthly averages reported by (World Bank, 2016)
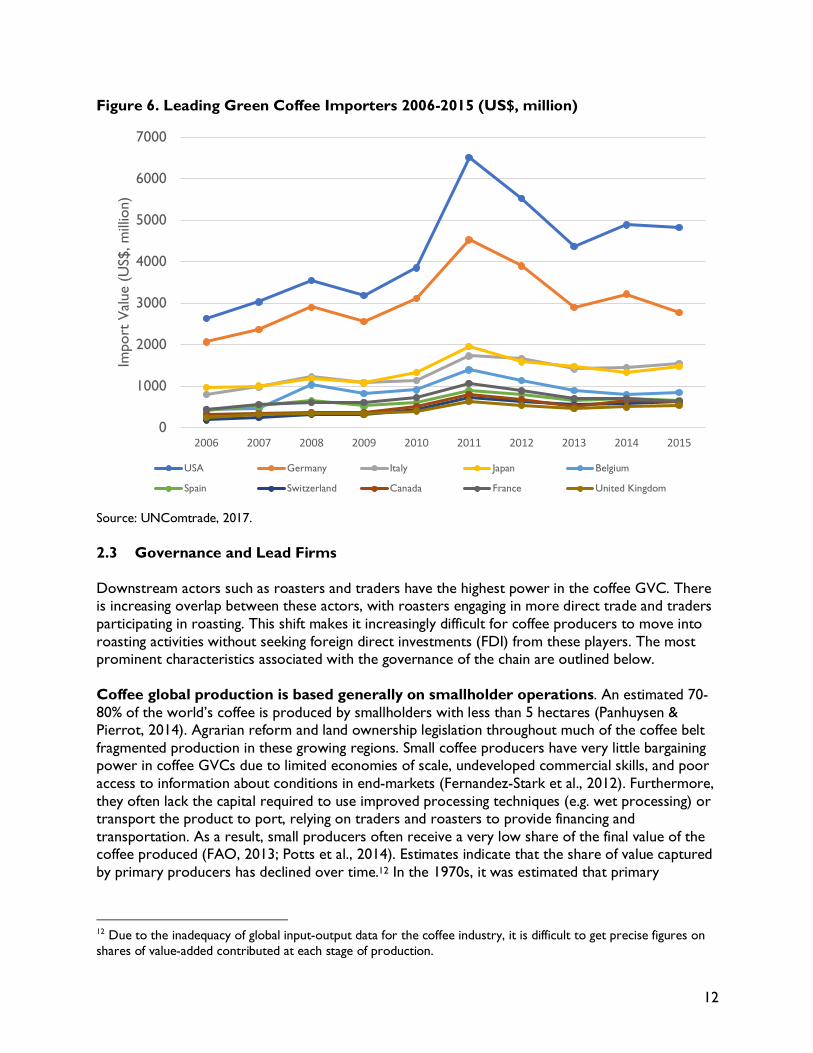
2.2.2 Global Demand Global consumption of unroasted coffee is concentrated primarily in developed economies. The three leading importers of green coffee beans are the United States, Germany and Italy and the three comprise approximately 48% of global imports (see Figure 6 below).10 Despite imports begin primarily destined for developed nations, developing countries are beginning to increase their imports of green coffee. Several developing countries have increased their import of green coffee between 2011 and 2016, including Malaysia, Turkey, China and Thailand (USDA, 2017). While these countries account for less than 10% of the global market and generally dominated by Robusta beans (ED&F MAN-Volcafe, 2014),11 demand for Arabica beans is growing and expected to continue to rise as incomes and coffee knowledge rise, especially in China. Starbucks, for example, recently announced aggressive expansion plans in China and is targeting opening 500 additional stores per year for the foreseeable future (Sorkin, 2017).
10 The leading markets differ in the price paid for coffee. Switzerland, Canada and the US have consistently paid higher prices per kilogram than other importers. Germany is a lower value market, consistent with higher commodity coffee imports (UNComtrade, 2017). Asian countries (China, Indonesia, Vietnam, the Philippines, Malaysia and Thailand) all consistently pay below the world average per unit/kg. This is the result of their strong bias towards cheaper Robusta imports (ED&F MAN-Volcafe, 2014). 11 China, Malaysia and Thailand’s green bean imports are primarily Robusta from Vietnam and Indonesia (ED&F MAN-Volcafe, 2014). These beans are being almost exclusively used for the production of instant/soluble coffees and mixes; some are for the instant markets, while others for regional export (ED&F MAN-Volcafe, 2014).
0
1
2
3
4
5
6
Costa
RicaKen
ya
Guatam
ala
Ethiop
ia
Nicarag
ua
Mexico
Colombia
Hondu
ras Peru
Arabica
Ave
rage
Brazi
l
Tanza
nia India
Indon
esia
Ugand
a
Vietna
m
Averag
e Rob
usta
Uni
t V
alue
, US$
/kg
2006 2015
Robusta Producers Arabica Producers
12
Figure 6. Leading Green Coffee Importers 2006-2015 (US$, million)
Source: UNComtrade, 2017. 2.3 Governance and Lead Firms Downstream actors such as roasters and traders have the highest power in the coffee GVC. There is increasing overlap between these actors, with roasters engaging in more direct trade and traders participating in roasting. This shift makes it increasingly difficult for coffee producers to move into roasting activities without seeking foreign direct investments (FDI) from these players. The most prominent characteristics associated with the governance of the chain are outlined below. Coffee global production is based generally on smallholder operations. An estimated 70-80% of the world’s coffee is produced by smallholders with less than 5 hectares (Panhuysen & Pierrot, 2014). Agrarian reform and land ownership legislation throughout much of the coffee belt fragmented production in these growing regions. Small coffee producers have very little bargaining power in coffee GVCs due to limited economies of scale, undeveloped commercial skills, and poor access to information about conditions in end-markets (Fernandez-Stark et al., 2012). Furthermore, they often lack the capital required to use improved processing techniques (e.g. wet processing) or transport the product to port, relying on traders and roasters to provide financing and transportation. As a result, small producers often receive a very low share of the final value of the coffee produced (FAO, 2013; Potts et al., 2014). Estimates indicate that the share of value captured by primary producers has declined over time.12 In the 1970s, it was estimated that primary
12 Due to the inadequacy of global input-output data for the coffee industry, it is difficult to get precise figures on shares of value-added contributed at each stage of production.
0
1000
2000
3000
4000
5000
6000
7000
2006 2007 2008 2009 2010 2011 2012 2013 2014 2015
Impo
rt V
alue
(U
S$, m
illio
n)
USA Germany Italy Japan Belgium
Spain Switzerland Canada France United Kingdom
13
producers captured 20% of the total value of the final product. Recent evidence suggests that primary producers now capture only between 5 and 10% of the final retail value (FAO, 2013). There are two sets of lead firms in the industry: roasters and traders. Traditionally, traders played a fundamental role in aggregating supply from a wide range of smallholders and delivering it to the market, on time and on budget (Fitter & Kaplinksy, 2001; TCC, 2012). Roasters would then purchase the bulk of their coffee through these traders, with a resulting balance of power as each relied on the other to gain access to important raw materials as well as access to the consumer base. Both segments include a small number of large lead firms, combined with a more fragmented market of medium and smaller operations. The influx of second and third-wave specialty roasters associated with premiumization has changed the make-up of the roasting segment. Nestle is by far the most powerful firm, with unmatched global reach and a leader in the standard fresh ground Arabica coffee markets; the firm’s 2015 global revenue for hot beverages was twice that of the next largest firm, JDE (Euromonitor, 2016; Nestle, 2015).13 Both Nestle and JDE are active in both Robusta and Arabica coffee roasting. Food brands such as Kraft Heinz and Smuckers remain important volume roasters for commodity Arabica coffee. In the roaster segment, in 2013, the top ten roasters controlled 40% of coffee sales (Panhuysen and Pierrot 2014); this has declined from a decade earlier when the top five controlled 69% of the market (Ponte, 2002). On the other hand, leading traders include both coffee specific operators, such as Neumann Gruppe, Volcafe (ED&F) and Sucafina, as well as diversified traders like Olam, ECOM and Louis Dreyfus. In 2012, the top 10 traders controlled over 50% of the market. Beyond these large volume roasters, second and third wave specialty roasters are changing the composition of the roasting segment. For example, Starbucks is the global leader in the coffee shop segment, and increasingly entering new markets, such as the Asian region (Starbucks, 2015). Sourcing strategies for leading roasters have thus begun to vary according to the market segment they are serving (see Table 2 below). Coffee producers can therefore cater to many markets, including the following:
• Standard fresh coffee: Major roasters like Smuckers and Kraft Heinz focus on standard fresh Arabica coffee and continue to operate with volume models; they usually do not accept coffee for their blends from countries that cannot guarantee a minimum of approximately 60,000 tons per a year (Ponte, 2002; Raikes & Gibbon, 2000). As a result, this market segment tends not to include countries that generate smaller volumes or have unpredictable supply.
• Premium coffee: The second and third-wave firms which cater to a much more discerning buyer have engaged in more direct trade. These firms are primarily concerned with coffee quality, traceability and volume. Sourcing is often associated with strong, direct relationships between the buyers and the producer, particularly when guaranteeing large volumes of better quality coffee is important. As in the cocoa sector, the decline in the price received by growers and high opportunity costs has led to fluctuations in the entry and exit rates of growers and contributed to the increased interest of roasters to engage upstream
13 This also includes Nestle’s participation in the hot chocolate, tea and coffee creamer markets, however, the bulk of their hot beverage revenue is derived from coffee sales (Nestle, 2015).
14
in order to guarantee their long-term supply (Potts et al., 2014). Starbucks and Nespresso AAA, for example, have both pursued more direct trade strategies for these reasons (Ponte, 2002; Starbucks, 2015).
• Specialty coffee: In this segment, direct trade has been facilitated by a growing interest of consumers in the origin and quality of their coffee, and their increased willingness to pay a higher price for that knowledge (Neilson & Shonk, 2014). Online auctions have become increasingly popular ways for connecting producers of ultra-high quality coffee with buyers (Wilson & Wilson, 2013). The Association of Coffee Excellence (ACE) is one of the most well-known auction platforms, hosting Cups of Excellence (CoE) competitions annually, during which batches of coffee are ‘cupped’ and ranked. This ranking is used as a key indicator in auction prices.
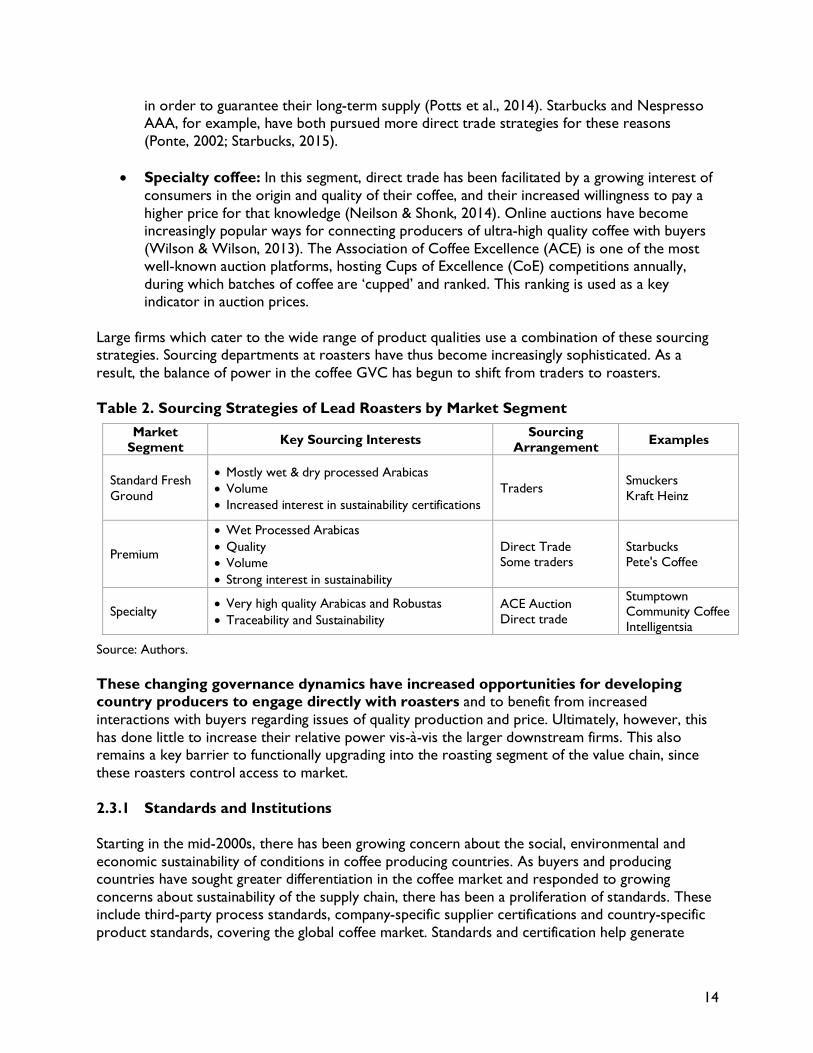
Large firms which cater to the wide range of product qualities use a combination of these sourcing strategies. Sourcing departments at roasters have thus become increasingly sophisticated. As a result, the balance of power in the coffee GVC has begun to shift from traders to roasters. Table 2. Sourcing Strategies of Lead Roasters by Market Segment
Market Segment Key Sourcing Interests Sourcing
Arrangement Examples
Standard Fresh Ground
• Mostly wet & dry processed Arabicas • Volume • Increased interest in sustainability certifications
Traders Smuckers Kraft Heinz
Premium
• Wet Processed Arabicas • Quality • Volume • Strong interest in sustainability
Direct Trade Some traders
Starbucks Pete's Coffee
Specialty • Very high quality Arabicas and Robustas • Traceability and Sustainability
ACE Auction Direct trade
Stumptown Community Coffee Intelligentsia
Source: Authors. These changing governance dynamics have increased opportunities for developing country producers to engage directly with roasters and to benefit from increased interactions with buyers regarding issues of quality production and price. Ultimately, however, this has done little to increase their relative power vis-à-vis the larger downstream firms. This also remains a key barrier to functionally upgrading into the roasting segment of the value chain, since these roasters control access to market. 2.3.1 Standards and Institutions Starting in the mid-2000s, there has been growing concern about the social, environmental and economic sustainability of conditions in coffee producing countries. As buyers and producing countries have sought greater differentiation in the coffee market and responded to growing concerns about sustainability of the supply chain, there has been a proliferation of standards. These include third-party process standards, company-specific supplier certifications and country-specific product standards, covering the global coffee market. Standards and certification help generate
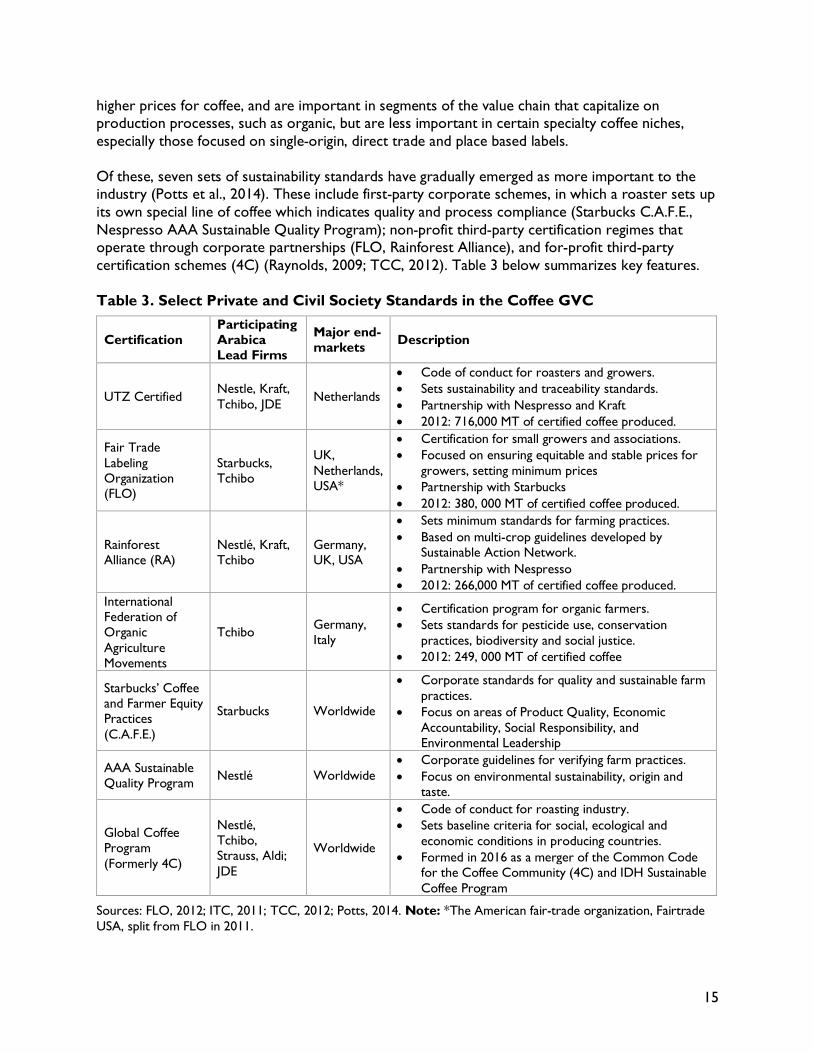
15
higher prices for coffee, and are important in segments of the value chain that capitalize on production processes, such as organic, but are less important in certain specialty coffee niches, especially those focused on single-origin, direct trade and place based labels. Of these, seven sets of sustainability standards have gradually emerged as more important to the industry (Potts et al., 2014). These include first-party corporate schemes, in which a roaster sets up its own special line of coffee which indicates quality and process compliance (Starbucks C.A.F.E., Nespresso AAA Sustainable Quality Program); non-profit third-party certification regimes that operate through corporate partnerships (FLO, Rainforest Alliance), and for-profit third-party certification schemes (4C) (Raynolds, 2009; TCC, 2012). Table 3 below summarizes key features. Table 3. Select Private and Civil Society Standards in the Coffee GVC
Certification Participating Arabica Lead Firms
Major end-markets Description
UTZ Certified Nestle, Kraft, Tchibo, JDE Netherlands
• Code of conduct for roasters and growers. • Sets sustainability and traceability standards. • Partnership with Nespresso and Kraft • 2012: 716,000 MT of certified coffee produced.
Fair Trade Labeling Organization (FLO)
Starbucks, Tchibo
UK, Netherlands, USA*
• Certification for small growers and associations. • Focused on ensuring equitable and stable prices for
growers, setting minimum prices • Partnership with Starbucks • 2012: 380, 000 MT of certified coffee produced.
Rainforest Alliance (RA)
Nestlé, Kraft, Tchibo
Germany, UK, USA
• Sets minimum standards for farming practices. • Based on multi-crop guidelines developed by
Sustainable Action Network. • Partnership with Nespresso • 2012: 266,000 MT of certified coffee produced.
International Federation of Organic Agriculture Movements
Tchibo Germany, Italy
• Certification program for organic farmers. • Sets standards for pesticide use, conservation
practices, biodiversity and social justice. • 2012: 249, 000 MT of certified coffee
Starbucks’ Coffee and Farmer Equity Practices (C.A.F.E.)
Starbucks Worldwide
• Corporate standards for quality and sustainable farm practices.
• Focus on areas of Product Quality, Economic Accountability, Social Responsibility, and Environmental Leadership
AAA Sustainable Quality Program Nestlé Worldwide
• Corporate guidelines for verifying farm practices. • Focus on environmental sustainability, origin and
taste.
Global Coffee Program (Formerly 4C)
Nestlé, Tchibo, Strauss, Aldi; JDE
Worldwide
• Code of conduct for roasting industry. • Sets baseline criteria for social, ecological and
economic conditions in producing countries. • Formed in 2016 as a merger of the Common Code
for the Coffee Community (4C) and IDH Sustainable Coffee Program
Sources: FLO, 2012; ITC, 2011; TCC, 2012; Potts, 2014. Note: *The American fair-trade organization, Fairtrade USA, split from FLO in 2011.
16
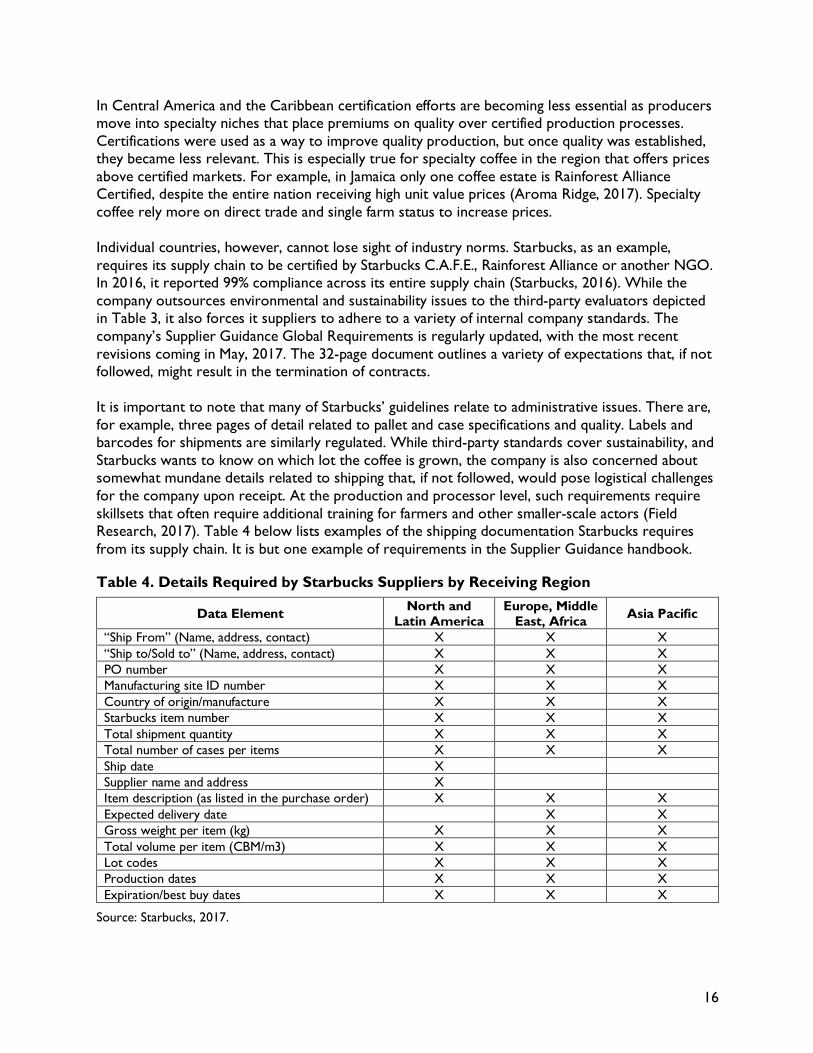
In Central America and the Caribbean certification efforts are becoming less essential as producers move into specialty niches that place premiums on quality over certified production processes. Certifications were used as a way to improve quality production, but once quality was established, they became less relevant. This is especially true for specialty coffee in the region that offers prices above certified markets. For example, in Jamaica only one coffee estate is Rainforest Alliance Certified, despite the entire nation receiving high unit value prices (Aroma Ridge, 2017). Specialty coffee rely more on direct trade and single farm status to increase prices. Individual countries, however, cannot lose sight of industry norms. Starbucks, as an example, requires its supply chain to be certified by Starbucks C.A.F.E., Rainforest Alliance or another NGO. In 2016, it reported 99% compliance across its entire supply chain (Starbucks, 2016). While the company outsources environmental and sustainability issues to the third-party evaluators depicted in Table 3, it also forces it suppliers to adhere to a variety of internal company standards. The company’s Supplier Guidance Global Requirements is regularly updated, with the most recent revisions coming in May, 2017. The 32-page document outlines a variety of expectations that, if not followed, might result in the termination of contracts. It is important to note that many of Starbucks’ guidelines relate to administrative issues. There are, for example, three pages of detail related to pallet and case specifications and quality. Labels and barcodes for shipments are similarly regulated. While third-party standards cover sustainability, and Starbucks wants to know on which lot the coffee is grown, the company is also concerned about somewhat mundane details related to shipping that, if not followed, would pose logistical challenges for the company upon receipt. At the production and processor level, such requirements require skillsets that often require additional training for farmers and other smaller-scale actors (Field Research, 2017). Table 4 below lists examples of the shipping documentation Starbucks requires from its supply chain. It is but one example of requirements in the Supplier Guidance handbook. Table 4. Details Required by Starbucks Suppliers by Receiving Region
Data Element North and Latin America
Europe, Middle East, Africa Asia Pacific
“Ship From” (Name, address, contact) X X X “Ship to/Sold to” (Name, address, contact) X X X PO number X X X Manufacturing site ID number X X X Country of origin/manufacture X X X Starbucks item number X X X Total shipment quantity X X X Total number of cases per items X X X Ship date X Supplier name and address X Item description (as listed in the purchase order) X X X Expected delivery date X X Gross weight per item (kg) X X X Total volume per item (CBM/m3) X X X Lot codes X X X Production dates X X X Expiration/best buy dates X X X
Source: Starbucks, 2017.
17
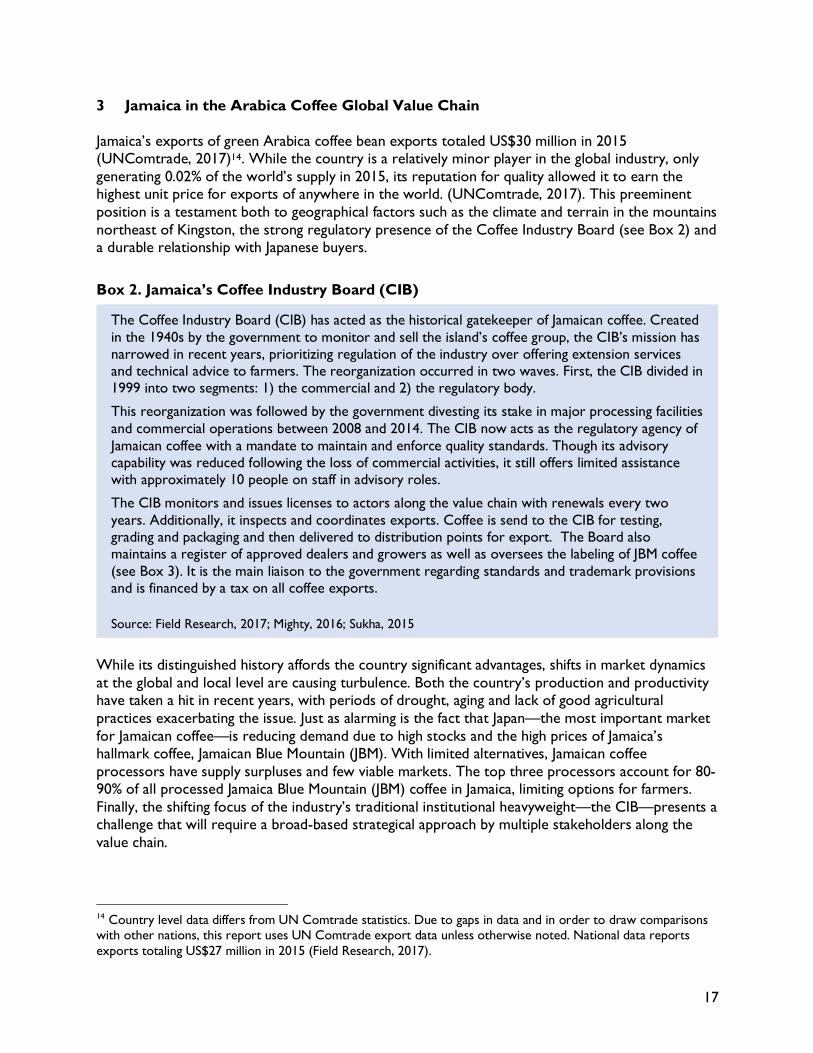
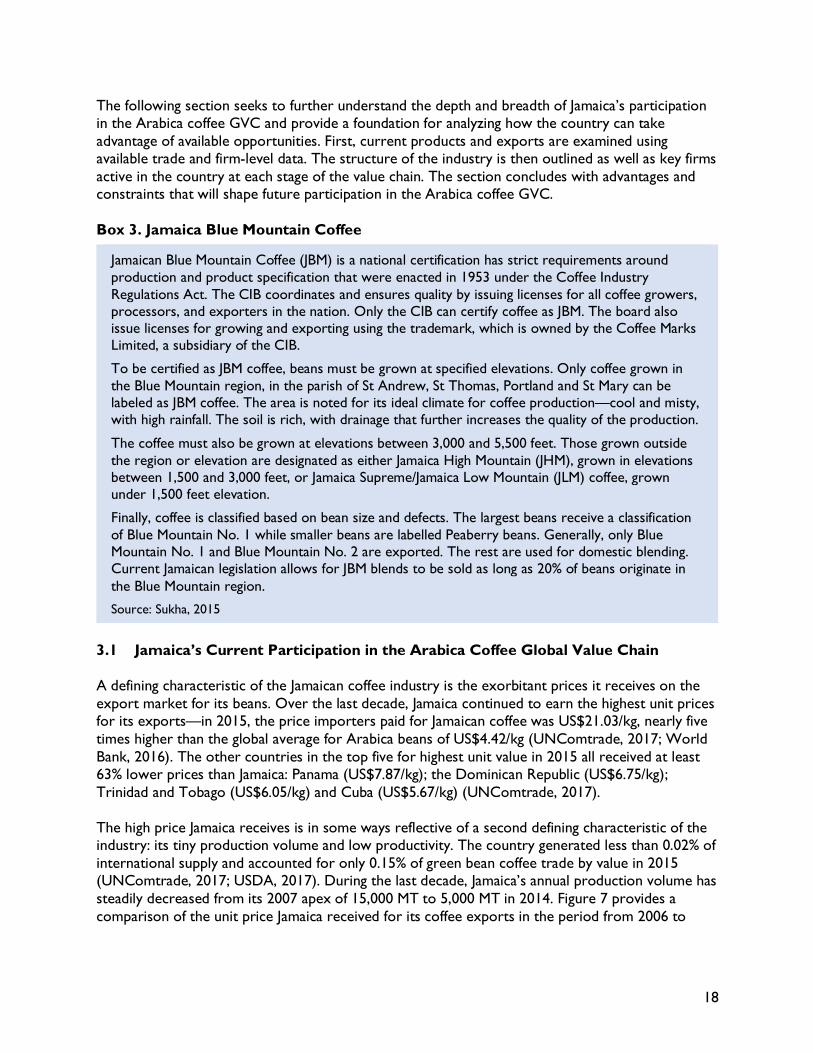
3 Jamaica in the Arabica Coffee Global Value Chain Jamaica’s exports of green Arabica coffee bean exports totaled US$30 million in 2015 (UNComtrade, 2017)14. While the country is a relatively minor player in the global industry, only generating 0.02% of the world’s supply in 2015, its reputation for quality allowed it to earn the highest unit price for exports of anywhere in the world. (UNComtrade, 2017). This preeminent position is a testament both to geographical factors such as the climate and terrain in the mountains northeast of Kingston, the strong regulatory presence of the Coffee Industry Board (see Box 2) and a durable relationship with Japanese buyers.
Box 2. Jamaica’s Coffee Industry Board (CIB)
The Coffee Industry Board (CIB) has acted as the historical gatekeeper of Jamaican coffee. Created in the 1940s by the government to monitor and sell the island’s coffee group, the CIB’s mission has narrowed in recent years, prioritizing regulation of the industry over offering extension services and technical advice to farmers. The reorganization occurred in two waves. First, the CIB divided in 1999 into two segments: 1) the commercial and 2) the regulatory body.
This reorganization was followed by the government divesting its stake in major processing facilities and commercial operations between 2008 and 2014. The CIB now acts as the regulatory agency of Jamaican coffee with a mandate to maintain and enforce quality standards. Though its advisory capability was reduced following the loss of commercial activities, it still offers limited assistance with approximately 10 people on staff in advisory roles.
The CIB monitors and issues licenses to actors along the value chain with renewals every two years. Additionally, it inspects and coordinates exports. Coffee is send to the CIB for testing, grading and packaging and then delivered to distribution points for export. The Board also maintains a register of approved dealers and growers as well as oversees the labeling of JBM coffee (see Box 3). It is the main liaison to the government regarding standards and trademark provisions and is financed by a tax on all coffee exports.
Source: Field Research, 2017; Mighty, 2016; Sukha, 2015
While its distinguished history affords the country significant advantages, shifts in market dynamics at the global and local level are causing turbulence. Both the country’s production and productivity have taken a hit in recent years, with periods of drought, aging and lack of good agricultural practices exacerbating the issue. Just as alarming is the fact that Japan—the most important market for Jamaican coffee—is reducing demand due to high stocks and the high prices of Jamaica’s hallmark coffee, Jamaican Blue Mountain (JBM). With limited alternatives, Jamaican coffee processors have supply surpluses and few viable markets. The top three processors account for 80-90% of all processed Jamaica Blue Mountain (JBM) coffee in Jamaica, limiting options for farmers. Finally, the shifting focus of the industry’s traditional institutional heavyweight—the CIB—presents a challenge that will require a broad-based strategical approach by multiple stakeholders along the value chain.
14 Country level data differs from UN Comtrade statistics. Due to gaps in data and in order to draw comparisons with other nations, this report uses UN Comtrade export data unless otherwise noted. National data reports exports totaling US$27 million in 2015 (Field Research, 2017).
18
The following section seeks to further understand the depth and breadth of Jamaica’s participation in the Arabica coffee GVC and provide a foundation for analyzing how the country can take advantage of available opportunities. First, current products and exports are examined using available trade and firm-level data. The structure of the industry is then outlined as well as key firms active in the country at each stage of the value chain. The section concludes with advantages and constraints that will shape future participation in the Arabica coffee GVC. Box 3. Jamaica Blue Mountain Coffee
Jamaican Blue Mountain Coffee (JBM) is a national certification has strict requirements around production and product specification that were enacted in 1953 under the Coffee Industry Regulations Act. The CIB coordinates and ensures quality by issuing licenses for all coffee growers, processors, and exporters in the nation. Only the CIB can certify coffee as JBM. The board also issue licenses for growing and exporting using the trademark, which is owned by the Coffee Marks Limited, a subsidiary of the CIB.
To be certified as JBM coffee, beans must be grown at specified elevations. Only coffee grown in the Blue Mountain region, in the parish of St Andrew, St Thomas, Portland and St Mary can be labeled as JBM coffee. The area is noted for its ideal climate for coffee production—cool and misty, with high rainfall. The soil is rich, with drainage that further increases the quality of the production.
The coffee must also be grown at elevations between 3,000 and 5,500 feet. Those grown outside the region or elevation are designated as either Jamaica High Mountain (JHM), grown in elevations between 1,500 and 3,000 feet, or Jamaica Supreme/Jamaica Low Mountain (JLM) coffee, grown under 1,500 feet elevation.
Finally, coffee is classified based on bean size and defects. The largest beans receive a classification of Blue Mountain No. 1 while smaller beans are labelled Peaberry beans. Generally, only Blue Mountain No. 1 and Blue Mountain No. 2 are exported. The rest are used for domestic blending. Current Jamaican legislation allows for JBM blends to be sold as long as 20% of beans originate in the Blue Mountain region. Source: Sukha, 2015
3.1 Jamaica’s Current Participation in the Arabica Coffee Global Value Chain A defining characteristic of the Jamaican coffee industry is the exorbitant prices it receives on the export market for its beans. Over the last decade, Jamaica continued to earn the highest unit prices for its exports—in 2015, the price importers paid for Jamaican coffee was US$21.03/kg, nearly five times higher than the global average for Arabica beans of US$4.42/kg (UNComtrade, 2017; World Bank, 2016). The other countries in the top five for highest unit value in 2015 all received at least 63% lower prices than Jamaica: Panama (US$7.87/kg); the Dominican Republic (US$6.75/kg); Trinidad and Tobago (US$6.05/kg) and Cuba (US$5.67/kg) (UNComtrade, 2017). The high price Jamaica receives is in some ways reflective of a second defining characteristic of the industry: its tiny production volume and low productivity. The country generated less than 0.02% of international supply and accounted for only 0.15% of green bean coffee trade by value in 2015 (UNComtrade, 2017; USDA, 2017). During the last decade, Jamaica’s annual production volume has steadily decreased from its 2007 apex of 15,000 MT to 5,000 MT in 2014. Figure 7 provides a comparison of the unit price Jamaica received for its coffee exports in the period from 2006 to

19
2015 against global Arabica averages; it also charts the fall in production volume. 2015 production volume was not available through FAO databases. Figure 7. Jamaica’s Coffee Unit Price and Production Volume, 2006-2015
Source: Production figures are based on reported data (FAOSTAT, 2017). Unit value calculated from value of imports/quantity per kilogram (UNComtrade, 2017). Average Arabica prices calculated from monthly averages reported (World Bank, 2016). As discussed in Section 2.2, six major segments comprise the Arabica coffee GVC: production, initial processing, trading, roasting, packaging, and marketing. Figure 8 highlights the current position of Jamaica with red rectangles; Jamaica’s participation is primarily concentrated in production and initial processing stages. There is roasting capacity among domestic businesses, although most of the output is sold in the local market with extremely limited quantities destined for foreign buyers. The CIB, an industry board that has functioned as the critical coordinating agency, serves under the Ministry of Industry, Commerce, Agriculture and Fisheries (MICAF) and plays an important regulatory role.
$-
$5.00
$10.00
$15.00
$20.00
$25.00
0
2
4
6
8
10
12
14
16
2006 2007 2008 2009 2010 2011 2012 2013 2014 2015
Uni
t Pr
ice
(US$
/kg)
Met
ric T
ons
(Tho
usan
ds)
Jamaica Production Jamaica Unit Value World Average Arabica Price
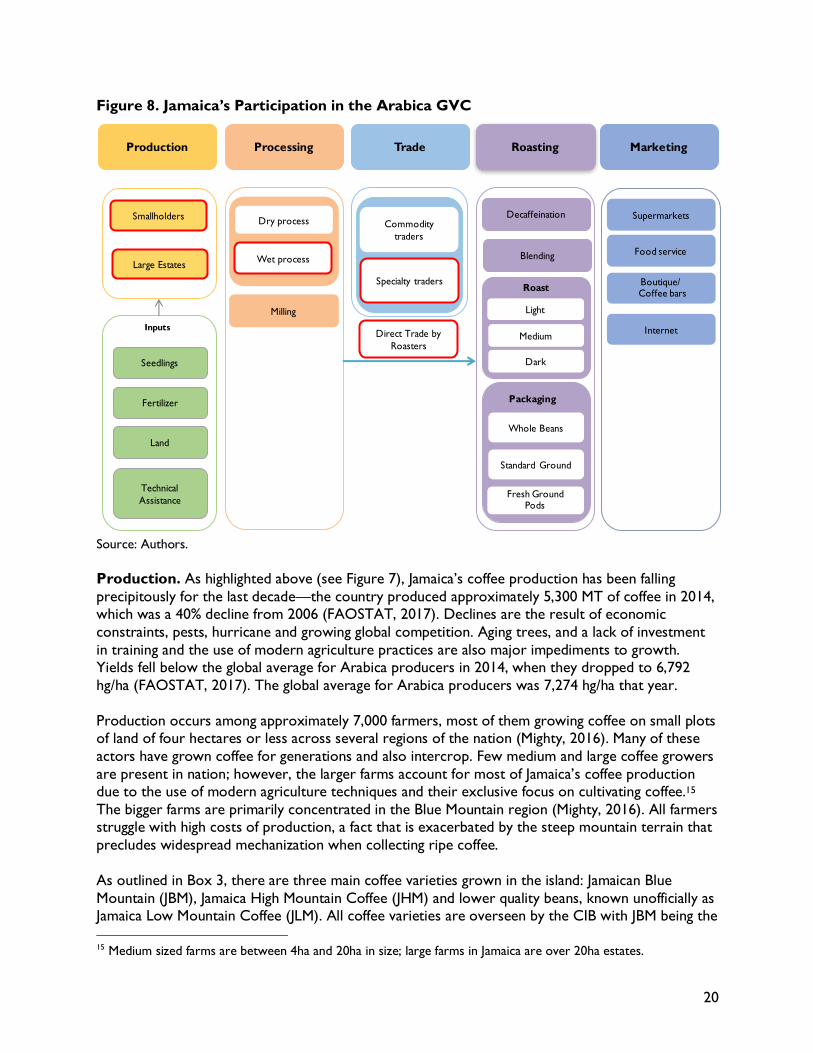
20
Figure 8. Jamaica’s Participation in the Arabica GVC
Source: Authors. Production. As highlighted above (see Figure 7), Jamaica’s coffee production has been falling precipitously for the last decade—the country produced approximately 5,300 MT of coffee in 2014, which was a 40% decline from 2006 (FAOSTAT, 2017). Declines are the result of economic constraints, pests, hurricane and growing global competition. Aging trees, and a lack of investment in training and the use of modern agriculture practices are also major impediments to growth. Yields fell below the global average for Arabica producers in 2014, when they dropped to 6,792 hg/ha (FAOSTAT, 2017). The global average for Arabica producers was 7,274 hg/ha that year. Production occurs among approximately 7,000 farmers, most of them growing coffee on small plots of land of four hectares or less across several regions of the nation (Mighty, 2016). Many of these actors have grown coffee for generations and also intercrop. Few medium and large coffee growers are present in nation; however, the larger farms account for most of Jamaica’s coffee production due to the use of modern agriculture techniques and their exclusive focus on cultivating coffee.15 The bigger farms are primarily concentrated in the Blue Mountain region (Mighty, 2016). All farmers struggle with high costs of production, a fact that is exacerbated by the steep mountain terrain that precludes widespread mechanization when collecting ripe coffee. As outlined in Box 3, there are three main coffee varieties grown in the island: Jamaican Blue Mountain (JBM), Jamaica High Mountain Coffee (JHM) and lower quality beans, known unofficially as Jamaica Low Mountain Coffee (JLM). All coffee varieties are overseen by the CIB with JBM being the 15 Medium sized farms are between 4ha and 20ha in size; large farms in Jamaica are over 20ha estates.
Seedlings
Wet process
SupermarketsDry process
Milling
Decaffeination
Food service
Fertilizer
Land
Technical Assistance
Smallholders
Light
Commodity traders
Specialty traders Boutique/Coffee bars
Internet
Standard Ground
Fresh Ground Pods
Whole Beans
Direct Trade by Roasters
Packaging
Roast
Production Processing Trade Marketing
Inputs
Large Estates
Medium
Dark
Blending
Roasting

21
most popular. In the decade of 2006-16, between 80-92% of Jamaica’s total coffee production was JBM coffee—in 2016, JBM’s share of total production was 87% (CIB, 2017a). Because of its dominant share of production and exports, this report primarily concentrates its analysis on JBM coffee; where appropriate, it specifically indicates JHM or other varieties. Figure 9 shows the decline in both JBM and JHM coffee over the last decade. Figure 9. Jamaica's Coffee Production by Type, 2007-16
Source: CIB, 2017 Initial Processing: Following harvest, coffee beans are transported to processing centers across the island. In 2014, farmers received an average of US$38 per box of coffee cherries when selling to processors (Jamaica Observer, 2014).16 These processors turn coffee cherries to dried beans primarily through wet processing, a fact that can be attributed to the large supply of water readily available (CIB, 2017b). This is typically followed by a period of natural drying, although mechanical dryers are sometimes used during periods of rain or when desired moisture content cannot be attained by exposure to the sun. The final stage of processing is hand sorting and grading of beans to allow for the highest selling price. Beans are sorted by size and color, and any beans with defects are removed prior to sending them to the CIB for inspection and shipment. (see Box 3 above).
16 Boxes are the standard unit of measurement of coffee in Jamaica. One box is the equivalent of 60lbs of coffee. The average productivity in Jamaica for coffee is 27 boxes per acre but can range from 10-100, depending on the location of the farm, the terrain, the age of the trees, the use of best practices, etc. (Field Research, 2017). Globally, the most efficient countries average the equivalent of 80-100 boxes per acre.
0
50
100
150
200
250
300
350
400
450
500
2007/2008
2008/2009
2009/2010
2010/2011
2011/2012
2012/2013
2013/2014
2014/2015
2015/2016
2016/2017
60 lb
box
es, t
hous
ands
JBM JHM
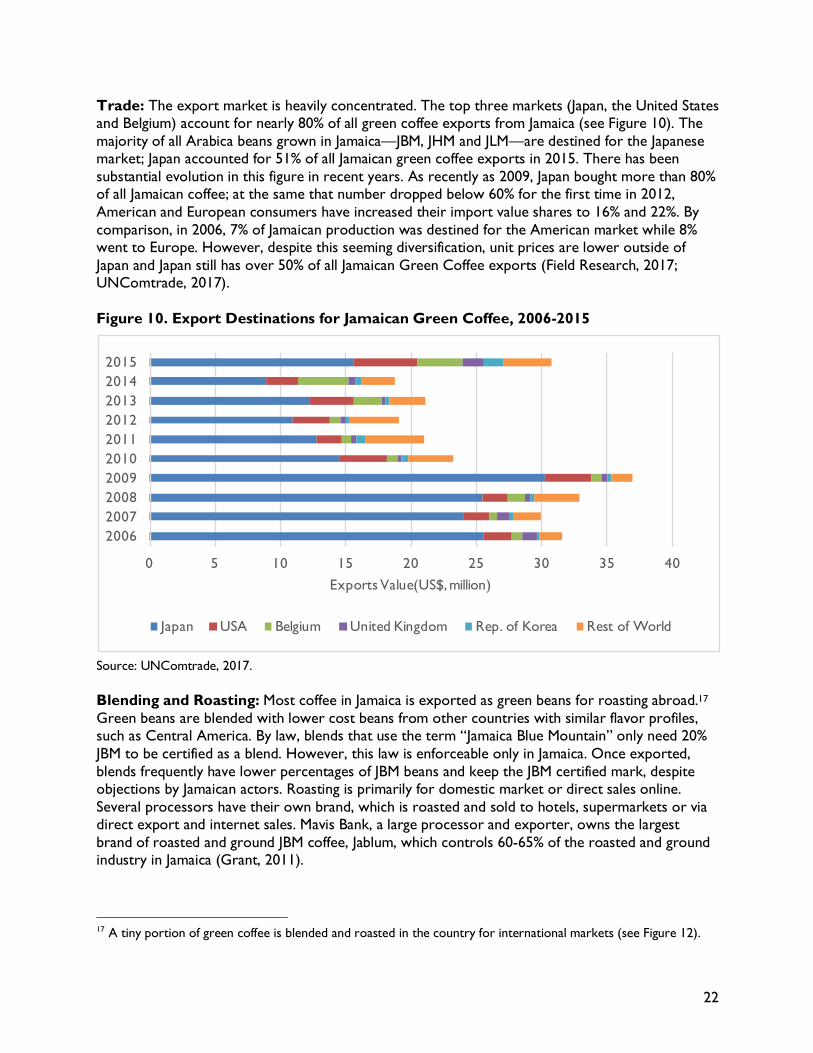
22
Trade: The export market is heavily concentrated. The top three markets (Japan, the United States and Belgium) account for nearly 80% of all green coffee exports from Jamaica (see Figure 10). The majority of all Arabica beans grown in Jamaica—JBM, JHM and JLM—are destined for the Japanese market; Japan accounted for 51% of all Jamaican green coffee exports in 2015. There has been substantial evolution in this figure in recent years. As recently as 2009, Japan bought more than 80% of all Jamaican coffee; at the same that number dropped below 60% for the first time in 2012, American and European consumers have increased their import value shares to 16% and 22%. By comparison, in 2006, 7% of Jamaican production was destined for the American market while 8% went to Europe. However, despite this seeming diversification, unit prices are lower outside of Japan and Japan still has over 50% of all Jamaican Green Coffee exports (Field Research, 2017; UNComtrade, 2017). Figure 10. Export Destinations for Jamaican Green Coffee, 2006-2015
Source: UNComtrade, 2017. Blending and Roasting: Most coffee in Jamaica is exported as green beans for roasting abroad.17 Green beans are blended with lower cost beans from other countries with similar flavor profiles, such as Central America. By law, blends that use the term “Jamaica Blue Mountain” only need 20% JBM to be certified as a blend. However, this law is enforceable only in Jamaica. Once exported, blends frequently have lower percentages of JBM beans and keep the JBM certified mark, despite objections by Jamaican actors. Roasting is primarily for domestic market or direct sales online. Several processors have their own brand, which is roasted and sold to hotels, supermarkets or via direct export and internet sales. Mavis Bank, a large processor and exporter, owns the largest brand of roasted and ground JBM coffee, Jablum, which controls 60-65% of the roasted and ground industry in Jamaica (Grant, 2011).
17 A tiny portion of green coffee is blended and roasted in the country for international markets (see Figure 12).
0 5 10 15 20 25 30 35 40
2006200720082009201020112012201320142015
Exports Value(US$, million)
Japan USA Belgium United Kingdom Rep. of Korea Rest of World
23
3.2 Governance and Industry Organization18 Power in the Jamaican coffee value chain is concentrated in three centers: 1) Japanese trading companies; 2) the CIB; and 3) a small cluster of Jamaican firms that process the majority of the country’s JBM coffee. At the other end of the spectrum are the producers, who number more than 7,000 and have engaged in nascent organization and institutionalization. While these characteristics have in some ways defined the Jamaican industry for years, there has been recent industry evolution. The most significant of these features includes the following:
• Production is fragmented. The major processors and exporters have limited capabilities in the production segment of the chain, instead relying on approximately 7,000 farmers who cultivate coffee in land smaller than four hectares (Mighty, 2016). While there are exceptions, processors and farmers generally do not have formal contracts or strong relationships with producers. Instead, producers sell to the processor offering the highest prices.
• The CIB has seen its role contract in recent years. Formerly an organization that had expansive extension and training capabilities as well as commercial operations, the CIB’s focus has narrowed to regulatory matters. While it still evaluates and exports beans from licensed dealers, it does not offer technical assistance in a widespread manner. Box 2 has further information on the CIB.
• Amidst industry consolidation, the major domestic companies remain focused on core activities. The industry has a high degree of integration in the downstream segments of the chain, with processors also acting as leading exporters. Together, Mavis Bank Coffee Factory, Wallenford and Coffee Traders control 80-90% of the export market for JBM green beans. AIC International Investment Limited, a Canadian parent company owned by Michael Lee-Chin, purchased Wallenford in 2014 and Mavis Bank in 2016. While all three of the major processors have varying downstream capabilities, each relies on the export of green beans as its primary source of revenue.
• Demand from Japanese buyers is weakening. Six Japanese trading companies
(Ueshima Coffee Company [UCC], Ataka, Kanematsu, MC Foods, Wataru and Yutaka) comprise the Association of Japanese Importers of Jamaican Coffee, an organization which helps sponsor an annual display at Japanese coffee trade fairs (Ueshima, 2017). While the relationship between businesses in both countries has been durable, there has been recent turbulence, with Japanese buyers proposing significant price reductions (Myers Jr., 2017). Japanese imports decreased nearly 39% between 2006 to 2015, from US$25 million to US$15 million (UNComtrade, 2017). If Japanese demand erodes, there are not obvious alternative buyers who are willing to pay the premium that has historically been associated with Jamaican coffee. The issue is further complicated by the fact many growers and processors lack the financial and human capital needed to meet the buying requirements of major retailers, such as Starbucks (Myers Jr., 2017).
18 The Governance and Industry Institutionalization section of the report is based on extensive interview with Jamaican stakeholders conducted in October, 2017. Individual citations are provided when additional material is used to supplement the field research.
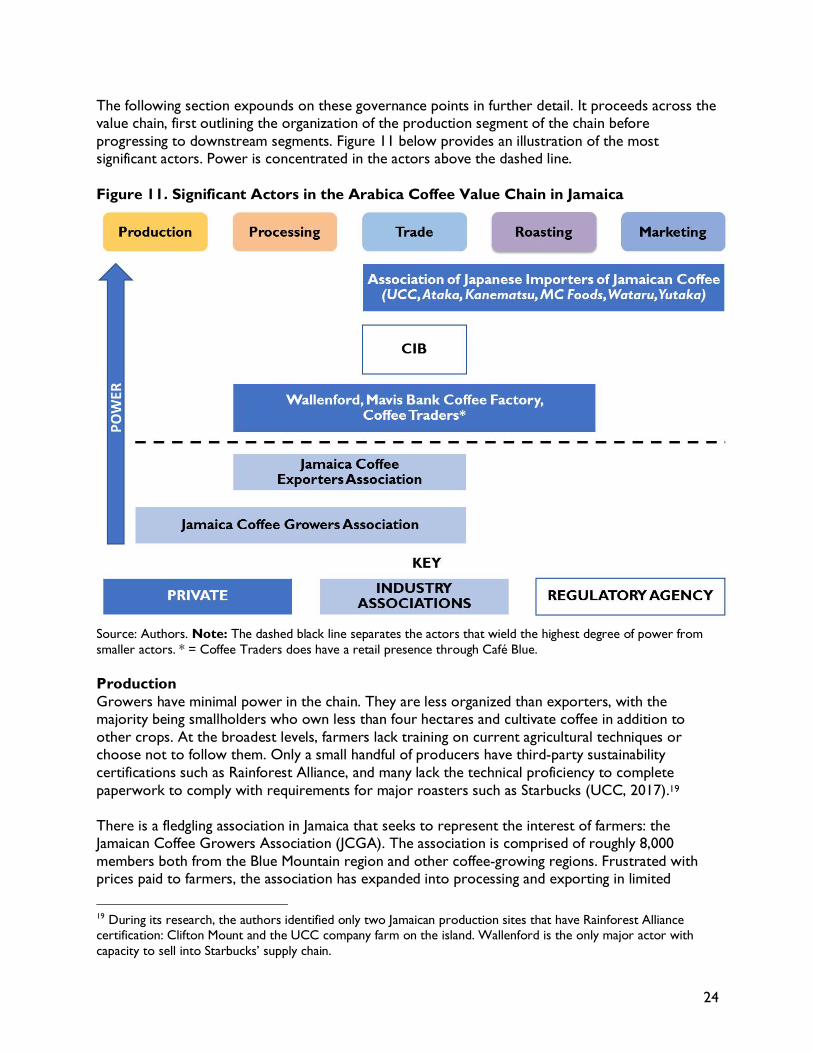
24
The following section expounds on these governance points in further detail. It proceeds across the value chain, first outlining the organization of the production segment of the chain before progressing to downstream segments. Figure 11 below provides an illustration of the most significant actors. Power is concentrated in the actors above the dashed line. Figure 11. Significant Actors in the Arabica Coffee Value Chain in Jamaica
Source: Authors. Note: The dashed black line separates the actors that wield the highest degree of power from smaller actors. * = Coffee Traders does have a retail presence through Café Blue. Production Growers have minimal power in the chain. They are less organized than exporters, with the majority being smallholders who own less than four hectares and cultivate coffee in addition to other crops. At the broadest levels, farmers lack training on current agricultural techniques or choose not to follow them. Only a small handful of producers have third-party sustainability certifications such as Rainforest Alliance, and many lack the technical proficiency to complete paperwork to comply with requirements for major roasters such as Starbucks (UCC, 2017).19 There is a fledgling association in Jamaica that seeks to represent the interest of farmers: the Jamaican Coffee Growers Association (JCGA). The association is comprised of roughly 8,000 members both from the Blue Mountain region and other coffee-growing regions. Frustrated with prices paid to farmers, the association has expanded into processing and exporting in limited
19 During its research, the authors identified only two Jamaican production sites that have Rainforest Alliance certification: Clifton Mount and the UCC company farm on the island. Wallenford is the only major actor with capacity to sell into Starbucks’ supply chain.
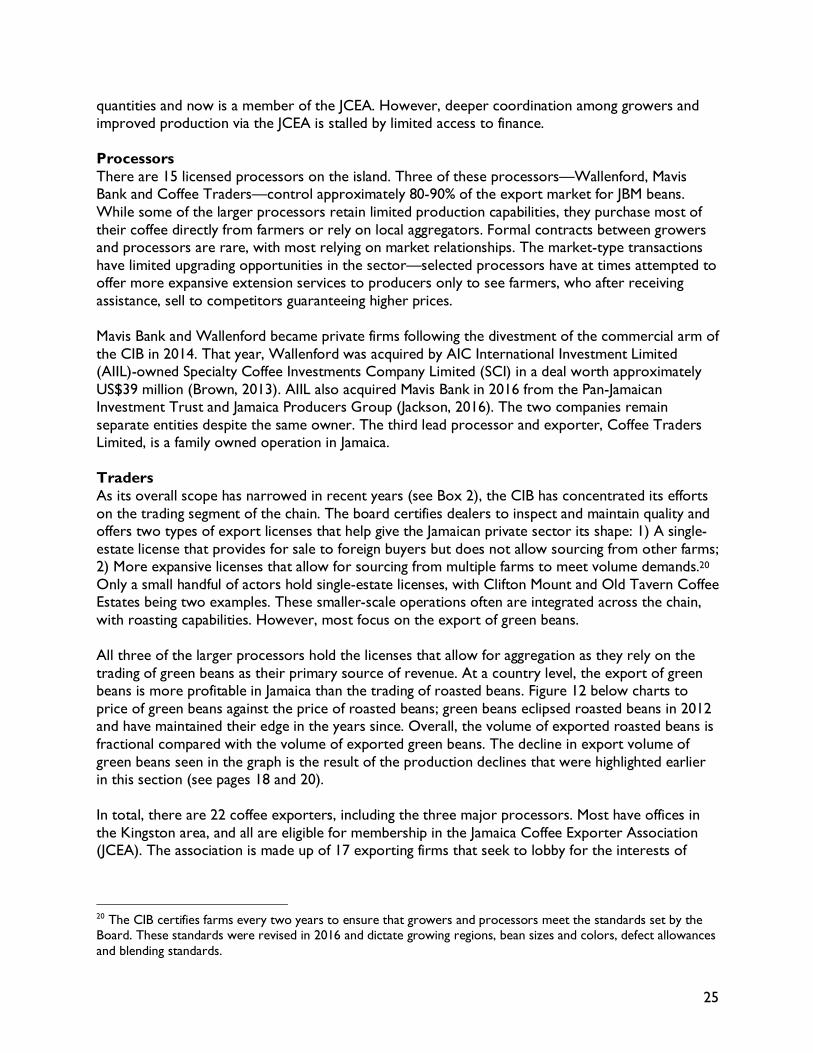
25
quantities and now is a member of the JCEA. However, deeper coordination among growers and improved production via the JCEA is stalled by limited access to finance. Processors There are 15 licensed processors on the island. Three of these processors—Wallenford, Mavis Bank and Coffee Traders—control approximately 80-90% of the export market for JBM beans. While some of the larger processors retain limited production capabilities, they purchase most of their coffee directly from farmers or rely on local aggregators. Formal contracts between growers and processors are rare, with most relying on market relationships. The market-type transactions have limited upgrading opportunities in the sector—selected processors have at times attempted to offer more expansive extension services to producers only to see farmers, who after receiving assistance, sell to competitors guaranteeing higher prices. Mavis Bank and Wallenford became private firms following the divestment of the commercial arm of the CIB in 2014. That year, Wallenford was acquired by AIC International Investment Limited (AIIL)-owned Specialty Coffee Investments Company Limited (SCI) in a deal worth approximately US$39 million (Brown, 2013). AIIL also acquired Mavis Bank in 2016 from the Pan-Jamaican Investment Trust and Jamaica Producers Group (Jackson, 2016). The two companies remain separate entities despite the same owner. The third lead processor and exporter, Coffee Traders Limited, is a family owned operation in Jamaica. Traders As its overall scope has narrowed in recent years (see Box 2), the CIB has concentrated its efforts on the trading segment of the chain. The board certifies dealers to inspect and maintain quality and offers two types of export licenses that help give the Jamaican private sector its shape: 1) A single-estate license that provides for sale to foreign buyers but does not allow sourcing from other farms; 2) More expansive licenses that allow for sourcing from multiple farms to meet volume demands.20 Only a small handful of actors hold single-estate licenses, with Clifton Mount and Old Tavern Coffee Estates being two examples. These smaller-scale operations often are integrated across the chain, with roasting capabilities. However, most focus on the export of green beans. All three of the larger processors hold the licenses that allow for aggregation as they rely on the trading of green beans as their primary source of revenue. At a country level, the export of green beans is more profitable in Jamaica than the trading of roasted beans. Figure 12 below charts to price of green beans against the price of roasted beans; green beans eclipsed roasted beans in 2012 and have maintained their edge in the years since. Overall, the volume of exported roasted beans is fractional compared with the volume of exported green beans. The decline in export volume of green beans seen in the graph is the result of the production declines that were highlighted earlier in this section (see pages 18 and 20). In total, there are 22 coffee exporters, including the three major processors. Most have offices in the Kingston area, and all are eligible for membership in the Jamaica Coffee Exporter Association (JCEA). The association is made up of 17 exporting firms that seek to lobby for the interests of
20 The CIB certifies farms every two years to ensure that growers and processors meet the standards set by the Board. These standards were revised in 2016 and dictate growing regions, bean sizes and colors, defect allowances and blending standards.
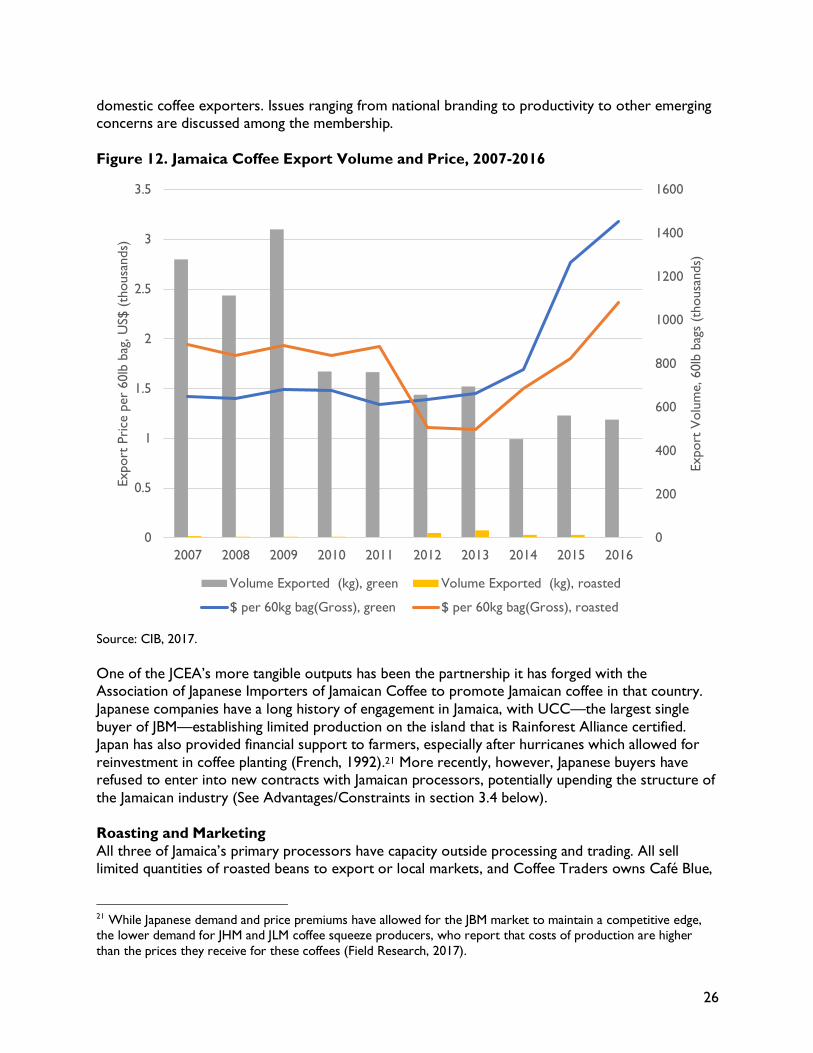
26
domestic coffee exporters. Issues ranging from national branding to productivity to other emerging concerns are discussed among the membership. Figure 12. Jamaica Coffee Export Volume and Price, 2007-2016
Source: CIB, 2017. One of the JCEA’s more tangible outputs has been the partnership it has forged with the Association of Japanese Importers of Jamaican Coffee to promote Jamaican coffee in that country. Japanese companies have a long history of engagement in Jamaica, with UCC—the largest single buyer of JBM—establishing limited production on the island that is Rainforest Alliance certified. Japan has also provided financial support to farmers, especially after hurricanes which allowed for reinvestment in coffee planting (French, 1992).21 More recently, however, Japanese buyers have refused to enter into new contracts with Jamaican processors, potentially upending the structure of the Jamaican industry (See Advantages/Constraints in section 3.4 below). Roasting and Marketing All three of Jamaica’s primary processors have capacity outside processing and trading. All sell limited quantities of roasted beans to export or local markets, and Coffee Traders owns Café Blue,
21 While Japanese demand and price premiums have allowed for the JBM market to maintain a competitive edge, the lower demand for JHM and JLM coffee squeeze producers, who report that costs of production are higher than the prices they receive for these coffees (Field Research, 2017).
0
200
400
600
800
1000
1200
1400
1600
0
0.5
1
1.5
2
2.5
3
3.5
2007 2008 2009 2010 2011 2012 2013 2014 2015 2016
Expo
rt V
olum
e, 6
0lb
bags
(tho
usan
ds)
Expo
rt P
rice
per
60l
b ba
g, U
S$ (t
hous
ands
)
Volume Exported (kg), green Volume Exported (kg), roasted
$ per 60kg bag(Gross), green $ per 60kg bag(Gross), roasted
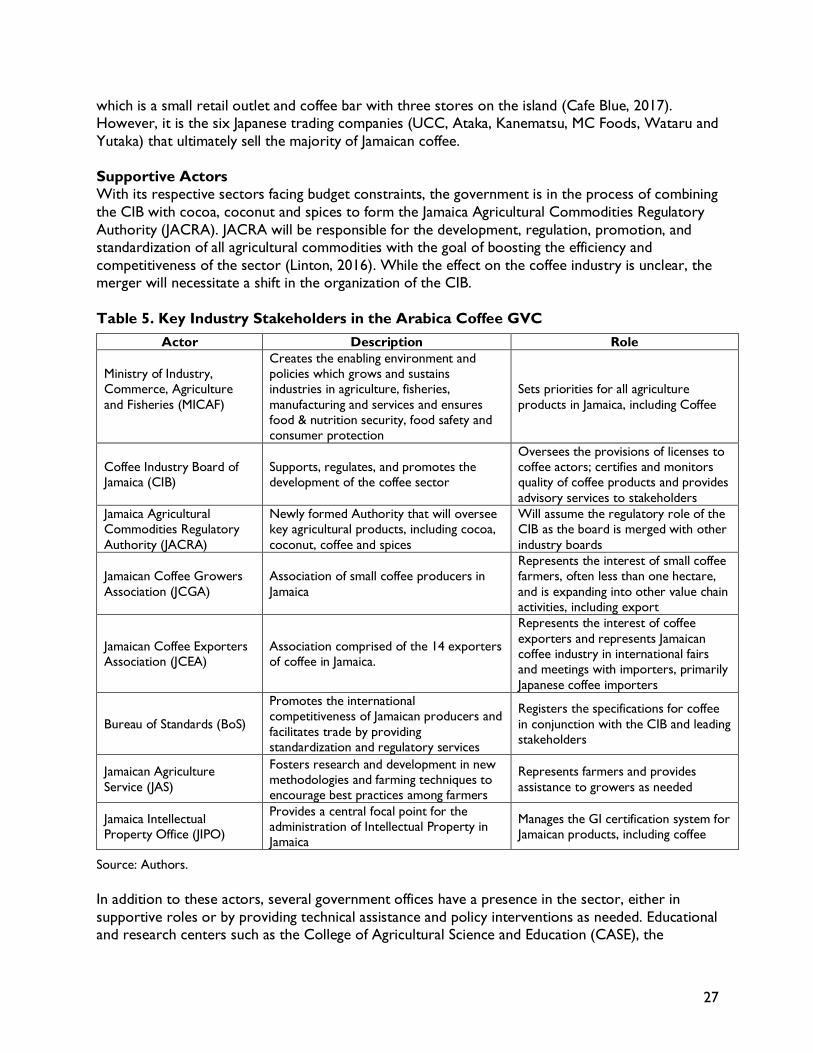
27
which is a small retail outlet and coffee bar with three stores on the island (Cafe Blue, 2017). However, it is the six Japanese trading companies (UCC, Ataka, Kanematsu, MC Foods, Wataru and Yutaka) that ultimately sell the majority of Jamaican coffee. Supportive Actors With its respective sectors facing budget constraints, the government is in the process of combining the CIB with cocoa, coconut and spices to form the Jamaica Agricultural Commodities Regulatory Authority (JACRA). JACRA will be responsible for the development, regulation, promotion, and standardization of all agricultural commodities with the goal of boosting the efficiency and competitiveness of the sector (Linton, 2016). While the effect on the coffee industry is unclear, the merger will necessitate a shift in the organization of the CIB. Table 5. Key Industry Stakeholders in the Arabica Coffee GVC
Actor Description Role
Ministry of Industry, Commerce, Agriculture and Fisheries (MICAF)
Creates the enabling environment and policies which grows and sustains industries in agriculture, fisheries, manufacturing and services and ensures food & nutrition security, food safety and consumer protection
Sets priorities for all agriculture products in Jamaica, including Coffee
Coffee Industry Board of Jamaica (CIB)
Supports, regulates, and promotes the development of the coffee sector
Oversees the provisions of licenses to coffee actors; certifies and monitors quality of coffee products and provides advisory services to stakeholders
Jamaica Agricultural Commodities Regulatory Authority (JACRA)
Newly formed Authority that will oversee key agricultural products, including cocoa, coconut, coffee and spices
Will assume the regulatory role of the CIB as the board is merged with other industry boards
Jamaican Coffee Growers Association (JCGA)
Association of small coffee producers in Jamaica
Represents the interest of small coffee farmers, often less than one hectare, and is expanding into other value chain activities, including export
Jamaican Coffee Exporters Association (JCEA)
Association comprised of the 14 exporters of coffee in Jamaica.
Represents the interest of coffee exporters and represents Jamaican coffee industry in international fairs and meetings with importers, primarily Japanese coffee importers
Bureau of Standards (BoS)
Promotes the international competitiveness of Jamaican producers and facilitates trade by providing standardization and regulatory services
Registers the specifications for coffee in conjunction with the CIB and leading stakeholders
Jamaican Agriculture Service (JAS)
• Fosters research and development in new methodologies and farming techniques to encourage best practices among farmers
Represents farmers and provides assistance to growers as needed
Jamaica Intellectual Property Office (JIPO)
Provides a central focal point for the administration of Intellectual Property in Jamaica
Manages the GI certification system for Jamaican products, including coffee
Source: Authors. In addition to these actors, several government offices have a presence in the sector, either in supportive roles or by providing technical assistance and policy interventions as needed. Educational and research centers such as the College of Agricultural Science and Education (CASE), the

28
Scientific Research Council (SRC) and the Jamaican Agricultural Service (JAS) also provide research, extension services and trainings on occasion, though most of these services are facilitated by the CIB and large processors on a limited extend. The key coffee stakeholders in Jamaica are presented in Table 5 above. 3.3 Upgrading and Industry Evolution in Jamaica’s Arabica Coffee Global Value Chain Since the 1950s, Jamaica has made several efforts to revitalize the coffee industry with a focus on quality as well as cultivating relationships with key export markets, primarily Japan. Current upgrading efforts have centered on end market diversification and product upgrading via the establishment of a GI to protect the quality of the JBM variety. Additionally, emerging blends of Jamaican coffee attempt to capitalize on the quality associated with JBM to raise the value of non-JBM varieties through blends. However, these blends often struggle to find the requisite non-JBM coffee beans at competitive prices to make this a viable diversification strategy. Historically, growth in the Jamaican coffee industry could be attributed to market upgrading, particularly the close relationship with the Japanese market. The country was an early mover into the specialty market because of the willingness of Japanese consumers to pay a price premium. Following the discovery in the 1960s that most coffee exports to the United Kingdom were re-exported to Japan, Jamaica began to establish direct trade with the nation. Japan long provide a stable, high value market for JBM beans, frequently purchasing over 80% of the crop at prices well above global average; for example, Japan paid US$60 per kg of JBM coffee in 2015, compared to the global average of US$4/kg for Arabica beans (Field Research, 2017; World Bank, 2016). At the country level, the establishment of a Geographic Indication (GI) for Jamaican Blue Mountain coffee is seeking to help upgrade JBM coffee. The GI, which is registered with the Jamaica Intellectual Property Office (JIPO) but is administered and owned by the CIB, seeks not only to certify the quality of JBM coffee but to prevent counterfeits through the use of a certified trademark (WIPO, 2017).22 The GI was formally established in 2004 and restricts use of the JBM geographic label to the producers operating in the Blue Mountain region who have received approval from the CIB. It also highlights the unique geographical and climate specifications that contribute to the singularity of the coffee. Additionally, the measure tracks counterfeit marks and seeks to notify consumers about these counterfeits and limit their presence on the international market. The current GI for JBM coffee is registered in 51 countries as a certification mark. However, as a result of conflicting interests of many stakeholders, the GI does not distinguish between blends and 100% JBM coffee. As a result, the GI is limited in its ability to promote the high value of the product. Furthermore, the cost of registration and monitoring of the GI is high, between US$250,000 and US$400,000/year (Goffe, 2017). Jamaica is helping move non-JBM coffee producers into higher value markets by blending coffee beans to help improve quality connotations. Approximately 25% of Jamaica’s total coffee production occurs outside the Blue Mountain region, but is often destined for domestic consumption and blends. These producers are smallholders who depend on coffee as a major source of income yet often receive lower premiums or institutional support compared to Blue Mountain operators.
22 The certifying mark is similar to a trademark but whose ownership is shared and administered by a public body verses ownership by a specific firm.

29
Current initiatives to address this gap center on blending requirements that mandate all imported beans be blended with local supplies prior to processing and packaging. The move, effective in November 2017, seeks to increase the use of non-JBM beans but could increase the price of imported coffee due to the higher production costs throughout Jamaica (Collinder, 2017b). 3.4 Advantages and Constraints Jamaica’s coffee industry is characterized by high JBM prices paid by Japanese consumers balanced against the low productivity and the costs associated with farming. Because of the positive reputation associated with the JBM brand, there are opportunities for economic upgrading. The industry can add value, if MICAF and CIB and other stakeholders systematically address some of the key constraints. Table 6 summarizes both the strengths and weaknesses of the Jamaican industry. The most prominent advantages and constraints are then outlined in the section that follows. The potential upgrading section expounds on the possible opportunities. Table 6. SWOT of Jamaica’s Arabica Coffee Industry
Strengths Weaknesses • Highest unit value globally for coffee • Favorable reputation for JBM coffee • Strong regulatory system to ensure quality • Integrated production and established
exporters/processors
• Reliance on single export market • Low productivity • High production costs • Poor infrastructure in coffee production areas • Limited coordination among stakeholders,
including on extension services actors, especially between farmers and processors
• Inability of many producers to sell into supply chains of major coffee retailers
• Insufficient marketing of Jamaican coffee
Opportunities Threats • Growing demand for single farm or regionally
sourced coffee • Increased interest in specialty coffee in emerging
markets, including China • Expanding demand for Jamaican tourism
• Perceived deterioration of product quality • Climate change and environmental shocks to
production • Emerging high quality varieties from Central and
South America • Coffee rust and other diseases
Source: Authors. 3.4.1 Advantages Jamaica’s advantages in the coffee industry revolve around its reputation for quality and its strong regulatory system as well as brand awareness in critical export markets. It also benefits from high integration among large processors in production and export. The following sub-section expounds upon these strengths.
• Highest global unit value for coffee. Jamaica earns the highest unit price in the world for its coffee exports, a trend that has persisted for decades. In 2015, the unit price for Jamaican green coffee beans was US$21.03/kg, nearly five times higher than the global average for Arabica beans: US$4.42/kg (UNComtrade, 2017; World Bank, 2016).
30
• Favorable reputation for JBM coffee. The high unit price Jamaica earns on the export
market is due largely to JBM’s reputation. The CIB’s long history of monitoring for quality along with a favorable climate and soil conditions led specialty consumers to see JBM coffee as a luxury product. Although the premiums are most often paid by Japanese consumers, some North American and European retailers also buy and sell JBM at high prices. In recent years, Starbucks has sold small quantities of JBM as part of its reserve line (Collinder, 2017a).23
• Strong regulatory system to ensure quality. The CIB has been instrumental in Jamaica maintaining its reputation for quality. The organization acts as a certifier and regulator of the industry, granting licenses for production, processing and trading as well as monitoring and certifying all coffee exported from Jamaica. Its exacting standards and its long history have afforded Jamaica a prominent niche in the specialty market and are prominent assets for the domestic industry.
• Integrated production and established processors and exporters. Jamaican coffee is relatively integrated, with several processors also acting as traders and some having their own production sites. Many of these actors have deep roots in the coffee industry and are expanding activities across the chain. For example, the JCGA recently expanded into processing and export activities, and Coffee Traders has a retail presence (Café Blue).
3.4.2 Challenges Although the island has a number of strengths, there are multiple challenges, some of which have become particularly pronounced in recent years. Over reliance on one export market and declining productivity are especially prominent concerns. Additionally, the high costs of production and lack of modern infrastructure in growing regions undermine the entire competitiveness of the sector while underdeveloped marketing, extension services and coordination threaten future growth. The following sub-section expounds upon these challenges.
1. Reliance on single export market. Jamaica depends heavily on Japan for most exports. Entrenched historical ties have helped develop high volumes of trade between the two countries; however, reliance on one market accentuates risk as Jamaica is exposed to shifts in local demand. In 2017, Japanese buyers balked at the asking price for JBM, refusing to pay more than US$40/kg for green beans. The buying price the previous two years had been US$60/kg after a 2015 spike due to a shortage in supply in Jamaica; Japanese actors cited improved local storage techniques and increased price sensitivity among its consumers in proposing to cut the price for JBM green beans and returning closer to historical norms (Field Research, 2017; Myers Jr., 2017). The result for farmers would be that prices they receive would be reduced to US$93 per 60-pound box to US$46 (Myers Jr., 2017).
2. Low productivity. Coffee production and yields are both declining in Jamaica, with aging trees and the lack of tree maintenance cited as major contributing factors (Field Research, 2017). The issue is further execrated by frequent hurricanes and droughts, which push many farmers into food crops to meet dietary needs. These farmers see coffee as a risky crop to
23 In recent years, Starbucks has sold small quantities of JBM as part of its reserve line (Collinder, 2017a).
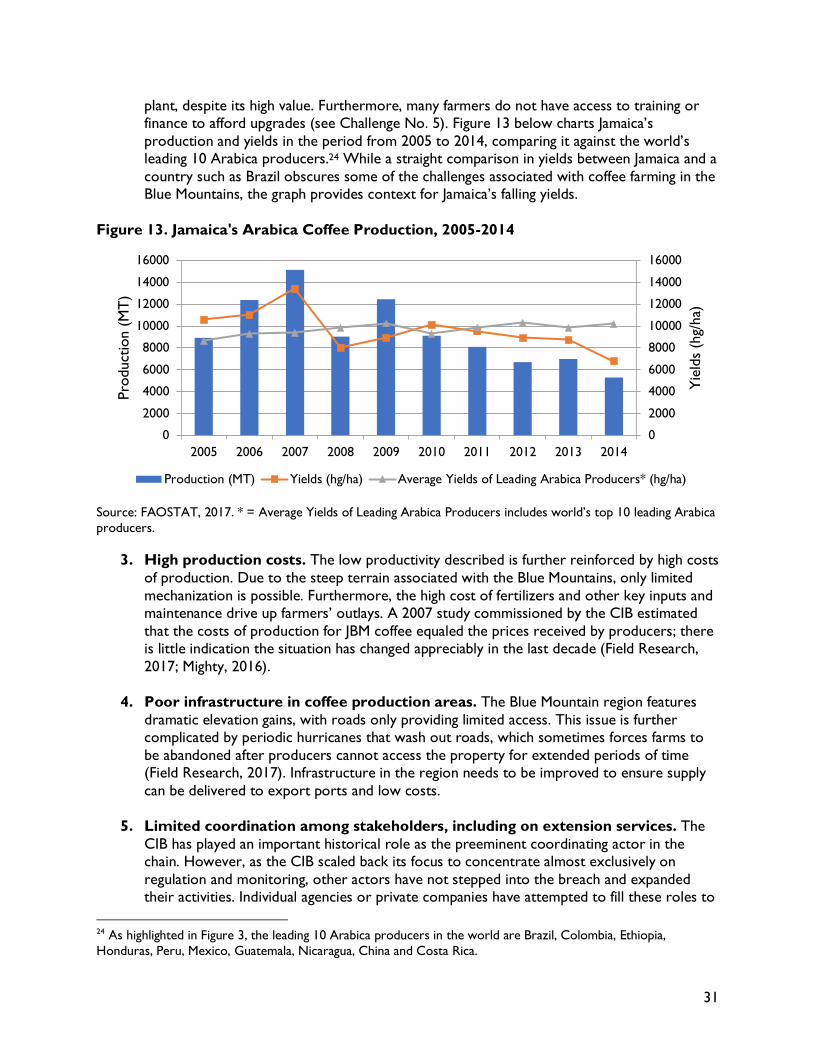
31
plant, despite its high value. Furthermore, many farmers do not have access to training or finance to afford upgrades (see Challenge No. 5). Figure 13 below charts Jamaica’s production and yields in the period from 2005 to 2014, comparing it against the world’s leading 10 Arabica producers.24 While a straight comparison in yields between Jamaica and a country such as Brazil obscures some of the challenges associated with coffee farming in the Blue Mountains, the graph provides context for Jamaica’s falling yields.
Figure 13. Jamaica's Arabica Coffee Production, 2005-2014
Source: FAOSTAT, 2017. * = Average Yields of Leading Arabica Producers includes world’s top 10 leading Arabica producers.
3. High production costs. The low productivity described is further reinforced by high costs of production. Due to the steep terrain associated with the Blue Mountains, only limited mechanization is possible. Furthermore, the high cost of fertilizers and other key inputs and maintenance drive up farmers’ outlays. A 2007 study commissioned by the CIB estimated that the costs of production for JBM coffee equaled the prices received by producers; there is little indication the situation has changed appreciably in the last decade (Field Research, 2017; Mighty, 2016).
4. Poor infrastructure in coffee production areas. The Blue Mountain region features dramatic elevation gains, with roads only providing limited access. This issue is further complicated by periodic hurricanes that wash out roads, which sometimes forces farms to be abandoned after producers cannot access the property for extended periods of time (Field Research, 2017). Infrastructure in the region needs to be improved to ensure supply can be delivered to export ports and low costs.
5. Limited coordination among stakeholders, including on extension services. The CIB has played an important historical role as the preeminent coordinating actor in the chain. However, as the CIB scaled back its focus to concentrate almost exclusively on regulation and monitoring, other actors have not stepped into the breach and expanded their activities. Individual agencies or private companies have attempted to fill these roles to
24 As highlighted in Figure 3, the leading 10 Arabica producers in the world are Brazil, Colombia, Ethiopia, Honduras, Peru, Mexico, Guatemala, Nicaragua, China and Costa Rica.
0
2000
4000
6000
8000
10000
12000
14000
16000
0
2000
4000
6000
8000
10000
12000
14000
16000
2005 2006 2007 2008 2009 2010 2011 2012 2013 2014
Yie
lds
(hg/
ha)
Prod
uctio
n (M
T)
Production (MT) Yields (hg/ha) Average Yields of Leading Arabica Producers* (hg/ha)
32
limited degrees, but without a body to coordinate actors, a unified strategy for coffee remains elusive. The issue is especially pronounced with the provision of extension services. Following the privatization of the commercial arm of the CIB, funding was reduced, diminishing the Board’s ability to offer training and services to farmers. At the same time, other agricultural extension service providers remained focused primarily on other products, seeing coffee as the domain of the CIB. As a result, services are limited—large processors have sporadically offered technical assistance to growers, but these efforts have not persisted over time because of concerns growers will sell to other processors.
6. Inability of many producers to sell into supply chains of major coffee retailers. As detailed in the Standards and Institutions section, the global coffee industry places a premium on third-party verifications of sustainability and environmental considerations. This is sometimes superseded in the specialty coffee niche by its emphasis on quality and traceability to the farm level; however, suppliers must still adhere to certain minimum economic, environmental or sustainability standards. Many actors in Jamaica either are not in compliance or cannot generate documents to prove they are. Furthermore, large aggregators such as Mavis Bank do not differentiate their supply and cannot necessarily provide lot codes as required by the company. This limits the ability to partner with large global brands.
7. Insufficient marketing of Jamaican coffee. Jamaica has relied on Japanese demand for
years and has not invested in extensive marketing efforts to build the brand. Campaigns to expand export partnerships in the United States, Europe, and other potential markets are limited, further hindering the ability to diversify end markets. Additionally, joint efforts with other Jamaican industries to capitalize on the country brand are also underdeveloped, reducing opportunities to build international awareness of the country’s coffee industry.
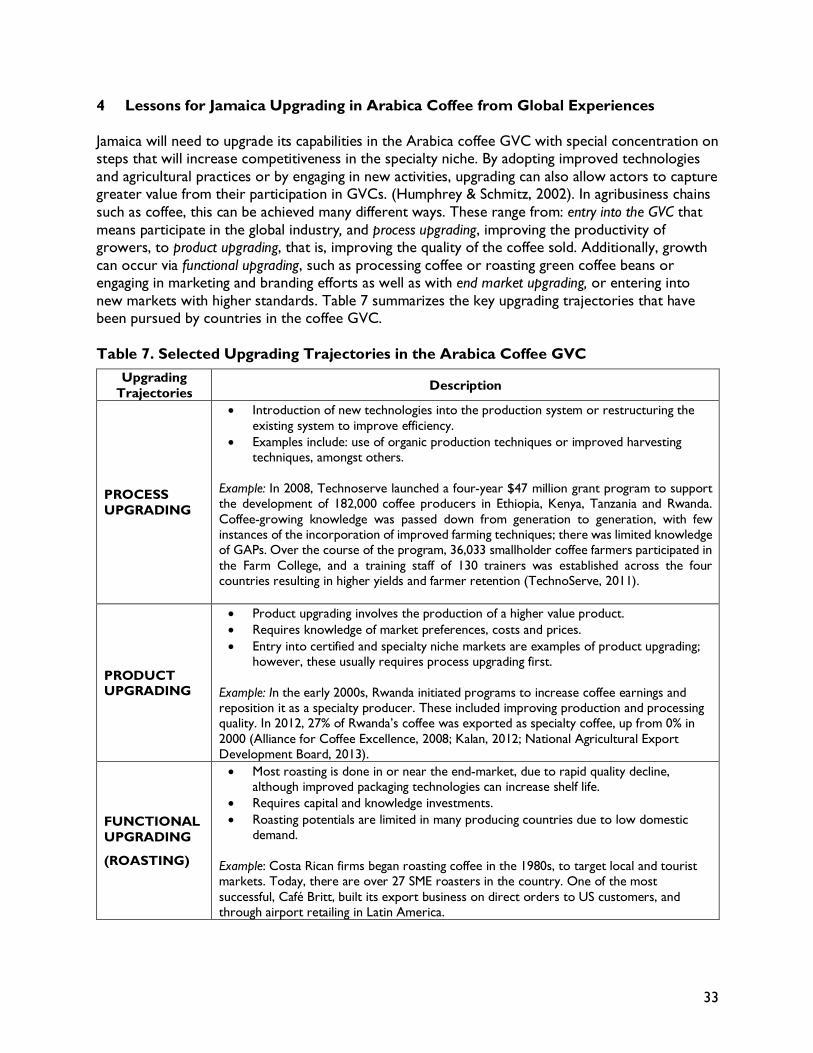
33
4 Lessons for Jamaica Upgrading in Arabica Coffee from Global Experiences Jamaica will need to upgrade its capabilities in the Arabica coffee GVC with special concentration on steps that will increase competitiveness in the specialty niche. By adopting improved technologies and agricultural practices or by engaging in new activities, upgrading can also allow actors to capture greater value from their participation in GVCs. (Humphrey & Schmitz, 2002). In agribusiness chains such as coffee, this can be achieved many different ways. These range from: entry into the GVC that means participate in the global industry, and process upgrading, improving the productivity of growers, to product upgrading, that is, improving the quality of the coffee sold. Additionally, growth can occur via functional upgrading, such as processing coffee or roasting green coffee beans or engaging in marketing and branding efforts as well as with end market upgrading, or entering into new markets with higher standards. Table 7 summarizes the key upgrading trajectories that have been pursued by countries in the coffee GVC. Table 7. Selected Upgrading Trajectories in the Arabica Coffee GVC
Upgrading Trajectories Description
PROCESS UPGRADING
• Introduction of new technologies into the production system or restructuring the existing system to improve efficiency.
• Examples include: use of organic production techniques or improved harvesting techniques, amongst others.
Example: In 2008, Technoserve launched a four-year $47 million grant program to support the development of 182,000 coffee producers in Ethiopia, Kenya, Tanzania and Rwanda. Coffee-growing knowledge was passed down from generation to generation, with few instances of the incorporation of improved farming techniques; there was limited knowledge of GAPs. Over the course of the program, 36,033 smallholder coffee farmers participated in the Farm College, and a training staff of 130 trainers was established across the four countries resulting in higher yields and farmer retention (TechnoServe, 2011).
PRODUCT UPGRADING
• Product upgrading involves the production of a higher value product. • Requires knowledge of market preferences, costs and prices. • Entry into certified and specialty niche markets are examples of product upgrading;
however, these usually requires process upgrading first.
Example: In the early 2000s, Rwanda initiated programs to increase coffee earnings and reposition it as a specialty producer. These included improving production and processing quality. In 2012, 27% of Rwanda’s coffee was exported as specialty coffee, up from 0% in 2000 (Alliance for Coffee Excellence, 2008; Kalan, 2012; National Agricultural Export Development Board, 2013).
FUNCTIONAL UPGRADING
(ROASTING)
• Most roasting is done in or near the end-market, due to rapid quality decline, although improved packaging technologies can increase shelf life.
• Requires capital and knowledge investments. • Roasting potentials are limited in many producing countries due to low domestic
demand.
Example: Costa Rican firms began roasting coffee in the 1980s, to target local and tourist markets. Today, there are over 27 SME roasters in the country. One of the most successful, Café Britt, built its export business on direct orders to US customers, and through airport retailing in Latin America.
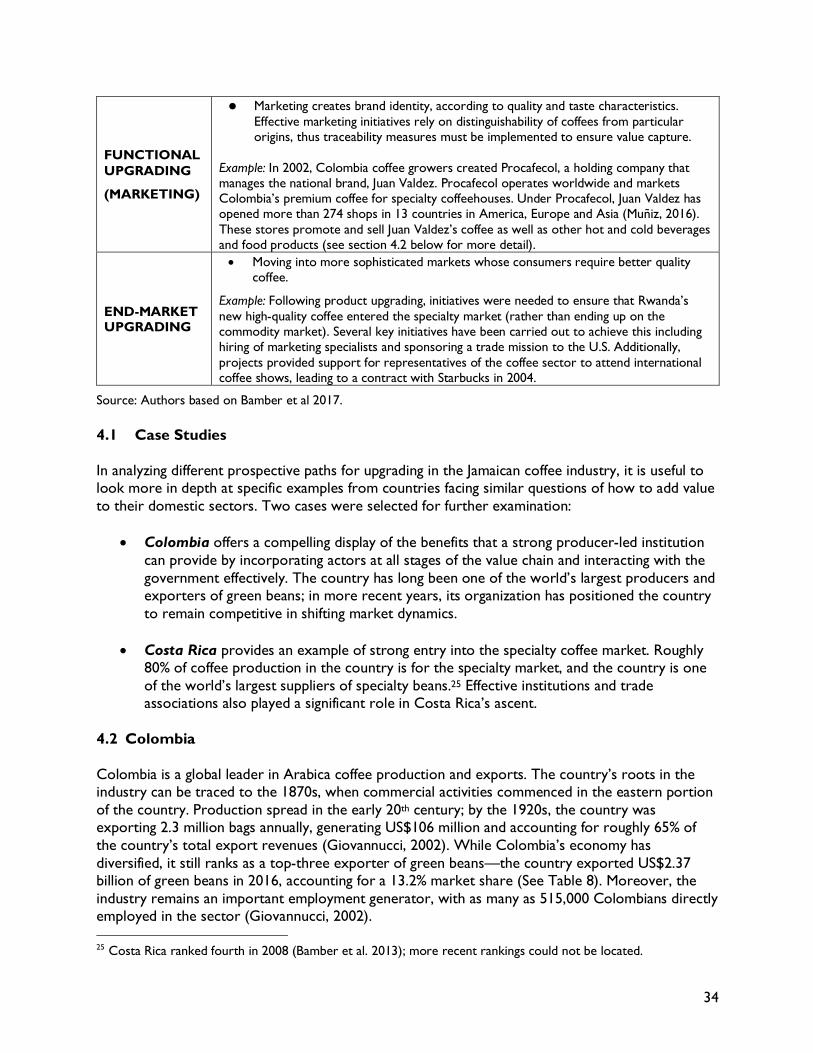
34
FUNCTIONAL UPGRADING
(MARKETING)
• Marketing creates brand identity, according to quality and taste characteristics. Effective marketing initiatives rely on distinguishability of coffees from particular origins, thus traceability measures must be implemented to ensure value capture.
Example: In 2002, Colombia coffee growers created Procafecol, a holding company that manages the national brand, Juan Valdez. Procafecol operates worldwide and markets Colombia’s premium coffee for specialty coffeehouses. Under Procafecol, Juan Valdez has opened more than 274 shops in 13 countries in America, Europe and Asia (Muñiz, 2016). These stores promote and sell Juan Valdez’s coffee as well as other hot and cold beverages and food products (see section 4.2 below for more detail).
END-MARKET UPGRADING
• Moving into more sophisticated markets whose consumers require better quality coffee.
Example: Following product upgrading, initiatives were needed to ensure that Rwanda’s new high-quality coffee entered the specialty market (rather than ending up on the commodity market). Several key initiatives have been carried out to achieve this including hiring of marketing specialists and sponsoring a trade mission to the U.S. Additionally, projects provided support for representatives of the coffee sector to attend international coffee shows, leading to a contract with Starbucks in 2004.
Source: Authors based on Bamber et al 2017. 4.1 Case Studies In analyzing different prospective paths for upgrading in the Jamaican coffee industry, it is useful to look more in depth at specific examples from countries facing similar questions of how to add value to their domestic sectors. Two cases were selected for further examination:
• Colombia offers a compelling display of the benefits that a strong producer-led institution can provide by incorporating actors at all stages of the value chain and interacting with the government effectively. The country has long been one of the world’s largest producers and exporters of green beans; in more recent years, its organization has positioned the country to remain competitive in shifting market dynamics.
• Costa Rica provides an example of strong entry into the specialty coffee market. Roughly 80% of coffee production in the country is for the specialty market, and the country is one of the world’s largest suppliers of specialty beans.25 Effective institutions and trade associations also played a significant role in Costa Rica’s ascent.
4.2 Colombia Colombia is a global leader in Arabica coffee production and exports. The country’s roots in the industry can be traced to the 1870s, when commercial activities commenced in the eastern portion of the country. Production spread in the early 20th century; by the 1920s, the country was exporting 2.3 million bags annually, generating US$106 million and accounting for roughly 65% of the country’s total export revenues (Giovannucci, 2002). While Colombia’s economy has diversified, it still ranks as a top-three exporter of green beans—the country exported US$2.37 billion of green beans in 2016, accounting for a 13.2% market share (See Table 8). Moreover, the industry remains an important employment generator, with as many as 515,000 Colombians directly employed in the sector (Giovannucci, 2002). 25 Costa Rica ranked fourth in 2008 (Bamber et al. 2013); more recent rankings could not be located.
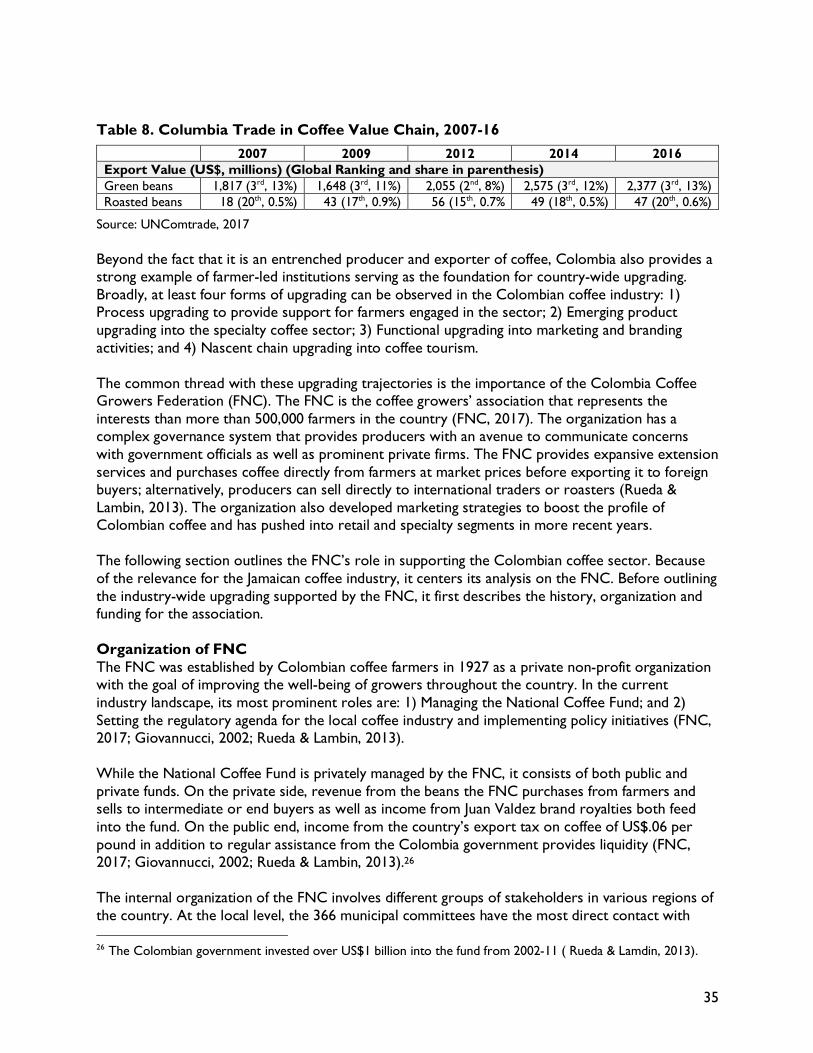
35
Table 8. Columbia Trade in Coffee Value Chain, 2007-16 2007 2009 2012 2014 2016 Export Value (US$, millions) (Global Ranking and share in parenthesis) Green beans 1,817 (3rd, 13%) 1,648 (3rd, 11%) 2,055 (2nd, 8%) 2,575 (3rd, 12%) 2,377 (3rd, 13%) Roasted beans 18 (20th, 0.5%) 43 (17th, 0.9%) 56 (15th, 0.7% 49 (18th, 0.5%) 47 (20th, 0.6%)
Source: UNComtrade, 2017 Beyond the fact that it is an entrenched producer and exporter of coffee, Colombia also provides a strong example of farmer-led institutions serving as the foundation for country-wide upgrading. Broadly, at least four forms of upgrading can be observed in the Colombian coffee industry: 1) Process upgrading to provide support for farmers engaged in the sector; 2) Emerging product upgrading into the specialty coffee sector; 3) Functional upgrading into marketing and branding activities; and 4) Nascent chain upgrading into coffee tourism. The common thread with these upgrading trajectories is the importance of the Colombia Coffee Growers Federation (FNC). The FNC is the coffee growers’ association that represents the interests than more than 500,000 farmers in the country (FNC, 2017). The organization has a complex governance system that provides producers with an avenue to communicate concerns with government officials as well as prominent private firms. The FNC provides expansive extension services and purchases coffee directly from farmers at market prices before exporting it to foreign buyers; alternatively, producers can sell directly to international traders or roasters (Rueda & Lambin, 2013). The organization also developed marketing strategies to boost the profile of Colombian coffee and has pushed into retail and specialty segments in more recent years. The following section outlines the FNC’s role in supporting the Colombian coffee sector. Because of the relevance for the Jamaican coffee industry, it centers its analysis on the FNC. Before outlining the industry-wide upgrading supported by the FNC, it first describes the history, organization and funding for the association. Organization of FNC The FNC was established by Colombian coffee farmers in 1927 as a private non-profit organization with the goal of improving the well-being of growers throughout the country. In the current industry landscape, its most prominent roles are: 1) Managing the National Coffee Fund; and 2) Setting the regulatory agenda for the local coffee industry and implementing policy initiatives (FNC, 2017; Giovannucci, 2002; Rueda & Lambin, 2013). While the National Coffee Fund is privately managed by the FNC, it consists of both public and private funds. On the private side, revenue from the beans the FNC purchases from farmers and sells to intermediate or end buyers as well as income from Juan Valdez brand royalties both feed into the fund. On the public end, income from the country’s export tax on coffee of US$.06 per pound in addition to regular assistance from the Colombia government provides liquidity (FNC, 2017; Giovannucci, 2002; Rueda & Lambin, 2013).26 The internal organization of the FNC involves different groups of stakeholders in various regions of the country. At the local level, the 366 municipal committees have the most direct contact with 26 The Colombian government invested over US$1 billion into the fund from 2002-11 ( Rueda & Lamdin, 2013).
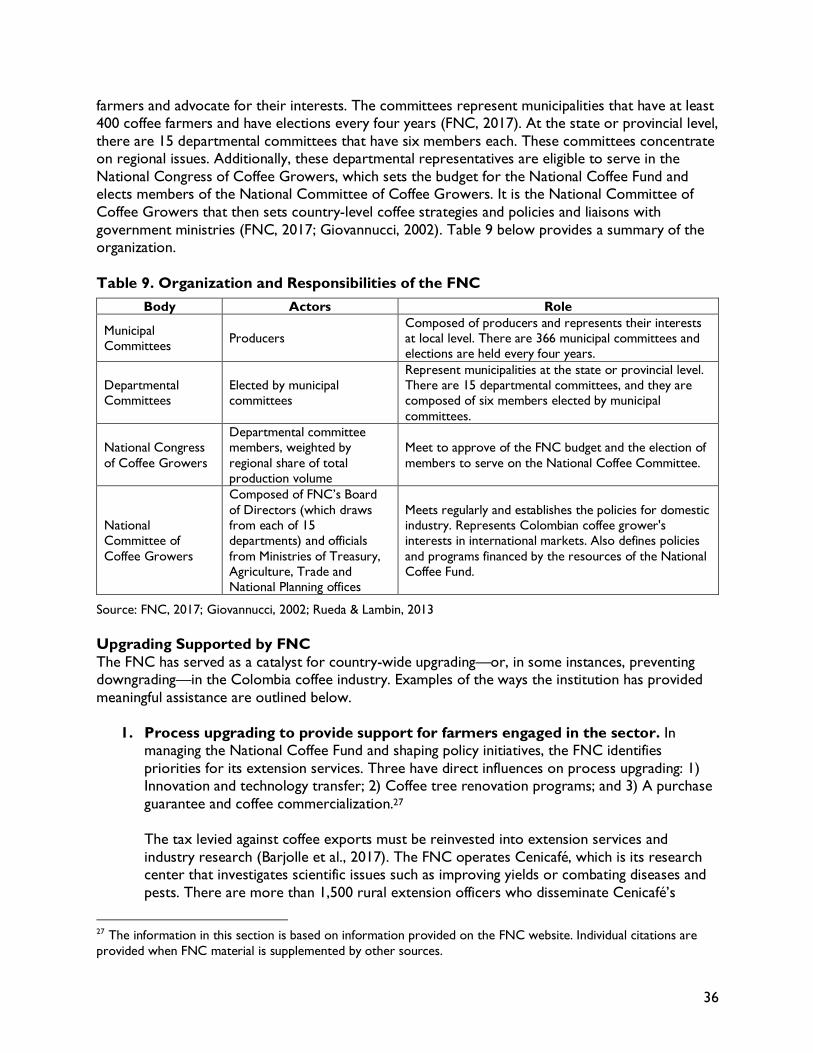
36
farmers and advocate for their interests. The committees represent municipalities that have at least 400 coffee farmers and have elections every four years (FNC, 2017). At the state or provincial level, there are 15 departmental committees that have six members each. These committees concentrate on regional issues. Additionally, these departmental representatives are eligible to serve in the National Congress of Coffee Growers, which sets the budget for the National Coffee Fund and elects members of the National Committee of Coffee Growers. It is the National Committee of Coffee Growers that then sets country-level coffee strategies and policies and liaisons with government ministries (FNC, 2017; Giovannucci, 2002). Table 9 below provides a summary of the organization. Table 9. Organization and Responsibilities of the FNC
Body Actors Role
Municipal Committees Producers
Composed of producers and represents their interests at local level. There are 366 municipal committees and elections are held every four years.
Departmental Committees
Elected by municipal committees
Represent municipalities at the state or provincial level. There are 15 departmental committees, and they are composed of six members elected by municipal committees.
National Congress of Coffee Growers
Departmental committee members, weighted by regional share of total production volume
Meet to approve of the FNC budget and the election of members to serve on the National Coffee Committee.
National Committee of Coffee Growers
Composed of FNC’s Board of Directors (which draws from each of 15 departments) and officials from Ministries of Treasury, Agriculture, Trade and National Planning offices
Meets regularly and establishes the policies for domestic industry. Represents Colombian coffee grower's interests in international markets. Also defines policies and programs financed by the resources of the National Coffee Fund.
Source: FNC, 2017; Giovannucci, 2002; Rueda & Lambin, 2013 Upgrading Supported by FNC The FNC has served as a catalyst for country-wide upgrading—or, in some instances, preventing downgrading—in the Colombia coffee industry. Examples of the ways the institution has provided meaningful assistance are outlined below.
1. Process upgrading to provide support for farmers engaged in the sector. In managing the National Coffee Fund and shaping policy initiatives, the FNC identifies priorities for its extension services. Three have direct influences on process upgrading: 1) Innovation and technology transfer; 2) Coffee tree renovation programs; and 3) A purchase guarantee and coffee commercialization.27 The tax levied against coffee exports must be reinvested into extension services and industry research (Barjolle et al., 2017). The FNC operates Cenicafé, which is its research center that investigates scientific issues such as improving yields or combating diseases and pests. There are more than 1,500 rural extension officers who disseminate Cenicafé’s
27 The information in this section is based on information provided on the FNC website. Individual citations are provided when FNC material is supplemented by other sources.
37
findings and engage with farmers on topics such as input application, tree care, sustainability techniques and other factors that can boost productivity or increase competitiveness. Cenicafé recommends farmers in Colombia replant coffee trees after they are more than five years old (Parizat et al., 2015). To help producers adhere to these guidelines, the FNC initiated two replanting programs in the period from 1998 to 2011 to rejuvenate a total of 715,000 hectares. The first, the Coffee Competitiveness Program (CP), involved farmers willing to replant at least 400 trees. Growers received fertilizer subsidies of US$0.09 per plant to support stumping, which is a rejuvenation technique where leaves are cut and the trees must rely on nutrient reserves in their roots (Parizat et al., 2015). Extension staff disbursed the fertilizer subsidy once determining the plants had been properly stumped or new seedling had been planted. Multi-cropping was also a component, with maize and beans being distributed to guarantee incomes while new coffee trees took root. During the 13 years of the program, an estimated 605,000 hectares of coffee were renewed at a cost of roughly US$181 million (Parizat et al., 2015). The second initiative, the Permanence, Sustainability and Future Program (PSF), targeted smallholders more directly than the CP. It was started in 2007 and, while administered by the FNC, used financing from the national agricultural financing fund (Parizat et al., 2015). Rather than using subsidized fertilizer as an incentive for adopting of best practices regarding coffee tree care, it provided funds to banks to encourage loans to farmers on favorable terms. From 2011 to 2015, at least US$361 million was distributed through the program, helping to rejuvenate 118,000 hectares (Parizat et al., 2015). Finally, the purchase guarantee program the FNC offers is one of the primary benefits the organization offers farmers (Rueda & Lambin, 2013). The FNC has 540 purchasing points among 36 cooperatives in the country, and producers receive prices that are equal or above the international C price for coffee. While the FNC has historically been the dominant Colombian exporter, it has lost market share in recent decades, although it is still the largest single exporter with roughly 23% of total market share in 2016 (FNC, 2017).
2. Emerging product upgrading into the specialty coffee sector. At the same time the
FNC and Juan Valdez have pursued retail operations, Colombia has attempted to enter higher-value specialty markets by emphasizing sustainable and traceable supply chains. Broadly, the FNC worked along three lines as it developed its “café’s especiales,” which were defined as coffees that consumers were willing to pay a higher premium to purchase: 1) Increasing the production and marketing of certified or third-party verified sustainable coffees; 2) Controlling the quality of coffees that were associated with specific regions; and 3) Producing blends that were suited to specific markets’ tastes (Rueda & Lambin, 2013). A key component of the efforts was the FNC’s pursuit of GIs and specifically PDO labels (see Box 1). The government initiated the process in 2002 and began recognizing specific regions in 2004 (Barjolle et al., 2017). The EU recognized Colombia’s PGI in 2007, and the FNC and Colombian government have further diversified regional and product offerings in the years since, with local geographical names being registered as DOs since 2011. While the government is the title holder of the GI, the actual administration and implementation of the GIs is the FNC’s responsibility (Barjolle et al., 2017).

38
There have been quantifiable gains associated with the efforts. In 2002, roughly 2% of the FNC’s total exports were differentiated through organic or specific origins—5,000 bags of certified sustainable coffee, and 59,000 single-origin bags. By 2009, that number had increased to 50% of the FNC’s exports, of which 624,000 bags were from sustainable sources and 150,000 were from single origins (Rueda & Lambin, 2013). Furthermore, the drive toward single origin traceability has provided farmers with the ability to sell to buyers outside the FNC, thereby increasing access to markets that potentially pay a higher premium. In the period from 2000 to 2016, the FNC’s total exports of 60kg bags stayed relatively consistent, falling from 3,326 in 2000 to 2,915 in 2016; however, during that same time period, non-FNC exports increased from 5,887 60kg bags in 2000 to 9,930 in 2016 (FNC, 2017). That jump has also been accompanied by an increase in the unit value of the country’s coffee export, from US$2.33 per kg in 2000 to US$3.47 per kg in 2016. Figure 14 below charts the change in the unit value in Colombian coffee exports in the period, comparing it to the average unit price of all coffee exporters in South American, Central America and the Caribbean. In that time, Colombia has widened the spread in the unit price of its exports between it and its peers from US$0.26 in 2000 to US$0.36 in 2016.
Figure 14. Unit Value of Colombian Coffee Exports against Regional, 2000-16
Source: UNComtrade, 2017. Note: The regional average includes every coffee exporting nation in Central America, South America and the Caribbean.
3. Functional upgrading into marketing and branding activities. Colombian coffee
sector has been able to move from production of coffee to roasting to marketing and retail. The FNC created the Juan Valdez brand in 1959 to strengthen consumer awareness of Colombia coffee. Advertisements campaigns were direct toward important markets such as the US, with the FNC utilizing print and television commercials to generate interest. The FNC also contributed to ad campaigns of prominent US roasters for them to promote Juan Valdez coffee and utilize the logo depicting a Colombia coffee farmer that is associated with the brand (Giovannucci, 2002).
0
1
2
3
4
5
6
7
2000
2001
2002
2003
2004
2005
2006
2007
2008
2009
2010
2011
2012
2013
2014
2015
2016
Uni
t V
alue
(U
S$/k
g)
Regional unit value ($/kg) Colombia ($/kg)
39
In more recent years, the FNC has expanded its retail presence under the Juan Valdez brand. In 2002, the FNC created Procafecol, which is a holding company that manages the Juan Valdez brand worldwide and markets Colombia’s premium coffee for specialty coffeehouses (IFC, 2014). Under Procafecol, Juan Valdez has opened more than 274 shops in 13 countries in America, Europe and Asia (Muñiz, 2016). These stores promote and sell Juan Valdez’s coffee as well as other hot and cold beverages and food products. In 2013, Procafecol had an operating budget of US$76 million and revenues of US$2.4 million, which was a 229% increase over the previous year (IFC, 2014).
4. Nascent chain upgrading into coffee tourism. As the FNC has cultivated Colombia
and Juan Valdez’s worldwide coffee brand, it has looked to reinforce and buttress its reputation by providing tourism that showcases the industry. The FNC and Ministry of Tourism initially approached coffee farmers in the Quindío district to modify farmhouses to accommodate tourists. The outreach proved to be successful, and Quindío has positioned itself as the second-most popular tourist destination in Colombia with coffee theme parks and routes as well as UNESCO World Heritage site that explore the crop’s history in the country. Roughly 30 farms in that region have facilities that can accommodate overnight visitors (Muñiz, 2016).
4.3 Costa Rica Costa Rica was the first Central American country to cultivate coffee. With favorable geographic features and fertile, volcanic soil of low acidity, the country has become the fourth largest supplier of specialty coffee in the world, despite its small size and predominantly smallholder production model (Instituto del Cafe de Costa Rica, 2013). Instituto del Café de Costa Rica (ICAFE), the country’s trade association provides a strong example of institutional establishment to support and regulate the activities of a large number of coffee producers. Like many other Central America countries, Costa Rica has received support from multilateral and bilateral organizations to improve the quality of coffee production and establish links with foreign buyers (Fernandez-Stark et al., 2012), however, ICAFE has played a central role in driving product, process and environmental upgrading. Costa Rica’s upgrading from a commodity producer to a specialty coffee leader can be divided into three key trajectories: (1) product and process upgrading to improve quality and move into the specialty coffee segment; (2) product, process and environmental upgrading to allow entry into certified coffee and; (3) functional upgrading into marketing and denomination of origin to support of regional sales to the single-origin premium market. Each of these are examined in further detail below:
1. Product and process upgrades to improve quality and move into specialty and sustainable coffees. While it is difficult to track annual changes in global supply and country shares of specialty coffee, export data for Costa Rican coffee highlights its shift into higher-value segments of the chain, including specialty and organic coffee. Although the overall volume of the country’s coffee exports fell 44% from 2000 to 2015 (from 128 million kilograms in 2000 to 71 million kg in 2015), both the overall value and unit price of its coffee exports steadily increased during the same time period. The gains have sustained themselves in the last 10 years. From 2005 to 2015, the value of Costa Rican coffee exports increased nearly 19%, from US$300 million to US$356 million. At the same time, the unit value of
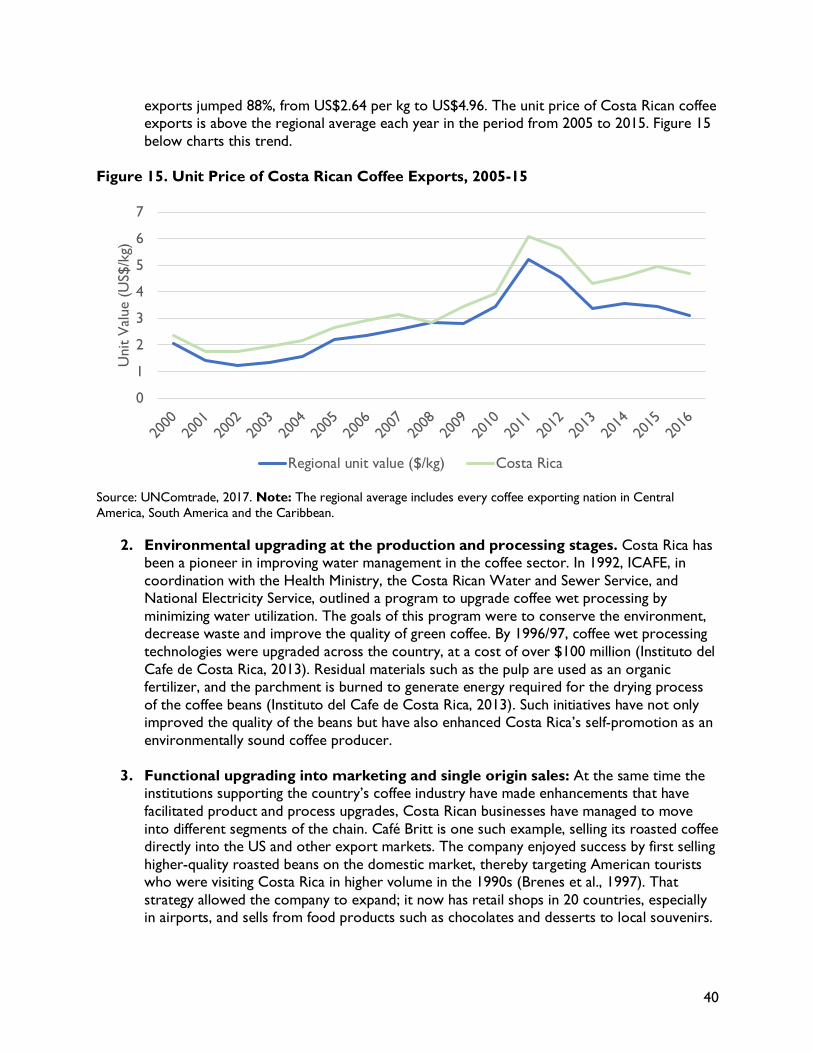
40
exports jumped 88%, from US$2.64 per kg to US$4.96. The unit price of Costa Rican coffee exports is above the regional average each year in the period from 2005 to 2015. Figure 15 below charts this trend.
Figure 15. Unit Price of Costa Rican Coffee Exports, 2005-15
Source: UNComtrade, 2017. Note: The regional average includes every coffee exporting nation in Central America, South America and the Caribbean.
2. Environmental upgrading at the production and processing stages. Costa Rica has been a pioneer in improving water management in the coffee sector. In 1992, ICAFE, in coordination with the Health Ministry, the Costa Rican Water and Sewer Service, and National Electricity Service, outlined a program to upgrade coffee wet processing by minimizing water utilization. The goals of this program were to conserve the environment, decrease waste and improve the quality of green coffee. By 1996/97, coffee wet processing technologies were upgraded across the country, at a cost of over $100 million (Instituto del Cafe de Costa Rica, 2013). Residual materials such as the pulp are used as an organic fertilizer, and the parchment is burned to generate energy required for the drying process of the coffee beans (Instituto del Cafe de Costa Rica, 2013). Such initiatives have not only improved the quality of the beans but have also enhanced Costa Rica’s self-promotion as an environmentally sound coffee producer.
3. Functional upgrading into marketing and single origin sales: At the same time the institutions supporting the country’s coffee industry have made enhancements that have facilitated product and process upgrades, Costa Rican businesses have managed to move into different segments of the chain. Café Britt is one such example, selling its roasted coffee directly into the US and other export markets. The company enjoyed success by first selling higher-quality roasted beans on the domestic market, thereby targeting American tourists who were visiting Costa Rica in higher volume in the 1990s (Brenes et al., 1997). That strategy allowed the company to expand; it now has retail shops in 20 countries, especially in airports, and sells from food products such as chocolates and desserts to local souvenirs.
0
1
2
3
4
5
6
7
2000
2001
2002
2003
2004
2005
2006
2007
2008
2009
2010
2011
2012
2013
2014
2015
2016
Uni
t V
alue
(U
S$/k
g)
Regional unit value ($/kg) Costa Rica
41
Policies and Programs Established in 1933, ICAFE represents all key industry stakeholders: farmers, processors, roasters and exporters. The organization serves a number of functions, including regulation of coffee production (for example, by permitting the cultivation of only certain varieties of coffee); disseminating information about “best practices” to all stakeholders; and monitoring, registering and verifying marketing channels (Instituto del Cafe de Costa Rica, 2013). The organization has helped support all the upgrading trajectories described above. Further details are provided below.
• Driving product and process upgrading to improve quality: Following the 2000/1 coffee crisis, ICAFE led the initiative to further improve conditions for cultivation, processing and marketing activities, opting to compete in the international coffee market through improved quality rather than expanding the quantity produced. ICAFE began the practice of retaining the 5% lowest quality coffee beans from each harvest and embarked on a set of initiatives to further differentiate Costa Rican coffee through improvements in the quality of exports (Varangis et al., 2003). Each Costa Rican coffee region signed a Quality Improvement Agreement (QIA) with ICAFE, in which the owners of the processing plants committed to accept only ripe fruits to guarantee quality (Instituto del Cafe de Costa Rica, 2013). In 2007, ICAFE hosted the first “CoE”, which helped the country to further showcase their quality coffee through internet auctions (Alliance for Coffee Excellence, 2008). Subsequent CoE competitions have since been held in the country. The organization also cooperates closely with The Specialty Coffee Association created in 1993 to promote Costa Rican Coffee in the specialty coffee market. These organizations regularly collaborate on joint initiatives with governmental programs run by the Ministry of Agriculture’s extension services. The organization also provides training on export protocols to producers so that they may export directly to consuming countries, without contracting with a third-party exporter. ICAFE also manages the Liquidation Payment System to ensure timely pay outs to producers at prices fixed in reference to the NYFOB price, plus a differential followed by a premium paid based on final sales at the end of the season. There is recognition that this system remains vulnerable to extremely low prices on the global market. The government thus is proactively engaged in protecting producers from price volatility. For example, in 1992, in response to the coffee crisis that followed the collapse of the ICA in 1989, the Costa Rican government created the National Fund for Coffee Stabilization (FONECAFE), which was allowed to accumulate debt up to $50 million to support coffee growers (Varangis et al., 2003). Through the fund, the government compensated farmers when their final price fell below the cost of production by more than 2.5% (Varangis et al., 2003). With the improvement in the coffee market, producers not only repaid the funds back to FONECAFE, but also accumulated an additional $23 million through a 2% fee assessed on the total value of coffee sales (Varangis et al., 2003). The results have been quantifiable. By providing strong leadership with respect to improving quality, ICAFE managed to contribute significantly to upgrading in the country’s coffee sector. As a result of these and other related initiatives, the number of producers gradually rose and coffee yields increased. By 2011, yields were approximately 1,000 kg/ha – second only to Brazil (ResponsAbility, 2013). Exports in specialty coffee increased from approximately 30% of production to 80% by 2011, and the country consolidated its position as one of the world’s most important producers of premium coffee.

42
• Leading environmental upgrading: ICAFE introduced initiatives to upgrade the
country’s coffee products through quality enhancements and a new focus on environmental and social sustainability. The use of agro chemicals has been minimized in order to conserve the richness of the soil and enhance the quality of green coffee, herbicides with low toxicity levels are selected by ICAFE and applied by farmers to protect coffee trees, and ICAFE helps producers to conduct soil analyses in order to identify the lowest possible level at which fertilizers can be fruitfully applied (Instituto del Cafe de Costa Rica, 2013). In 2002, ICAFE also launched a sustainable coffee seal to be awarded to coffee producers that protect plantation ecosystems, save energy, clean up waste-disposal, improve pest and disease control, provide healthy working condition for coffee pickers and reduce the use of chemicals (Institute for Agriculture and Trade Policy, 2002; Instituto del Cafe de Costa Rica, 2013). These techniques promote environmental upgrading and also allow farmers greater access to specialty coffee chains that may require organic production methods or other environmentally sustainable farming practices. In order to capture the value from these in product and environmental upgrading, ICAFE started to differentiate organic coffee by separately registering the production and sales of organic and conventionally grown coffee in 1996 (Instituto del Cafe de Costa Rica, 2013). The ability to separately register and trace organic and conventional coffees is important, as it enables the creation of separate marketing channels for each type of coffee and increased information available to clients. Importantly, ICAFE not only promotes activities within the coffee chain alone; the institute also encourages farmers to diversify their crop base in order to facilitate the realization of broader agricultural development goals and to reduce the over-dependence of coffee farmers on a single cash crop.
• Functional upgrading: ICAFE has expanded training efforts beyond the production and processing stages of the chain. In recent years, demand has grown within Costa Rica, among both tourists and middle-class urbanites, for specialty coffee, which also represents a chain upgrade as well. In order to satisfy this demand, ICAFE has helped to provide training to roasters and baristas in local specialty coffee shops. Given the large degree of value-capture enjoyed by roasters and specialty coffee shops (Daviron & Ponte, 2005), this expansion into downstream activities in the coffee value chain represents an important upgrading avenue for Costa Rica.
4.4 Lesson Learned for Jamaica Although there are important points of differentiation between Jamaica and the two countries examined in the case studies—both Colombia and Costa Rica export significantly higher volumes of Arabica beans, and both have embraced specialty markets more recently—there are significant lessons that can be learned by Jamaican stakeholders as they attempt to surmount local challenges and maintain their position as a prominent supplier in specialty markets. The most immediate of these include the following: Both nations benefited from a strong set of institutions to support the coffee industry. Colombian and Costa Rican institutions helped increase productivity as well as quality and facilitated upgrades along the value chain. This was accomplished by providing a singular strategy for the
43
industry and mobilizing all stakeholders towards a common goal. To a degree, Jamaica has similar institutions as Costa Rica and Colombia, with the CIB maintaining robust regulatory and monitoring capabilities, and the JCEA and JCGA coordinating individual interests. However, the organizational model employs more of a top-down perspective—they are driven more by major processors and are less collaborative in marketing the JBM brand than what can be seen in both Colombia and Costa Rica. Colombia’s FNC provides a particularly strong example of a farmer-led organization acting as a representative body and helping drive process upgrading. The FNC spearheads research and extension services through Cenicafé, providing farmers with access to best practices while also working with local institutions to create appropriate financial support mechanisms. One of the FNC and Cenicafé most expansive recent programs involved tree replanting and rejuvenation, an initiative that has relevance for Jamaica. It also provides a strong and massive technical assistance services to farmers with around 1,500 extension agents. Finally, the association offers a purchase guarantee program to farmers while also exporting Colombian coffee to end markets. Costa Rica’s ICAFE has supported product upgrading into specialty coffee through a variety of process upgrades. ICAFE instituted a Quality Improvement Agreement with coffee-producing regions and disseminated information about “best practices” to all stakeholders while also working with the government to create minimum floors for coffee prices through the National Fund for Coffee Stabilization Fund. This support has allowed Costa Rica to expand its capacity in sustainable, organic and single-origin product lines, the result of which has been steady gains in the export value of Costa Rican coffee exports. Beyond product and process upgrades, both the FNC and ICAFE have facilitated functional upgrading and supported chain upgrading. The FNC retains control of the Juan Valdez brand, thereby providing more farmers with more direct access to market signals communicated by foreign buyers. In more recent years, the FNC has directly sought to expand its retail presence and allow consumers to purchase Colombian coffee. It has also assisted efforts to support chain upgrading by facilitating the growth of coffee tourism in some regions of the country. ICAFE, meanwhile, targeted foreign tourists as a market for increasing demand for Costa Rican coffee by training local baristas in domestic coffee shops. This attentiveness to the Costa Rican brand has allowed companies such as Café Britt to expand their retail presence in local and regional markets.
44
5 Recommended Upgrading Trajectories for Jamaica Jamaica’s upgrading path in the Arabica coffee GVC can mimic some elements of Colombia and Costa Rica’s experience. It is worth accentuating that upgrading should not forfeit the high-quality reputation the country has cultivated; any upgrading must protect the status as a premium product. The overarching goal of these efforts is to increase both production and brand recognition, thereby providing increased economic benefits for small businesses. The most immediate upgrading trajectories that will accomplish these aims include:
1. Short-term process upgrading to improve both the productivity of Jamaican Blue Mountain coffee and expand planting of trees: Aging trees and inefficient agricultural practices are impairing production and productivity in Jamaica. This mirrors broader global trends in coffee. Significant attention to tree rejuvenation and the implementation of GAPs is necessary for the Jamaican industry to continue to thrive. For example, in East Africa, GAP training in 11 best practices led to a 42% increase in productivity on average and as much as 75% amongst high performers (TechnoServe, 2011). In Kenya, a shorter program carried out by a consortium of value chain actors, including a roaster (Tchibo), trader (ECOM), an international development agency (GIZ), the 4Cs certification association and partially funded by the World Bank, saw increases of 15% in production after just two years (GIZ, 2013). The Colombia case study outlined efforts there to boost tree plantings, leading to a quantifiable increase. For Jamaica, process upgrades should focus on tree replanting as well as training programs to help build the use of efficient farming techniques, such as pruning, among coffee producers.
2. Short-to-medium term functional upgrading to improve branding and
marketing efforts with an ultimate goal of end market diversification: Known for high quality coffee, Jamaican coffee exports are highly concentrated and end market diversification is needed for continued competitiveness. JBM coffee should be the focus since JHM faces an uncompetitive production environment. To aid in end market diversification, improved branding and marketing efforts are required. Strategies should include steps such as organizing trade missions for buyers to the Blue Mountain region, hosting of Cup of Excellence competitions and developing a “compelling story” to engage socially and environmentally conscious buyers. Compelling stories should include profiles of coffee growers in Jamaica. Colombia offers an example of this through the cultivation of the Juan Valdez brand and effective marketing campaigns centered on farmers to generate interest. Additionally, a more pronounced separation between 100% JBM coffee and blends is necessary to maintain Jamaica’s status as a high value producer.
3. Long-term functional upgrading to move into new segments of the value chain,
primarily retail operations: Once Jamaica has increased production and has sufficient supplies, it can move into new segments of the value chain with more value, including retail. Coffee Traders and Café Blue have a limited presence in retail, but there has not been a widespread country move in this direction. As seen in the example of Costa Rica, Café Brit sells roasted coffee directly to export markets and is known for its high quality. In the 1990s, it opened local shops geared towards tourists and have since expanded into 20 nations and also expanded to sell other Costa Rican products, such as chocolate. Moving to retail will help to build awareness and deepen participation in the Arabica GVC but will first
45
require increased in production of coffee beans and the development of marketing strategies for Jamaica.
4. Transversal efforts around improving the institutionalization of the industry and
investing in modern infrastructure: The above recommendations depend upon broad upgrading efforts that involve the whole industry but do not necessarily animate individual strategic aims. These efforts should encompass the following overarching components:
• Institutionalization: Jamaican coffee has a strong foundation in the CIB. However, the
board serves primarily as a regulatory body and has limited role in extension services or branding. In the absence of organized outreach to farmers, sector-wide efforts are undertaken by individual processors to limited degrees and success. Stronger coordination of all support roles, including knowledge transfer of best practices, input provisions and branding and marketing at the country level is needed to help better position the industry. Institutionalization should involve all value chain actors, including farmers, processors, and exporters as well as provide for a clear strategy for the nation. Furthermore, the government can employ a more aggressive posture in supporting the industry through offices such as JAMPRO and others.
• Infrastructure: The Blue Mountain terrain is difficult to traverse with sloping mountain
sides and frequent weather issues. As a result, many growers face difficulty moving product for processing or export. Some farms are no longer active because it is too difficult to access them on the existing roads. Significant investments to improve infrastructure in the region will help facilitate the upgrading trajectories mentioned above, particularly process upgrading by smoothing the flow of inputs. This will also help increase coffee tourism in the area by making it easier for visitors to access coffee estates.

46
6 Bibliography
Akiyama, T. (2001). Coffee market liberalization since 1990. In T. B. Akiyama, J.; Larson, D.F.; Varangis, P. (Ed.), Commodity Market Reforms: Lessons of Two Decades. Washington, D.C.: The World Bank.
Alliance for Coffee Excellence. (2008). First Cup Of Excellence® Held In Africa: Winner Awarded By President Kagame (August 31, 2008). Retrieved October 14, 2013, from http://www.allianceforcoffeeexcellence.org/en/about-us/pr-media/first-cup-excellence-held-africa-winner-awarded-pr/.
Areté. (2013). Study on Assessing the Added Value of PDO/PGI Products. Bologna, Italy: Areté Research and Consulting in Economics. pp. 1-15.
Aroma Ridge. (2017). Jamaica Blue Mountain Coffee—Clifton Mount Estate. Retrieved September 10, 2017, from http://aromaridge.com/contact-us/.
Bamber, Penny, Jack Daly and Gary Gereffi. (2017). The Philippines in the Coffee Global Value Chain. Durham, N.C.: Duke Center on Globalization, Governance and Competitiveness. Commissioned by Oxfam America. .
Bamber, Penny, Andrew Guinn and Gary Gereffi. (2013). Burundi in the Coffee Global Value Chain: Skills for Private Sector Development. Durham, NC: Duke University Center on Globalization, Governance and Competitiveness. Report Commissioned by the World Bank. . https://gvcc.duke.edu/wp-content/uploads/2014_02_28_Duke_CGGC_Burundi_CoffeeGVC.pdf.
Barjolle, Dominique, Xiomara F. Quiñones-Ruiz, Monique Bagal, and Hermann Comoé. (2017). "The Role of the State for Geographical Indications of Coffee: Case Studies from Colombia and Kenya." World Development.
Brenes, Esteban R., Isabel Bolanos, Ramon Burciaga, Marco Jimeno, and Francisco Salas. (1997). "Case Study on Cafe Britt." Journal of Business Research, 38: 23-33.
Brown, Nick. (2013). Government-Run Jamaican Estate Wallenford Divested to Private Firm for $39 Million USD. Retrieved November 1, 2017, from https://dailycoffeenews.com/2013/09/23/government-run-jamaican-estate-wallenford-divested-to-private-firm-for-39-billion-usd/.
Cafe Blue. (2017). Cafe Blue. Retrieved November 1, 2017, from http://www.jamaicacafeblue.com. CIB. (2017a). Coffee Industry Board. Retrieved October 31, 2017, from http://www.ciboj.org. ---. (2017b). Jamaica Blue Mountain Coffee. In C. I. Board (Ed.). Kingston, Jamaica: Coffee Industry Board. Collinder, Avia. (2017a). Blue Mountain Coffee Rejoins Starbucks Reserve. Jamaica Observer. Feb. 25
from http://www.jamaicaobserver.com/business/Blue-Mountain-Coffee-rejoins-Starbucks-reserve_90540.
---. (2017b). Coffee Processors Expect A New-Look Trade With Regulatory Upgrade. The Gleaner. October 25 Retrieved November 1, 2017, from http://jamaica-gleaner.com/article/business/20171025/coffee-processors-expect-new-look-trade-regulatory-upgrade.
Counter Culture. (2017). Our Reports. Retrieved September 10, 2017, from https://counterculturecoffee.com/sustainability/reports.
Daviron, Benoit and Stephano Ponte. (2005). Coffee Paradox: Global Markets, Commodity Trade & the Elusive Promise of Development (pp. 295). London: Zed Books.
DeSoucey, Michaela. (2010). "Gastronationalism: Food Traditions and Authenticity Politics in the European Union." American Sociological Review, 75(3): 432-455.
ED&F MAN-Volcafe. (2014). Insight Special: Asia Coffee Trade. Singapore: Coffee Business Services & Academy, A Volcafe Initiative. May.
Euromonitor. (2016). Coffee in 2016: From Premium to Luxury. London. FAO. (2013). Feeding the World. In Statistical Yearbook: World Food and Agriculture. Rome: Food and
Agricultural Organization. FAOSTAT. (2017). Food and Agricultural Oranization of the United Nations, Statistics Division.
47
Fernandez-Stark, Karina, Penny Bamber and Gary Gereffi. (2012). Inclusion of Small- and Medium-Sized Producers in High-Value Agro-Food Value Chains. Durham N.C.: Duke University Center on Globalization, Governance & Competitiveness for the Inter-American Development Bank Multilateral Investment Fund (IDB-MIF). http://www.cggc.duke.edu/pdfs/2012-05_DukeCGGC_InclusiveBusiness_and_HighValueAgricultureValueChains_v2.pdf.
Field Research. (2017). Jamaica Field Research. Personal communication with V. Couto, J. Daly, K. Fernandez Stark & D. Hamrick.
Fitter, Robert and Raphael Kaplinksy. (2001). "Who Gains from Product Rents as the Coffee Market Becomes More Differentiated? A Value-chain Analysis." IDS Bulletin, 32(3): 69-82.
FLO. (2012). Monitoring the Scope and Benefits of Fair Trade. Bonn, Germany: Fairtrade Labeling Organization International. pp. 106.
FNC. (2017). Colombian Coffe Growers Federation (FNC) Retrieved November 1, 2017, from https://www.federaciondecafeteros.org/particulares/en/.
French, Howard. (1992). Jamaica's Coffee Makes Japan a Jealous Lover. New York Times. December 25 Retrieved November 1, 2017, from http://www.nytimes.com/1992/12/25/world/jamaica-s-coffee-makes-japan-a-jealous-lover.html.
Giovannucci, Daniele. (2002). Colombia: Coffee Sector Study. Washington, D.C.: The World Bank. GIZ. (2013). Climate Change Adaptation and Mitigation in the Kenyan Coffee Sector. Eschborn: GIZ,
together with Tchibo, 4Cs Assocation and the World Bank Goffe, Marcus. (2017). Geographical Indications for the Protection & Promotion of Authentic Products
of Jamaica. Kingston, Jamaica: Jamaica Intellectual Property Office. http://www.jamaicatradeandinvest.org/sites/default/files/Benefits%20of%20GIs%20in%20Jamaica%20-%20JIPO.pdf.
Golding, Kirsty and Ken Peattie. (2005). "In search of a golden blend: perspectives on the marketing of fair trade coffee." Sustainable Development, 13(3): 154-165.
Grant, Norman. (2011). Interview with Senator Norman Grant (Part Two), CEO, Mavis Bank, Jamaica Blue Mountain Coffee. from http://www.bluemountaincoffeejamaica.com/index.php/videos/75-interview-with-senator-norman-grant-part-two-ceo-mavis-bank-jamaica-blue-mountain-coffee.
Humphrey, John and Hubert Schmitz. (2002). "How Does Insertion in Global Value Chains Affect Upgrading in Industrial Clusters?". Regional Studies, 36(9): 1017-1027.
ICO. (2013). Botanical Aspects. from http://www.ico.org/botanical.asp. IFC. (2014). Shortlisted for the 2014 FT/IFC Transformational Business Awards Achievement in Inclusive
Business: Procafecol S.A. Washington, D.C.: International Finance Corporation The World Bank Group. Institute for Agriculture and Trade Policy. (2002). Costa Rica has Launched a “Sustainable" Coffee Seal.
Retrieved October 13, 2013, from http://www.iatp.org/news/costa-rica-has-launched-a-sustainable-coffee-seal.
Instituto del Cafe de Costa Rica. (2013). Sustainable Coffee in Costa Rica. Retrieved October 1, 2013, from http://www.icafe.go.cr/ingles/our_coffee/best_coffee/sustainable.html.
ISIC. (2017). All about Coffee: Initial Processing. Retrieved September 10, 2017, from http://www.coffeeandhealth.org/all-about-coffee/initial-processing/.
ITC. (2009). Guide to Geogrphical Indications: Linking Products and their Origins. Geneva, Switzerland: International Trade Centre.
---. (2011). The Coffee Exporter's Guide. Geneva: International Trade Centre. Jackson, Steven. (2016). Mavis Bank Coffee Factory To Be Sold. The Gleaner. September 14 from
http://jamaica-gleaner.com/article/business/20160914/mavis-bank-coffee-factory-be-sold. Jamaica Observer. (2014). Coffee Processor Expects Tighter Profits, but Small Farmers May See Higher
Income. Jamaica Observer. May 16 from http://www.jamaicaobserver.com/business/Coffee-processor-expects-tighter-profits--but-small-farmers-may-see-higher-income_16675133.
48
Kalan, Jonathan. (2012). How Rwanda is Making a Name for Itself in 'Specialty' Coffee. Retrieved October 14, 2013, from http://www.howwemadeitinafrica.com/how-rwanda-is-making-a-name-for-itself-in-speciality-coffee/18959/
Linton, Latonya. (2016). House Passes Bill to Set Up Agricultural Commodities Regulatory Authority. Retrieved November 1, 2017, from http://jis.gov.jm/house-passes-bill-set-agricultural-commodities-regulatory-authority/.
Mighty, Mario. (2016). The Jamaican Coffee Industry: Challenges and Responses to Increasd Global Competition. In C. L. Beckford & K. Rhiney (Eds.), Globalization, Agricuulture and Food in the Caribbean (pp. 129-153). London, UK: Palgrave MacMillan UK.
Muñiz, Martínez Norberto. (2016). "Towards a Network Place Branding through Multiple Stakeholders and Based on Cultural Identities: The Case of “The Coffee Cultural Landscape” in Colombia." Journal of Place Management and Development, 9(1): 73-90.
Murray, Douglas L., Laura T. Raynolds and Peter L. Taylor. (2006). "The Future of Fair Trade Coffee: Dilemmas Facing Latin America's Small-Scale Producers." Development in Practice, 16(2): 179-192.
Myers Jr., John. (2017). Coffee Blues Brew As Japan Refuses Jamaica's Asking Price For Blue Mountain Beans. The Gleaner. October 3 Retrieved October 31, 2017, from http://jamaica-gleaner.com/article/news/20171003/coffee-blues-brew-japan-refuses-jamaicas-asking-price-blue-mountain-beans.
National Agricultural Export Development Board. (2013). Discover the Tase of Rwanda Tea and the Finest of Rwandan Coffee. Retrieved October 14, 2013, from http://www.naeb.gov.rw/index.php?option=com_content&view=article&id=214&Itemid=206
Neilson, Jeff and Felicity Shonk. (2014). "Chained to Development? Livelihoods and global value chains in the coffee-producing Toraja region of Indonesia." [Article]. Australian Geographer, 45(3): 269-288.
Nestle. (2015). Annual Review 2015. Cham & Vevey: Nestle S.A. . Panhuysen, Sjoerd and Joost Pierrot. (2014). Coffee Barometer 2014. London: Hivos, IUCN Nederland,
Oxfam, Solidaridad and WWF. Parizat, Roy, Hein Jan Van Hilten, Erin Genevieve Tressler, Michael Wheeler, Robert Waggwa Nsibirwa,
Rebecca Morahan, Josep Manel Modelo Ruiz, Jan De Smet, and David Fernando Pineda Pinto. (2015). Risk and finance in the coffee sector : a compendium of case studies related to improving risk management and access to finance in the coffee sector (English). Washington, DC: The World Bank. http://documents.worldbank.org/curated/en/742751467997014983/Risk-and-finance-in-the-coffee-sector-a-compendium-of-case-studies-related-to-improving-risk-management-and-access-to-finance-in-the-coffee-sector.
Ponte, Stefano. (2002). "The `Latte Revolution'? Regulation, Markets and Consumption in the Global Coffee Chain." 30(7): 1099–1122.
Potts, Jason, Matthew Lynch, Ann Wilkings, Gabriel Huppe, Maxine Cunningham, and Vivek Voora. (2014). The State of Sustainability Initiatives Review 2014: Standards and the Green Economy. Winnipeg, Canada and London: International Institute for Sustainable Development, International Institute for Environment and Development, Financial Alliance for Sustainable Trade, ENTWINED Research Consortium and the Sustainable Trade Initiative. https://www.iisd.org/pdf/2014/ssi_2014.pdf.
Raikes, Philip and Peter Gibbon. (2000). "'Globalisation' and African Export Crop Agriculture ". The Journal of Peasant Studies, 27(2): 50-93.
Raynolds, Laura. (2009). "Mainstreaming Fair Trade Coffee: From Partnership to Traceability." World Development, 37(6): 1083–1093.
ResponsAbility. (2013). Research Insight: Fair Trade Coffee From Costa Rica: A Smallholder Success Story: Zurich responsAbility Social Investments.
Ribeiro, F.C., F.M Borem, G.S. Giomo, R.R De Lima, M Malta, and L. Figuerido. (2011). "Storage of Green Coffee in Hermetic Pacakaging Injected with CO2." Journal of Stored Products Research, 47(4): 341-348.
49
Rueda, Ximena and Eric F. Lambin. (2013). "Linking Globalization to Local Land Uses: How Eco-consumers and Gourmands are Changing the Colombian Coffee Landscapes." World Development, 41(January): 286-301.
SCAA. (2015a). SCAA Protocols: Cupping Speciality Coffee. Retrieved September 10, 2017, from http://www.scaa.org/PDF/resources/cupping-protocols.pdf.
---. (2015b). U.S. Specialty Coffee Fact & Figures. Retrieved September 10, 2017, from http://www.scaa.org/?page=resources&d=facts-and-figures.
Starbucks. (2015). Fiscal 2015 Annual Report. Seattle: Starbucks. ---. (2016). Ethical Sourcing: Coffee. Retrieved November 10, 2017, from
https://www.starbucks.com/responsibility/sourcing/coffee. ---. (2017). Supplier Guidance Global Requirements Version 2.6. Seattle, WA: Starbucks.
https://www.starbucks.com/business/suppliers. Sukha, Darin A. (2015). Geographical Indications - Opportunities and Limitations. San Salvador, El
Salvador: World Cocoa Foundation. http://www.worldcocoafoundation.org/wp-content/uploads/files_mf/14424402961.D.Sukha.pdf.
Tastes of Europe. (2015). Tastes of Europe: Q&A. Retrieved July 21, 2017, from http://tastesofeurope.eu/qa/.
TCC. (2012). Coffee Barometer. The Hague: Tropical Commodities Coalition. http://www.newforesight.com/sites/default/files/newforesight/TCC_CoffeeBarometer2012.pdf.
TechnoServe. (2011). The Coffee Initiative: Phase One Final Report: Technoserve. UCC. (2017). Coffee Estates. Retrieved November 29, 2017, from
http://www.ucc.co.jp/eng/company/about/estates. Ueshima, Tatsushi. (2017). Coffee Attracts Global Fans. The Japan Times. August 6 UNComtrade. (2017). World Coffee Imports by All Reporters and Partners, 2005-2016 (based on HS-
2002), Retrieved August 30, 2017 from UNComtrade. New York: United Nations Statistics Division (UNSD).
USAID. (2010). A Regional Strategy for the Speciality Coffee Value Chain in Eastern Africa: A Practical Approach to Driving Greatr Value Capture in the Region.
USDA. (2017). Production, Supply and Distribution Online. In F. A. S. United States Department of Agriculture (Ed.). Washington, D.C. .
Varangis, Panos, Paul Siegel, Daniele Giovannucci, and Bryan Lewin. (2003). "Dealing with the Coffee Crisis in Central America Impacts and Strategies.".
Wilson, Adam and Nobert Wilson. (2013). "The Economics of Quality in the Specialty Coffee Industry: Insights from the Cup of Excellence Auction Programs". Paper presented at the Agriculture and Applied Economics Association & CAES Join Annual Meeting. Washington, D.C., from http://ageconsearch.umn.edu/bitstream/150721/2/The%20Economics%20of%20Quality%20in%20the%20Specialty%20Coffee%20Industry_AAEA%202013.pdf. August 4-6.
WIPO. (2015). Geographic Indications. Retrieved June 28, 2016, from http://www.wipo.int/geo_indications/en/.
---. (2017). In Search of a Perfect Cup. Retrieved November 1, 2017, from http://www.wipo.int/ipadvantage/en/details.jsp?id=2612.
World Bank. (2016). World Bank Commodity Price Data (The Pink Sheet) Washington, D.C.: The World Bank. September 27.