2018The company, placed in voluntary liquidation on 9 January 2017, completed the liquidation...
196
Dexia Crediop ANNUAL REPORT DEXIA CREDIOP 2018
Transcript of 2018The company, placed in voluntary liquidation on 9 January 2017, completed the liquidation...

2018R E L A Z I O N E E B I L A N C I O
D E X I A C R E D I O P
Dexia CrediopDexia Crediop
Dexia2018_CrediopIT_SansDos.indd 4 04/01/2019 15:15
A N N U A L R E P O R TD E X I A C R E D I O P
2018R E L A Z I O N E E B I L A N C I O
D E X I A C R E D I O P
Dexia CrediopDexia Crediop
Dexia2018_CrediopIT_SansDos.indd 4 04/01/2019 15:15

CONTENTS

4 Report on operations
4 Profile of Dexia Crediop 4 Profile of Dexia Crediop and the Dexia Group 5 Subsidiaries, investees and shareholding structure of Dexia Crediop 7 Rating 8 Organisation 11 Company information 12 Internal risk management and control system, pursuant to art. 123-bis, clause 2, letter b) of the Consolidated Finance Act
13 Economic and financial results 14 Reclassified Balance Sheet 15 Reclassified Income Statement 16 Economic and financial results 19 Performance indicators
22 Report on operations 22 Public Finance, Corporate and Project Finance activities 23 Funding and activity on the markets 24 Audit area activities 32 Human Resources 33 Main Support Activities and Projects
34 Relations with subsidiaries and Dexia Group companies
35 Business outlook 35 Significant post-balance sheet events 35 Future operational prospects Dexia Group Dexia Crediop
40 Proposed allocation of net results
41 Report by the Board of Statutory Auditors
45 Independent Auditors’ Report
51 Certification of the annual report pursuant to article 154-bis of Legislative Decree 58/98 and art. 81-ter of Consob Regulation no. 11971 of 14 May 1999 and successive amendments and additions
53 Corporate financial statements
Dexia Crediop S.p.A.4
Profile of Dexia Crediop
Profile of Dexia Crediop and the Dexia Group
Profile of Dexia Crediop
Dexia Crediop is a bank in run-off, previously specialising in public sector and infrastructure loans. The bank is 70% controlled by Dexia Crédit Local, which is part of the Dexia Group, and is also an investee of BPM S.p.A., which holds a 20% share, and of BPER Banca S.p.A., with a 10% share.
* * *
On 28 December 2012, the European Commission approved the orderly resolution plan for the Dexia Group, submitted by the Belgian, French and Luxembourg states. This plan involves management in run-off without new assets for the entities of the group which, as of 15 July 2014, has also included Dexia Crediop.
Therefore, the bank has reorganised its structure in line with the change in the company mission, adjusting the size of the organisational units to the tasks assigned to them and pursuing the objectives of simplification, synergy and developing the flexibility and versatility of personnel.
The rationalisation process undertaken has continued, as further adjustments are made to the organisational structure, in line with the bank’s mission.
In view of the above, Dexia Crediop remains within the scope of consolidation of the Dexia Group and continues to be an integral part of the orderly resolution plan, in line with Dexia’s mandate and objectives, and to benefit from the financial support of the parent company.
Profile of the Dexia Group
Dexia is a European banking group, managed under an orderly resolution plan since 2011, 99.6% controlled by the Belgian and French governments.
The orderly resolution plan for Dexia, approved by the European Commission in December 2012, aims to avoid the bankruptcy and liquidation of the Group which due to its residual size, could have destabilising effects on the entire European banking sector.
Report on operations

5Report on operations
Taking into account its significance1, as of 4 November 2014 Dexia passed under the direct supervision of the European Central Bank under the framework of the Single Supervisory Mechanism. The parent company Dexia is a financial joint stock company operating under Belgian law with shares listed in the Euronext market in Brussels.
The Dexia Group has 773 employees as of 31 December 2018. Dexia Crédit Local is the main operating entity and benefits from funding guarantees up to a maximum of € 85 billion, ensured by the governments of Belgium, France and Luxembourg, to allow for completion of the orderly resolution plan. Dexia Crédit Local has its headquarters in France, where it holds a banking license, with branches in Ireland, the United States and Spain2 and subsidiaries in Germany3 and Italy. These organisations also have banking licenses.
Dexia no longer does any commercial business and its activities are focussed solely on the management of its assets in run-off, mainly in the public sector and sovereign loans, while simultaneously protecting the interests of the shareholder countries and guarantors. To achieve these objectives, the Group has established three main goals:• to maintain the capacity to refinance its assets for the entirety of the resolution plan;• to preserve its Tier 1 capital, so as to comply with the capital ratios;• to guarantee operational continuity, maintaining the necessary skills and resources and developing
appropriate IT tools.
Subsidiaries, investees and shareholding structure of Dexia Crediop
At 31 December 2018, after the completion of the voluntary liquidation of the subsidiary Dexia Crediop Ireland Ulc, Dexia Crediop no longer has any equity investments in subsidiaries. Dexia Crediop Ireland Ulc in voluntary liquidationThe company, placed in voluntary liquidation on 9 January 2017, completed the liquidation process in August 2018 and presented a request to be removed from the Irish business register (the planned resolution date is 14 April 2019).
Shareholders of Dexia CrediopThere have been no changes in the shareholder body since 31 December 2017.
Dexia Crediop share capital is fully underwritten and paid up and amounts to € 450,210,000 consisting of 174,500,000 ordinary shares, each with a nominal value of € 2.58. On the date this report was approved, they were held as follows:• Dexia Crédit Local: 122,150,000 ordinary shares, representing 70% of the share capital, totalling
€ 315,147,000;• Banco BPM S.p.A.: 34,900,000 ordinary shares, representing 20% of the share capital, totalling
€ 90,042,000;• BPER Banca S.p.A.: 17,450,000 ordinary shares, representing 10% of the share capital, totalling
€ 45,021,000.
1 Regulation EU no. 468/2014 of the European Central Bank of 16 April 2014. 2 The Dexia Crédit Local branch in Madrid is planned to close 29 March 2019.3 On 14 December 2018, Dexia and the German banking group Helaba signed an agreement to sell Dexia Kommunalbank Deutschland, a subsidiary of Dexia
Crédit Local.
Dexia Crediop S.p.A.6
Dexia Crediop does not own any of its treasury shares or shares in the parent company, nor has it owned any such shares during the year.
Equity investments
Istituto per il Credito Sportivo (“ICS”), established under Italian Law 1295 of 24 December 1957 as a public sector bank pursuant to article 151 of the Consolidated Law on Banking. Technically, it is a “public law entity with autonomous management”. On 17 June 2011, ICS was made subject to a receivership ordered with a Prime Ministerial decree, in agreement with the Italian Ministry for Cultural Heritage and Assets and with the Italian Ministry of Economy and Finance, and subsequently, with effect from 1 January 2012, to the receivership procedure under the terms of article 70, paragraph 1, letter a) of the Consolidated Law on Banking, on the proposal of the Bank of Italy. Extraordinary administration ended on 28 February 2018, and as of 1 March 2018 the new company bodies took office.
Based on the economic results achieved during extraordinary administration period (01.01.2012–28.02.2018), at the end of 2018, the ICS paid dividends totalling 47.6 million, of which 1.48 million to Dexia Crediop (based on the investment stake in the equity established by the ICS Bylaws issued in 2014 and subject to administrative appeal by Dexia Crediop and the other private shareholders of ICS).
A complex series of lawsuits began in 2011 between ICS and the watchdog ministries, on the one hand, and Dexia Crediop and other private shareholders of ICS, on the other. For information on the relative administrative and civil proceedings, see the paragraph “Administrative, judicial, and arbitration procedures”, in this document.

7Report on operations
Rating
The rating situation for Dexia Crediop at 31 December 2018 is summarised in the table below:
Standard & Poor’s - m/l termine BBB
Standard & Poor’s - breve termine A-2
Dexia Crediop S.p.A.8
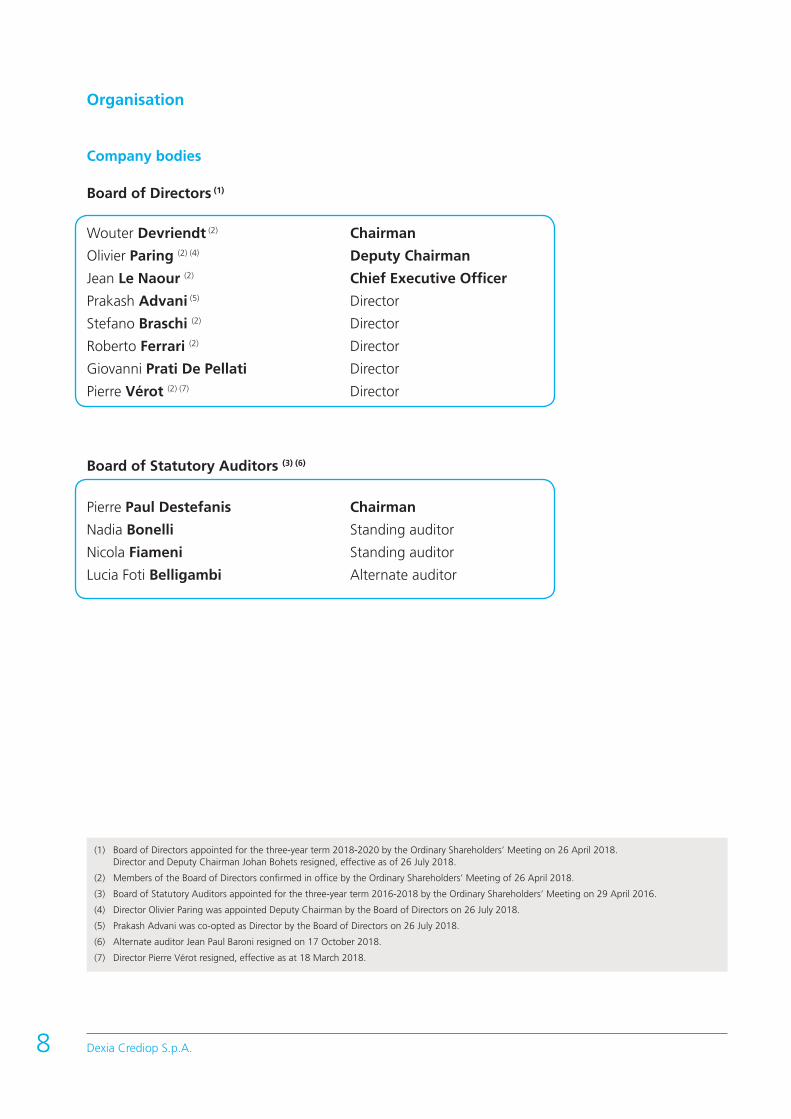
Organisation
Company bodies
Board of Directors (1)
Wouter Devriendt (2) Chairman
Olivier Paring (2) (4) Deputy Chairman
Jean Le Naour (2) Chief Executive Officer
Prakash Advani (5) Director
Stefano Braschi (2) Director
Roberto Ferrari (2) Director
Giovanni Prati De Pellati Director
Pierre Vérot (2) (7) Director
Board of Statutory Auditors (3) (6)
Pierre Paul Destefanis Chairman
Nadia Bonelli Standing auditor
Nicola Fiameni Standing auditor
Lucia Foti Belligambi Alternate auditor
(1) Board of Directors appointed for the three-year term 2018-2020 by the Ordinary Shareholders’ Meeting on 26 April 2018. Director and Deputy Chairman Johan Bohets resigned, effective as of 26 July 2018.
(2) Members of the Board of Directors confirmed in office by the Ordinary Shareholders’ Meeting of 26 April 2018.
(3) Board of Statutory Auditors appointed for the three-year term 2016-2018 by the Ordinary Shareholders’ Meeting on 29 April 2016.
(4) Director Olivier Paring was appointed Deputy Chairman by the Board of Directors on 26 July 2018.
(5) Prakash Advani was co-opted as Director by the Board of Directors on 26 July 2018.
(6) Alternate auditor Jean Paul Baroni resigned on 17 October 2018.
(7) Director Pierre Vérot resigned, effective as at 18 March 2018.

9Report on operations
Other company bodies
Management Committee
Jean Le Naour (as Chairman)
Edoardo Baratella
Samir Belarbi
Emmanuel Campana
Claudia Pieroni
Daniela Pozzali
Pasquale Tedesco
Stefano Vicari
Financial Reporting Manager
Emmanuel Campana

Dexia Crediop S.p.A.10
Internal Organisation (1)
Chief Executive Officer Jean Le Naour (2)
Assets Samir Belarbi (2)
CLM & Market Execution Claudia Pieroni (2)
Finance & Operations Emmanuel Campana (2)
IT & Supplying Pasquale Tedesco (2)
Risk Stefano Vicari (2)
Human Resources Daniela Pozzali (2)
General and Legal Secretariat Edoardo Baratella (2)
Units of the Chief Executive Officer’s Staff
Compliance & Anti-Money Laundering Daniele Albarin
Units which report to the Board of Directors
Internal Audit Giuseppe Nusiner
(1) At the time this document was drafted.(2) Members of the Management Committee.

11Report on operations
Company information
Dexia Crediop S.p.A.Via Flavia, 15 - 00187 RomaTel. + 39 06 4771.1 Fax + 39 06 4771.5952Website: www.dexia-crediop.itCertified e-mail: [email protected]
Share capital € 450,210,000 fully paid upRome Register of Companies no. 04945821009Register of banks no. 5288Member of the Interbank Deposit Protection Fund and the National Guarantee FundCompany subject to management and coordination by Dexia Crédit Local
Auditing firmMazars Italia S.p.A.

Dexia Crediop S.p.A.12
Internal risk management and control system, pursuant to art. 123-bis, clause 2, letter b) of the Consolidated Finance Act
Dexia Crediop has an internal risk management and control system which is able to continuously supervise the typical business risks to which it is exposed. This system involves the Financial Reporting Manager, the Company bodies, the independent auditing firm and the internal audit departments as established by the Corporate Governance Model, introduced in June 2009, following a specific resolution of the Board of Directors and regularly updated. With regard to financial reporting in particular, the administrative-accounting control system introduced by the Financial Reporting Manager is based on the control framework prepared by the Committee of Sponsoring Organizations (the CoSO Report), which is the most widespread international standard of reference for internal auditing and financial reporting. The system can be divided into the following components:
1) definition of the corporate perimeter and of the administrative-accounting processes relevant for financial reporting (known as Scoping);
2) assessment of the adequacy of the relevant processes and effective implementation of the controls which mitigate risks linked to accounting and financial reporting, and definition and monitoring of risk mitigation measures (Risk & Control Analysis and Test of Effectiveness - ToE);
3) evaluation of the adequacy and effectiveness of the administrative-accounting processes (Evaluation).
The administrative-accounting model is in line with the provisions of Italian Law 262 of 2005 and its subsequent amendments and additions made due to the European Transparency Directive (Italian Legislative Decree No. 195 of 6 November 2007).
All analyses and evaluations have been carried out by the Financial Reporting Manager in accordance with this model and confirm the adequacy and effective application of Dexia Crediop’s administrative-accounting procedures.

13Report on operations
Economic and financial results
To provide a better understanding of the results of the period, condensed versions of the Income Statement and Balance Sheet have been prepared, making the necessary reclassifications to the models provided in Bank of Italy Circular 262/2005.
The reclassifications are as follows:
Balance Sheet• the item “Cash and cash equivalents” has been included under other assets;• the item “Hedging derivatives” has been included under other assets/liabilities;• the item “Fair value change of financial assets in hedged portfolios” has been included among other
assets;• tangible and intangible assets have been aggregated into a single item;• the provisions for Employee termination indemnities and provisions for risks and charges have been
aggregated into a single item;• the item “Fair value change of financial liabilities in hedged portfolios” has been included among
other liabilities;• the “Reserves and valuation reserves” have been aggregated into a single item.
Income Statement• the item “Fair value adjustment in hedge accounting” has been included under net interest income,
in relation to the close correlation between hedging derivatives and the instruments hedged;• inclusion of the item “Profit/loss from contractual changes without derecognition” among net interest;• aggregation into a single item of the “Net trading gains (losses)”, “Gains (losses) on disposal or
repurchase” and “Gains (losses) on other financial assets and liabilities measured at fair value through profit and loss”;
• “Net adjustments on property plan and equipment” and “Net adjustments on intangible assets” have been aggregated into a single item.
Below we provide the reclassified Income Statement and Balance Sheet schedules and the relative reconciliation of the items called for in the stated Circular 262/2005 of the Bank of Italy.
For the balance sheet format, the data as at 31 December 2018 are compared with those of the last annual financial statements, determined pursuant to IAS 39 but restated in the new financial statement items to reflect the classification provided for in IFRS 9 (for reconciliation between the items, see that found in Part A - Accounting Policies in the Notes, The new IFRS 9 Financial Instruments accounting standard) and with 2018 opening figures determined after application of IFRS 9; for the Income statement, the comparison is with the figures for the corresponding period of the previous year, after applying IAS 39, and therefore not fully comparable.

Dexia Crediop S.p.A.14
Reclassified Balance Sheet euro millions
Reclassified Balance Sheet Assets 31/12/2018IFRS 9
01/01/2018IFRS 9
31/12/2017IFRS 39
Chan.%
Financial assets measured at fair value through profit and loss
20. Financial assets measured at fair value through profit and loss 1,407.0 2,039.1 2,114.3 -31%
a) financial assets held for trading 1,071.9 1,305.6 1,305.6 -18%
c) other financial assets mandatorily measured at fair value through profit and loss 335.1 733.5 808.7 -54%
Financial assets measured at fair value through comprehensive income
30. Financial assets measured at fair value through other comprehensive income 28.0 26.0 26.0 8%
Financial assets measured at amortised cost
40. Financial assets measured at amortised cost 16,618.2 18,131.9 18,085.3 -8%
a) due from banks 3,032.3 3,345.9 3,348.0 -9%
b) due from customers 13,585.9 14,786.0 14,737.3 -8%
Equity investments 70. Equity investments - - - -
Tangible and intangible assets
80. Property plant and equipment 0.4 0.8 0.8 -50%
90. Intangible assets 2.4 2.8 2.8 -14%
Tax assets 130. Tax assets 19.8 18.7 18.7 6%
Other asset items
10. Cash and cash equivalents - - - -
50. Hedging derivatives 141.4 222.7 222.7 -37%
60. Fair value change of financial assets in hedged portfolios (+/-) 1.9 2.7 2.7 -30%
120. Other assets 61.2 57.7 57.7 6%
Total assets 18,280.3 20,502.4 20,531.0 -11%
euro millions
Reclassified Balance Sheet Liabilities and shareholders’ equity 31/12/2018IFRS 9
01/01/2018IFRS 9
31/12/2017IFRS 39
Chan.%
Financial liabilities measured at amortised cost
10. Financial liabilities measured at amortised cost 13,912.7 15,569.2 15,569.3 -11%
a) due to banks 10,517.8 10,285.0 10,285.1 2%
b) due to customers 452.7 4,611.1 4,611.1 -90%
c) securities in issue 2,942.2 673.1 673.1 337%
Financial liabilities held fortrading 20. Financial liabilities held for trading 1,176.9 1,493.4 1,493.4 -21%
Tax liabilities 60. Tax liabilities 0.0 0.0 0.0 -
Other liabilities items40. Hedging derivatives 2,309.8 2,466.9 2,466.9 -6%
80. Other liabilities 12.8 29.9 29.9 -57%
Provisions90. Employee termination indemnities 1.1 1.5 1.5 -27%
100. Provisions for risks and charges 40.2 36.8 28.0 9%
Reserves110. Valuation reserves 4.2 4.3 (28.9) -2%
140. Reserves 450.2 448.2 518.7 0%
Share capital 160. Share capital 450.2 450.2 450.2 0%
Profit (Loss) for the period 180. Profit (Loss) for the period (+/-) (77.8) 2.0 2.0 -
Total liabilities and shareholders’ equity 18,280.3 20,502.4 20,531.0 -11%

15Report on operations
Reclassified Income Statement euro millions
Reclassified Income Statement Income Statement 31/12/2018IFRS 9
31/12/2017IAS 39
Chan.%
Net interest
30.4 52.0 -42%
10. Interest and similar income 85.2 86.8 -2%
20. Interest and similar expenses (61.3) (49.5) 24%
90. Risultato netto dell'attività di copertura 6.3 14.7 -57%
140. Profit/losses from contractual changes without derecognition 0.2 0.0 -
Dividend 70. Dividends and similar income 2.8 0.0 -
Net fee and commission income
(46.7) (37.7) 24%
40. Fee and commission income 3.6 4.3 -16%
50. Fee and commission expense (50.3) (42.0) 20%
Net trading gains (losses)
(35.8) 21.8 -264%
80. Net trading gains (losses) 0.2 22.3
100. Gains (losses) on disposal or repurchase 1.4 (0.5)
110. Gains (losses) on other financial assets and liabilities measured at fair value through profit and loss
(37.4) 0.0
Net interest and other banking income (49.3) 36.1 -
Net adjustment for impairment 130. Net adjustment for credit risk 6.0 (10.0) -
Net income from financial activities (43.3) 26.1 -
Administrative expenses 160. Administrative expenses (28.4) (30.2) -6%
Net provisions 170. Net provisions for risks and charges (6.1) (1.0) 510%
Amortization on assets
180. Net adjustments on property plant and equipment (0.2) (0.3) -33%
190. Net adjustments on intangible assets (1.7) (1.4) 21%
Other operating expenses/income 200. Other operating expenses/income 1.0 4.5 -78%
Operating costs (35.4) (28.4) 25%
Profit (Losses) on disposal ofinvestments 250. Profit (Losses) on disposal of investments 0.7 2.0 -65%
Profit (loss) from continuing operations before tax (78.0) (0.3) -
Income tax Taxes on income from continuing operatioons 0.2 2.3 -91%
Profit (Loss) from continuing operations after tax (77.8) 2.0 -
300. Net income (loss) (77.8) 2.0 -

Dexia Crediop S.p.A.16
Economic and financial results
Changes to key income statement itemsThe income statement for Dexia Crediop S.p.A. for 2018 shows net interest income, also including the fair value adjustments in hedge accounting and profits/losses from contractual changes without derecognition equal to +30.4 million. Said net interest income consists of interest income and expense and similar income and expense at +23.9 million, down with respect to the previous year by -13.4 million. This is mainly due to amortisation of the stock of assets and a decrease in the contribution of own funds due to a drop in volumes and the average investment rate. The item fair value adjustment in hedge accounting amounts to +6.3 million, a decrease of 8.4 million with respect to 2017, following the change in the ineffectiveness of hedges, above all due to a decrease in the Euribor spread versus OIS. Finally, the result of contractual changes without derecognition is equal to +0.2 million, following renegotiation of an operation with a local entity.
Net fee and commission income amounted to -46.7 million, a decrease of -9.0 million on the previous year. The drop is mainly due to the increase in the amount and cost of the liquidity lines received from the parent company Dexia Crédit Local which accounted for -48.1 million in 2018, compared to -38.7 million in 2017. Other net fee and commission income amounted to +1.4 million, up by +0.4 million with respect to the previous year, mainly due to a reduction in fees paid on guarantees received.
During the period, dividends totalling 2.8 million were received (none in 2017) relative to the final distribution after completion of the voluntary liquidation of the subsidiary Dexia Crediop Ireland Ulc (1.4 million) and 1.5 million from the Istituto per il Credito Sportivo relative to the economic results achieved during the extraordinary administration period (01.01.2012–28.02.2018).
Net trading gains (losses) amount to -35.8 million (-57.6 million with respect to 2017), and are mainly due to:• 0.2 million for net trading gains, compared to 22.3 million the previous year. This item was positively
influenced by the overall result of the measurement and trading of derivatives classified as economic hedges based on the new IFRS 9 (10.1 million), also in relation to renegotiation of operations classified as assets measured at fair value through profit and loss, covered by the same derivatives, which led to reclassification among assets measured at amortised cost. The overall result of trading derivatives was instead -10.6 million, due for 10.9 million because of trading gains and margins and -21.5 million for the measurement of derivatives, mainly influenced by Credit Value Adjustment (CVA) and Funding Value Adjustment (FVA) components, essentially based on an increase in the measurement spreads during the year. Additionally, the amendment of a credit support annex led to revenues of 0.8 million;
• 1.4 million from gains/losses on disposal or repurchase (-0.5 million in 2017) deriving for 1 million from the early redemption of a callable security issued by the bank and for the rest from indemnities on early redemption of assets;
• -37.4 million as the net result on other financial assets and liabilities measured at fair value through profit and loss, an item introduced by the new IFRS 9, which essentially includes the fair value change in loans classified in this category. The result was negatively influenced by the increase in credit spreads occurring during the second half of 2018 and redemptions during the period. It was positively affected by the increase in the value of certain loans, subject to renegotiation, which led to their reclassification among assets measured at amortised cost.
Net interest and other banking income amounted to -49.3 million, down by -85.4 million with respect to 2017.
The amount of net adjustments for credit risk was equal to +6.0 million (compared to -10.0 million in 2017), mainly due to writebacks following early redemptions or the sale of assets, as well as changes in the quality of certain assets which required, based on the rules established in IFRS 9, an adjustment in writedowns.

17Report on operations
Net income from financial activities therefore amounted to -43.3 million, a decrease of -69.4 million with respect to the +26.1 million of 2017.
Administrative expenses totalled -28.4 million, down by 1.8 million (-6%) over 2017. Net of contributions to the Single Resolution Fund and the National Resolution Fund (8.3 million in 2018, compared to 7.2 million in 2017), administrative expenses amounted to -20.1 million, a 13% decrease over 2017, when the amount was 23.0 million. This reduction can be attributed to personnel expenses, which totalled -12.4 million in 2018, compared to -13.4 million in 2017, mainly due to the decrease in the number of employees. Other administrative expenses, net of contributions to Resolution Funds, amounted to -7.7 million and fell by around 1.9 million when compared to the -9.6 million seen the previous year. This was mainly due to the change in the tool used to measure derivatives which generated costs in 2017 and savings in 2018, as well as the reduction in other administrative expenses (costs for properties, IT, and finance database).
Net allocations made to provisions for risks and charges came to -6.1 million (-1.0 million in 2017) and mainly regard positions relative to public entities and the Istituto per il Credito Sportivo.
Amortisation and depreciation, at -1.9 million, rose by 0.2 million with respect to the 1.7 million registered the previous year.
Other operating expense/income, equal to around +1 million, compared to the +4.5 million in 2017, essentially refers to the repayment of legal expenses, already suffered by Dexia Crediop in the context of disputes with local and regional entities regarding derivatives.
In 2018, profit on disposal of investments came to +0.7 million, following the sale of a real estate asset.
The result of continuing operations before tax was -78.0 million compared to -0.3 million in 2017.
Taxes were positive at +0.2 million (+2.3 million in 2017), reflecting the recognition of advance taxes on previous loan write-downs pursuant to Article 106, paragraph 3 of the Consolidated Law on Income Tax (TUIR). These advance taxes were converted to tax credits during the same year.
The net result for the period was therefore -77.8 million, compared to +2.0 million the previous year.
Changes to the main balance sheet items
Total assets in the balance sheet amounted to 18.3 billion at the end of 2018, down by 11% with respect to the opening figures at 1 January 2018, determined in application of accounting standard IFRS 9.
In particular, the item Financial assets measured at fair value through profit and loss was equal to 1.4 billion (compared to 2.0 billion at the start of 2018). This decrease was due to the change in other assets measured at fair value, consisting of loans, which fell during the period by around 0.4 billion due to, above all, the renegotiation of certain positions that led to their reclassification among financial assets measured at amortised cost and, secondarily, to an overall decrease in fair value.
The value of trading derivatives fell by 0.2 billion, in part due to early redemption of certain derivatives held with customers and a decrease in the portfolio. The amount is balanced out by a similar change in the item “financial liabilities held for trading”. It should be recalled that these derivatives are, in fact, measured at fair value and considered financial assets if their fair value is positive, and as financial liabilities if their fair value is negative.
The item “financial assets measured at fair value through other comprehensive income” includes the value of equity securities held by the bank (essentially, the equity held in the Istituto per il Credito Sportivo).
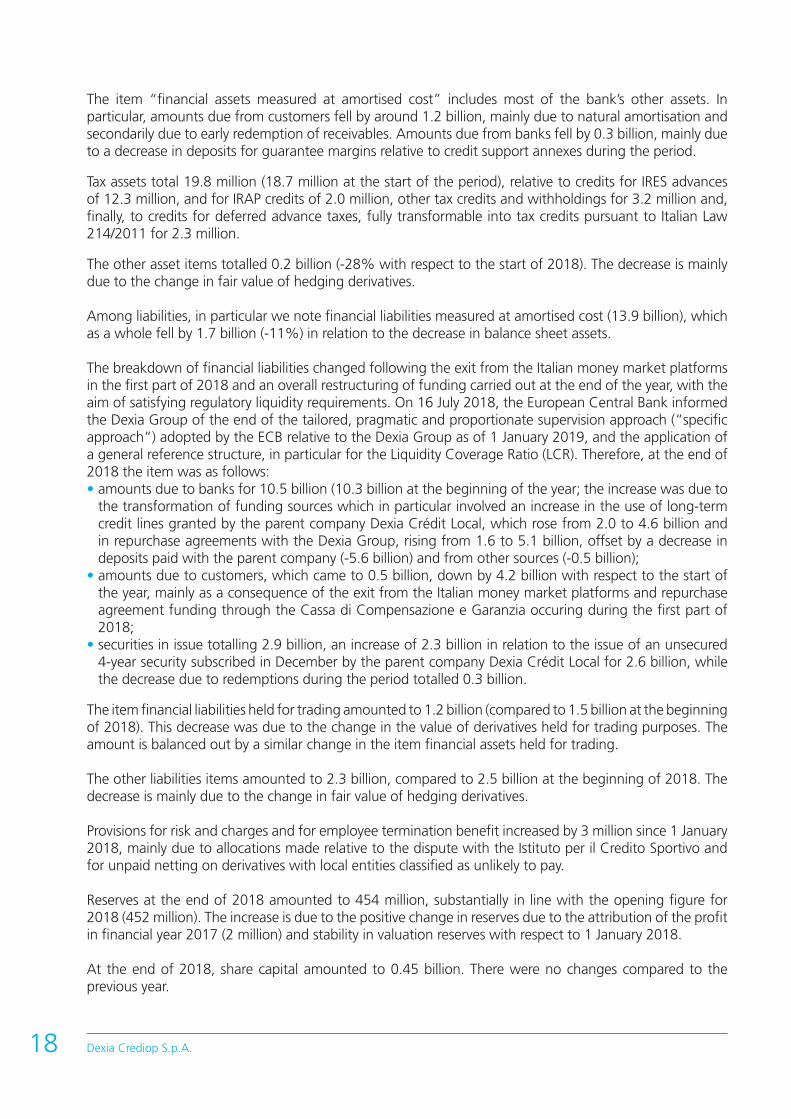
The item “financial assets measured at amortised cost” includes most of the bank’s other assets. In particular, amounts due from customers fell by around 1.2 billion, mainly due to natural amortisation and secondarily due to early redemption of receivables. Amounts due from banks fell by 0.3 billion, mainly due to a decrease in deposits for guarantee margins relative to credit support annexes during the period.
Tax assets total 19.8 million (18.7 million at the start of the period), relative to credits for IRES advances of 12.3 million, and for IRAP credits of 2.0 million, other tax credits and withholdings for 3.2 million and, finally, to credits for deferred advance taxes, fully transformable into tax credits pursuant to Italian Law 214/2011 for 2.3 million.
The other asset items totalled 0.2 billion (-28% with respect to the start of 2018). The decrease is mainly due to the change in fair value of hedging derivatives.
Among liabilities, in particular we note financial liabilities measured at amortised cost (13.9 billion), which as a whole fell by 1.7 billion (-11%) in relation to the decrease in balance sheet assets.
The breakdown of financial liabilities changed following the exit from the Italian money market platforms in the first part of 2018 and an overall restructuring of funding carried out at the end of the year, with the aim of satisfying regulatory liquidity requirements. On 16 July 2018, the European Central Bank informed the Dexia Group of the end of the tailored, pragmatic and proportionate supervision approach (“specific approach”) adopted by the ECB relative to the Dexia Group as of 1 January 2019, and the application of a general reference structure, in particular for the Liquidity Coverage Ratio (LCR). Therefore, at the end of 2018 the item was as follows:• amounts due to banks for 10.5 billion (10.3 billion at the beginning of the year; the increase was due to
the transformation of funding sources which in particular involved an increase in the use of long-term credit lines granted by the parent company Dexia Crédit Local, which rose from 2.0 to 4.6 billion and in repurchase agreements with the Dexia Group, rising from 1.6 to 5.1 billion, offset by a decrease in deposits paid with the parent company (-5.6 billion) and from other sources (-0.5 billion);
• amounts due to customers, which came to 0.5 billion, down by 4.2 billion with respect to the start of the year, mainly as a consequence of the exit from the Italian money market platforms and repurchase agreement funding through the Cassa di Compensazione e Garanzia occuring during the first part of 2018;
• securities in issue totalling 2.9 billion, an increase of 2.3 billion in relation to the issue of an unsecured 4-year security subscribed in December by the parent company Dexia Crédit Local for 2.6 billion, while the decrease due to redemptions during the period totalled 0.3 billion.
The item financial liabilities held for trading amounted to 1.2 billion (compared to 1.5 billion at the beginning of 2018). This decrease was due to the change in the value of derivatives held for trading purposes. The amount is balanced out by a similar change in the item financial assets held for trading.
The other liabilities items amounted to 2.3 billion, compared to 2.5 billion at the beginning of 2018. The decrease is mainly due to the change in fair value of hedging derivatives.
Provisions for risk and charges and for employee termination benefit increased by 3 million since 1 January 2018, mainly due to allocations made relative to the dispute with the Istituto per il Credito Sportivo and for unpaid netting on derivatives with local entities classified as unlikely to pay.
Reserves at the end of 2018 amounted to 454 million, substantially in line with the opening figure for 2018 (452 million). The increase is due to the positive change in reserves due to the attribution of the profit in financial year 2017 (2 million) and stability in valuation reserves with respect to 1 January 2018.
At the end of 2018, share capital amounted to 0.45 billion. There were no changes compared to the previous year.
Dexia Crediop S.p.A.18

19
LoansAt the end of 2018, amounts due from customers and banks totalled 75% and 17% of total loans with respect to the start of the year (in all the various technical forms).
Figures stated in millions of Euro.
Structure of lending A breakdown of loans by counterparty (in all the various technical forms) shows that most were made public administrations (72.4%).
Performance indicators
19Report on operations
01/01/2018
2018
Financial assets measured at amortised cost – due from customers
Financial assets measured at amortised cost – due from banks
Financial assets measured at fair value through other comprehensive income
Financial assets measured at fair value through profit and loss - other financial assets mandatorily measured at fair value through profit and loss
Financial assets measured at fair value through profit and loss – held for trading
Central banks
Banks
Non-financial corporations
General government
Other financial corporations
Households
20.196
31/12/2018
18.053
72%
18%
6%4%

Dexia Crediop S.p.A.20
Structure of funding At the end of 2018, amounts due to banks and customers and securities totalled 76%, 3% and 21% of total funding, respectively (in all the various technical forms).
Return on Equity (RoE) 2018 RoE4 comes to -8.6% (compared to 0.2% in 2017), in relation to the net results for the period.
Cost to Income RatioThe Cost to Income ratio5 in 2018 was not significant, in that net interest and other banking income was negative. In any case, there was a 5% reduction in costs (administrative expenses and amortisation of fixed assets) with respect to the previous year.
4 Return on Equity is calculated as the ratio between net result for the year and shareholders’ equity. This indicator expresses the profitability of own equity.5 Cost to income is the ratio between operating costs (administrative expenses, amortisation and depreciation) and net interest and other banking income.
This indicator is a measure of productivity expressed as a percentage of profit absorbed by operating costs.
2018
76% Due to banks
3% Due to customers
21% Securities in issue
2017
66% Due to banks
30% Due to customers
4% Securities in issue
2016
75% Due to banks
18% Due to customers
7% Securities in issue
72%
20172016
2018
2017 20182016
1.7%
0.2%
-8.6%
88.3%70.3%

21Report on operations
Net non-performing loansThe index of non-performing loans net of adjustments6 at the end of 2018 was 0 (in line with 2017).
Return on Asset (RoA)RoA7 for 2018 came to -0.425%, with respect to 0.010% in 2017, in relation to the changes in the net results for the period.
6 The effect of non-performing loans is calculated as the ratio between non-performing loans and overall net loans. This indicator expresses the risk level of the loan portfolio.
7 The Return on Assets figure is calculated as the ratio between net result for the financial year and the total balance sheet assets. This indicator expresses the profitability of total invested equity.
201820172016
20172016
2018
0.0%
0.069%
0.010%
-0.425%
0.0% 0.0%
Dexia Crediop S.p.A.22
Report on Operations
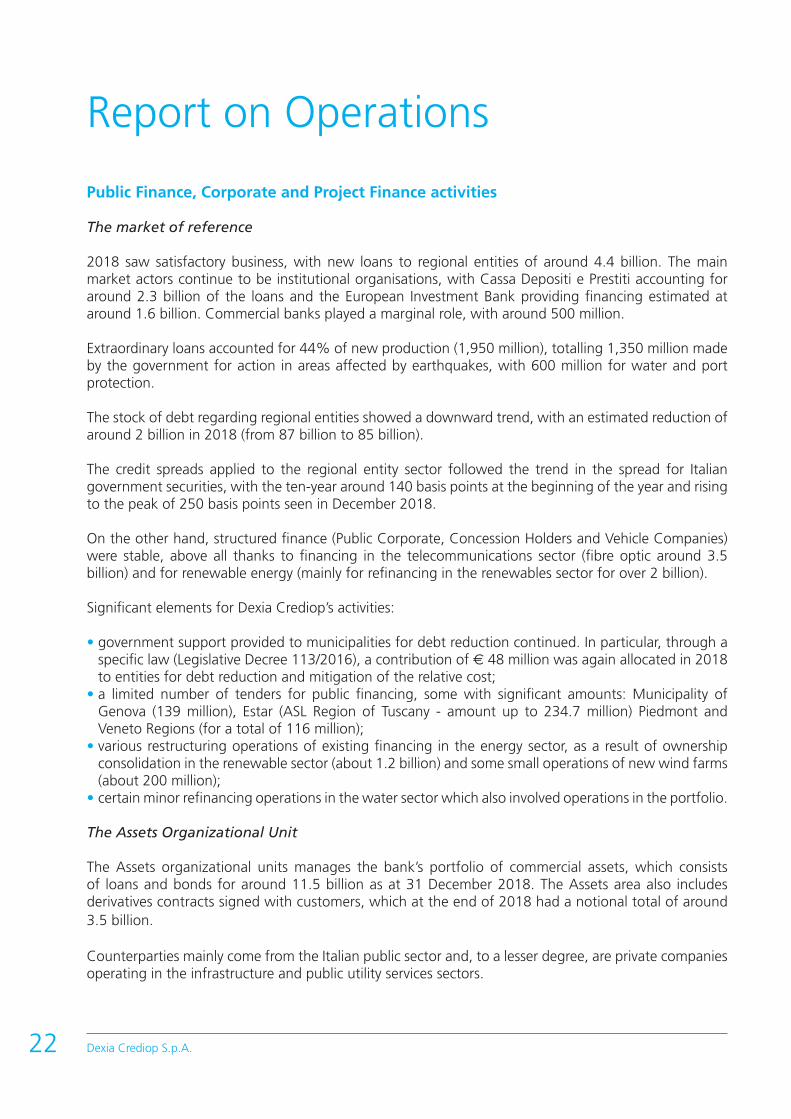
Public Finance, Corporate and Project Finance activities
The market of reference
2018 saw satisfactory business, with new loans to regional entities of around 4.4 billion. The main market actors continue to be institutional organisations, with Cassa Depositi e Prestiti accounting for around 2.3 billion of the loans and the European Investment Bank providing financing estimated at around 1.6 billion. Commercial banks played a marginal role, with around 500 million.
Extraordinary loans accounted for 44% of new production (1,950 million), totalling 1,350 million made by the government for action in areas affected by earthquakes, with 600 million for water and port protection.
The stock of debt regarding regional entities showed a downward trend, with an estimated reduction of around 2 billion in 2018 (from 87 billion to 85 billion).
The credit spreads applied to the regional entity sector followed the trend in the spread for Italian government securities, with the ten-year around 140 basis points at the beginning of the year and rising to the peak of 250 basis points seen in December 2018.
On the other hand, structured finance (Public Corporate, Concession Holders and Vehicle Companies) were stable, above all thanks to financing in the telecommunications sector (fibre optic around 3.5 billion) and for renewable energy (mainly for refinancing in the renewables sector for over 2 billion).
Significant elements for Dexia Crediop’s activities:
• government support provided to municipalities for debt reduction continued. In particular, through a specific law (Legislative Decree 113/2016), a contribution of € 48 million was again allocated in 2018 to entities for debt reduction and mitigation of the relative cost;
• a limited number of tenders for public financing, some with significant amounts: Municipality of Genova (139 million), Estar (ASL Region of Tuscany - amount up to 234.7 million) Piedmont and Veneto Regions (for a total of 116 million);
• various restructuring operations of existing financing in the energy sector, as a result of ownership consolidation in the renewable sector (about 1.2 billion) and some small operations of new wind farms (about 200 million);
• certain minor refinancing operations in the water sector which also involved operations in the portfolio.
The Assets Organizational Unit
The Assets organizational units manages the bank’s portfolio of commercial assets, which consists of loans and bonds for around 11.5 billion as at 31 December 2018. The Assets area also includes derivatives contracts signed with customers, which at the end of 2018 had a notional total of around 3.5 billion.
Counterparties mainly come from the Italian public sector and, to a lesser degree, are private companies operating in the infrastructure and public utility services sectors.

23Report on operations
In line with the objectives of the Dexia Group and its resolution plan, portfolio management is focussed on monitoring and reducing risks, including litigation and credit, at conditions favourable for the bank, through early repayment operations, restructuring or sale on the secondary market. For this reason, particular attention was paid to the management of customer relations in order to make the most of any market opportunities to carry out operations to simplify the portfolio.
Within the scope of these objectives, during 2018, Assets:
• launched an action plan to restructure about 650 million of structured loans with local authorities in order to turn them into fixed rate loans. To that end, during the year two significant operations were carried out with the Municipalities of Genoa and Turin for a total amount of around 285 million;
• completed three agreements ending civil disputes, for a total amount of 126 million, with the Municipality of Prato, the Municipality of Ferrara and the Campania Region, following the ruling of the Court of Appeal of London in 2017 confirming the legitimacy and validity of derivative transactions with the Municipality of Prato. These agreements permitted the recovery of all the sums due, in addition to the payment of interest on arrears and legal fees (please see Section legal risk of the Report);
• took advantage of the opportunity to extinguish loans totalling 54.2 million, with the simultaneous closure of swaps for a total notional value of 46 million.
Finally, the portfolio was subject to continuous monitoring in terms of changes in credit risk, both with reference to counterparty risk, and ensuring compliance with covenants and contractual commitments.
The above involved, in terms of ordinary activities, analysis and renegotiation of certain waivers, as well as management of various agency appointments.
Funding and activity on the markets
The CLM & Market Execution organisational unit is responsible for hedging liquidity and financial risks and executing all of Dexia Crediop’s transactions on the financial markets.
Funding
The economic and financial situation in which funding strategies were carried out during 2018 involved:
• negative money market rates, well below the European Central Bank rate for refinancing transactions;• the decision to concentrate all short-term funding activities for the Dexia Group at Dexia Crédit
Local and thus close Dexia Crediop’s access to Italian money market platforms (MID, MIC, XCOM, MTS);
• the establishment of a medium/long-term funding plan for Dexia Crediop, entirely subscribed by the parent company in December 2018. This plan is designed around Dexia Crediop’s liquidity requirements through 2022, as well as the regulatory requirements which the bank must comply with starting in January 2019 (Liquidity Coverage Ratio – LCR) and, looking forward, the Net Stable Funding Ratio (NSFR).
In this situation, the strategy to obtain funds to cover the liquidity gap was structured as follows:
• at the beginning of February a Long Term Repo transaction was concluded with Dexia Crédit Local (which in turn concluded a transaction with a market counterparty) for 400 million at 3 years through non-eligible securities. This operation was increased by an 152 million at the beginning of August;

Dexia Crediop S.p.A.24
• activities on the domestic money market continued through mid-May. Subsequently, the securities portfolio was transferred entirely to Dexia Crédit Local through repurchase agreements that are renewed in the short term;
• during 2018, Dexia Crediop participated in auctions held by the Ministry of Economy and Finance for the short-term use of its own available liquidity held with the Bank of Italy (OpTes);
• on 19 December the new funding plan became concrete, which will cover liquidity requirements, LCR requirements (as of January 2019) and NSFR requirements (when the regulatory requirement takes effect) and consists in:- the issuing of a 4-year amortising bond (domestic and intended for professional investors), with an
initial nominal amount of 2,600 million. The security was entirely subscribed by Dexia Crédit Local;- subscription and full drawing of a 4-year credit line of 4,100 million, granted by Dexia Crédit Local;- subscription of a 4 year revolving credit line of 1,000 million, granted by Dexia Crédit Local. This line,
partially drawn on starting from 31 December 2018, will be used to manage any daily variations in the bank’s liquidity requirements.
The support of the parent company is divided into the following financing channels:
• secured loans: at 31 December, the secured loan from the parent company amounted to a total value of around 5.1 billion (1.6 billion at 31 December 2017);
• unsecured funding: at 31 December, this segment amounted to a total of 7.5 billion (8.0 billion at 31 December 2017), of which 0.5 billion drawn from the revolving credit line granted in the amount of 1 billion.
Activities on derivatives markets
During the second half of 2018, transactions related to asset management and the related customer derivatives were carried out in the long-term derivatives segment, with early repayments or restructuring. Additionally, activities continued to reduce the stock of balanced trading derivatives.
In the short-term, monitoring of financial risks focused on managing re-fixing risk through the stipulation of EONIA swap contracts with durations falling between three and six months.
Audit area activities
Risk management
Credit risk
Credit risk is the risk of loss linked to the counterparties’ incapacity to honour their financial obligations.
With Dexia Crediop, this risk is most significant in the component represented by concentration risk, in particular relative to local and regional entities and the Italian Republic. In fact, at the end of the present year, credit exposure relative to these two types of counterparties amounted, respectively, to around 8.0 billion, or 53% of total Exposure at Default (EAD) and around 5.8 billion, or 38% of total EAD. We also note that, again in terms of EAD, around 78% of the bank’s portfolio at the end of December 2018 has an investment grade rating, based on internal ratings, in line with the previous year.
25Report on operations
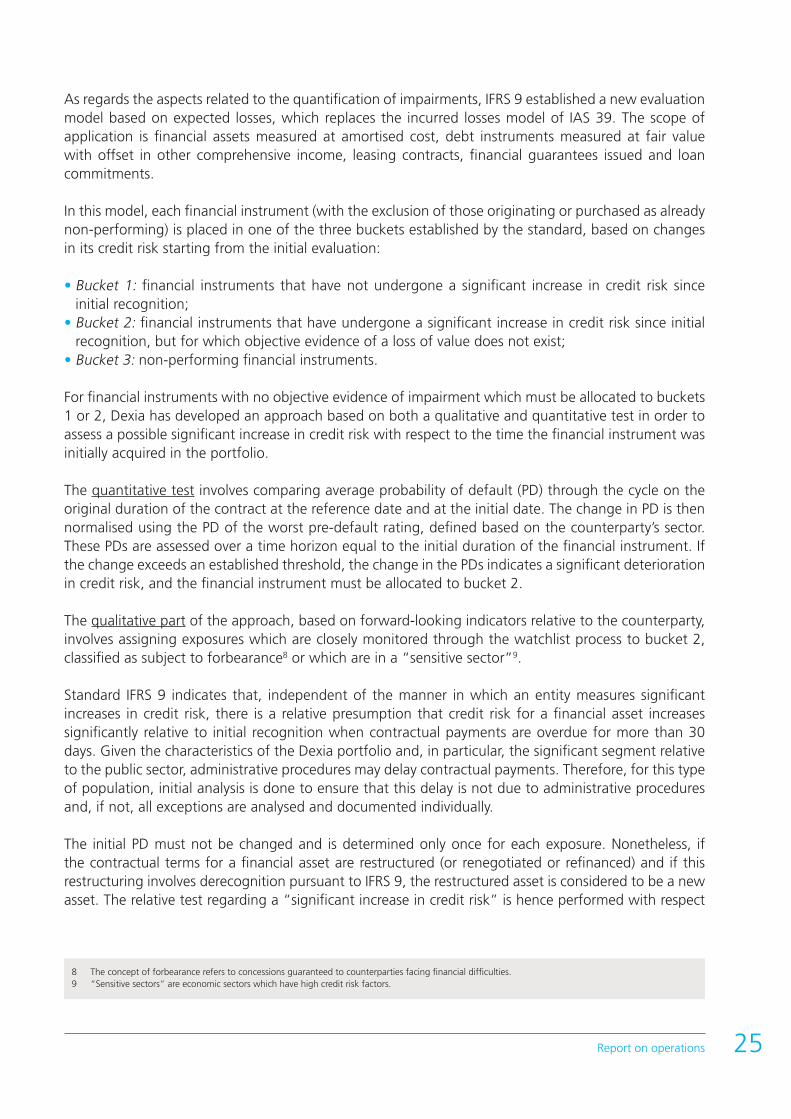
As regards the aspects related to the quantification of impairments, IFRS 9 established a new evaluation model based on expected losses, which replaces the incurred losses model of IAS 39. The scope of application is financial assets measured at amortised cost, debt instruments measured at fair value with offset in other comprehensive income, leasing contracts, financial guarantees issued and loan commitments.
In this model, each financial instrument (with the exclusion of those originating or purchased as already non-performing) is placed in one of the three buckets established by the standard, based on changes in its credit risk starting from the initial evaluation:
• Bucket 1: financial instruments that have not undergone a significant increase in credit risk since initial recognition;
• Bucket 2: financial instruments that have undergone a significant increase in credit risk since initial recognition, but for which objective evidence of a loss of value does not exist;
• Bucket 3: non-performing financial instruments.
For financial instruments with no objective evidence of impairment which must be allocated to buckets 1 or 2, Dexia has developed an approach based on both a qualitative and quantitative test in order to assess a possible significant increase in credit risk with respect to the time the financial instrument was initially acquired in the portfolio.
The quantitative test involves comparing average probability of default (PD) through the cycle on the original duration of the contract at the reference date and at the initial date. The change in PD is then normalised using the PD of the worst pre-default rating, defined based on the counterparty’s sector. These PDs are assessed over a time horizon equal to the initial duration of the financial instrument. If the change exceeds an established threshold, the change in the PDs indicates a significant deterioration in credit risk, and the financial instrument must be allocated to bucket 2.
The qualitative part of the approach, based on forward-looking indicators relative to the counterparty, involves assigning exposures which are closely monitored through the watchlist process to bucket 2, classified as subject to forbearance8 or which are in a “sensitive sector”9.
Standard IFRS 9 indicates that, independent of the manner in which an entity measures significant increases in credit risk, there is a relative presumption that credit risk for a financial asset increases significantly relative to initial recognition when contractual payments are overdue for more than 30 days. Given the characteristics of the Dexia portfolio and, in particular, the significant segment relative to the public sector, administrative procedures may delay contractual payments. Therefore, for this type of population, initial analysis is done to ensure that this delay is not due to administrative procedures and, if not, all exceptions are analysed and documented individually.
The initial PD must not be changed and is determined only once for each exposure. Nonetheless, if the contractual terms for a financial asset are restructured (or renegotiated or refinanced) and if this restructuring involves derecognition pursuant to IFRS 9, the restructured asset is considered to be a new asset. The relative test regarding a “significant increase in credit risk” is hence performed with respect
8 The concept of forbearance refers to concessions guaranteed to counterparties facing financial difficulties.9 “Sensitive sectors” are economic sectors which have high credit risk factors.
Dexia Crediop S.p.A.26
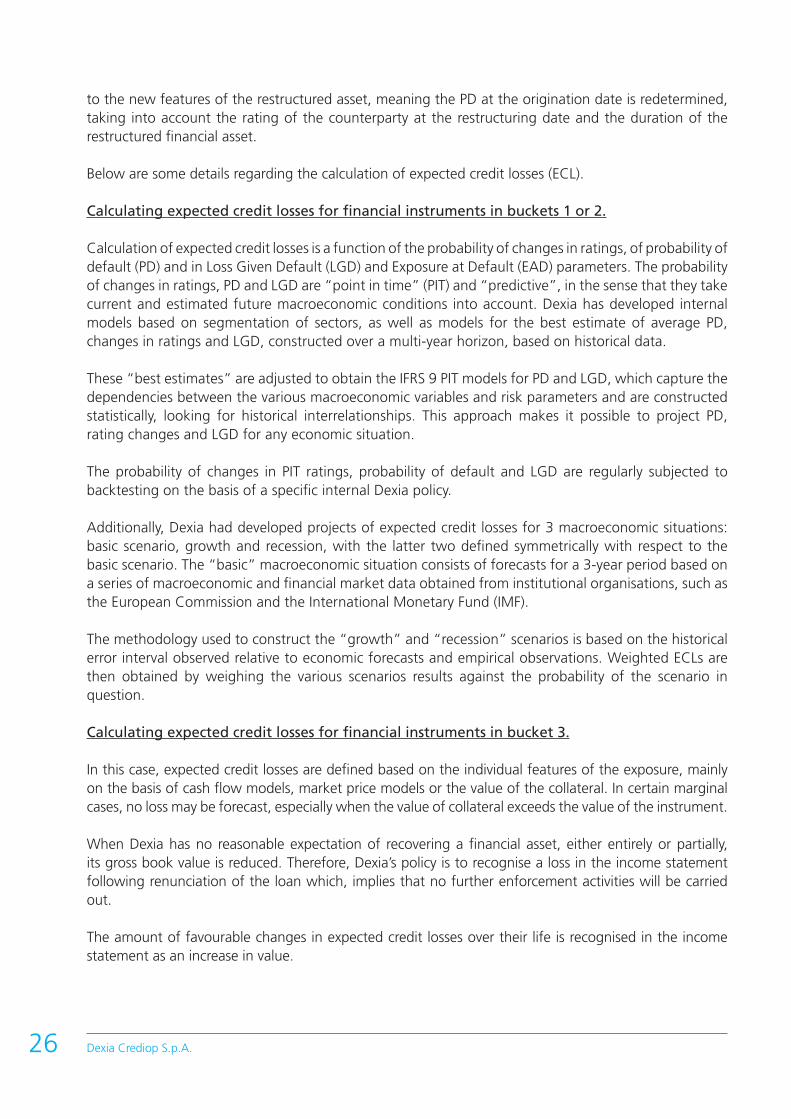
to the new features of the restructured asset, meaning the PD at the origination date is redetermined, taking into account the rating of the counterparty at the restructuring date and the duration of the restructured financial asset.
Below are some details regarding the calculation of expected credit losses (ECL).
Calculating expected credit losses for financial instruments in buckets 1 or 2.
Calculation of expected credit losses is a function of the probability of changes in ratings, of probability of default (PD) and in Loss Given Default (LGD) and Exposure at Default (EAD) parameters. The probability of changes in ratings, PD and LGD are “point in time” (PIT) and “predictive”, in the sense that they take current and estimated future macroeconomic conditions into account. Dexia has developed internal models based on segmentation of sectors, as well as models for the best estimate of average PD, changes in ratings and LGD, constructed over a multi-year horizon, based on historical data.
These “best estimates” are adjusted to obtain the IFRS 9 PIT models for PD and LGD, which capture the dependencies between the various macroeconomic variables and risk parameters and are constructed statistically, looking for historical interrelationships. This approach makes it possible to project PD, rating changes and LGD for any economic situation.
The probability of changes in PIT ratings, probability of default and LGD are regularly subjected to backtesting on the basis of a specific internal Dexia policy.
Additionally, Dexia had developed projects of expected credit losses for 3 macroeconomic situations: basic scenario, growth and recession, with the latter two defined symmetrically with respect to the basic scenario. The “basic” macroeconomic situation consists of forecasts for a 3-year period based on a series of macroeconomic and financial market data obtained from institutional organisations, such as the European Commission and the International Monetary Fund (IMF).
The methodology used to construct the “growth” and “recession” scenarios is based on the historical error interval observed relative to economic forecasts and empirical observations. Weighted ECLs are then obtained by weighing the various scenarios results against the probability of the scenario in question.
Calculating expected credit losses for financial instruments in bucket 3.
In this case, expected credit losses are defined based on the individual features of the exposure, mainly on the basis of cash flow models, market price models or the value of the collateral. In certain marginal cases, no loss may be forecast, especially when the value of collateral exceeds the value of the instrument.
When Dexia has no reasonable expectation of recovering a financial asset, either entirely or partially, its gross book value is reduced. Therefore, Dexia’s policy is to recognise a loss in the income statement following renunciation of the loan which, implies that no further enforcement activities will be carried out.
The amount of favourable changes in expected credit losses over their life is recognised in the income statement as an increase in value.

27Report on operations
That said, the total amount of impairments relative to the exposures classified in the new bucket 3 (corresponding, within the scope of IAS 39, to the specific value adjustments for credit risk) was, at the end of 2018, 17.4 million, compared to a value, at the end of 2017 - FTA IFRS 9, of 17.3 million.
The 0.1 million increase with respect to 31 December 2017 is due to a new position with a regional financial company. In addition, with regard to impairments relating to positions attributable to buckets 1 and 2, the stock amounted to 9.5 million (-6.3 million compared to the end of 2017 – FTA IFRS 9) at 31 December 2018. This difference is mainly due to early redemption operations, the natural amortisation of stocks of assets and changes in the internal ratings assigned to certain counterparties.
In any case, considering Dexia Crediop’s area of reference, the credit quality of the bank’s portfolio continues to be satisfactory, given the significantly reduced volume of non-performing loans with respect to total loans to customers. In fact, at the end of the year, the amount of non-performing loans (NPL) was around 82.2 million, or 0.5% of the reference total, consisting of 1.2 million in non-performing loans fully covered by provisions with the remaining part consisting of around 30 million of other secured positions.
Liquidity risk
Liquidity risk is the risk that the bank is not able to fulfil its payment commitments due to an inability to obtain funds from the market (funding liquidity risk) or by making its own assets liquid (market liquidity risk).
This risk is monitored on the basis of expected short-term balances and through medium/long-term projection of the bank’s assets and liabilities.
Following the funding operations carried out at the end of 2018 (described in paragraph Funding and activity on the markets), the liquidity gap fell significantly. Remaining liquidity requirements are covered until the end of 2022, provided no significant market disturbances occur, through short term repo transactions and the use of liquidity lines not yet drawn upon.
Dexia Crediop’s liquidity situation remains dependent upon trends in certain market parameters, including:
• trends in interest rates, which affect both the amount of margins relative to counterparties for cash collateral contracts and the value of reserves. A 10 basis point decrease in 10-year interest rates generates, taking into account the two cited effects, an increase of around 58 million in net liquidity requirements;
• the decrease in creditworthiness, which affects the value of Dexia Crediop’s eligible reserves; a 10 basis point increase in the credit spread decreases the value of reserves by around 43 million;
• the lowering of the counterparties’ rating below the Investment Grade threshold or decisions to abandon the rating.
The Liquidity Coverage Ratio (LCR) represents the bank’s capacity to cover its liquidity requirements at 30 days under given situations of stress.
Dexia Crediop S.p.A.28
On 16 July 2018, the ECB informed the Dexia Group of the termination of the tailored, pragmatic and proportionate supervision approach (“specific approach”) adopted by the ECB relative to the Dexia Group as of 1 January 2019, and the application of a general reference structure.
With the newly defined funding plan and stress hypotheses, at the end of December 2018 Dexia Crediop’s LCR is equal to 114%, in compliance with the relevant European regulation (100% as of 2018). Additionally, the Dexia Group’s consolidated LCR at the end of December 2018 was 202%.
Operational risk
Operational risk is the risk of loss resulting from inadequate or failed internal processes, human resources and systems, or from external events. This definition includes legal risk, but not strategic or reputational risk.
Risk events identified during the year were limited and did not lead to any financial losses worthy of note.
The Risk Control & Self Assessment (RCSA) that the bank periodically carries out, including that regarding IT assets, indicated that net risk exposure (that is after considering all the safeguards implemented to mitigate risk) has a final value that does not exceed “average” for all cases analysed, hence considered acceptable.
With reference to issues of operational continuity, the last annual test performed in 2018, aimed at verifying the reactions of relevant personnel in creating the emergency site, had fully satisfactory results.
Therefore, as a whole, the bank’s exposure to operational risks can be considered limited. For a detailed illustration of legal and compliance risks, please refer to the subsequent sections dedicated to these issues.
Market risk
Market risk is the risk of suffering accounting losses due to changes in the value of a financial instrument or portfolio associated with unexpected changes in market conditions.
Considering the fact that the bank is in run-off, no new risks arose during the year outside of the credit spread risk in the segment of loans measured at fair value (for more information on this, please see part E). To that end, Dexia Crediop has identified and defined, together with the parent company, a specific system of limits which are established through guidelines for each of the following main segments:
Cash & Liquidity Management (CLM):This refers to interest rate risk generated by operations carried out by the bank indexed to short term market parameters.
The risk indexes measured are fair value shift sensitivity for a parallel and instantaneous change in the market interest rate curves of +100 basis points and the Value at Risk (VaR) for interest rates at a confidence level of 99% and a holding period of ten business days. Limits have been set for these indexes, respectively, of 20 million (in absolute value) and 3.5 million which were always respected during the year:

29Report on operations
VAR 10 days (Euro) Shift Sensitivity 100 bps (absolute values in €)
31 December 2018 76,039 7,995,800
minimum 7,815 1,100
average 66,367 3,463,444
maximum 240,755 10,219,100
operating limit 3,500,000 20,000,000
ALM Rate:the scope analysed includes all the bank’s fixed rate operations which generate medium/long-term interest rate risk.The risk index measured is “shift sensitivity”, directional at 100 bps and rotational with differentiated shifts. A limit of 15 million (in absolute value) has been set for this index, which was always respected during the year.
The following table shows the values identified during 2018:
year 2018 Shift Sensitivity 100 bps (absolute values in €)
31 December 2018 10,015,795
minimum 7,623,037
average 8,333,584
maximum 10,015,795
operating limit 15,000,000
Structuring: The area of Structuring corresponds with balanced pairs of trading derivatives classified as held for trading (HFT), composed of balanced trading derivatives (only derivatives with customers are hedged by a credit support annex contract).The main risk indexes measured are the interest rate VaR and the shift sensitivity of fair value per 1 basis point of parallel and instantaneous change in market interest rates. Operating limits of € 500,000 and € 80,000 of absolute value have respectively been set for the above cited indexes, which were always respected during the year.
Legal risk
In the context of overall risk management and control, the implications under law and regarding reputation linked to the developments of judicial proceedings relative to transactions in derivatives carried out with counterparts of the public sector continue to be subject to careful monitoring.
In essence, at the end of December, there are still 3 disputes/pre-disputes ongoing with Italian local and regional government entities for a residual notional amount at 31 December 2018 of around 129 million and a negative mark to market value for the entities, of 16.5 million at 31 December 2018.
Below we note the most significant developments relative to these disputes during the year.
With reference to the dispute with the Campania Region, on 22 January 2018, Dexia Crediop and the Campania Region signed a settlement agreement which envisages, inter alia full recognition by the Region of the validity and efficacy of the swap contract from the time of origin.

Dexia Crediop S.p.A.30
The outcome of the ruling of the English Supreme Court of 18 December 2017, which confirmed the ruling of the Court of Appeal No. ([2017] EWCA Civ 428), declaring the full validity and efficacy of the swap contracts signed by the Municipality of Prato with Dexia Crediop, on 12 March 2018 a settlement agreement was finalised with the Municipality of Prato which recognised the full validity and efficacy of the swap contracts from the time of origin, thus putting an end to civil and administrative litigation (the criminal appeal brought by the Public Prosecutor before the Criminal Court of Appeal of Florence against the ruling of the Criminal Court of Prato of 31 May 2017 acquitted Dexia Crediop and one of its former employees of the charge of fraud against a public entity, in relation to the swap operations of the Municipality of Prato. The Municipality of Prato reimbursed the legal expenses suffered by Dexia Crediop in the three English civil court cases, as well as payment of interest on arrears on netting not paid since 2010.
Following the aforementioned Supreme Court ruling in the dispute with the Municipality of Prato, the Municipality of Ferrara also signed, on 7 March 2018, a settlement in which it recognised the full validity and efficacy of the swap contracts from the time of origin. On the same date, the Municipality carried out a payment of netting not paid as of 2012, plus interest on arrears, and reimbursed the legal expenses suffered by Dexia Crediop.
With regard to the dispute with the Municipality of Messina concerning swap contracts concluded with Dexia Crediop, on 22 February 2018, Dexia Crediop filed a claim before the High Court/Commercial Court of London.
In addition to the aforementioned judicial proceedings relating to derivative transactions, it should also be noted that, on 21 May 2018, Dexia Crediop received notification of a writ of summons before the Civil Court of L’Aquila by Fi.R.A. S.p.A. Regional Finance Abruzzo, in relation to the loan agreement signed with Dexia Crediop on 9 February 2004, in which Fi.R.A. disputes the early repayment clause of the loan.
The proceedings brought by Livorno Reti e Impianti S.p.A. (“LIRI”) before the Civil Court of Rome in relation to the loan agreement signed with Dexia Crediop on 23 December 2003, in which LIRI disputes the existence of an implicit derivative in the loan are also pending.
The proceedings brought by Dexia Crediop before the Court of Appeal of Rome appealing the Civil Court of Rome’s order of 4 February 2014 rejecting Dexia Crediop’s claims against ASL Roma 1 and the Lazio Region, aimed at obtaining, inter alia, a ruling to pay outstanding receivables deriving from the purchase transactions (for around 3.8 million), on 22 May 2012 and 5 June 2012, by the Italian Province of the Congregation of the Children of the Immaculate Conception (“Provincia Italiana della Congregazione dei Figli dell’Immacolata Concezione” - PICFIC) of certified healthcare receivables from various Lazio hospitals, including ASL Rome 1, were concluded with a judgment on 24 January 2019 which partially granted Dexia Crediop’s requests, against which the parties may appeal to the Supreme Court. The proceedings initiated by PICFIC at the Civil Court of Rome concerning the revocation of the deeds of sale of receivables in 2012 are also ongoing.
Dexia Crediop is a party in civil and administrative cases involving the Istituto per il Credito Sportivo (“ICS”), in which Dexia Crediop holds an equity investment, as well as against the relative watchdog Ministries.With regards to the administrative legal cases, after the judgment issued by the Council of State on 21 September 2015, which confirmed the legitimacy of the cancellation for self-protection purposes of the Interministerial Decree issuing the ICS 2005 Bylaws, Dexia Crediop is waiting for the hearing with the Regional Administrative Court of the Lazio Region, in relation to the appeal made by Dexia Crediop with regards to the Interministerial Decree approving the new ICS Bylaws. The civil case was brought by ICS, which requests the return of dividends distributed for financial years from 2005 to 2010, in excess of the minimum dividend set in the previous Bylaws issued in 2002 (amount

31Report on operations
requested from Dexia Crediop: 16.9 million, plus interest and damages). The hearing for clarification of the conclusions at the Civil Court of Rome has been set for 15 April 2019.
The development of these proceedings has led to the need to make additional allocations to the provisions for risks and charges relative to unpaid netting by the Municipality of Messina and the Province of Crotone, as well as in relation to dividends paid by the ICS, which it requests be returned. Additionally, the provision for risks and charges for legal expenses was increased by an additional 1 million.
***
For a further breakdown of risks and related hedging policies, qualitative and quantitative information is given in part E of the Notes to the Accounts.
Compliance, Anti-Money Laundering and Permanent Control
During the year, Compliance Control and Permanent Control activities were performed, based on the quarterly control plans determined by the Parent Company, as well as checks on proper insertion of information in the Centralised Computer Archive.
The results of the controls and checks reported above were positive and the areas identified which require attention did not necessitate specific recommendations.
There have been no notable events regarding anti-money laundering, pending the Bank of Italy’s decision to dictate measures for the effective implementation of Italian Legislative Decree no. 90, 25 May 2017 transposing into national law the IV EU Directive on the matter.
With the coordination of the parent company, during the year implementation of the relevant aspects of the MiFID II and MiFIR regulations within Dexia Crediop was completed, which came into force at the beginning of 2018, with particular reference to post-trade transparency, transaction reporting, investor protection and consequent updating of internal procedures. The entry into force of the Delegated Regulation (EU) No. 2014/1286 on documents containing key information for retail investment and pre-assembled insurance products (PRIIPS), led to the preparation of a KID (Key Information Document) for some residual retail bond issues, classified as PRIIP.
The company applied the provisions of Regulation (EU) No. 2016/679 to the protection of personal data (General Data Protection Regulation), which came into force on 25 May last. In particular, specific registers have been prepared relative to data processing, the updating of processing information and consent forms and a specific company policy aimed at regulating the entire subject of personal data processing in Dexia Crediop.
The possible consequences of Brexit were analysed in cooperation with the legal department, to determine the impact of the United Kingdom’s exit from the European Union on existing contracts governed by British law or contracts with counterparties residing in the United Kingdom. Special attention was paid to the consequences of a no-deal Brexit, that is an exit with no agreements intended to govern the effects in an orderly fashion. While the situation still is quite uncertain, it is held that the impacts on the bank will likely be limited.
Finally, during the fourth quarter, following instructions from the parent company, a Compliance risk self-assessment was performed to assess the Bank’s non-compliance risks and the adequacy of controls established to limit the risks identified. The analysis done determined that Compliance risk falls in the “low risk” category. The previous self-assessment, done in 2015, had identified “medium risk” for Dexia Crediop.

Dexia Crediop S.p.A.32
Internal Audit
During 2018, Internal Audit performed third level controls in compliance with Bank of Italy Supervisory Regulations and Parent Company directives, with respect to the principles of objectivity, impartiality and independence, and on the basis of methodology shared by all members of the Dexia Group.
Identification of audit projects was done through the definition of an audit plan, shared by the parent company Dexia Crédit Local and approved by the Board of Directors, based on an annual risk assessment on the main company processes, following the Dexia Group’s risk based methodological approach. This approach evaluates residual risk, taking into account the system of internal checks in effect and established to mitigate corporate risks, as well as based on results coming from previous years (backtesting), and the associated actions to remove anomalies and make improvements that have already been completed.
The main audits performed during the year involved management of the corporate and project finance portfolio, an audit of the Internal Capital Adequacy Assessment Process (ICAAP), the process used to feed information to the centralised computer archive, customer due diligence in compliance with the safeguards required by anti-money laundering regulations, implementation of the IFRS 9 project, IT project management, payment systems management, calculation of the Liquidity coverage ratio, the IT audit on the IT provider CSE, and implementation of the new European privacy law (GDPR).
The results indicated that the internal control system, supervision, monitoring and reporting on various company risks are substantially adequate. In particular, adaptation to the new accounting standard IFRS 9, as of 1 January 2018, was carried out in compliance with the schedule established and with the legal and regulatory requirements in effect (classification and measurement of financial instruments, development of accounting automation, adjustment of systems and reporting for the financial statements and regulatory reporting, coordination and integration with the parent company to apply shared methodology to calculate impairment and measure financial statement items in compliance with the new accounting rules).
Recommendations identified following the above audits were mainly aimed at improving the formalisation of certain process controls relative to the management of IT projects and analysis of IT risk relative to external providers, periodic monitoring of logical accesses, removal of obsolete data in systems, second level controls on manual records, and adjusting company procedures to new control safeguards. The corresponding action plans, shared with the relevant structures, were the subject of period monitoring and follow-up by Internal Audit. The managers of Internal Audit and Compliance are members of the Oversight Committee (Italian Legislative Decree no. 231 of 8 June 2001) and jointly carry out periodic checks on proper implementation of the Bank’s Organisational Model, as well as being responsible for updating it.
Additionally, the Internal Audit supervises the bank’s office in compliance with the procedures established through the provisions and regulations of the supervisory authorities.
Human Resources
At 31 December 2018, the staff consisted of 83 employees (-17 with respect to 31 December 2017), of which 60% were men and 40% were women, with an average age of 51 and average seniority of 24 years.
During the year, various organisational adjustments were made to adapt the structure and staff of certain units to changes in the bank’s situation, among which Finance & Operations, Assets, Funding & Markets and Human Resources.
33Report on operations
With regards to personnel training, there were various individual and collective projects carried out during the year, both for technical/specialist aspects and for regulatory updating (in particular, relative to the new General Data Protection Regulation - GDPR, developments in MIFID II and MIFIR, as well as workplace health and safety). In terms of language training, traditional e-learning courses were supported by workshops and meetings with mother tongue teachers involving various business skills, with the aim of extending and diversifying occasions available for improving English skills.
The fruitful social dialogue with the company’s trade union representatives continued, with updates on the evolution of the company’s situation and the Dexia Group, and with the adoption of shared solutions on various issues of common interest, such as funded training, the company premium and advances of the TFR; furthermore, after agreement with the trade unions, the health coverage for staff and their families was renewed for the three-year period 2018-2020.
Relative to employee remuneration policies, the Dexia Group remuneration policy, shared among all Group entities, which takes into account the specific context Dexia finds itself in, as well as the rules and regulations relative to governance and proper management of remuneration currently in effect was updated.
Main Support Activities and Projects
Below are the main IT projects carried out in 2018.
IFRS 9 – In the first quarter of the year, all the activities involving fine tuning resulting from the issue into production of the company IT system adjustments to the new IFRS9 accounting standards, which came into force on 1 January 2018, were completed and made operational in production.
Derivative Valuation – During the first half, activities involving the replacement and configuration of the application to measure derivatives (Openlink) were completed.
Data Governance – The multiyear project aimed at monitoring and controlling the quality of data managed by the bank’s IT system continued in 2018 with the development of new control rules.
Anacredit – The project to send loan information to Bankit/ECB was completed as the processes to automate the new set of reports was released, with regards to collected detailed data with regards to loans and credit risk. The transmission of the new data flows monthly and quarterly was begun in compliance with the schedule established in the regulations, starting in September 2018.
Additionally, other important actions were carried out aimed at:
• replacing the platform (RDJ) used to extract and transform date, which had become obsolete and difficult to maintain;
• increasing network security, both by improving the configuration of internal firewall equipment and by creating a VPN connection to be used in the case of an emergency with the parent company, in the case of additional interruption in the international COLT connection.

Dexia Crediop S.p.A.34
Relations with subsidiariesand Dexia Group companies
Subsidiaries
Equity and economic relations with subsidiaries at the end of the financial year amounted to zero. This is in consideration of the fact that at 31 December 2018, after the completion of the voluntary liquidation of the subsidiary Dexia Crediop Ireland Ulc in voluntary liquidation, Dexia Crediop no longer has any equity investments in subsidiaries.
Parent Company
Equity relations at the end of the year with the parent company Dexia Crédit Local, which directs and coordinates the Bank pursuant to article 2497 of the Italian Civil Code, amounted to 160.1 million in assets and 13.1 billion in liabilities, as well as guarantees received and commitments of 359.9 million.Relative to assets, these consist of trading derivatives for 7.8 million, of deposits for 150.6 million and of hedging derivatives for 1.7 million.Relative to liabilities, these essentially consist of loans received for repurchase agreements for 5.1 billion, loans received for 4.9 billion, securities in issue for 2.6 billion, hedging derivatives for 0.3 billion and deposits for 70 million.Economic relationships with the parent company Dexia Crédit Local amount to negative 114.8 million, essentially due to interest expense relative to funding received, hedging operations and fee and commission expense relative to confirmed lines of credit.The key data from the last Annual Report of the parent company DCL are contained in Part L of the Notes, as required by article 2497-bis of the Italian Civil Code. Other companies in the Dexia Group
With reference to 31 December 2018, Dexia Crediop has no equity relationships with other companies in the Dexia Group, other than the relationships with the parent company indicated above.
Economic relations with other companies in the Dexia Group refer to interest expense accrued on repurchase agreements and securities issued by Dexia Crediop S.p.A. relative to Dexia Kommunalbank Deutschland in the amount of negative 1.2 million. The related information is contained in Part H of the Notes.

35Report on operations
Business outlook
Significant post-balance sheet events
No significant post-balance sheet events occurred after closure of the period.
Future operational prospects
In order to assess Dexia Crediop’s future operational prospects, it is necessary to refer to the situation of the Dexia Group, which has adopted an orderly resolution plan approved by the European Commission on 28 December 2012.
Dexia Group
Following implementation of this plan, the current scope of the Group corresponds to Dexia SA and its subsidiary Dexia Crédit Local, which holds most of the assets and maintains an international presence through its branches in Ireland, the United States, Spain and its subsidiaries in Germany and Italy.
The convergence of the Dexia Group’s scope towards that defined in the orderly resolution plan enables Dexia to devote itself fully to its mission of managing the residual long-term assets with no new production preserving the interests of the shareholder and guarantor States.
The Dexia Group as a going concern The consolidated financial statements of Dexia as at 31 December 2018 were prepared in accordance with the accounting rules applicable to a going concern. This requires a number of constituent assumptions underlying the business plan for the resolution of the Dexia Group, decided upon by the European Commission in December 2012. They are listed below:• The macroeconomic hypotheses underlying the business plan are revised as part of the half-yearly
reviews of the overall plan. The update made on the basis of market data observable as at 30 June 2018 and validated by the Board of Directors of Dexia on 19 December 2018 integrates the regulatory developments known to date, including the final version of the CRD IV Directive. It also takes account of the extremely positive impact on the Dexia Group’s regulatory capital of the first time application of the IFRS 9 accounting standard as from 1 January 2018, with Dexia’s Total Capital Ratio at 27.3% at the end of December 2018. Finally it takes account of the non-renewal, as from 1 January 2019, of the specific approach implemented by the European Central Bank for the supervision of the Dexia Group.
• The ongoing resolution assumes that Dexia retains a sound funding capacity, relying in particular on the appetite of investors for debt guaranteed by the Belgian, French and Luxembourg States as well as on the Group’s capacity to raise secured funding. Since the end of 2012, Dexia has considerably reduced its funding requirement, diversified its access to different funding sources and taken advantage of favourable market conditions to extend the maturity of its liabilities, with a view to the prudent management of its liquidity. In particular, this enables the Group to maintain a level of liquidity reserves which is deemed appropriate considering the restriction of access to European Central Bank funding announced on 21 July 2017. The latest update of the business plan takes

Dexia Crediop S.p.A.36
account of a revision of the funding plan relying on the last observable market conditions.• The business plan assumes the maintenance of the banking licences of the various entities and the
rating of Dexia Crédit Local.
Regular revisions of the business plan lead to adjustments to the original plan and over time involve a significant change of the Group’s resolution trajectory as initially anticipated, particularly in terms of profitability, solvency and funding structure. At this stage, they do not raise any question as to the nature or the fundamentals of the resolution, which justifies the decision to establish the financial statements in accordance with “going concern” principles.
However, over the duration of the Group’s resolution, uncertainties remain regarding the implementation of the business plan:• In particular, this plan is likely to be impacted by new developments in accounting and prudential
rules. • The Dexia Group is also sensitive to the evolution of the macroeconomic environment and to market
parameters, particularly exchange rates, interest rates and credit spreads. An unfavourable evolution of these parameters over time could weigh on the Group’s liquidity and its solvency position, for instance by increasing the amount of cash collateral paid by Dexia to its derivatives counterparties or an impact on the valuation of financial assets and liabilities and OTC derivatives, fluctuations of which are booked in the income statement and are liable to result in a fluctuation of the level of the Group’s regulatory capital.
• Discussions are ongoing between the European Commission and the Belgian and French States on the conditions of the renewal of the State guarantee as from 1 January 2022.
• If market demand for government-guaranteed debt were to decline, Dexia might need to turn to more costly funding sources which would directly impact the profitability assumed in the original business plan.
• Finally, the Group is exposed to certain operational risks, specific to the resolution environment in which it operates.
Note on accounting and regulatory developments Accounting standard IFRS9 “Financial instruments” was published by the IASB in July 2014 and adopted by the European Union on 22 November 2016. It took effect on 1 January 2018, replacing IAS 39 “financial instruments: accounting and valuation”.
Application of IFRS9 had a net positive impact on the Dexia Group of approximately € 2.7 billion on the Dexia Group’s assets as of 1 January 2018. This impact is mainly explained by:• the reclassification of previously classified AFS assets into the “amortised cost” category with the
consequent significant positive impact related to the reversal of negative reserves recognised in equity according to the standard IAS 39. The amount of these reserves was € -3.5 billion as at 31 December 2017;
• the reclassification of securities and structured loans, mainly from financial assets at “amortised cost” to financial assets classified as “fair value through profit and loss”, the impact of the fair value measurement of these assets was negative;
• the reclassification of securities and loans from the category of “amortised cost” (IAS39) to the category “fair value through equity” (IFRS 9): the impact was negative because credit spreads generally broadened compared to the outset;
• the implementation of a new model of provisions for credit risk.

37Report on operations
Evolution of the Dexia Group’s liquidity situation As a result of the reduction of the asset portfolio and the decrease of cash collateral (total net amount of EUR 22.7 billion as at 31 December 2018), funding outstanding decreased by EUR -18.5 billion, compared to the end of December 2017, to EUR 106 billion at the end of December 2018. The adjustment of the funding mix was achieved through the reduction of secured funding (EUR -14.1 billion compared to the end of 2017) due to the sale of the underlying assets and the termination of Crediop’s domestic repo platform. There was also a reduction of unsecured funding (EUR -4.3 billion compared to the end of December 2017), half of which was due to the decrease of State-guaranteed funding, bringing the outstanding amount to EUR 65.5 billion at the end of December 2018, or 62% of the total outstanding amount of funding at that date.
Over the year, Dexia Crédit Local successfully launched various long-term public benchmark transactions in euros, US dollars and pounds sterling, raising EUR 7.3 billion at a particularly competitive funding cost. Short-term funding activity in guaranteed format was also strong, with an average maturity at issuance of 8.5 months.
The Group has made no use of central bank funding since September 2017. At 31 December 2018, the Dexia Group had liquidity reserves of € 16.3 billion, of which 9.1 billion in the form of liquid deposits with the central bank.
As of the same date, the Dexia Group’s liquidity coverage ratio (LCR) was 202%, compared to 111% at 31 December 2017. The minimum requirement for this ratio, 100%, was respected by all the subsidiaries. The Net Stable Funding Ratio (NSFR), estimated on the basis of the last proposed amendment to the CRR, should be higher than the 100% target threshold, based on the commitment made by the Dexia Group since 2013 to improve its funding profile. .
Non-renewal of the specific approach to supervision and strengthening of prudential requirements regarding solvency applicable in 2019 for Dexia GroupOn 16 July 2018, the European Central Bank (ECB) informed Dexia that the specific approach to the tailored, pragmatic and proportionate supervision applied to the Dexia Group since 2015 would not be renewed for 2019. This decision is a part of the trend of convergence of the requirements applied to Dexia towards the general supervision framework which began in 2018.
As from 1 January 2019, Dexia must therefore meet all the regulatory requirements applicable to banking institutions supervised by the ECB, at each level of the Group’s consolidation. The observance of the constraint regarding large exposures will continue to be applied as described in the communication dated 5 February 2018, i.e. the deduction from its CET1 regulatory capital of the economic impact which might be generated by remediation on a failure to comply with that ratio.
On 14 February 2019, the ECB informed the Dexia Group of the qualitative and quantitative prudential requirements with regard to solvency applicable to Dexia SA and its subsidiaries as from 1 March 2019, in accordance with Council Regulation (EU) 1024/2013 dated 15 October 2013. These requirements are based in particular on the conclusions of works carried out by the ECB within the framework of the Supervisory Review and Evaluation Process (SREP).
The Total SREP Capital Requirement (TSCR) has been set at 11% on a consolidated basis. This level includes a minimum own funds requirement of 8% (Pillar 1) and an additional own funds requirement of 3% (P2R – Pillar 2 Requirement). By including the capital conservation buffer, of 2.5%, as well as the countercyclical buffer relating to exposures in France and the United Kingdom, estimated at 0.35%, this takes the own funds requirement to 13.85%.

Dexia Crediop S.p.A.38
In addition the ECB expects Dexia to comply with Pillar 2 capital guidance (P2G) of 1%, to be held over the level of 13.85% and to be made up entirely of Common Equity Tier 1 capital (CET 1).
As a consequence, the minimum level of the CET1 ratio goes to 11.35%, taking account of P2G.
Reinforcing of the operating model: implementation of the service outsourcing agreement with Cognizant Implementation of the service outsourcing agreement, signed between Dexia and Cognizant on 4 October 2017, continued during the first half-year 2018 with the transfer, on 1 May 2018, of the back office market and credit teams to Cognizant. The IT teams were transferred in November 2017. In total, 133 Dexia staff members were transferred under this agreement.
Dexia also chose to entrust the renewal and management of its IT system infrastructure to Cognizant. This transaction was the object of a separate agreement, also for a term of ten years. Its implementation will extend until the second quarter of 2019 and will provide the Group with better-performing IT tools and strengthen operational continuity. On the other hand, it will facilitate the actions taken by Cognizant, which will be able to work in synergy between IT applications and infrastructures.
Dexia Crediop
Thanks to funding transactions carried out with the parent company Dexia Crédit Local at the end of 2018 for an overall amount equal to 7.7 billion and to the regular renewal of the short-term repo transactions and without relevant evolution of the market parameters (interest rates and credit spreads) the liquidity gap of the bank is covered until the end of 2022.
As already mentioned the European Central Bank informed the Dexia Group that the so-called “specific approach” applied to the Dexia Group since 2015 would not be renewed for 2019. Consequently Dexia Crediop must also comply with all prudential requirements applicable to credit institutions supervised by the ECB.
The Liquidity coverage ratio (LCR) at the end of December 2018 was equal to 114%, higher than the limit required by the European regulation equal to 100%.
In terms of prudential requirements, regarding the solvability, following the evaluation process and prudential audit carried out by the ECB, in 2019 Dexia Crediop must comply with:• Total SREP Capital requirement at 11% (compared to 10.25% in 2018);• Overall Capital Requirement at 13.5% (compared to 12.125% in 2018).
In addition the ECB expects Dexia Crediop to comply with Pillar 2 capital guidance of 1% to be held over the level of 13.5% and to be made up entirely of Common Equity Tier 1 (CET 1).
As occurred in recent years and in line with the Group’s guidelines, Dexia Crediop will continue with its opportunistic policy of asset disposals, aimed at reducing credit risk associated with its portfolio.
In addition, over the last few years the bank has become party to some administrative and legal proceedings in relation to derivative contracts signed with local and territorial Authorities, some of which are still in progress. In the light of the developments so far in the procedures described in detail in the notes to the Corporate Financial Statements and, in particular, following the positive outcomes obtained by Dexia Crediop in derivative litigations with local and regional Italian authorities, which

significantly reduced the existing litigation also preventing the emergence of new disputes, Dexia Crediop considers adequate the provisions already made and does not expect further risks on the ongoing litigations not covered by specific provisions already made.
In terms of administrative management, with the implementation of progressive adjustments in the organisational structure, in line with the bank’s current mission, Dexia Crediop continues to rationalise processes and contain costs, in line with that done in past years.
Dexia Crediop as a going concernThe financial statements of Dexia Crediop as at 31 December 2018 were prepared in accordance with the accounting rules applicable to a going concern. This accounting treatment relies on a certain number of assumptions made in the business plan underlying the resolution of the Dexia Group, decided upon by the European Commission in December 2012, which, since July 2014, also includes Dexia Crediop (see paragraph “Dexia Group” of this document).
Additionally, in the course of 2019, Dexia Crediop may have to draw up a capital plan in order to measure the potential capital needs arising notably from:• the recent increase of prudential requirements;• the expected prospective P&L losses negatively impacting the capital base.
Moreover, On-site inspections (OSI) by the European Central Bank are currently ongoing at the level of the Dexia group, in particular an inspection with regard to credit risk. To the extent relevant, Dexia Crediop might have to integrate, in the aforementioned capital plan, the conclusions of such inspections, which might have an impact on its regulatory requirements and its ability to satisfy them.
The outcome of the capital plan, together with the on-site inspections impacts, could potentially lead to Dexia Crediop not being compliant with certain regulatory ratios. In such a case, necessary remedial actions will have to be taken in due time by Dexia Crediop.
Note on accounting and regulatory developments Accounting standard IFRS9 “Financial instruments” was published by the IASB in July 2014 and adopted by the European Union on 22 November 2016. It took effect on 1 January 2018, replacing IAS 39 “financial instruments: recognition and measurement”. The adoption of this standard by Dexia Crediop took place in line with the planned schedule.
Dexia Crediop saw a negative total impact on equity of € -38 million following application of IFRS 9 at 1 January 2018, mainly associated with:• the reclassification of limited portions of structured loans, on the basis of their characteristics (not
solely payments of principal and interests - SPPI), from the amortised cost category to the fair value through profit or loss - FVTPL category with a negative impact of € 75 million on account of the broadening of market spread;
• elimination of negative reserves in relation to financial assets previously classified among financial assets available for sale (AFS) with a consequent positive impact of € 33 million;
• net writebacks on impairment of loans and securities reclassified in the category of amortised cost and calculation of impairment based on the new standard relative to guarantees and commitments, with a total impact of € 4 million.
For more details, see the Notes to the accounts - Part A Accounting Policies.
39Report on operations

Proposed allocation of net results
Dear Shareholders,
The proposed allocation of net results set out below is presented for your approval pursuant to art. 25 of the Bank’s Bylaws.
Euro
Verified net result for 2018 -77,762,759
- share of 5% to be allocated to reserve pursuant to art. 2430 of the Italian Civil Code -
Residual result 2018 -77,762,759
Profit carried forward from 2017 (1) 372,752,567
Profit available to the meeting 294,989,808
of which:
- to be distributed to shareholders pursuant to the 4th paragraph of article 25 of the Articles of Association 0
- to be carried forward 294,989,808
(1) Net of the effects of first-time application of IFRS 9
After the shareholders’ approval of the Annual Report, and considering the proposal not to distribute the dividend in view of the commitment undertaken by the Dexia Group with the European Commission and in line with the Bank of Italy’s recommendation to reinforce the Bank’s asset structure, net equity will amount to € 826.8 million, and will consist of share capital of € 450.2 million, a legal reserve of € 77.4 million, other reserves of € 295.0 million (excluding the valuation reserves) and valuation reserves of € 4.2 million.
As of 31 December 2018, regulatory capital amounts to € 812.1 million. At the end of December 2018, the total capital ratio (regulatory capital to assets weighted according to risk level) was 19.9%, while the Common Equity Tier 1 ratio (Tier 1 equity to risk weighted assets) was 19.7%.
Dexia Crediop S.p.A.40
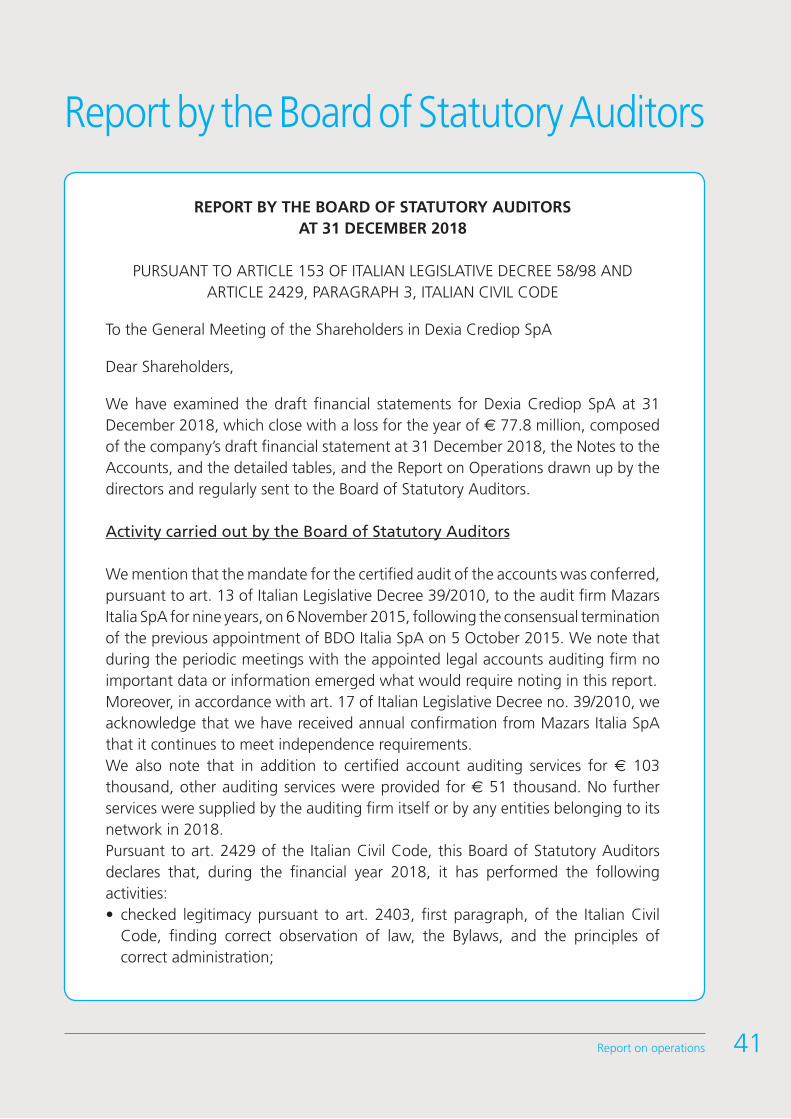
41Relazione sulla gestione
Report by the Board of Statutory Auditors
41Report on operations
REPORT BY THE BOARD OF STATUTORY AUDITORS AT 31 DECEMBER 2018
PURSUANT TO ARTICLE 153 OF ITALIAN LEGISLATIVE DECREE 58/98 AND ARTICLE 2429, PARAGRAPH 3, ITALIAN CIVIL CODE
To the General Meeting of the Shareholders in Dexia Crediop SpA
Dear Shareholders,
We have examined the draft financial statements for Dexia Crediop SpA at 31 December 2018, which close with a loss for the year of € 77.8 million, composed of the company’s draft financial statement at 31 December 2018, the Notes to the Accounts, and the detailed tables, and the Report on Operations drawn up by the directors and regularly sent to the Board of Statutory Auditors.
Activity carried out by the Board of Statutory Auditors
We mention that the mandate for the certified audit of the accounts was conferred, pursuant to art. 13 of Italian Legislative Decree 39/2010, to the audit firm Mazars Italia SpA for nine years, on 6 November 2015, following the consensual termination of the previous appointment of BDO Italia SpA on 5 October 2015. We note that during the periodic meetings with the appointed legal accounts auditing firm no important data or information emerged what would require noting in this report.Moreover, in accordance with art. 17 of Italian Legislative Decree no. 39/2010, we acknowledge that we have received annual confirmation from Mazars Italia SpA that it continues to meet independence requirements. We also note that in addition to certified account auditing services for € 103 thousand, other auditing services were provided for € 51 thousand. No further services were supplied by the auditing firm itself or by any entities belonging to its network in 2018.Pursuant to art. 2429 of the Italian Civil Code, this Board of Statutory Auditors declares that, during the financial year 2018, it has performed the following activities:• checked legitimacy pursuant to art. 2403, first paragraph, of the Italian Civil
Code, finding correct observation of law, the Bylaws, and the principles of correct administration;

Dexia Crediop S.p.A.42
Dexia Crediop S.p.A.42
• it has checked the adequacy of the company’s organisational, administrative and accounting structure, and its concrete functioning, and the reliability of the latter to correctly represent management activities;
• attended the periodic assemblies and participated in the meetings prescribed by art. 2405 of the Civil Code, and can state that they were conducted according to the provisions of the Bylaws, the law and regulations which govern their functioning, and we can reasonably ensure that the actions resolved conformed with the law and the Bylaws and were not manifestly imprudent, risky, in potential conflict of interests or such as to compromise the integrity of the company’s equity;
• examined the accounting audit plan relative for 2018 and periodically exchanged information with the auditing firm;
• verified that the company’s books have been kept and updated regularly, pursuant to art. 2421, Italian Civil Code.
We also inform you that, during the period, no complaints have been presented by shareholders for facts that do not comply with art. 2408 of the Civil Code.
Comments on the financial statements and proposals
With regard to the financial statements at 31 December 2018, the analytic control on the content of the same not being placed within our scope of competence, we have supervised the general approach to the same and conformity to law as regards preparation and structure, and we point out that the financial statements for the year 2018 also present, for comparative purposes, the data of the previous period for which, as allowed under the new accounting standard (paragraph 7.2.15 of IFRS 9), Dexia Crediop has decided to keep the data represented on the basis of the provisions of IAS 39.
For the Balance Sheet structure (and subsequent disclosure provided in the Notes), the figures at 31 December 2018 were compared with those from the last annual financial statements, determined by applying IAS 39, but restated in the new financial statement items to reflect the classification imposed under IFRS 9.In compliance with the provisions of the 5th update to the Bank of Italy Circular 262, a reconciliation schedule is provided for the figures in last approved financial statements applying the previous standard and the first financial statements prepared on the basis of the new provisions.The figures in the Income Statement were also compared with those from the last annual financial statements prepared using standard IAS 39 and therefore are not entirely comparable.
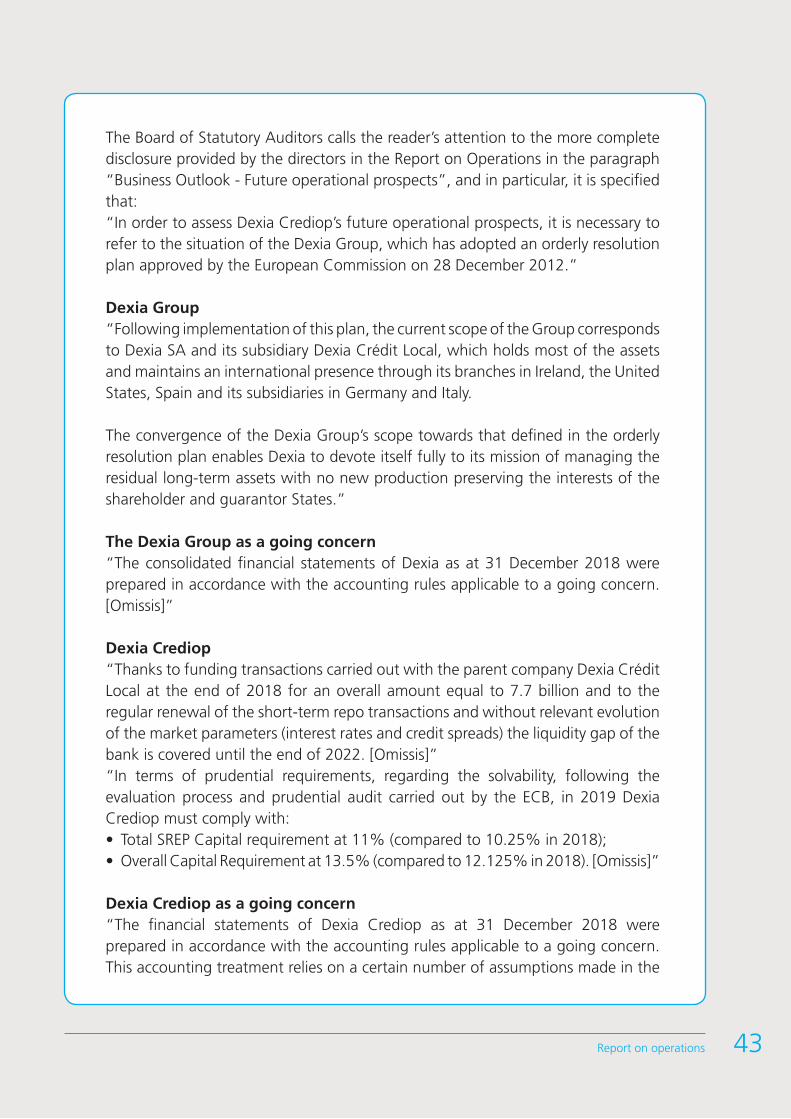
43Relazione sulla gestione
43Report on operations
The Board of Statutory Auditors calls the reader’s attention to the more complete disclosure provided by the directors in the Report on Operations in the paragraph “Business Outlook - Future operational prospects”, and in particular, it is specified that:“In order to assess Dexia Crediop’s future operational prospects, it is necessary to refer to the situation of the Dexia Group, which has adopted an orderly resolution plan approved by the European Commission on 28 December 2012.”
Dexia Group“Following implementation of this plan, the current scope of the Group corresponds to Dexia SA and its subsidiary Dexia Crédit Local, which holds most of the assets and maintains an international presence through its branches in Ireland, the United States, Spain and its subsidiaries in Germany and Italy.
The convergence of the Dexia Group’s scope towards that defined in the orderly resolution plan enables Dexia to devote itself fully to its mission of managing the residual long-term assets with no new production preserving the interests of the shareholder and guarantor States.”
The Dexia Group as a going concern“The consolidated financial statements of Dexia as at 31 December 2018 were prepared in accordance with the accounting rules applicable to a going concern. [Omissis]”
Dexia Crediop“Thanks to funding transactions carried out with the parent company Dexia Crédit Local at the end of 2018 for an overall amount equal to 7.7 billion and to the regular renewal of the short-term repo transactions and without relevant evolution of the market parameters (interest rates and credit spreads) the liquidity gap of the bank is covered until the end of 2022. [Omissis]” “In terms of prudential requirements, regarding the solvability, following the evaluation process and prudential audit carried out by the ECB, in 2019 Dexia Crediop must comply with:• Total SREP Capital requirement at 11% (compared to 10.25% in 2018);• Overall Capital Requirement at 13.5% (compared to 12.125% in 2018). [Omissis]”
Dexia Crediop as a going concern“The financial statements of Dexia Crediop as at 31 December 2018 were prepared in accordance with the accounting rules applicable to a going concern. This accounting treatment relies on a certain number of assumptions made in the

Dexia Crediop S.p.A.44
Dexia Crediop S.p.A.44
business plan underlying the resolution of the Dexia Group, decided upon by the European Commission in December 2012, which, since July 2014, also includes Dexia Crediop [Omissis]”.“Additionally, in the course of 2019, Dexia Crediop may have to draw up a capital plan in order to measure the potential capital needs arising notably from:• the recent increase of prudential requirements;• the expected prospective P&L losses negatively impacting the capital base.
Moreover, On-site inspections (OSI) by the European Central Bank are currently ongoing at the level of the Dexia group, in particular an inspection with regard to credit risk. To the extent relevant, Dexia Crediop might have to integrate, in the aforementioned capital plan, the conclusions of such inspections, which might have an impact on its regulatory requirements and its ability to satisfy them.
The outcome of the capital plan, together with the on-site inspections impacts, could potentially lead to Dexia Crediop not being compliant with certain regulatory ratios. In such a case, necessary remedial actions will have to be taken in due time by Dexia Crediop.”
To the best of our knowledge, pursuant to art. 2429, paragraph two, of the Civil Code, that in drawing up the financial statements the Directors have not made any derogations from the principles pursuant to art. 2423 of the Italian Civil Code.In part H of the Notes to the Financial Statements, operations carried out with related parties during the year are indicated, in compliance with the provisions of the law.
Dear Shareholders,In view of the above, and considering that the report issued on 04 April 2019 by the independent audit firm does not contain any findings, we would suggest that you approve these financial statements as they are presented to you by the Board of Directors.
Milan, 04 April 2019
THE BOARD OF STATUTORY AUDITORSPierre Paul Destefanis ChairmanNadia Bonelli Standing AuditorNicola Fiameni Standing Auditor

45Relazione sulla gestione
Independent Auditors’ Report
MAZARS ITALIA SPA LARGO AUGUSTO, 8 - 20122 MILANO TEL: +39 02 32 16 93 00 - www.mazars.it
SPA - CAPITALE SOCIALE DELIBERATO, SOTTOSCRITTO E VERSATO € 120.000,00 – SEDE LEGALE: LARGO AUGUSTO, 8 - 20122 MILANO
REA MI-2076227 - COD. FISC. E P. IVA 11176691001 – ISCRIZIONE AL REGISTRO DEI REVISORI LEGALI N. 163788 CON D.M. DEL 14/07/2011 G.U. N. 57 DEL 19/07/2011
Independent auditor’s report in accordance with article 14 of Legislative Decree No. 39 of 27 January 2010 and article 10 of Regulation (EU) No. 537/2014
To the shareholders of Dexia Crediop S.p.A.
Report on the Audit of the Financial Statements Opinion
We have audited the financial statements of Dexia Crediop S.p.A. (the Company), which comprise the balance sheet as at 31 December 2018, the income statement, the statement of comprehensive income, the statement of changes in equity, the cash flows statement for the year then ended and the explanatory notes, including a summary of significant accounting policies. In our opinion, the financial statements give a true and fair view of the financial position of the Company as at 31 December 2018, and of the result of its operations and cash flows for the year then ended in accordance with International Financial Reporting Standards as adopted by the European Union, as well as with the regulations issued to implement article 9 of Legislative Decree No. 38/05 and article 43 of Legislative Decree No. 136/15. Basis for opinion
We conducted our audit in accordance with International Standards on Auditing (ISA Italia). Our responsibilities under those standards are further described in the section of this report titled Auditor’s responsibilities for the audit of the financial statements. We are independent of the Company pursuant to the regulations and standards on ethics and independence applicable to audits of financial statements under Italian law. We believe that the audit evidence we have obtained is sufficient and appropriate to provide a basis for our opinion. Emphasis of matter
We draw attention to the disclosure described by the directors in the explanatory notes "Section 2 - General accounting principles" of the "Part A - Accounting policies" with reference to the paragraph “Future operational prospects" of the Report on operations in relation to the going concern of Dexia Group and Dexia Crediop S.p.A., and, in particular, it is indicated that:“In order to assess Dexia Crediop’s future operational prospects, it is necessary to refer to the situation of the Dexia Group, which has adopted an orderly resolution plan approved by the European Commission on 28 December 2012. Dexia Group Following implementation of this plan, the current scope of the Group corresponds to Dexia SA and its subsidiary Dexia Crédit Local, which holds most of the assets and maintains an international presence through its branches in Ireland, the United States, Spain and its subsidiaries in Germany and Italy.
The convergence of the Dexia Group’s scope towards that defined in the orderly resolution plan enables Dexia to devote itself fully to its mission of managing the residual long-term assets with no new production preserving the interests of the shareholder and guarantor States.
45Report on operations
Dexia Crediop S.p.A.46
The Dexia Group as a going concern The consolidated financial statements of Dexia as at 31 December 2018 were prepared in accordance with the accounting rules applicable to a going concern. [Omissis] Dexia Crediop Thanks to funding transactions carried out with the parent company Dexia Crédit Local at the end of 2018 for an overall amount equal to 7.7 billion and to the regular renewal of the short-term repo transactions and without relevant evolution of the market parameters (interest rates and credit spreads) the liquidity gap of the bank is covered until the end of 2022. [Omissis] In terms of prudential requirements, regarding the solvability, following the evaluation process and prudential audit carried out by the ECB, in 2019 Dexia Crediop must comply with:
• Total SREP Capital requirement at 11% (compared to 10.25% in 2018); • Overall Capital Requirement at 13.5% (compared to 12.125% in 2018). [Omissis]
Dexia Crediop as a going concern The financial statements of Dexia Crediop as at 31 December 2018 were prepared in accordance with the accounting rules applicable to a going concern. This accounting treatment relies on a certain number of assumptions made in the business plan underlying the resolution of the Dexia Group, decided upon by the European Commission in December 2012, which, since July 2014, also includes Dexia Crediop [Omissis]. Additionally, in the course of 2019, Dexia Crediop may have to draw up a capital plan in order to measure the potential capital needs arising notably from:
• the recent increase of prudential requirements; • the expected prospective P&L losses negatively impacting the capital base.
Moreover, On-site inspections (OSI) by the European Central Bank are currently ongoing at the level of the Dexia group, in particular an inspection with regard to credit risk. To the extent relevant, Dexia Crediop might have to integrate, in the aforementioned capital plan, the conclusions of such inspections, which might have an impact on its regulatory requirements and its ability to satisfy them.
The outcome of the capital plan, together with the on-site inspections impacts, could potentially lead to Dexia Crediop not being compliant with certain regulatory ratios. In such a case, necessary remedial actions will have to be taken in due time by Dexia Crediop.”
Our opinion is not modified in respect of this matter. Key audit matters
Key audit matters are those matters that, in our professional judgment, were of most significance in our audit of the financial statements of the current period. These matters were addressed in the context of our audit of the financial statements as a whole, and in forming our opinion thereon, and we do not provide a separate opinion on these matters.
Classification and valuation of financial assets / liabilities measured at fair value through profit and loss (Part A.2, paragraphs 1 – 11 of the explanatory notes) Description of the key audit matters Audit procedures Financial assets measured at fair value through profit and loss as at 31 December 2018 amount
In response to this key audit matter, the audit approach applied has included the following main audit procedures:
Dexia Crediop S.p.A.46
Classification and valuation of financial assets / liabilities measured at fair value through profit and loss (Part A.2, paragraphs 1 – 11 of the explanatory notes) Description of the key audit matters Audit procedures to 1,407 million euro, corresponding to 8% of total assets in the financial statements. Financial liabilities held for trading as at 31 December 2018 amount to 1,177 million euro, corresponding to 6% of total liabilities in the financial statements. These items are relevant for our audit in consideration of the significance and the complexity of the process for determining the value.
• understanding and assessing the whole organizational measures and the controls set forth by the internal control system, including those relating to the IT systems for the purposes of the financial assets/liabilities designated at fair value;
• on a sample basis, testing of the valuation of financial instruments in derivatives with the support of experts from Mazars organization;
• testing of reconciliation of management and accounting data with the Company's IT systems;
• review of the accounting treatment of the derecognition carried out for substantial changes on non-SPPI assets, following the 2018 operations of asset restructuring;
• analytical review procedures, analysis of significant variances and of the volatility parameters (CVA, DVA, FVA);
• obtaining of external confirmations, ISA 505; • analysis of the adequacy of the disclosure
provided in the explanatory notes.
Classification and valuation of the provisions for risks and charges (Part A.2, paragraph 9 of the explanatory notes) Description of the key audit matters Audit procedures The provisions for risks and charges as at 31 December 2018 amounts to 40.2 million euro, corresponding to 0.2% of total liabilities in the financial statements. This item is relevant for our audit in consideration of the significance and the complexity of the risk assessment linked to disputes in which the bank is involved.
In response to this key audit matter, the audit approach applied has included the following main audit procedures:
• acknowledgement and update of current disputes and analysis of the related documentation;
• analytical review procedures and analysis of significant variances;
• obtaining of information from legal external consultants ISA 505;
• on a sample basis, testing of the correct recognition of legal expenses
• analysis of the adequacy of the information provided in the explanatory notes.
47Report on operations

Appropriateness of the going concern assumption ("Section 2 - General principles of preparation" of "Part A - Accounting policies" with reference to the paragraph "Future operational prospects" of the Report on operations) Description of the key audit matters Audit procedures The Company is structurally exposed to liquidity risk since the activity is mainly focused on a long-term outlook, whereas the funding activity is characterized by a shorter average duration.
By the funding transactions carried out with the parent company Dexia Crédit Local at the end of 2018 for an overall amount equal to 7.7 billion and to the regular renewal of the short-term repo transactions and without relevant evolution of the market parameters (interest rates and credit spreads) the liquidity gap of the bank is covered until the end of 2022.
In view of the significance of directors’ assessments for the purposes of determining the basis of accounting of the financial statements, we deemed these assessments as a key audit matter for the audit of the Company's financial statements.
In response to this key audit matter, the audit approach applied has included the following main audit procedures:
• obtaining and analyzing the funding agreements signed with the parent company Dexia Crédit Local
• exchange of information with group auditors on macroeconomic assumptions regarding the industrial plan for the orderly resolution of the Dexia Group;
• analysis and understanding of the procedures related to the liquidity position;
• analysis of the company’s reports related to the liquidity gap and reserves monitoring
Finally, we verified the completeness and compliance of the disclosures provided in the financial statements with respect to the applicable financial reporting standards and the relevant regulation.
Responsibilities of the directors and board of statutory auditors for the financial statements
The directors are responsible for the preparation of financial statements that give a true and fair view in accordance with International Financial Reporting Standards as adopted by the European Union, as well as with the regulation issued to implement article 9 of Legislative Decree No. 38/05 and article 43 of Legislative Decree No. 136/15 and, according to the terms prescribed by law, for such internal control as the directors determine is necessary to enable the preparation of financial statements that are free from material misstatement, whether due to fraud or error. The directors are responsible for assessing the Company’s ability to continue as a going concern and for the appropriateness of the use of the going concern assumption in the preparation of the financial statements, and for appropriate disclosure thereof. In preparing the financial statements, the Directors use the going concern basis of accounting unless directors either intend to liquidate the Company or to cease operations or has no realistic alternative but to do so. The board of statutory auditors (“collegio sindacale”) is responsible for overseeing, according to the terms prescribed by law, the Company’s financial reporting process. Auditor’s responsibilities for the audit of the financial statements
Our objectives are to obtain a reasonable assurance about whether the financial statements as a whole are free from material misstatement, whether due to fraud or error, and to issue an auditor’s report that includes our opinion. Reasonable assurance is a high level of assurance, but
Dexia Crediop S.p.A.48

is not a guarantee that an audit performed in accordance with International Standards on Auditing (ISA Italia) will always detect a material misstatement when it exists. Misstatements can arise from fraud or error and are considered material if, individually or in the aggregate, they could reasonably be expected to influence the economic decisions of users taken on the basis of these financial statements.
As part of the audit in accordance with International Standards on Auditing (ISA Italia), we exercised professional judgement and maintained professional scepticism throughout the audit. Furthermore:
• we identified and assessed the risks of material misstatement of the financial statements, whether due to fraud or error; we designed and performed audit procedures in response to those risks; we obtained sufficient and appropriate audit evidence on which to base our opinion. The risk of not detecting a material misstatement resulting from fraud is higher than for one resulting from error, as fraud may involve collusion, forgery, intentional omissions, misrepresentations or the override of internal control;
• we obtained an understanding of the internal control relevant to the audit in order to design the audit procedures that are appropriate in the circumstances, but not for the purpose of expressing an opinion on the effectiveness of the Company’s internal control;
• we evaluated the appropriateness of accounting policies used and the reasonableness of accounting estimates and related disclosures made by the directors;
• we concluded on the appropriateness of the director’s use of the going concern basis of accounting and, based on the audit evidence obtained, whether a material uncertainty exists related to events or conditions that may cast significant doubt on the Company’s ability to continue as a going concern. Where a material uncertainty exists, we are required to draw attention, in our auditor’s report, to the related disclosures in the financial statements or, if such disclosures are inadequate, to modify our opinion. Our conclusions are based on the audit evidence obtained up to the date of our auditor’s report. However, subsequent events or conditions may cause the Company to cease to continue as a going concern;
• we evaluated the overall presentation, structure and content of the financial statements, including the disclosures, and whether the financial statements represent the underlying transactions and events in such a manner as to give a true and fair view.
We communicated to those charged with governance, identified at an appropriate level as required by ISA Italia, among other matters, the scope and timing of the audit and significant audit findings, including any significant deficiencies in internal control that we identified during our audit.
We also provided those charged with governance with a statement that we complied with the regulations and standards on ethics and independence applicable under Italian law and communicated to them any circumstances that may reasonably be thought to bear on our independence and, where applicable, related safeguards.
From the matters communicated to those charged with governance, we identified those that were of most significance in the audit of the financial statements of the current period, and are therefore representing the key audit matters. We described these matters in our auditor’s report.
49Report on operations
Additional disclosures required by article 10 of Regulation (EU) No. 537/2014
On 6 November 2015, the shareholders of Dexia Crediop S.p.A. in general meeting engaged us to perform the statutory audit of the Company’s financial statements for the years ending 31 December 2015 to 31 December 2023.
We declare that we did not provide any prohibited non-audit services referred to in article 5, paragraph 1, of Regulation (EU) No. 537/2014 and that we remained independent of the Company in conducting the statutory audit.
We confirm that the opinion on the financial statements expressed in this report is consistent with the additional report to the board of statutory auditors (“collegio sindacale”), in their capacity as audit committee, prepared pursuant to article 11 of the aforementioned Regulation.
Report on compliance with other laws and regulations Opinion in accordance with article 14, paragraph 2, letter e), of Legislative Decree No. 39/10 and article 123-bis, paragraph 4, of Legislative Decree No. 58/98
The directors of Dexia Crediop S.p.A. are responsible for preparing a report on operations and a report on the corporate governance and ownership structure of Dexia Crediop S.p.A. as at 31 December 2018, including their consistency with the relevant financial statements and their compliance with the law.
We have performed the procedures required under auditing standard (SA Italia) No. 720B in order to express an opinion on the consistency of the report on operations and of the specific information included in the report on corporate governance and ownership structure referred to in article 123-bis, paragraph 4, of Legislative Decree No. 58/98, with the financial statements of Dexia Crediop S.p.A. as at 31 December 2018 and on their compliance with the law, as well as to issue a statement on material misstatements, if any.
In our opinion, the report on operations and the specific information included in the report on corporate governance and ownership structure mentioned above are consistent with the financial statements of Dexia Crediop S.p.A. as at 31 December 2018 and are prepared in compliance with the law.
With reference to the statement referred to in article 14, paragraph 2, letter e), of Legislative Decree No. 39/10, issued based on our knowledge and understanding of the Company and its environment obtained in the course of the audit, we have nothing to report.
Milan, 4 April 2019
Mazars Italia S.p.A. (signed on the original)
Olivier Rombaut Partner
This report has been translated into English from the Italian original solely for the convenience of international readers
Dexia Crediop S.p.A.50

51Relazione sulla gestione
Certification of the consolidated annual report pursuant to Article 154-bis of Italian Legislative Decree 58/98 and Art. 81-ter of Consob Regulation no. 11971 of 14 May 1999 and successive amendments and additions
1. The undersigned Jean Le Naour, as Chief Executive Officer, and Emmanuel Campana, as the Financial Reporting Manager, responsible for preparing the annual report of Dexia Crediop S.p.A., hereby testify, also taking into account the provisions of Art. 154-bis, clauses 3 and 4, of Italian Legislative Decree no. 58 of 24 February 1998, to:
• the adequacy in respect of the features of the company, and • the effective application
of the administrative and accounting procedures on which the annual report for the 2018 period are based.
2. He also certifies that:
2.1 the annual report:
a) has been drawn up according to the international accounting standards applicable and recognised in the European Union pursuant to Regulation (EC) no. 1606/2002 of the European Parliament and Council of 19 July 2002;
b) corresponds to the balances in the accounting records;c) give a true and correct representation of the issuer’s equity and economic and financial
situation.
2.2 the report on business operations includes a reliable analysis of the management trend and result, as well as the issuer’s situation, together with a description of the main risks and uncertainties to which it is exposed.
22 March 2019
Jean Le Naour Emmanuel Campana Chief Executive Officer Financial Reporting Manager
51Report on operations

Dexia Crediop S.p.A.52
C O R P O R AT E F I N A N C I A L S TAT E M E N T SD E X I A C R E D I O P
at 31 December 2018
C O R P O R AT E F I N A N C I A L S TAT E M E N T SD E X I A C R E D I O P
at 31 December 2018
2018R E L A Z I O N E E B I L A N C I O
D E X I A C R E D I O P
Dexia CrediopDexia Crediop
Dexia2018_CrediopIT_SansDos.indd 4 04/01/2019 15:15
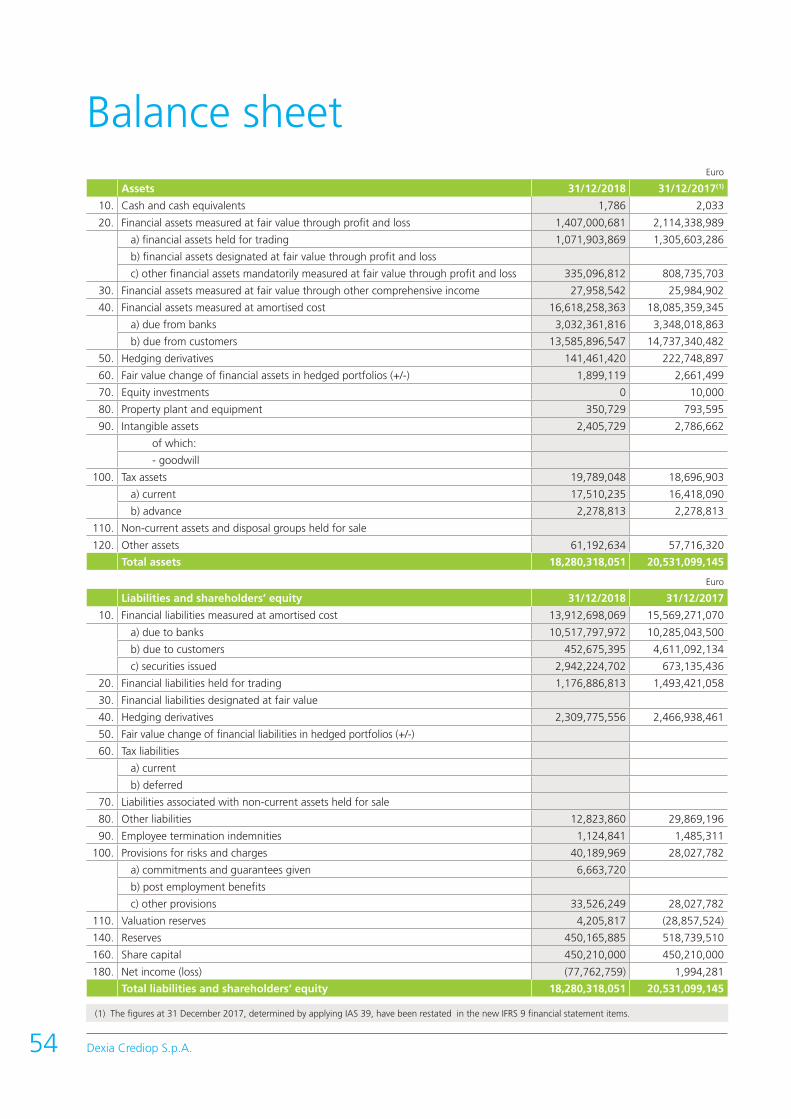
Dexia Crediop S.p.A.54
Balance sheetEuro
Assets 31/12/2018 31/12/2017(1)
10. Cash and cash equivalents 1,786 2,033
20. Financial assets measured at fair value through profit and loss 1,407,000,681 2,114,338,989
a) financial assets held for trading 1,071,903,869 1,305,603,286
b) financial assets designated at fair value through profit and loss
c) other financial assets mandatorily measured at fair value through profit and loss 335,096,812 808,735,703
30. Financial assets measured at fair value through other comprehensive income 27,958,542 25,984,902
40. Financial assets measured at amortised cost 16,618,258,363 18,085,359,345
a) due from banks 3,032,361,816 3,348,018,863
b) due from customers 13,585,896,547 14,737,340,482
50. Hedging derivatives 141,461,420 222,748,897
60. Fair value change of financial assets in hedged portfolios (+/-) 1,899,119 2,661,499
70. Equity investments 0 10,000
80. Property plant and equipment 350,729 793,595
90. Intangible assets 2,405,729 2,786,662
of which:
- goodwill
100. Tax assets 19,789,048 18,696,903
a) current 17,510,235 16,418,090
b) advance 2,278,813 2,278,813
110. Non-current assets and disposal groups held for sale
120. Other assets 61,192,634 57,716,320
Total assets 18,280,318,051 20,531,099,145
Euro
Liabilities and shareholders’ equity 31/12/2018 31/12/2017
10. Financial liabilities measured at amortised cost 13,912,698,069 15,569,271,070
a) due to banks 10,517,797,972 10,285,043,500
b) due to customers 452,675,395 4,611,092,134
c) securities issued 2,942,224,702 673,135,436
20. Financial liabilities held for trading 1,176,886,813 1,493,421,058
30. Financial liabilities designated at fair value
40. Hedging derivatives 2,309,775,556 2,466,938,461
50. Fair value change of financial liabilities in hedged portfolios (+/-)
60. Tax liabilities
a) current
b) deferred
70. Liabilities associated with non-current assets held for sale
80. Other liabilities 12,823,860 29,869,196
90. Employee termination indemnities 1,124,841 1,485,311
100. Provisions for risks and charges 40,189,969 28,027,782
a) commitments and guarantees given 6,663,720
b) post employment benefits
c) other provisions 33,526,249 28,027,782
110. Valuation reserves 4,205,817 (28,857,524)
140. Reserves 450,165,885 518,739,510
160. Share capital 450,210,000 450,210,000
180. Net income (loss) (77,762,759) 1,994,281
Total liabilities and shareholders’ equity 18,280,318,051 20,531,099,145
(1) The figures at 31 December 2017, determined by applying IAS 39, have been restated in the new IFRS 9 financial statement items.

55Corporate financial statements
Euro
Items 31/12/2018 31/12/2017(1)
10. Interest and similar income 85,174,087 86,781,405
of which: interest income calculated using the effective interest rate method 320,602,905
20. Interest and similar expenses (61,317,676) (49,451,939)
30. Net interest income 23,856,411 37,329,466
40. Fee and commission income 3,575,577 4,300,976
50. Fee and commission expenses (50,299,460) (42,027,757)
60. Net fee and commission income (46,723,883) (37,726,781)
70. Dividend and similar income 2,847,535 0
80. Net trading gains (losses) 244,565 22,348,671
90. Fair value adjustment in hedge accounting 6,250,422 14,693,725
100. Gains (losses) on disposal or repurchase of: 1,435,919 (467,641)
a) financial assets measured at amortised cost 386,731 (467,641)
b) financial assets measured at fair value through other comprehensive income
c) financial liabilities 1,049,188 0
110. Gains (losses) on other financial assets and liabilities measured at fair valuethrough profit and loss (37,403,949) 0
a) financial assets designated at fair value
b) other financial assets mandatorily measured at fair value through profit and loss (37,403,949) 0
120. Net interest and other banking income (49,492,980) 36,177,440
130. Net adjustments for credit risk of: 6,002,284 (9,982,667)
a) financial assets measured at amortised cost 6,002,284 (9,952,069)
b) financial assets measured at fair value through other comprehensive income (30,598)
140. Profits/losses from contractual changes without derecognition 248,000
150. Net income from financial activities (43,242,696) 26,194,773
160. Administrative expenses: (28,399,030) (30,209,706)
a) personnel expenses (12,349,976) (13,350,416)
b) other administrative expenses (16,049,054) (16,859,290)
170. Net provisions for risks and charges (6,072,141) (984,490)
a) commitments and guarantees given 179,317
b) other net provisions (6,251,458) (984,490)
180. Net adjustments on property plant and equipment (235,618) (282,971)
190. Net adjustments on intangible assets (1,666,006) (1,435,951)
200. Other operating expenses/income 978,848 4,464,186
210. Operating expenses (35,393,947) (28,448,932)
250. Profits (Losses) on disposal of investments 673,630 1,962,535
260. Profit (loss) from continuing operations before tax (77,963,013) (291,624)
270. Taxes on income from continuing operations 200,254 2,285,905
280. Profit (Loss) from continuing operations after tax (77,762,759) 1,994,281
290. Profit (Loss) after tax from discontinued operations
300. Net income (loss) (77,762,759) 1,994,281
Income statement
(1) Figures determined by applying IAS 39.
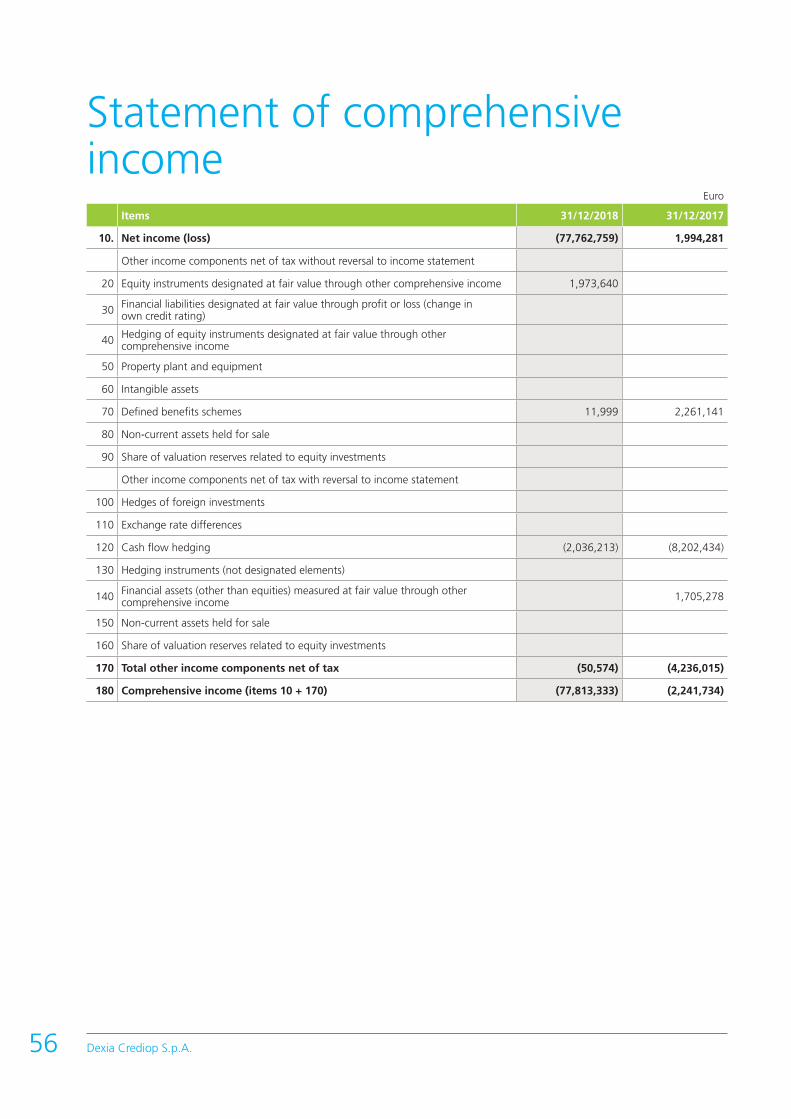
Dexia Crediop S.p.A.56
Euro
Items 31/12/2018 31/12/2017
10. Net income (loss) (77,762,759) 1,994,281
Other income components net of tax without reversal to income statement
20 Equity instruments designated at fair value through other comprehensive income 1,973,640
30 Financial liabilities designated at fair value through profit or loss (change inown credit rating)
40 Hedging of equity instruments designated at fair value through othercomprehensive income
50 Property plant and equipment
60 Intangible assets
70 Defined benefits schemes 11,999 2,261,141
80 Non-current assets held for sale
90 Share of valuation reserves related to equity investments
Other income components net of tax with reversal to income statement
100 Hedges of foreign investments
110 Exchange rate differences
120 Cash flow hedging (2,036,213) (8,202,434)
130 Hedging instruments (not designated elements)
140 Financial assets (other than equities) measured at fair value through other comprehensive income 1,705,278
150 Non-current assets held for sale
160 Share of valuation reserves related to equity investments
170 Total other income components net of tax (50,574) (4,236,015)
180 Comprehensive income (items 10 + 170) (77,813,333) (2,241,734)
Statement of comprehensive income

Bal
ance
s at
31.
12.2
017
Ch
ang
es t
o in
itia
l bal
ance
s
Bal
ance
s at
01.
01.1
8
Allocation of profit of
the previous period
Changes in the period
Shar
eho
lder
s’ e
qu
ity
at 3
1.12
.201
8
Ch
ang
es in
res
erve
s
Operations on shareholders’ equity
Co
mp
reh
ensi
ve in
com
e fo
r th
e p
erio
d 2
018
Res
erve
s
Div
iden
d a
nd
oth
er u
ses
New
sh
are
issu
es
Purc
has
e o
f tr
easu
ry s
har
es
Extr
aord
inar
y d
istr
ibu
tio
n o
f d
ivid
end
Ch
ang
es in
eq
uit
y in
stru
men
ts
Der
ivat
ives
on
tre
asu
ry s
har
es
Sto
ck o
pti
on
s
Share capital:
a) ordinary shares 450,210,000 450,210,000 450,210,000
b) other shares
Share premiums
Reserves:
a) of profits 518,739,510 (70,567,906) 448,171,604 1,994,281 450,165,885
b) others
Valuation reserves (28,857,524) 33,113,915 4,256,391 (50,574) 4,205,817
Equity instruments
Treasury shares
Profit (Loss) for theperiod 1,994,281 1,994,281 (1,994,281) (77,762,759) (77,762,759)
Shareholders’ equity 942,086,267 (37,453,991) 904,632,276 0 (77,813,333) 826,818,943
Statement of changes in shareholders’ equity
Euro
57Corporate financial statements

Dexia Crediop S.p.A.58
Euro
A. OPERATING ACTIVITIES Amount31/12/2018
Amount31/12/2017
1. Cash Flow from operations (82,734,519) (24,647,941)
- net income (+/-) (77,762,759) 1,994,281
- gains/losses on financial assets held for trading and on assets/liabilities designated at fair value through profit and loss (-/+) (244,565) (22,348,672)
- capital gains/losses on hedging assets (+/-) (6,250,422) (14,693,725)
- net adjustments for impairment (+/-) (6,002,284) 9,982,667
- net adjustments of tangible and intangible fixed assets (+/-) 1,901,624 1,718,923
- net provisions for risks and charges and other costs/revenues (+/-) 6,072,141 984,490
- taxes and duties to be settled (+) (200,254) (2,285,905)
- Net adjustments to/recoveries on discontinued operations net of tax effect (-/+)
- other adjustments (+/-) (248,000)
2. Cash flow from/used in financial assets 2,221,035,156 2,899,860,149
- financial assets held for trading 634,471,225 0
- financial assets designated at fair value 0 1,272,551,326
- financial assets measured at fair value through other comprehensive income (1,973,640) (5,193,813)
- financial assets measured at amortised cost 1,519,949,153 1,542,617,221
- other assets 68,588,418 89,885,415
3.Cash flow from/used in financial liabilities (2,141,647,239) (2,875,694,560)
- financial liabilities measured at amortised cost (1,656,573,000) (1,704,685,258)
- financial liabilities held for trading (317,248,180) (627,595,567)
- financial liabilities designated at fair value through profit and loss 0 0
- other liabilities (167,826,059) (543,413,735)
Net cash flow from (used in) operating activities (3,346,602) (482,352)
B. INVESTMENT ACTIVITIES
1. Cash flow from 4,635,549 1,755,312
- sales of equity investments 10,000 0
- dividend collected from equity investments 2,847,535 0
- sales of property plant and equipment 1,778,014 1,755,312
- sales of intangible assets
- sales of company divisions
2. Cash flow used in (1,289,194) (1,273,049)
- purchases of equity investments
- purchases of property plant and equipment (4,122) (18,804)
- purchases of intangible assets (1,285,072) (1,254,245)
- purchases of company divisions
Net liquidity generated/absorbed by investment activities 3,346,355 482,263
C. FUNDING ACTIVITIES 0 0
- issues/purchases of treasury shares
- issues/purchases of equity instruments
- distribution of dividend and other uses
Net liquidity generated/absorbed by funding activities 0 0
NET LIQUIDITY GENERATED/ABSORBED IN THE PERIOD (247) (89)
Cash flow statementIndirect method

ReconciliationEuro
Balance sheet items Amount31/12/2018
Amount31/12/2017
Cash and cash equivalents at start of period 2,033 2,122
Total net liquidity generated/absorbed in period (247) (89)
Cash and cash equivalents: effect of variations in exchange rates 0 0
Cash and liquid assets at end of period 1,786 2,033
59Corporate financial statements

Dexia Crediop S.p.A.60
Notes to the Financial Statements
64 Part A – Accounting policies
94 Part B – Comments on the balance sheet
123 Part C – Comments on the income statement
135 Part D – Comprehensive income
136 Part E – Comments on risks and associated hedging policies
180 Part F – Comments on the capital
183 Part H – Transactions with related parties
186 Part L – Information on sectors
191 Balance sheet data of parent company Dexia Crédit Local

Part A – Accounting policiesA.1 General Part – Section 1 - Declaration of conformity to International Accounting Standards – Section 2 - General accounting principles – Section 3 - Events after the balance sheet date – Section 4 - Other aspectsA.2 The main aggregates of the financial statements
1 - Financial assets held for trading 2 - Financial assets measured at fair value through other comprehensive income 3 - Financial assets measured at amortised cost 4 - Hedging transactions 5 - Equity investments 6 - Property plant and equipment 7 - Intangible assets
8 - Current and deferred taxes 9 - Provisions for risks and charges
10 - Financial liabilities measured at amortised cost 11 - Financial liabilities held for trading 12 - Currency transactions
13 - Other information A.4 Information on fair value Qualitative information A.4.1 - Fair value levels 2 and 3: valuation techniques and used inputs A.4.2 - Processes and sensitivity of the valuations A.4.3 - Fair Value hierarchy Quantitative information A.4.5 - Fair Value Hierarchy A.5 Information on the “day one profit/loss”
Part B – Comments on the balance sheet ASSETS
– Section 1 - Cash and cash equivalents – Section 2 - Financial assets measured at fair value through profit and loss – Section 3 - Financial assets measured at fair value through other comprehensive income – Section 4 - Financial assets measured at amortised cost – Section 5 - Hedging derivatives – Section 6 - Fair value adjustment of financial assets in hedged portfolios – Section 7 - Equity investments – Section 8 - Property plant and equipment – Section 9 - Intangible assets – Section 10 - Tax credits and liabilities – Section 12 - Other assets
LIABILITIES – Section 1 - Financial liabilities measured at amortised cost – Section 2 - Financial liabilities held for trading – Section 4 - Hedging derivatives – Section 5 - Fair value adjustment of financial liabilities in hedged portfolios – Section 6 - Tax liabilities – Section 7 - Liabilities associated with non-current assets held for sale – Section 8 - Other liabilities – Section 9 - Provision for severance indemnities – Section 10 - Provisions for risks and charges – Section 12 - Corporate capital
61Notes to the Financial Statements

Dexia Crediop S.p.A.62
Other information 1 - Guarantees given and commitments (other than those designated at fair value) 2 - Other guarantees given and commitments 3 - Assets pledged as collateral of liabilities and commitments 5 - Management and broking on behalf of third parties 6 - Financial assets subject to offsetting, enforceable master netting arrangements and similar agreements 7 - Financial liabilities subject to offsetting, enforceable master netting arrangements and similar agreements
Part C – Comments on the income statement – Section 1 - Interest – Section 2 - Commissions – Section 3 - Dividend and similar income: – Section 4 - Trading gains (losses) – Section 5 - Hedging gains (losses) – Section 6 - Disposal/repurchase gains (losses) – Section 7 - Gains (losses) on other financial assets and liabilities measured at fair value through profit and loss – Section 8 - Net adjustments for credit risk – Section 9 - Profits/losses from contractual changes without derecognition – Section 10 - Administrative expenses – Section 11 - Net provisions for risks and charges – Section 12 - Net adjustments on property plant and equipment – Section 13 - Net adjustments on intangible assets – Section 14 - Other operating expenses and income – Section 18 - Profits/Losses on disposal of investments – Section 19 - Tax on profit from continuing operations
Part D – Comprehensive income Analytic statement of comprehensive income
Part E – Comments on risks and associated hedging policies Section 1 – Credit risk
Qualitative information 1. General aspects 2. Credit risk management policies
2.1 Organisational aspects 2.2 Management, measuring and audit systems 2.3 Credit risk mitigation techniques 2.4 Impaired financial assets
3. Non-performing loan exposures 3.1 Strategies and management policies
4. Financial assets subject to commercial renegotiation and forborne exposures Quantitative information
A. Credit quality A.1 Non-performing and performing loan exposures: amounts, write-downs, trends, economic distribution A.2 Classification of financial assets, commitments and guarantee given according to external and internal ratings A.3 Breakdown of secured exposures according to type of guarantee
B. Distribution and concentration of credit exposures B.1 Distribution of on and off-balance sheet customer loan exposures according to sector (book value) B.2 Distribution of on and off-balance sheet customer loan exposures according to area (book value) B.3 Distribution of on and off-balance sheet bank loan exposures according to area (book value) B.4 Large exposures
C. Securitisation transactions Qualitative information Quantitative information
C.2 Exposure to main “third party” securitisation transactions according to type of securitised assets and type of exposure
E. Disposal transactions A. Financial assets sold but not fully derecognized
Qualitative information Quantitative information
Dexia Crediop S.p.A.62

Other information 1 - Guarantees given and commitments (other than those designated at fair value) 2 - Other guarantees given and commitments 3 - Assets pledged as collateral of liabilities and commitments 5 - Management and broking on behalf of third parties 6 - Financial assets subject to offsetting, enforceable master netting arrangements and similar agreements 7 - Financial liabilities subject to offsetting, enforceable master netting arrangements and similar agreements
Part C – Comments on the income statement – Section 1 - Interest – Section 2 - Commissions – Section 3 - Dividend and similar income: – Section 4 - Trading gains (losses) – Section 5 - Hedging gains (losses) – Section 6 - Disposal/repurchase gains (losses) – Section 7 - Gains (losses) on other financial assets and liabilities measured at fair value through profit and loss – Section 8 - Net adjustments for credit risk – Section 9 - Profits/losses from contractual changes without derecognition – Section 10 - Administrative expenses – Section 11 - Net provisions for risks and charges – Section 12 - Net adjustments on property plant and equipment – Section 13 - Net adjustments on intangible assets – Section 14 - Other operating expenses and income – Section 18 - Profits/Losses on disposal of investments – Section 19 - Tax on profit from continuing operations
Part D – Comprehensive income Analytic statement of comprehensive income
Part E – Comments on risks and associated hedging policies Section 1 – Credit risk
Qualitative information 1. General aspects 2. Credit risk management policies
2.1 Organisational aspects 2.2 Management, measuring and audit systems 2.3 Credit risk mitigation techniques 2.4 Impaired financial assets
3. Non-performing loan exposures 3.1 Strategies and management policies
4. Financial assets subject to commercial renegotiation and forborne exposures Quantitative information
A. Credit quality A.1 Non-performing and performing loan exposures: amounts, write-downs, trends, economic distribution A.2 Classification of financial assets, commitments and guarantee given according to external and internal ratings A.3 Breakdown of secured exposures according to type of guarantee
B. Distribution and concentration of credit exposures B.1 Distribution of on and off-balance sheet customer loan exposures according to sector (book value) B.2 Distribution of on and off-balance sheet customer loan exposures according to area (book value) B.3 Distribution of on and off-balance sheet bank loan exposures according to area (book value) B.4 Large exposures
C. Securitisation transactions Qualitative information Quantitative information
C.2 Exposure to main “third party” securitisation transactions according to type of securitised assets and type of exposure
E. Disposal transactions A. Financial assets sold but not fully derecognized
Qualitative information Quantitative information
E.1 Financial assets sold fully recognized and related financial liabilities: book value E.3 Disposal transaction with liabilities having recourse exclusively on assets sold and not fully derecognized: fair value
Section 2 – Market risks 2.1 Interest rate risk and price risk - regulatory trading book
Qualitative information A. General aspects B. Management processes and measurement methods of the interest rate risk and price risk Quantitative information 1. Regulatory banking book: distribution according to residual maturity (re-pricing date)of cash assets and liabilities and financial derivatives 3. Regulatory trading book - internal models and other sensitivity analysis methods
2.2 Interest rate risk and price risk - banking book Qualitative information A. General aspects, management procedures and measurement methods of the interest rate risk and price risk Quantitative information 1. Banking book: distribution according to residual maturity (re-pricing date) of financial assets and financial liabilities 2. Banking book: internal models and other methods for analysing sensitivity
2.3 Exchange rate risk Qualitative information A. General aspects, management processes and measurement methods of the exchange rate risk B. Exchange rate risk hedging activities Quantitative information 1. Distribution according to currency of the assets, liabilities and derivatives
2.4 Derivative instruments A. Financial derivatives B. Credit derivatives C. Credit and financial derivatives
Section 3 - Derivative instruments and hedging policies 3.1 Trading financial derivatives
A. Financial derivatives B. Credit derivatives
3.2 Accounting hedgesQualitative information A. Fair value hedging B. Cash flow hedging D. Hedging instruments E. Hedged items Quantitative information
A. Hedging financial derivatives D. Hedged instruments E. Effects of hedging policy to corporate capital Section 4 – Liquidity risk
Qualitative information A. General aspects, management processes and measurement methods of liquidity risk
Quantitative information 1. Distribution by maturity according to residual contractual term of financial assets and liabilities
Section 5 – Operational risks Qualitative information A. General aspects, management processes and measuring methods of the operational risk Quantitative information
Part F – Comments on the capital Section 1 – Corporate capital
A. Qualitative information B. Quantitative information
Section 2 – Own funds and capital ratios
Part H – Transactions with related parties 1. Information on key management personnel’s remuneration 2. Information on transactions with related parties
Part L – Information on sectors
Balance sheet data of parent company Dexia Crédit Local
63Notes to the Financial Statements

Dexia Crediop S.p.A.64
A. 1 – General Part
Section 1 – Declaration of conformity to international accounting standards
The Annual Report of the Dexia Crediop Company for the year ending 31 December 2018 were prepared in accordance with the International Financial Reporting Standards and the International Accounting Standards (hereafter “IFRS”, “IAS”, or “international accounting standards”) issued by the International Accounting Standards Board (IASB) and adopted by the European Commission according to procedures referred to in Article 6 of Regulation (EC) no. 1606/2002 of the European Parliament and Council dated 19 July 2002, which were approved on that date. The Annual Report was also prepared in accordance with the Bank of Italy’s instructions contained in Circular n. 262 of 22 December 2005 and later updates.
The IAS/IFRS principles approved and in effect at 31 December 2018 were used in preparing the Annual Report (including the interpretative documents known as SIC and IFRIC).
The table below indicates the new international accounting principles or the amendments to accounting principles already in existence, with the relative approval regulations of the European Commission, which took effect during 2018.
Document title Approval date EU Regulation publication date
IFRIC 22 Foreign Currency Transactions and Advance Consideration (issued on8 December 2016) 28 March 2018 3 April 2018
Amendments to IFRS 9: Prepayment Features with Negative Compensation(issued on 12 October 2017) 22 March 2018 26 March 2018
Amendments to IAS 40: Transfers of Investment Property (issued on8 December 2016) 14 March 2018 15 March 2018
Amendments to IFRS 2: Classification and Measurement of Share-based Payment Transactions (issued on 20 June 2016) 26 February 2018 27 February 2018
Amendments to IAS 7: Disclosure Initiative (issued on 29 January 2016) 6 November 2017 9 November 2017
Amendments to IAS 12: Recognition of Deferred Tax Assets for Unrealised Losses (issued on 19 January 2016) 6 November 2017 9 November 2017
Amendments to IFRS 4: Applying IFRS 9 Financial Instruments with IFRS 4 Insurance Contracts (issued on 12 September 2016) 3 November 2017 9 November 2017
Clarifications to IFRS 15 Revenue from Contracts with Customers(issued on 12 April 2016) 31 October 2017 9 November 2017
IFRS 9 Financial Instruments (issued on 24 July 2014) 22 November 2016 29 November 2016
IFRS 15 Revenue from Contracts with Customers (issued on 28 May 2014) including amendments to IFRS 15: Effective date of IFRS 15 (issued on 11 September 2015) 22 September 2016 29 October 2016
The table below instead shows the new international accounting standards, and relative European Commission approval regulations, which must be applied as of 1 January 2019.
Document title Approval date EU Regulation publication date
IFRIC 23 Uncertainty over Income Tax Treatments (issued on 7 June 2017) 23 October 2018 24 October 2018
IFRS 16 Leases (issued on 13 January 2016) 31 October 2017 9 November 2017
Part A – Accounting policies

The new accounting standard IFRS 16 Leases
The accounting standard IFRS 16 “Leases”, issued by the International Accounting Standard Board (IASB) in January 2016 and approved by the European Commission in October 2017, too effect on 1 January 2019, replacing IAS 17 “Leasing” relative to accounting for leasing contracts.
IFRS 16 supplies a complete model for identifying and handling leasing contracts in the financial statements of lessees and lessors.
In particular, the new standard introduces a significant change for the accounting model used by the lessee, eliminating the distinction between operating and financial leases used in IAS 17 and requiring that all leasing contracts be represented in the financial statements, apart from limited exceptions for short term lease contracts and leases involving modest values.
On the basis of this model, when a contract falls within the definition of leasing established under IFRS 16, the lessee must recognise a right of use asset relative to the leased asset and a lease liability for the debt contracted for the relative right of use, initially measured as the current value of the payments due throughout the duration of the contract. Subsequently, the asset represented by the right of use is amortised, generally at constant rates, and the liability is measured at the amortised cost.In the income statement, amortisation of the right to use is represented separately with respect to the interest expense associated with the lease liability.
The new accounting standard does not involve any significant changes with respect to the lessor’s accounting in comparison to IAS 17 (distinction between financial and operating leases).
First adoption options
In compliance with IFRS 16, the Dexia Group, and therefore Dexia Crediop, has decided to not apply the new accounting model to leasing contracts with a duration of less than one year (including renewal options) and contracts for assets with a limited unit value.
Impacts from initial application of IFRS 16 on the Dexia Crediop financial statements
On the basis of the analysis performed at the level of the Dexia Group, there will be no impacts on Dexia Crediop deriving from the transition to IFRS 16.
Section 2 – General accounting principles
The company’s annual report was drawn up in true and fair fashion and consist of the balance sheet, the income statement, the statement of total income, the statement of changes in shareholders’ equity, the statement of changes in the financial position and the notes to the statements. The annual report is also accompanied by the Directors’ Report on Operations.
The annual report was drawn up in units of one euro.
65Notes to the Financial Statements

Dexia Crediop S.p.A.66
1 The issuing act of the 5th update of the Bank of Italy Circular no. 262/2005 states that “With reference to comparative information (T-1), banks that make use of the exemption from the obligation to restate the comparative values provided for in paragraphs E1 and E2 of IFRS 1 “ First-time Adoption of International Financial Reporting Standards” must include, in the first financial statements prepared on the basis of this update, a statement of reconciliation indicating the method used and providing a reconciliation between the data of the last approved financial statements and the first financial statements prepared according to the these provisions. The form and content of such notice shall be decided autonomously by the competent corporate bodies.
The schedules of the balance sheet, income statement and statement of total income consist of items identified with numbers and sub-items identified with letters together with additional information (the various “of which” references relative to the items and sub-items). The items, sub-items and associated additional information make up the annual report accounts. Each account in the balance sheet, income statement and statement of total income also shows the amount relating to the previous period. The balance sheet, income statement and statement of total income do not include any accounts with zero amounts in both the year of reference and the previous financial year.
The notes to the statements were drawn up in thousands of euro. Any items and tables which do not have any amounts are not mentioned in the notes to the statements.
The annual report was drawn up according to the going concern principle and the accruals concept.
The going concern principle for the Dexia Group and for Dexia Crediop is also described in the Report on Operations, in the paragraph “Operating Prospects”.
The Dexia Crediop 2018 financial statements were prepared applying accounting standards IFRS 9 “Financial Instruments” and IFRS 15 “Revenue from Contracts with Customers”, which took effect on 1 January 2018.
With reference to IFRS 9, the impact deriving from the first application on 1 January 2018, retrospectively, was recognised in specific Shareholders’ equity accounts. Instead, there are no modifying effects of Shareholders’ Equity following the application, from the mandatory effective date and retrospectively, of IFRS 15.
As is allowed under the new accounting standard (paragraph 7.2.15 of IFRS 9), Dexia Crediop has decided not to present comparative information for 2017 in the annual report for 2018, recalculated within the scope of application of IFRS 9, but to instead maintain the data shown on the basis of the provisions within IAS 39.
For the Balance Sheet structure (and subsequent disclosure provided in the Notes), the figures at 31 December 2018 were compared with those from the last annual financial statements, determined by applying IAS 39, but restated in the new financial statement items to reflect the classification imposed under IFRS 9.In compliance with the provisions of the act issuing the 5th update of Circular 262 “The Bank’s financial statements: models and compilation rules”1, however, a statement of reconciliation between the data of the last approved financial statements applying the previous standard and the first financial statements prepared according to the new provisions is provided (see the section below “Impacts from initial adoption of IFRS 9 on the Dexia Crediop financial statements”).The figures relative to the Income Statement (and subsequent disclosure provided in the Notes) were also compared with those from the last annual financial statements prepared using standard IAS 39 and therefore are not entirely comparable.Additionally, for the purposes of comparability with the data as at 31 December 2018, the differentials on hedging derivative relating to 31 December 2017 were reclassified among interest income (item 10) or liabilities (item 20) based on the sign of interest of the hedged item, in accordance with the 5th update of Circular no. 262 of 22 December 2017 standard.
The new accounting standard IFRS 9 Financial Instruments
The accounting standard IFRS 9 “Financial Instruments” was issued by the International Accounting Standards Board (IASB) in July of 2014 and approved by the European Union on 22 November 2016. This

standard took effect on 1 January 2018 and envisages three stages for the definitive replacement of IAS 39 “Financial Instruments”: Recognition and Measurement: classification and measurement, write-downs for impairment and hedge accounting.
The main changes introduced by IFRS 9 include:• an approach to classification and measurement of financial assets based on the business model of the
entity and the financial flows associated with each financial asset;• a recognition model for write-downs of credit losses based on expected losses;• a new model for hedge accounting.
IFRS 9 also modifies IFRS 7, requiring an additional disclosure for financial instruments.
Classification and measurement
Financial assets
The new financial asset classification model envisages that they be measured at amortised cost, at fair value with changes recognised to shareholders’ equity (FVOCI - Fair Value Through Other Comprehensive Income) or at fair value with changes recognised directly in the Income Statement (FVTPL - Fair Value Through Profit and Loss).
Classification of financial assets must be done in accordance with two guidelines:• analysis of the characteristics of the contractual flows associated with each asset;• the business model adopted to manage these assets.
The business model reflects the decisions made by Dexia Crediop management.
Business model means the methods the entity uses to manage its assets in order to generate cash flows. In particular, a distinction is made between cases in which cash flows are generated by the receipt of contractual flows, from sales of assets or from a combination of the two methods.
Specifically, assets managed with the objective of holding them to receive contractual cash flows (Held to Collect), when the latter are represented by Solely Payments of Principal and Interest (SPPI), are measured at amortised cost.
Assets managed with both the objectives of receiving contractual cash flows and/or selling them (Held to Collect and Sale) and that have SPPI cash flows, are measured at fair value with a contra-entry in shareholders’ equity (Fair Value in Other Comprehensive Income).
Financial assets with cash flows not classifiable as SPPI are measured at fair value through profit and loss (FVTPL).
Financial assets with a business model that does not fall within either of the two previously listed categories (for example trading assets) are measured at fair value through profit and loss (FVTPL).
A financial asset may be irrevocably classified as FVTPL at initial recognition, when this designation makes it possible to significantly reduce or eliminate an accounting mismatch that derives from financial assets or liabilities measured on bases other than FVTPL.
With regard to equity instruments not held for trading purposes, these may be designated when first registered at their fair value with a contra-entry in shareholders’ equity (FVOCI). Changes in fair value
67Notes to the Financial Statements

Dexia Crediop S.p.A.68
of these instruments are not subject to reclassification in the Income Statement even in the case of sale. Moreover, these equity instruments are not subject to impairment.
Derivatives continue to be measured at fair value in the income statement (FVTPL). If they are part of hedging relationships, measurement follows that of the relationship itself.
Financial liabilities
The basic category for financial liabilities continues to be amortised cost, as in IAS 39. The exception is liabilities measured at fair value in the income statement (FVTPL), such as derivatives and financial liabilities held for trading and liabilities designated for FVO. The most significant change in the measurement of financial liabilities on the basis of IFRS 9 is that changes in fair value relative to own credit risk are recognised in Other Comprehensive Income (OCI), instead of the Income Statement, for liabilities measured at FVTPL.
Impairment
IFRS 9 establishes a new impairment model based on expected losses, which replaces the incurred loss model found in IAS 39.
The scope of application is financial assets measured at amortised cost, debt instruments measured at fair value with offsetting in other comprehensive income, leasing contracts, financial guarantees issued and loan commitments.
In this model, each financial instrument (with the exclusion of those originating or purchased as already non-performing) is placed in one of the three buckets (or risk stages) established by the standard, based on changes in its credit risk starting from the initial evaluation:
• Bucket 1 (stage 1): financial instruments that have not undergone a significant increase in credit risk since initial recognition;
• Bucket 2 (stage 2): financial instruments that have undergone a significant increase in credit risk since initial recognition, but for which objective evidence of a loss of value does not exist;
• Bucket 3 (stage 3): non-performing financial instruments.
The amount of expected losses and the calculation of interest income using the effective interest rate method depend on the bucket which a financial instrument is placed.
When a financial instrument is classified in bucket 1, the expected losses are assessed over a 12-month time horizon, while when the instrument is placed in buckets 2 and 3, the expected losses are assessed considering the entire life of the instrument.
The calculation of the interest income of the instruments placed in buckets 1 and 2 is carried out by applying the effective interest rate to the gross amount, while for the instruments placed in bucket 3 the effective interest rate is applied to the amortised cost.
Given that IFRS 9 does not provide a precise definition of “default”, Dexia Crediop has chosen to use a prudential definition found in Article 178 EU regulation no. 575/2013 (CRR), consistent with that provided by the supervisory authorities and used by credit risk management.
As of 1 January 2015, following a request by the European Central Bank (ECB) to adopt a threshold of relevance for missing payments, as indicated by the European Banking Authority (EBA), Dexia Crediop

decided to adopt a threshold of e 500. This threshold takes into account unpaid amounts relative to capital and interest (including any interest on arrears and fees and commissions).A payment is considered to be late when the contractual maturity date is not respected. Therefore, two credit obligations coming due on the same date and not paid constitute two distinct non-payments.The concept of default is applied at the debtor level. This means that if a counterparty is in default for one exposure, they are considered in default for all exposures.
Hedge accounting
With respect to IAS 39, IFRS 9 leaves unchanged hedge accounting models based on three types of hedges (cash flow hedge, fair value hedge and hedges of net investment in a foreign operation), as well as the need to designate and document the initial hedge and its effectiveness.
The main changes introduced by the new standard include:• the extension of the scope of hedged and hedging elements;• the introduction of a new alternative to hedge accounting: FVO for certain credit risk positions
hedged with credit derivatives;• simplification of the hedging efficacy test with the removal of the 80-125% threshold envisaged in
IAS 39;• additional disclosure requirements for risk management policies and risk hedging activities.
Relative to the hedging strategies for open portfolios of financial assets and liabilities (Macro-hedge Accounting), the IASB has decided to deal with these in a project that is separate from IFRS 9.While awaiting a future standard dedicated to macro-hedging relationships, in paragraph 7.2.21 IFRS 9 allows continued usage of the provisions within IAS on portfolio hedging.
Dexia Crediop has therefore decided to maintain the requirements already in force for IAS 39 for all hedging relationships.
Nonetheless, the failure of a financial asset to pass the SPPI test and its consequent classification among financial assets measured at fair value through profit or loss, also produces effects on the classification of the pre-existing hedging derivatives.In fact, these derivatives fall under the definition of “Economic Hedges”, and although they maintain a relationship of an economic kind with the underlying, they are presented in the financial statements under item 20 “Financial assets measured at fair value through profit or loss” just like trading derivatives.
The transition to IFRS 9 and its impact
Considering the importance of IFRS 9 for banks, Dexia Crediop started the IFRS 9 project in the first quarter of 2015 as part of the Dexia Group’s specific project task force.
Analysis was done, reviewing the characteristics, classification and measurement methods used for all financial assets.
This indicated that most assets fall in the SPPI category and, based on the Dexia Crediop business model decisions, can therefore be included in the categories of assets measured at the amortised cost or at fair value with a contra-entry in shareholders’ equity (FVOCI). These assets mainly consist of plain vanilla fixed or variable rate loans and debt securities.
However, based on the resolution plan approved by the European Commission in 2012, Dexia Crediop, as well as the rest of the Dexia Group, cannot generate new financial assets and manage its residual
69Notes to the Financial Statements

Dexia Crediop S.p.A.70
assets in run-off, however without an obligation to accelerate sales so as to safeguard Dexia’s capital.In view of this, Dexia Crediop has opted for the collection of contractual flows until maturity (Held to Collect) of financial assets falling under the SPPI category which are therefore valued at the amortised cost.
Some loans with structured interest rates were instead classified in the FVTPL category if they did not pass the SPPI test.
Additionally, the Dexia Group defined a new model to calculate impairment, from which Dexia Crediop will also benefit.
As noted in the previous paragraph, financial assets were divided into three buckets, based on the following approach:
• Financial assets in default, as defined in the prudential regulations, are placed in bucket 3;• For other financial assets, placement in buckets 1 or 2 will depend on the results of:
- a quantitative test that will determine whether credit risk has become impaired following initial recognition and the significance of said impairment.
This test is based on changes in the default probability of the exposure from the date of origin to the reporting date;
- a qualitative test that includes a review of positions included on the watch list, identification of forborne exposures and sensitive economic sectors.
If at least one of the two tests gives a positive result, the asset is classified in bucket 2. Otherwise, if both tests are negative, it is classified in bucket 1.
Estimates of expected losses are based on a 12-month expected loss model for assets in bucket 1, while an expected loss model for the entire duration of the instrument will be used for assets in Buckets 2 and 3.
The amount of expected losses is based on exposure at the time of default, probability of default and losses consequential to a default, calculated carefully and using forward looking information, taking into account macroeconomic assumptions and forecasts for the medium period.
A third phase was then carried out at the Dexia Group level, in which the pros and cons deriving from the application of the new hedge accounting model were evaluated.Pending the new standard on macro-hedging, Dexia Crediop decided to maintain the requirements already in force for IAS 39 for all hedging relationships.
Finally, during 2017, Dexia Crediop concluded the analysis phase aimed at adapting the information systems and internal processes to the new requirements of IFRS9, starting from 1 January 2018. The implementation of these changes was tested throughout the year and was communicated to the Board of Directors.
First adoption options
As described in Section 2 - “General accounting principles”, Dexia Crediop has decided not to present comparative information for 2017 in the annual report for 2018, recalculated within the scope of application of IFRS 9, but to instead maintain the data shown on the basis of the provisions within IAS 39, allowed under the same standard.
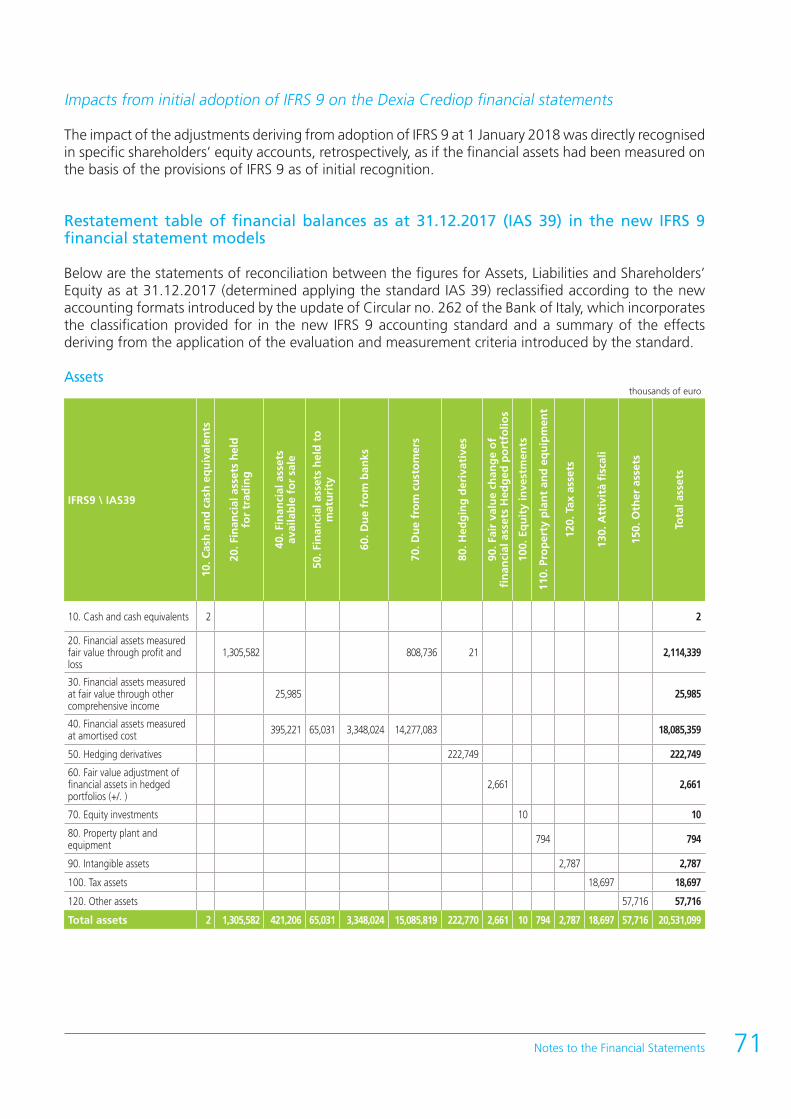
71Notes to the Financial Statements
Impacts from initial adoption of IFRS 9 on the Dexia Crediop financial statements
The impact of the adjustments deriving from adoption of IFRS 9 at 1 January 2018 was directly recognised in specific shareholders’ equity accounts, retrospectively, as if the financial assets had been measured on the basis of the provisions of IFRS 9 as of initial recognition.
Restatement table of financial balances as at 31.12.2017 (IAS 39) in the new IFRS 9 financial statement models
Below are the statements of reconciliation between the figures for Assets, Liabilities and Shareholders’ Equity as at 31.12.2017 (determined applying the standard IAS 39) reclassified according to the new accounting formats introduced by the update of Circular no. 262 of the Bank of Italy, which incorporates the classification provided for in the new IFRS 9 accounting standard and a summary of the effects deriving from the application of the evaluation and measurement criteria introduced by the standard.
Assetsthousands of euro
IFRS9 \ IAS39
10. C
ash
an
d c
ash
eq
uiv
alen
ts
20. F
inan
cial
ass
ets
hel
dfo
r tr
adin
g
40. F
inan
cial
ass
ets
avai
lab
le f
or
sale
50. F
inan
cial
ass
ets
hel
d t
om
atu
rity
60. D
ue
fro
m b
anks
70. D
ue
fro
m c
ust
om
ers
80. H
edg
ing
der
ivat
ives
90. F
air
valu
e ch
ang
e o
ffi
nan
cial
ass
ets
Hed
ged
po
rtfo
lios
100.
Eq
uit
y in
vest
men
ts
110.
Pro
per
ty p
lan
t an
d e
qu
ipm
ent
120.
Tax
ass
ets
130.
Att
ivit
à fi
scal
i
150.
Oth
er a
sset
s
Tota
l ass
ets
10. Cash and cash equivalents 2 2
20. Financial assets measured fair value through profit and loss
1,305,582 808,736 21 2,114,339
30. Financial assets measured at fair value through other comprehensive income
25,985 25,985
40. Financial assets measured at amortised cost 395,221 65,031 3,348,024 14,277,083 18,085,359
50. Hedging derivatives 222,749 222,749
60. Fair value adjustment of financial assets in hedged portfolios (+/. )
2,661 2,661
70. Equity investments 10 10
80. Property plant and equipment 794 794
90. Intangible assets 2,787 2,787
100. Tax assets 18,697 18,697
120. Other assets 57,716 57,716
Total assets 2 1,305,582 421,206 65,031 3,348,024 15,085,819 222,770 2,661 10 794 2,787 18,697 57,716 20,531,099

Dexia Crediop S.p.A.72
Liabilitiesthousands of euro
IFRS9 \ IAS39
10. D
ue
to b
anks
20. D
ue
to c
ust
om
ers
30. S
ecu
riti
es is
sued
40. F
inan
cial
liab
iliti
esh
eld
fo
r tr
adin
g
60. H
edg
ing
der
ivat
ives
100.
Oth
er li
abili
ties
110.
Em
plo
yee
term
inat
ion
ind
emn
itie
s
120.
Pro
visi
on
s fo
r ri
sks
and
ch
arg
es
Tota
l lia
bili
ties
10. Financial liabilities measured at amortised cost 10,285,044 4,611,092 673,135 15,569,271
20. Financial liabilities held for trading 1,338,899 154,522 1,493,421
50. Hedging derivatives 2,466,938 2,466,938
60. Tax liabilities 0
80. Other liabilities 29,869 29,869
90. Employee termination indemnities 1,485 1,485
100. Provisions for risks and charges 28,028 28,028
Total liabilities 10,285,044 4,611,092 673,135 1,338,899 2,621,460 29,869 1,485 28,028 19,589,012
Shareholders’ equitythousands of euro
IFRS9 \ IAS39140.
Valuation reserves
160. Rserves 180. Share capital
200. Net income(loss)
Total shareholders’
equity
110. Valuation reserves (28,857) (28,857)
140. Reserves 518,740 518,740
160. Share capital 450,210 450,210
180. Net income (loss) 1,994 1,994
Total shareholders’ equity (28,857) 518,740 450,210 1,994 942,087
Total liabilities and shareholders’ equity 20,531,099

73Notes to the Financial Statements
Effects of transition to standard IFRS 9
The impacts of the application of IFRS 9 deriving from the different classification and measurement, and therefore from the measurement criterion used, and from the adoption of the new impairment model provided for by the accounting standard are shown below.
Assetsthousands of euro
Item31/12/2017
(a)
Effect of transition to IFRS9 (b) 01/01/2018(c) = (a) + (b)Classification and
measurement Impairment
10. Cash and cash equivalents 2 2
20. Financial assets measured at fair value through profit and loss 2,114,339 (75,242) 2,039,097
30. Financial assets measured at fair value through other comprehensive income 25,985 25,985
40. Financial assets measured at amortised cost 18,085,359 33,114 13,484 18,131,957
50. Hedging derivatives 222,749 222,749
60. Fair value adjustment of financial assets in hedged portfolios (+/. ) 2,661 2,661
70. Equity investments 10 10
80. Property plant and equipment 794 794
90. Intangible assets 2,787 2,787
100. Tax assets 18,697 18,697
120. Other assets 57,716 57,716
Total assets 20,531,099 (42,128) 13,484 20,502,455
Liabilities and shareholders’ equitythousands of euro
Item 31/12/2017 (a)
Effect oftransition to
IFRS9 (b)
01/01/2018(c) = (a) + (b)
10. Financial liabilities measured at amortised cost 15,569,271 15,569,271
20. Financial liabilities held for trading 1,493,421 1,493,421
50. Hedging derivatives 2,466,938 2,466,938
80. Other liabilities 29,869 29,869
90. Emplotee termination indemnities 1,485 1,485
100. Provisions for risks and charges 28,028 8,810 36,838
110. Valuation reserves (28,857) 33,114 4,257
140. Reserves 518,740 (70,568) 448,172
160. Share capital 450,210 450,210
180. Net income (loss) 1,994 1,994
Total liabilities and shareholders’ equity 20,531,099 (28,644) 20,502,455
The application of the new classification and measurement rules provided for in IFRS 9 resulted in:• the reclassification of limited structure loan positions (balance sheet value at 31.12.2017 of 809 million),
based on their (not SPPI) characteristics from the amortised cost to the FVTPL category. The impact on net shareholder’s equity resulting from the fair value measurement of these instruments
is negative, due to the widening of spreads, and amounted to -75 million;• the reclassification of debt securities classified in financial assets available for sale to AFS (fair value of
395 million at 31.12.2017) in the amortised cost category. This reclassification had a positive impact on shareholders’ equity of 33 million due to the elimination
of negative reserves recognised as shareholders’ equity reserves according to the standard IAS 39, including AFS reserves relating to previous reclassifications of assets from the AFS category to the L&R category.
If these assets were not reclassified, at 31/12/2018 they would have had a fair value of 371 million, with a negative effect on other income statement items totalling around 29 million for the year;
• the reclassification of derivatives connected as regards management with assets reclassified in the FVTPL category (0 million of assets and 155 million of liabilities as at 31.12.2017) from the hedging derivatives category to the financial assets and liabilities held for trading category (Economic Hedge derivatives).
The adoption of the new impairment model provided for by IFRS 9 resulted in:• a positive effect of 13 million for financial assets valued at amortised cost. In particular, Dexia Crediop
did not see substantial changes for financial assets classified in bucket 3. The effect may be attributed mainly to assets classified in bucket 2, which includes financial instruments that have seen a significant increase in credit risk since initial measurement and which are on the watchlist;
• for financial guarantees issued and credit commitments, a negative effect of 9 million. In this regard, it should be noted that according to the new instructions provided by the Bank of Italy Circular no. 262, funds for credit risk against commitments to disburse funds and financial guarantees issued, must be included among the provisions for risks and charges.
In short, the impact of the introduction of the new IFRS 9 accounting standard on Dexia Crediop’s shareholders’ equity amounted to -38 million euro, of which:• -75 million attributable to the fair value measurement of instruments reclassified in the FVTPL category;• 33 million resulting from the cancellation of negative AFS reserves of instruments reclassified at
amortised cost;• 4 million related to the application of the new impairment rules.
With regards to the tax effects of FTA of IFRS 9, a net charge of around -70 million euro recognised in the FTA IFRS 9 reserve was identified, essentially consisting (for -75 million) of the net negative fair value of amounts due from customers reclassified to FVTPL, deductible during financial year 2018 on the basis of the provisions of the IFRS9 Tax Decree, to be done net of the net income (5 million) deriving from impairment of loans and debt securities reclassified in the amortised cost category.
No deferred tax assets were recognised relative to the negative difference resulting from calculation of estimated 2018 taxable income and on the deductible impacts of FTA, in line with the bank’s accounting policies for deferred taxes. Consequently, the FTA reserve recorded in shareholder’s equity is recognised gross of the tax effect.
Finally, note that the recognition of deferred tax assets not allocated at FTA has not time limits and, therefore, the relative positive tax impact may be recognised - if the requirements imposed by IAS 12 are met - at the appropriate time, in line with future taxable income observable over a defined time limit.
Dexia Crediop S.p.A.74
75Notes to the Financial Statements
The new accounting standard IFRS 15 Revenue from Contracts with Customers
IFRS 15 was issued in May 2014 and issues a new model for recognising revenues based on a distinction between a contractual obligation fulfilled at a single moment and an obligation fulfilled over time, associated with five phases applied to revenues deriving from contracts with customers. In the case of a contractual obligation fulfilled at a single moment, the revenue must be reflected in the financial statements only when full “control” over the asset or service being exchanged passes to the customer. Relevant for these purposes is not only significant exposure to the risks and benefits associated with the good or service, but also physical possession, customer acceptance, the existence of correlated legal rights, etc. In the case of a contractual obligation fulfilled over time, measurement and recognition of the revenues virtually reflect progress in terms of customer satisfaction levels. In practice, the entity must apply an accounting method based on the progress of the production or the costs sustained. The accounting standard provides a specific guide to direct the entity in selecting the most appropriate accounting method.
Finally, the new standard establishes that every individual obligation taken on by the vendor is subject to separate measurement, even if it is established as part of a single contractual or commercial context.
The new standard replaces all current requirements in IFRSs in terms of revenue recognition and is effective for financial years beginning on or after 1 January 2018, with full retrospective or amended application.
First adoption options
As is allowed under IFRS 15, Dexia Crediop has decided not to present comparative information for 2017 in the annual report for 2018, recalculated within the scope of application of IFRS 15, but to instead maintain the data shown on the basis of the provisions within IAS 18.
Impacts from initial application of IFRS 15 on the Dexia Crediop financial statements
Dexia Crediop applied the new standard as of its obligatory date of efficacy, using the full retrospective application method. Nonetheless, changes in equity were not seen following application of the standard.
Section 3 – Events after the balance sheet date
There were no events after the balance sheet date which entail a need to amend the results of the annual report as at 31 December 2018.
To that end, please see that stated in the section “Business outlook” in the Report on Operations.
Section 4 - Other aspects
In compliance with the cited international accounting principles, the preparation of the annual report obligatorily requires the use of estimates and hypotheses which are able to determine relevant effects on the values in the balance sheet and income statement, as well as in the disclosure provided regarding potential assets and liabilities.

Dexia Crediop S.p.A.76
These estimates and the associated hypotheses and assumptions are based on past experience and other current available information held to be reasonable for the purposes of identifying management facts. Given their intrinsic subjectivity, the estimates and hypotheses are naturally susceptible to changes, even sizeable, from one year to the next, based on changes in market parameters and other information used during the estimate process. The areas of the financial statement most affected by the subjective estimate and evaluation processes are the following:• determination of fair value for financial instruments not listed on active markets;• measurement of losses due to losses in value of financial assets based on IFRS 9;• evaluation of the severance indemnity fund and other funds for benefits due to employees;• estimate of allocations for other provisions for risks and charges;• estimates and assumptions of the recoverability of deferred tax assets (advance taxes).
On the closing date of this annual report there were also no apparent reasons to doubt the estimates which could lead to material amendments in the book values of the assets and liabilities. In addition, there were no changes made to the accounting estimates which have had effects in the current financial period. Information regarding the existence of the prospects of a going concern are also illustrated in the Report on Operations, in the Business Outlook section.
77Notes to the Financial Statements
A. 2 – The main aggregates of the annual report
1 – Financial assets measured at fair value through profit and loss (FVTPL)
This category includes all financial assets not classified in the portfolio of financial assets measured at fair value through other comprehensive income (FVOCI) and in the financial assets portfolio measured at amortised cost.
The item financial assets measured at fair value through profit and loss (FVTPL) includes:a) financial assets held for trading, such as debt securities, equity securities, loans and derivatives with a
positive value held for trading2;b) assets designated at fair value at initial recognition on the basis of the option recognised under IFRS 9;c) other financial assets mandatorily measured at fair value or financial assets which do not meet
requirements for classification at amortised cost or at FVOCI or which are not held for trading purposes. These are assets for which contractual cash flows do not represent solely payments of principal and
interest and therefore do not pass the “SPPI test”.
Initial recognition of financial assets occurs on the settlement date for debt and equity securities, on the disbursement date for loans and on the subscription (trade) date for derivative contracts.
Financial assets measured at fair value through profit and loss are initially recognised in the balance sheet at their fair value, which generally corresponds to the settlement price, exclusive of transaction costs and income which are immediately recognised in the income statement, as long as they are directly attributable to these financial instruments. When the settlement price is different from fair value, the financial asset is recognised at fair value and the difference compared to the settlement price is booked to the income statement.
Any commitments for transactions to be regulated that are in existence as of the date of the annual report are evaluated using the same criteria applied to regulated transactions.
Subsequent measurement is carried out on the basis of changes in the fair value and the result is booked to the income statement.
Differentials in derivative contracts classified in the trading portfolio and the results of the fair value measurement are included in “Net trading gains (losses)”.
Financial assets measured at fair value through profit and loss are derecognised only on expiry of the contractual rights relating to the cash flows or when the financial assets are sold with the transfer to third parties of all the risks and benefits associated with them. However, if a significant share of the risks and benefits of the sold financial assets are maintained, they continue to be recognised, even if ownership of such assets has effectively been transferred.
If substantial transfer of the risks and benefits cannot be ascertained, the financial assets are derecognised when no type of control is maintained over the same. Otherwise, when such control is retained, even partially, these assets are maintained on the balance sheet to the extent to which the said control is retained, calculated according to exposure to changes in the value of the sold assets and variations in the cash flows of the same.
2 Financial trading assets include the above cited operating or economic hedges.
Dexia Crediop S.p.A.78
These financial assets are derecognised on the date they are disposed of (settlement date).
Derivatives are considered financial assets if their fair value is positive and liabilities if their fair value is negative.The Group does not offset the current positive and negative values from transactions in existence with the same counterparty.
2 – Financial assets measured at fair value through other comprehensive income (FVOCI)
This category includes assets which meet both of the following conditions:• they are managed with the objective of collecting cash flows and/or selling them (Held to Collect and
Sale);• they have contractual cash flows which represent solely payments of principal and interest (SPPI). The item includes equity securities (equity investment in the Istituto per il Credito Sportivo) not held for trading purposes, which can be measured at fair value at initial recognition, with a contra-entry in shareholders’ equity (FVOCI).
The first recognition of the financial asset is done on the basis of the IAS criteria of “settlement date accounting”, meaning the settlement date for debt or equity securities and the disbursement date in the case of loans.
Any commitments for transactions to be regulated that are in existence as of the date of the annual report are evaluated using the same criteria applied to regulated transactions.
The category of financial assets measured at fair value through other comprehensive income, which are not equity securities, as well as the category of financial assets measured at amortised cost, are subject to impairment in accordance with the rules established in IFRS 9 and therefore to measurement of the significant increase in credit risk for the purposes of assigning them to buckets or risk stages (with reference to the methods of determining losses of value, please see that indicated in part E, section 1, paragraph 2.3 – Methods for measuring expected losses).
Financial assets measured at fair value through other comprehensive income are initially recognised in the balance sheet at fair value, which is normally the same as the purchase price, including any charges or revenue directly ensuing from the instrument. When the settlement price is different from fair value, the financial asset is recognised at fair value and the difference compared to the settlement price is booked to the income statement.
Subsequent measurement for instruments other than equity securities is carried out on the basis of the fair value with recognition of gains or losses deriving from changes in fair value booked to a specific reserve in shareholders’ equity. The portion of interest, determined using the amortised cost method, and the effects of impairment, are recognised in the income statement.Any accumulated or unrealised profits or losses on these instruments are recognised in the income statement when the asset is derecognised.
For equity securities in this category, subsequent fair value changes are not subject to reclassification in the income statement, even in the case of sale. Additionally, these equity instruments are not subject to impairment.

Changes in exchange rates for non-monetary instruments (equity securities) are booked to the specific shareholders’ equity reserve, while those relating to monetary instruments (loans and debt securities) are booked to the income statement.
To determine fair value for financial assets measured at fair value through comprehensive income and for derecognition criteria, please see that already stated for financial assets measured at fair value through profit and loss.
3 – Financial assets measured at amortised cost
This category includes financial assets (debt securities and loans) which meet both of the following conditions:• they are held as part of a business model with the objective of collecting contractual cash flows (Held
To Collect);• the contractual terms of the financial asset involve financial flows solely represented by payments of
principal and interest (SPPI).
This item includes loans to banks and customers, including debt securities with the characteristics outline above.
Initial recognition of a financial assets measured at amortised cost occurs on the disbursement date or, in the case of a debt security, on the settlement date. These assets are initially recognised at their fair value, equal to the amount paid out, or to the subscription/trading price, including any transaction costs/income directly attributable to the single receivable. Even if they have the above features, costs which are reimbursed by the borrower or which can be considered normal internal administrative costs are excluded.
After initial recognition, the financial assets in question are measured at amortised cost, using the effective interest rate method, equal to the initial booking value decreased/increased by equity payments, writedowns/writebacks and amortisation - calculated using the effective interest rate method - the difference between the amount paid out and that repayable at maturity, generally traceable to the costs/revenues directly attributed to the individual receivable. The effective interest rate is identified by calculating the rate that is equal to the current value of the future flows of the receivable, for capital and interest, to the amount paid out inclusive of costs/revenues traceable to the receivable. This method of accounting, using financial logic, makes it possible to distribute the economic effect of the costs/revenues throughout the expected maturity of the receivable.The amortised cost method is not used for short-term loans, as for these the effect of the application of the actualisation logic based on effective interest is negligible. For these receivables, interest matures “pro-rata temporis”, in accordance with the law of simple interest.
The book value of financial assets at amortised cost is closely connected to their classification in one of three buckets (or risk stages) as provided in the new IFRS 9 impairment model. The amount of expected losses and the calculation of interest income using the effective interest rate method depend on the bucket which the assets are classified in.In particular, when a financial instrument is placed in bucket 1, expected losses are measured over a time horizon of 12 months. When an instrument is placed in buckets 2 or 3, expected losses are measured for the entire life of the instrument. For more information on methods used to determine losses in value, please see that stated in part E, section 1, paragraph 2.3 – Methods for measuring expected losses).The calculation of the interest income of the instruments placed in buckets 1 and 2 is carried out by applying the effective interest rate to the gross amount, while for the instruments placed in bucket 3 the effective interest rate is applied to the amortised cost.
79Notes to the Financial Statements

Dexia Crediop S.p.A.80
The original value of financial assets designated at amortised cost is restored in subsequent financial periods to the extent to which the reasons for the writedown are no longer evident; the writeback is booked to the income statement and may not in any case exceed the amortised cost that the loan would have had in the absence of previous writedowns.
For the purposes of classifying impaired exposures in the various risk categories (non-performing loans, unlikely to pay, impaired past-due and/or over-the-limit exposures), reference is made to the regulations issued on the subject by the Bank of Italy together with the internal provisions which establish rules for classification and transfers within the scope of the various expected risk categories.
The financial assets in question are derecognised from the balance sheet only if the transfer involved the substantial transfer of all the risks and benefits connected to said loans. However, if a significant share of the risks and benefits of the sold assets is maintained, they continue to be recognised, even if ownership of such assets has effectively been transferred.
In the cases in which, during the life of an instrument, the original contractual conditions are modified in accordance with the desires of the parties, it is necessary to verify whether the original asset should continue to be recognised in the balance sheet or, if not, whether the original instrument must be derecognised and a new financial instrument recognised.Contractual changes to an asset lead to the derecognition of the same when the changes are “substantial” in qualitative or quantitative terms. Please see part E, section 1, paragraph 4 Financial assets subject to commercial renegotiation and exposures with forbearance measures for more information.
4 – Hedging derivatives
As described above in the section “The transition to IFRS 9 and its impact”, Dexia Crediop has decided to maintain the requirements already in effect through IAS 39 relative to Hedge Accounting for all its hedging relationships.
The item “Hedging derivatives” refers to instruments used to neutralize potential losses which may be recognised in a particular element and attributable to one or more types of risk (interest rate risk, exchange rate risk, price risk, credit risk, etc.).
The types of hedging used are the following:
• Fair value hedges, performed with the aim of hedging exposure to variations in the fair value of assets/liabilities recognised in the balance sheet; the subject of such hedging can be specific transactions, or an amount of balance sheet assets or liabilities, selected from a portfolio of financial instruments with a similar level of exposure to interest rate risk (generic hedges, as envisaged in the IAS 39 carve out adopted by the European Community);
• Cash flow hedges, performed with the aim of hedging the exposure to variations in expected cash flows of assets/liabilities recognised in the annual report or relating to highly probable future transactions.
A financial instrument is designated as a hedge if there is formal documentation on the relationship between the hedged item and the hedging instrument, which includes the risk management objectives, the strategy for carrying out the hedge and the methods used to test the effectiveness of the hedge itself.Dexia Crediop conducts an assessment at the start and periodically (on a quarterly basis), using forecasting and retrospective tests, to see whether or not the hedge is highly effective in offsetting the changes

in the fair value or the expected cash flows of the hedged instrument. The tests on effectiveness are considered as passed if the ratio between the changes in the fair value of hedging instruments and those of the hedged items fall within the range of 80-125%.
The hedging operation, and the relative Hedge Accounting are interrupted prospectively if: (i) the hedging operation through the derivative is revoked or is no longer highly effective; (ii) the derivative expires, is sold, annulled or exercised; (iii) the hedged item is sold, expires or is redeemed; (iv) it is no longer highly probable that the future hedged operation will be performed. In all the cases cited (except for the cases under (ii), the derivative in question is reclassified among financial instruments for trading.
The accounting rules for hedging transactions envisage the following (see IAS 39, §85-101):
• Like all derivatives, hedging derivatives are initially recognised in the balance sheet on the trade date and are subsequently measured at fair value. The “Hedging derivatives” items among the assets (item 50) and liabilities (item 40) on the balance sheet include the positive and negative value of derivatives which are part of effective hedging operations.
• In the case of effective fair value hedging, any changes in the value of the hedging instruments and the hedged instruments (as regards the part attributable to the hedged risk) are booked to the income statement. The differences between these variations in value constitute the partial ineffectiveness of the hedge and lead to a net impact in the income statement, recognised under item 90 “Net hedging gains/losses”. Variations in value of the elements hedged, attributable to the risk which is being hedged against, are booked to the income statement as a matching entry for the variation in value attributed to the element in question. In the case of generic hedging the changes in the fair value of the element hedged are posted in the appropriate items of the assets (60) and liabilities (50) of the balance sheet pursuant to IAS 39, paragraph 89A.
• If a fair value hedge ceases to exist for reasons other than realization of the hedged item, the variations in value of the latter, which were recognised in the balance sheet for as long as the effective hedge was maintained, are booked to the income statement under interest income or expenditures. When the hedge refers to interest-bearing financial instruments, this is done using the amortized cost principle, or in other cases with a single amount.
• As regards cash flow hedges, the gain or loss portion on a hedging instrument that is considered effective is initially recognised in shareholders’ equity (cash flow hedging reserve), under item 110 “Valuation reserves”. Any share of gain or loss associated with the hedging instrument, which exceeds the fair value change of the expected flows from the covered element in absolute value, is immediately booked to the income statement (over-hedging). When the cash flows being hedged become manifest and are recognised in the income statement, the relevant gain or loss on the hedging instrument is transferred from shareholders’ equity to the corresponding item in the income statement (90 - “Net hedging gains/losses”).
• In the case of interruption of a cash flow hedge relation, the total of the gain or loss of the hedging instrument previously booked to shareholders’ equity remains recognised in the specific equity reserve until the moment in which the transaction takes place or it is held that there is no longer a possibility that the transaction will occur. In this latter circumstance, this amount is transferred to the income statement under item 80 “Net trading gains/losses”. Fair value changes booked to item 110 of the liabilities are also recognised in the Statement of comprehensive income.
81Notes to the Financial Statements

Dexia Crediop S.p.A.82
5 – Equity investments
Investments in equity instruments fall under the definition of equity instruments contained in IAS 32.The item “Equity investments” includes equity investments in subsidiaries, associated companies and companies subject to joint control.Subsidiaries are companies in which the parent has the power to determine administrative, financial and management choices and in which it normally has more than half the voting rights. Associated companies are deemed to be those in which the Parent Company holds at least 20% share of the voting rights and companies whose administrative, financial and management choices are deemed to be subject to significant influence owing to the effects of actually existing legal links. Companies subject to joint control are deemed to be those where contractual agreements exist, which require the consent of the Company and of other investors with whom the control is shared, in order for administrative, financial and management choices to be made.Equity investments in subsidiaries, associated companies and companies under joint control, are booked to the balance sheet on the settlement date and are carried at cost, adjusted when impairment losses are ascertained.In the case that objective evidence of a loss in value is determined for an equity investment, an estimate of the recoverable value of the equity investment is carried out, corresponding to the greater of the fair value bet of sales expenses and the value in use. The value in use is the current value of the expected financial flows that the equity investment could generate, including the final disposal value.If the recoverable value is less than the book value of the equity investment, the associated writedown is recognised in the income statement under item 220 “Profit(Loss) from equity investments”.If the reasons for the write-down no longer exist, the reversals are booked to the income statement – under the same item 220 - only up to reinstatement of the original book value.
The associated dividend is recognised when the right to receive it arises.Minority interests, or at least those not subject to significant influence, are included under the item “Financial assets measured at fair value through other comprehensive income”.Equity investments are cancelled from the financial statement when the contractual rights on cash flows deriving from such assets cease, or when the equity is sold with substantial transfer of all risks and benefits linked to the same.
5.1 – Dividend Dividend is recognised when the right to receive it arises, which corresponds to the financial period in which the sum is received (IAS 18 paragraph 29).
6 – Property, plant and equipment
The item “Property, plant and equipment” includes assets held to be used for more than one financial year for the production and supply of services or for administrative purposes (e.g. instrumental assets). In line with paragraph 7 of IAS 16, Property, plant and equipment assets are recognised in the balance sheet only when it is reasonably possible to determine the cost of the asset and it is probable that the associated future economic benefits will accrue to the company. Therefore, it is important to establish the time when the risks and benefits attached to an asset are effectively transferred to the company, irrespective of when ownership is formally conveyed.
Property, plant and equipment assets are initially entered at cost, which includes not only the purchase price but also any associated charges directly ensuing from the purchase and costs involved in starting up the asset. The expenses incurred, subsequent to purchase, increase the book value of an asset or are recognised as separate assets only when they lead to an increase in future economic benefits due to the

use of the asset; other expenses incurred subsequent to purchase are booked to the income statement in the period in which they are incurred. In periods subsequent to that of initial recognition, assets are recognised in the accounts on the basis of the amortisable historical cost method. The relevant amortisation is carried out on the basis of the possible residual useful life of the assets. The useful life of Property, plant and equipment assets subject to depreciation is periodically re-assessed.A Property, plant and equipment asset is eliminated from the balance sheet when it is sold or scrapped and when no future economic benefits are expected from its use.
7 – Intangible Assets
The item “Intangible assets” includes assets that can be identified and are without physical consistency, which originate from legal or contractual rights and which are held to be used over a number of years. In the main, they are represented by application software.Intangible assets are recognised at cost, net of overall depreciation and permanent impairment losses, only if the future economic benefits ascribable to the asset are likely and if the cost of the asset itself can be measured reliably. Otherwise, the cost of the assets is booked to the Income Statement in the year in which it was incurred.Intangible assets recognised in the balance sheet are amortised on the basis of their residual useful life according to a straight-line method. The period and method of amortisation are re-assessed at the end of each financial period.An intangible asset is eliminated from the balance sheet when it is disposed of or when no future economic benefits are expected.
8 – Current and deferred taxes
Current income taxes are calculated on the basis of the tax result for the year. These taxes are entered as tax liabilities if they exceed the amounts already paid in advance during the year, and as tax assets if the amounts paid in advance exceed the taxes for the period.Current taxes are booked as a revenue or as a charge and are included in profits or losses for the year except for taxes that refer to items that are accredited or debited directly to shareholders’ equity, in which case they are booked directly to shareholders’ equity.With regards to deferred taxes, already as of financial year 2014, in accordance with that foreseen IAS 12, net advance tax assets were cancelled as the company did not hold it likely that they would be recovered in the future, nor that the value of the assets or liabilities recognised in the balance sheet would be extinguished through reductions or increases in future tax payments. Only those tax assets for which transformation into tax credits pursuant to Law 214/2011 is expected remained registered, for which it is automatically held that the probability test of IAS 12 is passed, in accordance with the Bank of Italy/CONSOB/ISVAP document no. 5 of 15 May 2012.
9 – Provisions for risks and charges
According to that envisaged in IAS 37, provisions for risks and charges involves exclusively provisions for current obligations (legal or implicit) originating from a past event, for which:• the payment of financial resources to fulfil said obligation is probable;• it is possible to make a reliable estimate of the relative amount.
If the time factor is significant, the provisions, which are recognised in contra-items in the income statement, are discounted at current market rates.
83Notes to the Financial Statements
Dexia Crediop S.p.A.84
The item includes provisions for early retirement incentives, applying the rules of the national contracts for bank workers and of specific company agreements.
9.1 – Provisions for risks and charges against commitments and guarantees issuedThe sub-item “commitments and guarantees issued” includes provisions for credit risks based on commitments to disburse funds and financial guarantees issued which are subject to the impairment rules established under IFRS 9 and provisions for other commitments and guarantees that do not fall under the cited scope of application.For the first type, that already illustrated relative to allocation within the three risk stages and calculation of expected losses applies (see paragraph 14.7) for financial assets measured at amortised cost and financial assets measured at fair value through other comprehensive income.
9.2 – Provisions for retirement funds and similar benefitsStaff pension funds include the various complementary retirement plans with defined benefits, established to implement company agreements and recognised in the accounts in compliance with the provisions of IAS 19 “Employee benefits”. These plans are considered defined benefit plans, in that they guarantee a series of benefits which depend on factors such as age, years of service, and salary prospects for employees, regardless of the effective performance of any financial assets used to serve the plan. In these cases, the actuarial risk and the investment risk fall mainly on the Company that guarantees the plan.Liabilities related to these plans and the relative retirement costs relating to current employment are determined by independent actuaries on the basis of actuarial and financial hypotheses defined by the Dexia Group, using the Project Unit Credit Method. This method makes it possible to uniformly distribute the cost of the benefit throughout the working life of the employee, as a function of the discount rate set, the years of service matured, hypotheses of salary increases, and theoretical seniority reached at the time the benefit is paid out.
More specifically, the amount booked as liability in item 120.b) “Provisions for risks and charges-retirement funds and similar benefits” is equal to the algebraic sum of the following values:• current value of the obligation at the reference date (calculated using the above method);• minus the fair value of any assets that serve the plan.
The cost components of benefits are recognised as follows:• the pension cost and net interest on the net liabilities (assets) are recognised in the income statement,
according to the actuarial method already provided for in the previous text of IAS 19;• the revaluations of net liabilities (assets) are recognised in the other components of comprehensive
income (O.C.I.) Para. 122 specifies that the amounts recognised in other comprehensive income can be reclassified to shareholders’ equity.
9.3 – Other provisions for risks and charges This item includes provisions made against legal and implicit obligations existing at the close of the period, including provisions for employee early retirement schemes and other social security and health charges, and provisions for the creation of the reserve required for paying employees their long-service bonuses according to the terms of company regulations.These liabilities are determined, in the same way as pension funds, on the basis of an assessment conducted by an independent actuary using the methods laid down in IAS 19 (refer to that above in Provisions for retirement funds and similar benefits). The actuarial gains and losses are therefore recognized in the balance sheet with a contra-item in the income statement.The provisions are reviewed at each balance sheet date and adjusted to reflect the current best estimate.
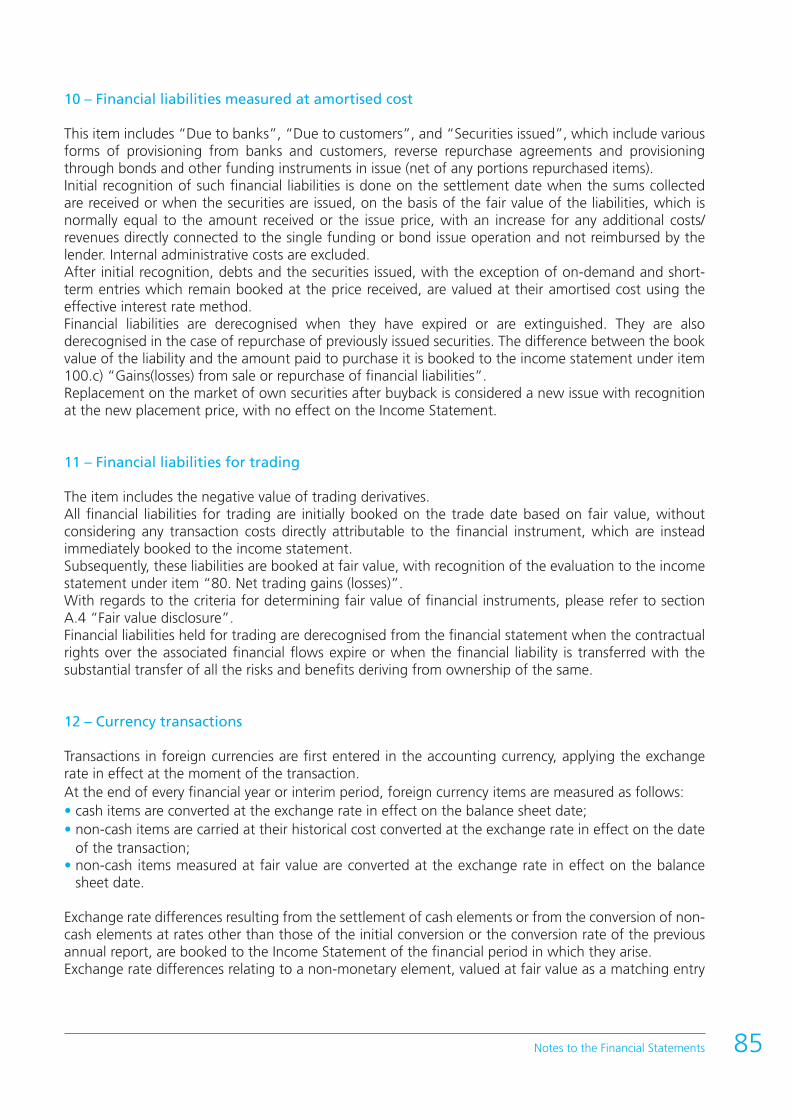
10 – Financial liabilities measured at amortised cost
This item includes “Due to banks”, “Due to customers”, and “Securities issued”, which include various forms of provisioning from banks and customers, reverse repurchase agreements and provisioning through bonds and other funding instruments in issue (net of any portions repurchased items). Initial recognition of such financial liabilities is done on the settlement date when the sums collected are received or when the securities are issued, on the basis of the fair value of the liabilities, which is normally equal to the amount received or the issue price, with an increase for any additional costs/revenues directly connected to the single funding or bond issue operation and not reimbursed by the lender. Internal administrative costs are excluded. After initial recognition, debts and the securities issued, with the exception of on-demand and short-term entries which remain booked at the price received, are valued at their amortised cost using the effective interest rate method. Financial liabilities are derecognised when they have expired or are extinguished. They are also derecognised in the case of repurchase of previously issued securities. The difference between the book value of the liability and the amount paid to purchase it is booked to the income statement under item 100.c) “Gains(losses) from sale or repurchase of financial liabilities”. Replacement on the market of own securities after buyback is considered a new issue with recognition at the new placement price, with no effect on the Income Statement.
11 – Financial liabilities for trading
The item includes the negative value of trading derivatives.All financial liabilities for trading are initially booked on the trade date based on fair value, without considering any transaction costs directly attributable to the financial instrument, which are instead immediately booked to the income statement.Subsequently, these liabilities are booked at fair value, with recognition of the evaluation to the income statement under item “80. Net trading gains (losses)”.With regards to the criteria for determining fair value of financial instruments, please refer to section A.4 “Fair value disclosure”.Financial liabilities held for trading are derecognised from the financial statement when the contractual rights over the associated financial flows expire or when the financial liability is transferred with the substantial transfer of all the risks and benefits deriving from ownership of the same.
12 – Currency transactions
Transactions in foreign currencies are first entered in the accounting currency, applying the exchange rate in effect at the moment of the transaction.At the end of every financial year or interim period, foreign currency items are measured as follows:• cash items are converted at the exchange rate in effect on the balance sheet date;• non-cash items are carried at their historical cost converted at the exchange rate in effect on the date
of the transaction;• non-cash items measured at fair value are converted at the exchange rate in effect on the balance
sheet date.
Exchange rate differences resulting from the settlement of cash elements or from the conversion of non-cash elements at rates other than those of the initial conversion or the conversion rate of the previous annual report, are booked to the Income Statement of the financial period in which they arise.Exchange rate differences relating to a non-monetary element, valued at fair value as a matching entry
85Notes to the Financial Statements
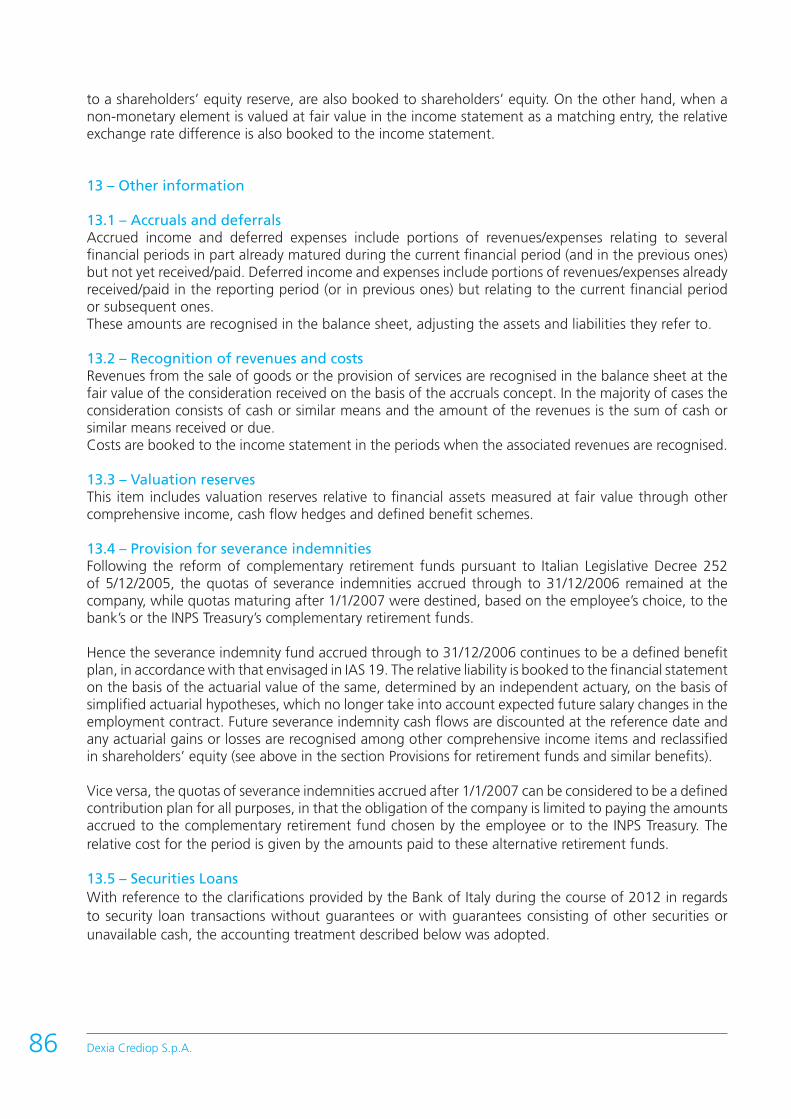
Dexia Crediop S.p.A.86
to a shareholders’ equity reserve, are also booked to shareholders’ equity. On the other hand, when a non-monetary element is valued at fair value in the income statement as a matching entry, the relative exchange rate difference is also booked to the income statement.
13 – Other information
13.1 – Accruals and deferralsAccrued income and deferred expenses include portions of revenues/expenses relating to several financial periods in part already matured during the current financial period (and in the previous ones) but not yet received/paid. Deferred income and expenses include portions of revenues/expenses already received/paid in the reporting period (or in previous ones) but relating to the current financial period or subsequent ones. These amounts are recognised in the balance sheet, adjusting the assets and liabilities they refer to.
13.2 – Recognition of revenues and costsRevenues from the sale of goods or the provision of services are recognised in the balance sheet at the fair value of the consideration received on the basis of the accruals concept. In the majority of cases the consideration consists of cash or similar means and the amount of the revenues is the sum of cash or similar means received or due.Costs are booked to the income statement in the periods when the associated revenues are recognised.
13.3 – Valuation reservesThis item includes valuation reserves relative to financial assets measured at fair value through other comprehensive income, cash flow hedges and defined benefit schemes.
13.4 – Provision for severance indemnitiesFollowing the reform of complementary retirement funds pursuant to Italian Legislative Decree 252 of 5/12/2005, the quotas of severance indemnities accrued through to 31/12/2006 remained at the company, while quotas maturing after 1/1/2007 were destined, based on the employee’s choice, to the bank’s or the INPS Treasury’s complementary retirement funds.
Hence the severance indemnity fund accrued through to 31/12/2006 continues to be a defined benefit plan, in accordance with that envisaged in IAS 19. The relative liability is booked to the financial statement on the basis of the actuarial value of the same, determined by an independent actuary, on the basis of simplified actuarial hypotheses, which no longer take into account expected future salary changes in the employment contract. Future severance indemnity cash flows are discounted at the reference date and any actuarial gains or losses are recognised among other comprehensive income items and reclassified in shareholders’ equity (see above in the section Provisions for retirement funds and similar benefits).
Vice versa, the quotas of severance indemnities accrued after 1/1/2007 can be considered to be a defined contribution plan for all purposes, in that the obligation of the company is limited to paying the amounts accrued to the complementary retirement fund chosen by the employee or to the INPS Treasury. The relative cost for the period is given by the amounts paid to these alternative retirement funds.
13.5 – Securities LoansWith reference to the clarifications provided by the Bank of Italy during the course of 2012 in regards to security loan transactions without guarantees or with guarantees consisting of other securities or unavailable cash, the accounting treatment described below was adopted.

The remuneration for the transactions in question is recognised by the lender under item 40 “fee income” in the income statement. Correspondingly, the cost of said transactions is recognised by the borrower under item 50 “fee expense” in the income statement.
With reference to any unavailable deposits made in favour of the lender by the borrower, considering that the cash remains fully available to the latter until maturity of the security loan transaction, the borrower - in application of the principle of substance prevailing over form - does not recognise either the asset in terms of the lender in the annual report, nor the corresponding constrained liability. Correspondingly, the lender does not recognise in the annual report a liability with the borrower or the connected constrained asset.
13.6 – Methods used to determine fair valueIn compliance with IFRS 13, fair value is defined as the price that would be received to sell an asset or paid to transfer a liability in an ordinary transaction between participants in the trading market for this asset/liability at the reference measurement date. This definition implies the concept of “exit price”, that is the expected sale or purchase value in realistic market conditions.
When determining fair value, the following have been duly considered:• the specific characteristics of the asset/liability being measured, if they are significant for a participant
in the relevant trading market at the moment of pricing the transaction;• the principal trading market for the asset or liability, or in the absence of this, the most advantageous;• all estimate assumptions that reference market participants would use when pricing the asset/liability,
acting in their best interest. Among these assumptions is non-performance risk, which includes the credit risk associated with the issuers or the counterparty of the transaction, including the creditworthiness of the entity that prepares the financial statements (in the case of valuation of a liability).
When listed prices from active markets are not available, fair value is determined using measurement techniques, based as much as possible on observable market data provided by external and independent information providers (e.g. Bloomberg or Markit) and on market standard quantitative methods.
The Financial Market Risk and Product Control structures, centralised in the parent company, ensure regular monitoring of the quality of measurements through comparing those provided by counterparties of derivatives covered by cash-collateral (Credit Support Annex or “CSA”) contracts and considering prices for market transactions. Measurement methodologies are subject to validation and periodic review by the Validation structure, also centralised in the parent company. The Market Risk unit is the local reference unit for the three centralised structures mentioned above.
Assessment of financial assets mandatorily measured at fair value, limited to the subset of loans to local Italian entities which did not pass the SPPI test, is done by discounting cash flows with credit spreads based on the maximum rates set by the MEF for loans to local entities, plus a fixed add-on equal to 40 basis points as an illiquidity factor due to the involvement of complex structures.
With regards to measuring derivatives, Dexia adjusts market value to take into account counterparty risk (Credit Value Adjustment (CVA) / Debt Value Adjustment (DVA)) and the costs or benefits of funding (Funding Value Adjustment (FVA)).
87Notes to the Financial Statements

Dexia Crediop S.p.A.88
In particular, when calculating CVA and DVA, the existence of two different markets is considered:• the market for collateralised derivatives, involving the daily exchange of collateral and for which CVA
and DVA are calculated on the basis of expected changes in value over the estimated time interval between the last exchange of collateral prior to default and the closure of the relative risk positions;
• the non-collateralised derivatives market, in which CVA and DVA are calculated on the basis of expected changes in value throughout the life of each derivative.
For derivatives with counterparties in the Dexia Group, regardless of whether there is an active bilateral CSA, the fair value and CVA and DVA adjustments are determined by applying the respective methodologies for collateralised derivatives.
On the basis of future flow projections, expected positive exposures were used to calculate CVA, and negative ones to calculate DVA. To calculate CVA and DVA, probability of default (PD) parameters were based on market data and conventions. Loss Given Default (LGD) parameters were based on market conventions or internal statistics that take historic recovery rate data into consideration.
The Funding Value Adjustment (FVA) reflects the costs/benefits of funding associated with the absence of collateralisation contracts on derivatives with customers with balanced brokering, against which mirror collateralised derivatives are achieved with market counterparties.
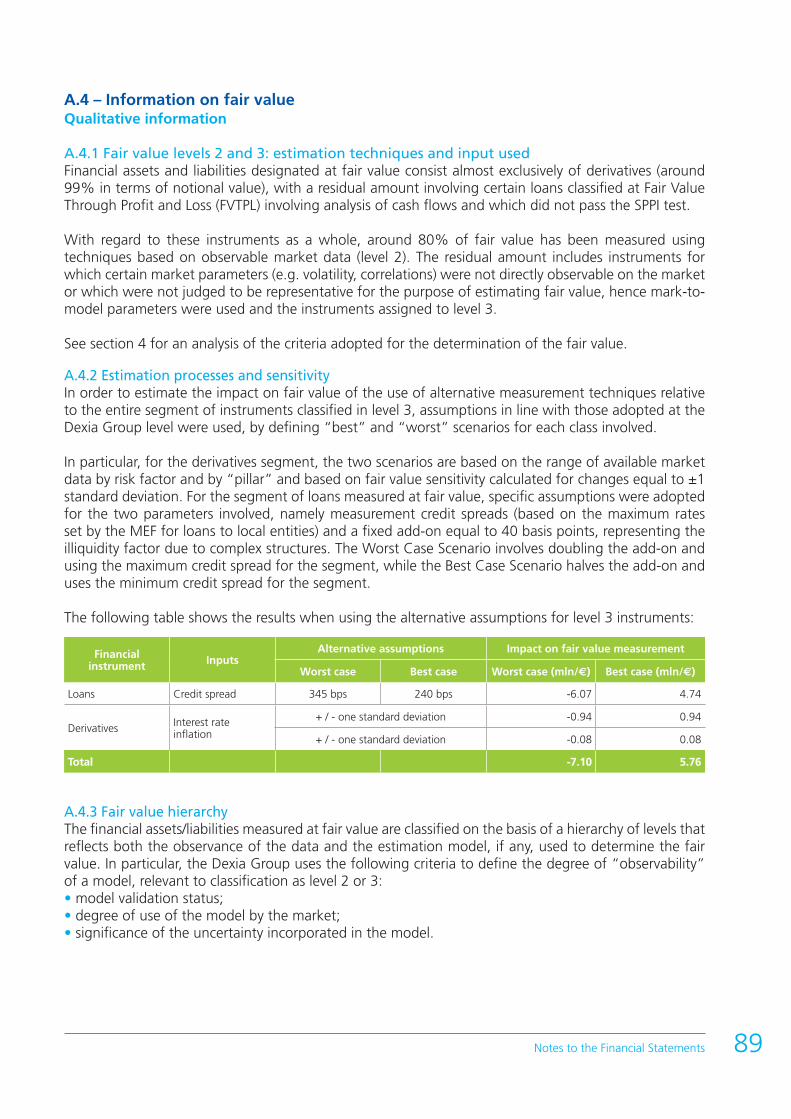
A.4 – Information on fair valueQualitative information
A.4.1 Fair value levels 2 and 3: estimation techniques and input usedFinancial assets and liabilities designated at fair value consist almost exclusively of derivatives (around 99% in terms of notional value), with a residual amount involving certain loans classified at Fair Value Through Profit and Loss (FVTPL) involving analysis of cash flows and which did not pass the SPPI test.
With regard to these instruments as a whole, around 80% of fair value has been measured using techniques based on observable market data (level 2). The residual amount includes instruments for which certain market parameters (e.g. volatility, correlations) were not directly observable on the market or which were not judged to be representative for the purpose of estimating fair value, hence mark-to-model parameters were used and the instruments assigned to level 3.
See section 4 for an analysis of the criteria adopted for the determination of the fair value.
A.4.2 Estimation processes and sensitivityIn order to estimate the impact on fair value of the use of alternative measurement techniques relative to the entire segment of instruments classified in level 3, assumptions in line with those adopted at the Dexia Group level were used, by defining “best” and “worst” scenarios for each class involved.
In particular, for the derivatives segment, the two scenarios are based on the range of available market data by risk factor and by “pillar” and based on fair value sensitivity calculated for changes equal to ±1 standard deviation. For the segment of loans measured at fair value, specific assumptions were adopted for the two parameters involved, namely measurement credit spreads (based on the maximum rates set by the MEF for loans to local entities) and a fixed add-on equal to 40 basis points, representing the illiquidity factor due to complex structures. The Worst Case Scenario involves doubling the add-on and using the maximum credit spread for the segment, while the Best Case Scenario halves the add-on and uses the minimum credit spread for the segment.
The following table shows the results when using the alternative assumptions for level 3 instruments:
Financialinstrument Inputs
Alternative assumptions Impact on fair value measurement
Worst case Best case Worst case (mln/e) Best case (mln/e)
Loans Credit spread 345 bps 240 bps -6.07 4.74
Derivatives Interest rateinflation
+ / - one standard deviation -0.94 0.94
+ / - one standard deviation -0.08 0.08
Total -7.10 5.76
A.4.3 Fair value hierarchyThe financial assets/liabilities measured at fair value are classified on the basis of a hierarchy of levels that reflects both the observance of the data and the estimation model, if any, used to determine the fair value. In particular, the Dexia Group uses the following criteria to define the degree of “observability” of a model, relevant to classification as level 2 or 3:• model validation status;• degree of use of the model by the market;• significance of the uncertainty incorporated in the model.
89Notes to the Financial Statements

Dexia Crediop S.p.A.90
The following table sums up the rules which define the fair value hierarchy in the Dexia Group:
Input data and models/Market activity Active market Less active market Non-regulated/inactive market
Observable prices level 1 level 2 level 3
Input and observable models level 2 level 2 level 3
Input or non-observable models level 3 level 3 level 3
Quantitative information
A.4.5 Fair Value HierarchyA.4.5.1 Assets and Liabilities measured at fair value on a recurring basis: breakdown by fair value levels
thousands of euro
Financial assets/liabilities measured at fair value
31/12/2018 31/12/2017
L 1 L 2 L 3 L 1 L 2 L 3
1. Financial assets measured at fair value through profit and loss 951,769 455,232 1,286,069 828,270
a) financial assets held for trading 825,933 245,971 1,286,069 19,534
b) financial assets designated at fair value through profit and loss
c) other financial assets mandatorily measured at fair value 125,836 209,261 808,736
2. Financial assets measured at fair value through other comprehensive income 27,959 25,985
3. Hedging derivatives 105,936 35,525 211,088 11,661
4. Property plant and equipment
5. Intangible assets
Total 1,085,664 490,757 1,523,142 839,931
1. Financial liabilities held for trading 691,261 485,626 1,436,081 57,340
2. Financial liabilities designated at fair value
3. Hedging derivatives 2,216,338 93,437 2,406,697 60,241
Total 2,907,599 579,063 3,842,778 117,581
Key:L 1 = Level 1L 2 = Level 2L 3 = Level 3
The fair value of derivative instruments classified as Financial Assets/Liabilities held for trading and Hedging derivatives, includes adjustments for Credit Value Asjustment (CVA) for -53 millions and Debt Value Adjustment (DVA) for 3.2 million.

A.4.5.2 Annual change of assets measured at fair value on a recurring basis (level 3)thousands of euro
Financial assets measured at fair value through profit and loss Financial
assets measured
at fair value through
other comprehensive
income
Hedging derivatives
Property plant and
equipmentIntangible
assetsTotal
of which: a) financial
assets held for trading
“of which: b) financial
assets designed
at fair value”
of which: c) other finan-cial assets
mandatorily measured
at fair value
1. Opening balances 31,845 31,845 0 11,661
2. Increases 441,131 231,870 209,261 35,525
2.1. Purchases
2.2. Profits booked to: 76 76
2.2.1. Income statement 76 76
- of which capital gains
2.2.2. Shareholders’ equity X X
2.3. Transfers from other levels 229,224 229,224 35,525
2.4. Other increases 211,831 2,570 209,261
3. Decreases 17,744 17,744 11,661
3.1. Sales
3.2. Redemptions
3.3. Losses booked to: 11,740 11,740 1,811
3.3.1. Income statement 11,740 11,740 1,811
- of which capital losses
3.3.2. Shareholders’ equity X X
3.4. Transfers to other levels 26 26 9,850
3.5. Other decreases 5,978 5,978
4. Closing balances 455,232 245,971 209,261 35,525
Other increases item of the “other financial assets mandatorily measured at fair value” includes due from customers measured at amortised cost in 2017.
91Notes to the Financial Statements

Dexia Crediop S.p.A.92
A.4.5.3 Annual change of liabilities measured at fair value on a recurring basis (level 3)
thousands of euro
Financial liabilities held for trading
Financial liabilities designated at fair
value
Hedgingderivatives
1. Opening balances 57,339 60,241
2. Increases 461,983 37,885
2.1. Issues
2.2. Losses booked to:
2.2.1. Income statement
- of which capital losses
2.2.2. Shareholders’ equity X
2.3. Transfers from other levels 461,983 37,885
2.4. Other increases
3. Decreases 33,695 4,689
3.1. Redemptions
3.2. Repurchases
3.3. Profits booked to: 21,927 4,689
3.3.1. Income statement 21,927 4,689
- of which capital gains
3.3.2. Shareholders’ equity X
3.4. Transfers to other levels 11,768
3.5. Other decreases
4. Closing balances 485,627 93,437
A.4.5.4 Assets and Liabilities not measured at fair value or measured at fair value on a not recurring basis: breakdown by fair value levels
thousands of euro
Assets/Liabilities not measured at fair value or measured at fair value on a non recurring basis
31/12/2018 31/12/2017
BV L1 L2 L3 BV L1 L2 L3
1. Financial assets measured at amortised cost 16,618,258 4,887,941 8,702,606 672,015 18,085,359 395,221 3,330,222 12,774,335
2. Property plant and equipement held as investments
3. Attività non correnti e gruppi di attività in via di dismissione
Total 16,618,258 4,887,941 8,702,606 672,015 18,085,359 395,221 3,330,222 12,774,335
1. Financial liabilities measured at amortised cost 13,912,698 222,678 13,711,284 58,999 15,569,271 0 9,385,559 5,497,873
2. Liabilities related to assets held for sale
Total 13,912,698 222,678 13,711,284 58,999 15,569,271 0 9,385,559 5,497,873
Key:BV = book valueL1= Level 1 L2= Level 2L3= Level 3

A.5 – Information on the day one profit/loss
Following restructuring operations carried out during the year, derecognition due to “substantial” changes in pre-existing non-SPPI assets involved, for 2018, the recognition of losses under item 110 “Net result of other financial assets and liabilities measured at fair value through profit and loss”. These losses were more than balanced by Day One Profit (DOP) recorded at the initial recognition at fair value of the restructured assets.
We can also note that as of 31 December 2018, there are no portions of DOP to be recognised in the income statement in future years.
93Notes to the Financial Statements
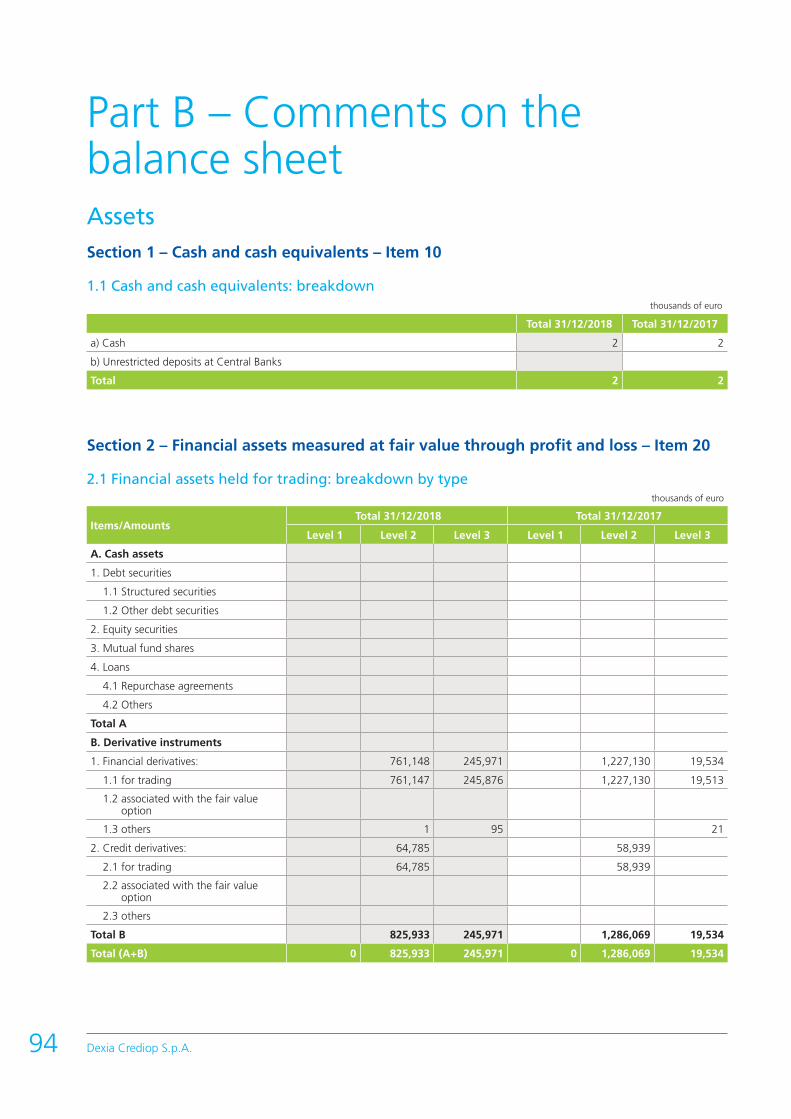
Dexia Crediop S.p.A.94
AssetsSection 1 – Cash and cash equivalents – Item 10
1.1 Cash and cash equivalents: breakdownthousands of euro
Total 31/12/2018 Total 31/12/2017
a) Cash 2 2
b) Unrestricted deposits at Central Banks
Total 2 2
Section 2 – Financial assets measured at fair value through profit and loss – Item 20
2.1 Financial assets held for trading: breakdown by typethousands of euro
Items/Amounts Total 31/12/2018 Total 31/12/2017
Level 1 Level 2 Level 3 Level 1 Level 2 Level 3
A. Cash assets
1. Debt securities
1.1 Structured securities
1.2 Other debt securities
2. Equity securities
3. Mutual fund shares
4. Loans
4.1 Repurchase agreements
4.2 Others
Total A
B. Derivative instruments
1. Financial derivatives: 761,148 245,971 1,227,130 19,534
1.1 for trading 761,147 245,876 1,227,130 19,513
1.2 associated with the fair value option
1.3 others 1 95 21
2. Credit derivatives: 64,785 58,939
2.1 for trading 64,785 58,939
2.2 associated with the fair value option
2.3 others
Total B 825,933 245,971 1,286,069 19,534
Total (A+B) 0 825,933 245,971 0 1,286,069 19,534
Part B – Comments on the balance sheet
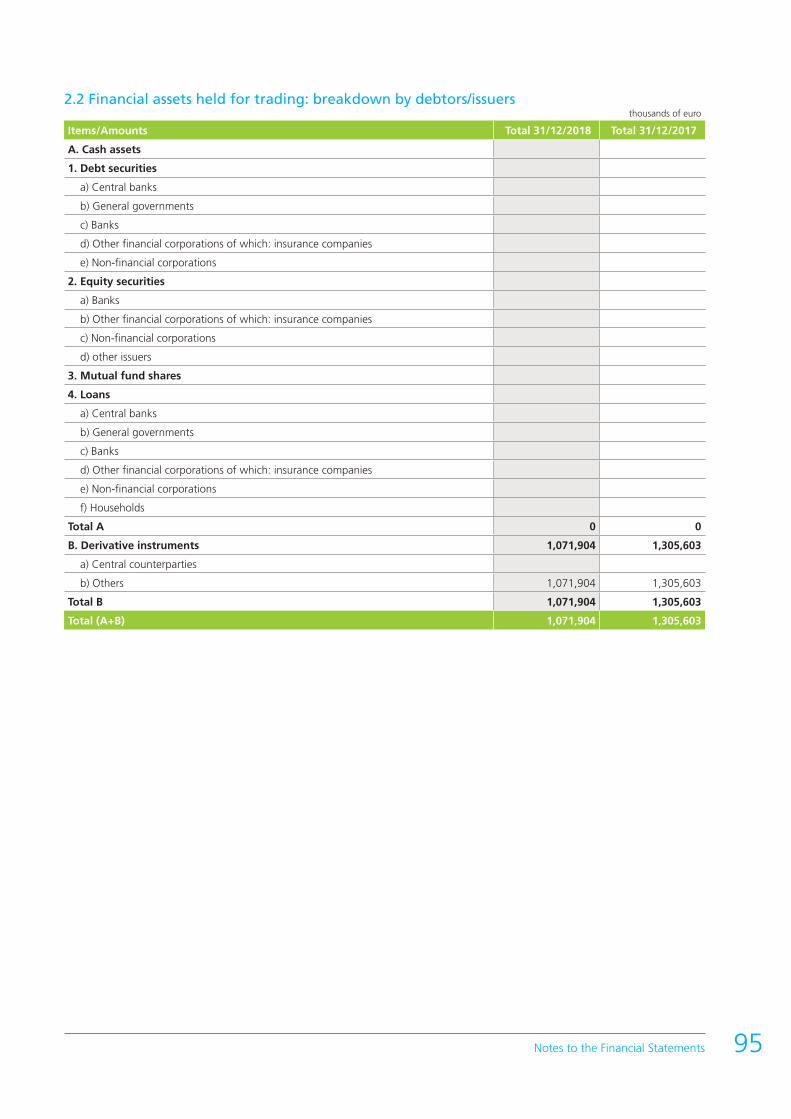
2.2 Financial assets held for trading: breakdown by debtors/issuersthousands of euro
Items/Amounts Total 31/12/2018 Total 31/12/2017
A. Cash assets
1. Debt securities
a) Central banks
b) General governments
c) Banks
d) Other financial corporations of which: insurance companies
e) Non-financial corporations
2. Equity securities
a) Banks
b) Other financial corporations of which: insurance companies
c) Non-financial corporations
d) other issuers
3. Mutual fund shares
4. Loans
a) Central banks
b) General governments
c) Banks
d) Other financial corporations of which: insurance companies
e) Non-financial corporations
f) Households
Total A 0 0
B. Derivative instruments 1,071,904 1,305,603
a) Central counterparties
b) Others 1,071,904 1,305,603
Total B 1,071,904 1,305,603
Total (A+B) 1,071,904 1,305,603
95Notes to the Financial Statements
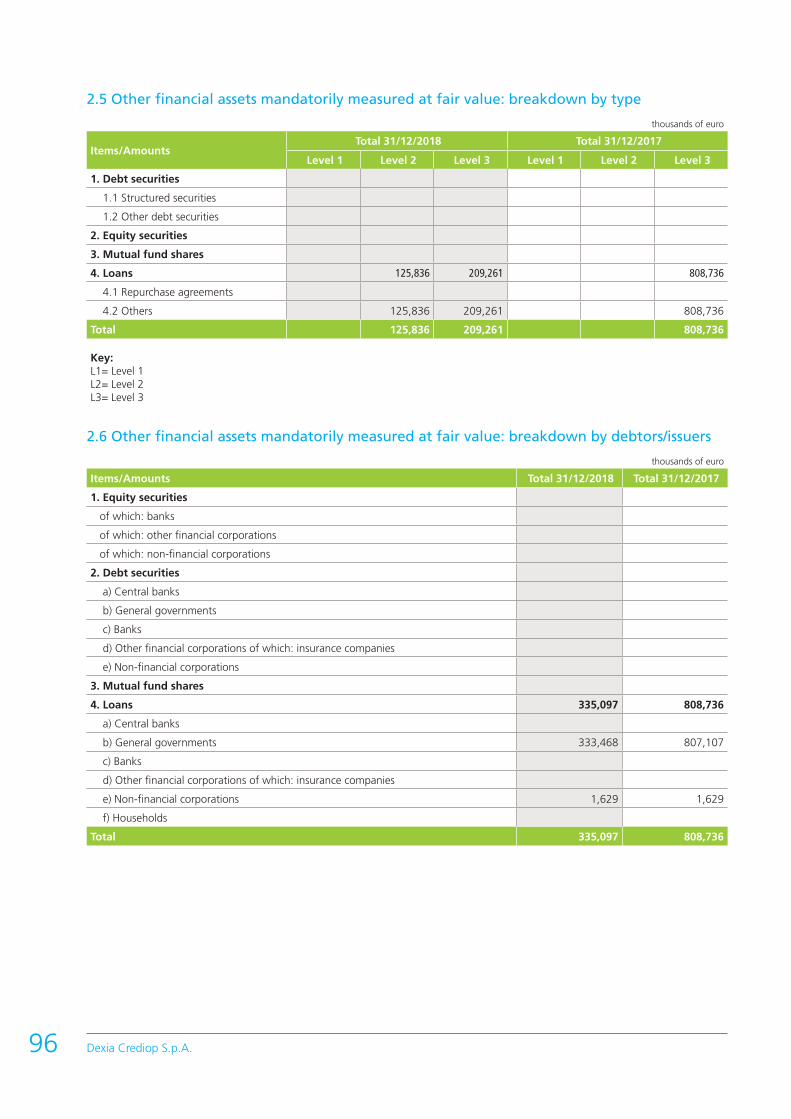
Dexia Crediop S.p.A.96
2.5 Other financial assets mandatorily measured at fair value: breakdown by type
thousands of euro
Items/Amounts Total 31/12/2018 Total 31/12/2017
Level 1 Level 2 Level 3 Level 1 Level 2 Level 3
1. Debt securities
1.1 Structured securities
1.2 Other debt securities
2. Equity securities
3. Mutual fund shares
4. Loans 125,836 209,261 808,736
4.1 Repurchase agreements
4.2 Others 125,836 209,261 808,736
Total 125,836 209,261 808,736
Key:L1= Level 1 L2= Level 2L3= Level 3
2.6 Other financial assets mandatorily measured at fair value: breakdown by debtors/issuers
thousands of euro
Items/Amounts Total 31/12/2018 Total 31/12/2017
1. Equity securities
of which: banks
of which: other financial corporations
of which: non-financial corporations
2. Debt securities
a) Central banks
b) General governments
c) Banks
d) Other financial corporations of which: insurance companies
e) Non-financial corporations
3. Mutual fund shares
4. Loans 335,097 808,736
a) Central banks
b) General governments 333,468 807,107
c) Banks
d) Other financial corporations of which: insurance companies
e) Non-financial corporations 1,629 1,629
f) Households
Total 335,097 808,736

Section 3 – Financial assets measured at fair value through other comprehensive income – Item 30
3.1 Financial assets measured at fair value through other comprehensive income: breakdown by type
thousands of euro
Items/Amounts Total 31/12/2018 Total 31/12/2017
Level 1 Level 2 Level 3 Level 1 Level 2 Level 3
1. Debt securities
1.1 Structured securities
1.2 Other debt securities
2. Equity securities 27,959 25,985
3. Loans
Total 27,959 25,985
3.2 Financial assets measured at fair value through other comprehensive income: breakdown by debtors/issuers
thousands of euro
Items/Amounts Total 31/12/2018 Total 31/12/2017
1. Debt securities
a) Central banks
b) General governments
c) Banks
d) Other financial corporations of which: insurance companies
e) Non-financial corporations
2. Equity securities 27,959 25,985
a) Banks 27,959 25,985
b) Other issuers:
- other financial corporations of which: insurance companies
- non-financial corporations
- others
3. Loans
a) Central banks
b) General governments
c) Banks
d) Other financial corporations of which: insurance companies
e) Non-financial corporations
f) Households
Total 27,959 25,985
97Notes to the Financial Statements

Dexia Crediop S.p.A.98
Section 4 – Financial assets measured at amortised cost – Item 40
4.1 Financial assets measured at amortised cost: breakdown by type of due from banksthousands of euro
Type of transaction/Amounts Total 31/12/2018 Total 31/12/2017
Book value Fair value Book value Fair value
Stage 1 and 2
Stage 3
of which: purchased or
originated impaired
L1 L2 L3 Stage 1 and 2 Stage 3
of which: purchased or
originated impaired
L1 L2 L3
A. Due from Central Banks 143,537 0 0 143,537 111,653 111,653
1. Term deposits X X X X X X
2. Compulsory reserve 143,537 X X X 111,653 X X X
3 Repurchase agreements X X X X X X
4. Others X X X X X X
B. Due from banks 2,888,825 2,883,865 3,236,371 3,218,569 0
1. Loans 2,888,825 2,883,865 3,236,371 3,218,569 0
1.1 Current accounts and demand deposits 870 X X X 12,921 X X X
1.2 Term deposits 2,772,628 X X X 3,081,213 X X X
1.3 Other loans: 115,327 X X X 142,237 X X X
- Repurchase agreements X X X X X X
- Financial lease X X X X X X
- Others 115,327 X X X 142,237 X X X
2. Debt securities 0 0 0
2.1 Structured securities
2.2 Other debt securities
Total 3,032,362 3,027,402 3,348,019 3,330,222
Key:L1= Level 1 L2= Level 2L3= Level 3
4.2 Financial assets measured at amortised cost: breakdown by type of due from customersthousands of euro
Type of transaction/Amounts
Total 31/12/2018 Total 31/12/2017
Book value Fair value Book value Fair value
Stage 1 and 2
Stage 3
of which: purchased or
originated impaired
L1 L2 L3 Stage1 and
2
Stage 3
of which: purchased or
originated impaired
L1 L2 L3
1. Loans 4,802,099 52,708 3,524,836 635,726 4,942,055
1.1. Current accounts X X X X X X
1.2. Reverserepurchase agreements X X X X X X
1.3. Loans 4,457,826 52,708 X X X X X X
1.4. Credit cards, personal loans,salary-backed loans
X X X X X X
1.5. Financial lease X X X X X X
1.6. Factoring X X X X X X
1.7. Other loans 344,273 X X X X X X
2. Debt securities 8,731,090 4,887,941 2,150,368 36,289 395,221 7,832,280
2.1. Structured securities
2.2. Other debt securities 8,731,090
Total 13,533,189 52,708 4,887,941 5,675,204 672,015 14,737,340 395,221 12,774,335

4.4 Financial assets measured at amortised cost: breakdown by debtors/issuers of due from customers
thousands of euro
Type of transaction/Amounts
Total 31/12/2018 Total 31/12/2017
Stage 1 and 2 Stage 3
of which: purchased or originat-ed impaired
assets
Stage 1 and 2 Stage 3
of which: purchased or originat-ed impaired
assets
1. Debt securities 8,731,090
a) General governments 7,787,752
b) Other financial corporations of which: insurance companies 597,219
c) Non-financial corporations 346,119
3. Loans 4,802,099 52,708
a) General governments 4,175,326 165
b) Other financial corporations 335,354 6,141
of which: insurance companies
c) Non-financial corporations 291,419 46,402
d) Households
Total 13,533,189 52,708 14,737,340
4.5 Financial assets measured at amortised cost: gross carrying amount and accumulated impairment
thousands of euro
Gross carrying amount Accumulated impairment
Accumu-lated partial write-offs*Stage 1
of which: instru-ments
with low credit risk
Stage 2 Stage 3 Stage 1 Stage 2 Stage 3
Debt securities 6,461,109 6,461,109 2,272,879 66 2,832
Lons 5,432,814 5,427,475 2,407,757 64,008 171 5,940 11,300
Total 31/12/2018 11,893,923 11,888,584 4,680,636 64,008 237 8,772 11,300
Total 31/12/2017
of which: purchasedcredit-impaired financial assets X X X
* Amount to be disclose for information purpose
Based on the characteristics of Dexia Crediop business, in the context of Stage 1, all transactions with counterparts with an internal investment grade rating are considered “low credit risk instruments”.
99Notes to the Financial Statements
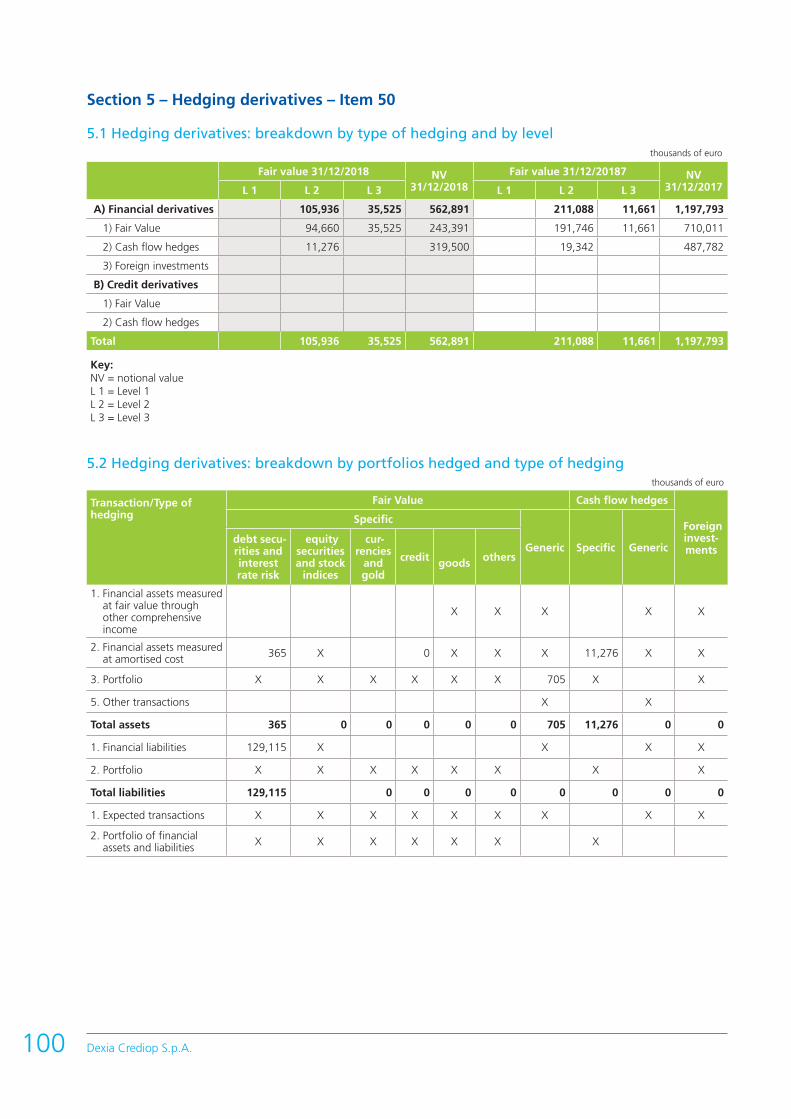
Dexia Crediop S.p.A.100
Section 5 – Hedging derivatives – Item 50
5.1 Hedging derivatives: breakdown by type of hedging and by levelthousands of euro
Fair value 31/12/2018 NV31/12/2018
Fair value 31/12/20187 NV 31/12/2017L 1 L 2 L 3 L 1 L 2 L 3
A) Financial derivatives 105,936 35,525 562,891 211,088 11,661 1,197,793
1) Fair Value 94,660 35,525 243,391 191,746 11,661 710,011
2) Cash flow hedges 11,276 319,500 19,342 487,782
3) Foreign investments
B) Credit derivatives
1) Fair Value
2) Cash flow hedges
Total 105,936 35,525 562,891 211,088 11,661 1,197,793
Key:NV = notional valueL 1 = Level 1L 2 = Level 2L 3 = Level 3
5.2 Hedging derivatives: breakdown by portfolios hedged and type of hedgingthousands of euro
Transaction/Type of hedging
Fair Value Cash flow hedges
Foreign invest-ments
Specific
Generic Specific Generic debt secu-rities and interest rate risk
equity securities and stock
indices
cur-rencies
and gold
credit goods others
1. Financial assets measured at fair value through other comprehensive income
X X X X X
2. Financial assets measured at amortised cost 365 X 0 X X X 11,276 X X
3. Portfolio X X X X X X 705 X X
5. Other transactions X X
Total assets 365 0 0 0 0 0 705 11,276 0 0
1. Financial liabilities 129,115 X X X X
2. Portfolio X X X X X X X X
Total liabilities 129,115 0 0 0 0 0 0 0 0
1. Expected transactions X X X X X X X X X
2. Portfolio of financial assets and liabilities X X X X X X X

Section 6 – Fair value adjustment of financial assets in hedged portfolios – Item 60
6.1 Fair value adjustments of hedged assets: breakdown by portfolios hedgedthousands of euro
Fair value adjustments of hedged assets/Securities Total 31/12/2018 Total 31/12/2017
1. Increases 2,604 4,039
1.1 of specific portfolios: 2,604 4,039
a) financial assets measured at amortised cost 2,604 4,039
b) financial assets measured at fair value through other comprehensive income
1.2 total
2. Decreases 705 1,378
2.1 of specific portfolios: 705 1,378
a) financial assets measured at amortised cost 705 1,378
b) financial assets measured at fair value through other comprehensive income
2.2 total
Total 1,899 2,661
Section 7 - Equity investments – Item 70
7.5 Equity investments: annual changethousands of euro
Total 31/12/2018 Total 31/12/2017
A. Opening balances 10 10
B. Increases
B.1 Purchases
B.2 Writebacks
B.3 Revaluations
B.4 Other changes
C. Decreases 10 0
C.1 Sales
C.2 Writedowns
C.4 Other changes 10
D. Closing balances 0 10
E. Total revaluations
F. Total adjustments
Additional information tiveAt 31 December 2018, after the completion of the voluntary liquidation of the subsidiary Dexia Crediop Ireland Ulc, Dexia Crediop no longer has any equity investments in subsidiaries.
101Notes to the Financial Statements
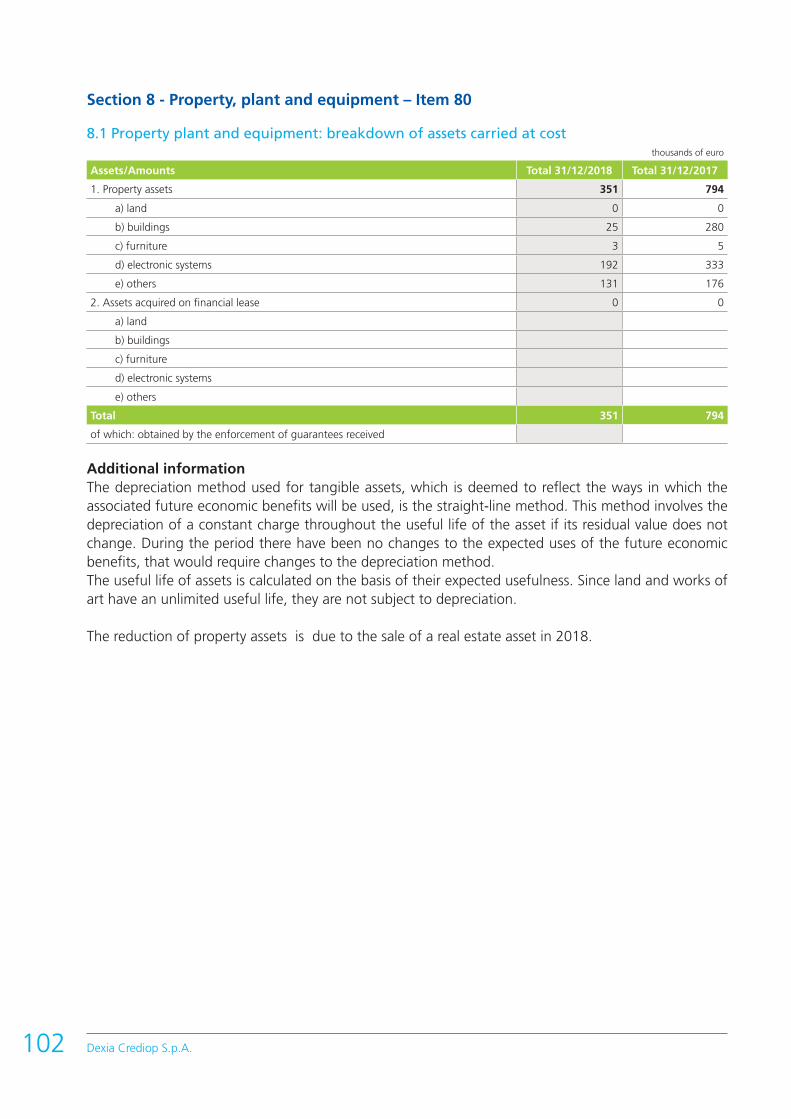
Dexia Crediop S.p.A.102
Section 8 - Property, plant and equipment – Item 80
8.1 Property plant and equipment: breakdown of assets carried at costthousands of euro
Assets/Amounts Total 31/12/2018 Total 31/12/2017
1. Property assets 351 794
a) land 0 0
b) buildings 25 280
c) furniture 3 5
d) electronic systems 192 333
e) others 131 176
2. Assets acquired on financial lease 0 0
a) land
b) buildings
c) furniture
d) electronic systems
e) others
Total 351 794
of which: obtained by the enforcement of guarantees received
Additional informationThe depreciation method used for tangible assets, which is deemed to reflect the ways in which the associated future economic benefits will be used, is the straight-line method. This method involves the depreciation of a constant charge throughout the useful life of the asset if its residual value does not change. During the period there have been no changes to the expected uses of the future economic benefits, that would require changes to the depreciation method.The useful life of assets is calculated on the basis of their expected usefulness. Since land and works of art have an unlimited useful life, they are not subject to depreciation.
The reduction of property assets is due to the sale of a real estate asset in 2018.

8.6 Property plant and equipment for business purposes: annual changethousands of euro
Land Buildings Furniture Electronic systems Others Total
A. Gross opening balances 0 13,119 1,688 1,586 1,858 18,251
A.1 Net total adjustments 0 12,839 1,683 1,253 1,682 17,457
A.2 Net opening balances 0 280 5 333 176 794
B. Increases: 0 0 1 3 4
B.1 Purchases 0 0 1 3 4
B.2 Expenses for capitalised improvements
B.3 Writebacks
B.4 Increases in fair value booked to
a) shareholders' equity
b) income statement
B.5 Positive exchange-rate differences
B.6 Reclassification from buildings held as investments X X X
B.7 Other changes
C. Decreases: 0 255 2 142 48 447
C.1 Sales 212 212
C.2 Depreciation 43 2 142 48 235
C.3 Impairment losses booked to:
a) shareholders' equity
b) income statement
C.4 Decreases in fair value booked to
a) shareholders' equity
b) income statement
C.5 Negative exchange-rate differences
C.6 Reclassification to:
a) property plant and equipment held as investments X X X
b) assets held for sale
C.7 Other changes
D. Net closing balances 0 25 3 192 131 351
D.1 Net total adjustments 0 12,882 1,685 1,395 1,730 17,692
D.2 Gross closing balances 0 12,907 1,688 1,587 1,861 18,043
E. Measurement at cost
103Notes to the Financial Statements

Dexia Crediop S.p.A.104
Section 9 – Intangible assets – Item 90
9.1 Intangible assets: breakdown by type of asset thousands of euro
Assets/AmountsTotal 31/12/2018 Total 31/12/2017
Defined duration
Indefinite duration
Defined duration
Indefinite duration
A.1 Goodwill X X
A.2 Other intangible assets 2,406 2,787
A.2.1 Assets carried at cost: 2,406 2,787
a) Intangible assets generated internally
b) Other assets 2,406 2,787
A.2.2 Assets designated at fair value:
a) Intangible assets generated internally
b) Other assets
Total 2,406 2,787
Intangible assets consist of software purchased from third parties in the process of amortization.The amortisation is carried out on the basis of the possible residual useful life.
9.2 Intangible assets: annual changethousands of euro
Goodwill Other intangible assets: generated internally
Other intangible assets: others
Total
DEF INDEF DEF INDEF
A. Opening balances 38,289 38,289
A.1 Net total adjustments 35,502 35,502
A.2 Net opening balances 2,787 2,787
B. Increases 1,285 1,285
B.1 Purchases 1,285 1,285
B.2 Increases in internal intangible assets X
B.3 Writebacks X
B.4 Increases in fair value:
- to shareholders' equity X
- to income statement X
B.5 Positive exchange-rate differences
B.6 Other changes
C. Decreases 1,666 1,666
C.1 Sales
C.2 Writedowns 1,666 1,666
- Amortization X 1,666 1,666
- Devaluations:
+ shareholders' equity X
+ income statement
C.3 Decreases in fair value:
- to shareholders' equity X
- to income statement X
C.4 Reclassification to non-current assets held for sale
C.5 Negative exchange-rate differences
C.6 Other changes
D. Net closing balances 2,406 2,406
D.1 Total net adjustments 37,168 37,168
E. Gross closing balances 39,574 39,574
F. Measurement at cost
Key:DEF: of defined durationINDEF: of indefinite duration

Section 10 – Tax credits and liabilities – Item 100 of the assets and Item 60 of the liabilities
10.1 Deferred tax assets: breakdown thousands of euro
31/12/2018 31/12/2017
A. Deferred tax assets 2,279 2,279
A1. Loans (including securitisations) 2,279 2,279
A2. Other financial assets
A3. Goodwill
A4. Deferred charges
A5. Property plant and equipment
A6. Provisions for risks and charges
A7. Representation expenses
A8. Staff expenses
A9. Tax losses
A10. Tax credit not used by discount
A11. Others
B. Compensation with deferred tax liabilities
C. Net deferred tax assets 2,279 2,279
As of financial year 2014, in accordance with that foreseen IAS 12, net advance tax assets have been cancelled as the company did not hold it likely that they would be recovered in the future, nor that the value of the assets or liabilities recognised in the balance sheet would be extinguished through reductions or increases in future tax payments. Instead, only deferred tax assets deriving from adjustments of credits deductible in future financial years are registered, for which transformation into tax credits is envisaged under Law 214/2011 and for which the probability test of IAS 12 is automatically considered to have been passed, in accordance with the Bank of Italy/CONSOB/ISVAP document no. 5 of 15 May 2012.
10.3 Change in deferred tax assets (with matching entry in income statement) thousands of euro
Total 31/12/2018 Total 31/12/2017
1. Initial balance 2,279
2. Increases 0 2,279
2.1 Deferred tax assets arising in the year 0
a) relating to prior years
b) due to changes in accounting policies
c) writebacks
d) other 2,279
2.2 New taxes or increases in tax rates
2.3 Other increases
3. Decreases 0
3.1 Deferred tax assets cancelled in the year
a) reversals
b) written down as now considered unrecoverable
c) change in accounting policies
d) other
3.2 Reduction in tax rates
3.3 Other decreases 0
a) tax credit trasformation pursuant L.214/2011 0
a) tax credit trasformation pursuant L.214/2011
4. Final balance 2,279 2,279
105Notes to the Financial Statements
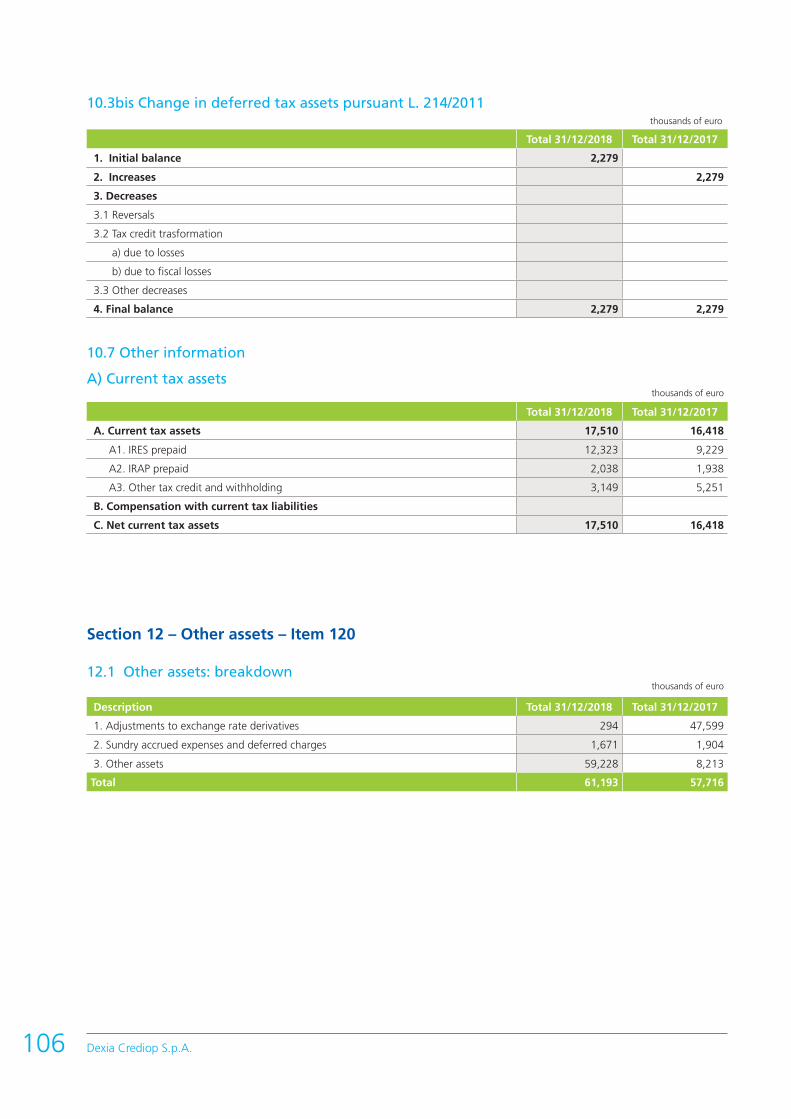
Dexia Crediop S.p.A.106
10.3bis Change in deferred tax assets pursuant L. 214/2011 thousands of euro
Total 31/12/2018 Total 31/12/2017
1. Initial balance 2,279
2. Increases 2,279
3. Decreases
3.1 Reversals
3.2 Tax credit trasformation
a) due to losses
b) due to fiscal losses
3.3 Other decreases
4. Final balance 2,279 2,279
10.7 Other information
A) Current tax assets thousands of euro
Total 31/12/2018 Total 31/12/2017
A. Current tax assets 17,510 16,418
A1. IRES prepaid 12,323 9,229
A2. IRAP prepaid 2,038 1,938
A3. Other tax credit and withholding 3,149 5,251
B. Compensation with current tax liabilities
C. Net current tax assets 17,510 16,418
Section 12 – Other assets – Item 120
12.1 Other assets: breakdown thousands of euro
Description Total 31/12/2018 Total 31/12/2017
1. Adjustments to exchange rate derivatives 294 47,599
2. Sundry accrued expenses and deferred charges 1,671 1,904
3. Other assets 59,228 8,213
Total 61,193 57,716
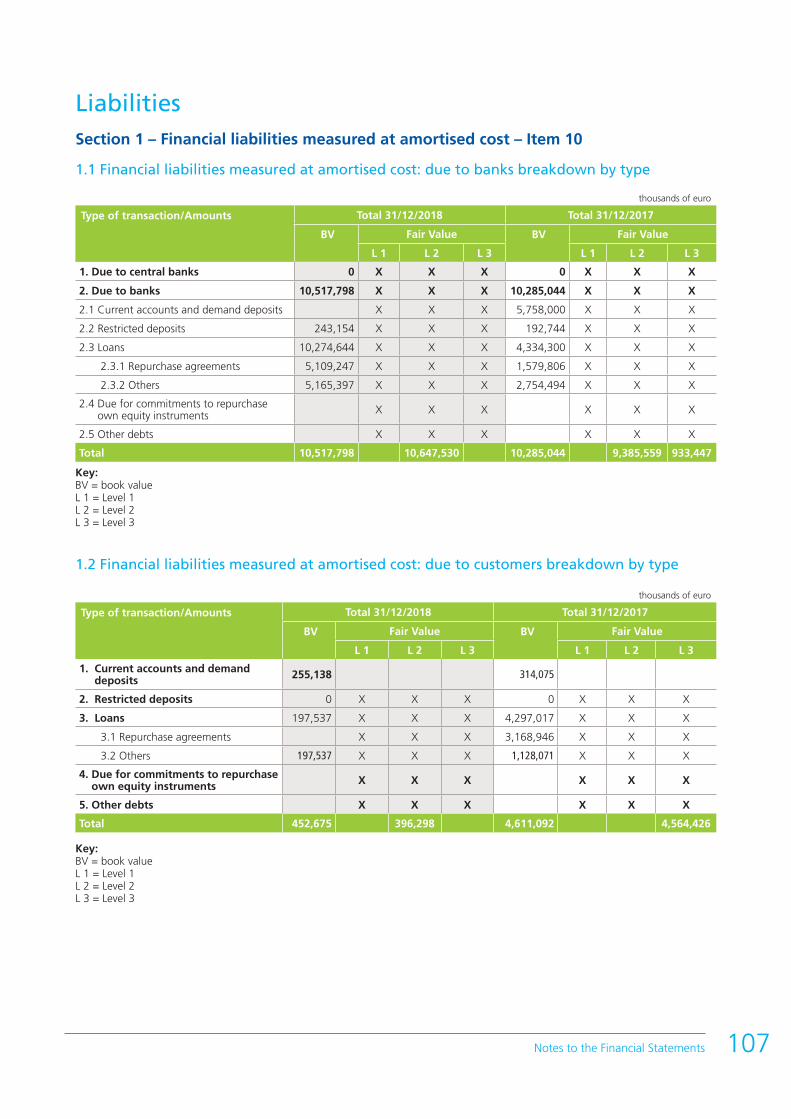
LiabilitiesSection 1 – Financial liabilities measured at amortised cost – Item 10
1.1 Financial liabilities measured at amortised cost: due to banks breakdown by type
thousands of euro
Type of transaction/Amounts Total 31/12/2018 Total 31/12/2017
BV Fair Value BV Fair Value
L 1 L 2 L 3 L 1 L 2 L 3
1. Due to central banks 0 X X X 0 X X X
2. Due to banks 10,517,798 X X X 10,285,044 X X X
2.1 Current accounts and demand deposits X X X 5,758,000 X X X
2.2 Restricted deposits 243,154 X X X 192,744 X X X
2.3 Loans 10,274,644 X X X 4,334,300 X X X
2.3.1 Repurchase agreements 5,109,247 X X X 1,579,806 X X X
2.3.2 Others 5,165,397 X X X 2,754,494 X X X
2.4 Due for commitments to repurchase own equity instruments X X X X X X
2.5 Other debts X X X X X X
Total 10,517,798 10,647,530 10,285,044 9,385,559 933,447
Key:BV = book valueL 1 = Level 1L 2 = Level 2L 3 = Level 3
1.2 Financial liabilities measured at amortised cost: due to customers breakdown by type
thousands of euro
Type of transaction/Amounts Total 31/12/2018 Total 31/12/2017
BV Fair Value BV Fair Value
L 1 L 2 L 3 L 1 L 2 L 3
1. Current accounts and demand deposits 255,138 314,075
2. Restricted deposits 0 X X X 0 X X X
3. Loans 197,537 X X X 4,297,017 X X X
3.1 Repurchase agreements X X X 3,168,946 X X X
3.2 Others 197,537 X X X 1,128,071 X X X
4. Due for commitments to repurchase own equity instruments X X X X X X
5. Other debts X X X X X X
Total 452,675 396,298 4,611,092 4,564,426
Key:BV = book valueL 1 = Level 1L 2 = Level 2L 3 = Level 3
107Notes to the Financial Statements
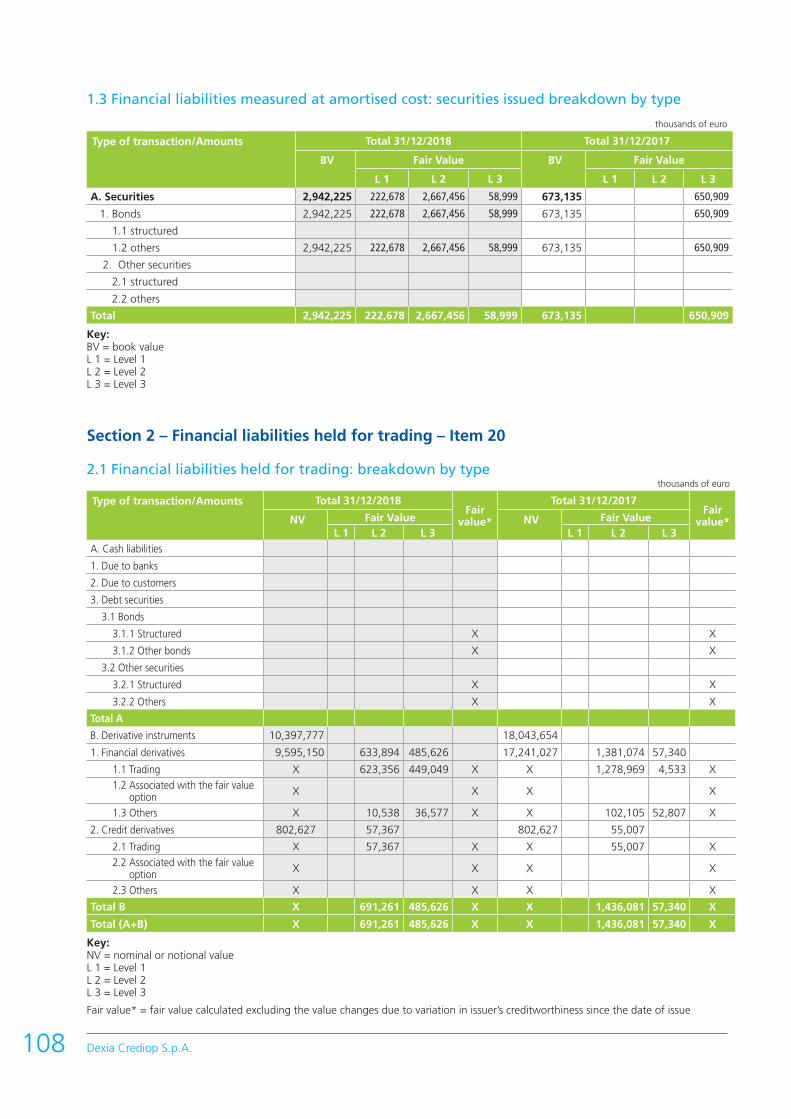
Dexia Crediop S.p.A.108
1.3 Financial liabilities measured at amortised cost: securities issued breakdown by type
thousands of euro
Type of transaction/Amounts Total 31/12/2018 Total 31/12/2017
BV Fair Value BV Fair Value
L 1 L 2 L 3 L 1 L 2 L 3
A. Securities 2,942,225 222,678 2,667,456 58,999 673,135 650,909
1. Bonds 2,942,225 222,678 2,667,456 58,999 673,135 650,909
1.1 structured
1.2 others 2,942,225 222,678 2,667,456 58,999 673,135 650,909
2. Other securities
2.1 structured
2.2 others
Total 2,942,225 222,678 2,667,456 58,999 673,135 650,909
Key:BV = book valueL 1 = Level 1L 2 = Level 2L 3 = Level 3
Section 2 – Financial liabilities held for trading – Item 20
2.1 Financial liabilities held for trading: breakdown by typethousands of euro
Type of transaction/Amounts Total 31/12/2018Fair
value*
Total 31/12/2017Fair
value* NV Fair Value NV Fair ValueL 1 L 2 L 3 L 1 L 2 L 3
A. Cash liabilities
1. Due to banks
2. Due to customers
3. Debt securities
3.1 Bonds
3.1.1 Structured X X
3.1.2 Other bonds X X
3.2 Other securities
3.2.1 Structured X X
3.2.2 Others X X
Total A
B. Derivative instruments 10,397,777 18,043,654
1. Financial derivatives 9,595,150 633,894 485,626 17,241,027 1,381,074 57,340
1.1 Trading X 623,356 449,049 X X 1,278,969 4,533 X
1.2 Associated with the fair value option X X X X
1.3 Others X 10,538 36,577 X X 102,105 52,807 X
2. Credit derivatives 802,627 57,367 802,627 55,007
2.1 Trading X 57,367 X X 55,007 X
2.2 Associated with the fair value option X X X X
2.3 Others X X X X
Total B X 691,261 485,626 X X 1,436,081 57,340 X
Total (A+B) X 691,261 485,626 X X 1,436,081 57,340 X
Key:NV = nominal or notional valueL 1 = Level 1L 2 = Level 2L 3 = Level 3
Fair value* = fair value calculated excluding the value changes due to variation in issuer’s creditworthiness since the date of issue

Section 4 – Hedging derivatives – Item 40
4.1 Hedging derivatives: breakdown by type of hedging and by hierarchical levels thousands of euro
Total 31/12/2018 Total 31/12/2017
NV31/12/2018 L 1 L 2 L 3 NV
31/12/2017 L 1 L 2 L 3
A. Financial derivatives 6,399,568 2,216,338 93,437 6,748,200 2,406,697 60,241
1) Fair Value 6,245,309 2,214,145 89,758 6,585,051 2,400,309 60,241
2) Cash flow hedges 154,259 2,193 3,679 163,149 6,388
3) Foreign investments
B) Credit derivatives
1) Fair Value
2) Cash flow hedges
Total 6,399,568 2,216,338 93,437 6,748,200 2,406,697 60,241
Key:NV = notional valueL 1 = Level 1L 2 = Level 2L 3 = Level 3
4.2 Hedging derivatives: breakdown by portfolios hedged and type of hedging thousands of euro
Transaction/Type of hedging
Fair value Cash flow hedges
Foreign invest-ment
Specific
Generic Specific Generic debt
securities and
interestrate risk
equity securities and stock
indices
currencies and gold credit goods others
1. Financial assets measured at fair value through other comprehensive income
X X X X X
2. Financial assets measured at amortised cost 2,297,731 X 3,547 X X X 4,993 X X
3. Portfolio X X X X X X 2,605 X X
4. Other transactions X X
Total assets 2,297,731 3,547 2,605 4,993
1. Financial liabilities 19 X X X 880 X X
2. Portfolio X X X X X X X X
Total liabilities 19 880
1. Expected transactions X X X X X X X X X
2. Portfolio of financialassets and liabilities X X X X X X X
109Notes to the Financial Statements

Dexia Crediop S.p.A.110
Section 6 – Tax liabilities – Item 60
See section 10 of assets.
Section 8 - Other liabilities – Item 80
8.1 Other liabilities: breakdown thousands of euro
Description Total 31/12/2018 Total 31/12/2017
1. Relations with suppliers and professionals 6,190 12
2. Sundry accrued expenses and deferred income 433 15
3. Adjustments to exchange rate derivatives 294 20,000
4. Other liabilities 5,907 9,842
Total 12,824 29,869
Section 9 - Provision for severance indemnities – Item 90
9.1 Provision for severance indemnities: annual changethousands of euro
Total 31/12/2018 Total 31/12/2017
A. Opening balances 1,485 1,729
B. Increases 25 27
B.1 Provision for the year 25 27
B.2 Other changes
C. Decreases 385 271
C.1 Indemnities paid 338 215
C.2 Other changes 47 56
D. Closing balances 1,125 1,485
Total 1,125 1,485
Section 10 – Provisions for risks and charges – Item 100
10.1 Provisions for risks and charges: breakdown thousands of euro
Items/Amounts Total 31/12/2018 Total 31/12/2017
1. Provisions for credit risk of commitments and financial guarantees given 6,664
2. Provisions on other commitments and other guarantees given
3 Provisions for retirement benefits
4. Other provisions for risks and charges 33,526 28,028
4.1 legal and tax disputes 32,961 27,265
4.2 personnel expenses 565 763
4.3 others
Total 40,190 28,028

10.2 Provisions for risks and charges: annual changethousands of euro
Provisions on other commitments and other
guarantees given Pension funds Other
provisions Total
A. Opening balances 28,028 28,028
B. Increases 6,664 343 6,353 13,360
B.1 Provision for the year 343 6,353 6,696
B.2 Changes due to the passing of time
B.3 Changes due to variations in the discount rate
B.4 Other changes 6,664
C. Decreases 343 855 1,198
C.1 Use during the period 343 855 1,198
C.2 Changes due to variations in the discount rate
C.3 Other changes
D. Closing balances 6,664 33,526 40,190
The Item C.1 “use during the period” includes 0.012 million relative to utilisatione, pursuant to IAS 19R, registered with a contra-entry to shareholder’s equity.
10.3 Provisions for credit risk of commitments and financial guarantees given
thousands of euro
Provisions for credit risk of commitments and financial guarantees given
Stage 1 Stage 2 Stage 3 Total
Commitments 380 380
Financial guarantees given 6 151 6,127 6,284
Total 6 531 6,127 6,664
10.5 Company defined-benefit pension funds
1. Description of the funds
The sub-item “Pension funds and similar benefits” includes provisions recognized on the basis of IAS 19 “Employee benefits” against various forms of complementary retirement schemes with defined benefits. These commitments are based on calculations carried out by independent Actuaries using the projected units credit method. In particular, the provisions are the same as the current value of the defined-benefit obligations net of the fair value of the fund’s assets.
111Notes to the Financial Statements
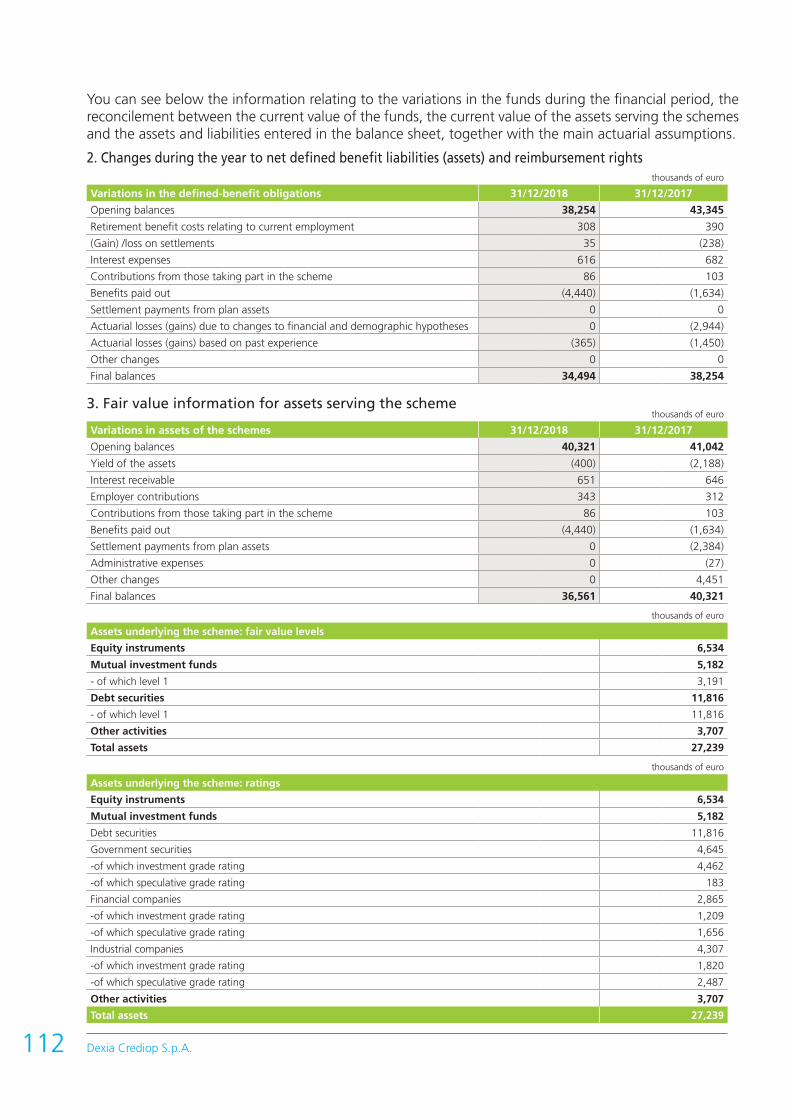
Dexia Crediop S.p.A.112
You can see below the information relating to the variations in the funds during the financial period, the reconcilement between the current value of the funds, the current value of the assets serving the schemes and the assets and liabilities entered in the balance sheet, together with the main actuarial assumptions.
2. Changes during the year to net defined benefit liabilities (assets) and reimbursement rightsthousands of euro
Variations in the defined-benefit obligations 31/12/2018 31/12/2017
Opening balances 38,254 43,345
Retirement benefit costs relating to current employment 308 390
(Gain) /loss on settlements 35 (238)
Interest expenses 616 682
Contributions from those taking part in the scheme 86 103
Benefits paid out (4,440) (1,634)
Settlement payments from plan assets 0 0
Actuarial losses (gains) due to changes to financial and demographic hypotheses 0 (2,944)
Actuarial losses (gains) based on past experience (365) (1,450)
Other changes 0 0
Final balances 34,494 38,254
3. Fair value information for assets serving the schemethousands of euro
Variations in assets of the schemes 31/12/2018 31/12/2017
Opening balances 40,321 41,042
Yield of the assets (400) (2,188)
Interest receivable 651 646
Employer contributions 343 312
Contributions from those taking part in the scheme 86 103
Benefits paid out (4,440) (1,634)
Settlement payments from plan assets 0 (2,384)
Administrative expenses 0 (27)
Other changes 0 4,451
Final balances 36,561 40,321
thousands of euro
Assets underlying the scheme: fair value levels
Equity instruments 6,534
Mutual investment funds 5,182
- of which level 1 3,191
Debt securities 11,816
- of which level 1 11,816
Other activities 3,707
Total assets 27,239
thousands of euro
Assets underlying the scheme: ratings
Equity instruments 6,534
Mutual investment funds 5,182
Debt securities 11,816
Government securities 4,645
-of which investment grade rating 4,462
-of which speculative grade rating 183
Financial companies 2,865
-of which investment grade rating 1,209
-of which speculative grade rating 1,656
Industrial companies 4,307
-of which investment grade rating 1,820
-of which speculative grade rating 2,487
Other activities 3,707
Total assets 27,239

4. Description of the main actuarial hypothesesthousands of euro
Main actuarial assumptions 31/12/2018 31/12/2017
minimum maximum minimum maximum
Discount rate 1.20% 1.90% 1.70% 1.70%
Expected rate of yield of the assets N/A N/A N/A N/A
Expected rate of salary increases 0.70% 0.70% 0.70% 2.25%
Inflation rate 1.75% 1.75% 1.75% 1.75%
Expected rate of pension increases 0.50% 0.50% 0.50% 0.50%
5. Information on amounts, schedules and uncertainties for financial flows
The estimated effects on the defined benefit obligation following a 50 bps change in the discount rate are as follows:• +50bps; assumed discount rate = 2,00%, obligation -229 • -50bps; assumed discount rate = 1,00%, obligation = +3,249
6. Plans relative to several employers
Based on collective agreements signed in 2015 between Dexia Crediop, Intesa Sanpaolo and the respective unions, a portion of former Dexia Crediop employees and pensioners, already registered with the defined benefit fund “pension fund for former Crediop personnel hired through 30 September 1989”, were transferred to the Intesa Sanpaolo Group defined benefit pension fund (former “complementary pension fund for Banco di Napoli employees”).At the end of each year, in the case a technical overdraft relative to the population attributable to the former Crediop Fund is identified, Dexia Crediop and Intesa Sanpaolo deposit the capital necessary to cover this overdraft, as identified during the actuarial checks, in proportion to the weight of the mathematical reserves of the members pertaining to each company with regards to total capital relative to the former Crediop Fund.
10.6 Provisions for risks and charges – other provisions The “other provisions” amounting to € 33,526 thousand, consist of:• provisions for legal disputes of € 32,961 thousand, relative to proceedings concerning Istituto per il
Credito Sportivo and administrative and to judicial proceedings with local authorities (see the following paragraphs for further details);
• personnel expenses: the provision includes € 565 thousand for charges related to redundancy bonus schemes, length of service bonuses, and life insurance benefits. Specifically, the provision includes the charge specifically allocated for the Solidarity Fund, the payment of which is directly connected with the 2009-2011 corporate restructuring plan, a defined service provision that falls under the scope of IAS 19.
113Notes to the Financial Statements
Dexia Crediop S.p.A.114
Administrative, judicial, and arbitration procedures
Below we provide information about the most important administrative, legal or arbitration proceedings which could have, or recently have had, repercussions for Dexia Crediop’s financial position and/or profitability.
From 2009, the year when some territorial and local authorities began to dispute derivative transactions concluded with Dexia Crediop, to 2018, Dexia Crediop has been successful in a number of cases and proceedings relating to the Province of Pisa, the Municipality of Florence and the Regions of Apulia, the Region of Tuscany, the Municipality of Forlì, the Regions of Lazio and Piedmont, the Metropolitan City of Milan, the Province of Brescia, the Municipality of Prato (civil and administrative disputes), the Municipality of Ferrara and the Region of Campania.
* * *
Municipality of Prato:On 31 December 2010, the Municipality of Prato, through a self-protection measure, reversed its own resolution regarding an interest rate swap signed on 29 June 2006 with Dexia Crediop in relation to two floating-rate bonded loan contracts entered into with Dexia Crediop.
Dexia Crediop initiated an action before the civil courts in England to obtain a ruling on the validity and effectiveness of the contract and the fulfilment by the municipality of its own obligations.
The civil dispute with the Municipality of Prato closed after the ruling issued by the Supreme Court in London which, on 18 December 2017, rejected the appeal request presented by the Municipality of Prato, and confirmed ruling no. [2017] EWCA Civ. 428 of the Court of Appeal in London which, on 15 June 2017, accepting Dexia Crediop’s requests, established, inter alia that: (i) the derivatives contracts signed by the Municipality of Prato and Dexia Crediop between 2002 and 2006 are fully valid and effective; (ii) the Municipality of Prato had full ability to conclude the swap contracts; (iii) the margin applied by the bank in the swap operations was necessary to cover the expected risks and costs, also clarifying the lack of grounds relative to the concept of “implicit costs”. The Municipality of Prato was also ordered to reimburse the legal expenses suffered by Dexia Crediop in the three court cases, as well as payment of interest on arrears on netting not paid since 2010.
Following the cited ruling issued by the Supreme Court, the Municipality of Prato and Dexia Crediop reached a settlement agreement on 12 March 2018, based on which the Municipality of Prato, among other things, recognised the full validity and efficacy of the swap contracts from the time of origin.
On 31 May 2017, the Criminal Court of Prato exonerated Dexia Crediop and one of its former employees of the charge of fraud against a public entity, in relation to swap operations carried out with the Municipality between 2002 and 2006 with no case to answer.
The Public Prosecutor and the Municipality of Prato, the civil claimant in the first level criminal proceedings, brought an appeal before the Court of Criminal Appeal of Florence against the ruling of the Criminal Court of Prato. Following the settlement agreement signed on 12 March 2018, the Municipality of Prato gave up the appeal.
Dexia Crediop had also launched legal action in Italy before the Regional Administrative Court of Tuscany, in order to obtain the cancellation of the above-mentioned self-protection measure, which ended in favour of Dexia Crediop, with a ruling dated 24 November 2011.
The Municipality of Prato also initiated a second self-protection measure notified on 31 January 2011 and aimed at verifying the validity of the tender called by the Municipality to select its advisor (Dexia Crediop) in 2002 and the subsequent restructuring operations of swaps prior to the one in 2006, which was the subject of the first self-protection proceedings. On 19 April 2012, the Municipality of Prato passed a resolution cancelling the tender on grounds of self-protection. On 19 May 2012, Dexia Crediop made an appeal against that resolution, with the Regional Administrative Court of Tuscany aimed at obtaining its cancellation. The litigation was closed in favour of Dexia Crediop, with a ruling handed down on 21 February 2013. The Regional Administrative Court of Tuscany, reaffirmed, amongst other things, the points it made in its previous ruling dated 24 November 2011: the jurisdiction of the civil courts (in this case, the English courts) when the dispute concerns a contract entered into by the Public Administration iure privatorum. On 21 May 2013, the Municipality served a writ to Dexia Crediop for its appeal to the Council of State against the above ruling. Following the settlement agreement signed on 12 March 2018, the Municipality of Prato renounced the appeal made to the Council of State.
On 23 December 2013 the Municipality of Prato summoned Dexia Crediop to appear before the Civil Court of Prato requesting the cancellation – and a declaration of ineffectiveness between the parties – of the ISDA framework agreement and the related Schedule signed by the Municipality of Prato with Dexia Crediop. With ruling no. 771/2015, filed on 30 June 2015, the Civil Court of Prato, accepting Dexia Crediop’s objections, declared that the Italian court had no jurisdiction, and that instead the English courts had jurisdiction.
Municipality of Ferrara:On 30 May 2012, the Municipality of Ferrara initiated a self-protection measure concerning a derivative entered into with Dexia Crediop in 2005. On 23 July 2012, the Municipality of Ferrara, with a self-protection procedures annulled its resolutions on derivatives finalised with Dexia Crediop in 2002, 2003 and 2005.
On 8 October 2012, Dexia Crediop lodged an appeal with the Regional Administrative Court of Emilia Romagna. On 15 December 2015, the Regional Administrative Court of Emilia Romagna declared that the Italian court lacked jurisdiction (both administrative and civil), in favour of the English courts.
Dexia Crediop also initiated legal action in England, aimed at ascertaining the validity and efficacy of the above swap contracts. Following the cited English Supreme Court ruling of 18 December 2017, regarding the dispute about the derivatives between Dexia Crediop and the Municipality of Prato, on 8 March 2018 Dexia Crediop and the Municipality of Ferrara signed a settlement agreement which, among other things, established full recognition by the Municipality of Ferrara of the validity and efficacy of the swap contracts from the time of origin. On the same date, the Municipality carried out a payment of netting not paid as of 2012 for an amount of € 6.6 million plus interest on arrears and reimbursed the legal expenses suffered by Dexia Crediop.
Region of Campania:With Executive Decree No. 5 of 1 March 2013, the Campania Region called for tenders for the selection of contractual and financial technical/legal analysis and assessment services in relation to the swap contracts entered into by the Campania Region in the period 2003-2006 with the aim of checking for the presence of any anomalies. Dexia Crediop therefore initiated proceedings before the civil court in England, aimed at ascertaining the validity and effectiveness of the Interest Rate Swap contract signed with the Campania Region on 10 October 2003.
115Notes to the Financial Statements

Dexia Crediop S.p.A.116
On 22 January 2018, Dexia Crediop and the Campania Region signed a settlement agreement that envisages full recognition by the Campania Region of the validity and efficacy of the swap contract from the time of origin, thereby closing the case pending in London.
Municipality of Messina:On 14 April 2011, the Municipality of Messina served Dexia Crediop with a writ of summons before the Civil Court of Messina. The writ concerns two derivative transactions entered into by the Municipality of Messina on 28 June 2007 to which Dexia Crediop is party, along with another bank. The Municipality of Messina demanded the nullity of the contracts with regards to Dexia Crediop or alternatively that they be declared cancelled and that the bank be ordered to pay compensation for damages. On 11 January 2017, the Civil Court of Messina, after the issuing of the Supreme Court ruling on 23 October 2014, which declared that the Italian civil and administrative Courts lacked jurisdiction in favour of the English courts, and as was also determined by the Regional Administrative Court of Sicily on 10 July 2015, declared it lacked jurisdiction with ruling no. 48 of 11 January 2017.
On 22 February 2018, as the Municipality of Messina’s breach of its obligations pursuant to the swap contracts still continued, Dexia Crediop took legal action in England, aimed at ascertaining the validity and effectiveness of the swap contracts signed with the Municipality of Messina and requiring the Municipality to pay the netting amounts.
Given the application for potential financial insolvency filed by the City of Messina, a provision was made equivalent to the currently unpaid netting amounting to € 6.6 million.
Province of Crotone:On 5 July 2012, Dexia Crediop initiated legal action in England, aimed at ascertaining the validity and effectiveness of the 3 swap contracts signed by the Province of Crotone in December 2007. On 11 May 2015, the High Court/Commercial Court issued a Default Judgement which granted Dexia Crediop’s request, containing, inter alia: (i) a declaration that the swap contracts are valid, effective and binding from the time of origin; and (ii) an order for the Province of Crotone to repay the legal expenses incurred by Dexia Crediop in the proceeding in question.
On 2 March 2017, Dexia Crediop received a declaration recognising and rendering enforceable the English ruling in Italy.
On 9 November 2017, Dexia Crediop began enforcement action in Italy. The enforcement proceedings against the Province of Crotone were declared to be complete on 8 January 2019 based on the Enforcement Judge’s determination that the Province had a lack of funds available at the time of seizure. Dexia Crediop has the option of beginning a new enforcement action. Considering the financial situation of the Province of Crotone, a provision was made equivalent to the currently unpaid netting amount of € 2 million.
PICFIC:On 22 May 2012 and 5 June 2012, Dexia Crediop purchased certified healthcare receivables in respect of various hospitals of Lazio from the “Italian Province of the Congregation of the Children of the Immaculate Conception” (“Provincia Italiana della Congregazione dei Figli dell’Immacolata Concezione” - PICFIC), including Rome 1 Local Health Authority. The receivables above relative to Rome 1 Local Health Authority, despite certification of the same having been made, were found to be partially subject to previous seizures.
Rome 1 Local Health Authority did not proceed with the payment of the assigned receivables for about € 3.8 million; pending litigation a provision for legal risks of equal value was set aside.
In an appeal pursuant to Art. 702 of the Italian Code of Civil Procedure Dexia Crediop summoned before the Civil Court of Rome the Rome 1 Local Health Authority, and the Lazio Region in order to obtain, among other things, an order to pay the receivables not yet received. With an order filed with the clerk of the court on 4 February 2014, the Civil Court of Rome rejected Dexia Crediop’s pleas.
With an appeal lodged on 5 March 2014, Dexia Crediop challenged the said order before the Rome Court of Appeal. The appeal ended on 24 January 2019 with the publication of judgment 486 with which the Appeals Court partially accepted Dexia Crediop’s appeal, condemning the Rome 1 Local Health Authority to pay Dexia Crediop approximately € 900 thousand, plus contractual interest.
On 30 October 2012, PICFIC was admitted to the procedure for a composition agreement pursuant to Art. 161, paragraph 6, of Italian Royal Decree No. 267 of 16 March 1942, converted on 29 March 2013, into the extraordinary administration procedure pursuant to Italian Law Decree No. 347 of 23 December 2003, converted into Law No. 39 of 18 February 2004.
On 5 April 2016, PICFIC served Dexia Crediop a writ of summons in the Civil Court of Rome concerning the revocation of the credit assignment deeds of 22 May 2012 and 5 June 2012 and, requesting to order Dexia Crediop to pay PICFIC a sum equal to the nominal value of the transferred receivables and those already cashed. The case is ongoing.
LIRI:On 23 December 2003, Dexia Crediop, in a pool with another bank, signed a loan contract with the company Livorno Reti e Impianti S.p.A. (“LIRI”) (currently in voluntary liquidation, begun in August 2014) which is 100% controlled by the Municipality of Livorno.
On 18 July 2016, LIRI summoned Dexia Crediop before the Civil Court of Rome, claiming (i) the existence of an implicit derivative in the loan contract, (ii) the presence of implicit costs and (iii) the violation inter alia of the requirements of proper conduct and good faith. The case is ongoing.
FIRA:On 9 February 2004, Dexia Crediop, in a pool with another bank, signed a loan contract with the company Fi.R.A. S.p.A. – Regional Finance Abruzzo (“FIRA”), currently 100% owned by the Abruzzo Region since 2017.
On 21 May 2018, FIRA summoned Dexia Crediop before the Civil Court of L’Aquila challenging the validity of the early termination clause of the loan agreement considering that this clause (i) represents an implicit derivative in the loan agreement, (ii) is affected by indeterminateness, and (iii) is contrary to the requirements of the Consolidated Banking Law and the legislation on banking transparency. The case is ongoing. Due to delays in payments of the instalments of the loan by FIRA, an adjustment of € 152,160.95 was made.
ICS:l’Istituto per il Credito Sportivo (“ICS”), a bank in which Dexia Crediop holds an equity investment, was subject to extraordinary administration procedures from 1 January 2012 to 28 February 2018. Within the scope of the commissioner activities, the special commissioners have questioned the legal status of a fund contributed by the State, disputing the distribution of profits to investors and the ICS Bylaws in effect in 2005. The Prime Minister’s Office, at the request of the extraordinary commissioners, opened an administrative procedure in November 2012, pursuant to Article 21-h, Italian Law no. 241/1990, aimed at the automatic cancellation, in self-protection, of the ICS Bylaws in force at the time(approved by ministerial decree on 2 August 2005) which ended on 6 March 2013 with the issue of a combined ministerial decree for the annulment of the acts issuing the ICS Bylaws which they followed: i) on 8
117Notes to the Financial Statements

Dexia Crediop S.p.A.118
August 2013 the combined Italian Ministerial Decree containing the guidelines of the new ICS Bylaws; ii) on 13 September 2013 the resolutions of the extraordinary commission for the cancellation and re-calculation of the dividends distributed by ICS under the financial statements from 2005 to 2010 and, iii) on 24 January 2014 the new Bylaws issued by combined ministerial decree. Such deeds gave rise to a complex sequence of legal actions involving, on the one side, Dexia Crediop and the other private partners of ICS and, on the other side, the supervising Ministries and the Special Commissioners of ICS.
The legal disputes in the administrative courts relate to cancellation, for self-protection, of the 2005 Bylaws of ICS with the Council of State ruling filed on 21 September 2015, which rejected the appeal made by Dexia Crediop and other private shareholders of ICS, declaring the legitimacy of the inter-ministerial decree annulling the implementation of the 2005 ICS Bylaws for self-protection, and confirming the ruling of the Regional Administrative Court of Lazio for which, as regards the annulment of the resolutions to distribute profits, the civil judge has jurisdiction.
Dexia Crediop is awaiting the hearing with the Regional Administrative Court of the Region of Lazio, in relation to the appeal filed together with other private shareholders of the ICS on 24 April 2014, in regard to the combined ministerial decree to approve the new ICS Bylaws.
The legal actions taken in the civil courts refer to the request, made by the Extraordinary Commissioners of ICS in the second half of 2013, for the restitution of the dividends received in the period 2005-2010 in excess of the minimum dividend established under the former Bylaws enacted in 2002 (amount requested from Dexia Crediop: € 16.9 million). While awaiting the results of this dispute, a provision for risks and charges has been made in an amount equal to the dividends, plus interest on arrears and legal expenses.

Section 12 – Corporate capital – Items 110, 130, 140, 150, 160, 170, and 180
12.1 “Share capital” and “Treasury shares”: breakdown The share capital is fully subscribed and paid up and amounts to €450,210,000 consisting of 174,500,000 ordinary shares with a nominal unit value of € 2.58. The company does not own any of its own shares.
12.2 Equity - Number of shares: annual change
Items/Types Ordinary Others
A. Shares existing at start of period 174,500,000
- fully paid up 174,500,000
- not fully paid up
A.1 Treasury shares (-)
A.2 Shares in circulation: opening balance 174,500,000
B. Increases
B.1 New issues
- against payment:
- company merger operations
- bond conversion
- exercise of warrants
- others
- free of charge:
- for employees
- for directors
- others
B.2 Sale of treasury shares
B.3 Other changes
C. Decreases
C.1 Cancelled
C.2 Purchase of treasury shares
C.3 Corporate sale transactions
C.4 Other changes
D. Shares in circulation: closing balance 174,500,000
D.1 Treasury shares (+)
D.2 Shares existing at end of period 174,500,000
- fully paid up 174,500,000
- not fully paid up
119Notes to the Financial Statements

Dexia Crediop S.p.A.120
12.4 Profit reserves: other information thousands of euro
Legal reserve Other reserves A. Opening balances 77,314 441,426
B. Increases 99 1,895 Legal reserve increases 99
Destination usefuel 2017 1,895
C. Decreases 70,568 First application IFRS9 70,568
D. Closing balances 77,413 372,753
Pursuant to article 2430 of the Italian Civil Code, the legal reserve is formed of at least one-twentieth of the net annual profits until the reserve reaches one fifth of the share capital.As of 31 December 2018, the other profit reserves, amount to € 373 million. After the shareholders’ approval of the Annual Report, and considering the proposal not to distribute the dividend in view of the commitment undertaken by the Dexia Group with the European Commission and in line with the Bank of Italy’s recommendation to reinforce the Bank’s asset structure, other reserves will amount to € 295 million.With reference to the impacts on profit reserves deriving from first time application of accounting standard IFRS 9, please see that described in section 2 - “General accounting principles”, in the Accounting Policies.
Other information1. Commitments and financial guarantees issued other than those designated at fair value
thousands of euro
Transactions Nominal value on commitments and financial guarantees issued Amount 31/12/2018
Amount 31/12/2017Stage 1 Stage 2 Stage 3
Commitments to disburse funds 28,320 28,320 29,720
a) Central Banks
b) General governments
c) Banks 9,250 9,250 9,750
d) Other financial corporations
e) Non-financial corporations 19,070 19,070 19,970
f) Households
Financial guarantees issued 59,378 59,378 71,016a) Central Banks
b) General governments
c) Banks
d) Other financial corporations
e) Non-financial corporations 59,378 59,378 71,016
f) Households
2. Other commitments and other guarantees issued
thousands of euro
Portfolios Nominal value
31/12/2018 31/12/2017Other guarantees issued
of which: non-performing
a) Central Banks
b) General governments
c) Banks
d) Other financial corporations
e) Non-financial corporations
f) Households
Other commitments 6 5 of which: non-performing
a) Central Banks
b) General governments
c) Banks
d) Other financial corporations
e) Non-financial corporations 6 5
f) Households

3. Assets set up as collateral for own liabilities and commitments thousands of euro
Portfolios Amount31/12/2018
Amount31/12/2017
1. Financial assets measured at fair value through profit and loss
2. Financial assets measured at fair value through other comprehensive income
3. Financial assets measured at amortized cost 9,854,306 9,772,147
4. Tangible assets
of which: tangible assets that constitute inventories
5. Management and broking for customer accounts thousands of euro
Type of services Amount
1. Execution of orders on behalf of the clientele
a) Purchases
1. settled
2. not settled
b) Sales
1. settled
2. not settled
2. Portfolio management
3. Custody and administration of securities 7,162,714
a)third-party securities on deposit: as custodian bank (excluding portfolio management schemes)
1. securities issued by consolidated companies
2. other securities
b) other third party securities on deposit (excluding portfolio management schemes): other 44,443
1. securities issued by consolidated companies
2. other securities 44,443
c) third-party securities deposited with third parties 995
d) portfolio securities deposited with third parties 7,118,271
4. Other transactions
121Notes to the Financial Statements
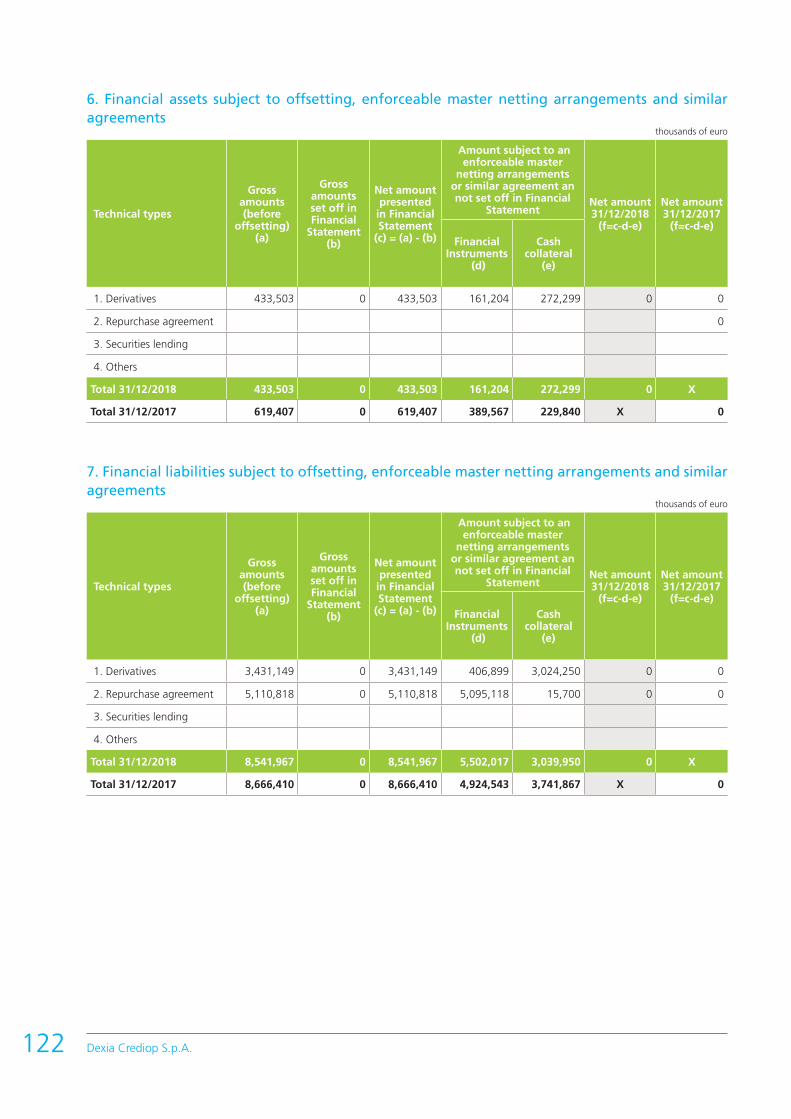
Dexia Crediop S.p.A.122
6. Financial assets subject to offsetting, enforceable master netting arrangements and similar agreements
thousands of euro
Technical types
Gross amounts (before
offsetting) (a)
Gross amounts set off in Financial
Statement (b)
Net amount presented
in Financial Statement
(c) = (a) - (b)
Amount subject to an enforceable master
netting arrangements or similar agreement an not set off in Financial
StatementNet amount 31/12/2018
(f=c-d-e)
Net amount 31/12/2017
(f=c-d-e) Financial
Instruments (d)
Cash collateral
(e)
1. Derivatives 433,503 0 433,503 161,204 272,299 0 0
2. Repurchase agreement 0
3. Securities lending
4. Others
Total 31/12/2018 433,503 0 433,503 161,204 272,299 0 X
Total 31/12/2017 619,407 0 619,407 389,567 229,840 X 0
7. Financial liabilities subject to offsetting, enforceable master netting arrangements and similar agreements
thousands of euro
Technical types
Gross amounts (before
offsetting) (a)
Gross amounts set off in Financial
Statement (b)
Net amount presented
in Financial Statement
(c) = (a) - (b)
Amount subject to an enforceable master
netting arrangements or similar agreement an not set off in Financial
Statement Net amount 31/12/2018
(f=c-d-e)
Net amount 31/12/2017
(f=c-d-e) Financial
Instruments (d)
Cash collateral
(e)
1. Derivatives 3,431,149 0 3,431,149 406,899 3,024,250 0 0
2. Repurchase agreement 5,110,818 0 5,110,818 5,095,118 15,700 0 0
3. Securities lending
4. Others
Total 31/12/2018 8,541,967 0 8,541,967 5,502,017 3,039,950 0 X
Total 31/12/2017 8,666,410 0 8,666,410 4,924,543 3,741,867 X 0

Section 1 – Interest – Items 10 and 201.1 Interest and similar income: breakdown
thousands of euro
Items/Technical types Debt securities Loans Other
transactionsTotal
31/12/2018Total
31/12/2017
1 Financial assets measured at fair value through profit and loss: 14,042 14,042
1.1 Financial assets held for trading
1.2 financial assets designated at fair value through profit and loss 1.3 other financial assets mandatorily measured at fair value through profit and loss 14,042 14,042
2 Financial assets measured at fair value through other comprehensive income 0 12,216
3 Financial assets measured at amortized cost: 202,523 97,122 299,645 346,027
3.1 Due from banks 4,056 4,056 4,792
3. 2 Due from customers 202,523 93,066 295,589 341,235
4 Hedging derivatives X X (249,471) (249,471) (291,646)
5 Other assets X X 20,958 20,958 20,184
6 Financial liabilities
Total 202,523 111,164 (228,513) 85,174 86,781
of which: interest income on impaired assets 2,097
The item “Hedging derivatives”, other operations , shows the amount of the differentials that corrects the interest income recorded on the hedged financial instruments.
1.2 Interest and similar income: other information thousands of euro
Items 31/12/2018
1.2.1 Interest income on financial assets in foreign currencies 5,848
1.3 Interest and similar expenses: breakdownthousands of euro
Items/Technical types Payables Securities Other transactions
Total31/12/2018
Total31/12/2017
1. Financial liabilities measured at amortized cost (33,494) (31,489) (64,983) (74,680)
1.1 Amounts due to central banks 0 X 0
1.2 Due to banks (33,481) X (33,481) (38,784)
1.3 Due to customers (13) X (13) (19)
1.4 Securities in issue X (31,489) (31,489) (35,877)
2. Financial liabilities held for trading
3. Financial liabilities designated at fair value
4. Other liabilities and provisions X (8,255) (8,255) (9,015)
5. Hedging derivatives X 11,920 11,920 34,243
5. Financial activities X
Total (33,494) (31,489) 3,665 (61,318) (49,452)
The item “Hedging derivatives”, other transactions, shows the amount of the differentials that corrects the interest expense recorded on the hedged financial instruments.
123Notes to the Financial Statements
Part C – Comments on the income statement

Dexia Crediop S.p.A.124
1.4 Interest and similar expenses: other information thousands of euro
Items 31/12/2018
1.4.1 Interest paid on liabilities in foreign currency (5,829)
1.5 Interest and similar expenses: differentials on hedging transactions thousands of euro
Items/Amounts 31/12/2018 31/12/2017
A. Positive differentials on hedging transactions: 42,448 52,823
B. Negative differentials on on hedging transactions: 279,999 310,226
C. Balance (A-B) (237,551) (257,403)
Section 2 - Fees and commissions - Items 40 and 50
2.1 Fee and commission income: breakdown thousands of euro
Type of services/Amounts Total 31/12/2018 Total 31/12/2017
a) guarantees given 507 595
b) credit derivatives
c) management, broking and consulting services: 2,819 2,871
1. financial instrument trading
2. foreign exchange trading
3. portfolio management
4. custody and administration of securities 2,819 2,871
5. depositary bank
6. placing of securities
7. collection of the data receipt and transmission activities
8. advisory services 0 0
8.1 in relation to investments
8.2 in relation to financial structure 0 0
9. distribution of third-party services
9.1. portfolio management
9.1.1. individual
9.1.2. collective
9.2. insurance products
9.3. other products
d) collection and payment services
e) servicing of securitisation transactions
f) services for factoring transactions
g) management of rate- and tax-collection agencies
h) multilateral trading facilities management
i) keeping and management of current accounts
j) other services 250 835
Total 3,576 4,301
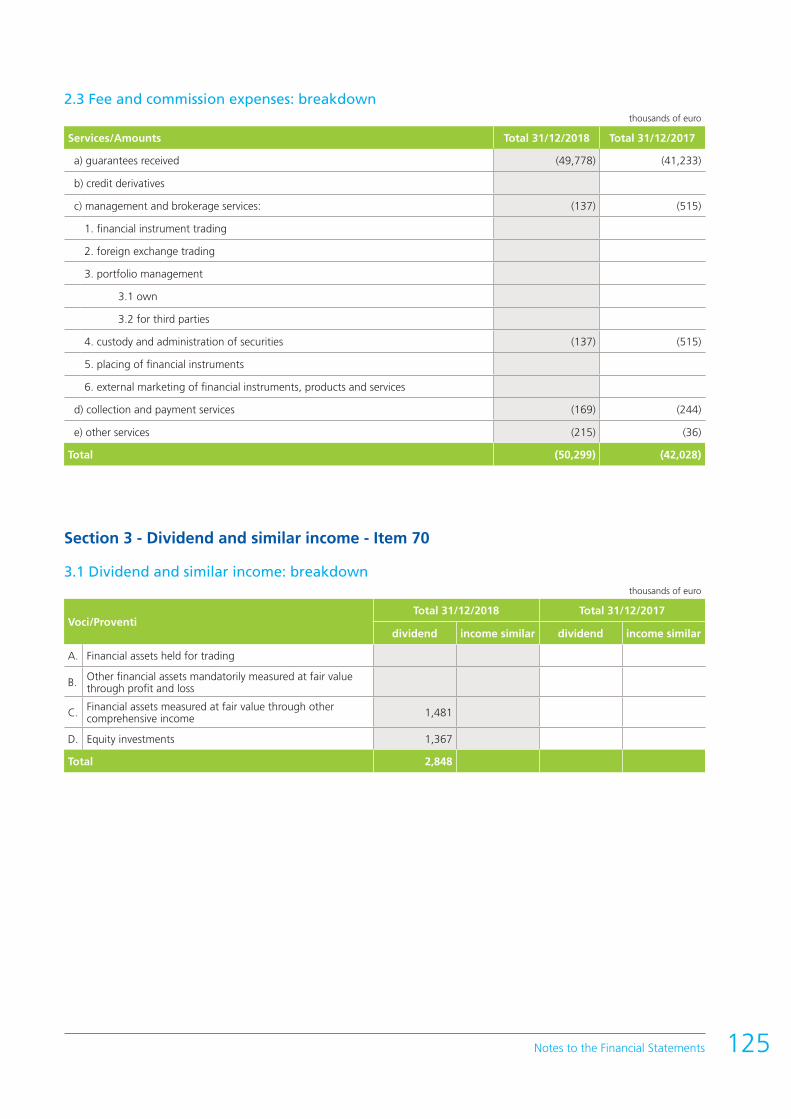
2.3 Fee and commission expenses: breakdown thousands of euro
Services/Amounts Total 31/12/2018 Total 31/12/2017
a) guarantees received (49,778) (41,233)
b) credit derivatives
c) management and brokerage services: (137) (515)
1. financial instrument trading
2. foreign exchange trading
3. portfolio management
3.1 own
3.2 for third parties
4. custody and administration of securities (137) (515)
5. placing of financial instruments
6. external marketing of financial instruments, products and services
d) collection and payment services (169) (244)
e) other services (215) (36)
Total (50,299) (42,028)
Section 3 - Dividend and similar income - Item 70
3.1 Dividend and similar income: breakdownthousands of euro
Voci/ProventiTotal 31/12/2018 Total 31/12/2017
dividend income similar dividend income similar
A. Financial assets held for trading
B. Other financial assets mandatorily measured at fair value through profit and loss
C. Financial assets measured at fair value through othercomprehensive income 1,481
D. Equity investments 1,367
Total 2,848
125Notes to the Financial Statements
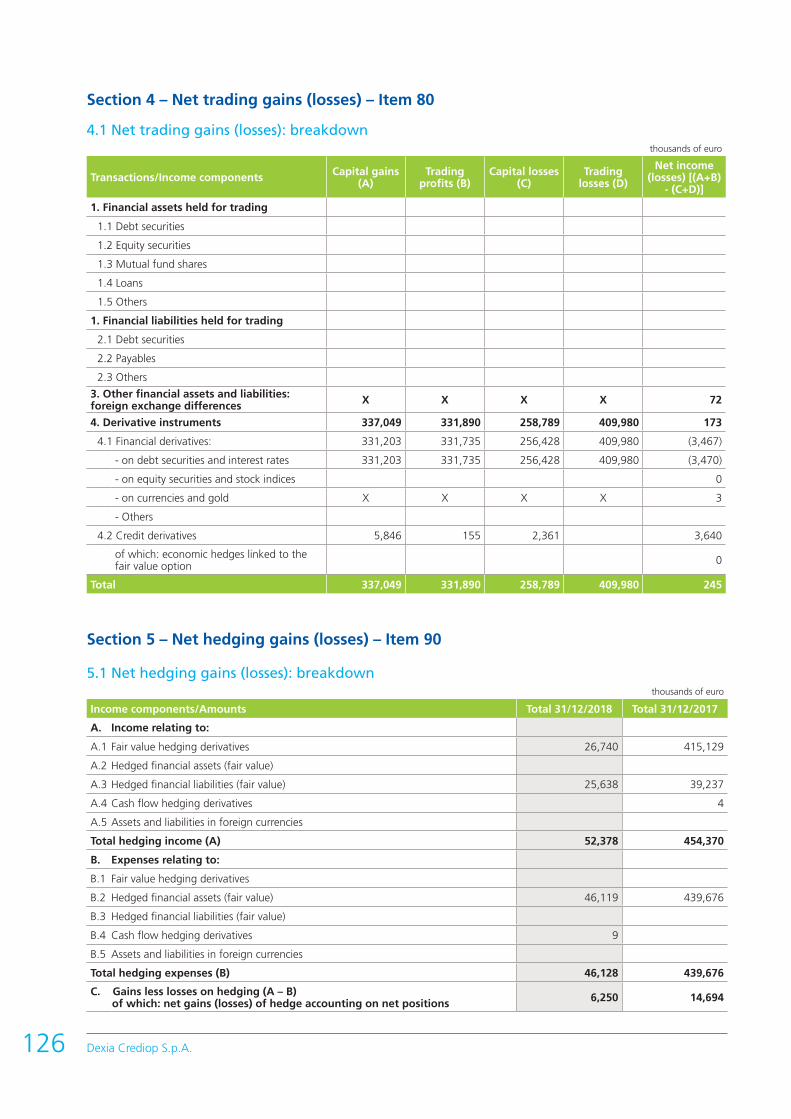
Dexia Crediop S.p.A.126
Section 4 – Net trading gains (losses) – Item 80
4.1 Net trading gains (losses): breakdown thousands of euro
Transactions/Income components Capital gains (A)
Trading profits (B)
Capital losses (C)
Trading losses (D)
Net income (losses) [(A+B)
- (C+D)]
1. Financial assets held for trading
1.1 Debt securities
1.2 Equity securities
1.3 Mutual fund shares
1.4 Loans
1.5 Others
1. Financial liabilities held for trading
2.1 Debt securities
2.2 Payables
2.3 Others
3. Other financial assets and liabilities: foreign exchange differences X X X X 72
4. Derivative instruments 337,049 331,890 258,789 409,980 173
4.1 Financial derivatives: 331,203 331,735 256,428 409,980 (3,467)
- on debt securities and interest rates 331,203 331,735 256,428 409,980 (3,470)
- on equity securities and stock indices 0
- on currencies and gold X X X X 3
- Others
4.2 Credit derivatives 5,846 155 2,361 3,640
of which: economic hedges linked to the fair value option 0
Total 337,049 331,890 258,789 409,980 245
Section 5 – Net hedging gains (losses) – Item 90
5.1 Net hedging gains (losses): breakdownthousands of euro
Income components/Amounts Total 31/12/2018 Total 31/12/2017
A. Income relating to:
A.1 Fair value hedging derivatives 26,740 415,129
A.2 Hedged financial assets (fair value)
A.3 Hedged financial liabilities (fair value) 25,638 39,237
A.4 Cash flow hedging derivatives 4
A.5 Assets and liabilities in foreign currencies
Total hedging income (A) 52,378 454,370
B. Expenses relating to:
B.1 Fair value hedging derivatives
B.2 Hedged financial assets (fair value) 46,119 439,676
B.3 Hedged financial liabilities (fair value)
B.4 Cash flow hedging derivatives 9
B.5 Assets and liabilities in foreign currencies
Total hedging expenses (B) 46,128 439,676
C. Gains less losses on hedging (A – B) of which: net gains (losses) of hedge accounting on net positions 6,250 14,694

Section 6 – Gains (losses) from sale/repurchase – Item 100
6.1 Gains (Losses) from sale/repurchase: breakdown thousands of euro
Items/Income components Total 31/12/2018 Total 31/12/2017
Gains Losses Net result Gains Losses Net
result
A. Financial assets
1. Financial assets measured at amortized cost: 387 387 3,328 3,796 (468)
1.1 Due from banks
1.2 Due from customers 387 387 3,328 3,796 (468)
2. Financial assets measured at fair value through other comprehensive income
2.1 Debt securities
2.1 Loans
Total assets (A) 387 387 3,328 3,796 (468)
B. Financial liabilities measured at amortized cost
1. Due to banks
2. Due to customers
3. Securities in issue 1,049 1,049
Total liabilities (B) 1,049 1,049
The overall result of € 1.4 million stems mainly from the early repayment of a callable security issued by the bank and early repayment of assets.
Section 7 – Net result of financial assets and liabilities measured at fair value through profit and loss – Item 110
7.2 Net change in other financial assets and liabilities measured at fair value through profit and loss: breakdown of the other financial assets mandatorily measured at fair value through profit and loss
thousands of euro
Transactions/Income components Gains(A)
Gains ondisposals (B)
Losses(C)
Losses on disposals (D)
Net result [(A+B) - (C+D)]
1. Financial assets
1.1 Debt securities
1.2 Equity securities
1.3 Mutual fund shares
1.4 Loans 32,725 5,523 75,652 (37,404)
2. Financial assets: foreign exchange differences X X X X
Total 32,725 5,523 75,652 0 (37,404)
127Notes to the Financial Statements

Dexia Crediop S.p.A.128
Section 8 – Net losses/recoveries on credit impairment – Item 130
8.1 Net impairment losses for credit risk relating to financial assets at amortised cost: breakdown
thousands of euro
Transactions/Income components
Writedowns Writebacks
31/12/2018 31/12/2017Stage 1 and 2
Stage 3Stage 1 and 2 Stage 3
Write-off Others
A. Due from banks 515 515 0
- Loans 515
- Debt securities
of which: acquired or originated impaired loans
B. Due from customers (1,217) (104) 6,808 5,487 (9,952)
- Loans (56) (104) 1,700 (10,533)
- Debt securities (1,161) 5,108 581
of which: acquired or originated impaired loans
Total (1,217) (104) 7,323 6,002 (9,952)
Section 9 – Gains/losses from contractual changes without cancellations – Item 140
9.1 Profits (losses) from contractual changes: breakdown
The result deriving from contractual changes without derecognition is equal to € 0.2 million and refers to the renegotiation of a loan with a local autority.

Section 10 – Administrative expenses – Item 160
10.1 Personnel expenses: breakdown thousands of euro
Type of expense/Amount Total 31/12/2018 Total 31/12/2017
1) Employees (11,309) (12,349)
a) wages and salaries (6,528) (7,796)
b) social security contributions (1,871) (2,161)
c) retirement indemnities (381) (458)
d) other pension costs
e) provisions for severance indemnities (25) (27)
f) provision for retirement benefits and similar benefits: (308) (215)
– defined contribution
– defined benefits (308) (215)
g) payments to complementary external pension funds: (219) (249)
– defined contribution
– defined benefits (219) (249)
h) costs pursuant to payment agreements based on own equity instruments
i) other employee benefits (1,977) (1,443)
2) Other personnel working
3) Directors and statutory auditors (792) (818)
4) Retired personnel
5) Recovery of expenses for employees seconded to other companies
6) Recovery of expenses for others’ employees seconded to the company (249) (183)
Total (12,350) (13,350)
10.2 Average number of employees by category
Employees:
a) managers 14
b) middle managers 55
-of which: of 3rd and 4th level 31
c) remaining employees 18
Other personnel
10.3 Company defined-benefit pension funds: total costs thousands of euro
31/12/2018 31/12/2017
a) Retirement benefit costs 308 152
b) Interest expenses 616 682
c) Yield of the assets (651) (646)
d) Administrative expenses 0 27
e) Actuarial losses (gains) recognized in the balance sheet 35
Total 308 215
10.4 Other employee benefits The balance includes amounts relative to redundancy incentives and premiums for insurance stipulated in favour of employees.
129Notes to the Financial Statements
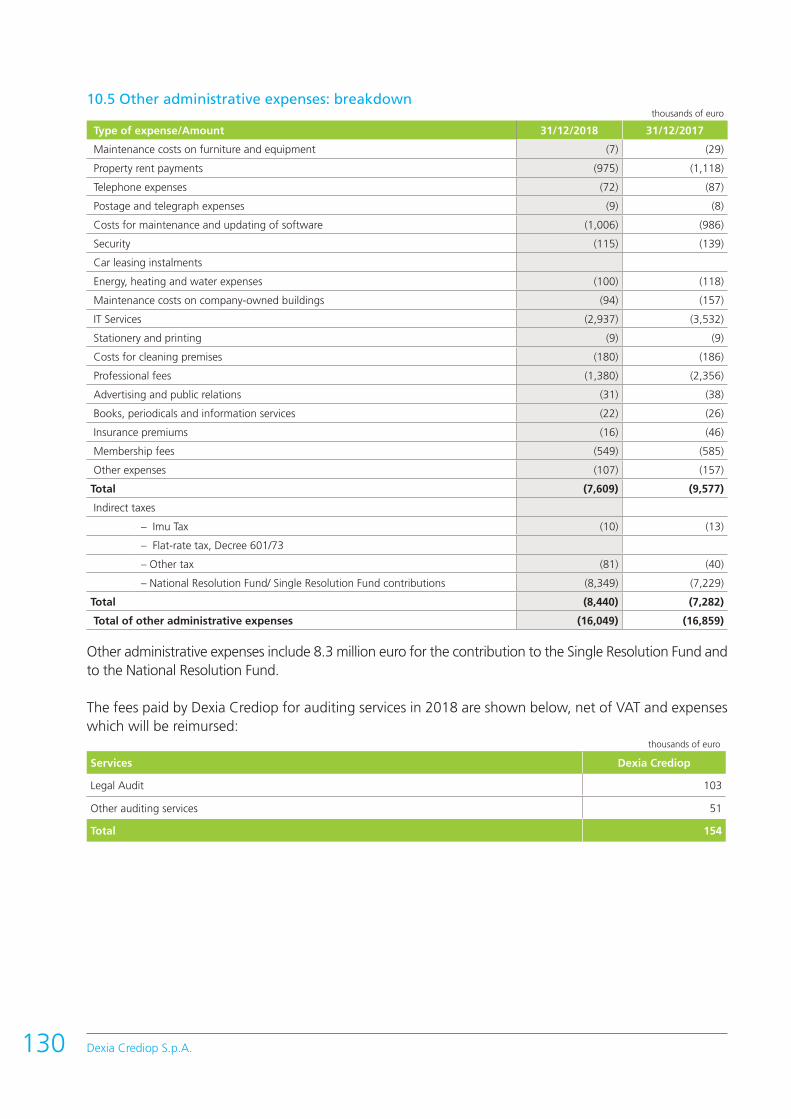
Dexia Crediop S.p.A.130
10.5 Other administrative expenses: breakdown thousands of euro
Type of expense/Amount 31/12/2018 31/12/2017
Maintenance costs on furniture and equipment (7) (29)
Property rent payments (975) (1,118)
Telephone expenses (72) (87)
Postage and telegraph expenses (9) (8)
Costs for maintenance and updating of software (1,006) (986)
Security (115) (139)
Car leasing instalments
Energy, heating and water expenses (100) (118)
Maintenance costs on company-owned buildings (94) (157)
IT Services (2,937) (3,532)
Stationery and printing (9) (9)
Costs for cleaning premises (180) (186)
Professional fees (1,380) (2,356)
Advertising and public relations (31) (38)
Books, periodicals and information services (22) (26)
Insurance premiums (16) (46)
Membership fees (549) (585)
Other expenses (107) (157)
Total (7,609) (9,577)
Indirect taxes
– Imu Tax (10) (13)
– Flat-rate tax, Decree 601/73
– Other tax (81) (40)
– National Resolution Fund/ Single Resolution Fund contributions (8,349) (7,229)
Total (8,440) (7,282)
Total of other administrative expenses (16,049) (16,859)
Other administrative expenses include 8.3 million euro for the contribution to the Single Resolution Fund and to the National Resolution Fund.
The fees paid by Dexia Crediop for auditing services in 2018 are shown below, net of VAT and expenses which will be reimursed:
thousands of euro
Services Dexia Crediop
Legal Audit 103
Other auditing services 51
Total 154

Section 11 – Net provisions for risks and charges – Item 170
11.1 Net provisions for credit risk from loans commitments and financial guarantees given: breakdown
thousands of euro
Items/Income components Total 31/12/2018 Total 31/12/2017
Provisions Utilisa-tion
Net result
Provisions Utilisa-tion
Net result
First stage 2 2
Second stage 177 177
Third stage
Total 179 179
11.3 Accantonamenti netti agli altri fondi per rischi e oneri: composizionethousands of euro
Items/Income components Total 31/12/2018 Total 31/12/2017
Provisions Utilisa-tion
Net result
Provisions Utilisa-tion
Net result
A. Risks (6,353) (6,353) (1,012) (1,012)
Total riscks (6,353) (6,353) (1,012) (1,012)
B. Charges
1. Personnel 102 102 (23) 48 25
2. Others 3 3
Total Charges 102 102 (23) 51 28
Total Risks and Charges (6,353) 102 (6,251) (1,035) 51 (984)
131Notes to the Financial Statements

Dexia Crediop S.p.A.132
Section 12 – Net adjustments on property plant and equipment – Item 180
12.1 Net adjustments on property plant and equipment: breakdown thousands of euro
Assets/Income component Amortization(a)
Impairment losses (b)
Writebacks(c)
Net result(a + b - c)
A. Property plant and equipment
A.1 Company owned (236) (236)
- for functional use (236) (236)
- for investment
- inventories X
A.2 Acquired on financial lease
- for functional use
- for investment
Total (236) (236)
Section 13 – Net adjustments on intangible assets – Item 190
13.1 Net adjustments on intangible assets: breakdown thousands of euro
Assets/Income component Amortization(a)
Impairment losses (b)
Writebacks(c)
Net result(a + b - c)
A. Intangible assets
A.1 Company owned (1,666) (1,666)
- Generated within the company
- Other (1,666) (1,666)
A.2 Acquired on financial lease
Total (1,666) (1,666)

Section 14 – Other operating expenses and revenues – Item 200
14.1 Other operating expenses: breakdown thousands of euro
Items/Amounts 31/12/2018
Interbank charges
Other expenses (2)
Total (2)
14.2 Other operating revenues: breakdown thousands of euro
Items/Amounts 31/12/2018
Rents collected
Interbank revenues
Refund of expenses
Other income 981
Total 981
Section 18 – Profits (losses) on disposal of investments – Item 250
18.1 Profits (losses) on disposal of investments: breakdownthousands of euro
Income component/Book value Total 31/12/2018 Total 31/12/2017
A. Assets
- Profit on disposal
- Losses on disposal
B. Others assets 674 1,963
- Profit on disposal 674 1,963
- Losses on disposal
Net result 674 1,963
The profit from the sale of properties refers to the sale of the building located in Naples.
133Notes to the Financial Statements

Dexia Crediop S.p.A.134
Section 19 – Income tax for the period on continuing operations – Item 270
19.1 Income tax for the period on continuing operations: breakdownthousands of euro
Component/Amounts Total 31/12/2018 Total 31/12/2017
1. Current taxes ( - ) 0
2. Changes in current taxes compared to previous periods ( +/- ) 7
3. Decreases in current taxes for the period ( + )
3bis. Decreases in current taxes for the period ( + ) 200
4. Changes in deferred tax assets ( +/- ) 2,279
5. Changes in deferred tax liabilities ( +/- )
6. Taxes for the period (-) (-1+/-2+3+3bis+/-4+/-5) 200 2,286
Current taxes are collected under the tax rules.
19.2 Reconciliation between theoretical tax burden and tax burden according to financial statements
thousands of euro
Taxable income/variations/taxes ( +/- )31/12/2018
Taxable amount Tax
Pre-tax profit - Rate (33.07%)
Increases in taxes (Rate 27.5%)
Decreases in taxes (Rate 27.5%)
Greater taxable amount for IRAP (Regional Business Tax) (Rate 5.57%)
Increases in taxes (Rate 5.57%)
Decreases in taxes (Rate 5.57%)
Changes in deferred tax assets
Taxes for the period 200

Detailed statement of comprehensive incomethousands of euro
Items Total 31/12/2018 Total 31/12/201710. Net Income (Loss) for the period (77,763) 1,994
Other comprehensive income without reversal to income statement20 Equity instruments measured at fair value through other comprehensive income: 1,974
a) change in fair value 1,974 b) transfers to other components of shareholders’ equity
30 Financial liabilities designated at fair value through profit or loss (changes in creditworthiness): a) change in fair value b) transfers to other components of shareholders’ equity
40 Hedging of equity securities designated at fair value through other comprehensive income: a) change in fair value (hedgged instrument) b) change in fair value (hedging instrument)
50 Property plant and equipment60 Intangible assets70 Defined benefit plans 12 2,26180 Non-current assets held for sale90 Share of valuation reserves related to equity investments
Other comprehensive income with reversal to income statement110 Hedging of foreign investments:
a) changes in fair value b) reversal to income statement c) other changes.
120 Exchange differences: a) changes in the value b) reversal to income statement c) other changes
130 Cash flow hedging: (2,036) (8,202) a) changes in fair value (500) (8,202) b) reversal to income statement (978) c) other changes. (558)of which: result of net positions
140 Hedging instruments (non-designated items): a) changes in the value b) reversal to income statement c) other changes.
150 Financial assets (other than equity securities) measured at fair value through other comprehensive income: 1,705
a) changes in fair value (612) b) reversal to income statement - adjustments for credit risk - profit / losses from realization c) other changes. 2,317
160 Non-current assets and groups of assets held for sale: a) changes in fair value b) reversal to income statement c) other changes
170 Share of valuation reserves related to equity investments a) changes in fair value b) reversal to income statement - Impairment losses - Gains / losses on disposals c) other changes
180 Income taxes relating to items reclassified to profit or loss190 Total other comprehensive income (50) (4,236)200 Comprehensive income (10+190) (77,813) (2,242)
135Notes to the Financial Statements
Part D - Comprehensive income

Dexia Crediop S.p.A.136
The information which must be given pursuant to Memorandum no. 285 “Supervisory provisions for banks” issued by the Bank of Italy on 17 December 2013 (Second Part, Chapter 13, “Information for the public”) is given on the Dexia Crediop website (www.dexia-crediop.it).
Introduction
In order to establish an efficient process for managing the risks to which the Bank is exposed, Dexia Crediop follows a series of sources of company regulations which transpose the Dexia Group’s policies, adapting them to national regulations.
The policies defined by the Dexia Group are applied and are generally valid for all the legal entities that fall within the Group’s scope. In performing their operations and on the subject of managing and measuring risks, the single entities follow the guidelines defined and formalised in the respective policies. The indications and guidelines contained in the policies defined by the Dexia Group are adopted within Dexia Crediop by defining and formalising specific regulations that make up the internal regulatory corpus.
In order to structure an efficient and effective corporate risk control and management system, Dexia Crediop has defined specific roles and responsibilities allocated to both the Bank’s corporate bodies and the single Company Operating Units (COU).
In the area of risk management, we note the fundamental role played by the Bank’s main corporate bodies, namely the Board of Directors, in its capacity as strategic supervisory body, the Chief Executive Officer in his/her capacity as management body, and the Board of Statutory Auditors in its capacity as control body. In addition, specific committees are provided for such as the Management Committee, the Lending Committee, the Finance Committee, and the Audit, Compliance, Accounting and Risk Committee, which are attended by the managers of the COUs.
Important risk management functions are also performed by specific Coordination Groups.In particular:• New Products Coordination Group: each of the Bank’s new products is analysed in detail, as regards
both operational impact and risk impact;• Rate Associated Risks Coordination Group: this group analyses problems relative to derivatives,
structured loans and debt management operations, relative to both public and private customers;• The Default Watchlist Coordination Group: this committee plays a fundamental role in the process of
analysing default operations and/or those on the company’s watchlist, and of monitoring credit risk;• The IT Security and Operational Continuity Coordination Group: this committee plays a fundamental
role in terms of the IT security process and in supervising provisions aimed at guaranteeing operational continuity.
Besides the Bodies/Committees/Coordination Groups indicated above, the Bank’s COUs responsible for monitoring and controlling risks are mainly the Risk and Compliance & Anti-Money Laundering.
Part E – Comments on risks andassociated hedging policies

Risk Department play a significant role in the Management Committee, Lending Committee, Finance Committee and all of the Coordination Groups detailed above. It should be noted that the Risk Department has no hierarchical relationship with the Bank’s operating units and, therefore, its function is performed independently of the Front-Office COUs.
The main duties of Compliance & Anti-Money Laundering include: monitoring the evolution of the legislative framework of reference, analysing the impact on processes and procedures; promoting and defining the necessary safeguards against identified non-compliance risks, consequently proposing organisational and procedural changes and verifying the effectiveness of the action taken; contributing to promoting a corporate culture based on values of correct conduct; identification of applicable regulations on anti-money laundering, financing of terrorism and regulations regarding identification and adequate verification of customers, and regulations regarding prevention of tax evasion.
Other corporate units, such as the Legal Unit, are positioned within the general framework for managing specific types of risk.
It is worth noting, finally, the role of the Internal Audit Unit, which is responsible for carrying out internal auditing in the Bank and constantly supervising its operation and effective application of the current internal audit system. In this context, Internal Audit assesses whether the risks assumed in the Bank’s various operations are adequately known, monitored and managed.
As can be deduced from what has been detailed above, the risk culture of the Dexia Group and of Dexia Crediop is diffused at every level, with multiple COUs directly involved in managing risks, and various Committees and Coordination Groups providing for the participation of representatives from many of the Bank’s units which, in turn, make use of the support of other COUs not directly involved in risk management.
Section 1 – Credit risk
Qualitative information
1. General aspects
Recall that, as of 15 July 2014, the European Commission confirmed the run-off management of Dexia Crediop. Therefore, as of said date, Dexia Crediop can no longer establish any new operational loan transactions.
2. Credit risk management policies
2.1 Organisational aspects
Credit risk is the risk of loss linked to the counterparties’ incapacity to honour their financial obligations. The factors which influence the level of this risk are:• the counterparty’s creditworthiness, measured by means of an internal rating (determined on the basis
of specific models);• the customer segment concerned (public sector, corporate, project finance, banking and financial
sector, etc.);• the economic, legal and financial context in which the counterparty operates;• the type of operation carried out; • the duration of the operations;• any guarantees (real, personal, financial) backing the operation.
137Notes to the Financial Statements
Dexia Crediop S.p.A.138
It should be highlighted that almost all the existing exposure regards customers in the public sector, with a moderate risk level and also subject to particular controls linked to their public nature. Credit risk (such as operative and market risk) is monitored by the Risk Department, in which two “line” functions–Operational Risk & Security, and Market Risk–ensure monitoring of the respective risk categories and activities aimed at the computerisation of the new strategic processes in relation to the Risk applications.
Risk has no hierarchical relationship with the bank’s operational COUs, and therefore exercises its functions in manner that is entirely dependent from Front Office units.
Specific Coordination Groups/Committees also form an integral part of the internal auditing systems, helping to ensure that the system works correctly.
In particular, the Lending Committee’s task is to examine materials related to existing loan proposals of any technical type. The Committee expresses an opinion regarding risk and financial conditions on the basis of proposals from the relevant COU, an opinion provided by Risk in regard to risk and, finally, an opinion (for “non standard” operations) containing legal assessments provided by the General and Legal Secretariat.The Default Watchlist Coordination Committee examines situations falling within the criteria of defaults as established by the Supervisory Authorities and by Dexia Group policies.
2.2 Management, measuring and auditing systems
As regards the methods of management, measuring and auditing, certain guidelines have been fixed at the Dexia Group level.
The Dexia Group has developed a number of internal rating systems (IRSs) for the various types of counterparties, including Corporate, Project Finance, Western European Local Public Sector (LPS), “Public Satellites”, “Private Satellites”, Banks and Sovereign States.
The internal rating system (IRS), defined on the basis of an advanced method (Advanced IRBA) involves: • the adoption of internal procedures to calculate and create historical data for IRSs;• the progressive development of an information system (FERMAT) aimed at consolidating - in a
common standardised form and “IFRS 9 compliant”- the information relating to all counterparties (Client Database) and all exposures (Exposure Database) of the Dexia Group;
• the adoption of a system for measuring the Bank’s entire risks on the basis of an approach based on its own economic resources.
To that end, we recall that, during 2014, the Risk & Capital Adequacy (RCA) approach developed by the Dexia Group was adopted, which changed the risk assessment methods (ECAP models) that had previously been used.
The new framework became operational starting from the ICAAP report sent to the Bank of Italy during the first half of 2014 and relative to the financial situation as at 31 December 2013.
2.3 Methods for measuring expected losses
As regards the aspects related to the quantification of impairments, IFRS 9 established a new evaluation model based on expected losses, which replaces the incurred losses model of IAS 39. The scope of application is financial assets measured at amortised cost, debt instruments measured at fair value with offsetting in other comprehensive income, leasing contracts, financial guarantees issued and loan commitments.

In this model, each financial instrument (with the exclusion of those originating or purchased as already non-performing) is placed in one of the three buckets established by the standard, based on changes in its credit risk starting from the initial evaluation:
Bucket 1: financial instruments that have not undergone a significant increase in credit risk since initial recognition;Bucket 2: financial instruments that have undergone a significant increase in credit risk since initial recognition, but for which objective evidence of a loss of value does not exist;Bucket 3: non-performing financial instruments.
For financial instruments with no objective evidence of impairment which must be allocated to buckets 1 or 2, Dexia has developed an approach based on both a qualitative and quantitative test in order to assess a possible significant increase in credit risk with respect to the time the financial instrument was initially acquired in the portfolio.
The quantitative test involves comparing average PD through the cycle on the original duration of the contract at the reference date and at the initial date. The change in PD is then normalised using the PD of the worst pre-default rating, defined based on the counterparty’s sector. These PDs are assessed over a time horizon equal to the initial duration of the financial instrument. If the change exceeds an established threshold, the change in the PDs indicates a significant deterioration in credit risk, and the financial instrument must be allocated to bucket 2.
The qualitative part of the approach, based on forward-looking indicators relative to the counterparty, involves assigning exposures which are closely monitored through the watchlist process to bucket 2, classified as subject to forbearance1 or which are in a “sensitive sector”2.
Standard IFRS 9 indicates that, independent of the manner in which an entity measures significant increases in credit risk, there is a relative presumption that credit risk for a financial asset increases significantly relative to initial recognition when contractual payments are overdue for more than 30 days. Given the characteristics of the Dexia portfolio and, in particular, the significant segment relative to the public sector, administrative procedures may delay contractual payments. Therefore, for this type of population, initial analysis is done to ensure that this delay is not due to administrative procedures and, if not, all exceptions are analysed and documented individually.
The initial PD must not be changed and is determined only once for each exposure. Nonetheless, if the contractual terms for a financial asset are restructured (or renegotiated or refinanced) and if this restructuring involves derecognition pursuant to IFRS 9, the restructured asset is considered to be a new asset. The relative test regarding a “significant increase in credit risk” is hence performed with respect to the new features of the restructured asset, meaning the PD at the origination date is redetermined, taking into account the rating of the counterparty at the restructuring date and the duration of the restructured financial asset.
Below are some details regarding the calculation of expected credit losses (ECL).
139Notes to the Financial Statements
1 The concept of forbearance refers to concessions guaranteed to counterparties facing financial difficulties.2 “Sensitive sectors” are economic sectors which have high credit risk factors.

Dexia Crediop S.p.A.140
Calculating expected credit losses for financial instruments in buckets 1 or 2.Calculation of expected credit losses is a function of the probability of changes in ratings, of probability of default (PD) and in Loss Given Default (LGD) and Exposure at Default (EAD) parameters. The probability of changes in ratings, PD and LGD are “Point in Time- PIT” and “predictions”, in the sense that they take current and estimated future macroeconomic conditions into account. Dexia has developed internal models based on segmentation of sectors, as well as models for the best estimate of average PD, changes in ratings and LGD, constructed over a multi-year horizon, based on historical data.
These “best estimates” are adjusted to obtain the IFRS 9 PIT models for PD and LGD, which capture the dependencies between the various macroeconomic variables and risk parameters and are constructed statistically, looking for historical interrelationships. This approach makes it possible to project PD, rating changes and LGD for any economic situation.The probability of changes in PIT ratings, probability of default and LGD are regularly subjected to backtesting on the basis of a specific internal Dexia policy.
Additionally, Dexia had developed projects of expected credit losses for 3 macroeconomic situations: basic scenario, growth and recession, with the latter two defined symmetrically with respect to the basic scenario. The “basic” macroeconomic situation consists of forecasts for a 3-year period based on a series of macroeconomic and financial market data obtained from institutional organisations, such as the European Commission and the International Monetary Fund (IMF).
The methodology used to construct the “growth” and “recession” situations is based on the historical error interval observed relative to economic forecasts and empirical observations. Weighted ECLs are then obtained by weighing the various situational results against the probability of the situation in question.
Calculating expected credit losses for financial instruments in bucket 3.In this case, expected credit losses are defined based on the individual features of the exposure, mainly on the basis of cash flow models, market price models or the value of the collateral. In certain marginal cases, no loss may be forecast, especially when the value of collateral exceeds the value of the instrument.
When Dexia has no reasonable expectation of recovering a financial asset, either entirely or partially, its gross book value is reduced. Therefore, Dexia’s policy is to recognise a loss in the income statement following renunciation of the loan which, implies that no further enforcement activities will be carried out.
2.4 Credit risk mitigation techniques
As concerns operations in derivatives, the ISDA Master Agreement is accompanied by the Credit Support Annex (CSA) for all banking counterparties: this collateralisation agreement minimises the credit risk through the regular (almost entirely daily, with a small residual amount weekly or monthly) exchange of margins as a guarantee of the net value of the bilateral exposure.
The forms of real guarantees used are essentially pledges (mainly on securities) and much less frequently mortgages on properties. The management of these guarantees is the task of the administrative and legal COUs.
The counterparties offering personal guarantees are general banks and local or regional governments. The credit risk of these counterparties is assessed on the basis of the external and internal ratings attributed to them.

The use of credit derivatives is not normally adopted as a mitigation technique, although it is permissible.
Since lending activities were mainly aimed at the domestic public sector, the majority of guarantees backing loans consist of the issue of payment notes issued by local entities or the debt service provided by the Italian State.
3. Non- performing loans exposure
3.1 Management strategies and policies
Dexia Crediop has issued specific rules governing the treatment of non-performing loans and actions to be taken in order to manage such loans so as to ensure that the procedures aimed at a positive outcome are implemented correctly.
These rules define the general guidelines within which the individual organisational units treat this subject within the scope of their own responsibilities.
The various conditions of each non-performing loan have been classified within the scope of an internal watchlist consisting of four categories with an ascending scale of seriousness: • watchlist exposures;• impaired past-due and/or over-the-limit exposures;• unlikely to pay;• non-performing loans. The Default Watchlist Coordinating Committee is responsible for examining the non-performing positions and proposes, in particular:• their classification in one of the four categories;• the adoption of impairments referring to the exposures of bucket 3;• the analysis of impairments relative to buckets 1 and 2, periodically quantified at the level of the Dexia
Group, on the basis of the new impairment model IFRS 9 based on expected losses, which replaces the incurred loss model of IAS 39 in force until last year.
Transactions which previously included in the default/watchlist categories are re-classified as “performing” when the counterparty emerges from a situation of economic/financial difficulty and returns to making all payments regularly as before.
Note that Dexia Crediop’s activities have never involved the execution of operations to purchase impaired loans falling within the IFRS 9 category of Purchased or Originated Credit-Impaired (POCI).
4. Financial assets subject to commercial renegotiation and exposures with forbearance measures
In line with the Dexia Group’s objectives and its orderly resolution plan, proactive management of the loan portfolio is limited solely to operations that provide a reduction in risks and/or simplification of the rate structure in order to transform positions to plain vanilla (fixed or variable rate).
In this context, special attention is paid to managing relationships with customers in order to implement these renegotiations in line with the stated goals.
For details regarding 2018 transactions, please see paragraph “Report on Operations” in the Dexia Crediop Report on Operations.
That being established, Dexia had determined the accounting standards applicable to loan restructuring in compliance with paragraph B3.3.6 of IFRS 9, relative to restructuring of financial liabilities.
141Notes to the Financial Statements
Dexia Crediop S.p.A.142
Restructured and modified financial assetsWhen financial assets are restructured, each one is considered individually. Changes in the contract involve changes in the originally foreseen future cash flows.
The criteria used for recognising restructured and modified loans and early repayments differs based on whether the results of the restructuring are “substantially diverse” with respect to the original contractual conditions as established.
A “substantial change” in the terms of an existing financial asset is recognised as the repayment of the original financial asset and a new financial asset is recognised.
To determine whether the terms for an asset after restructuring can be considered as substantially different from a qualitative point of view, the following factors are considered (other factors may also be considered):• the currency of the debt instrument;• the interest rate;• the conversion features associated with the instrument;• changes in covenants;• a change in counterparty.
Additionally, based on paragraph B.3.3.6 of IFRS 9, Dexia holds that terms are “substantially different” when the current net value of cash flows based on the new conditions, including any fees paid net of fees received, differs from the current net value of residual cash flows for the original asset by at least 10%.
When the change does not involve derecognition, any difference between the amended contractual cash flows discounted at the original effective interest rate and the current gross book value of a financial asset is immediately recognised in the income statement.
Restructuring or changes to a financial asset may lead to a substantial change in the terms and conditions, which would lead to the derecognition of the original financial asset. The amount received against early repayment is immediately recognised in the income statement. A new financial asset is recognised at fair value plus admissible transaction costs (even if the asset is classified and measured at amortised cost in subsequent periods).
Exposures with forbearance measuresExposures with forbearance measures (“forborne exposures”) are restructured contracts to which forbearance measures have been applied.
Forbearance measures involve concessions granted to a debtor who is facing or is about to face difficulties in respecting their financial commitments (in other words, forbearance involves counterparties dealing with “financial difficulties”).
Restructured contracts are transactions:• Renegotiated: renegotiation implies a change in the previous terms and conditions of the contract.• Refinanced: this involves the use of new debt to ensure the full or partial replacement of the
pre-existing debt.

That being established, relative to Dexia Crediop, at 31 December 2018, the financial statements include two transactions classified as “forborne” for a total amount of approximately € 3.6 million in terms of EAD, in the project finance segment.
These transactions have been granted concessions of various types in the past in relation to internal and external events which altered original credit quality. Both positions are classified as in default on the basis of the internal Dexia IRBA Advanced ratings model, and one of them is subject to specific impairment with regards to a part of the existing exposure. Therefore, for the purposes of calculating ECLs, these are allocated to bucket 3.
In reference to the calculation methodologies for the above ECLs, please see the sections “Calculating expected credit losses for financial instruments in buckets 1 and 2” and “Calculating expected credit losses for financial instruments in bucket 3”.
143Notes to the Financial Statements

Dexia Crediop S.p.A.144
Quantitative information
A. Credit quality A.1 Impaired and performing loan exposure: amounts, value adjustments, trends, economic distribution
A.1.1 Distribution of financial assets by portfolio and credit quality (book values)
thousands of euro
Portfolio/quality Non-
performing loans
Unlikely to pay
Past due impaired
exposures
Past due not impaired
exposures
Other not impaired
exposures Total
1. Financial assets measured at amortised cost 65,167 3,941 16,549,150 16,618,258
2. Financial assets measured at fair value through other comprehensive income
3. Financial assets designated at fair value through profit and loss
4. Other financial assets mandatorily measured at fair value through profit and loss 1,629 333,468 335,097
5. Financial instruments classified as held for sale 0
Total 31/12/2018 66,796 3,941 16,882,618 16,953,355
Total 31/12/2017 66,789 3,778 18,823,528 21,127,233
A.1.2 Distribution of financial assets by portfolio and credit quality (gross and net values)
thousands of euro
Portfolio/quality
Impaired Performing
Total (net exposure) Gross
exposure Specific
writedowns Net
exposure
Overall partial
write-offs *
Gross exposure
Portfolio writedowns
Netexposure
1. Financial assets measured at amortised cost
80,575 11,467 69,108 16,557,992 8,842 16,549,150 16,618,258
2. Financial assets measured at fair value through other comprehensive income
3. Financial assets designated at fair value through profit and loss
X X
4. Other financial assets mandatorily measured at fair value through profit and loss
1,629 1,629 X X 333,468 335,097
5. Financial instruments classified as held for sale
Total 31/12/2018 82,204 11,467 70,737 16,557,992 8,842 16,882,618 16,953,355
Total 31/12/2017 62,430 1,162 61,238 21,092,731 26,766 21,065,965 21,127,233
* Value shown for information purposes
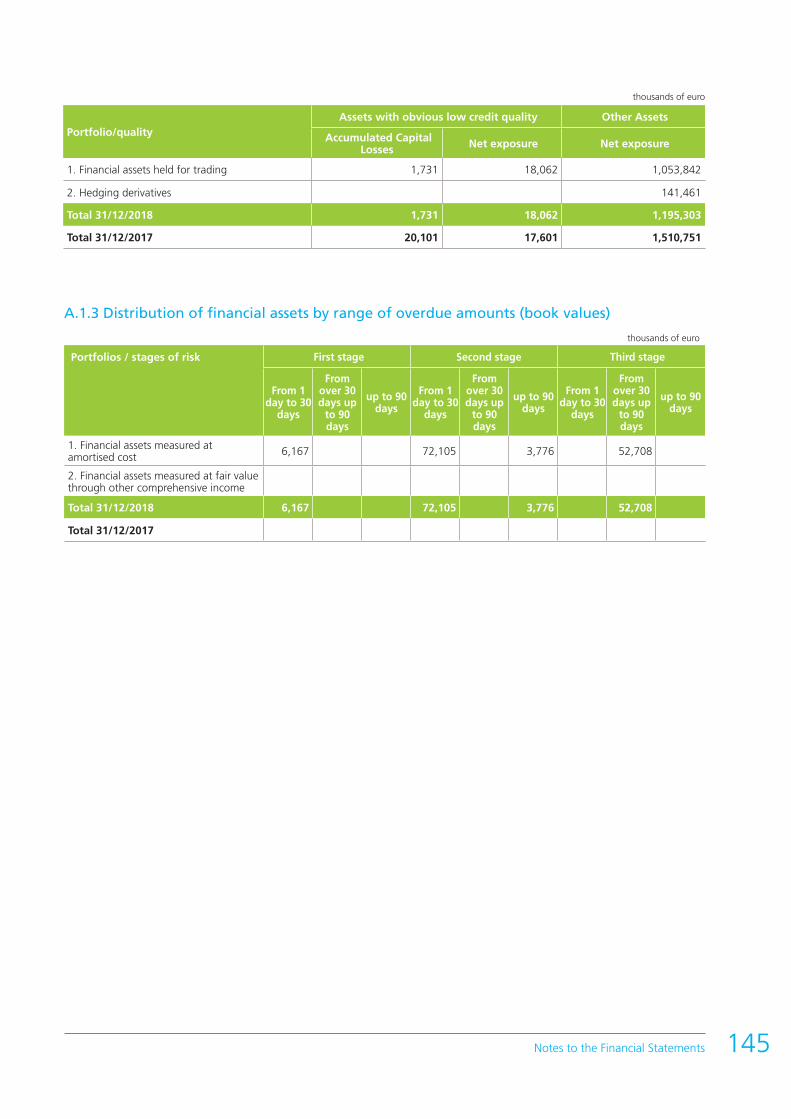
thousands of euro
Portfolio/quality Assets with obvious low credit quality Other Assets
Accumulated Capital Losses Net exposure Net exposure
1. Financial assets held for trading 1,731 18,062 1,053,842
2. Hedging derivatives 141,461
Total 31/12/2018 1,731 18,062 1,195,303
Total 31/12/2017 20,101 17,601 1,510,751
A.1.3 Distribution of financial assets by range of overdue amounts (book values)
thousands of euro
Portfolios / stages of risk First stage Second stage Third stage
From 1 day to 30
days
From over 30 days up
to 90 days
up to 90 days
From 1 day to 30
days
From over 30 days up
to 90 days
up to 90 days
From 1 day to 30
days
From over 30 days up
to 90 days
up to 90 days
1. Financial assets measured at amortised cost 6,167 72,105 3,776 52,708
2. Financial assets measured at fair value through other comprehensive income
Total 31/12/2018 6,167 72,105 3,776 52,708
Total 31/12/2017
145Notes to the Financial Statements
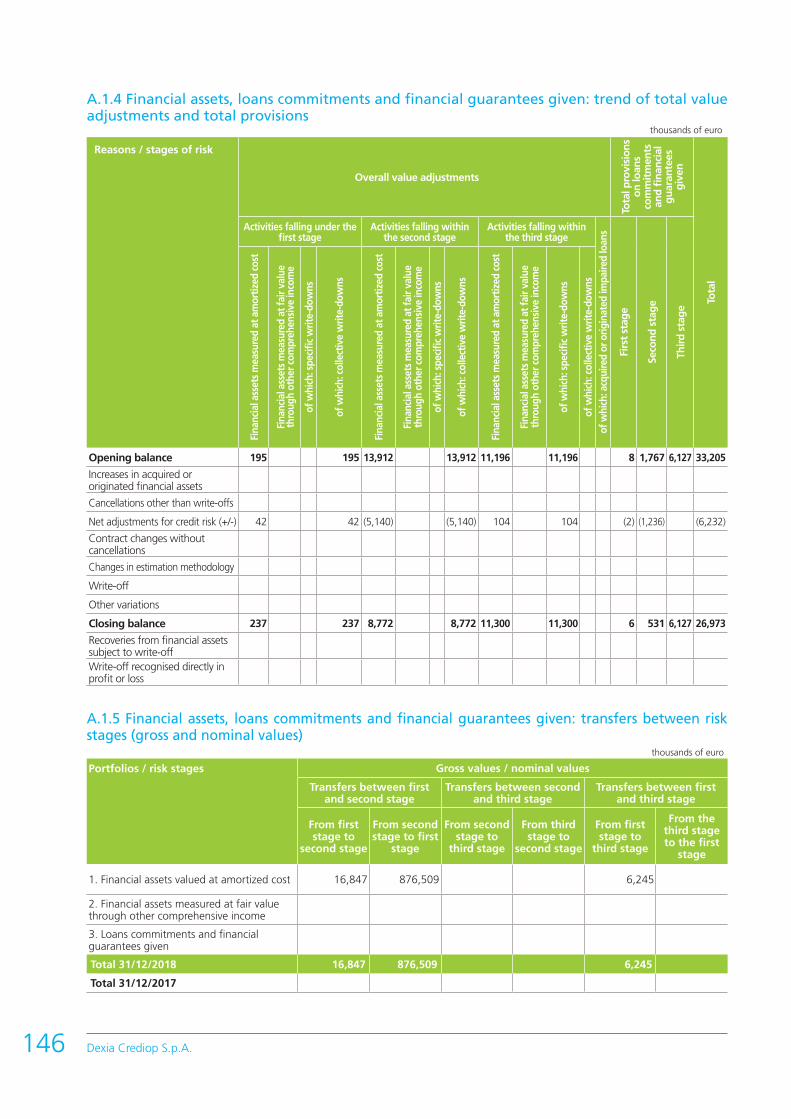
Dexia Crediop S.p.A.146
A.1.4 Financial assets, loans commitments and financial guarantees given: trend of total value adjustments and total provisions
thousands of euro
Reasons / stages of risk
Overall value adjustments
Tota
l pro
visi
on
s o
n lo
ans
com
mit
men
ts
and
fin
anci
al
gu
aran
tees
g
iven
Tota
l
Activities falling under the first stage
Activities falling within the second stage
Activities falling within the third stage
of w
hich
: acq
uire
d or
orig
inat
ed im
paire
d lo
ans
Firs
t st
age
Seco
nd
sta
ge
Thir
d s
tag
e
Fina
ncia
l ass
ets
mea
sure
d at
am
ortiz
ed c
ost
Fina
ncia
l ass
ets
mea
sure
d at
fair
valu
e th
roug
h ot
her c
ompr
ehen
sive
inco
me
of w
hich
: spe
cific
writ
e-do
wns
of w
hich
: col
lect
ive
writ
e-do
wns
Fina
ncia
l ass
ets
mea
sure
d at
am
ortiz
ed c
ost
Fina
ncia
l ass
ets
mea
sure
d at
fair
valu
e th
roug
h ot
her c
ompr
ehen
sive
inco
me
of w
hich
: spe
cific
writ
e-do
wns
of w
hich
: col
lect
ive
writ
e-do
wns
Fina
ncia
l ass
ets
mea
sure
d at
am
ortiz
ed c
ost
Fina
ncia
l ass
ets
mea
sure
d at
fair
valu
e th
roug
h ot
her c
ompr
ehen
sive
inco
me
of w
hich
: spe
cific
writ
e-do
wns
of w
hich
: col
lect
ive
writ
e-do
wns
Opening balance 195 195 13,912 13,912 11,196 11,196 8 1,767 6,127 33,205
Increases in acquired or originated financial assets
Cancellations other than write-offs
Net adjustments for credit risk (+/-) 42 42 (5,140) (5,140) 104 104 (2) (1,236) (6,232)
Contract changes without cancellations
Changes in estimation methodology
Write-off
Other variations
Closing balance 237 237 8,772 8,772 11,300 11,300 6 531 6,127 26,973
Recoveries from financial assets subject to write-offWrite-off recognised directly in profit or loss
A.1.5 Financial assets, loans commitments and financial guarantees given: transfers between risk stages (gross and nominal values)
thousands of euro
Portfolios / risk stages Gross values / nominal values
Transfers between first and second stage
Transfers between second and third stage
Transfers between first and third stage
From first stage to
second stage
From second stage to first
stage
From second stage to
third stage
From third stage to
second stage
From first stage to
third stage
From the third stage to the first
stage
1. Financial assets valued at amortized cost 16,847 876,509 6,245
2. Financial assets measured at fair value through other comprehensive income
3. Loans commitments and financialguarantees given
Total 31/12/2018 16,847 876,509 6,245
Total 31/12/2017
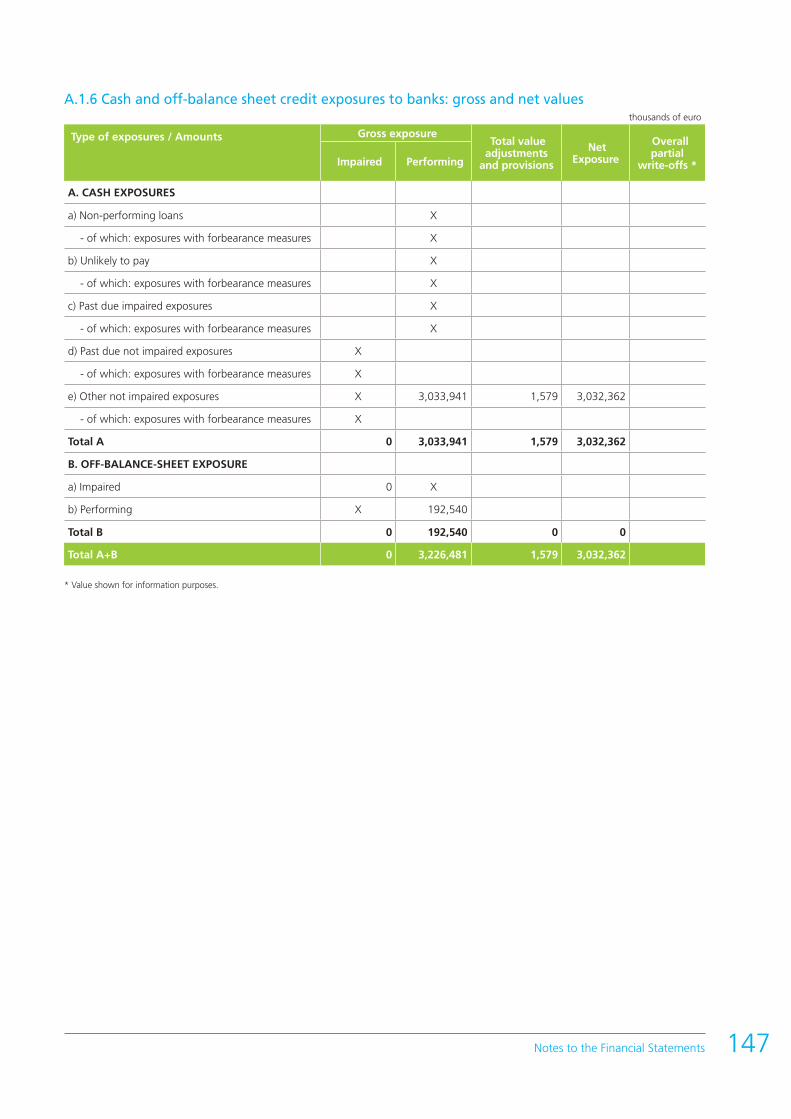
A.1.6 Cash and off-balance sheet credit exposures to banks: gross and net values thousands of euro
Type of exposures / Amounts Gross exposure Total value adjustments
and provisions
Net Exposure
Overall partial
write-offs * Impaired Performing
A. CASH EXPOSURES
a) Non-performing loans X
- of which: exposures with forbearance measures X
b) Unlikely to pay X
- of which: exposures with forbearance measures X
c) Past due impaired exposures X
- of which: exposures with forbearance measures X
d) Past due not impaired exposures X
- of which: exposures with forbearance measures X
e) Other not impaired exposures X 3,033,941 1,579 3,032,362
- of which: exposures with forbearance measures X
Total A 0 3,033,941 1,579 3,032,362
B. OFF-BALANCE-SHEET EXPOSURE
a) Impaired 0 X
b) Performing X 192,540
Total B 0 192,540 0 0
Total A+B 0 3,226,481 1,579 3,032,362
* Value shown for information purposes.
147Notes to the Financial Statements

Dexia Crediop S.p.A.148
A.1.7 Cash and off-balance sheet credit exposures to customers: gross and net values thousands of euro
Types of exposures / values Gross exposure Total value adjustments
and provisions Net Exposure
Overall partial
write-offs * Impaired Performing
A. CASH EXPOSURE
a) Non-performing loans 1,162 X 1,162 0
- of which: exposures with forbearance measures X
b) Unlikely to pay 77,099 X 10,303 66,796
- of which: exposures with forbearance measures 3,594 X 606 2,988
c) Past due impaired exposures 3,943 X 2 3,941
- of which: exposures with forbearance measures X
d) Past due not impaired exposures X
- of which: exposures with forbearance measures X
e) Other not impaired exposures X 13,857,519 7,263 13,850,256
- of which: exposures with forbearance measures X 0
Total A 82,204 13,857,519 18,730 13,920,993
B. OFF-BALANCE-SHEET EXPOSURE
a) Impaired 20,424 X 6,127 14,297
b) Performing X 871,384 536 870,848
Total B 20,424 871,384 6,663 885,145
Total A+B 102,628 14,728,903 25,393 14,806,138

A.1.9 Cash credit exposures to customers: trend of gross impaired exposuresthousands of euro
Reasons/Categories Non-performing loans Unlikely to pay Impaired past due
exposures
A. Gross initial exposure 1,162 82,950 3,778
- of which: loans sold but not derecognized
B. Increases 165
B.1 transfers from performing exposures
B.2 transfers from acquired or originated impaired financial assets
B.3 transfers from other categories of impaired exposures 165
B.4 contractual changes without cancellations
B.5 other increasing variations
C. Decreases 5,851
C.1 transfers to performing exposures
C.2 write-offs
C.3 collections 5,851
C.4 disposals
C.5 losses on disposals
C.6 transfers to other non-performing exposures categories
C.7 contractual changes without cancellations
C.8 other decreases
D. Gross closing exposure 1,162 77,099 3,943
- of which: loans sold but not derecognized
A.1.9 bis Cash credit exposures to customers: trend of gross exposures with forbearance measures by credit quality
thousands of euro
Reasons/Categories Exposures with
forbearance measures: impaired
Exposures with forbearance measures: performing
A. Gross initial exposure 3,600 10,853
- of which: loans sold but not derecognized
B. Increases
B.1 transfers from performing exposures without forbearance measures
B.2 transfers from performing exposures with forbearance measures X
B.3 transfers from non performing exposures with forbearance measures X
B.4 other increases
C. Decreases 10,853
C.1 transfers to performing exposures without forbearance measures X 10,853
C.2 transfers to performing exposures with forbearance measures
C.3 transfers to non performing exposures with forbearance measures X
C.4 writeoffs
C.5 collections 6
C.6 disposals
C.7 losses on disposals
C.8 other decreases
D. Gross closing exposure 3,594 0
- of which: loans sold but not derecognized
149Notes to the Financial Statements

Dexia Crediop S.p.A.150
A.1.11 Impaired cash loan exposures to customers: trend of overall value adjustments thousands of euro
Reasons/Categories Non-performing loans Unlikely to pay Past due impairedexposures
Total
Of which: exposures with
forbearance measures
Total
Of which: exposures with
forbearance measures
Total
Of which: exposures with
forbearance measures
A. Total initial adjustments 1,162 10,206 606
- of which: loans sold but not derecognized
B. Increases 0 104 2
B.1 value adjustments for impaired financial assets acquired or originated X X X
B.2 other value adjustments 104 2
B.3 losses on disposal
B.4 transfers from other categories of impaired exposures
B.5 contractual changes without cancellations X X X
B.6 other increasing variations
C. Decreases 0 7 0 0
C.1 writebacks from valuations 7
C.2 writebacks from collections
C.3 gains from disposal
C.4 write-off
C.5 transfers to other categories of impaired exposures
C.6 contract changes without cancellations X X X
C.7 other decreasing variations
D. Total final adjustments 1,162 10,303 606 2
- of which: loans sold but not derecognized

A.2 Classification of financial assets, loans commitments and financial guarantees given according to external and internal ratings A.2.1 Distribution of financial assets, loans commitments and financial guarantees given according to external ratings (gross amounts)
thousands of euro
ExposureExternal rating classes Without
rating Totalclass 1 class 2 class 3 class 4 class 5 class 6
A. Financial assets measured at amortized cost
428,312 2,127,951 7,858,880 2,994,173 3,229,251 16,638,567
- First stage 428,312 1,880,930 7,034,739 440,254 2,762,343 12,546,578
- Second stage 247,021 824,141 2,553,919 402,900 4,027,981
- Third stage 64,008 64,008
B. Financial assets measured at fair value through other comprehensive income
- First stage
- Second stage
- Third stage
Total (A+B) 428,312 2,127,951 7,858,880 2,994,173 3,229,251 16,638,567
of which: acquired or originated impaired loans
C. Loans commitments and financial guarantees given
157,609 60,466 199,630 446,708 219,935 1,084,348
- First stage 157,609 60,466 173,496 446,708 180,441 1,018,720
- Second stage 26,134 19,070 45,204
- Third stage 20,424 20,424
Total C 157,609 60,466 199,630 446,708 219,935 1,084,348
Total (A + B + C) 585,921 2,188,417 8,058,510 3,440,881 3,449,186 17,722,915
The exposure considered is that of the financial statements included in the tables above A.1.2, A.1.3 and A.1.7. The external rating classes adopted to complete the table are those used by Standard&Poor’s, Moody’s and Fitch. Given that several external ratings are assigned, the criteria adopted in making the choice is that established by the Bank of Italy, namely where there are two ratings, the worst is used, where there are three ratings the two best are identified, and, if these differ, the worse of the two is chosen. In order to breakdown according to ratings classes, a summary table has been used to convert the classification envisaged by the various different ratings companies to the credit standing classes.
151Notes to the Financial Statements

Dexia Crediop S.p.A.152
A.2.2 Distribution of financial assets, loans commitments and financial guarantees given according to internal ratings (gross amounts)
thousands of euro
Exposure Internal rating classes Without
rating TotalAAA / AA- A+ / A- BBB+/BBB- BB+/B- D1 / D2
A. Financial assets measured at amortized cost
593,431 2,643,434 5,737,369 7,600,325 64,008 16,638,567
- First stage 593,431 2,396,413 5,566,653 3,990,081 12,546,578 - Second stage 247,021 170,716 3,610,244 4,027,981 - Third stage 64,008 64,008
B. Financial assets measured at fair value through other comprehensive income
- First stage - Second stage - Third stageTotal (A+B) 593,431 2,643,434 5,737,369 7,600,325 64,008 16,638,567
of which: acquired or originated impaired loans
C. Loans commitments and financial guarantees given
157,609 26,968 162,818 698,246 18,278 20,429 1,084,348
- First stage 157,609 26,968 136,684 679,176 18,278 5 1,018,720 - Second stage 26,134 19,070 45,204 - Third stage 20,424 20,424 Total C 157,609 26,968 162,818 698,246 18,278 20,429 1,084,348 Total (A + B + C) 751,040 2,670,402 5,900,187 8,298,571 82,286 20,429 17,722,915
A.3 Distribution of secured credit exposures accoridng to type of guarantee
A.3.2 Secured cash and off-balance sheet credit exposures to customers thousands of euro
Gro
ss e
xpos
ure
Net
exp
osur
e
Collateral guarantee (1) Personal guarantee (2)
Tota
l (1)
+(2)
Loan derivatives Unsecured loans
Pro
pert
ies
- mor
tgag
es
Pro
pert
ies
- Fin
ance
leas
es
Sec
urit
ies
Oth
er c
olla
tera
l gua
rant
ee
CLN
Other derivatives
Gen
eral
gov
ernm
ents
Ban
ks
Oth
er fi
nanc
ial c
orpo
rati
ons
Oth
er s
ubje
cts
Cen
tral
cou
nter
part
ies
Ban
ks
Oth
er fi
nanc
ial
corp
orat
ions
Oth
er s
ubje
cts
1 Secured cash loan exposure: 1,641,875 1,628,393 41,804 17,309 75,068 750,019 657,600 16,014 1,557,814
1.1 fully secured 1,466,215 1,452,742 41,804 17,309 75,068 744,947 557,600 16,014 1,452,742
- of which impaired 75,381 65,122 11,616 0 23,461 30,045 65,122
1.2 partially secured 175,660 175,651 5,072 100,000 105,072
- of which impaired 0 0
2. Secured off-balance sheet loan exposure: 19,070 19,070 19,070 19,070
2.1 fully secured 19,070 19,070 19,070 19,070
- of which impaired 0 0
2.2 partially secured 0 0 0
- of which impaired

B. Distribution and concentration of credit exposures B.1 Distribution of on and off-balance sheet customer loan exposure according to sector
thousands of euro
Exposure/Counterparties
Generalgovernments
Financialcorporations
Financial corporations
(of which: insurance
corporations)
Non-financial corporations Householdes
Net
exp
osu
re
Tota
l val
ue
adju
stm
ents
Net
exp
osu
re
Tota
l val
ue
adju
stm
ents
Net
exp
osu
re
Tota
l val
ue
adju
stm
ents
Net
exp
osu
re
Tota
l val
ue
adju
stm
ents
Net
exp
osu
re
Tota
l val
ue
adju
stm
ents
A. Cash credit exposure
A.1 Non-performing loans 0 199 0 0 0 963
- of which: exposures with forbearance measures
A.2 Unlikely to pay 0 0 6,141 104 60,655 10,199
- of which: exposures with forbearance measures 2,988 606
A.3 Past due impaired exposures 3,941 2 0
- of which: exposures with forbearance measures
A.4 Not impaired exposures 12,292,770 3,228 932,573 70 624,914 3,965
- of which: exposures with forbearance measures
Total (A) 12,296,711 3,429 938,714 174 685,569 15,127
B. Off-balance sheet credit exosure
B.1 Impaired exposures 20,424
B.2 Performing exposures 685,293 91,730 94,361
Total (B) 685,293 0 91,730 0 114,785 0
Total (A+B) 31/12/2018 12,982,004 3,429 1,030,444 174 800,354 15,127
Total (A+B) 31/12/2017 14,192,162 15,056 1,308,353 1,986 1,088,279 20,838 194
153Notes to the Financial Statements
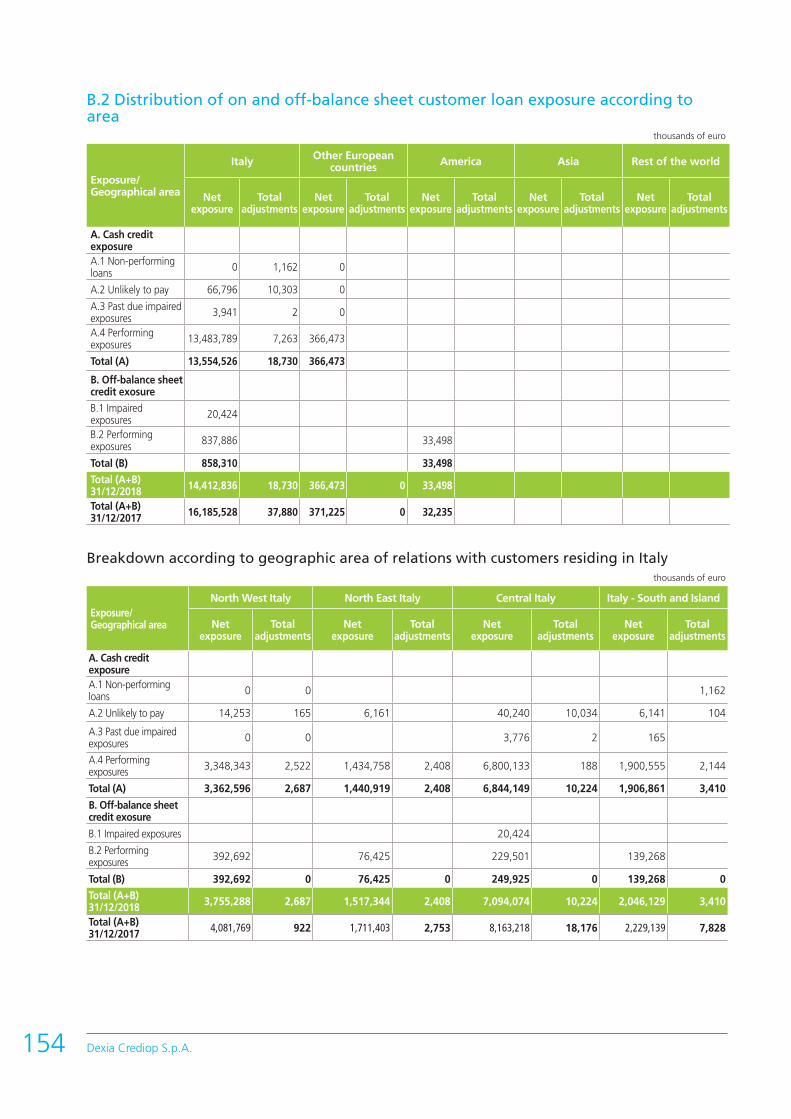
Dexia Crediop S.p.A.154
B.2 Distribution of on and off-balance sheet customer loan exposure according to area
thousands of euro
Exposure/Geographical area
Italy Other European countries America Asia Rest of the world
Netexposure
Total adjustments
Netexposure
Total adjustments
Netexposure
Total adjustments
Netexposure
Total adjustments
Netexposure
Total adjustments
A. Cash credit exposure A.1 Non-performing loans 0 1,162 0
A.2 Unlikely to pay 66,796 10,303 0
A.3 Past due impaired exposures 3,941 2 0
A.4 Performing exposures 13,483,789 7,263 366,473
Total (A) 13,554,526 18,730 366,473
B. Off-balance sheet credit exosure
B.1 Impaired exposures 20,424
B.2 Performing exposures 837,886 33,498
Total (B) 858,310 33,498
Total (A+B) 31/12/2018 14,412,836 18,730 366,473 0 33,498
Total (A+B) 31/12/2017 16,185,528 37,880 371,225 0 32,235
Breakdown according to geographic area of relations with customers residing in Italy thousands of euro
Exposure/Geographical area
North West Italy North East Italy Central Italy Italy - South and Island
Netexposure
Total adjustments
Netexposure
Total adjustments
Netexposure
Total adjustments
Netexposure
Total adjustments
A. Cash credit exposure A.1 Non-performing loans 0 0 1,162
A.2 Unlikely to pay 14,253 165 6,161 40,240 10,034 6,141 104
A.3 Past due impaired exposures 0 0 3,776 2 165
A.4 Performing exposures 3,348,343 2,522 1,434,758 2,408 6,800,133 188 1,900,555 2,144
Total (A) 3,362,596 2,687 1,440,919 2,408 6,844,149 10,224 1,906,861 3,410
B. Off-balance sheet credit exosure
B.1 Impaired exposures 20,424
B.2 Performing exposures 392,692 76,425 229,501 139,268
Total (B) 392,692 0 76,425 0 249,925 0 139,268 0
Total (A+B) 31/12/2018 3,755,288 2,687 1,517,344 2,408 7,094,074 10,224 2,046,129 3,410
Total (A+B) 31/12/2017 4,081,769 922 1,711,403 2,753 8,163,218 18,176 2,229,139 7,828

B.3 Distribution of on and off-balance sheet bank loan exposure according to area
thousands of euro
Exposure/Geographical area
Italy Other European countries America Asia Rest of the world
Netexposure
Total adjustments
Netexposure
Total adjustments
Netexposure
Total adjustments
Netexposure
Total adjustments
Netexposure
Total adjustments
A. Cash credit exposure A.1 Non-performing loans
A.2 Unlikely to pay
A.3 Past due impaired exposures A.4 Performing exposures 417,013 1,579 2,442,572 172,771
Total (A) 417,013 1,579 2,442,572 172,771
B. Off-balance sheet credit exosure B.1 Impaired exposures B.2 Performing exposures 7,962 184,578
Total (B) 7,962 0 184,578 0
Total (A+B) 31/12/2018 424,975 1,579 2,627,150 172,771
Total (A+B) 31/12/2017 423,441 0 2,949,762 176,839 1,192
Breakdown according to geographic area of relations with banks residing in Italy thousands of euro
Exposure/Geographical areaNorth West Italy North East Italy Central Italy Italy - South and Island
Netexposure
Total adjustments
Netexposure
Total adjustments
Netexposure
Total adjustments
Netexposure
Total adjustments
A. Cash credit exposure
A.1 Non-performing loans
A.2 Unlikely to pay
A.3 Past due impaired exposures
A.4 Performing exposures 162,564 254,449 1,579
Total (A) 162,564 0 254,449 1,579
B. Off-balance sheet credit exosure
B.1 Impaired exposures
B.2 Performing exposures 157 2,197 5,608
Total (B) 157 2,197 5,608 0
Total (A+B) 31/12/2018 162,721 2,197 260,057 1,579
Total (A+B) 31/12/2017 163,335 3,546 256,560
B.4 Large exposure
The information in relation to Large exposure is provided considering the changes made to prudential regulations on risk concentration.
a) Exposure (book value) 20,156,256 thousands of euro
b) Weighted (weithed value) 1,764,940 thousands of euro
c) Number 28
155Notes to the Financial Statements

Dexia Crediop S.p.A.156
C. Securitisation transactions Qualitative informationThe section does not include securitisations where all the liabilities issued by the vehicle company (e.g. ABS securities) are subscribed at the issue by the bank originator.C.2 Exposure resulting from securitization transactions Main “Third Party “ by type of securitized asset and by type of exposure
thousands of euro
Type of underlying assets/Exposure
Cash exposure Guarantees given Credit lines
Senior Mezzanine Junior Senior Mezzanine Junior Senior Mezzanine Junior
Book
val
ue
Impa
irmen
t/
Writ
ebac
ks
Book
val
ue
Impa
irmen
t/
Writ
ebac
ks
Book
val
ue
Impa
irmen
t/
Writ
ebac
ks
Net
exp
osur
e
Impa
irmen
t/
Writ
ebac
ks
Net
exp
osur
e
Impa
irmen
t/
Writ
ebac
ks
Net
exp
osur
e
Impa
irmen
t/
Writ
ebac
ks
Net
exp
osur
e
Impa
irmen
t/
Writ
ebac
ks
Net
exp
osur
e
Impa
irmen
t/
Writ
ebac
ks
Net
exp
osur
e
Impa
irmen
t/
Writ
ebac
ks
A.1
- Non-residential mortgage loans 0
A.2
- Other 496,883
A.3
- Leasing
A.4
- Other assets
A.5
- Other non-per-forming loans
E. Sales transactions A. Financial assets sold but not fully derecognized Qualitative and Quantitative Information E.1 Financial assets sold and fully recognised and associated financial liabilities: book value
thousands of euro
Financial assets sold and fully recognised Associated financial liabilities
Book value
Of which: subject to
securitisation transaction
Of which: subject to sale
agreement with repurchase obligation
of which nonperforming
Book value
of which: subject to
securitisation transaction
Of which: subject to sale
agreement with repurchase obligation
A. Financial assets held for trading X
1. Debt securties X
2. Equity instruments X
3. Loans X
4. Derivative instruments X
B. other financial assets mandatorily measured at fair value through profit and loss 1. Debt securties
2. Equity instruments X
3. Loans C. financial assets designated at fair value through profit and loss 1. Debt securties
2. Loans
D. Financial assets measured at fair value through other comprehensive income 1. Debt securties
2. Equity instruments X
3. Loans
E. Financial assets measured at amortised cost 6,912,400 5,109,247
1. Debt securties 6,912,400
2. Loans 5,109,247
Total 31/12/2018 6,912,400 5,109,247
Total 31/12/2017 2,878,752 4,748,752

E.3 Sale transactions with liabilities associeated exclusively to sold assets sold and not fully derecognised: fair value
thousands of euro
Fully recognised
Partially recognised
Total
31/dic/2018 31/dic/2017
A. Financial assets held for trading
1. Debt securties
2. Equity instruments
3. Loans
4. Derivative instruments
B. Other financial assets mandatorily measured at fair value through profit and loss 1. Debt securties
2. Equity instruments
3. Loans
C. Financial assets designated at fair value through profit and loss
1. Debt securties
2. Loans
D. Financial assets measured at fair value through other comprehensive income
1. Debt securties
2. Equity instruments
3. Loans
E. Financial assets at amortised cost 5,615,041 5,615,041 2,478,334
1. Debt securties 5,615,041 5,615,041 2,478,334
2. Loans
Total associated financial assets 5,615,041 5,615,041 2,478,334
Total associated financial assets 5,109,247 X X
Total net amount 31/12/2018 505,794 505,794 X
Total net amount 31/12/2017 (2,270,418) X (2,270,418)
157Notes to the Financial Statements
Dexia Crediop S.p.A.158
Section 2 – Market risks
2.1 - Interest rate and price risks - Regulatory trading book
INTEREST RATE RISK
Qualitative information
A. General aspectsThe portfolio consists exclusively of derivative products with an original maturity exceeding one year, mainly back to back Interest Rate Swaps (IRS) for which the interest rate risk is generated by the running margins.The underlying operations, for the most part, regard the management of the medium/long-term debt, represented by loans or securities, of public customers, and the sale of derivative products to financial and Corporate customers.In both cases, the interest rate risk is precisely covered by derivatives of the opposite sign traded on the market.
B. Management and measurement methods of interest rate risk The interest rate risk is managed by the CLM & Market Execution organisational unit and is subject to daily monitoring at local level by Market Risk and at a consolidated level by the structureProduct Control allocated at the parent company.
The main interest rate risk indicators measured are the following:• Shift sensitivity of fair value; • Value at Risk (VaR). The shift sensitivity of fair value quantifies the change in the portfolio value consequent to parallel and instantaneous increases of the market interest rates curve.
The VaR is defined as the maximum potential loss caused by possible adverse movements in market interest rates, with reference to a confidence level of 99% and a holding period of ten working days.
Periodic scenario analysis are also carried out to measure the impact on the value of the portfolios under management caused by a series of instantaneous shocks on market interest rates.
PRICE RISK
The portfolio is not exposed to price risk.

Quantitative information
1. Regulatory banking book: distribution according to residual maturity (re-pricing date) of financial assets and cash liabilities and financial derivatives Currency of instruments: Euro
thousands of euro
Type/ Residual maturity ondemand
Up to 3 months
Between 3 and 6 months
Between 6 months
and 1 year
Between 1 year and 5 years
Between 5 and 10
years
More than 10 years
Unspecified term
1. Cash assets
1.1 Debt securities
- with early redemption option
- others
1.2 Other assets
2. Cash liabilities
2.1 Repurchase agree-ments
2.2 Other liabilities
3. Financial derivatives
3.1 With underlying security
- Options
+ long positions
+ short positions
- Other derivatives
+ long positions
+ short positions
3.2 Without underlying security
- Options
+ long positions
+ short positions
- Other derivatives
+ long positions 1,838,739 3,406,699 5,129,690 1,339,512 1,649,037 636,722 1,716,038
+ short positions 1,317,566 2,415,553 5,038,280 1,310,078 1,710,225 603,432 3,318,060
159Notes to the Financial Statements

Dexia Crediop S.p.A.160
3. Regulatory trading book - internal models and other sensitivity analysis methods
Back to back pairs of trading derivatives, which make up the “Structuring” area, typically consist of a derivative with customers or market counterparties which may or may not be hedged by a CSA-type collateralisation contract. The previous operating limits set on the “Structuring” perimeter in terms of shift-sensitivity of fair value and VAR interest rate (respectively ± € 45,000/500,000) were the subject of a recent methodological review that led to the confirmation of the VAR limit and the replacement, starting from last May, of the previous sensitivity limit with a new global limit (set at € 80,000) measured in absolute value and accompanied by a series of sub-limits per curve/pillar/currency. At 31 December 2018, a global sensitivity shift was recorded in the “Structuring “ area equal to € 6,100 per 1 bp against an operating limit set at € 80,000 and a VAR of € 0.03 million, compared to an operating limit set at € 0.5 million.Both indicators, as well as all those related to the sub-limits mentioned above, have remained constantly below the limits during the year.
The internal model is not used to calculate the capital requirements for market risks.

2.2 - Interest rate risk and price risk – Banking book
INTEREST RATE RISK
Qualitative information
A. General aspects, management and measurement methods of interest rate risk The exposure to short-term interest-rate risk (usually below one year) of the banking book, generated in particular by the fixing of the Euribor parameter to which the bank’s floating rate financial assets and liabilities are typically indexed or synthetically transformed, is managed by the CLM & Market Execution organisational unit, within the Cash and Liquidity Management (CLM) area. Operating proposals for opening or closing the interest rate risk are discussed and approved by the Finance Committee, which evaluates expected impacts on the use of the fixed operating and risk limits. Derivatives used to hedge against interest rate risk are mainly Overnight Indexed Swaps (OIS).
Exposure to medium/long-term fixed rate interest rate risk is generated by mismatching between financial assets and liabilities with an original maturity of more than a year (including the conventional fixed rate liability represented by shareholders’ equity) and the relative hedging derivatives (“ALM Rate”segment). At the end of December 2018, this exposure was residual, at 10.02 million of sensitivity per 100 bp (up to a limit of e 15 million). Every operating proposal aimed at managing the interest rate risk, is approved by the Finance Committee based on interventions presented by Financial Control.
Activities to measure and control market risks are assigned to Market Risk (within CLM) and to Financial Control (within ALM Rate). They calculate risk indicators verifying whether theoperating limits set are respected.
For interest rate risk, fair value or cash flow hedging derivatives are used. The most commonly used instruments are Interest Rate Swaps.
PRICE RISK
Qualitative information A. General aspects, management and measurement of price risk The banking portfolio is exposed to price risk relative to equity securities classified among financial assets measured at fair value through other comprehensive income.The item include the equity investment in the Istituto per il Credito Sportivo for which the fair value was measured on the basis of the portion of shareholders’ equity attributed by the new articles of association, issued with a combined ministerial decree on 24 January 2014 and published in the Official Journal on 19 April 2014. As indicated in the section on judicial procedures in course, this measurement does not in any constitute acquiescence with respect to the “forced” reduction of the equity investment made by the new Articles of Association subject to disputes in course.
B. Price risk hedging activities Given the nature underlying the price risk, no hedges are implemented.
161Notes to the Financial Statements

Dexia Crediop S.p.A.162
Quantitative information
1. Banking book: distribution according to residual maturity (re-pricing date) of financial assets and liabilities Currency of instruments: Euro
thousands of euro
Type/ Residual maturity ondemand
Up to 3 months
Between 3 and 6 months
Between 6 months
and 1 year
Between 1 year and 5
years
Between 5 and 10
years
More than 10 years
Unspecified term
1. Cash assets 1,786,880 3,512,899 3,661,062 1,327,783 792,487 914,934 3,215,298
1.1 Debt securities 1,780,970 302,171 1,329,373 1,084,229 343,291 350,565 2,227,300
- with early redemption option 178,444 254,653 121,508 40,950 19,900 100,214 33,057
- others 1,602,526 47,518 1,207,865 1,043,279 323,391 250,351 2,194,244
1.2 Due from banks 870 2,651,733 204,046 12,322 46,911 37,440 66,698
1.3 Due from customers 5,040 558,995 2,127,643 231,232 402,286 526,929 921,300
- c/c
- other loans 5,040 558,995 2,127,643 231,232 402,286 526,929 921,300
- with early redemption option
- others 5,040 558,995 2,127,643 231,232 402,286 526,929 921,300
2. Cash liabilities 740,138 4,672,727 8,026,298 35,060 3,672 92,598 -
2.1 Due to customers 255,138 29,145 153,279 15,228 - -
- c/c 9,523
- other payables 245,615 29,145 153,279 15,228 - -
- with early redemption option
- others 245,615 29,145 153,279 15,228
2.2 Due to banks 485,000 4,473,982 5,273,019 - -
- c/c
- other payables 485,000 4,473,982 5,273,019 -
2.3 Debt securities 169,601 2,600,000 19,833 3,672 92,598
- with early redemption option
- others 169,601 2,600,000 19,833 3,672 92,598
2.4 Other liabilities
- with early redemption option
- others
3. Financial derivatives
3.1 With underlying security
- Options
+ long positions
+ short positions
- Other derivatives
+ long positions
+ short positions
3.2 Without underlying security
- Options
+ long positions
+ short positions
- Other derivatives
+ long positions 85,388 2,049,008 4,195,935 128,790 311,434 278,045 -
+ short positions 226,286 322,152 473,216 381,848 1,504,060 1,163,940 2,980,257
4. Other off-balance sheet
+ long positions
+ short positions

2. Banking book: internal models and other sensitivity analysis methods
The interest-rate risk indicators measured are the following:- Shift sensitivity of fair value; - Value at Risk (VaR).
The shift sensitivity of fair value quantifies the variation in the portfolio value consequent to parallel and instantaneous increases of the market rates curves.
The VaR is defined as the maximum potential loss caused by possible adverse movement in market rates, with reference to a confidence level of 99% and a holding period of ten working days.
The table and graphs below summarise the changes in the indicators relative to interest-rate risk over the short term (CLM perimeter) during the course of 2018:
VAR 10 days(Euro)
Shift Sensitivity 100 bps (absolute values in euro)
31 December 2018 76,039 7,995,800Minimum 7,815 1,100Medium 66,367 3,463,444Maximum 240,755 10,219,100Limit 3,500,000 20,000,000
The operating limits set for the two risk indicators cited above, as well as the sensitivity sub-limit of 15 million to be respected at each tenor (3, 6, 9, 12 months), were always respected throughout the year.
163Notes to the Financial Statements
300,000
250,000
200,000
150,000
100,000
50,000
0
VAR CLM 2018
Jan-
18
Feb-
18
Mar-
18
Apr-1
8
May
-18
Jun-
18
Jul-1
8
Aug-1
8
Sep-
18
Oct-18
Nov-1
8
Dec-1
8
Jan-
18
Feb-
18
Mar-
18
Apr-1
8
May
-18
Jun-
18
Jul-1
8
Aug-1
8
Sep-
18
Oct-18
Nov-1
8
Dec-1
8
Sensitivity CLM 2018 (absolute values in euro)
25,000,000
20,000,000
15,000,000
10,000,000
5,000,000
0
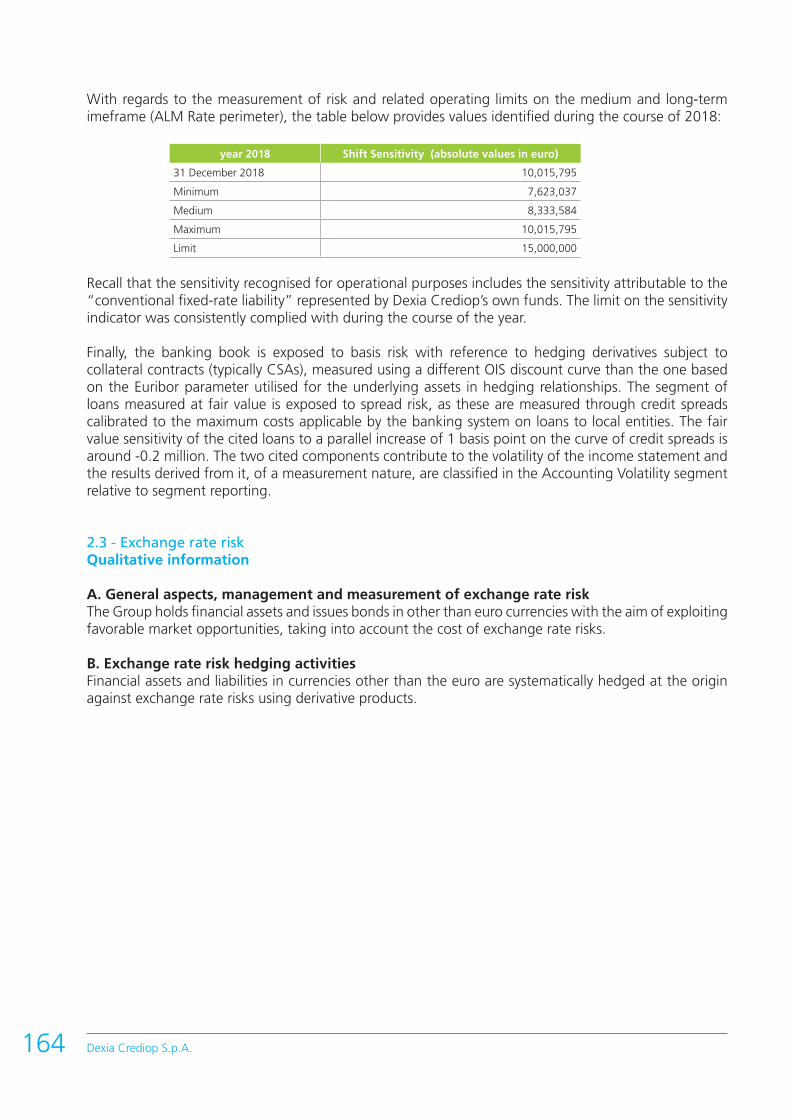
Dexia Crediop S.p.A.164
With regards to the measurement of risk and related operating limits on the medium and long-term imeframe (ALM Rate perimeter), the table below provides values identified during the course of 2018:
year 2018 Shift Sensitivity (absolute values in euro)
31 December 2018 10,015,795
Minimum 7,623,037
Medium 8,333,584
Maximum 10,015,795
Limit 15,000,000
Recall that the sensitivity recognised for operational purposes includes the sensitivity attributable to the “conventional fixed-rate liability” represented by Dexia Crediop’s own funds. The limit on the sensitivity indicator was consistently complied with during the course of the year. Finally, the banking book is exposed to basis risk with reference to hedging derivatives subject to collateral contracts (typically CSAs), measured using a different OIS discount curve than the one based on the Euribor parameter utilised for the underlying assets in hedging relationships. The segment of loans measured at fair value is exposed to spread risk, as these are measured through credit spreads calibrated to the maximum costs applicable by the banking system on loans to local entities. The fair value sensitivity of the cited loans to a parallel increase of 1 basis point on the curve of credit spreads is around -0.2 million. The two cited components contribute to the volatility of the income statement and the results derived from it, of a measurement nature, are classified in the Accounting Volatility segment relative to segment reporting.
2.3 - Exchange rate risk Qualitative information
A. General aspects, management and measurement of exchange rate risk The Group holds financial assets and issues bonds in other than euro currencies with the aim of exploiting favorable market opportunities, taking into account the cost of exchange rate risks.
B. Exchange rate risk hedging activities Financial assets and liabilities in currencies other than the euro are systematically hedged at the origin against exchange rate risks using derivative products.

Quantitative information1. Distribution according to currency of the assets, liabilities and derivatives
thousands of euro
Items Currencies
US Dollar Sterling Yen Canadian Dollar Swiss franc Othercurrencies
A. Financial assets
A.1 Debt securities 13,974
A.2 Equity securities
A.3 Due from banks 371 98
A.4 Due from customers
A.5 Other financial assets
B. Other assetsC. Financial liabilities C.1 Due to banks 16,169
C.2 Due to customers
C.3 Debt securities
C.4 Other financial liabilities
D. Other liabilitiesE. Financial derivatives - Options
+ long positions
+ short positions
- Other derivatives
+ long positions 16,169 30,742
+ short positions 13,974 30,742
Total assets 30,514 30,840Total liabilities 30,143 30,742Differences (+/-) 371 98
165Notes to the Financial Statements

Dexia Crediop S.p.A.166
Section 3 – Derivative instruments and hedging policies
3.1 Trading financial derivatives
A. Financial derivatives
A.1 Trading financial derivatives: notionalvalues at the end of the period thousands of euro
Underlying assets/Type of derivatives
31/12/2018 31/12/2017
Over the counter
Organised markets
Over the counter
Organised markets
Central counterpar-
ties
Without central counterpartiesCentral
counterpar-ties
Without central counterparties
With offsetting agreements
Without offsetting
agreements
With offsetting agreements
Withoutoffsetting
agreements
1. Debt securities and interest rates 10,685,075 3,291,400 19,025,524 3,865,108
a) Options 5,433 2,179 11,772 2,398
b) Swap 10,679,642 3,289,221 19,013,752 3,862,710
c) Forward
d) Futures
e) Others
2. Equity securities and stock indices
a) Options
b) Swap
c) Forward
d) Futures
e) Others
3. Currencies and gold 30,742 40,417 30,995 40,417
a) Options
b) Swap 30,742 40,417 30,995 40,417
c) Forward
d) Futures
e) Others
4. Goods
5. Others
Total 10,715,817 3,331,817 19,056,519 3,905,525

A.2 Trading financial derivatives: positive and negative gross fair value - breakdown by product
thousands of euro
Type of derivatives 30/06/2018 31/12/2017
Over the counter
Organised markets
Over the counter
Organised markets
Central counterpar-
ties
Without central counterparties Central counterpar-
ties
Without central counterparties
With netting agreements
Without netting agreements
With netting agreements
Without netting agreements
1. Positive Fair value
a) Options 1 116
b) Interest rate swaps 292,041 704,232 396,542 830,694
c) Cross currency swaps 10,845 19,312
d) Equity swaps
e) Forwards
f) Futures
g) Others
Total 292,042 715,077 396,658 850,006
2. Negative Fair value
a) Options 1 110 6
b) Interest rate swaps 1,035,793 55,513 1,364,732 43,378
c) Cross currency swaps 28,213 30,188
d) Equity swaps
e) Forwards
f) Futures
g) Others
Total 1,064,007 55,513 1,395,030 43,384
167Notes to the Financial Statements
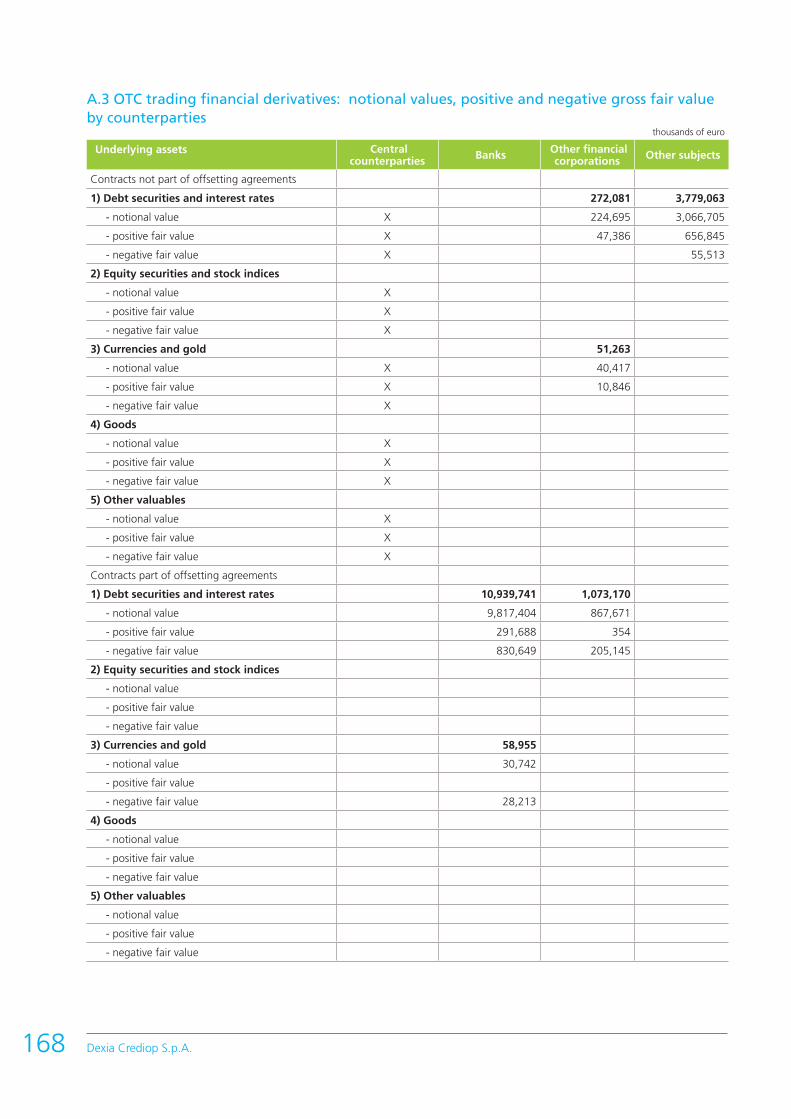
Dexia Crediop S.p.A.168
A.3 OTC trading financial derivatives: notional values, positive and negative gross fair value by counterparties
thousands of euro
Underlying assets Centralcounterparties Banks Other financial
corporations Other subjects
Contracts not part of offsetting agreements
1) Debt securities and interest rates 272,081 3,779,063
- notional value X 224,695 3,066,705
- positive fair value X 47,386 656,845
- negative fair value X 55,513
2) Equity securities and stock indices
- notional value X
- positive fair value X
- negative fair value X
3) Currencies and gold 51,263
- notional value X 40,417
- positive fair value X 10,846
- negative fair value X
4) Goods
- notional value X
- positive fair value X
- negative fair value X
5) Other valuables
- notional value X
- positive fair value X
- negative fair value X
Contracts part of offsetting agreements
1) Debt securities and interest rates 10,939,741 1,073,170
- notional value 9,817,404 867,671
- positive fair value 291,688 354
- negative fair value 830,649 205,145
2) Equity securities and stock indices
- notional value
- positive fair value
- negative fair value
3) Currencies and gold 58,955
- notional value 30,742
- positive fair value
- negative fair value 28,213
4) Goods
- notional value
- positive fair value
- negative fair value
5) Other valuables
- notional value
- positive fair value
- negative fair value

A.4 Residual maturity of OTC trading financial derivatives: notional values thousands of euro
Underlying instruments/ Residual maturity Up to 1 year Between 1 year
and 5 years More than 5 years Total
A.1 Financial derivatives on debt securities and interest rates 5,351,643 3,697,769 4,927,063 13,976,475
A.2 Financial derivatives on equity securities and stock indicesA.3 Financial derivatives on currencies and gold 2,490 68,669 71,159
A.4 Financial derivatives on commodities
A.5 Other financial derivatives
Total 31/12/2018 5,351,643 3,700,259 4,995,732 14,047,634
Total 31/12/2017 11,962,942 5,026,164 5,972,938 22,962,044
B. Credit derivatives
B.1 Trading credit derivatives: notional values at the end of the period thousands of euro
Type of transaction Trading derivatives
on a single subject on several subjects (basket)
1. Protection purchases
a) Credit default products 802,627
b) Credit spread products
c) Total rate of return swap
d) Others
Total 31/12/2018 802,627
Total 31/12/2017 802,627
2. Protection sales
a) Credit default products 802,627
b) Credit spread products
c) Total rate of return swap
d) Others
Total 31/12/2018 802,627
Total 31/12/2017 802,627
B.2 Trading credit derivatives: positive and negative gross fair value - breakdown by productthousands of euro
Types of derivatives Total 31/12/2018 Total 31/12/2017
1. Positive fair value
a) Credit default products 64,785 58,939
b) Credit spread products
c) Total rate of return swap
d) Others
Total 64,785 58,939
2. Negative fair value
a) Credit default products 57,367 55,007
b) Credit spread products
c) Total rate of return swap
d) Others
Total 57,367 55,007
169Notes to the Financial Statements

Dexia Crediop S.p.A.170
B.3 OTC trading credit derivatives: notional values, positive and negative gross fair value by counterparties
thousands of euro
Central counterparties Banks Other financial
corporations Other subjects
Contracts not part of offsetting agreements
1) Purchase of protection 865,181,478
- notional value X 802,627
- positive fair value X 64,785
- negative fair value X
2) Sale of protection
- notional value X
- positive fair value X
- negative fair value X
Contracts part of offsetting agreements
1) Purchase of protection
- notional value
- positive fair value
- negative fair value
2) Sale of protection 622,355 237,639
- notional value 583,724 218,903
- positive fair value
- negative fair value 38,631 18,736
B.4 Residual maturity of OTC credit derivatives: notional values thousands of euro
Underlying instruments/ Residual term Up to 1 year Between 1 year and 5 years
More than 5 years Total
1. Protection sale 802,627 802,627
2. Purchase of protection 802,627 802,627
Total 31/12/2018 1,605,254 1,605,254
Total 31/12/2017 1,605,254 1,605,254
3.2 Accounting hedges
Qualitative information
A. Fair value hedging
Fair value hedges (whether micro or macro, the latter achieved through the use of the portfolio hedge) have the aim of reducing exposure to interest-rate risk, as in the company’s risk management guidelines, particularly with reference to complying with the defined risk appetite levels. The risk hedged against involves changes in the fair value of underlying assets attributable to changes in the relative interest rate. The instruments underlying the hedging are specific financial assets or liabilities, or aggregates of similar type, and transactions are carried out under market conditions.
Initial tests are performed on each hedge regarding the applicability of hedge accounting, as well as regular tests on their effectiveness.

B. Cash flow hedging
Hedges, the purpose of which is to stabilise cash flow indexed to variable parameters (typically Euribor), have specific financial assets or liabilities as underlying elements, which are homogeneous with them and realised at market conditions.
Initial tests are performed on each hedge regarding the applicability of hedge accounting, as well as regular tests on their effectiveness.
D. Hedging instruments
For interest rate risk, fair value or cash flow hedging derivatives are used. Interest Rate Swaps are the most frequently used instruments.
E. Hedged items
The instruments underlying the hedging are specific financial assets or liabilities, or aggregates of similar types. Only the types of hedges listed above apply. Application of a financial instrument to one of these excludes simultaneous application of another one of the types listed. Each of these types can be further classified into one or more detailed operating strategies, within which the specific purposes of the hedge selected are clearly indicated, as well as allowable underlying instruments and possible hedging instruments.
Quantitative information
A. Hedging financial derivatives
A.1 Financial hedging derivatives: notional values at the end of the period thousands of euro
Underlying assets/Type of derivatives
31/12/2018 31/12/2017
Over the counter
Organized markets
Over the counter
Organized markets
Central counterpar-
ties
Without central counterparties Centralcounterpar-
ties
Without central counterparties
With offsetting agreements
Without offsetting
agreements
With offsetting agreements
Without offsetting agreements
1. Debt securities and interest rates 7,049,378 7,735,137
a) Options 27,917 30,230
b) Swap 7,021,461 7,704,907
c) Forward
d) Futures
e) Others
2. Equity securities and stock indices
a) Options
b) Swap
c) Forward
d) Futures
e) Others
3. Currencies and gold 30,258 225,971
a) Options
b) Swap 13,974 207,889
c) Forward 16,284 18,082
d) Futures
e) Others
4. Goods
5. Others
Total 7,079,636 7,961,108
171Notes to the Financial Statements

Dexia Crediop S.p.A.172
A.2 Financial hedging derivatives: positive and negative gross fair value - breakdown by product
thousands of euro
Type of derivatives Positive and negative fair value
31/12/2018 31/12/2017
Total 31/12/2018
Total 31/12/2017
Over the counter
Organized markets
Over the counter
Organized markets
Central counter-parties
Without central counterparties Central counter-parties
Without central counterparties
With offsetting agreements
Without offsetting
agreements
With offsetting agreements
Without offsetting
agreements
1. Positivefair value
a) Options
b) Interest rate swaps 141,461 175,213 141,461 175,213
c) Cross currency swaps 47,492 47,492
d) Equity swaps
e) Forwards 44 44
f) Futures
g) Others
Total 141,461 222,749 141,461 222,749
2. Negative fair value
a) Options 3,784 3,949 3,784 3,949
b) Interest rate swaps 2,298,642 2,456,043 2,298,642 2,456,043
c) Cross currency swaps 7,227 6,946 7,227 6,946
d) Equity swaps
e) Forwards 123 123
f) Futures
g) Others
Total 0,00 2,309,776 0 0 0 2,466,938 0 0 2,309,776 2,466,938
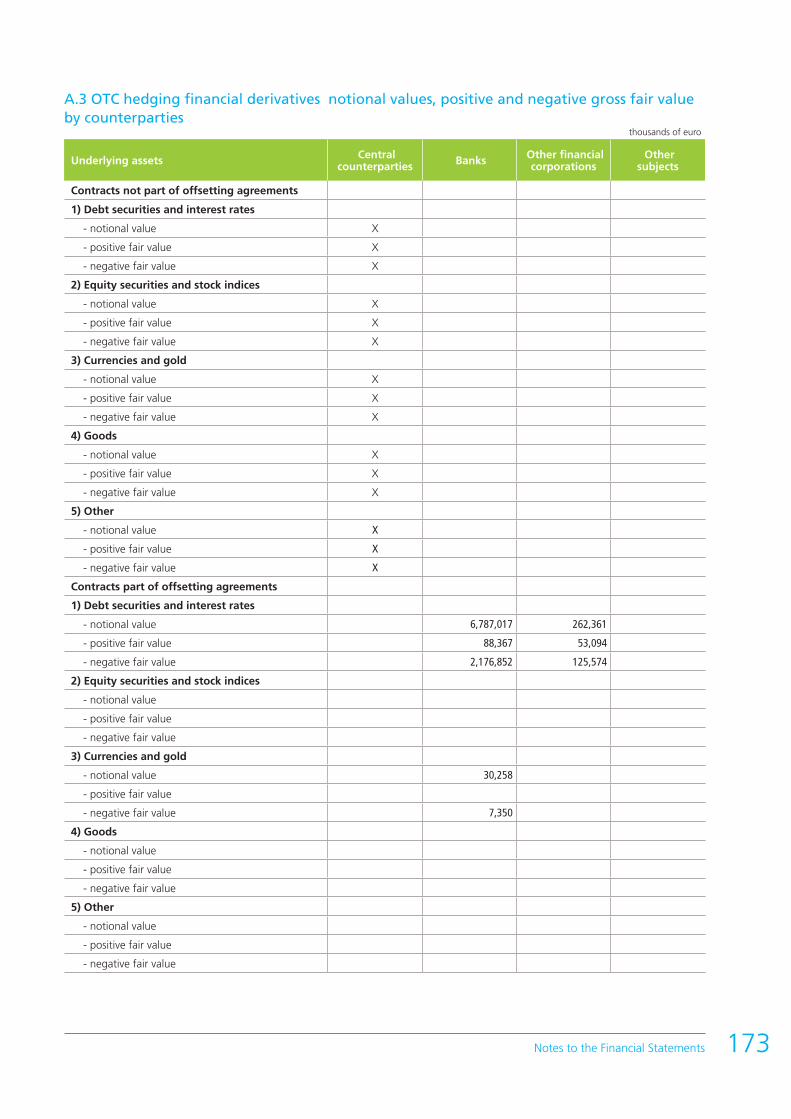
A.3 OTC hedging financial derivatives notional values, positive and negative gross fair value by counterparties
thousands of euro
Underlying assets Central counterparties Banks Other financial
corporations Other
subjects
Contracts not part of offsetting agreements
1) Debt securities and interest rates
- notional value X
- positive fair value X
- negative fair value X
2) Equity securities and stock indices
- notional value X
- positive fair value X
- negative fair value X
3) Currencies and gold
- notional value X
- positive fair value X
- negative fair value X
4) Goods
- notional value X
- positive fair value X
- negative fair value X
5) Other
- notional value X
- positive fair value X
- negative fair value X
Contracts part of offsetting agreements
1) Debt securities and interest rates
- notional value 6,787,017 262,361
- positive fair value 88,367 53,094
- negative fair value 2,176,852 125,574
2) Equity securities and stock indices
- notional value
- positive fair value
- negative fair value
3) Currencies and gold
- notional value 30,258
- positive fair value
- negative fair value 7,350
4) Goods
- notional value
- positive fair value
- negative fair value
5) Other
- notional value
- positive fair value
- negative fair value
173Notes to the Financial Statements

Dexia Crediop S.p.A.174
A.4 Residual maturity of OTC hedging financial derivatives: notional values thousands of euro
Underlying instruments/ Residual maturity Up to 1 year Between 1 year and 5 years
More than 5 years Total
A.1 Financial derivatives on debt securities and interest rates 696,665 1,745,733 4,606,980 7,049,378
A.2 Financial derivatives on equity securities and stock indices
A.3 Financial derivatives on currencies and gold 16,284 0 13,974 30,258
A.4 Financial derivatives on commodities
A.5 Other financial derivatives
Total 31/12/2018 712,949 1,745,733 4,620,954 7,079,636
Total 31/12/2017 1,160,725 1,863,636 4,936,747 7,961,108

D. Hedged instruments D.1 Fair value hedging
thousands of euro
Underlying instruments/ Residual maturity
Micro hedge:
carriyng amount
Micro hedge – net positions:
carrying amount of assets or
libilities (before the offset)
Coperture specifiche
Macro hedge: carryng amount
Cumulative changement of fair value of hedged instrument
Hedging interruption: cumulative
changement of residual fair
value
Changement value
recognised to hedging
ineffectiveness
A. ASSETS
1. Financial assets measured at fair value through other comprehensive income – hedging of:
1.1 Debt securities and interest rates X 1.2 Equity securities and stock indices X 1.3 Currencies and gold X 1.4 Credit X 1.5 Others X
2. Financial assets measured at amortised cost – hedging of: 8,511,582 (45,357) 113,555
1.1 Debt securities and interest rates 5,843,087 2,195 X 1.2 Equity instruments and stock indexes X 1.3 Currencies and gold 2,668,495 (47,552) X 1.4 Credit X 1.5 Others XTotal 31/12/2018 8,511,582 (45,357) 113,555Total 31/12/2017 9,322,884 (439,275) 4,480,829B. LIABILITES
1. Financial liabilites measured at amortised cost – hedging of: 336,706 25,638
1.1 Debt securities and interest rates 336,706 25,638 X 1.2 Currencies and gold X 1.3 Others XTotal 31/12/2018 336,706 25,638Total 31/12/2017 713,557 39,236
D.2 Cash flows and foreign investment hedging thousands of euro
Changement value recognised to hedging
ineffectiveness
Hedgingreserve
Hedging termination: residual value of hedging
reserve
A. CASH FLOWS HEDGING1. Assets1.1 Debt securities and interest rates1.2 Equity securities and stock indices1.3 Currencies and gold1.4 Credit 671,612 9,0871.5 Others2. Liabilites1.1 Debt securities and interest rates1.2 Gold and currencies1.3 Others 31,579 (1,234)Total 31/12/2018 703,191 7,853Total 31/12/2017 574,748 9,889B. FOREIGN INVESTMENT HEDGING XTotal 31/12/2018 703,191 7,853Total 31/12/2017 574,748 9,889
175Notes to the Financial Statements
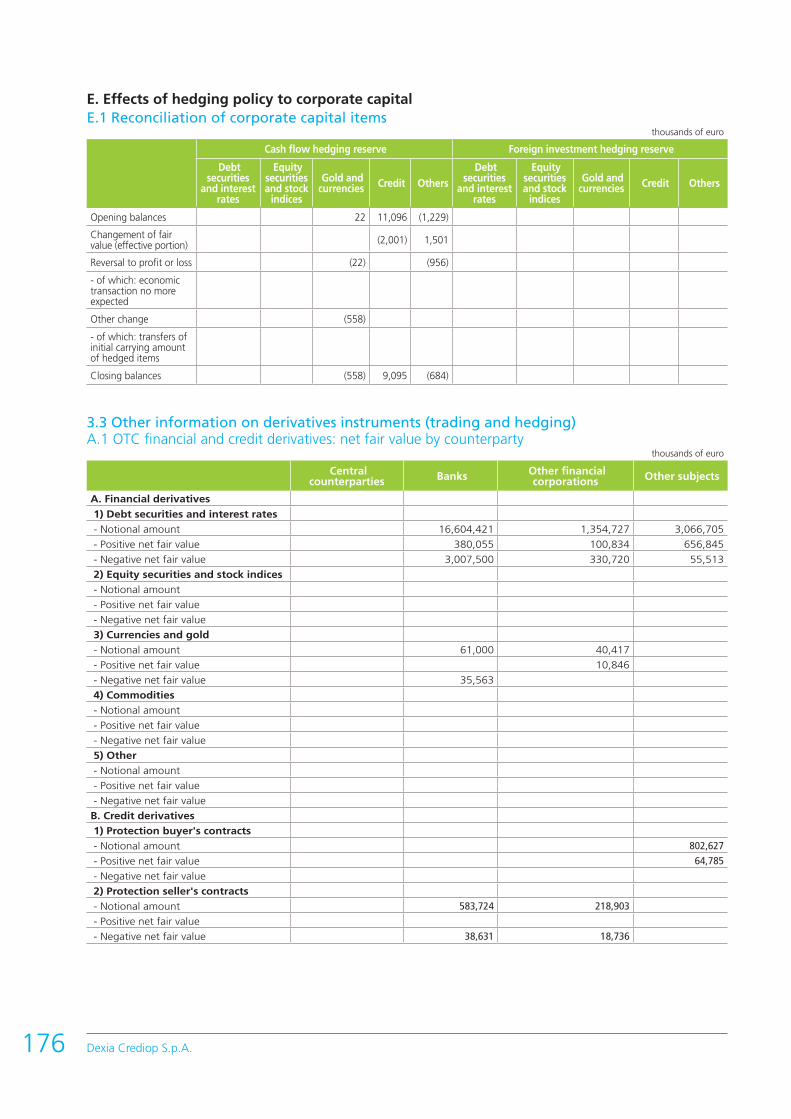
Dexia Crediop S.p.A.176
E. Effects of hedging policy to corporate capital E.1 Reconciliation of corporate capital items
thousands of euro
Cash flow hedging reserve Foreign investment hedging reserve
Debt securities
and interest rates
Equity securities and stock
indices
Gold and currencies Credit Others
Debt securities
and interest rates
Equity securities and stock
indices
Gold and currencies Credit Others
Opening balances 22 11,096 (1,229)
Changement of fair value (effective portion) (2,001) 1,501
Reversal to profit or loss (22) (956)
- of which: economic transaction no more expected
Other change (558)
- of which: transfers of initial carrying amount of hedged items
Closing balances (558) 9,095 (684)
3.3 Other information on derivatives instruments (trading and hedging)A.1 OTC financial and credit derivatives: net fair value by counterparty
thousands of euro
Central counterparties Banks Other financial
corporations Other subjects
A. Financial derivatives
1) Debt securities and interest rates
- Notional amount 16,604,421 1,354,727 3,066,705
- Positive net fair value 380,055 100,834 656,845
- Negative net fair value 3,007,500 330,720 55,513
2) Equity securities and stock indices
- Notional amount
- Positive net fair value
- Negative net fair value
3) Currencies and gold
- Notional amount 61,000 40,417
- Positive net fair value 10,846
- Negative net fair value 35,563
4) Commodities
- Notional amount
- Positive net fair value
- Negative net fair value
5) Other
- Notional amount
- Positive net fair value
- Negative net fair value
B. Credit derivatives
1) Protection buyer's contracts
- Notional amount 802,627
- Positive net fair value 64,785
- Negative net fair value
2) Protection seller's contracts
- Notional amount 583,724 218,903
- Positive net fair value
- Negative net fair value 38,631 18,736
Section 4 – Liquidity risk
Qualitative information
A. General aspects, management and measurement of liquidity risk
The bank is structurally exposed to liquidity risk as loans are mainly concentrated on the long-termhorizon, against deposits with a shorter average duration.
The management of short-term liquidity risk lies with the Cash & Liquidity Management unit.
The sustainability of the liquidity profile in the long-term is first and foremost verified during approval of the Financial Plan in relation to the objectives established in terms of volumes and time frames of loans and deposits.
Liquidity risk control is entrusted, within Finance&Operation, to Financial Control, which operates within the framework of the internal provision on liquidity risk governance, management and control.
In particular, this function monitors two basic amounts on a daily basis, over a time horizon of six months:a) liquidity gap (accumulated balance of forecast cash flows according to maturity);b) available reserves (value of eligible assets according to maturity),analysing the developments through daily communications to senior management, the correspondingDexia Group department and the regulatory authority (three-month maturity ladder). Financial Control, as established by the regulatory authority, also provides:• on a monthly basis, the value of the Liquidity Coverage Ratio (LCR) and the value of the main source
of the bank funding (Monitoring Tools);• quarterly, the actual use of the bank’s assets (Asset Encumbrance);• quarterly the value of the “Available Stable Funding” and “Required Stable Funding”.
The liquidity risk control system includes stress tests and a Contingency Funding Plan drawn up by theDexia Group.
With regard to maturities of more than six months, Financial Control periodically analyses monthlybuckets (up to three years) and annual buckets (more than three years) of developments in the liquiditygap and the available reserves, considering two alternative scenarios (“regulatory” and “management”liquidity positions) on the basis of the criteria respectively adopted for the maturity ladder drawn up forthe regulatory authority and management hypotheses such as the renewal of highly probable operations.
The outcome of the above analyses and audits are discussed by the Finance Committee usually once afortnight.
177Notes to the Financial Statements

Dexia Crediop S.p.A.178
Quantitative information
1.Breakdown by maturity by residual maturity of financial assets and liabilities - Currency: Euro
thousands of euro
Item/Timebracket
ondemand
from more than 1 day to 7 days
from more than 7
days to 15 days
from more than 15
days to 1 month
from more than 1
month to 3 months
between 3 and 6 months
between 6 months
and 1 anno year
between 1 year and 5
years
more than 5 years
unspecified term
Cash assets 12,857 26,791 1,646 2,818,769 9,617 462,305 687,681 2,429,949 8,145,121 147,328A.1 Government securities 256,220 788,822 2,259,269
A.2 Other debt securities 37 1,646 240 6,411 54,934 169,247 539,844 3,041,601
A.3 Mutual fund shares
A.4 Loans
- Banks 870 25,812 2,482,385 204,050 16,086 47,677 98,998 143,537
- Customers 11,987 941 336,144 3,206 203,321 246,128 1,053,607 2,745,252 3,792
Cash liabilities 255,142 30,845 32,043 2,088,647 2,459,052 918,825 4,265,780 3,462,741 127,117B.1 Deposits and current accounts - Banks 1,700 32,043 2,020,789 2,423,381 918,825 4,237,354 850,877 56,087
- Customers 255,139 29,145
B.2 Debt securities 3 67,858 35,671 0 28,426 2,611,864 71,030
B.3 Other liabilities Off balance sheet transactionsC.1 Financial derivatives with equity swap
- long positions 10,846
- short positions 123 35,440C.2 Financial derivatives without equity swap - long positions 987,175 3,541 25,590 2,997
- short positions 1,091,311 1 13 37 14,326C.3 Deposits and loans to be received - long positions
- short positions C.4 Irrevocable commitments to disburse funds - long positions 19,070 9,250
- short positionsC.5 Financial guarantees given 12,820 46,557
C.6 Financial guarantees receivedC.7 Credit derivatives with equity swap - long positions
- short positionsC.8 Credit derivatives without equity swap - long positions 64,785
- short positions 57,366
The item financial derivatives without the exchange of capital includes, in the case of trading derivatives, the related fair value in the “on demand” timeframe and, in the case of hedging derivatives, the positive or negative differentials that are due in the year following that of reference of the financial statements.
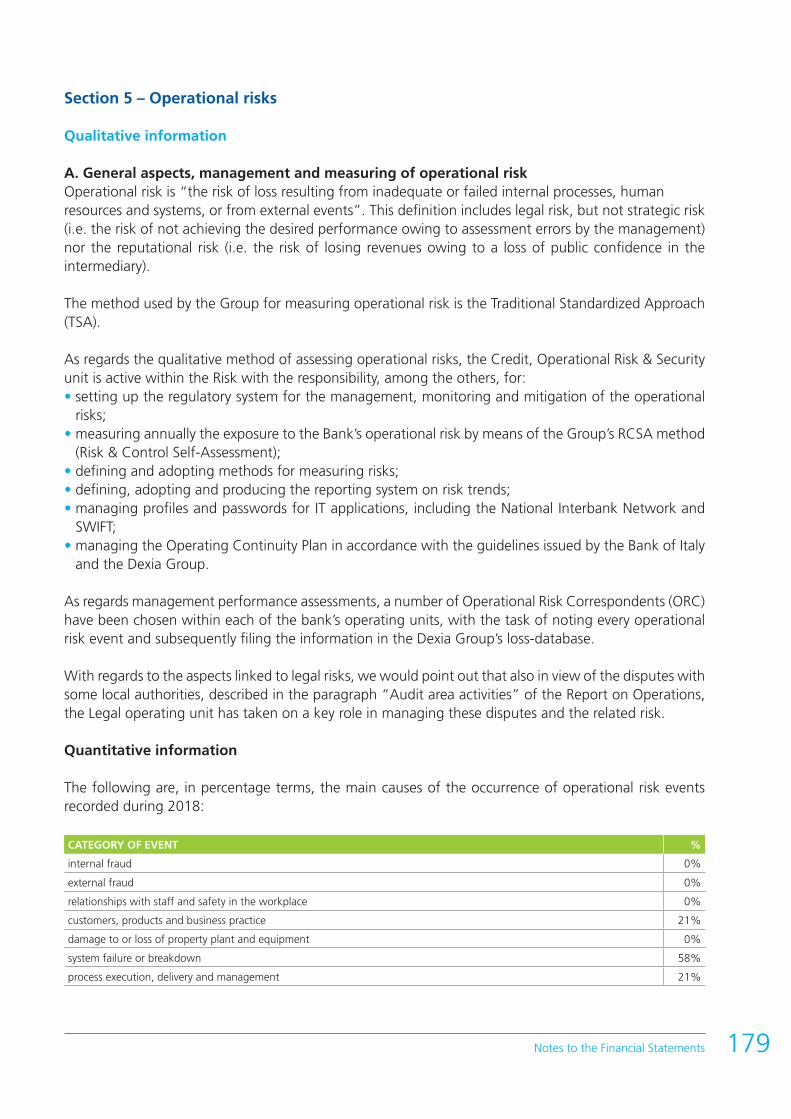
Section 5 – Operational risks
Qualitative information
A. General aspects, management and measuring of operational risk Operational risk is “the risk of loss resulting from inadequate or failed internal processes, humanresources and systems, or from external events”. This definition includes legal risk, but not strategic risk (i.e. the risk of not achieving the desired performance owing to assessment errors by the management) nor the reputational risk (i.e. the risk of losing revenues owing to a loss of public confidence in the intermediary).
The method used by the Group for measuring operational risk is the Traditional Standardized Approach (TSA).
As regards the qualitative method of assessing operational risks, the Credit, Operational Risk & Security unit is active within the Risk with the responsibility, among the others, for:• setting up the regulatory system for the management, monitoring and mitigation of the operational
risks;• measuring annually the exposure to the Bank’s operational risk by means of the Group’s RCSA method
(Risk & Control Self-Assessment);• defining and adopting methods for measuring risks;• defining, adopting and producing the reporting system on risk trends;• managing profiles and passwords for IT applications, including the National Interbank Network and
SWIFT;• managing the Operating Continuity Plan in accordance with the guidelines issued by the Bank of Italy
and the Dexia Group. As regards management performance assessments, a number of Operational Risk Correspondents (ORC) have been chosen within each of the bank’s operating units, with the task of noting every operational risk event and subsequently filing the information in the Dexia Group’s loss-database.
With regards to the aspects linked to legal risks, we would point out that also in view of the disputes with some local authorities, described in the paragraph “Audit area activities” of the Report on Operations, the Legal operating unit has taken on a key role in managing these disputes and the related risk.
Quantitative information
The following are, in percentage terms, the main causes of the occurrence of operational risk events recorded during 2018:
CATEGORY OF EVENT %
internal fraud 0%
external fraud 0%
relationships with staff and safety in the workplace 0%
customers, products and business practice 21%
damage to or loss of property plant and equipment 0%
system failure or breakdown 58%
process execution, delivery and management 21%
179Notes to the Financial Statements
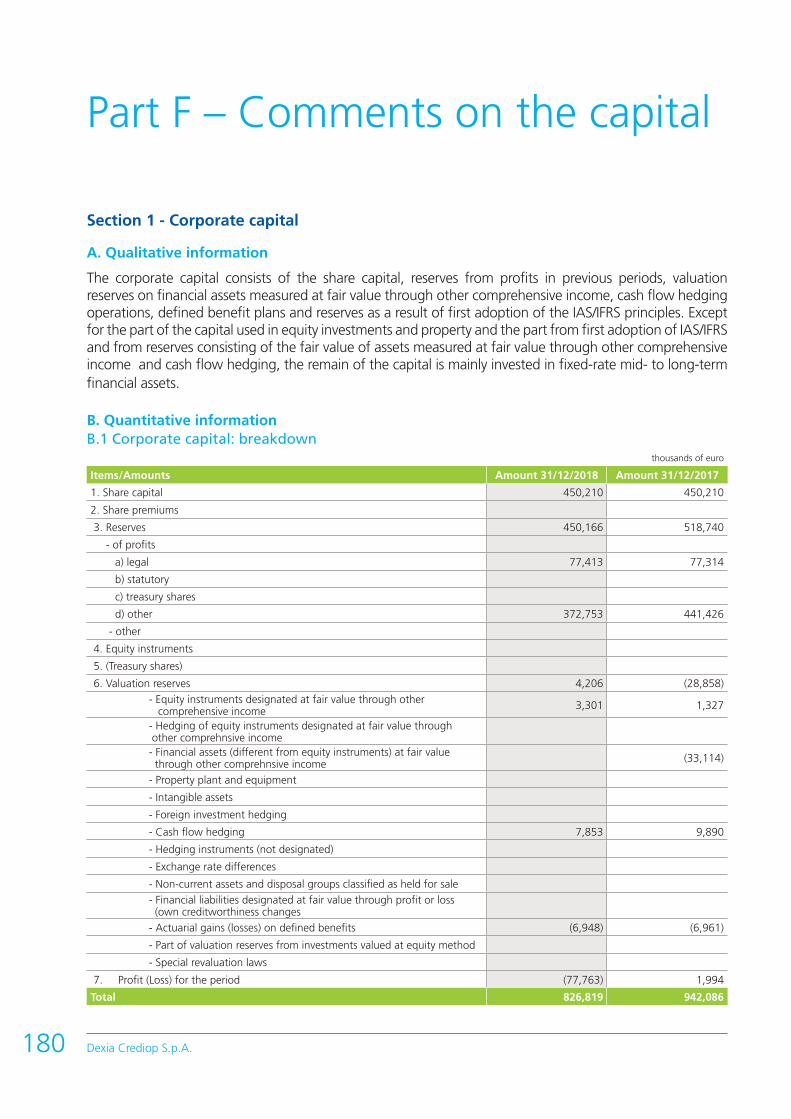
Dexia Crediop S.p.A.180
Section 1 - Corporate capital
A. Qualitative information
The corporate capital consists of the share capital, reserves from profits in previous periods, valuation reserves on financial assets measured at fair value through other comprehensive income, cash flow hedging operations, defined benefit plans and reserves as a result of first adoption of the IAS/IFRS principles. Except for the part of the capital used in equity investments and property and the part from first adoption of IAS/IFRS and from reserves consisting of the fair value of assets measured at fair value through other comprehensive income and cash flow hedging, the remain of the capital is mainly invested in fixed-rate mid- to long-term financial assets.
B. Quantitative information B.1 Corporate capital: breakdown
thousands of euro
Items/Amounts Amount 31/12/2018 Amount 31/12/2017
1. Share capital 450,210 450,210
2. Share premiums
3. Reserves 450,166 518,740
- of profits
a) legal 77,413 77,314
b) statutory
c) treasury shares
d) other 372,753 441,426
- other
4. Equity instruments
5. (Treasury shares)
6. Valuation reserves 4,206 (28,858)
- Equity instruments designated at fair value through other comprehensive income 3,301 1,327
- Hedging of equity instruments designated at fair value through other comprehnsive income - Financial assets (different from equity instruments) at fair value through other comprehnsive income (33,114)
- Property plant and equipment
- Intangible assets
- Foreign investment hedging
- Cash flow hedging 7,853 9,890
- Hedging instruments (not designated)
- Exchange rate differences
- Non-current assets and disposal groups classified as held for sale
- Financial liabilities designated at fair value through profit or loss (own creditworthiness changes
- Actuarial gains (losses) on defined benefits (6,948) (6,961)
- Part of valuation reserves from investments valued at equity method
- Special revaluation laws
7. Profit (Loss) for the period (77,763) 1,994
Total 826,819 942,086
Part F – Comments on the capital

B.2 Revaluation reserves of financial assets measured at fair value through other comprehensive income: brekdown
thousands of euro
Assets/Amounts Total 31/12/2018 Total 31/12/2017
Positive reserve Negative reserve Positive reserve Negative reserve
1. Debt securities 34,734 67,848
2. Equity securities 3,301 1,327
4. Loans
Total 3,301 36,061 67,848
B.3 Revaluation reserves of financial assets measured at fair value through other comprehensive income: annual change
thousands of euro
Debt securities Equity securities Loans
1. Opening balances 1,327
2. Increases 1,974
2.1 Increases in fair value 1,974
2.2 Net recoveries on credit risk X
2.3 Reversal to income statement of negative reserves: X
- following disposal
2.4 Transfers to other corporate capital items (equity instruments
2.5 Other changes
3. Decreases
3.1 Decreases in fair value
3.2 Net losses on credit risk
3.3 Reversal to income statement of positive reserves: X
- following disposal
3.4 Transfers to other corporate capital items (equity instruments)
3.5 Other changes
4. Closing balances 3,301
B.4 Valuation reserves of defined benefit schemes: annual changes
The valuation reserves of defined benefits schemes as at 31.12.2018 amounted to -6,948 thousand euros.
The variance of reserves as at 2018 is 13 thousand euro.
181Notes to the Financial Statements

Dexia Crediop S.p.A.182
Section 2 – Own funds and regulatory ratios
At 31 December 2018, Dexia Crediop had total Own Funds of 812 million, consisting of 805 million in Common Equity Tier 1 (CET1) and 7 million in Tier 2 (T2) capital. There are no additional Tier 1 funds.
Considering the own fund levels described above and risk weighted assets of € 4,083 million, the bank has a base/CET1 capital ratio of 19.7% and a total capital ratio of 19.9%.
For more information, please see the disclosure regarding own funds and capital adequacy found in the Dexia Crediop Pillar 3 disclosure.
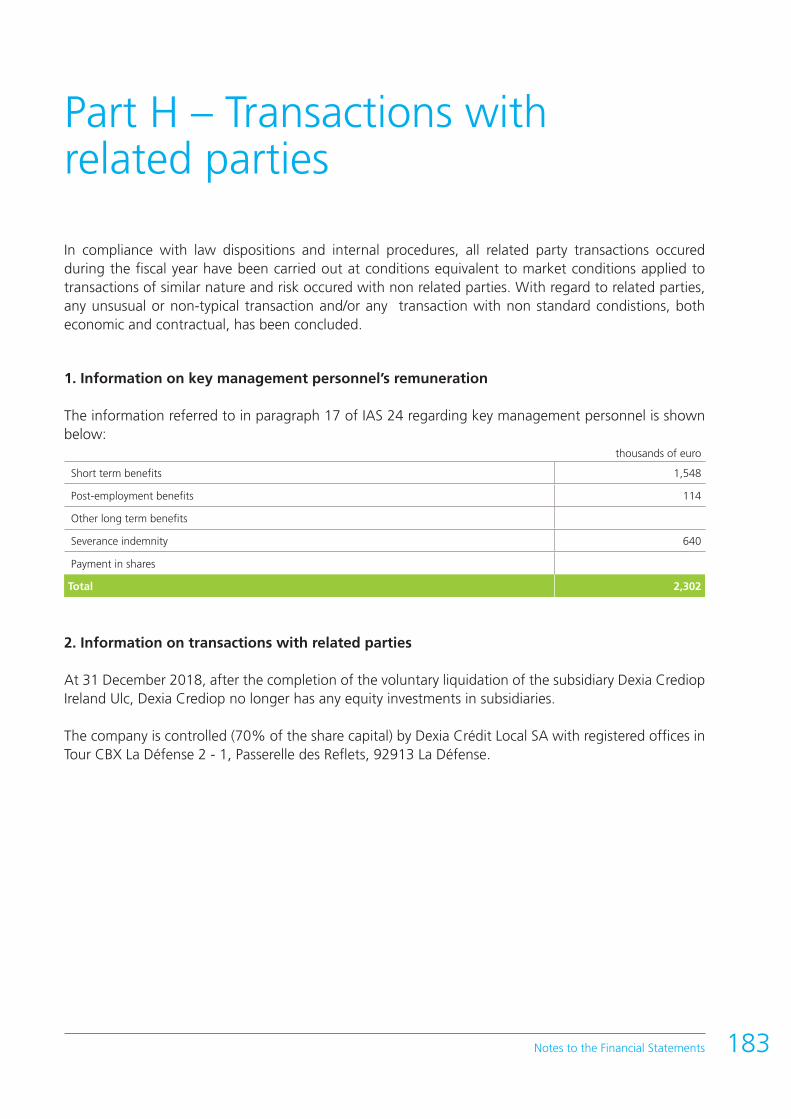
In compliance with law dispositions and internal procedures, all related party transactions occured during the fiscal year have been carried out at conditions equivalent to market conditions applied to transactions of similar nature and risk occured with non related parties. With regard to related parties, any unsusual or non-typical transaction and/or any transaction with non standard condistions, both economic and contractual, has been concluded.
1. Information on key management personnel’s remuneration
The information referred to in paragraph 17 of IAS 24 regarding key management personnel is shown below:
thousands of euro
Short term benefits 1,548
Post-employment benefits 114
Other long term benefits
Severance indemnity 640
Payment in shares
Total 2,302
2. Information on transactions with related parties
At 31 December 2018, after the completion of the voluntary liquidation of the subsidiary Dexia Crediop Ireland Ulc, Dexia Crediop no longer has any equity investments in subsidiaries.
The company is controlled (70% of the share capital) by Dexia Crédit Local SA with registered offices in Tour CBX La Défense 2 - 1, Passerelle des Reflets, 92913 La Défense.
183Notes to the Financial Statements
Part H – Transactions withrelated parties

Dexia Crediop S.p.A.184
2.1 Transactions with the parent company
thousands of euro
Assets and Liabilities
Assets
- Financial assets held for trading 7,750
- Deposits 150,587
- Hedging derivatives 1,724
Total 160,061
Liabilities
- Borrowings 4,892,801
- Financial liabilities held for trading 34,955
- Hedging derivatives 310,903
- Repurchase agreements 5,109,247
- Deposits 70,090
- Debt securities 2,605,519
- Other liabilities 59,263
Total 13,082,778
thousands of euro
Other transactions
- Guarantees received 359,921
thousands of euro
Income and charges
- Interest and similar income 14,218
- Interest paid and similar charges (62,218)
of which
interest margin on hedging transactions (40,913)
- Commission income
- Commission expenses (48,996)
- Net trading gains (losses) (16,680)
- Administrative expenses (1,098)
Total (114,774)

2.3 Transactions with other companies of the Dexia Group
In addition to the above-illustrated transactions with the parent company, Dexia Crediop also carried out transactions with Dexia SA holding and its subsidiaries; all these transactions refer to the core business.
SOCIETÀ DEL GRUPPO DCLthousands of euro
Income and charges
- Interest paid and similar charges Total (1,171)
Total (1,171)
185Notes to the Financial Statements

Dexia Crediop S.p.A.186
Criteria for segment reporting
Segment reporting is prepared in accordance with the standard “IFRS 8 - Operating segments”. The adoption of IFRS 8 confirms the logic according to which the business sectors subject to disclosure were chosen, since the Bank has long adopted the “management approach”, i.e. choosing to use the same structure for the financial statements as that used for the preparation of internal reporting.
Primary format: “Segment Reporting”
According to the segmentation, for the purposes of segment reporting the results of the Dexia Crediop Group’s recurrent transactions, classified in the “run rate” segment, are separated from the valuation results, classified in the “Accounting Volatility” segment.
The “run rate” segment includes the following lines of business with similar features in terms of products and services offered to customers:
• Public & Project Finance: this includes lending and financial services offered by the Group to its customers and the short and medium-to-long-term financing of such activity;
• Other Income: this includes managing free capital, equity investments and other assets not allocated elsewhere.
More information on the activities carried out by the company Dexia Crediop can be found in the paragraph “Report on Operations” of the Dexia Crediop Report on Operations.
Part L – Segment reporting

A. Primary formatThe following tables show the economic results of Dexia Crediop at 31 December 2018 and 31 December 2017, the latter determined using the rules under IAS 39, but restated in the new financial statement items to reflect the classification used under IFRS 91.
A.1 Distribution according to business sector: economic data 2018thousands of euro
Income Statement 2018 Project & Public Finance
Other Income
TotalRun Rate
Accounting Volatility Dexia Crediop
Net interest income 3,748 20,356 24,104 6,250 30,353
Net fee and commission income -45,281 -1,442 -46,723 0 -46,723
Dividend 0 2,848 2,848 0 2,848
Net trading gains (losses) 1,049 12,445 13,495 -49,218 -35,723
Net interest and other banking income -40,848 34,208 -6,276 -42,968 -49,245
Net adjustments for credit risk 6,002 0 6,002 0 6,002
Net income from financial activities -34,482 34,208 -274 -42,968 -43,243
Administrative expenses 0 -28,399 -28,399 0 -28,399
Net provisions -6,072 0 -6,072 0 -6,072
Amortisation on assets 0 -1,902 -1,902 0 -1,902
Other operating expense/income 0 979 979 0 979
Operating Costs -6,072 -29,322 -35,394 0 -35,394
Profits (Losses) on disposal of investments 0 674 674 0 674
Profits (Losses) from continuing operations before tax -40,554 5,560 -34,994 -42,968 -77,963
A.1 Distribution according to business sector: economic data 2017thousands of euro
Income Statement 2017 Project & Public Finance
Other Income
TotalRun Rate
Accounting Volatility Dexia Crediop
Net interest income 3,833 33,497 37,329 14,694 52,023
Net fee and commission income -36,005 -1,722 -37,727 0 -37,727
Dividend 0 0 0 0 0
Net trading gains (losses) 0 52 52 21,829 21,881
Net interest and other banking income -32,173 31,828 -345 36,522 36,177
Net adjustments for credit risk -9,983 0 -9,983 0 -9,983
Net income from financial activities -42,155 31,828 -10,327 36,522 26,195
Administrative expenses 0 -30,210 -30,210 0 -30,210
Net provisions -984 0 -984 0 -984
Amortisation on assets 0 -1,719 -1,719 0 -1,719
Other operating expense/income 0 4,464 4,464 0 4,464
Operating Costs -984 -27,464 -28,449 0 -28,449
Profits (Losses) on disposal of investments 0 1,963 1,963 0 1,963
Profits (Losses) from continuing operations before tax -43,140 6,326 -36,814 36,522 -292
187Notes to the Financial Statements
1 For reconciliation of the items, please see part A - Accounting Policies in these Notes.
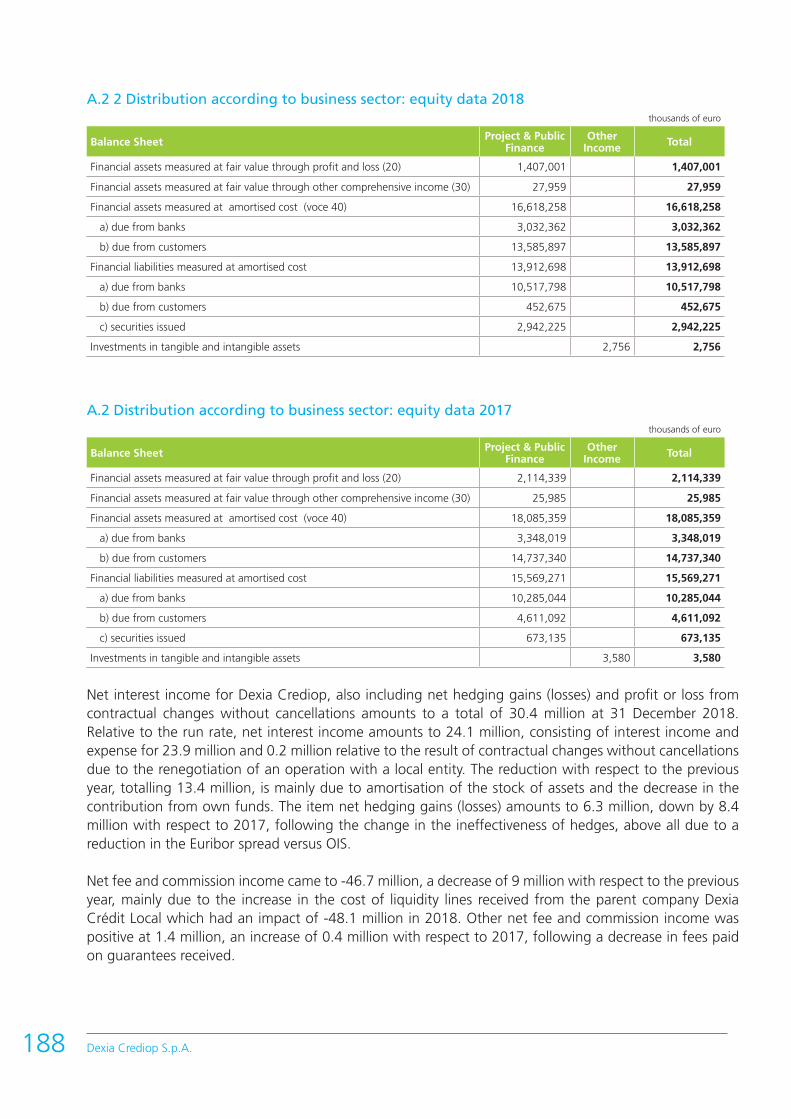
Dexia Crediop S.p.A.188
A.2 2 Distribution according to business sector: equity data 2018thousands of euro
Balance Sheet Project & Public Finance
OtherIncome Total
Financial assets measured at fair value through profit and loss (20) 1,407,001 1,407,001
Financial assets measured at fair value through other comprehensive income (30) 27,959 27,959
Financial assets measured at amortised cost (voce 40) 16,618,258 16,618,258
a) due from banks 3,032,362 3,032,362
b) due from customers 13,585,897 13,585,897
Financial liabilities measured at amortised cost 13,912,698 13,912,698
a) due from banks 10,517,798 10,517,798
b) due from customers 452,675 452,675
c) securities issued 2,942,225 2,942,225
Investments in tangible and intangible assets 2,756 2,756
A.2 Distribution according to business sector: equity data 2017thousands of euro
Balance Sheet Project & Public Finance
OtherIncome Total
Financial assets measured at fair value through profit and loss (20) 2,114,339 2,114,339
Financial assets measured at fair value through other comprehensive income (30) 25,985 25,985
Financial assets measured at amortised cost (voce 40) 18,085,359 18,085,359
a) due from banks 3,348,019 3,348,019
b) due from customers 14,737,340 14,737,340
Financial liabilities measured at amortised cost 15,569,271 15,569,271
a) due from banks 10,285,044 10,285,044
b) due from customers 4,611,092 4,611,092
c) securities issued 673,135 673,135
Investments in tangible and intangible assets 3,580 3,580
Net interest income for Dexia Crediop, also including net hedging gains (losses) and profit or loss from contractual changes without cancellations amounts to a total of 30.4 million at 31 December 2018. Relative to the run rate, net interest income amounts to 24.1 million, consisting of interest income and expense for 23.9 million and 0.2 million relative to the result of contractual changes without cancellations due to the renegotiation of an operation with a local entity. The reduction with respect to the previous year, totalling 13.4 million, is mainly due to amortisation of the stock of assets and the decrease in the contribution from own funds. The item net hedging gains (losses) amounts to 6.3 million, down by 8.4 million with respect to 2017, following the change in the ineffectiveness of hedges, above all due to a reduction in the Euribor spread versus OIS.
Net fee and commission income came to -46.7 million, a decrease of 9 million with respect to the previous year, mainly due to the increase in the cost of liquidity lines received from the parent company Dexia Crédit Local which had an impact of -48.1 million in 2018. Other net fee and commission income was positive at 1.4 million, an increase of 0.4 million with respect to 2017, following a decrease in fees paid on guarantees received.
During the period, dividends totalling 2.8 million were received (none in 2017) relative to the final distribution after completion of the voluntary liquidation of the subsidiary Dexia Crediop Ireland Ulc (1.4 million) and 1.5 million from the Istituto per il Credito Sportivo relative to the economic results achieved during the extraordinary administration period (01.01.2012–28.02.2018).
Net trading gains (losses) amount to -35.7 million (-57.6 million with respect to 2017), and include the following income statement items:• net trading gains (losses) (0.2 million);• gains and losses on disposal or repurchase (1.4 million);• net financial assets and liabilities designated at fair value through profit and loss (-37.4 million).
For the purposes of segment reporting, this aggregate can be broken down as follows:• 1.0 million in relation to the early redemption of a callable security issued by the bank in the Project &
Public Finance sector;• 12.4 million classified in other income mainly due to the effects of an increase in margins and valuations
of the renegotiation of loans to customers and an amendment to a credit support annex;• -49.2 million relative to accounting volatility, essentially due to the overall result for trading derivatives,
at -10.6 million, due for 10.9 million to the results of trading and margins on operations and for -21.5 to the valuation of derivatives, mainly influenced by the Credit Value Adjustment (CVA) and Funding Value Adjustment (FVA) components, essentially due to the increase in valuation spreads during the year and to the change in fair value of economic hedging derivatives and loans classified among financial assets designated at fair value through profit and loss, not already included in the other income sector (-38.2 million).
Net interest and other banking income amounted to -49.2 million, down by 85.4 million with respect to 2017.
The amount of net adjustments for impairment was 6.0 million (compared to -10.0 million in 2017), mainly due to writebacks following early redemption or sales of assets, as well as changes in the quality of certain assets.
Net income from financial activities therefore amounted to -43.2 million, a decrease of 69.4 million with respect to the 26.2 million of 2017.
Amortisation and depreciation, of 1.9 million, increased by 0.2 million, compared to the 1.7 million recorded the previous year.
Administrative expenses totalled 28.4 million, down by 1.8 million (-6%) over 2017. Net of contributions to the Single Resolution Fund and the National Resolution Fund (8.3 million in 2018, compared to 7.2 million in 2017), administrative expenses amounted to 20.1 million, a 13% drop over 2017, when the amount was 23.0 million. This reduction can be attributed to personnel expenses, which totalled 12.4 million in 2018, compared to 13.4 million in 2017, mainly due to the decrease in the number of employees. Other administrative expenses, net of contributions to the Resolution Funds, totalled 7.7 million (compared to 9.6 million) and fell by around 1.9 million.
189Notes to the Financial Statements
Allocations made to provisions for risks and charges came to -6.1 million (-1.0 million in 2017) and mainly regard positions relative to public entities and the Istituto per il Credito Sportivo.
Other operating expense/income, equal to 1 million compared to 4.5 million in 2017, relate to the recognition of redemptions of legal expenses, already suffered by Dexia Crediop in the context of disputes with local and regional entities regarding derivatives.
In 2018, gains on disposal of investments came to 0.7 million, following the sale of a real estate asset.The result of continuing operations before tax was -78.0 million compared to -0.3 million in 2017.
Dexia Crediop S.p.A.190

Balance sheet data of parentcompany Dexia Crédit Local
Under the terms of art. 2497 bis of the Italian Civil Code, Dexia Crediop S.p.A. is subject to management and coordination by Dexia Credit Local.
The following is the balance sheet, abbreviated income statement and key indicators as at 31.12.2017 for Dexia Credit Local.
DEXIA CRÉDIT LOCAL - Financial Statements at 31 December 2017
DEXIA CRÉDIT LOCAL Balance sheetEUR millions
ASSETS December 31, 2017 December 31, 2016
I. Cash, central banks and postal checking accounts 404 767
II. Government securities 2,737 3,214
III. Interbank loans and advances 28,958 22,243
IV. Customer loans 29,987 35,185
V. Bonds and other fixed income securities 26,676 36,875
VI. Equities and other variable income securities 140 152
VII. Long-term equity investments 266 588
VIII. Intangible assets 30 28
IX. Tangible fixed assets 2 3
X. Unpaid capital
XI. Uncalled capital
XII. Treasury stock
XIII. Other assets 22,676 28,006
XIV. Accruals and other assets 7,061 8,069
Total assets 118,937 135,130
191Notes to the Financial Statements

Dexia Crediop S.p.A.192
EUR millions
LIABILITIES AND SHAREHOLDERS’ EQUITY December 31, 2017 December 31, 2016
I. Interbank borrowings and deposits 30,998 40,308
II. Customer deposits 8 163
III. Debt securities 70,853 75,900
IV. Other liabilities 4,637 4,618
V. Accruals 8,417 10,116
VI. Provisions for risks and charges 1,184 2,055
VII. General banking risks reserve 0 0
VIII. Subordinated debt 182 435
IX. Capital stock 279 279
X. Additional paid-in capital 2,588 2,588
XI. Reserves and retained earnings (1,213) (1,115)
XII. Net income for the year 1,004 (217)
XIII. Interim dividends
Total liabilities and shareholders' equity 118,937 135,130
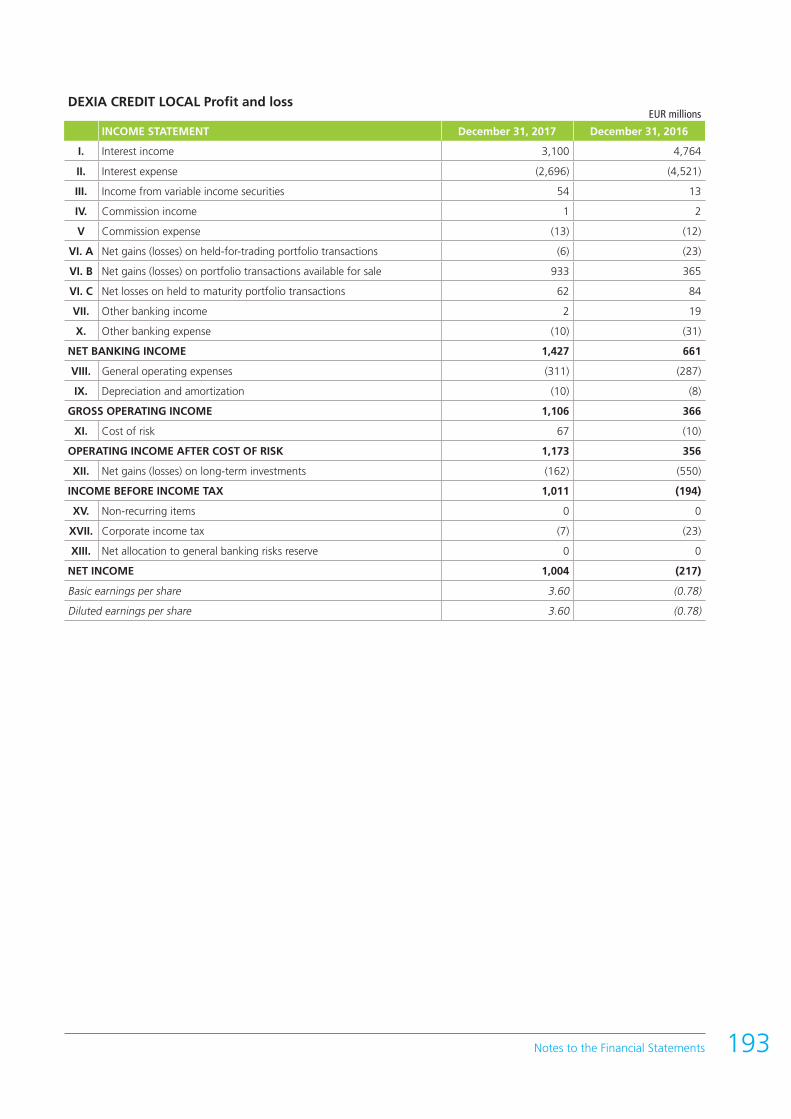
193Notes to the Financial Statements
DEXIA CREDIT LOCAL Profit and lossEUR millions
INCOME STATEMENT December 31, 2017 December 31, 2016
I. Interest income 3,100 4,764
II. Interest expense (2,696) (4,521)
III. Income from variable income securities 54 13
IV. Commission income 1 2
V Commission expense (13) (12)
VI. A Net gains (losses) on held-for-trading portfolio transactions (6) (23)
VI. B Net gains (losses) on portfolio transactions available for sale 933 365
VI. C Net losses on held to maturity portfolio transactions 62 84
VII. Other banking income 2 19
X. Other banking expense (10) (31)
NET BANKING INCOME 1,427 661
VIII. General operating expenses (311) (287)
IX. Depreciation and amortization (10) (8)
GROSS OPERATING INCOME 1,106 366
XI. Cost of risk 67 (10)
OPERATING INCOME AFTER COST OF RISK 1,173 356
XII. Net gains (losses) on long-term investments (162) (550)
INCOME BEFORE INCOME TAX 1,011 (194)
XV. Non-recurring items 0 0
XVII. Corporate income tax (7) (23)
XIII. Net allocation to general banking risks reserve 0 0
NET INCOME 1,004 (217)
Basic earnings per share 3.60 (0.78)
Diluted earnings per share 3.60 (0.78)

Dexia Crediop S.p.A.194
Information for the Public,Country by Country
DEXIA CREDIOPSituation at 31 December 2018
This document provides the information requested in Bank of Circular no. 285 of 17 December 2013, “Supervisory Provisions for Banks”, 4th update.
Company name and type of activity
ITALYDexia Crediop S.p.A. – bank and financial activity, as well as other connected or instrumental activities.
Turnover
ITALYe -49,493 thousand
Number of full time equivalent employees
ITALY71.02
Profit or loss before taxes
ITALYe -77,963 thousand
Taxes on profits or losses
ITALYe 200 thousand


2018R E L A Z I O N E E B I L A N C I O
D E X I A C R E D I O P
Dexia CrediopDexia Crediop
Dexia2018_CrediopIT_SansDos.indd 4 04/01/2019 15:15