2018 Strategy Consulting Compensation...
16
2018 Strategy Consulting Compensation Study January 26, 2018 Copyright 2018 Charles Aris Incorporated. All rights reserved. Not to be utilized by any third party without the prior consent of Charles Aris Incorporated.
Transcript of 2018 Strategy Consulting Compensation...

2018 Strategy Consulting Compensation Study
January 26, 2018
Copyright 2018 Charles Aris Incorporated. All rights reserved. Not to be utilized by any third party without the prior consent of Charles Aris Incorporated.

2
An important note on new pay equity laws
Perhaps you have heard that on October 31, 2017, New York City passed pay equity legislation. Since then California, Delaware and Oregon have passed similar laws. The State of Massachusetts is scheduled to implement the same restriction starting on July 1, 2018, and many other cities and states have proposed similar laws which are currently working their way through their respective legislative systems.
The purpose of pay equity legislation is to prohibit employers from discriminating on the basis of gender or ethnicity in the payment of wages. Here’s why: Historically, companies have extended offers to candidates at a value that was largely driven by the compensation packages which candidates had at that time. Given the fact that women and people of color have historically been paid less than others in equivalent positions, the practice of extending offers based on current compensation has prevented them from ever “catching up” with their counterparts. By preventing companies from asking about a candidate’s current compensation, the hope is that this gap will be closed, as companies will extend offers based on merit as opposed to current wages.
All of the compensation data gathered in this report abides strictly by the pay equity laws of each state, territory and municipality.
Going forward, our annual compensation study must change dramatically. Instead of focusing on what candidates currently earn, we will focus more on what consultants expect to earn in their next roles after consulting (which is perfectly legal to ask in all states, territories and municipalities).
New legislation is changing the way compensation data can be gathered. It’s also changing the face of our compensation report.
3
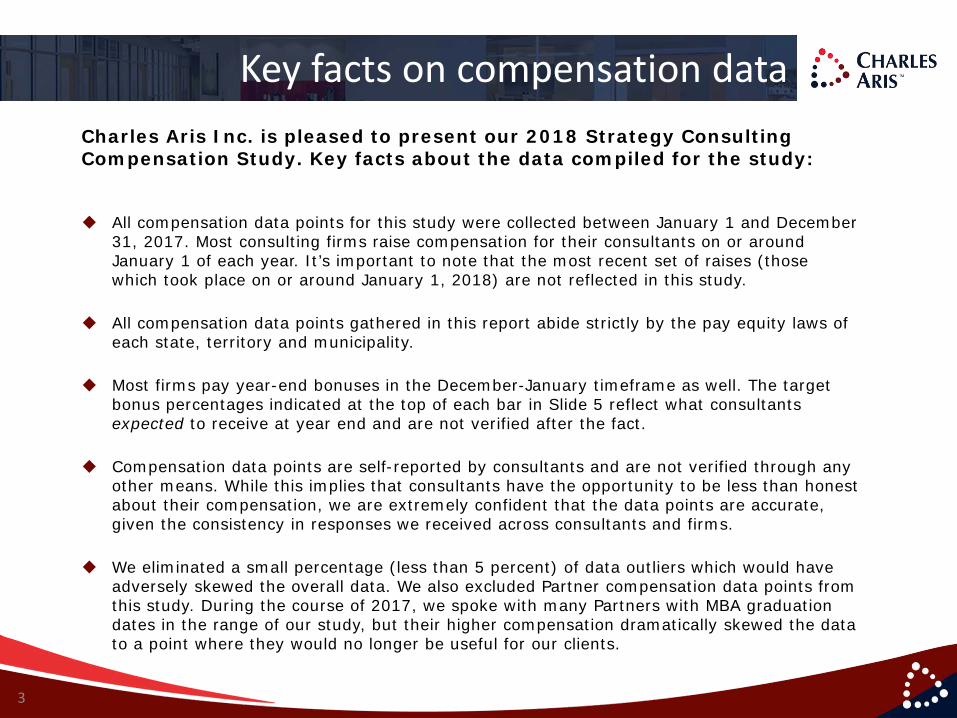
Key facts on compensation data
All compensation data points for this study were collected between January 1 and December 31, 2017. Most consulting firms raise compensation for their consultants on or around January 1 of each year. It’s important to note that the most recent set of raises (those which took place on or around January 1, 2018) are not reflected in this study.
All compensation data points gathered in this report abide strictly by the pay equity laws of each state, territory and municipality.
Most firms pay year-end bonuses in the December-January timeframe as well. The target bonus percentages indicated at the top of each bar in Slide 5 reflect what consultants expected to receive at year end and are not verified after the fact.
Compensation data points are self-reported by consultants and are not verified through any other means. While this implies that consultants have the opportunity to be less than honest about their compensation, we are extremely confident that the data points are accurate, given the consistency in responses we received across consultants and firms.
We eliminated a small percentage (less than 5 percent) of data outliers which would have adversely skewed the overall data. We also excluded Partner compensation data points from this study. During the course of 2017, we spoke with many Partners with MBA graduation dates in the range of our study, but their higher compensation dramatically skewed the data to a point where they would no longer be useful for our clients.
Charles Aris Inc. is pleased to present our 2018 Strategy Consulting Compensation Study. Key facts about the data compiled for the study:

4
Input data by consulting firm
During the course of 2017, Charles Aris recruiters spoke with more than 3,000 strategy candidates, of whom more than 95 percent were actively employed with industry-leading consulting firms, corporations or private equity firms.
Detailed discussions around compensation happen only on an as-needed basis. For the purpose of this study, we have distilled only those compensation data points from candidates who were actively employed by leading consulting firms.
Our 2018 Strategy Consulting Compensation Study is driven by 779 data points from consultants across nine consulting firms.
58.3 percent of the data points come from “The Big Three” firms: McKinsey & Company, The Boston Consulting Group and Bain & Company.
Of the 779 total data points, 584 come from post-MBA consultants and 195 come from pre-MBA / undergraduate consultants.
0%
25%
50%
75%
100%779 Total Data Points
Input Data By Consulting Firm
McKinsey & Company
The Boston Consulting Group
Deloitte Consulting(including Monitor)
Bain & Company
Strategy&
A.T. KearneyOliver Wyman
Parthenon-EYL.E.K. Consulting

5
$200,000$26,202Bonus
$25,745Bonus$19,450
$53,705Bonus
$100,000 $16,728
Average compensation by graduation yearAverage 2017 Compensation* for Strategy Consultants by Graduation Year
$300,000
$50,000
$150,000
$250,000
2014Undergrad
2015MBA
2014MBA
2013MBA
2012MBA
2011MBA
2015Undergrad
2016Undergrad
$02016MBA
$173,922
$147,720Salary
$203,775
$161,565Salary
$226,390
$172,685Salary
$256,338
$184,142Salary
$72,196Bonus
$281,840
$196,986Salary
$84,854Bonus
$309,347
$205,938Salary
$103,409Bonus
$315,910
$213,952Salary
$101,957Bonus
$98,002
$82,359Salary
$107,337
$90,609Salary
$123,024
$103,573Salary
$137,591
$111,846Salary
2013Undergrad
2010MBA
† †
$42,210Bonus
$15,643
N 32 105 45 13 20 178 165 97 71 32 21Std Dev.** $7.7K $23.0K $31.5K $36.5K $16.9K $23.6K $35.2K $44.6K $61.9K $68.7K $48.1KMedian** $96.9K $103.5K $115.7K $131.3K $169.2K $200.0K $224.0K $248.3K $274.5K $308.0K $315.0K% Change1yr^ 17.6% 14.0% 9.6% 4.2% 5.0% 10.9% 10.2% 12.7% 11.3%% Change2yr^^ 32.7% 30.8% 30.6% 29.3% 27.0% 24.1% 16.0%% Change3yr^^ 60.6% 47.3% 45.4% 44.1% 35.1%% Change4yr^^^^ 71.4% 55.6%% Change5yr^^^^^ 73.4%
*Base salary plus target annual bonus only. Does not include retirement contribution, profit sharing, sign-on, car allowance or other such cash equivalents.**Standard Deviation and Median numbers are calculated for base salary plus target annual bonus, i.e. the number at the top of each column.†Pre-Partner data points only, i.e. we excluded compensation data points from anyone at Partner level or equivalent as it skewed the data significantly.^% Change1Yr equals the percentage change in total annual compensation (base salary plus target annual bonus only), from 2016 to 2017, for that graduation year.^^% Change2Yr equals the percentage change in total annual compensation (base salary plus target annual bonus only), from 2015 to 2017, for that graduation year.^^^% Change3Yr equals the percentage change in total annual compensation (base salary plus target annual bonus only), from 2014 to 2017, for that graduation year.^^^^% Change4Yr equals the percentage change in total annual compensation (base salary plus target annual bonus only), from 2013 to 2017, for that graduation year.^^^^^% Change5Yr equals the percentage change in total annual compensation (base salary plus target annual bonus only), from 2012 to 2017, for that graduation year.
5
6
2017
9.4%
2017
13.3%
20162014
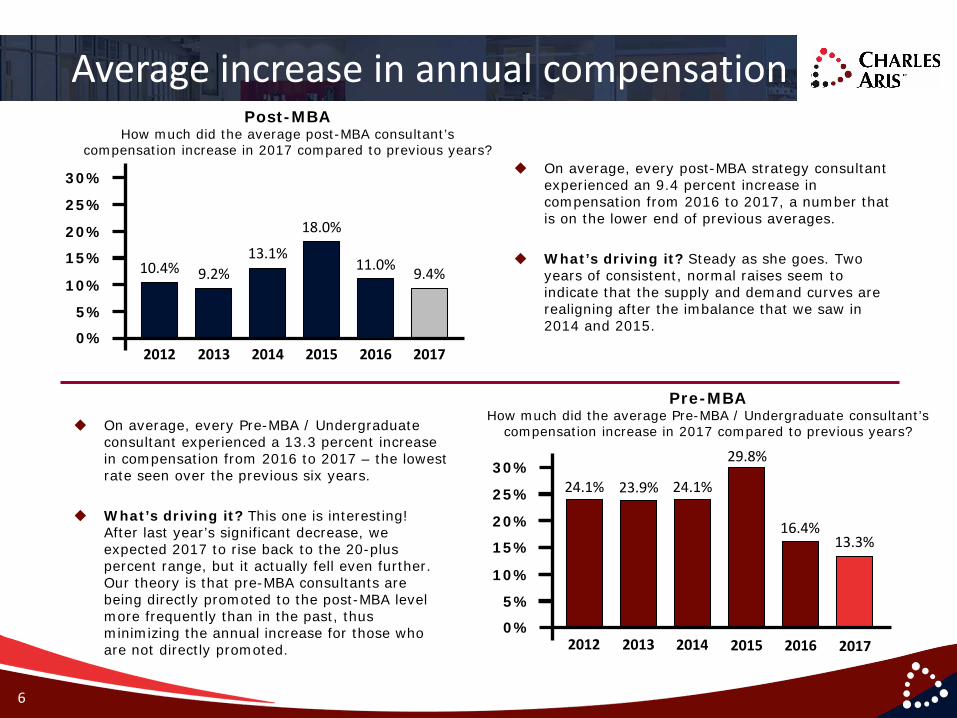
Average increase in annual compensation
2012
10.4%
2013
9.2%
2014
13.1%
0%
15%
20%
25%
30%
2012
24.1%
2013
23.9% 24.1%
Post-MBAHow much did the average post-MBA consultant’s
compensation increase in 2017 compared to previous years?
Pre-MBAHow much did the average Pre-MBA / Undergraduate consultant’s
compensation increase in 2017 compared to previous years?
10%
5%
0%
15%
20%
25%
30%
10%
5%
On average, every post-MBA strategy consultant experienced an 9.4 percent increase in compensation from 2016 to 2017, a number that is on the lower end of previous averages.
What’s driving it? Steady as she goes. Two years of consistent, normal raises seem to indicate that the supply and demand curves are realigning after the imbalance that we saw in 2014 and 2015.
On average, every Pre-MBA / Undergraduate consultant experienced a 13.3 percent increase in compensation from 2016 to 2017 – the lowest rate seen over the previous six years.
What’s driving it? This one is interesting! After last year’s significant decrease, we expected 2017 to rise back to the 20-pluspercent range, but it actually fell even further. Our theory is that pre-MBA consultants are being directly promoted to the post-MBA level more frequently than in the past, thus minimizing the annual increase for those who are not directly promoted. 2015
29.8%
2015
18.0%
2016
11.0%
16.4%
7
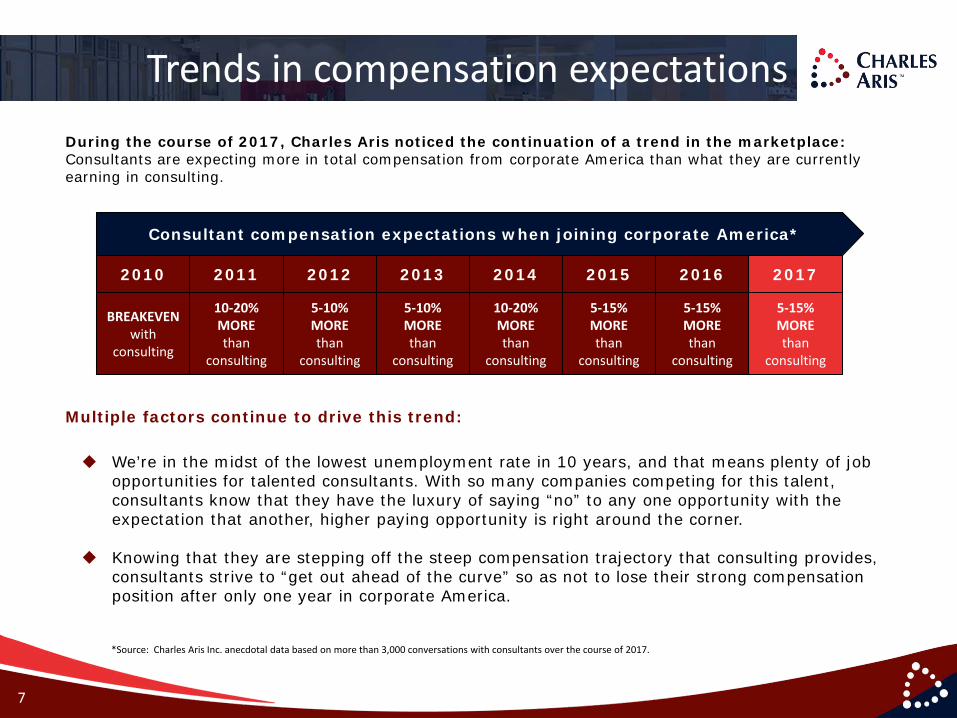
2017
5-15%MOREthan
consulting
Trends in compensation expectationsDuring the course of 2017, Charles Aris noticed the continuation of a trend in the marketplace: Consultants are expecting more in total compensation from corporate America than what they are currently earning in consulting.
We’re in the midst of the lowest unemployment rate in 10 years, and that means plenty of job opportunities for talented consultants. With so many companies competing for this talent, consultants know that they have the luxury of saying “no” to any one opportunity with the expectation that another, higher paying opportunity is right around the corner.
Knowing that they are stepping off the steep compensation trajectory that consulting provides, consultants strive to “get out ahead of the curve” so as not to lose their strong compensation position after only one year in corporate America.
Multiple factors continue to drive this trend:
*Source: Charles Aris Inc. anecdotal data based on more than 3,000 conversations with consultants over the course of 2017.
Consultant compensation expectations when joining corporate America*
2016
5-15%MOREthan
consulting
2010 2011 2012 2013
BREAKEVENwith
consulting
10-20%MOREthan
consulting
5-10%MOREthan
consulting
5-10%MOREthan
consulting
2015
5-15%MOREthan
consulting
2014
10-20%MOREthan
consulting
8
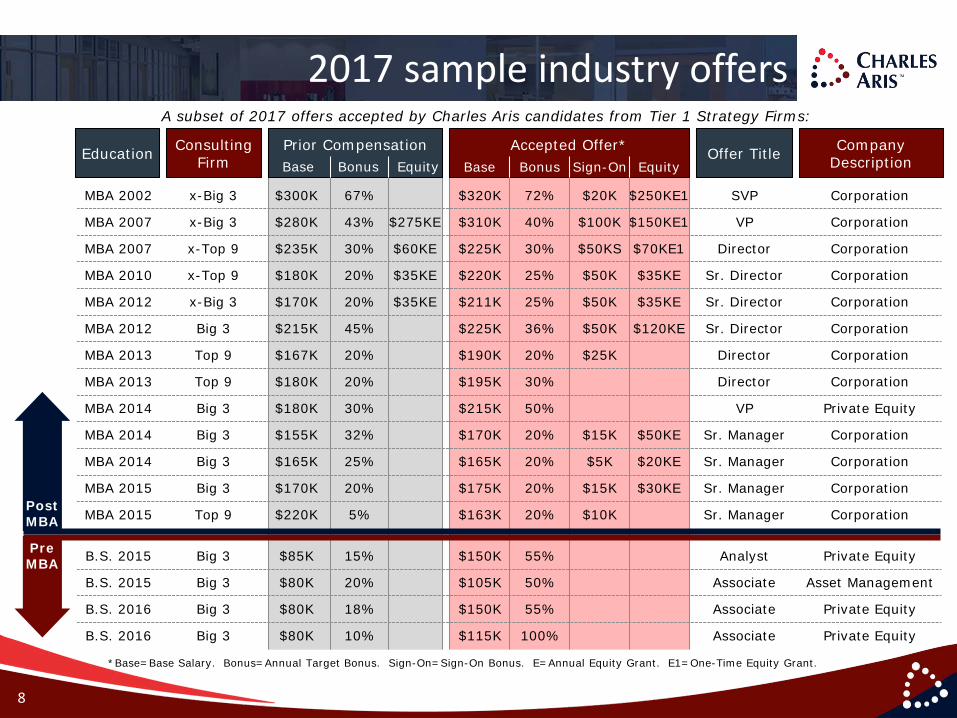
MBA 2002 x-Big 3 $300K 67% $320K 72% $20K $250KE1 SVP Corporation
MBA 2007 x-Big 3 $280K 43% $275KE $310K 40% $100K $150KE1 VP Corporation
MBA 2007 x-Top 9 $235K 30% $60KE $225K 30% $50KS $70KE1 Director Corporation
MBA 2010 x-Top 9 $180K 20% $35KE $220K 25% $50K $35KE Sr. Director Corporation
MBA 2012 x-Big 3 $170K 20% $35KE $211K 25% $50K $35KE Sr. Director Corporation
MBA 2012 Big 3 $215K 45% $225K 36% $50K $120KE Sr. Director Corporation
MBA 2013 Top 9 $167K 20% $190K 20% $25K Director Corporation
MBA 2013 Top 9 $180K 20% $195K 30% Director Corporation
MBA 2014 Big 3 $180K 30% $215K 50% VP Private Equity
MBA 2014 Big 3 $155K 32% $170K 20% $15K $50KE Sr. Manager Corporation
` MBA 2014 Big 3 $165K 25% $165K 20% $5K $20KE Sr. Manager Corporation
MBA 2015 Big 3 $170K 20% $175K 20% $15K $30KE Sr. Manager Corporation
MBA 2015 Top 9 $220K 5% $163K 20% $10K Sr. Manager Corporation
B.S. 2015 Big 3 $85K 15% $150K 55% Analyst Private Equity
B.S. 2015 Big 3 $80K 20% $105K 50% Associate Asset Management
B.S. 2016 Big 3 $80K 18% $150K 55% Associate Private Equity
B.S. 2016 Big 3 $80K 10% $115K 100% Associate Private Equity
Accepted Offer*
2017 sample industry offersA subset of 2017 offers accepted by Charles Aris candidates from Tier 1 Strategy Firms:
Education ConsultingFirm
Prior Compensation Offer Title CompanyDescriptionBase Bonus Sign-On EquityBase Bonus Equity
PreMBA
PostMBA
*Base=Base Salary. Bonus=Annual Target Bonus. Sign-On=Sign-On Bonus. E=Annual Equity Grant. E1=One-Time Equity Grant.
9
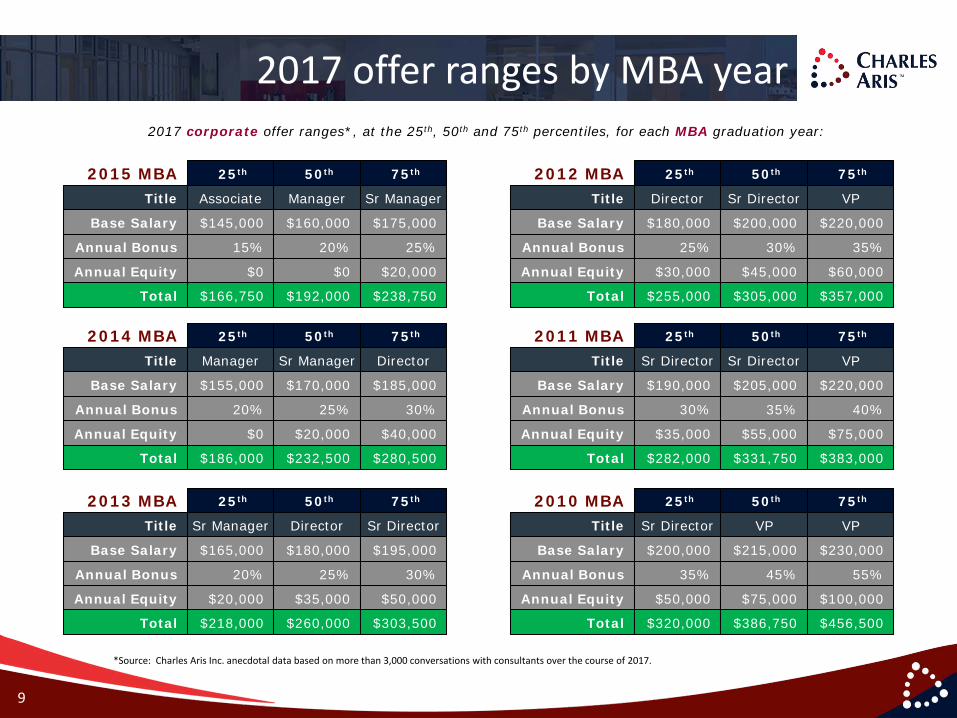
2017 offer ranges by MBA year
2015 MBATitle
Base Salary
Annual Bonus
Annual Equity
Total
25th 50th 75th
Associate Manager Sr Manager
$145,000 $160,000 $175,000
15% 20% 25%
$0 $0 $20,000
$166,750 $192,000 $238,750
2014 MBATitle
Base Salary
Annual Bonus
Annual Equity
Total
25th 50th 75th
Manager Sr Manager Director
$155,000 $170,000 $185,000
20% 25% 30%
$0 $20,000 $40,000
$186,000 $232,500 $280,500
2013 MBATitle
Base Salary
Annual Bonus
Annual Equity
Total
25th 50th 75th
Sr Manager Director Sr Director
$165,000 $180,000 $195,000
20% 25% 30%
$20,000 $35,000 $50,000
$218,000 $260,000 $303,500
2012 MBATitle
Base Salary
Annual Bonus
Annual Equity
Total
25th 50th 75th
Director Sr Director VP
$180,000 $200,000 $220,000
25% 30% 35%
$30,000 $45,000 $60,000
$255,000 $305,000 $357,000
2011 MBATitle
Base Salary
Annual Bonus
Annual Equity
Total
25th 50th 75th
Sr Director Sr Director VP
$190,000 $205,000 $220,000
30% 35% 40%
$35,000 $55,000 $75,000
$282,000 $331,750 $383,000
2010 MBATitle
Base Salary
Annual Bonus
Annual Equity
Total
25th 50th 75th
Sr Director VP VP
$200,000 $215,000 $230,000
35% 45% 55%
$50,000 $75,000 $100,000
$320,000 $386,750 $456,500
*Source: Charles Aris Inc. anecdotal data based on more than 3,000 conversations with consultants over the course of 2017.
2017 corporate offer ranges*, at the 25th, 50th and 75th percentiles, for each MBA graduation year:

10
2017 offer ranges by undergraduate year
2015 Pre-MBA
Title
Base Salary
Annual Bonus
Annual Equity
Total
25th 50th 75th
Analyst Analyst Sr Analyst
$90,000 $100,000 $110,000
5% 10% 15%
$0 $0 $0
$94,500 $110,000 $126,500
2014 Pre-MBA
Title
Base Salary
Annual Bonus
Annual Equity
Total
25th 50th 75th
Analyst Sr Analyst Associate
$100,000 $110,000 $120,000
10% 15% 20%
$0 $0 $0
$110,000 $126,500 $144,000
2013 Pre-MBA
Title
Base Salary
Annual Bonus
Annual Equity
Total
25th 50th 75th
Sr Analyst Associate Sr Associate
$115,000 $125,000 $135,000
15% 20% 20%
$0 $0 $15,000
$132,250 $150,000 $177,000
*Source: Charles Aris Inc. anecdotal data based on more than 3,000 conversations with consultants over the course of 2017.
2017 corporate offer ranges*, at the 25th, 50th and 75th percentiles, for each Pre-MBA / Undergraduate graduation year:

11
Strategy consultant competenciesThe matrix below defines the expected competencies for consultants at each level for the 2018 recruiting year:
Breakdown of Consultant Competencies by Position
Years of Experience
1-3 yearsPre-MBA
1-2 yearsPost-MBA
3-4 yearsPost-MBA
5-7 yearsPost-MBA
8+ yearsPost-MBA
Graduation Year
2015-17 undergraduate
degree
2016-17 MBA
2014-15 MBA
2011-13 MBA
2010 and earlier MBA
25%
50%
75%
100%(consultant competencies defined on next slide)
Project Mgmt.
Case Cracking
Analytics / Slide Building
Analyst Manager
Influencing / Leading
Case Cracking
Project Mgmt.
Analytics / Slides
Principal
Selling / Influencing /
Leading
Case Cracking
Project Mgmt.
Partner
Selling / Influencing /
Leading
Case Cracking
Project Mgmt.
Associate
Analytics / Slide Building
Project Mgmt.
Case Cracking
Influence/Lead
Analyst Associate Manager Principal PartnerTitle at
Consulting Firm*
*Titles differ significantly by firm. These are meant to serve as generic titles which work across all firms.

12
Consultant competency definitions
Analytics / Slide Building
Conduct quantitative analyses in a defect-free manner. Possess mastery of Microsoft Excel.
Leverage Microsoft PowerPoint to create impactful, concise and defect-free slide loops.
Selling / Influencing /
Leading
Generate revenue by selling consulting services. Establish vision, frame key issues and set high-
level strategy. Influence key executives and stakeholders to
support significant change.
Project Management
Understand strategic direction as set by the hypothesis-driven approach, set milestones, scope analysis, assign resources, manage execution and report findings.
Serve as quality control lead.
Case Cracking
Understand the problem at a more granular level and establish a hypothesis-driven approach through which a solution can be derived.
Effectively solve the problem. Write the storyline.
SeniorLevel
Competencies
JuniorLevel
Competencies

The Charles Aris Strategy Practice
13
Steven StewartVice President336-378-1818 ext. [email protected]
Caroline WilsonVice President336-378-1818 ext. [email protected]
Chad OakleyChief Executive Officer336-378-1818 ext. [email protected]
Charles Aris Inc. is an international executive search firm founded in 1969. Its Strategy & Corporate Development practice is led by CEO Chad Oakley, a former Bain & Company consultant and Wharton MBA.
Since its inception in 2003, this Strategy & Corporate Development practice has placed more than 550 candidates, at multiple levels, including Chief Strategy Officer, Vice President, Director, Manager and Analyst.
The Charles Aris client base falls into three categories: the Corporate Strategy teams of industry-leading Fortune 500 companies; the investment and portfolio management teams of leading private equity and asset management firms; and professional services firms including consultancies and the like.
The candidates whom we place typically work or have worked for top-tier strategy consulting firms and possess undergraduate and graduate degrees from the world's leading academic institutions.
For more information, please contact any of our team members as shown on this page or visit CharlesAris.com.
Jillian JitimaSenior Practice Leader336-378-1818 ext. [email protected]
Ashlee WagnerSenior Associate Practice Leader336-378-1818 ext. [email protected]
Jody KaravanicSenior Practice Leader336-378-1818 ext. [email protected]
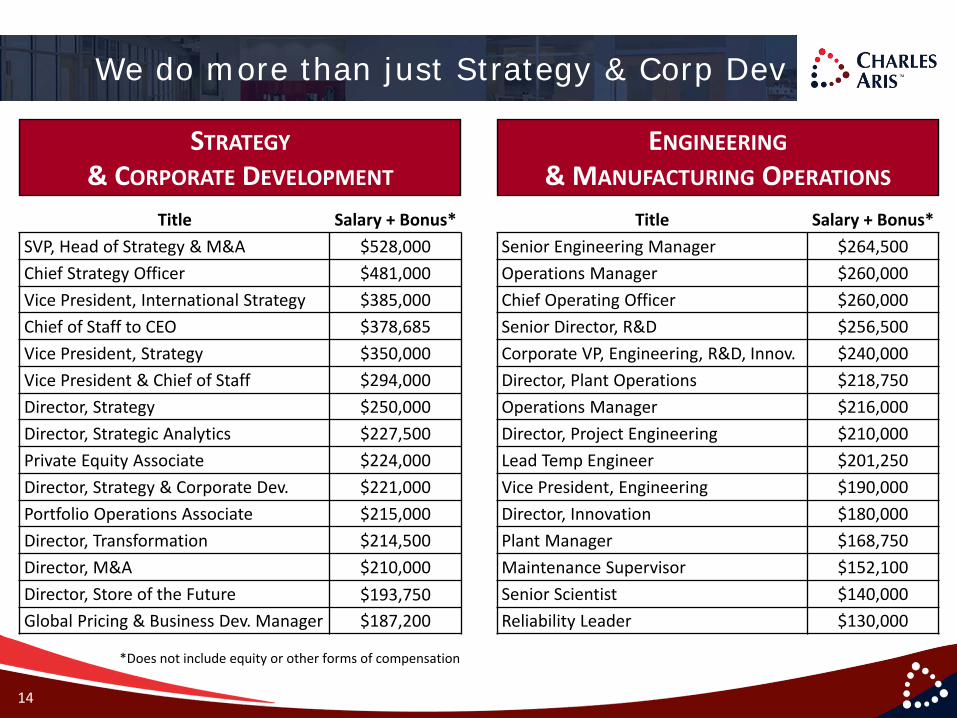
We do more than just Strategy & Corp Dev
14
STRATEGY& CORPORATE DEVELOPMENT
ENGINEERING& MANUFACTURING OPERATIONS
*Does not include equity or other forms of compensation
Title Salary + Bonus*SVP, Head of Strategy & M&A $528,000Chief Strategy Officer $481,000Vice President, International Strategy $385,000Chief of Staff to CEO $378,685Vice President, Strategy $350,000Vice President & Chief of Staff $294,000Director, Strategy $250,000Director, Strategic Analytics $227,500Private Equity Associate $224,000Director, Strategy & Corporate Dev. $221,000Portfolio Operations Associate $215,000Director, Transformation $214,500Director, M&A $210,000Director, Store of the Future $193,750 Global Pricing & Business Dev. Manager $187,200
Title Salary + Bonus*Senior Engineering Manager $264,500Operations Manager $260,000Chief Operating Officer $260,000Senior Director, R&D $256,500Corporate VP, Engineering, R&D, Innov. $240,000Director, Plant Operations $218,750Operations Manager $216,000Director, Project Engineering $210,000Lead Temp Engineer $201,250Vice President, Engineering $190,000Director, Innovation $180,000Plant Manager $168,750Maintenance Supervisor $152,100Senior Scientist $140,000Reliability Leader $130,000

We do more than just Strategy & Corp Dev
15
FINANCE & ACCOUNTING SALES & MARKETING
*Does not include equity or other forms of compensation
Title Salary + Bonus*CFO – Consumer Goods $500,000 CFO – Real Estate / Construction $357,500CFO – Insurance $300,000 CFO – Automotive Products $273,000 Director of Solar Finance $270,000 CFO – Apparel & Fashion $259,000 CFO – Pet Food Manufacturer $252,000 Director, Financial Planning & Analysis $247,000 CFO, Injection Molding $240,500 CFO – Industrial Products $206,250 CFO – Industrial Products $187,200 CFO – Industrial Automation $175,000 Finance Manager $156,000 Planning & Perf. Analytics Manager $147,600 Director, Global FP&A $140,000
Title Salary + Bonus*Chief Product Officer $468,000Chief Marketing Officer $362,500EVP, Sales & Marketing $317,300Vice President, Sales $281,250Vice President, Sales / Marketing $280,000Territory Vice President $224,000Director, Global Product Stewardship $215,000Territory Vice President $208,000Vice President, Business Development $200,000Vice President, Sales $180,000Category Manager $175,000Director, Marketing $174,000Vice President, Sales $150,000Product Manager $143,850Product Manager $142,500

We do more than just Strategy & Corp Dev
16
EXECUTIVE LEADERSHIP MISCELLANEOUS
*Does not include equity or other forms of compensation
Title Salary + Bonus*CEO – Hospitality $1,000,000SVP, Feed Division $735,000CEO – Food Manufacturing $600,000CEO – Retail $525,000President, Education Solutions $465,000President, Health Care Services $450,000CEO – Building Materials $375,000CEO – Injection Molding $375,000General Mgr – Consumer Electronics $350,000CEO – Oil & Energy $310,500General Manager – Consumer Goods $299,000President – Process & Controls $294,000EVP/GM – Consumer Electronics $240,000CEO – Education $237,500CEO – Investment Management $231,250
Title Salary + Bonus*Head of Performance Acceleration $472,500Vice President, Customer Analytics $368,450SVP, Risk Management $280,000IT Expert Manager $276,000Director, Communication Improvement $258,000HR Site Manager / Director $218,750Director of Human Resources $212,500VP, Clinic Operations $190,000Global Distribution Manager $187,500Vice President, Construction $179,400Senior Designer $155,250Investment Engineer $155,000Vice President of People $154,000VP, CIO $150,000Technology Innovation Leader $140,000