
2018 - State of Ohio EMS · 2019. 10. 16. · 2018 Ohio Trauma Annual Report 4 SECTION 1: STATE...
60
i 2018 OHIO TRAUMA REGISTRY ANNUAL REPORT Ohio Department of Public Safety Division of Emergency Medical Services Published: October 16, 2019
Transcript of 2018 - State of Ohio EMS · 2019. 10. 16. · 2018 Ohio Trauma Annual Report 4 SECTION 1: STATE...

i
2018
OHIO TRAUMA REGISTRY
ANNUAL REPORT
Ohio Department of Public Safety
Division of Emergency Medical Services
Published: October 16, 2019

i
This Page Intentionally Left Blank

ii
TABLE OF CONTENTS Page
Foreword . . . . . . . . . . . . . . . . . . . . . . . . . . . . . . . . . . . . . . . . . . . . . .
1
Introduction . . . . . . . . . . . . . . . . . . . . . . . . . . . . . . . . . . . . . . . . . . . . 2
Considerations . . . . . . . . . . . . . . . . . . . . . . . . . . . . . . . . . . . . . . . . . . . 3
Section 1: State Demographics . . . . . . . . . . . . . . . . . . . . . . . . . . . . . . . . . . 4
Section 2: Records of Hospital Patient Contact . . . . . . . . . . . . . . . . . . . . . . . . . 6
Section 3: Patient Characteristics . . . . . . . . . . . . . . . . . . . . . . . . . . . . . . . . . 15
Section 4: Injury Characteristics . . . . . . . . . . . . . . . . . . . . . . . . . . . . . . . . . . 17
Section 5: Outcome Measures . . . . . . . . . . . . . . . . . . . . . . . . . . . . . . . . . . . 25
Section 6: Case Fatality Rates . . . . . . . . . . . . . . . . . . . . . . . . . . . . . . . . . . . 32
Appendix A: Glossary of Terms . . . . . . . . . . . . . . . . . . . . . . . . . . . . . . . . . . 36
Appendix B: Ohio Trauma Registry Inclusion Criteria and Data Dictionary . . . . . . . . . . 38
Appendix C: Map of Ohio Adult Trauma Centers . . . . . . . . . . . . . . . . . . . . . . . . . 39
Appendix D: Map of Ohio Pediatric Trauma Centers . . . . . . . . . . . . . . . . . . . . . . 40
Appendix E: Map of Ohio Burn Centers . . . . . . . . . . . . . . . . . . . . . . . . . . . . . 41
Appendix F: Map of Ohio Critical Access Hospitals . . . . . . . . . . . . . . . . . . . . . . . . 42
Appendix G: Map of Acute Care Hospitals . . . . . . . . . . . . . . . . . . . . . . . . . . . . 43
Appendix H: Map of Freestanding Emergency Departments . . . . . . . . . . . . . . . . . . 44
Appendix I: Map of EMS Units Serving Trauma Patients in Ohio by BLS and ALS . . . . . . . 45
Appendix J: Map of Air Medical Services Serving Trauma Patients in Ohio . . . . . . . . . . 46
Appendix K: Ohio Department of Health Injury-Related Death Data . . . . . . . . . . . . . . 47
Appendix L: Map of Ohio Homeland Security Regions . . . . . . . . . . . . . . . . . . . . . . 51
Appendix M: Map of Ohio Counties, Urban and Rural Designation . . . . . . . . . . . . . . 52
Appendix N: Summary of Trauma Related EMS Grants . . . . . . . . . . . . . . . . . . . . . 53
Appendix O: Contributors - Members of the Emergency Medical, Fire, and Transportation Services Board, Trauma Committee, Trauma Registry Advisory Workgroup (TRAW), Performance Improvement (PI) Workgroup, and EMS Prehospital Workgroup . . . . . . . .
54

iii
This Page Intentionally Left Blank

1 2018 Ohio Trauma Annual Report
FOREWORD
When people present for emergency care, we can compartmentalize them into one of two buckets: those who
are ill, and those who are injured. Those who are ill could be suffering from a number of medical conditions, such
as heart disease, diabetes, or sepsis. Progress is being made for those residing in this bucket. Organizations have
been formed to develop protocols to standardize care based on best practices, and funding is used to further
research in hopes to ultimately identify a cure. All of this is beneficial and has improved life expectancy for
individuals plagued by illness. That is a good thing.
Traumatic injuries make up the other bucket. Injuries have lagged behind illnesses in regards to recognition status
as a disease process and in the development of standardized care and identification of a cure. However, times
are changing. Foundations for the injured have been established, evidence-based practice protocols are
developing and evolving, and research and injury prevention strategies are working hand-in-hand to not only help
those in the trauma bucket, but to reduce the total number of trauma patients treated yearly.
This report stands as part of the movement forward to better understand the changing needs of Ohio’s trauma
patients. If research is the engine driving our knowledge regarding treating this epidemic of injury, then data is
the gasoline. The Ohio Trauma Registry is comprised of data on injured patients imported from every hospital in
the state, from our largest Level I Trauma Center to our smallest Critical Access Hospital. The creation of this
report allows us to tease out, tug on, and test the water on new trends in managing traumatic injuries and
potential treatment options that could improve care and outcomes.
Trauma is a team sport, and Ohio is blessed to have some All-Star caliber players. Many thanks to the State Board
of Emergency Medical, Fire, and Transportation Services, that serves as the coach, offering direction and
facilitating the work being done. The State Trauma Committee consists of experts of injury who selflessly give of
their time and incredible talents to serve their state. While that Committee develops the vision of trauma care
for Ohio, the staff of Ohio Department of Public Safety (ODPS) collectively roll up their sleeves and complete the
lion’s share of the work, creating a tangible template of that vision. Finally and most importantly, if you are a
Trauma Medical Director, a Trauma Program Manager, a Trauma Registrar, a hospital CEO, a physician, a nurse,
or an out-of-hospital responder who provides care for the injured in our state, please know you score all our
points. There are no benchwarmers on our team.
The goal of this report, when compared with the 2017 Ohio Trauma Registry Annual report, is to begin to illustrate
trends in the injured within our state. Trends lead to targeted education, targeted education leads to injury
prevention, and injury prevention ultimately lessens the number of people who will need trauma care. Ultimately,
that is the collective goal of Ohio’s trauma team. Thank you for all you do in helping us make a safer Ohio!
Diane Simon RN, CEN
Diane Simon RN, CEN Chair, State Trauma Committee

2 2018 Ohio Trauma Annual Report
INTRODUCTION
The 2018 Ohio Trauma Registry (OTR) Annual Report presents an overview of data collected from patients who
sustained traumatic injuries and arrived at an Ohio facility in Calendar Year (CY) 2018. The purpose of this report
is to provide relevant information to healthcare professionals and to the public which describes Ohio’s trauma
patient load and an analysis of the traumatic injuries seen during this period.
In accordance with Ohio Revised Code (ORC) 4765.06(B), the State Board of Emergency Medical, Fire, and
Transportation Services (Board) has the statutory authority to establish a state trauma registry to be used for the
collection of information regarding the care of adult and pediatric trauma victims in Ohio. The registry provides
for the reporting of adult and pediatric trauma-related deaths, identification of adult and pediatric trauma
patients, monitoring of adult and pediatric trauma patient care data, determination of the total amount of
uncompensated adult and pediatric trauma care provided annually by each facility that provides care to trauma
victims, and collection of any other information specified by the Board. The Board has authority over the OTR,
specifications for information that may be collected (ORC 4765.11(B) (1)), and supervision of its operation via the
Board’s Trauma Committee and associated workgroups.
The Board’s Trauma Committee and composition is outlined in ORC 4765.04(B) (1 – 22). A total of twenty-four
(24) members, representing a diverse group of stakeholders from urban and rural areas, various geographical
areas of the state, and various schools of training who are involved with oversight and care of Ohio’s trauma
patients, are nominated by their respective organizations and appointed by the Director of the Ohio Department
of Public Safety. Currently, no more than one Committee member who is employed by or practices at the same
hospital, health system, or emergency medical service organization may be appointed to this Committee. The
Committee advises and assists the Board in matters related to adult and pediatric trauma care and the
establishment and operation of the OTR. In matters relating to the OTR, the Board and the Committee can consult
with trauma registrars from adult and pediatric trauma centers in the state. The Committee may appoint a
subcommittee to advise and assist with the OTR. The subcommittee may include persons with expertise relevant
to the OTR who are not members of the Board or Committee.
The OTR is operated and maintained by the Ohio Department of Public Safety, Division of Emergency Medical
Services (EMS). This report was produced by the Ohio Department of Public Safety, Division of EMS, Trauma and
Research Team, in conjunction with the Trauma Committee and its Performance Improvement Workgroup. The
information contained herein is based on data that were reported for trauma patients who arrived at a facility in
2018. It is intended for descriptive purposes only. The inclusion requirements for the trauma registry and the
associated data dictionary can be found in Appendix A. Questions or comments concerning the report should be
directed to [email protected].

3 2018 Ohio Trauma Annual Report
CONSIDERATIONS
For this report, 2018 data were defined as records that had an arrival date between 1/1/2018 and
12/31/2018. This is a departure from the 2017 annual report where the reporting period was defined by
patient discharge date. These data are intended for descriptive purposes only.
In the OTR, we do receive records where the injury occurred out of state. For the figures and tables that
look at health outcomes/injury information by county or region, these records are not included. The other
figures and tables do include records where the injury may have occurred out of state. This can help
provide an overall picture of the type of injuries that come to and the care that is provided at hospitals
and freestanding emergency departments in Ohio.
For calculations involving state and county populations, this analysis used the 2018 population estimates
provided from the census website (https://www.census.gov/).
If a table or figure has a label of “Not Recorded,” that means that the cell/value in the data was blank. If
a table or figure has a label of “Not Valued,” that means that the cell/value in the data was not applicable,
not classified, or unknown.
For tables that have percentages, the percentages may not add up to 100% due to rounding.
Patients with the following isolated ICD-10-CM codes are EXCLUDED from the OTR:
• S72.00-S72.14, fracture of head/neck of femur ONLY IF age >70 AND it resulted from slipping,
tripping, stumbling or a same level fall (W01.0, W18.30, W18.31, W18.39);
• S00, S10, S20, S30, S40, S50, S60, S70, S80, S90, patients with abrasion or contusion injuries that
were transferred in/out for treatment of injuries or died because of injuries would be included in
the registry.
Considerations should be made when evaluating the number of injuries and deaths that are reported for
counties near and on the border with other states. These patients could have been transported out of
Ohio where the injury occurred to be treated by a closer facility in a neighboring state. These injuries and
any deaths resulting from these injuries would not be reflected in this report.

4 2018 Ohio Trauma Annual Report
SECTION 1: STATE DEMOGRAPHICS
Geography
The State of Ohio encompasses a land area of 40,952.6 square miles. Land usage is predominantly farmland with
36.7% used for cultivated crops and an additional 13.3% used for hay and pasture land. Another 32.4% is forested
land. Developed land usage is divided into 2.49% lower intensity and 11.3% higher intensity categories. The
population is distributed across Ohio with 80% of Ohioans living in metropolitan areas.
Population
Based on a 2018 report from the Ohio Department of Development (ODD), Office of Research, Ohio’s population
was 11,689,442. Population growth in Ohio began to slow in the 1970s, increasing by only 2.7% since 2000 while
the U.S. population has increased by 15.7% during the same timeframe. Ohio is the seventh most populous state
and accounts for 3.6% of the nation’s population (325,719,178). The median age of Ohio’s population is 39.3 years
of age and slightly higher than the nation’s median age of 38 years. Children ranging from 0 – 17 years of age
make up 22.6% of the population. Adults ages 18 – 64 constitute 61.4% of the population and adults age 65 and
older account for 15.9%. According to the Ohio Department of Development the birthrate for women ages 15 –
44 is 62 per 1,000. Teen births for females ages 15 – 19 is 20.8 per 1,000. The death rate is 1065.4 per 100,000
population.
Education and Income Based on 2018 statistics from the ODD, 10.2% did not complete high school while 33.6% graduated high school
before discontinuing formal education. Nationally, 27.1% completed high school or equivalency before
discontinuing their formal education. An additional 20.5% have some college education without degree
completion. Another 8.5% obtained an Associate degree, 17% obtained a Bachelor’s degree, slightly lower than
the 19.7% national average. Lastly, 10.2% Ohioans have obtained a Master’s degree or higher compared to 12.3%
nationally.
The median annual income of Ohio households is $52,407. Approximately 23.6 % of Ohioans are below 150% of
the Federal Poverty Level (FPL).
Healthcare
There were 231 registered hospitals totaling 40,776 beds. In addition to hospitals, there are 986 nursing homes
and 753 residential care facilities. Of these, 85 acute care facilities and another 42 freestanding emergency
departments contributed data to the OTR. Of the 46 hospitals that met the American College of Surgeons
Committee on Trauma criteria for registered trauma centers that are equipped to handle the more extreme
traumatic injury cases, all 46 submitted data to the OTR. In Ohio there are currently 11 Level I Trauma Centers,
ten Level II Trauma Centers, and 20 Level III Trauma Centers (Appendix C). There are also three 3 Level I Pediatric
Trauma Centers and five Level II Pediatric Trauma Centers serving the state, three of which reside in the same
facility as an adult trauma center (Appendix D). These registered trauma centers are located in the metropolitan
areas of Akron, Cincinnati, Columbus, Cleveland, Dayton, and Toledo. Of the total registered hospitals, 32 are
identified as critical access hospitals that provide care in primarily rural areas of Ohio (Appendix F).

5 2018 Ohio Trauma Annual Report
Emergency Medical Services As of the end of December 2018, there were 41,135 individuals holding an active EMS provider certificate as either
an Emergency Medical Responder, Emergency Medical Technician, Advanced Emergency Medical Technician, or
Paramedic.
EMS coverage throughout Ohio included a mixture of Emergency Medical Responder (1.4%), Emergency Medical
Technician (6%), Advanced Emergency Medical Technician (3.6%), Paramedic (59.8%), and additional protocols
for invasive skills/interventions/advanced life support procedures beyond Paramedic level services (1.6%) based
on the highest level of approved operational protocols (27.6% Not Reported) (Appendix I). Of these providers,
37.5% worked for a volunteer service, 24.7% worked for a mixed volunteer/paid service, and 31.6% worked for a
paid service (6.2% Not Reported).
A total of 17 air medical service providers, many of which have one or more satellite locations, currently serve
Ohio patients. There are 15 air medical services located in Ohio, one service in Indiana and, one service in
Pennsylvania. The system is comprised of 76 aircraft total, of which seven aircraft are fixed wing and 69 are rotor.
Some headquarter locations and each satellite location have at least one aircraft stationed at their facility. The
Ohio Department of Public Safety Division of EMS inspects and licenses all air medical aircraft on an annual basis.
Appendix J identifies the location of these aircraft.
There were a total of 1,662,185 EMS calls reported to the Ohio EMS Incident Reporting System (EMSIRS) in 2018.
Of those records, 235,758 were categorized as “injury.”
Trauma Services Of all injuries treated by an emergency facility, 67,542 records met the inclusion criteria for submission to the
OTR. The inclusion criteria can be found in the “Trauma Acute Care Registry Data Dictionary,” prepared by the
Ohio Department of Public Safety (http://www.publicsafety.ohio.gov/links/ems_OTR-TACR-Data-Dictionary-
2018.pdf). For additional reference and context of these data, the Ohio Department of Health Injury Related
Death Data, including a focus on the “External Injury Mechanism,” is included in this report (Appendix K).

6 2018 Ohio Trauma Annual Report
SECTION 2: RECORDS OF HOSPITAL PATIENT CONTACT
Figure 1. Total records submitted to the Ohio Trauma Registry by month of arrival, 2018
This figure displays the number of trauma records submitted to the OTR by month of patient arrival during
2018. A total of 67,542 records met the inclusion criteria based on date of arrival in 2018. An average of
5,629 records were received by the OTR each month.
Figure 2. Total records submitted to the Ohio Trauma Registry by hospital type, 2018
This figure shows the number of records that were submitted to the OTR by hospital type. One record was
removed because it was reported by an out of state hospital. The records most frequently came from Level I
Trauma Centers (31,263; 46.3%).
5,643
4,726 4,8615,412
6,3946,004
6,6226,203
5,513 5,761 5,5314,872
0
1,000
2,000
3,000
4,000
5,000
6,000
7,000
Nu
mb
er
of
Re
cord
s
Month
3.1%
21.4%
11.4%
17.8%
46.3%
0% 10% 20% 30% 40% 50% 60% 70% 80% 90% 100%
Freestanding Emergency Department (n = 2,096)
Acute Care Hospital (n = 14,461)
Level III Trauma Center (n = 7,691)
Level II Trauma Center (n = 12,030)
Level I Trauma Center (n = 31,263)

7 2018 Ohio Trauma Annual Report
Figure 3. Rate of injuries by county of injury, Ohio, 2018
This map displays the rate of injury per 100,000 population based on the county where the injury occurred.
The Ohio counties with the highest rates of injury per 100,000 residents in 2018 were Marion (946 per
100,000) and Ross (903 per 100,000) counties. The Ohio counties with the lowest rates of injury per 100,000
in 2018 were Lawrence (17 per 100,000) and Van Wert (21 per 100,000) counties. There were 4,343 records
where the county of injury was not valued. These records are not represented in this figure. Records where
the injury occurred outside of Ohio were also not included in the analysis for this figure.

8 2018 Ohio Trauma Annual Report
Table 1. Rates of injuries by county of injury, Ohio, 2018
This table displays the rate of injuries by the county where the injury occurred. Marion (945.5 per 100,000
residents) and Ross (903.4 per 100,000 residents) counties reported the highest rates of injuries. For this
table, records where the injuries occurred out of state were not included in the analysis.
County Count Population Rate per 100,000
County Count Population Rate per 100,000
Adams 116 27,724 418.4 Logan 266 45,358 586.4 Allen 172 102,663 167.5 Lorain 960 309,461 310.2
Ashland 169 53,745 314.4 Lucas 2,816 429,899 655.0 Ashtabula 253 97,493 259.5 Madison 266 44,143 602.6
Athens 516 65,818 784.0 Mahoning 1,038 229,642 452.0 Auglaize 135 45,804 294.7 Marion 617 65,256 945.5 Belmont 42 67,505 62.2 Medina 348 179,146 194.3 Brown 159 43,602 364.7 Meigs 139 23,106 601.6 Butler 1,720 382,378 449.8 Mercer 127 40,959 310.1 Carroll 93 27,081 343.4 Miami 646 106,222 608.2
Champaign 199 38,754 513.5 Monroe 27 13,790 195.8 Clark 1,027 134,585 763.1 Montgomery 3,751 532,331 704.6
Clermont 598 205,466 291.0 Morgan 120 14,604 821.7 Clinton 261 42,057 620.6 Morrow 161 35,112 458.5
Columbiana 250 102,665 243.5 Muskingum 773 86,183 896.9 Coshocton 247 36,629 674.3 Noble 59 14,354 411.0 Crawford 222 41,550 534.3 Ottawa 270 40,769 662.3 Cuyahoga 3,619 1,243,857 290.9 Paulding 14 18,760 74.6
Darke 281 51,323 547.5 Perry 240 36,033 666.1 Defiance 85 38,165 222.7 Pickaway 326 58,086 561.2 Delaware 802 204,826 391.6 Pike 246 28,067 876.5
Erie 379 74,615 507.9 Portage 801 162,927 491.6 Fairfield 811 155,782 520.6 Preble 196 40,997 478.1 Fayette 101 28,666 352.3 Putnam 58 33,780 171.7 Franklin 7,886 1,310,300 601.8 Richland 935 121,099 772.1 Fulton 286 42,276 676.5 Ross 695 76,931 903.4 Gallia 146 29,979 487.0 Sandusky 333 58,799 566.3
Geauga 401 94,031 426.5 Scioto 425 75,502 562.9 Greene 1,059 167,995 630.4 Seneca 232 55,207 420.2
Guernsey 206 39,022 527.9 Shelby 146 48,627 300.2 Hamilton 2,823 816,684 345.7 Stark 1,405 371,574 378.1 Hancock 90 75,930 118.5 Summit 2,033 541,918 375.1 Hardin 39 31,480 123.9 Trumbull 625 198,627 314.7
Harrison 28 15,174 184.5 Tuscarawas 340 92,176 368.9 Henry 172 27,086 635.0 Union 268 57,835 463.4
Highland 274 43,058 636.4 Van Wert 6 28,281 21.2 Hocking 211 28,385 743.4 Vinton 63 13,139 479.5 Holmes 53 43,892 120.8 Warren 963 232,173 414.8 Huron 161 58,504 275.2 Washington 292 60,155 485.4
Jackson 236 32,384 728.8 Wayne 202 115,967 174.2 Jefferson 62 65,767 94.3 Williams 47 36,804 127.7
Knox 353 61,893 570.3 Wood 660 130,696 505.0 Lake 510 230,514 221.2 Wyandot 75 21,935 341.9
Lawrence 10 59,866 16.7 Not Recorded 4,343 Licking 660 175,769 375.5 Out of Ohio --

9 2018 Ohio Trauma Annual Report
Figure 4. Rate of injuries resulting in death by county of injury, Ohio, 2018
This map displays the rate of injuries resulting in death per 100,000 population by the county where the injury
occurred. The Ohio counties with the highest number of injuries that resulted in death per 100,000 residents
in 2018 were Morgan (34 per 100,000) and Clark (26 per 100,000) counties. Belmont, Jefferson, Lawrence,
Paulding, and Van Wert counties had no injuries resulting in death in 2018. There are 67 records where the
county of injury was not valued. These records are not represented in this figure. Records where the injury
occurred outside of Ohio were also not included in this analysis for this figure.

10 2018 Ohio Trauma Annual Report
Table 2. Rates of injuries resulting in death by county of injury, Ohio, 2018
This table displays the rate of injuries resulting in death by the county where the injury occurred. Morgan
(34.2 per 100,000 residents) and Clark (26.0 per 100,000 residents) counties reported the highest rates of
injuries resulting in deaths in 2018. For this table, records where the injuries occurred out of state were
not included in the analysis.
County Number of
Fatal Injuries Population
Rate per 100,000
County Number of
Fatal Injuries Population
Rate per 100,000
Adams 4 27,724 14.4 Logan 9 45,358 19.8 Allen 7 102,663 6.8 Lorain 19 309,461 6.1
Ashland 2 53,745 3.7 Lucas 84 429,899 19.5 Ashtabula 10 97,493 10.3 Madison 7 44,143 15.9
Athens 9 65,818 13.7 Mahoning 39 229,642 17.0 Auglaize 4 45,804 8.7 Marion 10 65,256 15.3 Belmont 0 67,505 0.0 Medina 4 179,146 2.2 Brown 3 43,602 6.9 Meigs 3 23,106 13.0 Butler 43 382,378 11.2 Mercer 3 40,959 7.3 Carroll 1 27,081 3.7 Miami 5 106,222 4.7
Champaign 3 38,754 7.7 Monroe 1 13,790 7.3 Clark 35 134,585 26.0 Montgomery 98 532,331 18.4
Clermont 20 205,466 9.7 Morgan 5 14,604 34.2 Clinton 2 42,057 4.8 Morrow 6 35,112 17.1
Columbiana 5 102,665 4.9 Muskingum 20 86,183 23.2 Coshocton 2 36,629 5.5 Noble 2 14,354 13.9 Crawford 4 41,550 9.6 Ottawa 8 40,769 19.6 Cuyahoga 133 1,243,857 10.7 Paulding 0 18,760 0.0
Darke 1 51,323 1.9 Perry 5 36,033 13.9 Defiance 2 38,165 5.2 Pickaway 14 58,086 24.1 Delaware 19 204,826 9.3 Pike 3 28,067 10.7
Erie 11 74,615 14.7 Portage 21 162,927 12.9 Fairfield 20 155,782 12.8 Preble 2 40,997 4.9 Fayette 4 28,666 14.0 Putnam 3 33,780 8.9 Franklin 222 1,310,300 16.9 Richland 16 121,099 13.2
Fulton 10 42,276 23.7 Ross 19 76,931 24.7
Gallia 2 29,979 6.7 Sandusky 7 58,799 11.9 Geauga 10 94,031 10.6 Scioto 11 75,502 14.6 Greene 10 167,995 6.0 Seneca 3 55,207 5.4
Guernsey 10 39,022 25.6 Shelby 2 48,627 4.1
Hamilton 129 816,684 15.8 Stark 47 371,574 12.6
Hancock 4 75,930 5.3 Summit 73 541,918 13.5 Hardin 1 31,480 3.2 Trumbull 18 198,627 9.1
Harrison 2 15,174 13.2 Tuscarawas 6 92,176 6.5 Henry 1 27,086 3.7 Union 6 57,835 10.4
Highland 1 43,058 2.3 Van Wert 0 28,281 0.0 Hocking 5 28,385 17.6 Vinton 2 13,139 15.2 Holmes 1 43,892 2.3 Warren 18 232,173 7.8 Huron 4 58,504 6.8 Washington 3 60,155 5.0
Jackson 6 32,384 18.5 Wayne 6 115,967 5.2 Jefferson 0 65,767 0.0 Williams 2 36,804 5.4
Knox 9 61,893 14.5 Wood 15 130,696 11.5 Lake 11 230,514 4.8 Wyandot 4 21,935 18.2
Lawrence 0 59,866 0.0 Not Recorded 67 Licking 18 175,769 10.2 Out of Ohio --
11 2018 Ohio Trauma Annual Report
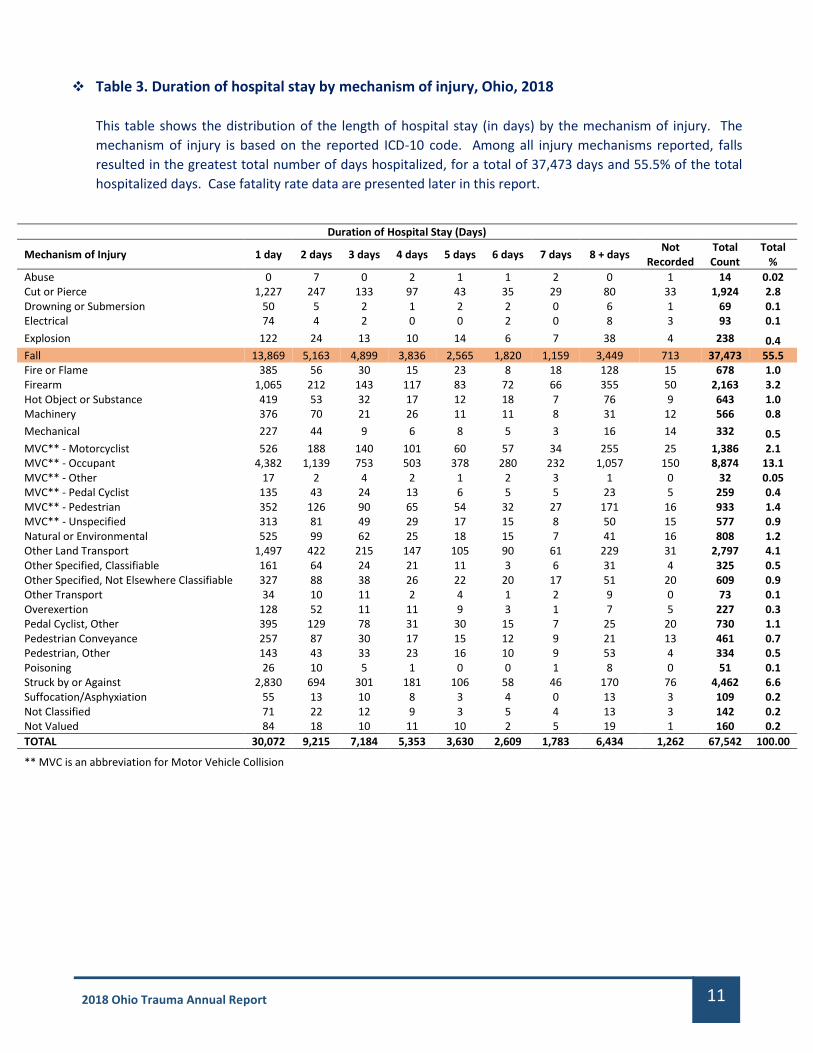
Table 3. Duration of hospital stay by mechanism of injury, Ohio, 2018
This table shows the distribution of the length of hospital stay (in days) by the mechanism of injury. The
mechanism of injury is based on the reported ICD-10 code. Among all injury mechanisms reported, falls
resulted in the greatest total number of days hospitalized, for a total of 37,473 days and 55.5% of the total
hospitalized days. Case fatality rate data are presented later in this report.
Duration of Hospital Stay (Days)
Mechanism of Injury 1 day 2 days 3 days 4 days 5 days 6 days 7 days 8 + days Not
Recorded Total Count
Total %
Abuse 0 7 0 2 1 1 2 0 1 14 0.02 Cut or Pierce 1,227 247 133 97 43 35 29 80 33 1,924 2.8 Drowning or Submersion 50 5 2 1 2 2 0 6 1 69 0.1 Electrical 74 4 2 0 0 2 0 8 3 93 0.1
Explosion 122 24 13 10 14 6 7 38 4 238 0.4 Fall 13,869 5,163 4,899 3,836 2,565 1,820 1,159 3,449 713 37,473 55.5 Fire or Flame 385 56 30 15 23 8 18 128 15 678 1.0 Firearm 1,065 212 143 117 83 72 66 355 50 2,163 3.2 Hot Object or Substance 419 53 32 17 12 18 7 76 9 643 1.0 Machinery 376 70 21 26 11 11 8 31 12 566 0.8
Mechanical 227 44 9 6 8 5 3 16 14 332 0.5 MVC** - Motorcyclist 526 188 140 101 60 57 34 255 25 1,386 2.1 MVC** - Occupant 4,382 1,139 753 503 378 280 232 1,057 150 8,874 13.1 MVC** - Other 17 2 4 2 1 2 3 1 0 32 0.05 MVC** - Pedal Cyclist 135 43 24 13 6 5 5 23 5 259 0.4 MVC** - Pedestrian 352 126 90 65 54 32 27 171 16 933 1.4 MVC** - Unspecified 313 81 49 29 17 15 8 50 15 577 0.9 Natural or Environmental 525 99 62 25 18 15 7 41 16 808 1.2 Other Land Transport 1,497 422 215 147 105 90 61 229 31 2,797 4.1 Other Specified, Classifiable 161 64 24 21 11 3 6 31 4 325 0.5 Other Specified, Not Elsewhere Classifiable 327 88 38 26 22 20 17 51 20 609 0.9 Other Transport 34 10 11 2 4 1 2 9 0 73 0.1 Overexertion 128 52 11 11 9 3 1 7 5 227 0.3 Pedal Cyclist, Other 395 129 78 31 30 15 7 25 20 730 1.1 Pedestrian Conveyance 257 87 30 17 15 12 9 21 13 461 0.7 Pedestrian, Other 143 43 33 23 16 10 9 53 4 334 0.5 Poisoning 26 10 5 1 0 0 1 8 0 51 0.1 Struck by or Against 2,830 694 301 181 106 58 46 170 76 4,462 6.6 Suffocation/Asphyxiation 55 13 10 8 3 4 0 13 3 109 0.2 Not Classified 71 22 12 9 3 5 4 13 3 142 0.2 Not Valued 84 18 10 11 10 2 5 19 1 160 0.2
TOTAL 30,072 9,215 7,184 5,353 3,630 2,609 1,783 6,434 1,262 67,542 100.00
** MVC is an abbreviation for Motor Vehicle Collision

12 2018 Ohio Trauma Annual Report
Figure 5. Duration of hospital stay by Injury Severity Score (ISS), Ohio, 2018
The Injury Severity Score (ISS) is an assessment of the patient’s injury severity. ISS scores range from 0 to 75,
where a higher ISS score indicates a more severe injury. This graph displays the duration of hospital stays (in
days) based on the ISS. A description on how the ISS is calculated is located in the Glossary.
Table 4. Duration of hospital stay by Injury Severity Score (ISS), Ohio, 2018
Persons with an ISS score between 01 and 09 were more likely to spend one day at the hospital following
injury compared to other hospital stay durations. Persons with an ISS score of 25+ were most likely to spend
eight days or more at the hospital following injury compared to other hospital stay durations. Case fatality
rate data are presented later in this report.
Injury Severity Score (ISS)
Hospital Days 01 - 09 10 - 14 15 - 24 25 + Not Calculable Total
1 24,495 3,161 1,376 670 377 30,079
2 6,985 1,480 573 145 25 9,208
3 5,063 1,411 568 126 18 7,186
4 3,614 1,117 482 124 15 5,352
5 2,320 735 442 127 6 3,630
6 1,584 569 341 114 2 2,610
7 1,018 391 272 94 6 1,781
8+ 2,761 1,325 1,436 906 7 6,435
Not Recorded 1,005 126 83 40 7 1,261
Total 48,845 10,315 5,573 2,346 463 67,542
0
5,000
10,000
15,000
20,000
25,000
30,000
1 2 3 4 5 6 7 8+ NotRecorded
Nu
mb
er
of
Re
cord
s
Number of Hospital Days
01 - 09 10 - 14 15 - 24 25 + Not Calculable

13 2018 Ohio Trauma Annual Report
Table 5. Number of transfers out of emergency departments by hospital type, Ohio, 2018
This table looks at the number of instances where a patient was transferred out of a hospital based on the
hospital type. This report looks at five different hospital types: Level I, II, and III Trauma Centers, freestanding
emergency departments, and acute care hospitals.
The majority (62.1%) of transfers out of the hospital were by acute care hospitals. Among the trauma centers,
most (2,004) of the transfers out came from Level III Trauma Centers.
Hospital Type Transfers
# %
Level I Trauma Center 204 1.6
Level II Trauma Center 518 4.1
Level III Trauma Center 2,004 15.9
Free Standing Emergency Department 2,036 16.2
Acute Care Hospital 7,811 62.1
Total 12,573 100.0
Table 5a. Destinations of emergency department transfers out of Level I Trauma Centers, Ohio,
2018
Though comprising the smallest percentage, there are a small number of transfers from emergency
departments that come from Level I Trauma Centers. The table below identifies the destination by hospital
type for these transfers.
Of the 204 emergency department transfers that came from Level I Trauma Centers most frequently went to
either Pediatric Facilities (71, 34.8%) or other Level I Trauma Centers (71, 34.8%). Pediatric facilities include
pediatric Level I and II Trauma Centers and acute care hospitals.
Hospital Type Transfers
# %
Pediatric Facility 71 34.8 Level I Trauma Center 71 34.8 Level II Trauma Center 7 3.4 Level III Trauma Center 4 2.0 Freestanding Emergency Department 0 0.0 Acute Care Hospital 15 7.4 Out of State 34 16.7 Other 2 1.0
Total 204 100.0

14 2018 Ohio Trauma Annual Report
Table 5b. Destinations of emergency department transfers out of acute care hospitals, Ohio, 2018
The majority of emergency department transfers came from acute care hospitals. The table below identifies
the destination by hospital type for these transfers.
Emergency department transfers that come from acute care hospitals most frequently (4,726; 60.5%) go to
other Level I Trauma Centers. Pediatric facilities include pediatric Level I and II Trauma Centers and pediatric
acute care hospitals.
Hospital Type Transfers
# %
Level I Trauma Center 4,726 60.5 Level II Trauma Center 1,299 16.6 Level III Trauma Center 181 2.3 Pediatric Facility 886 11.3 Acute Care Hospital 452 5.8 Out of State 244 3.1 Other 23 0.3
Total 7,811 100.0

15 2018 Ohio Trauma Annual Report
SECTION 3: PATIENT CHARACTERISTICS
Figure 6. Demographics by sex and age group, Ohio, 2018
This graph, along with Table 4 below, looks at the demographics of the records submitted to the trauma
registry by sex and age group. From birth to age 64, males outnumbered females in each age group. Females
accounted for a larger number of records compared to males from age 65 and older.
Table 6. Demographics by sex and age group, Ohio, 2018
The most common age group among males was 55 – 64. The most common age group among females was ≥
85.
Age (Years) Male Female Not Valued Total
# % # % # % # %
0 - 4 1,601 4.4 1,052 3.5 13 2.3 2,666 4.0 5-9 1,115 3.1 902 3.0 18 3.2 2,035 3.0 10-14 1,361 3.7 634 2.1 7 1.2 2,002 3.0 15 - 19 2,068 5.7 957 3.1 11 2.0 3,036 4.5 20 - 24 2,259 6.2 1,020 3.3 43 7.7 3,322 4.9 25 - 34 4,603 12.6 1,962 6.4 66 11.7 6,631 9.8 35 - 44 3,803 10.4 1,759 5.8 45 8.0 5,607 8.3 45 - 54 4,201 11.5 2,168 7.1 47 8.4 6,416 9.5 55 - 64 5,168 14.2 3,679 12.1 79 14.1 8,926 13.2 65 - 74 4,065 11.1 4,706 15.4 97 17.3 8,868 13.1 75 - 84 3,593 9.8 5,734 18.8 72 12.8 9,399 13.9 85 and over 2,669 7.3 5,900 19.4 64 11.4 8,633 12.8 Not Valued 1 0.0 0 0.0 0 0.0 1 0.0
Total 36,507 100.0 30,473 100.0 562 100.0 67,542 100.0
0
1,000
2,000
3,000
4,000
5,000
6,000
7,000
0 - 4 5-9 10 - 14 15 - 19 20 - 24 25 - 34 35 - 44 45 - 54 55 - 64 65 - 74 75 - 84 85+ NotValued
Nu
mb
er
of
Re
cord
s
Age (Years)
Male Female Not Valued

16 2018 Ohio Trauma Annual Report
Figure 7. Demographics by patient type and sex, Ohio, 2018
This analysis defines pediatric patients as those between the ages of 0 to 15 years, adult patients as those
between the ages of 16 to 69 years, and geriatric patients as those ages 70 and older.
The graph below shows the number of records based on type of patient (i.e. pediatric, adult, or geriatric) and
patient sex. Records where age was not valued (and therefore patient type could not be calculated) were not
included in this analysis.
Table 7. Demographics by patient type and sex, Ohio, 2018
The table below shows the number of patients based on type of patient (i.e. pediatric, adult, or geriatric) and
patient sex. There was one record where age was not valued and patient type could not be determined. This
record was not included in the table.
The majority of pediatric (61.6%) and adult (63.1%) records involved males. The majority (62.9%) of geriatric
records involved females.
Type of Patient
Sex Pediatric Adult Geriatric Total
# % # % # % # %
Male 4,425 61.6 23,929 63.1 8,152 36.4 36,506 54.1
Female 2,713 37.8 13,665 36.0 14,095 62.9 30,473 45.1
Not Valued 40 0.6 344 0.9 178 0.8 562 0.8
Total 7,178 100.0 37,938 100.0 22,425 100.0 67,541 100.0
4,425
23,929
8,152
2,713
13,665 14,095
40 344 1780
5,000
10,000
15,000
20,000
25,000
30,000
Pediatric Adult Geriatric
Nu
mb
er
of
Re
cord
s
Type of Patient
Male Female Not Valued

17 2018 Ohio Trauma Annual Report
SECTION 4: INJURY CHARACTERISTICS
Figure 8. Types of injuries, Ohio, 2018
This graph shows the types of injuries sustained in 2018. The type of injury is based on the reported ICD-10
code. Blunt injuries were the most common injury type identified, comprising 88.2% of the reported injuries.
Table 8. Types of injuries, Ohio, 2018
This table shows the types of injuries sustained by the patient in 2018. The most common type of injury was
blunt (88.2%), followed by penetrating (6.8%).
Type of Injury Injuries
# %
Blunt 59,556 88.2 Penetrating 4,586 6.8 Burn 1,348 2.0 Drowning or Suffocation 217 0.3 Explosion 185 0.3 Electrocution 94 0.1 Other/Unspecified/Not Classified 1,396 2.1
Not Classified/Reported 160 0.2
Total 67,542 100.0
88.2%
6.8% 2.0% 0.3% 0.3% 0.1% 2.1% 0.2%0%
10%20%30%40%50%60%70%80%90%
100%
Pe
rce
nta
ge
Type of Injury

18 2018 Ohio Trauma Annual Report
Table 9. Intent of injury, Ohio, 2018
This table shows the intent of the injury sustained in 2018. The categories of intent of injury were based on
the reported ICD-10 code. The majority (90.2%) of the injuries were unintentional.
Intent of Injury Injuries
# %
Unintentional 60,920 90.2 Self-inflicted 846 1.3 Assault 5,257 7.8 Undetermined 298 0.4 Other 59 0.1 Not Valued 162 0.2
Total 67,542 100.0
Table 10. Intent of injury by patient type, Ohio, 2018
This table shows the intent of injury sustained by patient type (i.e. pediatric, adult, geriatric). This analysis
defines pediatric patients as being between the ages of 0 and 15 years, adult patients as being between the
ages of 16 and 69 years, and geriatric patients as being ages 70 and older. There was one record where age
was not valued and patient type could not be calculated. This record was not included in the table.
Across all patient types, the majority (Pediatric: 92.5%; Adult: 84.5%; Geriatric: 99.2%; Overall: 90.2%) of the
injuries were unintentional.
Patient Type
Intent of Injury Pediatric Adult Geriatric Total
# % # % # % # %
Unintentional 6,641 92.5 32,040 84.5 22,239 99.2 60,920 90.2
Self-inflicted 50 0.7 766 2.0 30 0.1 846 1.3
Assault 375 5.2 4,780 12.6 101 0.5 5,256 7.8
Undetermined 81 1.1 205 0.5 12 0.1 298 0.4
Other 1 0.0 54 0.1 4 0.0 59 0.1
Not Valued 30 0.4 93 0.2 39 0.2 162 0.2
Total 7,178 100.0 37,938 100.0 22,425 100.0 67,541 100.0

19 2018 Ohio Trauma Annual Report
Table 11. Intent of injury by region, Ohio, 2018
This table shows the intent of the injuries sustained in 2018 based on region where the injury occurred.
Regions were based on the eight out-of-hospital emergency medical services regions that the State Board of
Emergency Medical, Fire, and Transportation Services geographically divided the state for purposes of
overseeing the delivery of adult and pediatric out-of-hospital emergency medical services. A state map of
these eight existing Homeland Security regions is located in Appendix L. For this table, records where the
injuries occurred out of state were not included in the analysis.
Across all regions, the majority (92.5% in Region 1; 89.3% in Region 2; 92.0% in Region 3; 88.2% in Region 4;
92.5% in Region 5; 90.3% in Region 6; 90.0% in Region 7; 92.3% in Region 8) of the injuries were unintentional.
Intent Region 1 Region 2 Region 3 Region 4 Region 5
# % # % # % # % # %
Unintentional 5,589 92.5 5,127 89.3 6,722 92.0 11,334 88.2 7,667 92.5
Self-Inflicted 89 1.5 77 1.3 49 0.7 171 1.3 137 1.7
Assault 336 5.6 478 8.3 444 6.1 1,270 9.9 448 5.4
Undetermined 22 0.4 27 0.5 70 1.0 46 0.4 16 0.2
Other 3 0.0 5 0.1 6 0.1 21 0.2 3 0.0
Not Valued 4 0.1 29 0.5 14 0.2 11 0.1 21 0.3
Total 6,043 100.0 5,743 100.0 7,305 100.0 12,853 100.0 8,292 100.0
Intent Region 6 Region 7 Region 8 Not Valued Total
# % # % # % # % # %
Unintentional 6,242 90.3 2,633 90.0 1,714 92.3 3,862 88.9 50,890 90.4
Self-Inflicted 111 1.6 46 1.6 33 1.8 42 1.0 755 1.3
Assault 521 7.5 211 7.2 99 5.3 392 9.0 4,199 7.5
Undetermined 28 0.4 14 0.5 7 0.4 27 0.6 257 0.5
Other 5 0.1 2 0.1 0 0.0 5 0.1 50 0.1
Not Valued 7 0.1 21 0.7 3 0.2 15 0.3 125 0.2
Total 6,914 100.0 2,927 100.0 1,856 100.0 4,343 100.0 56,276 100.0

20 2018 Ohio Trauma Annual Report
Table 12. Rates of injury intent by region of injury, Ohio, 2018
This table displays the rates of different intents of injury per 100,000 population by the region where the
injury occurred. A state map of these regions is located in Appendix L. For this table, records where the
injuries occurred out of state were not included in the analysis. Records where the county of injury was not
valued (and so a region of injury could not be determined) were not included in this analysis.
Across all regions, the highest rates of injury intent were for unintentional injuries. The highest rate of
unintentional injury was in Region 3, whereas the highest rate of injury by assault was in Region 4.
Region Unintentional Self-Inflicted Assault Undetermined
Number of Injuries
Rate per 100,000
Number of Injuries
Rate per 100,000
Number of Injuries
Rate per 100,000
Number of Injuries
Rate per 100,000
Region 1 5,589 417.4 89 6.6 336 25.1 22 1.6
Region 2 5,127 259.5 77 3.9 478 24.2 27 1.4
Region 3 6,722 599.7 49 4.4 444 39.6 70 6.2
Region 4 11,334 484.8 171 7.3 1,270 54.3 46 2.0
Region 5 7,667 342.2 137 6.1 448 20.0 16 0.7
Region 6 6,242 348.1 111 6.2 521 29.1 28 1.6
Region 7 2,633 561.2 46 9.8 211 45.0 14 3.0
Region 8 1,714 414.8 33 8.0 99 24.0 7 1.7
Total 47,028 402.3 713 6.1 3,807 32.6 230 2.0
Region Other Not Valued Total
Number of Injuries
Rate per 100,000
Number of Injuries
Rate per 100,000
Number of Injuries
Rate per 100,000
Region 1 3 0.2 4 0.3 6,043 451.3
Region 2 5 0.3 29 1.5 5,743 290.7
Region 3 6 0.5 14 1.2 7,305 651.7
Region 4 21 0.9 11 0.5 12,853 549.7
Region 5 3 0.1 21 0.9 8,292 370.1
Region 6 5 0.3 7 0.4 6,914 385.6
Region 7 2 0.4 21 4.5 2,927 623.8
Region 8 0 0.0 3 0.7 1,856 449.2
Total 45 0.4 110 0.9 51,933 444.3

21 2018 Ohio Trauma Annual Report
Table 13. Intent of injury by urban and rural areas, Ohio, 2018
This table shows the intent of injuries sustained in 2018 by urban and rural areas. For this table, records where
the injuries occurred out of state were not included in the analysis. Counties in Ohio were assigned an urban
or rural classification based on the 2013 National Center for Health Statistics Urban-Rural Classification
Scheme for Counties (Appendix M). In 2018, across all intents, more injuries occurred in urban areas
compared to rural areas.
Intent Rural Urban Not Valued Total
# % # % # % # %
Unintentional 9,968 92.8 37,060 90.0 3,862 88.9 50,890 90.9 Self-Inflicted 149 1.4 564 1.4 42 1.0 755 1.3 Assault 545 5.1 3,262 7.9 392 9.0 4,199 7.5 Undetermined 36 0.3 194 0.5 27 0.6 257 0.5 Other 6 0.1 39 0.1 5 0.1 50 0.1 Not Valued 36 0.3 74 0.2 15 0.3 125 0.2
Total 10,740 100.0 41,193 100.0 4,343 100.0 56,276 100.5
Figure 9. Gunshot wounds by age group, Ohio, 2018
This graph shows the distribution of gunshot wounds in Ohio by age group. In 2018, gunshot wounds occurred
most frequently among persons 25 – 34 years of age. Air guns were included in the ICD-10 codes that defined
gunshot wounds for this analysis.
13 1349
329
440
656
313
163108
5420 1 4
0
100
200
300
400
500
600
700
Nu
mb
er
of
Gu
nsh
ot
Wo
un
ds
Age (years)

22 2018 Ohio Trauma Annual Report
Table 14. Gunshot wounds by region, Ohio, 2018
This table shows the distribution of gunshot wounds in Ohio by region where the injury occurred. A state map
of these regions is located in Appendix L. For this table, records where the injuries occurred out of state were
not included in the analysis. Gunshot wounds occurred most frequently in Region 4 (365; 21.2%).
Region 1 Region 2 Region 3 Region 4 Region 5
# % # % # % # % # %
Number of Gunshot Wounds
145 8.4 275 16.0 170 9.9 365 21.2 214 12.5
Region 6 Region 7 Region 8 Not Valued Total
# % # % # % # % # %
Number of Gunshot Wounds
292 17.0 44 2.6 31 1.8 182 10.6 1,718 100.0

23 2018 Ohio Trauma Annual Report
Table 15. Rate of gunshot wounds by county of injury, Ohio, 2018
County Number of
gunshot wounds Population
Rate per 100,000
County Number of
gunshot wounds Population
Rate per 100,000
Adams 2 27,724 7.2 Logan 3 45,358 6.6 Allen 6 102,663 5.8 Lorain 43 309,461 13.9
Ashland 2 53,745 3.7 Lucas 91 429,899 21.2 Ashtabula 6 97,493 6.2 Madison 7 44,143 15.9
Athens 6 65,818 9.1 Mahoning 35 229,642 15.2 Auglaize 3 45,804 6.5 Marion 16 65,256 24.5
Belmont 2 67,505 3.0 Medina 3 179,146 1.7
Brown 1 43,602 2.3 Meigs 3 23,106 13.0 Butler 53 382,378 13.9 Mercer 0 40,959 0.0 Carroll 0 27,081 0.0 Miami 1 106,222 0.9
Champaign 0 38,754 0.0 Monroe 0 13,790 0.0 Clark 43 134,585 32.0 Montgomery 113 532,331 21.2
Clermont 10 205,466 4.9 Morgan 0 14,604 0.0 Clinton 4 42,057 9.5 Morrow 2 35,112 5.7
Columbiana 3 102,665 2.9 Muskingum 10 86,183 11.6 Coshocton 6 36,629 16.4 Noble 2 14,354 13.9 Crawford 0 41,550 0.0 Ottawa 3 40,769 7.4 Cuyahoga 216 1,243,857 17.4 Paulding 0 18,760 0.0
Darke 1 51,323 1.9 Perry 3 36,033 8.3 Defiance 1 38,165 2.6 Pickaway 5 58,086 8.6 Delaware 7 204,826 3.4 Pike 3 28,067 10.7
Erie 27 74,615 36.2 Portage 10 162,927 6.1 Fairfield 12 155,782 7.7 Preble 1 40,997 2.4 Fayette 2 28,666 7.0 Putnam 0 33,780 0.0 Franklin 301 1,310,300 23.0 Richland 21 121,099 17.3 Fulton 1 42,276 2.4 Ross 10 76,931 13.0 Gallia 4 29,979 13.3 Sandusky 4 58,799 6.8
Geauga 3 94,031 3.2 Scioto 4 75,502 5.3 Greene 9 167,995 5.4 Seneca 1 55,207 1.8
Guernsey 6 39,022 15.4 Shelby 2 48,627 4.1
Hamilton 214 816,684 26.2 Stark 47 371,574 12.6 Hancock 0 75,930 0.0 Summit 80 541,918 14.8 Hardin 0 31,480 0.0 Trumbull 8 198,627 4.0
Harrison 0 15,174 0.0 Tuscarawas 3 92,176 3.3 Henry 1 27,086 3.7 Union 0 57,835 0.0
Highland 5 43,058 11.6 Van Wert 0 28,281 0.0 Hocking 5 28,385 17.6 Vinton 0 13,139 0.0 Holmes 0 43,892 0.0 Warren 4 232,173 1.7 Huron 2 58,504 3.4 Washington 1 60,155 1.7
Jackson 6 32,384 18.5 Wayne 2 115,967 1.7 Jefferson 4 65,767 6.1 Williams 1 36,804 2.7
Knox 3 61,893 4.8 Wood 4 130,696 3.1 Lake 7 230,514 3.0 Wyandot 0 21,935 0.0
Lawrence 0 59,866 0.0 Not Valued 182 Licking 7 175,769 4.0 Out of Ohio --
This table displays the rate of gunshot wounds by the county where the injury occurred. For this table, records
where the injuries occurred out of state were not included in the analysis. Erie County (with 36.2 per 100,000
population) and Clark County (with 32.0 per 100,000 population) reported the highest rates of gunshot wounds
during this reporting period. Among the injuries with identified counties, the statewide rate of fatal gunshot

24 2018 Ohio Trauma Annual Report
wounds was 13.1 per 100,000 residents. Gunshot wounds were most commonly reported within the 25 – 34 age
group.
The national average rate of fatal firearm injuries from CY 2010 – 2012 was 10.23 per 100,000, and the average
rate of non-fatal firearm injuries was 21.6 per 100,000. 1 Nationally from CY 2010 – 2012, fatal firearm injuries
were most commonly reported within the 25 – 34 age group, while those ages 15 – 24 were the most common
age group in which non-fatal firearm injuries occurred. 1
Source: 1“Firearm Injuries in the United States”; Fowler, Dahlberg, Haileyesus & Annest, ePub.2015.
https://www.ncbi.nlm.nih.gov/pubmed/26116133.

25 2018 Ohio Trauma Annual Report
SECTION 5: OUTCOME MEASURES
Outcome measures as defined by the World Health Organization are the “change in the health of an individual,
group of people, or population that is attributable to an intervention or series of interventions.” For the purposes
of this report, outcome measures include but are not limited to a patient’s initial disposition on arrival, transfer
between different level facilities, final discharge disposition, and mortality.
Table 16. Emergency department disposition of trauma cases, Ohio, 2018
This table shows the disposition of patients after arriving at the emergency department. The most frequent
ED disposition was admitted to floor (39.0%).
Emergency Department Disposition Patients
# %
Floor 26,317 39.0 Transferred To Another Hospital 12,573 18.6 Intensive Care Unit (ICU) 8,582 12.7 Telemetry/Step-Down Unit 6,347 9.4 Operating Room 3,996 5.9 Observation Unit 3,951 5.8 Home without Services 3,009 4.5 Morgue 502 0.7 Left Against Medical Advice 137 0.2 Other (Out of Hospital) 143 0.2 Home with Services 7 0.0 Direct Admissions to Hospital 1,978 2.9
Total 67,542 100.0

26 2018 Ohio Trauma Annual Report
Table 17. Emergency department disposition of trauma cases by region, Ohio, 2018
This table shows the disposition of patients after arriving at the emergency department by the region where
the injury occurred. A state map of these regions is located in Appendix L. For this table, records where the
injuries occurred out of state were not included in the analysis.
Emergency Department Disposition Region 1 Region 2 Region 3 Region 4 Region 5
# % # % # % # % # %
Floor 2,084 34.5 2,527 44.0 2,463 33.7 4,661 36.3 3,310 39.9 Transferred To Another Hospital 1,155 19.1 903 15.7 1,758 24.1 2,427 18.9 1,278 15.4 Intensive Care Unit (ICU) 830 13.7 1,043 18.2 860 11.8 1,261 9.8 1,197 14.4 Telemetry/Step-Down Unit 1,009 16.7 95 1.7 1,113 15.2 1,490 11.6 901 10.9 Operating Room 209 3.5 440 7.7 322 4.4 724 5.6 457 5.5 Observation Unit 374 6.2 16 0.3 244 3.3 1,728 13.4 381 4.6 Home without Services 179 3.0 481 8.4 192 2.6 265 2.1 350 4.2 Morgue 39 0.6 65 1.1 44 0.6 112 0.9 63 0.8 Left Against Medical Advice 10 0.2 14 0.2 2 0.03 17 0.1 28 0.3 Other (Out of Hospital) 15 0.2 12 0.2 3 0.04 5 0.04 20 0.2 Home with Services 0 0.0 1 0.0 0 0.0 1 0.01 1 0.01 Direct Admissions to Hospital Upon Arrival
139 2.3
146 2.5
304 4.2
162 1.3
306 3.7
Total 6,043 100.0 5,743 100.0 7,305 100.0 12,853 100.0 8,292 100.0
Emergency Department Disposition Region 6 Region 7 Region 8 Not Valued Total
# % # % # % # % # %
Floor 3,475 50.3 588 20.1 703 37.9 1,634 37.7 21,445 38.3 Transferred To Another Hospital 1,173 17.0 1,025 35.0 568 30.6 895 20.7 11,182 20.0 Intensive Care Unit (ICU) 886 12.8 236 8.1 147 7.9 583 13.5 7,043 12.6 Telemetry/Step-Down Unit 189 2.7 302 10.3 140 7.5 275 6.4 5,514 9.8 Operating Room 498 7.2 129 4.4 97 5.2 257 5.9 3,133 5.6 Observation Unit 87 1.3 373 12.7 86 4.6 83 1.9 3,372 6.0 Home without Services 318 4.6 140 4.8 34 1.8 359 8.3 2,318 4.1 Morgue 60 0.9 14 0.5 10 0.5 17 0.4 424 0.8 Left Against Medical Advice 10 0.1 18 0.6 0 0.0 13 0.3 112 0.2 Other (Out of Hospital) 21 0.3 41 1.4 0 0.0 11 0.3 128 0.2 Home with Services 1 0.0 2 0.1 0 0.0 0 0.0 6 0.01 Direct Admissions to Hospital Upon Arrival
196 2.8
59 2.0
71 3.8
216 5.0
1,599 2.9
Total 6,914 100.0 2,927 100.0 1,856 100.0 4,343 100.3 56,276 100.5

27 2018 Ohio Trauma Annual Report
Table 18. Hospital inpatient discharge disposition, Ohio, 2018
This table shows the disposition of patients at the time of their discharge. The most common hospital
discharge disposition was going home without services (40.7%).
Discharge Disposition Patients
# %
Home without Services 27,474 40.7 Skilled Nursing Facility 4,559 6.7 Home with Services 552 0.8 Inpatient Rehab or Designated Unit 236 0.3 Expired 1,269 1.9 Left Against Medical Advice or Discontinued Care 543 0.8 Hospice 65 0.1 Transferred to Another Hospital 11416 16.9 Long Term Care Hospital (LTCH) 3611 5.3 Psychiatric Hospital or Psychiatric Distinct Part of a Hospital
469 0.7
Court/Law Enforcement 546 0.8 Intermediate Care Facility 379 0.6 Another Type of Inpatient Facility Not Defined Elsewhere 50 0.1 Discharged from Emergency Department After Arrival 16,371 24.2 Not Valued 2 0.003
Total 67,542 100.0

28 2018 Ohio Trauma Annual Report
Table 19. Hospital inpatient discharge disposition by region, Ohio, 2018
This table looks at the disposition of patients at the time of their discharge by the region where the injury occurred.
A state map of these regions is located in Appendix L. For this table, records where the injuries occurred out of
state were not included in the analysis.
Discharge Disposition Region 1 Region 2 Region 3 Region 4 Region 5
# % # % # % # % # %
Home or Self Care (Routine Discharge) 2,267 37.5 2,022 35.2 2,704 37.0 5,844 45.5 3,339 40.3 Skilled Nursing Facility 1,201 19.9 1,111 19.3 1,389 19.0 1,873 14.6 1,651 19.9 Home with Services 396 6.6 409 7.1 527 7.2 1,090 8.5 326 3.9 Inpatient Rehab or Designated Unit 301 5.0 386 6.7 333 4.6 442 3.4 653 7.9 Expired 126 2.1 121 2.1 113 1.5 245 1.9 180 2.2 Left Against Medical Advice or Discontinued Care
43 0.7 22 0.4 48 0.7 174 1.4 57 0.7
Hospice 49 0.8 50 0.9 58 0.8 87 0.7 91 1.1 Transferred to Another Hospital 64 1.1 68 1.2 54 0.7 45 0.4 94 1.1 Long Term Care Hospital (LTCH) 122 2.0 20 0.3 29 0.4 57 0.4 65 0.8 Psychiatric Hospital or Psychiatric Distinct Part of a Hospital
41 0.7 25 0.4 23 0.3 72 0.6 72 0.9
Court/Law Enforcement 9 0.1 16 0.3 19 0.3 87 0.7 9 0.1 Intermediate Care Facility 8 0.1 10 0.2 2 0.03 5 0.04 13 0.2 Another Type of Inpatient Facility Not Defined Elsewhere
17 0.3 7 0.1 6 0.1 5 0.04 2 0.02
Discharged from Emergency Department After Arrival/Not Valued
1,399 23.2 1,476 25.7 2,000 27.4 2,827 22.0 1,740 21.0
Total 6,043 100.0 5,743 100.0 7,305 100.0 12,853 100.0 8,292 100.0
Discharge Disposition Region 6 Region 7 Region 8 Not Valued Total
# % # % # % # % # %
Home or Self Care (Routine Discharge) 2,098 30.3 982 33.5 633 34.1 1,940 44.8 21,829 38.8 Skilled Nursing Facility 1,554 22.5 305 10.4 323 17.4 437 10.1 9,844 17.5 Home with Services 651 9.4 179 6.1 120 6.5 217 5.0 3,915 7.0 Inpatient Rehab or Designated Unit 519 7.5 72 2.5 55 3.0 248 5.7 3,009 5.3 Expired 163 2.4 50 1.7 35 1.9 54 1.2 1,087 1.9 Left Against Medical Advice or Discontinued Care
42 0.6 28 1.0 9 0.5 33 0.8 456 0.8
Hospice 93 1.3 22 0.8 15 0.8 17 0.4 482 0.9 Transferred to Another Hospital 58 0.8 22 0.8 27 1.5 33 0.8 465 0.8 Long Term Care Hospital (LTCH) 60 0.9 8 0.3 8 0.4 29 0.7 398 0.7 Psychiatric Hospital or Psychiatric Distinct Part of a Hospital
42 0.6 10 0.3 11 0.6 22 0.5 318 0.6
Court/Law Enforcement 37 0.5 4 0.1 6 0.3 16 0.4 203 0.4 Intermediate Care Facility 12 0.2 2 0.1 2 0.1 2 0.05 56 0.1 Another Type of Inpatient Facility Not Defined Elsewhere
2 0.0 3 0.1 0 0.0 0 0.0 42 0.1
Discharged from Emergency Department After Arrival/Not Valued
1,583 22.9 1,240 42.4 612 33.0 1,295 29.9 14,172 25.2
Total 6,914 100.0 2,927 100.0 1,856 100.0 4,343 100.3 56,276 100.0

29 2018 Ohio Trauma Annual Report
Figure 10. Discharge status of all reported trauma cases, Ohio, 2018
This pie chart shows the discharge status (i.e. alive or dead) of records with reported traumatic injuries.
Table 20. Discharge status of all reported trauma cases, Ohio, 2018
This table shows the discharge status (i.e. alive or dead) of records with reported traumatic injuries. The
majority (97.4%) were alive at the time of discharge. The case fatality rate is 2.6%. A table of case fatality
rates across multiple demographic, injury, and patient disposition variables can be found on page 32.
Discharge Status Patients
# %
Alive 65,786 97.4
Dead 1,756 2.6
Total 67,542 100.0

30 2018 Ohio Trauma Annual Report
Table 21. Discharge status of all reported trauma cases by region, Ohio, 2018
This table shows the discharge status of patients by region where the injury occurred. A state map of these
regions is located in Appendix L. For this table, records where the injuries occurred out of state were not
included in the analysis.
Region Alive Dead
# % # %
Region 1 5,875 10.7 168 11.2
Region 2 5,560 10.1 183 12.2
Region 3 7,149 13.1 156 10.4
Region 4 12,500 22.8 353 23.6
Region 5 8,053 14.7 239 16.0
Region 6 6,694 12.2 220 14.7
Region 7 2,862 5.2 65 4.3
Region 8 1,811 3.3 45 3.0
Not Valued 4,276 7.8 67 4.5
Total 54,780 100.0 1,496 100.0
Figure 11. Number of injury related deaths by age group and sex, Ohio, 2018
This graph shows the number of deaths related to injuries sustained by patients in 2018 by age group and sex.
Across the vast majority of age groups, deaths were more likely to occur among males.
31
515
64
84
147
117 117
159
134
170
139
0
206 3
33 31 3120
45 48
72
116
139
00 0 0 0 0 0 1 1 1 2 1 0 00
20
40
60
80
100
120
140
160
180
Nu
mb
er
of
de
ath
s
Age
Male Female Not Valued

31 2018 Ohio Trauma Annual Report
Table 22. GCS Documentation of head injuries with an Abbreviated Injury Scale (AIS) ≥ 3, Ohio,
2018
This table shows the number and percentages of patients with an AIS ≥ 3 who had a Glasgow Coma Scale (GCS)
score reported prior to arrival at the hospital and once in the facility. Of the 8,590 records who had an AIS ≥
3, 58.0% did not have a valued GCS score prior to arrival at the hospital, while 42.0% did have a GCS score
documented prior to arrival at the facility. Of all patients, 8.3% did not have a valued GCS score in the hospital.
Out-of-Hospital GCS
In-Hospital GCS
# % # %
GCS 3 385 4.5 916 10.7 GCS 4 45 0.5 67 0.8 GCS 5 36 0.4 49 0.6 GCS 6 65 0.8 133 1.5 GCS 7 45 0.5 97 1.1 GCS 8 42 0.5 82 1.0 GCS 9 66 0.8 56 0.7 GCS 10 58 0.7 73 0.8 GCS 11 70 0.8 98 1.1 GCS 12 110 1.3 109 1.3 GCS 13 185 2.2 268 3.1 GCS 14 501 5.8 1,042 12.1 GCS 15 2,003 23.3 4,883 56.8 Not Valued 4,979 58.0 717 8.3
Total 8,590 100.0 8,590 100.0
Figure 12. Emergency department deaths by hospital type, Ohio, 2018
This graph shows the number and percentage of emergency department deaths by hospital type. The majority
(68.2%) of deaths occurred at Level I Trauma Centers. This is likely due to the fact that by their nature, Level
I Trauma Centers receive the most critical trauma cases.
0.3%
8.4%
6.9%
16.2%
68.2%
0% 10% 20% 30% 40% 50% 60% 70% 80% 90% 100%
Freestanding Emergency Department (n = 5)
Acute Care Hospital (n = 148)
Level III Trauma Center (n = 121)
Level II Trauma Center (n = 285)
Level I Trauma Center (n = 1,197)
Percentage
Ho
spit
al T
ype

32 2018 Ohio Trauma Annual Report
SECTION 6: CASE FATALITY RATES
The Case Fatality Rate (CFR) is the proportion of deaths within a designated population or grouping of "cases"
(people with a particular medical condition or hospital disposition) over the course of the disease. A CFR is
conventionally expressed as a percentage.
Table 23. Case Fatality Rate (CFR) by age group and sex, Ohio, 2018
The table below looks at case fatality rates by age group and sex among the records submitted to the registry.
Except for the 0 – 4, 5 – 9 and 15 –19 age groups, the case fatality rate was higher among males compared to
females. Overall, the highest case fatality rate was among the 20 –24 age group.
CFR (%)
Age Group Male Female Not Reported Total
0-4 1.9 1.9 0.0 1.9 5-9 0.4 0.7 0.0 0.5 10-14 1.1 0.5 0.0 0.9 15-19 3.1 3.4 0.0 3.2
20-24 3.7 3.0 9.3 3.6 25-34 3.2 1.6 0.0 2.7 35-44 3.1 1.1 2.2 2.5 45-54 2.8 2.1 2.1 2.5 55-64 3.1 1.3 1.3 2.3 65-74 3.3 1.5 2.1 2.3 75-84 4.7 2.0 1.4 3.1 85+ 5.2 2.4 0.0 3.2 Not Reported 0.0 --* --* 0.0
Statewide 3.2 1.9 1.8 2.6
* There were no cases reported in this category
Table 24. Case Fatality Rate (CFR) by Injury Severity Score (ISS), Ohio, 2018
The table below looks at case fatality rates by age group and sex among the records submitted to the registry.
In 2018, the case fatality rate was the highest among those with an ISS of ≥ 25.
ISS CFR (%)
01-09 0.8
10-14 1.6
15-24 8.2
25+ 31.3
Not Valued 1.7
Total 2.6
33 2018 Ohio Trauma Annual Report
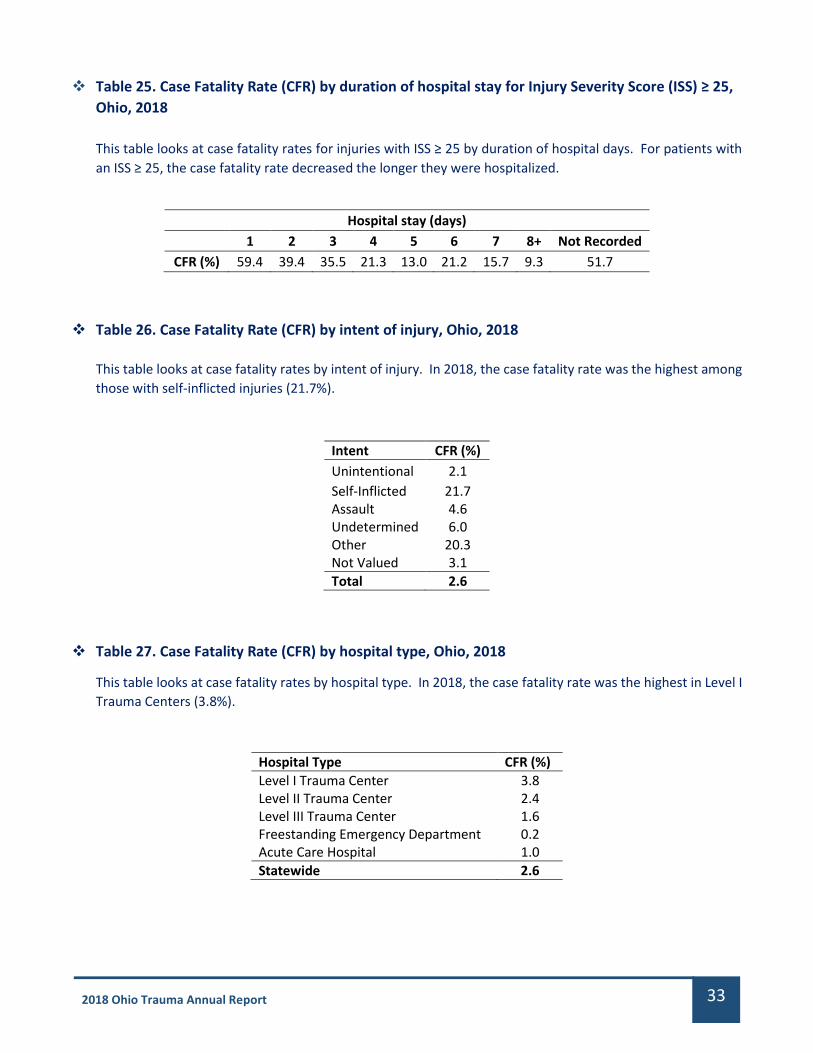
Table 25. Case Fatality Rate (CFR) by duration of hospital stay for Injury Severity Score (ISS) ≥ 25,
Ohio, 2018
This table looks at case fatality rates for injuries with ISS ≥ 25 by duration of hospital days. For patients with
an ISS ≥ 25, the case fatality rate decreased the longer they were hospitalized.
Hospital stay (days) 1 2 3 4 5 6 7 8+ Not Recorded
CFR (%) 59.4 39.4 35.5 21.3 13.0 21.2 15.7 9.3 51.7
Table 26. Case Fatality Rate (CFR) by intent of injury, Ohio, 2018
This table looks at case fatality rates by intent of injury. In 2018, the case fatality rate was the highest among
those with self-inflicted injuries (21.7%).
Intent CFR (%)
Unintentional 2.1
Self-Inflicted 21.7 Assault 4.6 Undetermined 6.0 Other 20.3 Not Valued 3.1
Total 2.6
Table 27. Case Fatality Rate (CFR) by hospital type, Ohio, 2018
This table looks at case fatality rates by hospital type. In 2018, the case fatality rate was the highest in Level I
Trauma Centers (3.8%).
Hospital Type CFR (%)
Level I Trauma Center 3.8 Level II Trauma Center 2.4 Level III Trauma Center 1.6 Freestanding Emergency Department 0.2 Acute Care Hospital 1.0
Statewide 2.6

34 2018 Ohio Trauma Annual Report
Table 28. Case Fatality Rate (CFR) by mechanism of injury, Ohio, 2018
This table looks at case fatality rates by mechanism of injury. In 2018, the case fatality rate was the highest
among those who died by suffocation/asphyxiation (35.8%), drowning/submersion (23.2%) and firearms
(15.9%).
Mechanism of Injury CFR (%)
Abuse 7.1
Cut or Pierce 1.6
Drowning/Submersion 23.2
Electrical 0.0
Explosion 1.7
Fall 1.9
Fire or Flame 4.9
Firearm 15.9
Hot Object or Substance 0.5
Machinery 0.4
Mechanical 2.1
MVC* - Motorcyclist 4.3
MVC* - Occupant 2.9
MVC* - Other 0.0
MVC* - Pedal Cyclist 4.6
MVC* - Pedestrian 6.5
MVC* - Unspecified 1.9
Natural or Environmental 0.6
Other Land Transport 1.5
Other Specified, Classifiable 9.5
Other Specified, Not Elsewhere Classifiable 3.4
Other Transport 2.7
Overexertion 0.0
Pedal Cyclist, Other 0.5
Pedestrian, Other 4.2
Pedestrian Conveyance 0.4
Poisoning 3.9
Struck by or Against 0.7
Suffocation/Asphyxiation 35.8
Not Classified/Not Valued 4.3
Statewide 2.6
*MVC refers to Motor Vehicle Collision

35 2018 Ohio Trauma Annual Report
Table 29. Case Fatality Rate (CFR) by county, Ohio, 2018
This table displays the case fatality rate by the county where the injury occurred. For this table, records
where the injuries occurred out of state were not included in the analysis. The statewide CFR is 2.6%.
Harrison (7.1%), Wyandot (5.3%), and Putnam (5.2%) counties reported the highest CFRs in 2018.
County Number of Deaths CFR (%) County Number of Deaths CFR (%)
Adams 4 3.4 Logan 9 3.4 Allen 7 4.1 Lorain 19 2.0 Ashland 2 1.2 Lucas 84 3.0 Ashtabula 10 4.0 Madison 7 2.6 Athens 9 1.7 Mahoning 39 3.8 Auglaize 4 3.0 Marion 10 1.6 Belmont 0 0.0 Medina 4 1.1 Brown 3 1.9 Meigs 3 2.2 Butler 43 2.5 Mercer 3 2.4 Carroll 1 1.1 Miami 5 0.8 Champaign 3 1.5 Monroe 1 3.7 Clark 35 3.4 Montgomery 98 2.6 Clermont 20 3.3 Morgan 5 4.2 Clinton 2 0.8 Morrow 6 3.7 Columbiana 5 2.0 Muskingum 20 2.6 Coshocton 2 0.8 Noble 2 3.4 Crawford 4 1.8 Ottawa 8 3.0 Cuyahoga 133 3.7 Paulding 0 0.0 Darke 1 0.4 Perry 5 2.1 Defiance 2 2.4 Pickaway 14 4.3 Delaware 19 2.4 Pike 3 1.2 Erie 11 2.9 Portage 21 2.6 Fairfield 20 2.5 Preble 2 1.0 Fayette 4 4.0 Putnam 3 5.2 Franklin 222 2.8 Richland 16 1.7 Fulton 10 3.5 Ross 19 2.7 Gallia 2 1.4 Sandusky 7 2.1 Geauga 10 2.5 Scioto 11 2.6 Greene 10 0.9 Seneca 3 1.3 Guernsey 10 4.9 Shelby 2 1.4 Hamilton 129 4.6 Stark 47 3.3 Hancock 4 4.4 Summit 73 3.6 Hardin 1 2.6 Trumbull 18 2.9 Harrison 2 7.1 Tuscarawas 6 1.8 Henry 1 0.6 Union 6 2.2
Highland 1 0.4 Van Wert 0 0.0
Hocking 5 2.4 Vinton 2 3.2
Holmes 1 1.9 Warren 18 1.9
Huron 4 2.5 Washington 3 1.0 Jackson 6 2.5 Wayne 6 3.0 Jefferson 0 0.0 Williams 2 4.3 Knox 9 2.5 Wood 15 2.3 Lake 11 2.2 Wyandot 4 5.3 Lawrence 0 0.0 Not Valued 67 1.5 Licking 18 2.7 Statewide 1,496 2.6

36 2018 Ohio Trauma Annual Report
Appendix A: Glossary of Terms
Abbreviated Injury Scales (AIS) – is an anatomically-based, global severity scoring system that classifies each
injury by body region according to its relative importance. AIS is the basis for the Injury Severity Score (ISS)
calculation of the multiply injured patient.
Acute Care Hospital – a facility providing a level of health care in which a patient is treated for a brief but severe
episode of illness, for conditions that are the result of disease or trauma, and during recovery from surgery.
Adult – is defined and used in this report to describe an individual whose age ranges from 16 to 69 years of age.
Case Fatality Rate (CFR) – the case fatality rate is the calculation derived from dividing the number of deaths from
a specific injury over a defined period of time by the total number of individuals diagnosed with the same injury
during the same time period; the resulting ratio is then multiplied by 100 to yield a percentage.
Critical Access Hospital – is a designation given to eligible rural hospitals by the Centers for Medicare and Medicaid
Services (CMS). See Appendix F for locations of Ohio’s Critical Access Hospitals.
Dataset – a collection of related sets of information that are composed of separate elements but can be
manipulated as a group to display relational information.
Disposition - The final place or setting to which the patient was discharged on the day of discharge (i.e. home,
hospice, acute care facility, etc.)
Division of Emergency Medical Services (DEMS) – the division where the State Board of Emergency Medical, Fire,
and Transportation Services is housed within the Ohio Department of Public Safety.
Emergency Medical, Fire and Transportation Services Board – The state board responsible for: Establishing
training and certification standards for emergency medical services personnel; accreditation of EMS training
programs; approval of EMS continuing education sites; oversight of Ohio’s trauma system; oversight of the EMS
grant program; providing grants for training, equipment and research; EMS for Children (EMSC) program
coordination; licensing of Ohio’s medical transportation services; coordination of the Regional Physician Advisory
Boards (RPABs); collection and analysis of data submitted to the EMS Incident Reporting System and the Ohio
Trauma Registry and investigations to ensure compliance with the Ohio Revised and Administrative Codes.
Emergency Medical Services Incident Reporting System (EMSIRS) – the system used to collect out-of-hospital
care data reported by Emergency Medical Service (EMS) providers to the State of Ohio.
Freestanding Emergency Department (FSED) – is an emergency facility that is structurally separate and distinct
from a hospital and provides emergency care.
Geriatric – is defined and used in this report to describe an individual whose age is 70 years of age or greater.
Glasgow Coma Scale (GCS) – an evaluation system developed to assess impairment and conscious levels in
response to defined stimuli.

37 2018 Ohio Trauma Annual Report
Injury Severity Score (ISS) - an evaluation system developed to predict the outcomes of traumas, including
mortality and length of hospital stay. The score is based on the Abbreviated Injury Scale (AIS), another scoring
system for injury severity. When a patient is injured, each area of the body is assigned an AIS score depending on
the injury severity. An ISS is calculated by squaring the AIS score from the three most severely injured body areas
and adding them together. ISS scores range from 0 to 75 1. The higher the ISS score, the more severe the injury.
Mechanism of Injury (MOI) – refers to the method by which damage (trauma) to the body occurred.
Motor Vehicle Collision (MVC) – also referred to as a Motor Vehicle Accident (MVA).
Ohio Trauma Registry (OTR) – the system used to collect trauma-related patient data reported by emergency
facilities and trauma centers to the State of Ohio.
Outcome measures – as defined by the World Health Organization are the “change in the health of an individual,
group of people, or population that is attributable to an intervention or series of interventions.” For the purposes
of this report, outcome measures include but are not limited to a patient’s initial disposition on arrival, transfer
between different level facilities, final discharge disposition, and mortality.
Pediatric – is defined and used in this report to describe an individual whose age ranges from 0 to 15 years of age.
Record – is used to reference an individual incident as reported to the Ohio Trauma Acute Care Registry.
Region – is defined and used in this report refers to one of eight regions a county is assigned to as part of the
Regional Physician Advisory Board (RPAB) Map. See Appendix L.
Rural – a county designation based on lower population densities and larger amounts of agricultural and
undeveloped land. See Appendix M.
Trauma Center – an emergency medical facility that can provide a higher-level treatment and surgical care to
trauma patients than other types of emergency facilities. In Ohio, the designation of “trauma center” and its level
of service is based on assessment and verification by the American College of Surgeons (ACS). See Appendix C
and D for locations of Ohio’s Trauma Centers.
Level I Trauma Centers are a comprehensive regional resource that is a tertiary care facility central to the trauma
system. A Level I Trauma Center is capable of providing total care for every aspect of injury – from prevention
through rehabilitation.
Level II Trauma Centers are able to initiate definitive care for all injured patients.
Level III Trauma Centers have demonstrated an ability to provide prompt assessment, resuscitation, surgery,
intensive care and stabilization of injured patients and emergency operations.
These descriptions above are provided by the American Trauma Society. A detailed description of the patient care
offered at each service level can be found in the ACS document, “Resources for Optimal Care of the Injured
Patient.” 2
Urban – a county designation based on higher population densities. See Appendix M.
1 http://www.trauma.org/archive/scores/iss.html
2 https://www.facs.org

38 2018 Ohio Trauma Annual Report
Appendix B: Ohio Trauma Registry Inclusion Criteria and Data Dictionary
TRAUMA PATIENT DEFINITION
In order to ensure consistent data collection across the State of Ohio and to follow the National Trauma Data
Standard, a trauma patient is defined as a patient sustaining a traumatic injury and meeting the patient inclusion
criteria described below:
PATIENT INCLUSION CRITERIA
The patient must have incurred, no more than 30 days prior to presentation for initial treatment, at least one
of the injury diagnostic codes defined in the International Classification of Diseases, Tenth Revision, Clinical
Modification (ICD-10-CM):
The patient MUST ALSO:
On initial presentation for treatment of an injury, be admitted to a hospital or hospital observation
unit, as defined by a physician order regardless of the length of stay;
AND/OR be transferred via EMS transport (including air ambulance) from one hospital (or
freestanding emergency department) to another hospital regardless of the patient’s length of stay or
admission status;
AND/OR have an outcome of death resulting from the traumatic injury (independent of hospital
admission or hospital transfer status).
More information on the trauma inclusion or exclusion criteria and the full 2017 data dictionary can be found
at https://www.publicsafety.ohio.gov/links/ems_OTR-TACR-Data-Dictionary-2017.pdf.
J70.5 (Respiratory conditions due to smoke inhalation),
S00-S99 with 7th character modifier of A, B or C ONLY (Injuries to specific body parts – initial encounter),
T07 (Unspecified multiple injuries),
T14 (Injury of unspecified body region),
T20-T28 with 7th character modifier of A ONLY (Burns by specified body parts – initial encounter),
T30-T32 (Burn by TBSA percentage),
T33 (Superficial frostbite),
T34 (Frostbite with tissue necrosis),
T67 (effects of heat and light),
T68 (Hypothermia),
T69 (Other effects of reduced temperature),
T70.4 (Effects of high-pressure fluids),
T70.8 (Other effects of air pressure and water pressure),
T70.9 (Effect of air pressure and water pressure, unspecified),
T71 (Asphyxiation),
T74.1 (Physical abuse, confirmed),
T74.4 (Shaken infant syndrome),
T75.0 (Other and unspecified effects of other external causes),
T75.1 (Unspecified effects of drowning and nonfatal submersion),
T75.4 (Electrocution),
T79.A1-T79.A9 with 7th character modifier of A ONLY (Traumatic compartment syndrome – initial encounter).

39 2018 Ohio Trauma Annual Report
Appendix C: Map of Ohio Adult Trauma Centers in 2018

40 2018 Ohio Trauma Annual Report
Appendix D: Map of Ohio Pediatric Trauma Centers in 2018

41 2018 Ohio Trauma Annual Report
Appendix E: Map of Ohio Burn Centers in 2018

42 2018 Ohio Trauma Annual Report
Appendix F: Map of Ohio Critical Access Hospitals in 2018
Adams County Regional Medical Center, Adena Pike Community Hospital, Aultman Orrville Hospital (Dunlap Memorial), Avita
- Bucyrus Community Hospital, Barnesville Hospital, Blanchard Valley Hospital - Bluffton Campus, CC - Akron General Lodi
Community Hospital, Community Hosp. of Williams Co. Montpelier, Community Memorial Hospital, Fayette County Memorial
Hospital, Fostoria Community Hospital, Fulton County Health Center, Galion Community Hospital, Greenfield Area Medical
Center, H.B. Magruder Memorial Hospital, Hardin Memorial Hospital, Harrison Community Hospital, Henry County Hospital,
Highland District Hospital, Hocking Valley Community Hospital, Holzer Medical Center – Jackson, MedCentral Health System
Shelby Hospital, Mercy Health - Allen Hospital, Mercy Health - Urbana Hospital, Mercy Health - Willard Hospital, Morrow
County Hospital, Paulding County Hospital, ProMedica Defiance Regional Hospital, Selby General Hospital, Trinity Hospital
Twin City, UH Conneaut Medical Center, UH Geneva Medical Center, and Wyandot Memorial Hospital.

43 2018 Ohio Trauma Annual Report
Appendix G: Map of Acute Care Hospitals in 2018
Summa Health St. Thomas Hospital, Alliance Community Hospital, CC - Ashtabula County Medical Center, OhioHealth O'Bleness Hospital,
CC - Avon Hospital, Summa Health Barberton Hospital, Mercy Health - Clermont Hospital, UH Ahuja Medical Center, UH Bedford Medical
Center, Mary Rutan Hospital, The Bellevue Hospital, Mercy Health - St. Elizabeth Boardman, Wood County Hospital, Community Hospitals
and Wellness Bryan, Southeastern Ohio Regional Medical Center, Diley Ridge Medical Center, Miami Valley Hospital – South, Southview
Hospital, Adena Regional Medical Center, Mercy Health - Anderson Hospital, Mercy Health - West Hospital, The Christ Hospital, The
Jewish Hospital - Mercy Health, TriHealth - Good Samaritan Hospital (Cincinnati), Berger Health System, CC - Lutheran Hospital, CC -
Cleveland Clinic Main Campus, St. Vincent Charity Hospital, Mercer County Community Hospital, Mount Carmel East Hospital, OhioHealth
Doctor's Hospital, The Ohio State University Hospital East, TriPoint Medical Center, Coshocton Regional Medical Center, Western Reserve
Hospital, Grandview Hospital, Mercy Health - Defiance Hospital, OhioHealth Grady Memorial Hospital, Union Hospital, OhioHealth Dublin
Methodist Hospital, East Liverpool City Hospital, UH Elyria Medical Center, CC - Euclid Hospital, Mercy Health - Fairfield Hospital,
ProMedica Memorial Hospital – Fremont, Holzer Medical Center, CC - Marymount Hospital, Wayne Hospital, Mount Carmel Grove City,
Fort Hamilton Hospital, TriHealth - Bethesda Butler Hospital, Fairfield Medical Center, Madison County Hospital, Mercy Regional Medical
Center, OhioHealth Marion General Hospital, East Ohio Regional Hospital, Memorial Hospital, St. Luke's Hospital – Toledo, CC - Medina
Hospital, Sycamore Hospital, Pomerene Hospital, Knox Community Hospital, Mount Carmel New Albany, Licking Memorial Hospital, Avita
- Ontario Hospital, Bay Park Community Hospital, Mc Cullough-Hyde Memorial Hospital, UH Parma Medical Center, King's Daughters
Medical Center – Ohio, Southern Ohio Medical Center, UH Richmond Medical Center, Salem Community Hospital, Wilson Hospital, Mercy
Health - Springfield Regional Medical Center, Joint Twp. District Memorial Hospital, Trinity Medical Center – West, Promedica Flower
Hospital, Mercy Hospital – Tiffin, Upper Valley Medical Center, Van Wert County Hospital, CC - South Pointe Hospital, Mount Carmel St.
Ann's, West Hospital - Lake Health, Wooster Community Hospital, and Northside Medical Center.

44 2018 Ohio Trauma Annual Report
Appendix H: Map of Freestanding Emergency Departments in 2018
CC- Akron General H&W Ctr – West, St. Joseph Emergency and Diagnostic Center, UH Avon Health Center Emergency Room,
Marietta Memorial - Belpre Medical Campus, MetroHealth Brecksville Health Center, Brunswick Medical Center, TriHealth -
Good Samaritan Western Ridge, MetroHealth Cleveland Heights Medical Center, Miami Valley Hospital – North, OhioHealth
Lewis Center Health Center, Kettering Health - Preble County Medical Center, Kettering Health Network - Franklin ED,
MercyHealth - Putnam County Ambulatory Care Center, Mercy Health - Harrison Medical Center, OhioHealth Hilliard,
Kettering Health - Huber Emergency Department, St. Mary's Medical Center - Ironton Campus, Miami Valley Hospital -
Jamestown ED, CC - Lakewood Emergency Department, TriHealth - Bethesda Arrow Springs, Mount Carmel Fitness and
Health - Lewis Center, The Christ Hospital Medical Center, Madison Medical Campus, Atrium Health Center – Mason, Summa
Health Medina Medical Center, Mercy Health - Mt. Orab Medical Center, OhioHealth Obetz, OhioHealth Ontario,
MetroHealth Parma Hospital, Mercy Emergency Services – Perrysburg, OhioHealth Pickerington Emergency Care Center,
Holzer Emergency Department – Meigs, OhioHealth Emergency Care – Powell, OhioHealth Emergency Care - Reynoldsburg,
CC - Twinsburg Fam Health & Surg Ctr, UH Twinsburg Health Center, CC - Akron General H&W Ctr – Green, Summa Health
Green Medical Center, Summa Health Wadsworth-Rittman ED, OhioHealth Westerville Emergency Care Center, St. Elizabeth
Emergency & Diagnostic Center, CC - Akron General H&W Ctr – North.

45 2018 Ohio Trauma Annual Report
Appendix I: Map of EMS Units Serving Trauma Patients in Ohio by BLS and ALS in 2018
Basic Life Support (BLS) – EMS units with the required definitive care equipment onboard and the
necessary certificate level of staff to provide basic life support services.
Advanced Life Support (ALS) – EMS units with the required definitive care equipment onboard
and the necessary certificate level of staff to provide advanced life support services.

46 2018 Ohio Trauma Annual Report
Appendix J: Map of Air Medical Services Available to Ohio Trauma Patients in 2018
This map includes the 17 air medical services agencies serving Ohio patients licensed by the Medical
Transportation Section. Of these, 15 services are headquartered in Ohio, one provider is headquartered in
Indiana, and one is headquartered in Pennsylvania. In addition to the 17 headquarter locations, there are 50
satellite locations comprising a system of 76 aircraft (7 fixed wing and 69 are rotor).
Each satellite location and some headquarter locations will have at least one aircraft stationed at its facility. Due
to the frequent relocation of aircraft between satellite locations, helicopter resources in neighboring states
represent transportation services that are registered service providers of Ohio.

47 2018 Ohio Trauma Annual Report
Appendix K: Ohio Department of Health Injury-Related Death Data
Number and rate of injury-related deaths that occurred in Ohio by age group, 2018*
* Data are considered partial and may be incomplete.
Source: Ohio Department of Health (ODH) Bureau of Vital Statistics; analysis conducted by ODH Violence and Injury
Prevention Section.
Number and age-adjusted rate of injury-related deaths that occurred in Ohio by sex, 2007-2018*
Female Male Total
Year Number Age-Adjusted
Rate Number
Age-Adjusted Rate
Number Age-Adjusted
Rate
2007 2,232 33.9 4,559 83.0 6,791 57.5
2008 2,430 36.9 4,756 86.3 7,186 60.5
2009 2,328 35.5 4,566 82.2 6,894 57.9
2010 2,417 36.6 4,739 85.2 7,156 59.9
2011 2,556 38.7 4,940 88.2 7,496 62.6
2012 2,608 39.8 5,120 91.2 7,728 64.6
2013 2,596 39.3 5,138 91.3 7,734 64.4
2014 2,809 42.8 5,545 98.2 8,354 69.6
2015 3,027 47.2 6,200 109.3 9,227 77.3
2016 3,469 53.7 7,088 124.8 10,557 88.3
2017 3,806 59.7 7,886 140.0 11,692 98.9
2018* 3,427 52.8 7,049 123.2 10,476 87.1 Includes injury-related deaths of individuals that died in Ohio regardless of their state of residence (underlying cause of death ICD-10 codes *U01-*U03, V01-Y36, Y85-Y87, Y89). * Data are considered partial and may be incomplete. Age-adjusted rates are based on the 2000 U.S. stardard population and are calculated per 100,000 population. Source: ODH Bureau of Vital Statistics; analysis conducted by ODH Violence and Injury Prevention Section.
98 79 91
934
1,8641,790
1,489 1,463
821 803
1,044
0
75
150
225
300
375
450
0
200
400
600
800
1,000
1,200
1,400
1,600
1,800
2,000
< 1 1-4 5-14 15-24 25-34 35-44 45-54 55-64 65-74 75-84 85+
De
ath R
ate p
er 1
00
,00
0 P
op
ulatio
nN
um
be
r o
f D
eat
hs
Age (in years)
Number Rate

48 2018 Ohio Trauma Annual Report
Number and age-adjusted rate of injury-related deaths that occurred in Ohio by mechanism and sex, all intent, 2018*
Female Male Total
External Injury Mechanism Number Age-Adjusted
Rate Number
Age-Adjusted Rate
Number Age-Adjusted
Rate
Cut or Pierce 34 0.6 76 1.3 110 0.9
Drowning 26 0.4 95 1.7 121 1.1
Drug Poisoning 1,380 24.7 2,629 47.9 4,009 36.2
Fall 768 8.2 761 12.5 1,529 10.1
Fire or Flame 61 0.9 101 1.6 162 1.2
Firearm 228 3.8 1,341 23.1 1,569 13.2
Hot Object or Substance 0 -- 2 -- 2 --
Machinery 0 -- 18 0.3 18 0.1
MV-Motorcyclist 27 0.5 97 1.7 124 1.1
MV-Occupant 100 1.6 216 3.7 316 2.6
MV-Pedal Cyclist 2 -- 20 0.3 22 0.2
MV-Pedestrian 44 0.7 106 1.8 150 1.3
MV-Unspecified 167 2.7 361 6.2 528 4.4
Natural or Environmental 31 0.4 28 0.4 59 0.4
Non-Drug Poisoning 41 0.7 131 2.3 172 1.5
Other Land Transport 16 0.3 46 0.8 62 0.5
Other Specified, classifiable and NEC
64 1 131 2.3 195 1.6
Other Transport 2 -- 11 0.2 13 0.1
Overexertion 0 -- 1 -- 1 --
Pedal Cyclist, Other 3 -- 5 -- 8 --
Pedestrian, Other 9 -- 23 0.4 32 0.3
Struck by or against 5 -- 34 0.5 39 0.3
Suffocation 268 4.2 635 11.2 903 7.6
Unspecified 151 1.8 181 2.9 332 2.3
Total 3,427 52.8 7,049 123.2 10,476 87.1 Includes injury-related deaths of individuals that died in Ohio regardless of their state of residence (underlying cause of
death ICD-10 codes *U01-*U03, V01-Y36, Y85-Y87, Y89).
All intent includes unintentional, suicide, homicide, legal intervention or war, and undetermined.
--Age-adjusted rates are suppressed when the death count is less than 10. Age-adjusted rates are based on the 2000 U.S.
standard population and calculated per 100,000 population.
* Data are considered partial and may be incomplete.
MV – motor vehicle crash
NEC – Not elsewhere classifiable
Source: ODH Bureau of Vital Statistics; analysis conducted by ODH Violence and Injury Prevention Section.
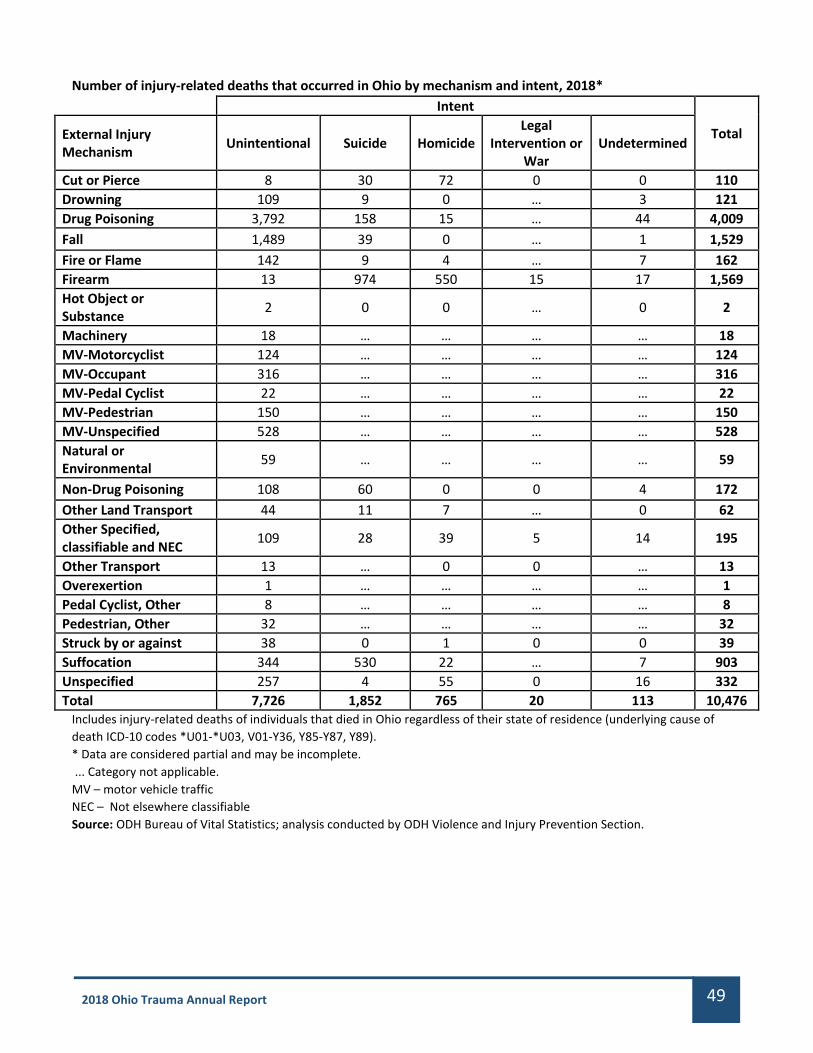
49 2018 Ohio Trauma Annual Report
Number of injury-related deaths that occurred in Ohio by mechanism and intent, 2018* Intent
Total External Injury Mechanism
Unintentional Suicide Homicide Legal
Intervention or War
Undetermined
Cut or Pierce 8 30 72 0 0 110
Drowning 109 9 0 … 3 121
Drug Poisoning 3,792 158 15 … 44 4,009
Fall 1,489 39 0 … 1 1,529
Fire or Flame 142 9 4 … 7 162
Firearm 13 974 550 15 17 1,569
Hot Object or Substance
2 0 0 … 0 2
Machinery 18 … … … … 18
MV-Motorcyclist 124 … … … … 124
MV-Occupant 316 … … … … 316
MV-Pedal Cyclist 22 … … … … 22
MV-Pedestrian 150 … … … … 150
MV-Unspecified 528 … … … … 528
Natural or Environmental
59 … … … … 59
Non-Drug Poisoning 108 60 0 0 4 172
Other Land Transport 44 11 7 … 0 62
Other Specified, classifiable and NEC
109 28 39 5 14 195
Other Transport 13 … 0 0 … 13
Overexertion 1 … … … … 1
Pedal Cyclist, Other 8 … … … … 8
Pedestrian, Other 32 … … … … 32
Struck by or against 38 0 1 0 0 39
Suffocation 344 530 22 … 7 903
Unspecified 257 4 55 0 16 332
Total 7,726 1,852 765 20 113 10,476 Includes injury-related deaths of individuals that died in Ohio regardless of their state of residence (underlying cause of
death ICD-10 codes *U01-*U03, V01-Y36, Y85-Y87, Y89).
* Data are considered partial and may be incomplete.
... Category not applicable.
MV – motor vehicle traffic
NEC – Not elsewhere classifiable
Source: ODH Bureau of Vital Statistics; analysis conducted by ODH Violence and Injury Prevention Section.

50 2018 Ohio Trauma Annual Report
Number and rate of all deaths that occurred in Ohio by age, 2018*
* Data are considered partial and may be incomplete. Source: ODH Bureau of Vital Statistics; analysis conducted by ODH Violence and Injury Prevention Section.
Number and age-adjusted rate of all deaths that occurred in Ohio by sex, 2007-2018*
Female Male Total†
Year Number Age-Adjusted
Rate Number
Age-Adjusted Rate
Number Age-Adjusted
Rate
2007 54,837 709.5 51,749 990.3 106,586 831.6
2008 56,495 721.5 53,209 1,001.5 109,704 843.8
2009 54,836 696.6 52,395 968.1 107,231 815.1
2010 55,767 697.4 52,865 960.9 108,632 812.8
2011 57,341 710.6 54,221 970.6 111,564 825.5
2012 57,831 709.1 54,975 961.4 112,808 820.7
2013 57,843 699.6 55,510 953.5 113,353 812.9
2014 57,592 689.7 57,012 959.4 114,607 810.6
2015 59,631 710.4 58,491 972.3 118,124 828.3
2016 59,590 706.5 60,042 982.3 119,632 831.1
2017 61,516 723.3 62,374 1,006.1 123,892 852.2
2018* 61,593 712.3 63,037 996.9 124,632 841.2 Includes all deaths of individuals that died in Ohio regardless of their state of residence. * Data are considered partial and may be incomplete. † Includes deaths with unknown sex. Age-adjusted rates are based on the 2000 U.S. standard population and are calculated per 100,000 population. Source: ODH Bureau of Vital Statistics; analysis conducted by ODH Violence and Injury Prevention Section.
1,007 177 199 1,2152,620 3,609
7,052
16,427
23,912
29,699
38,715
0
2,000
4,000
6,000
8,000
10,000
12,000
14,000
16,000
0
5,000
10,000
15,000
20,000
25,000
30,000
35,000
40,000
45,000
< 1 1-4 5-14 15-24 25-34 35-44 45-54 55-64 65-74 75-84 85+
De
ath R
ate p
er 1
00
,00
0 P
op
ulatio
nN
um
be
r o
f D
eat
hs
Age (in years)
Number Rate

51 2018 Ohio Trauma Annual Report
Appendix L: Map of Ohio Homeland Security Regions Utilized by the Regional Physician Advisory Board (RPAB)

52 2018 Ohio Trauma Annual Report
Appendix M: Map of Ohio Counties, Urban and Rural Designations
Source: U.S. Department of Health and Human Services, Centers for Disease Control and Prevention, 2013 NCHS
Urban-Rural Classification Scheme for Counties.
There are minor classification changes from the 2017 annual report where the USDA Economic Research Service
classification system was used. Erie, Ottawa, Preble and Washington counties are reclassified from “urban” to
“rural.” Hocking and Perry counties are reclassified from “rural” to “urban.”

53 2018 Ohio Trauma Annual Report
APPENDIX N: Summary of 2017 – 2018 Trauma Related EMS Grants
Complete summaries are located on the Grants page of the DEMS website (https://www.ems.ohio.gov).
Refining The Definitions of Under- and Over-Triage: A Data Analytics and Consensus-Based Approach
Principal Investigator: Pratik J. Parikh, PhD.
Co-Investigators: Peter Ekeh, MD; Brendan Deere, EMT-P; and Priti Parikh, PhD, Department of Biomedical,
Industrial and Human Factors Engineering and Department of Surgery Wright State University, Dayton, OH
Social and Emotional Support for Students with Persistent TBI Symptoms
Principal Investigator: Susan Davies, Ed.D., NCSP, University of Dayton
Co-Investigators: Dr. Elana Bernstein, clinical faculty, Department of Counselor Education & Human Services at
the University of Dayton; Dr. Corinne Daprano, associate professor, sport management, chair of the Department
of Health and Sport Science at the University of Dayton.
Promoting Positive Family Adaptation following Pediatric Brain Injury: Development and Pilot Trial of “Road
to Recovery for Caregivers after TBI” (R2R-TBI)
Principal Investigators: Shari L Wade, PhD, Cincinnati Children’s Hospital Medical Center, Cincinnati, OH; Stacey
P. Raj, PhD, Xavier University, Cincinnati, OH
Ohio Pediatric Prehospital Sepsis Screen (OH! PS)
Principal Investigator: Lynn Babcock, MD, MS, Professor Clinical Pediatrics, Division of Emergency Medicine,
Cincinnati Children’s Hospital Medical Center

54 2018 Ohio Trauma Annual Report
APPENDIX O: Members of the Board, Trauma Committee, Trauma Registry Advisory Workgroup
(TRAW), Performance Improvement (PI) Workgroup, and EMS Workgroup
Board
Dudley H.A. Wright II (Chair)
Kent Appelhans (Vice Chair)
Thomas Allenstein
Karen Beavers
Herb de la Porte
David DeVore
Geoffrey J. Dutton
Patrick Ferguson
Richard George, MD
Deanna L. Harris
Jeffery Jackson
Ruda Jenkins
Susan Kearns
Mark N. Resanovich
Julie Rose
Hamilton P. Schwartz, MD
George B. Snyder
Thomas A. Tallman, DO
Glen Tinkoff, MD
Kevin Uhl
Jason Walsh
Trauma Committee
Diane Simon (Chair)
Laurie Johnson, MD (Vice Chair)
Marco Bonta, MD
Joyce Burt
Jeffrey Claridge, MD
Herb de la Porte
Erik Evans, MD
Dave Freeman
Kathy Haley
Ryan Harrison, MD
Kent Harshbarger, MD
Patricia Hightower
Fran Lauriha
Travis Perry, MD
James Sauto, Jr., MD
Avraham Schlager, MD
Michael Shannon, MD
Rachel Velasquez
Howard Werman, MD
Tammy Wilkes
Trauma Registry Advisory Workgroup
(TRAW)
Joyce Burt (Chair) Deanah Moore (Co-Chair)
Roxanna Giambri
Kelly Harrison
Lita Holdeman
Erika Joos
Anne Moss
Pam Owen
Diane Simon
Pamela Tanner
Richard Treat, M.D.
Performance Improvement (PI) Workgroup
Anne Moss (Chair)
Richard George, MD (Co-Chair)
Jenifer Brodsky
Joyce Burt
Shannon Camick
Melody Campbell
Alex Carpenter
Roxanna Giambri
Vickie Graymire
Kelly Harrison
Erika Joos
Maria Penrose
Diane Simon
EMS Prehospital Workgroup
Ashish Panchal, M.D.
Brian Anderson
Brian Bemiller
Herb de la Porte
Joel Dickinson
Mark Huckaby
James Sauto, M.D.
Tammy Wilkes
Jamie Wilson
Paul Zeeb, M.D.
ODPS/Division of EMS
Carol A. Cunningham, MD,
State Medical Director
Melvin R. House, Executive Director
Robert L. Wagoner, Deputy Director
Eric M. Mays, Data Administration Manager
Sahithi Aurand, MPH,
Epidemiology Investigator
Natalie Haslage, MCHES, Human Services Program Consultant
Sue A. Morris, BA, Paramedic, CEI,
Human Services Program Consultant

55 2018 Ohio Trauma Annual Report
This Page Intentionally Left Blank

56 2018 Ohio Trauma Annual Report
Ohio Department of Public Safety
Division of Emergency Medical Services
2018 Trauma Annual Report
Published: October 16, 2019


![State ex rel. Ohio AFL-CIO v. Ohio Bur. of Workers' …Cite as State ex rel. Ohio AFL-CIO v. Ohio Bur. of Workers’ Comp., 97 Ohio St.3d 504, 2002-Ohio-6717.] THE STATE EX REL. OHIO](https://static.fdocuments.in/doc/165x107/5b0390027f8b9a3c378c6950/state-ex-rel-ohio-afl-cio-v-ohio-bur-of-workers-cite-as-state-ex-rel-ohio.jpg)

![State v. Madrigal - Supreme Court of Ohio · [Cite as State v.Madrigal, 87 Ohio St.3d 378, 2000-Ohio-448.] THE STATE OF OHIO, APPELLEE, v.MADRIGAL, APPELLANT. [Cite as State v.Madrigal](https://static.fdocuments.in/doc/165x107/60ad0f950b8d1154911286e8/state-v-madrigal-supreme-court-of-cite-as-state-vmadrigal-87-ohio-st3d-378.jpg)


