2018 Recycling Industry Yearbook€¦ · Despite the continued international trade and...
96
™ 2018 Recycling Industry Yearbook
Transcript of 2018 Recycling Industry Yearbook€¦ · Despite the continued international trade and...

™
2018Recycling Industry Yearbook


ISRI.ORG 1
Recycling Industry Yearbook 2018
Executive Summary
As the global scrap marketplace evolves ever more rapidly, there has never been a more pressing need for accurate, up-to-date information about the state of the recycling industry. The 2018 Recycling Industry Yearbook is designed to fill that void, providing the latest information and statistics about the U.S. and global scrap industries. In addition, the yearbook aims to provide readers with a clearer understanding of what the scrap industry actually is and how it works, along with the tremendous economic, environmental, energy, and trade benefits the industry generates globally.
Despite the continued international trade and industry-specific challenges faced by scrap recyclers in 2017, preliminary trade data indicate approximately 110 million tons of scrap worth more than $105 billion were exported globally, according to data from the United Nations Comtrade database.
U.S. exports of scrap totaled nearly 38 million metric tons valued at $17.85 billion and were shipped to industrial consumers in 145 countries around the world in 2017. In the United States, scrap recyclers processed a total of approximately 130 million tons of scrap metal, paper, plastics, electronics, textiles, glass, and
rubber last year for domestic and overseas consumption. Those efforts created significant energy savings, reduced greenhouse gas emissions, saved natural resources, and limited the amount of material that would otherwise have been sent to landfills. In addition to these critical environmental benefits, the scrap recycling industry also provided much needed support to the U.S. economy and trade balance.
Independent research conducted by John Dunham & Associates confirms that in the United States, the scrap recycling industry directly and indirectly supports more than 534,000 well-paying jobs while generating nearly $117 billion in economic activity and $13.2 billion in federal, state, and local tax revenue.
In addition to providing an overview of the U.S. scrap industry, the 2018 Recycling Industry Yearbook also describes what we mean when we’re talking about scrap (hint: it’s not waste), where scrap comes from, how it gets processed, and who uses it. In addition, the 2018 Yearbook contains updated and expanded information on nearly every aspect of the global industry. For more information about ISRI and the global scrap recycling industry, visit the ISRI website at ISRI.org.

Institute of Scrap Recycling Industries, Inc.2
ISRI.ORG/COMMODITIES2018
Table of Contents
Executive Summary 1
Chapter I: Introduction to ISRI 3
Chapter II: Scrap Recycling Overview 4
Commodity Origins 4
History of Scrap Recycling 6
What is Scrap and Where Does It Come From? 7
How is Scrap Processed? 8
Where are Scrap Recycling Facilities Located? 10
How is Scrap Transported? 11
How is Scrap Consumed? 12
Evolving Technologies 13
How do Scrap Commodity Markets Work? 14
ISRI Index 16
Chapter III: The Benefits of Scrap Recycling 17
Economic Benefits 17
Environmental Benefits 18
Energy Savings 19
Scrap Exports and the U.S. Trade Balance 20
Chapter IV: Scrap Commodities 22
Iron and Steel 23
Nonferrous Metal 28
Recovered Paper and Fiber 43
Plastics 48
Electronics 53
Tires and Rubber 56
Glass 59
Textiles 61
Chapter V: The Global Scrap Marketplace 63
The Expanding Scrap Marketplace 63
China's Role in the Global Recycling Marketplace 70
Chapter VI: Statistical Appendices 66
Appendix A: Historical Production, Recovery, and Consumption Data 71
Appendix B: Global Scrap Exports by Commodity 75
Appendix C: Global Flows by Country and Year 76

ISRI.ORG 3
ISRI is the Voice of the Recycling Industry™, promoting safe, economically-sustainable, and environmentally-responsible recycling through networking, advocacy, and education. ISRI represents approximately 1,300 member companies operating more than 4,000 locations in the United States and 41 countries worldwide. ISRI members process, broker, and consume the entire range of recycled commodities including ferrous and nonferrous metals, recovered paper and fiber, tires and rubber, plastics, glass, electronics, and textiles. Our members range in size from small family-owned firms to large multinational corporations.
ISRI promotes the best interests of the recycling industry; fostering the trade and commerce of its members; promoting free and fair trade; and aiding the industry by seeking to eliminate abusive and disruptive business practices and unfair competition.
Headquartered in Washington, DC, ISRI raises public awareness of the vital role recycling plays in the economy, global trade, the environment, and sustainable development. ISRI members benefit from a wide array of services including: safety and compliance training; networking and education; market research and reporting; regulatory and legal information; industry-specific publications; and industry representation. For more information or to join, visit ISRI.org.
CHAPTER I: Introduction to ISRI
Robin K. WienerPresidentISRI
Brian ShineChairManitoba Corp.

Institute of Scrap Recycling Industries, Inc.4
CHAPTER II: Scrap Recycling Overview
METALS
PLASTICS
PAPER
Commodities Origins
Responsibly maximizing
the value of materials
extracted from natural
resources by recycling
saves energy, protects
ecosystems, and
maintains the economic
freedom and security of
a nation. To understand
the value of recycling,
it is important to
understand how these
materials are initially
created from our natural
resources.
MiningOre is mined from mineral rich deposits. Hematite, Bauxite, Chalcocite, Limonite, and Galena are examples of ores used to extract base metals.
BeneficiationBeneficiation is a process where ores are crushed and sorted to concentrate pieces that will have higher yields when refined through smelting.
DrillingCrude oil and natural gas are extracted from deposits beneath the ground surface and seabeds. Oil tanker ships are some of the largest ships on the open seas. They’re often as long as the World Trade Center is tall and several times wider.
RefiningCrude oil is refined through a complex distillation process where chemicals with varying properties are extracted and separated to create products such as kerosene, gasoline, naphtha, paraffin, and asphalt.
ForestryTrees, and other fibrous plants, provide the basic raw material that is processed into paper. It is important to note that paper is a byproduct of deforestation. As trees are processed for lumber and fuel, the chips and sawdust are collected for pulping, which is about 15 percent of the total volume of trees cut down.
PulpingSawdust, wood chips, and other fibrous media are mechanically or chemically broken down in order to separate the fibers into a pulp. Mechanical pulping requires more energy than chemical pulping but produces higher yields. However, the paper strength from chemical pulping is higher.

ISRI.ORG 5
Recycling Industry Yearbook 2018
Smelting and RefiningBeneficiated ore is heated until it melts with reducing agents that remove non-metallic elements such as oxygen and sulfur. The resulting liquid metal is separated from the slag similar to how the impurities are skimmed when making broth and formed into working pieces such as ingots or billet. The process to raise the temperature of the ore above 2000˚ F requires enormous amounts of energy.
Polymer CrackingPetroleum distillates are often long complex chains of hydrocarbons and natural gas is a mix of several types of hydrocarbon gases. In order to create more uniform and adaptable products, those hydrocarbons are put into a chamber with catalysts to lower energy costs that will “crack” apart the longer chains into smaller blocks, such as ethylene and propylene, which are used to build new polymer chains, also known as plastics.
Paper MillingFibrous pulp is spread out on screens and absorptive mats that move through heated rollers stretching, compressing, and extracting moisture from the fiber. This process adheres the fibers together to create a roll of paper.
The scrap recycling industry connects the ends of the manufacturing supply chain. It has evolved in response to changing market dynamics and represents a key component in creating a circular economy.
2017 Volume of Scrap Material Processed in the United States (metric tons)
Iron and Steel 66,000,000
Paper 46,100,000
Aluminum 5,268,000
Copper 1,862,000
Lead 1,056,000
Zinc 67,000
Plastics 815,000 (2016)
Electronics 5 million+ (est.)
Tires (# of tires) 110,000,000 (2016)

Institute of Scrap Recycling Industries, Inc.6
ISRI.ORG/COMMODITIES2018
History of Scrap RecyclingSince the dawn of civilization and the earliest attempts at manufacturing, humans have recognized the intrinsic value of scrap and the benefits associated with using and re-using existing products to create new goods.
In the early days of recycling, scrap peddlers would typically buy and trade relatively small quantities of used household items, used farm equipment, and other goods.
As manufacturing ramped up and became more complex in response to society’s expanding needs, scrap recycling took on
even greater importance, adapting not only to market drivers, but also shifting priorities in the context of our finite natural resources.
In the second half of the 20th century, the scrap recycling industry continued to grow, becoming more innovative, competitive, and capital-intensive. In the last several decades, the introduction of containerization and the surge in commodities demand from China and other developing economies helped to create an even more globalized scrap marketplace.

ISRI.ORG 7
Recycling Industry Yearbook 2018
What Is Scrap and Where Does It Come From?Scrap is a valuable commodity. It is not waste. Recyclers process scrap from a number of sources, including used and end-of-life
products, off-spec and overrun material from manufacturing processes, and recyclables from commercial and industrial operations and
municipal programs. Recyclers process scrap into specification-grade products that manufacturers--such as steel mills, foundries, paper mills, compounders, extruders, and fabricators--purchase and use as ingredients in the manufacture of new products. In its processed form, ferrous (iron and steel) and nonferrous (copper, aluminum, lead, nickel, and zinc) metals, paper, plastic, rubber, electronics, glass, and textiles are produced into hundreds of different grades, each meeting globally accepted specifications that are designed to meet the needs of manufacturers worldwide.
There are two major sources of scrap supply. Obsolete scrap comes from a wide range of used products including end-of-life cars and trucks, old newspapers and magazines, used appliances, demolished buildings, used beverage containers, consumer goods, and much more.
Scrap generated by the manufacturing process, known as prompt, prime, or new scrap, comes in a variety of forms including metal clippings, stampings, and turnings. Because new products are continually entering the marketplace, scrap recyclers need to be extremely innovative in order to keep up with commodity and end-use market developments.
Scrap can be grouped into categories including: ferrous scrap, which includes items made from iron and steel like old automobiles and machinery; nonferrous scrap made of other metals such as aluminum, copper, lead, zinc, nickel, and tin; electronics scrap including used TVs, computers, cell phones, and other electronic equipment; and nonmetallic scrap such as recovered paper and fiber, plastics, rubber and tires, glass, and textiles.

Institute of Scrap Recycling Industries, Inc.8
ISRI.ORG/COMMODITIES2018
ISRI estimates that approximately 900 million metric tons of scrap metal, recovered paper and fiber, plastic scrap, used electronics, and other scrap commodities were consumed last year by manufacturers around the globe. As the world’s largest supplier of scrap, the United States annually processes approximately 130 million metric tons of scrap commodities per year, providing vital raw materials to manufacturers and helping to fuel global growth.
How is Scrap Processed?Regardless of the commodity being recycled, the basic goal of all scrap processing is the same: to transform unprocessed recyclable materials into smaller and/or denser forms of specific composition that meet a commercial-grade specification. With this rigorous processing, the finished scrap products are easier to handle and transport, and they are ready to use in manufacturing processes.
Unprocessed scrap usually arrives at a recycling operation by truck and is weighed on a scale. Then the truck is emptied and weighed again to determine the weight of the delivered scrap. The recycler determines how much to pay the seller based on the type of material in the load and its net weight. Recyclers purchase scrap materials from numerous suppliers each day to keep up with the demands of their customers, which use the scrap to make new products.
At the weighing-in stage, recyclers use a combination of sophisticated equipment and best practices, including radiation detectors, visual inspections, source control, and a nationwide theft-alert notification system to minimize the possibility of receiving unwanted materials in incoming loads of recyclable materials.
ISRI.ORG 9
Recycling Industry Yearbook 2018
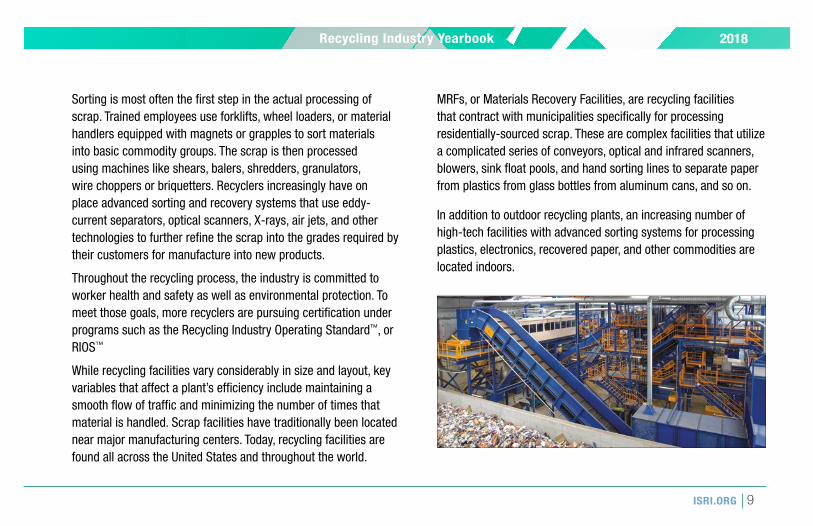
Sorting is most often the first step in the actual processing of scrap. Trained employees use forklifts, wheel loaders, or material handlers equipped with magnets or grapples to sort materials into basic commodity groups. The scrap is then processed using machines like shears, balers, shredders, granulators, wire choppers or briquetters. Recyclers increasingly have on place advanced sorting and recovery systems that use eddy-current separators, optical scanners, X-rays, air jets, and other technologies to further refine the scrap into the grades required by their customers for manufacture into new products.
Throughout the recycling process, the industry is committed to worker health and safety as well as environmental protection. To meet those goals, more recyclers are pursuing certification under programs such as the Recycling Industry Operating Standard™, or RIOS™
While recycling facilities vary considerably in size and layout, key variables that affect a plant’s efficiency include maintaining a smooth flow of traffic and minimizing the number of times that material is handled. Scrap facilities have traditionally been located near major manufacturing centers. Today, recycling facilities are found all across the United States and throughout the world.
MRFs, or Materials Recovery Facilities, are recycling facilities that contract with municipalities specifically for processing residentially-sourced scrap. These are complex facilities that utilize a complicated series of conveyors, optical and infrared scanners, blowers, sink float pools, and hand sorting lines to separate paper from plastics from glass bottles from aluminum cans, and so on.
In addition to outdoor recycling plants, an increasing number of high-tech facilities with advanced sorting systems for processing plastics, electronics, recovered paper, and other commodities are located indoors.

Institute of Scrap Recycling Industries, Inc.10
ISRI.ORG/COMMODITIES2018
Where are Scrap Recycling Facilities Located?U.S. Census Bureau data show that there are more than 8,000 recycling facilities operating in the United States.

ISRI.ORG 11
Recycling Industry Yearbook 2018
Barges and domestic waterborne shipments are a third major mode of transport for scrap. While adverse weather conditions can significantly impact barge traffic, barges are often the lowest-cost option on a per-unit basis.
The containerization of scrap shipments opened overseas markets to a much wider range of U.S. scrap processors, although a large portion of U.S. scrap exports are still shipped as bulk (unpackaged) cargo. In 2017, the United States exported nearly 38 million metric tons of scrap around the world. According to preliminary data from the United Nations Comtrade database, approximately 110 million tons of scrap valued at more than $105 billion were exported globally in 2017.
How Is Scrap Transported?The three most common modes of U.S. domestic scrap transport are by truck, rail, and barge, in addition to intermodal shipments that use more than one mode. Each mode of shipment has its own costs and benefits.
While shipping via trucks can be a high per-unit cost option, trucks are a significant mode of domestic transport for scrap, especially for intra-regional scrap flows. Shipment by rail can be a less costly option per ton than trucking, and railcars have a greater tonnage capacity than trucks, although during times of tight railcar availability this mode of transport can be less predictable. In the United States, according to figures from the Association of American Railroads, 41 million tons of scrap and waste materials originated on Class I railroads in 2017.

Institute of Scrap Recycling Industries, Inc.12
ISRI.ORG/COMMODITIES2018
How is Scrap Consumed?Scrap dealers and brokers sell scrap commodities to a wide range of consumers at home and abroad such as paper mills, plastic
manufacturing plants, steel mills, foundries, copper wire and brass mills, secondary aluminum smelters, and other customers.
Manufacturers prize scrap as a raw material input due in part to the cost and energy savings gained through using scrap. For example, domestic steelmakers rely on iron and steel scrap to make roughly two out of every three pounds of steel produced. Copper scrap accounted for 34 percent of total U.S. apparent copper consumption in 2017. Metal scrap can practically be melted and re-melted an infinite number of times to make products and parts for everything from cell phones to
automobiles, bridges, and buildings. Manufacturers also rely on scrap commodities to produce a wide array of nonmetallic goods including new paper and cardboard products, plastic containers, playground surfaces, and much more. And while overseas markets have been a growing source of demand for U.S. scrap, it’s worth remembering that most of the scrap that gets processed in the United States is also consumed domestically.
According to ISRI estimates, more than 70 percent of the approximately 130 million metric tons of recovered paper, plastic, rubber, metal, glass, textiles, and other scrap commodities that were processed in the United States in 2017 was consumed at home.

ISRI.ORG 13
Recycling Industry Yearbook 2018
Evolving TechnologiesToday, the scrap recycling industry utilizes a wide range of capital equipment including high-tech shredders, shears and balers, as well as the optical scanners, x-rays, and air jets that are used to separate recycled materials. From tires and rubber to electronics, scrap recyclers are investing in new separation technology and equipment to stay ahead of competitors and gain new revenue channels.
As scrap recyclers strive to meet rising consumer demands and improve their operational, quality, environmental, health and safety, and management systems, the use of third-party certifications has been on the rise. The marketplace is pushing recyclers to become certified through programs like RIOS™ – to improve health and safety, ensure environmental compliance, meet customer demands, and secure a competitive advantage. RIOS™ is a management system certification that is designed specifically for recyclers that deal in any commodity.
Institute of Scrap Recycling Industries, Inc.14
ISRI.ORG/COMMODITIES2018
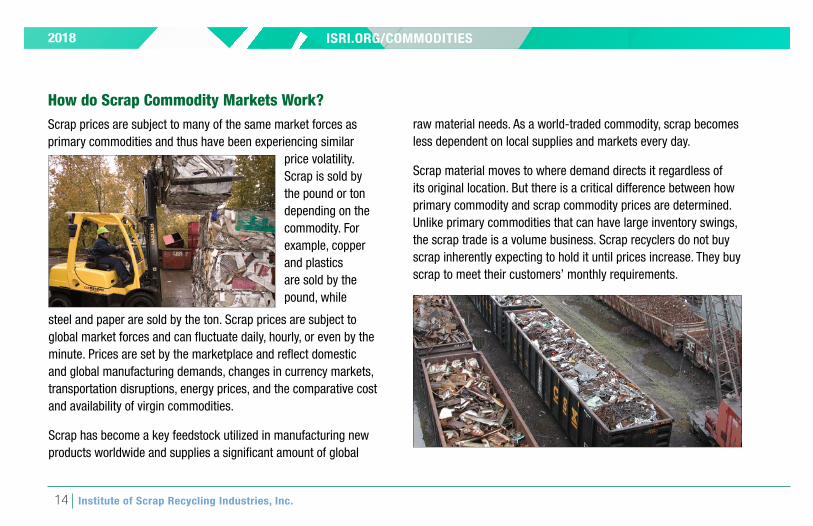
How do Scrap Commodity Markets Work?Scrap prices are subject to many of the same market forces as primary commodities and thus have been experiencing similar
price volatility. Scrap is sold by the pound or ton depending on the commodity. For example, copper and plastics are sold by the pound, while
steel and paper are sold by the ton. Scrap prices are subject to global market forces and can fluctuate daily, hourly, or even by the minute. Prices are set by the marketplace and reflect domestic and global manufacturing demands, changes in currency markets, transportation disruptions, energy prices, and the comparative cost and availability of virgin commodities.
Scrap has become a key feedstock utilized in manufacturing new products worldwide and supplies a significant amount of global
raw material needs. As a world-traded commodity, scrap becomes less dependent on local supplies and markets every day.
Scrap material moves to where demand directs it regardless of its original location. But there is a critical difference between how primary commodity and scrap commodity prices are determined. Unlike primary commodities that can have large inventory swings, the scrap trade is a volume business. Scrap recyclers do not buy scrap inherently expecting to hold it until prices increase. They buy scrap to meet their customers’ monthly requirements.

ISRI.ORG 15
Recycling Industry Yearbook 2018
Prices are based on a marketplace made up of consumers who use these recycled materials to manufacture steel, aluminum,
copper, paper, electronics, glass, and rubber products, among others. Scrap processors purchase scrap from thousands of sources each day
to keep up with expected consumer demand.
After acquiring and then processing scrap into specification-grade material, scrap processors deliver the material based on current market conditions dictated by the customer. Customers have orders to fill and thus buy scrap. Consequently scrap processors are viewed as the price taker, not the price setter, hence the phrase, “Scrap is bought, not sold.”
The ISRI Index is a weighted index of ferrous scrap, copper scrap, aluminum scrap, and recovered paper and fiber prices. Scrap prices and supply are closely connected as prices provide the incentive to bring recycled materials to the marketplace. When the ISRI Index fell to the lowest level since the Great Recession in November 2015, supplies were constrained, placing a floor under the market and setting the stage for a price recovery starting in the first half of 2016 and continuing into early 2018. Given the cyclical nature of commodity markets and industrial production, it should come as no surprise that the scrap industry faces similar business cycles.

Institute of Scrap Recycling Industries, Inc.16
ISRI.ORG/COMMODITIES2018
ISRI Index
ISRI Index: Jan 2012 - Jun 2018 (Jan 1998 = 100)
150.00
170.00
190.00
210.00
230.00
250.00
270.00
290.00
310.00
330.00
350.00

ISRI.ORG 17
CHAPTER III: The Benefits of Scrap Recycling
Direct: 155,632
Supplier:175,587
Induced: 203,287
Total:534,506
Economic BenefitsRecognized as one of the world’s first green industries, the scrap recycling industry creates and supports jobs while also having a positive impact on the environment. In 2017, the independent economic consulting firm of John Dunham and Associates performed an economic impact analysis to document the size and scope of the scrap recycling industry in the United States as well as its significant contribution to the U.S. economy in terms of employment, tax generation, and overall economic benefit.
The U.S. scrap recycling industry is a thriving economic engine and job creator. Specifically, the study found that the people and firms that purchase, process, and broker recycled materials to be manufactured into new products in America support 534,506 well-
paying jobs in the United States and generate $117 billion annually in economic activity.
According to the Dunham study, U.S. scrap processors and brokers directly employ more than 155,000 people and indirectly support more than 375,000 other jobs. These workers earn $34.3 billion in wages and benefits, while the industry pays $13.2 billion in direct federal, state, and local taxes, excluding state, and local sales taxes.
The Dunham Study is a snapshot of the industry as of April 2017.

Institute of Scrap Recycling Industries, Inc.18
ISRI.ORG/COMMODITIES2018
Environmental BenefitsIn addition to generating significant economic benefits, the scrap recycling industry is a pivotal player in environmental protection, resource conservation, and sustainable development. The industry recycled approximately 130 million metric tons of materials in 2017, transforming outdated or obsolete scrap into useful raw materials needed to produce a range of new products. In so doing, scrap recycling:
• Reduces the need to mine for new ore, cut down more trees, and otherwise deplete our natural resources;
• Produces significant energy savings as compared to using virgin materials, thereby reducing greenhouse gas emissions; and
• Reduces the amount of material being sent to landfills, saving the land for better uses.
While market forces provide the incentives to recycle and consume scrap material, scrap recycling offers real sustainable solutions for balancing economic growth and environmental stewardship. Not only does recycling conserve our limited natural resources, it
also reduces greenhouse gas emissions by significantly saving the amount of energy needed to manufacture the products that we buy, build, and use every day. The energy saved by recycling may then be used for other purposes, such as heating our homes and powering our automobiles.
Energy Saved Using Recycled Materials is Up To95% for aluminum
88% for plastic 75% for copper
60% for paper60% for steel34% for glass
DID YOU KNOW?

ISRI.ORG 19
Recycling Industry Yearbook 2018
Reduces Greenhouse GasEmissions by (CO2 equivalent)
Which is the Energy Equivalent to?
1 Car 8,811 lbs. 450 gallons of gasoline
1 Refrigerator 566 lbs. 29 gallons of gasoline
1 Computer & CRT Monitor
404 lbs. 21 gallons of gasoline
1 Washing Machine 397 lbs. 20 gallons of gasoline
4 Tires 323 lbs. 17 gallons of gasoline
1 Television 81 lbs. 4 gallons of gasoline
10 lbs. of Corrugated Cardboard
40 lbs. 2 gallons of gasoline
1 Ton of Plastic Bottles 3,380 lbs. 173 gallons of gasoline
Energy SavingsRecycling saves impressive amounts of energy which, in turn, reduces greenhouse gas emissions. According to figures from the U.S. EPA’s Greenhouse Gas Equivalencies Calculator, the nearly 130 million metric tons of commodities recycled in the U.S. last
year saved the CO2 equivalent of 410 million tons of greenhouse gas emissions, equal to the energy use of more than 43 million homes for one year.
Institute of Scrap Recycling Industries, Inc.20
ISRI.ORG/COMMODITIES2018
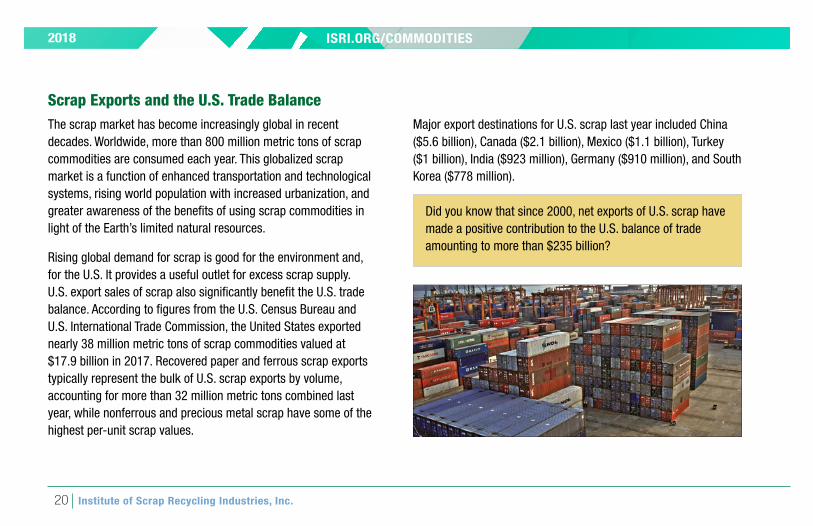
Scrap Exports and the U.S. Trade BalanceThe scrap market has become increasingly global in recent decades. Worldwide, more than 800 million metric tons of scrap commodities are consumed each year. This globalized scrap market is a function of enhanced transportation and technological systems, rising world population with increased urbanization, and greater awareness of the benefits of using scrap commodities in light of the Earth’s limited natural resources.
Rising global demand for scrap is good for the environment and, for the U.S. It provides a useful outlet for excess scrap supply. U.S. export sales of scrap also significantly benefit the U.S. trade balance. According to figures from the U.S. Census Bureau and U.S. International Trade Commission, the United States exported nearly 38 million metric tons of scrap commodities valued at $17.9 billion in 2017. Recovered paper and ferrous scrap exports typically represent the bulk of U.S. scrap exports by volume, accounting for more than 32 million metric tons combined last year, while nonferrous and precious metal scrap have some of the highest per-unit scrap values.
Major export destinations for U.S. scrap last year included China ($5.6 billion), Canada ($2.1 billion), Mexico ($1.1 billion), Turkey ($1 billion), India ($923 million), Germany ($910 million), and South Korea ($778 million).
Did you know that since 2000, net exports of U.S. scrap have made a positive contribution to the U.S. balance of trade amounting to more than $235 billion?

ISRI.ORG 21
Recycling Industry Yearbook 2018
$-
$50
$100
$150
$200
$250
Billi
ons
Cumulative Impact of U.S. Scrap Exports on the U.S. Trade Balance since 2000 ($ billions)

Institute of Scrap Recycling Industries, Inc.22
Scrap commodities are a special category of raw material commodities because their sources are often times as important as their composition. This added value makes scrap a hybrid of pure raw material and manufactured good. Like a bushel of corn or a bale of cotton, scrap materials are commodities that have a value based on how they may be consumed and what buyers are willing to pay to consume them. Commodities are traded to areas with the technology to consume them. For example, Turkey is a market economy that has the technology and capacity to produce many steel products but does not have sufficient domestic ore or scrap to meet its steelmaking needs. So market participants in Turkey will trade with U.S. scrap yards for the scrap they need to make new steel products. Rather than thinking of a single long chain, the supply chains in the global marketplace weave and interlock together much like the loops of a knitted sweater. The various commodities are like different colors and types of yarn woven together to represent the industry marketplace.
CHAPTER IV: Scrap Commodities

ISRI.ORG 23
Recycling Industry Yearbook 2018
Iron and SteelIron and steel scrap, also referred to as ferrous scrap, comes from many consumer and industrial products such as automobiles, steel structures, household appliances, railroad tracks, ships, farm equipment, and other sources. The largest single source of obsolete ferrous scrap in the United States is used vehicle scrappage, which is closely related to new
car sales. According to figures from the U.S. Bureau of Economic Analysis, light vehicle sales totaled 17.1 million units in 2017.
In addition to obsolete scrap, prompt scrap, which is generated from the manufacturing process, accounts for approximately half of the ferrous scrap supply. Today, ferrous scrap is the most recycled material in the United States and worldwide. In the United States alone, the U.S. Geological Survey estimates that 66 million metric tons of iron and steel scrap were processed in 2017.
How Is Ferrous Scrap Prepared?While a small proportion of unprepared obsolete ferrous scrap can be directly used by consumers, the vast majority of purchased iron and steel scrap requires processing by the scrap recycling industry in order to be made into new goods. Scrapyards use a variety of processes including sorting, shearing, shredding, torching, and baling to prepare ferrous scrap according to commodity-grade specifications.
The process of shredding, which was developed in the late 1950s, allows for whole cars, appliances, home fixtures, and other end-of-life products to be quickly shredded into fist-size pieces of metal, greatly increasing scrap processors´ ability to handle large items and to separate nonferrous material. In 2017, Scrap magazine reported that more than 350 shredders are installed in North America.
In addition to shredded, ferrous scrap can be grouped by prime scrap (including busheling, bundles, and clips), cut grades such and heavy melting steel, and foundry and miscellaneous grades such as machinery cast.

Institute of Scrap Recycling Industries, Inc.24
ISRI.ORG/COMMODITIES2018
Ferrous SpecificationsIn the 1920s, the U.S. Department of Commerce worked with the Institute of Scrap Iron and Steel and other industry groups to create specifications for ferrous scrap. These specifications helped facilitate ferrous scrap trading to ensure that buyers got what they asked for and sellers could more easily describe the sort of scrap they were trying to sell. Ferrous scrap specifications were codified with a three digit number system. For example, 211 refers to a specific sort of steel, Shredded Steel of an approximate density in this case, that generally comes from discarded automobiles processed through a shredder and magnetically separated from the nonferrous metals.
FERROUS SCRAP
Sorting
Shredding
Media Separation
Shearing
Baling
FERROUSSCRAP Sorting Shredding
MediaSeparation Shearing Baling
Stages of Ferrous Scrap Processing

ISRI.ORG 25
Recycling Industry Yearbook 2018
77
6267
53
6659 62
57 57 59
3.9 4.2 3.5 3.9 30
10
20
30
40
50
60
70
80
90
2013 2014 2015 2016 2017
Purchased Consumption Imports
U.S. Ferrous Scrap Purchases, Consumption, and Imports * 2013 - 2017 (millions of MT)
Sources: U.S. Geological Survey, U.S. Census Bureau, ISRI estimates * Data excludes stainless steel and alloy steel scrap

Institute of Scrap Recycling Industries, Inc.26
ISRI.ORG/COMMODITIES2018
The recycled steel is used in the
construction of items such as
buildings, bridges, and new cars.
STARTOld and broken cars that can no
longer be driven, but can be recycled.
Those old cars are sold as
scrap metal to a recycler.
Cars are inspected & potentially hazardous
materials are removed.
Scrap metal is sorted by type
of metal.
Shreddedscrap is sold to
a steel mill & melted to make
new steel. FerrousMetal
Old Cars Can Become A New BridgeThe steel in cars can be recycled and used to build other things, like bridges. Did you know:• Recycling one car saves more than 2,500 lbs. of iron ore, 1,400 lbs. of coal, and 120 lbs.
of limestone.
• Steel is the most recycled material in the United States. On average, the U.S.
the year.
• Recycling steel requires 60 percent less energy than producing steel from iron ore.
• By using ferrous scrap rather than virgin materials in the production of iron and steel, carbon dioxide emissions are reduced by 58 percent.
Cars are fed into a shredder to
sized pieces of scrap metal.
Sources: JASON Learning, ISRI
ISRI.ORG 27
Recycling Industry Yearbook 2018
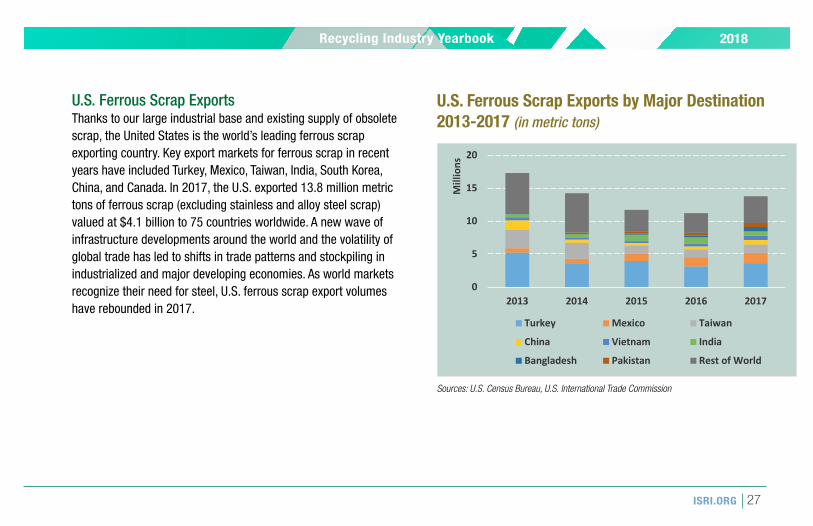
U.S. Ferrous Scrap ExportsThanks to our large industrial base and existing supply of obsolete scrap, the United States is the world’s leading ferrous scrap exporting country. Key export markets for ferrous scrap in recent years have included Turkey, Mexico, Taiwan, India, South Korea, China, and Canada. In 2017, the U.S. exported 13.8 million metric tons of ferrous scrap (excluding stainless and alloy steel scrap) valued at $4.1 billion to 75 countries worldwide. A new wave of infrastructure developments around the world and the volatility of global trade has led to shifts in trade patterns and stockpiling in industrialized and major developing economies. As world markets recognize their need for steel, U.S. ferrous scrap export volumes have rebounded in 2017.
0
5
10
15
20
2013 2014 2015 2016 2017
Mill
ions
Turkey Mexico Taiwan
China Vietnam India
Bangladesh Pakistan Rest of World
U.S. Ferrous Scrap Exports by Major Destination 2013-2017 (in metric tons)
Sources: U.S. Census Bureau, U.S. International Trade Commission

Institute of Scrap Recycling Industries, Inc.28
ISRI.ORG/COMMODITIES2018
Nonferrous MetalNonferrous metals, such as aluminum, copper, lead, nickel, tin, and zinc, do not degrade or lose their chemical properties in the recycling process. As a result, nonferrous metals have the capacity to be recycled an infinite number of times.
Making up less than 10 percent of the total quantity of recycled
Nonferrous scrap is then consumed by secondary smelters, refiners, ingot makers, foundries, and other industrial consumers in the United States and more than 70 countries worldwide. These consumers rely on nonferrous scrap as a competitive, environmentally-friendly and energy-efficient input to make brand new products, continuing the nonferrous metal life cycle. The Bureau of International Recycling (BIR) estimates that almost 40 percent of the world’s demand for copper is met using recycled material, while more than 80 percent of the zinc available for recycling is eventually recycled.
material in the United States last year, ISRI estimates that nonferrous metal scrap — including highly valued precious metal scrap — accounted for more than half of the total value of U.S. scrap recycling industry earnings in 2017. More than 8.5 million metric tons of nonferrous scrap valued at approximately $30 billion was processed in the United States last year from a wide array of consumer, commercial, and industrial sources: everything from copper and precious metal circuitry in electronic devices, to soft-drink containers, automobile batteries and radiators, aluminum siding, airplane parts, and more.

ISRI.ORG 29
Recycling Industry Yearbook 2018
MediaSeparation
NONFERROUSSCRAP Sorting Shearing Baling Melting
MediaSeparation
NONFERROUSSCRAP Sorting Shearing Baling Melting
Stages of Nonferrous Scrap Processing
Nonferrous SpecificationsIf you talk to anyone in the world who processes metals for a living and mention the word Zorba, Honey, Radio, or Saves, you’re talking about nonferrous metals like aluminum, copper, lead, and zinc. You’re also talking about combinations, shapes, sources, and chemical compositions to some degree. In 1914, the National Association of Waste Material Dealers began categorizing the different kinds of scrap metals that recyclers were processing to be used by manufacturers. Many of these transactions were made via teletype messages (like SMS text messages of today) and were charged by the letter. In order to keep the costs down, NAWMD used four-or five-letter code names for various types of nonferrous scrap. Berry, for example, means high quality (No. 1) copper wire that is free of virtually any other metals. Twitch refers to aluminum collected from shredding automobiles that went through a specific process of media separation to ensure a certain level of purity.

Institute of Scrap Recycling Industries, Inc.30
ISRI.ORG/COMMODITIES2018
AluminumAluminum holds the distinction of being both the youngest and the most widely used among all the base nonferrous metals in the United States. Aluminum is a lightweight, ductile, malleable, and corrosion-resistant metal that makes it a popular choice with manufacturers. As with other nonferrous metals, aluminum is also inherently recyclable and recycled aluminum is highly valued as a raw material input for new aluminum production. In 2017, USGS figures show aluminum metal recovered from purchased new and old scrap in the United States totaled about 3.7 million metric tons.
Aluminum can be recycled from a wide range of obsolete products including used beverage containers, aluminum siding, old radiators, used wire and cable, automobile and truck wheels, as well as end-of-life vehicles and airplanes. ISRI estimates that aluminum recovered scrap represented more than 55 percent of total U.S. apparent aluminum consumption.
The U.S. Aluminum Industry
Aluminum Recovered from Scrap (mt)
Total Aluminum Consumption (mt)
U.S. Aluminum Scrap Exports* (mt)
2017 3,700,000 6,580,000 1,568,000
2016 3,540,000 6,893,000 1,354,000
2015 3,460,000 6,719,000 1,550,000
2014 3,640,000 6,230,000 1,716,000
2013 3,480,000 6,196,000 1,867,000
* Includes UBC’s and Remelt Secondary Ingot. Sources: USGS, Census Bureau, ISRI Estimates

ISRI.ORG 31
Recycling Industry Yearbook 2018
U.S. Aluminum Scrap ConsumptionOf the 3.7 million tons of aluminum recovered from purchased scrap in the United States last year, USGS estimates that about 57 percent came from new (manufacturing) scrap and 43 percent from old scrap (discarded aluminum products). The aluminum recovered from old scrap, such as aluminum cans and other obsolete products was equivalent to about 27 percent of total U.S. apparent consumption of aluminum, according to the USGS figures.
U.S. Aluminum Industry Scrap Consumption by Consumer Type, 2017 (thousand mt, metallic content)
Secondary Smelters
1,660Independent Mill
Fabricators1,880
Foundries93
Other4

Institute of Scrap Recycling Industries, Inc.32
ISRI.ORG/COMMODITIES2018
STARTEmpty cans
are collected and sold to a
recycler.
The recycler presses hundreds of cans together to make bales,
weighing about 1000 pounds.
The bales are melted to
make large
aluminum.sheets of
aluminum are sent to a can factory.
The can factory makes new
cans from the recycled
aluminum.
Your new can completes the recycling
journey.
Your favorite beverage arrives
in a new canmade from this
process.
Aluminum
From One Can to AnotherIn this process, empty soda pop cans are recycled to make new cans. Did you know:• A used aluminum can is recycled and back on the grocery shelf in as little as 60 days.
• If all aluminum scrap processed in the United States were used solely to produce soda cans, the lined-up cans would stretch 25 million miles – the distance from Earth to Venus.
• Each year, United States domestically-recycled aluminum cans save the energy equivalent of 26 million barrels of gasoline – America’s entire gas supply for three days.
• Of an estimated total 700 million tons of aluminum produced in the world since commercial manufacturing began in the 1880s, about 75 percent is still in productive use as secondary raw material.
Sources: JASON Learning, ISRI

ISRI.ORG 33
Recycling Industry Yearbook 2018
Aluminum Scrap ExportsGiven the tremendous energy savings associated with using aluminum scrap – which can reach up to 95 percent compared with primary metal, global demand for aluminum scrap has rising sharply over the last decade.
China has been a key driver of global demand for aluminum scrap and remains the largest overseas buyer of aluminum scrap. Excluding Hong Kong (which is still treated as a separate export destination in official U.S. trade data), the United States exported more than 830,624 metric tons of aluminum scrap to China in 2017, accounting for 55 percent of total U.S. aluminum scrap exports.
843 871
703 696
0
200
400
600
800
1,000
1,200
1,400
1,600
1,800
2007 2017
China & Hong Kong Rest of World
U.S. Aluminum Scrap Exports to China & Hong Kong v. Rest of World, 2007 & 2017 (in thousands of metric tons)
Sources: U.S. Census Bureau, U.S. International Trade Administration

Institute of Scrap Recycling Industries, Inc.34
ISRI.ORG/COMMODITIES2018
CopperCopper was one of the first metals used by humanity, with archaeological evidence indicating its use more than 10,000 years ago. Today, copper remains a vital commodity used in construction, electrical equipment, transportation, consumer goods, and other products. Copper scrap is used at smelters and refineries to produce refined copper and is used at the semi-fabrication stage to produce copper rods, bars, wire, and other semi-fabricated shapes, which are transformed into power cables, plumbing tubes, and other end-use products.
According to the U.S. Geological Survey, in 2017 old scrap provided 145,000 metric tons of copper and purchased new scrap – derived from fabricating operations – contributed 715,000
metric tons of contained copper. Major consumers of copper and copper alloy scrap in the United States last year included brass mills (80 percent), smelter, refineries, and ingot makers (15 percent), and chemical plants and miscellaneous manufacturers (5 percent).
The U.S. Copper Industry
Copper Recovered from Scrap (mt)
Total Copper Usage (mt)
Copper Scrap Exports (mt)
2017 860,000 2,565,000 1,002,000
2016 810,000 2,440,000 943,000
2015 830,000 2,450,000 955,000
2014 820,000 2,380,000 1,044,000
2013 810,000 2,410,000 1,155,000
Sources: USGS, Census Bureau, ISRI Estimates

ISRI.ORG 35
Recycling Industry Yearbook 2018
In 2017, ISRI estimates that copper scrap usage in the United States represented 34 percent of total U.S. apparent consumption of refined copper. Globally, the International Copper Study Group has estimated world copper recycling input rates of between 33-35 percent in recent years, while the overall recycling efficiency rate (the efficiency with which old and new scrap are collected and recycled) has regularly exceeded 60 percent.
Copper and Copper AlloysThere are literally hundreds of different types of copper and copper alloys that use tin, lead, zinc, and other metals to form metal alloys. These metals can be subdivided into several main categories including:
• Coppers• High-copper alloys• Brasses• Bronzes
• Copper nickels• Copper-nickel-zinc alloys• Leaded coppers• Special alloys
Scrap processors have become experts at identifying different types of copper and copper alloy products in order to better ascertain their worth. ISRI specifications with names like Berry, Birch/Cliff, Druid, Honey, Ocean, and Pales cover a wide range of red metal products such as bare and insulated wire, light copper, refinery brass, red brass, yellow brass, brass ammunition, clippings, radiators, tubes, and more. As new products and alloys enter the recycling stream, ISRI specifications are continually being updated to reflect today’s marketplace. Some countries, such as India, utilize ISRI specifications in their import/export customs laws.

Institute of Scrap Recycling Industries, Inc.36
ISRI.ORG/COMMODITIES2018
Copper Scrap ExportsIn 2017, the United States exported 724,000 metric tons of copper and copper alloy scrap to mainland China and Hong Kong valued at $1.8 billion. China and Hong Kong accounted for 72 percent of all U.S. copper scrap exports by volume last year. Other important overseas markets for U.S. copper scrap export sales in 2017 included Canada ($284 million, up 48% from 2016), Germany ($143 million up 18% from 2016), South Korea ($130 million, up 19% from 2016), India ($72 million, up 9% from 2016), Japan ($90 million, up 38% from 2016), and Belgium ($57 million, stayed the same).
0
200,000
400,000
600,000
800,000
1,000,000
1,200,000
1,400,000
2007 2008 2009 2010 2011 2012 2013 2014 2015 2016 2017
China & Hong Kong Rest of World
U.S. Copper Scrap Exports to China & Hong Kong vs. Rest of World 2007 - 2017 (metric tons)
Sources: U.S. Census Bureau, U.S. International Trade Commission

ISRI.ORG 37
Recycling Industry Yearbook 2018
Nickel and Stainless SteelFor chemists, designers, and engineers, nickel is a transition element that exhibits a mixture of nonferrous and ferrous metal
properties. Among manufacturers who deal with this metal, it’s much less common for nickel to be examined on its own than as an element of
The U.S. Nickel Industry
Nickel Recovered from Scrap (mt)
Total Nickel Usage (mt)
Stainless Steel Scrap Exports (mt)
2017 90,000 231,000 488,000
2016 90,000 210,000 654,000
2015 101,900 210,000 514,000
2014 102,000 238,000 548,000
2013 88,800 199,000 643,000
Sources: USGS, Census Bureau, ISRI Estimates
corrosion-resistant alloys such as austenitic stainless steel. There are plenty of reasons why this difference in thinking occurs. Types of 18-8 stainless steel (named for their 18 percent chromium and 8 percent nickel content) account for large quantities of nickel consumption and also serve as an important scrap source for nickel. USGS figures show that 48 percent of the primary nickel consumed in the United States in 2017 went into stainless and alloy steel production, followed by nonferrous alloys and superalloys (40 percent), electroplating (8 percent), and other uses (4 percent).
Nickel, hi-temp, and stainless steel scrap come in a variety of forms such as wrought solids, clips, and turnings that are covered under ISRI specs from Aroma to Zurik. According to USGS, 90,000 tons of nickel were recovered from purchased scrap in 2017, while 1.33 million metric tons of home and purchased stainless steel scrap were consumed in the United States last year.

Institute of Scrap Recycling Industries, Inc.38
ISRI.ORG/COMMODITIES2018
Stainless and Heat Resisting Steel Meltshop Production (Ingot/Slab Equivalent) Year 2017 (in thousands of metric tons)
Provided by: International Stainless Steel Forum, Brussels
Qrt 1 Qrt 2 Qrt 3 Qrt 4 2017
Europe 1,980 1,902 1,665 1,830 7,377
USA 721 699 680 654 2,754
China 6,125 5,920 7,076 6,652 25,774
Asia (w/o China and S. Korea)
1,992 1,958 1,975 2,105 8,030
Others 845 857 1,140 1,304 4,146
World 11,664 11,335 12,536 12,545 48,081
Global Stainless Steel Production

ISRI.ORG 39
Recycling Industry Yearbook 2018
Lead and ZincLead and zinc are the two most widely used nonferrous metals after aluminum and copper. Lead has been used for centuries as a building material and to produce ceramic glazes, leaded glass and crystal, paints, and other protective coatings. Lead’s importance as an industrial metal in the modern ages solidified due to the development of storage battery technology in the mid-19th century. The recycling of automotive-type batteries spawned a viable secondary lead smelting industry in the United States. In 2017, the U.S. Geological Survey reports that lead acid batteries again accounted for about 85 percent of domestic lead use.
Other uses of lead include rolled and extruded products, shot and ammunition, alloys, pigments and compounds, and cable sheathing. USGS figures show that about 1 million metric tons of secondary lead was produced in the United States in 2017 – an amount equivalent to 60 percent of apparent domestic lead consumption, of which nearly all was recovered from postconsumer scrap.
The U.S. Lead Industry
Lead Recovered from Scrap (mt)
Total Lead Usage (mt)
Lead Scrap Exports (mt)
2017 1,000,000 1,680,000 56,000
2016 1,070,000 1,540,000 45,000
2015 1,120,000 1,540,000 47,000
2014 1,130,000 1,560,000 36,000
2013 1,150,000 1,710,000 34,000
Sources: USGS, Census Bureau, ISRI Estimates

Institute of Scrap Recycling Industries, Inc.40
ISRI.ORG/COMMODITIES2018
Zinc is mostly used as a mineral additive to protect from corrosion (galvanizing) and create useful metal alloys such as brass and bronze. Its low melting point makes it useful as a die-casting alloy and for rolling applications where more durable dies would be too expensive. Zinc is also consumed by compounding it with rubber, chemical salts, paint, and agricultural products. In the United States, USGS figures show that about 25 percent (or 33,000 metric tons) of the refined zinc produced in the United States was recovered from secondary materials.
Zinc scrap can come from a range of sources including old and new diecast zinc, new zinc clippings, drosses from galvanizing, skimmings, and ashes. Steelmaking dusts and zinc-coated steel scrap also remain rich sources of recoverable zinc. Prices for scrap zinc, such as galvanizing drosses, were frequently quoted as a percentage of the LME price. Other scrap items – such as die cast – are frequently quoted in cents per pound.
The U.S. Zinc Industry
Zinc Recovered from Scrap (mt)
Total Zinc Usage (mt)
Zinc Scrap Exports (mt)
2017 67,000 870,000 34,000
2016 65,000 780,000 30,000
2015 120,000 960,000 55,000
2014 166,000 965,000 71,000
2013 238,000 935,000 88,000
Sources: USGS, Census Bureau, ISRI Estimates

ISRI.ORG 41
Recycling Industry Yearbook 2018
Precious MetalsPrecious metals such as gold, silver, and platinum have long been valued as stores of wealth and for use in producing coinage,
jewelry, and decorative arts. Today, precious metals are used in a wide range of applications including electronic and communications
In addition, Census Bureau data indicate that more than 15,400 metric tons of precious metal scrap were exported from the United States in 2016 valued at nearly $3.6 billion.
210 135 124 123 120
1,700
1,4001,200
1,3001,150
0200400600800
1,0001,2001,4001,6001,800
2013 2014 2015 2016 2017e
Gold Silver
U.S. Secondary Production of Silver & Gold2013 - 2017 (metric tons)
Source: U.S. Geological Survey
equipment, spacecraft, and jet aircraft engines, and can be found in everything from cell phones to catalytic converters.
Given the relative scarcity and high per-unit values of precious metals, they continue to be recycled at a high rate of recovery. The U.S. Geological Survey estimates that 120 tons of new and old gold scrap and 1,150 tons of silver scrap were recycled in the United States in 2017.

Institute of Scrap Recycling Industries, Inc.42
ISRI.ORG/COMMODITIES2018
Average Annual PGM Prices ($/Troy Ounce)
Source: U.S. Geological Survey
Metal 2013 2014 2015 2016 2017
Platinum $1,490 $1,388 $1,056 $990 $960
Plalladium $730 $810 $695 $617 $860
Rhodium $1,069 $1,174 $955 $697 $1,050
Ruthenium $76 $65 $48 $42 $61
Iridium $826 $556 $544 $587 $907

ISRI.ORG 43
Recycling Industry Yearbook 2018
Recovered Paper and FiberRecovered fiber, also known as recovered paper and board, is one of the most widely recycled materials in the world. Since 1990, Americans have recycled more than 1.1 billion tons of recovered fiber and the recovery rate for paper and paperboard in the United States increased by more
The U.S. Recovered Paper and Fiber Industry
New Supply (short tons)
Recovered (short tons)
Recovery Rate
2017 77,269,000 50,822,000 65.8%
2016 77,729,000 52,196,000 67.2%
2015 77,895,000 52,040,000 66.8%
2014 78,504,000 51,171,000 65.2%
2013 78,761,000 50,128,000 63.6%
Source: American Forest and Paper Association
than 30 percent points to reach 65.8 percent in 2017.
The paper recycling segment of the scrap recycling industry collects, sorts, and processes the recovered fiber into specification grade products that were valued at more than $8.1 billion in 2017. These products are sold and transported to paper mills in the United States and worldwide for production into new packaging, office paper, tissue, newsprint, and a multitude of other paper products.
In the United States, more than three-quarters of paper mills rely on recovered fiber to make some or all of their products due in part to recovered paper’s significant cost and energy savings. In addition, the paper and fiber recovered in the United States helps to meet growing overseas demand: recovered paper valued at more than $3.2 billion was exported to more than 85 different countries in 2017, generating tremendous environmental benefits and energy savings while significantly helping the U.S. balance of trade.

Institute of Scrap Recycling Industries, Inc.44
ISRI.ORG/COMMODITIES2018
Paper GradesRecovered paper can be grouped into several main categories including:
OCC: An acronym for old corrugated containers, OCC contains a rippled middle layer that is sandwiched between two layers of linerboard. Mills use old corrugated containers to make new recycled-content shipping boxes, as well as recycled paperboard for product packaging.
News Grades: We don’t see newspapers on every doorstep these days. However, paper recyclers get this quality of paper in different ways and it still has quite a useful place in the papermaking industry. Mills primarily use news grades to make new newsprint and in recycled paperboard and tissue, among other grades.
Mixed Paper: Mixed paper is a broad category that often includes items such as discarded mail, telephone books, paperboard, magazines, and catalogs.
High-Grade De-inked Paper: This grade is made of high grade paper such as letterhead, copier paper, envelopes, and printer and converted scrap that has gone through the printing process. It must first be de-inked before it can be reprocessed into high-grade paper products such as printing and writing papers or tissue.
Pulp Substitutes: Also high-grade papers, pulp substitutes are often shavings and clippings from converting operations at paper mills and print shops. Mills can use pulp substitutes in place of virgin materials to make high-grade paper products.

ISRI.ORG 45
Recycling Industry Yearbook 2018
Stages of Recovered Paper and Fiber Processing
RECOVEREDPAPER
Sorting &Baling Shredding
Washing &Bleaching Pressing Rolling
Paper SpecificationsISRI’s Scrap Specifications Circular is used globally as a means of promoting consistency & quality in the trade of scrap – including recovered paper – within the United States and around the world. The terminology and standards contained within the ISRI Specs provide a common language for the global recycling community that allows everyone – regardless of their spoken language or geographical distance from their trading partner - to immediately understand the specific material being shipped, including allowable tolerances for contaminants or prohibitives.
Paper and fiber products are deceptively complicated and depend on rather specific mixtures. These products are also valued for properties such as being lightweight, absorptive, and flexible. The paper specifications that are important information for paper mills when formulating different kinds of paper. Paper specifications are generally referred to by a number such as Sorted Residential Papers & News (56), Hard White Envelope Cuttings (31), or Sorted Office Paper (37). These specifications help processors communicate to paper mill consumers about where the paper was collected from, the fiber content and composition, as well as the potential levels of other material contaminants.

Institute of Scrap Recycling Industries, Inc.46
ISRI.ORG/COMMODITIES2018
U.S. Recovered Paper ExportsIn addition to being consumed by domestic paper mills, the paper and fiber recovered in the United States helps to meet growing export demand as well. In 2017, the United States exported more than 18.3 million tons of recovered paper and fiber valued at more than $3.2 billion. By grade, corrugated exports accounted for 50 percent of all U.S. recovered paper and fiber exports last year, followed by mixed paper exports. China is the largest export market for U.S. recovered paper, with recovered paper export sales to mainland China alone valued at $1.7 billion in 2017.
2017 U.S. Paper Stock Export Volumes by Major Destination (metric tons)
0
2,000,000
4,000,000
6,000,000
8,000,000
10,000,000
12,000,000
Sources: U.S. Census Bureau, U.S. International Trade Commission
U.S. Paper Stock Exports (short tons)
Jan-Dec 2017
Corrugated 9,902,914
High Grade De-Inking 996,747
Mixed 3,909,449
Printed News 1,939,987
Pulp Substitutes 833,386
Other 2,623,808
Source – U.S. Census Bureau, U.S. International Trade Commission

ISRI.ORG 47
Recycling Industry Yearbook 2018
Your new computer arrives packed in a box made from this
recycling process.
STARTToday’s
newspapers can be recycled into
tomorrow’s cardboard boxes.
Old newspapers are bundled,
tied and sold to scrap paper
recyclers.
The recycler presses the
newspaper into huge bales, containing about 1000
newspapers.The bales are
sent to a paper mill where they are made into
paper pulp.
The pulp is used to make
the new cardboard
sheets.
A factory uses the
cardboard to make boxes for packaging new
products.Recovered
Paper
Old Newspapers Can Become New Again!Newspapers go through a paper recycling process so that trees don’t have to be chopped down to make new paper, protecting the environment. Did you know:• Since 1990, Americans have recycled more than 1.1 billion tons of recovered paper.
• Nearly 77 percent of all U.S. papermakers use some recovered paper to make everything from newspaper to paper packaging to o�ce paper.
• In 2016, the United States recovered more than 52 million tons of paper; that’s 335 lbs. of paper for every person in the country.
• Recycling one ton of paper saves 3.3 cubic yards of land�ll space.
Sources: JASON Learning, ISRI

Institute of Scrap Recycling Industries, Inc.48
ISRI.ORG/COMMODITIES2018
PlasticsThe manufacture and distribution of plastics is everywhere. According to PlasticsEurope, the global production of plastics (and related polymer products such as adhesives and coatings) reached 335 million metric tons in 2016. With the explosive growth in the manufacture of plastics comes the need to ensure that these materials are recycled in an environmentally-responsible manner once they reach the end of their useful lives. In the U.S. alone, ISRI estimates at least 5 million tons of post-industrial and post-consumer plastics were recycled in 2016. In addition, recycling of engineered and industrial plastics present tremendous opportunities that
According to the U.S. EPA, plastic recycling results in significant energy savings (an estimated 50–75 MBtus/ton of material recycled) compared with production of new plastics using virgin material.
While it is important that consumers recycle the plastic containers that hold food, beverages, and household cleaners as well as other plastics that arise in the home, recycling of engineered and industrial plastics is vital. Engineered and industrial plastics are typically high grade materials used as components in all types of equipment. They may be the sprocket wheel in an electric motor or the imitation wood that adorns your
vehicle interior. Engineered and industrial plastics are used as internal and external components of everything from refrigerators to computers, automobiles to boats, and medical equipment to sheet materials used in construction.
Despite the ubiquity of plastics, plastic recycling is still a young
demonstrate plastics recycling today is “Bigger Than the Bin.”
From an environmental perspective, recycled plastic can provide enormous benefits over the use of its virgin counterparts. For example, plastic lumber made with scrap plastic bags, and other materials, conserves trees and eliminates the need to use hazardous chemicals to treat wood that will be used outdoors.

ISRI.ORG 49
Recycling Industry Yearbook 2018
industry because no one really thought about recycling when plastics were first put into use. The technology to cost-effectively sort and
recycle plastics has been developed only over the past 25 years. While one can picture so much opportunity for growth in plastics recycling, there are many challenges
that confront this nascent segment of the recycling industry. The wide variety and incompatibility of the various polymer blends is a complicating factor in that plastics may look identical but be made of different, incompatible polymers. However, it is incumbent upon us to educate manufacturers about the merits of using plastics made from scrap and for those same manufacturers to Design for Recycling®, giving due consideration during the design stage to their products end-of-life. These challenges are not insurmountable and plastic recyclers are providing leadership to overcome them.
U.S. Plastic Bottle Recycling
New Supply (short tons)
Recovered (short tons)
Recovery Rate
2016 1,753 6,172 28.4%
2015 1,797 5,971 30.1%
2014 1,812 5,849 31.0%
2013 1,798 5,764 31.2%
2012 1,718 5,586 30.8%
2011 1,604 5,478 29.3%
2010 1,557 5,350 29.1%
2009 1,444 5,149 28.0%
2008 1,451 5,366 27.0%
2007 1,396 5,683 24.6%
2006 1,272 5,424 23.5%
2005 1,170 5,075 23.1%
Source: Association of Plastic Recyclers, NAPCOR

Institute of Scrap Recycling Industries, Inc.50
ISRI.ORG/COMMODITIES2018
Stages of Plastic Scrap Processing
Sorting Shredding &Compacting Washing Melting ReformingPLASTIC
SCRAP
Plastic Scrap SpecificationsThe plastic scrap market has been one of the fastest-developing scrap commodity markets. Plastic has a broad range of uses with new technological advancements happening on almost a yearly basis. ISRI, in partnership with our corporate and association partners, has been updating its plastic scrap specifications to reflect what is being traded in the plastic scrap marketplace. While chemists and plastic product manufacturers may be more concerned with the polymer composition, many incompatible plastic polymers can be used to create similar products. Is the takeout container you just received made from polyethylene, polystyrene, polypropylene, or polyethylene terephthalate? Is the plastic rigid or a flexible film? Was it extruded or thermoformed? Specifications about these various sources and categories help improve the process of recycling plastics that are being consumed everywhere.

ISRI.ORG 51
Recycling Industry Yearbook 2018
Plastic Scrap ExportsGlobal demand for plastic scrap is impacted by the relative prices of primary resins and plastic scrap, which in turn are influenced by the volatility in natural gas and crude oil markets, among other factors. By volume, plastic scrap has become one of the most important globally-traded scrap commodities. According to figures from the United Nations Comtrade Database, more than 11.7 million tons of plastic scrap valued at nearly $5.2 billion were exported by all reporting countries in 2016. Of that total, the United States exported 1.9 million metric tons of plastic scrap, generating $730 million in export sales. Last year, the United States shipped plastic scrap to more than 80 countries around the world. China and Hong Kong together accounted for more than $320 million, or 49 percent of the total. This was a significant shift from 2016 when China and Hong Kong imported nearly $500 million of U.S. plastic scrap and were the destination of 68 percent of it. Other major export destinations for U.S. plastic scrap last year included Canada ($67 million), India ($58 million), Vietnam ($49 million), and Malaysia ($31 million). This sudden drop in the export sales of plastic scrap was due to the imposition of a trade ban on recyclable plastics by China, the world’s largest consumer of plastic scrap recyclables.
U.S. Plastic Scrap Exports by Major Destination in 2017
Trade Value ($) Volume (metric tons)China $190,710,623 557,820
Hong Kong $130,662,220 372,904
Canada $67,454,563 135,795
India $58,336,236 123,116
Vietnam $49,389,260 137,042
Malaysia $31,472,356 121,125
Mexico $23,390,685 46,375
Thailand $10,772,518 32,862
Taiwan $9,299,167 33,976
Indonesia $8,307,152 29,175
Colombia $6,322,703 3,126
Australia $5,647,017 2,036
El Salvador $5,123,587 5,570
Belgium $4,268,691 1,254
Spain $4,178,527 8,594
Rest of the World $28,098,830 56,966
Sources: U.S. Census Bureau, U.S. International Trade Commission

Institute of Scrap Recycling Industries, Inc.52
ISRI.ORG/COMMODITIES2018
STARTYour family
separates your household plastic
and puts it in the bin.
Manufacturersalso collect
trimmings and other leftover plastic used
making new products.
The plastic is shredded into
small pieces and is ready to be
melted down.
These pelletsare sold to
manufacturers tobe molded and
shaped into new plastic products.
The plastic is washed to
remove contaminants such as labels
and dirt.
The plastic is sorted by color
using optical technology
combined withair jets.
The plasticis then melted
down and turned into small pellets ready for re-use. Plastics
Household Plastic Can Be Recycled Over and Over Again in ManufacturingSince 1950, the global production rate of plastic has grown steadily, and all signs point to continued growth. Because of this, there is a need to ensure that plastics are recycled when they reach the end of their useful lives so that we can protect our natural resources. While we are all familiar with the recycling of food, beverage, and other common plastic household containers, plastic recycling goes far beyond that. Engineered and industrial plastics are found in all types of products, from cars to refrigerators, and these plastics are being recycled every day as well.
Sources: JASON Learning, ISRI

ISRI.ORG 53
Recycling Industry Yearbook 2018
ElectronicsThe U.S. electronics recycling industry has shown tremendous growth over the past decade. This maturing segment of the scrap recycling industry provides a boost of approximately $20.6 billion, including exports of $1.45 billion, to the U.S. economy (up from less than $1 billion in 2002) and employs more than 45,000 full time employees (up from 6,000 in 2002).
A study published by the U.S. International Trade Commission in 2013 found that the U.S. electronics recycling industry processed more than 4.4 million tons of used and end-of-life electronics equipment annually, not including white goods. Of the used electronic products collected, the study found that 83 percent are reused and recycled domestically — including scrap steel, aluminum, copper, lead, circuit boards,
plastics, and glass. ISRI estimates that the volume of electronics recycled in the United States now exceeds 5 million tons per year.
Sophisticated technology has helped electronics recyclers become highly efficient at recycling material into valuable, specification-grade commodities which re-enter the manufacturing stream as the basis for new products. For example - one metric ton of electronic scrap from personal computers contains more gold than that recovered from 17 tons of gold ore.
Electronics recyclers repair, refurbish, and resell functioning electronics equipment as used products into domestic and international markets. Companies also provide a number of logistical services, like collection, storage, and transportation as well as scrubbing hard drives of sensitive personal and commercial data.
The industry is driven by equipment collected from businesses and commercial interests, comprising up to 75 percent of the market on a volume basis. The electronics recycling industry is poised to meet the anticipated increased demand for more used products and specification grade commodities.

Institute of Scrap Recycling Industries, Inc.54
ISRI.ORG/COMMODITIES2018
Collected UEPs4.4 million tons
DomesticRefurbishment &Recycling3.64 million tons
• Tested & Working UEPs (47,098 tons)• Working UEPs (58,021 tons)• Commodity Grade (323,772 tons)• Other - includes exports destined for redistribution, repair & recycling through channels such as warrenty programs & tracked distribution networks (102,295 tons)
THE “SLIVER”• Final Disposal (5,768 tons)• Recycling/disposal at Export Destination (84,941 tons)• Unknown (135,826 tons)
82.7% 12.1%
5.1%
Export0.76 million tons
Sources: U.S. International Trade Commission, ISRI
Flow of Used Electronic Products (UEPs)In February 2013, the U.S. International Trade Commission (USITC) released its study on Used Electronic Products: An Examination of U.S. Exports, the most comprehensive report on the collection and export of UEPs that found more than 80 percent of the UEPs collected in the United States were recycled, reused, or refurbished domestically while only 17 percent of UEPs were being sent for export. A subsequent report released by the Massachusetts Institute of Technology (MIT) Materials Systems Laboratory and
the U.S. National Center for Electronics Recycling (NCER) in 2013 indicates that more than 90 percent of used electronics collected for recycling within the United States remain in the United States for processing and are not exported. Taken together, the USITC and MIT/NCER studies provide irrefutable evidence that used electronics products are being reused and recycled in America, not “dumped” into developing countries as proponents of export controls have argued for years.

ISRI.ORG 55
Recycling Industry Yearbook 2018
Factoriesuse these valuable
ingredients to makea variety of new
products, preserving our natural resources
in the process.
STARTYour old
computer can become new
again.
Families, businesses, and schools recycle
their used electronics.
All data sources are wiped clean
and sanitized. The recycler inspects the
equipment to seeif it can be repaired. If it can, it is refurbished
and re-sold to someone who
needs it.
• If not, reusable parts are recovered for
resale and the rest is processed so valuable materials can be safely
and responsibly extracted.
Steel, copper, aluminum, plastic,
glass, and even gold and silver can all be found in electronics
and recovered for recycling.
Electronics
Your Old Computer Can Become New AgainThe U.S. electronics recycling industry annually processes more than 5 million tons of used and end-of-life electronics equipment – cell phones, TVs, computers, copiers, fax machines, music players, copiers, and even iPads! More than 70 percent of the electronics collected and recycled here in the United States can be sorted and used as ingredients in the manufacture of new products. Shredding or otherwise processing the electronics makes available the valuable materials contained within them – including steel, copper, aluminum, plastic, and glass. The rest are refurbished and resold as functioning electronic equipment both here in the United States and internationally.
Sources: JASON Learning, ISRI

Institute of Scrap Recycling Industries, Inc.56
ISRI.ORG/COMMODITIES2018
Tires and RubberIn 2016, 110 million tires were processed by the U.S. recycling industry. In the past, scrap tires — generated when an old, worn tire is replaced with a new tire — were often dumped illegally in lakes, abandoned lots, along the side of the road and in sensitive habitats. Today, scrap tires are playing a much different role as an important part of the manufacturing process. The tire and rubber recycling industry supports more than 8,500 jobs and had a total output estimated at $1.8 billion according to John Dunham & Associates. Scrap tire rubber is used in the manufacture of new tires, playground surfaces, equestrian mats, and rubberized asphalt among other products. Other cutting-edge manufacturers are combining scrap tires with materials such as scrap plastic to produce flower pots, roofing tiles, and auto parts.
A tire is a highly engineered, composite product that is virtually indestructible under a variety of conditions. This makes tires difficult to recycle but recyclers have invested millions of dollars in technologies and equipment to recycle tires. Scrap tires now play an important role in strengthening our economy and protecting our environment.
At tire recycling facilities, the main piece of equipment is the tire shredder, which uses powerful, interlocking knives to chop tires into smaller pieces.
Shredding a tire at room temperature using such knives is called ambient shredding. Tires can also be shredded through a cryogenic process that uses liquid nitrogen to freeze them at a sub-zero temperature. Such temperatures cause the physical properties of the tires to change dramatically and become very brittle.

ISRI.ORG 57
Recycling Industry Yearbook 2018
The tire is placed in an enclosure in which powerful hammers smash the tire apart.
Cryogenic grinding is used to make fine crumb rubber powders that are then used in products such as synthetic turf. The non-rubber portions of the tire also are recycled. For example, the steel beads that give the tire its shape and structure are recovered by recyclers and processed into specification grade product used by steel mills for the production of new steel. Scrap tire rubber is a highly sought material.
In 2016, 1.2 billion pounds of crumb rubber, including 92 million used tires, were used in the creation of new products ranging from sidewalks to horse tracks. Tire recycling is an economically-sound, environmentally-friendly activity that can contribute to the reduction of a product’s overall carbon footprint. In fact, the use of recycled rubber in molded products provides a substantial carbon footprint advantage over the use of virgin plastic resins, having between four and 20 times lower carbon footprint.
The future for tire recycling is strong. Applications for scrap tire rubber — such as rubberized asphalt — have become recognized for their preferable properties and is gaining in prominence and widespread use. Many states already use rubberized asphalt when they design, reconstruct or repair their roadways and it is used for several simple and straightforward reasons: it can cost less, provide safety benefits and last longer than conventional asphalt.
For more information on recycled tires and rubber, visit RecycledRubberFacts.org.

Institute of Scrap Recycling Industries, Inc.58
ISRI.ORG/COMMODITIES2018
Manufacturers turn the tire rubber into road insulation, crash barriers, and rubberized asphalt
that is used to make highways safer and
quieter.
STARTOld worn out tires
when recycled can be made into a multitude of new products, including
asphalt to pavehighways.
When a tire is no longer safe for the road it is taken to a
tire recycling facility.
There, a recycler determines
if it will be refurbished or
scrapped.
Through shredding and
grinding, scrap tires are ground into
palm-sized pieces and the steel is
removed.
The ground rubber is sold to manufacturers.
Refurbished tires are resold to consumers.
Tires
Your Old Tires Can Help Build the Newest HighwaysEach year, Americans generate approximately 300 million scrap tires. In the past, scrap tires — generated when an old, worn tire is replaced with a new tire — were often dumped illegally in lakes, abandoned lots, along the side of the road and in sensitive habitats. Today, scrap tires are playing a much di�erent role as an important part of the manufacture process with more than 90 percent recycled and reused annually. Rubber from scrap tires is used in the manufacture of landscaping mulch; playground mats and athletic surfaces; molded products such as railroad ties, �owerpots, garden hoses, welcome mats; and rubberized asphalt used in the paving of roads. Cutting-edge technologies are even being developed to allow scrap tires to be used in the manufacture of new tires!
Sources: JASON Learning, ISRI

ISRI.ORG 59
Recycling Industry Yearbook 2018
GlassGlass is made from readily available domestic materials, such as sand, soda ash, limestone and “cullet,” the industry term for furnace-ready scrap glass. Glass can be recycled again and again with no loss in quality or purity. In 2014, (the latest data available), 39.5 percent of beer and soft drink bottles were recovered for recycling, according to the U.S. EPA. Another 31.8 percent of wine and liquor bottles and 14.7 percent of food and other glass jars were recycled. In total, 32.5 percent of all glass containers were recycled, equivalent to taking 210,000 cars off the road each year.
For every ton of glass recycled, more than a ton of raw materials is saved, including 1,300 lbs. of sand, 410 lbs. of soda ash, 380 lbs. of limestone, and 160 lbs. of feldspar. Recycled glass is substituted for up to 70 percent of raw materials used in making new glass. An estimated 90 percent of recovered glass is used to make new glass bottles. Manufacturers benefit from recycling in several ways: it reduces emissions and consumption of raw materials, extends the life of plant equipment (such as furnaces) and saves energy. Glass recycling creates no additional waste or byproducts.
Glass manufacturers are requiring more and more high-quality recycled container glass to meet market demands for new glass containers. Color-sorted, contaminant-free recycled glass helps ensure that these materials are recycled into new glass containers. While curbside collection of glass recyclables can generate high participation and large amounts of recyclables, drop-off and commercial collection programs are also effective at yielding high-quality container glass.

Institute of Scrap Recycling Industries, Inc.60
ISRI.ORG/COMMODITIES2018
Glass Container Recycling Loop
* A material recovery facility is a specialized plant that receives, separates, and prepares recyclable materials for manufacturers.

ISRI.ORG 61
Recycling Industry Yearbook 2018
TextilesTextile recycling is a dynamic sector of the recycling industry that processes billions of pounds of cotton, wool, synthetic, and synthetic-blend products each year. These scrap materials come from a number of sources, ranging from apparel and home furnishing manufacturers, to textile mills and consumers.
In recent years, 2 million tons of clothing and textiles have been recovered from individuals (post-consumer) and manufacturers
(pre-consumer) in the United States each year that are recycled as new raw materials for the automotive, furniture, mattress, coarse yarn, home furnishings, paper,
and other industries. This translates to about 12 lbs. of textiles per person in the Unites States. Demand for used textiles and clothing is growing rapidly overseas as well. According to figures
from the Census Bureau, the value of U.S. exports of used textiles and clothing increased from $325 million in 2006 to nearly $667 million in 2017.
Used clothing collected from households is graded into a number of categories. Garments in good condition are exported for resale in parts of the world where new clothing is not affordable for many. This trade provides employment not only among the exporting nations, but also within the importing countries.

Institute of Scrap Recycling Industries, Inc.62
ISRI.ORG/COMMODITIES2018
$0$100$200$300$400$500$600$700$800$900
2007 2008 2009 2010 2011 2012 2013 2014 2015 2016 2017
Mill
ions
Worn Clothing Used Textile/Rags
FAS Values of U.S. Used Textile and Clothing Exports, 2007-2017 ($)
Source – U.S. Census Bureau, U.S. International Trade Commission

ISRI.ORG 63
The Expanding Scrap Marketplace The scrap market has become increasingly global in nature in recent decades. Figures from theUnited Nations Comtrade Database show that in 2017 (as reported through Sep 2018), showed exports of all scrap commodities from around the world were valued at approximately $105 billion. While the United States is the largest exporter of recycled commodities in the world and up until the end of 2017 China has been the world’s dominant consumer of commodities (including scrap), the scrap marketplace is far from bilateral, stretching to virtually every corner of the globe.
The globalized scrap market is a function of enhanced transportation and technological systems, the rising world population and increased urbanization, as well as the heightened awareness of the benefits of using scrap commodities given the earth’s limited natural resources. Those
benefits include not only the relatively lower price of scrap as compared to most other raw material inputs, but also
the resulting energy savings and environmental benefits about which manufacturers and
society at large are becoming increasingly mindful. As a result, global scrap usage is
expected to register continued growth in the decades ahead as the confluence of demographic, climate, sustainable development, market, and technological changes provide even greater incentives to use recycled goods.
But the growth in global scrap usage is not limited to any one commodity, industry,
or region. BIR figures also show that more than 36 million tons of nonferrous scrap were
consumed globally in 2011 and 233 million tons of recovered paper and fiber worldwide were consumed in 2012.
CHAPTER V: The Global Scrap Marketplace

Institute of Scrap Recycling Industries, Inc.64
ISRI.ORG/COMMODITIES2018
The following charts provide updated snapshots of where recycled commodities are being shipped and consumed by the major scrap commodities and markets around the globe. Of the 600 million metric tons of ferrous scrap consumed in 2017, the BIR
reports that China consumed 148 million metric tons, followed by European Union countries (93 million), the United States (nearly 59 million), and Japan (nearly 36 million).
Ferrous Scrap Use by Major Consumers 2013-2017 (million metric tons)
*No direct comparisons can be made because most of the steel scrap consumed by the outdated induction furnaces was not included in the figures for 2016 and for preceding years. Source: Bureau of International Recycling
2013 2014 2015 2016 2017 % 2017/2016
China 85.7 85.5 83.3 90.1 147.9 N.A.*
EU-28 90.3 91.6 90.61 88.4 93.35 +5.6
U.S.A. 59.0 62.0 56.5 56.7 58.8 +3.7
Japan 36.7 36.9 33.53 33.57 35.8 +6.6
Korea Rep. 32.7 32.6 29.85 27.4 30.5 +11.3
Turkey 30.4 28.2 24.1 25.9 30.3 +17.0
Russia 25.9 30.7 27.2 27.8 28.5 +2.5

ISRI.ORG 65
Recycling Industry Yearbook 2018
Ferrous Scrap Export Market Development (Global participation: Green-increased, Red-declined) 2016 to 2017
Source: Abrams World Trade Wiki, UN Comtrade Database Labs

Institute of Scrap Recycling Industries, Inc.66
ISRI.ORG/COMMODITIES2018
Import and Export Flows of Copper Scrap for 2016 (Red – Export, Blue – Import)
Source: Chatham House’s resourcetrade.earth database visualizer

ISRI.ORG 67
Recycling Industry Yearbook 2018
Main Flows of U.S. Steel Scrap Exports 2017 (million metric tons)
Source: Bureau of International Recycling

Institute of Scrap Recycling Industries, Inc.68
ISRI.ORG/COMMODITIES2018
Who’s Exporting Recovered Paper in 2016
Source: Harvard Center for International Development – Atlas of Economic Complexity
Africa
Asia
Oceania
Europe
North America
South America
Other

ISRI.ORG 69
Recycling Industry Yearbook 2018
Source: Harvard Center for International Development – Atlas of Economic Complexity
Africa
Asia
Oceania
Europe
North America
South America
Other
$13B
$12B
$11B
$9B
$8B
$10B
$7B
$6B
$5B
$4B
$3B
$2B
$1B
$0
20121996 1998 2000 2002 2004 2006 20102008 2014 2016
CURR
ENT
GROS
S IM
PORT
Who’s Importing Recovered Paper in 2016

Institute of Scrap Recycling Industries, Inc.70
ISRI.ORG/COMMODITIES2018
China’s Role in the Global Recycling Marketplace It would be hard to overstate how significantly China’s surge in demand for scrap imports impacted the global recycling marketplace. China’s rapid economic growth and lack of domestic scrap supply, along with competitive scrap prices and attractive shipping rates, spurred massive demand for imported scrap (see chart).
Today, China’s rising domestic supply of scrap, investment in scrap processing, and import restrictions are having an equally significant impact on the global scrap market. Scrap recyclers remain extremely responsive to changing market conditions and are focused on producing consistently high quality scrap commodities to meet consumer demands at home and abroad.
U.S. Exports of All Scrap Commodities to China (incl. Hong Kong) 1993-2017 (metric tons)
Sources: Census Bureau, USITC

ISRI.ORG 71
CHAPTER VI: Statistical Appendices
Appendix A: Historical Production, Recovery, and Consumption DataU.S. Iron & SteelU.S. Iron & Steel Scrap Production, Producer Stocks, and Apparent Consumption from Purchased and Home Scrap 1943–2017 (metric tons)
Year Production StocksApparent
Consumption1943 56,000,000 5,330,000 56,000,000
1944 55,000,000 4,010,000 56,000,000
1945 51,000,000 3,560,000 51,000,000
1946 45,000,000 3,080,000 45,000,000
1947 56,000,000 4,020,000 55,000,000
1948 61,000,000 5,860,000 59,000,000
1949 47,000,000 5,120,000 49,000,000
1950 62,000,000 4,920,000 63,000,000
1951 69,000,000 3,960,000 70,000,000
1952 65,000,000 6,260,000 63,000,000
1953 70,000,000 6,490,000 70,000,000
1954 57,000,000 6,670,000 56,000,000
1955 74,000,000 6,540,000 74,000,000
1956 77,000,000 6,730,000 73,000,000
1957 68,000,000 8,120,000 67,000,000
1958 52,000,000 8,700,000 51,000,000
1959 60,000,000 9,070,000 60,000,000
1960 60,000,000 8,430,000 60,000,000
1961 58,000,000 8,000,000 58,000,000
1962 60,000,000 7,690,000 60,000,000
1963 67,000,000 7,210,000 68,000,000
1964 76,000,000 6,740,000 77,000,000
1965 83,000,000 6,930,000 82,000,000
1966 84,000,000 7,430,000 83,000,000
1967 84,000,000 7,070,000 77,000,000
Year Production StocksApparent
Consumption1968 85,000,000 7,150,000 79,000,000
1969 91,000,000 5,940,000 86,000,000
1970 84,000,000 6,960,000 78,000,000
1971 81,000,000 7,710,000 75,000,000
1972 91,000,000 7,410,000 85,000,000
1973 103,000,000 6,430,000 94,000,000
1974 105,000,000 7,630,000 96,000,000
1975 84,000,000 7,950,000 75,000,000
1976 90,000,000 9,060,000 82,000,000
1977 89,000,000 8,490,000 84,000,000
1978 93,000,000 7,510,000 90,000,000
1979 99,000,000 7,910,000 90,000,000
1980 85,000,000 7,270,000 76,000,000
1981 83,000,000 7,360,000 77,000,000
1982 56,000,000 5,820,000 51,000,000
1983 62,000,000 5,270,000 56,000,000
1984 67,000,000 4,770,000 60,000,000
1985 71,000,000 4,630,000 64,000,000
1986 69,000,000 3,940,000 60,000,000
1987 72,000,000 4,390,000 62,000,000
1988 79,000,000 4,130,000 70,000,000
1989 75,000,000 4,290,000 68,000,000
1990 80,000,000 4,300,000 69,000,000
1991 69,000,000 4,100,000 62,000,000
1992 71,000,000 3,800,000 63,000,000
Year Production StocksApparent
Consumption1993 76,000,000 3,700,000 68,000,000
1994 78,000,000 4,100,000 70,000,000
1995 79,000,000 4,200,000 72,000,000
1996 77,000,000 5,200,000 71,000,000
1997 79,000,000 5,500,000 73,000,000
1998 76,000,000 5,300,000 73,000,000
1999 72,000,000 5,450,000 70,800,000
2000 76,000,000 5,320,000 74,600,000
2001 73,000,000 4,910,000 70,100,000
2002 73,000,000 4,930,000 69,500,000
2003 73,000,000 4,410,000 65,000,000
2004 73,000,000 5,400,000 66,500,000
2005 73,000,000 4,970,000 65,600,000
2006 71,000,000 4,210,000 64,600,000
2007 77,000,000 4,140,000 64,000,000
2008 84,000,000 4,340,000 67,600,000
2009 80,000,000 3,070,000 53,500,000
2010 76,000,000 3,330,000 59,700,000
2011 82,000,000 3,980,000 62,800,000
2012 80,000,000 4,200,000 63,000,000
2013 86,000,000 4,200,000 71,000,000
2014 69,000,000 4,300,000 59,000,000
2015 73,000,000 4,400,000 64,000,000
2016 71,000,000 4,400,000 52,000,000
2017 73,000,000 4,000,000 62,000,000
Source: U.S. Geological Survey

Institute of Scrap Recycling Industries, Inc.72
ISRI.ORG/COMMODITIES2018
U.S. Primary Refined Copper
YearPrimary
ProductionCopper From
Old ScrapCopper From New Scrap
1943 1,250,000 388,000 597,000
1944 1,110,000 414,000 448,000
1945 1,010,000 451,000 462,000
1946 797,000 369,000 360,000
1947 1,050,000 457,000 416,000
1948 1,010,000 459,000 424,000
1949 842,000 348,000 299,000
1950 1,130,000 440,000 446,000
1951 1,100,000 416,000 430,000
1952 1,070,000 376,000 443,000
1953 1,170,000 390,000 480,000
1954 1,100,000 369,000 393,000
1955 1,220,000 467,000 430,000
1956 1,310,000 425,000 419,000
1957 1,320,000 403,000 361,000
1958 1,230,000 373,000 350,000
1959 996,000 429,000 417,000
1960 1,380,000 390,000 401,000
1961 1,410,000 373,000 397,000
1962 1,460,000 377,000 459,000
1963 1,450,000 383,000 501,000
1964 1,500,000 430,000 562,000
1965 1,550,000 466,000 671,000
1966 1,550,000 485,000 725,000
1967 1,030,000 438,000 614,000
YearPrimary
ProductionCopper From
Old ScrapCopper From New Scrap
1968 1,300,000 472,000 633,000
1969 1,580,000 522,000 726,000
1970 1,600,000 457,000 675,000
1971 1,440,000 404,000 685,000
1972 1,700,000 416,000 765,000
1973 1,700,000 441,000 808,000
1974 1,500,000 439,000 781,000
1975 1,310,000 335,000 547,000
1976 1,400,000 380,000 659,000
1977 1,360,000 410,000 675,000
1978 1,450,000 502,000 746,000
1979 1,520,000 604,000 948,000
1980 1,220,000 613,000 824,000
1981 1,540,000 592,000 816,000
1982 1,230,000 518,000 670,000
1983 1,210,000 449,000 634,000
1984 1,170,000 461,000 659,000
1985 1,060,000 503,000 636,000
1986 1,070,000 477,000 649,000
1987 1,130,000 498,000 716,000
1988 1,410,000 518,000 789,000
1989 1,480,000 548,000 761,000
1990 1,580,000 536,000 775,000
1991 1,580,000 533,000 667,000
1992 1,710,000 554,000 722,000
YearPrimary
ProductionCopper From
Old ScrapCopper From New Scrap
1993 1,790,000 543,000 748,000
1994 1,840,000 500,000 827,000
1995 1,930,000 443,000 874,000
1996 2,010,000 428,000 891,000
1997 2,070,000 498,000 967,000
1998 2,140,000 466,000 956,000
1999 1,890,000 381,000 949,000
2000 1,580,000 358,000 955,000
2001 1,630,000 316,000 833,000
2002 1,440,000 208,000 842,000
2003 1,250,000 207,000 737,000
2004 1,260,000 191,000 774,000
2005 1,210,000 183,000 769,000
2006 1,210,000 151,000 819,000
2007 1,270,000 162,000 772,000
2008 1,220,000 159,000 700,000
2009 1,110,000 138,000 639,000
2010 1,060,000 143,000 642,000
2011 992,000 153,000 649,000
2012 962,000 160,000 650,000
2013 993,000 166,000 640,000
2014 1,050,000 173,000 640,000
2015 1,090,000 166,000 670,000
2016 1,180,000 150,000 640,000
2017 1,090,000 145,000 715,000
U.S. Primary Refined Copper Production, Old, and New Copper Scrap Recovery, 1943–2017 (metric tons)
Source: U.S. Geological Survey

ISRI.ORG 73
Recycling Industry Yearbook 2018
Source: U.S. Geological Survey
U.S. Primary Aluminum
U.S. Primary Aluminum Production and Secondary Production from Old and New Aluminum Scrap, 1943–2017 (metric tons)
YearPrimary
Production
Secondary Production Old Scrap
Secondary Production New Scrap
1943 834,600 30,000 255,000
1944 704,000 20,800 275,000
1945 449,100 24,800 246,000
1946 371,900 82,100 170,000
1947 518,900 149,000 164,000
1948 565,200 86,800 173,000
1949 547,000 40,500 124,000
1950 651,900 69,000 152,000
1951 759,300 70,000 196,000
1952 850,000 64,000 212,000
1953 1,136,000 72,000 263,000
1954 1,325,000 60,000 224,000
1955 1,421,000 91,000 285,000
1956 1,523,000 88,000 300,000
1957 1,495,000 89,000 315,000
1958 1,421,000 73,000 249,000
1959 1,773,000 94,000 313,000
1960 1,827,000 86,000 311,000
1961 1,727,000 142,000 299,000
1962 1,921,000 152,000 377,000
1963 2,098,000 144,000 449,000
1964 2,316,000 147,000 494,000
1965 2,498,000 186,000 566,000
1966 2,693,000 170,000 635,000
1967 2,966,000 159,000 638,000
YearPrimary
Production
Secondary Production Old Scrap
Secondary Production New scrap
1968 2,953,000 164,000 740,000
1969 3,441,000 181,000 862,000
1970 3,607,000 179,000 728,000
1971 3,561,000 196,000 757,000
1972 3,739,000 227,000 795,000
1973 4,109,000 240,000 886,000
1974 4,448,000 276,000 887,000
1975 3,519,000 305,000 816,000
1976 3,856,000 371,000 963,000
1977 4,118,000 482,000 974,000
1978 4,358,000 522,000 996,000
1979 4,557,000 557,000 1,060,000
1980 4,654,000 617,000 960,000
1981 4,489,000 758,000 1,030,000
1982 3,274,000 782,000 884,000
1983 3,353,000 820,000 953,000
1984 4,099,000 825,000 935,000
1985 3,500,000 850,000 912,000
1986 3,037,000 784,000 989,000
1987 3,343,000 852,000 1,130,000
1988 3,944,000 1,050,000 1,080,000
1989 4,030,000 1,010,000 1,040,000
1990 4,048,000 1,360,000 1,030,000
1991 4,121,000 1,320,000 969,000
1992 4,042,000 1,610,000 1,140,000
YearPrimary
Production
Secondary Production Old Scrap
Secondary Production New Scrap
1993 3,695,000 1,630,000 1,310,000
1994 3,299,000 1,500,000 1,580,000
1995 3,375,000 1,510,000 1,680,000
1996 3,577,000 1,570,000 1,730,000
1997 3,603,000 1,530,000 2,020,000
1998 3,713,000 1,500,000 1,950,000
1999 3,779,000 1,570,000 2,120,000
2000 3,668,000 1,370,000 2,080,000
2001 2,637,000 1,210,000 1,760,000
2002 2,707,000 1,170,000 1,750,000
2003 2,703,000 1,070,000 1,750,000
2004 2,516,000 1,160,000 1,870,000
2005 2,481,000 1,080,000 1,950,000
2006 2,284,000 1,580,000 2,800,000
2007 2,554,000 1,660,000 2,450,000
2008 2,658,000 1,500,000 2,130,000
2009 1,727,000 1,260,000 1,570,000
2010 1,726,000 1,250,000 1,540,000
2011 1,986,000 1,470,000 1,640,000
2012 2,070,000 1,630,000 1,802,000
2013 1,946,000 1,630,000 1,790,000
2014 1,710,000 1,690,000 1,870,000
2015 1,587,000 1,560,000 2,000,000
2016 841,000 1,580,000 2,010,000
2017 740,000 1,600,000 2,100,000

Institute of Scrap Recycling Industries, Inc.74
ISRI.ORG/COMMODITIES2018
Source: U.S. Geological Survey
U.S. Paper & Paperboard
U.S. Paper and Paperboard Supply, Recovery, and Recovery Rates, 1990–2017 (1,000 tons)
Year Supply Recovered Recovery Rate
1990 86,796 29,112 33.50%
1991 85,071 31,201 36.70%
1992 88,273 33,954 38.50%
1993 91,538 35,460 38.70%
1994 95,718 39,691 41.50%
1995 95,971 42,189 44.00%
1996 94,529 43,076 45.60%
1997 99,557 43,989 44.20%
1998 101,183 45,077 44.60%
1999 105,316 46,818 44.50%
2000 102,810 47,311 46.00%
2001 97,395 46,996 48.30%
2002 98,949 47,645 48.20%
2003 98,018 49,255 50.30%
Year Supply Recovered Recovery Rate
2004 101,884 50,187 49.30%
2005 99,613 51,272 51.50%
2006 100,665 53,314 53.00%
2007 97,007 54,325 56.00%
2008 89,838 51,822 57.70%
2009 78,711 50,036 63.60%
2010 81,784 51,545 63.00%
2011 79,444 52,767 66.40%
2012 78,619 51,092 65.00%
2013 78,761 50,128 63.60%
2014 78,504 51,171 65.20%
2015 77,895 52,040 66.8%
2016 77,729 52,196 67.2%
2017 77,269 50,822 65.80%

ISRI.ORG 75
Recycling Industry Yearbook 2018
Source: UN Comtrade Database
Appendix B: Global Scrap Exports by Commodity
2016 Global Scrap Trade Export Flow
Commodity Volume (mt) Value ($)
Ferrous 76,667,427 $24,337,286,284
Paper 38,334,765 $9,141,209,816
Nonferrous 15,181,962 $29,339,964,521
Copper 4,586,792 $16,127,263,021
Aluminum 7,898,106 $9,757,112,183
Nickel 135,848 $498,217,978
Lead 1,344,039 $453,145,016
Zinc 371,163 $457,247,699
Other base metals 846,014 $2,046,978,624
Plastics 11,743,468 $5,266,362,704
Rubber 1,199,513 $529,722,322
Precious Metals 359,545 $16,127,263,021
Textiles 769,752 $502,145,035
Glass 3,406,545 $366,301,018
World Total 144,256,432 $85,243,953,703

Institute of Scrap Recycling Industries, Inc.76
ISRI.ORG/COMMODITIES2018
Appendix C: Global Flows by Country and YearGlobal Exports of Ferrous Scrap by Country and Year(in metric tons)
Top 20 Exporters 2006 2007 2008 2009 2010 2011 2012 2013 2014 2015 2016
USA 14,872,679 16,480,539 21,544,131 22,421,369 20,498,154 24,479,347 21,336,156 18,462,548 15,851,693 12,757,824 12,635,807
Japan 7,653,727 6,447,304 5,437,263 9,397,866 6,463,708 5,442,464 8,585,766 8,149,661 7,338,714 7,838,577 8,706,388
Germany 8,328,422 7,770,488 8,268,658 7,275,297 9,175,797 9,852,132 9,809,707 9,236,668 9,487,994 8,106,175 8,520,295
United Kingdom 7,423,818 6,023,730 6,629,202 6,019,142 7,482,950 7,895,261 7,295,690 6,947,474 6,987,184 7,268,765 8,128,932
Netherlands 4,786,987 4,500,919 4,523,660 4,764,766 5,541,773 5,692,223 5,695,180 5,517,477 5,295,208 4,811,323 5,611,638
Russian Federation 9,633,475 7,915,602 6,035,629 2,386,411 4,031,752 4,377,943 4,557,101 4,542,095 5,765,412 5,580,354 5,572,857
France 6,020,127 6,193,938 5,985,486 5,210,196 6,647,972 6,255,942 6,286,887 6,183,301 6,291,790 5,423,243 5,518,586
Canada 3,927,599 4,738,335 3,705,300 4,794,046 5,190,665 4,845,641 4,551,810 4,537,463 4,510,092 3,420,757 3,634,286
Belgium 2,938,371 2,922,269 2,929,794 3,238,537 3,721,636 3,521,378 3,623,825 3,511,140 3,950,346 3,153,412 3,557,354
Czechia 1,497,647 1,676,692 1,832,764 1,443,888 1,811,045 2,085,362 2,085,809 1,967,522 2,125,940 1,847,040 1,881,439
Australia 1,357,582 1,432,189 1,750,846 1,884,924 1,584,114 1,767,939 2,198,674 2,198,625 2,300,988 1,869,225 1,579,771
Denmark 1,276,516 1,522,778 1,619,517 1,239,493 1,504,705 1,486,127 1,321,972 1,244,207 1,686,253 1,264,293 1,563,818
Sweden 850,105 1,095,063 1,449,321 1,438,647 1,355,138 1,505,398 1,551,724 1,316,710 1,489,924 1,249,784 1,402,797
UAE 529,249 960,516 1,211,409 1,184,145 1,206,860 1,253,063 1,194,263 1,167,376 1,074,126 1,091,532 1,273,830
Poland 1,197,586 1,162,408 1,378,317 959,965 1,396,561 1,889,352 1,930,729 1,972,367 1,986,216 1,368,470 1,267,384
Austria 1,122,616 1,261,105 1,382,962 1,076,351 1,034,399 950,865 1,008,502 963,642 1,055,952 1,071,095 1,123,220
Hong Kong 923,385 1,045,849 1,016,360 865,562 779,399 877,766 804,652 896,714 924,451 868,994 1,048,817
Hungary 954,951 904,287 1,008,287 680,324 1,076,879 1,269,437 1,185,649 1,126,929 1,057,364 862,143 918,105
Singapore 500,382 598,515 623,753 555,924 585,053 605,936 851,953 978,876 909,828 843,716 828,019
Romania 1,862,498 1,963,212 1,985,975 2,565,442 2,519,235 2,348,562 1,908,067 1,947,542 1,430,949 716,646 702,228
Rest of the World 18,389,867 20,476,334 19,868,173 15,189,164 19,257,563 24,234,755 20,796,725 16,071,092 16,861,593 15,612,367 13,818,555
Grand Total 96,047,589 97,092,074 100,186,807 94,591,459 102,865,357 112,636,892 108,580,839 98,939,429 98,382,016 87,025,738 89,294,125
*Notes1) Data tables were derived from the UN Comtrade Database (last downloaded on March 23, 2018)2) Top 20 determined by latest year of complete data3) Data includes stainless steel (HTS – 7204210000) and alloy steel (HTS – 7204290000)4) Export data was adjusted for the Netherlands, and Canada
Global Trade-Ferrous Scrap Exports
*Notes1) Data tables were derived from the UN Comtrade Database (last downloaded on March 23, 2018)2) Top 20 determined by latest year of complete data3) Data includes stainless steel (HTS – 7204210000) and alloy steel (HTS – 7204290000)4) Export data was adjusted for the Netherlands, and Canada

ISRI.ORG 77
Recycling Industry Yearbook 2018
Global Trade-Ferrous Scrap ImportsGlobal Imports of Ferrous Scrap by Country and Year(in metric tons)
Top 20 Importers 2006 2007 2008 2009 2010 2011 2012 2013 2014 2015 2016
Turkey 15,074,009 17,140,855 17,414,983 15,665,319 19,192,350 21,460,461 22,415,029 19,724,892 19,068,156 16,251,308 17,716,247
India 3,418,187 3,051,664 4,603,204 5,136,907 4,676,394 6,265,265 8,179,601 5,636,399 5,699,006 6,710,088 6,380,452
Rep. of Korea 5,616,235 6,880,885 7,313,414 7,800,414 8,089,529 8,626,039 10,125,916 9,261,167 8,001,567 5,745,884 5,842,211
Italy 5,682,247 5,265,184 5,751,165 3,347,489 4,619,195 5,753,381 5,272,709 4,960,353 5,146,318 4,649,968 4,434,285
Belgium 4,206,826 4,344,950 4,143,336 3,643,458 4,626,473 4,563,802 4,284,462 4,595,179 4,785,015 4,171,886 4,304,573
Germany 5,932,605 5,920,071 5,675,167 3,865,111 5,305,194 6,639,700 5,792,845 5,676,700 5,324,260 4,637,419 4,259,242
Spain 7,346,851 6,472,865 6,603,208 4,930,416 5,708,900 4,764,338 4,348,807 4,851,614 4,928,153 5,120,222 4,042,165
Pakistan 1,356,059 2,140,551 1,871,037 2,254,182 1,771,139 1,583,931 1,772,885 1,780,714 2,482,543 3,256,900 4,038,195
Viet Nam 567,209 828,319 1,082,299 2,065,522 2,126,335 3,234,553 3,280,695 3,232,855 3,375,564 3,185,923 3,893,842
Taiwan 4,458,882 5,418,435 5,542,389 3,915,292 5,374,122 5,331,247 4,955,519 4,453,005 4,272 3,373,657 3,154,978
Netherlands 2,321,144 1,669,159 1,842,597 2,846,151 1,988,278 2,188,452 2,378,258 2,290,454 2,359,263 2,233,172 2,471,753
Luxembourg 3,238,139 3,173,113 2,800,650 2,030,226 2,694,245 2,635,424 2,464,483 2,251,732 2,225,575 2,121,316 2,263,786
China 5,383,017 3,365,131 3,516,417 13,620,675 5,766,245 6,692,180 4,934,728 4,439,242 2,524,060 2,283,777 2,160,644
Mexico 1,560,873 1,418,350 1,257,029 849,697 786,362 732,883 946,455 863,775 914,665 1,482,877 1,892,621
Canada 1,870,845 1,667,222 1,689,516 1,416,166 3,024,594 1,861,455 2,656,533 1,753,949 2,918,818 1,717,166 1,844,290
France 3,206,787 3,076,905 3,050,559 2,310,634 2,354,206 2,596,201 2,629,456 2,309,007 2,405,454 2,200,963 1,831,565
Portugal 1,155,846 1,128,685 1,165,430 1,039,658 902,988 1,252,275 1,196,298 1,407,787 1,524,391 1,515,346 1,427,592
Belarus 1,477,413 1,399,415 1,418,570 1,294,326 1,593,836 1,561,015 1,356,745 1,262,243 1,253,909 1,382,061 1,234,730
Austria 1,070,337 1,345,517 1,783,766 1,143,787 991,578 1,016,309 1,007,905 1,168,752 1,270,084 1,215,013 1,042,605
Indonesia 1,001,690 1,259,932 1,898,539 1,484,059 1,642,360 2,156,920 1,943,845 2,398,735 2,136,802 1,019,586 1,019,791
Rest of the World 21,396,090 20,479,454 22,656,186 13,967,597 18,321,558 19,965,626 17,810,340 16,099,780 13,649,111 14,816,006 10,187,742
Grand Total 97,341,293 97,446,661 103,079,461 94,627,086 101,555,879 110,881,457 109,753,514 100,418,334 91,996,985 89,090,537 85,443,308
*Notes1) Data tables were derived from the UN Comtrade Database (last downloaded on March 23, 2018)2) Top 20 determined by latest year of complete data3) Data includes stainless steel (HTS – 7204210000) and alloy steel (HTS – 7204290000)4) Import data was adjusted for Viet Nam and the Netherlands
*Notes1) Data tables were derived from the UN Comtrade Database (last downloaded on March 23, 2018)2) Top 20 determined by latest year of complete data3) Data includes stainless steel (HTS – 7204210000) and alloy steel (HTS – 7204290000)4) Import data was adjusted for Viet Nam and the Netherlands

Institute of Scrap Recycling Industries, Inc.78
ISRI.ORG/COMMODITIES2018
Global Trade-Copper Scrap ExportsGlobal Exports of Copper Scrap by Country and Year(in metric tons)
Top 20 Exporters 2006 2007 2008 2009 2010 2011 2012 2013 2014 2015 2016
USA 803,121 906,511 908,130 842,573 1,041,918 1,242,556 1,189,395 1,154,931 1,043,916 954,167 943,552Germany 498,916 480,697 478,640 450,012 578,451 584,804 592,067 518,631 530,557 517,706 474,634
United Kingdom 317,073 346,760 358,159 430,373 421,131 514,347 373,751 291,924 295,739 263,912 310,403France 290,527 281,470 266,214 234,860 290,325 313,464 320,423 299,084 321,116 279,313 289,614
Netherlands 306,132 229,090 241,332 143,329 283,847 315,437 322,592 295,139 326,278 303,598 278,229Japan 411,734 422,903 395,458 359,535 285,642 287,769 327,930 313,043 294,003 261,100 258,677Italy 104,310 123,321 151,640 160,106 167,441 174,204 181,890 172,209 173,402 176,256 199,404
Canada 164,638 163,300 101,607 146,569 157,787 178,577 182,792 154,038 161,967 156,990 160,820Spain 85,454 88,030 84,783 100,498 102,236 87,122 159,419 156,511 150,874 156,617 157,692Mexico 125,858 122,307 128,715 107,995 125,982 116,266 147,260 144,087 114,051 114,313 123,419Belgium 161,672 186,795 162,219 111,183 142,841 164,958 168,461 157,204 128,490 105,691 113,018
Saudi Arabia 72,578 96,213 64,827 61,521 90,154 89,716 107,358 110,809 118,991 108,336 91,367Switzerland 74,079 75,542 82,687 71,204 75,973 84,373 86,964 80,104 82,237 82,921 83,224Rep. of Korea 201,689 216,151 191,500 186,958 100,090 84,608 119,105 95,652 85,669 71,322 82,296
United Arab Emirates 56,332 47,483 53,969 48,001 71,968 86,160 102,979 102,542 95,713 82,699 78,870Australia 51,267 48,389 51,267 62,433 73,613 80,381 85,246 104,034 88,052 81,192 76,866Poland 55,602 62,221 60,838 53,456 71,215 59,537 48,478 58,936 61,677 62,962 74,120Sweden 45,455 54,760 57,248 55,519 43,318 58,037 58,870 56,470 66,821 65,208 71,823Thailand 60,327 106,897 76,378 69,669 66,368 74,604 81,413 69,364 69,562 59,260 70,773Chile 67 100 64 74 120,828 60,638 25,331 52,976 51,704 50,559 65,679
Rest of the World 1,279,451 1,170,400 1,102,671 1,035,128 1,246,076 1,330,620 1,331,332 3,595,315 5,530,427 2,249,692 986,166Grand Total 5,166,282 5,229,339 5,018,347 4,730,997 5,557,203 5,988,176 6,024,926 5,589,066 5,351,580 5,021,164 4,990,647
*Notes1) Data tables were derived from the UN Comtrade Database (last downloaded on March 23, 2018)2) Top 20 determined by latest year of complete data3) Export data adjusted for Pakistan, United Arab Emirates, and the United States
*Notes1) Data tables were derived from the UN Comtrade Database (last downloaded on March 23, 2018)2) Top 20 determined by latest year of complete data3) Export data adjusted for Pakistan, United Arab Emirates, and the United States

ISRI.ORG 79
Recycling Industry Yearbook 2018
Global Trade-Copper Scrap ImportsGlobal Imports of Copper Scrap by Country and Year(in metric tons)
Top 20 Importers 2006 2007 2008 2009 2010 2011 2012 2013 2014 2015 2016
China 4,942,874 5,584,644 5,576,590 3,997,436 4,363,469 4,685,721 4,858,525 4,371,650 3,873,287 3,656,925 3,348,095Germany 585,140 595,749 563,559 454,753 626,443 646,282 660,890 619,121 658,986 603,783 606,841Belgium 295,565 316,297 245,758 212,834 265,228 253,533 303,572 334,658 291,471 234,806 296,845
Rep. of Korea 205,251 221,054 217,008 163,020 202,898 263,182 300,708 291,178 298,548 289,645 273,616Japan 120,787 135,663 138,729 97,144 159,424 136,881 142,559 127,914 160,128 169,435 228,471India 108,006 105,210 103,334 78,540 92,399 154,783 203,493 141,417 168,529 174,340 179,375
Netherlands 110,753 117,259 116,503 178,385 144,426 204,327 206,685 166,106 147,516 150,067 150,003Italy 215,687 180,706 169,257 94,755 129,103 148,430 137,615 151,702 178,161 164,534 144,048Spain 95,415 57,641 65,109 68,431 82,931 89,499 97,129 104,671 114,867 112,409 128,279Taiwan 145,904 130,130 106,518 70,266 90,422 89,735 93,867 99,353 95,721 94,597 111,069USA 117,506 132,915 106,333 71,833 95,895 109,736 104,585 106,331 116,618 111,668 125,293
Hong Kong 146,862 189,576 210,413 190,410 155,271 127,483 105,606 116,032 119,890 128,249 97,581Austria 88,890 90,398 114,063 134,135 145,902 130,675 127,186 102,554 105,904 88,646 83,968Sweden 55,756 80,880 91,807 96,739 105,279 120,154 136,653 149,992 101,726 114,664 77,173Canada 56,139 143,124 51,646 41,036 73,480 65,652 57,825 81,987 67,809 69,803 76,526Poland 4,902 18,747 19,152 15,467 24,075 26,872 52,632 49,668 63,001 67,297 75,594France 94,588 87,112 74,817 46,626 66,763 79,085 75,365 61,436 64,726 96,427 63,272Bulgaria 7,784 12,725 25,330 20,721 35,464 52,461 64,561 56,040 60,453 59,728 49,543
United Kingdom 21,080 21,890 21,611 18,404 28,193 29,292 26,833 25,046 28,226 28,135 35,073Slovakia 17,959 17,517 30,091 31,622 39,796 30,755 38,481 28,928 34,381 25,669 34,559
Rest of the World 213,535 316,638 245,528 210,724 275,393 341,759 335,706 313,469 311,689 289,235 290,973Grand Total 7,650,384 8,555,875 8,293,156 6,293,280 7,202,255 7,786,297 8,130,476 7,499,255 7,061,637 6,730,061 6,476,197
*Notes1) Data tables were derived from the UN Comtrade Database (last downloaded on March 23, 2018)2) Top 20 determined by latest year of complete data3) Import data adjusted for the Netherlands and the United States
*Notes1) Data tables were derived from the UN Comtrade Database (last downloaded on March 23, 2018)2) Top 20 determined by latest year of complete data3) Import data adjusted for the Netherlands and the United States

Institute of Scrap Recycling Industries, Inc.80
ISRI.ORG/COMMODITIES2018
Global Trade-Aluminum Scrap ExportsGlobal Exports of Aluminum Scrap by Country and Year(in metric tons)
Top 20 Exporters 2006 2007 2008 2009 2010 2011 2012 2013 2014 2015 2016
USA 1,442,272 1,522,021 1,935,165 1,596,601 1,821,190 2,049,151 1,967,664 1,812,917 1,666,019 1,498,303 1,279,788Germany 732,938 770,065 702,737 753,216 823,810 945,815 976,412 935,339 1,056,231 1,064,372 1,043,968Canada 417,369 429,765 403,882 365,356 443,996 473,247 482,748 457,277 493,456 499,982 501,550France 345,107 379,101 342,467 345,308 403,660 428,246 424,881 448,284 482,768 450,827 454,778
United Kingdom 385,292 848,568 874,909 419,972 454,699 440,726 445,390 402,061 452,606 406,070 439,713Netherlands 334,426 317,877 264,142 200,650 317,038 322,834 378,652 320,523 349,012 360,748 370,527Belgium 183,412 185,891 177,550 219,804 274,632 320,103 311,159 313,183 285,677 278,763 274,128Australia 173,865 178,498 177,078 160,948 196,259 189,361 205,016 207,246 228,379 258,970 266,061Poland 107,210 113,008 122,681 99,522 123,979 150,581 152,463 154,829 180,076 179,880 215,418Austria 79,390 90,275 87,952 117,949 122,057 105,137 128,587 151,419 173,159 151,625 199,021Mexico 163,079 179,260 186,510 162,668 183,932 194,355 234,333 169,557 151,152 156,049 180,629Japan 103,137 108,933 83,776 147,695 98,621 109,443 146,450 157,903 150,737 150,054 174,115
Saudi Arabia 101,894 131,242 111,569 103,413 137,349 149,895 200,558 176,108 189,858 156,296 170,525United Arab Emirates 43,291 46,171 53,129 90,278 128,798 112,367 143,071 164,251 162,986 139,675 163,981
Italy 50,536 47,153 66,993 88,702 107,155 103,006 103,667 107,060 111,214 144,319 151,977Switzerland 140,657 139,599 125,769 116,520 132,086 138,643 141,836 149,337 157,500 139,313 146,205Sweden 67,871 108,115 106,580 89,939 87,491 95,495 106,761 102,955 112,675 102,166 111,549Spain 43,191 34,104 110,468 46,974 66,976 51,518 90,881 94,856 80,107 89,263 100,021
Denmark 62,112 52,493 63,813 67,853 67,449 67,131 69,974 71,975 79,029 75,502 80,602Czechia 54,472 61,078 58,438 49,251 71,398 91,192 87,699 57,714 72,423 81,820 77,986
Rest of the World 1,160,062 1,164,287 2,199,497 952,681 1,337,992 2,252,639 1,514,186 1,364,435 1,418,872 1,434,042 1,496,787
Grand Total 6,191,581 6,907,503 8,255,103 6,195,302 7,400,567 8,790,883 8,312,391 7,819,230 8,053,936 7,818,040 7,899,327
*Notes1) Data tables were derived from the UN Comtrade Database (last downloaded on March 23, 2018)2) Top 20 determined by latest year of complete data3) Export data was adjusted for the United Arab Emirates
*Notes1) Data tables were derived from the UN Comtrade Database (last downloaded on March 23, 2018)2) Top 20 determined by latest year of complete data3) Export data was adjusted for the United Arab Emirates

ISRI.ORG 81
Recycling Industry Yearbook 2018
Global Trade-Aluminum Scrap ImportsGlobal Imports of Aluminum Scrap by Country and Year(in metric tons)
Top 20 Importers 2006 2007 2008 2009 2010 2011 2012 2013 2014 2015 2016
China 1,765,374 2,090,604 2,154,768 2,626,116 2,854,156 2,685,684 2,592,533 2,504,366 2,305,580 2,086,855 1,917,435India 247,929 237,194 241,180 297,855 456,333 584,740 709,532 724,101 840,540 882,882 919,376
Germany 597,310 613,081 543,837 362,582 479,416 534,989 577,092 560,691 656,604 790,138 770,140Rep. of Korea 377,177 467,491 503,154 443,898 545,692 566,953 641,800 711,174 801,211 745,958 715,173
Italy 377,548 448,689 386,459 273,083 376,486 461,302 445,450 456,370 511,986 520,448 517,954USA 495,527 462,068 476,462 395,212 480,034 545,913 564,447 538,196 536,994 509,848 513,240
Austria 155,586 166,850 170,815 162,155 268,845 282,707 304,271 280,710 285,563 282,557 308,272Belgium 192,053 192,072 193,475 203,681 221,425 254,967 247,463 219,054 237,096 248,872 275,997France 206,107 188,814 193,826 215,537 259,420 291,690 266,280 245,937 231,714 215,905 260,759Poland 52,416 59,519 66,968 66,793 84,850 106,438 107,598 176,509 205,230 238,950 235,391Spain 107,753 124,093 109,861 67,321 111,942 125,190 155,371 176,445 200,411 205,856 203,673
Netherlands 197,160 204,117 210,203 88,053 184,066 241,081 265,741 220,965 233,610 202,103 185,978Luxembourg 198,508 196,584 136,806 98,962 128,607 151,237 162,001 165,014 154,961 150,110 142,363Malaysia 270,015 45,225 56,249 61,754 64,318 79,515 74,988 70,492 88,132 93,747 136,665Czechia 49,358 63,606 58,686 50,279 61,714 88,951 105,390 83,294 78,491 83,103 125,211Pakistan 45,969 80,236 59,118 84,872 88,661 90,483 102,437 76,094 105,850 130,775 125,163
United Kingdom 141,469 158,724 149,900 117,673 126,773 110,275 103,224 113,461 168,300 123,124 123,246Canada 139,489 166,687 163,312 118,266 117,870 121,575 92,098 90,898 102,034 117,890 117,266Mexico 112,820 112,489 100,475 69,488 126,783 105,363 102,328 89,255 118,549 151,924 113,830Slovenia 51,596 52,126 51,194 37,315 51,792 52,844 61,462 69,014 77,942 84,186 91,076
Rest of the World 772,477 955,666 1,020,837 668,410 956,239 995,670 882,814 915,381 965,009 992,748 965,013
Grand Total 6,553,642 7,085,935 7,047,583 6,509,306 8,045,420 8,477,565 8,564,322 8,487,420 8,905,809 8,857,977 8,763,220
*Notes1) Data tables were derived from the UN Comtrade Database (last downloaded on March 23, 2018)2) Top 20 determined by latest year of complete data
*Notes1) Data tables were derived from the UN Comtrade Database (last downloaded on March 23, 2018)2) Top 20 determined by latest year of complete data

Institute of Scrap Recycling Industries, Inc.82
ISRI.ORG/COMMODITIES2018
Global Trade-Nickel Scrap ExportsGlobal Exports of Nickel Scrap by Country and Year(in metric tons)
Top 20 Exporters 2006 2007 2008 2009 2010 2011 2012 2013 2014 2015 2016
USA 44,558 76,372 40,090 11,279 22,253 34,301 26,974 26,004 30,758 27,077 17,865Saudi Arabia 6,423 1,155 3,747 7,202 12,575 10,626 9,919 14,429 17,797 13,224 17,641
United Kingdom 15,841 16,687 18,329 12,310 20,072 17,885 33,477 20,994 15,772 12,015 15,172Germany 6,354 7,383 5,647 8,227 9,563 8,918 7,727 6,516 9,882 10,866 9,977
United Arab Emirates 449 1,221 85 239 597 1,298 558 453 1,122 2,120 8,428
Belgium 3,488 4,907 2,809 6,813 3,371 7,364 2,418 3,146 11,769 3,477 8,382France 7,826 7,565 7,507 11,435 30,601 11,634 12,683 9,164 10,253 8,078 7,627
Rep. of Korea 7,879 10,297 10,689 9,241 17,459 6,043 4,440 4,457 7,490 8,429 7,102Canada 4,258 4,682 6,552 4,857 4,311 5,016 4,935 4,387 7,173 6,972 6,387Austria 2,342 2,201 1,750 2,098 1,607 2,709 2,633 3,322 5,402 3,659 5,012Japan 1,406 1,065 1,483 1,100 2,156 2,069 2,994 3,519 5,336 5,527 4,788Czechia 5,024 1,370 776 2,420 4,358 3,458 6,880 6,608 3,201 3,842 3,700Mexico 2,404 2,936 2,187 1,990 2,976 3,395 3,241 2,977 3,216 2,930 2,826
Singapore 4,347 3,898 2,892 1,854 2,908 2,611 1,792 1,664 2,073 1,640 2,393Malaysia 48,090 4,805 3,943 4,026 7,109 6,442 10,633 7,418 9,170 2,186 2,046Taiwan 1,475 2,548 1,358 1,306 1,421 1,057 1,222 1,421 1,758 1,547 1,788
Switzerland 1,669 1,750 1,603 1,519 1,090 909 1,214 1,069 1,649 992 1,522Spain 997 221 227 875 366 376 454 339 1,284 384 1,399
Sweden 5,741 5,343 1,517 1,377 1,021 1,137 13,857 1,264 1,397 1,175 1,342Netherlands 1,740 4,456 4,614 1,711 1,956 1,793 1,336 2,948 3,252 1,529 1,221
Rest of the World 14,504 13,155 14,806 18,095 22,652 15,089 10,385 8,839 13,956 19,839 9,618
Grand Total 186,814 174,017 132,610 109,974 170,422 144,131 159,774 130,937 163,709 137,506 136,236
*Notes1) Data tables were derived from the UN Comtrade Database (last downloaded on March 23, 2018)2) Top 20 determined by latest year of complete data
*Notes1) Data tables were derived from the UN Comtrade Database (last downloaded on March 23, 2018)2) Top 20 determined by latest year of complete data

ISRI.ORG 83
Recycling Industry Yearbook 2018
Global Trade-Nickel Scrap ImportsGlobal Imports of Nickel Scrap by Country and Year(in metric tons)
Top 20 Importers 2006 2007 2008 2009 2010 2011 2012 2013 2014 2015 2016
Canada 13,100 20,151 18,227 6,311 13,458 18,993 21,108 18,892 21,310 20,079 21,429USA 13,695 14,817 19,187 16,850 18,271 17,146 21,262 18,692 28,542 25,310 17,453
United Kingdom 8,468 11,882 10,890 9,736 8,783 6,729 8,834 9,887 10,999 9,405 12,325Sweden 9,176 9,121 12,217 8,708 10,491 10,333 8,801 8,896 9,928 12,283 12,044Germany 15,507 19,800 18,315 8,259 8,584 12,461 14,209 10,176 12,072 10,515 10,370Japan 6,702 6,889 5,397 3,919 5,638 5,762 5,342 7,247 10,236 8,392 9,248
Netherlands 9,870 14,008 12,647 4,666 10,872 4,607 2,507 2,803 4,208 4,708 4,732France 2,387 1,337 2,137 1,265 2,164 2,867 2,713 3,063 3,036 3,229 2,716India 1,332 2,209 705 836 1,005 1,158 619 2,300 2,481 2,385 2,145Italy 1,606 1,378 943 765 1,063 656 899 1,330 1,533 1,079 2,117
Singapore 2,856 3,049 3,019 2,466 4,062 2,520 1,432 1,802 2,234 1,135 1,419Austria 655 2,245 1,165 368 440 527 1,917 4,359 4,376 1,959 1,248Belgium 492 10,086 559 284 1,315 1,545 1,888 2,448 785 461 1,164
Rep. of Korea 214 492 816 874 433 573 374 313 676 1,358 1,048Hong Kong 85 290 79 477 40 50 308 252 1,298 213 929Czechia 152 298 473 1,468 1,257 250 1,442 1,183 755 637 869Spain 180 274 120 236 151 806 554 386 728 595 653Taiwan 462 215 220 497 399 469 252 792 357 220 395Thailand 80 116 131 46 75 115 269 222 306 963 335Slovenia 18 79 75 5 84 61 8 11 31 129 314
Rest of the World 3,118 10,168 6,425 3,851 1,341 1,523 849 1,318 892 1,251 795
Grand Total 90,154 128,904 113,748 71,886 89,927 89,151 95,587 96,372 116,782 106,307 103,749
*Notes1) Data tables were derived from the UN Comtrade Database (last downloaded on March 23, 2018)2) Top 20 determined by latest year of complete data3) Import data was adjusted for Slovenia
*Notes1) Data tables were derived from the UN Comtrade Database (last downloaded on March 23, 2018)2) Top 20 determined by latest year of complete data3) Import data was adjusted for Slovenia

Institute of Scrap Recycling Industries, Inc.84
ISRI.ORG/COMMODITIES2018
Global Trade-Lead Scrap ExportsGlobal Exports of Lead Scrap by Country and Year(in metric tons)
Top 20 Exporters 2006 2007 2008 2009 2010 2011 2012 2013 2014 2015 2016
United Kingdom 945 2,795 19,510 30,725 37,782 36,865 21,173 18,684 56,432 42,978 65,232France 21,857 29,541 15,826 18,439 37,437 20,805 15,939 22,573 25,644 57,659 49,019
Netherlands 16,067 21,822 12,278 13,807 35,168 30,486 22,847 38,896 42,570 52,276 45,785USA 120,934 128,837 174,795 140,364 28,000 31,449 25,914 34,352 36,344 46,573 39,496
Ireland 142 496 49 114 638 4,144 42,384 30,834 39,979 31,871 31,620United Arab Emirates 4,726 4,646 5,212 5,967 14,469 13,815 14,867 15,647 19,285 19,498 29,517
Australia 1,559 9,390 15,491 12,831 23,526 24,508 20,786 6,268 21,812 17,388 24,858Belgium 14,891 19,724 18,105 21,893 21,112 18,789 18,100 18,204 18,420 16,453 15,982Germany 9,512 17,801 13,133 13,100 9,892 12,898 8,004 12,895 16,250 8,845 11,059Portugal 14,522 10,443 4,230 2,241 1,811 2,047 1,348 3,522 1,866 1,753 7,854Italy 3,806 8,513 7,712 9,027 10,896 10,173 14,804 11,681 12,877 7,192 7,018
Sweden 705 734 816 1,044 1,454 1,471 1,458 1,114 9,181 5,570 6,940Romania 4,389 4,659 2,997 2,526 5,659 6,846 5,419 3,884 11,269 7,557 6,788Thailand 271 229 314 738 701 1,066 2,048 351 579 256 5,223Hungary 3,286 2,211 1,414 1,267 1,130 2,428 1,696 3,045 2,987 3,634 5,059
Switzerland 3,124 4,860 3,236 4,748 5,497 5,732 5,301 4,424 4,438 4,053 4,714Poland 2,041 3,040 960 1,517 1,506 947 1,277 1,046 946 3,776 4,004Finland 2,421 604 587 357 340 328 1,231 2,130 2,576 3,392 3,837Austria 3,989 4,616 2,176 775 1,720 4,842 3,175 2,107 2,062 2,182 3,657Norway 300 6 31 540 41 77 218 136 6,841 3,804 3,593
Rest of the World 91,018 98,950 81,980 77,907 85,425 79,794 78,743 75,956 68,090 57,159 43,815
Grand Total 316,530 368,681 380,229 359,925 324,119 311,552 311,514 315,553 394,817 399,174 425,094
*Notes1) Data tables were derived from the UN Comtrade Database (last downloaded on March 23, 20182) Top 20 determined by latest year of complete data3) Export data was adjusted for Pakistan, El Salvador, Ghana, and Norway
*Notes1) Data tables were derived from the UN Comtrade Database (last downloaded on March 23, 20182) Top 20 determined by latest year of complete data3) Export data was adjusted for Pakistan, El Salvador, Ghana, and Norway

ISRI.ORG 85
Recycling Industry Yearbook 2018
Global Trade-Lead Scrap ImportsGlobal Imports of Lead Scrap by Country and Year(in metric tons)
Top 20 Importers 2006 2007 2008 2009 2010 2011 2012 2013 2014 2015 2016
India 26,493 15,395 25,212 34,811 57,012 63,067 53,615 59,455 60,386 57,620 64,923Spain 30,848 45,434 35,556 35,703 43,432 42,236 34,702 35,284 32,249 42,845 43,740
Belgium 40,007 54,388 25,409 34,275 30,693 32,938 25,392 26,501 29,338 26,227 26,308Poland 1,108 1,256 2,371 2,276 7,164 6,365 4,979 10,370 11,139 14,148 21,527Bulgaria 1,346 3,548 5,478 12,143 17,461 4,627 1,660 11,050 16,660 16,484 17,827Germany 21,656 30,314 28,230 40,546 39,652 35,823 28,071 28,412 26,401 15,455 15,355
United Arab Emirates 1,132 856 1,231 1,245 1,682 3,524 11,875 21,092 27,420 21,010 15,250Ireland 37,664 25,828 17,702 16,689 12,074 12,305 14,089 16,572 16,128 12,435 12,295Czechia 4,411 6,519 4,773 4,157 2,901 2,932 2,723 4,369 5,232 2,894 10,998
Netherlands 17,508 22,006 11,325 13,593 21,255 16,886 15,138 10,578 8,823 9,607 8,686Portugal 822 1,056 493 305 822 346 1,019 4,870 961 7,085 7,971Sweden 3,101 3,770 2,092 4,979 9,464 8,400 9,627 9,282 9,575 11,627 6,323Greece 138 2,071 2,801 1,753 1,692 2,900 2,182 915 1,032 2,128 6,261USA 4,365 5,277 5,188 7,160 20,078 25,476 19,955 9,430 12,551 4,932 5,900
South Africa 10,456 10,761 6,947 7,554 9,233 6,829 12,214 6,369 6,569 3,997 5,582United Kingdom 5,933 17,685 4,535 4,904 9,046 4,839 3,258 4,169 7,236 6,532 5,482Rep. of Korea 876 1,527 1,749 3,246 4,426 5,132 15,735 10,351 10,238 13,620 5,270
Canada 80,162 64,788 93,314 78,834 8,089 5,038 4,365 6,493 4,268 4,050 5,027Latvia 13 4 19 24 92 1,221 502 922 3,836 4,271 4,484
Slovenia 2,978 4,995 1,506 1,979 3,807 3,655 3,787 4,117 5,056 3,659 4,406
Rest of the World 53,048 65,329 39,239 30,458 32,049 43,861 38,934 26,596 20,997 16,004 24,166
Grand Total 344,064 382,806 315,171 336,636 332,125 328,399 303,824 307,197 316,093 296,630 317,782
*Notes1) Data tables were derived from the UN Comtrade Database (last downloaded on March 23, 20182) Top 20 determined by latest year of complete data
*Notes1) Data tables were derived from the UN Comtrade Database (last downloaded on March 23, 20182) Top 20 determined by latest year of complete data

Institute of Scrap Recycling Industries, Inc.86
ISRI.ORG/COMMODITIES2018
Global Trade-Zinc Scrap ExportsGlobal Exports of Zinc Scrap by Country and Year(in metric tons)
Top 20 Exporters 2006 2007 2008 2009 2010 2011 2012 2013 2014 2015 2016
France 71,223 56,124 43,750 45,976 51,481 45,491 60,946 99,123 118,166 79,287 93,173Germany 58,008 59,297 51,800 68,648 74,269 74,965 73,263 52,770 53,342 45,865 40,739Thailand 3,563 5,600 4,153 5,701 12,684 8,323 4,019 1,801 4,472 11,606 30,759
Netherlands 39,073 67,010 19,815 17,399 32,543 25,629 29,417 26,682 31,910 26,101 27,464USA 83,842 102,305 90,992 47,119 77,934 85,223 90,447 88,047 71,446 55,224 26,567
Belgium 56,015 40,807 15,533 16,627 14,845 11,592 15,048 14,353 15,842 13,646 15,205Spain 8,542 5,576 6,210 26,675 37,362 15,625 8,283 17,625 8,669 9,171 12,586
Saudi Arabia 3,254 4,128 5,003 2,628 4,603 5,522 6,792 11,045 11,444 10,247 12,405Canada 18,647 13,359 6,121 5,690 10,770 14,257 15,069 18,127 22,341 17,561 11,704Austria 4,267 2,141 8,306 6,099 5,757 8,583 8,591 10,440 10,077 7,663 11,424Italy 12,911 13,067 9,060 12,429 16,452 13,143 7,149 7,024 10,407 9,262 9,160
Romania 228 1,348 442 1,615 711 597 672 592 885 6,753 7,653Poland 220 425 403 1,593 1,086 1,046 464 570 1,388 2,981 5,740
United Arab Emirates 3,226 3,816 3,240 2,359 3,271 4,880 5,883 4,666 4,369 4,264 5,344Malaysia 71,828 5,774 6,322 5,767 4,585 5,950 8,442 15,463 12,700 12,589 4,742Czechia 3,041 2,966 2,885 2,716 4,798 4,474 4,971 3,769 3,539 2,941 3,514Mexico 11,926 6,364 6,199 6,370 3,146 2,684 2,768 3,288 3,388 3,295 3,507Japan 3,219 4,238 3,908 3,071 4,472 4,417 3,712 3,924 3,852 3,457 3,315
Denmark 3,879 2,610 2,442 2,704 2,549 2,429 2,557 2,329 2,517 3,023 3,019United Kingdom 4,571 4,998 3,257 5,135 14,933 11,100 8,356 2,154 4,736 5,310 2,971
Rest of the World 105,372 66,140 50,062 44,382 43,333 45,426 43,919 46,202 62,020 40,963 40,173
Grand Total 566,855 468,093 339,903 310,945 418,310 391,357 400,770 429,993 457,510 371,211 371,164
*Notes1) Data tables were derived from the UN Comtrade Database (last downloaded on April 14, 20172) Top 20 determined by latest year of complete data3) Export data was adjusted for the Netherlands and the United Arab Emirates
*Notes1) Data tables were derived from the UN Comtrade Database (last downloaded on March 23, 20182) Top 20 determined by latest year of complete data

ISRI.ORG 87
Recycling Industry Yearbook 2018
Global Trade-Zinc Scrap ImportsGlobal Imports of Zinc Scrap by Country and Year(in metric tons)
Top 20 Importers 2006 2007 2008 2009 2010 2011 2012 2013 2014 2015 2016
China 173,448 174,076 168,742 109,743 158,801 150,440 140,295 122,479 98,892 80,414 63,713Italy 18,498 19,419 15,156 16,379 24,973 32,789 32,447 36,909 48,094 45,922 53,877India 119,023 43,549 24,472 44,419 39,533 35,941 49,860 59,546 67,024 44,821 47,803
Belgium 40,500 35,355 25,946 22,456 27,172 31,348 34,756 52,633 68,820 39,227 38,080Netherlands 14,872 10,439 6,865 22,929 27,727 17,639 29,811 41,486 36,996 25,767 34,468Germany 37,545 64,897 14,222 27,118 40,332 25,516 24,781 23,261 26,481 25,431 33,624
Rep. of Korea 6,535 2,529 3,995 3,845 5,913 3,289 1,349 5,173 4,967 11,723 29,413USA 21,416 19,385 12,208 9,179 13,932 16,269 18,143 19,161 23,473 17,815 11,563
France 24,787 6,253 2,300 6,256 17,491 9,771 8,838 7,623 8,129 7,994 8,439Poland 2,714 3,822 7,812 5,850 10,375 12,002 11,454 12,779 15,366 18,113 7,320
Luxembourg 4,783 4,707 5,322 3,171 3,746 4,735 4,227 3,248 5,628 6,219 5,534Spain 10,837 9,588 5,165 3,301 2,478 2,407 2,602 2,809 3,587 4,153 4,666Austria 5,471 4,209 4,244 4,033 4,662 4,562 4,025 3,284 4,460 3,707 4,345Japan 1,760 2,534 3,617 4,731 5,429 8,982 5,939 7,033 6,306 7,405 4,195
Slovakia 172 123 523 235 462 620 561 849 547 2,344 3,414United Kingdom 22,866 7,811 5,082 3,237 2,361 1,192 2,346 801 1,172 2,757 2,254
Malaysia 2,860 3,316 2,951 3,452 1,162 961 1,348 1,790 2,830 2,979 2,223Taiwan 15,318 15,014 6,041 3,869 6,407 10,288 6,337 4,072 4,140 3,208 1,768
Hong Kong 17,402 14,366 4,497 2,768 2,346 2,807 3,491 2,467 3,663 3,777 1,514United Arab Emirates 1,907 4,098 3,814 1,517 3,590 2,922 2,437 6,165 17,296 1,569 1,361
Rest of the World 24,140 22,602 16,925 14,146 22,910 16,043 15,723 16,448 9,637 15,866 11,589
Grand Total 566,855 468,093 339,903 312,633 421,800 390,525 400,770 430,013 457,510 371,211 371,164
*Notes1) Data tables were derived from the UN Comtrade Database (last downloaded on March 23, 2018)2) Top 20 determined by latest year of complete data and corrected with export-based reports due to consistency issues
*Notes1) Data tables were derived from the UN Comtrade Database (last downloaded on March 23, 2018)2) Top 20 determined by latest year of complete data and corrected with export-based reports due to consistency issues

Institute of Scrap Recycling Industries, Inc.88
ISRI.ORG/COMMODITIES2018
Global Trade-Recovered Paper ExportsGlobal Exports of Recovered Paper by Country and Year(in metric tons)
Top 20 Exporters 2006 2007 2008 2009 2010 2011 2012 2013 2014 2015 2016
USA 15,911,832 18,098,687 18,227,721 19,067,095 18,777,917 21,009,012 20,142,035 18,964,015 18,469,673 19,566,483 19,752,523United Kingdom 4,012,462 4,744,333 4,916,230 4,463,158 4,397,726 4,490,055 4,475,740 4,266,385 4,514,306 5,045,183 4,964,681
Japan 3,886,905 3,843,980 3,490,838 4,914,185 4,373,578 4,432,132 4,929,315 4,889,715 4,618,628 4,261,372 4,138,080Netherlands 3,195,798 3,456,154 3,671,452 3,018,050 3,584,906 3,896,997 3,553,697 3,025,029 2,780,061 3,044,991 3,058,185
France 1,986,173 2,113,364 2,171,191 2,739,764 2,623,678 2,924,478 3,052,896 2,895,122 2,855,845 2,868,832 2,858,269Germany 3,339,543 2,711,573 3,291,667 3,472,987 2,898,459 3,412,633 3,082,461 2,785,491 2,468,553 2,644,858 2,720,539Canada 1,017,382 1,252,915 1,224,604 1,698,604 1,864,690 2,049,243 2,341,126 2,128,628 2,085,177 2,344,550 2,576,480Italy 894,496 1,105,497 1,522,216 1,861,347 1,626,848 1,737,597 1,933,141 1,685,179 1,677,646 1,821,317 1,939,935
Australia 998,884 1,232,836 1,281,067 1,392,835 1,467,171 1,406,825 1,603,241 1,479,868 1,469,948 1,564,261 1,469,784Belgium 2,360,550 2,324,727 2,305,828 2,426,758 2,095,007 2,300,875 2,017,862 1,867,588 1,633,718 1,580,974 1,457,083Spain 389,155 503,628 732,422 954,049 664,796 782,817 709,901 665,860 891,583 1,013,825 1,152,768Czechia 260,698 296,882 382,637 409,865 476,420 545,877 642,053 711,857 731,631 795,423 818,204
Hong Kong 934,041 1,101,969 1,091,196 1,027,229 1,194,535 1,278,674 1,162,294 1,032,344 947,859 822,889 805,599Poland 406,082 410,579 547,874 358,947 398,815 531,215 525,390 593,123 579,044 661,677 688,372
Rep. of Korea 123,592 463,101 292,981 324,226 271,987 323,617 547,378 428,212 482,050 554,553 635,458Singapore 629,801 666,729 675,415 626,376 739,229 769,089 697,913 681,131 647,437 604,565 610,361Denmark 711,165 746,662 711,374 727,302 701,627 712,923 686,961 585,989 561,959 587,373 588,206
United Arab Emirates 189,720 252,865 260,682 278,144 280,048 359,092 391,175 438,328 471,462 456,308 521,842Sweden 198,389 314,655 339,885 318,223 395,164 478,873 431,363 451,439 453,130 466,853 501,829
Switzerland 450,246 518,858 542,404 550,441 589,798 573,381 539,251 520,576 499,651 485,420 477,643
Rest of the World 3,581,116 4,433,579 4,503,900 5,377,447 5,229,244 5,929,045 6,960,448 6,384,169 6,491,726 6,358,859 6,332,863
Grand Total 45,478,031 50,593,572 52,183,585 56,007,031 54,651,643 59,944,450 60,425,641 56,480,048 55,331,087 57,550,568 58,068,703
*Notes1) Data tables were derived from the UN Comtrade Database (last downloaded on March 23, 2018)2) Top 20 determined by latest year of complete data3) Export data was adjusted for the United Arab Emirates
*Notes1) Data tables were derived from the UN Comtrade Database (last downloaded on March 23, 2018)2) Top 20 determined by latest year of complete data3) Export data was adjusted for the United Arab Emirates

ISRI.ORG 89
Recycling Industry Yearbook 2018
Global Trade-Recovered Paper ImportsGlobal Imports of Recovered Paper by Country and Year(in metric tons)
Top 20 Importers 2006 2007 2008 2009 2010 2011 2012 2013 2014 2015 2016
China 19,621,156 22,562,110 24,205,826 27,501,707 24,352,351 27,278,635 30,067,145 29,236,774 27,518,476 29,283,649 28,498,511Germany 3,113,906 3,025,551 3,164,258 2,860,872 3,624,764 4,108,603 4,021,672 3,907,364 3,954,795 4,001,180 4,285,733India 1,737,049 1,782,177 1,739,619 2,161,685 1,962,983 2,079,101 2,303,727 2,531,167 3,187,792 3,088,921 3,177,568
Netherlands 2,577,200 2,449,310 2,568,851 1,376,270 2,928,725 3,193,646 2,931,399 2,739,020 2,383,691 2,618,133 2,748,707Indonesia 2,081,228 2,224,823 2,080,390 2,284,656 2,412,462 2,323,760 2,292,488 2,216,424 2,280,384 1,692,351 2,021,051Spain 1,125,285 1,277,484 1,170,728 921,186 1,279,188 1,154,169 1,226,263 1,544,586 1,505,165 1,627,547 1,638,323
Rep. of Korea 1,210,907 1,182,108 1,306,820 1,121,827 1,355,990 1,530,872 1,467,150 1,589,486 1,547,289 1,542,292 1,562,258Mexico 1,443,660 2,065,761 1,429,525 1,408,012 1,478,018 1,414,239 1,304,863 1,259,274 1,407,736 1,384,800 1,531,175Austria 1,174,401 1,316,447 1,288,989 1,172,977 1,299,671 1,387,955 1,284,855 1,212,240 1,162,476 1,226,687 1,279,027Thailand 1,049,631 1,015,835 1,217,338 969,850 1,023,857 923,981 999,833 858,301 856,513 1,133,075 1,086,867Belgium 1,219,998 1,315,999 1,473,890 1,643,748 1,454,905 1,456,191 1,311,531 1,335,797 1,147,548 1,089,102 1,069,313France 1,036,022 980,719 948,400 787,686 877,312 886,447 749,516 771,529 940,699 1,015,194 977,765Canada 2,045,287 1,944,475 1,764,051 1,314,241 1,057,584 802,379 1,205,258 721,825 628,656 736,422 762,639Viet Nam 257,425 404,012 525,867 289,623 591,162 556,700 384,196 450,556 637,453 648,232 712,826Taiwan 762,968 982,719 834,122 562,640 568,558 596,030 864,889 790,494 845,821 586,012 708,933Poland 3,894 8,529 14,240 17,843 264,677 306,645 392,984 457,695 518,191 444,857 479,079Sweden 794,722 777,648 841,728 894,365 1,059,611 976,319 871,241 612,446 618,816 462,590 454,577Turkey 52,832 28,919 84,827 82,246 115,965 71,922 52,501 80,068 183,834 301,404 450,913Hungary 28,555 39,498 17,188 103,115 359,743 390,415 415,333 442,558 428,249 398,172 433,586
Switzerland 130,576 131,125 119,819 95,382 139,285 257,718 324,956 351,626 319,471 329,472 379,998
Rest of the World 3,751,369 4,414,568 4,024,626 3,487,292 4,566,107 5,701,649 4,470,457 4,146,438 3,712,562 4,016,561 3,035,154
Grand Total 45,218,070 49,929,817 50,821,102 51,057,223 52,772,916 57,397,376 58,942,257 57,255,668 55,785,619 57,626,652 57,294,003
*Notes1) Data tables were derived from the UN Comtrade Database (last downloaded on March 23, 2018)2) Top 20 determined by latest year of complete data3) Import data was adjusted for the Viet Nam and Taiwan
*Notes1) Data tables were derived from the UN Comtrade Database (last downloaded on March 23, 2018)2) Top 20 determined by latest year of complete data3) Import data was adjusted for the Vietnam and Taiwan

Institute of Scrap Recycling Industries, Inc.90
ISRI.ORG/COMMODITIES2018
Global Trade-Plastic Scrap ExportsGlobal Exports of Plastic Scrap by Country and Year(in metric tons)
Top 20 Exporters 2006 2007 2008 2009 2010 2011 2012 2013 2014 2015 2016
USA 1,045,848 1,375,681 1,593,703 2,020,770 2,040,483 2,127,877 2,011,095 1,909,335 2,171,691 2,043,124 1,616,967Japan 1,296,197 1,517,312 1,513,419 1,487,705 1,638,962 1,631,455 1,673,620 1,681,733 1,670,228 1,606,271 1,526,921
Germany 748,603 846,084 774,655 1,445,533 1,418,680 1,462,561 1,511,349 1,324,863 1,453,609 1,376,833 1,445,155United Kingdom 440,852 548,298 654,393 711,223 838,188 880,577 811,509 648,614 764,404 791,554 805,072
France 379,183 385,592 390,634 447,683 477,954 502,826 508,034 454,119 483,026 468,754 483,957Netherlands 438,753 412,010 357,819 245,322 361,137 381,131 428,666 464,294 431,322 505,903 481,088Belgium 382,820 399,629 369,552 453,559 396,963 414,619 456,860 471,666 437,310 430,720 440,849Mexico 347,875 419,676 435,085 372,442 414,021 442,197 522,143 517,067 862,744 449,974 429,537Spain 91,944 108,685 112,448 166,850 217,892 192,363 236,880 225,844 333,466 329,937 318,926
Thailand 139,397 183,287 145,309 166,370 205,915 232,170 263,128 317,540 346,912 265,390 306,372Viet Nam 18,269 19,147 19,342 18,929 39,760 102,059 110,246 223,408 202,021 119,292 276,395
Italy 101,847 113,942 139,913 212,414 263,949 269,601 228,019 191,621 175,859 223,076 234,262Canada 219,263 199,638 229,263 188,862 190,252 197,638 203,046 170,783 191,778 208,955 213,690
Rep. of Korea 299,078 324,564 285,244 307,717 201,549 161,358 182,975 183,291 192,851 187,609 208,826Indonesia 36,838 58,167 53,203 53,728 116,354 166,430 204,750 231,747 193,842 148,735 203,586Australia 99,881 103,540 125,183 204,739 156,388 151,209 193,087 155,085 185,705 206,060 199,743Poland 50,877 56,911 66,831 97,153 107,541 102,736 101,301 99,431 138,834 166,378 192,224Slovenia 12,350 14,651 23,641 28,126 35,362 28,177 69,251 71,594 97,581 103,849 180,460Malaysia 96,789 107,316 114,943 123,627 134,326 153,865 197,598 250,809 247,007 182,271 163,622Taiwan 187,864 170,590 149,536 166,445 182,693 164,825 157,914 120,210 146,153 145,125 155,244
Rest of the World 1,860,496 2,040,892 2,466,761 2,551,903 3,527,297 2,752,215 2,218,891 2,168,939 2,031,824 1,909,652 1,860,761
Grand Total 8,295,026 9,405,613 10,020,878 11,471,102 12,965,664 12,517,888 12,290,363 11,881,993 12,758,169 11,869,461 11,743,659
*Notes1) Data tables were derived from the UN Comtrade Database (last downloaded on March 23, 2018)2) Top 20 determined by latest year of complete data3) Export data was adjusted for Viet Nam
*Notes1) Data tables were derived from the UN Comtrade Database (last downloaded on March 23, 2018)2) Top 20 determined by latest year of complete data3) Export data was adjusted for Vietnam

ISRI.ORG 91
Recycling Industry Yearbook 2018
Global Trade-Plastic Scrap ImportsGlobal Imports of Plastic Scrap by Country and Year(in metric tons)
Top 20 Importers 2006 2007 2008 2009 2010 2011 2012 2013 2014 2015 2016
China 5,864,733 6,912,222 7,074,626 7,325,810 8,009,674 8,384,190 8,877,767 7,881,304 8,254,247 7,354,229 7,347,176Hong Kong 4,421,329 4,145,835 4,503,012 4,752,654 4,795,350 3,962,054 3,200,487 2,506,171 3,080,676 2,864,769 2,877,956Netherlands 226,692 221,914 238,843 144,459 295,928 374,308 467,433 531,881 622,941 598,127 611,300Germany 219,474 239,700 227,723 214,448 296,940 302,344 420,106 423,052 501,628 545,607 548,029
USA 557,367 416,683 412,156 356,098 379,490 342,014 361,294 372,705 417,046 393,392 447,945Belgium 248,563 281,228 294,000 350,481 285,426 322,250 292,285 259,805 226,729 259,728 312,587Malaysia 73,785 81,900 38,194 92,323 81,885 142,860 176,779 301,435 225,986 249,941 287,673Austria 69,995 131,224 148,423 106,394 146,137 210,909 218,640 194,626 250,263 245,451 240,589Italy 190,103 199,010 162,786 116,475 138,291 145,795 138,957 134,360 160,232 153,379 178,631
Taiwan 102,548 122,913 150,203 119,829 148,887 153,084 149,491 201,522 204,365 221,499 177,934Canada 209,883 187,747 161,881 129,748 148,031 153,294 155,107 146,523 186,390 249,179 171,657India 94,137 169,909 97,936 478,491 116,252 131,419 195,988 259,614 251,546 185,746 166,859Turkey 3,516 19,114 10,848 7,169 23,260 55,780 56,497 67,396 105,287 104,031 159,569Sweden 18,338 79,494 87,251 138,100 300,324 255,449 134,230 213,483 153,842 179,539 139,748
United Kingdom 61,885 97,992 75,784 46,256 53,110 64,237 73,907 93,487 111,097 87,280 130,021Czechia 28,489 41,874 54,849 48,074 58,555 93,122 111,373 122,698 128,088 131,523 129,925France 65,222 70,526 81,392 58,708 98,940 109,177 109,822 111,921 110,017 117,055 122,987
Indonesia 7,552 313 8,588 3,175 39,906 90,535 106,994 135,993 107,423 97,146 120,979Poland 50,143 67,390 42,222 47,907 113,677 113,133 67,305 57,771 62,416 85,814 118,800Portugal 13,499 12,050 14,876 13,514 21,625 55,617 45,308 51,078 82,725 134,784 107,251
Rest of the World 603,609 649,764 768,681 784,800 889,657 1,070,135 1,045,232 1,202,175 1,138,664 1,118,591 1,087,326
Grand Total 13,130,863 14,148,804 14,654,275 15,334,914 16,441,343 16,531,706 16,405,000 15,268,998 16,381,608 15,376,810 15,484,941
*Notes1) Data tables were derived from the UN Comtrade Database (last downloaded on March 23, 2018)2) Top 20 determined by latest year of complete data
*Notes1) Data tables were derived from the UN Comtrade Database (last downloaded on March 23, 2018)2) Top 20 determined by latest year of complete data

Institute of Scrap Recycling Industries, Inc.92
ISRI.ORG/COMMODITIES2018
NOTES