2018 Michigan Department of Health and Human Services · 2018 Michigan Department of Health and...
84
2018 Michigan Department of Health and Human Services Adult Medicaid Health Plan CAHPS® Report September 2018
Transcript of 2018 Michigan Department of Health and Human Services · 2018 Michigan Department of Health and...
2018 Michigan Department of Health and Human Services
Adult Medicaid Health Plan CAHPS® Report
September 2018
2018 Adult Medicaid Health Plan CAHPS Report Page i State of Michigan MDHHS Adult Medicaid_2018 CAHPS Report_0918
Table of Contents
1. Executive Summary ........................................................................................................................ 1-1
Introduction ...................................................................................................................................... 1-1
Report Overview .............................................................................................................................. 1-1
Key Findings .................................................................................................................................... 1-2
Survey Dispositions and Demographics ..................................................................................... 1-2
National Comparisons and Trend Analysis ................................................................................ 1-4
Statewide Comparisons .............................................................................................................. 1-6
Key Drivers of Satisfaction ...................................................................................................... 1-10
2. Reader’s Guide ............................................................................................................................... 2-1
2018 CAHPS Performance Measures .............................................................................................. 2-1
How CAHPS Results Were Collected .............................................................................................. 2-2
Sampling Procedures .................................................................................................................. 2-2
Survey Protocol .......................................................................................................................... 2-2
How CAHPS Results Were Calculated and Displayed .................................................................... 2-4
Who Responded to the Survey ................................................................................................... 2-4
Demographics of Adult Members .............................................................................................. 2-4
National Comparisons ................................................................................................................ 2-4
Statewide Comparisons .............................................................................................................. 2-6
Trend Analysis ........................................................................................................................... 2-7
Key Drivers of Satisfaction Analysis ......................................................................................... 2-8
Limitations and Cautions .................................................................................................................. 2-9
Case-Mix Adjustment ................................................................................................................. 2-9
Non-Response Bias .................................................................................................................... 2-9
Causal Inferences ....................................................................................................................... 2-9
Missing Phone Numbers ............................................................................................................ 2-9
Survey Vendor Effects ............................................................................................................. 2-10
3. Results .............................................................................................................................................. 3-1
Who Responded to the Survey ......................................................................................................... 3-1
Demographics of Adult Members .................................................................................................... 3-2
National Comparisons ...................................................................................................................... 3-5
Statewide Comparisons .................................................................................................................... 3-9
Global Ratings .......................................................................................................................... 3-10
Composite Measures ................................................................................................................ 3-14
Individual Item Measures ......................................................................................................... 3-24
Effectiveness of Care Measures ............................................................................................... 3-28
Summary of Results ................................................................................................................. 3-34
4. Trend Analysis ................................................................................................................................ 4-1
Trend Analysis ................................................................................................................................. 4-1
Global Ratings ............................................................................................................................ 4-2
Composite Measures .................................................................................................................. 4-6
TABLE OF CONTENTS
2018 Adult Medicaid Health Plan CAHPS Report Page ii State of Michigan MDHHS Adult Medicaid_2018 CAHPS Report_0918
Individual Item Measures ......................................................................................................... 4-11
Effectiveness of Care Measures ............................................................................................... 4-13
5. Key Drivers of Satisfaction ............................................................................................................ 5-1
Key Drivers of Satisfaction .............................................................................................................. 5-1
6. Survey Instrument .......................................................................................................................... 6-1
Survey Instrument ............................................................................................................................ 6-1

2018 Adult Medicaid Health Plan CAHPS Report Page 1-1
State of Michigan MDHHS Adult Medicaid_2018 CAHPS Report_0918
1. Executive Summary
Introduction
The Michigan Department of Health and Human Services (MDHHS) periodically assesses the
perceptions and experiences of members enrolled in the MDHHS Medicaid health plans (MHPs) and the
Fee-for-Service (FFS) population as part of its process for evaluating the quality of health care services
provided to adult members in the MDHHS Medicaid Program. MDHHS contracted with Health Services
Advisory Group, Inc. (HSAG) to administer and report the results of the Consumer Assessment of
Healthcare Providers and Systems (CAHPS®) Health Plan Survey for the MDHHS Medicaid
Program.1-1,1-2 The goal of the CAHPS Health Plan Survey is to provide performance feedback that is
actionable and that will aid in improving overall member satisfaction.
This report presents the 2018 CAHPS results of adult members enrolled in an MHP or FFS. A sample of
at least 1,350 adult members was selected from the FFS population and each MHP. The surveys were
completed in the Spring of 2018. The standardized survey instrument selected was the CAHPS 5.0 Adult
Medicaid Health Plan Survey with the Healthcare Effectiveness Data and Information Set (HEDIS®)
supplemental item set.1-3,1-4
Report Overview
Results presented in this report include:
• Four global ratings: Rating of Health Plan, Rating of All Health Care, Rating of Personal Doctor,
and Rating of Specialist Seen Most Often.
• Five composite measures: Getting Needed Care, Getting Care Quickly, How Well Doctors
Communicate, Customer Service, and Shared Decision Making.
• Two individual item measures: Coordination of Care and Health Promotion and Education.
• Three Effectiveness of Care measures: Advising Smokers and Tobacco Users to Quit, Discussing
Cessation Medications, and Discussing Cessation Strategies.
1-1 CAHPS® is a registered trademark of the Agency for Healthcare Research and Quality (AHRQ). 1-2 HSAG surveyed the FFS Medicaid population. The 11 MHPs contracted with various survey vendors to administer the
CAHPS survey. 1-3 HEDIS® is a registered trademark of the National Committee for Quality Assurance (NCQA). 1-4 The 2018 CAHPS results were reported to NCQA for the 11 MHPs. The 2018 CAHPS survey results for the FFS
population were not reported to NCQA.

EXECUTIVE SUMMARY
2018 Adult Medicaid Health Plan CAHPS Report Page 1-2
State of Michigan MDHHS Adult Medicaid_2018 CAHPS Report_0918
HSAG presents aggregate statewide results and compares them to national Medicaid data and the prior
year’s results, where appropriate. Throughout this report, two statewide aggregate results are presented
for comparative purposes:
• MDHHS Medicaid Program – Combined results for FFS and the MHPs.
• MDHHS Medicaid Managed Care Program – Combined results for the MHPs.
Key Findings
Survey Dispositions and Demographics
Table 1-1 provides an overview of the MDHHS Medicaid Program adult member demographics and
survey dispositions. Please note, some percentages displayed in the table below may not total 100
percent due to rounding.
Table 1-1—Member Demographics and Survey Dispositions
Age Gender

EXECUTIVE SUMMARY
2018 Adult Medicaid Health Plan CAHPS Report Page 1-3
State of Michigan MDHHS Adult Medicaid_2018 CAHPS Report_0918
Race/Ethnicity General Health Status
Survey Dispositions
EXECUTIVE SUMMARY
2018 Adult Medicaid Health Plan CAHPS Report Page 1-4
State of Michigan MDHHS Adult Medicaid_2018 CAHPS Report_0918
National Comparisons and Trend Analysis
A three-point mean score was determined for the four CAHPS global ratings, four CAHPS composite
measures, and one CAHPS individual item measure. The resulting three-point mean scores were
compared to the National Committee for Quality Assurance’s (NCQA’s) 2018 HEDIS Benchmarks and
Thresholds for Accreditation to derive the overall member satisfaction ratings (i.e., star ratings) for each
CAHPS measure.1-5,1-6 In addition, a trend analysis was performed that compared the 2018 CAHPS
results to their corresponding 2017 CAHPS results. Table 1-2, on the following page, provides
highlights of the National Comparisons and Trend Analysis findings for the MDHHS Medicaid
Program. The numbers presented below the stars represent the three-point mean score for each measure,
while the stars represent overall member satisfaction ratings when the three-point means were compared
to NCQA HEDIS Benchmarks and Thresholds for Accreditation.
1-5 National Committee for Quality Assurance. HEDIS® Benchmarks and Thresholds for Accreditation 2018. Washington,
DC: NCQA; February 5, 2018. 1-6 NCQA does not publish national benchmarks and thresholds for the Shared Decision Making composite measure, and the
Health Promotion and Education individual item measure; therefore, these CAHPS measures were excluded from the
National Comparisons analysis.

EXECUTIVE SUMMARY
2018 Adult Medicaid Health Plan CAHPS Report Page 1-5
State of Michigan MDHHS Adult Medicaid_2018 CAHPS Report_0918
Table 1-2—National Comparisons and Trend Analysis MDHHS Medicaid Program
Measure National Comparisons Trend Analysis
Global Rating
Rating of Health Plan 2.47
—
Rating of All Health Care 2.38
Rating of Personal Doctor 2.51
—
Rating of Specialist Seen Most Often 2.55
—
Composite Measure
Getting Needed Care 2.42
—
Getting Care Quickly
2.47 —
How Well Doctors Communicate
2.66 —
Customer Service
2.60 —
Individual Item Measure
Coordination of Care 2.39
—
Star Assignments Based on Percentiles
90th or Above 75th-89th 50th-74th 25th-49th Below 25th
Statistically significantly higher in 2018 than in 2017.
Statistically significantly lower in 2018 than in 2017.
— Indicates the 2018 score is not statistically significantly different than the 2017 score.
The following are highlights of this comparison:
The MDHHS Medicaid Program scored at or above the 90th percentile on one measure, How Well
Doctors Communicate.
The MDHHS Medicaid Program scored at or between the 75th and 89th percentiles on two
measures: Getting Care Quickly and Customer Service.
The MDHHS Medicaid Program scored at or between the 50th and 74th percentiles on four
measures: Rating of Health Plan, Rating of Personal Doctor, Rating of Specialist Seen Most Often,
and Getting Needed Care.
The MDHHS Medicaid Program scored at or between the 25th and 49th percentiles on two
measures: Rating of All Health Care and Coordination of Care.

EXECUTIVE SUMMARY
2018 Adult Medicaid Health Plan CAHPS Report Page 1-6
State of Michigan MDHHS Adult Medicaid_2018 CAHPS Report_0918
Statewide Comparisons
HSAG calculated top-box rates (i.e., rates of satisfaction) for each global rating, composite measure,
individual item measure, and overall rates for the Effectiveness of Care measures. HSAG compared the
MHP and FFS results to the MDHHS Medicaid Managed Care Program average to determine if plan or
program results were statistically significantly different than the MDHHS Medicaid Managed Care
Program average. Table 1-3 through Table 1-5 show the results of this analysis for the global ratings,
composite measures, individual item measures, and Effectiveness of Care measures.
Table 1-3—Statewide Comparisons: Global Ratings
Plan Name Rating of
Health Plan Rating of All Health Care
Rating of Personal Doctor
Rating of Specialist Seen
Most Often
Fee-for-Service — — —
Aetna Better Health of Michigan — — —
Blue Cross Complete of Michigan — — — —
HAP Midwest Health Plan — — —
Harbor Health Plan — — —+
McLaren Health Plan — — —
Meridian Health Plan of Michigan — — — —
Molina Healthcare of Michigan — — —
Priority Health Choice, Inc. — — — —
Total Health Care, Inc. — — — —
UnitedHealthcare Community Plan — — — —
Upper Peninsula Health Plan — — —
+ Indicates fewer than 100 responses. Caution should be exercised when evaluating these results.
Indicates the plan’s score is statistically significantly above the MDHHS Medicaid Managed Care Program average.
Indicates the plan’s score is statistically significantly below than the MDHHS Medicaid Managed Care Program average.
— Indicates the plan’s score is not statistically significantly different than the MDHHS Medicaid Managed Care Program average.
EXECUTIVE SUMMARY
2018 Adult Medicaid Health Plan CAHPS Report Page 1-7
State of Michigan MDHHS Adult Medicaid_2018 CAHPS Report_0918
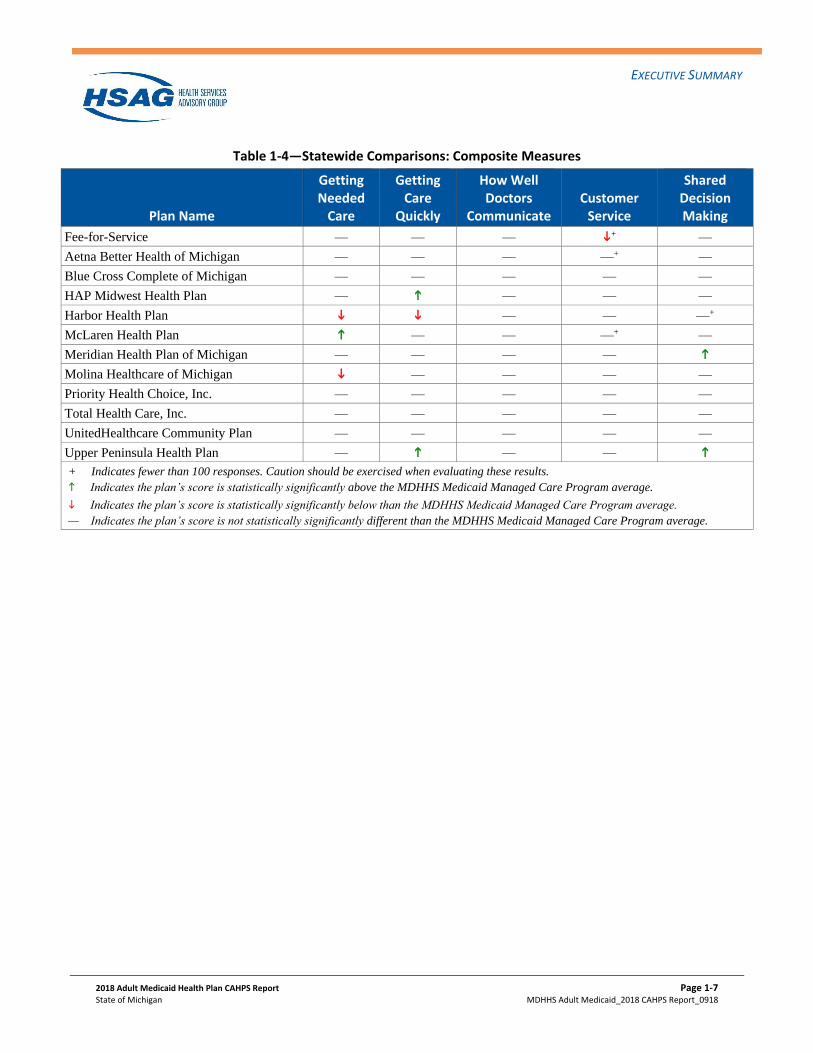
Table 1-4—Statewide Comparisons: Composite Measures
Plan Name
Getting Needed
Care
Getting Care
Quickly
How Well Doctors
Communicate Customer
Service
Shared Decision Making
Fee-for-Service — — — + —
Aetna Better Health of Michigan — — — —+ —
Blue Cross Complete of Michigan — — — — —
HAP Midwest Health Plan — — — —
Harbor Health Plan — — —+
McLaren Health Plan — — —+ —
Meridian Health Plan of Michigan — — — —
Molina Healthcare of Michigan — — — —
Priority Health Choice, Inc. — — — — —
Total Health Care, Inc. — — — — —
UnitedHealthcare Community Plan — — — — —
Upper Peninsula Health Plan — — —
+ Indicates fewer than 100 responses. Caution should be exercised when evaluating these results.
Indicates the plan’s score is statistically significantly above the MDHHS Medicaid Managed Care Program average.
Indicates the plan’s score is statistically significantly below than the MDHHS Medicaid Managed Care Program average.
— Indicates the plan’s score is not statistically significantly different than the MDHHS Medicaid Managed Care Program average.
EXECUTIVE SUMMARY
2018 Adult Medicaid Health Plan CAHPS Report Page 1-8
State of Michigan MDHHS Adult Medicaid_2018 CAHPS Report_0918
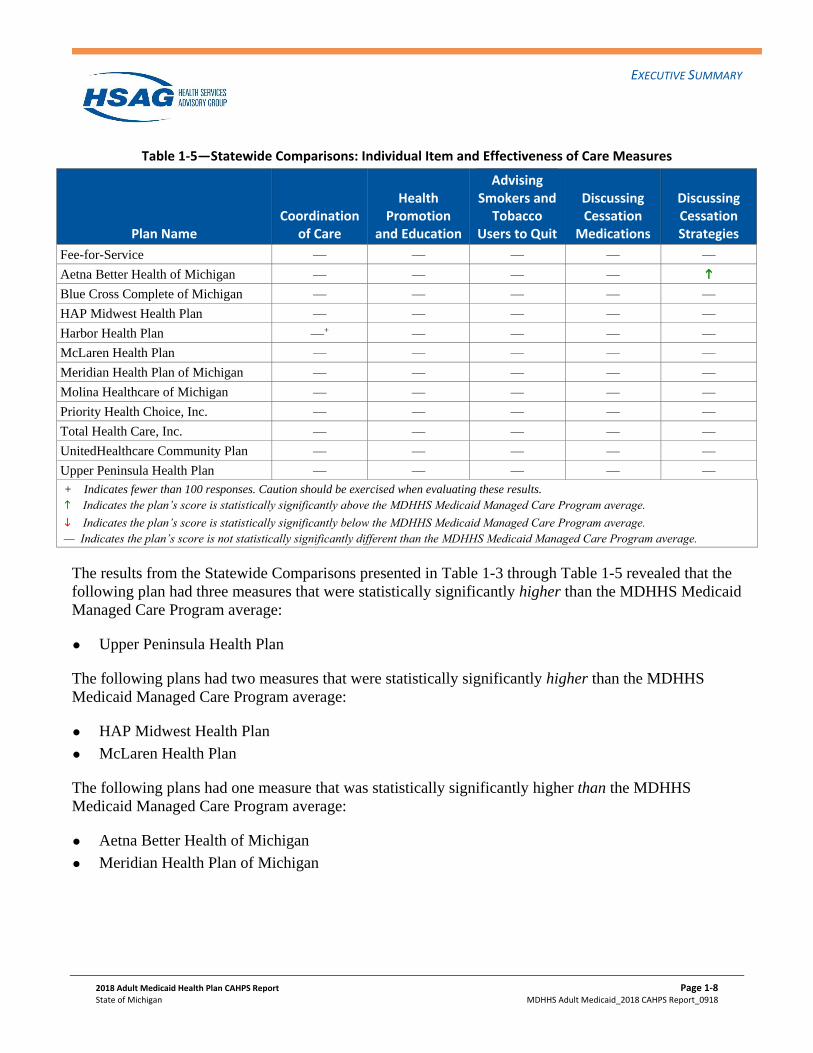
Table 1-5—Statewide Comparisons: Individual Item and Effectiveness of Care Measures
Plan Name Coordination
of Care
Health Promotion
and Education
Advising Smokers and
Tobacco Users to Quit
Discussing Cessation
Medications
Discussing Cessation Strategies
Fee-for-Service — — — — —
Aetna Better Health of Michigan — — — —
Blue Cross Complete of Michigan — — — — —
HAP Midwest Health Plan — — — — —
Harbor Health Plan —+ — — — —
McLaren Health Plan — — — — —
Meridian Health Plan of Michigan — — — — —
Molina Healthcare of Michigan — — — — —
Priority Health Choice, Inc. — — — — —
Total Health Care, Inc. — — — — —
UnitedHealthcare Community Plan — — — — —
Upper Peninsula Health Plan — — — — —
+ Indicates fewer than 100 responses. Caution should be exercised when evaluating these results.
Indicates the plan’s score is statistically significantly above the MDHHS Medicaid Managed Care Program average.
Indicates the plan’s score is statistically significantly below the MDHHS Medicaid Managed Care Program average.
— Indicates the plan’s score is not statistically significantly different than the MDHHS Medicaid Managed Care Program average.
The results from the Statewide Comparisons presented in Table 1-3 through Table 1-5 revealed that the
following plan had three measures that were statistically significantly higher than the MDHHS Medicaid
Managed Care Program average:
Upper Peninsula Health Plan
The following plans had two measures that were statistically significantly higher than the MDHHS
Medicaid Managed Care Program average:
HAP Midwest Health Plan
McLaren Health Plan
The following plans had one measure that was statistically significantly higher than the MDHHS
Medicaid Managed Care Program average:
Aetna Better Health of Michigan
Meridian Health Plan of Michigan

EXECUTIVE SUMMARY
2018 Adult Medicaid Health Plan CAHPS Report Page 1-9
State of Michigan MDHHS Adult Medicaid_2018 CAHPS Report_0918
Conversely, the following plan had three measures that were statistically significantly lower than the
MDHHS Medicaid Managed Care Program average:
Harbor Health Plan
The following plan/population had two measures that were statistically significantly lower than the
MDHHS Medicaid Managed Care Program average:
Fee-for-Service
Molina Healthcare of Michigan
The following plan had one measure that was statistically significantly lower than the MDHHS
Medicaid Managed Care Program average:
Aetna Better Health of Michigan
EXECUTIVE SUMMARY
2018 Adult Medicaid Health Plan CAHPS Report Page 1-10
State of Michigan MDHHS Adult Medicaid_2018 CAHPS Report_0918
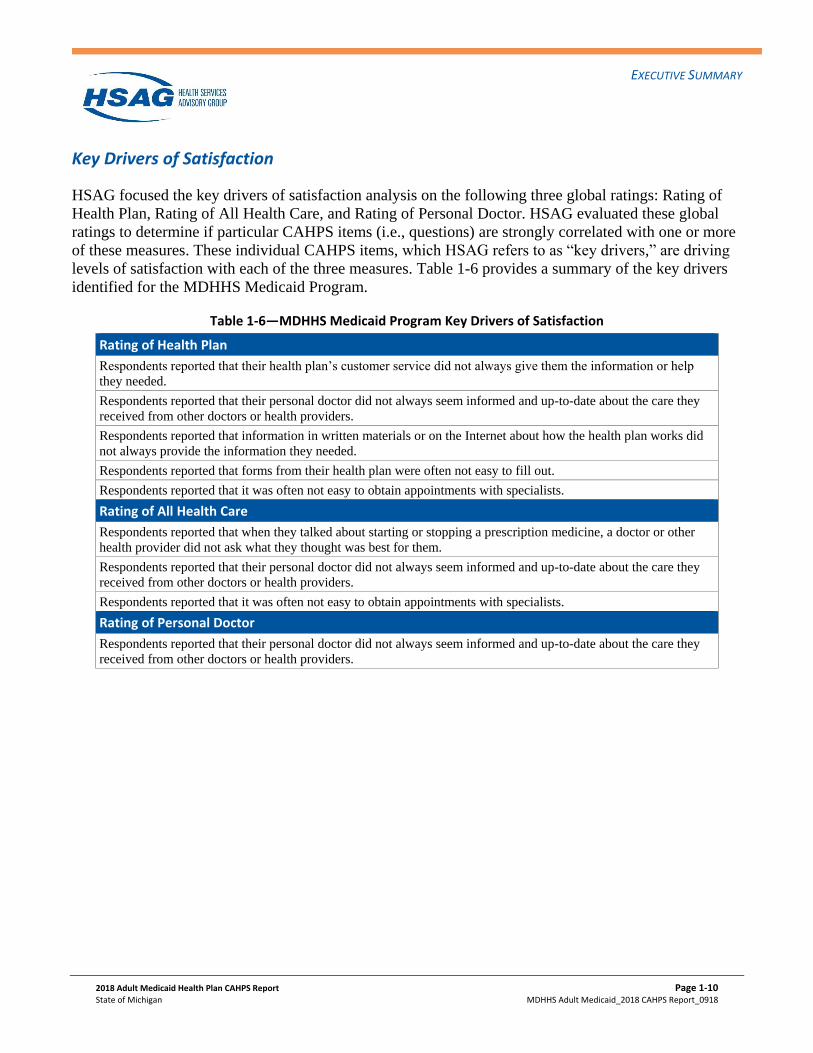
Key Drivers of Satisfaction
HSAG focused the key drivers of satisfaction analysis on the following three global ratings: Rating of
Health Plan, Rating of All Health Care, and Rating of Personal Doctor. HSAG evaluated these global
ratings to determine if particular CAHPS items (i.e., questions) are strongly correlated with one or more
of these measures. These individual CAHPS items, which HSAG refers to as “key drivers,” are driving
levels of satisfaction with each of the three measures. Table 1-6 provides a summary of the key drivers
identified for the MDHHS Medicaid Program.
Table 1-6—MDHHS Medicaid Program Key Drivers of Satisfaction
Rating of Health Plan
Respondents reported that their health plan’s customer service did not always give them the information or help
they needed.
Respondents reported that their personal doctor did not always seem informed and up-to-date about the care they
received from other doctors or health providers.
Respondents reported that information in written materials or on the Internet about how the health plan works did
not always provide the information they needed.
Respondents reported that forms from their health plan were often not easy to fill out.
Respondents reported that it was often not easy to obtain appointments with specialists.
Rating of All Health Care
Respondents reported that when they talked about starting or stopping a prescription medicine, a doctor or other
health provider did not ask what they thought was best for them.
Respondents reported that their personal doctor did not always seem informed and up-to-date about the care they
received from other doctors or health providers.
Respondents reported that it was often not easy to obtain appointments with specialists.
Rating of Personal Doctor
Respondents reported that their personal doctor did not always seem informed and up-to-date about the care they
received from other doctors or health providers.
2018 Adult Medicaid Health Plan CAHPS Report Page 2-1
State of Michigan MDHHS Adult Medicaid_2018 CAHPS Report_0918
2. Reader’s Guide
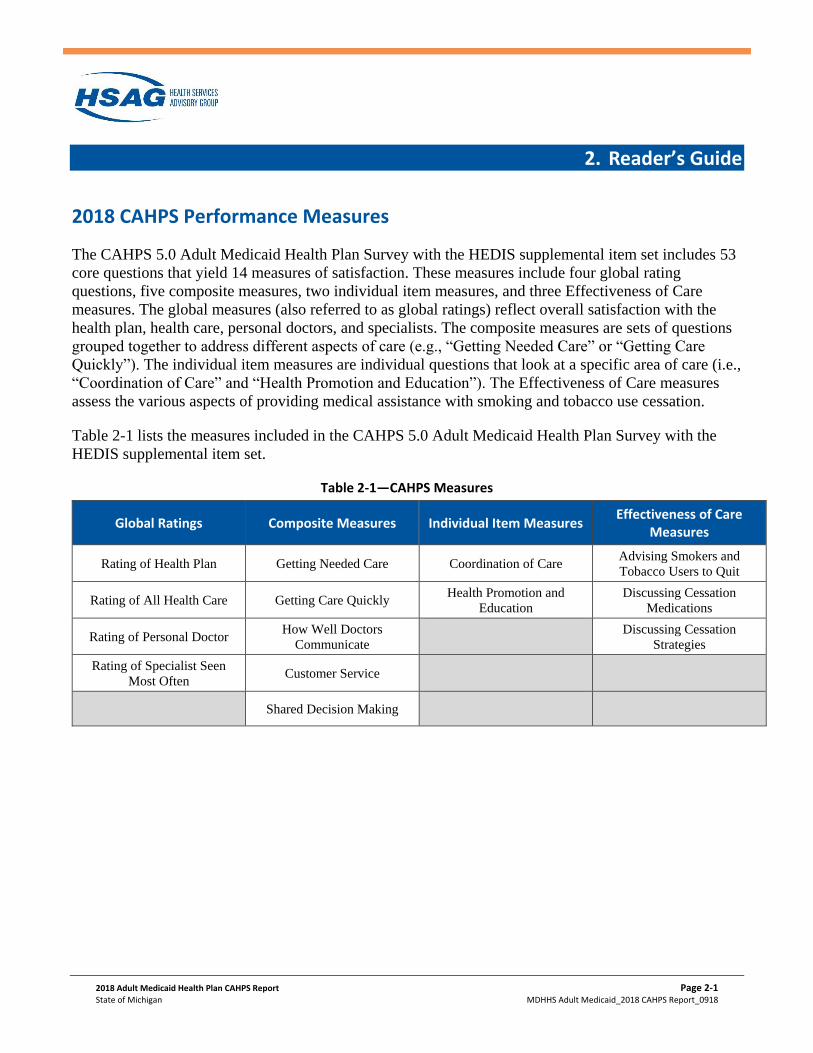
2018 CAHPS Performance Measures
The CAHPS 5.0 Adult Medicaid Health Plan Survey with the HEDIS supplemental item set includes 53
core questions that yield 14 measures of satisfaction. These measures include four global rating
questions, five composite measures, two individual item measures, and three Effectiveness of Care
measures. The global measures (also referred to as global ratings) reflect overall satisfaction with the
health plan, health care, personal doctors, and specialists. The composite measures are sets of questions
grouped together to address different aspects of care (e.g., “Getting Needed Care” or “Getting Care
Quickly”). The individual item measures are individual questions that look at a specific area of care (i.e.,
“Coordination of Care” and “Health Promotion and Education”). The Effectiveness of Care measures
assess the various aspects of providing medical assistance with smoking and tobacco use cessation.
Table 2-1 lists the measures included in the CAHPS 5.0 Adult Medicaid Health Plan Survey with the
HEDIS supplemental item set.
Table 2-1—CAHPS Measures
Global Ratings Composite Measures Individual Item Measures Effectiveness of Care
Measures
Rating of Health Plan Getting Needed Care Coordination of Care Advising Smokers and
Tobacco Users to Quit
Rating of All Health Care Getting Care Quickly Health Promotion and
Education
Discussing Cessation
Medications
Rating of Personal Doctor How Well Doctors
Communicate
Discussing Cessation
Strategies
Rating of Specialist Seen
Most Often Customer Service
Shared Decision Making
READER’S GUIDE
2018 Adult Medicaid Health Plan CAHPS Report Page 2-2
State of Michigan MDHHS Adult Medicaid_2018 CAHPS Report_0918
How CAHPS Results Were Collected
NCQA mandates a specific HEDIS survey methodology to ensure the collection of CAHPS data is
consistent throughout all plans. In accordance with NCQA requirements, the sampling procedures and
survey protocol were adhered to as described below.
Sampling Procedures
MDHHS provided HSAG with a list of all eligible members for the sampling frame, per HEDIS
specifications. HSAG inspected a sample of the file records to check for any apparent problems with the
files, such as missing address elements. The MHPs contracted with separate survey vendors to perform
sampling. Following HEDIS requirements, members were sampled who met the following criteria:
• Were 18 years of age or older as of December 31, 2017.
• Were currently enrolled in an MHP or FFS.
• Had been continuously enrolled in the plan or program for at least five of the last six months (July
through December) of 2017.
• Had Medicaid as a payer.
Next, a systematic sample of members was selected for inclusion in the survey. For each MHP, no more
than one member per household was selected as part of the survey samples. A sample of at least 1,350
adult members was selected from the FFS population and each MHP, with one exception.2-1 Table 3-1 in
the Results section provides an overview of the sample sizes for each plan and program.
Survey Protocol
The survey administration protocol employed by the MHPs and FFS was a mixed-mode methodology,
which allowed for two methods by which members could complete a survey. The first, or mail phase,
consisted of sampled members receiving a survey via mail. Non-respondents received a reminder
postcard, followed by a second survey mailing and reminder postcard.
The second phase, or telephone phase, consisted of Computer Assisted Telephone Interviewing (CATI)
of members who did not mail in a completed survey. At least three CATI calls to each non-respondent
were attempted.2-2 It has been shown that the addition of the telephone phase aids in the reduction of
2-1 Some MHPs elected to oversample their population. 2-2 National Committee for Quality Assurance. Quality Assurance Plan for HEDIS 2018 Survey Measures. Washington, DC:
NCQA; 2017.
READER’S GUIDE
2018 Adult Medicaid Health Plan CAHPS Report Page 2-3
State of Michigan MDHHS Adult Medicaid_2018 CAHPS Report_0918
non-response bias by increasing the number of respondents who are more demographically
representative of a plan’s population.2-3
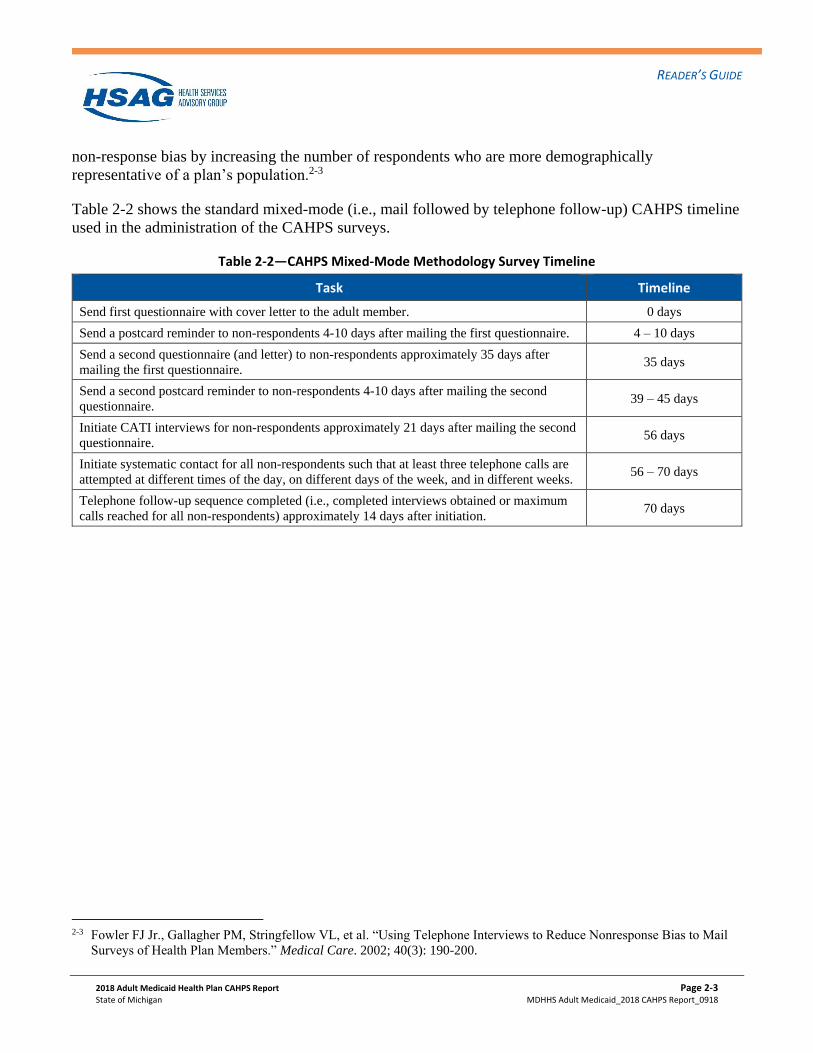
Table 2-2 shows the standard mixed-mode (i.e., mail followed by telephone follow-up) CAHPS timeline
used in the administration of the CAHPS surveys.
Table 2-2—CAHPS Mixed-Mode Methodology Survey Timeline
Task Timeline
Send first questionnaire with cover letter to the adult member. 0 days
Send a postcard reminder to non-respondents 4-10 days after mailing the first questionnaire. 4 – 10 days
Send a second questionnaire (and letter) to non-respondents approximately 35 days after
mailing the first questionnaire. 35 days
Send a second postcard reminder to non-respondents 4-10 days after mailing the second
questionnaire. 39 – 45 days
Initiate CATI interviews for non-respondents approximately 21 days after mailing the second
questionnaire. 56 days
Initiate systematic contact for all non-respondents such that at least three telephone calls are
attempted at different times of the day, on different days of the week, and in different weeks. 56 – 70 days
Telephone follow-up sequence completed (i.e., completed interviews obtained or maximum
calls reached for all non-respondents) approximately 14 days after initiation. 70 days
2-3 Fowler FJ Jr., Gallagher PM, Stringfellow VL, et al. “Using Telephone Interviews to Reduce Nonresponse Bias to Mail
Surveys of Health Plan Members.” Medical Care. 2002; 40(3): 190-200.

READER’S GUIDE
2018 Adult Medicaid Health Plan CAHPS Report Page 2-4
State of Michigan MDHHS Adult Medicaid_2018 CAHPS Report_0918
Response Rate = Number of Completed Surveys
Sample - Ineligibles
How CAHPS Results Were Calculated and Displayed
HSAG used the CAHPS scoring approach recommended by NCQA in Volume 3 of HEDIS
Specifications for Survey Measures. Based on NCQA’s recommendations and HSAG’s extensive
experience evaluating CAHPS data, HSAG performed a number of analyses to comprehensively assess
member satisfaction. In addition to individual plan results, HSAG calculated an MDHHS Medicaid
Program average and an MDHHS Medicaid Managed Care Program average. HSAG combined results
from FFS and the MHPs to calculate the MDHHS Medicaid Program average. HSAG combined results
from the MHPs to calculate the MDHHS Medicaid Managed Care Program average. This section
provides an overview of each analysis.
Who Responded to the Survey
The administration of the CAHPS survey is comprehensive and is designed to achieve the highest
possible response rate. NCQA defines the response rate as the total number of completed surveys
divided by all eligible members of the sample.2-4 HSAG considered a survey completed if members
answered at least three of the following five questions: 3, 15, 24, 28, and 35. Eligible members included
the entire sample minus ineligible members. Ineligible members met at least one of the following
criteria: they were deceased, were invalid (did not meet the eligible criteria), were mentally or physically
incapacitated, or had a language barrier.
Demographics of Adult Members
The demographics analysis evaluated demographic information of adult members. The demographic
characteristics included age, gender, race/ethnicity, level of education, and general health status.
MDHHS should exercise caution when extrapolating the CAHPS results to the entire population if the
respondent population differs significantly from the actual population of the plan or program.
National Comparisons
HSAG conducted an analysis of the CAHPS survey results using NCQA HEDIS Specifications for
Survey Measures. Although NCQA requires a minimum of at least 100 responses on each item in order
to obtain a reportable CAHPS Survey result, HSAG presented results with fewer than 100 responses.
2-4 National Committee for Quality Assurance. HEDIS® 2018, Volume 3: Specifications for Survey Measures. Washington,
DC: NCQA; 2017.

READER’S GUIDE
2018 Adult Medicaid Health Plan CAHPS Report Page 2-5
State of Michigan MDHHS Adult Medicaid_2018 CAHPS Report_0918
Therefore, caution should be exercised when evaluating measures’ results with fewer than 100
responses, which are denoted with a cross (+).
Table 2-3 shows the percentiles that were used to determine star ratings for each CAHPS measure.
Table 2-3—Star Ratings
Stars Percentiles
Excellent
At or above the 90th percentile
Very Good
At or between the 75th and 89th percentiles
Good
At or between the 50th and 74th percentiles
Fair
At or between the 25th and 49th percentiles
Poor
Below the 25th percentile
In order to perform the National Comparisons, a three-point mean score was determined for each
CAHPS measure. HSAG compared the resulting three-point mean scores to published NCQA HEDIS
Benchmarks and Thresholds for Accreditation to derive the overall member satisfaction ratings for each
CAHPS measure.2-5
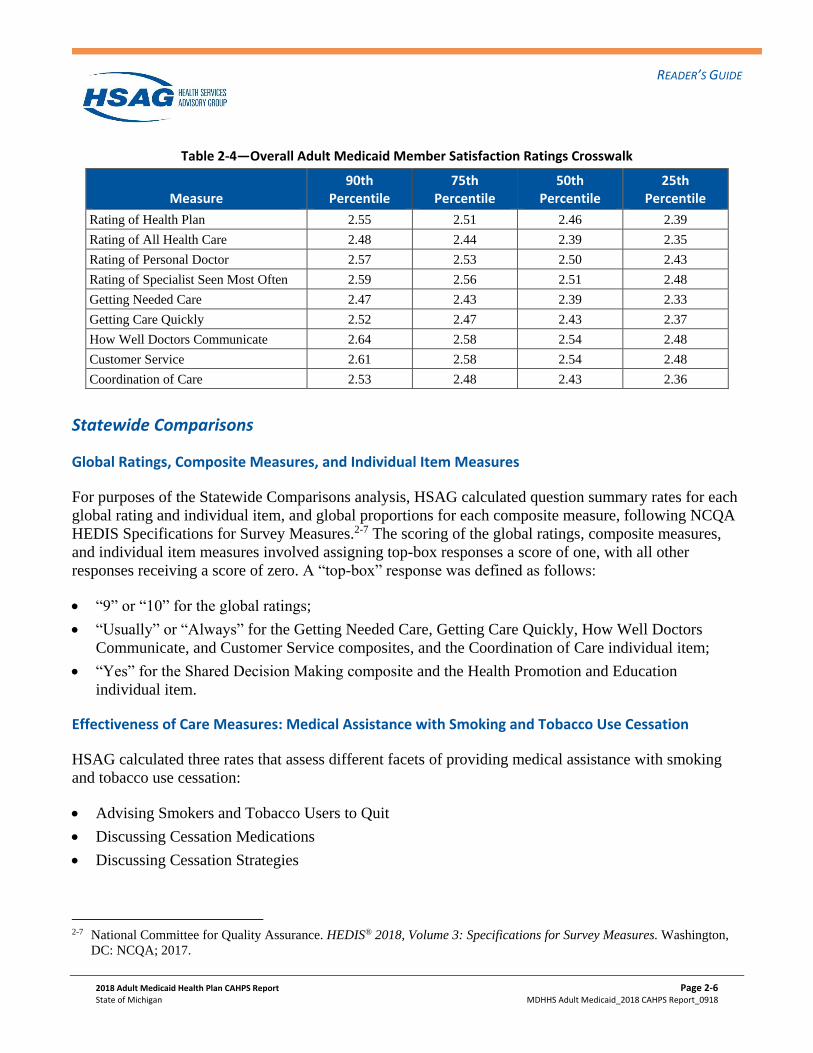
Table 2-4, on the following page, shows the NCQA HEDIS Benchmarks and Thresholds for
Accreditation used to derive the overall adult Medicaid member satisfaction ratings on each CAHPS
measure.2-6 NCQA does not publish national benchmarks and thresholds for the Shared Decision
Making composite measure and the Health Promotion and Education individual item measure; therefore,
star ratings could not be assigned for these measures.
2-5 For detailed information on the derivation of three-point mean scores, please refer to HEDIS® 2018, Volume 3:
Specifications for Survey Measures. 2-6 National Committee for Quality Assurance. HEDIS® Benchmarks and Thresholds for Accreditation 2018. Washington,
DC: NCQA; February 5, 2018.
READER’S GUIDE
2018 Adult Medicaid Health Plan CAHPS Report Page 2-6
State of Michigan MDHHS Adult Medicaid_2018 CAHPS Report_0918
Table 2-4—Overall Adult Medicaid Member Satisfaction Ratings Crosswalk
Measure 90th
Percentile 75th
Percentile 50th
Percentile 25th
Percentile
Rating of Health Plan 2.55 2.51 2.46 2.39
Rating of All Health Care 2.48 2.44 2.39 2.35
Rating of Personal Doctor 2.57 2.53 2.50 2.43
Rating of Specialist Seen Most Often 2.59 2.56 2.51 2.48
Getting Needed Care 2.47 2.43 2.39 2.33
Getting Care Quickly 2.52 2.47 2.43 2.37
How Well Doctors Communicate 2.64 2.58 2.54 2.48
Customer Service 2.61 2.58 2.54 2.48
Coordination of Care 2.53 2.48 2.43 2.36
Statewide Comparisons
Global Ratings, Composite Measures, and Individual Item Measures
For purposes of the Statewide Comparisons analysis, HSAG calculated question summary rates for each
global rating and individual item, and global proportions for each composite measure, following NCQA
HEDIS Specifications for Survey Measures.2-7 The scoring of the global ratings, composite measures,
and individual item measures involved assigning top-box responses a score of one, with all other
responses receiving a score of zero. A “top-box” response was defined as follows:
• “9” or “10” for the global ratings;
• “Usually” or “Always” for the Getting Needed Care, Getting Care Quickly, How Well Doctors
Communicate, and Customer Service composites, and the Coordination of Care individual item;
• “Yes” for the Shared Decision Making composite and the Health Promotion and Education
individual item.
Effectiveness of Care Measures: Medical Assistance with Smoking and Tobacco Use Cessation
HSAG calculated three rates that assess different facets of providing medical assistance with smoking
and tobacco use cessation:
• Advising Smokers and Tobacco Users to Quit
• Discussing Cessation Medications
• Discussing Cessation Strategies
2-7 National Committee for Quality Assurance. HEDIS® 2018, Volume 3: Specifications for Survey Measures. Washington,
DC: NCQA; 2017.

READER’S GUIDE
2018 Adult Medicaid Health Plan CAHPS Report Page 2-7
State of Michigan MDHHS Adult Medicaid_2018 CAHPS Report_0918
These rates assess the percentage of smokers or tobacco users who were advised to quit, were
recommended cessation medications, and were provided cessation methods or strategies, respectively.
Responses of “Sometimes,” “Usually,” and “Always” were used to determine if the member qualified
for inclusion in the numerator. The rates presented follow NCQA’s methodology of calculating a rolling
average using the current and prior year’s results. Please exercise caution when reviewing the trend
analysis results for the medical assistance with smoking and tobacco use cessation measures, as the 2018
results contain members who responded to the survey and indicated that they were current smokers or
tobacco users in 2017 and 2018.
Weighting
Both a weighted MDHHS Medicaid Program rate and a weighted MDHHS Medicaid Managed Care
Program rate were calculated. Results were weighted based on the total eligible population for each
plan’s or program’s adult population. The MDHHS Medicaid Program average includes results from
both the MHPs and the FFS population. The MDHHS Medicaid Managed Care Program average is
limited to the results of the MHPs (i.e., the FFS population is not included). For the Statewide
Comparisons, no threshold number of responses was required for the results to be reported. Measures
with fewer than 100 responses are denoted with a cross (+). Caution should be used when evaluating
rates derived from fewer than 100 respondents.
MHP Comparisons
The results of the MHPs were compared to the MDHHS Medicaid Managed Care Program average.
Two types of hypothesis tests were applied to these results. First, a global F test was calculated, which
determined whether the difference between MHP means was significant. If the F test demonstrated
MHP-level differences (i.e., p value < 0.05), then a t test was performed for each MHP. The t test
determined whether each MHP’s mean was statistically significantly different from the MDHHS
Medicaid Managed Care Program average. This analytic approach follows the Agency for Healthcare
Research and Quality’s (AHRQ’s) recommended methodology for identifying significant plan-level
performance differences.
Fee-for-Service Comparisons
The results of the FFS population were compared to the MDHHS Medicaid Managed Care Program
average. One type of hypothesis test was applied to these results. A t test was performed to determine
whether the results of the FFS population were statistically significantly different (i.e., p value < 0.05)
from the MDHHS Medicaid Managed Care Program average results.
Trend Analysis
A trend analysis was performed that compared the 2018 CAHPS scores to the corresponding 2017
CAHPS scores to determine whether there were statistically significant differences. A t test was
performed to determine whether results in 2017 were statistically significantly different from results in
2018. A difference was considered statistically significant if the two-sided p value of the t test was less

READER’S GUIDE
2018 Adult Medicaid Health Plan CAHPS Report Page 2-8
State of Michigan MDHHS Adult Medicaid_2018 CAHPS Report_0918
than 0.05. The two-sided p value of the t test is the probability of observing a test statistic as extreme as
or more extreme than the one actually observed by chance. Measures with fewer than 100 responses are
denoted with a cross (+). Caution should be used when evaluating rates derived from fewer than 100
respondents.
Key Drivers of Satisfaction Analysis
HSAG performed an analysis of key drivers of satisfaction for the following measures: Rating of Health
Plan, Rating of All Health Care, and Rating of Personal Doctor. The purpose of the key drivers of
satisfaction analysis is to help decision makers identify specific aspects of care that will most benefit
from quality improvement (QI) activities. The analysis provides information on: 1) how well the
MDHHS Medicaid Program is performing on the survey item and 2) how important that item is to
overall satisfaction.
The performance on a survey item was measured by calculating a problem score, in which a negative
experience with care was defined as a problem and assigned a “1,” and a positive experience with care
(i.e., non-negative) was assigned a “0.” The higher the problem score, the lower the member satisfaction
with the aspect of service measured by that question. The problem score could range from 0 to 1.
For each item evaluated, the relationship between the item’s problem score and performance on each of
the three measures was calculated using a Pearson product moment correlation, which is defined as the
covariance of the two scores divided by the product of their standard deviations. Items were then
prioritized based on their overall problem score and their correlation to each measure. Key drivers of
satisfaction were defined as those items that:
• Had a problem score that was greater than or equal to the median problem score for all items
examined.
• Had a correlation that was greater than or equal to the median correlation for all items examined.
READER’S GUIDE
2018 Adult Medicaid Health Plan CAHPS Report Page 2-9
State of Michigan MDHHS Adult Medicaid_2018 CAHPS Report_0918
Limitations and Cautions
The findings presented in this CAHPS report are subject to some limitations in the survey design,
analysis, and interpretation. MDHHS should consider these limitations when interpreting or generalizing
the findings.
Case-Mix Adjustment
The demographics of a response group may impact member satisfaction. Therefore, differences in the
demographics of the response group may impact CAHPS results. NCQA does not recommend case-mix
adjusting Medicaid CAHPS results to account for these differences; therefore, no case-mix adjusting
was performed on these CAHPS results.2-8
Non-Response Bias
The experiences of the survey respondent population may be different than that of non-respondents with
respect to their health care services and may vary by plan or program. Therefore, MDHHS should
consider the potential for non-response bias when interpreting CAHPS results.
Causal Inferences
Although this report examines whether respondents report differences in satisfaction with various
aspects of their health care experiences, these differences may not be completely attributable to an MHP
or the FFS population. These analyses identify whether respondents give different ratings of satisfaction
with their MHP or the FFS population. The survey by itself does not necessarily reveal the exact cause
of these differences.
Missing Phone Numbers
The volume of missing telephone numbers may impact the response rates and the validity of the survey
results. For instance, a certain segment of the population may be more likely to have missing phone
information than other segments.
2-8 Agency for Healthcare Research and Quality. CAHPS Health Plan Survey and Reporting Kit 2008. Rockville, MD: US
Department of Health and Human Services; 2008.
READER’S GUIDE
2018 Adult Medicaid Health Plan CAHPS Report Page 2-10
State of Michigan MDHHS Adult Medicaid_2018 CAHPS Report_0918
Survey Vendor Effects
The CAHPS survey was administered by multiple survey vendors. NCQA developed its Survey Vendor
Certification Program to ensure standardization of data collection and the comparability of results across
health plans. However, due to the different processes employed by the survey vendors, there is still the
small potential for vendor effects. Therefore, survey vendor effects should be considered when
interpreting the CAHPS results.

2018 Adult Medicaid Health Plan CAHPS Report Page 3-1
State of Michigan MDHHS Adult Medicaid_2018 CAHPS Report_0918
3. Results
Who Responded to the Survey
A total of 21,225 surveys were distributed to adult members. A total of 5,454 surveys were completed.
The CAHPS Survey response rate is the total number of completed surveys divided by all eligible
members of the sample. A survey was considered complete if members answered at least three of the
following five questions on the survey: 3, 15, 24, 28, and 35. Eligible members included the entire
sample minus ineligible members. Ineligible members met at least one of the following criteria: they
were deceased, were invalid (did not meet the eligible criteria), were mentally or physically
incapacitated, or had a language barrier.
Table 3-1 shows the total number of members sampled, the number of surveys completed, the number of
ineligible members, and the response rates.
Table 3-1—Total Number of Respondents and Response Rates
Plan Name Sample Size Completes Ineligibles Response
Rates
MDHHS Medicaid Program 21,225 5,454 543 26.37%
Fee-for-Service 1,350 380 125 31.02%
MDHHS Medicaid Managed Care Program 19,875 5,074 418 26.08%
Aetna Better Health of Michigan 1,485 279 17 19.01%
Blue Cross Complete of Michigan 1,825 382 14 21.09%
HAP Midwest Health Plan 1,350 470 77 36.92%
Harbor Health Plan 1,350 271 51 20.86%
McLaren Health Plan 1,350 351 16 26.31%
Meridian Health Plan of Michigan 1,890 534 39 28.85%
Molina Healthcare of Michigan 2,700 733 61 27.78%
Priority Health Choice, Inc. 1,850 477 22 26.09%
Total Health Care, Inc. 2,160 487 37 22.94%
UnitedHealthcare Community Plan 1,755 417 49 24.44%
Upper Peninsula Health Plan 2,160 673 35 31.67%

RESULTS
2018 Adult Medicaid Health Plan CAHPS Report Page 3-2
State of Michigan MDHHS Adult Medicaid_2018 CAHPS Report_0918
Demographics of Adult Members
Table 3-2 depicts the ages of members who completed a CAHPS survey.
Table 3-2—Adult Member Demographics: Age
Plan Name 18 to 24 25 to 34 35 to 44 45 to 54 55 to 64 65 and older
MDHHS Medicaid Program 7.3% 15.5% 15.2% 21.0% 32.3% 8.7%
Fee-for-Service 7.0% 9.9% 12.1% 12.9% 21.8% 36.3%
MDHHS Medicaid Managed Care Program 7.3% 15.9% 15.4% 21.6% 33.1% 6.7%
Aetna Better Health of Michigan 8.3% 13.8% 17.0% 22.5% 37.0% 1.4%
Blue Cross Complete of Michigan 6.4% 19.3% 15.8% 25.4% 30.7% 2.4%
HAP Midwest Health Plan 1.9% 6.3% 10.2% 14.7% 26.2% 40.7%
Harbor Health Plan 1.5% 14.0% 14.0% 25.4% 43.2% 1.9%
McLaren Health Plan 7.5% 18.2% 16.2% 24.9% 32.7% 0.6%
Meridian Health Plan of Michigan 7.6% 23.8% 15.9% 16.1% 33.1% 3.6%
Molina Healthcare of Michigan 8.0% 17.0% 14.5% 22.3% 31.5% 6.7%
Priority Health Choice, Inc. 8.1% 18.4% 12.8% 20.6% 34.0% 6.0%
Total Health Care, Inc. 8.3% 14.8% 17.4% 23.9% 33.5% 2.1%
UnitedHealthcare Community Plan 10.0% 15.4% 20.4% 25.1% 25.1% 4.0%
Upper Peninsula Health Plan 9.3% 13.1% 16.1% 21.5% 39.5% 0.5%
Please note, percentages may not total 100% due to rounding.
Table 3-3 depicts the gender of members who completed a CAHPS survey.
Table 3-3—Adult Member Demographics: Gender
Plan Name Male Female
MDHHS Medicaid Program 41.8% 58.2%
Fee-for-Service 30.9% 69.1%
MDHHS Medicaid Managed Care Program 42.7% 57.3%
Aetna Better Health of Michigan 44.9% 55.1%
Blue Cross Complete of Michigan 44.8% 55.2%
HAP Midwest Health Plan 35.1% 64.9%
Harbor Health Plan 65.9% 34.1%
McLaren Health Plan 39.9% 60.1%
Meridian Health Plan of Michigan 41.2% 58.8%
Molina Healthcare of Michigan 41.4% 58.6%
Priority Health Choice, Inc. 37.7% 62.3%
Total Health Care, Inc. 43.9% 56.1%
UnitedHealthcare Community Plan 38.2% 61.8%
Upper Peninsula Health Plan 45.8% 54.2%
Please note, percentages may not total 100% due to rounding.
RESULTS
2018 Adult Medicaid Health Plan CAHPS Report Page 3-3
State of Michigan MDHHS Adult Medicaid_2018 CAHPS Report_0918
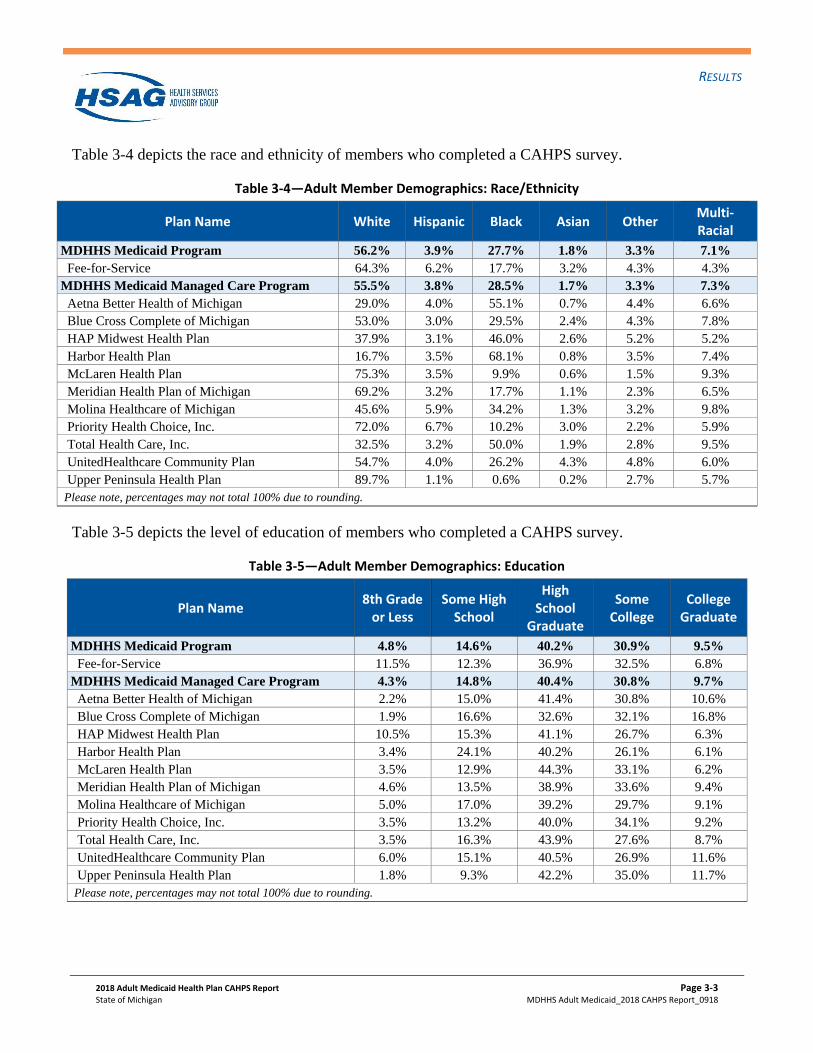
Table 3-4 depicts the race and ethnicity of members who completed a CAHPS survey.
Table 3-4—Adult Member Demographics: Race/Ethnicity
Plan Name White Hispanic Black Asian Other Multi-Racial
MDHHS Medicaid Program 56.2% 3.9% 27.7% 1.8% 3.3% 7.1%
Fee-for-Service 64.3% 6.2% 17.7% 3.2% 4.3% 4.3%
MDHHS Medicaid Managed Care Program 55.5% 3.8% 28.5% 1.7% 3.3% 7.3%
Aetna Better Health of Michigan 29.0% 4.0% 55.1% 0.7% 4.4% 6.6%
Blue Cross Complete of Michigan 53.0% 3.0% 29.5% 2.4% 4.3% 7.8%
HAP Midwest Health Plan 37.9% 3.1% 46.0% 2.6% 5.2% 5.2%
Harbor Health Plan 16.7% 3.5% 68.1% 0.8% 3.5% 7.4%
McLaren Health Plan 75.3% 3.5% 9.9% 0.6% 1.5% 9.3%
Meridian Health Plan of Michigan 69.2% 3.2% 17.7% 1.1% 2.3% 6.5%
Molina Healthcare of Michigan 45.6% 5.9% 34.2% 1.3% 3.2% 9.8%
Priority Health Choice, Inc. 72.0% 6.7% 10.2% 3.0% 2.2% 5.9%
Total Health Care, Inc. 32.5% 3.2% 50.0% 1.9% 2.8% 9.5%
UnitedHealthcare Community Plan 54.7% 4.0% 26.2% 4.3% 4.8% 6.0%
Upper Peninsula Health Plan 89.7% 1.1% 0.6% 0.2% 2.7% 5.7%
Please note, percentages may not total 100% due to rounding.
Table 3-5 depicts the level of education of members who completed a CAHPS survey.
Table 3-5—Adult Member Demographics: Education
Plan Name 8th Grade
or Less Some High
School
High School
Graduate
Some College
College Graduate
MDHHS Medicaid Program 4.8% 14.6% 40.2% 30.9% 9.5%
Fee-for-Service 11.5% 12.3% 36.9% 32.5% 6.8%
MDHHS Medicaid Managed Care Program 4.3% 14.8% 40.4% 30.8% 9.7%
Aetna Better Health of Michigan 2.2% 15.0% 41.4% 30.8% 10.6%
Blue Cross Complete of Michigan 1.9% 16.6% 32.6% 32.1% 16.8%
HAP Midwest Health Plan 10.5% 15.3% 41.1% 26.7% 6.3%
Harbor Health Plan 3.4% 24.1% 40.2% 26.1% 6.1%
McLaren Health Plan 3.5% 12.9% 44.3% 33.1% 6.2%
Meridian Health Plan of Michigan 4.6% 13.5% 38.9% 33.6% 9.4%
Molina Healthcare of Michigan 5.0% 17.0% 39.2% 29.7% 9.1%
Priority Health Choice, Inc. 3.5% 13.2% 40.0% 34.1% 9.2%
Total Health Care, Inc. 3.5% 16.3% 43.9% 27.6% 8.7%
UnitedHealthcare Community Plan 6.0% 15.1% 40.5% 26.9% 11.6%
Upper Peninsula Health Plan 1.8% 9.3% 42.2% 35.0% 11.7%
Please note, percentages may not total 100% due to rounding.

RESULTS
2018 Adult Medicaid Health Plan CAHPS Report Page 3-4
State of Michigan MDHHS Adult Medicaid_2018 CAHPS Report_0918
Table 3-6 depicts the general health status of members who completed a CAHPS survey.
Table 3-6—Adult Member Demographics: General Health Status
Plan Name Excellent Very Good
Good Fair Poor
MDHHS Medicaid Program 8.3% 21.1% 36.0% 26.5% 8.1%
Fee-for-Service 9.1% 17.4% 37.0% 26.8% 9.7%
MDHHS Medicaid Managed Care Program 8.2% 21.4% 35.9% 26.5% 8.0%
Aetna Better Health of Michigan 6.9% 19.9% 37.2% 28.5% 7.6%
Blue Cross Complete of Michigan 10.4% 23.4% 36.4% 23.7% 6.1%
HAP Midwest Health Plan 5.9% 12.7% 37.8% 34.5% 9.2%
Harbor Health Plan 10.4% 20.8% 32.0% 28.6% 8.1%
McLaren Health Plan 9.2% 19.9% 37.8% 26.5% 6.6%
Meridian Health Plan of Michigan 8.5% 24.4% 34.5% 23.7% 8.9%
Molina Healthcare of Michigan 8.6% 17.9% 36.3% 28.6% 8.6%
Priority Health Choice, Inc. 9.0% 23.3% 34.0% 26.1% 7.7%
Total Health Care, Inc. 7.7% 23.0% 31.5% 29.8% 8.1%
UnitedHealthcare Community Plan 7.7% 21.4% 41.8% 21.1% 8.0%
Upper Peninsula Health Plan 7.3% 26.9% 35.8% 21.9% 8.2%
Please note, percentages may not total 100% due to rounding.
RESULTS
2018 Adult Medicaid Health Plan CAHPS Report Page 3-5
State of Michigan MDHHS Adult Medicaid_2018 CAHPS Report_0918
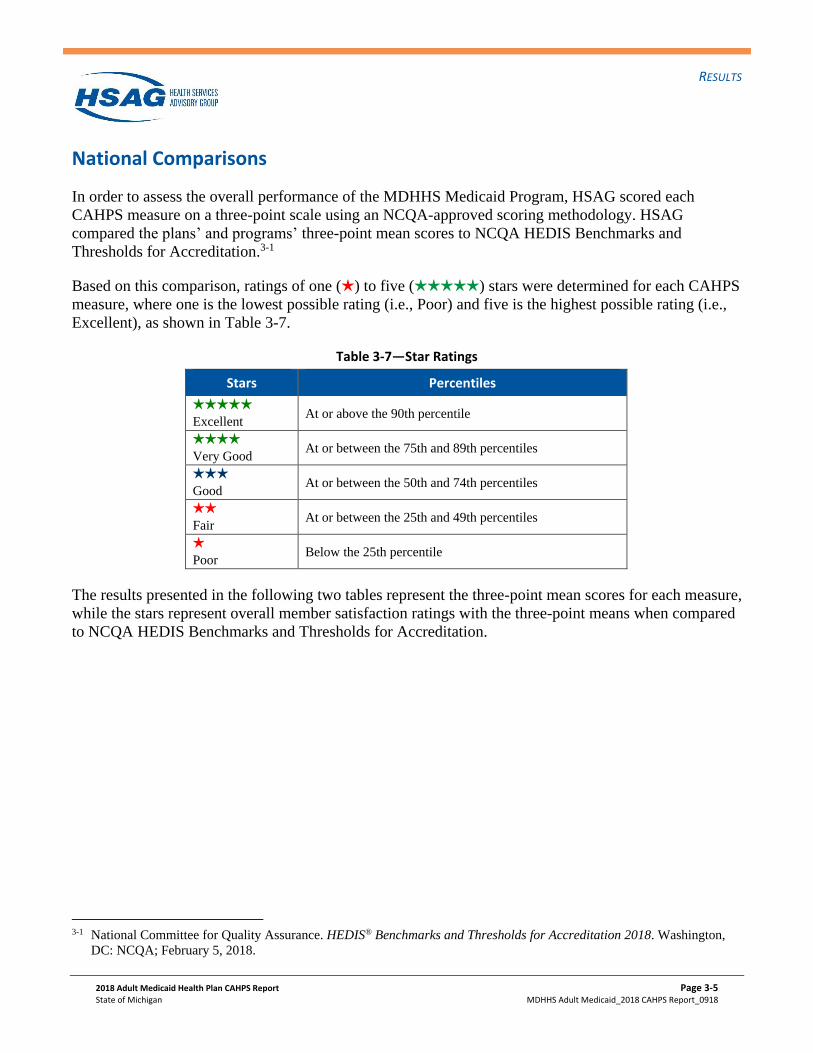
National Comparisons
In order to assess the overall performance of the MDHHS Medicaid Program, HSAG scored each
CAHPS measure on a three-point scale using an NCQA-approved scoring methodology. HSAG
compared the plans’ and programs’ three-point mean scores to NCQA HEDIS Benchmarks and
Thresholds for Accreditation.3-1
Based on this comparison, ratings of one () to five () stars were determined for each CAHPS
measure, where one is the lowest possible rating (i.e., Poor) and five is the highest possible rating (i.e.,
Excellent), as shown in Table 3-7.
Table 3-7—Star Ratings
Stars Percentiles
Excellent
At or above the 90th percentile
Very Good
At or between the 75th and 89th percentiles
Good
At or between the 50th and 74th percentiles
Fair
At or between the 25th and 49th percentiles
Poor
Below the 25th percentile
The results presented in the following two tables represent the three-point mean scores for each measure,
while the stars represent overall member satisfaction ratings with the three-point means when compared
to NCQA HEDIS Benchmarks and Thresholds for Accreditation.
3-1 National Committee for Quality Assurance. HEDIS® Benchmarks and Thresholds for Accreditation 2018. Washington,
DC: NCQA; February 5, 2018.

RESULTS
2018 Adult Medicaid Health Plan CAHPS Report Page 3-6
State of Michigan MDHHS Adult Medicaid_2018 CAHPS Report_0918
Table 3-8 shows the overall member satisfaction ratings on each of the four global ratings.
Table 3-8—National Comparisons: Global Ratings
Plan Name Rating of Health
Plan Rating of All Health Care
Rating of Personal Doctor
Rating of Specialist Seen
Most Often
MDHHS Medicaid Program 2.47
2.38
2.51
2.55
Fee-for-Service
2.35 2.40
2.56
2.58
MDHHS Medicaid Managed Care Program 2.48
2.38
2.51
2.54
Aetna Better Health of Michigan
2.34
2.32
2.56
2.58
Blue Cross Complete of Michigan
2.51 2.43
2.53
2.51
HAP Midwest Health Plan
2.56 2.39
2.59
2.64
Harbor Health Plan
2.38
2.29 2.45
+
2.42
McLaren Health Plan
2.55
2.45 2.50
2.65
Meridian Health Plan of Michigan 2.50
2.40
2.50
2.55
Molina Healthcare of Michigan 2.39
2.31
2.49
2.53
Priority Health Choice, Inc.
2.52 2.41
2.51
2.56
Total Health Care, Inc. 2.46
2.32
2.44
2.45
UnitedHealthcare Community Plan 2.47
2.42
2.50
2.54
Upper Peninsula Health Plan
2.55 2.41
2.54
2.52
+ Indicates fewer than 100 responses. Caution should be exercised when evaluating these results.
The MDHHS Medicaid Program and the MDHHS Medicaid Managed Care Program scored at or
between the 50th and 74th percentiles for three global ratings: Rating of Health Plan, Rating of Personal
Doctor, and Rating of Specialist Seen Most Often. The MDHHS Medicaid Program and the MDHHS
Medicaid Managed Care Program scored at or between the 25th and 49th percentiles for the Rating of
All Health Care global rating.

RESULTS
2018 Adult Medicaid Health Plan CAHPS Report Page 3-7
State of Michigan MDHHS Adult Medicaid_2018 CAHPS Report_0918
Table 3-9 shows the overall member satisfaction ratings on four of the composite measures and one
individual item measure.3-2
Table 3-9—National Comparisons: Composite and Individual Item Measures
Plan Name Getting
Needed Care Getting Care
Quickly
How Well Doctors
Communicate Customer
Service Coordination
of Care
MDHHS Medicaid Program 2.42
2.47
2.66
2.60
2.39
Fee-for-Service 2.41
2.48
2.63
+
2.42
2.44
MDHHS Medicaid Managed Care Program
2.43
2.47
2.66
2.61
2.38
Aetna Better Health of Michigan
2.52
2.48
2.73 +
2.54
2.43
Blue Cross Complete of Michigan 2.39
2.46
2.68
2.60
2.44
HAP Midwest Health Plan
2.47
2.59
2.70
2.64 2.46
Harbor Health Plan 2.37
2.35
2.65
2.64
+
2.32
McLaren Health Plan
2.54 2.46
2.66
+
2.73
2.41
Meridian Health Plan of Michigan 2.38
2.46
2.65
2.58
2.34
Molina Healthcare of Michigan 2.35
2.41
2.62
2.57
2.30
Priority Health Choice, Inc.
2.44
2.49
2.65
2.64 2.44
Total Health Care, Inc. 2.42
2.39
2.60
2.61
2.26
UnitedHealthcare Community Plan 2.41
2.43
2.66
2.58
2.42
Upper Peninsula Health Plan
2.45
2.55
2.67
2.63 2.42
+ Indicates fewer than 100 responses. Caution should be exercised when evaluating these results.
The MDHHS Medicaid Program and the MDHHS Medicaid Managed Care Program scored at or above
the 90th percentile for the How Well Doctors Communicate composite measure. The MDHHS Medicaid
Managed Care Program scored at or above the 90th percentile for the Customer Service composite
measure. The MDHHS Medicaid Program and the MDHHS Medicaid Managed Care Program scored at
or between the 75th and 89th percentiles for the Getting Care Quickly composite measure. The MDHHS
Medicaid Program scored at or between the 75th and 89th percentiles for the Customer Service
3-2 NCQA does not publish national benchmarks and thresholds for the Shared Decision Making composite measure, and the
Health Promotion and Education individual item measure; therefore, these CAHPS measures were excluded from the
National Comparisons analysis.
RESULTS
2018 Adult Medicaid Health Plan CAHPS Report Page 3-8
State of Michigan MDHHS Adult Medicaid_2018 CAHPS Report_0918
composite measure. The MDHHS Medicaid Managed Care Program scored at or between the 75th and
89th percentiles for the Getting Needed Care composite measure. The MDHHS Medicaid Program
scored at or between the 50th and 74th percentiles for the Getting Needed Care composite measure. The
MDHHS Medicaid Program and the MDHHS Medicaid Managed Care Program scored at or between
the 25th and 49th percentiles for the Coordination of Care individual item measure.
RESULTS
2018 Adult Medicaid Health Plan CAHPS Report Page 3-9
State of Michigan MDHHS Adult Medicaid_2018 CAHPS Report_0918
Statewide Comparisons
For purposes of the Statewide Comparisons analysis, HSAG calculated top-box rates (i.e., rates of
satisfaction) for each global rating, composite measure, and individual item measure. A “top-box”
response was defined as follows:
• “9” or “10” for the global ratings;
• “Usually” or “Always” for the Getting Needed Care, Getting Care Quickly, How Well Doctors
Communicate, and Customer Service composites, and the Coordination of Care individual item;
• “Yes” for the Shared Decision Making composite and the Health Promotion and Education
individual item.
HSAG also calculated overall rates for the Effectiveness of Care Medical Assistance with Smoking and
Tobacco Use Cessation measures. Refer to the Reader’s Guide section for more detailed information
regarding the calculation of these measures.
The MDHHS Medicaid Program and MDHHS Medicaid Managed Care Program results were weighted
based on the eligible population for each adult population (i.e., FFS and/or MHPs). HSAG compared the
MHP results to the MDHHS Medicaid Managed Care Program average to determine if the MHP results
were statistically significantly different than the MDHHS Medicaid Managed Care Program average.
Additionally, HSAG compared the FFS results to the MDHHS Medicaid Managed Care Program results
to determine if the FFS results were statistically significantly different than the MDHHS Medicaid
Managed Care Program results. The NCQA adult Medicaid national averages also are presented for
comparison.3-3 Colors in the figures note statistically significant differences. Green indicates a top-box
rate that was statistically significantly higher than the MDHHS Medicaid Managed Care Program
average. Conversely, red indicates a top-box rate that was statistically significantly lower than the
MDHHS Medicaid Managed Care Program average. Blue represents top-box rates that were not
statistically significantly different from the MDHHS Medicaid Managed Care Program average. Health
plan/program rates with fewer than 100 respondents are denoted with a cross (+). Caution should be
used when evaluating rates derived from fewer than 100 respondents.
In some instances, the top-box rates presented for two plans were similar, but one was statistically
different from the MDHHS Medicaid Managed Care Program average and the other was not. In these
instances, it was the difference in the number of respondents between the two plans that explains the
different statistical results. It is more likely that a significant result will be found in a plan with a larger
number of respondents.
3-3 The source for the national data contained in this publication is Quality Compass® 2017 and is used with the permission
of the National Committee for Quality Assurance (NCQA). Quality Compass 2017 includes certain CAHPS data. Any
data display, analysis, interpretation, or conclusion based on these data is solely that of the authors, and NCQA
specifically disclaims responsibility for any such display, analysis, interpretation, or conclusion. Quality Compass is a
registered trademark of NCQA. CAHPS® is a registered trademark of AHRQ.
RESULTS
2018 Adult Medicaid Health Plan CAHPS Report Page 3-10
State of Michigan MDHHS Adult Medicaid_2018 CAHPS Report_0918
Global Ratings
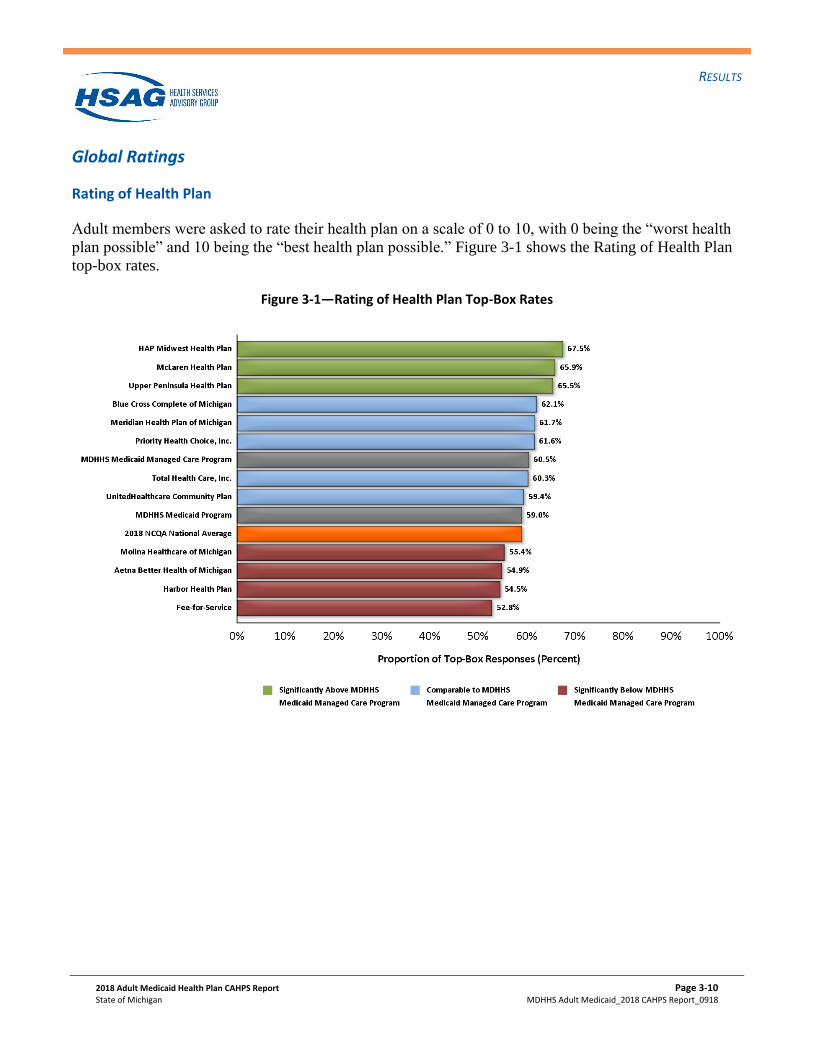
Rating of Health Plan
Adult members were asked to rate their health plan on a scale of 0 to 10, with 0 being the “worst health
plan possible” and 10 being the “best health plan possible.” Figure 3-1 shows the Rating of Health Plan
top-box rates.
Figure 3-1—Rating of Health Plan Top-Box Rates

RESULTS
2018 Adult Medicaid Health Plan CAHPS Report Page 3-11
State of Michigan MDHHS Adult Medicaid_2018 CAHPS Report_0918
Rating of All Health Care
Adult members were asked to rate all their health care on a scale of 0 to 10, with 0 being the “worst
health care possible” and 10 being the “best health care possible.” Figure 3-2 shows the Rating of All
Health Care top-box rates.
Figure 3-2—Rating of All Health Care Top-Box Rates

RESULTS
2018 Adult Medicaid Health Plan CAHPS Report Page 3-12
State of Michigan MDHHS Adult Medicaid_2018 CAHPS Report_0918
Rating of Personal Doctor
Adult members were asked to rate their personal doctor on a scale of 0 to 10, with 0 being the “worst
personal doctor possible” and 10 being the “best personal doctor possible.” Figure 3-3 shows the Rating
of Personal Doctor top-box rates.
Figure 3-3—Rating of Personal Doctor Top-Box Rates
RESULTS
2018 Adult Medicaid Health Plan CAHPS Report Page 3-13
State of Michigan MDHHS Adult Medicaid_2018 CAHPS Report_0918
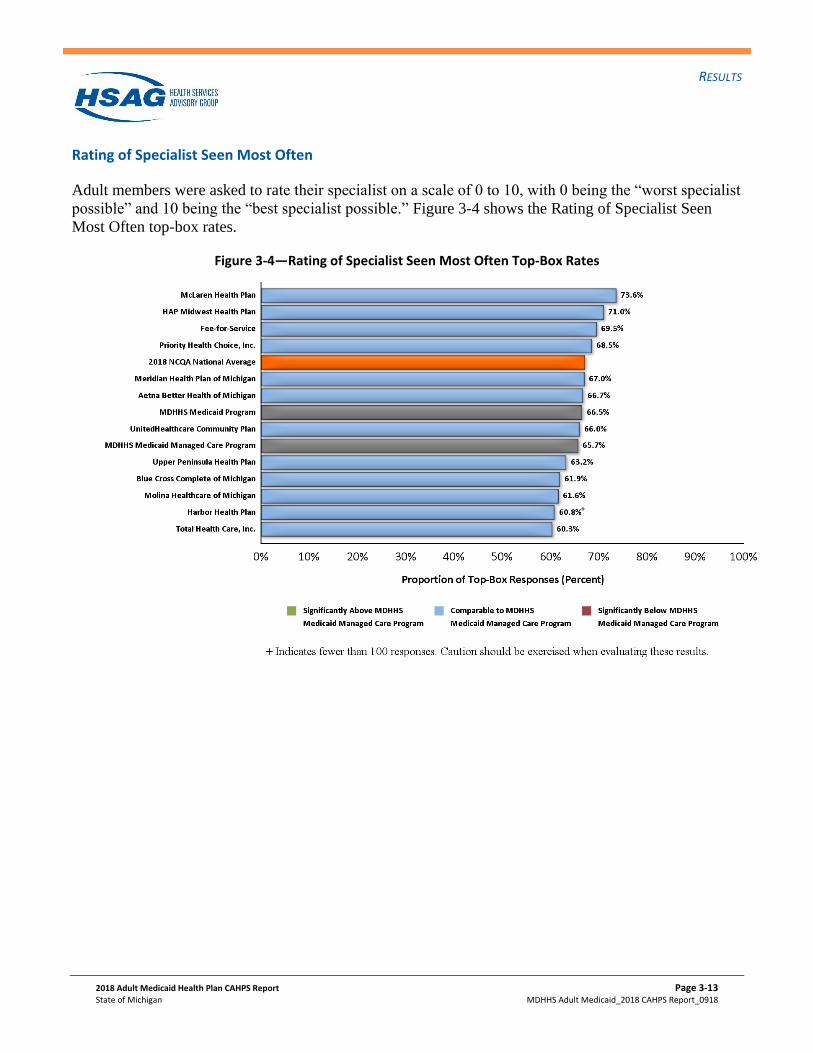
Rating of Specialist Seen Most Often
Adult members were asked to rate their specialist on a scale of 0 to 10, with 0 being the “worst specialist
possible” and 10 being the “best specialist possible.” Figure 3-4 shows the Rating of Specialist Seen
Most Often top-box rates.
Figure 3-4—Rating of Specialist Seen Most Often Top-Box Rates
RESULTS
2018 Adult Medicaid Health Plan CAHPS Report Page 3-14
State of Michigan MDHHS Adult Medicaid_2018 CAHPS Report_0918
Composite Measures
Getting Needed Care
Two questions (Questions 14 and 25) were asked to assess how often it was easy to get needed care:
• Question 14. In the last 6 months, how often was it easy to get the care, tests, or treatment you
needed?
o Never
o Sometimes
o Usually
o Always
• Question 25. In the last 6 months, how often did you get an appointment to see a specialist as soon
as you needed?
o Never
o Sometimes
o Usually
o Always
For purposes of the analysis, HSAG calculated top-box rates for the Getting Needed Care composite
measure, which was defined as a response of “Usually” or “Always.”

RESULTS
2018 Adult Medicaid Health Plan CAHPS Report Page 3-15
State of Michigan MDHHS Adult Medicaid_2018 CAHPS Report_0918
Figure 3-5 shows the Getting Needed Care top-box rates.
Figure 3-5—Getting Needed Care Top-Box Rates

RESULTS
2018 Adult Medicaid Health Plan CAHPS Report Page 3-16
State of Michigan MDHHS Adult Medicaid_2018 CAHPS Report_0918
Getting Care Quickly
Two questions (Questions 4 and 6) were asked to assess how often adult members received care quickly:
• Question 4. In the last 6 months, when you needed care right away, how often did you get care as
soon as you needed?
o Never
o Sometimes
o Usually
o Always
• Question 6. In the last 6 months, how often did you get an appointment for a check-up or routine
care at a doctor’s office or clinic as soon as you needed?
o Never
o Sometimes
o Usually
o Always
For purposes of the analysis, HSAG calculated top-box rates for the Getting Care Quickly composite
measure, which was defined as a response of “Usually” or “Always.”
RESULTS
2018 Adult Medicaid Health Plan CAHPS Report Page 3-17
State of Michigan MDHHS Adult Medicaid_2018 CAHPS Report_0918
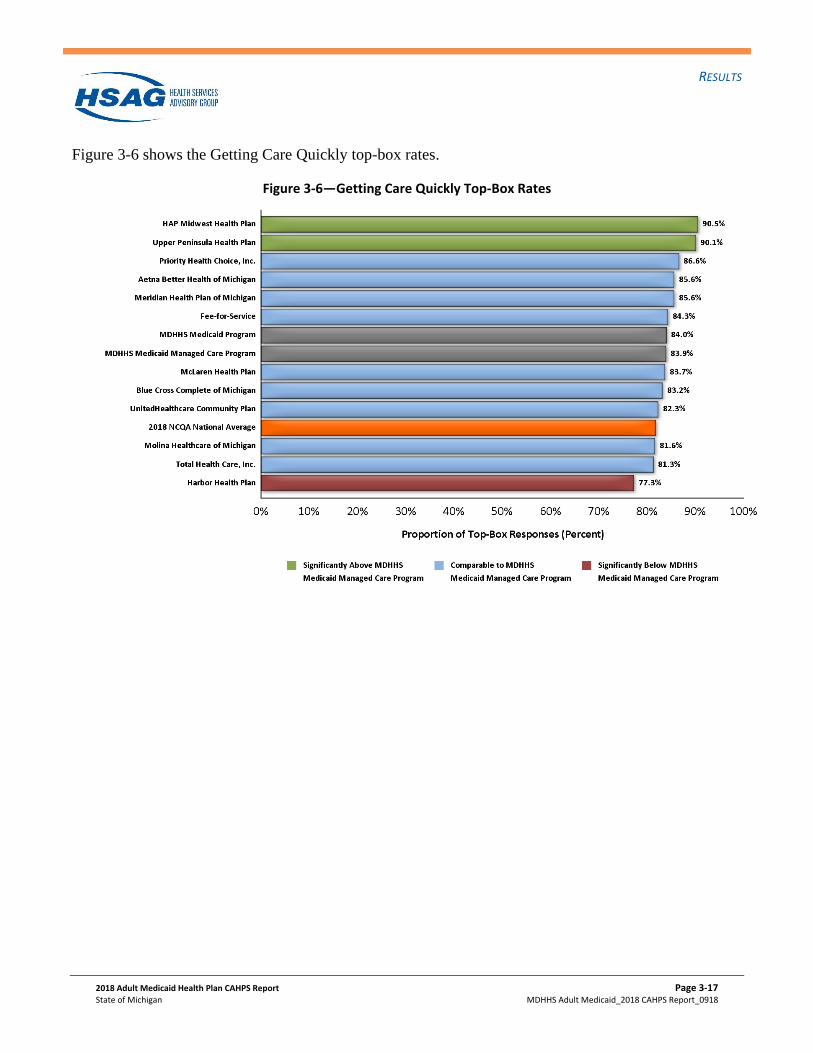
Figure 3-6 shows the Getting Care Quickly top-box rates.
Figure 3-6—Getting Care Quickly Top-Box Rates
RESULTS
2018 Adult Medicaid Health Plan CAHPS Report Page 3-18
State of Michigan MDHHS Adult Medicaid_2018 CAHPS Report_0918
How Well Doctors Communicate
A series of four questions (Questions 17, 18, 19, and 20) was asked to assess how often doctors
communicated well:
• Question 17. In the last 6 months, how often did your personal doctor explain things in a way that
was easy to understand?
o Never
o Sometimes
o Usually
o Always
• Question 18. In the last 6 months, how often did your personal doctor listen carefully to you?
o Never
o Sometimes
o Usually
o Always
• Question 19. In the last 6 months, how often did your personal doctor show respect for what you
had to say?
o Never
o Sometimes
o Usually
o Always
• Question 20. In the last 6 months, how often did your personal doctor spend enough time with you?
o Never
o Sometimes
o Usually
o Always
For purposes of the analysis, HSAG calculated top-box rates for the How Well Doctors Communicate
composite measure, which was defined as a response of “Usually” or “Always.”

RESULTS
2018 Adult Medicaid Health Plan CAHPS Report Page 3-19
State of Michigan MDHHS Adult Medicaid_2018 CAHPS Report_0918
Figure 3-7 shows the How Well Doctors Communicate top-box rates.
Figure 3-7—How Well Doctors Communicate Top-Box Rates

RESULTS
2018 Adult Medicaid Health Plan CAHPS Report Page 3-20
State of Michigan MDHHS Adult Medicaid_2018 CAHPS Report_0918
Customer Service
Two questions (Questions 31 and 32) were asked to assess how often adult members were satisfied with
customer service:
• Question 31. In the last 6 months, how often did your health plan’s customer service give you the
information or help you needed?
o Never
o Sometimes
o Usually
o Always
• Question 32. In the last 6 months, how often did your health plan’s customer service staff treat you
with courtesy and respect?
o Never
o Sometimes
o Usually
o Always
For purposes of the analysis, HSAG calculated top-box rates for the Customer Service composite
measure, which was defined as a response of “Usually” or “Always.”
RESULTS
2018 Adult Medicaid Health Plan CAHPS Report Page 3-21
State of Michigan MDHHS Adult Medicaid_2018 CAHPS Report_0918
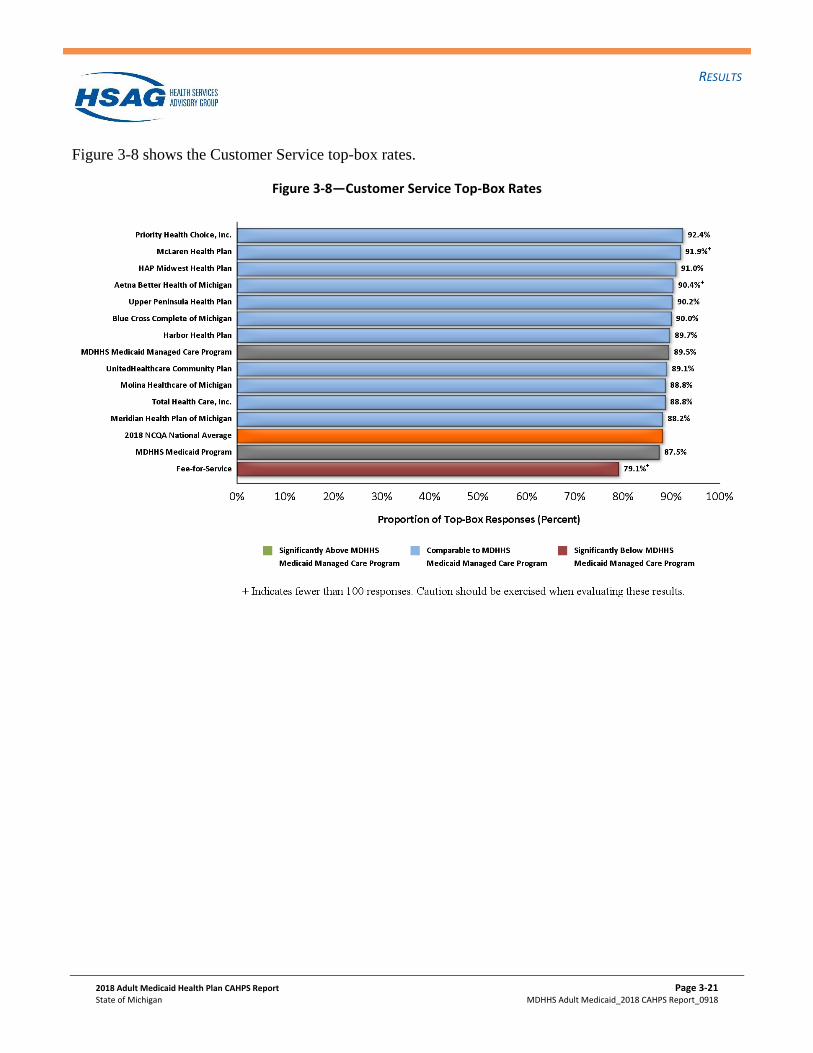
Figure 3-8 shows the Customer Service top-box rates.
Figure 3-8—Customer Service Top-Box Rates
RESULTS
2018 Adult Medicaid Health Plan CAHPS Report Page 3-22
State of Michigan MDHHS Adult Medicaid_2018 CAHPS Report_0918
Shared Decision Making
Three questions (Questions 10, 11, and 12) were asked regarding the involvement of adult members in
decision making when starting or stopping a prescription medicine:
• Question 10. Did you and a doctor or other health provider talk about the reasons you might want to
take a medicine?
o Yes
o No
• Question 11. Did you and a doctor or other health provider talk about the reasons you might not
want to take a medicine?
o Yes
o No
• Question 12. When you talked about starting or stopping a prescription medicine, did a doctor or
other health provider ask you what you thought was best for you?
o Yes
o No
For purposes of the analysis, HSAG calculated top-box rates for the Shared Decision Making composite
measure, which was defined as a response of “Yes.”

RESULTS
2018 Adult Medicaid Health Plan CAHPS Report Page 3-23
State of Michigan MDHHS Adult Medicaid_2018 CAHPS Report_0918
Figure 3-9 shows the Shared Decision Making top-box rates.
Figure 3-9—Shared Decision Making Top-Box Rates
RESULTS
2018 Adult Medicaid Health Plan CAHPS Report Page 3-24
State of Michigan MDHHS Adult Medicaid_2018 CAHPS Report_0918
Individual Item Measures
Coordination of Care
Adult members were asked one question (Question 22) to assess how often their personal doctor seemed
informed and up-to-date about care they received from another doctor:
• Question 22. In the last 6 months, how often did your personal doctor seem informed and up-to-date
about the care you got from these doctors or other health providers?
o Never
o Sometimes
o Usually
o Always
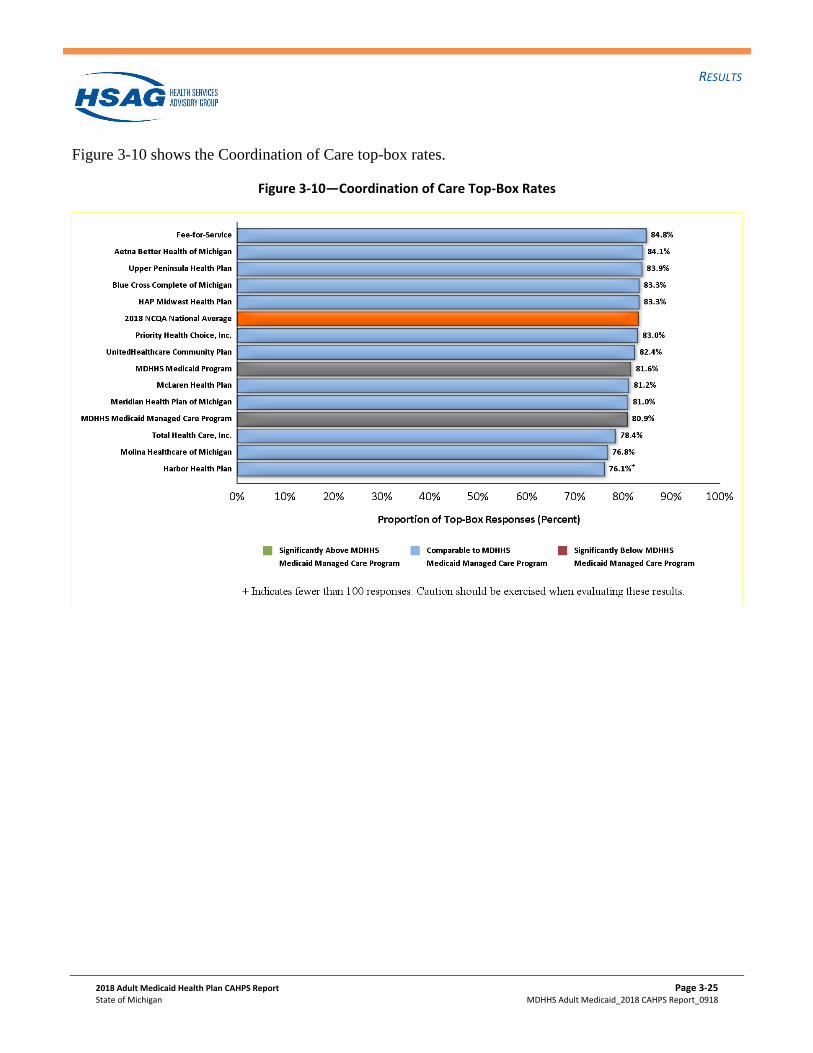
For purposes of the analysis, HSAG calculated top-box rates for the Coordination of Care individual
item measure, which was defined as a response of “Usually” or “Always.”
RESULTS
2018 Adult Medicaid Health Plan CAHPS Report Page 3-25
State of Michigan MDHHS Adult Medicaid_2018 CAHPS Report_0918
Figure 3-10 shows the Coordination of Care top-box rates.
Figure 3-10—Coordination of Care Top-Box Rates
RESULTS
2018 Adult Medicaid Health Plan CAHPS Report Page 3-26
State of Michigan MDHHS Adult Medicaid_2018 CAHPS Report_0918
Health Promotion and Education
Adult members were asked one question (Question 8) to assess if their doctor talked with them about
specific things they could do to prevent illness:
• Question 8. In the last 6 months, did you and a doctor or other health provider talk about specific
things you could do to prevent illness?
o Yes
o No
For purposes of the analysis, HSAG calculated top-box rates for the Health Promotion and Education
individual item measure, which was defined as a response of “Yes.”

RESULTS
2018 Adult Medicaid Health Plan CAHPS Report Page 3-27
State of Michigan MDHHS Adult Medicaid_2018 CAHPS Report_0918
Figure 3-11 shows the Health Promotion and Education top-box rates.
Figure 3-11—Health Promotion and Education Top-Box Rates
RESULTS
2018 Adult Medicaid Health Plan CAHPS Report Page 3-28
State of Michigan MDHHS Adult Medicaid_2018 CAHPS Report_0918
Effectiveness of Care Measures
Medical Assistance with Smoking and Tobacco Use Cessation
Advising Smokers and Tobacco Users to Quit
Adult members were asked how often they were advised to quit smoking or using tobacco by a doctor or
other health provider (Question 40):
• Question 40. In the last 6 months, how often were you advised to quit smoking or using tobacco by
a doctor or other health provider in your plan?
o Never
o Sometimes
o Usually
o Always
The results of this measure represent the percentage of smokers/tobacco users who answered
“Sometimes,” “Usually,” or “Always” to this question. The rates presented follow NCQA’s
methodology of calculating a rolling average using the current and prior years’ results.

RESULTS
2018 Adult Medicaid Health Plan CAHPS Report Page 3-29
State of Michigan MDHHS Adult Medicaid_2018 CAHPS Report_0918
Figure 3-12 shows the Advising Smokers and Tobacco Users to Quit rates.
Figure 3-12—Advising Smokers and Tobacco Users to Quit Rates
RESULTS
2018 Adult Medicaid Health Plan CAHPS Report Page 3-30
State of Michigan MDHHS Adult Medicaid_2018 CAHPS Report_0918
Discussing Cessation Medications
Adult members were asked how often medication was recommended or discussed by a doctor or other
health provider to assist them with quitting smoking or using tobacco (Question 41):
• Question 41. In the last 6 months, how often was medication recommended or discussed by a doctor
or health provider to assist you with quitting smoking or using tobacco? Examples of medication are:
nicotine gum, patch, nasal spray, inhaler, or prescription medication.
o Never
o Sometimes
o Usually
o Always
The results of this measure represent the percentage of smokers/tobacco users who answered
“Sometimes,” “Usually,” or “Always” to this question. The rates presented follow NCQA’s
methodology of calculating a rolling average using the current and prior years’ results.

RESULTS
2018 Adult Medicaid Health Plan CAHPS Report Page 3-31
State of Michigan MDHHS Adult Medicaid_2018 CAHPS Report_0918
Figure 3-13 shows the Discussing Cessation Medications rates.
Figure 3-13—Discussing Cessation Medications Rates

RESULTS
2018 Adult Medicaid Health Plan CAHPS Report Page 3-32
State of Michigan MDHHS Adult Medicaid_2018 CAHPS Report_0918
Discussing Cessation Strategies
Adult members were asked how often their doctor or health provider discussed or provided methods and
strategies other than medication to assist them with quitting smoking or using tobacco (Question 42):
• Question 42. In the last 6 months, how often did your doctor or health provider discuss or provide
methods and strategies other than medication to assist you with quitting smoking or using tobacco?
Examples of methods and strategies are: telephone helpline, individual or group counseling, or
cessation program.
o Never
o Sometimes
o Usually
o Always
The results of this measure represent the percentage of smokers/tobacco users who answered
“Sometimes,” “Usually,” or “Always” to this question. The rates presented follow NCQA’s
methodology of calculating a rolling average using the current and prior years’ results.
RESULTS
2018 Adult Medicaid Health Plan CAHPS Report Page 3-33
State of Michigan MDHHS Adult Medicaid_2018 CAHPS Report_0918
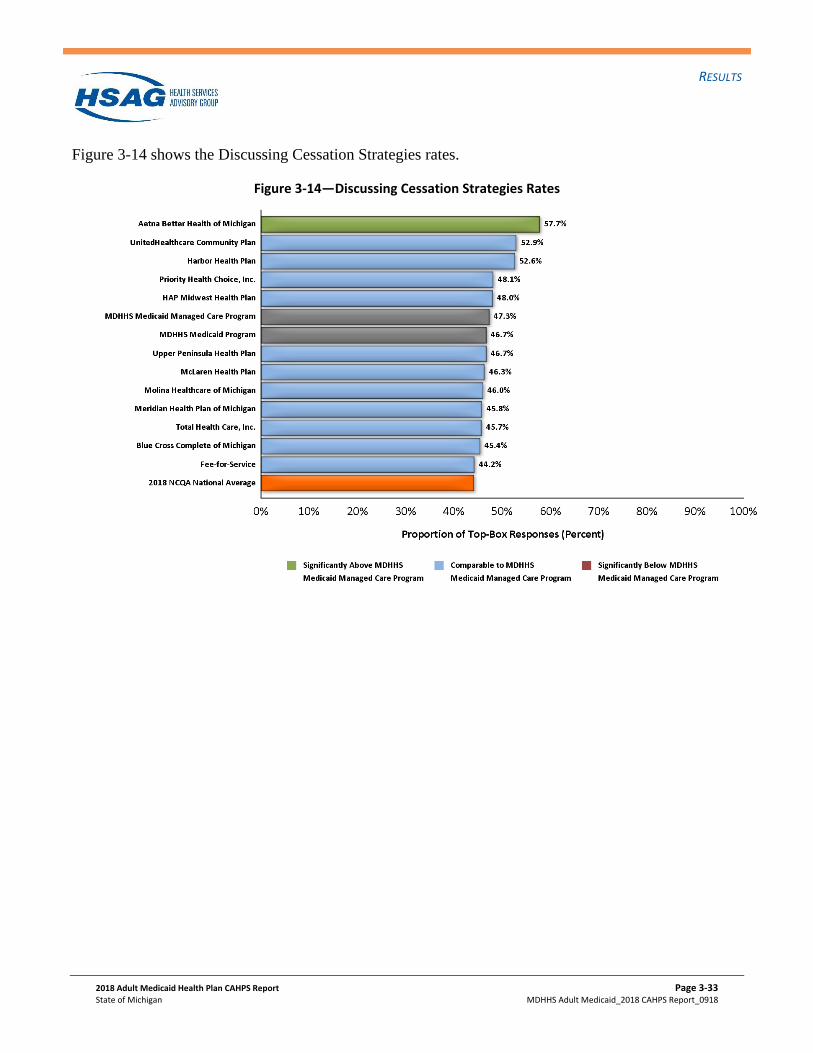
Figure 3-14 shows the Discussing Cessation Strategies rates.
Figure 3-14—Discussing Cessation Strategies Rates

RESULTS
2018 Adult Medicaid Health Plan CAHPS Report Page 3-34
State of Michigan MDHHS Adult Medicaid_2018 CAHPS Report_0918
Summary of Results
Table 3-10 provides a summary of the Statewide Comparisons results for the global ratings.
Table 3-10—Statewide Comparisons: Global Ratings
Plan Name Rating of
Health Plan Rating of All Health Care
Rating of Personal Doctor
Rating of Specialist Seen Most Often
Fee-for-Service — — —
Aetna Better Health of Michigan — — —
Blue Cross Complete of Michigan — — — —
HAP Midwest Health Plan — — —
Harbor Health Plan — — —+
McLaren Health Plan — — —
Meridian Health Plan of Michigan — — — —
Molina Healthcare of Michigan — — —
Priority Health Choice, Inc. — — — —
Total Health Care, Inc. — — — —
UnitedHealthcare Community Plan — — — —
Upper Peninsula Health Plan — — —
+ Indicates fewer than 100 responses. Caution should be exercised when evaluating these results.
Indicates the plan’s score is statistically significantly above the MDHHS Medicaid Managed Care Program average.
Indicates the plan’s score is statistically significantly below than the MDHHS Medicaid Managed Care Program average.
— Indicates the plan’s score is not statistically significantly different than the MDHHS Medicaid Managed Care Program average.

RESULTS
2018 Adult Medicaid Health Plan CAHPS Report Page 3-35
State of Michigan MDHHS Adult Medicaid_2018 CAHPS Report_0918
Table 3-11 provides a summary of the Statewide Comparisons for the composite measures.
Table 3-11—Statewide Comparisons: Composite Measures
Plan Name
Getting Needed
Care
Getting Care
Quickly
How Well Doctors
Communicate Customer
Service
Shared Decision Making
Fee-for-Service — — — + —
Aetna Better Health of Michigan — — — —+ —
Blue Cross Complete of Michigan — — — — —
HAP Midwest Health Plan — — — —
Harbor Health Plan — — —+
McLaren Health Plan — — —+ —
Meridian Health Plan of Michigan — — — —
Molina Healthcare of Michigan — — — —
Priority Health Choice, Inc. — — — — —
Total Health Care, Inc. — — — — —
UnitedHealthcare Community Plan — — — — —
Upper Peninsula Health Plan — — —
+ Indicates fewer than 100 responses. Caution should be exercised when evaluating these results.
Indicates the plan’s score is statistically significantly above the MDHHS Medicaid Managed Care Program average.
Indicates the plan’s score is statistically significantly below than the MDHHS Medicaid Managed Care Program average.
— Indicates the plan’s score is not statistically significantly different than the MDHHS Medicaid Managed Care Program average.

RESULTS
2018 Adult Medicaid Health Plan CAHPS Report Page 3-36
State of Michigan MDHHS Adult Medicaid_2018 CAHPS Report_0918
Table 3-12 provides a summary of the Statewide Comparisons for the individual item and Effectiveness
of Care measures.
Table 3-12—Statewide Comparisons: Individual Item and Effectiveness of Care Measures
Plan Name Coordination
of Care
Health Promotion
and Education
Advising Smokers and
Tobacco Users to Quit
Discussing Cessation
Medications
Discussing Cessation Strategies
Fee-for-Service — — — — —
Aetna Better Health of Michigan — — — —
Blue Cross Complete of Michigan — — — — —
HAP Midwest Health Plan — — — — —
Harbor Health Plan —+ — — — —
McLaren Health Plan — — — — —
Meridian Health Plan of Michigan — — — — —
Molina Healthcare of Michigan — — — — —
Priority Health Choice, Inc. — — — — —
Total Health Care, Inc. — — — — —
UnitedHealthcare Community Plan — — — — —
Upper Peninsula Health Plan — — — — —
+ Indicates fewer than 100 responses. Caution should be exercised when evaluating these results.
Indicates the plan’s score is statistically significantly above the MDHHS Medicaid Managed Care Program average.
Indicates the plan’s score is statistically significantly below the MDHHS Medicaid Managed Care Program average.
— Indicates the plan’s score is not statistically significantly different than the MDHHS Medicaid Managed Care Program average.
2018 Adult Medicaid Health Plan CAHPS Report Page 4-1
State of Michigan MDHHS Adult Medicaid_2018 CAHPS Report_0918
4. Trend Analysis
Trend Analysis
The completed surveys from the 2018 and 2017 CAHPS results were used to perform the trend analysis
presented in this section. The 2018 CAHPS top-box scores were compared to the 2017 CAHPS top-box
scores to determine whether there were statistically significant differences. Statistically significant
differences between 2018 scores and 2017 scores are noted with triangles. Scores that were statistically
significantly higher in 2018 than in 2017 are noted with upward triangles (). Scores that were
statistically significantly lower in 2018 than in 2017 are noted with downward triangles (). Scores in
2018 that were not statistically significantly different from scores in 2017 are noted with a dash (—).
Measures that did not meet the minimum number of 100 responses required by NCQA are denoted with
a cross (+). Caution should be used when evaluating rates derived from fewer than 100 respondents.
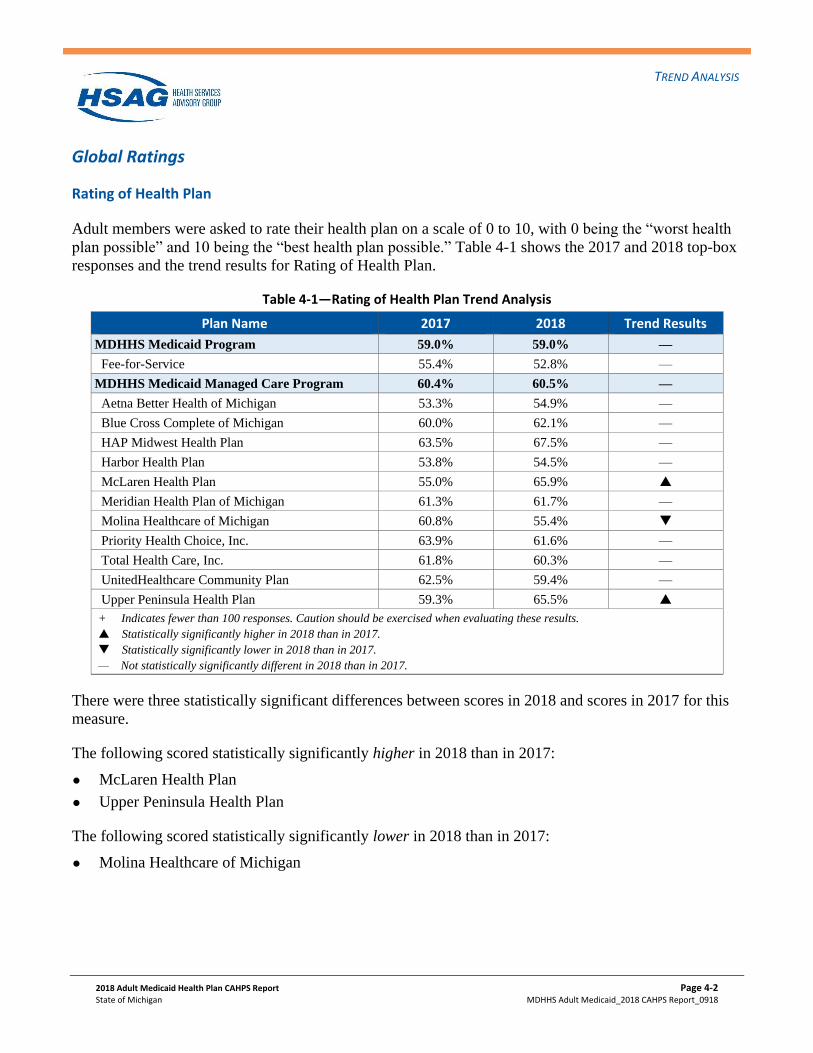
TREND ANALYSIS
2018 Adult Medicaid Health Plan CAHPS Report Page 4-2
State of Michigan MDHHS Adult Medicaid_2018 CAHPS Report_0918
Global Ratings
Rating of Health Plan
Adult members were asked to rate their health plan on a scale of 0 to 10, with 0 being the “worst health
plan possible” and 10 being the “best health plan possible.” Table 4-1 shows the 2017 and 2018 top-box
responses and the trend results for Rating of Health Plan.
Table 4-1—Rating of Health Plan Trend Analysis
Plan Name 2017 2018 Trend Results
MDHHS Medicaid Program 59.0% 59.0% —
Fee-for-Service 55.4% 52.8% —
MDHHS Medicaid Managed Care Program 60.4% 60.5% —
Aetna Better Health of Michigan 53.3% 54.9% —
Blue Cross Complete of Michigan 60.0% 62.1% —
HAP Midwest Health Plan 63.5% 67.5% —
Harbor Health Plan 53.8% 54.5% —
McLaren Health Plan 55.0% 65.9%
Meridian Health Plan of Michigan 61.3% 61.7% —
Molina Healthcare of Michigan 60.8% 55.4%
Priority Health Choice, Inc. 63.9% 61.6% —
Total Health Care, Inc. 61.8% 60.3% —
UnitedHealthcare Community Plan 62.5% 59.4% —
Upper Peninsula Health Plan 59.3% 65.5%
+ Indicates fewer than 100 responses. Caution should be exercised when evaluating these results.
Statistically significantly higher in 2018 than in 2017.
Statistically significantly lower in 2018 than in 2017.
— Not statistically significantly different in 2018 than in 2017.
There were three statistically significant differences between scores in 2018 and scores in 2017 for this
measure.
The following scored statistically significantly higher in 2018 than in 2017:
McLaren Health Plan
Upper Peninsula Health Plan
The following scored statistically significantly lower in 2018 than in 2017:
Molina Healthcare of Michigan

TREND ANALYSIS
2018 Adult Medicaid Health Plan CAHPS Report Page 4-3
State of Michigan MDHHS Adult Medicaid_2018 CAHPS Report_0918
Rating of All Health Care
Adult members were asked to rate all their health care on a scale of 0 to 10, with 0 being the “worst
health care possible” and 10 being the “best health care possible.” Table 4-2 shows the 2017 and 2018
top-box responses and the trend results for Rating of All Health Care.
Table 4-2—Rating of All Health Care Trend Analysis
Plan Name 2017 2018 Trend Results
MDHHS Medicaid Program 52.3% 55.4%
Fee-for-Service 51.7% 57.4% —
MDHHS Medicaid Managed Care Program 52.6% 54.9% —
Aetna Better Health of Michigan 47.3% 49.8% —
Blue Cross Complete of Michigan 49.8% 56.7% —
HAP Midwest Health Plan 55.9% 53.3% —
Harbor Health Plan 51.0% 49.1% —
McLaren Health Plan 50.0% 58.6%
Meridian Health Plan of Michigan 53.2% 55.2% —
Molina Healthcare of Michigan 55.4% 50.9% —
Priority Health Choice, Inc. 55.4% 57.4% —
Total Health Care, Inc. 57.7% 52.0% —
UnitedHealthcare Community Plan 49.3% 56.0% —
Upper Peninsula Health Plan 54.2% 56.1% —
+ Indicates fewer than 100 responses. Caution should be exercised when evaluating these results.
Statistically significantly higher in 2018 than in 2017.
Statistically significantly lower in 2018 than in 2017.
— Not statistically significantly different in 2018 than in 2017.
There were two statistically significant differences between scores in 2018 and scores in 2017 for this
measure.
The following scored statistically significantly higher in 2018 than in 2017:
MDHHS Medicaid Program
McLaren Health Plan
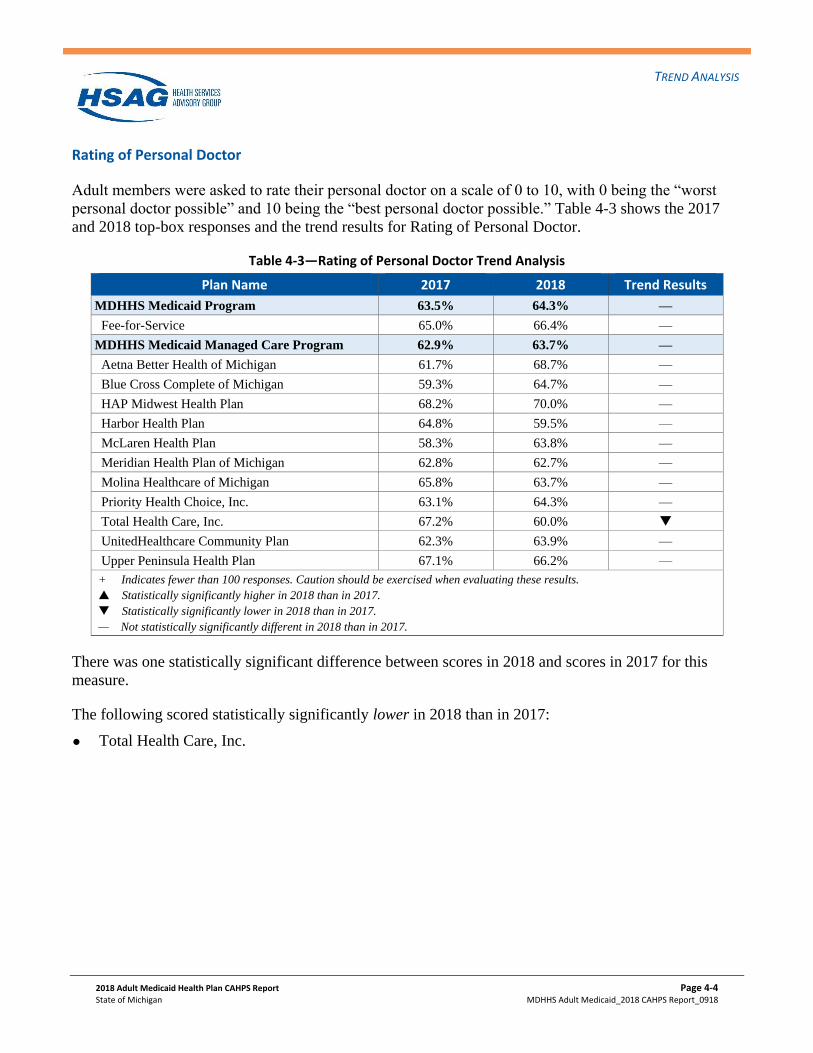
TREND ANALYSIS
2018 Adult Medicaid Health Plan CAHPS Report Page 4-4
State of Michigan MDHHS Adult Medicaid_2018 CAHPS Report_0918
Rating of Personal Doctor
Adult members were asked to rate their personal doctor on a scale of 0 to 10, with 0 being the “worst
personal doctor possible” and 10 being the “best personal doctor possible.” Table 4-3 shows the 2017
and 2018 top-box responses and the trend results for Rating of Personal Doctor.
Table 4-3—Rating of Personal Doctor Trend Analysis
Plan Name 2017 2018 Trend Results
MDHHS Medicaid Program 63.5% 64.3% —
Fee-for-Service 65.0% 66.4% —
MDHHS Medicaid Managed Care Program 62.9% 63.7% —
Aetna Better Health of Michigan 61.7% 68.7% —
Blue Cross Complete of Michigan 59.3% 64.7% —
HAP Midwest Health Plan 68.2% 70.0% —
Harbor Health Plan 64.8% 59.5% —
McLaren Health Plan 58.3% 63.8% —
Meridian Health Plan of Michigan 62.8% 62.7% —
Molina Healthcare of Michigan 65.8% 63.7% —
Priority Health Choice, Inc. 63.1% 64.3% —
Total Health Care, Inc. 67.2% 60.0%
UnitedHealthcare Community Plan 62.3% 63.9% —
Upper Peninsula Health Plan 67.1% 66.2% —
+ Indicates fewer than 100 responses. Caution should be exercised when evaluating these results.
Statistically significantly higher in 2018 than in 2017.
Statistically significantly lower in 2018 than in 2017.
— Not statistically significantly different in 2018 than in 2017.
There was one statistically significant difference between scores in 2018 and scores in 2017 for this
measure.
The following scored statistically significantly lower in 2018 than in 2017:
Total Health Care, Inc.
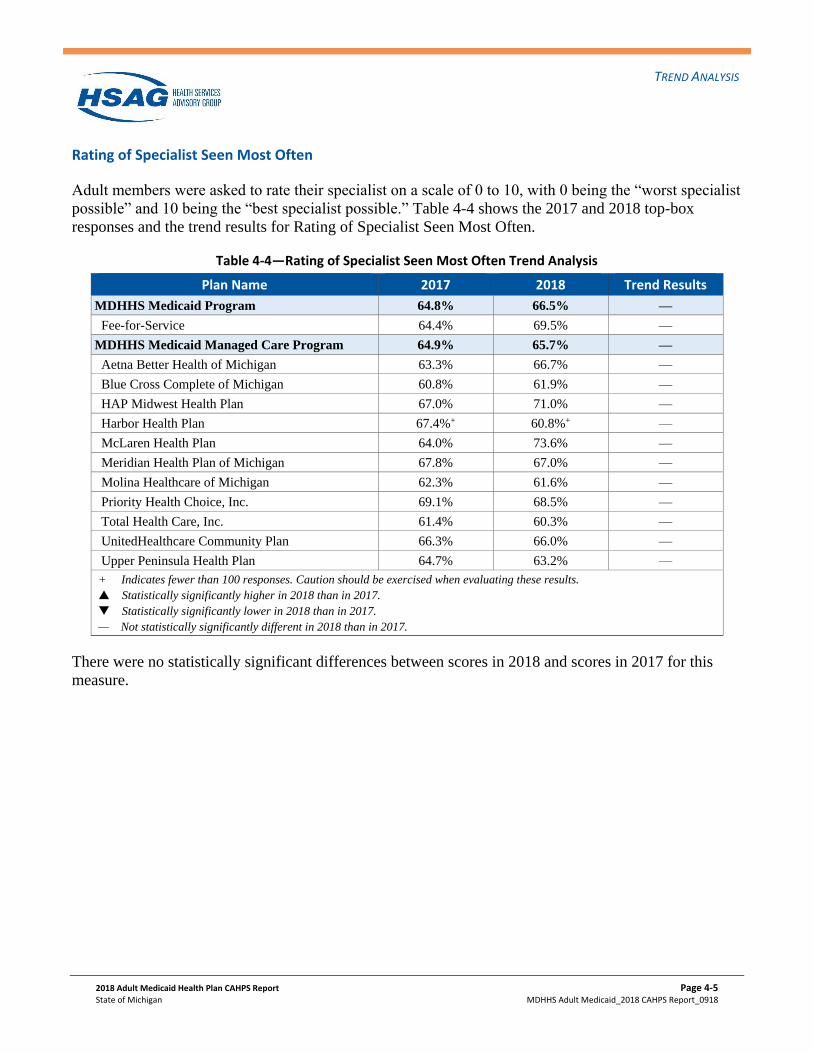
TREND ANALYSIS
2018 Adult Medicaid Health Plan CAHPS Report Page 4-5
State of Michigan MDHHS Adult Medicaid_2018 CAHPS Report_0918
Rating of Specialist Seen Most Often
Adult members were asked to rate their specialist on a scale of 0 to 10, with 0 being the “worst specialist
possible” and 10 being the “best specialist possible.” Table 4-4 shows the 2017 and 2018 top-box
responses and the trend results for Rating of Specialist Seen Most Often.
Table 4-4—Rating of Specialist Seen Most Often Trend Analysis
Plan Name 2017 2018 Trend Results
MDHHS Medicaid Program 64.8% 66.5% —
Fee-for-Service 64.4% 69.5% —
MDHHS Medicaid Managed Care Program 64.9% 65.7% —
Aetna Better Health of Michigan 63.3% 66.7% —
Blue Cross Complete of Michigan 60.8% 61.9% —
HAP Midwest Health Plan 67.0% 71.0% —
Harbor Health Plan 67.4%+ 60.8%+ —
McLaren Health Plan 64.0% 73.6% —
Meridian Health Plan of Michigan 67.8% 67.0% —
Molina Healthcare of Michigan 62.3% 61.6% —
Priority Health Choice, Inc. 69.1% 68.5% —
Total Health Care, Inc. 61.4% 60.3% —
UnitedHealthcare Community Plan 66.3% 66.0% —
Upper Peninsula Health Plan 64.7% 63.2% —
+ Indicates fewer than 100 responses. Caution should be exercised when evaluating these results.
Statistically significantly higher in 2018 than in 2017.
Statistically significantly lower in 2018 than in 2017.
— Not statistically significantly different in 2018 than in 2017.
There were no statistically significant differences between scores in 2018 and scores in 2017 for this
measure.

TREND ANALYSIS
2018 Adult Medicaid Health Plan CAHPS Report Page 4-6
State of Michigan MDHHS Adult Medicaid_2018 CAHPS Report_0918
Composite Measures
Getting Needed Care
Two questions (Questions 14 and 25) were asked to assess how often it was easy to get needed care.
Table 4-5 shows the 2017 and 2018 top-box responses and trend results for the Getting Needed Care
composite measure.
Table 4-5—Getting Needed Care Composite Trend Analysis
Plan Name 2017 2018 Trend Results
MDHHS Medicaid Program 84.1% 83.7% —
Fee-for-Service 84.3% 82.6% —
MDHHS Medicaid Managed Care Program 84.1% 84.0% —
Aetna Better Health of Michigan 77.1% 88.3%
Blue Cross Complete of Michigan 85.0% 83.1% —
HAP Midwest Health Plan 86.0% 86.6% —
Harbor Health Plan 75.9% 79.0% —
McLaren Health Plan 88.1% 89.6% —
Meridian Health Plan of Michigan 83.9% 82.6% —
Molina Healthcare of Michigan 83.4% 81.4% —
Priority Health Choice, Inc. 85.4% 85.6% —
Total Health Care, Inc. 84.9% 84.6% —
UnitedHealthcare Community Plan 82.9% 84.9% —
Upper Peninsula Health Plan 83.7% 86.3% —
+ Indicates fewer than 100 responses. Caution should be exercised when evaluating these results.
Statistically significantly higher in 2018 than in 2017.
Statistically significantly lower in 2018 than in 2017.
— Not statistically significantly different in 2018 than in 2017.
There was one statistically significant difference between scores in 2018 and scores in 2017 for this
measure.
The following scored statistically significantly higher in 2018 than in 2017:
Aetna Better Health of Michigan
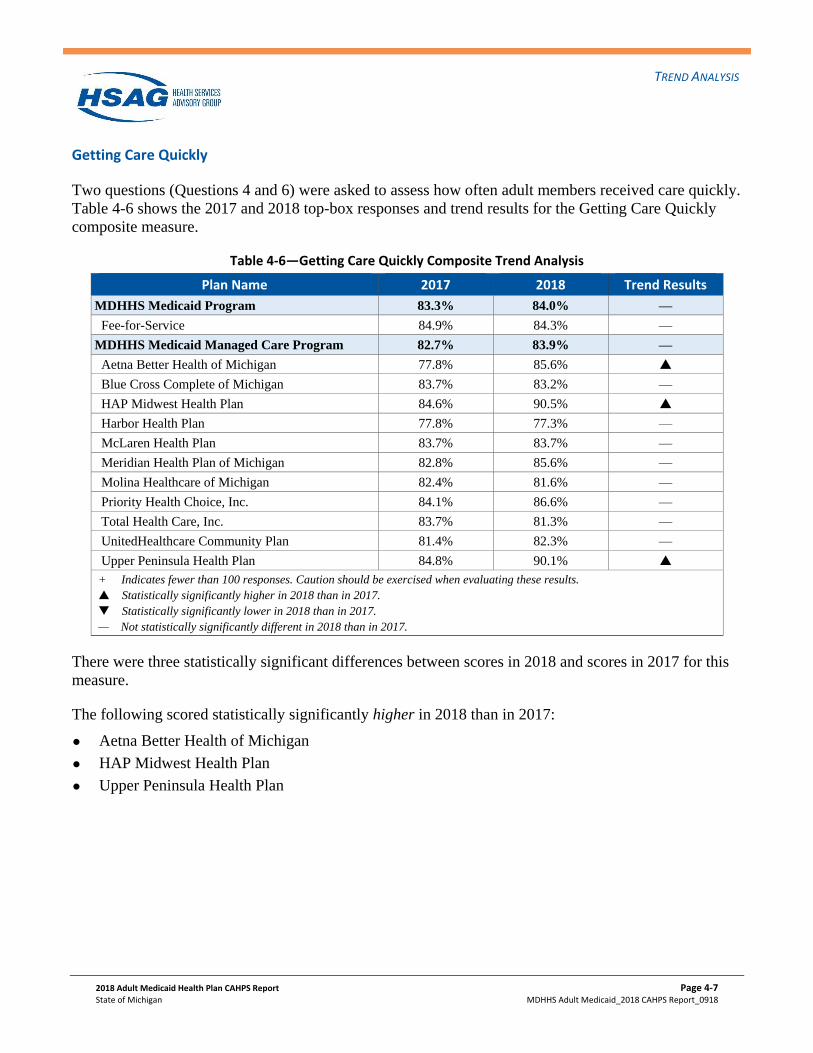
TREND ANALYSIS
2018 Adult Medicaid Health Plan CAHPS Report Page 4-7
State of Michigan MDHHS Adult Medicaid_2018 CAHPS Report_0918
Getting Care Quickly
Two questions (Questions 4 and 6) were asked to assess how often adult members received care quickly.
Table 4-6 shows the 2017 and 2018 top-box responses and trend results for the Getting Care Quickly
composite measure.
Table 4-6—Getting Care Quickly Composite Trend Analysis
Plan Name 2017 2018 Trend Results
MDHHS Medicaid Program 83.3% 84.0% —
Fee-for-Service 84.9% 84.3% —
MDHHS Medicaid Managed Care Program 82.7% 83.9% —
Aetna Better Health of Michigan 77.8% 85.6%
Blue Cross Complete of Michigan 83.7% 83.2% —
HAP Midwest Health Plan 84.6% 90.5%
Harbor Health Plan 77.8% 77.3% —
McLaren Health Plan 83.7% 83.7% —
Meridian Health Plan of Michigan 82.8% 85.6% —
Molina Healthcare of Michigan 82.4% 81.6% —
Priority Health Choice, Inc. 84.1% 86.6% —
Total Health Care, Inc. 83.7% 81.3% —
UnitedHealthcare Community Plan 81.4% 82.3% —
Upper Peninsula Health Plan 84.8% 90.1%
+ Indicates fewer than 100 responses. Caution should be exercised when evaluating these results.
Statistically significantly higher in 2018 than in 2017.
Statistically significantly lower in 2018 than in 2017.
— Not statistically significantly different in 2018 than in 2017.
There were three statistically significant differences between scores in 2018 and scores in 2017 for this
measure.
The following scored statistically significantly higher in 2018 than in 2017:
Aetna Better Health of Michigan
HAP Midwest Health Plan
Upper Peninsula Health Plan
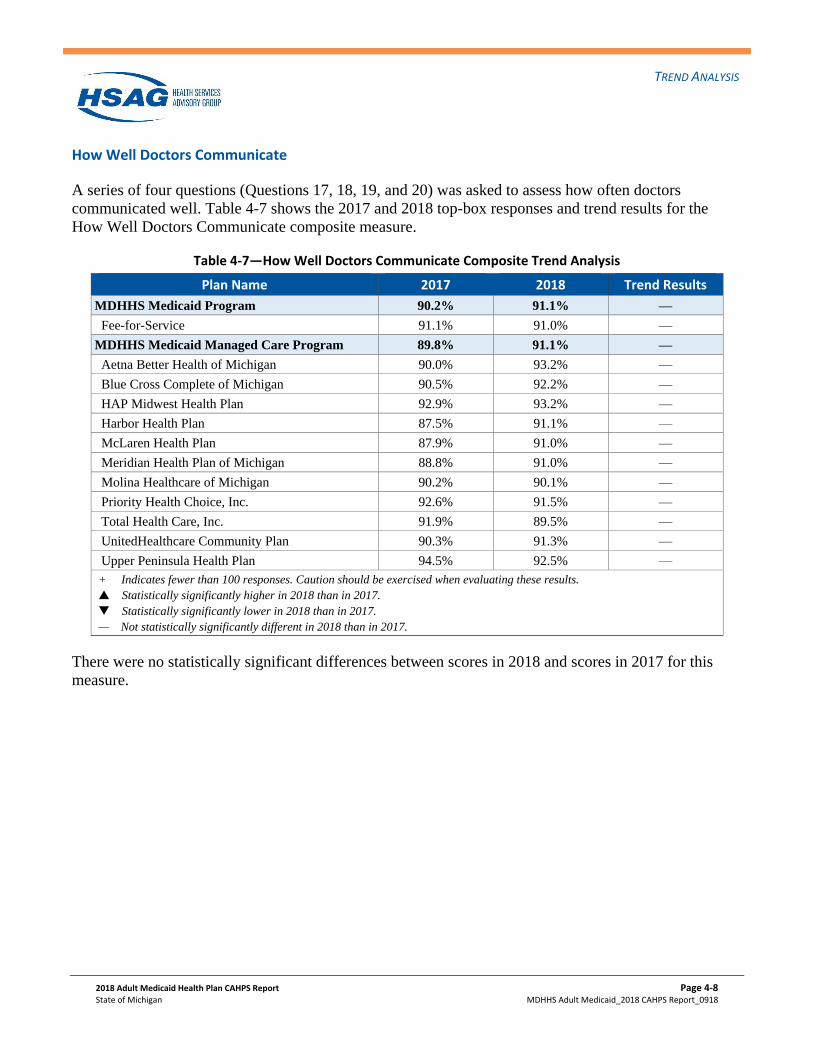
TREND ANALYSIS
2018 Adult Medicaid Health Plan CAHPS Report Page 4-8
State of Michigan MDHHS Adult Medicaid_2018 CAHPS Report_0918
How Well Doctors Communicate
A series of four questions (Questions 17, 18, 19, and 20) was asked to assess how often doctors
communicated well. Table 4-7 shows the 2017 and 2018 top-box responses and trend results for the
How Well Doctors Communicate composite measure.
Table 4-7—How Well Doctors Communicate Composite Trend Analysis
Plan Name 2017 2018 Trend Results
MDHHS Medicaid Program 90.2% 91.1% —
Fee-for-Service 91.1% 91.0% —
MDHHS Medicaid Managed Care Program 89.8% 91.1% —
Aetna Better Health of Michigan 90.0% 93.2% —
Blue Cross Complete of Michigan 90.5% 92.2% —
HAP Midwest Health Plan 92.9% 93.2% —
Harbor Health Plan 87.5% 91.1% —
McLaren Health Plan 87.9% 91.0% —
Meridian Health Plan of Michigan 88.8% 91.0% —
Molina Healthcare of Michigan 90.2% 90.1% —
Priority Health Choice, Inc. 92.6% 91.5% —
Total Health Care, Inc. 91.9% 89.5% —
UnitedHealthcare Community Plan 90.3% 91.3% —
Upper Peninsula Health Plan 94.5% 92.5% —
+ Indicates fewer than 100 responses. Caution should be exercised when evaluating these results.
Statistically significantly higher in 2018 than in 2017.
Statistically significantly lower in 2018 than in 2017.
— Not statistically significantly different in 2018 than in 2017.
There were no statistically significant differences between scores in 2018 and scores in 2017 for this
measure.

TREND ANALYSIS
2018 Adult Medicaid Health Plan CAHPS Report Page 4-9
State of Michigan MDHHS Adult Medicaid_2018 CAHPS Report_0918
Customer Service
Two questions (Questions 31 and 32) were asked to assess how often adult members were satisfied with
customer service. Table 4-8 shows the 2017 and 2018 top-box responses and trend results for the
Customer Service composite measure.
Table 4-8—Customer Service Composite Trend Analysis
Plan Name 2017 2018 Trend Results
MDHHS Medicaid Program 88.7% 87.5% —
Fee-for-Service 85.5%+ 79.1%+ —
MDHHS Medicaid Managed Care Program 89.9% 89.5% —
Aetna Better Health of Michigan 85.7% 90.4%+ —
Blue Cross Complete of Michigan 90.0% 90.0% —
HAP Midwest Health Plan 88.4% 91.0% —
Harbor Health Plan 91.6%+ 89.7% —
McLaren Health Plan 86.6% 91.9%+ —
Meridian Health Plan of Michigan 90.5% 88.2% —
Molina Healthcare of Michigan 89.6% 88.8% —
Priority Health Choice, Inc. 92.1% 92.4% —
Total Health Care, Inc. 90.9% 88.8% —
UnitedHealthcare Community Plan 91.6% 89.1% —
Upper Peninsula Health Plan 89.7% 90.2% —
+ Indicates fewer than 100 responses. Caution should be exercised when evaluating these results.
Statistically significantly higher in 2018 than in 2017.
Statistically significantly lower in 2018 than in 2017.
— Not statistically significantly different in 2018 than in 2017.
There were no statistically significant differences between scores in 2018 and scores in 2017 for this
measure.

TREND ANALYSIS
2018 Adult Medicaid Health Plan CAHPS Report Page 4-10
State of Michigan MDHHS Adult Medicaid_2018 CAHPS Report_0918
Shared Decision Making
Three questions (Questions 10, 11, and 12) were asked regarding the involvement of adult members in
decision making when starting or stopping a prescription medicine. Table 4-9 shows the 2017 and 2018
top-box responses and trend results for the Shared Decision composite measure.
Table 4-9—Shared Decision Making Composite Trend Analysis
Plan Name 2017 2018 Trend Results
MDHHS Medicaid Program 79.6% 79.8% —
Fee-for-Service 78.5% 78.8% —
MDHHS Medicaid Managed Care Program 80.0% 80.1% —
Aetna Better Health of Michigan 78.2% 78.3% —
Blue Cross Complete of Michigan 80.0% 80.1% —
HAP Midwest Health Plan 76.9% 77.4% —
Harbor Health Plan 78.5%+ 77.3%+ —
McLaren Health Plan 80.2% 82.4% —
Meridian Health Plan of Michigan 79.5% 83.0% —
Molina Healthcare of Michigan 78.9% 78.2% —
Priority Health Choice, Inc. 84.2% 79.0%
Total Health Care, Inc. 80.7% 75.7% —
UnitedHealthcare Community Plan 81.2% 75.9% —
Upper Peninsula Health Plan 84.4% 83.2% —
+ Indicates fewer than 100 responses. Caution should be exercised when evaluating these results.
Statistically significantly higher in 2018 than in 2017.
Statistically significantly lower in 2018 than in 2017.
— Not statistically significantly different in 2018 than in 2017.
There was one statistically significant difference between scores in 2018 and scores in 2017 for this
measure.
The following scored statistically significantly lower in 2018 than in 2017:
Priority Health Choice, Inc.
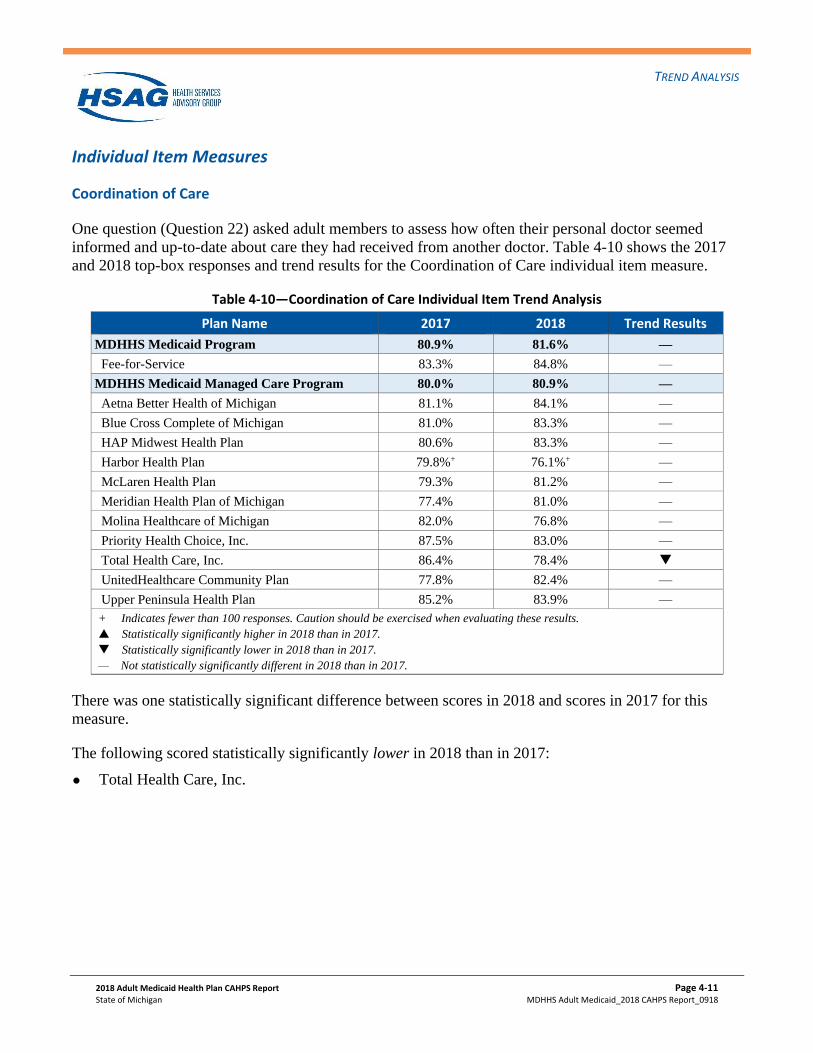
TREND ANALYSIS
2018 Adult Medicaid Health Plan CAHPS Report Page 4-11
State of Michigan MDHHS Adult Medicaid_2018 CAHPS Report_0918
Individual Item Measures
Coordination of Care
One question (Question 22) asked adult members to assess how often their personal doctor seemed
informed and up-to-date about care they had received from another doctor. Table 4-10 shows the 2017
and 2018 top-box responses and trend results for the Coordination of Care individual item measure.
Table 4-10—Coordination of Care Individual Item Trend Analysis
Plan Name 2017 2018 Trend Results
MDHHS Medicaid Program 80.9% 81.6% —
Fee-for-Service 83.3% 84.8% —
MDHHS Medicaid Managed Care Program 80.0% 80.9% —
Aetna Better Health of Michigan 81.1% 84.1% —
Blue Cross Complete of Michigan 81.0% 83.3% —
HAP Midwest Health Plan 80.6% 83.3% —
Harbor Health Plan 79.8%+ 76.1%+ —
McLaren Health Plan 79.3% 81.2% —
Meridian Health Plan of Michigan 77.4% 81.0% —
Molina Healthcare of Michigan 82.0% 76.8% —
Priority Health Choice, Inc. 87.5% 83.0% —
Total Health Care, Inc. 86.4% 78.4%
UnitedHealthcare Community Plan 77.8% 82.4% —
Upper Peninsula Health Plan 85.2% 83.9% —
+ Indicates fewer than 100 responses. Caution should be exercised when evaluating these results.
Statistically significantly higher in 2018 than in 2017.
Statistically significantly lower in 2018 than in 2017.
— Not statistically significantly different in 2018 than in 2017.
There was one statistically significant difference between scores in 2018 and scores in 2017 for this
measure.
The following scored statistically significantly lower in 2018 than in 2017:
Total Health Care, Inc.

TREND ANALYSIS
2018 Adult Medicaid Health Plan CAHPS Report Page 4-12
State of Michigan MDHHS Adult Medicaid_2018 CAHPS Report_0918
Health Promotion and Education
One question (Question 8) asked adult members to assess if their doctor talked with them about specific
things they could do to prevent illness. Table 4-11 shows the 2017 and 2018 top-box responses and trend
results for the Health Promotion and Education individual item measure.
Table 4-11—Health Promotion and Education Individual Item Trend Analysis
Plan Name 2017 2018 Trend Results
MDHHS Medicaid Program 75.9% 77.0% —
Fee-for-Service 73.2% 73.3% —
MDHHS Medicaid Managed Care Program 76.9% 77.9% —
Aetna Better Health of Michigan 79.6% 78.5% —
Blue Cross Complete of Michigan 80.7% 81.0% —
HAP Midwest Health Plan 74.9% 77.1% —
Harbor Health Plan 75.1% 77.5% —
McLaren Health Plan 77.4% 73.5% —
Meridian Health Plan of Michigan 74.9% 80.3% —
Molina Healthcare of Michigan 78.5% 76.8% —
Priority Health Choice, Inc. 71.4% 72.9% —
Total Health Care, Inc. 84.6% 73.7%
UnitedHealthcare Community Plan 73.9% 77.8% —
Upper Peninsula Health Plan 78.5% 77.4% —
+ Indicates fewer than 100 responses. Caution should be exercised when evaluating these results.
Statistically significantly higher in 2018 than in 2017.
Statistically significantly lower in 2018 than in 2017.
— Not statistically significantly different in 2018 than in 2017.
There was one statistically significant difference between scores in 2018 and scores in 2017 for this
measure.
The following scored statistically significantly lower in 2018 than in 2017:
Total Health Care, Inc.

TREND ANALYSIS
2018 Adult Medicaid Health Plan CAHPS Report Page 4-13
State of Michigan MDHHS Adult Medicaid_2018 CAHPS Report_0918
Effectiveness of Care Measures
Medical Assistance with Smoking and Tobacco Use Cessation
Advising Smokers and Tobacco Users to Quit
One question (Question 40) was asked to determine how often adult members were advised to quit
smoking or using tobacco by a doctor or other health provider. Table 4-12 shows the 2017 and 2018
rates and trend results for the Advising Smokers and Tobacco Users to Quit measure.
Table 4-12—Advising Smokers and Tobacco Users to Quit Trend Analysis
Plan Name 2017 2018 Trend Results
MDHHS Medicaid Program 80.4% 80.5% —
Fee-for-Service 81.0% 79.9% —
MDHHS Medicaid Managed Care Program 80.1% 80.6% —
Aetna Better Health of Michigan 80.6% 81.1% —
Blue Cross Complete of Michigan 75.3% 77.5% —
HAP Midwest Health Plan 82.1% 83.3% —
Harbor Health Plan 79.1% 80.8% —
McLaren Health Plan 76.8% 76.5% —
Meridian Health Plan of Michigan 81.2% 81.3% —
Molina Healthcare of Michigan 80.9% 81.1% —
Priority Health Choice, Inc. 81.5% 83.7% —
Total Health Care, Inc. 80.0% 78.7% —
UnitedHealthcare Community Plan 82.2% 83.5% —
Upper Peninsula Health Plan 79.2% 78.0% —
+ Indicates fewer than 100 responses. Caution should be exercised when evaluating these results.
Statistically significantly higher in 2018 than in 2017.
Statistically significantly lower in 2018 than in 2017.
— Not statistically significantly different in 2018 than in 2017.
There were no statistically significant differences between scores in 2018 and scores in 2017 for this
measure.

TREND ANALYSIS
2018 Adult Medicaid Health Plan CAHPS Report Page 4-14
State of Michigan MDHHS Adult Medicaid_2018 CAHPS Report_0918
Discussing Cessation Medications
One question (Question 41) was asked to ascertain how often medication was recommended or
discussed by a doctor or health provider to assist adult members with quitting smoking or using tobacco.
Table 4-13 shows the 2017 and 2018 rates and trend results for the Discussing Cessation Medications
measure.
Table 4-13—Discussing Cessation Medications Trend Analysis
Plan Name 2017 2018 Trend Results
MDHHS Medicaid Program 55.5% 56.8% —
Fee-for-Service 54.5% 55.0% —
MDHHS Medicaid Managed Care Program 55.9% 57.2% —
Aetna Better Health of Michigan 58.1% 61.8% —
Blue Cross Complete of Michigan 50.1% 54.5% —
HAP Midwest Health Plan 58.3% 60.6% —
Harbor Health Plan 59.0% 63.2% —
McLaren Health Plan 54.9% 54.5% —
Meridian Health Plan of Michigan 54.3% 54.9% —
Molina Healthcare of Michigan 57.6% 58.6% —
Priority Health Choice, Inc. 56.0% 60.9% —
Total Health Care, Inc. 55.2% 58.0% —
UnitedHealthcare Community Plan 60.8% 61.3% —
Upper Peninsula Health Plan 56.9% 56.8% —
+ Indicates fewer than 100 responses. Caution should be exercised when evaluating these results.
Statistically significantly higher in 2018 than in 2017.
Statistically significantly lower in 2018 than in 2017.
— Not statistically significantly different in 2018 than in 2017.
There were no statistically significant differences between scores in 2018 and scores in 2017 for this
measure.
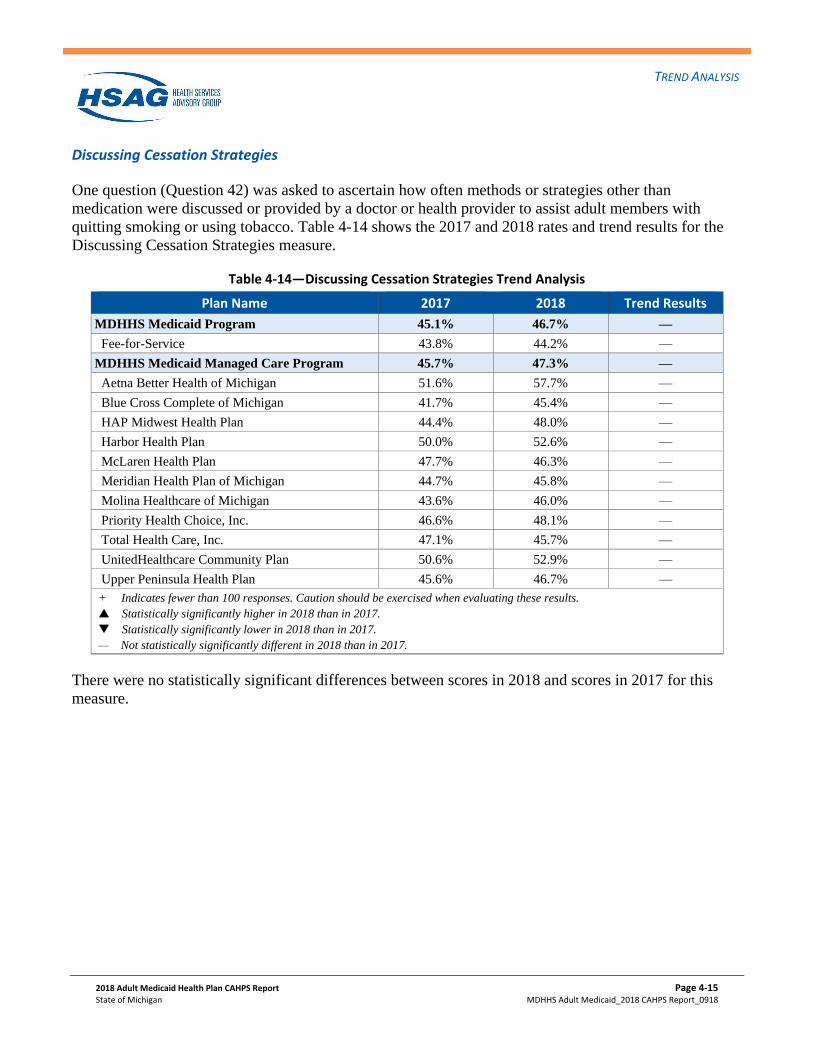
TREND ANALYSIS
2018 Adult Medicaid Health Plan CAHPS Report Page 4-15
State of Michigan MDHHS Adult Medicaid_2018 CAHPS Report_0918
Discussing Cessation Strategies
One question (Question 42) was asked to ascertain how often methods or strategies other than
medication were discussed or provided by a doctor or health provider to assist adult members with
quitting smoking or using tobacco. Table 4-14 shows the 2017 and 2018 rates and trend results for the
Discussing Cessation Strategies measure.
Table 4-14—Discussing Cessation Strategies Trend Analysis
Plan Name 2017 2018 Trend Results
MDHHS Medicaid Program 45.1% 46.7% —
Fee-for-Service 43.8% 44.2% —
MDHHS Medicaid Managed Care Program 45.7% 47.3% —
Aetna Better Health of Michigan 51.6% 57.7% —
Blue Cross Complete of Michigan 41.7% 45.4% —
HAP Midwest Health Plan 44.4% 48.0% —
Harbor Health Plan 50.0% 52.6% —
McLaren Health Plan 47.7% 46.3% —
Meridian Health Plan of Michigan 44.7% 45.8% —
Molina Healthcare of Michigan 43.6% 46.0% —
Priority Health Choice, Inc. 46.6% 48.1% —
Total Health Care, Inc. 47.1% 45.7% —
UnitedHealthcare Community Plan 50.6% 52.9% —
Upper Peninsula Health Plan 45.6% 46.7% —
+ Indicates fewer than 100 responses. Caution should be exercised when evaluating these results.
Statistically significantly higher in 2018 than in 2017.
Statistically significantly lower in 2018 than in 2017.
— Not statistically significantly different in 2018 than in 2017.
There were no statistically significant differences between scores in 2018 and scores in 2017 for this
measure.

2018 Adult Medicaid Health Plan CAHPS Report Page 5-1
State of Michigan MDHHS Adult Medicaid_2018 CAHPS Report_0918
5. Key Drivers of Satisfaction
Key Drivers of Satisfaction
HSAG performed an analysis of key drivers for three measures: Rating of Health Plan, Rating of All
Health Care, and Rating of Personal Doctor. The analysis provides information on (1) how well the
MDHHS Medicaid Program is performing on the survey item (i.e., question), and (2) how important the
item is to overall satisfaction.
Key drivers of satisfaction are defined as those items that (1) have a problem score that is greater than or
equal to the program’s median problem score for all items examined, and (2) have a correlation that is
greater than or equal to the program’s median correlation for all items examined. For additional
information on the assignment of problem scores, please refer to the Reader’s Guide section. Table 5-1
depicts those items identified for each of the three measures as being key drivers of satisfaction for the
MDHHS Medicaid Program.
Table 5-1—MDHHS Medicaid Program Key Drivers of Satisfaction
Rating of Health Plan
Respondents reported that their health plan’s customer service did not always give them the information or help
they needed.
Respondents reported that their personal doctor did not always seem informed and up-to-date about the care they
received from other doctors or health providers.
Respondents reported that information in written materials or on the Internet about how the health plan works did
not always provide the information they needed.
Respondents reported that forms from their health plan were often not easy to fill out.
Respondents reported that it was often not easy to obtain appointments with specialists.
Rating of All Health Care
Respondents reported that when they talked about starting or stopping a prescription medicine, a doctor or other
health provider did not ask what they thought was best for them.
Respondents reported that their personal doctor did not always seem informed and up-to-date about the care they
received from other doctors or health providers.
Respondents reported that it was often not easy to obtain appointments with specialists.
Rating of Personal Doctor
Respondents reported that their personal doctor did not always seem informed and up-to-date about the care they
received from other doctors or health providers.
KEY DRIVERS OF SATISFACTION
2018 Adult Medicaid Health Plan CAHPS Report Page 5-2
State of Michigan MDHHS Adult Medicaid_2018 CAHPS Report_0918
The following key driver was identified for all three global ratings:
Respondents reported that their personal doctor did not always seem informed and up-to-date about
the care they received from other doctors or health providers.
Additionally, the following key driver was identified for the Rating of Health Plan and Rating of All
Health Care global ratings:
Respondents reported that it was often not easy to obtain appointments with specialists.
2018 Adult Medicaid Health Plan CAHPS Report Page 6-1
State of Michigan MDHHS Adult Medicaid_2018 CAHPS Report_0918
6. Survey Instrument
Survey Instrument
The survey instrument selected was the CAHPS 5.0 Adult Medicaid Survey with the HEDIS
supplemental item set. HSAG administered the CAHPS Survey to the FFS population. The 11 MHPs
contracted with various survey vendors to administer the CAHPS survey. This section provides a copy
of the survey instrument administered by HSAG.
248-01 01 DDDAE
Your privacy is protected. The research staff will not share your personal information with anyone without your OK. Personally identifiable information will not be made public and will only be released in accordance with federal laws and regulations. You may choose to answer this survey or not. If you choose not to, this will not affect the benefits you get. You may notice a number on the cover of this survey. This number is ONLY used to let us know if you returned your survey so we don't have to send you reminders. If you want to know more about this study, please call 1-888-506-5134.
SURVEY INSTRUCTIONS
START HERE
1. Our records show that you are now in Michigan Medicaid Fee-For-Service. Is that right?
Yes Go to Question 3 No
2. What is the name of your health plan? (Please print)
Please be sure to fill the response circle completely. Use only black or blue ink or dark
pencil to complete the survey.
Correct Incorrect Mark Marks You are sometimes told to skip over some questions in the survey. When this happens
you will see an arrow with a note that tells you what question to answer next, like this:
Yes Go to Question 1 No
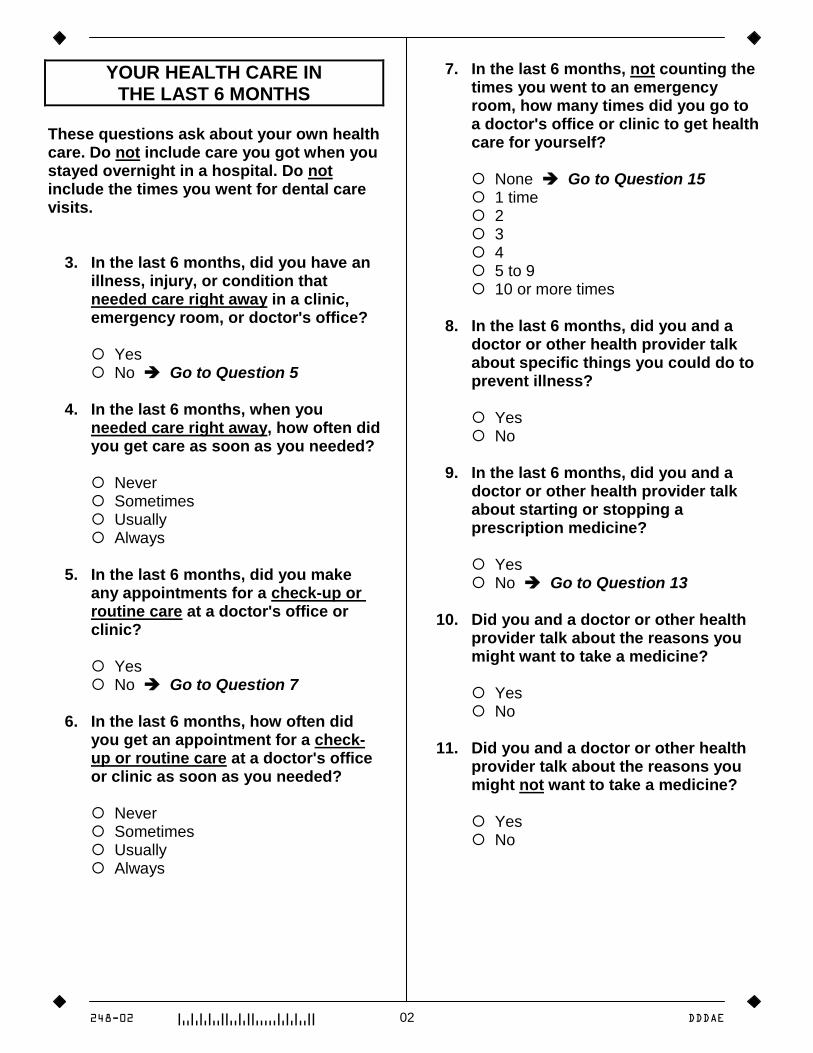
248-02 02 DDDAE
YOUR HEALTH CARE IN THE LAST 6 MONTHS
These questions ask about your own health care. Do not include care you got when you stayed overnight in a hospital. Do not include the times you went for dental care visits. 3. In the last 6 months, did you have an
illness, injury, or condition that needed care right away in a clinic, emergency room, or doctor's office?
Yes No Go to Question 5 4. In the last 6 months, when you
needed care right away, how often did you get care as soon as you needed?
Never Sometimes Usually Always 5. In the last 6 months, did you make
any appointments for a check-up or routine care at a doctor's office or clinic?
Yes No Go to Question 7 6. In the last 6 months, how often did
you get an appointment for a check-up or routine care at a doctor's office or clinic as soon as you needed?
Never Sometimes Usually Always
7. In the last 6 months, not counting the times you went to an emergency room, how many times did you go to a doctor's office or clinic to get health care for yourself?
None Go to Question 15 1 time 2 3 4 5 to 9 10 or more times 8. In the last 6 months, did you and a
doctor or other health provider talk about specific things you could do to prevent illness?
Yes No 9. In the last 6 months, did you and a
doctor or other health provider talk about starting or stopping a prescription medicine?
Yes No Go to Question 13 10. Did you and a doctor or other health
provider talk about the reasons you might want to take a medicine?
Yes No 11. Did you and a doctor or other health
provider talk about the reasons you might not want to take a medicine?
Yes No

248-03 03 DDDAE
12. When you talked about starting or stopping a prescription medicine, did a doctor or other health provider ask you what you thought was best for you?
Yes No 13. Using any number from 0 to 10, where
0 is the worst health care possible and 10 is the best health care possible, what number would you use to rate all your health care in the last 6 months?
0 1 2 3 4 5 6 7 8 9 10 Worst Best Health Care Health Care Possible Possible 14. In the last 6 months, how often was it
easy to get the care, tests, or treatment you needed?
Never Sometimes Usually Always
YOUR PERSONAL DOCTOR 15. A personal doctor is the one you
would see if you need a check-up, want advice about a health problem, or get sick or hurt. Do you have a personal doctor?
Yes No Go to Question 24
16. In the last 6 months, how many times did you visit your personal doctor to get care for yourself?
None Go to Question 23 1 time 2 3 4 5 to 9 10 or more times 17. In the last 6 months, how often did
your personal doctor explain things in a way that was easy to understand?
Never Sometimes Usually Always 18. In the last 6 months, how often did
your personal doctor listen carefully to you?
Never Sometimes Usually Always 19. In the last 6 months, how often did
your personal doctor show respect for what you had to say?
Never Sometimes Usually Always 20. In the last 6 months, how often did
your personal doctor spend enough time with you?
Never Sometimes Usually Always

248-04 04 DDDAE
21. In the last 6 months, did you get care from a doctor or other health provider besides your personal doctor?
Yes No Go to Question 23 22. In the last 6 months, how often did
your personal doctor seem informed and up-to-date about the care you got from these doctors or other health providers?
Never Sometimes Usually Always 23. Using any number from 0 to 10, where
0 is the worst personal doctor possible and 10 is the best personal doctor possible, what number would you use to rate your personal doctor?
0 1 2 3 4 5 6 7 8 9 10 Worst Best Personal Doctor Personal Doctor Possible Possible
GETTING HEALTH CARE FROM SPECIALISTS
When you answer the next questions, do not include dental visits or care you got when you stayed overnight in a hospital. 24. Specialists are doctors like surgeons,
heart doctors, allergy doctors, skin doctors, and other doctors who specialize in one area of health care.
In the last 6 months, did you make
any appointments to see a specialist?
Yes No Go to Question 28
25. In the last 6 months, how often did you get an appointment to see a specialist as soon as you needed?
Never Sometimes Usually Always 26. How many specialists have you seen
in the last 6 months?
None Go to Question 28 1 specialist 2 3 4 5 or more specialists 27. We want to know your rating of the
specialist you saw most often in the last 6 months. Using any number from 0 to 10, where 0 is the worst specialist possible and 10 is the best specialist possible, what number would you use to rate that specialist?
0 1 2 3 4 5 6 7 8 9 10 Worst Best Specialist Specialist Possible Possible
YOUR HEALTH PLAN The next questions ask about your experience with your health plan. 28. In the last 6 months, did you look for
any information in written materials or on the Internet about how your health plan works?
Yes No Go to Question 30

248-05 05 DDDAE
29. In the last 6 months, how often did the written materials or the Internet provide the information you needed about how your health plan works?
Never Sometimes Usually Always 30. In the last 6 months, did you get
information or help from your health plan's customer service?
Yes No Go to Question 33 31. In the last 6 months, how often did
your health plan's customer service give you the information or help you needed?
Never Sometimes Usually Always 32. In the last 6 months, how often did
your health plan's customer service staff treat you with courtesy and respect?
Never Sometimes Usually Always 33. In the last 6 months, did your health
plan give you any forms to fill out?
Yes No Go to Question 35
34. In the last 6 months, how often were the forms from your health plan easy to fill out?
Never Sometimes Usually Always 35. Using any number from 0 to 10, where
0 is the worst health plan possible and 10 is the best health plan possible, what number would you use to rate your health plan?
0 1 2 3 4 5 6 7 8 9 10 Worst Best Health Plan Health Plan Possible Possible
ABOUT YOU 36. In general, how would you rate your
overall health?
Excellent Very Good Good Fair Poor 37. In general, how would you rate your
overall mental or emotional health?
Excellent Very Good Good Fair Poor 38. Have you had either a flu shot or flu
spray in the nose since July 1, 2017?
Yes No Don't know
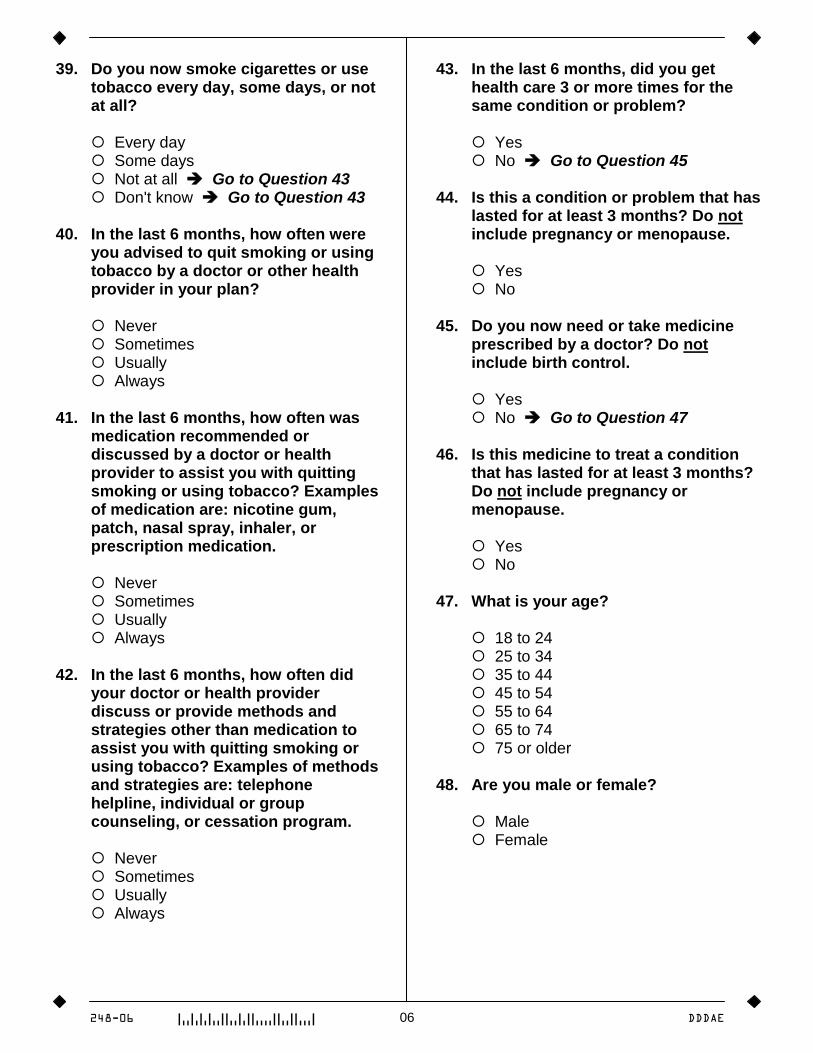
248-06 06 DDDAE
39. Do you now smoke cigarettes or use tobacco every day, some days, or not at all?
Every day Some days Not at all Go to Question 43 Don't know Go to Question 43 40. In the last 6 months, how often were
you advised to quit smoking or using tobacco by a doctor or other health provider in your plan?
Never Sometimes Usually Always 41. In the last 6 months, how often was
medication recommended or discussed by a doctor or health provider to assist you with quitting smoking or using tobacco? Examples of medication are: nicotine gum, patch, nasal spray, inhaler, or prescription medication.
Never Sometimes Usually Always 42. In the last 6 months, how often did
your doctor or health provider discuss or provide methods and strategies other than medication to assist you with quitting smoking or using tobacco? Examples of methods and strategies are: telephone helpline, individual or group counseling, or cessation program.
Never Sometimes Usually Always
43. In the last 6 months, did you get health care 3 or more times for the same condition or problem?
Yes No Go to Question 45 44. Is this a condition or problem that has
lasted for at least 3 months? Do not include pregnancy or menopause.
Yes No 45. Do you now need or take medicine
prescribed by a doctor? Do not include birth control.
Yes No Go to Question 47 46. Is this medicine to treat a condition
that has lasted for at least 3 months? Do not include pregnancy or menopause.
Yes No 47. What is your age?
18 to 24 25 to 34 35 to 44 45 to 54 55 to 64 65 to 74 75 or older 48. Are you male or female?
Male Female

248-07 07 DDDAE
49. What is the highest grade or level of school that you have completed?
8th grade or less Some high school, but did not
graduate High school graduate or GED Some college or 2-year degree 4-year college graduate More than 4-year college degree 50. Are you of Hispanic or Latino origin
or descent?
Yes, Hispanic or Latino No, Not Hispanic or Latino 51. What is your race? Mark one or more.
White Black or African-American Asian Native Hawaiian or other Pacific
Islander American Indian or Alaska Native Other 52. Did someone help you complete this
survey?
Yes No Go to Question 54 53. How did that person help you? Mark
one or more.
Read the questions to me Wrote down the answers I gave Answered the questions for me Translated the questions into my
language Helped in some other way
54. Some health plans help with transportation to doctors' offices or clinics. This help can be a shuttle bus, tokens or vouchers for a bus or taxi, or payments for mileage. In the last 6 months, did you phone your health plan to get help with transportation?
Yes Go to Question 55 No Thank you. Please return
the completed survey in the postage-paid envelope.
55. In the last 6 months, when you
phoned to get help with transportation from your health plan, how often did you get it?
Never Sometimes Usually Always 56. In the last 6 months, how often did
the help with transportation meet your needs?
Never Sometimes Usually Always
Thanks again for taking the time to complete this survey! Your answers are
greatly appreciated.
When you are done, please use the enclosed prepaid envelope to mail the
survey to:
DataStat, 3975 Research Park Drive, Ann Arbor, MI 48108