2018 JUST Capital Ranking Methodology - Amazon S3As part of the development of our scoring...
177
2018 JUST Capital Ranking Methodology As at December 10, 2018
Transcript of 2018 JUST Capital Ranking Methodology - Amazon S3As part of the development of our scoring...

2018
JUST Capital Ranking Methodology
As at December 10, 2018

2018 JUST Capital Ranking Methodology
Copyright © 2018 JUST Capital Foundation, Inc. All rights reserved. Table of Contents – 2

2018 JUST Capital Ranking Methodology
Copyright © 2018 JUST Capital Foundation, Inc. All rights reserved. Table of Contents – 3
1 Table of Contents 2 About JUST Capital .............................................................................................................................................. 6
3 Board of Directors................................................................................................................................................ 7
4 Executive Summary ............................................................................................................................................. 8
4.1 Our Process .................................................................................................................................................... 8
4.2 Survey Research ............................................................................................................................................ 8
4.3 Universe of Ranked Companies ................................................................................................................. 9
4.4 Metrics ....................................................................................................................................................... 9
4.5 Data Points ................................................................................................................................................ 9
4.6 Rankings ...................................................................................................................................................... 10
4.7 2018 Methodological Updates...................................................................................................................... 10
4.7.1 More Accurate Measures of Just Business Behavior ............................................................................... 10
5 Survey Research Methodology .......................................................................................................................... 13
5.1 Vendors and Advisors .................................................................................................................................. 13
5.1.3 Survey Advisory Council .......................................................................................................................... 13
5.2 The Process ................................................................................................................................................. 14
5.2.1 Qualitative Exploration ............................................................................................................................ 14
5.2.2 Quantitative Measurement .................................................................................................................. 15
5.3 Issues and Components .......................................................................................................................... 16
5.3.1 Obtaining the Weights ........................................................................................................................ 16
5.3.2 Components ........................................................................................................................................ 18
6 Information (Data) Hierarchy ............................................................................................................................ 22
7 Metric Development ........................................................................................................................................... 24
8 Data Selection, Verification, and Accuracy ........................................................................................................ 26
8.1 Data Sources ................................................................................................................................................ 26
8.2 Units of Measurement .................................................................................................................................. 27
8.3 Timeliness .................................................................................................................................................... 27
8.4 Quality Assurance and Control .................................................................................................................... 28
8.5 Controversy Data ......................................................................................................................................... 28
8.6 Crowdsourced Data ..................................................................................................................................... 29
8.7 Fines Data .................................................................................................................................................... 29
9 Ranked Companies ............................................................................................................................................ 31
10 Industry Classification .................................................................................................................................. 32
11 Company Data Review Period ..................................................................................................................... 33
12 Research Advisory Council ........................................................................................................................... 34
13 Board of Directors and Research Committee Oversight .............................................................................. 35

2018 JUST Capital Ranking Methodology
Copyright © 2018 JUST Capital Foundation, Inc. All rights reserved. Table of Contents – 4
13.1 Blackout Period for JUST Directors and the Finalized JUST Rankings .................................................... 35
14 Company Liaison .......................................................................................................................................... 37
15 Rankings ...................................................................................................................................................... 38
15.1 Normalizing for Company Size (Scaling) ................................................................................................. 38
15.2 Missing Data ............................................................................................................................................ 41
15.2.1 Method 1: Zero Value ......................................................................................................................... 41
15.2.2 Method 2: Industry Mean ................................................................................................................... 42
15.2.3 Method 3: Neutral Score ..................................................................................................................... 43
15.3 Outliers .................................................................................................................................................... 43
15.4 Scoring and Ranking Calculation ............................................................................................................. 45
15.4.1 Absolute (cross-industry) ranking ....................................................................................................... 45
15.4.2 Industry ranking .................................................................................................................................. 47
16 Unique Events .............................................................................................................................................. 48
17 Disclosure of Ranked Companies................................................................................................................. 49
18 Appendix A: Industry Classification ............................................................................................................. 50
19 Appendix B: Companies Excluded from the Rankings ................................................................................. 54
20 Appendix C: 2018 Components, Metrics, and Data Points .......................................................................... 58
20.1 Workers (25%) ........................................................................................................................................ 58
20.1.1 Provides Workers with Good Benefits Package .................................................................................. 58
20.1.2 Pays a living wage............................................................................................................................... 59
20.1.3 Provides a safe workplace................................................................................................................... 60
20.1.4 Pays a fair wage for industry and job level ........................................................................................ 61
20.1.5 Does not discriminate in pay............................................................................................................... 62
20.1.6 Adheres to equal opportunity workplace policies ............................................................................... 62
20.1.7 Promotes work-life balance ................................................................................................................. 64
20.1.8 Creates a responsive and transparent workplace culture ................................................................... 65
20.2 Customers (18%) .................................................................................................................................... 66
20.2.1 Treats customers fairly ....................................................................................................................... 66
20.2.2 Protects customer privacy ................................................................................................................... 67
20.2.3 Is truthful in advertising...................................................................................................................... 67
20.2.4 Provides positive customer service experiences ................................................................................. 68
20.3 Products (14%) ....................................................................................................................................... 69
20.3.1 Makes quality products ....................................................................................................................... 69
20.3.2 Makes products that are beneficial to health, environment or society ............................................... 70
20.3.3 Provides fair pricing ............................................................................................................................ 70
20.3.4 Is accurate in labelling ........................................................................................................................ 71

2018 JUST Capital Ranking Methodology
Copyright © 2018 JUST Capital Foundation, Inc. All rights reserved. Table of Contents – 5
20.4 Environment (13%) ................................................................................................................................. 72
20.4.1 Has policies and practices to protect the environment....................................................................... 72
20.4.2 Uses environmental resources efficiently............................................................................................ 73
20.4.3 Minimizes pollution .............................................................................................................................. 74
20.5 Jobs (12%) .............................................................................................................................................. 77
20.5.1 Creates jobs in the US ........................................................................................................................ 77
20.5.2 Number of jobs in the US ................................................................................................................... 78
20.5.3 Creates jobs Globally .......................................................................................................................... 79
20.6 Communities (11%) ................................................................................................................................ 80
20.6.1 Manages the impacts of working with companies with abusive conditions ....................................... 80
20.6.2 Does not work with governments or authorities that oppress their people ....................................... 84
20.6.3 Maintains strong relationships with communities ............................................................................... 84
20.6.4 Uses local products and resources ...................................................................................................... 86
20.6.5 Contributes to charitable causes ......................................................................................................... 86
20.6.6 Takes steps to avoid causing or contributing to international conflicts .............................................. 88
20.7 Company Leadership and Shareholders (8%) ........................................................................................ 90
20.7.1 Follows laws and regulations .............................................................................................................. 90
20.7.2 Leadership acts and communicates with integrity .............................................................................. 91
20.7.3 Maintains integrity in financial reporting............................................................................................. 94
20.7.4 Pays fair share of taxes ....................................................................................................................... 94
20.7.5 Makes a profit over the long term ...................................................................................................... 95
20.7.6 Pays CEO fairly compared to workers ................................................................................................. 96
20.7.7 Provides investor return over the long term ....................................................................................... 97
21 Appendix D: Survey Methodology, Qualitative Report, and Weighting Survey Questionnaires .................. 98

2018 JUST Capital Ranking Methodology
Copyright © 2018 JUST Capital Foundation, Inc. All rights reserved. Table of Contents – 6
2 About JUST Capital
The JUST Capital Foundation, Inc. (http://justcapital.com) is an independent, nonprofit 501(c)(3) organization that works to align business practices with the American people to ensure capitalism works for all. Co-founded in 2013 by a group of concerned people from the world of business, finance,
and civil society – including Chairman Paul Tudor Jones II, Deepak Chopra, Rinaldo Brutoco, Arianna Huffington, Paul Scialla, and others – JUST Capital ranks how the largest, publicly traded U.S. corporations measure up against the American people’s definition of just business behavior, and provides research, indexes, and data-driven tools to help people make more informed decisions about where to invest, work, and buy to direct capital toward companies advancing a more just future. The organization is based in New York City.

2018 JUST Capital Ranking Methodology
Copyright © 2018 JUST Capital Foundation, Inc. All rights reserved. Table of Contents – 7
3 Board of Directors
Sharon Block Harvard Law School Executive Director, Labor and Worklife Program
Rinaldo Brutoco World Business Academy Founding President & CEO
Ray Chambers United Nations Health in Agenda 2030 and Malaria
UN Secretary-General’s Special Envoy
Deepak Chopra Chopra Foundation
Founder
Robert Deutsch JP Morgan Exchange Traded Funds Board Former Chairman
Carlos Dominguez Sprinklr President
Alan Fleischmann Laurel Strategies Founder, President & CEO
Peter Georgescu Young & Rubicam Chairman Emeritus
Dan Hesse PNC, Akamai Director Sprint Former President & CEO
John Hofmeister Citizens for Affordable Energy
Founder & CEO
Arianna Huffington Thrive Global Founder & CEO
Paul Tudor Jones II Tudor Investment Corporation
Founder, Co-Chairman & Chief Investment Officer
Randall Lane
Forbes Chief Content Officer
Mindy Lubber
Ceres President
Marc H. Morial
National Urban League President & CEO
Jean Oelwang Virgin Unite CEO & Virgin Group Partner
B Team Senior Partner
Andrew Paul Tudor Investment Corporation
Former General Counsel & Managing Director
Steve Schmidt Campaign Strategist & Political Analyst
Paul Scialla Delos Living
Founder & CEO
James P. Steyer Common Sense Media
CEO
Kip Tindell The Container Store Co-founder, Chairman of the Board
David Vogel Voloridge Investment Management CEO & Chief Scientist
Jeff Walker Health in Agenda 2030 and Malaria Vice Chairman
Michael Weinstein Impact Matters Executive Director Robin Hood Foundation
Former Chief Program Officer

2018 JUST Capital Ranking Methodology
Copyright © 2018 JUST Capital Foundation, Inc. All rights reserved. Table of Contents – 8
4 Executive Summary
Each year, JUST Capital ranks the largest, publicly traded U.S. corporations, producing a list that reflects how well each company measures up against the American public’s definition of just corporate behavior. In 2016, JUST Capital released its inaugural industry-relative rankings. In 2017, we released
our first ever ranking of companies on an overall, cross-industry basis. In 2018, we have been building on that foundation, bringing a lot of the data collection in house, and refining our measurement of just corporate behavior.
To define just corporate behaviors, JUST Capital has, between 2015 and 2018, polled over 81,000 members of the American public as part of continuous, multiphase series of surveys. These polls, which target a representative sample of the U.S. population, determine the topics that matter most to Americans, including higher-level thematic Issues and specific Components of just business behavior, as well as their relative importance. JUST Capital has established Metrics for each of these Components, collected and evaluated data from an extensive range of sources, and then used this data
to measure companies' performance on the Issues defined by the American public.
As part of the development of our scoring methodology, JUST Capital solicits input from both the American public and subject matter experts (i.e. academics, investment practitioners, and corporations) on our choice of Metrics and Data Points, a well as the means of transforming and processing raw data to use in the ranking model. We believe this process ensures our work remains as informed, objective, and accurate as possible.
4.1 Our Process
The JUST Capital ranking methodology follows a three-step process:
1. Survey Research: JUST Capital conducts representative surveys of the American public on a regular basis in order to understand what issues represent just corporate behavior, how these issues should be defined, and the relative importance of each.
2. Company Evaluation: In as fair, unbiased, and rigorous a way as possible, JUST Capital develops Metrics and collects data on how the companies it covers perform across these issues.
At every major methodological step, JUST Capital seeks guidance from its expert advisors and/or the public through polls or surveys.
3. Rankings: With input from various stakeholders and independent experts, JUST Capital develops a ranking model that leverages our survey research and company evaluations to rank the largest, publicly traded U.S. companies. That same ranking provides the basis for a ranking by industry so that companies can be compared to their peers. An industry ranking is obtained by looking at the overall ranking on an industry-by-industry basis.
4.2 Survey Research
JUST Capital has utilized qualitative and quantitative survey research over the past four years to develop the framework for the ranking model. Over time, and after engaging more than 81,000 American adults, JUST Capital and the public have created a structure of seven “Issues” – overarching categories of business behavior – and 36 underlying “Components” – more specific categories of

2018 JUST Capital Ranking Methodology
Copyright © 2018 JUST Capital Foundation, Inc. All rights reserved. Table of Contents – 9
business behavior. Each year, JUST conducts focus groups across the country to get detailed, unfiltered input from Americans of all backgrounds on what business priorities should be for just companies. Following the focus groups’ findings, JUST Capital conducts quantitative surveys to confirm the issues’ importance and relevance to justness and to tell us how the issues should be weighted in our ranking model. This year, between the focus groups and the quantitative surveys, JUST Capital engaged over 9,000 Americans in representative samples of the population. The full process is described in Section 5 Survey Research Methodology.
4.3 Universe of Ranked Companies
Our universe of ranked companies is roughly equivalent to the 1,000 largest, publicly traded U.S. companies (by market capitalization, as defined by the Russell 1000 Index). We exclude companies
that, due to data availability, we cannot subject to common standards of measurement, as well as companies that have been acquired. In 2018, we ranked 890 companies across 33 industries.
4.4 Metrics
In consultation with our advisors, JUST Capital has developed a series of Metrics to measure corporate performance on each Component. Using the following criteria, we established Metrics that:
1. are judged to best reflect the public’s definition of the Component in question;
2. accurately measure company performance or managerial commitment to specific actions;
3. require as few assumptions and as little subjective interpretation as possible;
4. can be assessed with clear units of measurement, or with clearly defined binary outcomes;
5. reflect measurement best practices; and
6. are broadly applicable to all companies in our universe, regardless of size, industry, or business
model.
4.5 Data Points
For each Metric, we aim to identify appropriate Data Points that describe the actual performance of
each company. JUST Capital considers the quality of the underlying data used to measure performance to be of paramount importance to the Rankings, and draws on a variety of Data Points from many reliable sources. These include:
1. Publicly Available Company Reports: Audited company filings, annual reports, Corporate Social Responsibility and Sustainability reports, integrated reports, company presentations, corporate websites, and other reports.
2. Third-Party Data Vendors: For-profit companies that collect and distribute data – both financial and non-financial – including those focused on environmental, social, and governance issues.
3. Government Data: U.S. government agencies (e.g. The Bureau of Labor Statistics).

2018 JUST Capital Ranking Methodology
Copyright © 2018 JUST Capital Foundation, Inc. All rights reserved. Table of Contents – 10
4. Academic and Nonprofit: Non-governmental organizations and nonprofits focused on corporate activities.
5. National Media and Press
6. Crowdsourced Data: Company and products-review websites.
JUST Capital’s methods for evaluating corporate performance are continually reviewed as we strive to represent the public’s views of corporate performance as accurately as possible.
4.6 Rankings
JUST Capital’s ranking Methodology, and the underlying model that drives it, support the ranking of corporations within custom groupings of companies, within established industry categories, and across the entire universe of publicly traded companies.
Our Overall Ranking compares companies across all industries using the same Components and Metrics, regardless of industry. This ranking reflects the universal nature of just corporate behavior,
and allows users to compare the performance of any group of companies without regard to, or adjustment for, the specific circumstances of each company. The final output of the overall approach is an ordinal one to 890 ranking of all companies. Industry-Specific Rankings are obtained by comparing the overall rank on an industry-by-industry basis.
To produce the Rankings, JUST Capital calculates a series of individual numerical scores at the Metric and Component level. These scores are calculated and normalized for all Metrics and Components, while the treatment of missing data, outliers, and scaling varies based on the nature of the underlying data. A company’s overall score is then determined by calculating the sum of its scores across all Components, weighted by the importance scores from the survey work.
4.7 2018 Methodological Updates
4.7.1 More Accurate Measures of Just Business Behavior
4.7.1.1 Enhanced In-House Data Collection
In an effort to increase transparency, data quality (more accurate representation of the American public’s priorities based on our polling), and coverage (number of companies with Data Points), we identified better ways to measure data, bringing more collection in-house and reducing the amount of data coming from third-party vendors.
4.7.1.2 Increased Data Precision
To make the model more precise wherever possible and to differentiate high-performing corporations from others, we altered how we scored companies on certain Data Points – specifically, in some instances, we shifted from binary scores to scaling grades. For example, we scaled the scores for companies’ charitable funding processes. This year, companies that accept unsolicited grant applications, support broad causes and organizations, and have a transparent giving policy received a 3. Organizations that have a transparent policy and accept unsolicited applications, but impose significant restrictions on the kinds of causes or organizations that qualify, received a 2. Companies

2018 JUST Capital Ranking Methodology
Copyright © 2018 JUST Capital Foundation, Inc. All rights reserved. Table of Contents – 11
that have a transparent giving policy or process, but do not accept unsolicited applications for funding, received a 1. If no evidence of grants were found, companies were assigned a 0.
4.7.2 Enhancements to Each Issue Area
4.7.2.1 Workers
Our surveys and focus groups identified that the American public cares about issues we did not specifically measure in 2017 – for example, whether a company has paid parental leave, tuition reimbursement, or outplacement service policies. In 2018, we integrated these new Data Points into the model. We also improved how we measure a company’s commitment to ensuring a safe workplace, and are now collecting this data in-house rather than through third-party vendors.
Note about improvements under Workers: This year, the United Kingdom passed a law requiring companies with over 250 employees to disclose their gender pay gap. We noticed that this impacted our Rankings: of the 15 most improved companies for Workers, there were seven whose scores increased due to their pay equity policy. Of those most improved, we also noticed increased benefits scores caused some of the greatest leaps. It is positive to see companies trending toward more comprehensive benefits, including paid parental leave, as these issues are increasingly important to the American people.
4.7.2.2 Customers
In an effort to increase data quality and coverage, we changed our data sources for evaluating customer service ratings. We now rely on crowd-sourced reviews of customer experience, and the combination of the sources has increased our coverage from 20% to 80% of our universe.
4.7.2.3 Products
In 2018, we changed the way we assess whether companies make products that are beneficial to health, environment, or society. This year, we polled the American public to determine what were more or less just products, and we scored companies based on whether they offer such products. We also improved our methodology for assessing recalled products. In our analysis, we now include the number of incidents reported, the number of products recalled, the company’s overall revenue, and the company’s responsiveness (how many months the product was on the market). This new approach more effectively levels the playing field and reflects the recall’s scale.
4.7.2.4 Environment
This year, we substantially changed how we measure the Environment Issue. We stopped using third-
party data that aggregated performance across a range of environmental criteria and switched to sources that provide more specific coverage. We changed vendors for the Minimizes Pollution Component to allow us to have a more comprehensive view of companies’ greenhouse gas emissions. In 2018, we stopped measuring companies’ overall water usage and instead honed in on measuring their chemical (cancerous and non-cancerous) water discharge. We also stopped measuring electricity

2018 JUST Capital Ranking Methodology
Copyright © 2018 JUST Capital Foundation, Inc. All rights reserved. Table of Contents – 12
and fuel usage and instead focused on pollution outputs rather than resource inputs. This benefited some water- and electricity-intensive industries such as Utilities, Industrials, and Basic Resources.
4.7.2.5 Jobs
Through this year’s surveys and focus groups, the American people expressed that creating jobs globally is important to just corporate behavior. To reflect this, we introduced a new Component – Creates Jobs Globally – which accounts for 13% of a company’s Jobs score.
4.7.2.6 Communities
As part of our efforts to enhance data quality and precision related to Communities, we focused on measuring more granular nuance. This year, we scored companies’ supplier codes of conduct in more
detail, which enables us to better distinguish companies with robust policies. We also diversified and added more specificity to our measures of charitable giving by moving from binary scores to more nuanced scaling grades in certain areas, e.g. corporate giving sources and employee gift matching. Companies that match employee donations for a wide range of causes receive higher scores than companies that do so only for select causes or have no employee gift matching policies.
4.7.2.7 Company Leadership and Shareholders
On the advice of our focus groups and survey respondents, we renamed this Issue from its 2017 name (“Management and Shareholders”) to more accurately reflect that we are focusing on the top company leadership, and not middle management. This year, we adjusted for one-time tax expenses and benefits related to the Tax Cut and Jobs Act, which did not exist in previous years and added a new
measurement for whether a company discloses a tax strategy in line with best practices. We also improved our board diversity evaluation to exclude diversity of nationality (country of birth), which, as experts agree, does not best represent people’s understanding of diversity.

2018 JUST Capital Ranking Methodology
Copyright © 2018 JUST Capital Foundation, Inc. All rights reserved. Table of Contents – 13
5 Survey Research Methodology
The foundation of JUST Capital’s Methodology is its annual survey research that captures the voice of the public and determines the benchmarks against which companies are evaluated. JUST Capital works with NORC at the University of Chicago, YouGov, and our Survey Research Advisory Council (The
Council) to achieve this goal.
5.1 Vendors and Advisors
5.1.1 Primary Research Partner
The National Opinion Research Center (NORC), based at the University of Chicago, has been JUST Capital’s primary survey partner since 2016. NORC was chosen as a partner based on their technical
expertise, experience, the high quality of their work, organizational capacity and abilities, and demonstrated understanding of and interest in the JUST Capital mission and its challenges.
JUST Capital works with NORC to conduct qualitative research and the quantitative weighting surveys described below. The quantitative surveys are done using NORC's AmeriSpeak panel, a nationally representative panel of households across the country that provides for scientifically rigorous statistical surveys of the U.S. population. Panelists can choose to answer surveys online or by telephone. Most participants choose to answer online, but about 10 to 15 percent answer over telephone. More information on NORC's methodology can be found in Appendix D: Survey Methodology, Qualitative Report, and Weighting Survey Questionnaires.
5.1.2 Additional Survey Work
In June 2018, JUST Capital decided to supplement some of NORC’s work with additional surveys to confirm and expand on their findings. As the work had not been budgeted for through NORC and the surveys could be developed in-house, JUST Capital opted to do this work with YouGov, an online survey company. YouGov is able to turn around surveys very quickly and at a low cost, which is valuable for JUST Capital’s supplemental research needs.
YouGov is a well-regarded online panel survey company, but a key distinction between YouGov and NORC is that YouGov’s samples are nonprobability samples – meaning that not all Americans had an opportunity to be included. This means that the usual representativeness assumptions that apply to probability-based samples, such as NORC’s AmeriSpeak panel, do not apply. However, YouGov has a
strong reputation for overcoming those difficulties and achieving reasonably representative survey results. According to a 2016 Pew Research study, one panel provider consistently outperformed all others in this regard. Although the report anonymized the providers, YouGov confirmed that they were the high-performing company, and for this reason, JUST Capital chose to work with YouGov. More information on YouGov's methodology can be found in Appendix D: Survey Methodology, Qualitative Report, and Weighting Survey Questionnaires.
5.1.3 Survey Advisory Council
JUST Capital believes it is critical to gather a wide range of expert reviews on the organization’s approach throughout the research process, so we assembled a council of advisors to assist in our

2018 JUST Capital Ranking Methodology
Copyright © 2018 JUST Capital Foundation, Inc. All rights reserved. Table of Contents – 14
survey research. In assembling this council of advisors, we sought individuals with diverse expertise related to the survey research process, a willingness to dedicate time and thought to that process, and an understanding of our mission and the challenges of surveying complex topics.
Survey Research Council members include:
● Jeff Brazell, Chairman, The Modellers
● Don Dillman, Regents Professor, Department of Sociology and Deputy Director for Research and Development in the Social and Economic Sciences Research Center, Washington State University
● Sunshine Hillygus, Professor of Political Science, Duke University
● Neil Malhotra, Professor of Political Economy and Professor of Political Science, Graduate School of Business at Stanford University
● Andy Weiss, Vice President and Director, Surveys and Information Systems, Mathematica Policy Research
We are very appreciative of our Council members' time and efforts.
5.2 The Process
Our survey research process includes both qualitative and quantitative work. We use the qualitative process to dive deeply into what Americans think makes a company just and why, then use measurable benchmarks to confirm those findings and derive weights for our ranking model using quantitative surveys. The benchmark is made up of the most important issues according to the American public (which we call Components) and the relative importance of each of these Components (which we call weights). All quantitative studies were balanced by the following demographic traits: region, gender, age, household income, political affiliation, ideology, ethnicity, education, and employment. This 2018
approach closely mirrors the approach used every year since 2015.
5.2.1 Qualitative Exploration
This qualitative process enables JUST Capital to capture what each Issue means to the American public, incorporating language used by the respondents themselves. Moreover, since JUST Capital is founded on the belief that “the American people know what is best for themselves,” this collaborative approach speaks to that directly. These members of the American public actively participated in co-constructing what a just corporation means to them, which in turn enriched the value of the knowledge gained.
In February and March of 2018, NORC and JUST Capital conducted two focus groups in each of seven U.S. cities – New York City, Albuquerque, Atlanta, Detroit, San Francisco, Spokane, and Wichita – totaling 14 groups. These locations were chosen to offer the broadest possible representation of Americans’ perspectives: large and small, liberal and conservative, and on both coasts or in the middle of the country. Each group consisted of eight to 12 participants, who were each carefully recruited to be as representative of their regions as possible. Recruitment efforts targeted representation of gender, age, race/ethnicity, income, education level, and political beliefs. Where possible, participants were recruited from rural locations outside of each city.

2018 JUST Capital Ranking Methodology
Copyright © 2018 JUST Capital Foundation, Inc. All rights reserved. Table of Contents – 15
Each group met for 90 minutes. During that time, participants discussed what they found favorable and unfavorable about businesses. Then, they defined the concept of “doing the right thing” and subsequently, “justness.” The majority of the time, however, was used to focus on identifying what behaviors make a company just related to particular Issues. The groups were assigned one or two Issues: four groups each discussed Workers and Jobs, Products and Customers, and Environment and Communities, while the remaining three groups discussed Company Leadership and Shareholders. For counterbalancing purposes, the assignments were scattered across the cities so that no two groups in the same city focused on the same sets of Issues.
Without any prior information, participants were asked to brainstorm what makes a company just with regard to the assigned Issues. Facilitators wrote participants’ ideas on pieces of paper and taped them to the wall so that every idea was visible. After this brainstorming session, the participants were asked to categorize the ideas. Subsequently, JUST Capital’s existing Components from 2017 were revealed in a “matching” exercise in which participants expressed their views on whether those Components, and their overarching Issues, seemed reasonable.
In order to assess whether the participants’ views warranted adjusting the Components, JUST Capital staff reviewed every idea from each focus groups’ brainstorming section, using transcripts and images of the walls with ideas taped up. Then, JUST Capital staff developed a coding process to categorize and
analyze the output. To summarize:
1. An analysis software tool facilitated the identification of the smallest meaningful unit of text (i.e. coding).
2. All relevant data was then categorized thematically (i.e. axial coding) to ensure adequate distinction and no overlaps. High inter-rater reliability was also achieved at this stage.
3. From there, all themes were examined and contrasted with the existing 2017 Components to determine which Issues and Components needed modification. This then fed into the survey questions.
The results, which represented the specific and comprehensive characteristics that respondents
associated with just corporate behavior, yielded relatively similar findings to previous years’ qualitative work. Americans’ views on what makes a company just are reasonably consistent, and most of our Components remained unchanged. However, we did make some tweaks to the 2018 Components and their definitions based on these focus group analyses. Those changes are indicated in Section 5.3 Issues and Components below.
The qualitative report from NORC, and a more thorough description of the coding methodology JUST Capital applied, can be found in Appendix D: Survey Methodology, Qualitative Report, and Weighting Survey Questionnaires.
5.2.2 Quantitative Measurement
JUST Capital conducted survey research to transform the issues that matter most to the public into a
measurable benchmark, against which companies can be evaluated. The benchmark is made up of the most important issues according to the American public (which we call Components) and the relative importance of each of these Components (which we call weights). All quantitative studies were balanced by the following demographic traits: region, gender, age, household income, race, ethnicity, political affiliation, ideology, education, and employment.

2018 JUST Capital Ranking Methodology
Copyright © 2018 JUST Capital Foundation, Inc. All rights reserved. Table of Contents – 16
JUST Capital derives weights for the ranking model from public opinion, using a MaxDiff approach. Four surveys about the Issues and Components were conducted with NORC MaxDiff, deriving the scores’ relative importance, which we use as weights in our company rankings model. The survey questions present respondents with a set of items, from which they are then asked to identify the most and least important. In our implementation, we presented respondents with a random selection of three (of seven) issues at a time, and repeated the question until the respondent had answered for all combinations of the seven issues. As respondents went through these choice tasks, their strength of preference, based on the consistency of their choices, was developed. JUST staff implemented a
statistical model using Sawtooth software and Hierarchical Bayes, to summarize the information and calculate each Issue’s relative importance, summing to 100 percent. These relative importance measures become the weights we then use in our Rankings. We repeated the MaxDiff process on the three to nine Components within each Issue to obtain their relative importance weights within each Issue.
5.3 Issues and Components
The 2018 Issues and Components, and their weights, are largely unchanged since 2017, with a few exceptions:
1. the Management & Shareholders Issue was renamed Company Leadership & Shareholders to better represent the Components it covers;
2. the number of Components decreased from 39 in 2017 to 36 in 2018: a. two Components moved to a different Issue:
i. “Pays CEO fairly compared to workers” moved from Workers to Company
Leadership, and ii. “Is accurate in labeling” moved from Customers to Products.
b. one new Component “Creates jobs globally” was added under Jobs; c. three Workers Components from 2017 were combined into the single 2018 Component,
“Provides workers with good benefits package”; d. two other Workers Components from 2017 were combined into a single Component,
“Adheres to equal opportunity workplace policies,” in 2018; and e. several Components were reworded for clarity and to better align with the public’s
views. These changes are noted in the tables at the end of this section.
All of these changes were made based on feedback from focus groups and in coordination with experts.
5.3.1 Obtaining the Weights
JUST Capital utilizes a two-step weighting structure: First, we calculate the Issue weights and then calculate the Component weights within each Issue. All weights are calculated using a MaxDiff survey design, as described above.
First, relative importance is derived at the Issue level. Then, within each Issue, the relative importance of each Component is determined. This means that the full set of Components is not tested against itself – for example, Workers Components were only compared to other Workers Components,

2018 JUST Capital Ranking Methodology
Copyright © 2018 JUST Capital Foundation, Inc. All rights reserved. Table of Contents – 17
Communities Components were only compared only to other Communities Components, and so on for each Issue. These ratings determined the weights for the Components within the relevant Issue, rather than across all Components.
The absolute contribution of any given Component to the final rankings depends on both its weight and the corresponding Issue’s weight. For example, the 12 percent weight assigned to the Jobs Issue is split between the three Jobs Components in proportion to the Component weights, and the 25 percent weight assigned to the Workers Issue is split amongst the eight Components according to their weights. Thus, the important Components in the Workers Issue might be less influential on the overall
model than the Jobs Components, though the Workers Issue, percentage-wise, is more important than the Jobs Issue.
The Issues and Components MaxDiff surveys were each conducted independently of one another. The Issue survey consisted of 3,582 respondents, with a Margin Of Error (MOE) of +/- 2.2 percentage points. The Components survey was randomly divided into four sections: Environment and Communities consisted of 1,070 respondents (MOE +/- 4.2%), Company Leadership & Shareholders consisted of 1,071 respondents (MOE +/- 4.2%), Customers and Products consisted of 932 respondents (MOE +/- 4.5%), and Workers and Jobs consisted of 1,010 respondents (MOE +/- 4.3%).
The Issues and Components surveys also contained validation measures for the weights derived in the MaxDiff exercises. The surveys had respondents complete a points allocation exercise, level of importance as well as a ranking exercise. The points allocation asked respondents to indicate the percentage (ranging from 0% to 100%) of resources they thought should be allocated to each of the 7 Issues (or one of the sets of Components) to improve its justness. The level of importance exercise asked respondents to judge some corporate behaviors that closely mirrored the Issues (or Components) on a scale of “very important” to “not at all important.” The ranking exercise simply asked respondents to put the Issues (or Components) in order from most to least important. These results closely mirrored the MaxDiff results.
The survey questionnaires for the quantitative stage can be found in Appendix D: Survey Methodology, Qualitative Report, and Weighting Survey Questionnaires. The complete weights and changes from 2017 to 2018 are detailed below.
2017 Issues and Weights 2018 Issues and Weights
Workers 23% Workers 25%
Customers 19% Customers 18%
Products 17% Products 14%
Environment 13% Environment 13%
Communities 11% Jobs 12%
Jobs 10% Communities 11%
Shareholders & Management 6% Company Leadership & Shareholders*
8%
*was Shareholders & Management in 2017

2018 JUST Capital Ranking Methodology
Copyright © 2018 JUST Capital Foundation, Inc. All rights reserved. Table of Contents – 18
5.3.2 Components
Worker Components and Weights (25%)
Provides workers with good benefits package*
Reworded: In 2017 this was measured as three separate Components (“Provides paid time off,” “Provides access to health insurance,” and “Helps workers prepare for retirement”). Changed because benefits are typically packaged together in a workplace situation, and focus groups understood it better this way.
16%
Pays a living wage 15%
Provides a safe workplace 14%
Pays a fair wage for industry and job level 13%
Does not discriminate in pay 13%
Adheres to equal opportunity workplace policies*
Combined: In 2017 this was made up of two separate Components: “Does not
discriminate in hiring, firing, and promotion” and “Handles grievances and layoffs fairly.”
Changed because this rewording more accurately captures the policy-related issues that
focus groups talked about.
12%
Promotes work-life balance 6%
Provides training and career development opportunities
Reworded: In 2017 was “Encourages employee career development.” Changed to be more comprehensive of both within-job and across-job prospects.
6%
Creates a responsive and transparent workplace culture*
Reworded: In 2017 was “Communicates openly and transparently with employees.”
Changed to reflect how focus groups understood the underpinnings of this idea that
hinged on the timeliness of overall workplace communications too.
4%

2018 JUST Capital Ranking Methodology
Copyright © 2018 JUST Capital Foundation, Inc. All rights reserved. Table of Contents – 19
Customers Components and weights (18%)
Treats customers fairly *
Reworded and combined: In 2017 was “Does not discriminate in customer treatment” and “Provides fair sales terms.” Changed because focus groups were confused about the use of the word “discriminate.” Its meaning is often ambiguous, depending on context (e.g. ‘discriminate’ as in give loyal customers special treatment/additional attention OR ‘discriminate’ as in treat poorly and unfairly), and did not seem conducive to participants understanding the concept. “Fair sales terms,” referring to returns and refunds, was not viewed as a separate concept from overall fair treatment.
30%
Protects customer privacy 25%
Is truthful in advertising 24%
Provides positive customer service experiences
Reworded: In 2018 the word “service” was added to accurately reflect customers and
companies’ interactive and communicative relationship and to clarify the difference between fair treatment and positive service.
21%
Products Components and weights (14%)
Makes quality products 31%
Makes products that are beneficial to health, environment, or society 30%
Provides fair pricing 21%
Is accurate in labeling
Moved: In 2017 was in the Customers Issue Changed because focus group participants thought this concept pertains more to a product attribute (e.g. a physical adhesive on a product), and only affects Customers indirectly.
18%
Environment Components and weights (13%)
Has policies and practices to protect the environment 36%
Uses natural resources efficiently and reduces waste
Reworded: In 2017 was called “Uses Environmental Resources Efficiently.” Changed name and added “reduces waste” to clarify the Component’s meaning.
35%
Minimizes pollution 29%

2018 JUST Capital Ranking Methodology
Copyright © 2018 JUST Capital Foundation, Inc. All rights reserved. Table of Contents – 20
Jobs Components and weights (12%)
Creates jobs in the U.S. 50%
Number of jobs in the U.S. 36%
Creates jobs globally
New: In 2018, this Component was added to the Jobs Issue to reflect focus groups’ understanding of corporations’ impact on jobs globally. Focus group participants suggested that companies should create jobs at an international level as well as in the U.S., particularly in parts of the world that lack quality jobs.
13%
Communities Components and weights (11%)
Does not do business with companies with abusive conditions
27%
Does not work with governments or authorities that oppress people
Reworded: In 2017 there was no “or a authorities.” Changed because focus groups and experts understood it as not isolated to governments, but that it also applies to non-governmental groups, for example the military or paramilitary, powerful interest groups, and international coalitions.
22%
Maintains strong relationships with communities 14%
Uses local products and resources 13%
Contributes to charitable causes and gives back to communities
Reworded: In 2017 it was “Contributes to charitable causes.” Added “gives back to communities” as focus groups used the exact verbiage “gives back” repeatedly.
13 %
Does not cause or contribute to international conflicts 11%

2018 JUST Capital Ranking Methodology
Copyright © 2018 JUST Capital Foundation, Inc. All rights reserved. Table of Contents – 21
Company Leadership & Shareholders Components and weights (8%)
Follows laws and regulations 23%
Leadership acts and communicates with integrity 21%
Maintains integrity in financial reporting 20%
Pays fair share of taxes 15%
Makes a profit over the long term 8%
Pays CEO fairly compared to workers
Moved: In 2017, this Component fell under Workers Changed because focus groups and experts understood it more as an issue that is controlled by the company leadership.
8%
Provides investor return over the long term 6%

2018 JUST Capital Ranking Methodology
Copyright © 2018 JUST Capital Foundation, Inc. All rights reserved. Table of Contents – 22
6 Information (Data) Hierarchy
JUST Capital's Rankings have been designed and developed in accordance with the following formal data hierarchy:
● Based on our survey work, JUST Capital has defined a list of 36 Components, which constitute the most important determinants of just corporate performance according to the American people.
● Through further survey work, related Components have been grouped together into seven
categories referred to as Issues. These are the topics that are most important to Americans when identifying just corporate behavior. Broadly speaking, Issues represent major stakeholder groups – such as Workers, Customers, Communities, and the Environment, as well as the main functions of companies such as Products, Jobs, and Shareholders.
● For each Component, JUST Capital has developed a series of Metrics, which are the specific ways we measure corporate performance for each Component.
● For each Metric, we have identified and sourced appropriate Data Points, which describe the actual performance of each company on specific issues.
● JUST Capital’s 2018 polling has derived weights for each Issue that reflect its relative
importance to the public. This process was repeated for the Components.
● The Data Point scores are fed into our ranking model to generate scores at the Metric, Component, and Issue levels. Weights are applied at the Component and Issue levels, which are then summed to produce an overall company score.

2018 JUST Capital Ranking Methodology
Copyright © 2018 JUST Capital Foundation, Inc. All rights reserved. Table of Contents – 23
This information hierarchy is illustrated in the chart and table below:
Information Type
Number in Model
Example
Issue 7 Workers
Component 36 Pays a Living Wage
Metric 76 Employee Living Wage Ratio
Data Point 118 The estimated percentage of employees at the company making
a living wage.

2018 JUST Capital Ranking Methodology
Copyright © 2018 JUST Capital Foundation, Inc. All rights reserved. Table of Contents – 24
7 Metric Development
The JUST Capital team develops Metrics that strive to meet the following criteria:
1. Are judged to best reflect the public’s definition of the Component in question.
2. Accurately measure company performance or managerial commitment.
3. Require as few assumptions and as little subjective interpretation as possible.
4. Can be assessed with clear units of measurement, binary outcomes, or scaled outcomes.
5. Reflect measurement of best practices.
6. Are broadly applicable to all companies in our universe, regardless of size, industry, or business model.
With regard to the sixth criterion (above), it would be ideal to assemble a universal set of Metrics to which we can subject all companies (regardless of industry or size) to standardized measurement. However, given the range and diversity of the Components of just business behavior, it is not possible to assemble a single set of Metrics that apply equally to companies within all industries. This is driven
by two factors: first, the industry-specificity of certain risks and management practices and, second, the uneven availability of data across industries. Where it is not possible to design Metrics that reasonably encompass performance for companies across all industries, we design additional metrics to ensure that a subset of Metrics within each Component is relevant to every company.
JUST Capital employs Metrics that measure companies’ actual performance (e.g. kilowatt-hours of green power used), assess their management practices (e.g. quality and comprehensiveness of a company's Environmental Management System), and evaluate their transparency on related issues. Input from the public, advisors, and specialist research experts confirmed that Metrics on management practices should be included in a company’s evaluation, particularly where measurement relies heavily
on the availability of controversy data.
JUST Capital analysts have reviewed, screened, and consolidated thousands of individual Data Points from reputable third-party sources across every aspect of just corporate performance. Selection of final Metrics and data is driven by analyst recommendation, takes into account the above criteria, and involves internal and external review. Our current Metrics, including data sources and format, are detailed alongside the Issue and Component definitions in Appendix C: 2018 Components, Metrics, and Data Points of this Methodology.

2018 JUST Capital Ranking Methodology
Copyright © 2018 JUST Capital Foundation, Inc. All rights reserved. Table of Contents – 25
In response to stakeholder feedback on draft methodology, JUST Capital has selected, developed, and classified its Metrics according to the following taxonomy:
Type of Data Point
Description Number
Performance Measures and assesses actual company performance (e.g. Quality of a company’s 401k plan on a 0-100 point scale; Percentage change in U.S. workforce; Annual amount of green power used in kilowatt-hours; CEO
or company director involvement in material related-party transactions, reported as True or False).
52
Management Companies’ policies, commitments, and management practices, which meet an established minimum standard or best practice. Typically
measured on a binary Yes/No or True/False basis, or on a graded scale based on the strength of the policies.
40
Controversies Controversies reported by influential media, stakeholder, and third-
party sources captured according to a strict, rules-based research process. Measured by the number and severity of cases.
13
Crowdsourced Reviews and salary disclosures from current and former employees of ranked companies, as well as crowdsourced customer reviews.
5
Fines Fines levied by relevant regulatory authorities, measured in U.S. Dollars.
8

2018 JUST Capital Ranking Methodology
Copyright © 2018 JUST Capital Foundation, Inc. All rights reserved. Table of Contents – 26
8 Data Selection, Verification, and Accuracy
JUST Capital selects Data Points to support the Rankings based on its analysts’ best judgment, taking into account a number of key criteria and following a strict protocol:
1. Data points must be derived from sources deemed credible by JUST Capital’s Research Staff,
together with the Research Committee of the Board and the Research Advisory Council.
2. Data points selected should reflect company performance or managerial commitment on the Metric being measured.
3. Data points should be verified where possible by JUST Capital’s network of advisors and consultants and subjected to continual review, validation, and improvement.
JUST Capital acknowledges that there are tradeoffs between the currency and certainty of all data. For example, indicators of corporate misconduct include fine-and-settlement data, which are factual but where there is a significant time lapse between the event and the fine, or controversy data, which is more current but involves a more subjective evaluation. JUST Capital has sought to balance these
tradeoffs and create a robust framework that includes a range of data types to increase its accuracy and its responsiveness to events.
JUST Capital evaluates each data series for its correlation to the company’s size, measured by market capitalization and revenue. If significant correlations are identified, they are investigated to understand whether these correlations reflect actual performance or are the result of size bias. In some cases, underlying data have been normalized for size (see Section 15.1 Normalizing for Company Size (Scaling)). In all cases, we seek to minimize correlations that are artifacts of size and to use data that best reflect actual company performance.1
8.1 Data Sources
JUST Capital considers the quality of the underlying data used to measure performance to be of paramount importance to the Rankings. Due to the range of Components measured and the breadth of industries covered, JUST Capital utilizes a broad range of data from many reliable sources. These include:
1. Company filings and other public documents: Audited company filings, annual reports, Corporate Social Responsibility and Sustainability reports, integrated reports, company presentations, corporate websites, and other reports.
2. Third-party Data Vendors: Companies that collect and distribute data – both financial and non-financial – including those focused on environmental, social, and governance issues. JUST Capital uses such vendors to source data on a range of matters, including environmental performance, corporate governance, community engagement, and media controversies.
3. Government Data: U.S. government agencies (e.g. The Bureau of Labor Statistics).
1 This year, we have sought to decrease our dependence on third-party data sources. Therefore, we brought a greater proportion of data collection and analysis in house.

2018 JUST Capital Ranking Methodology
Copyright © 2018 JUST Capital Foundation, Inc. All rights reserved. Table of Contents – 27
4. Academic and Nonprofit: Non-governmental organizations and nonprofits focused on corporate activities in certain areas. For example, JUST Capital sources its fines data from the Corporate Research Project of Good Jobs First, a nonprofit, nonpartisan economic development research center.
5. Crowdsourced Data: Company review websites (see Section 8.6 Crowdsourced Data).
A comprehensive description of our current data sources and their mapping to the Metrics are provided alongside the Issue and Component definitions in Section 5.3 Issues and Components.
8.2 Units of Measurement
The units of measurement associated with the various Metrics vary considerably, reflecting differences in the nature of the Components being measured. Generally, measurement units come in one of three forms:
1. Quantitative: Expressed as a number based on observations of company performance. For
example, JUST Capital records a company’s charitable giving and calculates its Charitable Giving Ratio based on each company's pre-tax profit.
2. Qualitative: Expressed as a number based on the assessment of available evidence by an analyst or relevant stakeholders. For example, JUST Capital assesses the detail of each company’s paid time off policy disclosure. A general statement (e.g. “Employees accrue annual paid time off”) receives a score of five, whereas a more detailed disclosure (e.g. “New employees receive 10 days of paid vacation each year”) receives a score of 10. This score reflects the detail of the policy, and therefore serves as a proxy for managerial commitment to those issues.
3. Binary: Expressed as either Yes/No or True/False, depending on whether a company meets specified performance thresholds or has specific management practices in place. For example, companies receive a binary score for disclosing a certain policy or making an effort to source from local suppliers. The use of binary variables is limited to cases where the data available is naturally segmented and/or lacks granularity.
8.3 Timeliness
For Metrics that measure change in corporate performance over a period of time, JUST Capital generally uses three to five years as the standard assessment period. This period was chosen to
accurately capture the long-term performance of companies and approximates the length of a typical business cycle. For controversies and fines, we have used a three year time frame.
JUST Capital seeks to maintain the timeliest rankings possible. Some of the data in the JUST Capital model are sourced from third parties that are themselves striving to standardize and track disclosures that do not occur on any regular or predictable schedule. We therefore use the most recent available data for each Metric, meaning that data within and across Metrics may pertain to different years. The companies we evaluate have conveyed a clear preference that we use the most up-to-date data available.

2018 JUST Capital Ranking Methodology
Copyright © 2018 JUST Capital Foundation, Inc. All rights reserved. Table of Contents – 28
8.4 Quality Assurance and Control
JUST Capital undertakes rigorous quality assurance and quality control processes on data from all sources.
The primary objective of JUST Capital's quality assurance/quality control processes are to ensure our
data, whether collected and analyzed in house or sourced from third parties, is accurate and complete. The data is subject to an annual data review period during which companies are invited to review their data and submit feedback through a secure online platform (see Section 11 Company Data Review Period).
Data Collected by JUST Capital
We apply a range of checks before, during, and after data collection. These checks include developing and strictly adhering to robust research protocols, searching for and investigating data irregularities thoroughly, and conducting a range of statistical analyses and regressions relating particularly to outliers.
Third-Party Data
In relation to data sourced from third parties, we have two principal quality control methods: first, through dialogue with our vendors and second, through random sampling and desktop research.
8.5 Controversy Data
Controversies reported by media sources or elsewhere in the public domain can be a useful and timely but largely unstructured source of information on companies. Controversy data can also ensure that our model remains alert to capturing real world events and stakeholder sentiments that otherwise may not be represented in more traditional company data sets. That said, controversy data must be judged carefully and used purposefully to ensure the Rankings remain as unbiased, accurate, and data-driven as possible.
We examine controversy data to inform our measurement of company performance whenever conventional performance data is unavailable – due to the absence of company disclosures, for example. We use controversy data for certain Components because it is the most natural way to
measure them, particularly in cases when the incidents a metric is concerned with are rare, unique, or geographically or geopolitically disparate. In all of these cases, JUST Capital uses controversy data from reputable third parties following a strict, rules-based research process.
JUST Capital has also sought to supplement controversy data metrics with metrics that assess company management practices and seek to mitigate risks related to controversy data. Feedback from stakeholders has confirmed that many observers consider such controversies, especially where they reveal behavioral patterns, as indicators of potential management problems in certain areas of corporate performance. As indicators, controversies can be considered useful complements to information about company management practices.

2018 JUST Capital Ranking Methodology
Copyright © 2018 JUST Capital Foundation, Inc. All rights reserved. Table of Contents – 29
8.6 Crowdsourced Data
Crowdsourced data is derived from reviews submitted anonymously by current and former employees of ranked companies on matters such as salary, benefits, and management. We also rely on crowdsourced data to measure customer service ratings.
JUST Capital uses crowdsourced data in cases where it most accurately reflect the views of a relevant stakeholder. In many instances, crowdsourced data can provide internal perspectives of companies that are otherwise impossible to ascertain. For example, crowdsourced data from employee review sites are central to understanding workers’ perspectives. Since companies do not disclose wage data, crowdsourced salary reviews provide unique insights into companies’ compensation practices. In these ways, crowdsourced data help us build a more comprehensive picture of corporate performance.
JUST Capital is aware that crowdsourced data presents a range of public perceptions and that it can be biased and of uneven quality. We have conducted thorough quantitative assessments and qualitative reviews of all the crowdsourced data used in our models and are confident in the data's integrity and
accuracy. In instances where coverage is inadequate or sample sizes are small, JUST Capital has restricted its use of this data. The sources from which we are using crowdsourced data are thoroughly screened. We only accept data from organizations with strict policies and guidelines preventing companies from altering or biasing their reviews.
8.7 Fines Data
Financial penalties levied by Federal regulatory bodies in relation to corporate misconduct are a rich source of information on company performance. JUST Capital sources all of its fines data from the Violation Tracker produced by the Corporate Research Project of Good Jobs First.
Fines data used by JUST Capital include penalty amounts reported in agency enforcement records and in settlement announcements (adjusted to avoid double counting) relating to criminal and civil cases brought by regulatory agencies and the Department of Justice. The data refer only to instances where the company was listed as a defendant (and therefore does not include cases against individual executives) and does not include lawsuits brought by individual plaintiffs, including class actions. The
threshold for the penalty amount is $5,000; penalties with no dollar amount are excluded (this is the case for the U.S. Food and Drug Administration (FDA) penalties which generally do not involve a dollar amount but instead require that the product be removed from the market); and all penalties reflect final judgments (taking into account any reductions negotiated between companies and regulators). For cases brought by the Environmental Protection Agency, penalties include any amounts companies were required to pay to state or local government agencies as well as the stated costs of any supplementary environmental projects undertaken as part of a settlement.
It should be noted that financial penalties are often imposed long after a violation occurred – in many cases, several years later. This delay reflects the nature of the civil or criminal proceedings that
precede the imposition of any formal penalty. While JUST Capital regards financial penalties levied by Federal regulators as reliable and robust sources of company performance data, we also acknowledge that the lag intrinsic to these data means that a model dependent on it would not be as responsive to

2018 JUST Capital Ranking Methodology
Copyright © 2018 JUST Capital Foundation, Inc. All rights reserved. Table of Contents – 30
recent occurrences of corporate misconduct as it could be. JUST Capital has sought to compensate for this lag by including Controversy data, where appropriate (see Section 8.5 Controversy Data).
For more details on the collection and treatment of JUST Capital's fines data, please refer to the website of the Violation Tracker produced by the Corporate Research Project of Good Jobs First.

2018 JUST Capital Ranking Methodology
Copyright © 2018 JUST Capital Foundation, Inc. All rights reserved. Table of Contents – 31
9 Ranked Companies
JUST Capital ranks the 1,000 largest, publicly traded U.S. companies (by market capitalization, as defined by the Russell 1000 Index). Following the reconstitution of the Russell 1000 Index on June 22, 2018, we excluded companies that do not file Form 10-K reports with the SEC, duplicate securities of companies with multiple share classes in the Index, and others that we could not subject to common measurement standards due to data unavailability. For example, we excluded certain investment holding companies and Real Estate Investment Trusts (REITs) with fewer than 1000 employees. The number of ranked companies reduced further due to market developments during the data collection period, for example due to mergers and acquisitions.
This year, we assigned a substantial penalty to companies in the Industry Classification Benchmark (ICB) Tobacco Subsector. This decision follows JUST Capital’s 2016-2018 survey research, which revealed that most Americans believe that companies that make and market tobacco products are extremely harmful and less just. These Americans also expressed that tobacco-producing companies should be in the bottom quartile of JUST Capital’s rankings. This year, tobacco companies in 2018 will not be allowed to rank higher than 667 of our 890 companies.
Excluded companies as of November 28, 2018 are summarized in the table below and a complete list of companies excluded from our universe is included at Appendix B: Companies Excluded from the Rankings.
Ranked Companies Number of companies
Russell 1000 988
No 10K -7
Multiple Share Classes -12
Holding Company -5
Acquired since June 22, 2018 -5
REITS with fewer than 1,000 employees -57
No employees in the U.S. -2
TOTAL 890
We may expand the collection of companies we rank in future years.

2018 JUST Capital Ranking Methodology
Copyright © 2018 JUST Capital Foundation, Inc. All rights reserved. Table of Contents – 32
10 Industry Classification
Grouping companies by industry is important to JUST Capital's ranking model. JUST Capital defines a company's industry group as the group of companies to which its business model is most comparable, or with which it competes for business within a market. Industry groups can impact a company's
performance in JUST Capital's ranking model in several ways. For instance, a company's industry influences the way in which we calculate scores for the Fair Pay metric, by comparing the performance of its industry peers. Industry groups can also impact the availability of certain data and how we impute missing data (see Section 15.2 Missing Data).
JUST Capital categorizes companies into industries according to the Industry Classification Benchmark (ICB). The ICB is a globally recognized standard, operated and managed by FTSE Russell for categorizing companies and securities according to the nature of each company's business. FTSE Russell assigns each company to a single industry according to its principal business activity as determined by the source of its revenue or the source of the majority of its revenue. Most recently, the
list consists of 10 Industries, 19 Supersectors, 41 Sectors, and 114 Subsectors. JUST Capital derives its 33 industry groupings, which form the basis of its 33 industry-relative rankings, from a combination of the ICB's 19 Supersectors and 41 Sectors. JUST Capital has adopted this approach in order to create industry groupings that are roughly similar in size, based on number of constituents. A table illustrating the mapping of JUST Capital's 33 industries to the ICB can be found in Appendix A: Industry Classification.
While JUST Capital has elected to exclude Real Estate Investment Trusts (REITs) with fewer than 1,000 employees from its rankings, REITs with greater than 1,000 employees have been included in the Real Estate industry rankings.

2018 JUST Capital Ranking Methodology
Copyright © 2018 JUST Capital Foundation, Inc. All rights reserved. Table of Contents – 33
11 Company Data Review Period
As part of a broader process to ensure the accuracy and validity of its data, JUST Capital provides each ranked company an opportunity to review and submit suggested revisions to the data on which its scores and ranking are based. On an annual basis, representatives from each company are invited to
access their data via the JUST Capital Corporate Portal, a secure platform. In 2018, the window for companies to review and submit data was six weeks, from July to September.
In 2018 and 2017, the Company Data Review Period lasted six weeks. This number was increased from 2016, where the period lasted four weeks. This year, we also developed and deployed a new secure platform with a more intuitive user interface. Over 300 companies registered on our platform in 2018, compared to approximately 150 companies in 2017 and 60 companies in 2016. This year, around 8,500 Data Points and comments were submitted.
As part of this process, JUST Capital assesses all submitted data with their related metric(s) and methodologies, to ensure accuracy, relevance, and consistency. JUST Capital uses a series of reference
points for these assessments: the current data on hand, supporting evidence provided by companies, historical data, and other relevant sources. JUST Capital only considers supporting evidence that is publicly disclosed. Subject to these assessments, JUST Capital makes all reasonable efforts to incorporate company data submissions into annual ranking calculations, without guaranteeing that the submitted data will affect companies’ rankings or scores, materially or otherwise.

2018 JUST Capital Ranking Methodology
Copyright © 2018 JUST Capital Foundation, Inc. All rights reserved. Table of Contents – 34
12 Research Advisory Council
JUST Capital’s Research Advisory Council provides independent guidance on JUST Capital’s research program and technical expertise on specific research matters. The Council helps ensure that JUST Capital appropriately captures the American public’s views and that it accurately measures corporations
on those issues important to the American public, with rigorous, unbiased and up-to-date methods.
The Council is comprised of researchers and thought leaders who are passionate about JUST Capital’s mission and willing to provide experience and expertise to the research team, specifically related to one or more of the following:
1. Capturing, analyzing, and accurately reflecting public opinion.
2. Designing assessment metrics and identifying data to evaluate corporate performance.
3. Developing statistical methods and models to fairly evaluate corporate behavior.
4. Informing and improving JUST Capital’s research and ranking methodologies.
The Council is divided into two specialized groups: one focused on Survey Research and the other on
Corporate Performance and Ranking.
The composition of JUST Capital's Research Advisory Council is published on JUST Capital’s website at www.justcapital.com.2
2 JUST Capital's Research Advisory Council was substantially expanded in 2017, particularly on the Survey Research side.

2018 JUST Capital Ranking Methodology
Copyright © 2018 JUST Capital Foundation, Inc. All rights reserved. Table of Contents – 35
13 Board of Directors and Research Committee Oversight
The Research Committee of the Board of Directors meets regularly with JUST Capital research staff to review and provide their input on the methodology. Any major changes to the methodology are discussed with the Research Committee, as are new developments and major controversies. If a
Unique Event occurs, the Research Committee is tasked with reviewing the material events that could affect the JUST Capital Rankings and their maintenance (see Section 16 Unique Events). The Committee may revise its policies and metrics to analyze corporate performance according to available data and new research.
13.1 Blackout Period for JUST Directors and the Finalized JUST Rankings
The role of JUST Capital's Board of Directors in relation to the rankings is to, in conjunction with JUST
personnel, agree the methodology and scope of the rankings. The Directors shall not be involved in the ranking of individual companies, and shall have no input into the final rankings or the final membership of the JUST 100.
The purpose of the Blackout Period is to protect the integrity of JUST Capital’s rankings from any conflicts of interest—real or perceived—that might arise from non-executive members of the JUST Capital Board of Directors having access to, or influence over, company scores and/or rankings in advance of their public release. Such real or perceived conflicts include, but are not limited to:
● actions that might influence the ranking methodology or ranking results themselves such that the scores and/or rankings of one or more companies are intentionally impacted, either positively or
negatively.
● actions based on information about the rankings or the composition of the JUST 100 prior to their public release.
Annually, a blackout period of no less than 12 weeks prior to the date on which the rankings are made public shall be put in place. During the Blackout Period, all Directors are prohibited (i) from accessing the rankings (whether in draft or final form) such that the names and ranking of constituent companies is made known or can be determined, or (ii) from communicating in any format regarding the membership of the JUST 100 including, but not limited to, any communications regarding the rank or identity of any company or companies. Furthermore, during the Blackout Period all JUST Capital
personnel shall be prohibited from communicating with any Director regarding the membership of the JUST 100 including, but not limited to, any communications regarding the rank or identity of any company or companies.

2018 JUST Capital Ranking Methodology
Copyright © 2018 JUST Capital Foundation, Inc. All rights reserved. Table of Contents – 36
Notwithstanding the above, JUST Capital personnel may on an exceptional basis have the right to inform Directors of the names of companies that are ranked for the purpose of contacting top ranked companies, overall and within each industry sector of the Rankings, for the sole purpose of discussing the scheduled announcement and other marketing purposes and only pursuant to an appropriate non-disclosure agreement prior to any substantive discussions. JUST Capital personnel may not disclose the actual ranking of the company, and only minimal information can be communicated. Designated Directors are authorized to contact top ranked companies, overall and within each industry sector of the Rankings, for the sole purpose of discussing the scheduled announcement and other marketing
purposes and only pursuant to an appropriate non-disclosure agreement prior to any substantive discussions.

2018 JUST Capital Ranking Methodology
Copyright © 2018 JUST Capital Foundation, Inc. All rights reserved. Table of Contents – 37
14 Company Liaison
JUST Capital undertakes a year-round corporate engagement effort to ensure that every company has the opportunity to understand JUST Capital’s mission, methodology, data, and analysis. We have reached out to the CEO of every constituent of our Ranked Companies as well as marketing,
sustainability, and investor relations teams, as appropriate.
JUST Capital is committed to creating an independent and unbiased analysis of all our Ranked Companies. JUST Capital is not a “pay-to-play” or “opt-in” organization and does not take money from ranked companies. We expend an equivalent amount of time and resources in our attempts to reach out to and engage with each company. Under no circumstances have any donations or any other sources of money had an impact on the rankings or analysis of companies.

2018 JUST Capital Ranking Methodology
Copyright © 2018 JUST Capital Foundation, Inc. All rights reserved. Table of Contents – 38
15 Rankings
In 2018, JUST Capital is releasing two different, but highly interconnected sets of rankings. This is the second year that we are producing an ordinal cross-industry ranking. This ranking allows users to view and compare company performance in an absolute sense – that is, all ranked companies, regardless of
size or industry. We also produce a series of industry rankings, which allow users to better explore company performance within an industry. The industry rankings consists of the subset of companies within their own industry, in the same order as in the general ranking. As we have 33 separate industry groupings (see Appendix A: Industry Classification), there are 33 Industry rankings.3
15.1 Normalizing for Company Size (Scaling)
The companies ranked by JUST Capital vary considerably in terms of their size and scale, whether measured by revenue, market capitalization, or number of employees, customers, suppliers, or other stakeholders. Companies’ physical impact, use of resources, and scope of operations vary similarly. These inherent size differences may influence the performance of ranked companies across many of the metrics, and particularly those metrics that are directly correlated with size and scale.
JUST Capital has developed and implemented a protocol for normalizing metrics that, in our view, reflect performance that is proportional to the size of the company. There are three key reasons for the implementation of this protocol:
1. Alignment with JUST Capital’s mission. JUST Capital’s mission is to drive better performance on the issues that matter most to the American public. In some areas, performance is not an absolute concept – it can be measured in terms of efficiency or in terms of a company's gross impact. For instance, within an industry, a larger company will generally use more natural resources than a smaller peer, even if it uses those resources more efficiently. For example, our model analyzes both the total amount of waste that a company recycles, as well as the percentage of a company’s waste that was recycled. We also measure a company’s charitable contributions relative to its pre-tax profits. By normalizing for company size in such instances, our Rankings provide a measure of a company's efficiency, rather than its gross impact (which is
a function of its size and growth), and therefore rewards both companies that are just and those that are becoming more just over time.
2. Preventing insurmountable bias against larger companies and growth in the Rankings. There would be little point in ranking companies on a set of metrics every year if there was no practical way that a large company could perform better than a smaller company through its effort. For example, consider two utility companies, one that serves 5 million customers and another that serves 500,000 customers. The former will have a much larger environmental footprint as a function of serving more people, even if it serviced those customers with fewer emissions per customer than the smaller utility. Without scaling the data, the
environmental ranking would amount to little more than simply sorting the companies from smallest to largest. Furthermore, by scaling the data, we avoid a bias against growth. If we did not scale, certain companies could be penalized simply by virtue of having successful, fast-growing businesses, even if they were becoming more efficient over time.
3 Since 2017 we have been producing an overall ranking. In 2016, we produced 32 industry-specific rankings. The additional industry-specific ranking in 2017 (i.e. 33, up from 32 in 2016) reflected a move from the Global Industry Classification System to the Industry Classification Benchmark (see Appendix A: Industry Classification).

2018 JUST Capital Ranking Methodology
Copyright © 2018 JUST Capital Foundation, Inc. All rights reserved. Table of Contents – 39
3. Preventing insurmountable bias against smaller companies and growth in the Rankings. While issues like environmental footprint potentially have a greater impact on larger companies, smaller companies have fewer resources available to dedicate to sustainability programs. Larger companies have more resources to develop and maintain policies. For certain areas – for example, having a human rights policy – we have left this bias in place to encourage smaller companies to devote a portion of their resources to becoming more just. Americans care that companies do not violate human rights and, therefore, it is important that it is reflected in our model. The Jobs Issue is also biased toward companies with more jobs because, when
polled, the American public indicated their preference for companies that provide more jobs. This is partially negated by also including two job growth components that favor small but growing companies.
4. Scaling is standard practice by both policy analysts and company executives. Scaling this type of data is a general practice within the ESG, business, and statistical communities for the above reasons. While companies do disclose their overall environmental footprint, company executives generally consider their technological and investment tradeoffs on a per-unit basis – for example, emissions per kWh. It is appropriate that JUST Capital's contribution to this conversation occurs in a manner that acknowledges current practice
There is no one-size-fits-all approach to normalization. JUST Capital exerts an ongoing effort to explore different normalization strategies to reduce size-related effects. Different variables exhibit different properties and necessitate different normalization procedures. Accordingly, JUST Capital has applied a scaling protocol as consistently as possible within the its framework of metric-types (see Section 7 Metric Development).
Many performance metrics are scaled implicitly without the need for any explicit scaling protocol. For instance, metrics presented as rates, ratios, or percentages (such as Total Recordable Incident Rate, CEO to Median Worker Pay Ratio, Percentage Change in U.S. Workforce, Charitable Giving as a Percentage of Pre-Tax Profits, and 5-year average Return on Invested Capital), are intrinsically scaled.
Management metrics (which assess a company's policies, commitments, and management practices) may exhibit some size bias – larger companies tend to perform slightly better at times. We take the view that a company's interests in managing certain risks grow as the size of the company does, principally because larger companies have greater exposures to such risks, are often subject to greater media and regulatory scrutiny than small companies, and can devote more time and resources to developing policies and management practices than their smaller peers. However, because many management metrics are measured on a binary Yes/No basis, for which there is no scaling protocol that can be meaningfully applied, we do not scale them.
In relation to controversies and fines metrics, the likelihood of a negative incident (that is investigated and subsequently reported by relevant regulators, media organizations, or NGOs) is proportional to the
size of a company’s operations (i.e. the larger a company's economic footprint, the more likely it is that a negative incident will come to the attention of the press or government). Similarly, the scrutiny applied to a company by those same regulators, media organizations, and NGOs is generally proportional to a company's size and public prominence. While public prominence is a difficult variable to control for, the normalization of controversies and fines metrics by company size allows a greater degree of size-neutral comparison.
JUST Capital’s approach to scaling has been informed by stakeholder feedback on our draft methodology, survey work conducted in 2016, and the input of our Research Advisory Council. Where

2018 JUST Capital Ranking Methodology
Copyright © 2018 JUST Capital Foundation, Inc. All rights reserved. Table of Contents – 40
adjustments have been deemed appropriate through these processes, JUST Capital has normalized metrics for size and scale in the following ways:
Metric type Application of scaling treatment
Performance All metrics related to resource efficiency are presented as intensities (e.g. units
used per million USD of revenue) or percentages (e.g. metric tons of waste recycled as a percentage of total waste).
No formal scaling protocol has been applied to other performance metrics.
However, some metrics are, by design, intrinsically scaled. This is true, for instance, of all metrics presented as rates, ratios, or percentages (such as Total Recordable Incident Rate, CEO to Median Worker Pay Ratio, Percentage Change in US Workforce, and 5-year Average Return on Invested Capital). This is also true for the
Product Recall metric which includes an analysis of the number of products recalled, the severity of the recall, and a company’s responsiveness, all in relation to the company’s overall revenue.
Management No scaling applied. These metrics are often measured on a binary Yes/No basis.
Controversies All controversies are scaled by company revenue.
Crowdsourced No scaling applied. These metrics represent worker sentiment on specific issues (and, in some cases, salary disclosures).
Fines All fines are scaled by company revenue.
Selection of Scaling Factor
There are a range of measures of company size that can be used to normalize metrics. JUST Capital considered company revenue, number of employees, and market capitalization as candidates and
ultimately selected company revenue.
Market capitalization was discarded because it depends not only on a company’s current economic footprint, but also on investors' expectations of its future profits. As a result, the market multiple placed on current operations varies widely – for example, small footprint and high market multiple companies, such as Tesla, versus large footprint and low multiple companies, such as ExxonMobil. Therefore, market capitalization is not an appropriate scaling factor for current data.
A company's number of employees is a natural and intuitively appealing scaling factor. However, it is disadvantaged in that it may be mostly a function of a company’s technological choices and efficiency, rather than a measure of its footprint or exposure to risk. For example, two utility companies may
produce the same volume of greenhouse gas emissions, though one uses a more modern generator that requires fewer workers. If scaling were based on the number of workers, the company with the more efficient technology would be penalized, even though its environmental footprint is the same as its peer company.
Company revenue is thus the most appropriate scaling factor because it relates only to the economic trade-off between revenue and the given metric and does not incorporate market expectations of future returns or a company's level of investment in technology.

2018 JUST Capital Ranking Methodology
Copyright © 2018 JUST Capital Foundation, Inc. All rights reserved. Table of Contents – 41
15.2 Missing Data
Since 2017, we have worked to substantially reduce the extent of missing data. In 2018, the share of metrics that were imputed by industry mean declined to 2.5% from 6.5% in 2017. Given the diversity of Components measured within the Rankings, and the breadth of companies and industries covered,
the challenges of finding credible data vary substantially. Typically, within the context of the Rankings, missing data or missing values within data sets generally occur in one of three situations:
1. A company does not disclose the data publicly;
2. A company discloses partial data or processes data differently than other companies, which may be due in part to the absence of standardized or conventional disclosure requirements;
3. No data is collected for a specific metric by a company, either because the metric in question is considered less relevant to that company's industry or because the data has not been compiled (for instance, in some cases, the universe of companies covered by one of our data sources may not wholly align with our own).
It is important to note that JUST Capital’s Rankings are not inferential statistical models. Whereas an inferential model might employ techniques that seek to maximize the integrity of a dataset’s distribution such that properties can be inferred from the whole, our Ranking focus on every individual Data Point, as each and every one can influence a company’s overall performance. The most relevant literature is often in the field of composite indicators. Thus, one of our guiding principles for missing data imputation is that we should not unduly disadvantage a company or set of companies where data is missing, especially where the availability of that data is beyond the control of the company or companies in question.
JUST Capital’s approach to handling missing data has been informed by stakeholder feedback on our
draft methodology, survey work conducted in 2016, and the input of our Research Advisory Council. All mentions of values in the tables that follow reference raw data values, prior to any transformation we subsequently apply in calculating scores, which are described elsewhere (see Section 15.4 Scoring and Ranking Calculation).
Regarding normalizing for company size, a blanket rule for the imputation of missing data will not present a clear, unbiased picture of company performance across our diverse range of metrics (See Section 15.1 Normalizing for Company Size (Scaling)). As such, missing data are typically
handled in one of three ways: zero value, industry mean, or neutral score, as detailed below.
15.2.1 Method 1: Zero Value
In many instances, the absence of data is not the same as having missing data. This is because certain values are not really “missing” in the statistical sense – that is, if the data are not required to exist or the company has not engaged in behavior that would cause the data to exist. This is true of all management metrics (where the absence of data means there was no evidence of a relevant policy), controversies (where the absence of data means there were no controversies recorded), and fines (where the absence of data means no fines were levied), for instance. It is also true of some of our performance metrics. In such instances, JUST Capital assigns a value of zero where a Data Point is missing.

2018 JUST Capital Ranking Methodology
Copyright © 2018 JUST Capital Foundation, Inc. All rights reserved. Table of Contents – 42
Data Point Type
Application of 'zero' treatment
Performance This treatment is applied to the following performance metrics:
● Charitable Giving Ratio ● Total Recordable Incident Rate ● Chemical Water Discharge ● Toxic Chemical Emissions
● Reduces Solid Waste to Landfill ● Maximizes Use of Renewable Energy ● Environmental Management Systems and Disclosure ● Related Party Transactions
● Independent Board Leadership ● Board Oversight of JUST Issues ● Commitment to Follow Laws & Regulations
● 5-year Shareholder Payout Ratio ● Total Recordable Incident Rate ● Product Recalls
Management This treatment is applied to all management metrics. A value of zero denotes the
absence of publicly available evidence that a company is proactively managing the risk(s) in question. For most Management metrics, zero represents a value of No or False on binary Yes/No or True/False questions, respectively.
Controversies This treatment is applied to all controversy metrics. A value of zero in this instance is positive (indicating no controversies) and assumes the data available to us are complete.
Fines This treatment is applied to all fines metrics. A value of zero is positive (indicating
no fines) and assumes the data available to us are complete.
15.2.2 Method 2: Industry Mean
When zero-value imputation is not the best manner to treat missing data, we generally impute the industry mean. In these situations, the information may exist but is not disclosed. Rather than imputing a zero, which would penalize companies, we chose to impute that company’s industry mean for the specific Data Point. This is a neutral treatment that allows us to create a fair assessment based on a company’s industry.

2018 JUST Capital Ranking Methodology
Copyright © 2018 JUST Capital Foundation, Inc. All rights reserved. Table of Contents – 43
Below are the Data Points for which we impute the industry mean, in the event of missing data.
Data Point
Type
Application of “industry mean” treatment
Performance This treatment is applied to most performance metrics not subject to the “zero value” treatment described above in Method 1. This treatment reflects the practical reality that data availability is frequently beyond the control of companies. See 2018 Metrics & Data for details on which metrics are imputed by industry and
super-industry. ● Customer Service Rating ● CEO-to-Median Worker Pay Ratio
● 5-year Operating Income Growth CAGR ● 5-year Earnings Per Share Growth CAGR ● 5-year Change in Operating Margin ● 5-year Average Return on Equity
● 5-year Risk-Adjusted Total Shareholder Return ● Fair Pay Rating ● Fair Pay Percent ● Greenhouse Gas Emissions
Crowdsourced This treatment is applied to all crowdsourced metrics, reflecting the practical reality that data availability is beyond the control of companies.
● Career Opportunities
● Crowdsourced Work-Life Balance ● Benefits and 401k Quality Assessment ● Crowdsourced Employee Respect
15.2.3 Method 3: Neutral Score
When we choose to use a metric with a high degree of missing data (e.g. over 50 percent missing overall), it is because the metric is important to the American public. While there is an argument for
excluding such metrics from the calculation of the overall ranking, we feel that these metrics bring unique information about certain companies to our Rankings. In order to use these metrics in a way that does not disadvantage companies for whom the data is missing nor artificially deflate the variance in these metrics and thereby impact the calculation of all scores, we have opted to calculate scores for companies with data and, then, assign companies without data a neutral score (i.e. 50, which represents the mean of all scores). This is also due to the fact that we do not have sufficient data to calculate a representative industry mean. For companies without data, this treatment has the effect of “zeroing out” the metric. This treatment has been applied to the Customer Privacy metric.
15.3 Outliers
The treatment of outlier Data Points and component scores has the potential to significantly impact the results of the Rankings. Containing the influence of extreme outliers is particularly important in the context of JUST Capital's work because a company’s outperformance on one variable can be counteracted by its underperformance on another. In the absence of an effective outlier treatment,
extreme outperformance or underperformance on a single metric can unduly influence a company’s

2018 JUST Capital Ranking Methodology
Copyright © 2018 JUST Capital Foundation, Inc. All rights reserved. Table of Contents – 44
overall ranking. For example, one positive outlier event could compensate for multiple unrelated negative performances.
This is particularly important with regard to our overall ranking, which includes two opposing considerations:
● On the one hand, JUST Capital prefers to assess every company's performance on every issue as accurately as possible, based on reliable data. This preference would suggest leaving a company's data completely untreated, with no adjustment for outlier Data Points, as this would be the truest representation of a company's performance.
● On the other hand, because JUST Capital ranks companies across a broad range of industries and diverse issues, the order of magnitude of certain Data Points varies substantially, depending on the industry. Section 15.1 Normalizing for Company Size (Scaling) explains our first-line approach to controlling for this diversity. However, even after normalizing for company size, certain outlier Data Points have the potential to drive a company's overall results beyond what the polling weight of the issue would deem representative of public opinion. Accordingly, we have adopted the following "light touch" approach to controlling for outliers. Our intention is that this only affects a small proportion of company data and results in more robust and reliable rankings.
Our approach is as follows:
1. We only control for outlier data at the Component level, not at the individual Data Point or Metric level, because Components are, in effect, the basic building blocks of the ranking model. As there is, most often, not a single definitive way to measure company performance on a particular Component (e.g., “Reduces Environmental Pollution” can be measured in many ways), we use multiple metrics in order to fully capture company performance as accurately and completely as we can. Companies are measured on each metric and the overall score for a particular Component is calculated as the average of its constituent metrics. Where there are
multiple metrics associated with a single Component, it is rare for outliers to exist for all metrics. As such, the existence of outliers rarely, in practice, unduly influences a company’s score at the Component level. This increases the stability of the overall model and in most cases, explicit action to control for outliers is not required.
2. We winsorize or "cap" component scores at the ranking stage just prior to calculating a company's final weighted average score as the weighted sum of component scores.
3. We have deliberately chosen the limits of this winsorization to be wider than the general statistical practice for outlier control. The intention is to affect a very small number of company component scores. The limits we have chosen are three standard deviations from the component mean (three sigma). In terms of our component scoring method, which normalizes
component scores to a mean of 50 and a standard deviation of 25, this means that in the computation of the final weighted average score, component scores are limited to -25 at the bottom end of the range and 125 at the top of the range. (50 - (3*25)) = -25 and (50 + (3*25)) = 125.
4. We believe this represents a fair compromise, where the only companies that are capped are those with outliers so significant that they may drive their overall score. The resulting impact of this procedure is that approximately 385 company-component scores out of a possible 32,112

2018 JUST Capital Ranking Methodology
Copyright © 2018 JUST Capital Foundation, Inc. All rights reserved. Table of Contents – 45
are subjected to capping at the above limit. This represents about 1.2 percent of all component data.
5. As shown in the table below, the vast majority of component scores are within two standard deviations of their mean, and only the most extreme outliers are subjected to capping in our methodology.
6. It is worth noting that the overall prevalence of outlier component scores in the dataset, even at the more traditional 2 S.D. (standard deviations from the mean) + level, is quite low.
Dispersion of component scores relative to component mean (% of observations)
Within 2 S.Ds. 2-3 S.D. 3+ S.D.
96.2% 2.6% 1.2%
S.D.: standard deviations from the mean.
15.4 Scoring and Ranking Calculation
In 2018, the ranking process began with the calculation of a company's score first and then its overall rank (i.e. against all Ranked Companies). We obtain a company's industry ranking by simply taking the subset of companies within that industry, and maintaining the same ordinal ranking as the overall
ranking but starting at 1 and continuing until all companies within an industry have been ranked.
15.4.1 Absolute (cross-industry) ranking
A company’s overall rank is calculated as follows:
1. Corporate performance Data Points are transformed into a numeric format. We convert all scales (binary, qualitative, and quantitative) into numeric form. For example, data that tracks corporate policy implementation, which may come in the form of a Yes/No response, is transformed into a numeric score. A Yes response may be given a value of one, and a No response may be given a value of zero. A verbal scale (e.g. assessing the severity of a company’s controversies at one of five different levels from “None” to “Very Severe”) may also be transformed (e.g. from 1 to 5). At the end of this step, all the scales are numeric, but they have different units (e.g. one might
be U.S. Dollars, another tons of pollutant emissions, another number of employees, another a rating, and another a numerical encoding of Yes/No). Some data is normalized for company size at this stage (see Section 15.1 Normalizing for Company Size (Scaling)). Data points are used to calculate the metrics. The Data Points are not weighted at the metric level. The Data Points can be added (e.g. for Commitment to Work-life Balance, we add the Flexible Working Hours Policy score with the Day Care Services score), or they can used as denominators and numerators in fractions (e.g. for Charitable Giving Ratio, we divide a company’s Total Corporate Giving by its Pre-tax profits).

2018 JUST Capital Ranking Methodology
Copyright © 2018 JUST Capital Foundation, Inc. All rights reserved. Table of Contents – 46
2. A z-score method is applied to normalize the metrics onto a standardized scale for consistent measurement across varied metrics. The z-score method achieves this by normalizing, using the standard deviation and the mean for each metric. The generalized z-score formula is: z = (x – μ) / σ where “z” is the normalized score; “x” is a given company’s raw value for a given metric; “μ” is the mean value for the metric within the comparison group and “σ” is the standard deviation for the metric within the same group. This normalization is performed across all companies for each metric.
3. All heterogeneous numeric scales are aligned so that they run in the same direction with regard
to positive vs. negative performance (e.g. higher board diversity is positively ranked, but a high rate of antitrust controversies is negatively ranked).
4. In order to make these scores more accessible, we transform them to have a range of scores from mostly 0 to 100, with an average of 50. In order to do so, we multiply the z-score by 25 and add 50. We do this to make the scores more intuitive. This transformation does not change the order of the Rankings, but provides a value of 50 for the average company, with one standard deviation from the mean represented by 25 points. For example, a company with a z-score of two (i.e. two standard deviations above the mean) would receive a score of 100. While scores at this stage in the scoring process are not bound within any technical limits, most
company scores will fall in a range between zero and 100.
5. Component scores are calculated as the average of the Component's underlying metrics.
This year, there are two Components with Metrics that are not equally weighted in our model:
● Takes Steps to Avoid Causing or Contributing to International Conflicts. The controversy metric weighted 50% of this Component in 2017. This year, it was reduced based on external expert input on the limits of controversy data to reflect performance and on increased knowledge about the rigor of Development International’s scoring. In 2018, the controversy metric received a 1/3rd weight, while the metric based on Development International’s scoring received a 2/3rds weight.
● Makes Products that are Beneficial to Health or Society: Commitment to Producing Beneficial and Non-Harmful Products (62.5% weight) and Beneficial and Non-Harmful Products Assessment (37.5% weight). This number was obtained by first giving both metrics equal weight, and then reducing the impact of Products that are Beneficial to Health or Society by 75% because this was a new metric. The rationale here was to gradually introduce the new Beneficial Products Assessment metric.
6. Extreme outliers may cause misleading results. We aim to minimize this by using statistical techniques, including winsorization. Winsorization preserves all observations in a data set, but replaces outlier values with non-outlier values at a specified threshold, in our case at three standard deviations above and below the data set’s mean such that component scores are
bound between -25 and 125 (see Section 15 Outliers).
7. The last step before calculating the weighted average is to repeat a z-score normalization for each Component (see step 2) so that all Component scores have a mean of 50 and standard deviation of 25 before being aggregated. This is conducted so that the importance of each Component within the Rankings is consistent with the polling weights, to reset the means and standard deviations to 50 and 25 after they are changed during the outlier treatment.

2018 JUST Capital Ranking Methodology
Copyright © 2018 JUST Capital Foundation, Inc. All rights reserved. Table of Contents – 47
8. The company’s score for each Component is then weighted according to its relative importance based on our polling of the American public.
9. The weighted scores for each of the 36 Components are added together to produce the final score. The aggregation formula is illustrated below, where “C” indicates each Component score and “W” indicates the weight corresponding to the respective Component: FINAL SCORE = W1C1+W2C2+ … + W35C35+ W36C36
10. A company's Issue score is calculated as the weighted sum of its Components.
11. The final overall rankings are created by comparing the scores of all companies and listing them in numerical order from highest to lowest.
15.4.2 Industry ranking
The industry rankings are simply the subset of companies within their own industry, in the same order
as in the overall rank.

2018 JUST Capital Ranking Methodology
Copyright © 2018 JUST Capital Foundation, Inc. All rights reserved. Table of Contents – 48
16 Unique Events
Unique events are defined by JUST Capital as important, defined events resulting from action(s) or inaction(s) by a company, are sudden, extreme, or unusual in nature, are considered material to JUST business behavior as defined by the public, and have the potential to affect a company’s ranking, either positively or negatively, outside the normal architecture of, or out-of-sync with, our ranking process. Examples of unique events include the occurrence of a major workplace scandal or environmental disaster on the negative side, or groundbreaking improvements in employee wages or breakthroughs in healthy products on the positive side. In short, a unique event is a significant development which is not captured by our most current data.
There are significant challenges associated with how we consider and incorporate the impact of unique
events outside of the formal data-driven ranking process. To do so in real time is challenging, because relevant details about the scale, severity, and impact of an event can take some time to play out, and even more time before it is reflected in the data on which our model relies to produce a ranking (e.g. because of annual reporting periods, or the lag between an incident and the imposition of a fine/violation, etc.).
A decision to alter a company’s score outside of the data-driven model is, by definition, a departure from our standard processes and necessarily involves some degree of subjectivity. Such interventions are considered carefully, and only undertaken when an event is so significant that failure to acknowledge it would undermine the integrity or credibility of our Rankings.
In addressing unique events, JUST Capital has sought to balance timeliness and currency with fairness to companies and other stakeholders. We have developed a formal process for considering unique events in consultation with the public as well as independent specialists and other neutral third parties. Our process involves the following steps:
● JUST Capital monitors news and events related to the companies we evaluate on a daily basis.
● Events that meet specified severity thresholds are labeled as "potential unique events" and are promptly brought to JUST Capital's Research Committee for consideration and adjudication.
● The Research Committee may make one of a number of decisions in relation to a "potential unique event" including, but not limited to:
o Polling the public on the impact of the event, with a view to adjusting a company’s score
based on the public’s views at that time.
o Placing the affected company on a “watch-list,” and incorporating the event into the next scheduled annual evaluation.
o Attaching a positive or negative "outlook" to a company's performance on one or more Issues or Components, pending more information on the impact of the event.
In 2018, there were no unique events that required that this procedure be used. While there were some notable controversies, these were captured by our model.

2018 JUST Capital Ranking Methodology
Copyright © 2018 JUST Capital Foundation, Inc. All rights reserved. Table of Contents – 49
17 Disclosure of Ranked Companies
JUST Capital is disclosing the scores and ranks of all companies within each of the 33 industry-specific rankings, and the top 90 percent of ranked companies in our overall ranking. Companies that rank in the bottom 10 percent of the overall ranking will be listed in alphabetical order.
Our mission is to build a more just marketplace that better reflects the true priorities of the American people. We believe that business, and capitalism, can and must be a positive force for change. We believe that if they have the right information, people will buy from, invest in, work for, and otherwise support companies that align with their values. To those ends, in our third major Rankings release, we do not believe that our mission is advanced by calling out bottom performers in the overall ranking by name. We will periodically reevaluate our position on this and update our ranking disclosures to reflect decisions taken by our Board of Directors.

2018 JUST Capital Ranking Methodology
Copyright © 2018 JUST Capital Foundation, Inc. All rights reserved. Table of Contents – 50
18 Appendix A: Industry Classification
The table below illustrates how the 33 JUST Capital industries map to the ICB (Industry Classification Benchmark), operated and managed by FTSE Russell. The ICB structure shown is effective as of July 2018. This is discussed in greater detail in Section 10 Industry Classification.
ICB Industry ICB Supersector ICB Sector ICB Subsector JUST Industry
Industrials Industrial Goods &
Services
Aerospace & Defense Aerospace Aerospace &
Defense
Industrials Industrial Goods &
Services
Aerospace & Defense Defense Aerospace &
Defense
Consumer Goods
Automobiles & Parts
Automobiles & Parts Automobiles Automobiles & Parts
Consumer Goods
Automobiles & Parts
Automobiles & Parts Auto Parts Automobiles & Parts
Consumer
Goods
Automobiles &
Parts
Automobiles & Parts Tires Automobiles & Parts
Financials Banks Banks Banks Banks
Basic
Materials
Basic Resources Forestry & Paper Forestry Basic Resources
Basic
Materials
Basic Resources Forestry & Paper Paper Basic Resources
Basic
Materials
Basic Resources Industrial Metals &
Mining
Aluminum Basic Resources
Basic Materials
Basic Resources Industrial Metals & Mining
Nonferrous Metals Basic Resources
Basic
Materials
Basic Resources Industrial Metals &
Mining
Iron & Steel Basic Resources
Basic
Materials
Basic Resources Mining Coal Basic Resources
Basic
Materials
Basic Resources Mining Diamonds & Gemstones Basic Resources
Basic Materials
Basic Resources Mining General Mining Basic Resources
Basic
Materials
Basic Resources Mining Gold Mining Basic Resources
Basic
Materials
Basic Resources Mining Platinum & Precious
Metals
Basic Resources
Industrials Construction &
Materials
Construction &
Materials
Building Materials &
Fixtures
Building Materials &
Packaging
Industrials Industrial Goods & Services
General Industrials Containers & Packaging Building Materials & Packaging
Industrials Construction &
Materials
Construction &
Materials
Heavy Construction Industrial Goods
Industrials Industrial Goods &
Services
General Industrials Diversified Industrials Industrial Goods
Industrials Industrial Goods &
Services
Electronic & Electrical
Equipment
Electrical Components &
Equipment
Industrial Goods
Industrials Industrial Goods & Services
General Industrials Electronic Equipment Industrial Goods
Financials Financial Services Financial Services Asset Managers Capital Markets

2018 JUST Capital Ranking Methodology
Copyright © 2018 JUST Capital Foundation, Inc. All rights reserved. Table of Contents – 51
Financials Financial Services Financial Services Investment Services Capital Markets
Basic
Materials
Chemicals Chemicals Commodity Chemicals Chemicals
Basic
Materials
Chemicals Chemicals Specialty Chemicals Chemicals
Industrials Industrial Goods &
Services
Support Services Business Support
Services
Commercial Support
Services
Industrials Industrial Goods & Services
Support Services Business Training & Employment Agencies
Commercial Support Services
Industrials Industrial Goods &
Services
Support Services Financial Administration Commercial Support
Services
Industrials Industrial Goods &
Services
Support Services Industrial Suppliers Commercial Support
Services
Industrials Industrial Goods &
Services
Support Services Waste & Disposal
Services
Commercial Support
Services
Financials Financial Services Financial Services Consumer Finance Consumer & Diversified Finance
Financials Financial Services Financial Services Specialty Finance Consumer &
Diversified Finance
Financials Financial Services Financial Services Mortgage Finance Consumer &
Diversified Finance
Consumer
Goods
Personal &
Household Goods
Household Goods &
Home Construction
Durable Household
Products
Household Goods &
Apparel
Consumer Goods
Personal & Household Goods
Household Goods & Home Construction
Furnishings Household Goods & Apparel
Consumer
Goods
Personal &
Household Goods
Household Goods &
Home Construction
Home Construction Household Goods &
Apparel
Consumer
Goods
Personal &
Household Goods
Leisure Goods Consumer Electronics Household Goods &
Apparel
Consumer
Goods
Personal &
Household Goods
Leisure Goods Recreational Products Household Goods &
Apparel
Consumer Goods
Personal & Household Goods
Leisure Goods Toys Household Goods & Apparel
Consumer
Goods
Personal &
Household Goods
Personal Goods Clothing & Accessories Household Goods &
Apparel
Consumer
Goods
Personal &
Household Goods
Personal Goods Footwear Household Goods &
Apparel
Consumer
Services
Travel & Leisure Travel & Leisure Gambling Restaurants &
Leisure
Consumer Services
Travel & Leisure Travel & Leisure Hotels Restaurants & Leisure
Consumer
Services
Travel & Leisure Travel & Leisure Recreational Services Restaurants &
Leisure
Consumer
Services
Travel & Leisure Travel & Leisure Restaurants & Bars Restaurants &
Leisure
Consumer
Services
Travel & Leisure Travel & Leisure Travel & Tourism Restaurants &
Leisure
Oil & Gas Oil & Gas Oil Equipment, Services & Distribution
Oil Equipment & Services
Energy Equipment & Services
Oil & Gas Oil & Gas Oil Equipment,
Services & Distribution
Pipelines Energy Equipment &
Services
Oil & Gas Oil & Gas Alternative Energy Alternative Fuels Energy Equipment &
Services
Consumer
Services
Retail Food & Drug Retailers Drug Retailers Food & Drug
Retailers

2018 JUST Capital Ranking Methodology
Copyright © 2018 JUST Capital Foundation, Inc. All rights reserved. Table of Contents – 52
Consumer
Services
Retail Food & Drug Retailers Food Retailers &
Wholesalers
Food & Drug
Retailers
Consumer Goods
Food & Beverage Beverages Brewers Food, Beverage & Tobacco
Consumer Goods
Food & Beverage Beverages Distillers & Vintners Food, Beverage & Tobacco
Consumer
Goods
Food & Beverage Beverages Soft Drinks Food, Beverage &
Tobacco
Consumer
Goods
Food & Beverage Food Producers Farming, Fishing &
Plantations
Food, Beverage &
Tobacco
Consumer Goods
Food & Beverage Food Producers Food Products Food, Beverage & Tobacco
Consumer Goods
Personal & Household Goods
Tobacco Tobacco Food, Beverage & Tobacco
Health Care Health Care Health Care Equipment
& Services
Medical Equipment Health Care
Equipment & Services
Health Care Health Care Health Care Equipment
& Services
Medical Supplies Health Care
Equipment & Services
Health Care Health Care Health Care Equipment & Services
Health Care Providers Health Care Providers
Consumer
Goods
Personal &
Household Goods
Household Goods &
Home Construction
Nondurable Household
Products
Personal Products
Consumer
Goods
Personal &
Household Goods
Personal Goods Personal Products Personal Products
Financials Insurance Nonlife Insurance Full Line Insurance Insurance
Financials Insurance Nonlife Insurance Insurance Brokers Insurance
Financials Insurance Nonlife Insurance Property & Casualty Insurance
Insurance
Financials Insurance Nonlife Insurance Reinsurance Insurance
Financials Insurance Life Insurance Life Insurance Insurance
Technology Technology Software & Computer
Services
Internet Internet
Technology Technology Software & Computer Services
Computer Services Computer Services
Industrials Industrial Goods & Services
Industrial Engineering Commercial Vehicles & Trucks
Commercial Vehicles & Machinery
Industrials Industrial Goods &
Services
Industrial Engineering Industrial Machinery Commercial Vehicles
& Machinery
Consumer
Services
Media Media Broadcasting &
Entertainment
Media
Consumer Services
Media Media Media Agencies Media
Consumer Services
Media Media Publishing Media
Oil & Gas Oil & Gas Oil & Gas Producers Exploration & Production Oil & Gas
Oil & Gas Oil & Gas Oil & Gas Producers Integrated Oil & Gas Oil & Gas
Health Care Health Care Pharmaceuticals &
Biotechnology
Biotechnology Pharmaceuticals &
Biotech
Health Care Health Care Pharmaceuticals & Biotechnology
Pharmaceuticals Pharmaceuticals & Biotech
Financials Real Estate Real Estate Investment & Services
Real Estate Holding & Development
Real Estate
2018 JUST Capital Ranking Methodology
Copyright © 2018 JUST Capital Foundation, Inc. All rights reserved. Table of Contents – 53
Financials Real Estate Real Estate Investment
& Services
Real Estate Services Real Estate
Financials Real Estate Real Estate Investment Trusts
Specialty REITs Real Estate
Consumer Services
Retail General Retailers Apparel Retailers Retail
Consumer
Services
Retail General Retailers Broadline Retailers Retail
Consumer
Services
Retail General Retailers Home Improvement
Retailers
Retail
Consumer Services
Retail General Retailers Specialized Consumer Services
Retail
Consumer Services
Retail General Retailers Specialty Retailers Retail
Oil & Gas Oil & Gas Alternative Energy Renewable Energy
Equipment
Semiconductors &
Equipment
Technology Technology Technology Hardware
& Equipment
Semiconductors Semiconductors &
Equipment
Technology Technology Software & Computer Services
Software Software
Technology Technology Technology Hardware & Equipment
Computer Hardware Technology Hardware
Technology Technology Technology Hardware
& Equipment
Electronic Office
Equipment
Technology
Hardware
Technology Technology Technology Hardware
& Equipment
Telecommunications
Equipment
Technology
Hardware
Telecommunications
Telecommunications
Fixed Line Telecommunications
Fixed Line Telecommunications
Telecommunications
Telecommunications
Telecommunications
Mobile Telecommunications
Mobile Telecommunications
Telecommunications
Industrials Industrial Goods &
Services
Industrial
Transportation
Delivery Services Transportation
Industrials Industrial Goods &
Services
Industrial
Transportation
Marine Transportation Transportation
Industrials Industrial Goods & Services
Industrial Transportation
Railroads Transportation
Industrials Industrial Goods & Services
Industrial Transportation
Transportation Services Transportation
Industrials Industrial Goods &
Services
Industrial
Transportation
Trucking Transportation
Consumer
Services
Travel & Leisure Travel & Leisure Airlines Transportation
Utilities Utilities Electricity Conventional Electricity Utilities
Utilities Utilities Electricity Alternative Electricity Utilities
Utilities Utilities Gas, Water & Multi-utilities
Gas Distribution Utilities
Utilities Utilities Gas, Water & Multi-
utilities
Multi-utilities Utilities
Utilities Utilities Gas, Water & Multi-
utilities
Water Utilities

2018 JUST Capital Ranking Methodology
Copyright © 2018 JUST Capital Foundation, Inc. All rights reserved. Table of Contents – 54
19 Appendix B: Companies Excluded from the Rankings
The table below is a complete list of companies excluded from our Rankings as of November 28, 2018. An
explanation of the reasons for exclusion are set out in Section 9 Ranked Companies.
Ticker Name Reason for exclusion
AET AETNA INC Acquired
AGNC AGNC INVESTMENT REIT with fewer than 1,000 employees
ANDV ANDEAVOR Acquired
APLE APPLE HOSPITALITY REIT REIT with fewer than 1,000 employees
ARD ARDAGH GROUP SA No 10-K
ARE ALEXANDRIA REAL ESTATE REIT with fewer than 1,000 employees
BDN BRANDYWINE REALTY TRUST REIT with fewer than 1,000 employees
BF.A BROWN FORMAN CORP CL A Multiple share classes
BRX BRIXMOR PROPERTY GROUP REIT with fewer than 1,000 employees
BXP BOSTON PROPERTIES INC REIT with fewer than 1,000 employees
CA CA INC Acquired
CAVM CAVIUM INC Acquired
CIM CHIMERA INVESTMENT CORP REIT with fewer than 1,000 employees
CLNS COLONY NORTHSTAR INC REIT with fewer than 1,000 employees
COL ROCKWELL COLLINS INC Acquired
CONE CYRUSONE INC REIT with fewer than 1,000 employees
COR CORESITE REALTY CORP REIT with fewer than 1,000 employees
CPA COPA HOLDINGS SA No 10-K
CXP COLUMBIA PPTY TR INC REIT with fewer than 1,000 employees
DCT DCT INDUSTRIAL TRUST INC REIT with fewer than 1,000 employees
DDR DDR CORP REIT with fewer than 1,000 employees
DEI DOUGLAS EMMETT INC REIT with fewer than 1,000 employees
DISCK DISCOVERY INC SERIES C Multiple share classes
DOX AMDOCS LTD No 10-K

2018 JUST Capital Ranking Methodology
Copyright © 2018 JUST Capital Foundation, Inc. All rights reserved. Table of Contents – 55
DRE DUKE REALTY CORP REIT with fewer than 1,000 employees
DVMT DELL TECHNOLOGIES Holding company
EGN ENERGEN CORP Acquired
EPR EPR PROPERTIES REIT with fewer than 1,000 employees
EQC EQUITY COMMONWEALTH REIT with fewer than 1,000 employees
ESRT EMPIRE STATE REALTY REIT with fewer than 1,000 employees
EVHC ENVISION HEALTHCARE CORP Acquired
FCE.A FOREST CITY REALTY TRUST Acquired
FOXA 21ST CENTURY FOX CL A Multiple share classes
FRT FEDERAL REALTY INVT REIT with fewer than 1,000 employees
FWONA LIBERTY FORMULA 1 SER A Multiple share classes
GGP GGP INC Acquired
GLPI GAMING AND LEISURE PPTYS REIT with fewer than 1,000 employees
GOOGL ALPHABET INC CL A Multiple share classes
HCP HCP INC REIT with fewer than 1,000 employees
HEI.A HEICO CORP CL A Multiple share classes
HIW HIGHWOODS PROPERTIES INC REIT with fewer than 1,000 employees
HPP HUDSON PAC PPTYS INC REIT with fewer than 1,000 employees
HPT HOSPITALITY PPTYS TRUST REIT with fewer than 1,000 employees
HST HOST HOTELS & RESORTS REIT with fewer than 1,000 employees
HTA HEALTHCARE TR AMER INC REIT with fewer than 1,000 employees
IGT INTERNATIONAL GAME TECH No 10-K
JBGS JBG SMITH PROPERTIES REIT with fewer than 1,000 employees
KIM KIMCO REALTY CORP REIT with fewer than 1,000 employees
KRC KILROY REALTY CORP REIT with fewer than 1,000 employees
LBRDA LIBERTY BROADBAND CL A Holding company
LBRDK LIBERTY BROADBAND CL C Holding company
LEN.B LENNAR CORP CL B Multiple share classes
LGF.B LIONS GATE ENT CLASS B Multiple share classes
LPT LIBERTY PROPERTY TRUST REIT with fewer than 1,000 employees
LSXMA LIBERTY SIRIUSXM SER A Holding company

2018 JUST Capital Ranking Methodology
Copyright © 2018 JUST Capital Foundation, Inc. All rights reserved. Table of Contents – 56
LSXMK LIBERTY SIRIUSXM SER C Holding company
MAC MACERICH CO REIT with fewer than 1,000 employees
MFA MFA FINANCIAL INC REIT with fewer than 1,000 employees
MPW MEDICAL PROPERTIES TRUST REIT with fewer than 1,000 employees
NLY ANNALY CAPITAL MGMT INC REIT with fewer than 1,000 employees
NNN NATIONAL RETAIL PPTYS REIT with fewer than 1,000 employees
NRZ NEW RESIDENTIAL INVT REIT with fewer than 1,000 employees
NWSA NEWS CORP CL A Multiple share classes
NXPI NXP SEMICONDUCTORS NV No 10-K
O REALTY INCOME CORP REIT with fewer than 1,000 employees
OFC CORPORATE OFFICE PPTYS REIT with fewer than 1,000 employees
OHI OMEGA HEALTHCARE INVS REIT with fewer than 1,000 employees
PF PINNACLE FOODS INC Acquired
PGRE PARAMOUNT GROUP INC REIT with fewer than 1,000 employees
PK PARK HOTELS & RESORTS REIT with fewer than 1,000 employees
PM PHILIP MORRIS INTL No significant number of U.S. employees
PX PRAXAIR INC Acquired
QGEN QIAGEN NV No 10-K
REG REGENCY CENTERS CORP REIT with fewer than 1,000 employees
RPAI RETAIL PPTYS AMER INC REIT with fewer than 1,000 employees
RSPP RSP PERMIAN INC Acquired
RYN RAYONIER INC REIT with fewer than 1,000 employees
SNH SENIOR HOUSING PPTYS TR REIT with fewer than 1,000 employees
SRC SPIRIT RLTY CAP INC REIT with fewer than 1,000 employees
STOR STORE CAPITAL CORP REIT with fewer than 1,000 employees
STWD STARWOOD PPTY TRUST INC REIT with fewer than 1,000 employees
TCO TAUBMAN CENTERS INC REIT with fewer than 1,000 employees
TEAM ATLASSIAN CORP PLC No 10-K
TWO TWO HBRS INVT CORP REIT with fewer than 1,000 employees
TWX TIME WARNER INC Acquired
UAA UNDER ARMOUR CLASS A Multiple share classes

2018 JUST Capital Ranking Methodology
Copyright © 2018 JUST Capital Foundation, Inc. All rights reserved. Table of Contents – 57
UNIT UNITI GROUP INC REIT with fewer than 1,000 employees
VER VEREIT INC REIT with fewer than 1,000 employees
VIAB VIACOM INC CL B Multiple share classes
VICI VICI PROPERTIES INC REIT with fewer than 1,000 employees
VR VALIDUS HOLDINGS LTD Acquired
VTR VENTAS INC REIT with fewer than 1,000 employees
WELL WELLTOWER INC REIT with fewer than 1,000 employees
WPC W P CAREY INC REIT with fewer than 1,000 employees
WRI WEINGARTEN RLTY INVS REIT with fewer than 1,000 employees
XL XL GROUP LTD Acquired
YUMC YUM CHINA HOLDINGS INC No significant number of U.S. employees
ZG ZILLOW GROUP INC CLASS A Multiple share classes

2018 JUST Capital Ranking Methodology
Copyright © 2018 JUST Capital Foundation, Inc. All rights reserved. Table of Contents – 58
20 Appendix C: 2018 Components, Metrics, and Data Points
The following pages provide a complete overview of Issues, Components, Metrics, and Data Points.
20.1 Workers (25%)
The Workers Issue evaluates how a company treats its employees, including pay, benefits, and working conditions. Our survey and focus groups identified that the American population cared about issues we did not specifically measure in 2017, such as whether a company has a paid parental leave policy, tuition reimbursement policy, and an outplacement services policy. In 2018, our model integrates these new Data Points into the model. We also found a better way to measure a company’s commitment to ensuring a safe workplace, and are now collecting this data in-house rather than using a third-party vendor.
20.1.1 Provides Workers with Good Benefits Package
Company offers quality healthcare insurance, retirement planning (401k), and paid time off (vacation, sick, and parental leave) for all its workers.
Metric Name Data Name Data Definition Data Source
Date(s) Geo-graphy
Unit of Measure-ment
Metric Varia-ble
Metric Logic
Missing Data
Scaling
Provision of Worker Benefits
Packages
Paid Time Off Policy
An assessment of the company's disclosure of its paid time off policy.
Companies are scored from 0 to 10 and receive a 0 for no disclosure, 5 for boilerplate disclosure, and 10 for detailed
disclosure.
Company filings and other public
documents
Latest year available (2016, 2017,
2018)
U.S. Score (0, 5, or 10)
a a+b None None
Paid Parental
Leave Policy
An assessment of the company's disclosure of its paid
parental leave policy. Companies are scored from 0 to 10 and receive a 0 for no
disclosure, 5 for boilerplate disclosure, and 10 for detailed disclosure.
Company
filings and other public
documents
Latest year
available (2016, 2017,
2018)
U.S. Score (0,
5, or 10)
b a+b None None
Benefits and 401k Quality Assessment
Benefits Quality Rating
A score based on crowd-sourced ratings of the company's benefits (including health and retirement benefits), measured on a five-point scale by current and former
employees.
Crowd-sourced company
review platforms
2015 - 2018 U.S. Score (0-5)
a a *.75 + (b / 20)*.
25
Industry Mean
None

2018 JUST Capital Ranking Methodology
Copyright © 2018 JUST Capital Foundation, Inc. All rights reserved. Table of Contents – 59
401k Score An assessment of the quality of the company's 401k plan, based on cost, participation rates, salary deferrals, and
performance.
Brightscope Most recent plan
assessment (2012-2017)
U.S. Score (0-100)
b a *.75 + (b /
20)*.25
Industry Mean
None
Commitment
to Education & Training
Career
Development Policy
An assessment of whether the company has a policy to
support the career development and/or skills training of its employees.
Company
filings and other public
documents
Latest year
available (2016, 2017,
2018)
U.S. True (1)
or False (0)
a a+b None None
Tuition
Reimburse-ment Policy
An assessment of whether the company offers tuition
reimbursements to its employees. Companies that offer tuition reimbursements receive a score of 1, and companies
that don’t receive a 0.
Company
filings and other public
documents
Latest year
available (2016, 2017,
2018)
U.S. True (1)
or False (0)
b a+b None None
Career
Opportuni-ties
Career
Opportunities Rating
A score based on crowd-sourced ratings of the company's
career opportunities, measured on a five-point scale by current and former employees.
Crowd-
sourced company review
platforms
2015 - 2018 U.S. Score (0-
5)
a a Industry
Mean
None
20.1.2 Pays a living wage
Company pays wages that cover local needs for food, housing, and medical care, and adjusts for cost of living increases.
Metric Name Data Name Data Definition Data
Source
Date(s) Geogra-
phy
Unit of
Measure-ment
Metric
Varia-ble
Metric
Logic
Missing
Data
Scaling
Employee
Living Wage Ratio
Percentage of
workers making a
living wage
The estimated percentage of employees at the company
making a living wage. Wage, employment, and job title distribution estimates for
each company are calculated according to the Branch Model methodology, using a combination of crowd-sourced salary
respondent data, BLS national wage averages, and publicly available company documents. We use county-level living wage profiles generated by the MIT Living Wage Calculator
for the average Census family.
Crowd-
sourced company
review platforms,
Bureau of Labor Statistics,
MIT Living Wage
Calculator
2013 - 2018 U.S. Percent-
age
a A None None

2018 JUST Capital Ranking Methodology
Copyright © 2018 JUST Capital Foundation, Inc. All rights reserved. Table of Contents – 60
20.1.3 Provides a safe workplace
Company protects its workers from harmful and hazardous conditions by adhering to workplace health and safety standards and practices.
Metric Name Data Name Data Definition Data Source
Date(s) Geogra-phy
Unit of Measure-
ment
Metric Varia-
ble
Metric Logic
Missing Data
Scaling
Controver-
sies in Workplace
Safety as Reported in
the Media
Occupational
Safety and Health
Controversies
The number of cases (severe controversies deemed major
scandals or systematic risk incidents by RepRisk) occurring in the U.S. that pertain to occupational health and safety issues,
as reported by influential and highly influential news sources over the past three years. RepRisk: Due Diligence on ESG
and Business Conduct www.reprisk.com.
RepRisk May 2015 -
May 2018
U.S. Number a a None Revenue
Worker Safety Fines
U.S. Occupational
Safety and Health
Administration and Mine
Safety and Health
Administra-tion
Any fines over the past three years from the Occupational Safety and Health Administration and Mine Safety and Health
Administration. Violation Tracker produced by the Corporate Research Project of Good Jobs First.
Good Jobs First
May 2015 - May 2018
U.S. U.S. Dollars
a a None Revenue
Commitment
to Ensuring a Safe
Workplace
Employee
Health & Safety Policy
An assessment of whether the company has established a
policy to improve employee health and safety.
Company
filings and other public
documents
Latest year
available (2016,
2017, 2018)
U.S. True (1)
or False (0)
a a+b+
c+d
None None
Employee Health &
Safety Team
An assessment of whether the company has established an employee health and safety team.
Company filings and
other public documents
Latest year available
(2016, 2017,
2018)
U.S. True (1) or False
(0)
b a+b+c+d
None None
Health & Safety
Training
An assessment of whether the company trains its executives or key employees on health and safety.
Company filings and
other public documents
Latest year available
(2016, 2017,
2018)
U.S. True (1) or False
(0)
c a+b+c+d
None None

2018 JUST Capital Ranking Methodology
Copyright © 2018 JUST Capital Foundation, Inc. All rights reserved. Table of Contents – 61
Health & Safety
Management Systems
An assessment of whether the company has health and safety management systems in place, such as the OSHAS
18001 (Occupation Health & Safety Management System).
Company filings and
other public documents
Latest year available
(2016, 2017, 2018)
U.S. True (1) or False
(0)
d a+b+c+d
None None
Total Recordable
Incident Rate
Total Recordable
Incident Rate (TRIR)
The total number of recordable incidents, per 200,000 hours worked (equivalent to 100 full-time employees annually). The
value presented is for the company's most recently reported year.
Company filings and
other public documents
Latest year available
(2016, 2017, 2018)
Global Incidents per 100
FTE employ-ees
annually
a a 0 None
20.1.4 Pays a fair wage for industry and job level
Company pays wages appropriate for qualifications, experience, performance, and employee contribution in line with industry averages.
Metric Name Data Name Data Definition Data Source
Date(s) Geogra-phy
Unit of Measure-
ment
Metric Varia-
ble
Metric Logic
Missing Data
Scaling
Wage
Violations
U.S.
Department of Labor Wage and
Hour Compliance
Any back wage amounts and/or civil penalties over the past
three years, assessed by the Department of Labor's Wage and Hour Division. Violation Tracker produced by the Corporate Research Project of Good Jobs First.
Good Jobs
First
May 2015 -
May 2018
U.S. U.S.
Dollars
a a None Revenue
Fair Pay Rating
Fair Pay Rating by
Industry and Job Level
A score based on crowd-sourced ratings of the company's overall compensation, factoring in bonuses/benefits,
measured on a five-point scale by current and former employees.
Crowd-sourced
company review
platforms
2015 - 2018
U.S. Score (0-5)
a a Industry Mean
None

2018 JUST Capital Ranking Methodology
Copyright © 2018 JUST Capital Foundation, Inc. All rights reserved. Table of Contents – 62
Fair Pay Percent
Fair Pay Score by Industry
and Job Level
A comparison of company wages to industry peers' by job title, adjusted by a county-level purchasing power index.
JUST Capital's wage analysis uses crowdsourced reviews of company wages that have been subdivided into 2,340
occupation classifications to allow cross-company comparisons. For each of the sectors being reviewed, JUST
Capital compares wages by title (using a minimum of 10 salary reviews per title) to determine how each company
pays its employees in real terms relative to its peers. Each company’s score is based on comparisons by title and
assigned a numerical score based on the highest real wage (e.g. a company with the highest real wage score out of 10
companies will get a 10 out of 10). Scores for each title are then summed and divided by the maximum possible total to produce a score that represents how each company
compares to its industry group.
Crowd-sourced
company review platforms
and U.S. Department
of Labor (H-1B
Visas)
2013 - 2018
U.S. Score (1-100)
a a Industry Mean
None
20.1.5 Does not discriminate in pay
Company is committed to pay equity across race, religion, gender, age, ethnicity, sexual orientation, disability status, and other such characteristics.
Metric Name Data Name Data Definition Data Source
Date(s) Geogra-phy
Unit of Measure-
ment
Metric Varia-
ble
Metric Logic
Missing Data
Scaling
Commitment
to Promoting Employment Equity
Pay Equity
Policy
An assessment of the company's commitment to gender pay
equity. Companies are scored from 0 to 10, and receive a 0 for no evidence of commitment, 5 for conducting a pay equity
analysis or committing to conduct a pay equity analysis (as a signatory to the UN Women's Empowerment Principles), or
10 if the company has made public the results of their gender pay equity analysis.
Company
filings and other public documents
Latest year
available (2016, 2017,
2018)
U.S. Score (0,
5, or 10)
a a None None
20.1.6 Adheres to equal opportunity workplace policies
Company does not base personnel decisions (including firing, hiring, promotions, grievances, and layoffs) on race, religion, gender, age, ethnicity, sexual orientation, disability status, or other such characteristics, and actively recruits a diverse workforce.

2018 JUST Capital Ranking Methodology
Copyright © 2018 JUST Capital Foundation, Inc. All rights reserved. Table of Contents – 63
Metric Name Data Name Data Definition Data Source
Date(s) Geogra-phy
Unit of Measure-
ment
Metric Varia-
ble
Metric Logic
Missing Data
Scaling
Legal Convictions
in Employment
Discrimina-tion as
Reported in the Media
Discrimination in
Employment Controversies
The number of cases (severe controversies deemed major scandals or systematic risk incidents by RepRisk) occurring in
the U.S. that pertain to discrimination in employment, as reported by influential and highly influential news sources
over the past three years. RepRisk: Due Diligence on ESG and Business Conduct www.reprisk.com.
RepRisk May 2015 - May 2018
U.S. Number a a None Revenue
EEOC Violations
and Worker Grievance Fines
Equal Employment
Opportunity Commission and Worker
Grievance Fines
Any fines over the past three years from the Equal Employment Opportunity Commission and the Justice
Department's Civil Rights Division. Violation Tracker produced by the Corporate Research Project of Good Jobs First.
Good Jobs First
May 2015 - May 2018
U.S. US Dollars
a a None Revenue
Commitment to Equal
Opportunity Workplace
Policies
Diversity and Opportunity
Policy
An assessment of whether the company has a policy to drive diversity and equal opportunity.
Company filings and
other public documents
Latest year available
(2016, 2017,
2018)
U.S. True (1) or False
(0)
a a+b+c
None None
Diversity and Opportunity
Targets
An assessment of whether the company has set targets or objectives on diversity and equal opportunity.
Company filings and
other public documents
Latest year available
(2016, 2017,
2018)
U.S. True (1) or False
(0)
b a+b+c
None None
Outplacement Services
Policy
An assessment of whether the company provides outplacement services for employees leaving the company
(e.g. help on resume, networking, finding job postings, mock interviews).
Company filings and
other public documents
Latest year available
(2016, 2017,
2018)
U.S. True (1) or False
(0)
c a+b+c
None None

2018 JUST Capital Ranking Methodology
Copyright © 2018 JUST Capital Foundation, Inc. All rights reserved. Table of Contents – 64
20.1.7 Promotes work-life balance
Company supports workers' needs for flexible working arrangements, workplace health and wellness, and balance with personal life situations.
Metric Name Data Name Data Definition Data Source
Date(s) Geogra-phy
Unit of Measure-
ment
Metric Varia-
ble
Metric Logic
Missing Data
Scaling
Commitment
to Work-Life Balance
Flexible
Working Hours Policy
An assessment of whether the company states that it
provides flexible working hours or working hours that promote a work-life balance.
Company
filings and other public
documents
Latest year
available (2016,
2017, 2018)
U.S. True (1)
or False (0)
a a+b None None
Day Care Services
An assessment of whether the company states that it provides day care services for its employees.
Company filings and
other public documents
Latest year available
(2016, 2017,
2018)
U.S. True (1) or False
(0)
b a+b None None
Crowdsour-ced Work-
Life Balance
Work-Life Balance
Rating
A score based on crowd-sourced ratings of the company's work-life balance, measured on a five-point scale by current
and former employees.
Crowd-sourced
company review
platforms
2015 - 2018
U.S. Score (0-5)
a a Industry Mean
None

2018 JUST Capital Ranking Methodology
Copyright © 2018 JUST Capital Foundation, Inc. All rights reserved. Table of Contents – 65
20.1.8 Creates a responsive and transparent workplace culture
Company facilitates a positive culture and open communication at all levels of the organization, and gives workers the freedom to engage in collective bargaining.
Metric Name Data Name Data Definition Data
Source
Date(s) Geogra-
phy
Unit of
Measure-ment
Metric
Varia-ble
Metric
Logic
Missing
Data
Scaling
Commitment to Employee Respect
Freedom of Association Policy
An assessment of whether the company discloses freedom of association and collective bargaining policies.
Company filings and other public
documents
Latest year available (2016,
2017, 2018)
U.S. True (1) or False (0)
a a None None
Senior Management Rating
A score based on crowd-sourced ratings of the company's senior management, measured on a five-point scale by current and former employees.
Crowd-sourced company
review platforms
2015 - 2018
U.S. Score (0-5)
a a Industry Mean
None

2018 JUST Capital Ranking Methodology
Copyright © 2018 JUST Capital Foundation, Inc. All rights reserved. Table of Contents – 66
20.2 Customers (18%)
The Customers Issue measures how a company treats its customers, including providing a positive experience and protecting their privacy. In an effort to increase
data quality and coverage, we changed our data sources for evaluating customer service ratings. We rely on crowd-sourced reviews of customer experience, and the combination of the sources has increased our coverage.
20.2.1 Treats customers fairly
Company does not discriminate based on race, religion, gender, age, ethnicity, sexual orientation, or disability status, and strives to meet the needs of diverse
customers when possible.
Metric Name
Data Name Data Definition Data Source
Date(s) Geogra-phy
Unit of Measure-
ment
Metric Varia-
ble
Metric Logic
Missing Data
Scaling
Contro-
versies in Customer Discrimi-
nation
Customer
Discrimination Controversies
The number of cases (severe controversies deemed major
scandals or systematic risk incidents by RepRisk) occurring in the U.S. that pertain to customer discrimination, as reported by influential and highly influential news sources
over the past three years. RepRisk: Due Diligence on ESG and Business Conduct www.reprisk.com.
RepRisk May 2015 -
May 2018
U.S. Number a a None Revenue
Sales Terms
Fines and Violations
Consumer Protection Fines
Any fines incurred over the past three years from the Consumer Financial Protection Bureau and the
Transportation Department Aviation Consumer Protection Division. Violation Tracker produced by the Corporate
Research Project of Good Jobs First.
Good Jobs First
May 2015 - May 2018
U.S. U.S. Dollars
a a None Revenue

2018 JUST Capital Ranking Methodology
Copyright © 2018 JUST Capital Foundation, Inc. All rights reserved. Table of Contents – 67
20.2.2 Protects customer privacy
Company has transparent customer privacy policies and securely stores customers' personally-identifiable information.
Metric
Name
Data Name Data Definition Data
Source
Date(s) Geogra-
phy
Unit of
Measure-ment
Metric
Varia-ble
Metric
Logic
Missing
Data
Scaling
Contro-versies in
Customer Privacy
Data Privacy Controversies
The number of cases (severe controversies deemed major scandals or systematic risk incidents by RepRisk) occurring
globally that pertain to privacy violations, as reported by influential and highly influential news sources over the past
three years. RepRisk: Due Diligence on ESG and Business Conduct www.reprisk.com.
RepRisk May 2015 - May 2018
U.S. Number a a None Revenue
Customer
Privacy Rating
Customer Privacy
Rating
An assessment of the company's disclosure of customer
privacy practices. A score of 10 indicates a high level of disclosure, and a score of 0 indicates little or no disclosure.
Institutional
Shareholder Services
Latest year
available (2016,
2017, 2018)
Global Score (0,
5, or 10)
a a 5 None
20.2.3 Is truthful in advertising
Company is honest and does not provide misleading information about its products and services in any communications.
Metric
Name
Data Name Data Definition Data
Source
Date(s) Geogra-
phy
Unit of
Measure-ment
Metric
Varia-ble
Metric
Logic
Missing
Data
Scaling
Advertis-ing Fines
and Violations
Federal Trade Commission Fines
Any fines incurred over the past three years from the Federal Trade Commission. Violation Tracker produced by
the Corporate Research Project of Good Jobs First.
Good Jobs First
May 2015 - May 2018
U.S. U.S. Dollars
a a None Revenue

2018 JUST Capital Ranking Methodology
Copyright © 2018 JUST Capital Foundation, Inc. All rights reserved. Table of Contents – 68
20.2.4 Provides positive customer service experiences
Company communicates responsively, has clear sales and return policies, and follows up to resolve customer issues.
Metric Name
Data Name Data Definition Data Source
Date(s) Geogra-phy
Unit of Measure-
ment
Metric Varia-
ble
Metric Logic
Missing Data
Scaling
Customer
Service Rating
Customer Service
Rating
A compilation score based on publicly-available net
promoter scores and survey data. Scores are standardized onto the -100 to 100 NPS scale. Where scores from multiple
sources are available, they are averaged with equal weight. If only one score is available, it stands alone. Sources
include YouGov ratings, found at link: https://today.yougov.com/ratings/overview.
Customer
Guru; YouGov
Latest year
available (2016,
2017, 2018)
U.S. Score (-
100 to 100)
a a Industry
Mean
None

2018 JUST Capital Ranking Methodology
Copyright © 2018 JUST Capital Foundation, Inc. All rights reserved. Table of Contents – 69
20.3 Products (14%)
The Products Issue evaluates characteristics of the company’s products and services, including price, quality, benefit or harm to the consumer, and importance to
their daily life. In 2018, we changed the way we assess whether companies make products that are beneficial to health, environment, or society. This year, we polled the American public to determine what were more or less just products, and we scored companies based on whether they offer such products. This year we also improved our methodology for recalled products. We now include in our analysis the number of incidents reported, the number of products recalled, the company’s overall revenue and its responsiveness (how many months the product was on the market). This new approach provides a better way to level the
playing field and reflect the scale of the recall.
20.3.1 Makes quality products
Company provides products and services that are reliable, safe, and durable.
Metric
Name
Data Name Data Definition Data
Source
Date(s) Geogra-
phy
Unit of
Measure-ment
Metric
Varia-ble
Metric
Logic
Missing
Data
Scaling
Product
Recalls
Product Recall
Disclosure
The number and types of recalls formally announced by the
company on the Consumer Product Safety Commission, Food and Drug Administration, and other publicly available
recall websites, as well as those captured by RepRisk for automobiles over the last three years. Companies are scored on a 0 to 6 scale, with scores of 0 representing no recalls in
this time period, 1 given for minor recalls with no human impact, and scores of 6 for the most severe or significant
recall(s) with major human impact, including deaths. RepRisk: Due Diligence on ESG and Business Conduct
www.reprisk.com.
Consumer
Product Safety
Commission Food and Drug
Administra-tion and
RepRisk for auto recalls
May 2015 -
May 2018
U.S. Score (0-
6)
a a Zero None
Product
Fines
Product Safety
Fines
Any fines incurred over the past three years from the
Consumer Product Safety Commission, the U.S. Food and Drug Administration, National Highway Traffic Safety
Administration referral to the Justice Department, and National Highway Traffic Safety Administration. Violation Tracker produced by the Corporate Research Project of
Good Jobs First.
Good Jobs
First
May 2015 -
May 2018
U.S. U.S.
Dollars
a a None Revenue

2018 JUST Capital Ranking Methodology
Copyright © 2018 JUST Capital Foundation, Inc. All rights reserved. Table of Contents – 70
20.3.2 Makes products that are beneficial to health, environment or society
Company makes products or offers services that are beneficial and non-harmful to health, environment, or society.
Metric Name
Data Name Data Definition Data Source
Date(s) Geogra-phy
Unit of Measure-
ment
Metric Varia-
ble
Metric Logic
Missing Data
Scaling
Commit-ment to
Produ-cing
Beneficial and Non-
Harmful Products
Health and Environmental
Controversies
The number of cases (severe controversies deemed major scandals or systematic risk incidents by RepRisk) occurring
in the U.S. that pertain to companies' products and services, as reported by influential and highly influential news sources
over the past three years. RepRisk: Due Diligence on ESG and Business Conduct www.reprisk.com.
RepRisk May 2015 - May 2018
U.S. Number a a None Revenue
Beneficial and Non-Harmful
Products Assess-
ment
Product Benefit Assessment
An industry-specific assessment of products and services that are beneficial to health, environment, or society. The final score is an aggregate of public surveys, conducted by
JUST Capital, which assess whether 32 different products and services contribute to product benefit or harm. Products
are mapped to ICB Subsectors and include tobacco, pharmaceuticals, food staples, military weapons, gasoline,
and key parts of automobile, fast food, health insurance, renewable energy, and entertainment services.
JUST Capital
2018 Global Score (0-10)
a a None None
20.3.3 Provides fair pricing
Company provides products and services of good value, and does not price unfairly when options are limited.
Metric Name
Data Name Data Definition Data Source
Date(s) Geogra-phy
Unit of Measure-
ment
Metric Varia-
ble
Metric Logic
Missing Data
Scaling
Anti-competi-
tive Practices
Anti-competitive Practices
Controversies
The number of cases (severe controversies deemed major scandals or systematic risk incidents by RepRisk) occurring
in the U.S. that pertain to anti-competitive practices, as reported by influential and highly influential news sources
over the past three years. RepRisk: Due Diligence on ESG and Business Conduct www.reprisk.com.
RepRisk May 2015 - May 2018
U.S. Number a a None Revenue

2018 JUST Capital Ranking Methodology
Copyright © 2018 JUST Capital Foundation, Inc. All rights reserved. Table of Contents – 71
20.3.4 Is accurate in labelling
Company provides products and services that have clear, accurate, and informative labeling.
Metric Name
Data Name Data Definition Data Source
Date(s) Geogra-phy
Unit of Measure-
ment
Metric Varia-
ble
Metric Logic
Missing Data
Scaling
Mislead-ing
Commu-nication
Misleading Communication
Controversies
The number of cases (severe controversies deemed major scandals or systematic risk incidents by RepRisk) occurring
in the U.S. that pertain to misleading communication, as reported by influential and highly influential news sources over the past three years. RepRisk: Due Diligence on ESG
and Business Conduct www.reprisk.com.
RepRisk May 2015 - May 2018
U.S. Number a a None Revenue

2018 JUST Capital Ranking Methodology
Copyright © 2018 JUST Capital Foundation, Inc. All rights reserved. Table of Contents – 72
20.4 Environment (13%)
The Environment Issue evaluates a company’s impact on the environment, including pollution and overall environmental responsibility. Measurement on this Issue
changed substantially this year. We discontinued use of third-party data that aggregated performance across a range of environmental criteria and switched to sources that provide more specific coverage. We changed vendors for the Minimizes Pollution Component to allow us to have a more comprehensive view of companies’ greenhouse gas emissions. In 2018, we stopped measuring companies’ overall water usage and instead honed in on measuring their chemical (cancerous and non-cancerous) water discharge. We also stopped measuring electricity and fuel usage, focusing more on pollution outputs instead of resource
inputs. This benefited some water- and electricity-intensive industries, such as Utilities, Industrials, and Basic Resources.
20.4.1 Has policies and practices to protect the environment
Company has environmental management policies and systems in place to ensure best practice across all operations.
Metric
Name
Data Name Data Definition Data
Source
Date(s) Geogra-
phy
Unit of
Measure-ment
Metric
Varia-ble
Metric
Logic
Missing
Data
Scaling
Contro-versies in
Environ-mental
Respon-sibility as
Reported in the Media
Environmental Controversies
The number of cases (severe controversies deemed major scandals or systematic risk incidents by RepRisk) occurring
globally that pertain to waste issues, overuse and wasting of resources, local pollution, impacts on
ecosystems/landscapes, and/or global pollution (including climate change and GHG emissions), as reported by
influential and highly influential news sources over the past three years. RepRisk: Due Diligence on ESG and Business Conduct www.reprisk.com.
RepRisk May 2015 - May 2018
Global Number a a None Revenue
Environ-mental
Fines
Environmental Fines
Any fines incurred over the past three years from the Environmental Protection Agency, Energy Department Office
of Enforcement, Bureau of Safety and Environmental Enforcement, Pipeline and Hazardous Materials Safety
Administration, Environmental Protection Agency referral to the Justice Department, National Oceanic and Atmospheric
Administration referral to the Justice Department, U.S. Coast Guard referral to the Justice Department, U.S. Fish and Wildlife Service referral to the Justice Department,
Energy Department referral to the Justice Department, Federal Energy Regulatory Commission, Interior Department
Office of Natural Resources Revenue, and/or Environmental
Good Jobs First
May 2015 - May 2018
U.S. USD a a None Revenue

2018 JUST Capital Ranking Methodology
Copyright © 2018 JUST Capital Foundation, Inc. All rights reserved. Table of Contents – 73
Protection Agency civil settlements. Violation Tracker produced by the Corporate Research Project of Good Jobs
First.
Environmental
Manage-ment
Systems and
Disclo-sure
Risk and Opportunity
Management
An assessment of whether the company discloses risk and opportunity management as part of its environmental
management systems.
A score of 1 indicates a high level of disclosure and a score of 10 indicates little or no disclosure.
Institutional Shareholder
Services
Latest year available
(2016, 2017,
2018)
Global Score (1-10)
a a+b+c
10 None
Carbon and Climate
Management
An assessment of whether the company discloses carbon and climate management as part of its environmental
management systems.
A score of 1 indicates a high level of disclosure and a score of 10 indicates little or no disclosure.
Institutional Shareholder
Services
Latest year available
(2016, 2017,
2018)
Global Score (1-10)
b a+b+c
10 None
Natural Resource Management
An assessment of whether the company discloses natural resource management as part of its environmental
management systems.
A score of 1 indicates a high level of disclosure and a score of 10 indicates little or no disclosure.
Institutional Shareholder
Services
Latest year available
(2016, 2017,
2018)
Global Score (1-10)
c a+b+c
10 None
20.4.2 Uses environmental resources efficiently
Company recycles, minimizes use of nonrenewable energy and resources, and reduces product-related waste.
Metric Name
Data Name Data Definition Data Source
Date(s) Geogra-phy
Unit of Measure-ment
Metric Varia-ble
Metric Logic
Missing Data
Scaling
Maximi-zes Use
of Renewa-
ble Energy
Green Power Emissions
Avoidance
The annual amount of green power used in kilowatt-hours (kWh).
Environ-mental
Protection Agency
2016 U.S. Kilowatt-hours
(kWh)
a a / b (Scop
e 2 Emis-
sions)
0 Scope 2
Emissions (b)

2018 JUST Capital Ranking Methodology
Copyright © 2018 JUST Capital Foundation, Inc. All rights reserved. Table of Contents – 74
Reduces Solid
Waste to Landfill
Total Solid Waste The total amount of waste the company generates, both hazardous and non-hazardous.
Company filings and
other public documents
Latest year available
(2016, 2017, 2018)
Global Thou-sands of
metric tons
a b/a c, then 0
None
Total Solid Waste
Recycled
The total amount of waste the company recycles. JUST
Capital may adjust for one-time items such as demolition waste recycled, or add additional items such as composting
or recycling of other items not always included in the primary recycling category, such as batteries or electronic
waste.
Company
filings and other public
documents
Latest year
available (2016,
2017, 2018)
Global Thou-
sands of metric
tons
b b/a c, then
0
None
Percentage of
Solid Waste Recycled
The percentage of waste the company recycles. Company
filings and other public documents
Latest year
available (2016, 2017,
2018)
Global Percent-
age
c b/a c, then
0
None
20.4.3 Minimizes pollution
Company minimizes the harmful impact of its operations on the environment and cleans up any environmental damage it causes.
Metric Name
Data Name Data Definition Data Source
Date(s) Geogra-phy
Unit of Measure-ment
Metric Varia-ble
Metric Logic
Missing Data
Scaling
Chemical
Water Dis-
charge
Non-Cancerous
Chemical Water Discharge
Any non-cancerous chemical water discharge as a result of
the company's operations, based on the U.S. Environmental Protection Agency (EPA) Toxic Release Inventory (TRI)
dataset. Chemicals evaluated for carcinogenic potential are published by the Science Information Management Branch
of the U.S. Environmental Protection Agency. The factors considered in review of cancer risk include carcinogenic
potency and the potential for human exposure, based on short-term, long-term, mutagenicity, and structure activity studies.
Environ-
mental Protection
Agency
2016 U.S. Pounds a a+b 0 Revenue

2018 JUST Capital Ranking Methodology
Copyright © 2018 JUST Capital Foundation, Inc. All rights reserved. Table of Contents – 75
Cancerous Chemical Water
Discharge
Any cancerous chemical water discharge as a result of the company's operations, based on the U.S. Environmental
Protection Agency (EPA) Toxic Release Inventory (TRI) dataset.
Chemicals evaluated for carcinogenic potential are published by the Science Information Management Branch of the U.S.
Environmental Protection Agency. The factors considered in review of cancer risk include carcinogenic potency and the
potential for human exposure, based on short-term, long-term, mutagenicity, and structure activity studies.
Environ-mental
Protection Agency
2016 U.S. Pounds b a+b 0 Revenue
Green-house
Gas Emissions
Total Greenhouse Gas Emissions
The company's total GHG/CO2 equivalent (CO2e) emissions. Institutional Shareholder
Services
2016 Global Metric tonnes
(t)
a a Industry Mean
Revenue
Maximi-
zes Use of
Renew-able
Energy
Scope 2
Greenhouse Gas Emissions
The company's indirect/scope 2 GHG/CO2 equivalent
(CO2e) emissions.
Institutional
Shareholder Services
2016 Global Metric
tonnes (t)
b a / b
(Scope 2
Emis-sions)
None Scope 2
Emis-sions (b)

2018 JUST Capital Ranking Methodology
Copyright © 2018 JUST Capital Foundation, Inc. All rights reserved. Table of Contents – 76
Toxic Chemical
Emissions
RSEI Score Total The company's toxic chemical emissions, determined from the EPA's Risk Screening Environmental Indicators (RSEI), a
multi-media model that helps policy makers, researchers, and communities explore data on releases of toxic substances from industrial facilities. The RSEI is a unitless
value that accounts for the size of a chemical release, the fate and transport of the chemical through the environment,
the size and location of the exposed population, and the chemical's toxicity. RSEI Scores are calculated by multiplying
the toxicity weight of the chemical by the estimated dose and the number of exposed people.
For air releases, RSEI calculates concentrations in air up to
49 kilometers from the releasing facility using an EPA dispersion model called AERMOD. RSEI then calculates potential exposure results for residents within the 49-
kilometer radius. RSEI estimates the exposed population using block-level census data for 1990, 2000, and 2010, and
estimates the dose, or how much of the chemical a person might take into their body, based on the calculated
concentration in air and water. For each chemical with available toxicity data, separate toxicity weights are
calculated for oral ingestion and inhalation.
Environ-mental
Protection Agency
2016 U.S. Number a a 0 None

2018 JUST Capital Ranking Methodology
Copyright © 2018 JUST Capital Foundation, Inc. All rights reserved. Table of Contents – 77
20.5 Jobs (12%)
The Jobs Issue evaluates the effect a company has on the number of jobs, both in the U.S. and worldwide. Through our survey and focus group work, the
American people identified that creating jobs on a global scale mattered when defining just corporate behavior. As a result, we introduced a new Component this year – Creates Jobs Globally – which accounts for 13% of a company’s Jobs score.
20.5.1 Creates jobs in the US
Company focuses on growing its U.S.-based workforce.
Metric Name
Data Name Data Definition Data Source
Date(s) Geogra-phy
Unit of Measure-
ment
Metric Varia-
ble
Metric Logic
Missing Data
Scaling
Percen-tage
Change in U.S.
Work-force
Employees in the U.S. (2012)
The company's total U.S. employees in 2012, or total employees if the U.S. accounts for greater than 95% of
revenues/long-term assets. The number is adjusted for all material transactions, adding employees of acquired
businesses and subtracting employees of divested businesses.
In cases where U.S. headcount is not disclosed in company
filings, a number widely reported in the media may be used.
Company filings and
other public documents
As of the end of the
fiscal year in which at
least half of the months
fell in 2012 (i.e., FYE
June 2012 to May 2013). For
companies that went
public after 2012, the
earliest available
data is used.
U.S. Number a a / b - 1
c None
Employees in the U.S. (2017)
The company's total U.S. employees in 2017, or total employees if the U.S. accounts for greater than 95% of revenues/long-term assets. The number is adjusted for all
material transactions, adding employees of acquired businesses and subtracting employees of divested
businesses.
In cases where U.S. headcount is not disclosed in company
Company filings and other public
documents
As of the end of the fiscal year
in which at least half of
the months fell in 2017
(i.e., FYE
U.S. Number b a / b - 1
c None

2018 JUST Capital Ranking Methodology
Copyright © 2018 JUST Capital Foundation, Inc. All rights reserved. Table of Contents – 78
filings, a number widely reported in the media may be used. Otherwise, the number will be estimated by applying
average of percentage of sales and long-lived assets (property, plant, & equipment) in the U.S., when available, to total global headcount.
June 2017 to May
2018)
Industrywide
Change in U.S. Work-
force
Industrywide Change in
Domestic Jobs
The change in employees in the industry, including all relevant NAICS codes, from YE2012 to YE2017.
Bureau of Labor
Statistics
2012 to 2017
U.S. Number c N/A None None
20.5.2 Number of jobs in the US
Company has a sizeable U.S.-based workforce.
Metric
Name
Data Name Data Definition Data
Source
Date(s) Geogra-
phy
Unit of
Measure-ment
Metric
Varia-ble
Metric
Logic
Missing
Data
Scaling
Number of Jobs in
the U.S. (2017)
Employees in the U.S. (2017)
The company's total U.S. employees in 2017, or total employees if the U.S. accounts for greater than 95% of
revenues/long-term assets. The number is adjusted for all material transactions, adding employees of acquired
businesses and subtracting employees of divested businesses.
In cases where U.S. headcount is not disclosed in company
filings, a number widely reported in the media may be used. Otherwise, the number will be estimated by applying
average of percentage of sales and long-lived assets (property, plant & equipment) in the U.S., when available, to total global headcount.
Company filings and
other public documents
As of the end of the
fiscal year in which at
more than half of the
months fell in 2017
(i.e., FYE June 2017
to May 2018)
U.S. Number a a None None

2018 JUST Capital Ranking Methodology
Copyright © 2018 JUST Capital Foundation, Inc. All rights reserved. Table of Contents – 79
20.5.3 Creates jobs Globally
Company focuses on growing its worldwide workforce.
Metric
Name
Data Name Data Definition Data
Source
Date(s) Geogra-
phy
Unit of
Measure-ment
Metric
Varia-ble
Metric
Logic
Missing
Data
Scaling
Percen-tage Change
in Global Work-
force
Number of Global Jobs (2012)
The company's global workforce in 2012. The number is adjusted for all material transactions, adding employees of acquired businesses and subtracting employees of divested
businesses. In cases where U.S. headcount is not disclosed in company filings, a number widely reported in the media
may be used.
Company filings and other public
documents
As of the end of the fiscal year
in which at least half of
the months fell in 2012
(i.e., FYE June 2012
to May 2013). For
companies that went public after
2012, the earliest
available data is
used.
Global Number a a / b - 1
c None
Number of Global
Jobs (2017)
The company's global workforce in 2017. The number is
adjusted for all material transactions, adding employees of acquired businesses and subtracting employees of divested businesses. In cases where U.S. headcount is not disclosed
in company filings, a number widely reported in the media may be used.
Company
filings and other public documents
As of the
end of the fiscal year in which at
least half of the months
fell in 2017 (i.e., FYE
June 2017 to May
2018)
Global Number b a / b -
1
c None

2018 JUST Capital Ranking Methodology
Copyright © 2018 JUST Capital Foundation, Inc. All rights reserved. Table of Contents – 80
20.6 Communities (11%)
The Communities Issue measures how a company manages risks to human rights internationally, including addressing child labor and forced labor in the supply
chain or operating in countries with oppressive governments, and how it engages with local communities. In 2018, the metric-level scoring methodology was changed slightly from 2017, based on consultation with external experts and observed reporting practices. For example, controversy metrics were given less weight in 2018 to balance increased nuance in scoring and new metrics for corresponding management metrics and to further address bias in media to cover larger companies. The scoring of a company’s supplier code of conduct is more detailed in 2018, enabling us to better distinguish companies with more robust
policies. We have also diversified and added more specificity to our measures of charitable giving, moving away from binary scores in areas such as corporate giving sources and employee gift matching, to more nuanced scaling grades. Companies that offer matching employee gifts programs for a wide range of causes receive a higher score than those that only match giving to select causes or institutions, or companies that do not have an employee gift matching policy.
20.6.1 Manages the impacts of working with companies with abusive conditions
Company is transparent about efforts to address child labor, forced labor, and other abuses of people in the supply chain.
Metric Name Data Name Data Definition Data Source
Date Geogra-phy
Unit of Measu-
rement
Metric Varia-
ble
Metric Logic
Missing Data
Scaling 2018 Metric
Weight
Labor & Human
Rights Controver-
sies in the Supply Chain as Reported
in the Media
Labor & Human Rights
Controversies in the Supply Chain
as Reported in the Media
The number of cases (severe controversies deemed major scandals or systematic risk incidents by RepRisk) occurring
globally that pertain to human rights and/or labor rights violations in the company's supply chain, as reported or
discussed by influential and highly influential news sources over the past three years. RepRisk: Due Diligence on ESG and Business Conduct www.reprisk.com.
RepRisk May 2015 - May
2018
Global Number
a a Reve-nue
25%
Labor &
Human Rights
Commitment
Human Rights
Policy or Statement
An assessment of whether the company website discloses a
public statement or policy regarding a commitment to respecting human rights across all business operations, not
only with respect to supply chain activities. The statement must explicitly mention "human rights."
Company
filings and other
public docu-
ments
Latest
year available
(2016, 2017,
2018)
Global Yes or
No
a a+b+
c+d
a+b+c
+d = 25%
Board Oversight of
Human Rights Issues
An assessment of whether the board of directors is
specifically mentioned as having responsibility for the company's human rights policy. N/A: Not collected. T: True.
F: False.
Institu-
tional Share-
holder Services
Latest
year available
(2016, 2017,
2018)
Global True or
False
b a+b+
c+d

2018 JUST Capital Ranking Methodology
Copyright © 2018 JUST Capital Foundation, Inc. All rights reserved. Table of Contents – 81
Human Rights Policy Detail
An assessment of the company's policy or statement on human rights. Typically found in the company's code of
conduct (CoC), corporate responsibility report (CSR or CR report), as a standalone document/policy, or on the company's website.
Companies without a statement or policy receive a "None."
Companies with references only to "human rights" without elaboration receive a "0;" "1" if at least two relevant issues
(child labor, forced labor, or abusive/unsafe working conditions) are described; and "2" if a recognized, leading
international standard specifically addressing labor rights or human rights issues is referenced.
Recognized, leading international standards specifically addressing labor rights or human rights issues include the
International Labor Organization's Fundamental Principles, the UN Guiding Principles, and the Responsible Business
Alliance (formerly EICC) Code of Conduct, for example. The UN Global Compact also counts, but only if its labor rights
and human rights principles are detailed specifically as part of the policy. Only mentioning being a signatory of the UN
Global Compact is not sufficient.
A company may receive a "No" for the data point "Human Rights Policy or Statement" and a "1" for this data point if the company does not mention "human rights" at all but
states it has zero tolerance of at least two of the following in its operations: child labor, forced labor, or abusive/unsafe
working conditions. Statements that only mention forced labor, human trafficking, or slavery without including other
issues do not qualify.
Company filings
and other public docu-
ments
Latest year
available (2016, 2017,
2018)
Global None, 0, 1, 2
c a+b+c+d
Company Has
Conducted an Assessment of its
Overall Human Rights Impacts
An assessment of whether the company has conducted a
high-level study of its human rights impacts across all business operations, also known as an "HRIA." The
assessment must be across ALL operations and not for distinct projects.
Company
filings and other
public docu-ments
Latest
year available
(2016, 2017, 2018)
Global Yes or
No
d a+b+
c+d

2018 JUST Capital Ranking Methodology
Copyright © 2018 JUST Capital Foundation, Inc. All rights reserved. Table of Contents – 82
Quality of Supply Chain
Management Reporting
Enhanced Reporting of
Supply Chain Management Performance
An assessment of whether the company publicly reports any performance indicators or tracks and reports relevant
human rights-related information. Disclosures are categorized into four scores: Score of 0: No relevant information could be found, or the company reports
in alignment to the Global Reporting Initiative (GRI) but does not report any relevant human rights metrics. 1:
Reports relevant (related to labor rights or human rights) indicators not in line with a standard (Example: one
common practice is reporting just the % of suppliers whose contracts include the code of conduct terms relating to
human rights.). 2: Reports human rights and labor rights-related indicators, and the report aligns with a standard,
such as GRI (Example: disclosing negative labor impacts from supply chain operations). 3: Reports findings from audits or other efforts to manage the impacts of supply
chain or business operations, such as number of audits and status of each supplier's compliance or corrective actions. 4:
Discloses information or data relating to remedied outcomes for people, including workers (Example: reporting the
amount of migrant worker fees reimbursed, providing a description of how the company remedied the use of
underage workers in the supply chain, etc.). Notable supply chain transparency disclosure also counts for a "Type 4"
categorization – such as listing the top 100 supplier factories by name.
Company filings
and other public
documen
ts
Latest year
available (2016, 2017,
2018)
Global 0, 1, 2, 3, 4
a a 25%
Supplier
Require-ments on
Labor & Human
Rights
Participation in
External Human Rights Initiatives
An assessment of whether the company states that it is part
of an external industry initiative or multi-stakeholder initiative to address its social impacts, specifically.
Companies receive a "1" if they are part of an initiative and a "0" if evidence was not found.
This would include the Responsible Business Alliance and its
initiatives, the Sustainable Apparel Coalition, the Fair Labor Association, Sedex, UN Global Compact LEAD (being a
signatory of the UN Global Compact alone does not qualify), The Voluntary Principles for Security and Human Rights, or similar efforts. Organizations must have a stated, if not
specific, detailed purpose to address human rights and labor rights issues facing an industry.
Company
filings and other
public docu-
ments
Latest
year available
(2016, 2017,
2018)
Global Yes (1)
or No (0)
d a+b+
c+d
a+b+c
+d = 25%

2018 JUST Capital Ranking Methodology
Copyright © 2018 JUST Capital Foundation, Inc. All rights reserved. Table of Contents – 83
Supplier Code of Conduct
Regarding Child Labor, Forced Labor, and Health
& Safety
An assessment of whether the company discloses, or describes in detail, policies or terms expecting suppliers,
vendors, or business partners to commit to upholding human rights or labor rights, especially with respect to the prohibition of child labor, forced labor, and abusive working
conditions. These terms must specifically mention the relevant issues and not just include them in general "legal
compliance." Companies without this disclosure receive a "0." If the company explicitly mentions "human rights," it
receives a "1." If it mentions at least two of the above issues, it receives a "2." If it mentions both human rights
and two of the above issues, it receives a "3." Statements that only mention forced labor, human trafficking, or slavery
without including other issues do not qualify.
Company filings
and other public docu-
ments
Latest year
available (2016, 2017,
2018)
Global 0, 1, 2, 3
a a+b+c+d
Implementation of Supplier
Requirements on Labor & Human
Rights
An assessment of whether the company discloses practices for implementing supplier requirements, with respect to
human rights and labor rights.
These practices should be specifically related to human rights and labor rights or social impacts, and not general
quality assurance, legal compliance, or risk. Practices are categorized into four scores: Score "None" or 0: No
evidence of implementation or enforcement. 1: Implementation is largely left to the supplier (hotline,
reserving the right to terminate business, reserving the right to conduct audits, etc.). 2: The company regularly gathers information and builds capacity to assess risk in its supply
chain (training procurement staff on labor rights issues, collecting questionnaires or self-assessments from suppliers,
including specific labor rights or human rights terms in legal agreements, collecting audit information without disclosing
actions taken to address nonconformances, etc.). 3: The company is regularly making decisions and taking action
based on findings from "Score 2" practices (regularly taking corrective actions based on noncompliance from auditing
process, providing descriptions of steps taken to address negative findings, etc.). Ad-hoc and "as needed" steps do not qualify, rather there should be evidence of an active,
ongoing management system. 4: Disclosure of advanced practices demonstrating thought leadership or innovation in
addressing social impacts in the supply chain and across
Company filings
and other public
docu-ments
Latest year
available (2016,
2017, 2018)
Global None, 0, 1, 2,
3, 4
b a+b+c+d

2018 JUST Capital Ranking Methodology
Copyright © 2018 JUST Capital Foundation, Inc. All rights reserved. Table of Contents – 84
operations. This can include leading advanced capacity-building programs across many suppliers, practices that
recognize the challenge of transparency in auditing systems, and/or established programs to address and remediate issues such as child labor and forced labor at the root-cause
level.
Supplier Code of
Conduct References
Leading International
Standard(s)
An assessment of the company's supplier policy referencing
an international or specific standard relevant to human rights and labor rights. Examples of broad standards include
the UNGPs (Ruggie Principles) or ILO (International Labor Organization) principles. Examples of specific standards are
SA8000 or the Responsible Business Alliance Code of Conduct. Companies that make no reference receive a "0." Companies that reference a broad standard receive a "1."
Those that reference a more specific standard receive a "2."
Company
filings and other
public docu-
ments
Latest
year available
(2016, 2017,
2018)
Global 0, 1, 2 c a+b+
c+d
20.6.2 Does not work with governments or authorities that oppress their people
Company has comparatively few reported controversies in regions where people's rights are severely restricted or their freedom denied.
Metric Name Data Name Data Definition Data Source
Date(s Geogra-phy
Unit of Measu-
rement
Metric Varia-
ble
Metric Logic
Missing Data
Scaling 2018 Metric
Weight
Controver-sies Relating
to Oppressive
Govern-ments as
Reported in the Media
Business with Oppressive
Governments Controversies
The number of cases (severe controversies deemed major scandals or systematic risk incidents by RepRisk) occurring
in countries categorized as "Not Free" by Freedom House in 2018 (https://freedomhouse.org/report/freedom-
world/freedom-world-2018) that pertain to complicity in human rights violations, as reported by influential and highly
influential news sources over the past three years. RepRisk: Due Diligence on ESG and Business Conduct
www.reprisk.com.
RepRisk May 2015 - May
2018
Global Num-ber
a a Reve-nue
100%
20.6.3 Maintains strong relationships with communities
Company is transparent in its efforts to communicate with its local communities and act on community input.

2018 JUST Capital Ranking Methodology
Copyright © 2018 JUST Capital Foundation, Inc. All rights reserved. Table of Contents – 85
Metric Name Data Name Data Definition Data Source
Date(s) Geogra-phy
Unit of Measu-
rement
Metric Varia-
ble
Metric Logic
Missing Data
Scaling 2018 Metric
Weight
Controver-sies in
Community Impacts as Reported in
the Media
Impacts on Communities
Controversies
The number of cases (severe controversies deemed major scandals or systematic risk incidents by RepRisk) occurring
globally that pertain to community relations and negative impacts on communities, as reported by influential and highly influential news sources over the past three years.
RepRisk: Due Diligence on ESG and Business Conduct www.reprisk.com.
RepRisk May 2015 - May
2018
Global Num-ber
a a Reve-nue
20%
Community
Engagement and Employee
Volunteerism
Paid Time Off For
Volunteering
An assessment of whether the company sponsors employee
volunteering with paid time off. Assigned one of three scores. 0: No evidence found. 1: Evidence of companies allowing employees to volunteer on company time, but with
restrictions on the time or cause, such as a company "Day of Volunteering." It must be a program open to a majority
of employees. 2: Evidence of a program where employees have a set amount of hours they can use for a cause and
time of their choosing commonly known as "volunteer time off" (VTO). This must also be open to a majority of
employees.
Company
filings and other public
documents
Latest
year available (2016,
2017, 2018)
Global 0, 1, 2 a a+b+
c+d
a+b+c
+d = 80%
Community
Engagement Mechanism
An assessment of whether the company has a formal
system to implement stakeholder consultation and engagement. Assigned one of four scores. N/A: Not collected. 0: No. 1: Only intent to implement process. 2:
Formal process, but no details. 3: Yes, formal process.
Institu-
tional Share-holder
Services
Latest
year available (2016,
2017, 2018)
Global 0, 1, 2,
3
b a+b+
c+d
Has an open and transparent
process for charitable funding
An assessment of whether the company publicly discloses a process through which nonprofits or community members
can submit unsolicited applications for grant funding or corporate donations. Assigned one of three scores. 0: No evidence found. 1: Transparent giving policy or process, but
does not accept unsolicited applications for funding. 2: Transparent policy and accepts unsolicited applications, but
with significant restrictions on the qualifying causes or kinds of organizations. 3: Transparent policy, accepts unsolicited
applications, and supports broad causes and organizations.
Company filings
and other public docu-
ments
Latest year
available (2016, 2017,
2018)
Global 0, 1, 2, 3
c a+b+c+d
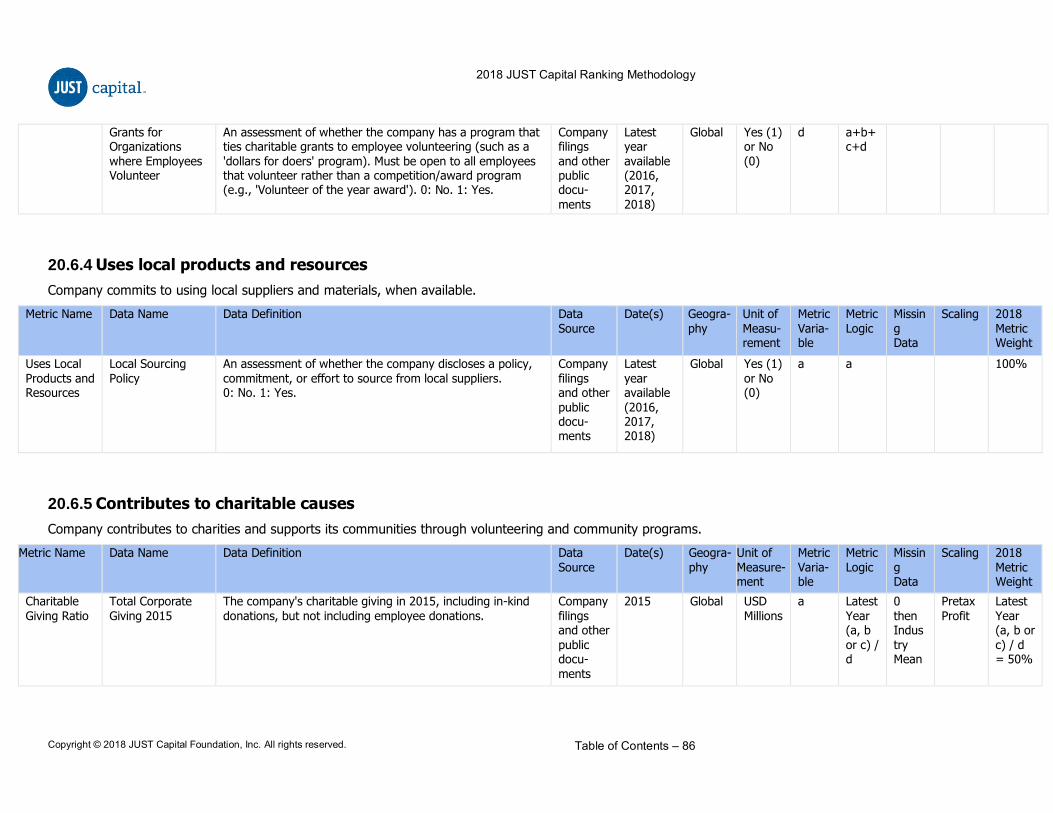
2018 JUST Capital Ranking Methodology
Copyright © 2018 JUST Capital Foundation, Inc. All rights reserved. Table of Contents – 86
Grants for Organizations
where Employees Volunteer
An assessment of whether the company has a program that ties charitable grants to employee volunteering (such as a
'dollars for doers' program). Must be open to all employees that volunteer rather than a competition/award program (e.g., 'Volunteer of the year award'). 0: No. 1: Yes.
Company filings
and other public docu-
ments
Latest year
available (2016, 2017,
2018)
Global Yes (1) or No
(0)
d a+b+c+d
20.6.4 Uses local products and resources
Company commits to using local suppliers and materials, when available.
Metric Name Data Name Data Definition Data
Source
Date(s) Geogra-
phy
Unit of
Measu-rement
Metric
Varia-ble
Metric
Logic
Missin
g Data
Scaling 2018
Metric Weight
Uses Local
Products and Resources
Local Sourcing
Policy
An assessment of whether the company discloses a policy,
commitment, or effort to source from local suppliers. 0: No. 1: Yes.
Company
filings and other
public docu-ments
Latest
year available
(2016, 2017, 2018)
Global Yes (1)
or No (0)
a a 100%
20.6.5 Contributes to charitable causes
Company contributes to charities and supports its communities through volunteering and community programs.
Metric Name Data Name Data Definition Data
Source
Date(s) Geogra-
phy
Unit of
Measure-ment
Metric
Varia-ble
Metric
Logic
Missin
g Data
Scaling 2018
Metric Weight
Charitable
Giving Ratio
Total Corporate
Giving 2015
The company's charitable giving in 2015, including in-kind
donations, but not including employee donations.
Company
filings and other
public docu-
ments
2015 Global USD
Millions
a Latest
Year (a, b
or c) / d
0
then Indus
try Mean
Pretax
Profit
Latest
Year (a, b or
c) / d = 50%

2018 JUST Capital Ranking Methodology
Copyright © 2018 JUST Capital Foundation, Inc. All rights reserved. Table of Contents – 87
Total Corporate Giving 2016
The company's charitable giving in 2016, including in-kind donations, but not including employee donations.
Company filings
and other public docu-
ments
2016 Global USD Millions
b Latest Year
(a, b or c) / d
0 then
Industry Mean
Pretax Profit
Total Corporate Giving 2017
The company's charitable giving in 2017, including in-kind donations, but not including employee donations.
Company filings
and other public docu-
ments
2017 Global USD Millions
c Latest Year
(a, b or c) / d
0 then
Industry Mean
Pretax Profit
(d)
Pre-Tax Profit The company's total pre-tax profit. This data is used to calculate charitable giving as a percentage of pre-tax profits.
Company filings
and other public docu-
ments
2017 Global USD Millions
d Latest Year
(a, b or c) / d
0 then
Industry Mean
Pretax Profit
(d)
Transparent
and Employee-
led Corporate
Giving
Transparent
Disclosure of Corporate Giving
Sources
An assessment of whether the company provides a detailed
description of corporate giving sources by year and into distinct categories, such as employee donations or matched
employee donations, corporate or foundation donations, and in-kind giving. Three scores are assigned. 0: No giving
disclosure or general disclosure (e.g., "...given over $1 million to charity since 2010"). 1: Reporting corporate giving
amount for one year, distinct from employee giving. 2: Reporting annual corporate giving amount, distinct from employee giving, for at least two years (should be easily
comparable in reporting) OR at least two categories of giving (such as in-kind, matched, corporate, foundation,
etc.).
Company
filings and other
public docu-
ments
Latest
year available
(2016, 2017,
2018)
Global 0, 1, 2 a a+b+
c
a+b+c
=50%

2018 JUST Capital Ranking Methodology
Copyright © 2018 JUST Capital Foundation, Inc. All rights reserved. Table of Contents – 88
Transparent Disclosure of
Corporate Giving Recipients
An assessment of how a company discloses information about the recipients of its charitable funding. Disclosure
should be on the company's website or in its responsibility report. Three scores are assigned. 0: No relevant disclosure found. 1: The company reports one recipient organization
by name and the amount the organization was awarded for one year OR what seems to be a list of all grant recipients
by name for one year. 2: The company makes an effort to disclose an exhaustive list of annual grant recipients by
name, amount awarded, and by year.
Company filings
and other public docu-
ments
Latest year
available (2016, 2017,
2018)
Global 0, 1, 2 b a+b+c
Program to Match
Employee Giving to Charitable Causes of
Employees' Choice
An assessment of whether the company discloses a program
to match employee donations and its openness to employees' giving preferences. Three scores are assigned. 0: No evidence found. 1: Evidence of a matching program
but with limitations on the cause or type of organization (for example, some companies only match giving to educational
institutions). 2: Evidence of a matching program with broad allowance of causes and types of organizations. Please note
that matching employee donations to employee-assistance or employee emergency funds do not qualify for either "1"
or "2."
Company
filings and other public
docu-ments
Latest
year available (2016,
2017, 2018)
Global 0, 1, 2 c a+b+
c
20.6.6 Takes steps to avoid causing or contributing to international conflicts
Company is transparent about efforts to comply with conflict minerals disclosure regulation and related due diligence.
Metric Name Data Name Data Definition Data Source
Date(s) to which Data
pertains
Geogra-phy
Unit of Measur-ement
Metric Varia-ble
Metric Logic
Missing Data
Scaling 2018 Metric Weight
Controver-
sies in Conflict
Minerals as Reported in
the Media
Conflict Minerals
Controversies
The number of cases (severe controversies deemed major
scandals or systematic risk incidents by RepRisk) occurring globally that pertain to conflict minerals in the supply chain,
as reported by influential and highly influential news sources over the past three years. RepRisk: Due Diligence on ESG
and Business Conduct www.reprisk.com.
RepRisk May 2015
- May 2018
Global Numbe
r
a a Reve-
nue
33.33
%

2018 JUST Capital Ranking Methodology
Copyright © 2018 JUST Capital Foundation, Inc. All rights reserved. Table of Contents – 89
Commitment to Conflict-
Free Sourcing
Conflict Minerals Compliance Score
The score determined by non-profit research organization Development International, for the company's compliance
with the U.S. Securities and Exchange Commission (SEC) Dodd-Frank Section 1502 Conflict Minerals rules.
Scores are based on reporting year 2016. See www.developmentinternational.org and
https://docs.wixstatic.com/ugd/f0f801_9502a3a2a8f143a7b5d863792a01318a.pdf for more information.
Develop-ment
Interna-tional
2016 Global Score (0-
100)
a a+b a+b=66.66%
OECD-based Conflict Minerals
Due Diligence Score
The score determined by non-profit research organization Development International, for the company's conflict
minerals due diligence program.
The score reflects the program's conformance with the Organization for Economic Co-operation and Development's
(OECD) guidance for responsible supply chains of minerals from conflict-affected and high-risk areas. Scores are based on Reporting Year 2016. See
www.developmentinternational.org or https://docs.wixstatic.com/ugd/f0f801_9502a3a2a8f143a7b
5d863792a01318a.pdf for more information.
Develop-ment
Interna-tional
2016 Global Score (0-
100)
b a+b

2018 JUST Capital Ranking Methodology
Copyright © 2018 JUST Capital Foundation, Inc. All rights reserved. Table of Contents – 90
20.7 Company Leadership and Shareholders (8%)
The Company Leadership and Shareholders Issue measures how leadership manages the company and treats its investors. This year, we made adjustments for
one-time tax expenses and benefits related to the Tax Cut and Jobs Act, which did not exist in prior years and added a new measurement of whether a company discloses a tax strategy that is in line with best practices. We also improved our board diversity evaluation to exclude diversity of nationality (country of birth), which experts agree is not the best measure to represent what people understand as diversity.
20.7.1 Follows laws and regulations
Company complies with all applicable international, federal, state, and local legal requirements and regulations.
Metric Name
Data Name Data Definition Data Source
Date(s) Geogra-phy
Unit of Measure-
ment
Metric Varia-
ble
Metric Logic
Missing Data
Scaling
Controver-
sies in Legal &
Regulatory as
Reported in the Media
Violation of
National Legislation
Controversies
The number of cases (severe controversies deemed major
scandals or systematic risk incidents by RepRisk) occurring in the U.S. that pertain to violations of national or state
legislation in relation to environmental, social, or governance issues, as reported by influential and highly
influential news sources over the past three years. RepRisk: Due Diligence on ESG and Business Conduct www.reprisk.com.
RepRisk May 2015 -
May 2018
U.S. Number a a None Revenue
Legal Fines and
Violations
Legal Fines and Violations
Any fines over the past three years from the Nuclear Regulatory Commission, Federal Motor Carrier Safety
Administration, Federal Aviation Administration, Federal Railroad Administration, Justice Department multiagency
referral, Food and Drug Administration referral to the Justice Department, Justice Department Antitrust Division, Federal
Deposit Insurance Corporation, Office of the Comptroller of the Currency, Federal Reserve, Treasury Department Financial Crimes Enforcement Network, Justice Department
Civil Division, Justice Department Criminal Division, Securities and Exchange Commission, Federal Housing
Finance Agency, Fannie Mae, Freddie Mac, National Credit Union Administration, Commodity Futures Trading
Commission, Southern District of New York (selected cases), Justice Department Tax Division, Office of Foreign Assets
Control, Alcohol and Tobacco Tax and Trade Bureau, Federal Aviation Administration referral to the Justice
Good Jobs First
May 2015 - May 2018
U.S. U.S. Dollars
a a None Revenue

2018 JUST Capital Ranking Methodology
Copyright © 2018 JUST Capital Foundation, Inc. All rights reserved. Table of Contents – 91
Department, Bureau of Industry and Security, Health & Human Services Department Office of Inspector General,
Centers for Medicare & Medicaid Services, Justice Department National Security Division, Drug Enforcement Administration, Federal Maritime Commission, Housing and
Urban Development Department, Office of Federal Contract Compliance Programs, State Department Directorate of
Defense Trade Controls, Employee Benefits Security Administration, Federal Communications Commission, and
Grain Inspection, Packers, & Stockyards Administration. Violation Tracker produced by the Corporate Research
Project of Good Jobs First.
Commitm
ent to Follow
Laws & Regula-
tions
Disclosure of
Business Ethics Policy or Code of
Conduct
An assessment of whether the company has a publicly
disclosed Business Ethics Policy or Code of Conduct. A value of True indicates the presence of a Code of Conduct.
Institutional
Shareholder Services
Latest year
available (2016,
2017, 2018)
U.S. True or
False
a a*10
+ b*2
0 None
Business Ethics Policy/Code of
Conduct – Monitor/Internal Audit
An assessment of whether the company actively monitors or audits internal compliance with its Business Ethics Policy or
Code of Conduct. Companies are scored from 0 to 10 and receive a 0 for no disclosure, a 5 for occasional audits, and a 10 for scheduled audits.
Institutional Shareholder
Services
Latest year available
(2016, 2017, 2018)
U.S. Score (0, 5, or 10)
b a*10 + b*2
0 None
20.7.2 Leadership acts and communicates with integrity
Company executives and board members behave ethically and take responsibility for all company-related issues.
Metric
Name
Data Name Data Definition Data
Source
Date(s) Geogra-
phy
Unit of
Measure-ment
Metric
Varia-ble
Metric
Logic
Missing
Data
Scaling
Board Independence
Board Independence Ratio
The percentage of Independent Outside Directors on the board. Independence is defined by ISS in their U.S. Proxy Voting
guidelines. Directors are classified, depending on their relationships and affiliations with the company or its
executives, as either Inside Director, Affiliated Outside Director, or Independent Outside Director. The value shown
here is the percentage classified as Independent Outside Directors.
Institutional Shareholder Services
2017 U.S. Percent-age
a a None None

2018 JUST Capital Ranking Methodology
Copyright © 2018 JUST Capital Foundation, Inc. All rights reserved. Table of Contents – 92
Exec Comp
Linked to JUST Issues
Disclosure Link ESG
Risks/Performance – Executive Remuneration
An assessment of whether the company provides information indicating a link between consideration of ESG
risks and performance, as well as executive remuneration.
Institutional Shareholder
Services
Latest year available
(2016, 2017, 2018)
U.S. True or False
a (a* 10 +
b * 2) / 3
None None
Strategic ESG KPIs
Are Represented In Compensation
Metrics
An assessment of whether the company indicates that
strategic ESG-related key performance indicators (KPIs) in the company plan are represented in the compensation or
remuneration metrics. Companies are scored from 0 to 10 and receive a 0 for no disclosure, 5 for partial
representation and 10 for clear representation.
Institutional
Shareholder Services
Latest year
available (2016,
2017, 2018)
U.S. Score (0,
5, or 10)
b (a*
10 + b * 2)
/ 3
None None
Gender
Diversity on Board
Board of Directors
Gender Diversity
The percentage of women on the company's board of
directors.
Company
filings and other public
documents
2018 U.S. Percent-
age
a 10 -
20*abs(.5 -
a)
None None
Indepen-
dent Board
Leader-ship
Board Chair
Independence
An assessment of whether the company has an independent
chair, by ISS's standards. A chair is classified as non-independent if the chair of the company is also the CEO, a
former CEO, a company executive/insider, or a non-independent non-executive director.
Institutional
Shareholder Services
2017 U.S. Yes or No a a 0 None
Board
Diversity
Board Diversity
Score
A statistical measure of the board's diversity as measured by
age, gender, and tenure, ranging between 0 (Max) and 1 (Min).
Company
filings and other public
documents
2018 U.S. Score (0-
1)
a a None None
Board
Oversight of JUST
Issues
Formal Schedule
On Environmental/He
alth/Safety/Social Matters
An assessment of whether the company's board has a
formal schedule to consider environmental, health and safety, and social matters. Companies are scored from 0 to
10, and receive a 0 for no schedule, 5 for an annual schedule, and 10 for a formal schedule that meets more
often than annually.
Institutional
Shareholder Services
Latest year
available (2016,
2017, 2018)
U.S. Score (0,
5, or 10)
a a 0 None
Related
Party Trans-actions
Related Party
Transactions – CEO
An assessment of whether there are material related-party
transactions involving the CEO, either directly or indirectly (through employers and immediate family members). In the U.S., a material transactional relationship is defined
as one that: includes grants to non-profit organizations; exists if the company makes annual payments to, or
receives annual payments from, another entity exceeding the greater of $200,000 or 5 percent of the recipient‘s gross
revenues, in the case of a company that follows NASDAQ
Institutional
Shareholder Services
Latest year
available (2016, 2017,
2018)
U.S. True or
False
a a+b None None

2018 JUST Capital Ranking Methodology
Copyright © 2018 JUST Capital Foundation, Inc. All rights reserved. Table of Contents – 93
listing standards; or the greater of $1,000,000 or 2 percent of the recipient‘s gross revenues, in the case of a company
that follows NYSE/Amex listing standards. In the case of a company that follows neither of the preceding standards, ISS applies the NASDAQ-based materiality test.
A material professional service relationship is defined as one
that includes, but is not limited to, the following: investment banking/financial advisory services, commercial banking
(beyond deposit services), investment services, insurance services, accounting/audit services, consulting services,
marketing services, legal services, property management services, realtor services, lobbying services, executive
search services, and IT consulting services, and exist if the company or an affiliate of the company makes annual payments to, or receives annual payments from, another
entity in excess of $10,000 per year.
Related Party
Transactions – Directors
An assessment of whether there are material related-party
transactions involving company directors, either directly or indirectly (i.e. through employers and immediate family
members).
In the U.S., a material transactional relationship is defined as one that: includes grants to non-profit organizations;
exists if the company makes annual payments to, or receives annual payments from, another entity exceeding the greater of $200,000 or 5 percent of the recipient‘s gross
revenues, in the case of a company that follows NASDAQ listing standards; or the greater of $1,000,000 or 2 percent
of the recipient‘s gross revenues, in the case of a company that follows NYSE/Amex listing standards. In the case of a
company that follows neither of the preceding standards, ISS applies the NASDAQ-based materiality test.
A material professional service relationship is defined as one
that includes, but is not limited to, the following: investment banking/financial advisory services, commercial banking (beyond deposit services), investment services, insurance
services, accounting/audit services, consulting services, marketing services, legal services, property management
services, realtor services, lobbying services, executive
Institutional
Shareholder Services
Latest year
available (2016,
2017, 2018)
U.S. True or
False
b a+b None None

2018 JUST Capital Ranking Methodology
Copyright © 2018 JUST Capital Foundation, Inc. All rights reserved. Table of Contents – 94
search services, and IT consulting services, and exists if the company or an affiliate of the company makes annual
payments to, or receives annual payments from, another entity in excess of $10,000 per year.
20.7.3 Maintains integrity in financial reporting
Company reports all financial matters transparently and thoroughly, and keeps clear, honest, and accessible financial statements.
Metric Name
Data Name Data Definition Data Source
Date(s) Geogra-phy
Unit of Measure-
ment
Metric Varia-
ble
Metric Logic
Missing Data
Scaling
SEC
Filings Review
Independent
Auditor Opinion
An assessment of whether, in the past year, the company's
independent auditor issued an adverse opinion.
Institutional
Shareholder Services
2017 U.S. Yes (1)
or No (0)
a a+b+
c+d
None None
Internal Financial
Controls
An assessment of whether, in the past two years, the
company has disclosed any material weaknesses in its internal controls.
Institutional
Shareholder Services
2017 U.S. Yes (1)
or No (0)
b a+b+
c+d
None None
Late SEC Filings An assessment of whether, in the past two years, the company has made any non-timely financial disclosure filings.
Institutional Shareholder Services
2017 U.S. Yes (1) or No (0)
c a+b+c+d
None None
Financial
Restatements
An assessment of whether, in the past two years, the
company has restated financials for any period.
Institutional
Shareholder Services
2017 U.S. Yes (1)
or No (0)
d a+b+
c+d
None None
20.7.4 Pays fair share of taxes
Company pays taxes on U.S. income at a rate that is in line with most large American companies.
Metric Name
Data Name Data Definition Data Source
Date(s) Geogra-phy
Unit of Measure-
ment
Metric Varia-
ble
Metric Logic
Missing Data
Scaling
Effective U.S. Tax
Rate
Effective U.S. Tax Rate
The effective U.S.-only tax rate, as calculated by adding the U.S. Federal taxes (both current and deferred) and dividing
that by the company's pre-tax income from the U.S. only.
To adjust for the new ASC 718 rules coming into effect this year (simplifying share-based compensation expense
Company filings and
other public documents
2013 to 2017
U.S. Percent-age
a a Industry Mean
None

2018 JUST Capital Ranking Methodology
Copyright © 2018 JUST Capital Foundation, Inc. All rights reserved. Table of Contents – 95
accounting), we retroactively add the excess tax benefit from share-based compensation to the numerator. We also
bind the output between a minimum of 0% and maximum of 60%, and then take the trailing five-year average of these tax rates.
Respon-sible Tax
Principles
Responsible Tax Principles
An assessment of whether the company is a signatory to The B Team Responsible Tax Principles or similar standards.
These Principles offer a clear framework for tax practice, emphasizing responsible tax management, a cooperative
relationship with tax authorities, and transparent shareholder reporting. Responsible tax management
stresses accountability, compliance, and a pledge to avoid business structures with the intent of abusing tax rules.
The B Team;
Company filings, and other public
documents
2018 U.S. True (1) or False
(0)
a a None None
Incorpo-rated
Outside the U.S.
Incorporated Outside the U.S.
An assessment of whether the company is incorporated or reincorporated outside the U.S., while maintaining corporate
headquarters and/or primary trading exchange in the U.S.
Companies are assigned scores of either 0 for non-U.S. companies or 10 for U.S. companies, based on jurisdiction
or incorporation.
Company filings and
other public documents
2018 U.S. Score (0 or 10)
a a None None
20.7.5 Makes a profit over the long term
Company successfully manages operations throughout the business cycle to remain profitable.
Metric Name
Data Name Data Definition Data Source
Date(s) Geogra-phy
Unit of Measure-ment
Metric Varia-ble
Metric Logic
Missing Data
Scaling
5-year Operat-
ing Income
Growth CAGR
5-year Operating Income CAGR
The 5-year Operating Income compound annual growth rate (CAGR), requiring at least a 3-year history.
Company filings and
other public documents
2012 to 2017
Global Percent-age
a a Industry Mean
None

2018 JUST Capital Ranking Methodology
Copyright © 2018 JUST Capital Foundation, Inc. All rights reserved. Table of Contents – 96
5-year Earnings
Per Share Growth CAGR
5-year Earnings Per Share Growth
CAGR
The 5-year earnings per share (EPS, adjusted), compound annual growth rate (CAGR), requiring at least a 3-year
history.
Company filings and
other public documents
2012 to 2017
Global Percent-age
a a Industry Mean
None
5-year Change
in Opera-ting
Margin
5-year Change in Operating Margin
The average year-over-year change in Operating Margin over the trailing 5 years, requiring at least a 3-year history.
Company filings and
other public documents
2012 to 2017
Global Percent-age
Points
a a Industry Mean
None
5-year Average Return
on Equity
5-year Average ROE
The 5-year average Return on Equity (ROE), requiring at least a 3-year history, with each individual year bounded between -100 and 100.
Company filings and other public
documents
2012 to 2017
Global Percent-age
a a Industry Mean
None
20.7.6 Pays CEO fairly compared to workers
Company pays CEO fairly and proportionately to its workers, as compared to most large American companies.
Metric Name
Data Name Data Definition Data Source
Date(s) Geogra-phy
Unit of Measure-
ment
Metric Varia-
ble
Metric Logic
Missing Data
Scaling
CEO-to-
Median Worker
Pay Ratio
CEO
Compensation
The compensation, salary, and bonus for the CEO or
equivalent, per SEC executive compensation rules, including Executive Chairperson.
The value excludes "Change in Pension Value & Nonqualified Deferred Compensation Earnings" and "All Other Compensation” for comparability to estimated median
worker pay. The value is also adjusted to remove one time payments for severance or sign-on bonuses, while prior
lump sum multi-year retention bonuses (cash or stock) are annualized and added back.
Company
filings and other public
documents
As of May
2018
U.S. U.S.
Dollars
a a/b Industry
Mean
None
Median Worker Pay
The estimated median U.S. employee compensation, based on analysis of crowd-sourced compensation data by title and
location, with Bureau of Labor Statistics (BLS) wage averages by job title and industry where crowd-sourced
data is incomplete. BLS job title distributions by industry are applied, and the median wage derived, by company.
Crowd-sourced
company review
platforms; Bureau of Labor
Statistics
2013 to 2018
U.S. U.S. Dollars
b a/b Industry Mean
None

2018 JUST Capital Ranking Methodology
Copyright © 2018 JUST Capital Foundation, Inc. All rights reserved. Table of Contents – 97
20.7.7 Provides investor return over the long term
Company provides long-term gains on shareholders' investments, including stock returns, dividends, and share buybacks.
Metric
Name
Data Name Data Definition Data
Source
Date(s) Geogra-
phy
Unit of
Measure-ment
Metric
Varia-ble
Metric
Logic
Missing
Data
Scaling
5-year Shareholder
Payout Ratio
5-year Shareholder Payout to Free
Cash Flow
The average of the ratio of shareholder payouts to free cash flow per share over the trailing five years. The payout ratio for any year is calculated as the dividend per share declared
in that year, plus cash flows used for share repurchases divided by weighted average basic shares outstanding for
that year (excluding years in which the company was not publicly traded).
Company filings and other public
documents
Trailing 5 years as of 5/31/18
Global Number a a 0 None
5-year Risk-
Adjusted Total
Shareholder Return
5-year Total Shareholder
Return
The annualized 5-year total shareholder return, including reinvested dividends.
Alpha Vantage
Trailing 5 years as of
5/31/18
Global Percent-age
a (a - c) / b
Industry Mean
None
Beta Beta defined as three-year regression of weekly stock returns against Russell 1000 index returns.
Alpha Vantage
As of 5/31/18
Global Number b (a - c) / b
None None
Risk Free Rate The Risk free rate (10 Year U.S. Treasury). Federal Reserve
As of 5/31/18
Global Percent-age
c (a - c) / b
None None

2018 JUST Capital Ranking Methodology
Copyright © 2018 JUST Capital Foundation, Inc. All rights reserved. Table of Contents – 98
21 Appendix D: Survey Methodology, Qualitative Report, and Weighting Survey Questionnaires

1
JUST Capital Survey Research Methodology Appendix
Section 1: Focus Group Reports
NORC Report 2 JUST Capital Analysis 22
Section 2: Survey Questionnaires
NORC Sample Summaries 31 Driver Survey 33 Components Survey 61 Product Harm Survey 76

2
F I N A L R E P O R T
JUST Capital
Focus Groups Final Report
DATE: MARCH 29, 2018
PRESENTED TO: NATALIE JACKSON FIYIN ADESINA
PRESENTED BY: NORC

3
I. Introduction
During the weeks of February 12, 19, 26 and March 5, 2018, NORC conducted 14 focus groups in seven locations in order to understand whether any modifications were needed to the existing Drivers and Components framework. Additionally, the research investigated some specific issues raised in the development of the measurement framework. Focus Group Objectives 1) Refine the Components under each Driver for the 2018 Ranking Model
a. Validate the current set of Components, including exploring whether there are factors related to JUSTness that are not captured with the current list, or if there are any Components on the current list that are no longer important to the American public.
b. Understand if the American public’s understanding of the Components is consistent with the definition assigned by JUST.
c. Understand if the current mapping of Components to Drivers is consistent with the opinions of the American public.
2) Explore the opinions of the American public about corporate behavior broadly, including asking participants about their definition of ‘JUST’, in order to refine these definitions.
NORC conducted 14 focus groups in seven locations: New York, Atlanta, Albuquerque, Detroit, Wichita, San Francisco, and Spokane, WA. These groups provided representation of a wide variety of Americans. Each group included between six and eleven participants. In each location we hosted two groups, alternating Driver groups. NORC developed a moderator protocol that started broadly, asking participants their thoughts about corporate just behavior. High level thinking was promoted by asking participants to imagine a business as a superhero. Themes, stakeholders, and broad categories were noted. The result of these focus groups was further clarification of the current Components under each Driver and for testing quantitatively.
II. Session Flow
Lobby Exercise While waiting for the groups to start in the lobby, respondents were given a sheet of paper with an activity to do in order to get them in the right mindset and get them thinking about the topics. Participants were instructed to think of three businesses which they had a favorable impression of and to write down five characteristics or things about those businesses that drive their impression of them. Participants were then instructed to do the same for three business of which they had an unfavorable impression. Introduction NORC explained that the participants had been invited to participate in a focus group about what it means for a business to do “the right thing”. Participants were informed that the group

4
discussion would be managed in order to stay on schedule. NORC moderators explained that, at times, discussions may have to be cut short and that some participants may be called on in order to capture feedback from all participants. Participants were also instructed to avoid interrupting one another and to be respectful of viewpoints with which they disagreed. Finally, participants were asked to introduce themselves and list a fun fact about themselves or something they were looking forward to in the next few months. Lobby Exercise Discussion Participants were asked to share the businesses they had listed on the lobby exercise and to explain why those businesses were favorable. Participants were then asked to think about businesses with which they had never conducted business, but had a favorable impression of nevertheless. The same exercise was conducted for businesses of which participants had an unfavorable opinion. Introduction of “Just” The moderators asked the group to describe what “doing the right thing” related to in a broad sense. After discussing participant ideas, NORC moderators introduced the concept of just. Just was explained as a business operating justly, with a concept of justice and justness. NORC moderators made it clear that just did NOT mean “merely” or “only”. NORC moderators noted that participants found it helpful to think of a just business behaving as how a superhero might, in order to avoid focusing on profitable behavior versus just behavior. Participants were instructed to prioritize what they considered to be just behavior, even if they believed that behavior might impact a businesses’ profit. Components Focus Group NORC conducted groups focused on Components of specific sets of Drivers. Drivers were initially grouped into three sets: Workers, Jobs, and Management & Shareholders; Environment and Communities; Customers and Products. However, it became clear after the first focus group in NYC that the Workers, Jobs, and Management & Shareholders group had too many components to discuss in 90 minutes. This resulted in the creation of a fourth Driver group. The final four sets of Drivers were Workers and Jobs; Management & Shareholders; Environment and Communities; and Customers and Products. Each set was discussed in a total of four groups with the exception of the Management & Shareholders group, which was only discussed in three groups. Consistent with the previous approach, participants were asked about their concerns about corporate just behavior. The existing Components were introduced along with the name and language used to describe each Component. Participants were asked if any changes should be made to the existing Components or if there were any Components which had not been covered. Again, themes, stakeholders, and broad categories were noted. Finally, participants were asked to name the categories into which they had organized the Components. Close out Participants were thanked and informed that their input would be used in JUST Capital’s research into America’s Most Just Businesses.

5
III. Findings
Component Categories- Workers and Jobs
Component JUST?Understanding
correct?No - how understood Other comments JUST?
Understanding correct?
No - how understood Other comments
Pays a living wage Y Y
Should make more in certa in areas for
same job because di fferent costs of
l iving. People have di fferent ideas of what "l iving" i s -
l i festyle di fferences
Debated Y
Different ideas on what a "l iving" wage
i s and how i t i s ca lculated
Pays a fair wage for industry and job level
Y Y Y Debated
How do you determine fa i r? How to compare industry level across
s tates with di fferent l iving costs?
Provides a safe workplace
Y Y
Safe could mean free from discrimination. Can't be guarenteed safe but have safe protocols in place
Y Debated
phys ica l safety (machinery but a lso safety from
intruders l ike shooters ) vs . cul tura l safety (sexual
harrassment, etc)
Does not discriminate in pay
Y Y Y Y
Provides access to health insurance
Y Y Y Y
Does not discriminate in hiring, firing, and
promotionY Y
Discussed how this i s s imi lar/di fferent from does not discriminate
in pay
Y Y
Pays workers fairly compared to CEO
Debated Y
There shouldn't be a huge wage gap but
a lso should be pa id what the market can
provide. -CEOS should make more because they are CEOS- It i s
what i t i s .
Debated Y
Okay with CEOs making a lot more i f
lower employees are s ti l l making l iving
wage and fa i r pay for industry and job level .
Discuss ion about these are guidel ines
for being a JUST/favorable
company but should not be enforced by
government
Provides paid time off Y Y Y Y
Handles grievances and layoffs fairly
Y Y
Related to discrimination and
communiticates transparently
Y Y
Helps workers prepare for retirement
Y Y Y Y
Promotes work life balance
Y Y Y Y
Communicates openly and transparently with
employeesY Y Y Y
Encourages employee career development
Y Y Y Y
Creates jobs in the U.S.
Y Y Y Y
If going to el iminate jobs in US for jobs
overseas , how they handle layoffs or
severance can make i t just
Number of jobs in the U.S.
Y Y Y YThe kind/qual i ty of
job matters . Not contract/1099 jobs .
NYC 5:30pm ALBUQUERQUE 7:30pm

6
Component JUST?Understanding
correct?No - how understood Other comments JUST?
Understanding correct?
No - how understood Other comments
Pays a living wage Y Y Y YAble to get by without needing ass is tance;
Pays a fair wage for industry and job level
Y Y Y Y
Discussed that there may not a lways be a
comparison for job in certa in industry
Provides a safe workplace
Y Y
Phys ica l ly safe from violence, safe from
sexual harrassment, safe protocols and procedures , safe to express opinions at
workplace (safe space)
Y Y
Phys ica l ly safe us ing equiptment/tools and a lso feel safe around
people work with
Does not discriminate in pay
Y Y Y Y
Provides access to health insurance
Y Y Y Y
Does not discriminate in hiring, firing, and
promotionY Y Y Y
Pays workers fairly compared to CEO
Y Y Y Y
Provides paid time off Y Y Y Y
Handles grievances and layoffs fairly
Y Y Y Y
Helps workers prepare for retirement
Y Y Y Y
Promotes work life balance
Y Y Y Y
Communicates openly and transparently with
employeesY Y Y Y
Encourages employee career development
Y Y Y Y
Creates jobs in the U.S.
Y Y Debated Y
Part of outsourcing i s creating best qual i ty products . Find best minds which may
come from di fferent countries
Number of jobs in the U.S.
Y Y Y Y
DETROIT 7:30pm WICHITA 5:30pm

7
Component Categories- Products and Customers
Component JUST?Understanding
correct?No - how understood Other comments JUST?
Understanding correct?
No - how understood Other comments
Does not discriminate in customer treatment
Y Y
Nuance- a i rl ines treat frequent flyers
di fferent than casual flyers
Y Y
Protects customer privacy
Y Y Y Y
Felt this was impl ied for a l l bus inesses , which was why they
didn't think of i t
Is truthful in advertising
Y Y Y Y
Provides fair sales terms
Y Unsure
Discussed in terms of price rather than sa les
terms. Later sa id everything about the sa le except the price
Came up again during fa i r pricing discuss ion
and return pol icies were mentioned
Y DebatedSaid "sa les terms" did
not make them think of return pol icy
Provides positive customer experiences
Y Y Y Y
Is accurate in labeling Y Y Y Y
Makes quality products
Y Y Y Y
Makes products that are beneficial to
health, environment, or society
Y Y Y Y
Provides fair pricing Y YRelated to fa i r sa les
termsY Y
NYC 7:30 PM ATLANTA 5:30pm

8
Component JUST?Understanding
correct?No - how understood Other comments JUST?
Understanding correct?
No - how understood Other comments
Does not discriminate in customer treatment
Y Y Y Y
Protects customer privacy
Y Y
Customers should have a say i f
companies can track or not; should at least
let customers know their purchases wi l l
be tracked
Y Y
Is truthful in advertising
Y Y Y Y
Provides fair sales terms
Y Unsure
Different prices onl ine vs . in s tore, having to pay a lot of insurance
when never had an accident, 24-month
payment for phones
Y YWarrenty, fine print, refund, return pol icy
Provides positive customer experiences
Y Y Y Y
Is accurate in labeling Y Y Y Y
Not just l i s ting components that go
into product, but a lso provide clari ty for
what i s i t and what does i t do. Would
move this to Products
Makes quality products
Y Y Debated Y
Dol lar s tore JUST because you know you're getting what
you pay for. Not necessari ly qual i ty,
but comfortable paying low price for
less qual i ty.
Makes products that are beneficial to
health, environment, or society
Debated Y
Discuss ion about personal choice when
us ing harmful products -as long as
company s tates heal th ri sk. Others thought i f harmful products , can't be
JUST
Debated Y
1. A company cannot be truly JUST i f they make a product that i s purposely harmful
(has no other benefi ts ). 2. How make products i s
more important than actual product-can
s ti l l be JUST i f product i s harmful .
Discuss ion about personal choice. As
long as transparent to customers about
product, s ti l l JUST.
Provides fair pricing Y Y
Reasonable-affordable, cheap,
less expens ive. Fa i r-right price for what
you're purchas ing, not necessari ly a low
price
Debated Y
What i s fa i r? Hard to say what's fa i r to each individual
person. There i s such a thing as ethica l pricing, but don't
particularly l ike the word fa i r. Equitable
better than fa i r.
WICHITA 7:30pm SPOKANE 5:30pm

9
Component Categories- Environment and Communities
Component JUST?Understanding
correct?No - how understood Other comments JUST?
Understanding correct?
No - how understood Other comments
Minimizes pollution Y Y Y Y
Uses environmental resources efficiently
Y Y
Mentioned environmental
resources and other resources l ike time and office suppl ies
Y YNatura l resources and
money were cons idered resources .
Has environmentally responsible
management Y Y Y Y
Does not do business with companies with
abusive conditionsY Unsure
abus ive could mean many things- environmental
abuse, animal abuse, chi ld labor, sexual harrassment. Include i f employees are abus ive in personal l ives
Y Y
Does not do business with governments that
oppress their peopleY Y Y Y
Maintains strongly relationships with
communitiesY Y Y Y
Does not cause or contribute to
international conflictsY Y Y Y
Uses local products and resourcees
Y Y Y Y
"Provide jobs wherever you do
bus iness" was s tated as a loca l resource by
one participant
Contributes to charitable causes
Y Y Y Y
ALBUQUERQUE 5:30pm DETROIT 5:30pm

10
Component JUST?Understanding
correct?No - how understood Other comments JUST?
Understanding correct?
No - how understood Other comments
Minimizes pollution Y Y Y Y
Uses environmental resources efficiently
Y Y
Us ing what we have efficiently, but a lso actively looking for
new ways to be efficient
Y Y
Has environmentally responsible
management Y Y Y Y
Does not do business with companies with
abusive conditionsDebated Y
Example of getting materia ls from prison workers -prisons are
abus ive, but opportunity to work
gave them purpose in l i fe. A JUST company
would try to fix or make better
companies with abus ive conditions . Di fference between
going in and exploi ting a
country/company and going in to try to
better the country/company
Y Y
Does not do business with governments that
oppress their peopleDebated Debated
What i s an oppress ive government? Who decides
what i s oppress ive?
Subjective-one country may think a
country i s being oppress ive and the other may think i t i s
rul ing s trongly. Supports a closed
door pol icy-should go in to help oppress ive
countries
Debated Y
Nuance of not wanting to do bus iness with
oppress ive gov't, but then hurting people
in that country
Maintains strongly relationships with
communitiesY Y Y Y
Does not cause or contribute to
international conflictsY Y
Includes companies supporting more war-mongering pol i ticians
that may be more l ikely to cause
confl ict
Debated Y
Two s ides-some may see something as good, another may
see i t as bad
Uses local products and resourcees
Y Y Y YAdd use respons ibly/
efficiently
Contributes to charitable causes
Debated Y
Debated whether motivation to
contribute to chari ties (advertis ing vs .
goodness of heart) matters . Not JUST i f
doing i t for ga in rather than to be
giving? Not just about external facing, but a lso about showing
employees .
Y Y
SAN FRANCISCO 7:30pm SPOKANE 5:30pm

11
Component Categories- Management & Shareholders
Component JUST?Understanding
correct?No - how understood Other comments JUST?
Understanding correct?
No - how understood Other comments
Follows laws and regulations
Y Y Y Y
Pays fair share of taxes Y Y Debated Y
Fair share i s tied to legal i ty; Didn't think
fa i r share should measure JUSTness , but money saved on taxes should go to
company as a whole or chari table
donations otherwise not JUST
Leaders act and communicate with
integrityY Y Y Y
Maintains integrity in financial reporting
Y Y Y Y
Makes a profit over the long term
Y Y
Thought this and provides investor
return was s imi lar/related
Y Y
Provides investor return
Y Y Debated Y
Could at times not provide investor
return with anticipation of higher
profi ts later
NYC 5:30pm ATLANTA 7:30pm

12
Component JUST?Understanding
correct?No - how understood Other comments
Follows laws and regulations
Y Y
Understood fol lows laws and regulations
as external checks and balances rather than internal checks
and balances
Pays fair share of taxes Y Y
Leaders act and communicate with
integrityY Y
Maintains integrity in financial reporting
Y Y
Makes a profit over the long term
Debated Y
Profi t not the main thing, other company
practices more important
Provides investor return
Debated Y
JUST is not an appropriate word to
discuss profi t. JUST is about moral - a
respectful company would provide
investor return but a JUST company might
not because not a moral i ssue. Investing i s not just s tocks and shares , but investing time or contributing to chari ties i s a lso
"investing"
SAN FRANCISCO 5:30pm

13
Suggested Group Names
NEW YORK CITY 5:30pm 7:30pm
Drivers: Workers, Jobs, Management & Shareholders Suggested groups: Benefits, Employee advice, Corporate Citizenship; Investors, Profitability, Leadership, Environment
Drivers: Customers, Products Suggested groups: Product; Customers, People, Experience; Society, Social responsibility
ATLANTA ALBUQUERQUE 5:30pm 7:30pm 5:30pm 7:30pm
Drivers: Customers, Products Suggested groups: Ran out of time to make groups
Drivers: Management & Shareholders Suggested groups: Internal view vs. External view; Financials
Drivers: Environment, Communities Suggested groups: Environmentally friendly, Sustainability, Earth friendly, Green; Ethics, Relationships, Socially responsible, Ethical
Drivers: Workers, Jobs Suggested groups: Employees, Benefits

14
DETROIT WICHITA 5:30pm 7:30pm 5:30pm 7:30pm
Drivers: Environment, Communities Suggested groups: Corporate ethics, Human responsibility, Clean business, International business; Communities (for local ones), global communities (for 3 international ones); Environment; In place of "Communities"-World responsibilities, local and global responsibilities
Drivers: Workers, Jobs Suggested groups: Life, Community, Utopia; External facing (number of jobs and creates jobs) vs. Internal facing (everything else)
Drivers: Workers, Jobs Suggested groups: Finance and people; Culture; External culture (jobs in U.S.) and Internal culture (everything else)
Drivers: Customers, Products Suggested groups: Customer focused; definitions of a JUST corporation; Transparency
SAN FRANCISCO SPOKANE 5:30pm 7:30pm 5:30pm 7:30pm
Drivers: Management & Shareholders Suggested groups: Ethical; Ethically successful; Fiscally responsible, Fiscal responsibility; Corporation. Felt Management is not specific enough- what kind of management, who is management?
Drivers: Environment, Communities Suggested groups: Environment, Workforce, Philosophy, Management, International strategies (3 about international conflict, abusive conditions and oppressive gov'ts), Community; Nice to have vs. Must have; New group- Global Community
Drivers: Customers, Products Suggested groups: Customer experience; Transparency and truth
Drivers: Environment, Communities Suggested groups: Not contributing to harm; Liked idea of changing communities to local and global communities
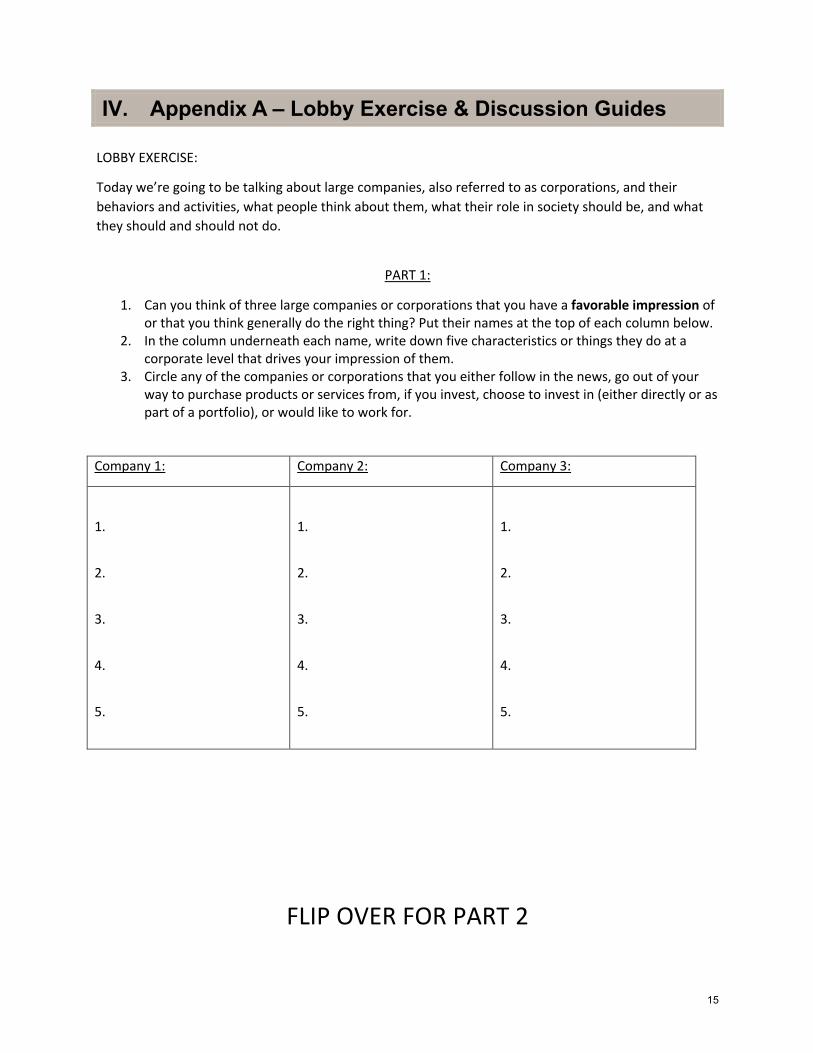
15
IV. Appendix A – Lobby Exercise & Discussion Guides
LOBBY EXERCISE:
Today we’re going to be talking about large companies, also referred to as corporations, and their behaviors and activities, what people think about them, what their role in society should be, and what they should and should not do.
PART 1:
1. Can you think of three large companies or corporations that you have a favorable impression of or that you think generally do the right thing? Put their names at the top of each column below.
2. In the column underneath each name, write down five characteristics or things they do at a corporate level that drives your impression of them.
3. Circle any of the companies or corporations that you either follow in the news, go out of your way to purchase products or services from, if you invest, choose to invest in (either directly or as part of a portfolio), or would like to work for.
Company 1: Company 2: Company 3:
1.
2.
3.
4.
5.
1.
2.
3.
4.
5.
1.
2.
3.
4.
5.
FLIP OVER FOR PART 2

16
Part 2:
1. Can you think of three large companies or corporations that you have an unfavorable impression of or that you think generally DO NOT do the right thing? Put their names at the top of each column below.
2. In the column underneath each name, write down five characteristics or things they do at a corporate level that drives your impression of them.
3. Circle any of the companies or corporations if, because of your impression of it, you AVOID buying its products and services or, if you invest, AVOID investing in its stock (either directly or as part of a portfolio).
Company 1: Company 2: Company 3:
1.
2.
3.
4.
5.
1.
2.
3.
4.
5.
1.
2.
3.
4.
5.

17
Just Capital Research Discussion Guide- Workers, Jobs Focus Group Objectives: 3) Refine the Components under each Driver for the 2018 Ranking Model
a. Validate the current set of Components, including exploring whether there are factors related to JUSTness that are not captured with the current list, or if there are any Components on the current list that are no longer important to the American public.
b. Understand if the American public’s understanding of the Components is consistent with the definition assigned by JUST.
c. Understand if the current mapping of Components to Drivers is consistent with the opinions of the American public.
4) Explore the opinions of the American public about corporate behavior broadly, including asking participants about their definition of ‘JUST’, in order to refine these definitions.
Lobby Exercise: While waiting for the groups to start in the lobby, respondents will be given a sheet of paper with an activity to do in order to get them in the right mindset and get them thinking about the topics we want to engage on. FRONT: We’re going to be talking today about large companies, also referred to as corporations, and their behaviors and activities, what people think about them, what their role in society should be, and what they should and should not do. 1. Can you think of three large companies or corporations that you have a favorable
impression of or that you think generally do the right thing? Put their names at the top of each column below.
2. In the column underneath each name, write down five things that they do at a corporate level that drives your impression of them.
3. Circle any of the companies or corporations that you either follow in the news, go out of your way purchase products or services from, if you invest, choose to invest in (either directly or as part of a portfolio), or would like to work for.
4. Where do you get information you can trust about these businesses? Flip your paper over. BACK: 5. Can you think of three large companies or corporations that you have an unfavorable
impression of or that you think generally do not do the right thing? Put their names at the top of each column below.
6. In the column underneath each name, write down five things that they do that drives your impression of them.
7. Circle any of the companies or corporations if, because of your impression of it, you avoid buying its products and services or, if you invest, investing in its stock (either directly or as part of a portfolio).
8. Where do you get information you can trust about these businesses? Please take your paper into the group with you.

18
Introduction — ~5 Mins
o Have two component cards face-down on table in front of each participant’s seat (so you do NOT have to take time handing out cards)
o Group general overview: o Please turn off your cell phones. o There’s a tendency in these groups for some people to speak at length when there’s an
issue they know about or are particularly passionate about. However, we have a lot to get through in the next 90 minutes so we will be moving along at a fairly quick pace. I may have to cut some of you off in order to move us on to another topic. If that happens, please do not take it personally. We are not looking to embarrass you. It’s just that we have limited time and a lot of material to cover.
o Additionally, there may be some of you who do not speak up much at all. I may call on you to get your opinion. Again, if I do this, it is not to embarrass you. We value your opinion and would like to hear from everyone.
o Please do not interrupt the other person when they are talking. o Lastly, and most importantly, there are no right or wrong answers. If you disagree with
one another, please feel free to verbalize that, but be respectful of the other person’s feelings.
Lobby Exercise Discussion — ~10 Mins 1) Conversation: discussion of lobby exercise • Thinking about the companies you are favorable toward …
o Why did you include these companies? o What is it about these companies that leads you to feel good about them? (Probe
if needed: What characteristics do they have?) o What things do they do that are good or admirable? (Probe if needed: What
specific behaviors?) o What about a company that you may not have ever dealt with, for example – a
company that deals with other businesses or the government (give an example of a business that operates somewhere else in the country which you’ve never dealt with – but that you have a favorable impression of)
• Thinking about the companies you are unfavorable toward …
o Why did you include these companies? o Again what are the key overall characteristics of these companies that lead you
to have a negative opinion? o What are the things they do that lead you to feel unfavorably about them? [Probe
if necessary: What specific behaviors?) o What are some of the things you wrote down on your list that we haven’t
mentioned? [Moderator will specifically ask this question to respondents who have been silent, to bring them into the conversation]
o What about a company that you may not have ever dealt with, for example – a company that deals with other businesses or the government (give an example of a business that operates somewhere else in the country which you’ve never dealt with – but that you have an unfavorable impression of)

19
● How do you know if they are doing the right thing?
o Where do you get information about these companies? o Why do you trust these sources? o Which sources do you NOT trust?
Introduce “Just” — ~ 10 Mins Does the way businesses operate matter?
1) Understand how the public would define “just” ● What words would you use to describe businesses that generally do the right thing? ● What do you think about the word “just” as a description of these businesses and behaviors?
How would you define the word just in this context? What about that word fits or doesn’t? ● IF NEEDED: By “just” we don’t mean “only,” we mean fair, equitable, balanced
– that kind of thing. ● [PRESENT DEFINITION OF JUST]. How well do you think this definition fits the term
‘JUST’ that we’ve been talking about? ● What about it works? What doesn’t?
● So, we use this term ‘JUST’ to describe businesses that operate this way – as in a concept of fair/equitable/balanced. Tonight, we’re interested in understanding what YOU think a JUST business might look like.
● Is it important for a business to be just? Why or why not? ● Are the businesses you are favorable toward “just” businesses? ● Are the businesses you are unfavorable toward “unjust” businesses? ● Are the characteristics of “just” and “unjust” businesses the same as what you
have listed? What is the same or different? ● Does “just” include doing things that are required by law and/or market
competition, or only things that are above and beyond the law and market competition?
Components — ~60 Mins For the rest of the conversation we are specifically interested in discussing large businesses, such as those that have over 5,000 employees and are among the thousand or so largest in the U.S. We’d like to have a conversation about what makes a business ‘just’, specifically related to two categories: Workers and Jobs. One last item before we start: there’s a tendency in these conversations to think about how a business would behave in order to be PROFITABLE. That is NOT what we are looking to discuss here. In this room, for our remaining time, we can “have our cake and eat it too.”
1) Brainstorm: create a list of all the issues that go into making a business just or unjust [as participants name items, write on half sheets and tape to wall] • First question. Imagine that you were writing a news story about businesses that were
‘doing the right thing’, as it relates to Workers and Jobs. What kinds of things would those be? What would be the most important thing these businesses could be doing?

20
• Imagine you were writing an advertisement about your JUST company, specifically about what your company did related to Workers and Jobs– what would be the 2-3 high level JUST things you’d want to brag about related to these topics?
• Imagine you were writing a job description about your JUST company, specifically about what your company did related to Workers and Jobs– what would be the 2-3 high level JUST things you’d want to brag about related to these topics?
[Additional prompts] ● A JUST company is…_______? ● What makes a business “just”? ● What kinds of issues would you take into consideration? ● What characteristics and behaviors does a “just” business have? ● What makes a business “unjust”? ● What kinds of issues would you take into consideration? ● What characteristics and behaviors does an “unjust” businesses have? ● How about an employee? ● Is there a difference between creating jobs in the US and internationally? Is one better/ not as good? ● Does the KIND of jobs matter? ● Does it matter if creating jobs causes other companies to lose jobs? ● Is there anything a company can do that makes it unjust even if all other practices are just?
Final Prompt: Thinking of all of the groups that businesses serve and impact—shareholders, consumers, communities, government, and employees—what’s missing from our lists?
2) Match to existing: match the existing Components to the list of unaided items on the wall. Now, we’re going to hand out a few slips of paper that have “components” of justness, that is – these components might be considered something a business does that makes it qualified to be labeled “just”. Many of these will likely look familiar – they might match what we just put on the wall! What we’d like to do is see if our list of components matches what we came up with and posted on the wall, and if there are differences. When I call on you, I’d like you read the component on your first slip, and then we can discuss, as a group, if it matches something we have, or is different in some way. Once you read your slips, we’ll match them to what’s on the wall. [Ps read Components] Great! Does that match anything we already have up?
• [If so, tape to wall on (if exact) or near it’s ‘match’) • [If not, ask]
o What does this mean to you? o Does anyone else have a different idea of what that means? o Is that similar to anything we have, or totally different? [if similar, tape near
mentioned items] [Do this for all Components in the Drivers being discussed]
3) Categorize: Place Components in to groups (Drivers) • Great! Our final task tonight is to put these components we’ve discussed in to groups.
We have quite a few issue here. Are there any of these that could be grouped together, in

21
a single larger category? [as group directs, move half sheets in to categories on the wall until all items are grouped]
• I think that’s all of them! Let’s stop for a second and think about the categories that these
components fit into. Once all showcards are on the wall, go category by category:
• Do we like these items categorized together? Are there any that don’t belong? Are there any duplicates?
• What might we call or name this category? • What’s missing in this category? Are there any items that should be here that aren’t?
• Do you think there are any items that would be better classified under Products, Customers, Environment, Communities or Management & Shareholders?
Close out MODERATOR:
• Have respondents fill out any additional profiling • Conclusion and thanks • Provide background info on JUST Capital’s purpose and interest in creating a
measurement of the most just businesses in America.

22
Process For JUST Capital 2018 Qualitative Analysis A) Background information and the purpose of the codebook
The creation of this codebook is intended to serve as a dictionary or guidebook/manual for subsequent years’ qualitative (primarily focus group) analysis. Specifically, it is meant to represent the grand total of uniquely different concepts that participants raised in the focus group discussions across all 14 cities where they were conducted in 2018. That is to say, the ideas presented in this codebook, while potentially closely related do not conceptually overlap. In 2018, this process resulted in 372 codes (i.e. ‘unique concepts’). It was designed to be exhaustive, however this list was based on the work of two researchers.
Methodology/Approach This analysis process was undertaken primarily using a ground theory framework, and then
merged with thematic analysis (given that Components were already in existence),and was done to see if there was any alignment between what this year’s participants said and the 2017 components. Grounded theory research is a “systematic method for constructing a theoretical analysis from data, with explicit analytic strategies and implicit guidelines for data collection… ‘it is an inductive, comparative, iterative, and interactive method’ (Charmaz, 2006 cited by Gubrium, Holstein, Marvasti & McKinney, 2012).
This qualitative process enables researchers to capture an image of what each driver(s) means to a sample of the American public using the words that these respondents themselves have painted. Moreover, since a pillar of JUST Capital’s work and mission is the belief that “the American people know what is best for themselves”, this collaborative approach to hearing from a representative sample of Americans speaks to that directly. These members of the public took an active co-constructive role in what a “just” corporation meant to them, which thus enhanced the value of the knowledge gained here. B) Description of the columns
The first column consisted of a unique number for each code within that Driver Grouping. That is, there may have been 76 codes for the Products and Customers driver analysis, so the numbers would be 1 to 76. However, other driver groups such as Company Leadership and Shareholders had 53 codes and that meant the numbers in that column would be 1 to 53. Specifically, any numbers in this column that are followed by a double asterisk “**” denotes that this unique concept was initially mentioned in another focus group. NB: The square notes in any codebooks refer to a slight modification of a participant’s words similar to a journalistic style when an interviewee is being coded. Moving from left to right, the column titled “code name” gives the name of the code (i.e. unique concept) that was identified in one or more focus groups. They were derived from the data (not from any extant theory or literature) and as much as possible were “in vivo” codes meaning that the speaker’s own language was used to create the code. This is also, in general, in line with approaches taken by those who do grounded theory research. Furthermore, the column titled “references (# if an original code)” is not necessarily equal to the number of individual, unique mentions. Rather, for analyses reasons it was the number of times that a certain comment was coded as a particular code, and this may have come from the same person or different people making the same comment. The software used simply quantifies the number of times a comment is coded as a specific code, as per what the researcher has chosen. That is, it is not always representative of a net number of mentions. Also, any cells that have a “NEW” written in them refer to codes which were not initially created in the original coding process in NVivo 11 and only upon categorization were made. The column named “Content Description” gave a brief description of what this code encompassed. Generally, one to two sentences describing and defining the idea. Furthermore, “example/ direct quotes (representative)” were verbatim quotes pulled from across different transcripts. The column called “Driver/Superordinate codes (Level 2, if applicable)” refers to whether that specific code (if thought about in a hierarchy) would fall under a 2018 driver. The last column contains the numerical value of the

23
number of times a portion of text was coded a specific code. Moreover, the column titled “Code inclusion and exclusions criteria (if applicable)” referred to specifics as to what main idea(s) would typically fit into/be appropriate for any comments coded as that code. In terms of exclusion criteria, it may also include a simple negative case identification as well (i.e. what would NOT fit into this code though it may seem similar. However, where the deviation occurs from a traditional grounded theory approach is that when we got to the secondary iteration and more advanced axial coding stage (referred to as “theme” or “level 2”), because components from 2017 were already in existence, the researchers explored whether there would be a matching between this year’s codes and last year’s components. If this was the case, it would be indicated in the column called “Map onto 2018 Component/Theme (Level 2). If there was not, this was noted in the “2018 Component (Y/N)” column with an “N”. The column titled “Notes” contains descriptions of the rationale behind why some codes were thought of as falling under a certain 2018 component and not another. Such cells were filled when a specific code could arguably fall under another component. To illustrate, “value for the money” was categorized as being part of “provides fair prices” and not “makes quality products” primarily because the context in which the respondent discussed the subject, it pertained more to a pricing issue than a quality issue. Conversely, it could be said that idea of value for the money exists at the intersection of price and quality. Lastly, the column called “Driver/Superordinate Codes (Level 3, if applicable)” contains which driver each code would map onto at a higher level

24
See example images below of a) and b) focus group brainstorm, c) opening coding with preliminary categorization, c) final codebook and d) landscape summary of final codes. A.
B.
C.

25

26
D.
E. F. to I.

27

28
C) Analysis
C1) How Themes Were Derived and Components were Matched Part of qualitative inquiry involves coding. “A code is most often a word or short phrase that
symbolically assigns a summative, salient, essence-capturing and/or evocative attribute for a portion of

29
language-based or visual data” (Saldana, 2009, p.3). In particular, NVivo 11 (a qualitative software package) was used to facilitate the coding process and analysis. In order to move from preliminary to the final codes, to themes, it required codifying and categorizing. Many codes were then subsumed under themes. Themes comprised of broader, higher-level ways to organize the same concept e.g. “stands behind their products” would include codes about backing up the value, willing to do whatever they need to do and having a return policy. In total, there were 15 themes for Products and Customers, X for Workers and Jobs, Y for Management & Shareholders and Z for Environment and Communities.
Transcripts were analyzed for individual and unique meaningful pieces of information that
pertained to examples of “ways in which a corporation is just when it comes to [insert driver].” Those responses from the brainstorm session were what were analyzed. A single coder read through all 14 transcripts and created the initial and original codes. Portions of text which relayed the same concept were identified as recurrent and thus coded the same. Text could also be double or triple coded if many ideas were referred to in the statement and specific elements were not meaningful to parse out. However, even this part of the process was not done in complete isolation, such that the researcher would at times seek insight and feedback from the second researcher. Following this, axial coding occurred such that related ideas were either collapsed or merged, or mini hierarchies were created. This process was done in an iterative manner accounting for the context in which the respondent made the comment and what was most intuitive.
**It should be made clear that this analysis also deviated from the traditional grounded theory
process in that part of the analysis was done with the 2017 components in mind AND no theory was ultimately created**
C2) Specifics of qualitative methodology Across all 14 focus groups, there was an even split of the 120 females and males. Furthermore, using the midpoint of ranges and actual participant reporting of ages, the mean age was 46 years old. Analysis: If coding was used, be sure to state how many people were involved in co-coding. If more than one coder was used, explain how consistency–if viewed as important–was established between coders and how conflicts were resolved. In addition, describe the steps taken to increase the credibility, transferability, auditability, confirmability, or other goodness metrics related to the findings. These can include peer debriefing, audit trail, negative case analysis, prolonged engagement, triangulation of data, and member checking Co-coding scheme There was a sole coder who coded all 14 transcripts. Codes were added successively as needed and sometimes revised to better reflect what the participant said. This was then followed by a second researcher reviewing all the candidate codes in a sequential fashion, then made recommendations regarding the sufficiency of data to support particular codes. Furthermore, the two coders then met to determine which codes needed to be merged or, separated if two different ideas were identified in the statement that was coded. If this was the case, in general the original transcript was not edited (in order to remain authentic to the original iteration) and only the codebook was changed to reflect this. Description of the coding tree A description of the coding scheme is described in Part B. Currently there is no single coding tree, this is because the codes were grouped according to the focus group driver they were referenced in or, if it was explicitly about one issue versus another. Though there exists a family tree for each of the driver groups and the level 2 themes that emerged. Quotations presented
30
Participants words were used as verbatim codes as often as possible. Though some were slightly reworded. (No participant numbers because participants were not individual identified in focus groups, this was not an interview or case study.) Clarity of major and minor themes Codes were organized into a taxonomy such that what are referred to here as emergent themes, served as the second level (of three levels) in the hierarchy. [Code à theme/component match à driver]. These were either mapped onto a present component or some other higher-level idea. All codes were derived bottom-up then a separate column was made that delineated between which had a corresponding 2018 component (with codes subsumed). Minor codes were initially grouped together at the second level as miscellaneous, then upon subsequent meeting between the two researchers, they reconceptualized the code and explored where it best fit. (In the rare cases that it did not, these codes remained as “outliers”/ diverse cases that could not be classified and this was noted.) E) Ways that validity and reliability were promoted in the analysis During each focus group, member checks were also employed such that the moderator would repeat back or summarize a point made by a participant to determine and verify the accuracy of the data being collected in the moment. As such, internal coherence was established across the coding scheme and relatively clear distinctions between codes could be made. Though, it should be noted that no concrete numerical intercoder reliability rating was attempted, as the overarching goal was consensus, thus difference in opinion regarding a code was debated and discussed until an agreement was reached. Furthermore, a cornerstone of the methodology was the pertinence of ensuring representativeness across the country, across focus groups, hence bolstering transferability regarding the inferences that could be drawn.

31

32

33
Client JUST Capital Project Name Driver Study 2018 Project Number 8268 Survey length (median) 15 minute survey Population 18+ gen pop Pretest N/A Main N=3500 MODE Web and Phone Language English/Spanish Incentive 3,000 Survey description Driver Study 2018 Eligibility Rate 100%

34
PHONE SCRIPTS [CATI - OUTBOUND] INTRO Hello, my name is $I. I'm calling from AmeriSpeak by NORC. May I please speak with [FIRSTNAME]? Hola, mi nombre es $I. Lo estoy llamando de AmeriSpeak del NORC. ¿Podría hablar con [FIRSTNAME]?
[IF RESPONDENT IS AVAILABLE] Thank you for your continued participation in AmeriSpeak. I am calling to let you know that your next survey is available. The survey takes approximately [SURVEYLENGTH] minutes to complete. If you complete the survey, you will receive [INCENTWCOMMA] AmeriPoints for your time. We will keep all of your answers confidential. Shall we proceed? Gracias por su participación continúa en AmeriSpeak. Le estoy llamando para informarle que su próxima encuesta está lista. La encuesta toma aproximadamente [SURVEYLENGTH] minutos para completar. Si completa la encuesta, recibirá [INCENTWCOMMA] AmeriPoints por su tiempo. Mantendremos todas sus respuestas confidenciales. ¿Desea que procedamos? Great. As always, for quality assurance purposes, this call may be recorded or monitored. Excelente. Esta llamada puede ser grabada o monitoreada.
[CATI-INBOUND] INTRO Thank you for calling AmeriSpeak by NORC. My name is $I. How are you today? Gracias por llamar a AmeriSpeak de NORC. Mi Nombre es $I. ¿Cómo está hoy? And are you calling to take your next survey? ¿Y está llamando para tomar su próxima encuesta? I just need to confirm that I'm speaking with [FIRSTNAME] [LASTNAME]. Is that you? Sólo necesito confirmar que estoy hablando con [FIRSTNAME] [LASTNAME]. ¿Sería usted? Great. This survey takes approximately [SURVEYLENGTH] minutes to complete over the phone and you will earn [INCENTPOINTS] AmeriPoints for your time. We will keep all of your answers confidential. Excelente. Esta encuesta dura aproximadamente [SURVEYLENGTH] minutos para completar a través del teléfono y usted ganará [INCENTWCOMMA] AmeriPoints por su tiempo. Mantendremos todas sus respuestas confidenciales. As always, for quality assurance purposes, this call may be recorded or monitored. Esta llamada puede ser grabada o monitoreada. Shall we proceed? ¿Desea que procedamos? Text shown in green includes researcher notes and should not be included in the programming. Text shown in purple indicates Spanish translation that should be incorporated into the Spanish version of the survey

35
[DISPLAY – WINTRO_1] Thank you for agreeing to participate in our new AmeriSpeak survey! To thank you for sharing your opinions, we will give you a reward of [INCENTWCOMMA] AmeriPoints after completing the survey. As always, your answers are confidential. ¡Gracias por participar en nuestra nueva encuesta de AmeriSpeak! Para agradecerle por compartir su opinión, le daremos una recompensa de [INCENTWCOMMA] AmeriPoints después de completar esta encuesta. Como siempre, sus respuestas son confidenciales. Please use the "Continue" and "Previous" buttons to navigate between the questions within the questionnaire. Do not use your browser buttons. Por favor utilice los botones “Continuar” y “Anterior” para navegar entre las preguntas del cuestionario. No utilice los botones de su navegador. [DISPLAY – INTRO2] This survey is about large public companies, also called corporations. Your responses to the questions that follow are important, no matter how much you currently know or don’t know about corporations and their behavior. This survey will take approximately 10 minutes to complete. Esta encuesta trata sobre grandes empresas, también llamadas corporaciones. Sus respuestas a las siguientes preguntas son importantes, sin importar cuánto sabe o no sabe actualmente sobre las corporaciones y sus comportamientos. Le tomará aproximadamente 10 minutos completar esta encuesta. [SP] Q1. How much do you trust or distrust companies? ¿Cuánto confía o desconfía usted de las empresas? SHOW IF RND_05=0 RESPONSE OPTIONS:
1. Trust a great deal 2. Trust somewhat 3. Distrust somewhat 4. Distrust a great deal 77. Don’t know [ANCHOR] 1. Confío mucho 2. Confía algo 3. Desconfío un poco 4. Desconfío mucho 77. No lo sé [ANCHOR]
SHOW IF RND_05=1 RESPONSE OPTIONS:
1. Distrust a great deal 2. Distrust somewhat 3. Trust somewhat 4. Trust a great deal 77. Don’t know [ANCHOR] 1. Desconfío mucho 2. Desconfío un poco

36
3. Confía algo 4. Confío mucho 77. No lo sé [ANCHOR]
[SP] Q2. In general, do you think the behavior of companies is going in the right direction or in the wrong direction? En general, ¿cree usted que el comportamiento de las empresas va en la dirección correcta o en la dirección incorrecta? ROTATE RESPONSE OPTIONS:
1 Right direction 2 Wrong direction 77 Don’t know [ANCHOR] 1 Dirección correcta 2 Dirección equivocada 77 No lo sé [ANCHOR]
[DISPLAY – IntroMaxdiff] In this survey, we’ll ask you questions about what makes a company <u>just</u>. A <u>just</u> company is ethical, honest, and fair and behaves this way when it comes to its employees, customers, shareholders, and the environment, as well as the communities it impacts locally and around the world. We want to know what specific behaviors are most important to you in making a company <u>just</u>. En esta encuesta, le realizaremos preguntas sobre lo que hace que una empresa <u>sea justa</u>. Una empresa<u>justa</u> es ética, honesta, y justa y se comporta de esta forma con sus empleados, clientes, accionistas, y el medio ambiente, así como con las comunidades en las que tiene impacto a nivel local y mundial. Queremos saber qué comportamientos específicos son más importantes para usted para hacer a una empresa <u>justa</u>. [CATI] In the next section, I will read several categories of ways a company can exhibit <u>just</u> behavior. For each question, please tell me which of the three categories of behaviors is <u>most</u> important in evaluating how <u>just</u> a company is, and which category is <u>least</u> important in evaluating how <u>just</u> a company is. En esta encuesta, le realizaremos preguntas sobre lo que hace que una empresa <u>sea justa</u>. Una empresa<u>justa</u> es ética, honesta, y justa y se comporta de esta forma con sus empleados, clientes, accionistas, y el medio ambiente, así como con las comunidades en las que tiene impacto a nivel local y mundial. Queremos saber qué comportamientos específicos son más importantes para usted para hacer a una empresa <u>justa</u>. [SPACE] [CAWI] In the next section, you will be shown several categories of ways a company can exhibit <u>just</u> behavior. For each question, please indicate which of the three categories of behaviors is <u>most</u> important in evaluating how <u>just</u> a company is, and which category is <u>least</u> important in evaluating how <u>just</u> a company is. [CAWI] En la siguiente sección, le mostraremos varias categorías de formas en las que una empresa puede mostrar su comportamiento <u>justo</u>. Para cada pregunta, por favor indique cuál de las tres categorías de comportamiento es <u>más</u> importante al evaluar cuán <u>justa</u> es una empresa, y cuál categoría es <u>menos</u> importante al evaluar cuán <u>justa</u> es una empresa.

37
[CATI] In the next section, I will read several categories of ways a company can exhibit <u>just</u> behavior. For each question, please tell me which of the three categories of behaviors is <u>most</u> important in evaluating how <u>just</u> a company is, and which category is <u>least</u> important in evaluating how <u>just</u> a company is. [CATI] En la siguiente sección, le voy a leer varias categorías de formas en las que una empresa puede mostrar su comportamiento <u>justo</u>. Para cada pregunta, por favor dígame cuál de las tres categorías de comportamiento es <u>más</u> importante al evaluar cuán <u>justa</u> es una empresa, y cuál categoría es <u>menos</u> importante al evaluar cuán <u>justa</u> es una empresa. [SPACE] [CAWI] There are 7 questions in this section. While these questions might seem repetitive, please review each one carefully. Thank you. [CAWI Hay 7 preguntas en esta sección. Aunque estas preguntas puedan parecerle repetitivas, por favor revise cada una de ellas cuidadosamente. Gracias. [CATI] There are 7 questions in this section. While these questions might seem repetitive, please consider each one carefully. Thank you. [CATI] Hay 7 preguntas en esta sección. Aunque estas preguntas puedan parecerle repetitivas, por favor revise cada una de ellas cuidadosamente. Gracias. MAXDIFF DESIGN – see JUST Driver_DesignFile.csv 100 VERSIONS – Stats will preload P_VERSION however CS team needs to have testing-only page Each version has 7 sets (questions Q3A-Q3G) Each of the 7 sets will insert 3 of the 7 drivers below: WORKERS: How a company treats its employees and contractors, including fair pay, good benefits, and safe working conditions TRABAJADORES: Cómo una empresa trata a sus empleados y contratistas, incluyendo paga justa, buenos beneficios, y condiciones laborales seguras CUSTOMERS: How a company treats its customers, including providing positive experiences, protecting their privacy, and providing fair sales terms CLIENTES: La forma en que una empresa trata a sus clientes, incluyendo brindar experiencias positivas, proteger su privacidad, y brindar términos y condiciones de ventas justos COMPANY LEADERSHIP & SHAREHOLDERS: How a company’s leadership acts ethically and with integrity, achieving long-term financial growth, and creating value for its shareholders LÍDERES & ACCIONISTAS DE LA EMPRESA: La forma en que los líderes de una empresa actúan en forma ética y con integridad, alcanzando crecimiento financiero a largo plazo, y generando valor para sus accionistas ENVIRONMENT: A company’s environmental impact, including overall environmental responsibility, using resources efficiently, and minimizing pollution MEDIO AMBIENTE: El impacto medioambiental de una empresa, incluyendo la responsabilidad medioambiental general, utilizando los recursos eficientemente, y minimizando la contaminación COMMUNITIES IN THE US & ABROAD: How a company manages risks to human rights internationally, including minimizing forced labor or operating in countries with oppressive governments, and how it engages with local communities COMUNIDADES EN LOS ESTADOS UNIDOS & EN EL EXTERIOR: Cómo una empresa maneja los riesgos de derechos humanos internacionalmente, incluyendo la minimizar el trabajo forzado u operar en países con gobiernos opresivos, y cómo se compromete con comunidades locales

38
PRODUCTS: A company’s products and services, including fair pricing and quality, as well as the benefit or harm of the product PRODUCTOS: Los productos y servicios de una empresa, incluyendo precios y calidad justos, así como el beneficio y perjuicio del producto JOBS: The positive impact a company has on the job market in the U.S., including the number of people the company employs and the number of new jobs created EMPLEOS: El impacto positivo que una empresa tiene en el mercado laboral en los Estados Unidos, incluyendo el número de personas que la empresa emplea y el número de nuevos empleos que crea NOTE: THE BELOW IS AN EXAMPLE OF HOW THE MAXDIFF QUESTION SHOULD LOOK ON SCREEN [GRID, SP VERTICAL; prompt twice for each Q3A_Most/Q3A_Least] [custom prompt if “most important” column is left blank: “We would really like your answer for the <u>most</u> important behavior question.”] [custom prompt if “most important” column is left blank: “Realmente nos gustaría su respuesta para la pregunta sobre el comportamiento <u>más</u> importante.”] [custom prompt if “least important” column is left blank: “We would really like your answer for the <u>least</u> important behavior question.”] [custom prompt if “least important” column is left blank: “Realmente nos gustaría su respuesta para la pregunta sobre el comportamiento <u>menos</u> importante.”] [custom prompt if both columns are left blank: “We would really like your answer to this question.”] [custom prompt if both columns are left blank: “Realmente nos interesa su respuesta a esta pregunta.”] Q4 (example). In your opinion, which of these behavior categories is <u>most</u> important in evaluating how JUST a company is, and which of these behavior categories is <u>least</u> important? En su opinión, ¿cuál de estas tres categorías de comportamiento es <u>más</u> importante al evaluar cuán JUSTA es una empresa, y cuál de estas categorías de comportamiento es <u>menos</u> importante? [CAWI – remove bold] <i>Select one response in <u>each</u> column. </i> [CAWI – remove bold] <i> Seleccione una respuesta en <u> cada </u> columna. </i>
Q3A_Most Most important
Which item is <u>most</u> important and which item is <u>least</u> important?
Q3A_Least Least important
o WORKERS: How a company treats its employees and contractors, including fair pay, good benefits, and safe working conditions
o
o COMPANY LEADERSHIP & SHAREHOLDERS: How a company’s leadership acts ethically and with integrity, achieving long-term financial growth, and creating value for its shareholders
o
o CUSTOMERS: How a company treats its customers, including providing positive experiences, protecting their privacy, and providing fair sales terms
o
Q3A_Most
Más importante ¿Qué ítem es <u>más</u> importante y qué ítem es <u>menos</u> importante?
Q3A_Least

39
Menos importante
o TRABAJADORES: Cómo una empresa trata a sus empleados y contratistas, incluyendo paga justa, buenos beneficios, y condiciones laborales seguras
o
o LÍDERES & ACCIONISTAS DE LA EMPRESA: La forma en que los líderes de una empresa actúan en forma ética y con integridad, alcanzando crecimiento financiero a largo plazo, y generando valor para sus accionistas.
o
o CLIENTES: La forma en que una empresa trata a sus clientes, incluyendo brindar experiencias positivas, proteger su privacidad, y brindar términos y condiciones de ventas justos.
o
[SP][ROTATE RESPONSE OPTIONS] Q35. Do you think the top priority for companies in this country right now is their shareholders, their employees, or their customers? ¿Cree usted que las principales prioridades de las empresas en este país hoy en día son sus accionistas, sus empleados, o sus clientes? CAWI RESPONSE OPTIONS:
1. Their shareholders 2. Their employees 3. Their customers
1. Sus accionistas 2. Sus empleados 3. Sus clientes
CATI RESPONSE OPTIONS:
1. THEIR SHAREHOLDERS 2. THEIR EMPLOYEES 3. THEIR CUSTOMERS
1. SUS ACCIONISTAS 2. SUS EMPLEADOS 3. SUS CLIENTES
[SP] Q36. Which one of the following statements comes closest to your view? ¿Cuál de los siguientes enunciados se acerca más a su punto de vista? ROTATE RESPONSE OPTIONS:
1. Companies do not share enough of their success with their employees

40
2. Companies generally share a fair amount of their success with their employees 3. Companies share too much of their success with their employees
1. Las empresas no comparten lo suficiente de su éxito con sus empleados 2. Las empresas generalmente comparten una cantidad justa de su éxito con sus empleados 3. Las empresas comparten demasiado de su éxito con sus empleados
Q5: SPLIT SAMPLE (50% Q5a / 50% Q5b) [SHOW IF RND_01=0] Q5A.
Which one of these two perspectives comes closest to your opinion? ¿Cuál de las siguientes dos perspectivas se acerca más a su opinión? RESPONSE OPTIONS: 1. Some people think CEOs of large companies <u>do have</u> a responsibility to take a stand on important social issues. 2. Other people think CEOs of large companies <u>do not have</u> a responsibility to take a stand on important social issues. 1. Algunas personas creen que los Directores Generales de las grandes empresas <u>tienen</u> la responsabilidad de adoptar una posición en temas sociales importantes. 2. Otras personas piensan que los Directores Generales de las grandes empresas <u>no tienen</u> la responsabilidad de adoptar una posición en temas sociales importantes. [SHOW IF RND_01=1] Q5B.
Which one of these two perspectives comes closest to your opinion? ¿Cuál de las siguientes dos perspectivas se acerca más a su opinión? RESPONSE OPTIONS: 1. Some people think CEOs of large companies should take a stand on important social issues – no matter what the issue. 2. Other people think that CEOs of large companies should take a stand on important social issues – but only if the issues are related to their business. 1. Algunas personas creen que los Directores Generales de las grandes empresas deberían tomar una posición en temas sociales importantes – sin importar el tema. 2. Otras personas piensan que los Directores Generales de las grandes empresas deberían tomar una posición en temas sociales importantes – pero solo si están relacionados a sus negocios. [SP] Q6.

41
Remember that a <u>just</u> company is ethical, honest, and fair and behaves this way when it comes to its employees, customers, shareholders, and the environment, as well as the communities it impacts locally and around the world. Recuerde que una empresa <u>justa</u> es ética, honesta, y comporta de esta forma con sus empleados, clientes, accionistas, y el medio ambiente, así como con las comunidades en las que tiene impacto a nivel local y mundial. [SPACE] Imagine you’re <u>considering accepting a job</u> and have to choose between two companies. The companies are similar in many ways, but differ in <u>how just the company is</u> and <u>how much the job pays</u>. Imagine que usted está <u>considerando aceptar un empleo</u> y tiene que elegir entre dos empresas. Las empresas son parecidas en varios aspectos, pero difieren en <u>cuán justa la empresa es</u> y <u>en cuánto pagan</u>. [SPACE] Company A is <u>more just</u> but <u>pays less</u>. Company B is <u>less just</u>, but <u>pays more</u>. La Empresa A es <u>más justa</u> pero <u>paga menos</u>. La Empresa B es <u>menos justa</u>, pero <u>paga más</u>. [SPACE] First, to keep this question relevant for you, which one of the following annual salary ranges is closest to the typical annual salary for the type of work you do, or have done? This is only to make the question relevant to you; all of your answers will be kept strictly confidential. Primero, para que esta pregunta sea relevante para usted, ¿cuál de los siguientes rangos salariales anuales se acerca más al típico salario anual del tipo de trabajo que usted hace, o ha hecho? Esto es sólo para realizar la pregunta de forma que sea relevante para usted; todas sus respuestas serán estrictamente confidenciales. RESPONSE OPTIONS:
1. Less than $24,999 2. $25,000 to $49,999 3. $50,000 to $74,999 4. $75,000 to $99,999 5. $100,000 to $149,999 6. $150,000 or more 7. Decline to say
1. Menos de $24,999 2. $25,000 a $49,999 3. $50,000 a $74,999 4. $75,000 a $99,999 5. $100,000 a $149,999 6. $150,000 o más 7. Me niego a contesta
[SP] Q7.
[CAWI] Please look carefully at the information below. Which company would you choose – Company A or Company B? If you are not currently looking for work, <u>imagine what you would do</u> if you had to make that decision today.

42
Por favor mire con atención la siguiente información. ¿Qué empresa usted elegiría – Empresa A o Empresa B? Si actualmente no está buscando trabajo, <u>imagine qué usted haría</u> si tuviera que tomar la decisión hoy. [CATI] Please carefully consider the following information. Which company would you choose – Company A or Company B? If you are not currently looking for work, <u>imagine what you would do</u> if you had to make that decision today. [CATI] Por favor considere con atención la siguiente información. ¿Qué empresa usted elegiría – Empresa A o Empresa B? Si actualmente no está buscando trabajo, <u>imagine qué usted haría</u> si tuviera que tomar la decisión hoy. [SHOW IF P_CHOOSE=1] NO MENTION OF MONEY CONDITION
Company A More Just Pays Less
Company B Less Just
Pays More
More just means more honest and fair when it comes to its employees, customers, the environment, investors, as well as the
communities it impacts locally and around the world.
Less just means less honest and fair when it comes to its employees, customers, the environment,
investors, as well as the communities it impacts locally and around the world.
Empresa A Más Justa
Paga Menos
Empresa B Menos Justa
Paga Más
Más simplemente significa más honesta y justa en lo que respecta al trato con sus empleados,
clientes, el medio ambiente, inversores, así como con las comunidades en las que tiene
impacto a nivel local y mundial.
Menos simplemente significa menos honesta y justa en lo que respecta al trato con sus empleados, clientes, el medio ambiente,
inversores, así como con las comunidades en las que tiene impacto a nivel local y mundial.
[SHOW IF P_CHOOSE=2] PAYS 10% CONDITION
Company A More Just Pays Less
Company B Less Just
Pays More
More just means more honest and fair when it comes to its employees, customers, the environment, investors, as well as the
communities it impacts locally and around the world.
Less just means less honest and fair when it comes to its employees, customers, the environment,
investors, as well as the communities it impacts locally and around the world.
Pays 10% Less [IF Q6=$25,000-$49,999 THEN INSERT 10% LESS AMOUNT OF: $3,750; IF
Q6=7 OR 98 OR 77 OR 99 THEN USE $50,000-74,999 RANGE]
Approximately $3,750
Pays 10% More [IF Q6 =$25,000-$49,999 THEN INSERT 10% MORE AMOUNT OF: $3,750; IF Q6=7 OR 98 OR 77 OR 99 THEN USE $50,000-
74,999 RANGE] Approximately $3,750

43
Empresa A Más Justa
Paga Menos
Empresa B Menos Justa
Paga Más
Más simplemente significa más honesta y justa en lo que respecta al trato con sus empleados,
clientes, el medio ambiente, inversores, así como con las comunidades en las que tiene
impacto a nivel local y mundial.
Menos simplemente significa menos honesta y justa en lo que respecta al trato con sus empleados, clientes, el medio ambiente,
inversores, así como con las comunidades en las que tiene impacto a nivel local y mundial.
Paga 10% Menos [IF Q6=$25,000-$49,999 THEN INSERT 10% LESS AMOUNT OF:
$3,750; IF Q6=7 OR 98 OR 77 OR 99THEN USE $50,000-74,999 RANGE]
Aproximadamente $3,750
Paga 10% Más [IF Q6 =$25,000-$49,999 THEN INSERT 10% MORE AMOUNT OF: $3,750; IF Q6=7 OR 98 OR 77 OR 99 THEN USE $50,000-
74,999 RANGE] Aproximadamente $3,750
USE THIS TABLE BELOW FOR 10% AND 20% INSERT DATA Fill
Range $0-24,999 $25,000 - $49,999
$50,000 - $74,999
$75,000 - $99,999
$100,000 - $149,999
$150,000 +
Mid-point $12,500 $37,500 $62,500 $87,500 $125,00 $150,000 10% $1,250 $3,750 $6,250 $8,750 $12,500 $15,000 20% $2,500 $7,500 $12,500 $17,500 $25,000 $30,000
Rango $0-24,999 $25,000 -
$49,999 $50,000 - $74,999
$75,000 - $99,999
$100,000 - $149,999
$150,000 +
Punto medio
$12,500 $37,500 $62,500 $87,500 $125,00 $150,000
10% $1,250 $3,750 $6,250 $8,750 $12,500 $15,000 20% $2,500 $7,500 $12,500 $17,500 $25,000 $30,000
**Use 50-74,999 category if “decline to say.” [SHOW IF P_CHOOSE=3] PAYS 20% MORE CONDITION
Company A More Just Pays Less
Company B Less Just
Pays More
More just means more honest and fair when it comes to its employees, customers, the environment, investors, as well as the
communities it impacts locally and around the world.
Less just means less honest and fair when it comes to its employees, customers, the environment,
investors, as well as the communities it impacts locally and around the world.
Pays 20% Less [IF Q6=$100,000-$150,000 THEN INSERT 20% LESS AMOUNT OF:
$25,000; IF Q6=7 OR 98 THEN USE $50,000-74,999 RANGE]
Pays 20% Less [IF Q6=$100,000-$150,000 THEN INSERT 20% MORE AMOUNT OF: $25,000; IF
Q6=7 OR 98 THEN USE $50,000-74,999 RANGE]

44
Approximately $25,000 Approximately $25,000
Empresa A Más Justa
Paga Menos
Empresa B Menos Justa
Paga Más
Más simplemente significa más honesta y justa en lo que respecta al trato con sus empleados,
clientes, el medio ambiente, inversores, así como con las comunidades en las que tiene
impacto a nivel local y mundial.
Menos simplemente significa menos honesta y justa en lo que respecta al trato con sus empleados, clientes, el medio ambiente,
inversores, así como con las comunidades en las que tiene impacto a nivel local y mundial.
Paga 20% Menos [IF Q6=$100,000-$150,000 THEN INSERT 20% LESS AMOUNT OF:
$25,000; IF Q6=7 OR 98 THEN USE $50,000-74,999 RANGE]
Aproximadamente $25,000
Paga 20% Menos [IF Q6=$100,000-$150,000 THEN INSERT 20% MORE AMOUNT OF:
$25,000; IF Q6=7 OR 98 THEN USE $50,000-74,999 RANGE]
Aproximadamente $25,000 USE THIS TABLE BELOW FOR 10% AND 20% INSERT DATA Fill
Range $0-24,999 $25,000 - $49,999
$50,000 - $74,999
$75,000 - $99,999
$100,000 - $149,999
$150,000 +
Mid-point $12,500 $37,500 $62,500 $87,500 $125,00 $150,000 10% $1,250 $3,750 $6,250 $8,750 $12,500 $15,000 20% $2,500 $7,500 $12,500 $17,500 $25,000 $30,000
Rango $0-24,999 $25,000 -
$49,999 $50,000 - $74,999
$75,000 - $99,999
$100,000 - $149,999
$150,000 +
Punto medio
$12,500 $37,500 $62,500 $87,500 $125,00 $150,000
10% $1,250 $3,750 $6,250 $8,750 $12,500 $15,000 20% $2,500 $7,500 $12,500 $17,500 $25,000 $30,000
**Use 50-74,999 category if “decline to say.” RESPONSE OPTIONS:
1. Company A 2. Company B
1. Empresa A 2. Empresa B
[GRID 5,4; SP] Q47. Now imagine that you’re considering [INSERT IF RND_04=0: accepting a job] [INSERT IF RND_04=1: buying a product] from a company. How important would each of the following be in your choice? Ahora imagine que usted está considerando [INSERTAR SI RND_04=0: aceptar un empleo] [INSERTAR SI RND_04=1: comprar un producto] de una empresa. ¿Cuán importante sería cada una de las siguientes cosas en su elección?

45
GRID ITEMS: A. The company provides paid parental leave for all of its workers. B. The company provides full-time hours for employees who want to work full-time. C. The company provides training and opportunities for career advancement. D. The company provides health care benefits for employees. E. The company has non-discrimination and anti-sexual harassment policies in place. F. The company is environmentally responsible. G. The company focuses on creating jobs in the U.S. H. The company contributes to charitable causes and gives back to communities. I. The company helps employees find meaning in their work.
A. La empresa brinda licencia parental paga para todos sus empleados. B. La empresa brinda horario completo para empleados que deseen trabajar a tiempo completo. C. La empresa brinda capacitación y oportunidades de crecimiento. D. La empresa brinda beneficios de atención de salud a sus empleados. E. La empresa tiene políticas no discriminatorias y anti-acoso sexual. F. La empresa sea ecológicamente responsable G. La empresa se focalice en crear empleos en Estados Unidos H. La empresa contribuye con causas de caridad y devuelve a la comunidad. I. La empresa ayuda a los empleados a encontrar el sentido en sus trabajos.
RESPONSE OPTIONS:
1. Very important 2. Somewhat important 3. Not very important 4. Not at all important
1. Muy importante 2. Algo importante 3. No muy importante 4. Para nada importante
[SP] Q47J. Which <u>one</u> of the following would be <u>most important</u> in your choice/decision?
¿Cuál <u> </u> de las siguientes opciones sería <u>más importante</u> en su elección/decisión?
RESPONSE OPTIONS:
1. The company provides paid parental leave for new parents. 2. The company provides full-time hours for employees who want to work full-time. 3. The company has policies and opportunities for career advancement within the company. 4. The company provides health care benefits for employees. 5. The company has non-discrimination and anti-sexual harassment policies in place. 6. The company is environmentally responsible. 7. The company focuses on creating jobs in the U.S. 8. The company contributes to charitable causes. 9. The company helps employees find meaning in their work.
1. La empresa brinda licencia parental paga para los futuros padres.

46
2. La empresa brinda horario completo para empleados que deseen trabajar a tiempo completo. 3. La empresa tiene políticas y oportunidades de crecimiento dentro de la empresa. 4. La empresa brinda beneficios de atención de salud a sus empleados. 5. La empresa tiene políticas no discriminatorias y anti-acoso sexual. 6. La empresa sea ecológicamente responsable 7. La empresa se focalice en crear empleos en Estados Unidos 8. La empresa contribuye con causas caritativas. 9. La empresa ayuda a los empleados a encontrar el sentido en sus trabajos.
[SP] Q48. How effective do you think ordinary people can be when they act together to try to change companies’ behaviors? ¿Cuán efectivas cree usted que pueden ser las personas comunes cuando actúan juntas para intentar cambiar los comportamientos de las empresas? RESPONSE OPTIONS: [SHOW IF RND_02=0]
1. Very effective 2. Somewhat effective 3. Not very effective 4. Not effective at all
1. Muy efectivo 2. Algo efectivo 3. No muy efectivo 4. Nada efectivos
[SHOW IF RND_02=1]
1. Not effective at all 2. Not very effective 3. Somewhat effective 4. Very effective
1. Nada efectivos 2. No muy efectivo 3. Algo efectivo 4. Muy efectivo
ROTATE Q8aPositive and Q8a Negative, and ROTATE items within each list. Q8aOther last.
PROGRAMMING NOTE: ROTATE ORDER OF Q8aP/Q8b AND Q8aN/Q8b_2, KEEP Q8aO LAST.
[MP] Q8aP. Which of the following, if any, have you <u>ever</u> done to show <u>your support</u> for a company’s <u>positive</u> behavior?

47
¿Cuál de las siguientes opciones, si alguna, ha hecho usted <u>alguna vez</u> para demostrar <u>su apoyo</u> al comportamiento <u>positivo</u> de una empresa?
<CAWI remove bold><i>Please select all that apply.</i><CAWI remove bold>
<CAWI remove bold><i> Seleccione todos los que correspondan.</i><CAWI remove bold>
[CATI] YOU MAY SELECT ALL THAT APPLY.
[CATI] PUEDE SELECCIONAR TODAS LAS OPCIONES QUE APLIQUEN.
[SPACE]
[SHOW IF Q8aP IS SHOWN FIRST] Remember that we’re referring to large companies, also known as corporations.
[SHOW IF Q8aP IS SHOWN FIRST] Recuerde que nos estamos refiriendo a empresas grandes, también llamadas corporaciones.
ROTATE RESPONSE OPTIONS: 1. Began purchasing, or started purchasing, more of a company’s product or services 2. Applied for a job at that company 3. Invested in a company 4. Mentioned a company in social (or other) media 5. Signed a petition 6. Attended a community meeting, a rally, or other similar gathering 7. Collaborated with or became a member of an advocacy or activist organization 8. None of the above [ANCHOR][SP] 1. Compró por primera vez o comenzó a comprar, más de un producto o servicio de una empresa. 2. Solicitó un empleo en esa empresa 3. Invirtió en una empresa 4. Mencionó a una empresa en una red social (u otro medio) 5. Firmó una petición 6. Asistió a una reunión comunitaria, una concentración, u otra reunión similar 7. Colaboró o se hizo miembro de un grupo de defensa u organización activista 8. Ninguna de las anteriores [ANCHOR][SP]
[SHOW IF AT LEAST 1 ITEM SELECTED AT Q8aP]
[MP]
Q8b.
Which of the following, if any, have you done in the <u>past 12 months</u> to show your support for a company’s positive behavior?
¿Cuál de las siguientes opciones, si es que alguna, ha hecho usted <u>en los últimos 12 meses</u> para demostrar su apoyo por el comportamiento positivo de una empresa?

48
RESPONSE OPTIONS: 1. [SHOW IF Q8aP=1] Began purchasing, or started purchasing, more of a company’s product or services 2. [SHOW IF Q8aP=2] Applied for a job at that company 3. [SHOW IF Q8aP=3] Invested in a company 4. [SHOW IF Q8aP=4] Mentioned a company in social (or other) media 5. [SHOW IF Q8aP=5] Signed a petition 6. [SHOW IF Q8aP=6] Attended a community meeting, a rally, or other similar gathering 7. [SHOW IF Q8aP=7] Collaborated with or became a member of an advocacy or activist organization 8. None of the above 1. [SHOW IF Q8aP=1] Compró por primera vez o comenzó a comprar, más de un producto o servicio de una empresa. 2. [SHOW IF Q8aP=2] Solicitó un empleo en esa empresa 3. [SHOW IF Q8aP=3] Invirtió en una empresa 4. [SHOW IF Q8aP=4] Mencionó a una empresa en una red social (u otro medio) 5. [SHOW IF Q8aP=5] Firmó una petición 6. [SHOW IF Q8aP=6] Asistió a una reunión comunitaria, una concentración, u otra reunión similar 7. [SHOW IF Q8aP=7] Colaboró o se hizo miembro de un grupo de defensa u organización activista 8. Ninguna de las anteriores
PROGRAMMING NOTE: ROTATE ORDER OF Q8aP/Q8b AND Q8aN/Q8b_2, KEEP Q8aO LAST.
[MP] Q8aN. Which of the following, if any, have you <u>ever</u> done to show <u>your disagreement</u> with a company’s <u>negative</u> behavior?
¿Cuál de las siguientes opciones, si alguna, ha hecho usted <u>alguna vez </u> para demostrar <u>su desacuerdo</u> con el comportamiento <u>negativo</u> de una empresa?
<CAWI remove bold><i>Please select all that apply.</i><CAWI remove bold>
<CAWI remove bold><i>Seleccione todos los que correspondan.</i><CAWI remove bold>
[CATI] YOU MAY SELECT ALL THAT APPLY.
[CATI] PUEDE SELECCIONAR TODAS LAS OPCIONES QUE APLIQUEN.
[SPACE]
[SHOW IF Q8aN IS SHOWN FIRST] Remember that we’re referring to large companies, also known as corporations.
[SHOW IF Q8aN IS SHOWN FIRST] Recuerde que nos estamos refiriendo a empresas grandes, también llamadas corporaciones.
ROTATE RESPONSE OPTIONS: 1. Stopped purchasing or boycotted a company’s products or services 2. Quit a job at a company 3. Sold off investments in a company 4. Mentioned a company in social (or other) media

49
5. Signed a petition 6. Attended a community meeting, rally, or other similar gathering 7. Collaborated with or became a member of an advocacy or activist organization 8. None of the above [ANCHOR] [SP] 1. Dejó de comprar o boicoteó los productos o servicios de una empresa. 2. Dejó el trabajo en una empresa 3. Vendió las inversiones en una empresa. 4. Mencionó a una empresa en una red social (u otro medio) 5. Firmó una petición 6. Asistió a una reunión comunitaria, una concentración, u otra reunión similar 7. Colaboró o se hizo miembro de un grupo de defensa u organización activista 8. Ninguna de las anteriores [ANCHOR] [SP]
[SHOW IF AT LEAST 1 ITEM SELECTED AT Q8aN]
[MP]
Q8b_2.
Which of the following, if any, have you done in the <u>past 12 months</u> to show your disagreement with a company’s negative behavior?
¿Cuál de las siguientes opciones, si alguna, ha hecho usted en <u>los últimos 12 meses</u> para demostrar su desacuerdo con el comportamiento negativo de una empresa?
RESPONSE OPTIONS: 1. [SHOW IF Q8aN=1] Stopped purchasing or boycotted a company’s products or services 2. [SHOW IF Q8aN=2] Quit a job at a company 3. [SHOW IF Q8aN=3] Sold off investments in a company 4. [SHOW IF Q8aN=4] Mentioned a company in social (or other) media 5. [SHOW IF Q8aN=5] Signed a petition 6. [SHOW IF Q8aN=6] Attended a community meeting, rally, or other similar gathering 7. [SHOW IF Q8aN=7] Collaborated with or became a member of an advocacy or activist organization 8. None of the above 1. [SHOW IF Q8aN=1] Dejó de comprar o boicoteó los productos o servicios de una empresa. 2. [SHOW IF Q8aN=2] Dejó el trabajo en una empresa 3. [SHOW IF Q8aN=3] Vendió las inversiones en una empresa. 4. [SHOW IF Q8aN=4] Mencionó a una empresa en una red social (u otro medio) 5. [SHOW IF Q8aN=5] Firmó una petición 6. [SHOW IF Q8aN=6] Asistió a una reunión comunitaria, una concentración, u otra reunión similar 7. [SHOW IF Q8aN=7] Colaboró o se hizo miembro de un grupo de defensa u organización activista 8. Ninguna de las anteriores
[MP]

50
Q8aO.
Which of the following, if any, have you <u>ever</u> done? Remember that we’re referring to large companies, also known as corporations.
¿Cuál de las siguientes opciones, si alguna, ha hecho usted <u>alguna vez</u>? Recuerde que nos estamos refiriendo a empresas grandes, también llamadas corporaciones.
<CAWI remove bold><i>Please select all that apply.</i><CAWI remove bold>
[CATI] YOU MAY SELECT ALL THAT APPLY.
<CAWI remove bold><i>Seleccione todos los que correspondan.</i><CAWI remove bold>
[CATI] PUEDE SELECCIONAR TODAS LAS OPCIONES QUE APLIQUEN.
[SPACE]
ROTATE RESPONSE OPTIONS: 1. Sued a company, as an individual or as part of a class action lawsuit 2. Joined your coworkers to form a union at your company. 3. None of the above [ANCHOR] [SP] 1. Demandó a una empresa, como individuo o como parte de una demanda judicial colectiva 2. Se unió con sus colegas para formar un sindicato en su empresa. 3. Ninguna de las anteriores [ANCHOR] [SP]
[SP]
Q12a.
How much, if anything, have you seen, read, or heard about the <u>tax reform act</u> (Tax Cuts and Jobs Act) passed by the U.S. government in December 2017? ¿Cuánto, si algo, ha visto, leído o escuchado sobre la <u>ley de reforma impositiva</u> (Ley de Reducción de Impuestos y Empleos) aprobado por el gobierno de los Estados Unidos en diciembre de 2017? RESPONSE OPTIONS:
1. A lot 2. A little 3. Nothing at all
1. Muchas 2. Muy poco 3. Nada en absoluto
[NUMBOXES][RANDOMIZE ORDER OF ITEMS] [ADD IN TOTAL PERCENTAGE ALLOCATION AT THE BOTTOM OF THE GRID][ALLOW 777/999 TO BE ENTERED INTO NUMBOX IF R SAYS DON’T KNOW OR REFUSED FOR THE QUESTION; TOTAL WILL NOT SUM TO 100% BUT ALLOW TO CONTINUE]

51
Custom prompt; force response if total does not sum to 100%: “Please check that your total allocation entries sum to 100%. Custom prompt; force response if total does not sum to 100%: “Por favor verifique que su total de entradas colocadas sumen 100%. [CATI CUSTOM PROMPT: MUST ADD TO 100%] [CATI] IF R SAYS DON’T KNOW OR REFUSED, YOU MUST ENTER IN 777/999 FOR EACH NUMBER BOX TO CONTINUE Q12b.
In December 2017, the U.S. government changed the tax rate for large companies from 35% to 21%. As a result of this significant tax rate reduction, large companies now have more money. The decision as to how that money will be used is up to each company. But what if that decision was up to the American public and you had a say/vote in how companies use that money? En diciembre de 2017, el gobierno de los Estados Unidos cambió la tasa de impuestos a empresas grandes del 35% a 21%. Como resultados de esta reducción significativa de la tasa de impuestos, las empresas grandes ahora tienen más dinero. La decisión de cómo ese dinero será utilizado dependerá de cada empresa. ¿Pero qué pasaría si esa decisión dependiera del público americano y usted tuviera decisión/voto en cómo las empresas utilizan ese dinero? [SPACE]
[CAWI] Here is a list of 7 different categories that companies could use to allocate the additional money they’ve received from the tax reform. Read the entire list carefully and indicate the percentage (ranging from 0% to 100%) of the tax savings you think should be allocated to each category. The percentages you insert must add to 100%. [CAWI] A continuación encontrará una lista de 7 diferentes categorías que las empresas podrían utilizar para colocar el dinero adicional que han recibido de la reforma impositiva. Lea la siguiente lista completa e indique el porcentaje (de 0% a 100%) de los ahorros de impuestos que usted cree que debería ser colocado en cada categoría. Los porcentajes que usted coloque deben sumar 100%. [CATI] I’m going to read a list of 7 different categories that companies could use to allocate the additional money they’ve received from the tax reform. Please consider the entire list carefully and indicate the percentage (ranging from 0% to 100%) of the tax savings you think should be allocated to each category. The percentages you select must add to 100%. [CATI] Le voy a leer una lista de 7 diferentes categorías que las empresas podrían utilizar para colocar el dinero adicional que han recibido de la reforma impositiva. Por favor considere la lista entera cuidadosament e indique el porcentaje (de 0% a 100%) de los ahorros de impuestos que usted cree que debería ser colocado en cada categoría. Los porcentajes que usted coloque deben sumar 100%. 1. Create new jobs ____[NUMBOX ACCEPT 0-100%] 2. Give back to communities____[NUMBOX ACCEPT 0-100%] 3. Give back to workers in pay and/or benefits____[NUMBOX ACCEPT 0-100%] 4. Give back to customers in price reductions and/or additional benefits____[NUMBOX ACCEPT 0-
100%] 5. Create more and/or better products ____[NUMBOX ACCEPT 0-100%] 6. Invest in ways to reduce its environmental impact ____[NUMBOX ACCEPT 0-100%] 7. Pass savings onto to its shareholders____[NUMBOX ACCEPT 0-100%]
Total tax savings allocated: [SUM THE AMOUNT AS R ENTERS RESPONSES]
1. Crear nuevos empleos ____[NUMBOX ACCEPT 0-100%] 2. Devolverle a las comunidades ____[NUMBOX ACCEPT 0-100%] 3. Devolverle a los empleados en dinero y/o beneficios____[NUMBOX ACCEPT 0-100%] 4. Devolverle a los clientes en reducciones de precios y/o beneficios adicionales____[NUMBOX
ACCEPT 0-100%]

52
5. Crear más y/o mejores productos ____[NUMBOX ACCEPT 0-100%] 6. Invertir en formas para reducir el impacto medioambiental ____[NUMBOX ACCEPT 0-100%] 7. Pasar los ahorros a los accionistas____[NUMBOX ACCEPT 0-100%]
Total de ahorros de impuestos colocados: [SUM THE AMOUNT AS R ENTERS RESPONSES]
[SP]
Q13a.
In your opinion, which one of the following 7 categories do you think should be the <u>top priority</u> when companies decide how to use their tax savings?
En su opinión, ¿cuál de las siguientes 7 categorías cree usted que debería ser la <u>principal prioridad</u> cuando las empresas deciden como utilizar los ahorros impositivos?
RESPONSE OPTIONS:
1. Create new jobs 2. Give back to communities 3. Give back to workers in pay and/or benefits 4. Give back to customers in price reductions and/or additional benefits 5. Create more and/or better products 6. Invest in ways to reduce its environmental impact 7. Pass savings onto its shareholders
1. Crear nuevos empleos 2. Devolverle a las comunidades 3. Devolverle a los empleados en dinero y/o beneficios 4. Devolverle a los clientes en reducciones de precios y/o beneficios adicionales 5. Crear más y/o mejores productos 6. Invertir en formas para reducir el impacto medioambiental 7. Pasar los ahorros a los accionistas
[MEDIUM TEXTBOX]
Q13B.
You identified [INSERT RESPONSE IF Q13A=1-7 AND ADJUST VERB/EXAMPLE IF Q13A=5: “creating more/better products”] as the top priority when companies decide how to use their tax savings. Can you say a little more about <u>how</u> you think the money could be used in that category? Usted identificó [INSERT RESPONSE IF Q13A=1-7 AND ADJUST VERB/EXAMPLE IF Q13A=5: “Crear más/mejores productos”] como prioridad principal cuando las empresas deciden cómo utilizar sus ahorros de impuestos. ¿Puede decir un poco más sobre <u>cómo</u> usted cree que el dinero podría ser utilizado en esa categoría? [SP]
Q13C.

53
Now, if a company is offering a pay increase or a one-time lump sum bonus, which would you prefer to receive? Ahora, si una empresa está ofreciendo un aumento de sueldo o un bono con una suma de dinero por única vez, ¿qué usted preferiría recibir? RESPONSE OPTIONS:
1. Pay increase 2. One-time bonus
1. Aumento de sueldo 2. Bono por única vez
SAMPLE SPLIT – RANDOM HALF GETS POINTS, OTHER HALF GETS RANKING [SHOW IF RND_03=0] [NUMBOXES][RANDOMIZE ORDER OF ITEMS] [ADD IN TOTAL DOLLAR ALLOCATION AT THE BOTTOM OF THE GRID][ALLOW 777/999 TO BE ENTERED INTO NUMBOX IF R SAYS DON’T KNOW OR REFUSED FOR THE QUESTION; TOTAL WILL NOT SUM TO 100%, BUT ALLOW TO CONTINUE] Custom prompt; force response if total does not sum to $100: “Please check that your total allocation entries sum to 100%. Custom prompt; force response if total does not sum to $100: “Por favor verifique que su total de entradas colocadas sumen 100%. [CATI CUSTOM PROMPT: MUST ADD TO 100%.] [CATI] IF R SAYS DON’T KNOW OR REFUSED, YOU MUST ENTER IN 777/999 FOR EACH NUMBER BOX TO CONTINUE Q27. Recall that a <u>just</u> company is ethical, honest, and fair and behaves this way when it comes to its employees, customers, shareholders, and the environment, as well as the communities it impacts locally and around the world. We want to know what specific behaviors are most important to you in making a company <u>just</u>. Recuerde que una empresa <u>justa</u> es ética, honesta, y justa y se comporta de esta forma con sus empleados, clientes, accionistas, y el medio ambiente, así como con las comunidades en las que tiene impacto a nivel local y mundial. Queremos saber qué comportamientos específicos son más importantes para usted para hacer a una empresa <u>justa</u>. [CAWI] Here is a list of 7 different categories to which a company could allocate resources in order to improve its justness. Read the entire list carefully and indicate the percentage (ranging from 0% to 100%) of resources you think should be allocated to each category. The percentages you insert must add to 100%. [CAWI] A continuación encontrará una lista de 7 diferentes categorías que las empresas podrían utilizar para colocar los recursos para mejorar la equidad. Lea la lista completa cuidadosamente e indique el porcentaje (de 0% a 100%) de recursos que cree que deberían ser colocados en cada categoría. Los porcentajes que usted coloque deben sumar 100%. [CATI] I’m going to read a list of 7 different categories that companies could use to allocate the additional money they’ve received from the tax reform. Please consider the entire list carefully and indicate the percentage (ranging from 0% to 100%) of the tax savings you think should be allocated to each category. The percentages you select must add to 100%. [CATI] Le voy a leer una lista de 7 diferentes categorías que las empresas podrían utilizar para colocar los recursos para mejorar la equidad. Por favor considere la lista completa cuidadosamente e indique el

54
porcentaje (de 0% a 100%) de recursos que cree que deberían ser colocados en cada categoría. Los porcentajes que usted coloque deben sumar 100%. 1. WORKERS: How a company treats its employees and contractors, including fair pay, good benefits, and safe working conditions _____[NUMBOX] 1. TRABAJADORES: Cómo una empresa trata a sus empleados y contratistas, incluyendo paga justa, buenos beneficios, y condiciones laborales seguras _____[NUMBOX] 2. CUSTOMERS: How a company treats its customers, including providing positive experiences, protecting their privacy, and providing fair sales terms _____[NUMBOX] 2. CLIENTES: La forma en que una empresa trata a sus clientes, incluyendo brindar experiencias positivas, proteger su privacidad, y brindar términos y condiciones de ventas justos. _____[NUMBOX] 3. COMPANY LEADERSHIP & SHAREHOLDERS: How a company’s leadership acts ethically and with integrity, achieving long-term financial growth, and creating value for its shareholders _____[NUMBOX] 3. LÍDERES & ACCIONISTAS DE LA EMPRESA: La forma en que los líderes de una empresa actúan en forma ética y con integridad, alcanzando crecimiento financiero a largo plazo, y generando valor para sus accionistas. _____[NUMBOX] 4. ENVIRONMENT: A company’s environmental impact, including overall environmental responsibility, using resources efficiently, and minimizing pollution _____[NUMBOX] 4. MEDIO AMBIENTE: El impacto medioambiental de una empresa, incluyendo la responsabilidad medioambiental general, utilizando los recursos eficientemente, y minimizando la contaminación _____[NUMBOX] 5. COMMUNITIES IN THE US & ABROAD: How a company manages risks to human rights internationally, including minimizing forced labor or operating in countries with oppressive governments, and how it engages with local communities _____[NUMBOX] 5. COMUNIDADES EN LOS ESTADOS UNIDOS & EN EL EXTERIOR: Cómo una empresa maneja los riesgos de derechos humanos internacionalmente, incluyendo la minimizar el trabajo forzado u operar en países con gobiernos opresivos, y cómo se compromete con comunidades locales _____[NUMBOX] 6. PRODUCTS: A company’s products and services, including fair pricing and quality, as well as the benefit or harm of the product _____[NUMBOX] 6. PRODUCTOS: Los productos y servicios de una empresa, incluyendo precios y calidad justos, así como el beneficio y perjuicio del producto _____[NUMBOX] 7. JOBS: The positive impact a company has on the job market in the U.S., including the number of people the company employs and the number of new jobs created _____[NUMBOX] 7. EMPLEOS: El impacto positivo que una empresa tiene en el mercado laboral en los Estados Unidos, incluyendo el número de personas que la empresa emplea y el número de nuevos empleos que crea. _____[NUMBOX] Total Percentage Allocated: _____% [SUM THE AMOUNT AS R ENTERS RESPONSES]
Porcentaje Total Colocado: _____% [SUM THE AMOUNT AS R ENTERS RESPONSES] [SHOW IF RND_03=1] [NUMBOXES ACCEPT 1-7][RANDOMIZE ORDER OF ITEMS]

55
[DO NOT ALLOW MORE THAN 1 SELECTION TO BE RANKED THE SAME NUMBER, 1-7 ARE EXCLUSIVE] Custom prompt; force response if ranked numbers are not exclusive: “You ranked two behaviors with the same importance. Please review your answers” Custom prompt; force response if ranked numbers are not exclusive: “Usted calificó dos comportamientos con el mismo grado de importancia. Por favor revise sus respuestas.” [CATI] IF R SAYS DON’T KNOW OR REFUSED, YOU MUST ENTER IN 77/99 FOR EACH NUMBER BOX TO CONTINUE Q28. Recall that a <u>just</u> company is ethical, honest, and fair and behaves this way when it comes to its employees, customers, shareholders, and the environment, as well as the communities it impacts locally and around the world. We want to know what specific behaviors are most important to you in making a company <u>just</u>. Recuerde que una empresa <u>justa</u> es ética, honesta, y justa y se comporta de esta forma con sus empleados, clientes, accionistas, y el medio ambiente, así como con las comunidades en las que tiene impacto a nivel local y mundial. Queremos saber qué comportamientos específicos son más importantes para usted para hacer a una empresa <u>justa</u>. Please rate the following from 1-7, with 1 being most important to <u>just</u> company behavior and 7 being least important to <u>just</u> company behavior. Por favor califique lo siguiente del 1-7, siendo 1 lo más importante para el comportamiento <u>justo</u> de una empresa y 7 lo menos importante para el comportamiento <u>justo</u> de una empresa. 1. WORKERS: How a company treats its employees and contractors, including fair pay, good benefits, and safe working conditions [NUMBOX] 1. TRABAJADORES: Cómo una empresa trata a sus empleados y contratistas, incluyendo paga justa, buenos beneficios, y condiciones laborales seguras [NUMBOX] 2. CUSTOMERS: How a company treats its customers, including providing positive experiences, protecting their privacy, and providing fair sales terms [NUMBOX] 2. CLIENTES: La forma en que una empresa trata a sus clientes, incluyendo brindar experiencias positivas, proteger su privacidad, y brindar términos y condiciones de ventas justos [NUMBOX] 3. COMPANY LEADERSHIP & SHAREHOLDERS: How a company’s leadership acts ethically and with integrity, achieving long-term financial growth, and creating value for its shareholders [NUMBOX] 3. LÍDERES & ACCIONISTAS DE LA EMPRESA: La forma en que los líderes de una empresa actúan en forma ética y con integridad, alcanzando crecimiento financiero a largo plazo, y generando valor para sus accionistas [NUMBOX] 4. ENVIRONMENT: A company’s environmental impact, including overall environmental responsibility, using resources efficiently, and minimizing pollution [NUMBOX] 4. MEDIO AMBIENTE: El impacto medioambiental de una empresa, incluyendo la responsabilidad medioambiental general, utilizando los recursos eficientemente, y minimizando la contaminación [NUMBOX] 5. COMMUNITIES IN THE US & ABROAD: How a company manages risks to human rights internationally, including minimizing forced labor or operating in countries with oppressive governments, and how it engages with local communities [NUMBOX] 5. COMUNIDADES EN LOS ESTADOS UNIDOS & EN EL EXTERIOR: Cómo una empresa maneja los riesgos de derechos humanos internacionalmente, incluyendo la minimizar el trabajo forzado u operar en países con gobiernos opresivos, y cómo se compromete con comunidades locales [NUMBOX] 6. PRODUCTS: A company’s products and services, including fair pricing and quality, as well as the benefit or harm of the product [NUMBOX]

56
6. PRODUCTOS: Los productos y servicios de una empresa, incluyendo precios y calidad justos, así como el beneficio y perjuicio del producto [NUMBOX] 7. JOBS: The positive impact a company has on the job market in the U.S., including the number of people the company employs and the number of new jobs created [NUMBOX] 7. EMPLEOS: El impacto positivo que una empresa tiene en el mercado laboral en los Estados Unidos, incluyendo el número de personas que la empresa emplea y el número de nuevos empleos que crea. [NUMBOX] BACK TO ALL RESPONDENTS [MEDIUM TEXTBOX]
Q14.
This survey has been about large companies, also known as corporations, and sometimes referred to as corporate America. Esta encuesta ha sido sobre grandes empresas, también conocidas como corporaciones, y algunas veces como la América Corporativa. If you could send <u>one message</u> to the CEOs of America’s largest companies on any topic, what would your message be? Si pudiera enviar <u>un mensaje</u> a los Directores Generales de las grandes empresas estadounidenses sobre algún tema, ¿cuál sería su mensaje? [SP] Q24. In general, which do you consider yourself to be? En general, ¿qué se considera usted ser?
1 Very liberal 2 Liberal 3 Moderate 4 Conservative 5 Very conservative 6 None of the above 1 Muy liberal 2 Liberal 3 Moderado 4 Conservador 5 Muy conservador 6 Ninguna de las anteriores
[SP] Q26A. Generally speaking, do you usually think of yourself as a Republican, Democrat, Independent, or something else? En términos generales, ¿normalmente usted se considera como Republicano, Demócrata, Independiente, o alguna otra cosa? [CAWI]
1. Republican

57
2. Democrat 3. Independent 4. Something else 1. Republicano/a 2. Demócrata 3. Independiente 4. Otra
[CATI]
1. REPUBLICAN 2. DEMOCRAT 3. INDEPENDENT 4. SOMETHING ELSE 1. REPUBLICANO/A 2. DEMÓCRATA 3. INDEPENDIENTE 4. OTRA
PARTY_STRENGTH [SHOW IF Q26A=1, 2] [SP] Q26B. Would you call yourself a strong [if Q26A=1, insert: Republican; if Q26A=2, insert: Democrat] or not so strong [if Q26A=1, insert: Republican; if Q26A=2, insert: Democrat]? ¿Se consideraría usted un [if Q26A=1, insert: Republicano/a; if Q26A=2, insert: Demócrata] firme o un[if Q26A=1, insert: Republicano/a; if Q26A=2, insert: Demócrata] no tan firme? [CAWI]
1. Strong 2. Not very strong 1. Firme 2. No muy firme
[CATI]
1. STRONG 2. NOT VERY STRONG 1. FIRME 2. NO MUY FIRME
PARTY_CLOSER [SHOW IF Q26A=3, 77, 98, 99] [SP] Q26C. Do you think of yourself as closer to the Republican or Democratic Party? ¿Usted piensa que es más cercano al partido Republicano o Demócrata? [CAWI]

58
1. Closer to the Republican Party 2. Closer to the Democratic Party 3. Neither 77. Don’t know 1. Más cerca al Partido Republicano 2. Más cerca al Partido Demócrata 3. Ninguno 77. No lo sé
[CATI]
1. CLOSER TO REPUBLICAN PARTY 2. CLOSER TO DEMOCRATIC PARTY 3. NEITHER 77. DON’T KNOW 1. MÁS CERCANO AL PARTIDO REPUBLICANO 2. MÁS CERCANO AL PARTIDO DEMÓCRATA 3. NINGUNO 77. NO LO SÉ
[SHOW IF s_EMPLOY=1] [SP] Q29. At work, do you have significant decision-making authority for a team, division, or organization?
1 Yes 2 No
En el trabajo, ¿usted tiene significativo poder de decisión para un equipo, división, u organización?
1 Sí 2 No
(If R has significant decision-making authority) [SHOW IF Q29=1] [SP] Q60. At which level do you have significant decision-making authority?
1 Your organization as a whole 2 Multiple departments or divisions 3 Your own department or division only 4 A team within your department or division
¿En qué nivel usted tiene una autoridad significativa en la toma de decisiones?
1 Su organización como un conjunto 2 Varios departamentos o divisiones 3 Sólo su propio departamento o división

59
4 Un equipo dentro de su departamento o división [SP] Q62. Do you currently invest in stocks, bonds or mutual funds through a brokerage account, IRA or 401K account?
1 Yes 2 No 77 Don’t know
¿En la actualidad usted invierte en acciones, bonos o fondos mutuos a través de una cuenta de corretaje, IRA o cuentas 401K?
1 Sí 2 No 77 No lo sé
(R currently invests in stocks, bonds, etc.) [SHOW IF Q62=1] [SP] Q63. How much in total assets do you currently have invested, whether in stocks, bonds, or other types of investments?
1. Less than $99,999 2. $100,000 – $249,999 3. $250,000 – $499,999 4. $500,000 – $999,999 5. $1,000,000 or greater 77. Don’t know/prefer not to answer
¿Qué cantidad en activos totales tiene actualmente usted invertidos, bien sea en acciones, bonos, u otro tipo de inversiones?
1. Menos de $99,999 2. $100,000 – $249,999 3. $250,000 – $499,999 4. $500,000 – $999,999 5. $1.000.000 o más 77. No sé / Prefiero no contestar
QFINAL3. Do you have any general comments or feedback on this survey you would like to share? If you would like a response from us, please email [email protected] or call (888) 326-9424. QFINAL3. ¿Tiene algún comentario u observación sobre esta encuesta que le gustaría compartir con nosotros? Si desea recibir una respuesta de nosotros, por favor envíe un mail a [email protected] o llámenos al (888) 326-9424. [DISPLAY]

60
END. [CATI version] Those are all the questions we have. You have earned a reward of [INCENTWCOMMA] AmeriPoints for completing the survey. If you have any questions at all for us, you can email us at [email protected] or call us toll-free at 888-326-9424. Let me repeat that again: email us at [email protected] or call us at 888-326-9424. Thank you for participating in our new AmeriSpeak survey! Esas fueron todas las preguntas. Usted ha ganado una recompensa de [INCENTWCOMMA] Ameripoints por completar esta encuesta. Si tiene alguna pregunta, puede enviarnos un correo electrónico a [email protected] o llamarnos al número gratuito 888-326-9424. Permítame repetirlo nuevamente: envíenos un correo electrónico a [email protected] o llámenos al 888-326-9424. ¡Gracias por participar en nuestra nueva encuesta AmeriSpeak! [CAWI version] Those are all the questions we have. You have earned a reward of [INCENTWCOMMA] AmeriPoints for completing the survey. If you have any questions at all for us, you can email us at [email protected] or call us toll-free at 888-326-9424. Thank you for participating in our new AmeriSpeak survey! Esas fueron todas las preguntas. Usted ha ganado una recompensa de [INCENTWCOMMA] Ameripoints por completar esta encuesta. Si tiene alguna pregunta, puede enviarnos un correo electrónico a [email protected] o llamarnos al número gratuito 888-326-9424. ¡Gracias por participar en nuestra nueva encuesta AmeriSpeak! You can close your browser window now if you wish or click Continue below to be redirected to the AmeriSpeak member website. Ya puede cerrar la ventana de su explorador si lo desea o puede hacer clic en Continuar para ser redireccionado al sitio de usuario de AmeriSpeak.

61
Client JUST Capital Project Name Component Study 2017 Project Number 8099 Survey length (median) 15 minute survey Population 18+ general population Pretest N/A Main N=4100 MODE Phone and Web Language English and Spanish Incentive 10,000 AmeriPoints PIMS description Component Study 2017 Eligibility Rate 100%

62
PHONE SCRIPTS [CATI - OUTBOUND] INTRO Hello, my name is $I. I'm calling from AmeriSpeak by NORC. May I please speak with [FIRSTNAME]? Hola, mi nombre es $I. Lo estoy llamando de AmeriSpeak del NORC. ¿Podría hablar con [FIRSTNAME]?
[IF RESPONDENT IS AVAILABLE] Thank you for your continued participation in AmeriSpeak. I am calling to let you know that your next survey is available. The survey takes approximately [SURVEYLENGTH] minutes to complete. If you complete the survey, you will receive [INCENTWCOMMA] AmeriPoints for your time. We will keep all of your answers confidential. Shall we proceed? Gracias por su participación continúa en AmeriSpeak. Le estoy llamando para informarle que su próxima encuesta está lista. La encuesta toma aproximadamente [SURVEYLENGTH] minutos para completar. Si completa la encuesta, recibirá [INCENTWCOMMA] AmeriPoints por su tiempo. Mantendremos todas sus respuestas confidenciales. ¿Desea que procedamos? Great. As always, for quality assurance purposes, this call may be recorded or monitored. Excelente. Esta llamada puede ser grabada o monitoreada.
[CATI-INBOUND] INTRO Thank you for calling AmeriSpeak by NORC. My name is $I. How are you today? Gracias por llamar a AmeriSpeak de NORC. Mi Nombre es $I. ¿Cómo está hoy? And are you calling to take your next survey? ¿Y está llamando para tomar su próxima encuesta? I just need to confirm that I'm speaking with [FIRSTNAME] [LASTNAME]. Is that you? Sólo necesito confirmar que estoy hablando con [FIRSTNAME] [LASTNAME]. ¿Sería usted? Great. This survey takes approximately [SURVEYLENGTH] minutes to complete over the phone and you will earn [INCENTPOINTS] AmeriPoints for your time. We will keep all of your answers confidential. Excelente. Esta encuesta dura aproximadamente [SURVEYLENGTH] minutos para completar a través del teléfono y usted ganará [INCENTWCOMMA] AmeriPoints por su tiempo. Mantendremos todas sus respuestas confidenciales. As always, for quality assurance purposes, this call may be recorded or monitored. Esta llamada puede ser grabada o monitoreada. Shall we proceed? ¿Desea que procedamos? Text shown in green includes researcher notes and should not be included in the programming. Text shown in purple indicates Spanish translation that should be incorporated into the Spanish version of the survey [START OF SURVEY]

63
CREATE DATA-ONLY VARIABLE: QUAL 1=Qualified Complete 2=Not Qualified 3=In progress AT START OF SURVEY COMPUTE QUAL=3 “IN PROGRESS” CREATE MODE_START 1=CATI 2=CAWI JUST Component 2017 Draft Date: June 15, 2017 [SP] [IF RACETHNICITY=4] LANGSWITCH. [CAWI VERSION] Would you like to take this survey in English or Spanish? ¿A usted le gustaría tomar esta encuesta en inglés o español?
1. English/Inglés 2. Spanish/Español
[CATI VERSION] We are offering this survey in both English and Spanish. Which would you prefer? Estamos ofreciendo esta encuesta en inglés y español. ¿Cuál preferiría?
1. Continue 1. Continuar
IF LANGSWITCH=1, 77, 98, 99 continue in English (EN) IF LANGSWITCH=2, switch to Spanish language version of the survey (ES) [DISPLAY – WINTRO_1] Thank you for agreeing to participate in our new AmeriSpeak survey! To thank you for sharing your opinions, we will give you a reward of [INCENTWCOMMA] AmeriPoints after completing the survey. As always, your answers are confidential. ¡Gracias por participar en nuestra nueva encuesta de AmeriSpeak! Para agradecerle por compartir su opinión, le daremos una recompensa de [INCENTWCOMMA] AmeriPoints después de completar esta encuesta. Como siempre, sus respuestas son confidenciales. Please use the "Continue" and "Previous" buttons to navigate between the questions within the questionnaire. Do not use your browser buttons. Por favor utilice los botones “Continuar” y “Anterior” para navegar entre las preguntas del cuestionario. No utilice los botones de su navegador.

64
[DISPLAY – INTRO2] This survey is about large public companies, also called corporations. Your responses to the questions that follow are important, no matter how much you currently know or don’t know about corporations and their behavior. This survey will take approximately 10 minutes to complete. [SP] Q1. How much do you trust or distrust companies?
RESPONSE OPTIONS: ROTATE
1. Trust a great deal
2. Trust somewhat
3. Distrust somewhat
4. Distrust a great deal
77. Don’t know
[SP] Q2. In general, do you think the behavior of companies is going in the right direction or in the wrong direction?
RESPONSE OPTIONS: ROTATE
1 Right direction
2 Wrong direction
77 Don’t know
Version 1 (Workers, Environ, Products) [SHOW IF GROUP=1] [DISPLAY – IntroMaxdiff] In this survey, we’ll ask you questions about what makes a company <u>just</u>. A <u>just</u> company is ethical, honest, and fair and behaves this way when it comes to its employees, customers, shareholders, and the environment, as well as the communities it impacts locally and around the world. We want to know what specific behaviors are most important to you in making a company <u>just</u>. [SPACE]

65
In the next section, you will be shown several categories of ways a company can exhibit just behavior. For each question, please indicate which of the categories of behaviors is <u>most</u> important in evaluating how <u>just</u> a company is, and which category is <u>least</u> important in evaluating how just a company is. En la próxima sección, le mostraremos diversas categorías de formas en la que una empresa puede mostrar su justo comportamiento. Para cada pregunta, por favor indique cuál de las categorías de comportamientos es <u>más</u> importante al evaluar cuán <u>justa</u> es una empresa, y cuál categoría es <u>menos</u> importante al evaluar cuan justa es una empresa. [SPACE] There are quite a few questions in this section. While these questions might seem repetitive, please review each one carefully. Thank you. Hay 18 preguntas en esta sección. Aunque estas preguntas puedan parecerle repetitivas, por favor revise cuidadosamente cada una de ellas. Gracias. Version 1 (Products & Customers) [SHOW IF GROUP=1] USE P_VERSION1 MAXDIFF DESIGNS – There are three maxdiffs (Products & Customers) ***Customer items*****
1. Treats customers fairly: Company does not discriminate based on race, religion, gender, age, ethnicity, sexual orientation, or disability status, and strives to meet the needs of diverse customers when possible
2. Protects customer privacy: Company has transparent customer privacy policies and stores customers' personally-identifiable information securely
3. Provides positive customer service experiences: Company communicates responsively, has clear sales and return policies, and follows up to resolve customer issues
4. Is truthful in advertising: Company is honest and does not mislead about its products and services in all communications
NOTE: THE BELOW IS AN EXAMPLE OF HOW THE MAXDIFF QUESTION SHOULD LOOK ON SCREEN [GRID, SP VERTICAL; prompt twice for each Q4A_Most/Q4A_Least] [custom prompt if “most important” column is left blank: “We would really like your answer for the <u>most</u> important behavior question.”] [custom prompt if “least important” column is left blank: “We would really like your answer for the <u>least</u> important behavior question.”] [custom prompt if both columns are left blank: “We would really like your answer to this question.”] Q4a-j (example). In your opinion, which of these behavior categories is <u>most</u> important in evaluating how <u>just</u> a company is, and which of these behavior categories is <u>least</u> important? [CAWI – remove bold] <i>Select one response in <u>each</u> column. </i>
Q4A_Most Most
important
Which item is <u>most</u> important and which item is <u>least</u> important?
Q4A_Least Least important

66
o Treats customers fairly: Company does not discriminate based on race, religion, gender, age, ethnicity, sexual orientation, or disability
status, and strives to meet the needs of diverse customers when possible
o
o Protects customer privacy: Company has transparent customer privacy policies and stores customers' personally-identifiable
information securely
o
o Provides positive customer service experiences: Company communicates responsively, has clear sales and return policies, and follows up to resolve customer issues
o
____________________________________________________________________________________ Version 1 (Products & Customers) [SHOW IF GROUP=1] DISPLAY – MAX2 Recalling that a <u>just</u> company is ethical, honest, and fair and behaves this way when it comes to its employees, customers, shareholders, and the environment, as well as the communities it impacts locally and around the world, in the next section, you will be shown several categories of ways a company can exhibit <u>just</u> behavior. For each question, please indicate which of the categories of behaviors is <u>most</u> important in evaluating how <u>just </u> a company is. [SPACE] In your opinion, which of these behavior categories is <u>most</u> important in evaluating how <u>just</u> a company is, and which of these behavior categories is <u>least</u> important?
1. Makes products that are beneficial to health, environment, or society: Company makes products or offers services that are beneficial and non-harmful to health, environment, or society
2. Makes quality products: Company provides products and services that are reliable, safe, and durable
3. Provides fair pricing: Company provides products and services that are good value for the money, and does not price unfairly when options are limited
4. Is accurate in labeling: Company has products and services that have clear, accurate, and informative labeling
Q6a. Select all that apply, randomize order In this next question, which of the following do you think contribute to a company treating its customers in a “just” way?
1 Treats customers fairly 2 Provides positive customer service experiences 3 Protects customer privacy 4 Is truthful in advertising 5 Other [open end]
99 None of these – companies don’t need to provide any of these to be considered “just.”
Q6b. Select all that apply, randomize order

67
In this next question, which of the following do you think contribute to a company’s products being “just”?
1 Makes quality products 2 Makes products that are beneficial to health, environment, or society 3 Prices products fairly 4 Is accurate in labelling
99 None of these – companies don’t need to provide any of these to be considered “just.”
Q7. [grid/or keep prompt at top of each screen] Do you think large companies are having a very positive impact, a somewhat positive impact, a somewhat negative impact, a very negative impact, or no impact on: a. Society overall? b. The quality of products and services?
1. Very positive impact 2. Somewhat positive impact 3. Somewhat negative impact 4. Very negative impact 5. No impact
Q8. [Put 3 items on one page, 2 on next page, keep prompt at top of each screen] Recall that JUST companies are ethical, honest, and fair and behave this way when it comes to its employees, customers, shareholders, and the environment, as well as the communities it impacts locally and around the world. Please keep this definition of a JUST company in mind as you answer the following questions about company behaviors. After each statement, ASK: In your opinion, is this company’s behavior: very just, somewhat just, not very just, or not just at all? a. A large company creates new warehousing and storage jobs across multiple counties in the U.S. Most of the new jobs pay blow-average wages. b. A large company promises to create new jobs with benefits, and in exchange received a large tax break and incentives from state and local governments. After two years, the jobs have not yet been created. c. A large company creates new warehousing and storage jobs across multiple counties in the U.S. After two years, the overall employment rate in individual counties has not increased due to job losses at smaller companies in those same counties. d. CEOs at America’s largest companies make an average of $15 million in compensation each year. This is more than 250 times the annual average pay of the typical American worker. e. Large companies use lobbying organizations to influence politicians (through corporate campaign donations). These companies outspend other lobbying organizations such as labor unions and consumer advocacy groups. 1. Very just 2. Somewhat just 3. Not very just 4. Not just at all Q10.

68
Recall that a <u>just</u> company is ethical, honest, and fair and behaves this way when it comes to its employees, customers, shareholders, and the environment, as well as the communities it impacts locally and around the world. We want to know what specific behaviors are most important to you in making a company <u>just</u>. Please rank the following from 1-6, with 1 being most important to <u>just</u> company behavior and 6 being least important to <u>just</u> company behavior.
1) Vacation policy 2) Sick leave policy 3) Parental leave policy 4) Bereavement leave 5) Health insurance options 6) Retirement planning (401k or other options)
Q11a. How much have you seen, read, or heard about each of the following? A lot, a little, or nothing at all.
Greenhouse gas emissions Water pollution Air pollution
Q11b. Based on what you’ve seen, read, or heard, about these topics, in a few words, what stood out most for you? OE Q12. Which group should be most responsible for cleaning up pollution? [Select one only; first 3 in random order] -Government -Large companies -Environmental organizations -Other (specify) Random split between shareholders/investors/stockholders fill Q11. When you think of shareholders/investors/stockholders, what first comes to mind? Version 1 (Products & Customers) SAMPLE SPLIT – RANDOM HALF GETS POINTS, OTHER HALF GETS RANKING PREVIOUSLY PROGRAMMED AS Q27 IN JUST DRIVER STUDY 2017 [SHOW IF RND_03=0] [NUMBOXES][RANDOMIZE ORDER OF ITEMS] [ADD IN TOTAL DOLLAR ALLOCATION AT THE BOTTOM OF THE GRID][ALLOW 777/999 TO BE ENTERED INTO NUMBOX IF R SAYS DON’T KNOW OR REFUSED FOR THE QUESTION; TOTAL WILL NOT SUM TO 100%, BUT ALLOW TO CONTINUE] Custom prompt; force response if total does not sum to 100%: “Please check that your total allocation entries sum to 100%. [CATI CUSTOM PROMPT: MUST ADD TO 100%.]

69
[CATI] IF R SAYS DON’T KNOW OR REFUSED, YOU MUST ENTER IN 777/999 FOR EACH NUMBER BOX TO CONTINUE Q27. Recall that a <u>just</u> company is ethical, honest, and fair and behaves this way when it comes to its employees, customers, shareholders, and the environment, as well as the communities it impacts locally and around the world. We want to know what specific behaviors are most important to you in making a company <u>just</u>. Here is a list of 4 different categories to which a company could allocate resources in order to improve its justness. Read the entire list carefully and indicate the percentage (ranging from 0% to 100%) of resources you think should be allocated to each category. The percentages you insert must add to 100%.
1. Treats customers fairly: Company does not discriminate based on race, religion, gender, age, ethnicity, sexual orientation, or disability status, and strives to meet the needs of diverse customers when possible [NUMBOX]
2. Protects customer privacy: Company has transparent customer privacy policies and stores customers' personally-identifiable information securely [NUMBOX]
3. Provides positive customer service experiences: Company communicates responsively, has clear sales and return policies, and follows up to resolve customer issues [NUMBOX]
4. Is truthful in advertising: Company is honest and does not mislead about its products and services in all communications [NUMBOX]
Total: _____[SUM THE AMOUNT AS R ENTERS RESPONSES] Q27a. Here is a list of 4 different categories to which a company could allocate resources in order to improve its justness. Read the entire list carefully and indicate the percentage (ranging from 0% to 100%) of resources you think should be allocated to each category. The percentages you insert must add to 100%.
1. Makes products that are beneficial to health, environment, or society: Company makes products or offers services that are beneficial and non-harmful to health, environment, or society [NUMBOX]
2. Makes quality products: Company provides products and services that are reliable, safe, and durable [NUMBOX]
3. Provides fair pricing: Company provides products and services that are good value for the money, and does not price unfairly when options are limited [NUMBOX]
4. Is accurate in labeling: Company has products and services that have clear, accurate, and informative labeling [NUMBOX]
PREVIOUSLY PROGRAMMED AS Q28 IN JUST DRIVER STUDY 2017 [SHOW IF RND_03=1] [NUMBOXES ACCEPT 1-7][RANDOMIZE ORDER OF ITEMS] [DO NOT ALLOW MORE THAN 1 SELECTION TO BE RANKED THE SAME NUMBER, 1-7 ARE EXCLUSIVE] Custom prompt; force response if ranked numbers are not exclusive: “You ranked two behaviors with the same importance. Please review your answers” [CATI] IF R SAYS DON’T KNOW OR REFUSED, YOU MUST ENTER IN 77/99 FOR EACH NUMBER BOX TO CONTINUE Q28. Recall that a <u>just</u> company is ethical, honest, and fair and behaves this way when it comes to its employees, customers, shareholders, and the environment, as well as the communities it impacts locally

70
and around the world. We want to know what specific behaviors are most important to you in making a company <u>just</u>. Please rank the following from 1-4, with 1 being most important to <u>just</u> company behavior and 4 being least important to <u>just</u> company behavior.
1. Treats customers fairly: Company does not discriminate based on race, religion, gender, age, ethnicity, sexual orientation, or disability status, and strives to meet the needs of diverse customers when possible [NUMBOX]
2. Protects customer privacy: Company has transparent customer privacy policies and stores customers' personally-identifiable information securely [NUMBOX]
3. Provides positive customer service experiences: Company communicates responsively, has clear sales and return policies, and follows up to resolve customer issues [NUMBOX]
4. Is truthful in advertising: Company is honest and does not mislead about its products and services in all communications [NUMBOX]
Q28a. Please rank the following from 1-4, with 1 being most important to <u>just</u> company behavior and 4 being least important to <u>just</u> company behavior.
1. Makes products that are beneficial to health, environment, or society: Company makes products or offers services that are beneficial and non-harmful to health, environment, or society [NUMBOX]
2. Makes quality products: Company provides products and services that are reliable, safe, and durable [NUMBOX]
3. Provides fair pricing: Company provides products and services that are good value for the money, and does not price unfairly when options are limited [NUMBOX]
4. Is accurate in labeling: Company has products and services that have clear, accurate, and informative labeling [NUMBOX]
****** Here we go back to all respondents******* [SP] Q24. In general, which do you consider yourself to be? En general, ¿qué se considera usted ser?
1 Very liberal 2 Liberal 3 Moderate 4 Conservative 5 Very conservative 6 None of the above 1 Muy liberal 2 Liberal 3 Moderado 4 Conservador 5 Muy conservador 6 Ninguna de las anteriores

71
[SP] Q26A. Generally speaking, do you usually think of yourself as a Republican, Democrat, Independent, or something else? En términos generales, ¿normalmente usted se considera como Republicano, Demócrata, Independiente, o qué? [CAWI]
5. Republican 6. Democrat 7. Independent 8. Something else 5. Republicano/a 6. Demócrata 7. Independiente 8. Otra
[CATI]
5. REPUBLICAN 6. DEMOCRAT 7. INDEPENDENT 8. SOMETHING ELSE 5. REPUBLICANO/A 6. DEMÓCRATA 7. INDEPENDIENTE 8. OTRA
PARTY_STRENGTH [SHOW IF Q26A=1, 2] [SP] Q26B. Would you call yourself a strong [if Q26A=1, insert: Republican; if Q26A=2, insert: Democrat] or not so strong [if Q26A=1, insert: Republican; if Q26A=2, insert: Democrat]? ¿Se consideraría usted un [if Q26A=1, insert: Republicano/a; if Q26A=2, insert: Demócrata] firme o un[if Q26A=1, insert: Republicano/a; if Q26A=2, insert: Demócrata] no tan firme? [CAWI]
3. Strong 4. Not very strong 3. Firme 4. No muy firme
[CATI]
3. STRONG 4. NOT VERY STRONG 3. FIRME

72
4. NO MUY FIRME PARTY_CLOSER [SHOW IF Q26A=3, 77, 98, 99] [SP] Q26C. Do you think of yourself as closer to the Republican or Democratic Party? ¿Usted piensa que es más cercano al partido Republicano o Demócrata? [CAWI]
4. Closer to the Republican Party 5. Closer to the Democratic Party 6. Neither 77. Don’t know 4. Más cerca al Partido Republicano 5. Más cerca al Partido Demócrata 6. Ninguno 77. No lo sé
[CATI]
4. CLOSER TO REPUBLICAN PARTY 5. CLOSER TO DEMOCRATIC PARTY 77. DON’T KNOW 4. MÁS CERCANO AL PARTIDO REPUBLICANO 5. MÁS CERCANO AL PARTIDO DEMÓCRATA 77. NO LO SÉ
ALL RESPONDENTS Q9a. Have you ever worked for a large corporation? Working includes regular full-time employment, regular part-time employment, and/or work as an independent freelance contractor or consultant. For the purposes of this survey, large corporations are companies that have approximately 5,000 or more employees and/or are generally among the 1,000 largest companies in the U.S.
1) Yes, I have worked for a large corporation (ASK Q9b) 2) No, I have never worked for a large corporation (SKIP TO NEXT SECTION)
Programming: Keep Q9a on screen, add Q9b (if Q9a.1) Yes, respondent has “ever” worked for a large corporation (Q9a.1) Q9b. Which of the following best describes you?
1) I am currently working for a large corporation (ASK Q9c.1) 2) I have worked for a large corporation in the past 5 years (but not currently) (SKIP TO Q9c.2) 3) I have worked for a large corporation, but it was more than 5 years ago (SKIP TO NEXT
SECTION)
Respondent is currently working for a large corporation (Q9b.1)

73
Q9c1: Thinking about your current work at a large corporation, which one of the following best describes your position:
1) A regular full-time position 2) A regular part-time position 3) An independent freelance contractor or consultant 4) Something else [specify]
Respondent worked for corporation within past 5 years (but not currently) (Q9b.2) Q9c2: Thinking about your most recent work at a large corporation, which one of the following best describes your position:
1) Regular full-time position 2) Regular part-time position 3) Independent freelance contractor or consultant 4) Something else [specify]
[SP] Q29. [ask only of those employed] At work, do you have significant decision-making authority for a team, division, or organization?
1 Yes 2 No
En el trabajo, ¿usted tiene significativo poder de decisión para un equipo, división, u organización?
1 Sí 2 No
PREVIOUSLY PROGRAMMED AS Q30 IN MAXDIFF2016 (If R has significant decision-making authority) [SHOW IF Q29=1] [SP] Q30. At which level do you have significant decision-making authority?
1 Your organization as a whole 2 Multiple departments or divisions 3 Your own department or division only 4 A team within your department or division
¿En qué nivel usted tiene una autoridad significativa en la toma de decisiones?
1 Su organización como un conjunto 2 Varios departamentos o divisiones 3 Sólo su propio departamento o división 4 Un equipo dentro de su departamento o división

74
[SP] Q32. Do you currently invest in stocks, bonds or mutual funds through a brokerage account, IRA or 401K account?
3 Yes 4 No 77 Don’t know
¿En la actualidad usted invierte en acciones, bonos o fondos mutuos a través de una cuenta de corretaje, IRA o cuentas 401K?
3 Sí 4 No 77 No lo sé
(R currently invests in stocks, bonds, etc.) [SHOW IF Q32=1] [SP] Q33. How much in total assets do you currently have invested, whether in stocks, bonds, or other types of investments?
6. Less than $99,999 7. $100,000 – $249,999 8. $250,000 – $499,999 9. $500,000 – $999,999 10. $1,000,000 or greater 77. Don’t know/prefer not to answer
¿Qué cantidad en activos totales tiene actualmente usted invertidos, bien sea en acciones, bonos, u otro tipo de inversiones?
6. Menos de $99,999 7. $100,000 – $249,999 8. $250,000 – $499,999 9. $500,000 – $999,999 10. $1.000.000 o más 77. No sé / Prefiero no contestar
QFINAL3. Do you have any general comments or feedback on this survey you would like to share? If you would like a response from us, please email [email protected] or call (888) 326-9424. QFINAL3. ¿Tiene algún comentario u observación sobre esta encuesta que le gustaría compartir con nosotros? Si desea recibir una respuesta de nosotros, por favor envíe un mail a [email protected] o llámenos al (888) 326-9424. [DISPLAY]

75
END. [CATI version] Those are all the questions we have. You have earned a reward of [INCENTWCOMMA] AmeriPoints for completing the survey. If you have any questions at all for us, you can email us at [email protected] or call us toll-free at 888-326-9424. Let me repeat that again: email us at [email protected] or call us at 888-326-9424. Thank you for participating in our new AmeriSpeak survey! Esas fueron todas las preguntas. Usted ha ganado una recompensa de [INCENTWCOMMA] Ameripoints por completar esta encuesta. Si tiene alguna pregunta, puede enviarnos un correo electrónico a [email protected] o llamarnos al número gratuito 888-326-9424. Permítame repetirlo nuevamente: envíenos un correo electrónico a [email protected] o llámenos al 888-326-9424. ¡Gracias por participar en nuestra nueva encuesta AmeriSpeak! [CAWI version] Those are all the questions we have. You have earned a reward of [INCENTWCOMMA] AmeriPoints for completing the survey. If you have any questions at all for us, you can email us at [email protected] or call us toll-free at 888-326-9424. Thank you for participating in our new AmeriSpeak survey! Esas fueron todas las preguntas. Usted ha ganado una recompensa de [INCENTWCOMMA] Ameripoints por completar esta encuesta. Si tiene alguna pregunta, puede enviarnos un correo electrónico a [email protected] o llamarnos al número gratuito 888-326-9424. ¡Gracias por participar en nuestra nueva encuesta AmeriSpeak! You can close your browser window now if you wish or click Submit below to be redirected to the AmeriSpeak member website. Ya puede cerrar la ventana de su explorador si lo desea o puede hacer clic en Enviar para ser redireccionado al sitio de usuario de AmeriSpeak.

76
Product harm survey Product List: Full list used in Q1, Q2. Partial list (those labeled “harmful” in Q2) used in Q2a, Q2b, Q2c, Q3, Q3a, Q6, Q6a, Q7
1. Alcoholic beverages 2. Fossil fuels 3. Weapons, including guns, sold to the public 4. Pesticides 5. Prescription opioid painkillers 6. Sugary beverages 7. Tobacco products
Harm descriptions (used in Q3)
1. Alcoholic beverages can cause significant health problems over time for those who drink, including heart and liver damage, and in extreme cases, death. Those who drink alcoholic beverages to excess can endanger the lives of others. Some people say companies that make alcoholic beverages are responsible for the harm caused because they provide products that can be harmful. Others say that the companies are not responsible for the harm because they are producing a product that is legal to consume in society, and people who abuse alcoholic beverages are responsible for the harm.
2. Prescription opioid painkillers are at the root of an “epidemic” of addiction and death in the U.S. Opioids are misused in part because drug makers initially claimed that the painkillers are not addictive. Some people say companies that make prescription opioid painkillers are responsible for the harm caused because they provide products that can be harmful. Others say that the companies are not responsible for the harm because they are producing a product that is legal to use in society, and people who abuse prescription opioid painkillers are responsible for the harm.
3. Sugary beverages, also known as soft drinks, are a major contributor to obesity in the United States. When consumed in large quantities, these beverages are detrimental to health, most notably by aggravating diabetes but with the potential to cause more substantial problems. Some people say companies that make sugary beverages are responsible for the harm caused because they provide products that can be harmful. Others say that the companies are not responsible for the harm because they are producing a product that is legal to consume in society, and people who drink too many sugary beverages are responsible for the harm.
4. Tobacco products are known to be highly addictive and cause heart disease and cancer, leading to substantial deterioration of well-being, and ultimately death. Second-hand cigarette smoke causes disease and death even for those who do not directly use tobacco products. Some people say companies that make tobacco products are responsible for the harm caused because they provide products that can be harmful. Others say that the companies are not responsible for the harm because they are producing a product that is legal to consume in society, and people who use tobacco products are responsible for the harm.
5. Fossil fuels release carbon dioxide and other pollutants into the atmosphere when they are burned for energy, contributing to climate change and aggravating respiratory and other health issues when people breathe polluted air. Some people say companies that produce fossil fuels are responsible for the harm caused because they provide products that can be harmful. Others say that the companies are not responsible for the harm because they are producing a product that is legal to use in society, and people who overuse fossil fuels are responsible for the harm.
6. Weapons, including guns, sold to the public can be a public health hazard when used to cause serious injury and death. Most homicides in the U.S. are committed using firearms. Some people say companies that make weapons, including guns, that are sold to the public are responsible for the harm caused because they provide products that can be harmful. Others say that the companies are not responsible for the harm because they are producing a product that is legal to own in society, and people who own the weapons are responsible for the harm.
7. Pesticides have to be poisonous in order to kill the pests they target. That means they can also cause environmental harm and, with continuing exposure, trigger allergic reactions and other potentially severe health problems. Some people say companies that make pesticides are responsible for the harm caused because they provide products that can be harmful. Others say that the companies are not responsible for the harm because they are producing a product that is legal to use in society, and people who use pesticides are responsible for the harm.

77
Introduction: This survey is about the products made by large companies (also called corporations). Your responses are important, no matter how much you currently know or don’t know about this topic. The survey will take approximately 10 minutes to complete. Q1. [Repeat for all products on product list, randomize order] To begin, based on anything you may have seen, read, or heard – either in the news, from friends, family members, or co-workers, or learned any other way – how familiar are you with each of the following products made by large companies? Note that you do not have to have used a product to be familiar with it. [fill product]
[ROTATE] -Very familiar -Somewhat familiar -Have heard name, but not familiar -Not at all familiar [end survey if not at all familiar with any product on the list]
Q2: [Repeat for all products R is very familiar/somewhat familiar/heard name but not familiar with. Randomize order of products; one per screen] In your opinion, do you think [fill product] are overall:
[ROTATE order of first two options] -Beneficial to society [Ask Q2a on same screen] -Harmful to society [Ask Q2b/c on same screen] -Both beneficial and harmful [continue to next product] -Neither beneficial nor harmful [continue to next product] -Don’t know enough to say [continue to next product]
Q2a: [If product beneficial, right after Q2 same screen] Would you describe [fill product] as:
ROTATE -Extremely beneficial -Moderately beneficial -Only slightly beneficial
Q2b: [If product harmful, right after Q2 same screen] Would you describe [fill product] as extremely harmful? -Yes [SKIP Q2c] -No Q2c: [If product harmful, if no to Q2b, same screen. Note: Question order is intentional – we do need 2b first and only for the harmful products] Would you describe as [fill product] as:
ROTATE -Moderately harmful -Only slightly harmful
Q3. [Ask for all products considered harmful in Q2, ask Q3 then Q3a for each before proceeding to Q4] We have a few questions about the products you consider harmful. [space] [Fill product explanation for product considered harmful in Q2] What do you think – are the companies that make this product mostly responsible, somewhat responsible, or not at all responsible for its harmful effects? -Mostly responsible -Somewhat responsible -Not at all responsible
Q3a. Still thinking about [fill product] and the companies that make this product, which of the following is closer to your view?
ROTATE

78
-The harmful effects from this product are significant enough to outweigh other possible positive company behaviors. -The harmful effects from this product are not significant enough to outweigh other possible positive company behaviors.
Q4. [Ask all respondents regardless of answers to Q2] Are there other harmful products you can think of that were not mentioned?
-Yes [Ask Q4a, on same screen] - No [Skip to Q5]
Q4a: In a few words, please say what that harmful product is or was? If more than one harmful product comes to mind, which product do you think is the most harmful? [short entry text box]
Q5. [Ask all respondents regardless of answers to Q2] The next few questions are about company rankings (also referred to corporate rankings). Company rankings are lists of companies that have been evaluated on specific features and then published in newspapers, magazines, and websites. Examples of rankings include the “most admired companies,” “most ethical companies,” “most trusted companies,” companies with the “best reputations,” or the “best places to work.” [space] How familiar are you with these types of company rankings?
[rotate response options] -Very familiar -Somewhat familiar -Not very familiar -Not at all familiar [SKIP to Q6]
Q5a. [Ask if Q5: very/somewhat/not very familiar] Which of the following, if any, have you ever done after seeing a corporate ranking?
Grid/Randomize 1) Used information from the ranking to make a decision 2) Talked about the ranking with friends, family, or co-workers 3) Shared the ranking with others on social media Answer options for all: -Yes -No
Q6. [Ask for all products rated as harmful in Q2] Now imagine a ranking of 100 companies based on their behaviors and activities, where 1 is the best company and 100 is the worst. Do you think a company that makes [fill product] should be penalized for the harm caused by this product by being restricted to the bottom 25% of the rankings? That would mean the highest rank the company could achieve would be 76 out of 100. -Yes [Skip to next product] -No [Ask Q6a on same page]
Q6a. If answer to Q6 is “No” – same page Do you think a company that makes [fill product] should be penalized for that harm by being restricted to the bottom 50% of the rankings? That would mean the highest position the company could achieve would be #51 of 100. -Yes -No

79
Q7. [Repeat for all items rated as harmful in Q2. Note: Question order is intentional – we do need 6 & 6a first] Thinking about ranking companies on their behaviors and activities, including worker treatment, customer treatment, environmental impact, community impact, products impact, jobs provided, and leadership quality, on a 1-100 ranking, where would you rank a company that makes [fill product]? -1-25: These are the highest (most positively) ranked companies. -26-50: These companies rank better than those below 50, but not as positively as those in the top 25. -51-75: These companies are in the bottom half of the ranking, but better than the bottom 25. -76-100: These are the lowest (least positively) ranked companies.