2018 HALF-YEAR FINANCIAL STATEMENTS (Translation into ...2018 HALF-YEAR FINANCIAL STATEMENTS...
102
2018 HALF-YEAR FINANCIAL STATEMENTS (Translation into English of the original Italian version) JOINT-STOCK COMPANY - SHARE CAPITAL EURO 62,461,355.84 COMPANY REGISTER OF MILAN MONZA-BRIANZA LODI AND TAX NO. 00607460201 COMPANY SUBJECT TO MANAGEMENT AND COORDINATION BY CIR S.p.A. REGISTERED OFFICE: 20121 MILAN (ITALY), VIA CIOVASSINO, 1/A - PHONE 02.467501 OFFICES: 78286 GUYANCOURT (FRANCE), PARC ARIANE IV- 7 AVENUE DU 8 MAI 1945 PHONE 0033 01 61374300 WEBSITE: WWW.SOGEFIGROUP.COM
Transcript of 2018 HALF-YEAR FINANCIAL STATEMENTS (Translation into ...2018 HALF-YEAR FINANCIAL STATEMENTS...

2018 HALF-YEAR FINANCIAL STATEMENTS
(Translation into English of the original Italian version)
JOINT-STOCK COMPANY - SHARE CAPITAL EURO 62,461,355.84
COMPANY REGISTER OF MILAN MONZA-BRIANZA LODI AND TAX NO. 00607460201
COMPANY SUBJECT TO MANAGEMENT AND COORDINATION BY CIR S.p.A. REGISTERED OFFICE: 20121 MILAN (ITALY), VIA CIOVASSINO, 1/A - PHONE 02.467501
OFFICES: 78286 GUYANCOURT (FRANCE), PARC ARIANE IV- 7 AVENUE DU 8 MAI 1945 PHONE 0033 01 61374300
WEBSITE: WWW.SOGEFIGROUP.COM

2
CONTENTS
CORPORATE BODIES page 3
BOARD OF DIRECTORS' REPORT
ON OPERATIONS OF THE GROUP IN THE FIRST HALF YEAR
page
4
SOGEFI GROUP CONDENSED INTERIM CONSOLIDATED
FINANCIAL STATEMENTS AS AT JUNE 30, 2018
- Condensed Interim Consolidated Financial statements page 18
- Explanatory and supplementary notes to the Condensed Interim
Consolidated Financial Statements
page 24
- List of Equity Investments as at June 30, 2018 page 88
DECLARATION OF SOGEFI GROUP CONDENSED INTERIM
CONSOLIDATED FINANCIAL STATEMENTS AS AT 30 JUNE 2018
PURSUANT TO ART. 81-TER OF CONSOB REGULATION NO.
11971/99 AND SUBSEQUENT AMENDMENTS
page
93
HOLDING COMPANY INTERIM FINANCIAL STATEMENTS AS AT 30
JUNE 2018
- Financial statements page 94
INDEPENDENT AUDITOR’S REPORT page 101

3
BOARD OF DIRECTORS
Honorary Chairman CARLO DE BENEDETTI
Chairman MONICA MONDARDINI(1)
Managing Director and General Manager LAURENT HEBENSTREIT(1)
Directors PATRIZIA CANZIANI (3)
RODOLFO DE BENEDETTI
ROBERTA DI VIETO (3) - (4)
GIOVANNI GERMANO (2)
MAURO MELIS (2)
RAFFAELLA PALLAVICINI
PAOLO RICCARDO ROCCA (2) -
(3) - (4) - (5)
Secretary to the Board NICCOLO’ MORESCHINI
BOARD OF STATUTORY AUDITORS
Chairman SONIA PERON
Acting Auditors RICCARDO ZINGALES
GIUSEPPE LEONI
Alternate Auditors ANNA MARIA ALLIEVI
MAURO GIRELLI
BARBIERI DAVIDE
INDEPENDENT AUDITORS
KPMG S.p.A.
Disclosure under Consob Recommendation no. 97001574 of 20 February 1997:
(1) Powers as per Corporate Governance.
(2) Members of the Appointment and Remuneration Committee.
(3) Members of the Control and Risk Committee and of the Committee for Related Party
Transactions.
(4) Members of the Supervisory Body (Italian Legislative Decree no. 231/2001).
(5) Lead independent director.

4
BOARD OF DIRECTORS' REPORT
ON OPERATIONS OF THE SOGEFI GROUP
IN THE FIRST HALF YEAR
This semi-annual financial report contains the financial statements, the consolidated
explanatory notes of the Group, and the financial statements of the Holding Company
(the latter submitted voluntarily, although not provided for Italian Legislative Decree
no. 195 of 6 November 2007), prepared in accordance with International Accounting
Standards (“IFRS”) issued by the International Accounting Standards Board (“IASB”)
approved by the European Union and prepared according to IAS 34 applicable on
interim financial reporting.
INFORMATION ON OPERATIONS
In the first half of 2018, the world's automotive market saw a 1.7% increase in
production. Production grew in Europe (+1.8%), Asia (+4.2% thanks to the recovery
of the Chinese market) and South America (+10.7%).
By contrast, in North America production was again down (-2.9% in the first six
months).
Before the presentation of the results of Sogefi in the first half of 2018, it is worth
noting that from 1 January 2018 there was a change in the accounting standards for
the recognition of revenues, deriving from the new accounting standard "IFRS 15 -
Revenue from contracts with customers". For the purpose of a correct analysis of the
evolution of the results, the values for the previous year have been recalculated on the
basis of the new accounting standard.
Moreover, the strong fluctuation in the exchange rates of currencies other than the
Euro in which the Group operates (all of which were significantly devaluated) had a
significant impact on the evolution of the key economic indicators and in particular
on revenue.
In this context, Sogefi recorded revenues of Euro 839.1 million, an increase of 3.2%
at constant exchange rates and a decrease of 2.1% at historical exchange rates,
compared to the same period of 2017.
The business grew slightly in Europe and North America compared to the previous
year (+0.7% and +1.6%, respectively, at constant exchange rates) and significantly
increased in Asia and South America (+10% and +13.5%, respectively, at constant
exchange rates), recording higher growth than the market.

5
The table below shows a breakdown of sales by key markets.
(in millions of Euro)
Amount % Amount %
Europe 532.2 63.4 529.9 61.8 0.4 0.7
North America 145.0 17.3 156.5 18.3 (7.3) 1.6
South America 85.9 10.2 100.0 11.7 (14.1) 13.5
Asia 82.4 9.8 79.8 9.3 3.3 10.0
Intercompany eliminations (6.4) (0.7) (8.7) (1.1) (26.4) -
TOTAL 839.1 100.0 857.5 100.0 (2.1) 3.2
1st half 2017
% change
1h 18/1h
17
constant
exchange
% change
1h 18/1h
17
1st half 2018
Suspension recorded a 7.1% growth at constant exchange rates (1.9% at current
exchange rates due to the devaluation mainly of South American currencies),
Filtration reported a 2.7% increase at constant exchange rates (-4% at current
exchange rates due to the devaluation mainly of South American currencies) and
finally Air and Cooling recorded a 1.2% decrease at constant exchange rates (-5.1%
at current exchange rates, affected both by the drop in car production and by the trend
of the Canadian dollar).
(in millions of Euro)
Amount % Amount %
Suspensions 314.7 37.5 308.7 36.0 1.9 7.1
Filtration 277.2 33.0 288.6 33.6 (4.0) 2.7
Air&Cooling 248.9 29.7 262.3 30.6 (5.1) (1.2)
Intercompany eliminations (1.7) (0.2) (2.1) (0.2) (19.0) -
TOTAL 839.1 100.0 857.5 100.0 (2.1) 3.2
% change
1h 18/1h
17
% change
1h 18/1h
17
constant
1st half 20171st half 2018
Sogefi's key customers are Renault/Nissan, PSA, FCA, Ford, Daimler and GM
which overall account for 63.5% of revenues (65% in the first half of
2017).
(in millions of Euro)
Group Amount % Amount %
Renault/Nissan 100.7 12.0 100.4 11.7 0.3
PSA 96.8 11.5 91.9 10.7 5.3
FCA/CNH Industrial 94.2 11.2 107.2 12.5 (12.1)
Ford 93.5 11.1 107.8 12.6 (13.2)
Daimler 75.4 9.0 68.4 8.0 10.2
GM 72.2 8.6 81.5 9.5 (11.4)
Volkswagen/Audi 42.4 5.1 36.2 4.2 17.1
Toyota 25.4 3.0 26.1 3.0 (2.6)
BMW 22.1 2.6 23.0 2.7 (3.9)
Other (including Aftermarket) 216.4 25.9 215.0 25.1 0.6
TOTAL 839.1 100.0 857.5 100.0 (2.1)
1st half 2018 1st half 2017 % change
1h 18/1h 17
The following table provides comparative figures of the income statement for the
first half of the year 2018 and the corresponding period of the previous year.

6
(in millions of Euro)
Amount % Amount % Amount %
Sales revenues 839.1 100.0 857.5 100.0 1,647.8 100.0
Variable cost of sales 583.8 69.6 586.9 68.4 1,128.3 68.5
CONTRIBUTION MARGIN 255.3 30.4 270.6 31.6 519.5 31.5
Manufacturing and R&D overheads 77.0 9.1 80.3 9.4 157.4 9.5
Depreciation and amortization 56.0 6.7 56.4 6.6 110.0 6.7
Distribution and sales fixed expenses 21.5 2.6 22.7 2.6 44.3 2.7
Administrative and general expenses 45.1 5.4 44.8 5.2 88.8 5.4
Restructuring costs 2.7 0.3 6.0 0.7 11.3 0.7
Losses (gains) on disposal (0.1) - (0.2) - - -
Exchange (gains) losses 3.0 0.3 0.6 0.1 3.2 0.2
Other non-operating expenses (income) 5.7 0.7 10.8 1.3 18.7 1.1
EBIT 44.4 5.3 49.2 5.7 85.8 5.2
Financial expenses (income), net 13.5 1.6 12.8 1.5 31.7 1.9
Losses (gains) from equity investments - - - - - -
RESULT BEFORE TAXES AND
NON-CONTROLLING INTERESTS 30.9 3.7 36.4 4.2 54.1 3.3
Income taxes 11.8 1.4 14.9 1.7 23.4 1.4
NET RESULT BEFORE
NON-CONTROLLING INTERESTS 19.1 2.3 21.5 2.5 30.7 1.9
Loss (income) attributable to
non-controlling interests (2.1) (0.3) (2.1) (0.2) (4.1) (0.2)
GROUP NET RESULT 17.0 2.0 19.4 2.3 26.6 1.7
1st half 2018 1st half 2017 Year 2017
EBITDA1 amounted to Euro 104.0 million, down with respect to the first half of
2017 (Euro 114.0 million). The reduction is due to the evolution of exchange rates
(with a total effect of Euro 5.4 million) and the negative impact of steel price
increases (Euro 6.0 million) in Suspension.
Profitability (EBITDA/Turnover) was down from 13.3% to 12.4%.
EBIT was Euro 44.4 million, down from Euro 49.2 million in the first half of 2017
and accounts for 5.3% of revenues (5.7% in the first half of 2017). The first half year
result for 2017 included also Euro 6.0 million writedowns on fixed assets in Brazil.
The profit before taxes and minority interests in 2018 was at Euro 30.9 million
(Euro 36.4 million in the first half of 2017), after financial expenses of Euro 13.5
million (Euro 12.8 million in 2017).
Net profit was Euro 17.0 million, compared with Euro 19.4 million in the first half
of 2017 (2% of revenues vs 2.3% in 2017), after tax of Euro 11.8 million in 2018
compared with Euro 14.9 million in the previous year.
As for the risks concerning the claims of Sogefi Air & Cooling S.A.S. (ex
Systèmes Moteurs S.A.S.), the situation was unchanged in the first half of 20182.
1 EBITDA is calculated by adding to “EBIT” the item “Depreciation and amortization” and the amount of
writedowns of tangible and intangible assets posted in “Other non-operating expenses (income)” for Euro 3.6
million in the first half of 2018 (Euro 8.5 million in the corresponding period last year).
2 For more details see the "Explanatory and Supplementary Notes to the Condensed Interim Consolidated
Financial Statements", Note 2, "Principles of consolidation and valuation criteria".

7
As at 30 June 2018, the Sogefi Group's workforce was 7,040 (6,947 as at 31
December 2017).
Number % Number % Number %
Managers 107 1.5 115 1.6 111 1.6
Clerical staff 1,935 27.5 1,908 27.5 1,871 27.5
Blue collar workers 4,998 71.0 4,924 70.9 4,817 70.9
TOTAL 7,040 100.0 6,947 100.0 6,799 100.0
June 30, 2017June 30, 2018 December 31, 2017
As at 30 June 2018 shareholders' equity, excluding minority interests, was
Euro 190.8 million (Euro 177.4 million as at 31 December 2017) as shown
in the table below.
(in millions of Euro) Note*
Amount % Amount % Amount %
Short-term operating assets (a) 352.7 327.8 353.2
Short-term operating liabilities (b) (446.5) (430.5) (420.2)
Net working capital (93.8) (19.9) (102.7) (22.4) (67.0) (14.2)
Equity investments (c) - - - - 0.1 -
(d)
CAPITAL INVESTED 665.9 141.6 658.7 143.4 673.7 142.9
Other medium and long-term
liabilities (e) (195.6) (41.6) (199.6) (43.4) (202.2) (42.9)
NET CAPITAL INVESTED 470.3 100.0 459.1 100.0 471.5 100.0
Net financial indebtedness 259.6 55.2 264.0 57.5 280.4 59.5
Non-controlling interests 19.9 4.2 17.7 3.9 15.7 3.3
Consolidated equity of the
Group 190.8 40.6 177.4 38.6 175.4 37.2
TOTAL 470.3 100.0 459.1 100.0 471.5 100.0
740.6 157.1
June 30, 2017
759.7
December 31,
2017
Intangible, tangible fixed
assets and other medium and
long-term assets 161.5 761.4 165.8
June 30, 2018
(*) See the notes at the end of this report for a detailed explanation of the reasons for the reclassifications that
we have made.
The net financial position as at 30 June 2018 was Euro 259.6 million, showing a
year-over-year increase of Euro 4.4 million (Euro 264.0 million as at 31 December
2017) and was down by Euro 20.8 million when compared to 30 June 2017 (Euro
280.4 million).
Free Cash Flow was a positive Euro 3.9 million in the first half year 2018, lower
compared to Euro 19.0 million in the same period of 2017. The drop is linked to the
decrease in Ebitda and the cash consumption deriving from the start-up of the new
plant in Morocco (about Euro 9 million) which will be operating in the fourth quarter
of 2018.

8
The table below shows a breakdown of the cash flows of the period compared with
first half and full year 2017: (in millions of Euro) Note* 1st half 1st half Year
2018 2017 2017
SELF-FINANCING (f) 81.7 92.4 165.8
Change in net working capital (11.8) (15.1) 9.3
Other medium/long-term assets/liabilities (g) (3.6) 0.8 1.8
CASH FLOW GENERATED BY
OPERATIONS 66.3 78.1 176.9
Sale of equity investments (h) - - -
Net decrease from sale of fixed assets (i) 0.3 0.2 0.5
TOTAL SOURCES 66.6 78.3 177.4
Increase in intangible assets 18.0 17.5 40.0
Purchase of tangible assets 45.1 41.4 104.2
TOTAL APPLICATION OF FUNDS 63.1 58.9 144.2
Exchange differences on assets/liabilities and
equity (l) 0.4 (0.4) 1.2
FREE CASH FLOW 3.9 19.0 34.4
Holding Company increases in capital 0.2 0.9 1.3
Increases in share capital of consolidated
subsidiaries 0.1 0.1 0.2
Dividends paid by subsidiaries to
non-controlling interests - (2.6) (2.6)
Change in fair value derivative instruments 0.2 1.2 1.7
CHANGES IN SHAREHOLDERS' EQUITY 0.5 (0.4) 0.6
Change in net financial position (m) 4.4 18.6 35.0
Opening net financial position (m) (264.0) (299.0) (299.0)
CLOSING NET FINANCIAL POSITION (m) (259.6) (280.4) (264.0)
(*) See the notes at the end of this report for a detailed explanation of the reasons for the reclassifications that
we have made.
Net financial indebtedness is mainly comprised of medium and long-term debts,
which account for 79% of gross indebtedness as shown below:
(in millions of Euro) June 30, 2018 December 31, 2017 June 30, 2017
Cash, banks, financial receivables
and securities held for trading 106.0 105.5 76.4
Medium/long-term financial
receivables 2.6 2.2 6.8
Short-term financial debts (*) (78.3) (83.4) (81.3)
Medium/long-term financial debts (289.9) (288.3) (282.3)
NET FINANCIAL POSITION (259.6) (264.0) (280.4)
(*) Including current portions of medium/long-term financial debts

9
RECONCILIATION BETWEEN THE HOLDING COMPANY'S
STATUTORY FINANCIAL STATEMENTS AND THE CONSOLIDATED
FINANCIAL STATEMENTS
The following is a reconciliation of the Group’s net result and equity at the end of the
year with the equivalent figures for the Holding Company.
Net profit for the period
(in millions of Euro) 1st half 1st half
2018 2017
Net profit per Sogefi S.p.A. financial statements 24.2 21.5
Group share of results of subsidiary companies
included in the consolidated financial statements 28.5 30.1
Elimination of Sogefi S.p.A. dividends (33.9) (32.4)
Elimination of unrealized gains deriving from
intercompany transactions and other consolidation
adjustments, net of the related deferred taxation (1.8) 0.2
NET PROFIT PER CONSOLIDATED FINANCIAL
STATEMENTS 17.0 19.4
Shareholders' equity
(in millions of Euro) June 30, 2018 December 31, 2017
Shareholders' equity per Sogefi S.p.A. financial
statements 240.5 214.5
Group share of excess equity value of investments in
consolidated companies over carrying value in
Sogefi S.p.A. financial statements (49.1) (38.5)
Elimination of unrealized gains deriving from
intercompany transactions and other consolidation
adjustments, net of the related deferred taxation (0.6) 1.4
SHAREHOLDERS' EQUITY PER CONSOLIDATED
FINANCIAL STATEMENTS 190.8 177.4

10
PERFORMANCE OF THE HOLDING COMPANY SOGEFI S.p.A.
Net result in the first half of 2018 amounted to Euro 24.2 million compared to Euro
21.5 million in the corresponding period of the previous year.
The increase over the first half of 2017 was primarily attributable to the increased
flow of dividends from subsidiaries (Euro +1.5 million) and lower non-operating
expenses (Euro 1 million).
(in millions of Euro) 1st half 2018 1st half 2017 Year 2017
Financial income/expenses and dividends 26.3 24.8 16.8
Adjustments to financial assets - - (0.8)
Other operating revenues 6.3 7.0 14.0
Operating costs (8.8) (9.6) (17.6)
Other non-operating income (expenses) (0.7) (1.7) (3.3)
RESULT BEFORE TAXES 23.1 20.5 9.1
Income taxes (1.1) (1.0) (2.4)
NET RESULT 24.2 21.5 11.5
The following table shows the main items of the statement of financial position as at
30 June 2018, compared with the figures as at 31 December 2017 and 30 June 2017:
(in millions of Euro) Note* June 30, December 31, June 30,
2018 2017 2017
Short-term assets (n) 7.2 14.1 8.7
Short-term liabilities (o) (5.7) (7.0) (7.9)
Net working capital 1.5 7.1 0.8
Equity investments (p) 416.0 415.8 416.4
Other fixed assets (q) 48.4 50.2 55.6
CAPITAL INVESTED 465.9 473.1 472.8
Other medium and long-term liabilities (r ) (1.6) (0.8) (1.1)
NET CAPITAL INVESTED 464.3 472.3 471.7
Net financial indebtedness 223.8 257.8 249.3
Shareholders' equity 240.5 214.5 222.4
TOTAL 464.3 472.3 471.7
(*) See the notes at the end of this report for a detailed explanation of the reasons for the reclassifications that
we have made.
"Net working capital" decreased by Euro 5.6 million compared to 31 December 2017,
mainly due to the payments from the Holding company CIR S.p.A. of net receivables
of Euro 3.7 million from the tax filing system and Euro 3.3 million received from the
French subsidiary Sogefi Gestion S.A.S. referred to the transfer of IT applications
that took place at 31 December 2017.
“Shareholders’ equity” as at 30 June 2018 amounts to Euro 240.5 million, up from
Euro 214.5 million as at 31 December 2017, mainly thanks to the results of the year.

11
The following table shows the main items of the statement of financial position of the
Company as at 30 June 2018, compared with the figures as at 31 December 2017 and
30 June 2017:
(in millions of Euro)
June 30,
2018
December 31,
2017
June 30,
2017
Short-term cash investments 43.4 36.3 19.6
Short/medium-term financial receivables to
third and subsidiaries 130.5 96.0 137.4
Short-term financial debts (*) (122.6) (120.1) (149.5)
Medium/long-term financial debts (275.1) (270.0) (256.8)
NET FINANCIAL POSITION (223.8) (257.8) (249.3)
(*) Including current portions of medium/long-term financial debts
The item "Medium/long-term financial receivables to third and subsidiaries" includes
the receivable of Euro 18 million as at 30 June 2018 for dividends resolved by
French subsidiary Sogefi Suspensions S.A., the collection of which is scheduled
within the second half year.
The table below illustrates the cash flow statement of Sogefi S.p.A.:
(in millions of Euro) Note* 1st half 1st half Year
2018 2017 2017
SELF-FINANCING (s) 26.7 23.8 18.3
Change in net working capital (t) 5.6 4.2 (2.0)
Other medium/long term assets/liabilities (u) 1.7 1.4 2.7
CASH FLOW GENERATED BY
OPERATIONS 34.0 29.4 19.0
Sale of equity investments - 0.4 0.4
Sale of intangible assets - - 3.2
TOTAL SOURCES 34.0 29.8 22.6
Increase in intangible assets 0.2 0.9 3.1
Purchase of tangible assets - - -
Purchase of equity investments 0.2 0.2 0.3
TOTAL APPLICATION OF FUNDS 0.4 1.1 3.4
FREE CASH FLOW 33.6 28.7 19.2
Holding Company increases in capital 0.2 0.9 1.3
Net purchase of treasury shares 0.2 1.2 1.8
Dividends paid by the Holding Company 0.4 2.1 3.1
CHANGES IN SHAREHOLDERS' EQUITY 34.0 30.8 22.3
Opening net financial position (v) (257.8) (280.1) (280.1)
CLOSING NET FINANCIAL POSITION (v) (223.8) (249.3) (257.8)
(*) See the notes at the end of this report for a detailed explanation of the reasons for the reclassifications that
we have made.
The net indebtedness as at 30 June 2018 was Euro 233.8 million, showing a decrease
compared to 31 December 2017 (Euro 257.8 million) and 30 June 2017 (Euro 249.3
million).
Free cash flow generated in the first half of 2018 was positive at Euro 33.6 million,
compared to Euro 28.7 million in the first half of 2017. The increase was mainly
generated by the improved result for the period and by a better administration of
working capital that allowed this generation of cash.

12
PERFORMANCE OF THE FILTRATION BUSINESS UNIT
In the first half of 2018, the Filtration business unit reported revenues of Euro 277.2
million, down by 4%, but up by 2.7% at constant exchange rates. At constant
exchange rates, dynamic trends are recorded in Asia, South and North America.
The EBIT amounted to Euro 18.1 million, compared to Euro 13.0 million in the first
six months of 2017, with an increase in the impact of revenue at 6.5%, from 4.5% of
the corresponding period of the previous year.
Employees of the business unit at 30 June 2018 were 2,973 (2,831 at 31 December
2017).
PERFORMANCE OF THE SUSPENSION BUSINESS UNIT
In the first six months of 2018, the Suspension business unit reported revenues of
Euro 314.7 million, up by 1.9% (+7.1% at constant exchange rates), with a positive
trend in all geographical areas except for China.
The EBIT amounted to Euro 13.2 million, down compared to Euro 22.6 million in
the first six months of 2017, with an impact of revenue of 4.2% (7.3% in the first half
of 2017). The reduction in the result is due to the significant increase in the purchase
price of steel, which was only partially transferred to sales prices.
Employees of the business unit at 30 June 2018 were 2,593 (2,623 at 31 December
2017).
PERFORMANCE OF THE AIR AND COOLING BUSINESS UNIT
In the first six months of 2018, the Air and Cooling business unit reported revenues
of Euro 248.9 million, down by 5.1% (-1.2% at constant exchange rates) compared
with the same period of the previous year. In addition to foreign exchange rates, the
business unit's revenues were affected by the weakness of the European and North
American markets.
The EBIT amounted to Euro 17.6 million, compared with Euro 17.1 million in the
first six months of 2017, with an increase in the impact of revenue from 6.5% in the
first six months of 2017 to 7.1%.
Employees of the business unit at 30 June 2018 were 1,414 (1,431 at 31 December
2017).

13
PERFORMANCE IN THE SECOND QUARTER OF 2018
The following table provides comparative figures of the income statement for the
second quarter and the same prior year period.
(in millions of Euro)
Amount % Amount % Amount %
Sales revenues 418.0 100.0 424.8 100.0 (6.8) (1.6)
Variable cost of sales 290.5 69.5 289.0 68.0 1.5 0.6
CONTRIBUTION MARGIN 127.5 30.5 135.8 32.0 (8.3) (6.2)
Manufacturing and R&D overheads 37.8 9.1 40.5 9.5 (2.7) (6.4)
Depreciation and amortization 28.7 6.8 27.9 6.6 0.8 2.5
Distribution and sales fixed expenses 11.2 2.7 11.6 2.7 (0.4) (3.3)
Administrative and general expenses 22.9 5.5 22.5 5.3 0.4 1.6
Restructuring costs 1.6 0.4 1.3 0.3 0.3 20.5
Losses (gains) on disposal (0.1) - (0.1) - - -
Exchange (gains) losses 2.3 0.5 0.8 0.2 1.5 -
Other non-operating expenses (income) 4.3 1.0 8.2 2.0 (3.9) (47.7)
EBIT 18.8 4.5 23.1 5.4 (4.3) (18.7)
Financial expenses (income), net 6.7 1.6 6.4 1.5 0.3 3.1
Losses (gains) from equity investments - - - - - -
RESULT BEFORE TAXES AND
NON-CONTROLLING INTERESTS 12.1 2.9 16.7 3.9 (4.6) (27.2)
Income taxes 6.1 1.5 7.3 1.7 (1.2) (17.4)
NET RESULT BEFORE
NON-CONTROLLING INTERESTS 6.0 1.4 9.4 2.2 (3.4) 34.8
Loss (income) attributable to
non-controlling interests (1.0) (0.2) (1.1) (0.2) 0.1 (4.1)
GROUP NET RESULT 5.0 1.2 8.3 2.0 (3.3) (39.5)
4.1 - 6.30.2018 4.1 - 6.30.2017 Change
Period Period
In the second quarter of 2018, Sogefi posted revenue drop of 1.6% (+3.5% at
constant exchange rates) amounting to Euro 418.0 million and a decrease in the
contribution margin from 32% to 30.5% of revenues.
EBITDA amounted to Euro 50.9 million (Euro 59.2 million in the corresponding
period of 2017). Lower profitability is mainly a result of the increase in steel
purchase price, increase in labour cost for the start-up of the new plant in Morocco
and increase in non-operating costs for foreign exchange differences.
EBIT amounts to Euro 18.8 million (Euro 23.1 million in the second quarter of
2017).
The result before taxes and minority interests was a positive Euro 12.1 million
(Euro 16.7 million in the second quarter 2017), after financial expenses of Euro 6.7
million (Euro 6.4 million in the same period of the previous year).
The Group's net result in the second quarter 2018 was positive at Euro 5.0 million
(Euro 8.3 million in the same period of the previous year).

14
INVESTMENTS AND RESEARCH & DEVELOPMENT ACTIVITIES
The investments totalled Euro 63.1 million in the first half year 2018 (Euro 58.9
million in the first half of the previous year). In detail, investment in tangible fixed
assets amounted to Euro 45.1 million (Euro 41.4 million in the first half year 2017)
and investment in intangible fixed assets amounted to Euro 18.0 million (Euro 17.5
million in the first half year 2017).
As for material investments, these were mainly geared to increasing production
capacity, industrialisation of new products, improvement of industrial processes and
productivity growth.
TREASURY SHARES
As at 30 June 2018, the Holding Company has 2,620,111 treasury shares in its
portfolio, corresponding to 2.18% of share capital, at an average price of Euro 2.28
each. In the first half year 2018, treasury shares decreased after they were assigned to
beneficiaries of stock-based compensation plans.
RELATED PARTY TRANSACTIONS
Information on the most important economic transactions and balances with related
parties is provided in the explanatory and supplementary notes to the consolidated
financial statements, in the section entitled “Related Party Transactions”.
Dealings between Group companies are conducted at arm’s length, taking into
account the quality and type of services rendered.
We point out that no transactions have been carried out with related parties or with
entities or individuals other than related parties that, according to the definition used
by Consob, are atypical or unusual, do not relate to the normal business activity or
have a significant impact on the Group's results, balance and financial position.
In 2010 in accordance with Consob Regulation no. 17221 of 12 March 2010 and
subsequent amendments, the Company’s Board of Directors appointed the Related
Party Transactions Committee, establishing that the members are to be the same as
those of the Control and Risks Committee and approved the “Discipline for related-
party transactions”, which had previously received a favourable opinion of the
Control and Risks Committee. The purpose of this Procedure is to establish the
principles of conduct that the Company is bound to observe to guarantee the correct
management of related-party transactions. This Discipline is available on the
Company's website at www.sogefigroup.com, in the “Investor - Corporate
Governance” section.
In accordance with Art. 2497 bis of Italian Civil Code, we point out that Sogefi
S.p.A. is subject to management and coordination by its Holding company CIR
S.p.A.

15
DISCLOSURES PURSUANT TO ART. 70 AND 71 OF CONSOB RULES FOR
ISSUERS
Under a resolution of the Board of Directors of 23 October 2012, the Company
adopted the simplified procedure provided for by art. 70, paragraph 8 and art. 71,
paragraph 1-bis of Consob Regulation issued under Consob Resolution no. 11971 of
14 May 1999 and subsequent amendments and additions, and made use of the
exemption from the obligation to publish the information documents required for
significant transactions consisting in mergers, spin-offs, capital increases by means of
the conferral of assets in kind, takeovers and transfers.
SIGNIFICANT SUBSEQUENT EVENTS AFTER 30 JUNE 2018
No significant events occurred after 30 June 2018.
OUTLOOK FOR OPERATIONS
Despite the current uncertainties of the global car market, the group confirms the
expectation that it will moderately outperform the market at constant exchange rates
thanks to the growth initiatives in Mexico (Suspensions) and Morocco (Filtration).
The group also foresees a net result on a full year basis in line with that of 2017
despite the increases in the cost of raw materials and the adverse exchange rates.
Milan, 24 July 2018 FOR THE BOARD OF DIRECTORS
Chief Executive Officer

16
ANNEX: NOTES RECONCILING THE FINANCIAL STATEMENTS SHOWN IN THE REPORT ON OPERATIONS AND THE FINANCIAL STATEMENTS CONTAINED IN THE NOTES TO THE CONSOLIDATED FINANCIAL STATEMENTS AND THE HOLDING COMPANY'S STATUTORY FINANCIAL STATEMENTS PREPARED IN ACCORDANCE WITH IAS/IFRS Notes relating to the Condensed interim consolidated financial statements
a) the heading agrees with “Total working capital” in the Consolidated Statement Of Financial Position;
b) the heading agrees with the sum of the line items “Trade and other payables”, “Tax payables” and “Other current liabilities” in
the Consolidated Statement Of Financial Position;
c) the heading agrees with the sum of the line items “Investments in joint ventures” and “Other financial assets” in the
Consolidated Statement Of Financial Position;
d) the heading agrees with the sum of the line items “Total fixed assets”, “Other receivables”, “Non-current trade receivables”,
“Deferred tax assets” and “Non-current assets held for sale” in the Consolidated Statement Of Financial Position;
e) the heading agrees with the line item "Total other long-term liabilities" in the Consolidated Statement Of Financial Position;
f) the heading agrees with the sum of the line items “Net result”, “Non-controlling interests”, “Depreciation, amortization and
writedowns”, “Accrued costs for stock-based incentive plans”, “Provisions for risks, restructuring and deferred taxes” and “Post-
retirement and other employee benefits” in the Consolidated Cash Flow Statement;
g) the heading agrees with the sum of the line items of the Consolidated Cash Flow Statement “Exchange differences on private
placement”, “Recognition in the income statement of the fair value reserve in cash flow hedge” and “Other medium/long term
assets/liabilities”, excluding movements in Income Statement, of the fair value reserve no longer in hedge accounting;
h) the heading corresponds to the line item “Sale of subsidiaries (net of cash and cash equivalents) and associates” in the
Consolidated Cash Flow Statement;
i) the heading agrees with the sum of the line items “Losses/(gains) on disposal of fixed assets and non-current assets held for
sale”, “Sale of property, plant and equipment” and “Sale of intangible assets” in the Consolidated Cash Flow Statement;
(l) the heading agrees with the line items “Exchange differences” in the Consolidated Cash Flow Statement, excluding exchange
differences on medium/long-term financial receivables and payables;
(m) these headings differ from those shown in the Consolidated Cash Flow Statement as they refer to the total net financial position
and not just to cash and cash equivalents.
Notes relating to the Holding Company's Statutory Financial Statements
(n) the heading agrees with “Total working capital” (“Totale attivo circolante operativo”) in the Holding Company's statutory
Statement Of Financial Position;
(o) the heading agrees with the sum of the line items “Trade and other payables” (“Debiti commerciali e altri debiti”), “Tax
payables” (“Debiti per imposte”) and “Other current liabilities” (“Altre passività correnti”) in the Holding Company's statutory
Statement Of Financial Position;
(p) the heading agrees with the sum of the line items “Equity investments in subsidiaries” (“Partecipazioni in società controllate”),
“Equity investments in associates” (“Partecipazioni in società collegate”) and “Other financial assets” (“Altre attività
finanziarie”) in the Holding Company's statutory Statement Of Financial Position;
(q) the heading agrees with the sum of the line items “Total fixed assets” (“Totale immobilizzazioni”), “Other receivables” (“Altri
crediti”) and “Deferred tax assets” (“Imposte anticipate”) in the Holding Company's statutory Statement Of Financial Position;
(r) the heading agrees with the line item "Total other long-term liabilities" (“Totale altre passività a lungo termine”) in the Holding
Company's statutory Statement Of Financial Position;
(s) the heading agrees with the sum of the line items “Net profit for the period” (“Utile netto di periodo”), “Depreciation and
amortization” (“Ammortamenti immobilizzazioni materiali e immateriali”), “Accrual to Income Statement for fair value of cash
flow hedging instruments” (“Stanziamento a conto economico fair value derivati cash flow hedge”), “Accrued costs for stock-
based incentive plans” (“Accantonamenti costi per piani di incentivazione basati su azioni”), "Exchange differences on private
placement" ("Differenze cambio su private placement"), “(Unpaid) financial expense on bonds” (“Oneri finanziari (non pagati)
su prestiti obbligazionari”), “Net change in deferred charge provision” (“Variazione netta fondo oneri futuri”) and “Net change
in provision for employment termination indemnities” (“Variazione netta fondo trattamento di fine rapporto”) as well as the
change of deferred tax assets/liabilities included in the line “Other medium/long-term assets/liabilities” (“Altre attività/passività
a medio lungo termine”) of the Holding Company's statutory Cash Flow Statement;
(t) the heading agrees with the sum of the line items “Change in net working capital” (“Variazione del capitale circolante netto”),
“Change in tax receivables/payables” (“Variazione dei crediti/debiti per imposte”) and “Waiver of receivables from subsidiaries”
(“Rinuncia crediti commerciali verso società controllate”) of the Holding Company's statutory Cash Flow Statement;
(u) the heading is included in the line item “Other medium/long-term assets/liabilities” (“Altre attività/passività a medio lungo
termine”) in the Holding Company's Statutory Cash Flow Statement, excluding movements relating to financial
receivables/payables;
(v) these headings differ from those shown in the Holding Company's Statutory Cash Flow Statement as they refer to the total net
financial position and not just to cash and cash equivalents.

17
DEFINITION OF THE PERFORMANCE INDICATORS
In accordance with recommendation CESR/05-178b published on 3 November 2005, the criteria used
for constructing the main performance indicators deemed by the management to be useful for the
purpose of monitoring Group performance are provided below.
EBITDA: EBITDA is calculated as the sum of "EBIT", “Depreciation and Amortization” and the
impairment losses of tangible and intangible fixed assets included in the item “Other non-operating
expenses (income)”.
“Other non-operating expenses (income)” include amounts that do not relate to ordinary business
activities such as:
- writedowns of tangible and intangible fixed assets
- imputed cost of stock option and stock grant plans
- accruals to provisions for legal disputes with employees and third parties
- product warranty costs
- strategic consulting services
“Restructuring costs” include voluntary redundancy incentives for all employee categories (managers,
clerical staff, blue collar workers) and costs relating to the shutdown of a plant or the discontinuation
of individual business lines (personnel costs and related costs associated with shutdown).
“Losses (gains) on disposal” include the difference between the net book value of sold assets and
selling price.
Please note that at 30 June 2018 there are no non-recurring charges as defined by Consob in its
communication no. DEM/6064293 of 28 July 2006.

18
CONDENSED INTERIM CONSOLIDATED FINANCIAL STATEMENTS
CONSOLIDATED STATEMENT OF FINANCIAL POSITION
(in thousands of Euro)
ASSETS Note June 30, 2018 December 31, 2017
CURRENT ASSETS
Cash and cash equivalents 4 104,357 103,889
Other financial assets 5 1,712 1,510
Working capital
Inventories 6 125,930 122,928
Trade receivables 7 189,349 173,959
Other receivables 7 7,624 5,508
Tax receivables 7 25,000 23,062
Other assets 7 4,749 2,304
TOTAL WORKING CAPITAL 352,652 327,761
TOTAL CURRENT ASSETS 458,721 433,160
NON-CURRENT ASSETS
TANGIBLE AND INTANGIBLE FIXED
ASSETS
Land 8 12,951 13,040
Property, plant and equipment 8 367,069 365,854
Other tangible fixed assets 8 6,380 5,583
Of which: leases 5,181 5,772
Intangible assets 9 288,154 290,481
TOTAL TANGIBLE AND INTANGIBLE
FIXED ASSETS 674,554 674,958
OTHER NON-CURRENT ASSETS
Investments in joint ventures 10 - -
Other financial assets 11 46 46
Non-current trade receivables 12 4 4
Financial receivables 12 2,626 2,215
Other receivables 12 38,656 37,382
Deferred tax assets 13-19 44,191 45,646
TOTAL OTHER NON-CURRENT ASSETS 85,523 85,293
TOTAL NON-CURRENT ASSETS 760,077 760,251
NON-CURRENT ASSETS HELD FOR SALE 14 2,341 3,418
TOTAL ASSETS 1,221,139 1,196,829
Some values for the year 2017 were recalculated following the application of “IFRS 15 – Revenue from
Contracts with Customers” and “IFRS 9 – Financial Instruments”.

19
LIABILITIES Note June 30, 2018 December 31, 2017
CURRENT LIABILITIES
Bank overdrafts and short-term loans 15 2,060 14,170
Current portion of medium/long-term
financial debts and other loans 15 76,035 66,584
Of which: leases 1,744 1,679
TOTAL SHORT-TERM FINANCIAL DEBTS 78,095 80,754
Other short-term liabilities for derivative
financial instruments 15 228 2,678
TOTAL SHORT-TERM FINANCIAL DEBTS
AND DERIVATIVE FIN. INSTRUMENTS 78,323 83,432
Trade and other payables 16 388,798 373,181
Tax payables 16 11,570 7,817
Other current liabilities 17 46,102 49,367
TOTAL CURRENT LIABILITIES 524,793 513,797
NON-CURRENT LIABILITIES
MEDIUM/LONG-TERM FINANCIAL DEBTS
AND
DERIVATIVE FINANCIAL INSTRUMENTS
Financial debts to bank 15 113,783 101,993
Other medium/long-term financial debts 15 176,164 186,224
Of which: leases 5,679 6,408
TOTAL MEDIUM/LONG-TERM
FINANCIAL DEBTS 289,947 288,217
Other medium/long-term financial liabilities
for derivative financial instruments 15 - -
289,947 288,217
OTHER LONG-TERM LIABILITIES
Long-term provisions 18 83,541 87,049
Other payables 18 67,580 71,983
Deferred tax liabilities 19 44,616 40,640
TOTAL OTHER LONG-TERM LIABILITIES 195,737 199,672
TOTAL NON-CURRENT LIABILITIES 485,684 487,889
SHAREHOLDERS' EQUITY
Share capital 20 62,461 62,394
Reserves and retained earnings
(accumulated losses) 20 111,244 88,425
Group net profit (loss) for the period 20 17,045 26,600
TOTAL SHAREHOLDERS' EQUITY
ATTRIBUTABLE TO THE HOLDING
COMPANY 190,750 177,419
Non-controlling interests 20 19,912 17,724
TOTAL SHAREHOLDERS' EQUITY 210,662 195,143
TOTAL LIABILITIES AND EQUITY 1,221,139 1,196,829
TOTAL MEDIUM/LONG-TERM
FINANCIAL DEBTS AND DERIVATIVE
FINANCIAL INSTRUMENTS
Some values for the year 2017 were recalculated following the application of “IFRS 15 – Revenue from
Contracts with Customers” and “IFRS 9 – Financial Instruments”.

20
CONSOLIDATED INCOME STATEMENT (in thousands of Euro)
Note
Amount % Amount %
Sales revenues 22 839,144 100.0 857,501 100.0
Variable cost of sales 24 583,837 69.6 586,889 68.4
CONTRIBUTION MARGIN 255,307 30.4 270,612 31.6
Manufacturing and R&D overheads 25 77,001 9.1 80,291 9.4
Depreciation and amortization 26 56,013 6.7 56,350 6.6
Distribution and sales fixed expenses 27 21,454 2.6 22,725 2.6
Administrative and general expenses 28 45,124 5.4 44,828 5.2
Restructuring costs 30 2,697 0.3 5,962 0.7
Losses (gains) on disposal 31 (58) - (168) -
Exchange losses (gains) 32 2,908 0.3 646 0.1
Other non-operating expenses (income) 33 5,729 0.7 10,793 1.3
EBIT 44,439 5.3 49,185 5.7
Financial expenses (income), net 34 13,508 1.6 12,806 1.5
Losses (gains) from equity investments 35 - - - -
RESULT BEFORE TAXES AND NON-
CONTROLLING INTERESTS 30,931 3.7 36,379 4.2
Income taxes 36 11,831 1.4 14,910 1.7
NET RESULT BEFORE NON-CONTROLLING
INTERESTS 19,100 2.3 21,469 2.5
Loss (income) attributable to non-controlling interests (2,055) (0.3) (2,117) (0.2)
GROUP NET RESULT 17,045 2.0 19,352 2.3
Earnings per share (EPS) (Euro): 38
Basic 0.145 0.166
Diluted 0.145 0.165
1st half 20171st half 2018
Some values for the year 2017 were recalculated following the application of “IFRS 15 – Revenue from
Contracts with Customers”.

21
CONSOLIDATED STATEMENT OF OTHER COMPREHENSIVE INCOME
(in thousands of Euro)
Note 1st half 2018 1st half 2017
Net result before non-controlling interests 19,100 21,469
Other Comprehensive Income:
Items that will not be reclassified to profit or loss
- Actuarial gains (losses) 20 1,137 2,844
- Tax on items that will not be reclassified to profit or loss 20 (193) (483)
Total items that will not be reclassified to profit or loss 944 2,361
Items that may be reclassified to profit or loss
- Profit (loss) booked to cash flow hedge reserve 20 1,658 2,446
- Income tax relating to items that may be reclassified to
profit or loss 20 (398) (587)
- Profit (loss) booked to translation reserve 20 (6,491) (10,825)
Total items that may be reclassified to profit or loss (5,231) (8,966)
Other Comprehensive Income (4,287) (6,605)
Total comprehensive result for the period 14,813 14,864
Attributable to:
- Shareholders of the Holding Company 12,755 12,911
- Non-controlling interests 2,058 1,953
Some values for the year 2017 were recalculated following the application of “IFRS 15 – Revenue from
Contracts with Customers”.

22
CONSOLIDATED CASH FLOW STATEMENT (in thousands of Euro)
1st half 2018 1st half 2017
Cash flows from operating activities
Net result 17,045 19,352
Adjustments:
- non-controlling interests 2,055 2,117
- depreciation, amortization and writedowns 59,561 64,839
- expenses recognised for share-based incentive plans 358 265
- exchange rate differences on private placement 854 (10,138)
- (not paid) interest expense on bonds 1,944 1,822
- provision in income statement of fair value derivatives in cash
flow hedge (1,329) 9,182
- losses/(gains) on disposal of fixed assets and non-current
assets held for sale (58) (168)
- provisions for risks, restructuring and deferred taxes 3,596 6,247
- post-retirement and other employee benefits (868) (407)
- change in net working capital (11,758) (15,110)
- other medium/long-term assets/liabilities (5,090) (494)
CASH FLOWS FROM OPERATING ACTIVITIES 66,310 77,507
INVESTING ACTIVITIES
Purchase of property, plant and equipment (45,077) (41,430)
Purchase of intangible assets (17,951) (17,485)
Net change in other securities - 2,230
Sale of property, plant, equipment and businesses 379 357Sale of intangible assets - 53
NET CASH FLOWS FROM INVESTING ACTIVITIES (62,649) (56,275)
FINANCING ACTIVITIES
Capital increase in subsidiaries from third parties 104 72
Net change in capital 253 901
Dividends paid to Holding Company shareholders and non-
controlling interests (9) (2,544)
New (repayment of) bonds (12,584) (12,587)
New (repayment of) long-term loans 21,701 (26,345)New (repayment of) finance leases (829) (915)
NET CASH FLOWS FROM FINANCING ACTIVITIES 8,636 (41,418)
(DECREASE) INCREASE IN CASH AND CASH EQUIVALENTS 12,297 (20,186)
Balance at the beginning of the period 89,720 82,656
(Decrease) increase in cash and cash equivalents 12,297 (20,186)
Exchange differences 280 (2,672)
BALANCE AT THE END OF THE PERIOD 102,297 59,798
ADDITIONAL INFORMATIONS OF CASH FLOW STATEMENT
Taxes paid (4,983) (4,238)
Financial expenses paid (11,768) (13,620)
Financial income collected 1,757 2,181
Some values for the year 2017 were recalculated following the application of “IFRS 15 – Revenue from
Contracts with Customers”.
Note: this table shows the elements that bring about the change in cash and cash equivalents, as expressly required by IAS 7. The cash
flow statement included in the Report of the board of directors on operations shows the various operational components of cash flow,
thereby explaining all of the changes in the overall net financial position.

23
CONSOLIDATED STATEMENT OF CHANGES IN EQUITY (in thousands of Euro) Non-
controlli
ng
Total
Balance at December 31, 2016 62,065 89,863 9,336 161,264 16,118 177,382
Paid share capital increase 228 673 - 901 72 973
Allocation of 2016 net profit:
Legal reserve - - - - - -
Dividends - - - - (2,544) (2,544)
Retained earnings - 9,336 (9,336) - - - Recognition of share-based incentive
plans - 265 - 265 - 265
Net purchase of treasury shares - - - - - -
Other changes - (51) - (51) 51 -
Comprehensive result for the period
Actuarial gains (losses) - 2,844 - 2,844 - 2,844Tax on items booked in Other
Comprehensive Income - (1,070) - (1,070) - (1,070)
Currency translation differences - (10,661) - (10,661) (164) (10,825)
Net result for the period - - 19,352 19,352 2,117 21,469
Total Comprehensive result for the
period - (6,441) 19,352 12,911 1,953 14,864
Balance at June 30, 2017 62,293 93,645 19,352 175,290 15,650 190,940
(in thousands of Euro) Non-
controlli
ng
Total
Balance at December 31, 2017 62,394 88,425 26,600 177,419 17,724 195,143
Paid share capital increase 67 186 - 253 104 357
Allocation of 2017 net profit:
Legal reserve - - - - - -
Dividends - - - - (9) (9)
Retained earnings - 26,600 (26,600) - - -
Recognition of share-based incentive
plans - 358 - 358 - 358
Net purchase of tresury shares - - - - - -
Other changes - (35) - (35) 35 -
Comprehensive result for the period
Fair value measurement of cash flow
hedging instruments - 1,658 - 1,658 - 1,658
Actuarial gains (losses) - 1,137 - 1,137 - 1,137
Tax on items booked in Other
Comprehensive Income - (591) - (591) - (591)
Currency translation differences - (6,494) - (6,494) 3 (6,491)
Net result for the period - - 17,045 17,045 2,055 19,100
Total Comprehensive result for the
period - (4,290) 17,045 12,755 2,058 14,813
Balance at June 30, 2018 62,461 111,244 17,045 190,750 19,912 210,662
Total
Attributable to the shareholders of the parent
company
Share
capital
Reserves
and
retained
earnings
(accumul
a- ted
losses)
Net result
for the
period
Fair value measurement of cash flow
hedging instruments
Share
capital
Reserves
and
retained
earnings
(accumul
a- ted
losses)
Net result
for the
period
2,446 2,446 -
Attributable to the shareholders of the parent
company
- 2,446 -
Total
Some values for the year 2017 were recalculated following the application of “IFRS 15 – Revenue from
Contracts with Customers” and “IFRS 9 – Financial Instruments”.

24
EXPLANATORY AND SUPPLEMENTARY NOTES TO THE CONDENSED INTERIM CONSOLIDATED
FINANCIAL STATEMENTS: CONTENTS
Chapter Note no. Description
A GENERAL ASPECTS
1 Content and format of the Condensed interim consolidated financial statements
2 Consolidation principles and accounting policies
B SEGMENT INFORMATION
3 Operating segments
C NOTES ON THE MAIN ITEMS OF THE STATEMENT OF FINANCIAL POSITION
C1 ASSETS
4 Cash and cash equivalents
5 Other financial assets
6 Inventories
7 Trade and other receivables
8 Tangible fixed assets
9 Intangible assets
10 Investments in joint ventures
11 Other financial assets
12 Financial receivables and other non-current receivables
13 Deferred tax assets
14 Non-current assets held for sale
C2 LIABILITIES
15 Financial debts to banks and other financing creditors
16 Trade and other current payables
17 Other current liabilities
18 Long-term provisions and other payables
19 Deferred taxation
20 Share capital and reserves
21 Analysis of the net financial position
D NOTES ON THE MAIN INCOME STATEMENT ITEMS
22 Sales revenues
23 Seasonal nature of sales
24 Variable cost of sales
25 Manufacturing and R&D overheads
26 Depreciation and amortization
27 Distribution and sales fixed expenses
28 Administrative and general expenses
29 Personnel costs
30 Restructuring costs
31 Losses (gains) on disposal
32 Exchange (gains) losses
33 Other non-operating expenses (income)
34 Financial expenses (income), net
35 Losses (gains) from equity investments
36 Income taxes
37 Dividends paid
38 Earnings per share (EPS)
E 39 RELATED PARTY TRANSACTIONS
F COMMITMENTS AND RISKS
40 Operating leases
41 Investment commitments
42 Guarantees given
43 Other risks
44 Contingent assets and liabilities
45 Subsequent events
G 46 FINANCIAL INSTRUMENTS
H GROUP COMPANIES
47 List of Group companies

25
A) GENERAL ASPECTS
1. CONTENT AND FORMAT OF THE CONDENSED INTERIM
CONSOLIDATED FINANCIAL STATEMENTS
The interim condensed Consolidated Financial Statements for the period 1 January -
30 June 2018 have been prepared in accordance with International Financial
Reporting Standards ("IFRS") issued by the International Accounting Standards
Board (“IASB”) and adopted by the European Union and have been prepared
according to IAS 34 - "Interim Financial Reporting", applying the same accounting
policies used in the preparation of the condensed Consolidated Financial Statements
at 31 December 2017 except as provided by note no. 2 “Consolidation principles and
accounting policies”. “IFRS” also means the International Accounting Standards
(“IAS”) currently in force, as well as all of the interpretation documents issued by the
International Financial Reporting Standards Interpretations Committee (“IFRS IC”,
formerly “IFRIC”) previously called the Standing Interpretations Committee (“SIC”).
To this end, the figures of the financial statements of the consolidated subsidiaries
have been appropriately reclassified and adjusted.
As a partial exception to IAS 34 provisions, these interim condensed financial
statements provide detailed as opposed to condensed statements in order to provide a
better and clearer overview of the changes that have taken place in the Company’s
assets and liabilities, financial position and results during the half-year.
They also contain the disclosures required by IAS 34 with the supplementary
information considered useful for a clearer understanding of these half-year financial
statements.
The interim condensed financial statements as at 30 June 2018 should be read in
conjunction with the annual financial statements as at 31 December 2017.
With reference to IAS 1, the Board Directors confirm that, considering the economic
forecasts, the capitalisation and the financial position of the Group, the same operates
as a going concern.
The interim condensed financial statements as at 30 June 2018 were approved by the
Board of Directors on 24 July 2018.
1.1 Format of the Condensed interim consolidated financial statements
The financial statements as at 30 June 2018 are consistent with those used for the
annual report as at 31 December 2017.
The Income Statement also provides the following intermediate results in order to
give a clearer understanding of the typical results of normal manufacturing activities,
the financial side of the business and the impact of taxation:
- Contribution margin: it is the difference between sales revenues and variable
cost of sales;
- EBIT: it represents the profit before financial items, tax and profit attributable
to minority interests;
- Result before taxes and non-controlling interests;
- Net result before non-controlling interests;
- Group net result.

26
1.2 Content of the condensed interim consolidated financial statements
The interim condensed interim consolidated financial statements for the six-month
period ending 30 June 2018 include the Holding Company Sogefi S.p.A. and its
controlled subsidiaries.
Section H of these notes gives a list of the companies included in the scope of
consolidation and the percentages held.
These financial statements are presented in Euro and all figures are rounded up or
down to the nearest thousand Euro, unless otherwise indicated.
The consolidated interim condensed financial statements have been prepared
according to the consolidation method on a line-by-line basis of the statements of
Sogefi S.p.A., the Holding Company, and those of all Italian and foreign companies
under its control.
It should be noted that in the first half of 2018 the subsidiary Allevard IAI
Suspensions Pvt Ltd approved a capital increase of Euro 104 thousand (amount
approved and paid in) fully subscribed by minority shareholders; the stake held by the
Holding company Sogefi Suspensions S.A. therefore fell from 75.67% to 74.23%.
This transaction generated a reclassification between equity of non-controlling
interests and group's equity of Euro 35 thousand.
No further changes were made to the scope of consolidation during the period.

27
1.3 Group composition
As required by IFRS 12, Group composition as at 30 June 2018 and 31 December
2017 was as follows:
June 30, 2018 December 31,
Air&Cooling Canada 1 1
France 1 1
Mexico (*) 1 1
Romania 1 1
China (**) 2 2
Luxembourg 1 1
USA 1 1Hong Kong 1 1
Filtration Italy (***) 1 1
France 1 1
Great Britain 1 1
Spain 1 1
Slovenia 1 1
USA (***) 1 1
Brazil 1 1
Argentina 1 1Morocco 1 1
Suspensions Italy 2 2
France 2 2
Great Britain 2 2
Germany 2 2
The Netherlands 1 1
Brazil 1 1Argentina 1 1
Sogefi Gestion S.A.S. France 1 1
TOTAL 31 31
(*) This subsidiary works also for Suspensions business unit.
(***) This subsidiary works also for Air&Cooling business units.
June 30, 2018 December 31, Air&Cooling China 1 1
Filtration India (***) 1 1
Suspensions France 1 1
Spain 1 1
China 1 1India 1 1
TOTAL 6 6
(***) This subsidiary works also for Air&Cooling business unit.
Business Unit RegionNon-wholly-owned subsidiaries
Business Unit RegionWholly-owned subsidiaries
(**) These subsidiaries work also for Filtration and Suspensions business units.

28
2. CONSOLIDATION PRINCIPLES AND ACCOUNTING POLICIES
The consolidation and accounting policies applied in preparing the condensed
financial statements for the six-month period ended 30 June 2018 are consistent with
those used for the annual financial statements as of 31 December 2017 to which the
reader should refer, except as reported below due to the application of the new
accounting standards IFRS 15 and IFRS 9.
The financial statements of the consolidated Argentine companies were prepared at
30 June 2018 in the functional currency without taking into account the effects of the
application of IAS 29 "Financial Reporting in Hyperinflationary Economies", which
will be considered, except for significant changes in the inflation trend of the
Argentine economy, for the period closing at 31 December 2018.
The preparation of the interim condensed financial statements requires Directors to
make estimates and assumptions, which affect the values of revenues, costs, assets
and liabilities and the information regarding potential assets and liabilities as at the
date of the interim condensed financial statements. If in the future such estimates and
assumptions, which are based on the best estimates of the Directors, should change
due to actual circumstances, they will be adjusted accordingly in the period in which
said circumstances change.
It should also be noted that some measurement processes, in particular the more
complex ones, such as the calculation of any impairment of non-current assets, are
generally fully made only when the annual financial statements are prepared, when
all of the information that may be required is available, with the exception of the
cases in which there are impairment indicators that require the performance of an
impairment test.
The main items affected by these estimates are as follows:
goodwill (Euro 126,639 thousand as at 30 June 2018): the goodwill
impairment test conducted as of 31 December 2017 confirmed that there was
no need to recognise any impairment loss to the values shown in the financial
statements. The trend of operating results of the business units in the first half
year 2018 and the forecasts for the full year 2018 are basically in line with the
expectations included in the 2018 - 2022 multiyear plan for the Group as
approved by the management. Hence there are no indications that the
goodwill might be impaired in the first half of 2018;
recoverability of deferred tax assets for tax losses (Euro 5.302 thousand as at
30 June 2018): as at 30 June 2018 recognised deferred tax assets for tax
losses incurred during previous years (referred to subsidiaries Sogefi Air &
Cooling S.A.S., Sogefi Filtration d.o.o., Sogefi (Suzhou) Auto Parts Co., Ltd
and Sogefi Filtration Spain S.A.U.) to the extent that the availability of future
taxable income is considered probable, over the time horizon of the plan,
against which the tax losses can be used for the subsidiaries. Such probability
is also determined based on the fact that such losses have originated under
extraordinary circumstances, such as past or on-going restructuring, that are
unlikely to occur again in the future and that these losses may be recovered
throughout an unlimited or long-term time frame.
With reference to the Holding Company Sogefi S.p.A., taxes are recognised
in the income statement under "Current taxes" to the extent that the loss is
actually offset against taxable income generated within the CIR Group tax
filing system. The possible tax losses carried forward in excess of the offset

29
amount will be recognised as deferred tax assets as they are likely to be
recovered taking into account that the Holding Company has joined the CIR
Group tax filing system permanently. The ability to recover such tax will be
based on expected future taxable income according to the forecasts involving
the companies participating in the CIR Group tax filing system;
pension plans (Euro 47,127 thousand as of 30 June 2018): actuaries who offer
their consulting services to the Group use different statistic assumptions in
order to anticipate future events for the purpose of estimating pension plan
expenses, liabilities and assets. Such assumptions concern discount rate,
expected return on pension plan assets (this particular assumption concerns
nearly exclusively British pension funds), future wage inflation rates,
mortality and turnover rates;
derivatives (Euro 801 thousand for assets and Euro 228 thousand for
liabilities as at 30 June 2018): the estimate of derivatives fair value and the
efficacy test on derivatives held for “hedge accounting” were performed with
the aid of external consultants based on valuation models commonly used in
the industry;
provision for product warranties (Euro 16.3 million)/Other non-current
receivables (Euro 9.7 million).
1) With regard to provision for product warranties, there are claims in
progress by two customers relating to a defective component supplied
starting from 2010 by the subsidiary Sogefi Air & Cooling S.A.S.
(formerly named Systèmes Moteurs S.A.S., “SM”) before and after it was
purchased by Dayco Europe S.r.l. (in 2011). The Company believes that
the defect was caused by a thermostat manufactured by a supplier of SM
and in 2012 filed a law suit against that supplier at the French courts
seeking indemnity for any damages it might have to pay to its customers.
In June 2012 the court appointed a technical expert to write an expert
witness report, initially for the purpose of determining the causes of
product defect. Subsequently, the subsuppliers and the customers, and
lastly Dayco took part in the investigation process.
The court’s expert is tasked with determining the nature of the defect, the
liability of the different parties involved and the amount of damages.
To date, the expert established that the defect was caused by the thermostat
manufactured by the supplier of SM.
With regard to the liability of the parties involved, the expert is analysing
the different phases of the product approval procedure to allocate liability
among the different parties involved (thermostat supplier, its subsuppliers,
SM as first-tier supplier, and the customers).
With regard to the determination of damages, the expert was asked to
evaluate whether the damages claimed by the customers are appropriate for
the purpose of allocating final damages among the parties involved.

30
2) The total amount of the claims is currently Euro 165.4 million, broken
down as follows:
- Euro 112.4 million for past and future campaigns;
- Euro 31.5 million for interest and other costs;
- Euro 21.5 million for damage to reputation and loss of future income.
Based on existing proceedings, the Company and its legal counsel deem
that there is only a remote possibility that a liability will arise from the
latter claim in the amount of Euro 21.5 million.
Regarding the request for Euro 31.5 million for interest and other costs, the
Company, supported by its legal counsel, recalculated the amounts for
which details were provided by the customers and then based on the
current situation fully and prudentially assessed the amounts for which
details have not yet been provided.
3) Based on the foregoing, the claim considered by the Company today
amounts to Euro 132.9 million.
The Company investigated such claim thoroughly to identify the concerned
production periods and – prior to the allocation of liability, if any –
according to its estimates Euro 64.1 million relate to products
manufactured before the SM acquisition, and Euro 68.8 million to post-
acquisition periods.
In this regard, in May 2016, the Company obtained an arbitration award in
the international arbitration proceedings initiated against Dayco to recover
the costs incurred by SM after the acquisition.
In short, the award confirmed that Sogefi has a general right to
indemnification for the claims relating to products manufactured before
Sogefi purchased SM, and ordered Dayco to pay Euro 9.4 million to Sogefi
for the claims already paid (including the amounts paid in connection with
the above mentioned defective component). The award amount had been
paid at the end of the year 2016. In 2017, an additional amount of Euro 0.3
million was collected for further claims still pending between Sogefi and
Dayco at the end of 2016.
If appropriate, the Company will claim such general right to
indemnification against Dayco in connection with amounts paid to
customers for production lots of the defective components before Sogefi
purchased SM.
The award stated that Sogefi is responsible for any claims relating to
production lots manufactured after the acquisition.
4) The Company estimates the claims relating to production lots
manufactured after the acquisition in total Euro 68.8 million before this
liability is allocated among the different parties involved (thermostat
supplier, its subsuppliers, SM, and the customers).
The Company, supported by its legal counsel, feels that the expert can
recognise only a portion of these sums.

31
5) SM paid Euro 21 million on a provisional basis for claims received by
customers. These amounts were paid under standstill agreements, without
any admission of liability. Such amounts will be adjusted when the Court
decides on the merits of the case or under subsequent settlement
agreements.
At the end of the year 2016, the Company’s provision for product
warranties – less the total amount already paid of Euro 21 million –
amounted to Euro 16.3 million. This amount was re-analysed in the fiscal
year 2017 and in the first semester 2018. The Company, supported by its
legal counsel, confirmed this provision.
6) With regard to the indemnities owed by the seller of SM shares, it is
worthwhile pointing out that the Sogefi Group entered an indemnification
asset totalling Euro 23.4 million in the Consolidated Financial Statements
in 2011, because the seller Dayco had provided contractual guarantees
relating to defect liability claims existing at the time of the acquisition,
including those noted above.
Based on the outcome of the arbitration proceedings, in 2016 the Company
reduced the amount expected to be recovered from Dayco by Euro 4
million and consequently wrote down the indemnification asset by the
same amount.
After the payments of 2016 and 2017, the residual value of the
indemnification asset as at 30 June 2018 was Euro 9.7 million.
Please note that both Sogefi and Dayco appealed parts of the award before
the Court of Appeals in Milan. Sogefi appealed against the decision which
stipulated that any payments for claims relating to production that took
place after the acquisition will be borne by Sogefi; Dayco appealed against
the award for the part which confirmed the validity of the compensation to
Sogefi included in the acquisition contract. It should be noted that the
validity of such indemnities was confirmed by both the award and a
preliminary ruling of the Court of Appeals in Milan, that rejected Dayco’s
petition to stay enforcement of the award and confirmed that the award is
enforceable.
It should be noted that these are complex proceedings that involve
judgements on technical, juridical and commercial matters, and present
uncertainties connected with the outcome of the proceedings before the
French courts and the arbitration award. Estimates concerning risks
provision and the recovery of booked assets are based on the information
available at the time of preparing the financial statements. The estimate is
subject to change as events evolve.
IFRS accounting standards, amendments and interpretations applicable since 1
January 2018
The following IFRS accounting standards, amendments and interpretations were first
adopted by the Group as from 1 January 2018:
32
Application of the new accounting standard IFRS 15 – Revenue from contracts
with customers
The standard provides for a new revenue recognition model, which will be applicable
to all agreements made with customers, with the exception of those falling under the
scope of application of other IFRSs, such as leases, insurance contracts and financial
instruments.
As far as the Sogefi Group is concerned, application of the new standard IFRS 15
substantially led to a change in the accounting of "tooling" and "prototypes" supplied
to customers, as shown below.
Supply of “tooling” and "prototypes" does not meet the requirements to be identified
as a separate performance obligation, so related revenues will be recognised on the
same duration as the performance obligation identified by the supply of goods. This
is because the "tooling" is used by the Group exclusively for the supply of the
specific goods ordered by the customer and the customer does not have a substantial
option to obtain the production of these specific goods from another supplier through
the use of "tooling". Contracts entered into with customers feature specific clauses in
the different jurisdictions in which the Group operates (the legal ownership of the
“tooling” could be transferred to the customer before the start of mass production in
exchange for a fixed fee or at the end of mass production, i.e. the revenue from the
sale of “tooling” could be included in the sale price of the individual goods).
Previously, revenues from the contractual obligation to supply the “tooling” were
recognised on the basis of the contractual provisions, with specific reference to the
transfer of ownership of the “tooling” to the customer.
By changing the recognition policy for revenues deriving from the contractual
obligation to provide the “tooling”, the Group changed the accounting policy relating
to the costs for the production/purchase of the “tooling” as well. These costs are now
capitalised in the item "Tangible fixed assets" and are depreciated over the period
corresponding to the supply of the goods to the customer (these costs are therefore no
longer recorded in the item "Variable cost of sales - Materials"). Costs relating to the
development of “prototypes” (previously recorded under the item "Variable cost of
sales - Materials") are now capitalised in the item "Intangible fixed assets" and
amortised over the period corresponding to the supply of goods to the customer.
The average duration of supply of goods to the customer has been conventionally
defined by the Group in 4 years on the basis of historical experience. During this
period, revenues from contractual obligations relating to the development of the
production process and the supply of "tooling" and "prototypes" will be recorded, and
the costs for the production/purchase of "tooling" and "prototypes" will be
depreciated.
The Group has analysed the contractual obligation for the warranty for the supplied
components, concluding that it does not represent a distinct performance obligation
because it does not provide additional services that benefit the customers. Warranty
costs will continue to be recognised under IAS 37 - Provisions, Contingent Liabilities
and Contingent Assets.
The Group has also identified an impact on the presentation of revenues from
aftermarket customers. This is due to the "marketing contributions" provided to

33
customers who meet the definition of "consideration payable to customers" in IFRS
15 and that have to be presented net of revenues. These costs were previously
presented in the item "Variable cost of sales" because they are considered marketing
costs provided by customers to the Group.
In addition to the effects described above, other aspects of the contracts with
customers that are relevant to the Group's activities and business were analysed,
without finding any significant impact for the application of the new standard. This
includes, for example, contractual aspects (price review, productivity, contract
acquisition costs) which have been measured and recorded in accordance with the
new principle, and their analysis is still under consideration for new contracts.
The Group restated the comparative period to the date of first-time adoption of IFRS
15 by adopting practical measures. In particular, IFRS 15 has not been applied
retrospectively for contracts completed before 1 January 2018. The retrospective
application has also been applied to the corresponding 2017 balances, with an effect
on initial equity at 1 January 2017 of Euro 11.7 million.
The adoption of the new standard caused a reduction in shareholders' equity as at 1
January 2018 from Euro 189 million to approximately Euro 177.7 million (net of the
tax effect). It should be noted that the impact on the net profit for 2017 was not
material.
It should also be noted that the new accounting policy relating to “tooling” and
“prototypes” mentioned above led to a reduction in the items "Sales revenues" and
"Variable cost of sales" and an increase in the item "Depreciation and amortization".
Lastly, it should be noted that some measurements may be subject to changes until
presentation of the Group's first consolidated financial statements for the year
including the date of first adoption, also in light of the checks carried out on the
changes made to the application models and information systems currently being
completed.

34
The following tables present the effects of the adoption of the new standard in the
income statement as at 30 June 2017 and in the balance sheet as at 31 December
2017.
CONSOLIDATED INCOME STATEMENT
Period Period
(in millions of Euro)
01.01 –
06.30.2017
01.01 –
06.30.2017
restated Change
Amount Amount Amount
Sales revenues 866.0 857.5 (8.5)
Variable cost of sales 615.5 586.9 (28.6)
Depreciation and amortization 35.6 56.3 20.7
Income taxes 14.9 14.9 -
GROUP NET RESULT 20.0 19.4 (0.6)
CONSOLIDATED STATEMENT OF FINANCIAL POSITION
ASSETS12.31.2017
12.31.2017
restated Change
Inventories 159.3 122.9 (36.4)
Property, plant and equipment 275.8 384.5 108.7
Intangible assets 272.6 290.5 17.9
Deferred tax assets 40.1 45.5 5.4
TOTAL ASSETS 1,101.5 1,197.1 95.6
LIABILITIES12.31.2017
12.31.2017
restated Change
Other current liabilities 8.6 49.3 40.7
Deferred tax liabilities 39.7 40.6 0.9
Other non-current payables 6.7 72.0 65.3
TOTAL LIABILITIES 894.8 1,001.7 106.9
SHAREHOLDERS' EQUITY - - -
Reserves and retained earnings (accumulated
losses) 100.0 88.7 (11.3)
Group net result for the period 26.6 26.6 -
TOTAL SHAREHOLDERS' EQUITY
ATTRIBUTABLE TO THE HOLDING COMPANY 189.0 177.7 (11.3)
TOTAL LIABILITIES AND EQUITY 1,101.5 1,197.1 95.6
Application of new accounting standard IFRS 9 – Financial instruments
The document (issued on 24 July 2014) includes the results of the classification,
valuation, derecognition, impairment and hedge accounting phases relating to the
IASB project pending the replacement of IAS 39:
it introduces new criteria to classify and measure financial assets and
liabilities;
with reference to the impairment model, the new standard requires the losses
on receivables to be estimated based on the expected losses model (instead of
the incurred losses model of IAS 39) using information that can be evidenced,

35
available free of charge or without unreasonable effort and including historic,
current and forecast data;
a new hedge accounting model is introduced (additional types of transactions
can be designated for hedge accounting, different accounting method for
forward contracts and options when they are included in a hedge accounting
transaction, changes to effectiveness test).
Based on the analysis performed, the effect on initial shareholders' equity, resulting
from the implementation of IFRS 9, is a reduction of Euro 0.3 million (net of the tax
effect) as a result of a reduction in receivables of Euro 0.4 million, without, however,
making any significant changes to the income statement figures for the first half of
2018.
The adjustment to reduce retained earnings refers to the recognition of further, and
possible, losses due to a reduction in financial assets, deriving from the application of
the expected credit loss model introduced by IFRS 9, in replacement of the incurred
credit loss model provided for by IAS 39. On the basis of this new model, the
financial assets not past due, for which there is no evidence of impairment, were also
analysed.
It should also be noted that the reduction in value recorded as at 1 January 2018
mainly refers to trade receivables; the analyses carried out at present on the other
financial assets and liabilities did not reveal any significant critical issues.
The Group decided to continue to use the hedge accounting rules provided for in IAS
39 for all hedges already designated as hedge accounting at 31 December 2017.
It should be noted that the effects of the adoption of this standard at 1 January 2018
may change as the Group has not yet completed the verification and evaluation of the
application models, and in addition the new accounting policies may be subject to
changes until the presentation of the first consolidated financial statements of the
Group for the year which includes the date of first adoption.
The Group did not restate the first comparative year at the date of first-time adoption
of IFRS 9 considering the limited impact deriving from the adoption of this standard.
Other standards
IFRIC 22 “Foreign Currency Transactions and Advance Consideration”
(issued on 8 December 2016 and endorsed by the European Commission in
March 2018). This interpretation provides guidelines on foreign currency
transactions when non-monetary advance consideration paid or received is
recognised before recognition of the relating asset, expense or income. This
document clarifies how an entity has to determine the date of the transaction
and consequently the spot exchange rate to be used for foreign currency
transactions whose consideration is paid or received in advance. IFRIC 22
applies as from 1 January 2018. The new provisions as at 30 June 2018 did
not have any impact on the Sogefi Group's interim financial statements.
Amendments to IAS 40 “Transfers of Investment Property” (issued on 8
December 2016). These amendments provide clarifications on the transfer of
properties to, or from, investment properties. Specifically, an entity should

36
only reclassify a property asset to or from investment property when there is
evidence of a change in use of that asset. Such change in use must be
supported by a specific event occurred in the past. A change in intention by
the entity’s management alone is not sufficient. These amendments apply as
from 1 January 2018. The new provisions as at 30 June 2018 did not have any
impact on the Sogefi Group's Interim Financial Statements.
Amendments to IFRS 2 “Classification and measurement of share-based
payment transactions” (issued on 20 June 2016). This document provides
clarifications on how to account for the effects of vesting conditions in cash-
settled share-based payments, how to classify share-based payments that
include net settlement features and how to account for changes to the terms
and conditions of a share-based payment that turn cash-settled share-based
payment to equity-settled share-based payment. As of 30 June 2018, the
Group there are no significant transactions of this kind currently in place.
Document “Annual Improvements to IFRS Standards 2014-2016 Cycle"
(published on 8 December 2016 and endorsed in February 2018) with major
changes concerning:
o IFRS 1 - First adoption of International Financial Reporting Standards
- The changes eliminate some exemptions from IFRS 1 as the benefit
of these exemptions is deemed to have been superseded. These
amendments are to be applied for financial periods beginning on 1
January 2018.
o IAS 28 – Equity investments in associates and joint ventures– The
amendment clarifies that the option for an investment entity in risk
capital or another entity qualified to measure the investments in
associates and joint ventures values at fair value posted to the income
statement (rather than by applying the equity method) is performed for
each single investment upon initial recognition. These amendments
are to be applied for financial periods beginning on 1 January 2018.
These improvements had no effects for the companies within the Sogefi
Group.
IFRS and IFRIC accounting standards, amendments and interpretations
approved by the European Union but not yet compulsorily applicable and not
early adopted by the Group
The Group has not adopted the following new and amended standards that have been
issued but are not yet applicable:
IFRS 16 – Leases (issued on 13 January 2016). This document replaces IAS
17 – Leases, as well as IFRIC 4 Determining whether an Arrangement
contains a Lease, SIC-15 Operating Leases - Incentives and SIC-27
Evaluating the Substance of Transactions Involving the Legal Form of a
Lease.
The new standard provides a new definition of lease and introduces a criterion
based on the control (right of use) of an asset to differentiate between lease
and service agreements according to: asset identification, right to replacement

37
of the asset, right to obtain all economic benefits arising out of use of the
asset and right to control the use of the asset underlying the agreement.
The standard introduces a single lessee accounting model for recognising and
measuring lease agreements, which provides for the underlying asset –
including assets underlying operating leases – to be recognised in the
statement of financial position as assets and leas financial liability. Lessees
may elect to not recognise agreements for low-value assets or with a term of
up to 12 within the scope of this standard. No significant changes are
introduced for lessor accounting.
The standard applies for reporting period beginning on or after 1 January
2019. Early application is only allowed for early adopters of IFRS 15 –
Revenue from Contracts with Customers.
Directors expect that the adoption of IFRS 16 will have a significant impact
on lease accounting and the relevant disclosures included in the Group’s
Consolidated Financial Statements. Still, it will be impossible to provide a
reasonable estimate as to the effects until the Group completes a detailed
analysis of the relevant agreements. The overall impact will be reliably
outlined in the next half of the year and any operational integrations/changes
to company processes will be implemented on the IT systems.
Amendment to IFRS 9 “Prepayment features with Negative Compensation”
(issued on 12 October 2017 and endorsed by the European Commission in
March 2018). The amendment proposes that the financial assets which could
result in a negative compensation would be eligible to be measured at
amortised cost or fair value through other comprehensive income as a result
of a prepayment feature (depending on a company's business model). These
amendments are to be applied for financial periods beginning on 1 January
2019.
IFRS and IFRIC accounting standards, amendments and interpretations not yet
endorsed by the European Union
The European Union has not yet completed its endorsement process for the standards
and amendments below reported at the date of these Interim Financial Statements.
The Directors are evaluating the possible effects of applying these amendments to the
Group’s Consolidated Financial Statements.
Amendments to IFRS 10 and IAS 28 “Sales or Contribution of Assets
between an Investor and its Associate or Joint Venture” (issued on 11
September 2014). The purpose of these amendments was to resolve the
conflict between IAS 28 and IFRS 10 concerning the measurement of profit
or loss arising from transfers or assignments of a non-monetary asset to a
joint venture or associate in return for its shares. The IASB has suspended the
application of these amendments for the time being.
IFRIC 23 “Uncertainty over income taxes treatment” (issued on 7 June 2017).
The interpretation clarifies the application of recognition and measurement
requirements in IAS 12 Income Taxes when there is uncertainty about tax
treatment. These amendments are to be applied for financial periods
beginning on 1 January 2019, though early adoption is allowed.
Amendment to IAS 28 “Long-term Interests in Associates and Joint Ventures”
(issued on 12 October 2017). The amendment clarifies that a company applies

38
IFRS 9 to long-term interests in an associate or joint venture that form part of
the net investment in the associate or joint venture. The amendment also
requires IFRS 9 to be applied to these assets before the application of IAS 28,
so that the entity does not take into account any adjustments to long-term
interests arising from the application of this IAS. These amendments are to be
applied for financial periods beginning on 1 January 2019, though early
adoption is allowed.
Document “Annual Improvements to IFRS Standards 2015-2017 Cycle"
(issued on 12 December 2017). These amendments are part of the Board's
process for maintaining and clarifying IFRS Standards and affected: IAS 12
Income Taxes, IAS 23 Borrowing Costs e IFRS 3 Business Combination.
These amendments are to be applied for financial periods beginning on 1
January 2019, though early adoption is allowed.
Amendment to IAS 19 - Plan Amendment, Curtailment or Settlement
(published in February 2018). The amendment clarifies how current service
cost and net interest are determined when a change occurs in a defined benefit
plan. These amendments are to be applied for financial periods beginning on
1 January 2019. Early adoption is allowed.
Exchange rates
The following exchange rates have been used for translation purposes:
F.Y. 2017
Average 06.30 Average 06.30 12.31
US dollar 1.2108 1.1658 1.0825 1.1412 1.1993
Pound sterling 0.8797 0.8860 0.8601 0.8793 0.8872
Brazilian real 4.1413 4.4876 3.4393 3.7600 3.9728
Argentine peso 26.0281 32.7048 16.9981 18.8857 22.9305
Chinese renminbi 7.7101 7.7170 7.4416 7.7387 7.8046
Indian rupee 79.4913 79.8130 71.1238 73.7463 76.6284
New romanian Leu 4.6544 4.6631 4.5364 4.5523 4.6585
Canadian dollar 1.5464 1.5442 1.4445 1.4785 1.5039
Mexican peso 23.0787 22.8817 21.0261 20.5846 23.6630
Moroccan Dirham 11.2486 11.1080 10.7793 11.0096 11.2360
Hong Kong dollar 9.4904 9.1468 8.4161 8.9071 9.3721
1st half 2018 1st half 2017

39
B) SEGMENT INFORMATION
3. OPERATING SEGMENTS
In compliance with the provisions of IFRS 8, the following information is provided
by operating segments (business segments).
The operating segments and performance indicators have been determined on the
basis of the reports used by the Group’s Managing Director for taking strategic
decisions.
Business segments
With regard to the business segments, disclosures concerning the three business units
are provided: Suspensions, Filtration, and Air and Cooling. Figures for the Holding
Company Sogefi S.p.A. and the subsidiary Sogefi Gestion S.a.S. are also provided
for the purpose of reconciliation with consolidated values.
The tables below provide the income statement and the statement of financial
position figures of the Group for the first half of 2017 and 2018:
(in thousands of Euro)
Air &
Cooling
Suspensions Filtration Sogefi SpA
/ Sogefi
Gestion
S.A.S.
Adjust-
ments
Sogefi
Group
consolida-
tion
REVENUES
Sales to third parties 261,896 307,911 287,694 - - 857,501
Intersegment sales 441 829 920 14,535 (16,725) -
TOTAL REVENUES 262,337 308,740 288,614 14,535 (16,725) 857,501
RESULTS
EBIT 16,584 22,631 15,616 (5,062) (584) 49,185
Financial expenses, net (12,806)
Income from
equity investments -
Losses from
equity investments -
Result before taxes 36,379
Income taxes (14,910)
Loss (profit) attributable
to non-controlling (2,117)
NET RESULT 19,352
ASSETS
Segment assets 366,523 429,636 353,044 606,612 (729,606) 1,026,209
Unallocated assets - - - - 150,776 150,776
TOTAL ASSETS 366,523 429,636 353,044 606,612 (578,830) 1,176,985
LIABILITIES
Segment liabilities 240,821 283,013 273,470 424,367 (235,626) 986,045
TOTAL LIABILITIES 240,821 283,013 273,470 424,367 (235,626) 986,045
OTHER INFORMATION
Increase in tangible and
intangible fixed assets 23,326 17,220 17,612 949 (192) 58,915
Depreciation, amortization
and writedowns 22,389 16,900 23,230 1,745 575 64,839
June 30, 2017
STATEMENT OF FINANCIAL POSITION

40
(in thousands of Euro)
Air &
Cooling
Suspensions Filtration Sogefi SpA
/ Sogefi
Gestion
S.A.S.
Adjust-
ments
Sogefi
Group
consolida-
tion
REVENUES
Sales to third parties 248,469 313,784 276,891 - - 839,144
Intersegment sales 411 910 281 12,705 (14,307) -
TOTAL REVENUES 248,880 314,694 277,172 12,705 (14,307) 839,144
RESULTS
EBIT 17,556 13,184 18,124 (4,030) (395) 44,439
Financial expenses, net (13,508)
Income from
equity investments
Losses from
equity investments
Result before taxes 30,931
Income taxes (11,831)
Loss (profit) attributable to
non-controlling interests (2,055)
NET RESULT 17,045
ASSETS
Segment assets 374,009 439,234 390,764 620,376 (751,325) 1,073,058
Unallocated assets - - - - 148,081 148,081
TOTAL ASSETS 374,009 439,234 390,764 620,376 (603,244) 1,221,139
LIABILITIES
Segment liabilities 243,194 295,064 314,376 412,695 (254,854) 1,010,476
TOTAL LIABILITIES 243,194 295,064 314,376 412,695 (254,854) 1,010,476
OTHER INFORMATION
Increase in tangible and
intangible fixed assets 23,290 15,461 24,004 760 (487) 63,028
Depreciation, amortization
and writedowns 21,959 17,881 17,172 2,020 529 59,561
June 30, 2018
-
-
STATEMENT OF FINANCIAL POSITION
Please note that the Air and Cooling Business Unit figures include the net book value
of the Systèmes Moteurs Group (company name is now Sogefi Air & Cooling
S.A.S.), deriving from local accounts – in other words, not including the fair value
adjustment of net assets after the Purchase Price Allocation of 2011 – and only the
adjustments arising from the Purchase Price Allocation and relating to the change in
product warranty provisions (contingent liabilities booked upon PPA); the remaining
adjustments arising from the Purchase Price Allocation are posted in column
"Adjustments".
Adjustments to “Intersegment sales” mainly refer to services provided by the Holding
Company Sogefi S.p.A. and by subsidiary Sogefi Gestion S.A.S. to other Group
companies (see note 39 for further details on the nature of the services provided).
This item also includes intersegment sales between the business units. Intersegment
transactions are conducted according to the Group's transfer pricing policy.
The adjustments to “EBIT” mainly refer to depreciation and amortization linked to
the revaluation of assets resulting from the acquisition of the Systemes Moteurs
Group in 2011.
In the Statement of Financial Position, the adjustments to the item "Segment assets"
refer to the consolidation entry of investments in subsidiaries and intercompany
receivables.

41
Adjustments to “Unallocated assets” mainly include the goodwill and the fixed assets
revaluations resulting from the acquisitions of: the Allevard Ressorts Automobile
Group, Sogefi Rejna S.p.A., the Filtrauto Group, 60% of Sogefi-MNR Engine
Systems India Pvt Ltd and the Systemes Moteurs Group.
Adjustments to “Unallocated assets” mainly include the goodwill and the fixed assets
revaluations resulting from the acquisitions of: the Allevard Ressorts Automobile
Group, Sogefi Rejna S.p.A., the Filtrauto Group, 60% of Sogefi M.N.R. Filtration
India Private Ltd (now merged into Sogefi-MNR Engine Systems India Pvt Ltd) and
Systemes Moteurs Group.
“Depreciation, amortization and writedowns” include writedowns of tangible fixed
assets of Euro 3,550 thousand for the most part relating to European subsidiaries.
These assets were written down based on the recoverable amount of assets at the end
of the first half of 2018.
Information on the main customers
Revenues from sales to third parties as of 30 June 2018 accounting for over 10% of
Group revenues are shown in the following table:
(in thousands of Euro)
Group BU Filtration BU Air &
Cooling
BU
Suspensions
Amount %
Renault/Nissan 100,680 12.0 28,225 22,907 49,548
PSA 96,800 11.5 25,184 32,798 38,818
FCA/CNH Industrial 94,202 11.2 39,276 26,347 28,579
Ford 93,467 11.1 28,020 36,190 29,257
June 30, 2018
Group
Information on geographic areas
The breakdown of revenues by geographical area is analysed in the Directors' Report
and in note 22.
The following table shows a breakdown of total assets by geographical area:
(in thousands of Euro)
EuropeSouth
America
North
AmericaAsia
Adjust-
ments
Sogefi Group
consolidation
TOTAL ASSETS 1,518,707 97,798 148,701 76,724 (664,945) 1,176,985
June 30, 2017
(in thousands of Euro)
EuropeSouth
America
North
AmericaAsia
Adjust-
ments
Sogefi Group
consolidation
TOTAL ASSETS 1,582,075 80,776 164,846 78,655 (685,213) 1,221,139
June 30, 2018

42
C) NOTES ON THE MAIN INCOME STATEMENT ITEMS: STATEMENT OF
FINANCIAL POSITION
C 1) ASSETS
4. CASH AND CASH EQUIVALENTS
Cash and cash equivalents amount to Euro 104,357 thousand versus Euro 103,889
thousand as of 31 December 2017 and break down as follows:
(in thousands of Euro) June 30, 2018 December 31, 2017
Short-term cash investments 104,308 103,850
Cash on hand 49 39
TOTAL 104,357 103,889
“Short-term cash investments” earn interest at a floating rate.
For further details on changes in the various components of the net financial position,
please see note 21.
As of 30 June 2018, the Group has unused lines of credit for the amount of Euro
300,676 thousand. These funds are available for use on demand, because the
conditions required for their availability are met.
Please note that this item includes cash and cash equivalents in ARS (Argentine
Peso) for 10,892 thousand, i.e. the equivalent of Euro 333 thousand at the exchange
rate in force on 30 June 2018 (ARS 54,253 thousand, the equivalent of Euro 2,366
thousand at the exchange rate in force on 31 December 2017) held by the Argentinian
subsidiaries.
5. OTHER FINANCIAL ASSETS
“Other financial assets” can be broken down as follows:
(in thousands of Euro) June 30, 2018 December 31, 2017
Financial receivables 911 653
Held-to-maturity investments - -
Assets for derivative financial instruments 801 857
TOTAL 1,712 1,510
“Assets for derivative financial instruments” refer to the fair value of forward foreign
currency contracts not designated in hedge accounting.

43
6. INVENTORIES
The breakdown of inventories is as follows:
(in thousands of Euro)
Gross
Write-
downs Net Gross
Write-
downs Net
Raw, ancillary and consumable
materials 67,061 5,221 61,840 64,642 5,286 59,356
Work in progress and semi-
finished products 17,245 568 16,677 16,117 626 15,491
Finished goods and goods for
resale 53,966 6,553 47,413 54,773 6,692 48,081
TOTAL 138,272 12,342 125,930 135,532 12,604 122,928
June 30, 2018 December 31, 2017
The net value of inventories increased by Euro 3,002 thousand compared to 31
December 2017 (at constant exchange rates the increase would be Euro 6,233
thousand). This increase is due to the start of operations of the new plant in Morocco
for Euro 1,289 thousand and, for the remainder, to the usual seasonal trends.
7. TRADE AND OTHER RECEIVABLES
Current receivables break down as follows:
(in thousands of Euro) June 30, 2018 December 31, 2017
Trade receivables 190,064 172,136
Less: allowance for doubtful accounts 4,242 4,661
Trade receivables, net 185,822 167,475
Due from Parent Company 3,526 6,484
Tax receivables 25,000 23,062
Other receivables 7,627 5,508
Other assets 4,747 2,304
TOTAL 226,722 204,833
“Trade receivables” are non-interest bearing and have an average due date of 33 days,
against 36 days at the end of the previous year.
It should be noted that as of 30 June 2018, the Group factored trade receivables for
Euro 108,577 thousand (Euro 94,885 thousand as of 31 December 2017), including
an amount of Euro 95,317 thousand which was not notified (Euro 83,582 thousand as
of 31 December 2017) and for which the Group continues to manage collection
services. The risks and benefits related to these receivables have been transferred to
the factor; therefore these receivables have been derecognised in the Statement of
Financial Position debiting the consideration received from the factoring company.
Excluding the factoring transactions (Euro 108,577 thousand as at 30 June 2018 and
Euro 94,885 thousand as at 31 December 2017) and the negative effect of exchange
rates (Euro 3,841 thousand), net trade receivables show an increase of Euro 35,880
thousand mainly as a result of the increase in the Group’s business activities which
occurred in the second quarter of 2018 with respect to the end of the previous year.
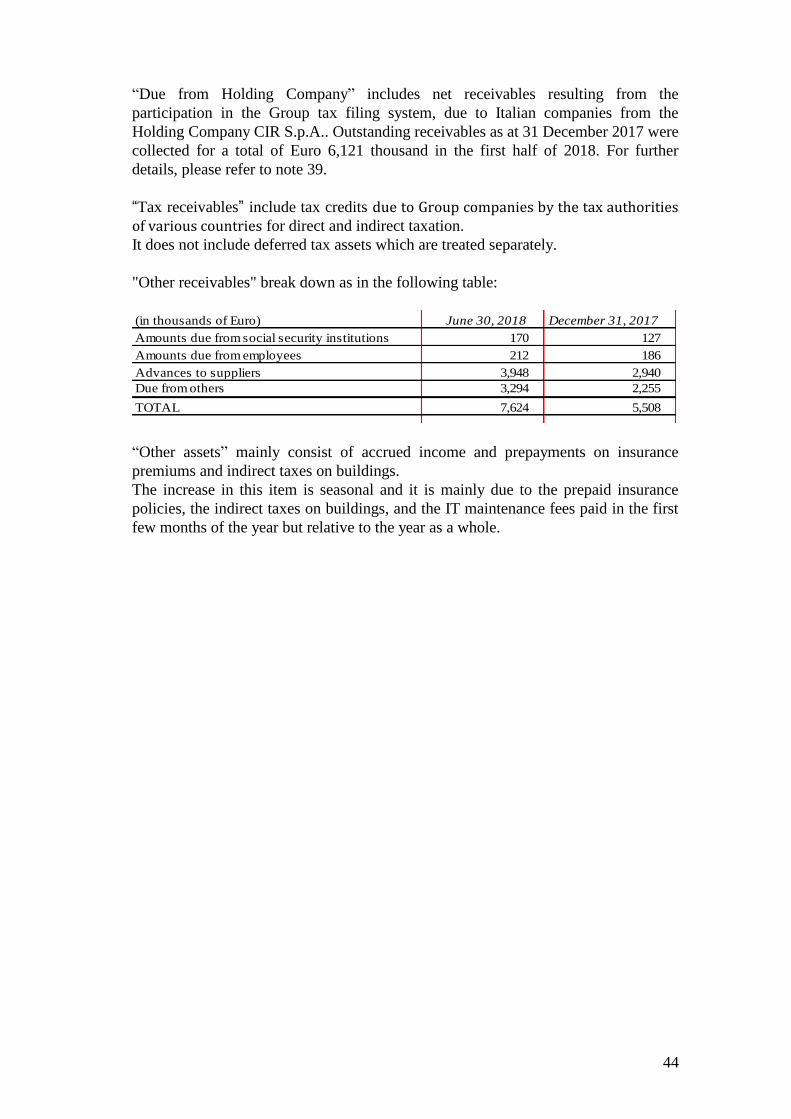
44
“Due from Holding Company” includes net receivables resulting from the
participation in the Group tax filing system, due to Italian companies from the
Holding Company CIR S.p.A.. Outstanding receivables as at 31 December 2017 were
collected for a total of Euro 6,121 thousand in the first half of 2018. For further
details, please refer to note 39.
“Tax receivables” include tax credits due to Group companies by the tax authorities of various countries for direct and indirect taxation.
It does not include deferred tax assets which are treated separately.
"Other receivables" break down as in the following table:
(in thousands of Euro) June 30, 2018 December 31, 2017
Amounts due from social security institutions 170 127
Amounts due from employees 212 186
Advances to suppliers 3,948 2,940
Due from others 3,294 2,255
TOTAL 7,624 5,508
“Other assets” mainly consist of accrued income and prepayments on insurance
premiums and indirect taxes on buildings.
The increase in this item is seasonal and it is mainly due to the prepaid insurance
policies, the indirect taxes on buildings, and the IT maintenance fees paid in the first
few months of the year but relative to the year as a whole.

45
8. TANGIBLE FIXED ASSETS
The net carrying amount of tangible fixed assets as of 30 June 2018 amounted to
Euro 386,400 thousand versus Euro 384,477 thousand at the end of the previous year
and breaks down as follows:
(in thousands of Euro)
Land Buildings,
plant and
machinery,
commercial
and industrial
equipment
Other
assets
Assets under
construction
and payments
on account
Tooling Tooling
in corso
TOTALE
Balance at December 31, 2017
Historical cost 13,089 840,857 28,807 48,133 165,333 27,249 1,123,468
of which: leases - gross value - 15,008 78 - - - 15,086
Accumulated depreciation 51 630,767 23,223 1,049 83,901 - 738,991
of which: leases - accumulated
depreciation - 9,235 78 - - - 9,313
Net value 13,038 210,090 5,584 47,084 81,432 27,249 384,477
of which: leases - net value - 5,773 - - - - 5,773
Balance at December 31, 2017 13,038 210,090 5,584 47,084 81,432 27,249 384,477
Additions of the period - 5,512 400 21,587 2,909 14,671 45,079
Disposals during the period, net - (315) (6) - - - (321)
Exchange differences (44) (2,457) (463) (190) (747) (223) (4,124)
Depreciation for the period - (19,139) (1,222) - (17,100) - (37,461)Writedowns/revaluations during
the period - (1,436) (62) - (420) (81) (1,999)
Reclassification of non-current
assets held for sale - 1,076 - - - - 1,076Other changes (44) 13,472 2,149 (16,477) 3,090 (2,518) (328)
Balance at June 30, 2018 12,950 206,804 6,380 52,004 69,164 39,098 386,400
Historical cost 13,038 845,569 32,340 53,053 169,977 39,182 1,153,159
of which: leases - gross value - 15,357 80 - - - 15,437
Accumulated depreciation 88 638,766 25,960 1,049 100,813 84 766,760
of which: leases - accumulated
depreciation - 10,176 80 - - - 10,256
Net value 12,950 206,804 6,380 52,004 69,164 39,098 386,400
of which: leases - net value - 5,181 - - - - 5,181
Investments during the period amounted to Euro 45,079 thousand and mainly refer to
“Assets under construction and payments on account" and "Tooling under
construction".
In the category "Assets under construction and payments on account" the main
investments concerned in particular the subsidiary Filter Systems Maroc S.a.r.l. for
the new Moroccan establishment relating to the Filtration business unit, the
subsidiary Sogefi (Suzhou) Auto Parts Co, Ltd for the new Chinese plant relating to
the Suspension business unit and for the development of new products, the French
companies Sogefi Filtration S.A. and Sogefi Suspensions S.A. for extraordinary
maintenance and the increase in production capacity, Sogefi Suspension Brasil Ltda
for the development of new products, S.C. Sogefi Air & Cooling S.r.l. for the
increase in production capacity and Sogefi USA Inc. for the development of new
products and the improvement of production processes.
In the category “Tooling under construction” the main investments concerned in
particular the subsidiaries Sogefi Air & Cooling S.A.S., Sogefi Engine Systems

46
Mexico S. de R.L. de C.V., Sogefi (Suzhou) Auto Parts Co., Ltd and Sogefi-MNR
Engine Systems India Pvt Ltd..
During the first half year 2018, no relevant disposals were made.
“Depreciation for the period” has been recorded in the appropriate item in the Income
Statement.
“Writedowns/revaluations during the period” totalled Euro 1,999 thousand and
mainly relates to the subsidiaries Sogefi Filtration d.o.o. and Sogefi Suspensions
S.A..
“Other changes” refer mainly to the completion of projects that were under way at the
end of the previous year and their reclassification under the pertinent items.
Guarantees
As of 30 June 2018, tangible fixed assets are encumbered by mortgages or liens
totalling Euro 1,285 thousand to guarantee loans from financial institutions,
compared to Euro 1,828 thousand as of 31 December 2017. Existing guarantees refer
to subsidiary Sogefi Air & Cooling Canada Corp..
Purchase commitments
As at 30 June 2018, there are binding commitments to buy tangible fixed assets for
the amount of Euro 2,056 thousand (Euro 785 thousand as at 31 December 2017).
Said commitments will be settled for the most part within 12 months.
Leases
The carrying value of fixed assets under financial leases as of 30 June 2017 was Euro
15,437 thousand, and the related accumulated depreciation amounted to Euro 10,256
thousand.
The financial aspects of the lease payments and their due dates are explained in note
15.

47
9. INTANGIBLE ASSETS
At 30 June 2018 intangible assets amount to Euro 288,154 thousand against Euro
290,481 thousand at the end of the previous year and break down as follows:
(in thousands of Euro)
Develop-
ment
costs
Industrial
patents and
intellectual
property
rights,
concessions
licences and
trademarks
Other,
assets under
constructi-
on and
payments on
account
Customer
Relationship
Trade name
Systemes
Moteurs
Goodwill TOTAL
Balance at December 31, 2017
Historical cost 253,656 68,782 25,435 19,215 8,437 149,537 525,062Accumulated amortization 161,992 35,108 5,440 6,352 2,791 22,898 234,581
Net value 91,664 33,674 19,995 12,863 5,646 126,639 290,481
Balance at December 31, 2017 91,664 33,674 19,995 12,863 5,646 126,639 290,481
Additions of the period 10,061 312 7,578 - - - 17,951
Disposals during the period, net - - - - - - -
Exchange differences (104) 1 (74) - - - (177)
Amortization for the period (15,621) (1,972) (245) (495) (217) - (18,550)
Writedowns / revaluations during
the period (1,501) - (50) - - - (1,551)
Other changes 6,262 3,298 (9,560) - - - -
Balance at June 30, 2018 90,761 35,313 17,644 12,368 5,429 126,639 288,154
Historical cost 266,465 72,272 23,215 19,215 8,437 149,541 539,145
Accumulated amortization 175,704 36,959 5,571 6,847 3,008 22,902 250,991
Net value 90,761 35,313 17,644 12,368 5,429 126,639 288,154
Investments in the half year amounted to Euro 17,951 thousand.
The increases in “Development costs” refer to the capitalisation of costs incurred by
Group companies to develop new products in collaboration with leading motor
vehicle manufacturers. The most significant investments refer to the subsidiaries
Sogefi (Suzhou) Auto Parts Co., Ltd, Sogefi Filtration S.A., Sogefi Engine Systems
Mexico S. de R.L. de C.V. and Sogefi Air & Cooling Canada Corp..
Increases in “Industrial patents and intellectual property rights, concessions, licences
and trademarks” refer mainly to the development and implementation of the new
information system across the Sogefi Group. This integrated information system is
amortised on a ten-year basis, based on its estimated useful life, starting from the date
of implementation in each subsidiary.
Increases in “Other, assets under construction and payments on account” refer mainly
to a large number of investments in the development and implementation of the new
information system across the Sogefi Group. Among these, the most significant were
recognised for the subsidiaries Filter Systems Maroc S.a.r.l., Sogefi Filtration d.o.o.,
Sogefi Air & Cooling S.A.S. and Sogefi Suspensions S.A..
“Writedowns/revaluations during the period” totalled Euro 1,551 thousand and
relates to no longer recoverable research and development projects, mainly of the
subsidiary Sogefi Filtration d.o.o..
There are no intangible assets with an indefinite useful life except for goodwill.

48
The specific goodwill of the CGU “filtration” amounts to Euro 77,030 thousand; the
goodwill of CGU “Air and Cooling” amounts to Euro 32,560 thousand; and the
goodwill of C.G.U. “Car Suspension” amounts to Euro 17,049 thousand.
10. INVESTMENTS IN JOINT VENTURES
As at 30 June 2018, this item amounts to zero.
11. OTHER FINANCIAL ASSETS
As at 30 June 2018, this item amounts to Euro 46 thousand, unchanged compared to
the previous fiscal year.
12. FINANCIAL RECEIVABLES AND OTHER NON-CURRENT RECEIVABLES
Financial receivables total Euro 2,626 thousand (Euro 2,215 thousand as of 31
December 2017) and refer to the fair value of Cross Currency Swap (CCS) hedging
contracts. For further details, please refer to note 46.
“Other receivables” break down as follows:
(in thousands of Euro) June 30, 2018 December 31, 2017
Indemnification asset 9,735 9,735Other receivables 28,921 27,647
TOTAL 38,656 37,382
“Other receivables” include an indemnification asset of Euro 9,735 thousand owed by
the seller of Sogefi Air & Cooling S.A.S.’s shares. – booked upon the PPA of the
Systemes Moteurs Group – relating to the recovery of expenses charged by
customers following claims on the quality of products sold, based on warranties
given by the same seller.
Please refer to note 2 for further details, “Consolidation principles and accounting
policies”.
The item “Other receivables” also includes tax credits relating to the research and
development activities of the French subsidiaries, other tax credits and non-interest
bearing guarantee deposits for leased properties. These receivables will be collected
over the coming years.
13. DEFERRED TAX ASSETS
As at 30 June 2018, this item amounts to Euro 44,191 thousand compared to Euro
45,646 thousand as of 31 December 2017.
This amount mainly relates to the expected benefits on deductible temporary
differences, booked to the extent that it is likely to be recovered.
This item also includes deferred tax assets for tax losses of Euro 5,302 thousand
(Euro 6,568 thousand as at 31 December 2017).
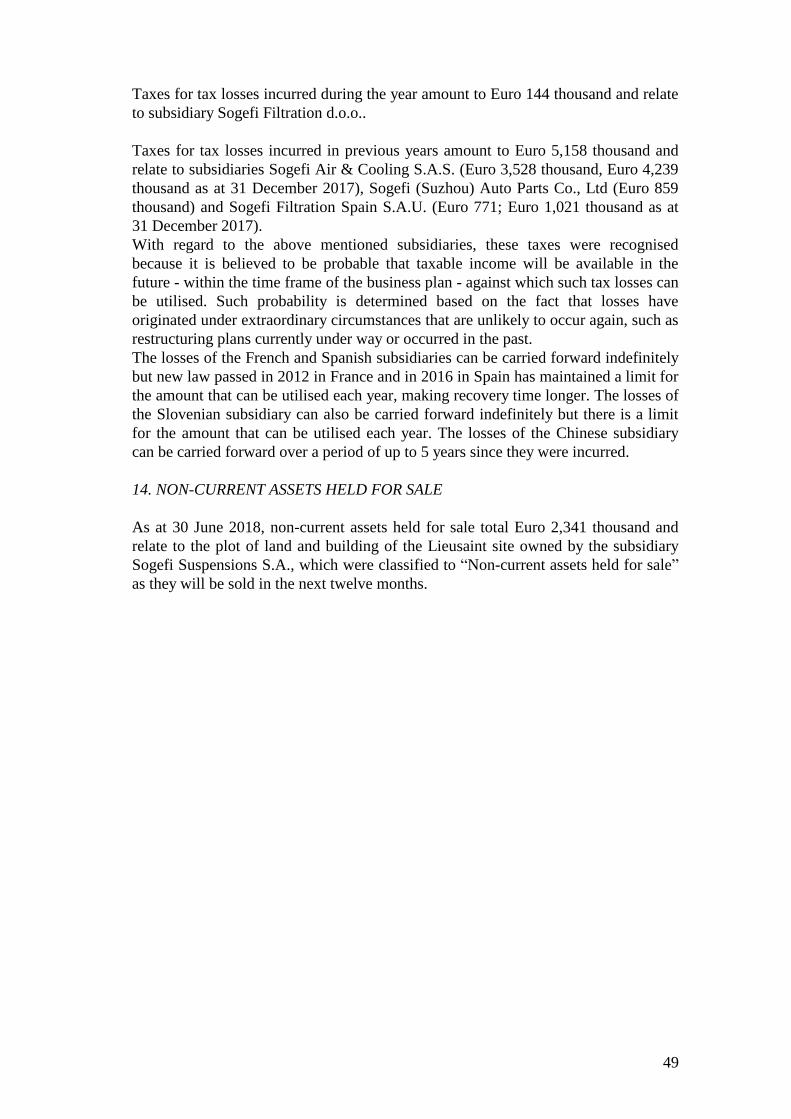
49
Taxes for tax losses incurred during the year amount to Euro 144 thousand and relate
to subsidiary Sogefi Filtration d.o.o..
Taxes for tax losses incurred in previous years amount to Euro 5,158 thousand and
relate to subsidiaries Sogefi Air & Cooling S.A.S. (Euro 3,528 thousand, Euro 4,239
thousand as at 31 December 2017), Sogefi (Suzhou) Auto Parts Co., Ltd (Euro 859
thousand) and Sogefi Filtration Spain S.A.U. (Euro 771; Euro 1,021 thousand as at
31 December 2017).
With regard to the above mentioned subsidiaries, these taxes were recognised
because it is believed to be probable that taxable income will be available in the
future - within the time frame of the business plan - against which such tax losses can
be utilised. Such probability is determined based on the fact that losses have
originated under extraordinary circumstances that are unlikely to occur again, such as
restructuring plans currently under way or occurred in the past.
The losses of the French and Spanish subsidiaries can be carried forward indefinitely
but new law passed in 2012 in France and in 2016 in Spain has maintained a limit for
the amount that can be utilised each year, making recovery time longer. The losses of
the Slovenian subsidiary can also be carried forward indefinitely but there is a limit
for the amount that can be utilised each year. The losses of the Chinese subsidiary
can be carried forward over a period of up to 5 years since they were incurred.
14. NON-CURRENT ASSETS HELD FOR SALE
As at 30 June 2018, non-current assets held for sale total Euro 2,341 thousand and
relate to the plot of land and building of the Lieusaint site owned by the subsidiary
Sogefi Suspensions S.A., which were classified to “Non-current assets held for sale”
as they will be sold in the next twelve months.

50
C 2) LIABILITIES AND EQUITY
15. FINANCIAL DEBTS TO BANKS AND OTHER FINANCING CREDITORS
These break down as follows:
Current portion
(in thousands of Euro) June 30, 2018 December 31, 2017
Bank overdrafts and short-term loans 2,060 14,170
Current portion of medium/long-term financial debts 76,035 66,584
of which: leases 1,744 1,679
Total loans maturing within one year 76,035 66,584
TOTAL SHORT-TERM FINANCIAL DEBTS 78,095 80,754
Other short-term liabilities for derivative financial
instruments 228 2,678
TOTAL SHORT-TERM FINANCIAL DEBTS AND
DERIVATIVE FINANCIAL INSTRUMENTS 78,323 83,432
Non-current portion
(in thousands of Euro) June 30, 2018 December 31, 2017
Financial debts to banks 113,783 101,993
Other medium/long-term financial debts 176,164 186,224
of which: leases 5,679 6,408
TOTAL MEDIUM/LONG-TERM FINANCIAL
DEBTS 289,947 288,217
Other medium/long-term liabilities for derivative
financial instruments - -
TOTAL MEDIUM/LONG-TERM FINANCIAL
DEBTS AND DERIVATIVE FINANCIAL
INSTRUMENTS 289,947 288,217
Bank overdrafts and short-term loans
For further details, please refer to the Analysis of the Net Financial Position included
in note 21 and to the Consolidated Cash Flow Statement included in the financial
statements.

51
Current and non-current portions of medium/long-term financial debts
Details are as follows (in thousands of Euro):
Balance at 30 June 2018:
Company Bank/Credit Institute Signing date Due date Original
amount loan
Interest rate Current
portion
Non-current
portion
Total amount Real
Guaran-
tees
Sogefi S.p.A. ING Bank July - 2015 Sept - 2022 55,000
Euribor 3m +
165 bps 10,000 39,896 49,896 N/A
Sogefi S.p.A. BNP Paribas S.A. Sept - 2014 Nov - 2019 35,000
Euribor 3m +
153 bps - 34,984 34,984 N/A
Sogefi S.p.A. Mediobanca S.p.A Jun- 2017 Jun- 2020 20,000
Euribor 3m +
110 bps 0 19,981 19,981 N/A
Sogefi S.p.A. Banco do Brasil S.A. May - 2018 Sept - 2020 20,000 0.98% fixed 8,372 11,608 19,980 N/A
Sogefi S.p.A. Banco do Brasil S.A. Sept - 2015 Sept - 2018 19,000
Euribor 3m +
130 bps 3,793 0 3,793 N/A
Sogefi S.p.A. Banca Carige Italia S.p.A Nov - 2015 Jun - 2019 10,000
Euribor 6m +
130 bps 2,883 0 2,883 N/A
Sogefi (Suzhou) Auto
Parts Co., Ltd Unicredit S.p.A. Nov - 2017 Nov - 2018 7,715
107% PBOC
6m 7,715 - 7,715 N/A
Sogefi (Suzhou) Auto
Parts Co., Ltd Intesa SanPaolo S.p.A. Jan- 2018 May - 2019 5,071
107% PBOC
6m 5,071 - 5,071 N/A
S.C. Sogefi Air&Cool
Srl ING Bank Jan - 2018 May - 2020 4,718
ROBOR 3m
+ 1.75% 1,897 1,897 3,795 N/A
Sogefi Air & Cooling
Canada Corp. Ge Capital Sept - 2015 Sept - 2019 3,886 4.207% fixed 1,023 262 1,285 SI
Sogefi Filtration S.A. Société Générale Apr - 2017 Oct - 2019 5,000
Euribor 3m +
75 bps 2,500 1,257 3,757 N/A
Sogefi Suspensions
S.A. Société Générale Apr - 2017 Oct - 2019 5,000
Euribor 3m +
75 bps 2,500 1,257 3,757 N/A
Sogefi Air&Cooling
S.A.S. Société Générale May - 2017 Nov - 2019 5,000
Euribor 3m +
75 bps 1,247 2,510 3,757 N/A
Sogefi Filtration S.A. BNP Paribas S.A. Apr - 2018 Jan - 2020 5,000
Euribor 3m +
60 bps 5,000 0 5,000 N/A
Sogefi Filtration do
Brasil Ltda Banco Itau Jan - 2018 Jan - 2019 1,117 3.84% fixed 1,117 - 1,117 N/A
Sogefi Filtration do
Brasil Ltda Banco Itau Apr - 2018 Apr - 2019 1,114 4.05% fixed 1,114 - 1,114 N/A
Other financial debts 21,803 130 21,933
TOTALE 76,035 113,783 189,818
Line “Other loan” includes other minor loans, as well as financial lease payments in
accordance with IAS 17.

52
Balance at 31 December 2017:
Company Bank/Credit Institute Signing date Due date Original
amount loan
Interest rate Current
portion
Non-current
portion
Total amount Real
Guaran-
tees
Sogefi S.p.A. BNP Paribas S.A. Sept - 2014 Nov - 2019 35,000
Euribor 3m +
153 bps - 34,993 34,993 N/A
Sogefi S.p.A. ING Bank July - 2015 Sept - 2022 55,000
Euribor 3m +
165 bps 10,000 34,876 44,876 N/A
Sogefi S.p.A. Mediobanca S.p.A Jun- 2017 Jun- 2020 20,000
Euribor 3m +
110 bps - 19,976 19,976 N/A
Sogefi S.p.A. Banco do Brasil S.A. Sept - 2015 Sept - 2018 19,000
Euribor 3m +
130 bps 7,580 - 7,580 N/A
Sogefi S.p.A. Banca Carige S.p.A Nov - 2015 Jun - 2019 10,000
Euribor 6m +
130 bps 2,885 1,425 4,310 N/A
Sogefi Filtration S.A. Société Générale Apr - 2017 Oct - 2019 5,000
Euribor 3m +
75 bps 2,490 2,510 5,000 N/A
Sogefi Suspensions
S.A. Société Générale Apr - 2017 Oct - 2019 5,000
Euribor 3m +
75 bps 2,491 2,509 5,000 N/A
Sogefi Air&Cooling
S.A.S. Société Générale May - 2017 Nov - 2019 5,000
Euribor 3m +
75 bps 2,491 2,509 5,000 N/A
Sogefi (Suzhou) Auto
Parts Co., Ltd Intesa SanPaolo S.p.A. Aug - 2017 May - 2018 5,941
106.4%
PBOC 6m 5,941 - 5,941 N/A
Sogefi (Suzhou) Auto
Parts Co., Ltd Unicredit S.p.A. Nov - 2017 Nov - 2018 6,347
107% PBOC
6m 6,347 - 6,347 N/A
Sogefi (Suzhou) Auto
Parts Co., Ltd Commerz bank July - 2017 Jan - 2018 705
106% PBOC
6m 705 - 705 N/A
Sogefi Air & Cooling
Canada Corp. Ge Capital Sept - 2015 Sept - 2019 3,990 4.207% fixed 1,028 800 1,828 SI
Sogefi Filtration do
Brasil Ltda Banco do Brasil Aug - 2017 Aug - 2018 1,166 3.84% fixed 1,166 - 1,166 N/A
Sogefi Filtration do
Brasil Ltda Banco Itau Nov - 2017 May - 2018 600 5% fixed 600 - 600 N/A
Sogefi Filtration do
Brasil Ltda Banco do Brasil Apr - 2017 Apr - 2018 1,458 4.05% fixed 1,458 - 1,458 N/A
S.C. Sogefi Air &
Cooling S.r.l ING Bank May - 2016 May - 2020 4,602
ROBOR 3m +
1.75% 1,416 2,124 3,540 N/A
Other financial debts 19,986 272 20,257
TOTALE 66,584 101,993 168,577
Other short-term liabilities for derivative financial instruments
The item includes the short-term portion of the fair value of exchange risk hedging
contracts and interest risk hedging contracts.
Please refer to chapter G for a further discussion of this matter.

53
Other medium/long-term financial debts
Details are as follows:
Company Bank/Credit Institute Signing
date
Due date Original
amount
loan
Interest rate Total
amount at
June 30,
2018
Real
guarantee
s
Sogefi S.p.A. Private placement May - 2013 May - 2023 USD 115,000
Fixed coupon
600 bps 56,151 N/A
Sogefi S.p.A. Private placement May - 2013 May - 2020 Euro 25,000
Fixed coupon
505 bps 24,974 N/A
Sogefi S.p.A. Equity linked bond May - 2014 May - 2021 Euro 100,000
Fixed coupon
2% year 87,593 N/AOther financial
debts 7,446
TOTAL 176,164
Please note that an amount of Euro 14,092 thousand relating to the bond issue of
original USD 115,000 thousand was classified under “Current portion of
medium/long-term financial debts” because redemption will occur by 30 June 2019.
The line “Other medium/long-term financial debts” includes other minor loans.
As at 31 December 2017, details are as follows:
Company Bank/Credit Institute Signing
date
Due date Original
amount
loan
Interest rate Total
amount at
December
31, 2017
Real
guarantees
Sogefi S.p.A. Private placement May - 2013 May - 2023 USD 115,000
Fixed coupon
600 bps 68.253 N/A
Sogefi S.p.A. Private placement May - 2013 May - 2020 Euro 25,000
Fixed coupon
505 bps 24.967 N/A
Sogefi S.p.A. Equity linked bond May - 2014 May - 2021 Euro 100,000
Fixed coupon
2% year 85.678 N/AOther financial
debts 7.326
TOTAL 186.224
In May 2018, the Holding Company Sogefi S.p.A. took out a loan with Banco do
Brasil S.A. in amortised instalments, with a final instalment falling due in September
2020, for a total amount of Euro 20 million at a fixed rate of 98 basis points; the loan
had been fully drawn down at 30 June 2018.
Also in May 2018, the Holding Company Sogefi S.p.A. took out a revolving loan
with Intesa Sanpaolo S.p.A. for a total amount of Euro 50 million with a duration of
five years. This loan accrues floating rate interest linked to Euribor plus a spread of
155 basis points. At 30 June 2018 Sogefi S.p.A. has not drawn any money on this
loan.
With reference to the bond loan originally for Usd 115 million expiring in May 2023,
as per the relative contract the Holding Company Sogefi S.p.A. paid the second
instalment in May, for a total sum of Usd 16.4 million.
The existing loans are not secured by the Holding Company Sogefi S.p.A.’s assets.
Furthermore, note that, contractually, the spreads relating to the loans of the Holding
Company Sogefi S.p.A. are reviewed every six months on the basis of the
computation of the consolidated NFP/normalised consolidated EBITDA ratio. For an
analysis of the covenants relating to loans outstanding at the end of the period, please
refer to the note 21 below entitled “Analysis of the financial position”.

54
Other medium/long-term financial liabilities for derivative financial instruments
Please refer to chapter G for a further discussion of this matter.
Finance leases
The Group has finance leases as well as rental and hire contracts for building, plant
and machinery that, according to their type, cover almost the entire useful life of the
asset concerned. The assets held under these leases, rental and hire contracts are
booked in accordance with IAS 17 as though they were fixed assets owned by the
company, disclosing their historical cost, depreciation, financial cost and residual
liability.
Future payments deriving from these contracts can be summarised as follows:
(in thousands of Euro) Instalments Capital
Within 12 months 2,058 1,744
Between 1 and 5 years 6,239 5,679
Beyond 5 years - -
Total lease payments 8,297 7,423
Interests (874) -
TOTAL PRESENT VALUE OF LEASE PAYMENTS 7,423 7,423
16. TRADE AND OTHER CURRENT PAYABLES
The amounts shown in the financial statements can be broken down into the
following categories:
(in thousands of Euro) June 30, 2018 December 31, 2017
Trade and other payables 388,798 373,181
Tax payables 11,570 7,817
TOTAL 400,368 380,998
Details of trade and other payables are as follows:
(in thousands of Euro) June 30, 2018 December 31, 2017
Due to suppliers 299,370 283,805
Due to Parent company 1,780 4,611
Due to tax authorities for indirect and other taxes 9,287 9,287
Due to social and security institutions 18,807 20,354
Due to employees 32,764 31,871
Fair value put option 16,423 14,997
Other payables 10,367 8,256
TOTAL 388,798 373,181
Amounts “Due to suppliers ” are not interest-bearing and are settled on average in 73
days (67 days at 31 December 2017).
The amounts “Due to suppliers” increased by Euro 15,565 thousand (by Euro 19,733
thousand at constant exchange rates); this is mainly due to business growth in the
second quarter of 2018 compared to the last quarter of 2017 and to the increase in
average payment time.

55
Amounts “Due to the Holding company” refer to the debt amounting to Euro 320
thousand due to the Holding Company CIR S.p.A. for services rendered in the first
half of 2018 (Euro 250 thousand in the first half of 2017); Euro 959 thousand reflect
the consideration due for the fiscal surplus transferred by companies that have joined
the CIR Group tax filing system; the amount of Euro 501 thousand reflects the tax
liabilities in connection with the CIR Group tax filing system.
The increase in amounts “Due to employees” is highly seasonal and is due mainly to
provisions for vacation accrued and not yet utilised and the Italian 13th month
salaries that will be paid to employees in the coming months.
Item “Fair value put option” reflects the fair value of the liability generated when the
non-controlling shareholders of subsidiary Sogefi M.N.R. exercised their put option.
Engine Systems India Pvt Ltd, on 30% of its share capital. The fair value of the
liability represents a reasonable estimate of the option exercise price, and was
determined using the method that involves discounted cash flows method, based on
the cash flows of the 2018 budget and the plan for 2019-2022 of the affected
subsidiary, also taking into account the information resulting from the ongoing
purchase process.
The increase, in the amount of Euro 1,426 thousand, was booked to “Financial
expenses (income), net”.
The increase in "Income tax payables" is mainly due to the taxes accrued in the first
half of 2018.
17. OTHER CURRENT LIABILITIES
“Other current liabilities” mainly includes liabilities recognised for the adoption of
IFRS15. These liabilities represent the amounts received from customers for the sale
of “tooling” and “prototypes” that will be recognised in the income statement over
the life of the product.
This item also includes adjustments to costs and revenues for the period so as to
ensure compliance with the accruals based principle (accrued expenses and deferred
income) and advances received from customers for orders still to be delivered.
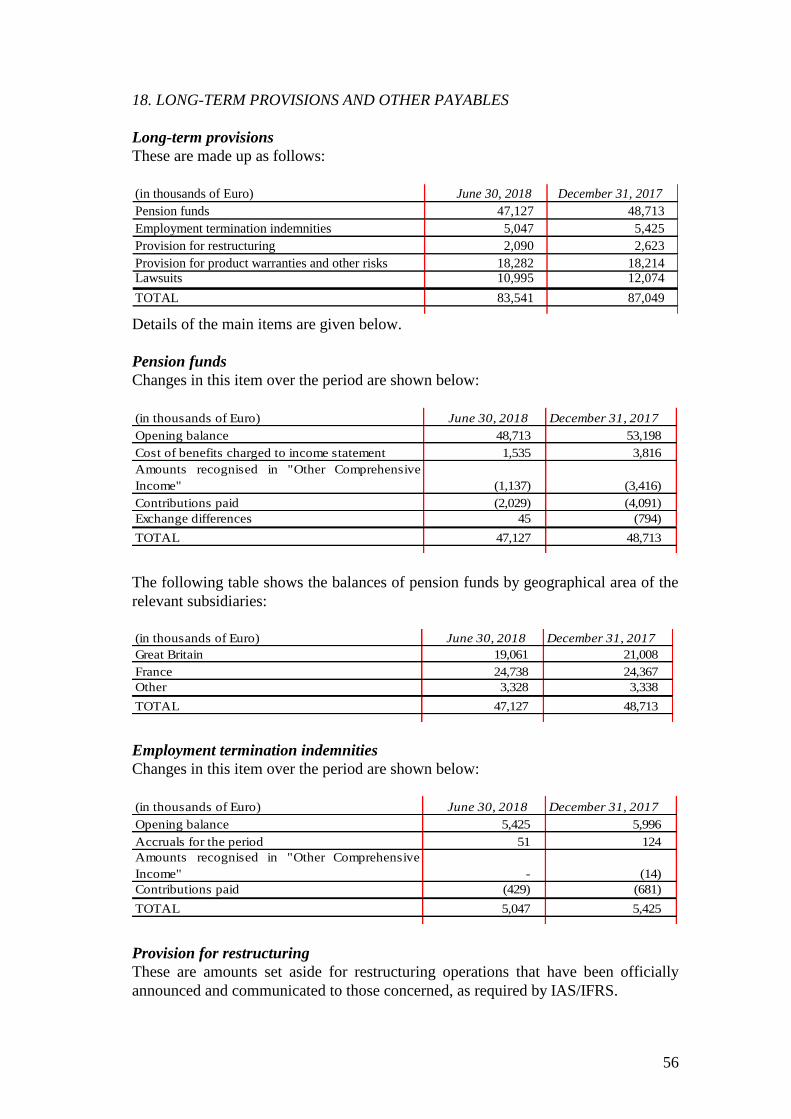
56
18. LONG-TERM PROVISIONS AND OTHER PAYABLES
Long-term provisions
These are made up as follows:
(in thousands of Euro) June 30, 2018 December 31, 2017
Pension funds 47,127 48,713
Employment termination indemnities 5,047 5,425
Provision for restructuring 2,090 2,623
Provision for product warranties and other risks 18,282 18,214Lawsuits 10,995 12,074
TOTAL 83,541 87,049
Details of the main items are given below.
Pension funds
Changes in this item over the period are shown below:
(in thousands of Euro) June 30, 2018 December 31, 2017
Opening balance 48,713 53,198
Cost of benefits charged to income statement 1,535 3,816
Amounts recognised in "Other Comprehensive
Income" (1,137) (3,416)
Contributions paid (2,029) (4,091)
Exchange differences 45 (794)
TOTAL 47,127 48,713
The following table shows the balances of pension funds by geographical area of the
relevant subsidiaries:
(in thousands of Euro) June 30, 2018 December 31, 2017
Great Britain 19,061 21,008
France 24,738 24,367
Other 3,328 3,338
TOTAL 47,127 48,713
Employment termination indemnities
Changes in this item over the period are shown below:
(in thousands of Euro) June 30, 2018 December 31, 2017
Opening balance 5,425 5,996
Accruals for the period 51 124
Amounts recognised in "Other Comprehensive
Income" - (14)
Contributions paid (429) (681)
TOTAL 5,047 5,425
Provision for restructuring
These are amounts set aside for restructuring operations that have been officially
announced and communicated to those concerned, as required by IAS/IFRS.
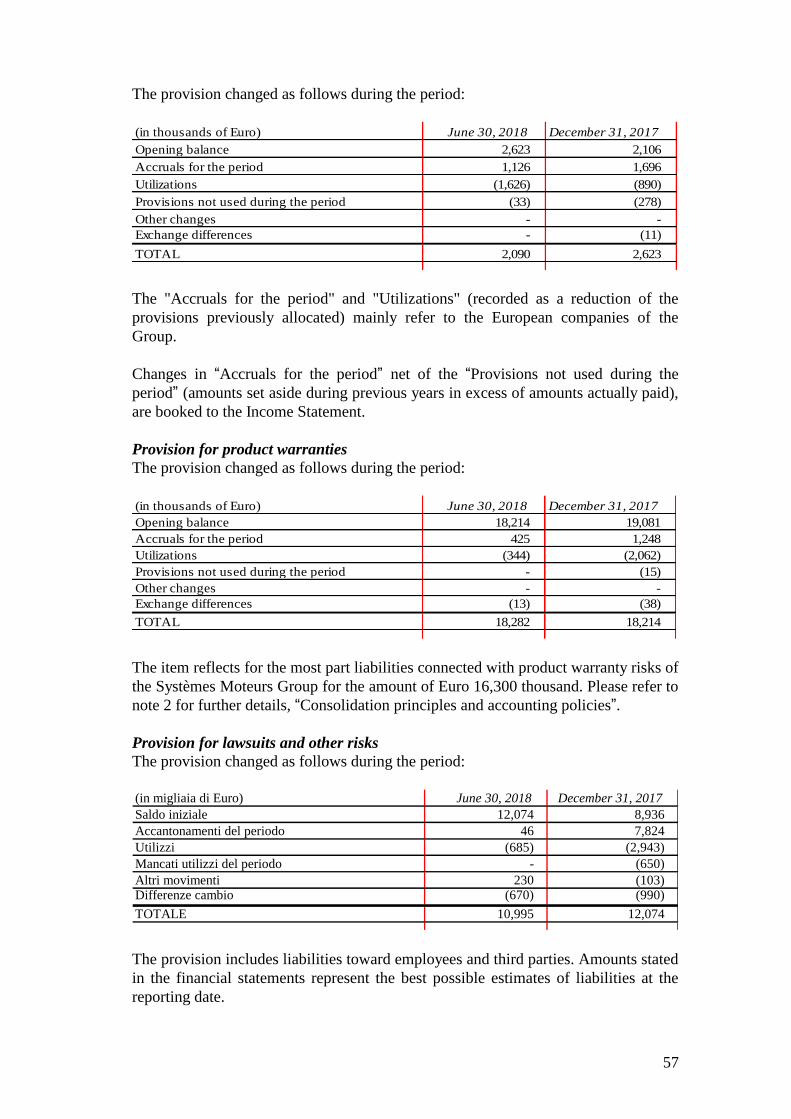
57
The provision changed as follows during the period:
(in thousands of Euro) June 30, 2018 December 31, 2017
Opening balance 2,623 2,106
Accruals for the period 1,126 1,696
Utilizations (1,626) (890)
Provisions not used during the period (33) (278)
Other changes - -
Exchange differences - (11)
TOTAL 2,090 2,623
The "Accruals for the period" and "Utilizations" (recorded as a reduction of the
provisions previously allocated) mainly refer to the European companies of the
Group.
Changes in “Accruals for the period” net of the “Provisions not used during the
period” (amounts set aside during previous years in excess of amounts actually paid),
are booked to the Income Statement.
Provision for product warranties
The provision changed as follows during the period:
(in thousands of Euro) June 30, 2018 December 31, 2017
Opening balance 18,214 19,081
Accruals for the period 425 1,248
Utilizations (344) (2,062)
Provisions not used during the period - (15)
Other changes - -
Exchange differences (13) (38)
TOTAL 18,282 18,214
The item reflects for the most part liabilities connected with product warranty risks of
the Systèmes Moteurs Group for the amount of Euro 16,300 thousand. Please refer to
note 2 for further details, “Consolidation principles and accounting policies”.
Provision for lawsuits and other risks
The provision changed as follows during the period:
(in migliaia di Euro) June 30, 2018 December 31, 2017
Saldo iniziale 12,074 8,936
Accantonamenti del periodo 46 7,824
Utilizzi (685) (2,943)
Mancati utilizzi del periodo - (650)
Altri movimenti 230 (103)Differenze cambio (670) (990)
TOTALE 10,995 12,074
The provision includes liabilities toward employees and third parties. Amounts stated
in the financial statements represent the best possible estimates of liabilities at the
reporting date.

58
Other payables
The item "Other payables" mainly includes the non-current portion of liabilities
recorded in connection with the adoption of IFRS 15. These liabilities represent the
amounts received from customers for the sale of “tooling” and “prototypes” that will
be recognised in the income statement over the life of the product.
19. DEFERRED TAX LIABILITIES
As of 30 June 2018, this item amounts to Euro 44,616 thousand compared to Euro
40,640 thousand as of 31 December 2017.
This amount relates to the expected taxation on taxable temporary differences.
20. SHARE CAPITAL AND RESERVES
Share capital
The share capital of the Holding Company Sogefi S.p.A. is fully paid in and amounts
to Euro 62,461 thousand as of 30 June 2018 (Euro 62,394 thousand as of 31
December 2017), split into 120,117,992 ordinary shares with a par value of Euro 0.52
each.
As at 30 June 2018, the Company has 2,620,111 treasury shares (2,698,195 as at 31
December 2017) in its portfolio, corresponding to 2.18% of share capital (2.25% as
at 31 December 2017), at an average price of Euro 2.28 each.
Reserves and retained earnings (accumulated losses)
These are made up as follows:

59
(in thousands of Euro) Share
capital
Legal
reserve
Share
premium
reserve
Reserve for
treasury
shares
Treasury
shares
Stock-
based
incentive
plans
reverve
Translation
reserve
Cash flow
hedging
reserve
Actuarial
gain (loss)
reserve
Tax on items
booked in Other
Comprehensive
Income
Other
reserves
Retained
earnings
Net result
for the
period
Total
Balance at December 31, 2016 62,065 12,640 16,159 6,572 (6,572) 2,992 (30,594) (9,555) (42,338) 15,200 12,201 113,158 9,336 161,264
Paid share capital increase 228 - 673 - - - - - - - - - - 901
Allocation of 2016 net profit: - - - - - - -
Legal reserve - - - - - - - - - - - - - -
Dividends - - - - - - - - - - - - - -
Retained earnings - - - - - - - - - - - 9,336 (9,336) -
Credit to equity for stock-based
incentive plans - - - - - - - - - - - - - -
Fair value measurement of
embedded derivative (conversion
option) - - - - - 265 - - - - - - - 265
Other changes - - 262 (262) 262 (292) - - - - - (21) - (51)
Fair value measurement of
cash flow hedging instruments:
share booked to equity - - - - - - - 1,604 - - - - - 1,604
Fair value measurement of
cash flow hedging instruments:
share booked to income statement - - - - - - - 842 - - - - - 842
Actuarial gain (loss) - - - - - - - - 2,844 - - - - 2,844
Tax on items booked in - - - (1,070) - - -
Other Comprehensive Income - - - - - - (10,661) - - - - - - (1,070)
Currency translation differences - - - - - - - - - - - - - (10,661)
Net result for the period - - - - - - - - - - - - 19,352 19,352
Balance at June 30, 2017 62,293 12,640 17,094 6,310 (6,310) 2,965 (41,255) (7,109) (39,494) 14,130 12,201 122,473 19,352 175,290
Balance at December 31, 2017 62,394 12,640 17,542 6,161 (6,161) 2,528 (49,273) (5,301) (38,908) 13,313 12,201 123,683 26,600 177,419
Paid share capital increase 67 - 186 - - - - - - - - - - 253
Allocation of 2017 net profit: - - - - - - - -
Legal reserve - - - - - - - - - - - - - -
Dividends - - - - - - - - - - - - - -
Retained earnings - - - - - - - - - - - 26,600 (26,600) -
Credit to equity for stock-based
incentive plans - - - - - 358 - - - - - - - 358
Other changes - - 178 (178) 178 (172) - - - - - (41) - (35)
Fair value measurement of -
cash flow hedging instruments:
share booked to equity - - - - - - - 275 - - - - - 275
Fair value measurement of
cash flow hedging instruments:
share booked to income statement - - - - - - - 1,383 - - - - - 1,383
Actuarial gain (loss) - - - - - - - - 1,137 - - - - 1,137
Tax on items booked in
Other Comprehensive Income - - - - - - - - - (591) - - - (591)
Currency translation differences - - - - - - (6,494) - - - - - - (6,494)
Net result for the period - - - - - - - - - - - - 17,045 17,045
Balance at June 30, 2018 62,461 12,640 17,906 5,983 (5,983) 2,714 (55,767) (3,643) (37,771) 12,722 12,201 150,242 17,045 190,750
60
Share premium reserve
It amounts to Euro 17,906 thousand compared to Euro 17,542 thousand in the
previous year.
The increase by Euro 186 thousand accounts for share subscriptions under stock
option plans.
In the first half year 2018, the Holding Company Sogefi S.p.A. credited Euro 178
thousand to the Share premium reserve after the free grant of 78,084 treasury shares
to Stock Grant beneficiaries.
Treasury shares
Item “Treasury shares” reflects the purchase price of treasury shares. Movements
during the year amount to Euro 178 thousand and reflect the free grant of 78,084
treasury shares as reported in the note to “Stock-based incentive plans reserve”.
Translation reserve
This reserve is used to record the exchange differences arising from the translation of
foreign subsidiaries' financial statements.
Changes during the period show a decrease of Euro 6,494 thousand mainly due to the
South American subsidiaries.
Reserve for actuarial gains/losses
This reserve reflects the net impact of the application of the amendment to IAS 19
“Employee Benefits” on other actuarial gains (losses) as at 1 January 2012. The item
also includes actuarial gains and losses accrued after 1 January 2012 and recognised
under Other Comprehensive Income.
Cash flow hedging reserve
This reserve has changed as a result of accounting for the cash flows deriving from
instruments that for IAS 39 purposes are designated as “cash flow hedging
instruments”. Changes during the period show an increase of Euro 1,658 thousand
which breaks down as follows:
- increase of Euro 239 thousand as a consequence of the change after 31
December 2017 in the fair value of the effective hedging contracts;
- increase of Euro 1,419 thousand reflecting the portion of the negative reserve
relating to contracts no longer in hedge accounting that will be recognised to
the Income Statement over the same period of time as the differentials
relating to the underlying hedged item.
Stock-based incentive plans reserve
The reserve refers to credit to equity for stock-based incentive plans, assigned to
Directors, employees and co-workers, resolved after 7 November 2002, including the
portion relating to the stock grant plan approved in 2018.
In 2018, further to Stock Grant Plan beneficiaries exercising their rights and due to
the corresponding free grant of 78,084 treasury shares, the amount of Euro 172
thousand, corresponding to the fair value at right (Unit) allocation date, was
reclassified from “Stock- based incentive plans reserve” to “Share premium reserve”
(increased of Euro 178 thousand) and “Retained earnings reserve” (decreased of Euro
6 thousand).
While the increase by Euro 358 thousand refers to the cost of accruing plans.

61
Other reserves
This item amounts to Euro 12,201 thousand (unchanged compared to 31 December
2017).
Retained earnings
These totalled Euro 150,242 thousand and include amounts of profit that have not
been distributed.
The decrease of Euro 41 thousand refers to the following events:
- the interest held by subsidiary Sogefi Suspensions S.A. in Allevard IAI
Suspensions Pvt Ltd from 75.67% to 74.23% through a share capital increase
(Euro 104 thousand, resolved and paid out) only subscribed by non-
controlling interests that led to an amount of Euro 35 thousand being
reclassified between non-controlling interests' and Group's shareholders'
equity;
- reclassification from the above mentioned "Stock-based incentive plans
reserve" as outlined above for a total of Euro 6 thousand.
Tax on items booked in Other Comprehensive Income
The table below shows the amount of income taxes relating to each item of Other
Comprehensive Income:
(in thousands of Euro)
Gross
AmountTax effect
Net
Amount
Gross
AmountTax effect
Net
Amount
- Profit (loss) booked to cash
flow hedge reserve 1,658 (398) 1,260 2,446 (587) 1,859
- Actuarial profit (loss) 1,137 (193) 944 2,844 (483) 2,361
- Profit (loss) booked to translation reserve (6,491) - (6,491) (10,825) - (10,825)
(3,696) (591) (4,287) (5,535) (1,070) (6,605)
1st half 2018 1st half 2017
Total Other Comprehenive Income, net of tax
effect
NON-CONTROLLING INTERESTS
The balance amounts to Euro 19,912 thousand and refers to the portion of
shareholders' equity attributable to non-controlling interests.
The reserve increased by Euro 35 thousand during the first half of 2018 (booked to
“Other changes” in the “Consolidated Statement of Changes in Equity”) referred to the
above mentioned change in the interest held in subsidiary Allevard IAI Suspensions
Pvt Ltd.

62
Details of non-controlling interests are given below:
(in thousands of Euro)
Subsidiary's name RegionJune 30,
2018
Decembe
r 31,
2017
June 30,
2017
June 30,
2018
June 30,
2017
June 30,
2018
Decembe
r 31,
2017
S.ARA Composite S.A.S. France 4.02% 4.21% 4.57% (16) (38) 309 325
Iberica de Suspensiones S.L. Spain 50.00% 50.00% 50.00% 2,073 2,274 16,477 14,403
Shanghai Allevard Spring Co., Ltd China 39.42% 39.42% 39.42% 36 (55) 2,399 2,336
Allevard IAI Supensions Pvt Ltd India 25.33% 25.33% 25.77% (43) (70) 660 588
Sogefi-MNR Engine Systems India Pvt India 30.00% 30.00% 30.00% - - - -
Sogefi Filtration Italy S.p.A Italy 0.12% 0.12% 0.12% - 3 35 41
Sogefi Suspensions Passenger Car Italy Italy 0.12% 0.12% 0.12% - 1 19 19
Sogefi Suspensions Heavy Duty Italy Srl Italy 0.12% 0.12% 0.12% 5 2 13 12
TOTAL 2,055 2,117 19,912 17,724
% owned by third parties
Loss (profit)
attributable to non-
controlling interests
Shareholders' equity
attributable to non-
controlling interests
Specifically, 50% owned company Iberica de Suspensiones S.L. is treated as a
subsidiary because the Group controls the majority of votes of the Board of
Directors, which is the corporate body tasked with deciding on the entity's relevant
activities.

63
21. ANALYSIS OF THE NET FINANCIAL POSITION
The following table provides details of the net financial position as required by
Consob in its communication no. DEM/6064293 of 28 July 2006 with a
reconciliation of the net financial position shown in the report on operations:
(in thousands of Euro) June 30, 2018 December 31, 2017
A. Cash 104,357 103,889
B. Other cash at bank and on hand (held-to-maturity
investments) - -
C. Financial instruments held for trading - -
D. Liquid funds (A) + (B) + (C) 104,357 103,889
E. Current financial receivables 1,712 1,510
F. Current payables to banks (2,060) (14,170)
G. Current portion of non-current indebtedness (76,035) (66,584)
H. Other current financial debts (228) (2,678)
I. Current financial indebtedness (F) + (G) + (H) (78,322) (83,432)
J. Current financial indebtedness, net (I) + (E) + (D) 27,746 21,967
K. Non-current payables to banks (113,783) (101,993)
L. Bonds issued (168,718) (178,898)
M. Other non-current financial debts (7,446) (7,326)
O. Non-current financial indebtedness (K) + (L) + (M) (289,947) (288,217)
P. Net indebtedness (J) + (O) (262,201) (266,250)
Non-current financial receivables 2,626 2,215
Financial indebtedness, net including non-current
financial receivables (as per the "Net financial position"
included in the Report on operations) (259,575) (264,035)
Details of the covenants applying to loans outstanding at the end of the first half year
2018 are as follows (see note 15 for further details on loans):
- loan of Euro 20,000 thousand from Mediobanca S.p.A.: the ratio of consolidated
net financial position to consolidated normalised EBITDA has to be less or equal to
3.5; the ratio of consolidated normalised EBITDA to consolidated net financial
expenses must not be less than 4;
- loan of Euro 50,000 thousand from Unicredit S.p.A.: the ratio of consolidated net
financial position to consolidated normalised EBITDA has to be less or equal to 3.5;
the ratio of consolidated normalised EBITDA to consolidated net financial expenses
must not be less than 4;
- loan of Euro 70,000 thousand from BNP Paribas S.A.: the ratio of consolidated net
financial position to consolidated normalised EBITDA has to be less than or equal to
3.5; the ratio of consolidated normalised EBITDA to consolidated net financial
expenses must not be less than 4;
- loan of Euro 55,000 thousand from Ing Bank N.V.: the ratio of consolidated net
financial position to consolidated normalised EBITDA has to be less or equal to 3.5;
the ratio of consolidated normalised EBITDA to consolidated net financial expenses
must not be less than 4;
- loan of Euro 50,000 thousand from Intesa Sanpaolo S.p.A.: the ratio of consolidated
net financial position to consolidated normalised EBITDA has to be less or equal to
3.5; the ratio of consolidated normalised EBITDA to consolidated net financial
expenses must not be less than 4;
64
- bond issue of USD 115,000 thousand: the ratio of consolidated net financial
position to consolidated normalised EBITDA has to be less than or equal to 3.5; the
ratio of consolidated normalised EBITDA to consolidated net financial expenses
must not be less than 4;
- bond issue of Euro 25,000 thousand: the ratio of consolidated net financial position
to consolidated normalised EBITDA has to be less than or equal to 3.5; the ratio of
consolidated normalised EBITDA to consolidated net financial expenses must not be
less than 4.
As at 30 June 2018, these covenants were complied with.

65
D) NOTES ON THE MAIN INCOME STATEMENT ITEMS: INCOME STATEMENT
22. SALES REVENUES
Revenues from sales and services
In the first half of 2018 Sogefi reported revenues of Euro 839.1 million, up by 3.2%
at constant exchange rates and down by 2.1% at historical exchange rates, compared
to the same period of 2017.
Revenues from the sale of goods and services break down as follows:
By business sector:
(in thousands of Euro)
Amount % Amount %
Suspensions 314,694 37.5 308,740 36.0
Filtration 277,171 33.0 288,615 33.7
Air&Cooling 248,881 29.7 262,337 30.6
Intercompany eliminations (1,602) (0.2) (2,191) (0.3)
TOTAL 839,144 100.0 857,501 100.0
1st half 2018 1st half 2017
Suspensions recorded a 7.1% growth at constant exchange rates (1.9% at current
exchange rates due to the devaluation mainly of South American currencies).
Filtration reported a 2.7% increase at constant exchange rates (-4.0% at current
exchange rates due to the devaluation mainly of South American currencies). Finally,
Air and Cooling reported a 1.2% decrease (-5.1% at current exchange rates, affected
both by the drop in car production and by the trend of the Canadian dollar).
By geographic area:
(in thousands of Euro)
Amount % Amount %
Europe 532,251 63.4 529,919 61.8
North America 145,012 17.3 156,506 18.3
South America 85,865 10.2 99,997 11.7
Asia 82,366 9.8 79,818 9.3
Intercompany eliminations (6,350) (0.7) (8,739) (1.1)
TOTAL 839,144 100.0 857,501 100.0
1st half 2018 1st half 2017
The business grew slightly in Europe and North America compared to the previous
year (+0.7% and +1.6%, respectively, at constant exchange rates) and significantly
increased in Asia and South America (+10.2% and +13.5, respectively, at constant
exchange rates), recording higher growth than the market
23. SEASONAL NATURE OF SALES
The type of products sold by the company and the sectors in which the Group
operates mean that revenues record a reasonably linear trend over the course of the
year and are not subject to particular cyclical phenomena when considered on a like-
for-like basis.

66
Sales by half-year period for the past two years are shown below:
(in thousands of Euro) 1st half 2nd half Total year
FY 2016 798,556 775,535 1,574,091
FY 2017 857,501 790,298 1,647,799
24. VARIABLE COST OF SALES
Details are as follows:
(in thousands of Euro) 1st half 2018 1st half 2017
Materials 445,702 447,177
Direct labour cost 63,824 66,594
Energy costs 18,330 18,567
Sub-contracted work 24,812 23,544
Ancillary materials 10,761 10,853
Variable sales and distribution costs (*) 17,279 17,305
Royalties paid to third parties on sales 3,493 3,457
Other variable costs (364) (608)
TOTAL 583,837 586,889
The impact of “Variable cost of sales” on revenues stands at 69.6%, up from 68.4% in
the first six months of the previous year. The decrease in profitability is mainly due
to the negative impact of steel price increases in the Suspension business units.
“Other variable costs” represent the portion of direct labour cost and fixed cost
included in the increase in the inventory of finished goods and semi-finished
products.
25. MANUFACTURING AND R&D OVERHEADS
Details are as follows:
(in thousands of Euro) 1st half 2018 1st half 2017
Labour cost 58,922 57,480
Materials, maintenance and repairs 13,209 15,156
Rental and hire charges 5,149 5,372
Personnel services 4,336 4,321
Technical consulting 5,428 4,530
Sub-contracted work 1,173 1,293
Insurance 1,131 1,591
Utilities 734 652
Capitalization (15,194) (12,859)
Other 2,113 2,755
TOTAL 77,001 80,291
“Manufacturing and R&D overheads” show a decrease of Euro 3,290 thousand.
Decrease is Euro 503 thousand at constant exchange rates.
"Labour cost" reported an overall increase of Euro 1,442 thousand, of which Euro
283 thousand from an increase in the production function and Euro 1,159 thousand

67
for an increase in the research and development function of the subsidiaries Sogefi
Air & Cooling USA, Inc., Sogefi (Suzhou) Auto Parts Co., Ltd. Sogefi Filtration
S.A., Sogefi - MNR Filtration India for the strengthening of its workforce.
The decrease of Euro 1,947 thousand in the item "Repair and maintenance expenses
and materials" was affected for Euro 774 thousand by the exchange rate effect,
mainly due to the South American subsidiaries, and for the remainder it is mainly
related to the lower maintenance interventions in the European subsidiaries.
“Technical consulting” increased by Euro 898 thousand compared to the first half of
2017 as a consequence of a more extensive use of external consultants for improving
the quality and production performance mainly in the subsidiary Sogefi Suspensions
S.A..
Item “Capitalisations” increased by Euro 2,335 thousand as a result of the
capitalisation of research and development expenses.
Total costs for Research and Development (not reported in the table) amount to Euro
20,424 thousand compared to Euro 19,480 thousand as of 30 June 2017.
26. DEPRECIATION AND AMORTIZATION
Details are as follows:
(in thousands of Euro) 1st half 2018 1st half 2017
Depreciation of tangible fixed assets 37,466 36,821
of which: assets under finance leases 715 802
Amortization of intangible assets 18,547 19,529
TOTAL 56,013 56,350
Item “Depreciation and amortization” amounts to Euro 56,013 thousand compared to
Euro 56,350 thousand in the first half of 2017, with a negative variation of Euro 337
thousand (at constant exchange rates this item increased by Euro 1,764 thousand).
27. DISTRIBUTION AND SALES FIXED EXPENSES
The table below shows the main components of this item:
(in thousands of Euro) 1st half 2018 1st half 2017
Labour cost 14,423 14,998
Sub-contracted work 2,579 2,339
Advertising, publicity and promotion 1,591 2,361
Personnel services 990 1,216
Rental and hire charges 1,114 893
Consulting 305 554
Other 452 364
TOTAL 21,454 22,725
“Distribution and sales fixed expenses” decreased by Euro 1,271 thousand. At
constant exchange rates, this item would have decreased by Euro 100 thousand.

68
"Labour cost" reported an overall decrease of Euro 575 thousand, mainly due to the
French subsidiaries, as a result of a reduction in personnel and efficiency policies,
and to the South American subsidiaries due to the effect of exchange rates.
The heading "Advertising and promotions" decreased by Euro 770 thousand
following the cutting of these costs in the aftermarket segment of the Filtration
division.
28. ADMINISTRATIVE AND GENERAL EXPENSES
These can be broken down as follows:
(in thousands of Euro) 1st half 2018 1st half 2017
Labour cost 19,495 20,161
Personnel services 2,362 2,615
Maintenance and repairs 1,290 815
Cleaning and security 1,131 1,089
Consulting 5,310 4,829
Utilities 1,432 1,695
Rental and hire charges 1,822 1,925
Insurance 947 760
Administrative, financial, tax-related and other
services provided by Parent Company 380 308
Audit fees 829 903
Directors' and statutory auditors' remuneration 464 478
Sub-contracted work 256 577
Capitalization (92) (919)
Indirect taxes 3,672 4,333
Other fiscal charges 1,806 1,832
Other 4,020 3,427
TOTAL 45,124 44,828
In the first half of 2018, “Administrative and general expenses” increased by Euro
296 thousand compared to the previous year; the increase would have been Euro
2,131 thousand at constant exchange rates.
The decrease of Euro 666 thousand in "Labour cost" is mainly due to the effect of
exchange rates.
The increase in the item "Consulting" (Euro 481 thousand more than in the first half
of 2017) is mainly due to higher costs for personnel search and selection, and legal,
tax and administrative consulting services.
The decrease in the item "Capitalisations", equal to Euro 827 thousand, corresponds
to lower investments made by the Holding Company Sogefi S.p.A. on the SAP
system compared to the first half of 2017.
“Indirect taxes” include tax charges such as property tax, taxes on sales revenues
(taxe organic of the French companies), non-deductible VAT and taxes on
professional training.

69
“Other fiscal charges” consist of the cotisation économique territoriale (previously
called taxe professionnelle) relating to the French companies, which is calculated on
the value of fixed assets and on added value.
29. PERSONNEL COSTS
Personnel
Personnel costs can be broken down as follows:
(in thousands of Euro) 1st half 2018 1st half 2017
Wages, salaries and contributions 154,513 157,010
Pension costs: defined benefit plans 1,063 1,226
Pension costs: defined contribution plans 1,088 979
Participation des salaries 83 (7)
Imputed cost of stock option and stock grant plans 358 265
Other costs 78 104
TOTAL 157,183 159,584
With respect to the first half of the previous year, “Personnel costs” have decreased
by Euro 2,401 thousand (-1.5%). At constant exchange rates, this item would have
increased by Euro 4,873 thousand (+3.2%).
The impact of “Personnel costs” on sales revenues is 18.7%, basically in line with the
first half of 2017 (18.6%).
“Wages, salaries and contributions”, “Pension costs: defined benefit plans” and
“Pension costs: defined contribution plans” are posted in the tables provided above at
line “Labour cost”.
“Other costs” is included in “Administrative and general expenses”.
“Imputed cost of stock option and stock grant plans” is included in “Other non-
operating expenses (income)”. The following paragraph “Personnel benefits” provides
details of the stock option and stock grant plans.
The average number of employees broken down by category is as follows:
(Number of employees) 1st half 2018 1st half 2017
Managers 108 109
Clerical staff 1,922 1,866
Blue collar workers 4,934 4,822
TOTAL 6,964 6,797
Personnel benefits
Sogefi S.p.A. implements stock-based incentive plans for the employees of the
Company and of its subsidiaries that hold important positions of responsibility within
the Group. The purpose is to foster greater loyalty to the Group and to provide an
incentive that will raise their commitment to improving business performance and
generating value in the long term.

70
The stock-based incentive plans of Sogefi S.p.A. are first approved by the
Shareholders’ Meeting.
Except as outlined at the following paragraphs “Stock grant plans” and “Stock option
plans”, the Group has not carried out any other transaction that involves the purchase
of goods or services with payments based on shares or any other kind of instrument
representing portions of equity. As a result, it is not necessary to disclose the fair
value of such goods or services.
In addition to the plan issued in 2018, The Group has issued plans from 2008 to 2017
of which the main details are provided blow.
Stock grant plans
The stock grant plans provide for the free assignment of conditional rights (called
units) that cannot be transferred to third parties or other beneficiaries; each of them
entitles to the free assignment of one Sogefi S.p.A. share. There are two categories of
rights under these plans: Time-based Units, that vest upon the established terms and
Performance Units, that vest upon the established terms provided that shares have
achieved the target price value established in the regulation.
The regulation provides for a minimum holding period during which the shares held
for the plan can not be disposed of.
All shares assigned under these plans will be treasury shares held by Sogefi S.p.A.
According to the regulation, a pre-condition for assigning the shares is a continued
employer-employee relationship or the continued appointment as a director/executive
of the Company or one of its subsidiaries throughout the vesting period of the rights.
On 23 April 2018, the Board of Directors executed the 2018 stock grant plan
approved by the Shareholders’ Meeting on the same day to assign a maximum of
500,000 conditional rights, restricted to employees of the Company and its
subsidiaries, who were assigned a total of 415,000 Units (171,580 of which were
Time-based Units and 243,420 Performance Units).
Time-based Units will vest in tranches on a three-monthly basis, accounting for
12.5% of their respective total, starting on 23 July 2020 and ending on 23 April 2022.
Performance Units will vest at the same vesting dates established for Time-based
Units, provided that the increase in price value of Sogefi S.p.A. shares at each vesting
date is higher than the increase of the Sector Index (as defined in the Regulation) at
that date.
As at 30 June 2018 no Time Based Units or Performance Units expired as per
regulation.
The fair value of the rights assigned during 2018 has been determined by an external
consultant at the time the rights were assigned using the binomial option pricing
model (so-called Cox, Ross and Rubinstein model) for US options and amounts to
Euro 1,202 thousand overall.
Input data used for measuring the fair value of the 2018 stock grant plan are provided
below:
- curve of EUR/GBP/SEK/CHF-riskless interest rates as at 23 April 2018;
- prices of the underlying (equal to price of Sogefi S.p.A. share as at 23 April 2018,
and equal to Euro 3.310) and of the securities included in the benchmark basket,
again as at 23 April 2018;

71
- standard prices of Sogefi S.p.A. share and of the securities included in the
benchmark basket during the period starting on 22 March 2018 and ending on 22
April 2018 for the determination of the stock grant Performance Units limit;
- historical volatility rate of stock and exchange rates during 260 days, as at 23 April
2018;
- null dividend yield for stock grant valuation;
- historical series of the logarithmic returns of involved securities and EUR/GBP,
EUR/SEK and EUR/CHF exchange rates to calculate the correlation among
securities and among the three non-EUR denominated securities and associated
exchange rates (to adjust for estimated trends), calculated for the period starting on
23 April 2017 and ending on 23 April 2018.
The main characteristics of the stock grant plans approved during previous years and
still under way are outlined below:
• 2011 stock grant plan to assign a maximum of 1,250,000 conditional rights,
restricted to the Director who filled the post of Managing Director of the Holding
Company at the date of issue of the relevant plan and to employees of the Company
and its subsidiaries, who were assigned a total of 757,500 Units (320,400 of which
were Time-based Units and 437,100 Performance Units).
The Time-based Units were scheduled to vest in tranches on a three-monthly basis,
accounting for 12.5% of their respective total, starting on 20 April 2013 and ending
on 20 January 2015.
The Performance Units were scheduled to vest at the same vesting dates established
for Time-based Units, provided that the price value of shares at vesting date is at
least equal to the percentage of the initial value indicated in the regulation.
As at 30 June 2018 29,837 Time-based Units and 134,866 Performance Units expired
as per regulation. While 291,325 Time-based Units and 298,333 Performance Units
had been exercised.
• 2012 stock grant plan to assign a maximum of 1,600,000 conditional rights,
restricted to the Director who filled the post of Managing Director of the Holding
Company at the date of issue of the relevant plan and to employees of the Company
and its subsidiaries, who were assigned a total of 1,152,436 Units (480,011 of which
were Time-based Units and 672,425 Performance Units).
The Time-based Units were scheduled to vest in tranches on a three-monthly basis,
accounting for 12.5% of their respective total, starting on 20 April 2014 and ending
on 31 January 2016.
The Performance Units were scheduled to vest at the same vesting dates established
for Time-based Units, provided that the increase in price value of Sogefi S.p.A.
shares at each vesting date is higher than the increase of the Sector Index (as
provided for by the Regulation) on that date.
As at 30 June 2018 82,374 Time-based Units and 596,630 Performance Units expired
as per regulation. While 392,252 Time-based Units and 74,852 Performance Units
had been exercised.
• 2013 stock grant plan to assign a maximum of 1,700,000 conditional rights,
restricted to employees of the Company and its subsidiaries, who were assigned a
total of 1,041,358 Units (432,434 of which were Time-based Units and 608,924
Performance Units).

72
The Time-based Units were scheduled to vest in tranches on a three-monthly basis,
accounting for 12.5% of their respective total, starting on 20 April 2015 and ending
on 31 January 2017.
The Performance Units were scheduled to vest at the same vesting dates established
for Time-based Units, provided that the increase in price value of Sogefi S.p.A.
shares at each vesting date is higher than the increase of the Sector Index (as
provided for by the Regulation) on that date.
As at 30 June 2018 256,954 Time-based Units and 608,924 Performance Units
expired as per regulation. While 167,665 Time-based Units had been exercised.
• 2014 stock grant plan to assign a maximum of 750,000 conditional rights, restricted
to employees of the Company and its subsidiaries, who were assigned a total of
378,567 Units (159,371 of which were Time-based Units and 219,196 Performance
Units).
Time-based Units vest in tranches on a three-monthly basis, accounting for 12.5% of
their respective total, starting on 20 April 2016 and ending on 20 January 2018.
Performance Units vest at the same vesting dates established for Time-based Units,
provided that the increase in price value of Sogefi S.p.A. shares at each vesting date
is higher than the increase of the Sector Index (as provided for by the Regulation) at
that date.
As at 30 June 2018 109,543 Time-based Units and 219,196 Performance Units
expired as per regulation. While 46,922 Time-based Units had been exercised.
• 2015 stock grant plan to assign a maximum of 1,500,000 conditional rights,
restricted to employees of the Company and its subsidiaries, who were assigned a
total of 441,004 Units (190,335 of which were Time-based Units and 250,669
Performance Units).
Time-based Units vest in tranches on a three-monthly basis, accounting for 12.5% of
their respective total, starting on 20 October 2017 and ending on 20 July 2019.
Performance Units vest at the same vesting dates established for Time-based Units,
provided that the increase in price value of Sogefi S.p.A. shares at each vesting date
is higher than the increase of the Sector Index (as provided for by the Regulation) at
that date.
As at 30 June 2018 52,425 Time-based Units and 69,043 Performance Units expired
as per regulation. While 38,686 Time-based Units and 50,949 Performance Units had
been exercised.
• 2016 stock grant plan to assign a maximum of 750,000 conditional rights, restricted
to employees of the Company and its subsidiaries, who were assigned a total of
500,095 Units (217,036 of which were Time-based Units and 283,059 Performance
Units).
Time-based Units will vest in tranches on a three-monthly basis, accounting for
12.5% of their respective total, starting on 27 July 2018 and ending on 27 April 2020.
Performance Units will vest at the same vesting dates established for Time-based
Units, provided that the increase in price value of Sogefi S.p.A. shares at each vesting
date is higher than the increase of the Sector Index (as provided for by the
Regulation) at that date.
On 30 June 2018, 61,517 Time-based Units and 80,235 Performance Units expired as
per regulation.
• 2017 stock grant plan to assign a maximum of 750,000 conditional rights, restricted
to employees of the Company and its subsidiaries, who were assigned a total of
287,144 Units (117,295 of which were Time-based Units and 169,849 Performance
Units).

73
Time-based Units will vest in tranches on a three-monthly basis, accounting for
12.5% of their respective total, starting on 26 July 2019 and ending on 26 April 2021.
Performance Units will vest at the same vesting dates established for Time-based
Units, provided that the increase in price value of Sogefi S.p.A. shares at each vesting
date is higher than the increase of the Sector Index (as provided for by the
Regulation) at that date.
As at 30 June 2018, 9,355 Time-based Units and 14,146 Performance Units expired
as per regulation.
The imputed cost for the first half of 2018 for existing stock grant plans is Euro 358
thousand, and is booked to the Income Statement under “Other non-operating
expenses (income)”.
The following table shows the total number of existing rights with reference to the
2011-2018 plans:
June 30, 2018 December 31, 2017
Not exercised/not exercisable at the start of the
year 1,036,192 1,286,966
Granted during the period 415,000 287,144
Cancelled during the period (81,414) (357,662)
Exercised during the period (78,084) (180,256)
Not exercised/not exercisable at the end of the
period 1,291,694 1,036,192
Exercisable at the end of the period 59,840 53,490
The line “Not exercised/not exercisable at the end of the period” refers to the total
number of options, net of those exercised or cancelled during the current and
previous periods.
The line “Exercisable at the end of the period” refers to the total amount of options
matured at the end of the period and not yet subscribed.
Stock option plans
The stock option plans provide beneficiaries with the opportunity to exercise an
option to subscribe to newly-issued Sogefi shares at a set price and within a specific
period of time. According to the regulation, a pre-condition for exercising the option
is a continued employer-employee relationship with or the continued appointment as
a director/executive of the Company or one of its subsidiaries throughout the vesting
period.
The main characteristics of the stock option plans approved during previous years
and still under way are outlined below:
• 2008 stock option plan restricted to employees of the foreign subsidiaries for a
maximum of 875,000 shares (0.73% of the share capital as at 30 June 2018) with a
subscription price of Euro 2.1045, to be exercised between 30 September 2008 and
30 September 2018;
• 2009 stock option plan restricted to employees of the Company and its subsidiaries
for a maximum of 2,335,000 shares (1.94% of the share capital as of 30 June 2018)
with a subscription price of Euro 1.0371, to be exercised between 30 September 2009
and 30 September 2019;

74
• 2010 stock option plan restricted to the Director who filled the post of Managing
Director of the Holding Company at the date of issue of the relevant plan and to
employees of the Company and its subsidiaries for a maximum of 2,440,000 shares
(2.03% of the share capital as of 30 June 2018) with a subscription price of Euro
2.3012, to be exercised between 30 September 2010 and 30 September 2020.
Please note that the second portion of the 2009 extraordinary stock option plan
restricted to employees of the Company and its subsidiaries expired on 3 April 2018
as per relevant regulation.
The following table shows the total number of existing options with reference to the
2008-2010 plans and their average exercise price:
Number Averag
e price
of the
period
Number Averag
e price
of the
periodNot exercised/not exercisable at the start
of the year 285,000 1.91 2,254,737 2.77
Granted during the period - - - -
Cancelled during the period (40,000) 1.67 (1,338,200) 3.29
Exercised during the period (130,000) 1.95 (631,537) 2.06
Expired during the period - - - -
Not exercised/not exercisable at the end
of the period 115,000 1.96 285,000 1.91
Exercisable at the end of the period 115,000 1.96 285,000 1.91
June 30, 2018 December 31, 2017
The line “Not exercised/not exercisable at the end of the period” refers to the total
number of options, net of those exercised or cancelled during the current and
previous years.
The line “Exercisable at the end of the period” refers to the total amount of options
matured at the end of the period and not yet subscribed.
With reference to the options exercised during 2018, the average weighted price of
the Sogefi share at the exercise dates is Euro 3.6626.

75
Details of the number of options exercisable at 30 June 2018 are given below:
Total
Number of exercisable options remaining at December 31, 2017 285,000
Options matured during the period -
Options cancelled during the period (40,000)
Options exercised during the period (130,000)
Number of exercisable options remaining at June 30, 2018 115,000
30. RESTRUCTURING COSTS
The "Restructuring costs" amount to Euro 2,697 thousand (Euro 5,962 thousand in
the first half year of the previous year).
This item is comprised of costs incurred and paid during the half-year in the amount
of Euro 1,604 thousand, and of allocations to “Provision for restructuring” net of the
provisions not used during the period in the amount of Euro 1,093 thousand.
31. LOSSES (GAINS) ON DISPOSAL
Net gains on disposal amounted to Euro 58 thousand compared to Euro 168 thousand
in the first six months of the previous year.
32. EXCHANGE (GAINS) LOSSES
Net exchange losses as of 30 June 2018 amount to Euro 2,908 thousand (Euro 646
thousand net exchange gains as of the first half year 2017) and mainly refer to the
South American subsidiaries and the Mexican subsidiary.
33. OTHER NON-OPERATING EXPENSES (INCOME)
These amount to Euro 5,729 thousand (Euro 10,793 thousand in the first six months
of the previous year).
The following table shows the main elements:
(in thousands of Euro) 1st half 2018 1st half 2017
Write-downs of tangible and intangible fixed assets 3,550 8,491
Product warranty costs 1,049 984
Imputed cost of stock options and stock grant 358 265
Litigations 756 542
Actuarial losses (gains) 48 44
Other ordinary expenses (revenue) (32) 467
TOTAL OTHER NON-OPERATING EXPENSES
(INCOME) 5,729 10,793
The item "Writedowns of tangible and intangible fixed assets", amounting to Euro
3,550 thousand, includes Euro 1.999 thousand for writedowns of tangible fixed assets
mainly for European subsidiaries, Euro 1,551 thousand for writedowns of intangible
fixed assets mainly related to research and development projects capitalised in
previous years for which the capitalisation requirements no longer exist.

76
The item “Product warranty costs” refers for the most part to subsidiaries Sogefi Air
& Cooling S.A.S. and Sogefi U.S.A. Inc.
34. FINANCIAL EXPENSES (INCOME), NET
Financial expenses are detailed as follows:
(in thousands of Euro) 1st half 2018 1st half 2017
Interest on bonds 6,004 6,532
Interest on amounts due to banks 1,706 2,235
Financial charges under lease contracts 182 236
Financial component of pension funds and
termination indemnities 509 552
Loss on interest-bearing hedging instruments 2,160 2,564
Fair value put option adjustment 1,426 -
Other interest and commissions 2,470 2,867
TOTAL FINANCIAL EXPENSES 14,457 14,986
Financial income is detailed as follows:
(in thousands of Euro) 1st half 2018 1st half 2017
Financial income from Cross currency swap in cash
flow hedge - 577
Financial income from Cross currency swap not in
cash flow hedge 303 -
Net financial income from derivatives no more in
hedge accounting 474 1,145
Interest on amounts due from banks 144 146
Other interest and commissions 28 312
TOTAL FINANCIAL INCOME 949 2,180
TOTAL FINANCIAL EXPENSES (INCOME), NET 13,508 12,806
Net financial expenses show an increase of Euro 702 thousand, mainly due to the
item "Adjustment of fair value of put options" (this item reflects the change in the
fair value of the liability generated when the non-controlling shareholders of
subsidiary Sogefi M.N.R. Engine Systems India Pvt Ltd exercised their put option on
30% of its share capital) and lower income from the change in fair value of derivative
contracts no longer designated in hedge accounting. Interest on bonds and on
amounts due to banks decreased.
The item "Costs of interest-rate hedges" includes the differential between fixed rate
and floating rate in the first half of 2018 in respect of all interest rate swap contracts
in force in the period.
It should be noted that as at 30 June 2018, the impact of the change in fair value of
IRS and Cross currency swap contracts no longer designated in hedge accounting is
positive by an amount of Euro 474 thousand (positive by Euro 1,145 thousand as at
30 June 2017), and is comprised of:
- a financial expense of Euro 1,419 thousand reflecting the portion of the reserve
previously booked to Other Comprehensive Income that will be reclassified to
Income Statement over the same period of time expected for the differentials
relating to the former underlying hedged item;
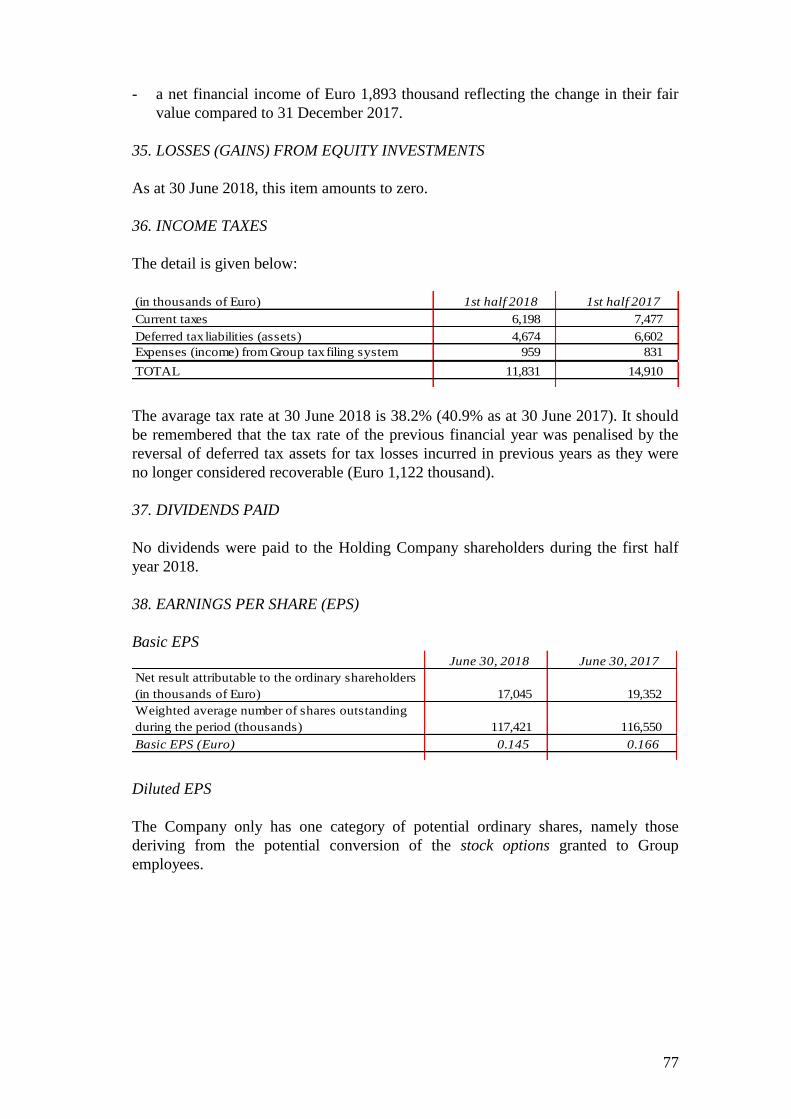
77
- a net financial income of Euro 1,893 thousand reflecting the change in their fair
value compared to 31 December 2017.
35. LOSSES (GAINS) FROM EQUITY INVESTMENTS
As at 30 June 2018, this item amounts to zero.
36. INCOME TAXES
The detail is given below:
(in thousands of Euro) 1st half 2018 1st half 2017
Current taxes 6,198 7,477
Deferred tax liabilities (assets) 4,674 6,602
Expenses (income) from Group tax filing system 959 831
TOTAL 11,831 14,910
The avarage tax rate at 30 June 2018 is 38.2% (40.9% as at 30 June 2017). It should
be remembered that the tax rate of the previous financial year was penalised by the
reversal of deferred tax assets for tax losses incurred in previous years as they were
no longer considered recoverable (Euro 1,122 thousand).
37. DIVIDENDS PAID
No dividends were paid to the Holding Company shareholders during the first half
year 2018.
38. EARNINGS PER SHARE (EPS)
Basic EPS
June 30, 2018 June 30, 2017
Net result attributable to the ordinary shareholders
(in thousands of Euro) 17,045 19,352
Weighted average number of shares outstanding
during the period (thousands) 117,421 116,550
Basic EPS (Euro) 0.145 0.166
Diluted EPS
The Company only has one category of potential ordinary shares, namely those
deriving from the potential conversion of the stock options granted to Group
employees.

78
June 30, 2018 June 30, 2017
Net result attributable to the ordinary shareholders (in
thousands of Euro) 17,045 19,352
Average number of shares outstanding during the
period (thousands) 117,421 116,550
Weighted average number of shares potentially under
option during the period (thousands) 142 1,754
Number of shares that could have been issued at fair
value (thousands) (81) (1,045)
Adjusted weighted average number of shares
outstanding during the period (thousands) 117,482 117,259
Diluted EPS (Euro) 0.145 0.165
The “Weighted average number of shares potentially under option during the period”
represents the average number of shares that are potentially outstanding under stock
option plans (only for potentially dilutive options, i.e. with an exercise price lower
than the average fair value of the ordinary shares of Sogefi S.p.A. in the first half of
the year), for which the subscription right has vested but has not yet been exercised at
the end of the reporting period. These shares have a potentially dilutive effect on
Basic EPS and are therefore taken into consideration in the calculation of Diluted
EPS.
The “Number of shares that could have been issued at fair value” represents the
normalisation factor, being the number of shares that would have been issued
dividing the proceeds that would have been received from subscription of the stock
options by the average half-year fair value of the Sogefi S.p.A. ordinary shares,
which in the first half of 2018 amounted to Euro 3.3735, compared to Euro 3.6327 in
the first half of 2017.

79
E) 39. RELATED PARTY TRANSACTIONS
See IAS 24 and the related communications from Consob for the definition of related
party transactions.
The Group is controlled by the Holding Company CIR S.p.A. (which in turn is
controlled by the ultimate Holding Company F.lli De Benedetti S.p.A.), which as of
30 June 2018 held 55.33% of the total shares (56.56% of outstanding shares,
excluding treasury shares). Sogefi S.p.A.’s shares are listed on the STAR segment of
Mercato Telematico Azionario managed by Borsa Italiana S.p.A.
The Group’s consolidated financial statements include the financial statements of the
consolidated companies, listed in chapter H along with the stake held in the same by
the Group.
Dealings between Group companies are conducted at arm’s length, taking into
account the quality and type of services rendered.
The Holding Company Sogefi S.p.A., because of its role of Holding company,
provides administrative, financial and management services directly to the three
French sub-holding operative companies (Sogefi Filtration S.A., Sogefi
Suspensions S.A. and Sogefi Air & Cooling S.A.S.) which, in turn, beside
dealing with the services provided by the Holding Company to the companies
operating in the relevant business units, provide directly to the latter support
services as well as operating and business services. The Holding Company also
debits and credits interest at a market spread to those subsidiaries that have
joined the Group's cash pooling system. The Holding Company is also charging
royalties fees on the Group “SAP” information system to those subsidiaries at which
implementation has been completed.
The subsidiary Sogefi Gestion S.A.S. carries out centralised functions and
charges Group companies for administrative, financial, legal, industrial and IT
services as well as royalties for the use of Group-wide IT applications.
As part of its activity, the Holding Company Sogefi S.p.A. makes use of the services
provided by CIR S.p.A., its Holding Company, in areas such as strategic
development and of an administrative, financial, fiscal and corporate nature. This
relationship is regulated by contracts at arm's-length conditions and the cost is
commensurate to the effective value of such services to the Sogefi Group in terms of
the resources devoted to them and the specific economic advantages obtained as a
result. It should be noted that Sogefi's interest in the provision of services by the
Holding company is considered to be preferable to services provided by third parties
because of, among other things, its extensive knowledge acquired over time in its
specific business and market environment.
Services provided to Sogefi S.p.A. by the Holding Company CIR S.p.A. as at 30 June
2018 amount to Euro 320 thousand (Euro 250 thousand in the first half of 2017). At
30 June 2018, amounts payable to the Holding Company CIR S.p.A. by the Holding
Company Sogefi S.p.A. totalled Euro 320 thousand.

80
The Holding Company Sogefi S.p.A. is party to an existing rental contract with the
Holding company CIR S.p.A., effective from 1 July 2018, concerning the offices
located in Milan, via Ciovassino 1/A where Sogefi has its registered offices, that will
also correspond to the registered office.
The Italian companies of the Sogefi Group had receivables for the amount of Euro
3,267 thousand owed by CIR S.p.A. in connection with their participation in the
group tax filing system, and payables for the amount of Euro 959 thousand.
Outstanding receivables as at 31 December 2017 were collected for a total of Euro
6,121 thousand in the first half of 2018.
At the end of the first half of 2018, the Italian subsidiaries recorded an income of
Euro 259 thousand following the transfer of fiscal surplus to companies that have
joined the CIR Group tax filing system in order to have an interest deduction; the
amount receivable as at 30 June 2018 of the Italian subsidiaries from the Holding
Company CIR S.p.A. is equal to Euro 259 thousand.
At 30 June 2018, the Holding Company Sogefi S.p.A. records a liability
amounting to Euro 959 thousand (Euro 831 thousand in the previous year)
reflecting the consideration due for the fiscal surplus transferred by companies
that have joined the CIR Group tax filing system. The amount payable by Holding
Company Sogefi S.p.A. to Holding Company CIR S.p.A. for such consideration as at
30 June 2018 is Euro 959 thousand.
As regards economic transactions with the Board of Directors, Statutory Auditors,
the Chief Executive Officer and the Managers with strategic responsibility, please
refer to the attached table for remuneration paid in the first half of 2018.
Apart from those mentioned above and shown in the tables below, at the date of these
interim financial statements, we are not aware of any other related party transactions.
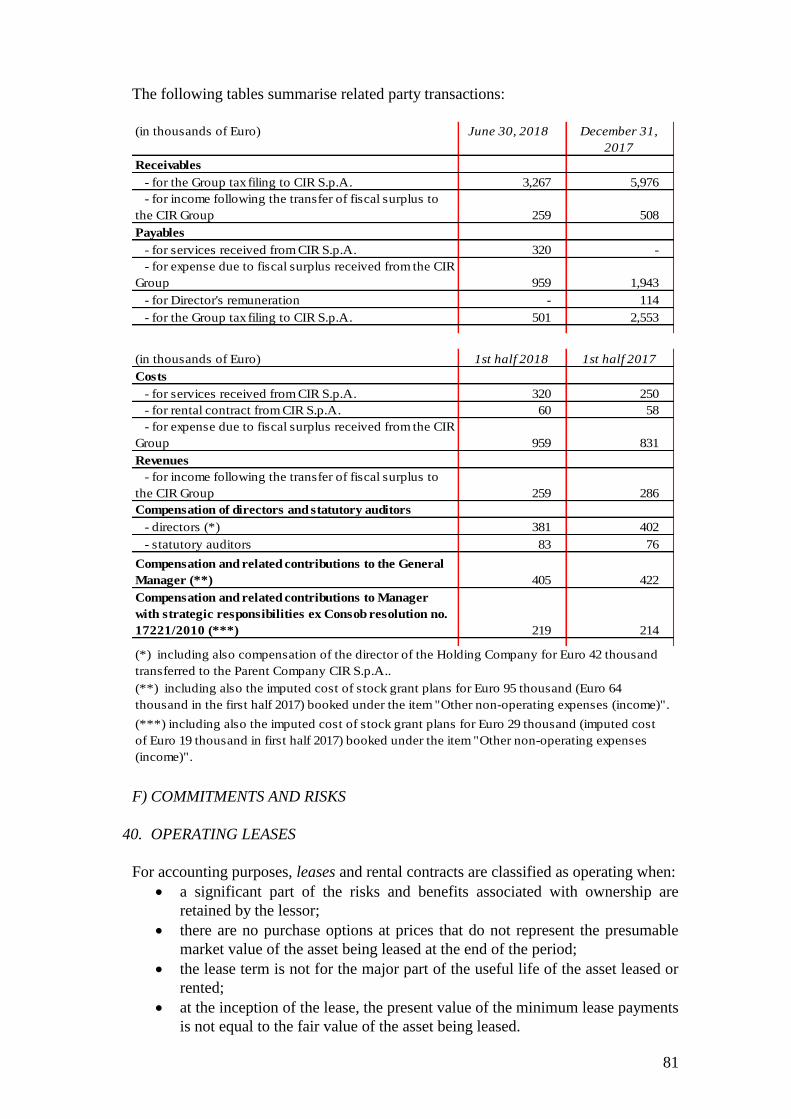
81
The following tables summarise related party transactions:
(in thousands of Euro) June 30, 2018 December 31,
2017
Receivables
- for the Group tax filing to CIR S.p.A. 3,267 5,976
- for income following the transfer of fiscal surplus to
the CIR Group 259 508
Payables
- for services received from CIR S.p.A. 320 -
- for expense due to fiscal surplus received from the CIR
Group 959 1,943
- for Director's remuneration - 114
- for the Group tax filing to CIR S.p.A. 501 2,553
(in thousands of Euro) 1st half 2018 1st half 2017
Costs
- for services received from CIR S.p.A. 320 250
- for rental contract from CIR S.p.A. 60 58
- for expense due to fiscal surplus received from the CIR
Group 959 831
Revenues
- for income following the transfer of fiscal surplus to
the CIR Group 259 286
Compensation of directors and statutory auditors
- directors (*) 381 402
- statutory auditors 83 76
Compensation and related contributions to the General
Manager (**) 405 422
Compensation and related contributions to Manager
with strategic responsibilities ex Consob resolution no.
17221/2010 (***) 219 214
(*) including also compensation of the director of the Holding Company for Euro 42 thousand
transferred to the Parent Company CIR S.p.A..
(**) including also the imputed cost of stock grant plans for Euro 95 thousand (Euro 64
thousand in the first half 2017) booked under the item "Other non-operating expenses (income)".
(***) including also the imputed cost of stock grant plans for Euro 29 thousand (imputed cost
of Euro 19 thousand in first half 2017) booked under the item "Other non-operating expenses
(income)".
F) COMMITMENTS AND RISKS
40. OPERATING LEASES
For accounting purposes, leases and rental contracts are classified as operating when:
a significant part of the risks and benefits associated with ownership are
retained by the lessor;
there are no purchase options at prices that do not represent the presumable
market value of the asset being leased at the end of the period;
the lease term is not for the major part of the useful life of the asset leased or
rented;
at the inception of the lease, the present value of the minimum lease payments
is not equal to the fair value of the asset being leased.

82
Operating lease instalment payments are booked to the Income Statement in line with
the underlying contracts.
The main operating leases existing as of 30 June 2018 regard the following
companies:
- Sogefi Filtration do Brasil Ltda for the rental of three production plant in Jarinu,
under a contract that will expire in August 2034.
As at 30 June 2018, remaining payments amount to Euro 21,379 thousand, Euro
1,379 thousand of which due by the end of the year. For this contract, the
company signed a bank guarantee of Euro 1,668 thousand.
- Sogefi (Suzhou) Auto Parts Co., Ltd. for the rental of the production plant in
Wujiang, under a contract that will expire in September 2033.
As at 30 June 2018, total remaining payments amount to Euro 12,599 thousand,
Euro 707 thousand of which due by the end of the year. The Group has not given
any guarantees whatsoever for this contract;
- Sogefi Filtration S.A. for the rental of the offices in Guyancourt. The two
contracts will expire in March 2020 and May 2027, respectively. As at 30 June
2017, the remaining payments amount to Euro 4,591 thousand, Euro 515
thousand of which due by the end of the year.
The Group has not given any guarantees for this contract;
- Sogefi Air & Cooling Canada Corp. for the rental of the production plant in
Montreal. The contract expires in December 2021. As at 30 June 2018, the
remaining payments amount to Euro 2,869 thousand, Euro 1,051 thousand of
which due by the end of the year.
For this contract Sogefi S.p.A. provided a guarantee equal to approximately
100% of the residual instalments still to fall due;
- Sogefi Engine Systems Mexico S. de R.L. de C.V. for the rental of the production
plant in Monterrey. The contract expires in June 2031. As at 30 June 2018, the
remaining payments amount to Euro 20,260 thousand, Euro 1,401 thousand of
which due by the end of the year.
For this contract Sogefi S.p.A. provided a guarantee equal to approximately
100% of the residual instalments still to fall due.
41. INVESTMENT COMMITMENTS
At 30 June 2018, Group companies have binding commitments for investments
relating to the purchase of property, plant and equipment for Euro 2,056 thousand
(Euro 785 thousand at 31 December 2017), as already disclosed in the explanatory
notes regarding tangible fixed assets.

83
42. GUARANTEES GIVEN
Details of guarantees are as follows:
(in thousands of Euro) June 30, 2018 December 31, 2017
PERSONAL GUARANTEES GIVEN
a) Sureties to third parties 4,904 7,210
b) Other personal guarantees in favour of third
parties 2,541 2,541
TOTAL PERSONAL GUARANTEES GIVEN 7,445 9,751
REAL GUARANTEES GIVEN
a) against liabilities shown in the financial
statement 1,598 2,130
TOTAL REAL GUARANTEES GIVEN 1,598 2,130
The guarantees given in favour of third parties relate to guarantees given to certain
customers, to suppliers for operating lease contracts and VAT tax authorities and for
other indirect taxes; guarantees are shown at a value equal to the outstanding
commitment at the reporting period. These items indicate risks, commitments and
guarantees provided by Group companies to third parties.
The "Other personal guarantees in favour of third parties" relate to the commitment
of the subsidiary Sogefi HD Suspensions Germany GmbH to the employee pension
fund for the two business lines at the time it was acquired in 1996; this commitment
is covered by the contractual obligations of the seller, who is a leading German
operator.
“Real guarantees given” refer to subsidiaries Sogefi Air & Cooling Canada Corp. and
Allevard IAI Suspensions Private Ltd, which pledged tangible fixed assets and trade
receivables as real guarantees to secure loans obtained from financial institutions.
43. OTHER RISKS
As at 30 June 2018, the Group had third-party goods and materials held at Group
companies worth Euro 14,975 thousand (Euro 14,884 thousand as at 31 December
2017).
44. CONTINGENT ASSETS AND LIABILITIES
Sogefi Group is managing environmental issues in some production plants. No
relevant costs are expected.
In October 2016, the Holding Company Sogefi S.p.A. received four notices of
assessment relating to fiscal periods 2011 and 2012, as a result of a tax audit carried
out during the first half year 2016, with two irregularities: i) undue detraction of Euro
0.6 million of VAT paid on purchases of goods and services, ii) non-deductibility
from IRES tax (and relating non-deductibility for VAT of Euro 0.2 million) of the
expense for services performed by Holding company CIR S.p.A. (same irregularity
found in the notices relating to the year 2009) for a total taxable amount of Euro 1.3
million.
The notifications have already been appealed before the Provincial Tax Commission,
which issued a ruling favourable to the Holding Company Sogefi S.p.A..

84
The judgement was partially appealed by the Provincial Directorate of Mantua, which
requested confirmation of the notices of assessment served for VAT purposes only.
Based on the tax advisor's opinion, with regard to all notices of assessment, Directors
believe said arguments to be groundless and inconsistent with the applicable tax
regulation in force and, for the moment, the risk of losing to be possible but not
likely.
This is why the Company did not set aside any amount for tax risks in financial
statements as at 30 June 2018.
45. SUBSEQUENT EVENTS
No significant events occurred after 30 June 2018.

85
G) 46. FINANCIAL INSTRUMENTS
A) Exchange risk – not designated in hedge accounting
As at 30 June 2018 the following forward purchase/sale contracts were maintained to
hedge the exchange risk on intercompany financial positions and on commercial
positions:
Company Date openedCurrency
exchangeSpot price Date closed
Forward
price
Fair value* at
06.30.2018
Sogefi S.p.A A GBP 8,000,000 04/23/2018 €/currency 0.86965 07/23/2018 0.87210 (154)
Sogefi S.p.A V USD 15,000,000 05/29/2018 €/currency 1.17000 07/30/2018 1.17620 (83)
Sogefi Filtration S.A. A USD 400,000 06/12/2018 €/currency 1.78200 07/12/2018 1.18082 4
Sogefi Filtration S.A. A USD 400,000 06/12/2018 €/currency 1.78200 08/22/2018 1.18444 4
Sogefi Air&Cooling
Canada Corp. A USD 1,000,000 06/15/2018 CAD/currency 1.32050 07/16/2018 1.32020 3
Sogefi Air&Cooling
Canada Corp. A USD 1,000,000 06/19/2018 CAD/currency 1.32950 07/16/2018 1.32930 (3)
Sogefi Engine systems
Mexico S. de R.L. de A USD 15,000,000 04/10/2018 MXN/currency 18.33000 07/10/2018 18.60000 693
Sogefi Suspension Brasil
LtdaA EUR 120,000 05/17/2018 USD/currency 4.37120 07/19/2018 4.42000 3
Sogefi Suspension Brasil
LtdaA EUR 200,000 06/12/2018 USD/currency 4.38960 07/19/2018 4.42150 5
Sogefi Suspension Brasil
LtdaA EUR 200,000 06/12/2018 USD/currency 4.39200 08/20/2018 4.44800 5
Sogefi Suspension Brasil
LtdaV USD 250,000 05/17/2018 BRL/currency 3.70000 07/19/2018 3.71930 (9)
Sogefi Suspension Brasil
LtdaV USD 300,000 05/17/2018 BRL/currency 3.70000 07/12/2018 3.71780 (11)
Sogefi Suspensions
ArgentinaA USD 1,200,000 06/28/2018 ARP/currency 27.78000 07/31/2018 28.72000 7
Sogefi Suspensions
ArgentinaA USD 1,200,000 06/28/2018 ARP/currency 27.75000 08/31/2018 29.44000 8
Sogefi Suspensions
ArgentinaA USD 1,200,000 06/28/2018 ARP/currency 27.78000 09/28/2018 30.20000 9
Air Intake India Pvt.LtdA EUR 1,200,000 05/29/2018 INR/currency 78.75000 08/31/2018 80.32000 8
Allevard IAI Suspensions
Private LtdA EUR 350,000 06/29/2018 INR/currency 79.57000 10/29/2018 82.64000 -
Sogefi Filtration do Brasil
LtdaA USD 58,312 04/20/2018 BRL/currency 3.40000 04/15/2019 3.70000 5
Sogefi Filtration do Brasil
LtdaA USD 720,489 05/29/2018 BRL/currency 3.70920 11/29/2018 3.69044 24
Forward purchase /
Forward sale
'
* Positive fair value was recognised in "Other financial assets - Asset for derivative financial instruments", whreas negative fair
value was recognised in "Other short-term liabilities" for derivative financial instruments", exept for Sogefi Filtration do Brasil
Ltda that recognised positive fair value in "Other short-term liabilities"
B) Interest rate risk – in hedge accounting
As at 31 December 2017 the Holding company Sogefi S.p.A. had three existing
Interest Rate Swap contracts, entered into in 2013, for an overall notional amount of
Euro 25 million that expired in June 2018.
C) Interest rate risk – no longer in hedge accounting
As at 31 December 2017, the Holding company Sogefi S.p.A. held Interest Rate
Swap contracts, expired in June 2018, for an overall notional amount of Euro 165
million, which, based on effectiveness tests carried out in the previous years, proved
ineffective so the hedging relationship was interrupted, with a resulting
reclassification of the derivative contracts to speculative instruments.
The discontinuation of hedge accounting had the following impact on the financial
statements as at 30 June 2018:

86
- a financial income of Euro 2,336 thousand reflecting the change in fair value
compared to 31 December 2017 was immediately recognised in the income
statement;
- a financial expense of Euro 1,055 thousand was recognised in the income
statement; this amount reflects the portion of the reserve previously booked to
“Other Comprehensive Income” that is recognised in the income statement over
the same period of time as the differentials relating to the former underlying
hedged item.
D) Exchange risk (Cross currency swap) no longer in hedge accounting
During 2013 the Holding Company Sogefi S.p.A. entered into three cross currency
swap (Ccs) contracts maturing in June 2023, initially designated in hedge accounting,
in order to hedge interest and exchange rate risks relating to the private placement
currently of USD 82.1 million bonds. Under these contracts, a fixed interest
receivable of 600 basis points on subscribed notional USD amount is collected by the
Company on a quarterly basis against payment of a fixed interest payable on a
notional amount in EUR corresponding to the USD notional amount converted at the
fixed exchange rate of 1.3055 (totalling Euro 62,921 thousand).
Based on the tests carried out on 31 December 2017, they have become ineffective so
that the hedging relationship was discontinued and the derivative contracts were
reclassified as fair value through profit or loss instruments. The change in fair value
(exclusively for the interest rate risk) compared to 31 December 2017 was recognised
in the income statement, whereas the reserve booked to "Other Comprehensive
Income" (if any) is reclassified in the income statement over the same period of time
as the differentials relating to the underlying hedged item.
Details of these contracts are as follows:
Description of CCSwap Date opened Contract
maturity
Notional
(in
thousands
of Usd)
Fixed rate Fair value at
06.30.2018
Fair value at
12.31.2017
Private placement USD 115
million (05/03/2013 maturity
06/01/2023), coupon 600 bps
04/30/2013 06/01/2023 39,286
6.0% USD
receivable
5.6775%
Euro
payables
1,298 1,103
Private placement USD 115
million (05/03/2013 maturity
06/01/2023), coupon 600 bps
04/30/2013 06/01/2023 28,571
6.0% USD
receivable
5.74% Euro
payables
892 752
Private placement USD 115
million (05/03/2013 maturity
06/01/2023), coupon 600 bps
04/30/2013 06/01/2023 14,286
6.0% USD
receivable
5.78% Euro
payables
436 360
TOTAL 82,143 2,626 2,215
The discontinuation of hedge accounting, for the interest rate risk, had the following
impact on the financial statements as at 30 June 2018:
- a financial expense of Euro 443 thousand reflecting the change in fair value
compared to 31 December 2017 was immediately recognised in the income
statement;
- a financial expense of Euro 364 thousand was recognised in the income statement;
this amount reflects the portion of the reserve previously booked to “Other
Comprehensive Income” that is recognised in the income statement over the same
period of time as the differentials relating to the former underlying hedged item.

87
As at 30 June 2018, an amount of Euro 3,583 thousand remains to be recycled to
the income statement in the future years.
E) Fair value of derivatives in hedge accounting and no longer in hedge accounting
The fair value of all derivatives was calculated using the forward curves of exchange
and interest rates as at 30 June 2018, also taking into account a credit valuation
adjustment / debit valuation adjustment. The fair value amounts of derivatives are
classified as Level 2 in fair value hierarchy, based on the significance of the inputs
used in fair value measurements.
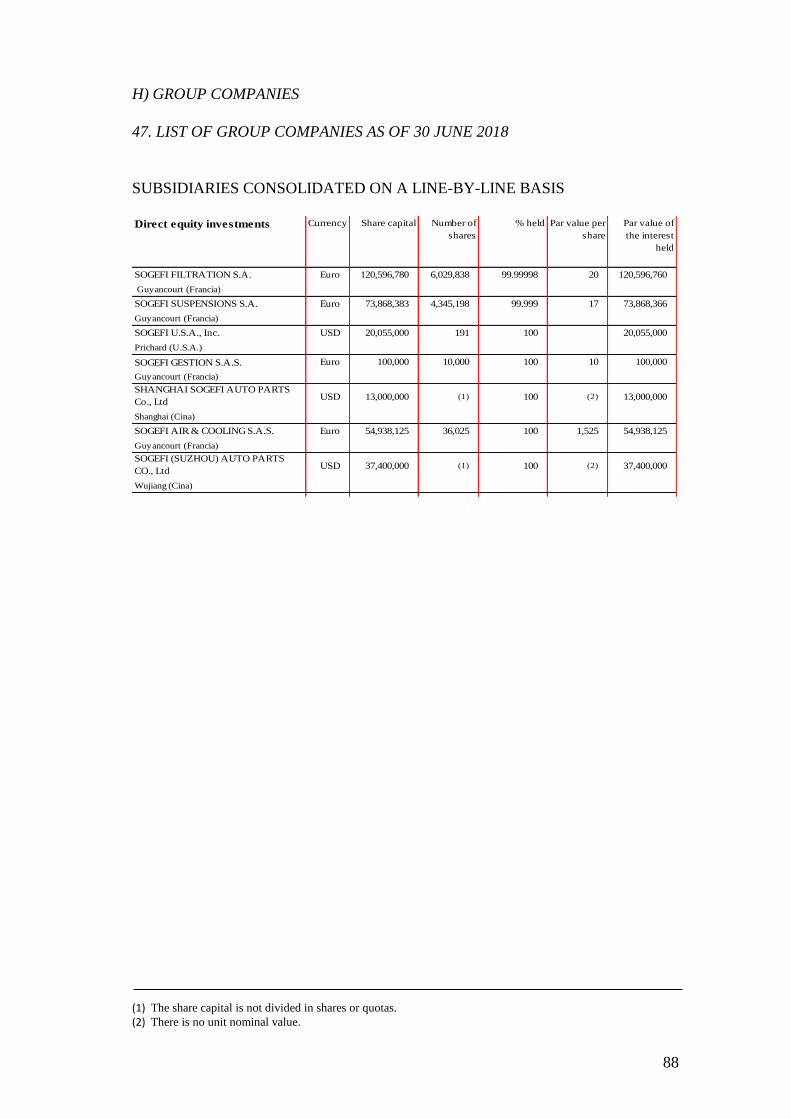
88
H) GROUP COMPANIES
47. LIST OF GROUP COMPANIES AS OF 30 JUNE 2018
SUBSIDIARIES CONSOLIDATED ON A LINE-BY-LINE BASIS
Direct equity investments Currency Share capital Number of
shares
% held Par value per
share
Par value of
the interest
held
SOGEFI FILTRATION S.A. Euro 120,596,780 6,029,838 99.99998 20 120,596,760
Guyancourt (Francia)
SOGEFI SUSPENSIONS S.A. Euro 73,868,383 4,345,198 99.999 17 73,868,366
Guyancourt (Francia)
SOGEFI U.S.A., Inc. USD 20,055,000 191 100 20,055,000
Prichard (U.S.A.)
SOGEFI GESTION S.A.S. Euro 100,000 10,000 100 10 100,000
Guyancourt (Francia)
SHANGHAI SOGEFI AUTO PARTS
Co., LtdUSD 13,000,000 (1) 100 (2) 13,000,000
Shanghai (Cina)
SOGEFI AIR & COOLING S.A.S. Euro 54,938,125 36,025 100 1,525 54,938,125
Guyancourt (Francia)
SOGEFI (SUZHOU) AUTO PARTS
CO., LtdUSD 37,400,000 (1) 100 (2) 37,400,000
Wujiang (Cina)
(1) The share capital is not divided in shares or quotas. (2) There is no unit nominal value.

89
Indirect equity investments Currency Share capital Number of
shares
% held Par value per
share
Par value of
the interest
held
FILTRATION BUSINESS UNIT
SOGEFI FILTRATION Ltd GBP 5,126,737 5,126,737 100 1 5,126,737
Tredegar (Gran Bretagna)
held by Sogefi Filtration S.A.
SOGEFI FILTRATION SPAIN S.A.U. Euro 14,249,084.96 2,370,896 100 6.01 14,249,085
Cerdanyola (Spagna)
held by Sogefi Filtration S.A.
SOGEFI FILTRATION d.o.o. Euro 10,291,798 1 100 10,291,798 10,291,798
Medvode (Slovenia)
held by Sogefi Filtration S.A.
FILTER SYSTEMS MAROC S.a.r.l. MAD 95,000,000 95,000 100 1,000 95,000,000
Tanger (Marocco)
held by Sogefi Filtration S.A.
SOGEFI FILTRATION RUSSIA LLC* RUB 6,800,000 1 100 6,800,000 6,800,000
Russia
held by Sogefi Filtration S.A.
SOGEFI-MNR ENGINE SYSTEMS INDIA
Pvt LtdINR 21,254,640 1,487,825 70 10 14,878,250
Bangalore (India)
45% held by Sogefi Filtration S.A.
24,98% held by Sogefi Air & Cooling S.A.S.
0,02% held by Systemes Moteurs China, S.à.r.l.
SOGEFI FILTRATION DO BRASIL Ltda BRL 103,713,074 103,713,074 100 1 103,713,074
São Bernardo do Campo (Brasile)
86,1084% held by Sogefi Filtration S.A.
13,8915% held by Sogefi Filtration Spain S.A.U.
0,0000010% held by Sogefi Suspension Brasil
Ltda
SOGEFI FILTRATION ARGENTINA S.A. ARP 57,235,407 57,235,405 99.999 1 57,235,405
Buenos Aires (Argentina)
99,42425% held by Sogefi Filtration S.A.
0,5757% held by Sogefi Filtration Italy S.p.A.
SOGEFI FILTRATION ITALY S.p.A. Euro 8,000,000 7,990,043 99.88 1 7,990,043
Sant’Antonino di Susa (Italia)
held by Sogefi Filtration S.A.
* The company was built on 22 December 2017
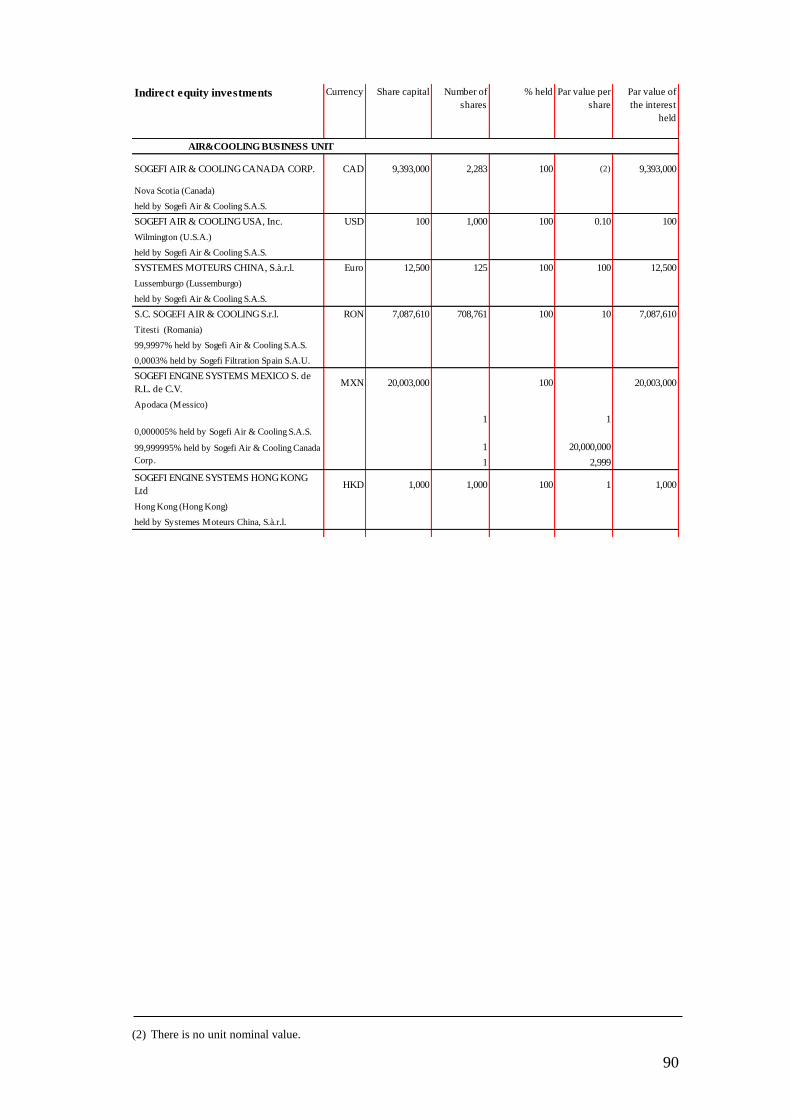
90
Indirect equity investments Currency Share capital Number of
shares
% held Par value per
share
Par value of
the interest
held
AIR&COOLING BUSINESS UNIT
SOGEFI AIR & COOLING CANADA CORP. CAD 9,393,000 2,283 100 (2) 9,393,000
Nova Scotia (Canada)
held by Sogefi Air & Cooling S.A.S.
SOGEFI AIR & COOLING USA, Inc. USD 100 1,000 100 0.10 100
Wilmington (U.S.A.)
held by Sogefi Air & Cooling S.A.S.
SYSTEMES MOTEURS CHINA, S.à.r.l. Euro 12,500 125 100 100 12,500
Lussemburgo (Lussemburgo)
held by Sogefi Air & Cooling S.A.S.
S.C. SOGEFI AIR & COOLING S.r.l. RON 7,087,610 708,761 100 10 7,087,610
Titesti (Romania)
99,9997% held by Sogefi Air & Cooling S.A.S.
0,0003% held by Sogefi Filtration Spain S.A.U.
SOGEFI ENGINE SYSTEMS MEXICO S. de
R.L. de C.V.MXN 20,003,000 100 20,003,000
Apodaca (Messico)
0,000005% held by Sogefi Air & Cooling S.A.S.
1 1
1 20,000,000
1 2,999
SOGEFI ENGINE SYSTEMS HONG KONG
Ltd HKD 1,000 1,000 100 1 1,000
Hong Kong (Hong Kong)
held by Systemes Moteurs China, S.à.r.l.
99,999995% held by Sogefi Air & Cooling Canada
Corp.
(2) There is no unit nominal value.

91
Indirect equity investments Currency Share capital Number of
shares
% held Par value per
share
Par value of the
interest held
SUSPENSIONS BUSINESS UNIT
ALLEVARD SPRINGS Ltd GBP 4,000,002 4,000,002 100 1 4,000,002
Clydach (Gran Bretagna)
held by Sogefi Suspensions S.A.
SOGEFI PC SUSPENSIONS GERMANY
GmbH Euro 50,000 1 100 50,000 50,000
Volklingen (Germania)
held by Sogefi Suspensions S.A.
SOGEFI SUSPENSION ARGENTINA S.A. ARP 48,858,410 48,853,430 99.99 1 48,853,430
Buenos Aires (Argentina)
held by Sogefi Suspensions S.A. al 90,19%
held by Sogefi Suspension Brasil Ltda al 9,80%
IBERICA DE SUSPENSIONES S.L. (ISSA) Euro 10,529,668 5,264,834 50 1 5,264,834
Alsasua (Spagna)
held by Sogefi Suspensions S.A.
SOGEFI SUSPENSION BRASIL Ltda BRL 37,161,683 37,161,683 100 1 37,161,683
São Paulo (Brasile)
held by Sogefi Suspensions S.A. al 99,997%
held by Allevard Springs Ltd allo 0,003%
UNITED SPRINGS Limited GBP 4,500,000 4,500,000 100 1 4,500,000
Rochdale (Gran Bretagna)
held by Sogefi Suspensions S.A.
UNITED SPRINGS B.V. Euro 254,979 254,979 100 1 254,979
Hengelo (Olanda)
held by Sogefi Suspensions S.A.
SHANGHAI ALLEVARD SPRINGS Co.,
LtdEuro 5,335,308 1 60.58 (2) 3,231,919
Shanghai (Cina)
held by Sogefi Suspensions S.A.
UNITED SPRINGS S.A.S. Euro 5,109,000 2,043,600 100 2.5 5,109,000
Guyancourt (Francia)
held by Sogefi Suspensions S.A.
S.ARA COMPOSITE S.A.S. Euro 13,000,000 25,000,000 96.15 0.5 12,500,000
Guyancourt (Francia)
held by Sogefi Suspensions S.A.
ALLEVARD IAI SUSPENSIONS Pvt Ltd INR 432,000,000 32,066,926 74.23 10 320,669,260
Pune (India)
held by Sogefi Suspensions S.A.
SOGEFI HD SUSPENSIONS GERMANY
GmbH Euro 50,000 (1) 100 50,000 50,000
Hagen (Germania)
held by Sogefi PC Suspensions Germany
GmbH
SOGEFI SUSPENSIONS HEAVY DUTY
ITALY S.P.A.*Euro 6,000,000 5,992,531 99.88 1 5,992,531
Puegnago sul Garda (Italia)
held by Sogefi Suspensions S.A.
SOGEFI SUSPENSIONS PASSENGER CAR
ITALY S.P.A.**Euro 8,000,000 7,990,043 99.88 1 7,990,043
Settimo Torinese (Italia)
held by Sogefi Suspensions S.A.
* The company changed name from Sogefi Suspension Heavy Duty Italy S.r.l. to Sogefi Suspension Heavy Duty Italy S.p.A. on
1 July 2018
** The company changed name from Sogefi Suspension Passenger Car Italy S.r.l. to Sogefi Suspension Passenger Car Italy
S.p.A. on 1 July 2018
(1) The share capital is not divided in shares or quotas. (2) There is no unit nominal value.

92
EQUITY INVESTMENTS IN SUBSIDIARIES CONSOLIDATED USING THE
EQUITY METHOD
Indirect equity investments Currency Share capital Number of
shares
% held Par value per
share
Par value of
the interest
held
MARK IV ASSET (Shanghai) AUTO
PARTS Co., Ltd
CNY 5,000,000 (1) 50 (2) 2,500,000
Shanghai (Cina)
Held by Sogefi Engine Systems Hong
Kong Limited
EQUITY INVESTMENTS IN OTHER COMPANIES CARRIED AT COST
Indirect equity investments Currency Share capital Number of
shares
% held Par value per
share
Par value of
the interest
held
AFICO FILTERS S.A.E. EGP 14,000,000 24,880 17.77 100 2,488,000
Il Cairo (Egitto)
Held by Sogefi Filtration Italy S.p.A.
(1) The share capital is not divided in shares or quotas. (2) There is no unit nominal value.
DECLARATION OF THE CONDENSED INTERIM CONSOLIDATED FINANCIAL STATEMENTS PURSUANT TO ART. 81-TER OF CONSOB RESOLUTION No. 11971 OF MAY 14, 1999 AND SUBSEQUENT MODIFICATIONS AND INTEGRATIONS 1. The undersigned:
Laurent Hebenstreit –Managing Director and General Manager of Sogefi S.p.A. Yann Albrand – Manager responsible for preparing Sogefi S.p.A.’s financial reports hereby certify, having also taken into consideration the provisions of Article 154-bis, paragraph 3 and 4, of Italian Legislative Decree n. 58 of February 24, 1998, that: the administrative and accounting procedures for the preparation of the condensed interim consolidated financial statements for the 2018 first half: ● are adequate with respect to the company structure and ● have been effectively applied.
2. No relevant aspects are to be reported on this subject. 3. It is also certified that: 3.1 the condensed interim consolidated financial statements as at June 30, 2018:
- have been prepared in accordance with international accounting standards as endorsed by the European Union through Regulation (EC) 1606/2002 of the European Parliament and of the Council of July 19, 2002;
- correspond to the books and accounting records; - provide a true and fair representation of the financial position, result of operations
and cash flow of the issuer and the subsidiaries included in the scope of consolidation.
3.2 the interim report on operations of the Group includes a reliable analysis of the
significant events that occurred in the first half of the year and their impact on the half-year condensed interim consolidated financial statements. In addition, the report includes a description of the main risks and uncertainties for the remaining six months of the year and a reliable analysis of the information about any significant related party transactions.
Milan, July 24, 2018
Managing Director and General Manager
Manager responsible for preparing financial reports
Laurent Hebenstreit Yann Albrand

94
INTERIM FINANCIAL STATEMENTS OF THE HOLDING COMPANY
SOGEFI S.p.A.

95
STATEMENT OF FINANCIAL POSITION (in thousands of Euro)
ASSETS June 30, 2018 December 31, 2017
CURRENT ASSETS
Cash and cash equivalents 43,430 36,329
Cash pooling current accounts with subsidiaries 33,417 60,678
Other financial assets 63 464
Loans and financial receivables similar to loans
with subsidiaries
of which dividends from subsidiaries not yet collected
18,482
18,033
65
-
WORKING CAPITAL
Inventories - -
Trade receivables 5,531 12,909
of which from subsidiaries 2,918 7,586
of which from parent company 2,613 5,323
Other receivables 50 18
Tax receivables 968 852
Other assets 595 304
TOTAL WORKING CAPITAL 7,144 14,083
TOTAL CURRENT ASSETS 102,536 111,620
NON-CURRENT ASSETS
FIXED ASSETS
Investment properties: land 13,083 13,083
Investment properties: other 7,041 7,041
Other tangible fixed assets 158 188
of which leases - -
Intangible assets 25,574 26,834
TOTAL FIXED ASSETS 45,856 47,146
OTHER NON-CURRENT ASSETS
Equity investments in subsidiaries 415,993 415,786
Equity investments in associates - -
Other financial assets - -
Loans and financial receivables similar to loans 78,492 34,722
of which from subsidiaries 75,866 32,507
of which other medium/long term assets for derivatives financial
instruments
2,626
2,215
Other receivables 49 49
Deferred tax assets 2,495 3,091
TOTAL OTHER NON CURRENT ASSETS 497,029 453,648
TOTAL NON CURRENT ASSETS 542,885 500,794
TOTAL ASSETS 645,421 612,414
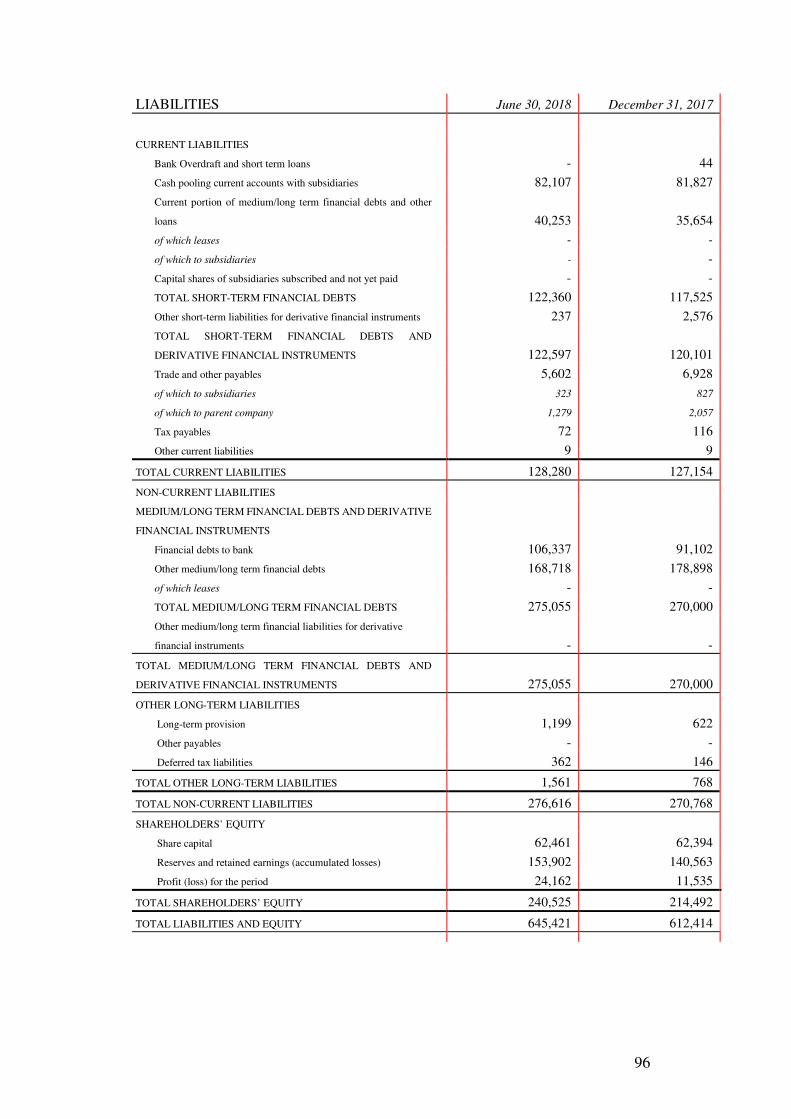
96
LIABILITIES June 30, 2018 December 31, 2017
CURRENT LIABILITIES
Bank Overdraft and short term loans - 44
Cash pooling current accounts with subsidiaries 82,107 81,827
Current portion of medium/long term financial debts and other
loans
40,253
35,654
of which leases - -
of which to subsidiaries - -
Capital shares of subsidiaries subscribed and not yet paid
TOTAL SHORT-TERM FINANCIAL DEBTS
-
122,360
-
117,525
Other short-term liabilities for derivative financial instruments 237 2,576
TOTAL SHORT-TERM FINANCIAL DEBTS AND
DERIVATIVE FINANCIAL INSTRUMENTS
122,597
120,101
Trade and other payables 5,602 6,928
of which to subsidiaries 323 827
of which to parent company 1,279 2,057
Tax payables 72 116
Other current liabilities 9 9
TOTAL CURRENT LIABILITIES 128,280 127,154
NON-CURRENT LIABILITIES
MEDIUM/LONG TERM FINANCIAL DEBTS AND DERIVATIVE
FINANCIAL INSTRUMENTS
Financial debts to bank 106,337 91,102
Other medium/long term financial debts 168,718 178,898
of which leases - -
TOTAL MEDIUM/LONG TERM FINANCIAL DEBTS 275,055 270,000
Other medium/long term financial liabilities for derivative
financial instruments
-
-
TOTAL MEDIUM/LONG TERM FINANCIAL DEBTS AND
DERIVATIVE FINANCIAL INSTRUMENTS
275,055
270,000
OTHER LONG-TERM LIABILITIES
Long-term provision 1,199 622
Other payables - -
Deferred tax liabilities 362 146
TOTAL OTHER LONG-TERM LIABILITIES 1,561 768
TOTAL NON-CURRENT LIABILITIES 276,616 270,768
SHAREHOLDERS’ EQUITY
Share capital 62,461 62,394
Reserves and retained earnings (accumulated losses) 153,902 140,563
Profit (loss) for the period 24,162 11,535
TOTAL SHAREHOLDERS’ EQUITY 240,525 214,492
TOTAL LIABILITIES AND EQUITY 645,421 612,414

97
INCOME STATEMENT (in thousands of Euro)
First half 2018 First half 2017
FINANCIAL INCOME AND EXPENSES
1) Income from equity investments 33,883 32,407
2) Other financial income 6,798 16,406
of which from subsidiaries 1,212 1,767
of which exchange gains 3,993 12,916
3) Interests expenses and other financial expenses 14,410 24,025
of which to subsidiaries 130 32
of which exchange losses 4,029 13,287
TOTAL FINANCIAL INCOME AND EXPENSES 26,271 24,788 10,973
ADJUSTMENTS TO THE VALUE OF FINANCIAL ASSETS
- Revaluations - -
- Writedowns - -
TOTAL VALUE ADJUSTMENTS - -
6) OTHER OPERATING INCOME 6,313 7,024
of which from subsidiaries 6,297 7,002
OTHER OPERATING EXPENSES
7) Non-financial services 1,964 2,468
of which to subsidiaries 81 929
of which to parent company 320 310
8) Leases and rental 2,773 2,886
of which to parent company 60 58
9) Personnel 1,977 2,178
10) Depreciation, amortization and writedowns 1,492 1,538
11) Provisions for risks - -
12) Other provision - -
13) Other operating expenses 531 517
TOTAL OTHER OPERATING EXPENSES 8,737 9,587
NON-OPERATING INCOME AND EXPENSES
14) Non operating income 126 80
15) Non operating expenses 859 1,856
NON-OPERATING PROFIT (LOSS) (732) (1,776)
PROFIT (LOSS) BEFORE TAXES 23,115 20,449
16) Income taxes (1,047) (1,021)
NET PROFIT 24,162 21,470
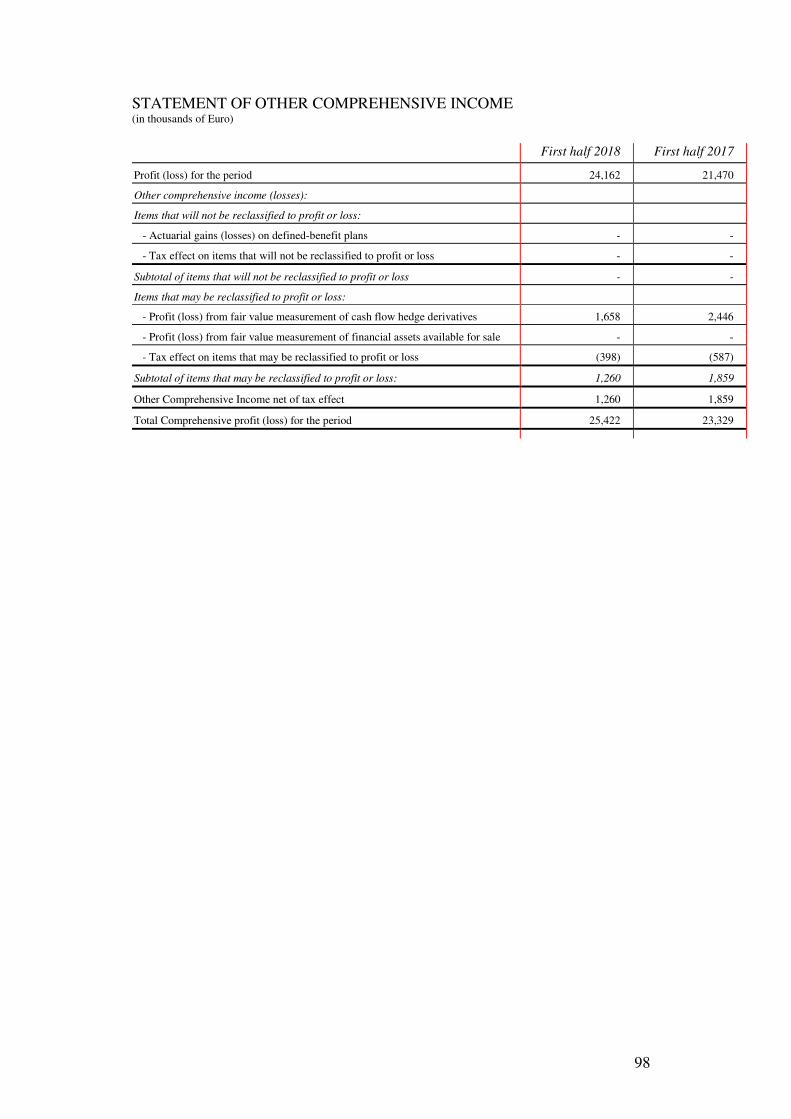
98
STATEMENT OF OTHER COMPREHENSIVE INCOME (in thousands of Euro)
First half 2018 First half 2017
Profit (loss) for the period 24,162 21,470
Other comprehensive income (losses):
Items that will not be reclassified to profit or loss:
- Actuarial gains (losses) on defined-benefit plans - -
- Tax effect on items that will not be reclassified to profit or loss - -
Subtotal of items that will not be reclassified to profit or loss - -
Items that may be reclassified to profit or loss:
- Profit (loss) from fair value measurement of cash flow hedge derivatives 1,658 2,446
- Profit (loss) from fair value measurement of financial assets available for sale - -
- Tax effect on items that may be reclassified to profit or loss (398) (587)
Subtotal of items that may be reclassified to profit or loss: 1,260 1,859
Other Comprehensive Income net of tax effect 1,260 1,859
Total Comprehensive profit (loss) for the period 25,422 23,329

99
CASH FLOW STATEMENT (in thousands of Euro) First half 2018 First half 2017
CASH FLOWS FROM OPERATING ACTIVITIES
Net profit for the period 24,162 21,470
Adjustments:
- non collected dividends (18,033) (25,019)
- trade receivables waiver from subsidiaries - 1,764
- depreciation and amortisation of tangible and intangible fixed assets 1,492 1,538
- reclassification to income statement of cash flow hedge reserve (1,329) 8,993
- expenses recognized for share-based incentive plans 151 129
- exchange rate differences on private placement 854 (10,138)
- (not paid) interest expenses on bonds 1,944 1,822
- net change in deferred charge provision 720 -
- net change in provision for employment termination indemnities (143) (12)
- change in net working capital 5,729 2,787
- change in tax receivables/payables (160) (278)
- other medium/long-term assets/liabilities 414 630
CASH FLOWS FROM OPERATING ACTIVITIES 15,801 3,686
INVESTING ACTIVITIES
Paid share capital increase in subsidiaries - (20)
Repayment share capital from subsidiaries - 421
Net change in intangible and tangible fixed assets (201) (948)
Net change in other financial assets 639 (480)
NET CASH FLOW FROM INVESTING ACTIVITIES 438 (1,027)
FINANCING ACTIVITIES
Paid share capital increase 253 900
New (repayment of) medium/long term loans 19,440 (31,182)
New (repayment of) bonds (12,584) (12,587)
Net cash pooling position 27,541 10,622
Loans and other financial receivables from subsidiaries (43,744) 24,032
NET CASH FLOW FROM FINANCING ACTIVITIES (9,094) (8,215)
(DECREASE) INCREASE IN CASH AND CASH EQUIVALENTS 7,144 (5,556)
Balance at the beginning of the period 36,285 25,150
(Decrease) increase in cash and cash equivalents 7,144 (5,556)
BALANCE AT THE END OF THE PERIOD 43,430 19,594
NB: this table shows the elements that bring about the change in cash and cash equivalents, as expressly required by IAS
7 (in particular the net balance between “Cash and cash equivalents” and “Bank overdrafts and short-term loans”). For a
better understanding of the various operating cash flows and hence the changes in the overall net financial position,
reference should be made to the cash flow statement included in the Report of the Board of Directors on Operations.

100
ADDITIONAL INFORMATION OF CASH FLOW STATEMENT First half 2018 First half 2017
Interests collected 926 2,472
Interests paid (7,680) (8,667)
Dividends collected 15,851 7,388
Current income tax collections (payments) 5,614 5,520
STATEMENTS OF CHANGE IN EQUITY
(in thousands of Euro) Share
Capital
Reserves
and retained
earnings
(accumulated
losses)
Profit
for
the
period
Total
Shareholders’
equity
Balance at December 31, 2016 62,065 108,131 27,721 197,917
Increase in share capital restricted to the employees of Sogefi
S.p.A. and its subsidiaries
228
672
-
900
Allocation of 2016 profit:
- Retained earnings reserve
-
27,721
(27,721)
-
Recognition of share-based incentive plans - 265 - 265
Comprehensive income for the period:
- Actuarial gains (losses) on defined-benefit plans - - - -
- Fair value measurement of cash flow hedging instruments - 2,446 - 2,446
- Fair value measurement of financial assets available for sale - - - -
- Tax on items booked directly to equity - (587) - (587)
- Net result for the period - - 21,470 21,470
Total other comprehensive profit for the period - 1,859 21,470 23,329
Balance at June 30, 2017 62,293 138,648 21,470 222,411
(in thousands of Euro) Share
Capital
Reserves
and retained
earnings
(accumulated
losses)
Profit
for
the
period
Total
Shareholders’
equity
Balance at December 31, 2017 62,394 140,563 11,535 214,492
Increase in share capital restricted to the employees of Sogefi
S.p.A. and its subsidiaries
67
186
-
253
Allocation of 2017 profit:
- Retained earnings reserve
-
11,535
(11,535)
-
Recognition of share-based incentive plans - 358 - 358
Comprehensive income for the period:
- Actuarial gains (losses) on defined-benefit plans - - - -
- Fair value measurement of cash flow hedging instruments - 1,658 - 1,658
- Fair value measurement of financial assets available for sale - - - -
- Tax on items booked directly to equity - (398) - (398)
- Net result for the period - - 24,162 24,162
Total other comprehensive profit for the period - 1,260 24,162 25,422
Balance at June 30, 2018 62,461 153,902 24,162 240,525