2018 Edelman Trust Barometer Global Deck · Journalism is an average of traditional media and...
25
1 Winston Peters and Jacinda Ardern/TPPA protest © Stuff Limited #TrustBarometerNZ
Transcript of 2018 Edelman Trust Barometer Global Deck · Journalism is an average of traditional media and...

1
Winston Peters and Jacinda Ardern/TPPA protest © Stuff Limited
#TrustBarometerNZ

2
Methodology
2018 Edelman
Trust Barometer
Online Survey in 28 Countries
18 years of data
33,000+ respondents total
All fieldwork was conducted between
October 28 and November 20, 2017
Survey in New Zealand
3 years of data
1,000+ respondents each year
New Zealand fieldwork was conducted in 11th-21st
November, 2017
General Online Population
7 years in 25+ countries
Ages 18+
1,150 respondents per country
1,150 respondents in New Zealand
All slides show general online population data unless otherwise noted
Mass Population
All population not including informed public
Represents 85% of total global population
1,065 in New Zealand
Informed Public
10 years in 20+ countries
Represents 15% of total global population
500 respondents in U.S. and China; 200 in all other global study countries
158 in New Zealand
Must meet 4 criteria:
Ages 25-64
College educated
In top 25% of household income per age group in each country
Report significant media consumption and engagement in business news
28-country global data margin of error: General population +/-
0.6% (N=32,200), informed public +/- 1.2% (N=6,200), mass
population +/- 0.6% (26,000+), half-sample global general online
population +/- 0.8 (N=16,100).
Country-specific data margin of error: General population +/- 2.9
(N=1,150), informed public +/- 6.9% (N = min 200, varies by
country), China and U.S. +/- 4.4% (N=500), mass population +/-
3.0 to 3.6 (N =min 740, varies by country), New Zealand +/- 4.4
(N=1,150).

Source: 2018 Edelman Trust Barometer.
The Trust Index is an average of a country's trust in the institutions
of government, business, media and NGOs. General population,
28-country global total, New Zealand General Population (n=1,150).
Global totals exclude New Zealand figures.3
Average trust in institutions,
general population, 2017 vs. 2018
Trust Index
A World of
Distrust
47 Global
72 India
69 Indonesia
67 China
60 Singapore
60 UAE
53 The Netherlands
52 Mexico
52 U.S.
50 Colombia
49 Canada
48 Brazil
48 Italy
48 Malaysia
45 Argentina
44 Hong Kong
44 Spain
43 New Zealand
43 Turkey
42 Australia
42 S. Africa
41 Germany
40 France
40 U.K.
38 S. Korea
37 Sweden
36 Ireland
35 Japan
35 Poland
34 Russia
Trust
(60-100)
Neutral
(50-59)
Distrust
(1-49)
48 Global
74 China
71 Indonesia
68 India
66 UAE
58 Singapore
54 Mexico
54 The Netherlands
53 Malaysia
49 Canada
47 Argentina
47 Colombia
47 Spain
46 Turkey
45 Hong Kong
44 New Zealand
44 Brazil
44 S. Korea
43 Italy
43 U.S.
41 Germany
41 Sweden
40 Australia
40 France
39 Poland
39 U.K.
38 Ireland
38 S. Africa
37 Japan
36 Russia
2017General Population
2018General Population
Global Trust Index remains at distruster level
20 of 28 countries are distrusters, up 1 from 2017
Biggest changes in
U.S. -9
China +7
S. Korea +6
UAE +6
Italy -5
Trust decline in the U.S. is
the steepest ever measured

Source: 2018 Edelman Trust Barometer. TRU_INS. Below is a list of institutions. For each one, please indicate how much you trust that institution to do
what is right using a nine-point scale, where one means that you “do not trust them at all” and nine means that you “trust them a great deal.” (Top 4 Box,
Trust) Informed Public and General Population, 28-country global total, New Zealand General Population (n=1,150).
4
New Zealanders have most trust in Government
Informed Public’s trust in institutions drops
significantly
General
Population
Business MediaNGOs Government
53 52
41 43
53 52
43 4351
47 46
29
48 4751
31
0 0 +2 0-3 0 +5 +2
20182017
Y-to-Y Change− +0
NZ 2018NZ 2017
67 65
53 53
64 64
53 53
75
66 63
42
5652
57
38
-3 -1 0 0
Informed
Public -19 -14 -6 -4

Source: 2018 Edelman Trust Barometer. Trust-Building Mandates Analysis. The most effective trust building mandates for each institution. INS_EXP_GOV;
INS_EXP_MED; INS_EXP_BUS; and INS_EXP_NGO. Below is a list of potential expectations or responsibilities that a social institution might have. Thinking about [insert
institution] in general, how would you characterize each using the following three-point scale. General population, 28-country global total. For more details on the Trust
Mandates Analysis, please refer to the Technical Appendix.5
Each Institution
Plays a Different Role
With different
mandates on
which to build
trust
NGOsProtect privacy of information
Be the guardian of fairness and equality
Uphold the Kiwi way of life
BusinessProtect privacy of information
Foster prosperity
Provide job opportunities and
development
GovernmentProvide infrastructure
Foster prosperity
Uphold the Kiwi way of life
MediaEducate people
Check and balance other institutions
Protect privacy of information

Media and trust building mandates
6

Source: 2018 Edelman Trust Barometer. ATT_MED_AGR. Below is a list of statements. For each one, please rate how much you agree or disagree with
that statement using a nine-point scale where one means “strongly disagree” and nine means “strongly agree”. (Top 4 Box, Agree), question asked of half
of the sample. General population, 28-country global total, New Zealand General Population (n=575).
7
Percent who agree that they…
Uncertainty Over
Real vs. Fake News
64%
The average person does not
know how to tell good journalism
from rumour or falsehoods
53% It is becoming harder to tell if a
piece of news was produced by a
respected media organisation
Global:
63%
Global:
59%
Can’t recognise
journalism from rumourCan’t recognise
respected sources

Source: 2018 Edelman Trust Barometer. News Engagement
Scale, built from MED_SEG_OFT. How often do you engage in
the following activities related to news and information? Indicate
your answer using the 7-point scale below. General population,
28-country global total. For details on how the News Engagement
Scale was built, please refer to the Technical Appendix.
NB: Numbers for New Zealand do not sum to 100% due to
rounding8
ConsumptionHow frequently do you consume news
produced by major news organisations,
either at the original source, shared by
others or pushed to you in a feed?
Half the population is
disengaged with news
AmplificationHow often do you share or forward news
items, or post opinions or other content?
54%
The DisengagedConsume news
less than weekly
32%
ConsumersConsume news
about weekly
or more
13%
AmplifiersConsume news about
weekly or more AND
share or post content
several times a month
or more
50%
The Disengaged25%
Consumers
25%
Amplifiers

Source: 2018 Edelman Trust Barometer. ATT_MED_AGR. Below is a list of statements. For each one, please rate how much you agree or disagree with
that statement using a nine-point scale where one means “strongly disagree” and nine means “strongly agree”. (Top 4 Box, Agree), question asked of half
of the sample. General population, 28-country global total, New Zealand General Population (n=575).
9
Percent who agree that news
organisations are overly focused on …
Sceptical About
News Organisations
69%
are more concerned
with attracting a big
audience than reporting
Attracting
Large Audiences
48%
support an ideology vs.
informing the public
Politics
64%
sacrifice accuracy to be
the first to break a story
Breaking News
Global:
66%
Global:
65%
Global:
59%
59% 56% 42%
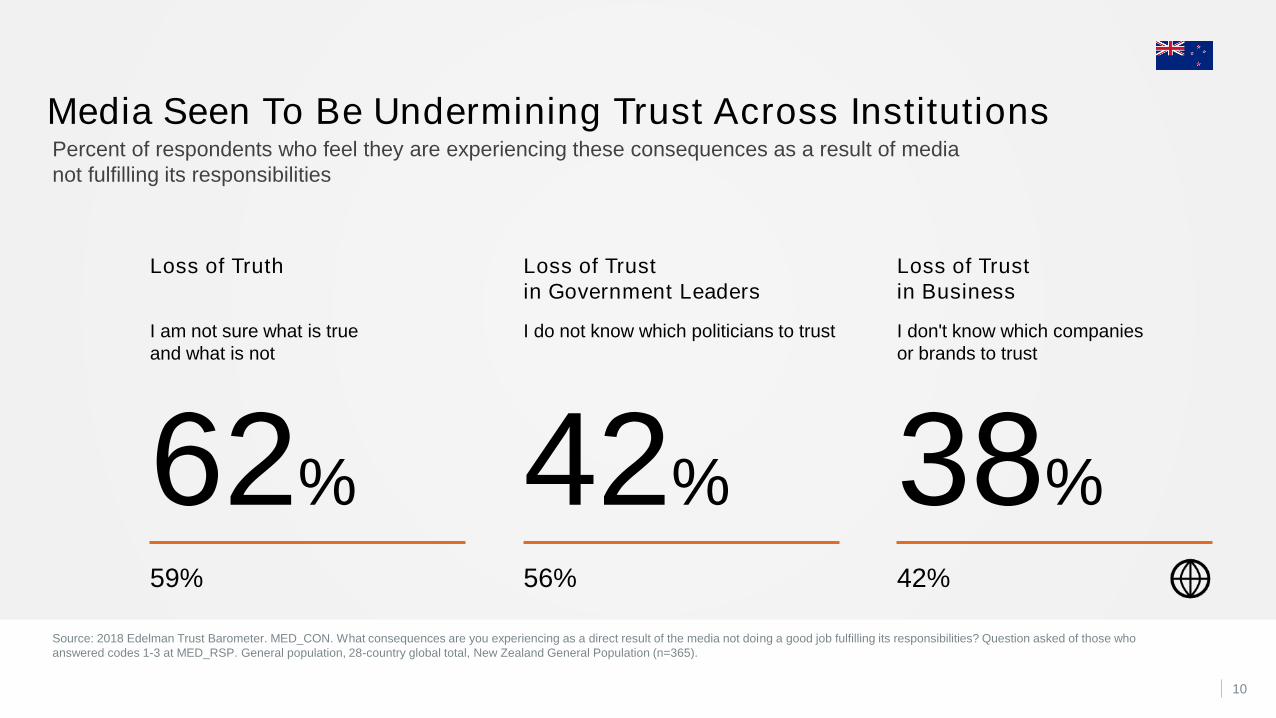
Source: 2018 Edelman Trust Barometer. MED_CON. What consequences are you experiencing as a direct result of the media not doing a good job fulfilling its responsibilities? Question asked of those who
answered codes 1-3 at MED_RSP. General population, 28-country global total, New Zealand General Population (n=365).
10
Percent of respondents who feel they are experiencing these consequences as a result of media
not fulfilling its responsibilities
Media Seen To Be Undermining Trust Across Institutions
I am not sure what is true
and what is not
Loss of Truth
I do not know which politicians to trust
Loss of Trust
in Government Leaders
I don't know which companies
or brands to trust
Loss of Trust
in Business
62% 42% 38%

11
People see media
as both content
and platforms
What did you assume was meant by
the phrase “media in general”?
Source: 2018 Edelman Trust Barometer. TRU_MED. In the above
question, what did you assume was meant by the phrase “media in
general”? General population, 28-country global total, New Zealand
General Population (n=1,150). Social is a net of TRU_MEDr3 and
r12, Influencers is r5, Search is r7, Brands is a net of r10 and r11,
Journalists is a net of r1 and r6, News Apps is r8.
PLATFORMS
PUBLISHERS
16%39%
SearchSocial
38%News
Apps
19%
Influencers
95%
Journalists
37%
Brands

Source: 2018 Edelman Trust Barometer. COM_MCL. When looking for general news and information, how much would you trust each type of source for
general news and information? Please use a nine-point scale where one means that you “do not trust it at all” and nine means that you “trust it a great deal.”
(Top 4 Box, Trust), question asked of half of the sample. General population, 25-country global total, New Zealand General Population (n=1,150).
Journalism is an average of traditional media and online-only media. Platforms is an average of search engines and social media.12
Percent trust in each source for general news
and information, 2012 to 2018
Trust in Journalism Outpaces Trust in Platforms
in New Zealand
Platforms
+1
Journalism
+1646
41
57
41
36 37
2016 2017 2018
Average trust in search engines
and social media platforms
Average trust in traditional
and online-only media
7067
54
48 47 4744
4137 35
31
+11 +9 +11 +10 -4 +4 +5 +13 +10 +10 N/A
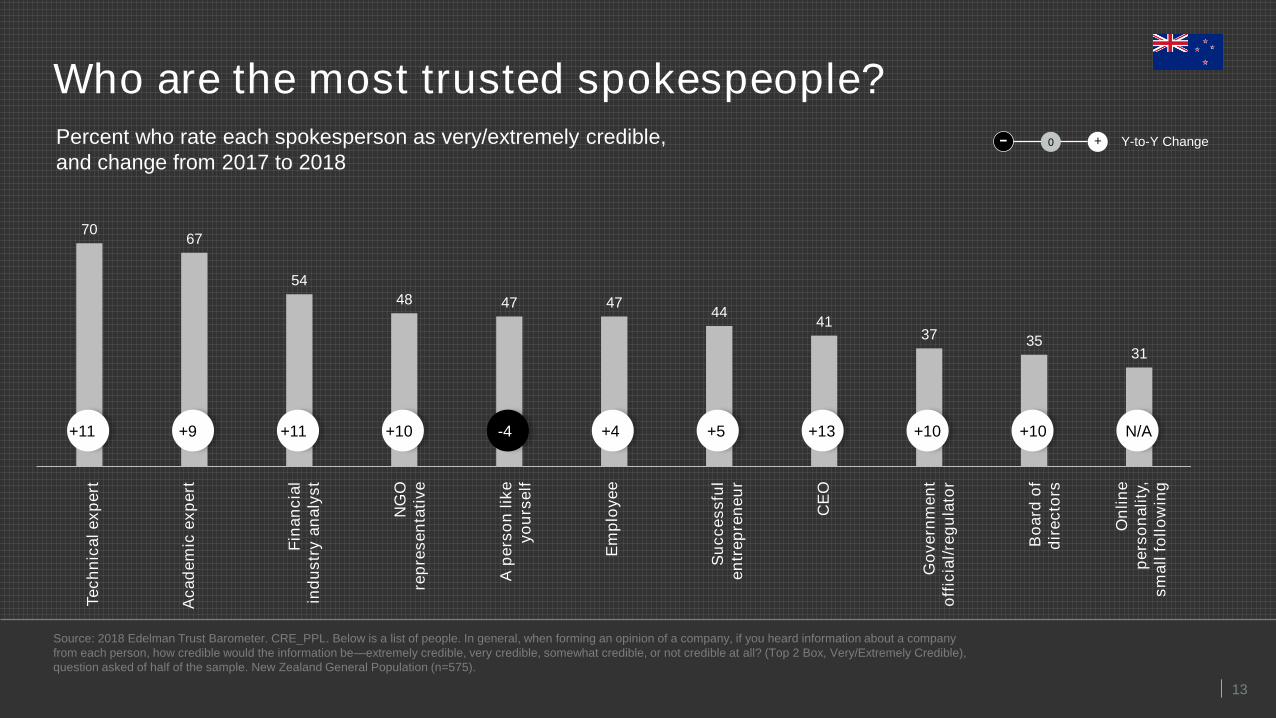
Source: 2018 Edelman Trust Barometer. CRE_PPL. Below is a list of people. In general, when forming an opinion of a company, if you heard information about a company
from each person, how credible would the information be—extremely credible, very credible, somewhat credible, or not credible at all? (Top 2 Box, Very/Extremely Credible),
question asked of half of the sample. New Zealand General Population (n=575).
13
Percent who rate each spokesperson as very/extremely credible,
and change from 2017 to 2018
Who are the most trusted spokespeople?
− Y-to-Y Change+0
Te
ch
nic
al e
xp
ert
Ac
ad
em
ic e
xp
ert
Fin
an
cia
l
ind
us
try a
na
lys
t
NG
O
rep
res
en
tati
ve
A p
ers
on
lik
e
yo
urs
elf
Em
plo
ye
e
Su
cc
es
sfu
l
en
tre
pre
ne
ur
CE
O
Go
ve
rnm
en
t
off
icia
l/re
gu
lato
r
Bo
ard
of
dir
ec
tors
On
lin
e
pe
rso
nali
ty,
sm
all
fo
llo
win
g

Source: 2018 Edelman Trust Barometer. Trust-building mandates Analysis. The most effective trust building mandates for each institution. INS_EXP_MED. Below is
a list of potential expectations or responsibilities that a social institution might have. Thinking about the media in general, how would you characterize each using the
following three-point scale. INS_PER_MED. How well do you feel the media is currently meeting this obligation to society? Please indicate your answer using the 5-
point scale below. (Top 2 Box, Performing well), question only asked of those codes 2 or 3 at the expectation question with data displayed only among code 3. New
Zealand General Population (n=1,150). For more details on the Trust-building mandates Analysis, please refer to the Technical Appendix.14
Top six trust-building mandates for
media, and percent who say the
media is performing well or very
well against them
The Mandates:
Media is Failing to
Meet Expectations
Trust-Building Mandates
Support
as a Mandate
Guard information quality 63%
Educate people on important issues 59%
Investigate wrongdoing 57%
Ensure people have information they
need to make good life decisions 51%
Protect privacy and personal
information 51%
Provide society with entertainment 42%
Mandate
Performance
26%
46%
44%
40%
22%
61%
15
NGOs and Trust Building Mandates

Source: 2018 Edelman Trust Barometer. Trust-building mandates Analysis. The most effective trust building mandates for each institution. INS_EXP_MED. Below is
a list of potential expectations or responsibilities that a social institution might have. Thinking about NGOs in general, how would you characterize each using the
following three-point scale. INS_PER_MED. How well do you feel NGOs are currently meeting this obligation to society? Please indicate your answer using the 5-
point scale below. (Top 2 Box, Performing well), question only asked of those codes 2 or 3 at the expectation question with data displayed only among code 3. New
Zealand General Population (n=1,150). For more details on the Trust-building mandates Analysis, please refer to the Technical Appendix.16
NGOs have
potential to step up
Top six trust-building mandates
for NGOs, and percent who
say NGOs are performing well
or very well against them
Trust-Building Mandates
Support
as a Mandate
Protect people’s privacy and
personal information 48%
Ensure even the poorest have
the minimum they need 46%
Work to ensure everyone has an
equal opportunity to succeed 44%
Be the champion of the ordinary
person 44%
Ensure people have information they
need to make good life decisions 41%
Improve and advance our quality
of life 41%
Mandate
Performance
34%
27%
34%
34%
39%
34%

17
Government and Trust Building Mandates

Source: 2018 Edelman Trust Barometer. ATT_STE. Please indicate which institution – Government, Media, Business or NGO’s – is best described by each
of the following statements? General population, 28-country global total and Australia.
18
Which institution is most likely to lead to a better future?
Government – the Path to a Better Future in New Zealand?
These figures exclude the “don’t knows”, hence does not add to 100
NGOs 19%
Business 23%
Media 6%30%
Government
Media 2%
Business 18%
NGOs 13%45%
Government

Source: 2018 Edelman Trust Barometer. Trust-building mandates Analysis. The most effective trust building mandates for each institution. INS_EXP_MED. Below is
a list of potential expectations or responsibilities that a social institution might have. Thinking about government in general, how would you characterize each using
the following three-point scale. INS_PER_MED. How well do you feel government are currently meeting this obligation to society? Please indicate your answer using
the 5-point scale below. (Top 2 Box, Performing well), question only asked of those codes 2 or 3 at the expectation question with data displayed only among code 3.
New Zealand General Population (n=1,150). For more details on the Trust-building mandates Analysis, please refer to the Technical Appendix.19
Six four trust-building mandates for
government, and percent who say
the government is performing well
or very well against them
Government trusted,
but has work to do
Trust-Building Mandates
Support
as a Mandate
Build schools, roads, hospital
and other infrastructure 80%
Drive the economic prosperity
of our country 76%
Ensure even the poorest have
the minimum they need 68%
Investigate wrongdoing 61%
Ensure future generations
are provided for 58%
Work to ensure everyone has
an equal opportunity to succeed 55%
Mandate
Performance
45%
41%
31%
38%
29%
32%

Business and Trust Building Mandates
20

Source: 2018 Edelman Trust Barometer. TMA_SIE_SHV. Please indicate how much you agree or disagree with the following statements. (Top 4 Box,
Agree), question asked of half of the sample. CEO_AGR. Thinking about CEOs, how strongly do you agree or disagree with the following statements?
(Top4 Box, Agree), question asked of half of the sample. General population, 28-country global total, New Zealand General Population (n=575).
21
Percent who agree that …
44%
Companies that only think
about themselves and their
profits are bound to fail
59%
CEOs are driven more by greed
than a desire to make a positive
difference in the world
Global:
56%
Global:
60%
Business Must
Show Commitment
to Long-Term

Source: 2018 Edelman Trust Barometer. Trust-building mandates Analysis. The most effective trust building mandates for each institution. INS_EXP_MED. Below is
a list of potential expectations or responsibilities that a social institution might have. Thinking about business in general, how would you characterize each using the
following three-point scale. INS_PER_MED. How well do you feel business are currently meeting this obligation to society? Please indicate your answer using the 5-
point scale below. (Top 2 Box, Performing well), question only asked of those codes 2 or 3 at the expectation question with data displayed only among code 3. New
Zealand General Population (n=1,150). For more details on the Trust-building mandates Analysis, please refer to the Technical Appendix.22
Business needs
to act on wider
societal issues
Six trust-building mandates for
business, and percent who say
business is performing well or
very well against them
Trust-Building Mandates
Support
as a Mandate
Protect people’s privacy and
personal information 63%
Keep people safe from physical
harm 48%
Drive the economic prosperity
of our country 47%
Ensure workers have necessary
skills to be competitive in the
global market 47%
Ensure there are plenty of
available job opportunities 43%
Foster an environment where
innovation can thrive 43%
Mandate
Performance
42%
47%
50%
36%
28%
42%

Source: 2018 Edelman Trust Barometer. CEO_AGR. Thinking about CEOs, how strongly do you agree or disagree with the following statements? (Top 4
Box, Agree), question asked of half of the sample. CEO_EXP. Below is a list of potential expectations that you might have for a company CEO. Thinking
about CEOs in general, whether they are global CEOs or a CEO who oversees a particular country, how would you characterise each using the following
three-point scale? (Most important responsibility, code 3), question asked of half of the sample. New Zealand General Population (n=575).23
Percent who agree and percent who say each is one of the most
important expectations they have for a CEO
Business Is Expected to Lead
Percent who say that CEOs
should take the lead on change
rather than waiting for
government to impose it
70
72
74
74
For CEOs, reflecting company values is job one
60%
Ensure their company is trusted
Business decisions reflect company values
Their products and services are high quality
Set high ethical standards

Source: 2018 Edelman Trust Barometer. Trust-Building Mandates Analysis. The most effective trust building mandates for each institution. INS_EXP_GOV;
INS_EXP_MED; INS_EXP_BUS; and INS_EXP_NGO. Below is a list of potential expectations or responsibilities that a social institution might have. Thinking
about [insert institution] in general, how would you characterize each using the following three-point scale. General population, 28-country global total. For more
details on the Trust Mandates Analysis, please refer to the Technical Appendix.24
Conclusion
1. Each Institution Plays
a Different Role
2. Each has different
mandates on which
to build trust
3. The Battle for Truth
affects all
NGOsProtect privacy of information
Ensuring poorest have the minimum
they need
Ensuring everyone has the
opportunity to succeed
BusinessProtect privacy of information
Keeping people safe
Foster prosperity
GovernmentBuild infrastructure
Foster economic prosperity
Ensuring poorest have the minimum they need
MediaGuard information quality
Educate people
Investigate wrongdoing

25
Winston Peters and Jacinda Ardern/TPPA protest © Stuff Limited