

2018 Annual Report - Macquarie Group
160
2018 Annual Report Macquarie Bank Year ended 31 March 2018 MACQUARIE BANK LIMITED ACN 008 583 542
Transcript of 2018 Annual Report - Macquarie Group
2018 Annual ReportMacquarie Bank
Year ended 31 March 2018
MACQUARIE BANK LIMITED ACN 008 583 542

2018 Annual General MeetingMacquarie Bank Limited’s 2018 Annual General Meeting (AGM) will be held in the Macquarie Auditorium, Level 10, 50 Martin Place, Sydney NSW 2000 after the Macquarie Group Limited AGM but not earlier than 2:00 pm on Thursday 26 July 2018.
Details of the business of the meeting will be contained in the Notice of Annual General Meeting, to be sent to securityholders separately.
Cover imageMacquarie has embraced new technologies to deliver superior client experiences, building a leading digital experience with personalised and intuitive features that are firsts in Australian banking. We built Australia’s first open banking platform to give our customers control over their own data and the power to securely manage how they want to share it, and last year launched DEFT AuctionPay – a real time digital payments service – which changes the way Australians buy property at auction.
The Macquarie name and Holey Dollar device are registered trade marks of Macquarie Group Limited ACN 122 169 279.
Macquarie Bank Limited is a subsidiary of Macquarie Group Limited ACN 122 169 279 and is regulated by the Australian Prudential Regulation Authority (APRA) as an authorised deposit-taking institution (ADI). Macquarie Group Limited is regulated by APRA as a non-operating holding company of an ADI.
Contents
Operating and Financial Review (OFR) 2
Directors’ Report 11Schedule 1 – Directors’ experience and special responsibilities 18Schedule 2 – Remuneration Report 24
Financial Report 41Contents 42Income Statements 43Statements of comprehensive income 44Statements of financial position 45Statements of changes in equity 46Statements of cash flows 48Notes to the financial statements 49Directors’ declaration 141Independent auditor’s report 142
Further Information 147Additional investor information 148Glossary 152

2 macquarie.com2018 Annual ReportMacquarie Bank Limited and its subsidiaries
1OPERATING AND FINANCIAL REVIEW
2
3FURTHER INFORMATIONOFR DIRECTORS’ REPORT FINANCIAL REPORT
OPERATING AND FINANCIAL REVIEWREVIEW OF PERFORMANCE AND FINANCIAL POSITION
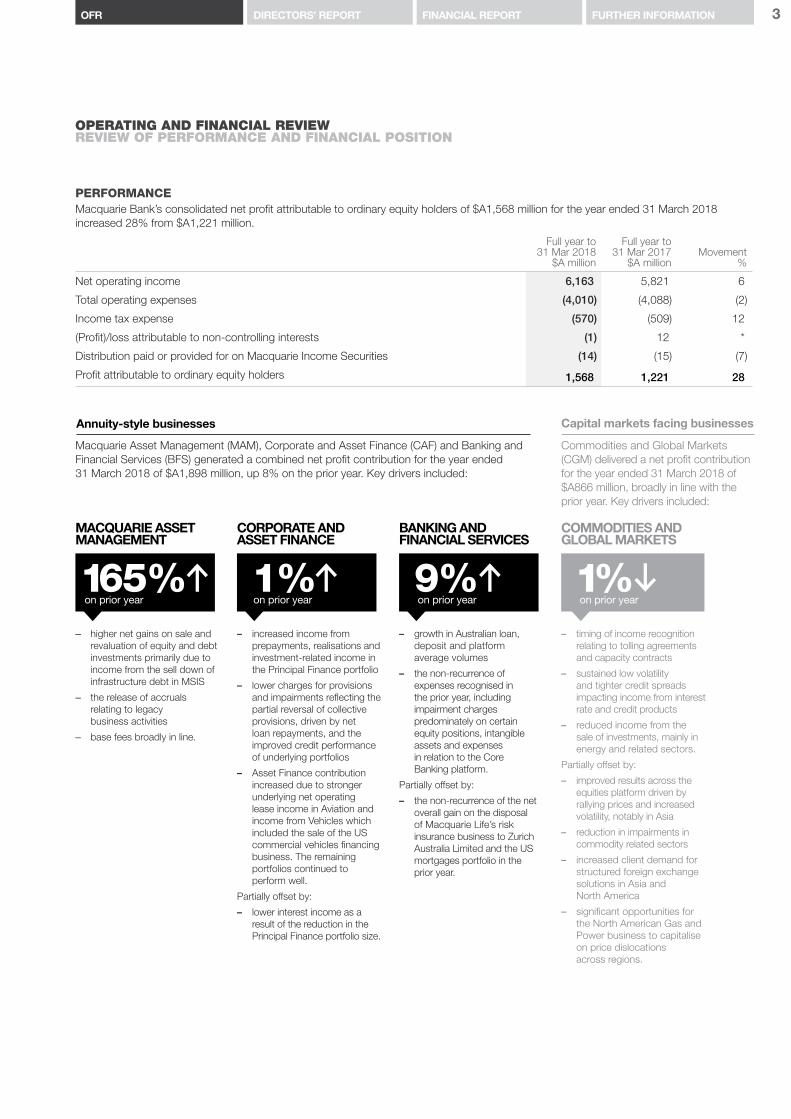
Macquarie Bank’s consolidated net profit attributable to ordinary equity holders of $A1,568 million for the year ended 31 March 2018 increased 28% from $A1,221 million.
Full year to31 Mar 2018
$A million
Full year to31 Mar 2017
$A millionMovement
%
Net operating income 6,163 5,821 6
Total operating expenses (4,010) (4,088) (2)
Income tax expense (570) (509) 12
(Profit)/loss attributable to non-controlling interests (1) 12 *
Distribution paid or provided for on Macquarie Income Securities (14) (15) (7)
Profit attributable to ordinary equity holders 1,568 1,221 28
PERFORMANCE
MACQUARIE ASSET MANAGEMENT
CORPORATE AND ASSET FINANCE
BANKING AND FINANCIAL SERVICES
COMMODITIES AND GLOBAL MARKETS
165% 1% 9% 1% – higher net gains on sale and
revaluation of equity and debt investments primarily due to income from the sell down of infrastructure debt in MSIS
– the release of accruals relating to legacy business activities
– base fees broadly in line.
– increased income from prepayments, realisations and investment-related income in the Principal Finance portfolio
– lower charges for provisions and impairments reflecting the partial reversal of collective provisions, driven by net loan repayments, and the improved credit performance of underlying portfolios
– Asset Finance contribution increased due to stronger underlying net operating lease income in Aviation and income from Vehicles which included the sale of the US commercial vehicles financing business. The remaining portfolios continued to perform well.
Partially offset by:
– lower interest income as a result of the reduction in the Principal Finance portfolio size.
– growth in Australian loan, deposit and platform average volumes
– the non-recurrence of expenses recognised in the prior year, including impairment charges predominately on certain equity positions, intangible assets and expenses in relation to the Core Banking platform.
Partially offset by:
– the non-recurrence of the net overall gain on the disposal of Macquarie Life’s risk insurance business to Zurich Australia Limited and the US mortgages portfolio in the prior year.
– timing of income recognition relating to tolling agreements and capacity contracts
– sustained low volatility and tighter credit spreads impacting income from interest rate and credit products
– reduced income from the sale of investments, mainly in energy and related sectors.
Partially offset by:
– improved results across the equities platform driven by rallying prices and increased volatility, notably in Asia
– reduction in impairments in commodity related sectors
– increased client demand for structured foreign exchange solutions in Asia and North America
– significant opportunities for the North American Gas and Power business to capitalise on price dislocations across regions.
Annuity-style businesses Capital markets facing businesses
Macquarie Asset Management (MAM), Corporate and Asset Finance (CAF) and Banking and Financial Services (BFS) generated a combined net profit contribution for the year ended 31 March 2018 of $A1,898 million, up 8% on the prior year. Key drivers included:
Commodities and Global Markets (CGM) delivered a net profit contribution for the year ended 31 March 2018 of $A866 million, broadly in line with the prior year. Key drivers included:
on prior year on prior year on prior year on prior year

4 macquarie.com2018 Annual ReportMacquarie Bank Limited and its subsidiaries
Net operating incomeNet operating income of $A6,163 million for the year ended 31 March 2018 increased 6% from $A5,821 million in the prior year. The result included lower charges for impairments and provisions and increased fee and commission income, partially offset by lower investment income.
Key drivers included:
Net interest and trading income Fee and commission income
Full year to31 Mar 2018$A million
31 Mar 2017$A million
3,899 3,837 2% on prior year
Full year to31 Mar 2018$A million
31 Mar 2017$A million
890 820 9% on prior year
– growth in average Australian loan portfolio and deposit volumes in BFS
– lower costs of holding long-term liquidity and the impact of accounting volatility on economically hedged positions that do not qualify for hedge accounting in Corporate
– significant opportunities for the North American Gas and Power business to capitalise on price dislocations across regions in CGM.
Offset by:
– lower interest income as a result of the reduction in the Principal Finance portfolio in CAF
– sustained low volatility and tighter credit spreads impacting income from interest rate and credit products and timing of income recognition relating to tolling agreements and capacity contracts in CGM
– impact of Australian Government Major Bank Levy.
– increase driven by demand for advisory and structured products, primarily in Asia and North America in CGM.
Net operating lease income Share of net profits/(losses) of associates and joint ventures accounted for using the equity method
Full year to31 Mar 2018$A million
31 Mar 2017$A million
937 922 2% on prior year
Full year to31 Mar 2018$A million
31 Mar 2017$A million
22 (19) significantly
on prior year – improved underlying income from the Aviation, Energy
and Technology portfolios in CAF. – increase includes CGM’s share of net profits from
equity investments
– non-recurrence of equity accounted losses recognised in the prior year in Corporate, reflecting the reclassification of non-core assets to investments held for sale that were subsequently disposed of during the current year.
Other operating income and charges
Full year to31 Mar 2018$A million
31 Mar 2017$A million
415 26159%
on prior year – lower charges for provisions and impairments
across most Operating Groups due to improved credit conditions
– the release of accruals related to legacy business activities as well as higher revenue for MSIS Retail in MAM, as well as the sale of certain CAF Principal Finance assets in the US.
Partially offset by:
– lower investment income mainly due to the non-recurrence of gains in the prior year including the sale of Macquarie Life’s risk insurance business to Zurich Australia Limited in BFS and the sale of a number of investments in the energy and related sectors in CGM. This was partially offset by the sell down of infrastructure debt in MAM in the current year.
OPERATING AND FINANCIAL REVIEWREVIEW OF PERFORMANCE AND FINANCIAL POSITION CONTINUED
5FURTHER INFORMATIONOFR DIRECTORS’ REPORT FINANCIAL REPORT
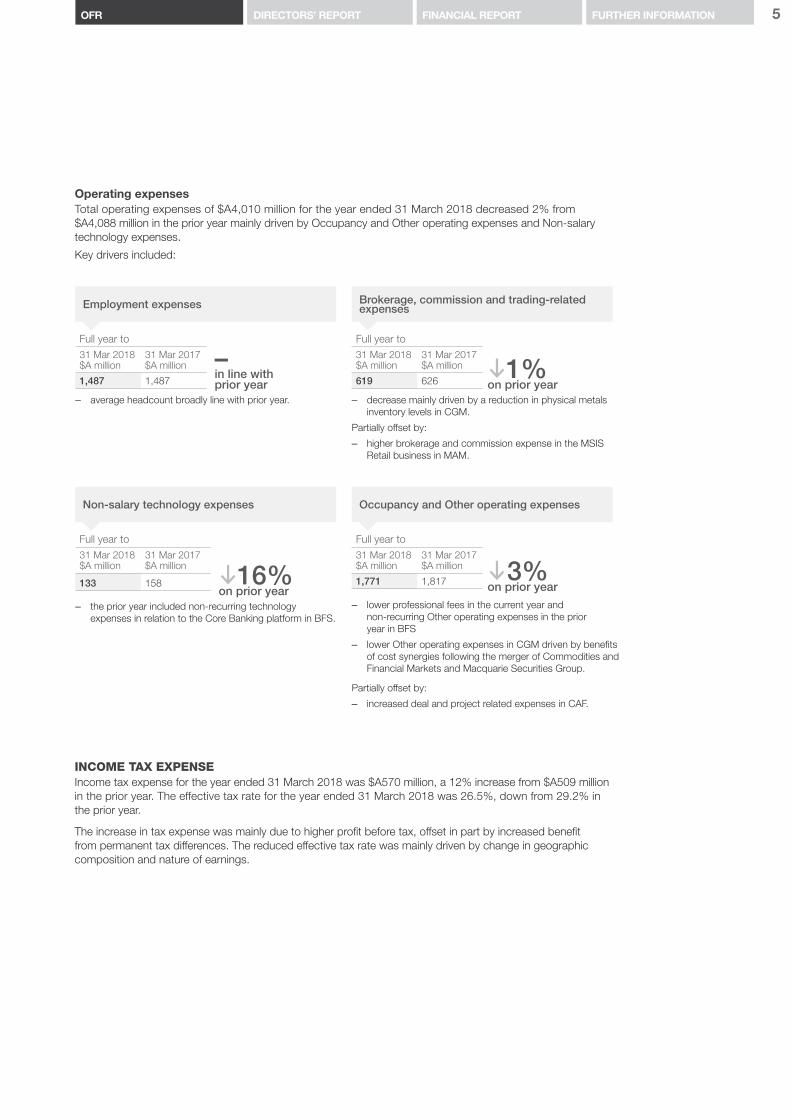
Operating expensesTotal operating expenses of $A4,010 million for the year ended 31 March 2018 decreased 2% from $A4,088 million in the prior year mainly driven by Occupancy and Other operating expenses and Non-salary technology expenses.
Key drivers included:
Employment expenses Brokerage, commission and trading-related expenses
Full year to31 Mar 2018$A million
31 Mar 2017$A million
1,487 1,487
– in line with prior year
Full year to31 Mar 2018$A million
31 Mar 2017$A million
619 626 1% on prior year
– average headcount broadly line with prior year. – decrease mainly driven by a reduction in physical metals inventory levels in CGM.
Partially offset by:
– higher brokerage and commission expense in the MSIS Retail business in MAM.
Non-salary technology expenses Occupancy and Other operating expenses
Full year to31 Mar 2018$A million
31 Mar 2017$A million
133 158 16% on prior year
Full year to31 Mar 2018$A million
31 Mar 2017$A million
1,771 1,817 3% on prior year
– the prior year included non-recurring technology expenses in relation to the Core Banking platform in BFS.
– lower professional fees in the current year and non-recurring Other operating expenses in the prior year in BFS
– lower Other operating expenses in CGM driven by benefits of cost synergies following the merger of Commodities and Financial Markets and Macquarie Securities Group.
Partially offset by:
– increased deal and project related expenses in CAF.
INCOME TAX EXPENSEIncome tax expense for the year ended 31 March 2018 was $A570 million, a 12% increase from $A509 million in the prior year. The effective tax rate for the year ended 31 March 2018 was 26.5%, down from 29.2% in the prior year.
The increase in tax expense was mainly due to higher profit before tax, offset in part by increased benefit from permanent tax differences. The reduced effective tax rate was mainly driven by change in geographic composition and nature of earnings.

6 macquarie.com2018 Annual ReportMacquarie Bank Limited and its subsidiaries
FINANCIAL POSITION
Total Assets Total Liabilities
As at31 Mar 2018$A billion
31 Mar 2017$A billion
173.2 167.4 3% on prior year
As at31 Mar 2018$A billion
31 Mar 2017$A billion
160.1 154.9 3% on prior year
– Receivables from financial institutions of $A36.6 billion at 31 March 2018 increased 43% from $A25.6 billion at 31 March 2017 mainly due to an increase in stock borrowing and reverse repurchase trades in CGM driven by short term funding opportunities and client flow
– Loan assets held at amortised cost of $A80.1 billion at 31 March 2018 increased 6% from $A75.6 billion at 31 March 2017 mainly due to net new loans written in BFS’ mortgages and business lending portfolios, and an increase in CGM’s lending in the Fixed Income and Currencies and Futures businesses. This was partially offset by a decrease of 8% in CAF’s loan and finance lease portfolio to $A24.1 billion at 31 March 2018 from $A26.3 billion at 31 March 2017 mainly in Principal Finance
– Other assets of $A9.3 billion at 31 March 2018 increased 7% from $A8.6 billion at 31 March 2017 mainly due to an increase in unsettled trade balances in CGM and Held for sale investments in CAF. The receivable following the sale of the Canadian mortgages portfolio in BFS in the prior year was partially offset by the receivable on the sale of CAF’s US commercial vehicles financing business in the current year
– Derivative assets of $A12.7 billion at 31 March 2018 increased 5% from $A12.1 billion at 31 March 2017 mainly due an increase in US Gas derivatives due to the acquisition of Cargill and positive price movements on energy derivatives in CGM
– Interests in associates and joint ventures accounted for using the equity method of $A0.7 billion increased significantly from $A0.2 billion at 31 March 2017 mainly due to an additional investment by CAF, which resulted in the reclass of an investment from Available for sale to Associate
– Trading portfolio assets of $A14.9 billion at 31 March 2018 decreased 44% from $A26.6 billion at 31 March 2017 mainly due to a decrease in long equity positions and a reduction in the holdings of physical commodities and volume of oil cargo contracts.
– Due to related body corporate entities of $A14.0 billion at 31 March 2018 increased 90% from $A7.4 billion at 31 March 2017 mainly due to new non-bank debt issuances placed by MGL and other entities with MBL
– Trading portfolio liabilities of $A7.9 billion at 31 March 2018 increased 61% from $A4.9 billion at 31 March 2017 mainly due to an increase in short equity positions
– Deposits of $A59.4 billion at 31 March 2018 increased 3% from $A57.7 billion at 31 March 2017 mainly due to an increase in transaction and savings accounts and business deposit volumes
– Derivative liabilities of $A11.8 billion increased 6% from $A11.1 billion at 31 March 2017 reflecting increased activity in CGM’s Commodity business
– Debt issued at amortised cost of $A39.7 billion at 31 March 2018 decreased 8% from $A43.1 billion at 31 March 2017, mainly driven by a reduction in CAF leasing facilities and bond repayments in BFS Mortgages. This was partially offset by Treasury’s funding and liquidity management activities which included a US commercial paper issuance
– Payables to financial institutions of $A11.7 billion at 31 March 2018 decreased 18% from $A14.2 billion at 31 March 2017 mainly due to a net repayment of Treasury funding facilities and a decrease in cash collateral on securities lent in CGM
– Other liabilities of $A8.8 billion at 31 March 2018 decreased 6% from $A9.4 billion at 31 March 2017 mainly due a decrease in unsettled trade balances in CGM
– Loan capital of $A4.3 billion decreased 8% from $A4.6 billion mainly due to the redemption of Exchangeable Capital Securities notes during the year.
Total Equity
As at31 Mar 2018$A billion
31 Mar 2017$A billion
13.1 12.6 4% on prior year
– The increase was mainly due to the retained earnings generated during the year ended 31 March 2018 (net of dividends paid), partially offset by a decrease in the Available for sale reserve due to the reclassification of investments from Available for sale to Associates during the year ended 31 March 2018.
Balance sheetMacquarie Bank’s statement of financial position has been impacted by changes in business activities and Treasury management initiatives during the year ended 31 March 2018.
OPERATING AND FINANCIAL REVIEWREVIEW OF PERFORMANCE AND FINANCIAL POSITION CONTINUED
7FURTHER INFORMATIONOFR DIRECTORS’ REPORT FINANCIAL REPORT
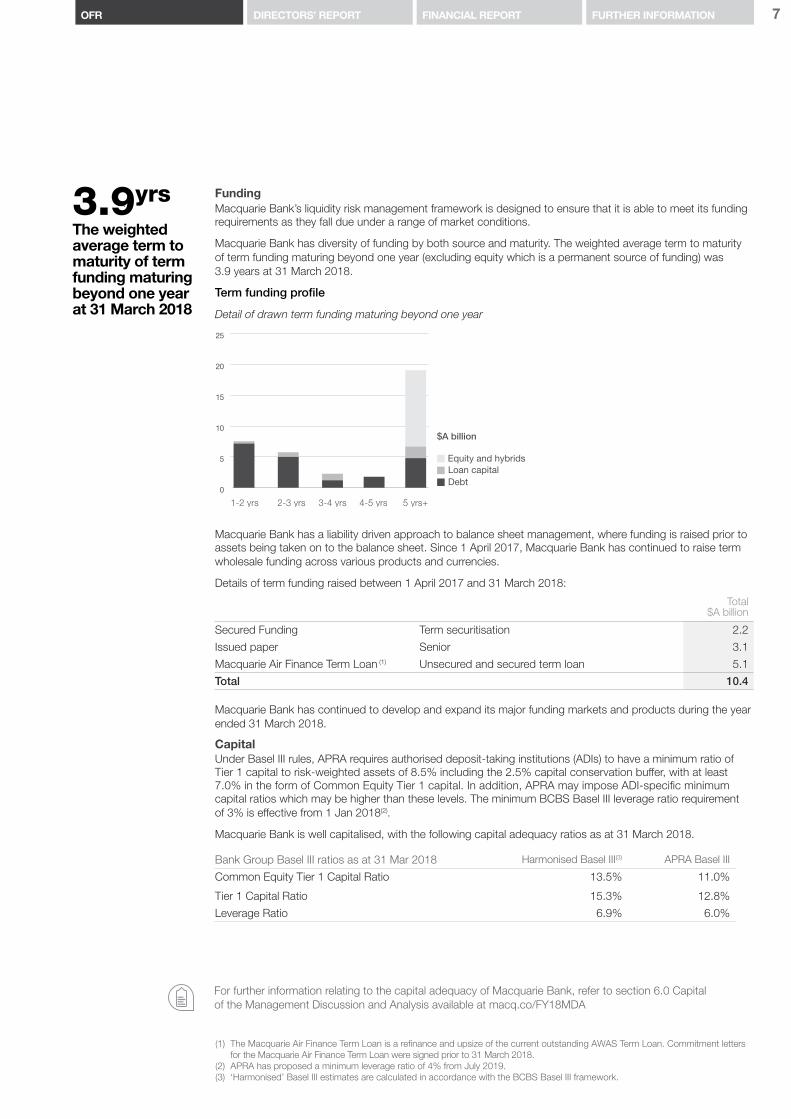
3.9yrsThe weighted average term to maturity of term funding maturing beyond one year at 31 March 2018
FundingMacquarie Bank’s liquidity risk management framework is designed to ensure that it is able to meet its funding requirements as they fall due under a range of market conditions.
Macquarie Bank has diversity of funding by both source and maturity. The weighted average term to maturity of term funding maturing beyond one year (excluding equity which is a permanent source of funding) was 3.9 years at 31 March 2018.
Term funding profile
Detail of drawn term funding maturing beyond one year
1-2 yrs 2-3 yrs 3-4 yrs 4-5 yrs 5 yrs+
Loan capitalEquity and hybrids
Debt
$A billion
0
5
10
15
20
25
Macquarie Bank has a liability driven approach to balance sheet management, where funding is raised prior to assets being taken on to the balance sheet. Since 1 April 2017, Macquarie Bank has continued to raise term wholesale funding across various products and currencies.
Details of term funding raised between 1 April 2017 and 31 March 2018:
Total$A billion
Secured Funding Term securitisation 2.2
Issued paper Senior 3.1
Macquarie Air Finance Term Loan (1) Unsecured and secured term loan 5.1
Total 10.4
Macquarie Bank has continued to develop and expand its major funding markets and products during the year ended 31 March 2018.
CapitalUnder Basel III rules, APRA requires authorised deposit-taking institutions (ADIs) to have a minimum ratio of Tier 1 capital to risk-weighted assets of 8.5% including the 2.5% capital conservation buffer, with at least 7.0% in the form of Common Equity Tier 1 capital. In addition, APRA may impose ADI-specific minimum capital ratios which may be higher than these levels. The minimum BCBS Basel III leverage ratio requirement of 3% is effective from 1 Jan 2018(2).
Macquarie Bank is well capitalised, with the following capital adequacy ratios as at 31 March 2018.
Bank Group Basel III ratios as at 31 Mar 2018 Harmonised Basel III(3) APRA Basel III
Common Equity Tier 1 Capital Ratio 13.5% 11.0%
Tier 1 Capital Ratio 15.3% 12.8%
Leverage Ratio 6.9% 6.0%
For further information relating to the capital adequacy of Macquarie Bank, refer to section 6.0 Capital of the Management Discussion and Analysis available at macq.co/FY18MDA
(1) The Macquarie Air Finance Term Loan is a refinance and upsize of the current outstanding AWAS Term Loan. Commitment letters for the Macquarie Air Finance Term Loan were signed prior to 31 March 2018.
(2) APRA has proposed a minimum leverage ratio of 4% from July 2019.(3) ‘Harmonised’ Basel III estimates are calculated in accordance with the BCBS Basel III framework.
MBL

8 macquarie.com2018 Annual ReportMacquarie Bank Limited and its subsidiaries
The Code of conduct is available at macquarie.com/what-we-stand-for
Our Purpose
What We Stand For
Our Business Strategy
Risk management approach Adopting a conservative approach to risk management. Macquarie Bank’s robust risk management framework is embedded across all Bank Group entities. This equips the business for unanticipated disruptions with the objective of ensuring that both the relevant business and Macquarie Bank can survive a worst case outcome from any existing or new activity.
Strong balance sheetMaintaining a strong and conservative balance sheet.
This is consistent with Macquarie Bank’s longstanding policy of holding a level of capital which supports its business and managing its capital base ahead of ordinary business requirements. Macquarie Bank remains well funded, with diversified funding sources, including deposits.
We continue to pursue the strategy of diversifying funding sources by growing our deposit base and accessing different funding markets.
Opportunity, Accountability and Integrity. These long-held principles form the basis of Macquarie Group’s expectations of our staff and adherence to them is required under the Code of conduct.
The balance between opportunity and accountability, while operating with integrity within a strong risk management framework, is a feature of Macquarie Group’s success and a key factor in our long record of unbroken profitability.
Business mix Conducting a mix of annuity-style and capital markets facing businesses that deliver solid returns in a range of market conditions.
Macquarie Bank has dynamically developed its annuity-style businesses, providing steady returns to the business and our shareholders, and certainty to clients.
DiversificationOperating a diversified set of businesses across different locations and service offerings: asset finance, lending, banking, and risk and capital solutions across debt, equity and commodities.
Macquarie Bank offers a range of services to government, institutional, corporate and retail clients. This diversity mitigates concentration risk and provides resilience to Macquarie Bank, as highlighted by Macquarie Bank’s results in the challenging global markets of recent years.
Proven expertiseUtilising proven deep expertise has allowed Macquarie Bank to establish leading market positions as a global specialist in sectors including resources and commodities, energy, financial institutions and real estate. This is coupled with deep knowledge of Asia-Pacific financial markets.
Adjacencies Expanding progressively by pursuing adjacencies through organic opportunities and selective acquisitions.
These include products and geographies adjacent to our established areas of expertise. This results in sustainable evolutionary growth.
Pursuit of growth opportunitiesTargeting continued evolution and growth through innovation. We start with real knowledge and skill, and we encourage ingenuity and entrepreneurial spirit coupled with accountability.
Ideas for new businesses are typically generated in the Operating Groups. Additionally, there are no specific businesses, markets or regions in which our strategy demands we operate. This means we retain operational flexibility and can adapt the portfolio mix to changing market conditions within the boundaries of the Risk Appetite Statement (RAS) approved by the Board.
Consistent with our What We Stand For principles, Macquarie Bank adopts a business strategy focused on the medium-term. It is consistent with the Macquarie Group business strategy and approach. Key aspects include:
Macquarie Bank’s purpose is to realise opportunity for the benefit of our clients, shareholders and staff. We are in business to be profitable and to achieve an appropriate and resilient long-term return on capital. Ultimately though, it is the way we do business that defines Macquarie Bank.
OPERATING AND FINANCIAL REVIEWOUR STRATEGY

9FURTHER INFORMATIONOFR DIRECTORS’ REPORT FINANCIAL REPORT
Macquarie Bank recognises that a sound risk culture is a fundamental requirement of an effective risk management framework. Macquarie Bank’s risk culture is well established and the risk management framework is embedded across all operations.
The long-held foundations of Macquarie Bank’s risk culture are the principles of What We Stand For:
The key macroeconomic risks to Macquarie Bank’s short and medium-term financial outlook noted on page 10 are:
Market conditionsThe general condition of markets, driven mainly by macroeconomic factors, will influence the volume of transactions that businesses experience. For example, an increase in market volatility may increase the income CGM derives from hedging transactions performed on behalf of clients. Market conditions can also influence the value of various credit, market and equity risk exposures held by Macquarie Bank.
The value of the Australian dollarA significant proportion of Macquarie Bank’s net income is denominated in foreign currency. Therefore, net income will be lower in Australian dollar terms if it appreciates against these currencies.
Potential regulatory changesMacquarie Bank, like all financial institutions, is affected by changes in regulation. Regulatory change, particularly for banks, continues to be developed at both the global and Australian levels and has the potential to affect the capital adequacy, funding and profitability of businesses.
Funding and liquidityMacquarie Bank uses deposits and debt markets to fund its assets. Macquarie Bank is therefore exposed to the risk of an increase in the cost of funding, or of reduced access to funding sources, which could affect the volume of income earning assets and the margin earned on those assets.
IntegrityWe earn the trust of our clients, colleagues, community and shareholders through the quality of our work and our high ethical standards.
AccountabilityWe are accountable for all our actions, to our clients, our community, our shareholders and each other.
OpportunityWe seek to identify opportunity and realise it for our clients, community, shareholders and our people.
Risk Management Macroeconomic factors
In addition, there are specific risks which relate to the nature of Macquarie Bank’s operations. These include conduct, credit, cyber and information security, data, environmental and social (including climate change), equity, legal, liquidity, market, model, operational, regulatory and compliance, reputation and tax risks. All of these risks, including those mentioned above are monitored, mitigated and managed under Macquarie Bank’s risk management framework.
Further details on the management of these risks are available at macquarie.com/risk-management
Staff are made aware that these principles must form the basis of all behaviours and actions.
The acceptance of risk is an integral part of Macquarie Bank’s businesses. Strong independent prudential management has been a key to Macquarie Bank’s success and stability over many years. The assumption of risk is made within a calculated and controlled framework that assigns clear risk roles and responsibilities.
Refer to the Risk Management Report in the MGL Annual Report for details on Macquarie Group’s risk management framework, risk culture and conduct risk management, which apply to all Macquarie Group businesses including the Bank Group entities.

10 macquarie.com2018 Annual ReportMacquarie Bank Limited and its subsidiaries
– Ownership of risk at the business level: Group Heads are responsible for identifying risks within their businesses and ensuring appropriate management. Before taking decisions, clear analysis of the risks is sought to ensure risks taken are consistent with the risk appetite and strategy of the Bank Group entities.
– Understanding worst case outcomes: Highly experienced professionals use both quantitative and qualitative inputs to examine the consequences of worst case outcomes and determine whether these are acceptable. This approach is adopted for all material risk types and is often achieved by stress testing. In particular, the market risk management framework is based primarily on the application of stress tests, rather than statistical models. Macquarie Bank applies limits to contingent losses from worst case scenarios that include market movements larger than have occurred historically. For example, an instantaneous 40% gap move in stock prices. These limits effectively constrain position taking by divisions trading in products where the current risk appears low but potential risk exists in extreme loss events. Macquarie Bank has over 15,000 contingent loss limits that consider a variety of worst case scenarios.
– Requirement for an independent sign-off by risk management: Macquarie Bank places significant importance on having a strong, independent RMG charged with signing off all material risk acceptance decisions. It is essential that RMG has the capability to do this effectively. RMG has invested in recruiting skilled professionals, many with previous banking or trading experience. For all material proposals, RMG’s opinion is sought at an early stage in the decision-making process. The approval document submitted to Senior Management includes independent input from RMG on risk and return.
OUTLOOKMacquarie Bank currently expects that the combined net profit contribution from Operating Groups for the financial year ending 31 March 2019 will be broadly in line with the financial year ended 31 March 2018.
The tax rate for the financial year ending 31 March 2019 is currently expected to be broadly in line with the financial year ended 31 March 2018.
Macquarie Bank’s short-term outlook remains subject to market conditions, the impact of foreign exchange, potential regulatory changes and tax uncertainties and the geographic composition of income.
Macquarie Bank remains well positioned to deliver superior performance in the medium-term due to: its deep expertise in major markets; strength in diversity and ability to adapt its portfolio mix to changing market conditions; the ongoing benefits of continued cost initiatives; a strong and conservative balance sheet; and a proven risk management framework and culture.
The core risk management principles underlying the framework have remained stable and continue to be effective.
OPERATING AND FINANCIAL REVIEWRISK MANAGEMENT CONTINUED
The risk management framework has been established on the premise that a disciplined approach to risk management is best maintained with a single risk management framework located within Macquarie Group that applies to all Macquarie businesses (including Bank Group entities). The framework is supported by a Macquarie-wide approach to policies and procedures. Macquarie Bank adopts policies, procedures and risk limits in accordance with the risk profile of each Bank Group entity.
The Risk Management Group (RMG) consistently adopts the same level of rigour in relation to risk acceptance, monitoring and reporting for all Macquarie entities.

11
Directors’ ReportSchedule 1 – Directors’ experience and special responsibilitiesSchedule 2 – Remuneration Report
DIRECTORS’ REPORT
2DIRECTORS’ REPORT
FURTHER INFORMATIONFINANCIAL REPORTOFR
12 macquarie.com2018 Annual ReportMacquarie Bank Limited and its subsidiaries
DIRECTORS’ REPORT FOR THE FINANCIAL YEAR ENDED 31 MARCH 2018
The Directors of MBL submit their report with the financial report of the Consolidated Entity and the Company for the year ended 31 March 2018.
DIRECTORSAt the date of this report, the Directors of MBL are:
Independent DirectorsP.H. Warne, Chairman
G.R. Banks AO
G.M. Cairns
M.J. Coleman
P.A. Cross
D.J. Grady AM
M.J. Hawker AM
G.R. Stevens AC
N.M. Wakefield Evans
Executive Voting DirectorsM.J. Reemst, Managing Director and Chief Executive Officer (CEO)
N.W. Moore
Other than Mr Stevens, the Directors listed above each held office as a Director of MBL throughout the financial year ended 31 March 2018. Mr Stevens became a director effective from 1 November 2017. Those Directors listed as Independent Directors have been independent throughout the period of their appointment.
Details of the qualifications, experience and special responsibilities of the Directors and qualifications and experience of the Company Secretaries at the date of this report are set out in Schedule 1 at the end of this report.
PRINCIPAL ACTIVITIESThe principal activity of MBL during the financial year ended 31 March 2018 was to act as a full service financial services provider offering a range of commercial banking and retail financial services in Australia and selected financial services offshore. MBL is a subsidiary of MGL and is regulated by the APRA as an authorised deposit-taking institution (ADI). In the opinion of the Directors, there were no significant changes to the principal activities of the Consolidated Entity during the financial year under review that are not otherwise disclosed in this report.
RESULTThe financial report for the financial years ended 31 March 2018 and 31 March 2017, and the results have been prepared in accordance with Australian Accounting Standards.
The consolidated profit after income tax attributable to ordinary equity holders for the financial year ended 31 March 2018 was $A1,568 million (2017: $A1,221 million). This result represents profit from continuing operations of $A1,568 million (2017:$A1,221 million) and profit from discontinued operations of $A nil million (2017:$A nil million).

13FURTHER INFORMATIONOFR DIRECTORS’ REPORT FINANCIAL REPORT
Directors’ ReportSchedule 1 – Directors’ experience and special responsibilitiesSchedule 2 – Remuneration Report
DIVIDENDS AND DISTRIBUTIONSMBL paid dividends and paid or provided distributions during the financial year as set out in the table below:
Security Payment Date Payment Type $A million In respect of financial year ended/period
Ordinary Shares 11 May 2017 Final 607.0 31 March 2017 Paid
8 November 2017 Interim 603.0 31 March 2018 Paid
Macquarie Income Securities (MIS)(1)
18 April 2017 Periodic 3.4 15 January 2017 to 14 April 2017
Paid
17 July 2017 Periodic 3.5 15 April 2017 to 14 July 2017
Paid
16 October 2017 Periodic 3.4 15 July to 14 October 2017
Paid
15 January 2018 Periodic 3.4 15 October 2017 to 14 January 2018
Paid
16 April 2018 Periodic 2.9 15 January 2018 to 31 March 2018
Provided
Subsequent to the year ended 31 March 2018 the Directors have resolved to pay a final ordinary dividend of $A924 million on 16 May 2018.
No other dividends or distributions were declared or paid during the financial year.
STATE OF AFFAIRSThere were no other significant changes in the state of affairs of the Consolidated Entity that occurred during the financial year under review that are not otherwise disclosed in this report.
OPERATING AND FINANCIAL REVIEWPlease refer to Section 1 of this Annual Report for the following in respect of the Consolidated Entity, which includes:
– a review of the operations during the year and the results of those operations
– likely developments in the operations in future financial years and the expected results of those operations
– comments on the financial position – comments on business strategies and prospects for future
financial years.
In respect of likely developments, business strategies and prospects for future financial years, material which if included would be likely to result in unreasonable prejudice to the Consolidated Entity, has been omitted.
(1) MIS are stapled securities comprising an interest in a note, being an unsecured debt obligation of Macquarie Finance Limited (MFL), issued to a trustee on behalf of the holders of the MIS (MFL note), and a preference share in MBL. The MIS are quoted on the ASX. The MIS distributions set out above represent payment as made, or to be made, by MBL to its members. The MIS are classified as equity under Australian Accounting Standards – see Note 27 and Note 28 to the financial statements in the Financial Report for further information on the MIS and MIS distributions.
14 macquarie.com2018 Annual ReportMacquarie Bank Limited and its subsidiaries
DIRECTORS’ REPORT FOR THE FINANCIAL YEAR ENDED 31 MARCH 2018CONTINUED
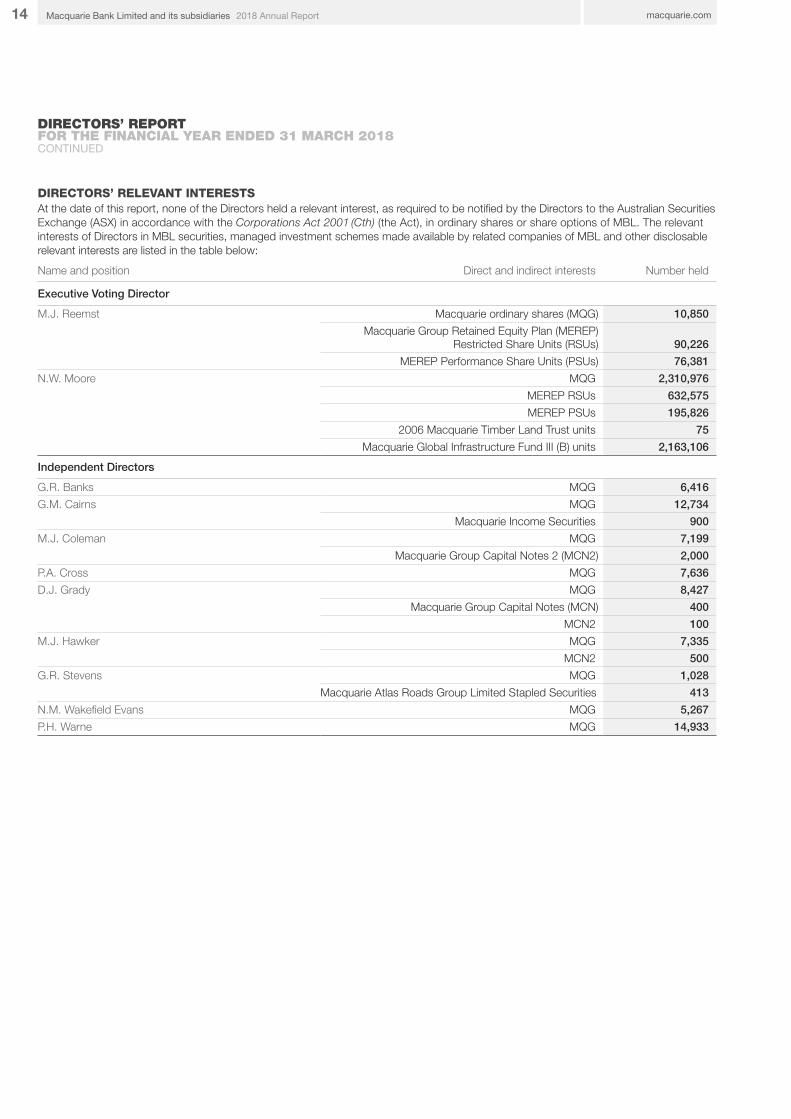
DIRECTORS’ RELEVANT INTERESTSAt the date of this report, none of the Directors held a relevant interest, as required to be notified by the Directors to the Australian Securities Exchange (ASX) in accordance with the Corporations Act 2001 (Cth) (the Act), in ordinary shares or share options of MBL. The relevant interests of Directors in MBL securities, managed investment schemes made available by related companies of MBL and other disclosable relevant interests are listed in the table below:
Name and position Direct and indirect interests Number held
Executive Voting Director
M.J. Reemst Macquarie ordinary shares (MQG) 10,850
Macquarie Group Retained Equity Plan (MEREP)Restricted Share Units (RSUs) 90,226
MEREP Performance Share Units (PSUs) 76,381
N.W. Moore MQG 2,310,976
MEREP RSUs 632,575
MEREP PSUs 195,826
2006 Macquarie Timber Land Trust units 75
Macquarie Global Infrastructure Fund III (B) units 2,163,106
Independent Directors
G.R. Banks MQG 6,416
G.M. Cairns MQG 12,734
Macquarie Income Securities 900
M.J. Coleman MQG 7,199
Macquarie Group Capital Notes 2 (MCN2) 2,000
P.A. Cross MQG 7,636
D.J. Grady MQG 8,427
Macquarie Group Capital Notes (MCN) 400
MCN2 100
M.J. Hawker MQG 7,335
MCN2 500
G.R. Stevens MQG 1,028
Macquarie Atlas Roads Group Limited Stapled Securities 413
N.M. Wakefield Evans MQG 5,267
P.H. Warne MQG 14,933
15FURTHER INFORMATIONOFR DIRECTORS’ REPORT FINANCIAL REPORT
Directors’ ReportSchedule 1 – Directors’ experience and special responsibilitiesSchedule 2 – Remuneration Report
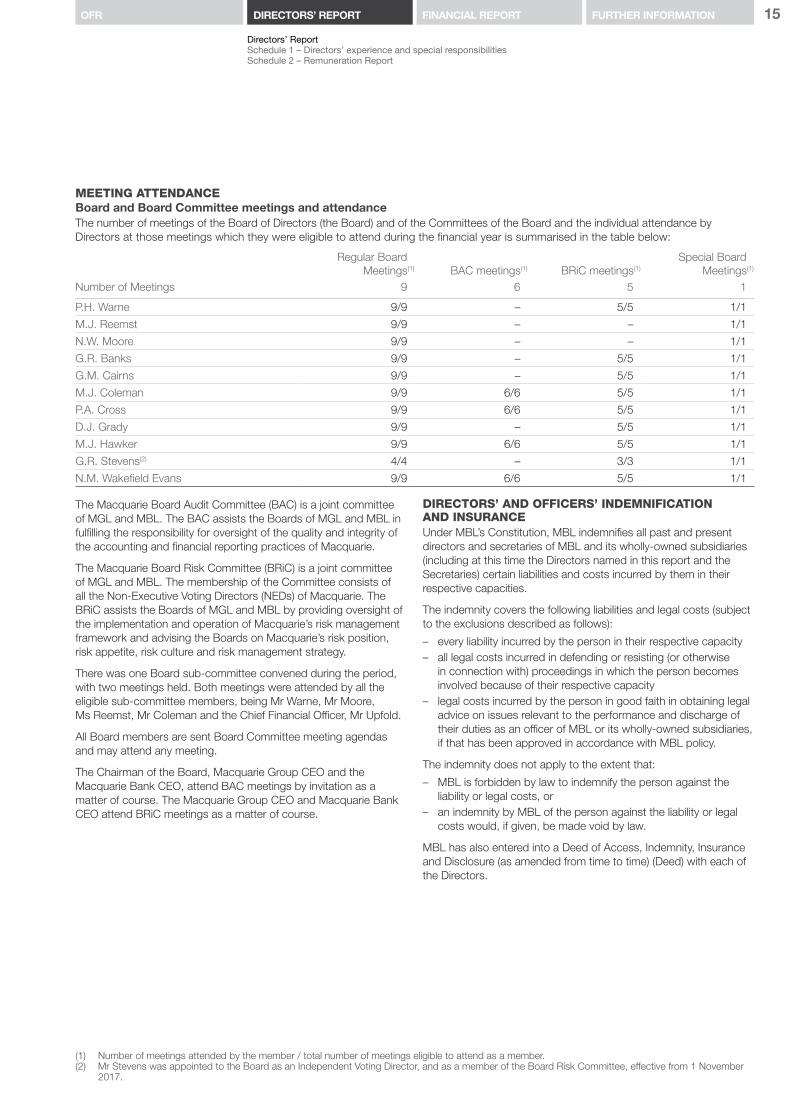
MEETING ATTENDANCEBoard and Board Committee meetings and attendanceThe number of meetings of the Board of Directors (the Board) and of the Committees of the Board and the individual attendance by Directors at those meetings which they were eligible to attend during the financial year is summarised in the table below:
Regular BoardMeetings(1) BAC meetings(1) BRiC meetings(1)
Special BoardMeetings(1)
Number of Meetings 9 6 5 1
P.H. Warne 9/9 – 5/5 1/1
M.J. Reemst 9/9 – – 1/1
N.W. Moore 9/9 – – 1/1
G.R. Banks 9/9 – 5/5 1/1
G.M. Cairns 9/9 – 5/5 1/1
M.J. Coleman 9/9 6/6 5/5 1/1
P.A. Cross 9/9 6/6 5/5 1/1
D.J. Grady 9/9 – 5/5 1/1
M.J. Hawker 9/9 6/6 5/5 1/1
G.R. Stevens(2) 4/4 – 3/3 1/1
N.M. Wakefield Evans 9/9 6/6 5/5 1/1
The Macquarie Board Audit Committee (BAC) is a joint committee of MGL and MBL. The BAC assists the Boards of MGL and MBL in fulfilling the responsibility for oversight of the quality and integrity of the accounting and financial reporting practices of Macquarie.
The Macquarie Board Risk Committee (BRiC) is a joint committee of MGL and MBL. The membership of the Committee consists of all the Non-Executive Voting Directors (NEDs) of Macquarie. The BRiC assists the Boards of MGL and MBL by providing oversight of the implementation and operation of Macquarie’s risk management framework and advising the Boards on Macquarie’s risk position, risk appetite, risk culture and risk management strategy.
There was one Board sub-committee convened during the period, with two meetings held. Both meetings were attended by all the eligible sub-committee members, being Mr Warne, Mr Moore, Ms Reemst, Mr Coleman and the Chief Financial Officer, Mr Upfold.
All Board members are sent Board Committee meeting agendas and may attend any meeting.
The Chairman of the Board, Macquarie Group CEO and the Macquarie Bank CEO, attend BAC meetings by invitation as a matter of course. The Macquarie Group CEO and Macquarie Bank CEO attend BRiC meetings as a matter of course.
DIRECTORS’ AND OFFICERS’ INDEMNIFICATION AND INSURANCEUnder MBL’s Constitution, MBL indemnifies all past and present directors and secretaries of MBL and its wholly-owned subsidiaries (including at this time the Directors named in this report and the Secretaries) certain liabilities and costs incurred by them in their respective capacities.
The indemnity covers the following liabilities and legal costs (subject to the exclusions described as follows):
– every liability incurred by the person in their respective capacity – all legal costs incurred in defending or resisting (or otherwise
in connection with) proceedings in which the person becomes involved because of their respective capacity
– legal costs incurred by the person in good faith in obtaining legal advice on issues relevant to the performance and discharge of their duties as an officer of MBL or its wholly-owned subsidiaries, if that has been approved in accordance with MBL policy.
The indemnity does not apply to the extent that:
– MBL is forbidden by law to indemnify the person against the liability or legal costs, or
– an indemnity by MBL of the person against the liability or legal costs would, if given, be made void by law.
MBL has also entered into a Deed of Access, Indemnity, Insurance and Disclosure (as amended from time to time) (Deed) with each of the Directors.
(1) Number of meetings attended by the member / total number of meetings eligible to attend as a member.(2) Mr Stevens was appointed to the Board as an Independent Voting Director, and as a member of the Board Risk Committee, effective from 1 November
2017.

16 macquarie.com2018 Annual ReportMacquarie Bank Limited and its subsidiaries
DIRECTORS’ REPORT FOR THE FINANCIAL YEAR ENDED 31 MARCH 2018CONTINUED
Under the Deed, MBL, inter alia, agrees to:
– indemnify the Director upon terms broadly consistent with the indemnity contained in MBL’s Constitution
– take out and maintain an insurance policy (or procure that an insurance policy is taken out and maintained) against liabilities incurred by the Director acting as an officer of MBL or its wholly owned subsidiaries. The insurance policy must be for an amount and on terms and conditions appropriate for a reasonably prudent company in MBL’s position. Insurance must be maintained for seven years after the Director ceases to be a Director or until any proceedings commenced during that period have been finally resolved (including any appeal proceedings)
– grant access to Directors to all relevant company papers (including Board papers and other documents) for seven years after the Director ceases to be a Director or until any proceedings commenced during that period have been finally resolved (including any appeal proceedings).
In addition, MGL made an Indemnity and Insurance Deed Poll on 12 September 2007 (Deed Poll). The benefit of the undertakings made by MGL under the Deed Poll have been given to each of the directors, secretaries, persons involved in the management and certain other persons, of MGL and its wholly-owned subsidiaries (which includes MBL) and other companies where the person is acting as such at the specific request of MGL and its wholly-owned subsidiaries. The Deed Poll provides for broadly the same indemnity and insurance arrangements for those persons with the benefit of the Deed Poll as for the Deed described above. However, the Deed Poll does not provide for access to company documents. The Deed Poll largely supersedes previous deed polls which were provided by MBL which were on similar terms. Certain directors and secretaries still have the benefit of the previous deed polls.
A Directors’ and Officers’ insurance policy, taken out by Macquarie Group, is in place that provides cover for each person in favour of whom such insurance is required to be taken out under the Deed and the Deed Poll and for MBL in indemnifying such persons pursuant to the Deed and the Deed Poll. Relevant individuals pay the premium attributable to the direct coverage under the policy and Macquarie Group pays the premium attributable to the reimbursement coverage under the policy. The Directors’ and Officers’ insurance policy prohibits disclosure of the premium payable under the policy and the nature of the liabilities insured.
ENVIRONMENTAL REGULATIONSMBL and its subsidiaries have policies and procedures in place that are designed to ensure that where operations are subject to any particular and significant environmental regulation under a law of the Commonwealth or of a State or Territory, those obligations are identified, appropriately addressed and material breaches notified.
The Directors have determined that there has not been any material breach of those obligations during the financial year.
NON-AUDIT SERVICESFees paid or payable to the auditor of the Consolidated Entity, PricewaterhouseCoopers (PwC), for non-audit services during the period ended 31 March 2018 total $A5.5 million. Further details of amounts paid or payable to PwC and its related practices are disclosed in Note 40 – Audit and other services provided by PwC in the Financial Report.
The Directors are satisfied that the provision of non-audit services did not compromise the auditor independence requirements of the Act for the following reasons:
– The operation of the Consolidated Entity’s Auditor Independence Policy, restricts the external auditor from providing non-audit services under which the auditor assumes the role of management, becomes an advocate for the Consolidated Entity, audits its own professional expertise, or creates a mutual or conflicting interest between the auditor and the Consolidated Entity. The policy also provides that significant permissible non-audit assignments awarded to the external auditor must be approved in advance by the BAC or the BAC Chairman, as appropriate.
– The BAC has reviewed a summary of non-audit services provided by PwC, including details of the amount paid or payable to PwC for non-audit services, and has provided written advice to the Board of Directors.
Consistent with the advice of the BAC, the Directors are satisfied that the provision of non-audit services during the year by the auditor and its related practices is compatible with the general standard of independence for auditors imposed by the Act.
17FURTHER INFORMATIONOFR DIRECTORS’ REPORT FINANCIAL REPORT
Directors’ ReportSchedule 1 – Directors’ experience and special responsibilitiesSchedule 2 – Remuneration Report
ROUNDING OF AMOUNTSIn accordance with ASIC Corporations (Rounding in Financial/Directors’ Reports) Instrument 2016/191, amounts in the Directors’ Report and Financial Report have been rounded off to the nearest million Australian dollars unless otherwise indicated.
This report is made in accordance with a resolution of the Directors.
EVENTS SUBSEQUENT TO BALANCE DATEAt the date of this report, the Directors are not aware of any matter or circumstance that has arisen that has significantly affected or may significantly affect the operations of the Consolidated Entity, the results of those operations or the state of affairs of the Consolidated Entity in the financial years subsequent to 31 March 2018.
Peter WarneIndependent Director and Chairman
Mary ReemstManaging Director and Chief Executive Officer
Sydney
4 May 2018
AUDITOR’S INDEPENDENCE DECLARATIONAs lead auditor for the audit of Macquarie Bank Limited for the year ended 31 March 2018, I declare that to the best of my knowledge and belief, there have been:
(a) no contraventions of the auditor independence requirements of the Corporations Act 2001 in relation to the audit; and
(b) no contraventions of any applicable code of professional conduct in relation to the audit.
This declaration is in respect of Macquarie Bank Limited and the entities it controlled during the period.
K.G. SmithPartner PricewaterhouseCoopers
Sydney
4 May 2018
Liability limited by a scheme approved under Professional Standards Legislation
PricewaterhouseCoopers, ABN 52 780 433 757One International Towers Sydney, Watermans Quay, Barangaroo, GPO BOX 2650, SYDNEY NSW 2001T: +61 2 8266 0000, F: +61 2 8266 9999, w ww.pwc.com.au
18 macquarie.com2018 Annual ReportMacquarie Bank Limited and its subsidiaries
DIRECTORS’ REPORT SCHEDULE 1 DIRECTORS’ EXPERIENCE AND SPECIAL RESPONSIBILITIES
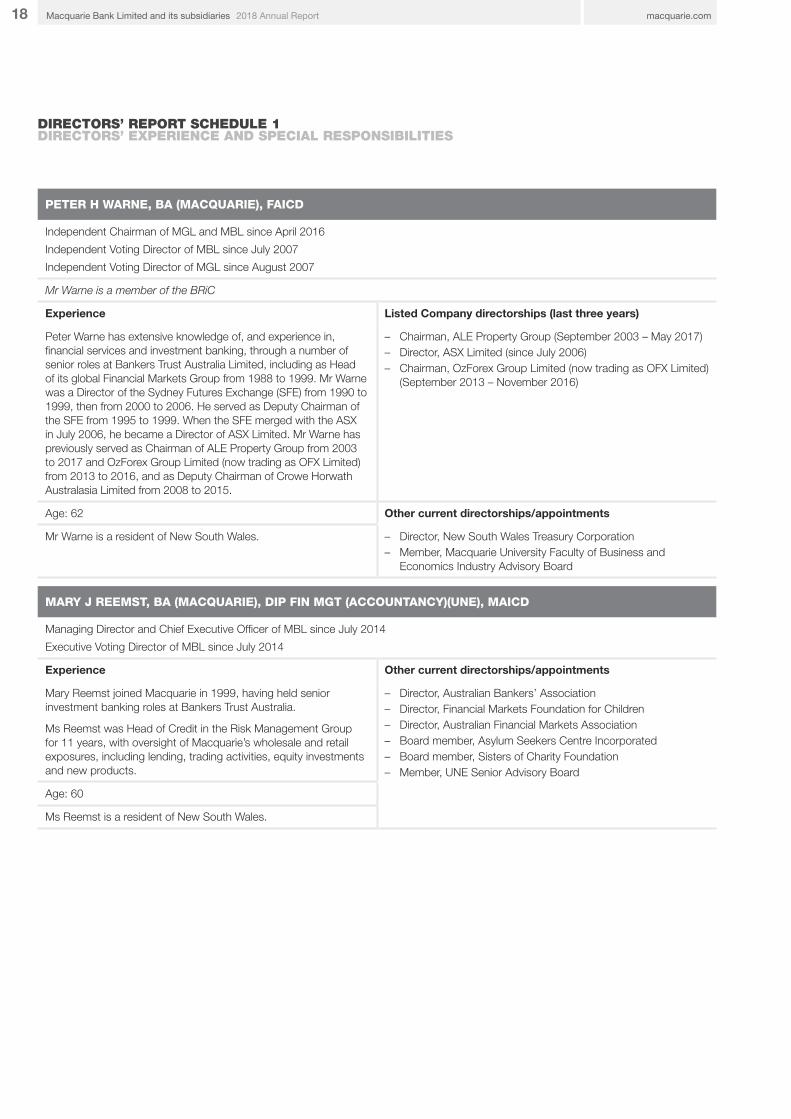
PETER H WARNE, BA (MACQUARIE), FAICD
Independent Chairman of MGL and MBL since April 2016
Independent Voting Director of MBL since July 2007
Independent Voting Director of MGL since August 2007
Mr Warne is a member of the BRiC
Experience Listed Company directorships (last three years)
Peter Warne has extensive knowledge of, and experience in, financial services and investment banking, through a number of senior roles at Bankers Trust Australia Limited, including as Head of its global Financial Markets Group from 1988 to 1999. Mr Warne was a Director of the Sydney Futures Exchange (SFE) from 1990 to 1999, then from 2000 to 2006. He served as Deputy Chairman of the SFE from 1995 to 1999. When the SFE merged with the ASX in July 2006, he became a Director of ASX Limited. Mr Warne has previously served as Chairman of ALE Property Group from 2003 to 2017 and OzForex Group Limited (now trading as OFX Limited) from 2013 to 2016, and as Deputy Chairman of Crowe Horwath Australasia Limited from 2008 to 2015.
– Chairman, ALE Property Group (September 2003 – May 2017) – Director, ASX Limited (since July 2006) – Chairman, OzForex Group Limited (now trading as OFX Limited)
(September 2013 – November 2016)
Age: 62 Other current directorships/appointments
Mr Warne is a resident of New South Wales. – Director, New South Wales Treasury Corporation – Member, Macquarie University Faculty of Business and
Economics Industry Advisory Board
MARY J REEMST, BA (MACQUARIE), DIP FIN MGT (ACCOUNTANCY)(UNE), MAICD
Managing Director and Chief Executive Officer of MBL since July 2014
Executive Voting Director of MBL since July 2014
Experience Other current directorships/appointments
Mary Reemst joined Macquarie in 1999, having held senior investment banking roles at Bankers Trust Australia.
Ms Reemst was Head of Credit in the Risk Management Group for 11 years, with oversight of Macquarie’s wholesale and retail exposures, including lending, trading activities, equity investments and new products.
– Director, Australian Bankers’ Association – Director, Financial Markets Foundation for Children – Director, Australian Financial Markets Association – Board member, Asylum Seekers Centre Incorporated – Board member, Sisters of Charity Foundation – Member, UNE Senior Advisory Board
Age: 60
Ms Reemst is a resident of New South Wales.
19FURTHER INFORMATIONOFR DIRECTORS’ REPORT FINANCIAL REPORT
Directors’ ReportSchedule 1 – Directors’ experience and special responsibilitiesSchedule 2 – Remuneration Report
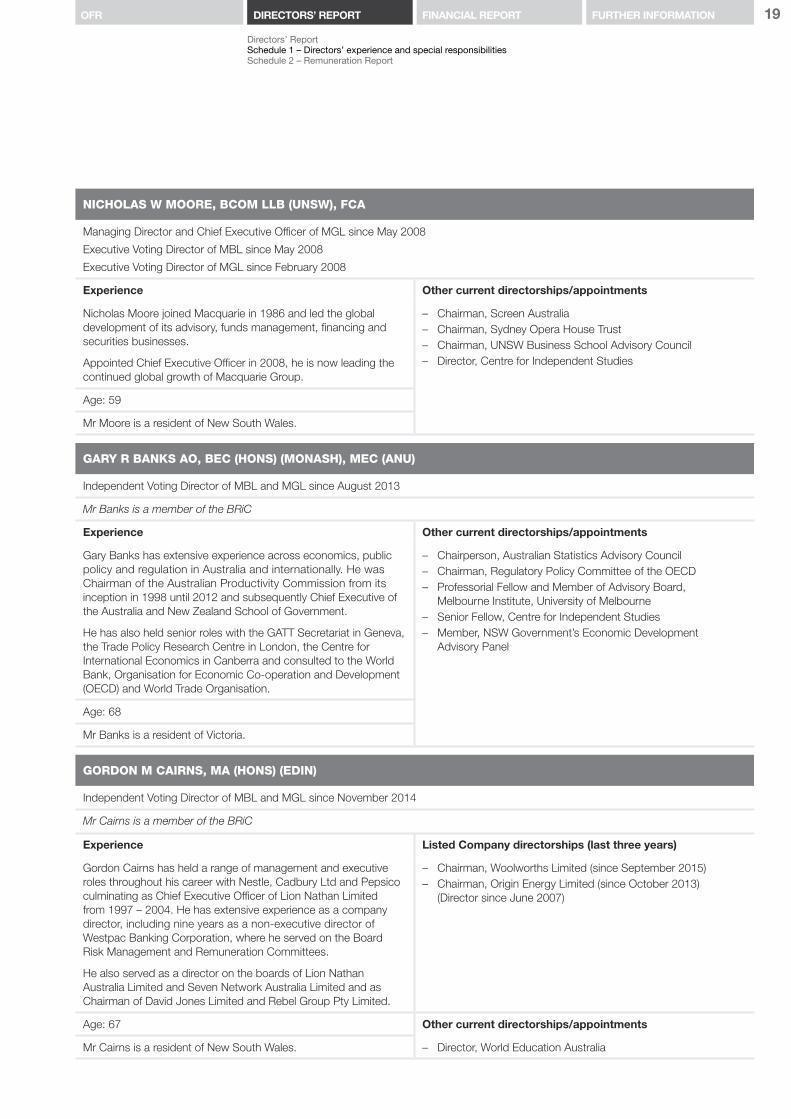
NICHOLAS W MOORE, BCOM LLB (UNSW), FCA
Managing Director and Chief Executive Officer of MGL since May 2008
Executive Voting Director of MBL since May 2008
Executive Voting Director of MGL since February 2008
Experience Other current directorships/appointments
Nicholas Moore joined Macquarie in 1986 and led the global development of its advisory, funds management, financing and securities businesses.
Appointed Chief Executive Officer in 2008, he is now leading the continued global growth of Macquarie Group.
– Chairman, Screen Australia – Chairman, Sydney Opera House Trust – Chairman, UNSW Business School Advisory Council – Director, Centre for Independent Studies
Age: 59
Mr Moore is a resident of New South Wales.
GARY R BANKS AO, BEC (HONS) (MONASH), MEC (ANU)
Independent Voting Director of MBL and MGL since August 2013
Mr Banks is a member of the BRiC
Experience Other current directorships/appointments
Gary Banks has extensive experience across economics, public policy and regulation in Australia and internationally. He was Chairman of the Australian Productivity Commission from its inception in 1998 until 2012 and subsequently Chief Executive of the Australia and New Zealand School of Government.
He has also held senior roles with the GATT Secretariat in Geneva, the Trade Policy Research Centre in London, the Centre for International Economics in Canberra and consulted to the World Bank, Organisation for Economic Co-operation and Development (OECD) and World Trade Organisation.
– Chairperson, Australian Statistics Advisory Council – Chairman, Regulatory Policy Committee of the OECD – Professorial Fellow and Member of Advisory Board,
Melbourne Institute, University of Melbourne – Senior Fellow, Centre for Independent Studies – Member, NSW Government’s Economic Development
Advisory Panel
Age: 68
Mr Banks is a resident of Victoria.
GORDON M CAIRNS, MA (HONS) (EDIN)
Independent Voting Director of MBL and MGL since November 2014
Mr Cairns is a member of the BRiC
Experience Listed Company directorships (last three years)
Gordon Cairns has held a range of management and executive roles throughout his career with Nestle, Cadbury Ltd and Pepsico culminating as Chief Executive Officer of Lion Nathan Limited from 1997 – 2004. He has extensive experience as a company director, including nine years as a non-executive director of Westpac Banking Corporation, where he served on the Board Risk Management and Remuneration Committees.
He also served as a director on the boards of Lion Nathan Australia Limited and Seven Network Australia Limited and as Chairman of David Jones Limited and Rebel Group Pty Limited.
– Chairman, Woolworths Limited (since September 2015) – Chairman, Origin Energy Limited (since October 2013)
(Director since June 2007)
Age: 67 Other current directorships/appointments
Mr Cairns is a resident of New South Wales. – Director, World Education Australia
20 macquarie.com2018 Annual ReportMacquarie Bank Limited and its subsidiaries
DIRECTORS’ REPORT SCHEDULE 1 DIRECTORS’ EXPERIENCE AND SPECIAL RESPONSIBILITIESCONTINUED
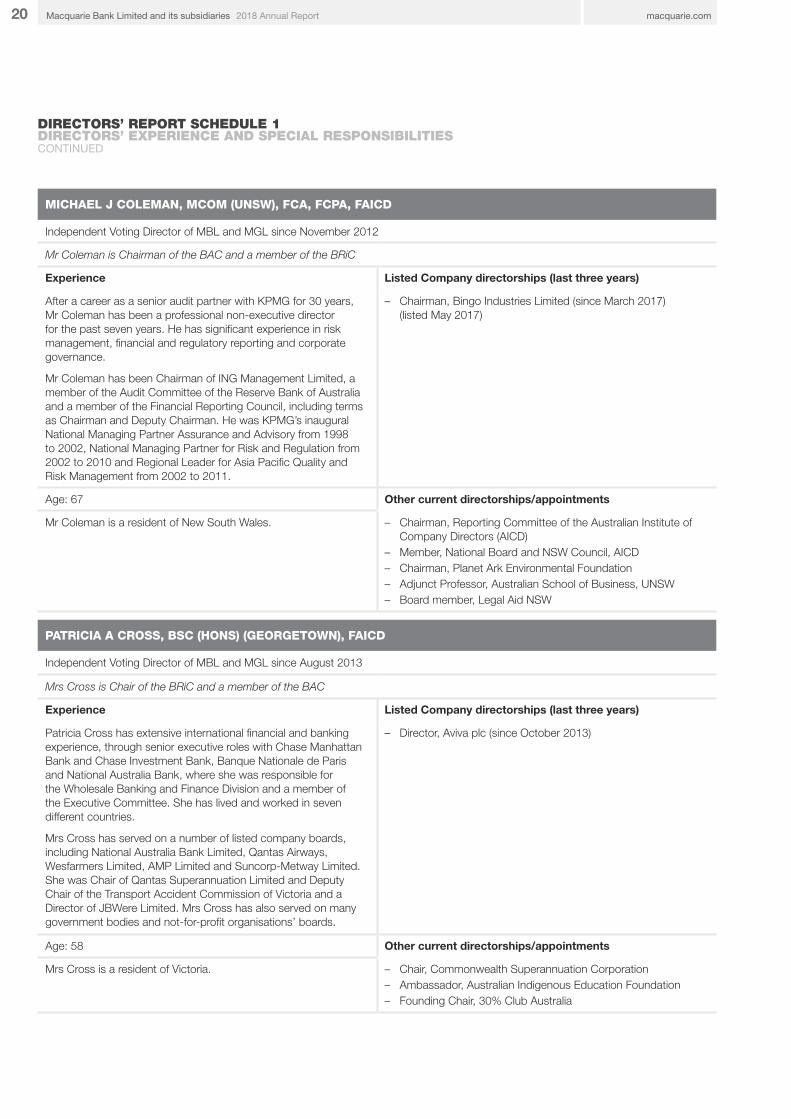
MICHAEL J COLEMAN, MCOM (UNSW), FCA, FCPA, FAICD
Independent Voting Director of MBL and MGL since November 2012
Mr Coleman is Chairman of the BAC and a member of the BRiC
Experience Listed Company directorships (last three years)
After a career as a senior audit partner with KPMG for 30 years, Mr Coleman has been a professional non-executive director for the past seven years. He has significant experience in risk management, financial and regulatory reporting and corporate governance.
Mr Coleman has been Chairman of ING Management Limited, a member of the Audit Committee of the Reserve Bank of Australia and a member of the Financial Reporting Council, including terms as Chairman and Deputy Chairman. He was KPMG’s inaugural National Managing Partner Assurance and Advisory from 1998 to 2002, National Managing Partner for Risk and Regulation from 2002 to 2010 and Regional Leader for Asia Pacific Quality and Risk Management from 2002 to 2011.
– Chairman, Bingo Industries Limited (since March 2017) (listed May 2017)
Age: 67 Other current directorships/appointments
Mr Coleman is a resident of New South Wales. – Chairman, Reporting Committee of the Australian Institute of Company Directors (AICD)
– Member, National Board and NSW Council, AICD – Chairman, Planet Ark Environmental Foundation – Adjunct Professor, Australian School of Business, UNSW – Board member, Legal Aid NSW
PATRICIA A CROSS, BSC (HONS) (GEORGETOWN), FAICD
Independent Voting Director of MBL and MGL since August 2013
Mrs Cross is Chair of the BRiC and a member of the BAC
Experience Listed Company directorships (last three years)
Patricia Cross has extensive international financial and banking experience, through senior executive roles with Chase Manhattan Bank and Chase Investment Bank, Banque Nationale de Paris and National Australia Bank, where she was responsible for the Wholesale Banking and Finance Division and a member of the Executive Committee. She has lived and worked in seven different countries.
Mrs Cross has served on a number of listed company boards, including National Australia Bank Limited, Qantas Airways, Wesfarmers Limited, AMP Limited and Suncorp-Metway Limited. She was Chair of Qantas Superannuation Limited and Deputy Chair of the Transport Accident Commission of Victoria and a Director of JBWere Limited. Mrs Cross has also served on many government bodies and not-for-profit organisations’ boards.
– Director, Aviva plc (since October 2013)
Age: 58 Other current directorships/appointments
Mrs Cross is a resident of Victoria. – Chair, Commonwealth Superannuation Corporation – Ambassador, Australian Indigenous Education Foundation – Founding Chair, 30% Club Australia

21FURTHER INFORMATIONOFR DIRECTORS’ REPORT FINANCIAL REPORT
Directors’ ReportSchedule 1 – Directors’ experience and special responsibilitiesSchedule 2 – Remuneration Report
DIANE J GRADY AM, BA (MILLS), MA (HAWAII), MBA (HARV), FAICD
Independent Voting Director of MBL and MGL since May 2011
Ms Grady is a member of the BRiC
Experience Listed Company directorships (last three years)
Diane Grady has extensive international experience in a variety of industries having served as a full time independent director of public companies and not-for-profit boards since 1994. Previous directorships include Australian Stationery Industries, BlueScope Steel Limited, Woolworths Limited, Goodman Group, Wattyl Limited, Lend Lease US Office Trust, Lend Lease Limited and MLC. She also served as a member of the ASIC Business Consultative Panel, the National Investment Council, the Sydney Opera House Trust and was President of Chief Executive Women.
Ms Grady was a partner at McKinsey & Company where she consulted for over 15 years to clients on strategic and operational issues related to growth and was a worldwide leader of the firm’s Organisation and Change Management practice. She has a Masters degree in Chinese Studies and worked for three years as a journalist in Asia. She has published research on innovation, corporate governance and gender diversity.
– Director, Spotless Group Holdings Limited (March 2014 – July 2017)
Age: 69 Other current directorships/appointments
Ms Grady is a resident of New South Wales. – Chair, The Hunger Project Australia – Member, Centre for Ethical Leadership – Member, Heads Over Heels Advisory Board – Member, NFP Chairs Forum – Director, Tennis Australia – Director, Grant Thornton Australia Board
MICHAEL J HAWKER AM, BSC (SYDNEY), FAICD, SF FIN, FAIM, FIOD
Independent Voting Director of MBL and MGL since March 2010
Mr Hawker is a member of the BAC and BRiC
Experience Listed Company directorships (last three years)
Michael Hawker has substantial expertise and experience in the financial services industry including management experience in regulated entities in Australia and internationally and a deep understanding of risk management. He was Chief Executive Officer and Managing Director of Insurance Australia Group from 2001 to 2008 and has held senior positions at Westpac and Citibank.
Mr Hawker was also President of the Insurance Council of Australia, Chairman of the Australian Financial Markets Association, a board member of the Geneva Association and a member of the Financial Sector Advisory Council.
– Director, Aviva plc (since January 2010) – Director, Washington H Soul Pattinson and Company Ltd
(since October 2012)
Age: 58 Other current directorships/appointments
Mr Hawker is a resident of New South Wales. – Chairman, the George Institute for Global Health – Director, Rugby World Cup Limited

22 macquarie.com2018 Annual ReportMacquarie Bank Limited and its subsidiaries
DIRECTORS’ REPORT SCHEDULE 1 DIRECTORS’ EXPERIENCE AND SPECIAL RESPONSIBILITIESCONTINUED
GLENN R STEVENS AC, BEC (HONS) (SYDNEY), MA (ECON) (UWO)
Independent Voting Director of MGL and MBL since November 2017
Mr Stevens is a member of the BRiC
Experience Other current directorships/appointments
Glenn Stevens worked at the highest levels of the Reserve Bank of Australia (RBA) for 20 years and, as well as developing Australia’s successful inflation targeting framework for monetary policy, played a significant role in central banking internationally. Most recently, he was Governor of the Reserve Bank of Australia between 2006 and 2016.
Mr Stevens has also made key contributions to a number of Australian and international boards and committees, including as chair of the Australian Council of Financial Regulators between 2006 and 2016, as a member of the Financial Stability Board and on a range of G20 committees.
– Director, Lowy Institute – Director, Anika Foundation – Member, Investment Committee, NWQ Capital Management – Advisor, Ellerston Capital Global Macro Fund – Deputy Chair, Temora Aviation Museum
Age: 60
Mr Stevens is a resident of New South Wales.
NICOLA M WAKEFIELD EVANS, BJURIS/BLAW (UNSW), FAICD
Independent Voting Director of MBL and MGL since February 2014
Ms Wakefield Evans is a member of the BAC and BRiC
Experience Listed Company directorships (last three years)
Nicola Wakefield Evans has significant Asia-Pacific experience as a corporate finance lawyer and was a partner at King & Wood Mallesons (and its predecessor, Mallesons Stephen Jaques) for more than 20 years. Ms Wakefield Evans has particular expertise in the financial services, resources and energy, and infrastructure sectors.
She held several key management positions at King & Wood Mallesons including Managing Partner International in Hong Kong and Managing Partner, Practice in Sydney.
– Director, Lendlease Corporation Limited (since September 2013)
– Director, Toll Holdings Limited (May 2011 – June 2017 (de-listed May 2015))
Age: 57 Other current directorships/appointments
Ms Wakefield Evans is a resident of New South Wales. – Director, BUPA ANZ Healthcare Holdings Pty Ltd – Director, BUPA ANZ Insurance Pty Ltd – Director, Clean Energy Finance Corporation – Director, Chief Executive Women – Member, Asialink (University of Melbourne) and
Asialink Business – Member, Takeovers Panel – Director, UNSW Foundation Limited – Member, National Board, Australian Institute of
Company Directors

23FURTHER INFORMATIONOFR DIRECTORS’ REPORT FINANCIAL REPORT
Directors’ ReportSchedule 1 – Directors’ experience and special responsibilitiesSchedule 2 – Remuneration Report
COMPANY SECRETARIES’ QUALIFICATIONS AND EXPERIENCE
DENNIS LEONG, BSC BE (HONS) (SYD), MCOM (UNSW), CPA, FGIA
IDA LAWRANCE, BCOM (HONS) (QUEENS), LLM (UNSW), AGIA, GAICD
Company Secretary since October 1993 Assistant Company Secretary since January 2014
Dennis Leong is an Executive Director of Macquarie and has had responsibility for Macquarie’s company secretarial requirements, general and professional risks insurances and aspects of its employee equity plans. He has over 24 years company secretarial experience and 12 years experience in corporate finance at Macquarie and Hill Samuel Australia Limited.
Ida Lawrance is a Division Director of Macquarie and has over 15 years legal and governance experience. Prior to joining Macquarie in March 2006, Ida practiced as a lawyer in both the private and public sectors.

24 macquarie.com2018 Annual ReportMacquarie Bank Limited and its subsidiaries
INTRODUCTIONMacquarie Bank is a subsidiary of the Macquarie Group. Whilst subject to the remuneration framework determined by the Macquarie Group, the Board considers remuneration recommendations relating to the senior executives of Macquarie Bank. Throughout this Remuneration Report, for consistency, references are made to the Macquarie Group’s remuneration arrangements rather than Macquarie Bank’s remuneration arrangements.
During the year, the MGL Board and the BRC have reviewed the Macquarie Group’s remuneration framework to ensure it continues to support our overarching objective of delivering superior company performance over both the short and long-term, while prudently managing risk and reinforcing the Code of conduct and the long-held foundations of the Macquarie Group’s risk culture, the principles of What We Stand For – Opportunity, Accountability and Integrity.
The Macquarie Group has a longstanding and consistent approach to remuneration which has evolved over time. Our approach to remuneration is a partnership where profits are shared between our shareholders and our staff. No significant changes have been made to the Macquarie Group’s remuneration structure for this year.
The Board believes this approach is integral to the Macquarie Group’s sustained success and creates a strong alignment between staff and shareholders.
Our approach is characterised by:
– an emphasis on performance-based remuneration including consideration of the following factors: financial performance, risk management and compliance, business leadership, people leadership and professional conduct
– comparatively low fixed remuneration – profit share based on realised after-tax profits – significant retention and long deferral periods (for example, for the MGL CEO, 80% is retained, vesting over three to seven years).
Including Performance Share Units (PSUs), the effective deferral rate for the MGL CEO is 82% for the year.
MACQUARIE GROUP’S REMUNERATION FRAMEWORK
This section explains the objectives and principles of the remuneration framework.
The Macquarie Group’s remuneration framework continues to support the overarching objective of delivering superior company performance over the short and long-term, while prudently managing risk and reinforcing the Code of conduct and What We Stand For. The MGL Board recognises that to achieve this objective, the Macquarie Group must attract, motivate and retain exceptional people, while aligning their interests with those of shareholders.
Overall remuneration objectives and principles
SUPERIOR LONG-TERM COMPANY PERFORMANCE
Align interests of staff and shareholders Attract, motivate and retain high quality people
The Board considers this is best achieved by supporting the following principles:
– linking rewards to create sustainable shareholder value through the use of shareholder return drivers, namely profitability and returns in excess of the cost of capital
– emphasising performance-based remuneration with an appropriate balance between short-term and long-term incentives having regard to risk
– determining variable remuneration as a share of profits (not a short-term bonus) based on realised after-tax profits
– remunerating high performing staff appropriately, relative to global peers, so they are attracted to and stay with the Macquarie Group
– ensuring remuneration is structured to drive behaviours which reflect the Macquarie Group’s culture and promote the Macquarie Group’s risk management framework
– delivering remuneration in a way that encourages a long-term perspective, creates alignment with shareholder interests and encourages the prudent management of risk
– providing consistent arrangements over time to give staff the confidence to pursue multi-year initiatives.
CREATING A LONG-TERM FOCUS
DIRECTORS’ REPORT SCHEDULE 2 REMUNERATION REPORT
25FURTHER INFORMATIONOFR DIRECTORS’ REPORT FINANCIAL REPORT
Directors’ ReportSchedule 1 – Directors’ experience and special responsibilitiesSchedule 2 – Remuneration Report
MACQUARIE GROUP’S REMUNERATION STRUCTURE
This section describes the way in which remuneration is structured and delivered.
The Macquarie Group’s remuneration framework works as an integrated whole. An individual’s remuneration comprises fixed remuneration, profit share and, for Executive Committee members (our Executive KMP), PSUs. The table below provides an overview of these components.
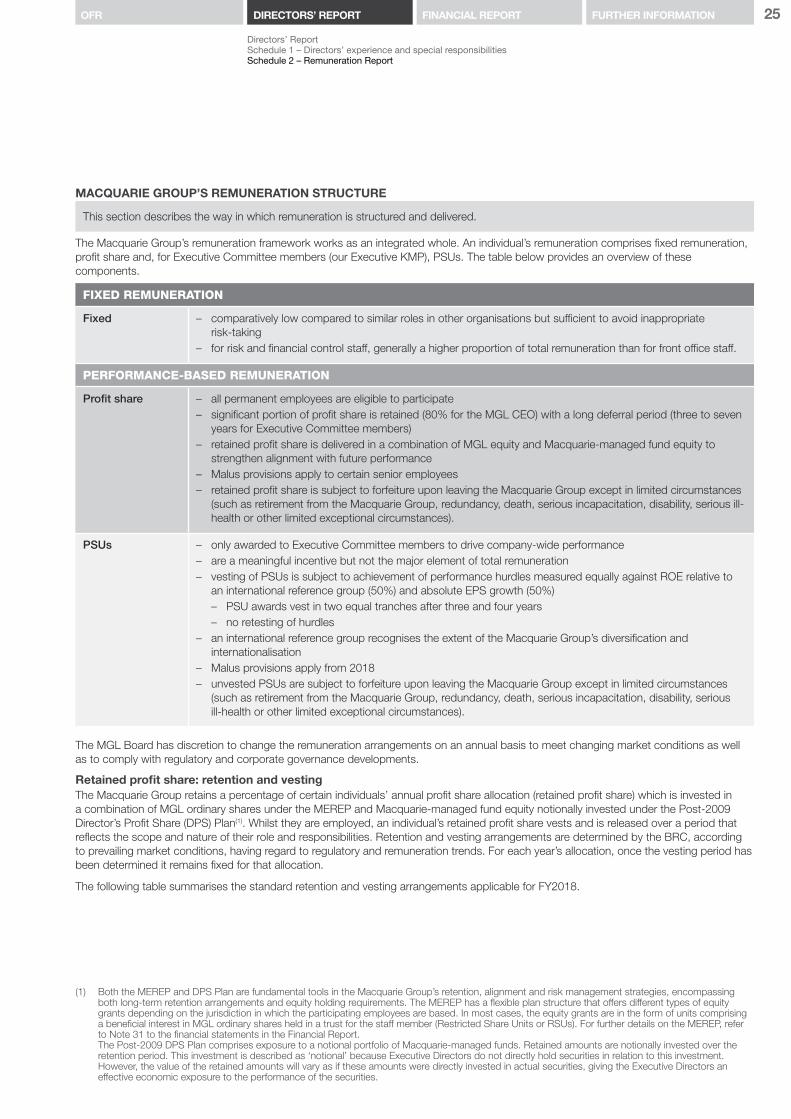
FIXED REMUNERATION
Fixed – comparatively low compared to similar roles in other organisations but sufficient to avoid inappropriate risk-taking
– for risk and financial control staff, generally a higher proportion of total remuneration than for front office staff.
PERFORMANCE-BASED REMUNERATION
Profit share – all permanent employees are eligible to participate – significant portion of profit share is retained (80% for the MGL CEO) with a long deferral period (three to seven
years for Executive Committee members) – retained profit share is delivered in a combination of MGL equity and Macquarie-managed fund equity to
strengthen alignment with future performance – Malus provisions apply to certain senior employees – retained profit share is subject to forfeiture upon leaving the Macquarie Group except in limited circumstances
(such as retirement from the Macquarie Group, redundancy, death, serious incapacitation, disability, serious ill-health or other limited exceptional circumstances).
PSUs – only awarded to Executive Committee members to drive company-wide performance – are a meaningful incentive but not the major element of total remuneration – vesting of PSUs is subject to achievement of performance hurdles measured equally against ROE relative to
an international reference group (50%) and absolute EPS growth (50%) – PSU awards vest in two equal tranches after three and four years – no retesting of hurdles
– an international reference group recognises the extent of the Macquarie Group’s diversification and internationalisation
– Malus provisions apply from 2018 – unvested PSUs are subject to forfeiture upon leaving the Macquarie Group except in limited circumstances
(such as retirement from the Macquarie Group, redundancy, death, serious incapacitation, disability, serious ill-health or other limited exceptional circumstances).
The MGL Board has discretion to change the remuneration arrangements on an annual basis to meet changing market conditions as well as to comply with regulatory and corporate governance developments.
Retained profit share: retention and vestingThe Macquarie Group retains a percentage of certain individuals’ annual profit share allocation (retained profit share) which is invested in a combination of MGL ordinary shares under the MEREP and Macquarie-managed fund equity notionally invested under the Post-2009 Director’s Profit Share (DPS) Plan(1). Whilst they are employed, an individual’s retained profit share vests and is released over a period that reflects the scope and nature of their role and responsibilities. Retention and vesting arrangements are determined by the BRC, according to prevailing market conditions, having regard to regulatory and remuneration trends. For each year’s allocation, once the vesting period has been determined it remains fixed for that allocation.
The following table summarises the standard retention and vesting arrangements applicable for FY2018.
(1) Both the MEREP and DPS Plan are fundamental tools in the Macquarie Group’s retention, alignment and risk management strategies, encompassing both long-term retention arrangements and equity holding requirements. The MEREP has a flexible plan structure that offers different types of equity grants depending on the jurisdiction in which the participating employees are based. In most cases, the equity grants are in the form of units comprising a beneficial interest in MGL ordinary shares held in a trust for the staff member (Restricted Share Units or RSUs). For further details on the MEREP, refer to Note 31 to the financial statements in the Financial Report.
The Post-2009 DPS Plan comprises exposure to a notional portfolio of Macquarie-managed funds. Retained amounts are notionally invested over the retention period. This investment is described as ‘notional’ because Executive Directors do not directly hold securities in relation to this investment. However, the value of the retained amounts will vary as if these amounts were directly invested in actual securities, giving the Executive Directors an effective economic exposure to the performance of the securities.
26 macquarie.com2018 Annual ReportMacquarie Bank Limited and its subsidiaries
DIRECTORS’ REPORT SCHEDULE 2 REMUNERATION REPORTCONTINUED
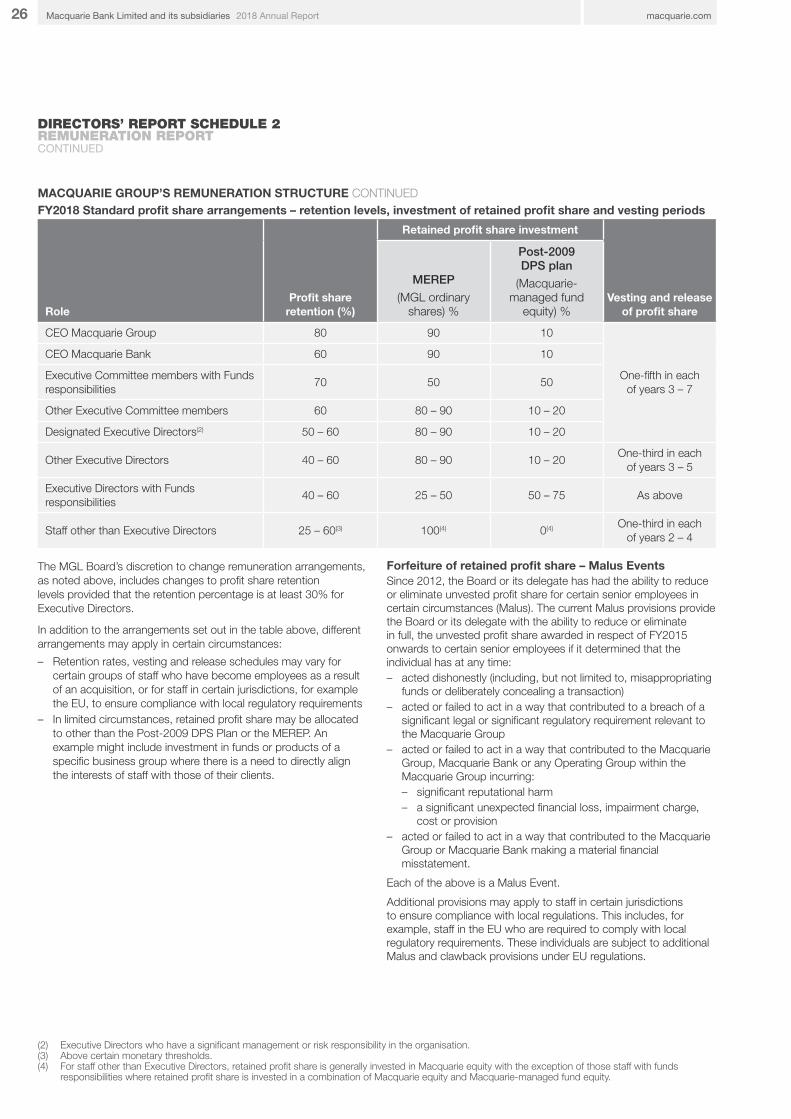
MACQUARIE GROUP’S REMUNERATION STRUCTURE CONTINUEDFY2018 Standard profit share arrangements – retention levels, investment of retained profit share and vesting periods
RoleProfit share
retention (%)
Retained profit share investment
Vesting and release of profit share
MEREP
(MGL ordinary shares) %
Post-2009 DPS plan
(Macquarie-managed fund
equity) %
CEO Macquarie Group 80 90 10
One-fifth in each of years 3 – 7
CEO Macquarie Bank 60 90 10
Executive Committee members with Funds responsibilities
70 50 50
Other Executive Committee members 60 80 – 90 10 – 20
Designated Executive Directors(2) 50 – 60 80 – 90 10 – 20
Other Executive Directors 40 – 60 80 – 90 10 – 20One-third in each
of years 3 – 5
Executive Directors with Funds responsibilities
40 – 60 25 – 50 50 – 75 As above
Staff other than Executive Directors 25 – 60(3) 100(4) 0(4) One-third in each
of years 2 – 4
The MGL Board’s discretion to change remuneration arrangements, as noted above, includes changes to profit share retention levels provided that the retention percentage is at least 30% for Executive Directors.
In addition to the arrangements set out in the table above, different arrangements may apply in certain circumstances:
– Retention rates, vesting and release schedules may vary for certain groups of staff who have become employees as a result of an acquisition, or for staff in certain jurisdictions, for example the EU, to ensure compliance with local regulatory requirements
– In limited circumstances, retained profit share may be allocated to other than the Post-2009 DPS Plan or the MEREP. An example might include investment in funds or products of a specific business group where there is a need to directly align the interests of staff with those of their clients.
Forfeiture of retained profit share – Malus Events Since 2012, the Board or its delegate has had the ability to reduce or eliminate unvested profit share for certain senior employees in certain circumstances (Malus). The current Malus provisions provide the Board or its delegate with the ability to reduce or eliminate in full, the unvested profit share awarded in respect of FY2015 onwards to certain senior employees if it determined that the individual has at any time: – acted dishonestly (including, but not limited to, misappropriating
funds or deliberately concealing a transaction) – acted or failed to act in a way that contributed to a breach of a
significant legal or significant regulatory requirement relevant to the Macquarie Group
– acted or failed to act in a way that contributed to the Macquarie Group, Macquarie Bank or any Operating Group within the Macquarie Group incurring: – significant reputational harm – a significant unexpected financial loss, impairment charge,
cost or provision – acted or failed to act in a way that contributed to the Macquarie
Group or Macquarie Bank making a material financial misstatement.
Each of the above is a Malus Event.
Additional provisions may apply to staff in certain jurisdictions to ensure compliance with local regulations. This includes, for example, staff in the EU who are required to comply with local regulatory requirements. These individuals are subject to additional Malus and clawback provisions under EU regulations.
(2) Executive Directors who have a significant management or risk responsibility in the organisation.(3) Above certain monetary thresholds.(4) For staff other than Executive Directors, retained profit share is generally invested in Macquarie equity with the exception of those staff with funds
responsibilities where retained profit share is invested in a combination of Macquarie equity and Macquarie-managed fund equity.

27FURTHER INFORMATIONOFR DIRECTORS’ REPORT FINANCIAL REPORT
Directors’ ReportSchedule 1 – Directors’ experience and special responsibilitiesSchedule 2 – Remuneration Report
Macquarie Group has always had and continues to have, the ability to terminate staff where a Malus Event has occurred, at which time any unvested profit share would be forfeited in full. The BRC considers whether, and the extent to which, to apply Malus, taking into account local employment laws, the nature and circumstances of the event and any other redress that has been or may be applied.
Early vesting and release of retained profit shareAn Executive Director’s unvested retained profit share is only paid out on termination of employment in the case of retirement from the Macquarie Group, redundancy, death, serious incapacitation, disability, serious ill-health or other limited exceptional circumstances. The Board has discretion to accelerate the vesting of retained profit share under these circumstances (subject to the conditions of early release as set out below).
Discretion may be exercised in certain other limited exceptional circumstances on the grounds of business efficacy, in relation to strategic business objectives, including in connection with the divestment or internalisation of Macquarie Group’s businesses, or when an employee resigns to fulfil a public service role in a governmental organisation or agency. Where such discretion is exercised, the Board may impose such other conditions as it considers appropriate.
This year such discretion has been exercised and retained profit share relation was released for one executive due to the sale of the business, to which they provided services.
Conditions of early release to departing Executive Directors – Post Employment EventsIn addition to the Malus provisions set out above, where discretion has been exercised to accelerate the vesting of the retained profit share of any departing Executive Director, the Board may reduce or eliminate in full their retained profit share, if it determines that the Executive Director has at any time during their employment, or the relevant release periods after their employment, committed a Malus Event (as described on page 26) or:
a) taken staff to a competitor of the Macquarie Group or been instrumental in causing staff to go to a competitor, orb) joined a competitor of the Macquarie Group or otherwise participated in a business that competes with the Macquarie Group.
Each of the above is a Post Employment Event.
In the case of death or serious incapacitation, the Board will typically accelerate the vesting of retained profit share and immediately release it to the Executive Director, or to the Executive Director’s legal personal representative. In other circumstances, the release will occur over the period from six months to two years after the Executive Director leaves, in accordance with the following table:
First Period Second Period Third Period
Time post-departure Six months Six months to one year One year to two years
Unvested retained profit share released
From all but the last two years of employment
From the second year prior to the end of employment
From the year prior to the end of employment
Subject to No Malus Event as set out on the previous page or Post Employment Event as set out above
No Malus Event or Post Employment Event during the First Period, and
No Malus Event or Post Employment Event during the First Period, and
No Malus Event or Post Employment Event a) above during Second Period
No Malus Event or Post Employment Event a) during the Second Period, and
No Malus Event during the Third Period
Where the release is by reason of retirement from the Macquarie Group
As above As above and in addition, the release is subject to no Post Employment Event b) during the Second Period
As above and in addition, the release is subject to no Post Employment Event b) during the Second and/or Third Period
As set out in the table above, the release provisions for retirement from the Macquarie Group were enhanced during FY2018, whereby the release of retention post termination at six months, one year and two years is subject to the Executive Director not having joined a competitor or otherwise participated in a business that competes with the Macquarie Group (Post Employment Event b).
Where an Executive Director has a tax liability on termination of employment in respect of any unvested retained profit share, the Board has discretion to release unvested retained profit share up to an amount equal to the Executive Director’s tax liability at an earlier time than noted above.
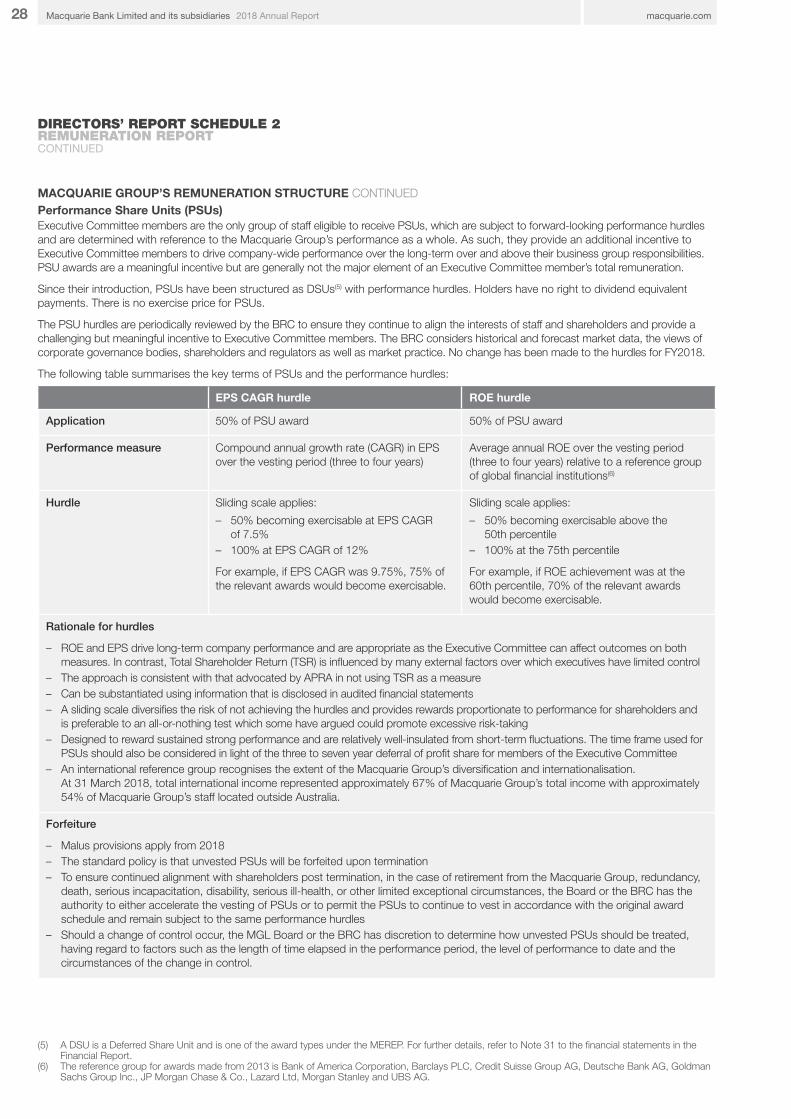
28 macquarie.com2018 Annual ReportMacquarie Bank Limited and its subsidiaries
DIRECTORS’ REPORT SCHEDULE 2 REMUNERATION REPORTCONTINUED
MACQUARIE GROUP’S REMUNERATION STRUCTURE CONTINUEDPerformance Share Units (PSUs)Executive Committee members are the only group of staff eligible to receive PSUs, which are subject to forward-looking performance hurdles and are determined with reference to the Macquarie Group’s performance as a whole. As such, they provide an additional incentive to Executive Committee members to drive company-wide performance over the long-term over and above their business group responsibilities. PSU awards are a meaningful incentive but are generally not the major element of an Executive Committee member’s total remuneration.
Since their introduction, PSUs have been structured as DSUs(5) with performance hurdles. Holders have no right to dividend equivalent payments. There is no exercise price for PSUs.
The PSU hurdles are periodically reviewed by the BRC to ensure they continue to align the interests of staff and shareholders and provide a challenging but meaningful incentive to Executive Committee members. The BRC considers historical and forecast market data, the views of corporate governance bodies, shareholders and regulators as well as market practice. No change has been made to the hurdles for FY2018.
The following table summarises the key terms of PSUs and the performance hurdles:
EPS CAGR hurdle ROE hurdle
Application 50% of PSU award 50% of PSU award
Performance measure Compound annual growth rate (CAGR) in EPS over the vesting period (three to four years)
Average annual ROE over the vesting period (three to four years) relative to a reference group of global financial institutions(6)
Hurdle Sliding scale applies:
– 50% becoming exercisable at EPS CAGR of 7.5%
– 100% at EPS CAGR of 12%
For example, if EPS CAGR was 9.75%, 75% of the relevant awards would become exercisable.
Sliding scale applies:
– 50% becoming exercisable above the 50th percentile
– 100% at the 75th percentile
For example, if ROE achievement was at the 60th percentile, 70% of the relevant awards would become exercisable.
Rationale for hurdles
– ROE and EPS drive long-term company performance and are appropriate as the Executive Committee can affect outcomes on both measures. In contrast, Total Shareholder Return (TSR) is influenced by many external factors over which executives have limited control
– The approach is consistent with that advocated by APRA in not using TSR as a measure – Can be substantiated using information that is disclosed in audited financial statements – A sliding scale diversifies the risk of not achieving the hurdles and provides rewards proportionate to performance for shareholders and
is preferable to an all-or-nothing test which some have argued could promote excessive risk-taking – Designed to reward sustained strong performance and are relatively well-insulated from short-term fluctuations. The time frame used for
PSUs should also be considered in light of the three to seven year deferral of profit share for members of the Executive Committee – An international reference group recognises the extent of the Macquarie Group’s diversification and internationalisation.
At 31 March 2018, total international income represented approximately 67% of Macquarie Group’s total income with approximately 54% of Macquarie Group’s staff located outside Australia.
Forfeiture
– Malus provisions apply from 2018 – The standard policy is that unvested PSUs will be forfeited upon termination – To ensure continued alignment with shareholders post termination, in the case of retirement from the Macquarie Group, redundancy,
death, serious incapacitation, disability, serious ill-health, or other limited exceptional circumstances, the Board or the BRC has the authority to either accelerate the vesting of PSUs or to permit the PSUs to continue to vest in accordance with the original award schedule and remain subject to the same performance hurdles
– Should a change of control occur, the MGL Board or the BRC has discretion to determine how unvested PSUs should be treated, having regard to factors such as the length of time elapsed in the performance period, the level of performance to date and the circumstances of the change in control.
(5) A DSU is a Deferred Share Unit and is one of the award types under the MEREP. For further details, refer to Note 31 to the financial statements in the Financial Report.
(6) The reference group for awards made from 2013 is Bank of America Corporation, Barclays PLC, Credit Suisse Group AG, Deutsche Bank AG, Goldman Sachs Group Inc., JP Morgan Chase & Co., Lazard Ltd, Morgan Stanley and UBS AG.
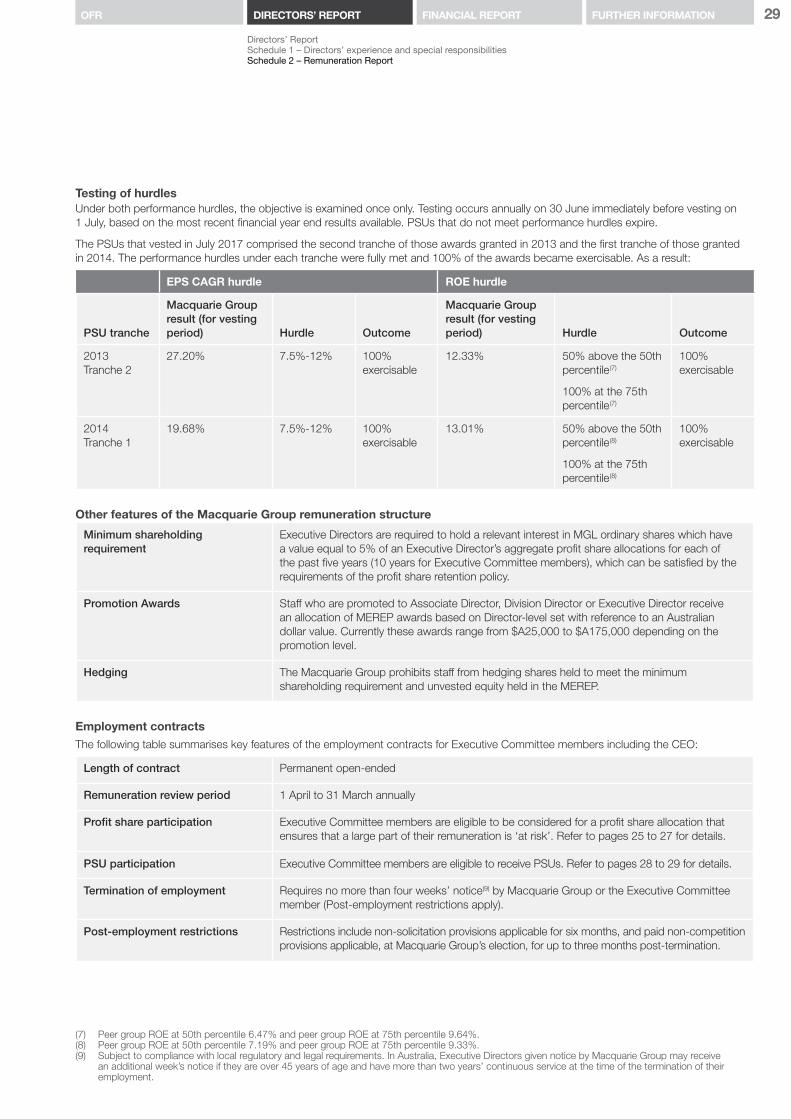
29FURTHER INFORMATIONOFR DIRECTORS’ REPORT FINANCIAL REPORT
Directors’ ReportSchedule 1 – Directors’ experience and special responsibilitiesSchedule 2 – Remuneration Report
Testing of hurdlesUnder both performance hurdles, the objective is examined once only. Testing occurs annually on 30 June immediately before vesting on 1 July, based on the most recent financial year end results available. PSUs that do not meet performance hurdles expire.
The PSUs that vested in July 2017 comprised the second tranche of those awards granted in 2013 and the first tranche of those granted in 2014. The performance hurdles under each tranche were fully met and 100% of the awards became exercisable. As a result:
EPS CAGR hurdle ROE hurdle
PSU tranche
Macquarie Group result (for vesting period) Hurdle Outcome
Macquarie Group result (for vesting period) Hurdle Outcome
2013 Tranche 2
27.20% 7.5%-12% 100% exercisable
12.33% 50% above the 50th percentile (7)
100% at the 75th percentile (7)
100% exercisable
2014 Tranche 1
19.68% 7.5%-12% 100% exercisable
13.01% 50% above the 50th percentile (8)
100% at the 75th percentile (8)
100% exercisable
Other features of the Macquarie Group remuneration structure
Minimum shareholding requirement
Executive Directors are required to hold a relevant interest in MGL ordinary shares which have a value equal to 5% of an Executive Director’s aggregate profit share allocations for each of the past five years (10 years for Executive Committee members), which can be satisfied by the requirements of the profit share retention policy.
Promotion Awards Staff who are promoted to Associate Director, Division Director or Executive Director receive an allocation of MEREP awards based on Director-level set with reference to an Australian dollar value. Currently these awards range from $A25,000 to $A175,000 depending on the promotion level.
Hedging The Macquarie Group prohibits staff from hedging shares held to meet the minimum shareholding requirement and unvested equity held in the MEREP.
Employment contractsThe following table summarises key features of the employment contracts for Executive Committee members including the CEO:
Length of contract Permanent open-ended
Remuneration review period 1 April to 31 March annually
Profit share participation Executive Committee members are eligible to be considered for a profit share allocation that ensures that a large part of their remuneration is ‘at risk’. Refer to pages 25 to 27 for details.
PSU participation Executive Committee members are eligible to receive PSUs. Refer to pages 28 to 29 for details.
Termination of employment Requires no more than four weeks’ notice(9) by Macquarie Group or the Executive Committee member (Post-employment restrictions apply).
Post-employment restrictions Restrictions include non-solicitation provisions applicable for six months, and paid non-competition provisions applicable, at Macquarie Group’s election, for up to three months post-termination.
(7) Peer group ROE at 50th percentile 6.47% and peer group ROE at 75th percentile 9.64%.(8) Peer group ROE at 50th percentile 7.19% and peer group ROE at 75th percentile 9.33%. (9) Subject to compliance with local regulatory and legal requirements. In Australia, Executive Directors given notice by Macquarie Group may receive
an additional week’s notice if they are over 45 years of age and have more than two years’ continuous service at the time of the termination of their employment.
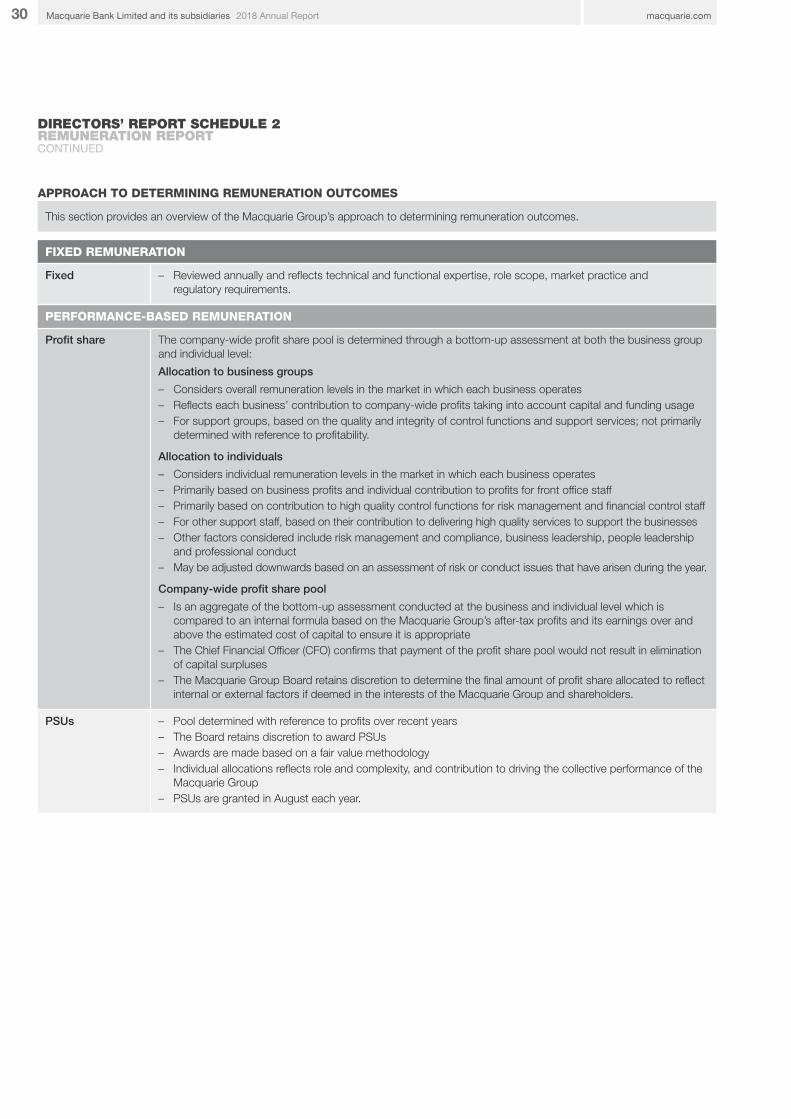
30 macquarie.com2018 Annual ReportMacquarie Bank Limited and its subsidiaries
DIRECTORS’ REPORT SCHEDULE 2 REMUNERATION REPORTCONTINUED
APPROACH TO DETERMINING REMUNERATION OUTCOMES
This section provides an overview of the Macquarie Group’s approach to determining remuneration outcomes.
FIXED REMUNERATION
Fixed – Reviewed annually and reflects technical and functional expertise, role scope, market practice and regulatory requirements.
PERFORMANCE-BASED REMUNERATION
Profit share The company-wide profit share pool is determined through a bottom-up assessment at both the business group and individual level:
Allocation to business groups
– Considers overall remuneration levels in the market in which each business operates – Reflects each business’ contribution to company-wide profits taking into account capital and funding usage – For support groups, based on the quality and integrity of control functions and support services; not primarily
determined with reference to profitability.
Allocation to individuals
– Considers individual remuneration levels in the market in which each business operates – Primarily based on business profits and individual contribution to profits for front office staff – Primarily based on contribution to high quality control functions for risk management and financial control staff – For other support staff, based on their contribution to delivering high quality services to support the businesses – Other factors considered include risk management and compliance, business leadership, people leadership
and professional conduct – May be adjusted downwards based on an assessment of risk or conduct issues that have arisen during the year.
Company-wide profit share pool
– Is an aggregate of the bottom-up assessment conducted at the business and individual level which is compared to an internal formula based on the Macquarie Group’s after-tax profits and its earnings over and above the estimated cost of capital to ensure it is appropriate
– The Chief Financial Officer (CFO) confirms that payment of the profit share pool would not result in elimination of capital surpluses
– The Macquarie Group Board retains discretion to determine the final amount of profit share allocated to reflect internal or external factors if deemed in the interests of the Macquarie Group and shareholders.
PSUs – Pool determined with reference to profits over recent years – The Board retains discretion to award PSUs – Awards are made based on a fair value methodology – Individual allocations reflects role and complexity, and contribution to driving the collective performance of the
Macquarie Group – PSUs are granted in August each year.
31FURTHER INFORMATIONOFR DIRECTORS’ REPORT FINANCIAL REPORT
Directors’ ReportSchedule 1 – Directors’ experience and special responsibilitiesSchedule 2 – Remuneration Report
RISK CONSIDERATIONS AND CONSEQUENCE MANAGEMENT
This section describes how risk is considered throughout the Macquarie Group’s remuneration approach.
Risk cultureA sound risk culture has been integral to Macquarie Group’s risk management framework since inception. Staff are made aware that Macquarie Group’s What We Stand For principles of Opportunity, Accountability and Integrity must form the basis of all behaviours and actions. These behavioural expectations are outlined in the Board approved Code of conduct, which is actively promoted by Management and cascaded through the organisation.
The Board and the BRC take risk and behavioural matters very seriously. There are consistent and transparent practices in place for managing non-compliance with our policies.
Alignment of remuneration with prudent risk takingThe Board considers that the effective alignment of remuneration with prudent risk-taking is fundamental to its remuneration approach. Performance-based remuneration reflects an individual’s performance which includes an assessment of a range of factors including risk management and compliance as well as behavioural measures to promote good conduct and commitment to the Code of conduct and What We Stand For.
The Macquarie Group’s remuneration framework is characterised by significant retention and long deferral periods, which enables risk outcomes to be taken into account over a longer period. There are robust processes in place to ensure that risk, reputation and conduct related matters, as well as financial losses and impairments, and other breaches of the risk management framework are specifically considered when assessing performance and determining remuneration outcomes. These processes may result in downward adjustment to group and/or individual profit share allocations where appropriate.
To assist the Macquarie Group and the BRC:
– The Macquarie Group receives regular reports to assist Board members in assessing the Macquarie Group’s risk culture as well as through personal observation including visits to the Macquarie Group’s overseas offices
– The Chief Risk Officer (CRO) provides an independent annual report to the BRC detailing any material breaches of policy, losses and impairments, residual risks associated with large transactions concluded during the current financial year, return on economic capital by business and the relationship between profitability and risk
– The Global Head of HR discusses the CRO’s report with the Group Heads to ensure any matters listed in the report have been appropriately reflected in remuneration outcomes for relevant staff and provides a report to the BRC detailing how this has been achieved
– The General Counsel, in conjunction with HR, considers whether there are any incidents that should be brought to the attention of the BRC which might lead to a Malus determination and reports to the BRC at year end.
The BRC conducts a detailed review of all the material presented and uses this information when considering remuneration outcomes for relevant businesses and individuals.
Consequence ManagementThe Macquarie Group operates a robust consequence management process whereby incidents, breaches of policy and misconduct are regularly reported to senior management. The Macquarie Group’s Consequence Management Guideline applies wherever a breach of internal policy, including the Code of conduct, or regulatory requirement is identified. Consequences may include requirements to undergo further training, removal of delegated authorities or permissions, adjustments to performance-based remuneration, impact on promotion, formal warnings or termination.
In any given year, each of these different types of consequences may be imposed on individuals working for the Macquarie Group. The most serious consequences are formal warnings and terminations. Where an employee has received a formal warning, in most cases the discretionary component of their remuneration will be impacted. In the event that an individual’s employment is terminated on account of a compliance or conduct concern (or they resign), the Macquarie Group standard policy would apply, whereby retained and unvested remuneration is forfeited.
To assist the Board and the BRC:
– RMG and HR routinely provide information on identified breaches of policies and regulatory rules to (amongst other purposes) ensure that appropriate consequence management is applied. RMG and HR data relating to employee conduct, including individual employee warnings, incidents and breaches, is collated from various sources and regularly reported to senior management
– The Global Head of HR annually reports to the BRC on the outcomes from the consequence management process and confirms these matters have been considered in determining remuneration and promotion outcomes where appropriate.

32 macquarie.com2018 Annual ReportMacquarie Bank Limited and its subsidiaries
DIRECTORS’ REPORT SCHEDULE 2 REMUNERATION REPORTCONTINUED
ALIGNMENT OF REMUNERATION OUTCOMES TO RESULTSMacquarie Bank’s FY2018 net profit after tax (NPAT) is up 28% compared to FY2017.
2014(10) 2015(10) 2016(10) 2015(11) 2016(11) 2017(11) 2018
NPAT attributable to ordinary equity holders ($Am) 752 1,096 2,090 906 1,050 1,221 1,568
Return on average ordinary shareholders’ funds (% p.a.) 8.5 11.5 18.3 9.5 9.2 10.1 12.9
REMUNERATION GOVERNANCE
Effective governance is central to the Macquarie Group’s remuneration strategy and approach. The key elements of the Macquarie Group’s remuneration governance framework are described below.
Strong Board oversightThe Macquarie Group Board oversees the Macquarie Group’s remuneration framework. The Macquarie Group Board has a BRC whose objective is to assist the Boards of Macquarie Group and Macquarie Bank with their remuneration policies and practices.
The BRC currently comprises five independent Non-Executive Directors (NEDs):
– Michael Hawker (Chairman) – Gary Banks – Gordon Cairns – Diane Grady – Peter Warne.
The BRC members have the required experience and expertise in human resources, remuneration and risk that enable them to achieve effective governance of the Macquarie Group’s remuneration framework. The BRC has a regular meeting cycle and it met seven times over the last financial year. Attendance at the meetings by the BRC members is set out in the Directors’ Report. Strict processes are in place to ensure that conflicts of interest are appropriately managed.
The BRC pays close attention to the design and the operation of remuneration practices for all of the Macquarie Group, not just for the most senior executives. The responsibilities of the BRC are outlined in its Charter, which is reviewed and approved annually by the Macquarie Group Board. Some of the responsibilities include:
– recommending to the Board the remuneration outcomes for all Executive KMP, Designated Executive Directors as well as other senior executives
– assessing the effectiveness of the Remuneration Policy to ensure compliance with legal and regulatory requirements, as well as to support the alignment of remuneration with prudent risk taking and professional conduct across the organisation
– recommending the Remuneration Policy to the Boards of Macquarie Group and Macquarie Bank for approval, and
– overseeing the process for the annual performance review of the CEOs’ by the Macquarie Group and Macquarie Bank Boards.
The Charter is available on the Macquarie Group’s website at macquarie.com/leadership-corporate-governance
As part of the Board’s annual review of the Macquarie Bank CEO’s performance, the CEO meets with the NEDs towards the end of each financial year to consider formal documentation that outlines her views of Macquarie Bank’s performance. The presentation includes a broad range of Macquarie Bank’s activities covering the following main areas:
– regulatory – risk management and compliance – customer outcomes – financial performance – investing in the future.
Over the course of the year the Board receives regular reports and updates on many of these areas. These are summarised in the CEO’s presentation, together with additional information on any particular matters of interests that the Board has identified for further discussion as a part of the review process. The Board then considers the CEO’s performance and progress against all of these topics in determining the CEO’s remuneration for the year.
The MGL Board and the BRC also consider formal documentation for each Executive Committee member, which covers financial performance, risk management and compliance, business leadership and people leadership and professional conduct consistent with the Code of conduct and What We Stand For.
In addition, the BRC considers remuneration levels for organisations in an international reference group that broadly operate in the same markets and compete for the same people as the Macquarie Group. This information helps the BRC and Board make decisions about remuneration.
(10) Including the profit from discontinued operations on the transfer of the MIM business from the Bank to the Non-Bank as reported in the Financial Statements for the year ended 31 March 2016.
(11) Excluding the profit from discontinued operations on the transfer of the MIM business from the Bank to the Non-Bank as reported in the Financial Statements for the year ended 31 March 2016.
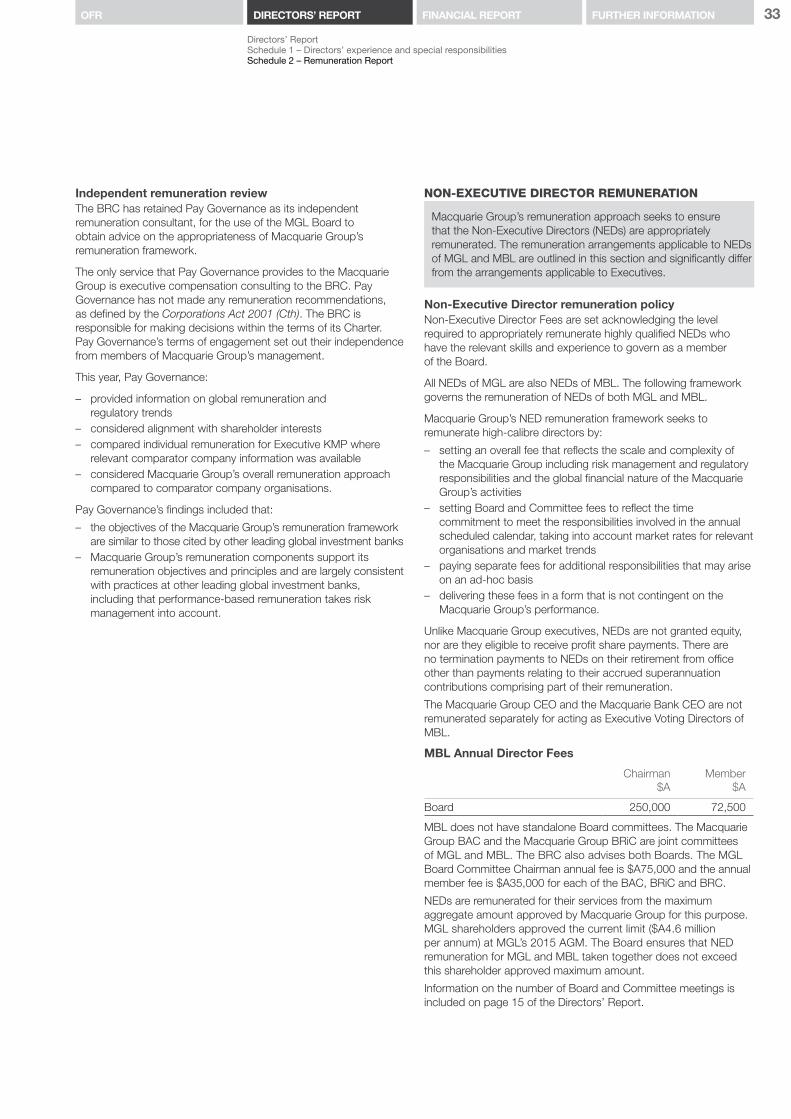
33FURTHER INFORMATIONOFR DIRECTORS’ REPORT FINANCIAL REPORT
Directors’ ReportSchedule 1 – Directors’ experience and special responsibilitiesSchedule 2 – Remuneration Report
Independent remuneration reviewThe BRC has retained Pay Governance as its independent remuneration consultant, for the use of the MGL Board to obtain advice on the appropriateness of Macquarie Group’s remuneration framework.
The only service that Pay Governance provides to the Macquarie Group is executive compensation consulting to the BRC. Pay Governance has not made any remuneration recommendations, as defined by the Corporations Act 2001 (Cth). The BRC is responsible for making decisions within the terms of its Charter. Pay Governance’s terms of engagement set out their independence from members of Macquarie Group’s management.
This year, Pay Governance:
– provided information on global remuneration and regulatory trends
– considered alignment with shareholder interests – compared individual remuneration for Executive KMP where
relevant comparator company information was available – considered Macquarie Group’s overall remuneration approach
compared to comparator company organisations.
Pay Governance’s findings included that:
– the objectives of the Macquarie Group’s remuneration framework are similar to those cited by other leading global investment banks
– Macquarie Group’s remuneration components support its remuneration objectives and principles and are largely consistent with practices at other leading global investment banks, including that performance-based remuneration takes risk management into account.
NON-EXECUTIVE DIRECTOR REMUNERATION
Macquarie Group’s remuneration approach seeks to ensure that the Non-Executive Directors (NEDs) are appropriately remunerated. The remuneration arrangements applicable to NEDs of MGL and MBL are outlined in this section and significantly differ from the arrangements applicable to Executives.
Non-Executive Director remuneration policyNon-Executive Director Fees are set acknowledging the level required to appropriately remunerate highly qualified NEDs who have the relevant skills and experience to govern as a member of the Board.
All NEDs of MGL are also NEDs of MBL. The following framework governs the remuneration of NEDs of both MGL and MBL.
Macquarie Group’s NED remuneration framework seeks to remunerate high-calibre directors by:
– setting an overall fee that reflects the scale and complexity of the Macquarie Group including risk management and regulatory responsibilities and the global financial nature of the Macquarie Group’s activities
– setting Board and Committee fees to reflect the time commitment to meet the responsibilities involved in the annual scheduled calendar, taking into account market rates for relevant organisations and market trends
– paying separate fees for additional responsibilities that may arise on an ad-hoc basis
– delivering these fees in a form that is not contingent on the Macquarie Group’s performance.
Unlike Macquarie Group executives, NEDs are not granted equity, nor are they eligible to receive profit share payments. There are no termination payments to NEDs on their retirement from office other than payments relating to their accrued superannuation contributions comprising part of their remuneration.
The Macquarie Group CEO and the Macquarie Bank CEO are not remunerated separately for acting as Executive Voting Directors of MBL.
MBL Annual Director Fees
Chairman $A
Member $A
Board 250,000 72,500
MBL does not have standalone Board committees. The Macquarie Group BAC and the Macquarie Group BRiC are joint committees of MGL and MBL. The BRC also advises both Boards. The MGL Board Committee Chairman annual fee is $A75,000 and the annual member fee is $A35,000 for each of the BAC, BRiC and BRC.
NEDs are remunerated for their services from the maximum aggregate amount approved by Macquarie Group for this purpose. MGL shareholders approved the current limit ($A4.6 million per annum) at MGL’s 2015 AGM. The Board ensures that NED remuneration for MGL and MBL taken together does not exceed this shareholder approved maximum amount.
Information on the number of Board and Committee meetings is included on page 15 of the Directors’ Report.

34 macquarie.com2018 Annual ReportMacquarie Bank Limited and its subsidiaries
DIRECTORS’ REPORT SCHEDULE 2 REMUNERATION REPORTCONTINUED
This page has been intentionally left blank.
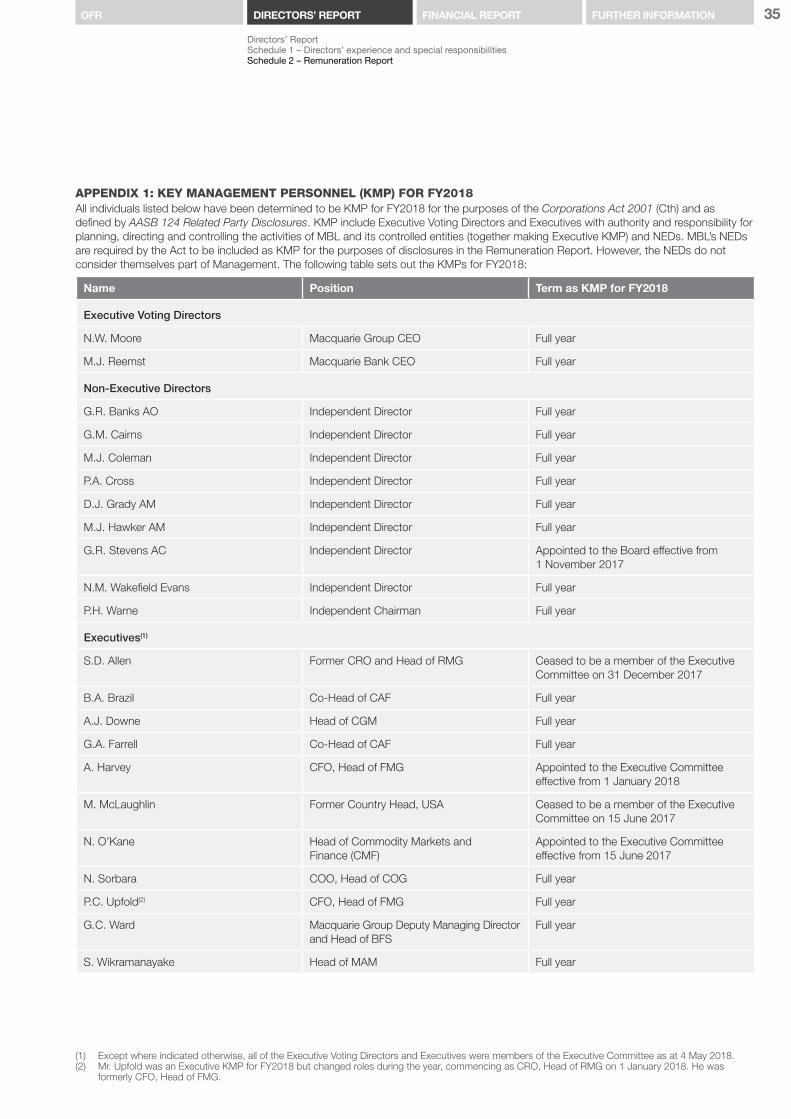
35FURTHER INFORMATIONOFR DIRECTORS’ REPORT FINANCIAL REPORT
Directors’ ReportSchedule 1 – Directors’ experience and special responsibilitiesSchedule 2 – Remuneration Report
APPENDIX 1: KEY MANAGEMENT PERSONNEL (KMP) FOR FY2018 All individuals listed below have been determined to be KMP for FY2018 for the purposes of the Corporations Act 2001 (Cth) and as defined by AASB 124 Related Party Disclosures. KMP include Executive Voting Directors and Executives with authority and responsibility for planning, directing and controlling the activities of MBL and its controlled entities (together making Executive KMP) and NEDs. MBL’s NEDs are required by the Act to be included as KMP for the purposes of disclosures in the Remuneration Report. However, the NEDs do not consider themselves part of Management. The following table sets out the KMPs for FY2018:
Name Position Term as KMP for FY2018
Executive Voting Directors
N.W. Moore Macquarie Group CEO Full year
M.J. Reemst Macquarie Bank CEO Full year
Non-Executive Directors
G.R. Banks AO Independent Director Full year
G.M. Cairns Independent Director Full year
M.J. Coleman Independent Director Full year
P.A. Cross Independent Director Full year
D.J. Grady AM Independent Director Full year
M.J. Hawker AM Independent Director Full year
G.R. Stevens AC Independent Director Appointed to the Board effective from 1 November 2017
N.M. Wakefield Evans Independent Director Full year
P.H. Warne Independent Chairman Full year
Executives(1)
S.D. Allen Former CRO and Head of RMG Ceased to be a member of the Executive Committee on 31 December 2017
B.A. Brazil Co-Head of CAF Full year
A.J. Downe Head of CGM Full year
G.A. Farrell Co-Head of CAF Full year
A. Harvey CFO, Head of FMG Appointed to the Executive Committee effective from 1 January 2018
M. McLaughlin Former Country Head, USA Ceased to be a member of the Executive Committee on 15 June 2017
N. O’Kane Head of Commodity Markets and Finance (CMF)
Appointed to the Executive Committee effective from 15 June 2017
N. Sorbara COO, Head of COG Full year
P.C. Upfold(2) CFO, Head of FMG Full year
G.C. Ward Macquarie Group Deputy Managing Director and Head of BFS
Full year
S. Wikramanayake Head of MAM Full year
(1) Except where indicated otherwise, all of the Executive Voting Directors and Executives were members of the Executive Committee as at 4 May 2018.(2) Mr. Upfold was an Executive KMP for FY2018 but changed roles during the year, commencing as CRO, Head of RMG on 1 January 2018. He was
formerly CFO, Head of FMG.

36 macquarie.com2018 Annual ReportMacquarie Bank Limited and its subsidiaries
DIRECTORS’ REPORT SCHEDULE 2 REMUNERATION REPORTCONTINUED
APPENDIX 2: STATUTORY REMUNERATION DISCLOSURES Executive KMP Remuneration Disclosure (in accordance with Australian Accounting Standards)
SHORT-TERM EMPLOYEE BENEFITS LONG-TERM EMPLOYEE BENEFITS SHARE BASED PAYMENTS
Name Position Year
Salary (including
super-annuation)
$A
Performance related
remuneration$A
Total short-term
employeebenefits
$A
Restricted profit share
$A
Earnings on prior year restricted
profit share$A
Total long-term employee
benefits$A
Equity awards including
shares$A
PSUs$A
Total share-based
payments$A
Total Remuneration
$A
Percentage of remuneration
that consists of PSUs
%
Executive Voting Directors
N.W. Moore Macquarie Group CEO 2018 447,377 1,974,935 2,422,312 789,974 438,670 1,228,644 5,283,633 1,796,979 7,080,612 10,731,568 16.74
2017 452,760 1,925,749 2,378,509 770,300 267,171 1,037,471 5,030,134 2,003,276 7,033,410 10,449,390 19.17
M.J Reemst Macquarie Bank CEO 2018 700,750 1,590,412 2,291,162 238,562 110,241 348,803 1,397,486 1,349,723 2,747,209 5,387,174 25.05
2017 700,800 1,401,648 2,102,448 210,247 72,717 282,964 1,223,635 1,112,092 2,335,727 4,721,139 23.56
Other Executives
B.A. Brazil Co-Head of CAF 2018 700,750 5,728,513 6,429,263 859,277 481,598 1,340,875 7,231,912 1,914,747 9,146,659 16,916,797 11.32
2017 700,800 6,387,347 7,088,147 958,102 223,087 1,181,189 6,973,281 1,619,586 8,592,867 16,862,203 9.60
A.J. Downe Head of CGM 2018 435,236 4,910,094 5,345,330 736,514 965,835 1,702,349 4,773,652 2,197,132 6,970,784 14,018,463 15.67
2017 757,509 5,015,848 5,773,357 752,377 795,839 1,548,216 4,252,383 2,263,567 6,515,950 13,837,523 16.36
G.A. Farrell Co-Head of CAF 2018 698,144 2,994,236 3,692,380 449,135 296,281 745,416 3,260,608 2,281,630 5,542,238 9,980,034 22.86
2017 698,181 2,984,964 3,683,145 447,745 212,138 659,883 3,152,855 2,468,658 5,621,513 9,964,541 24.77
N. Sorbara COO, Head of COG 2018 414,746 1,258,979 1,673,725 188,847 62,003 250,850 964,220 884,910 1,849,130 3,773,705 23.45
2017 386,356 998,852 1,385,208 149,828 28,367 178,195 759,931 932,470 1,692,401 3,255,804 28.64
P.C. Upfold CRO, Head of RMG 2018 552,795 1,667,830 2,220,625 250,174 94,799 344,973 1,606,089 990,798 2,596,887 5,162,485 19.19
2017 565,634 1,594,365 2,159,999 239,155 41,971 281,126 1,442,428 835,802 2,278,230 4,719,355 17.71
G.C. Ward Macquarie Group Deputy Managing Director, Head of BFS 2018 692,889 3,123,218 3,816,107 936,965 291,146 1,228,111 2,511,574 2,191,456 4,703,030 9,747,248 22.48
2017 690,458 3,012,845 3,703,303 903,853 140,936 1,044,789 2,283,535 2,294,326 4,577,861 9,325,953 24.60
S. Wikramanayake Head of MAM 2018 94,598 407,394 501,992 475,293 161,557 636,850 306,122 196,518 502,640 1,641,482 11.97
2017 104,339 203,028 307,367 152,271 30,152 182,423 105,937 87,667 193,604 683,394 12.83
Total Remuneration – Comparable Executive KMP(1) 2018 4,737,285 23,655,611 28,392,896 4,924,741 2,902,130 7,826,871 27,335,296 13,803,893 41,139,189 77,358,956
2017 5,056,837 23,524,646 28,581,483 4,583,878 1,812,378 6,396,256 25,224,119 13,617,444 38,841,563 73,819,302
New Executives
A. Harvey(2) CFO, Head of FMG 2018 107,279 433,811 541,090 65,072 21,131 86,203 367,481 69,200 436,681 1,063,974 6.50
2017 – – – – – – – – – – –
N. O’Kane(2) Head of CMF 2018 298,543 4,050,098 4,348,641 607,515 303,968 911,483 4,323,099 410,528 4,733,627 9,993,751 4.11
2017 – – – – – – – – – – –
Former Executives
S.D. Allen(3) Former CRO, Head of RMG 2018 394,537 1,028,682 1,423,219 154,302 104,953 259,255 1,068,115 645,039 1,713,154 3,395,628 19.00
2017 514,182 1,600,124 2,114,306 240,019 86,412 326,431 1,374,770 1,150,466 2,525,236 4,965,973 23.17
M. McLaughlin(3) Former Country Head, USA 2018 111,416 – 111,416 – 47,027 47,027 126,973 66,450 193,423 351,866 18.89
2017 523,213 342,764 865,977 51,415 102,350 153,765 552,993 241,098 794,091 1,813,833 13.29
S. Vrcelj(3) Former Head of MSG 2018 – – – – – – – – – – –
2017 73,043 167,265 240,308 39,028 22,708 61,736 695,774 813,866 1,509,640 1,811,684 44.92
Total Remuneration – Executive KMP (including new and former executives)
2018 5,649,060 29,168,202 34,817,262 5,751,630 3,379,209 9,130,839 33,220,964 14,995,110 48,216,074 92,164,175
2017 6,167,275 25,634,799 31,802,074 4,914,340 2,023,848 6,938,188 27,847,656 15,822,874 43,670,530 82,410,792
(1) Comparable KMP are Executive KMP who are members of the Executive Committee for the full year in both FY2018 and FY2017.(2) Mr Harvey and Mr O’Kane were appointed to the Executive Committee effective 1 January 2018 and 15 June 2017 respectively.(3) Mr Allen, Mr McLaughlin and Mr Vrcelj ceased to be members of the Executive Committee on 31 December 2017, 15 June 2017
and 29 November 2016 respectively.
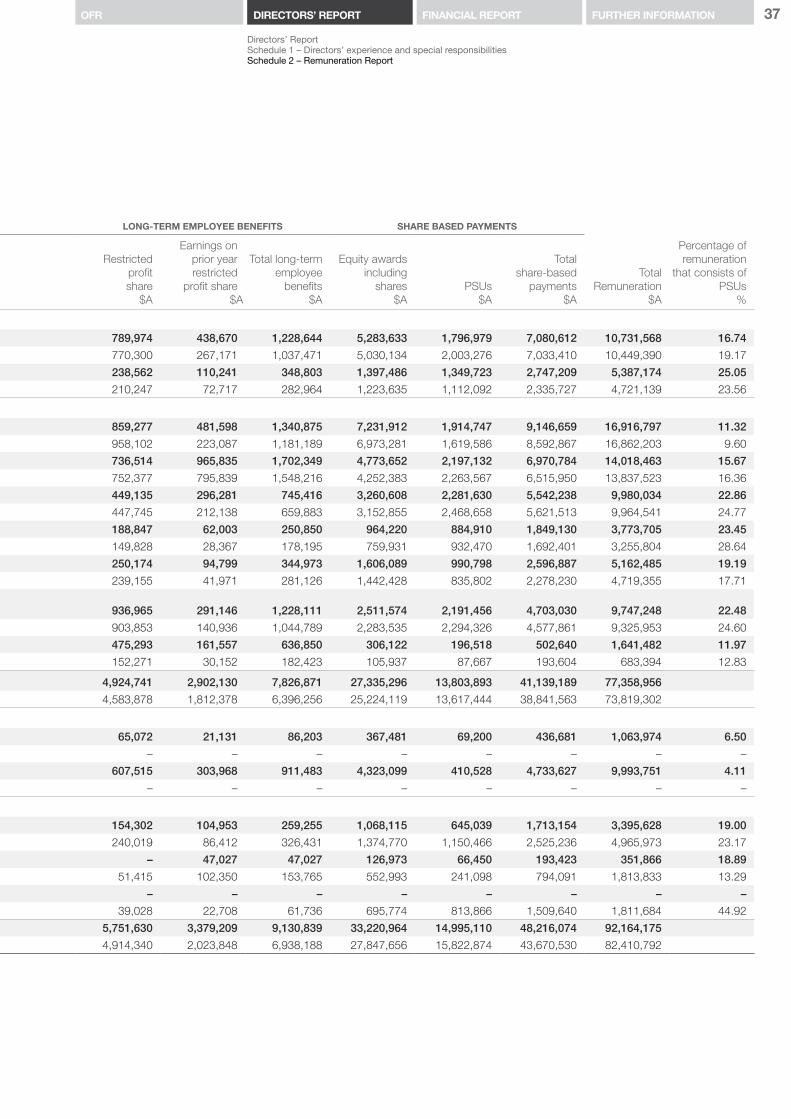
37FURTHER INFORMATIONOFR DIRECTORS’ REPORT FINANCIAL REPORT
Directors’ ReportSchedule 1 – Directors’ experience and special responsibilitiesSchedule 2 – Remuneration Report
APPENDIX 2: STATUTORY REMUNERATION DISCLOSURES Executive KMP Remuneration Disclosure (in accordance with Australian Accounting Standards)
SHORT-TERM EMPLOYEE BENEFITS LONG-TERM EMPLOYEE BENEFITS SHARE BASED PAYMENTS
Name Position Year
Salary (including
super-annuation)
$A
Performance related
remuneration$A
Total short-term
employeebenefits
$A
Restricted profit share
$A
Earnings on prior year restricted
profit share$A
Total long-term employee
benefits$A
Equity awards including
shares$A
PSUs$A
Total share-based
payments$A
Total Remuneration
$A
Percentage of remuneration
that consists of PSUs
%
Executive Voting Directors
N.W. Moore Macquarie Group CEO 2018 447,377 1,974,935 2,422,312 789,974 438,670 1,228,644 5,283,633 1,796,979 7,080,612 10,731,568 16.74
2017 452,760 1,925,749 2,378,509 770,300 267,171 1,037,471 5,030,134 2,003,276 7,033,410 10,449,390 19.17
M.J Reemst Macquarie Bank CEO 2018 700,750 1,590,412 2,291,162 238,562 110,241 348,803 1,397,486 1,349,723 2,747,209 5,387,174 25.05
2017 700,800 1,401,648 2,102,448 210,247 72,717 282,964 1,223,635 1,112,092 2,335,727 4,721,139 23.56
Other Executives
B.A. Brazil Co-Head of CAF 2018 700,750 5,728,513 6,429,263 859,277 481,598 1,340,875 7,231,912 1,914,747 9,146,659 16,916,797 11.32
2017 700,800 6,387,347 7,088,147 958,102 223,087 1,181,189 6,973,281 1,619,586 8,592,867 16,862,203 9.60
A.J. Downe Head of CGM 2018 435,236 4,910,094 5,345,330 736,514 965,835 1,702,349 4,773,652 2,197,132 6,970,784 14,018,463 15.67
2017 757,509 5,015,848 5,773,357 752,377 795,839 1,548,216 4,252,383 2,263,567 6,515,950 13,837,523 16.36
G.A. Farrell Co-Head of CAF 2018 698,144 2,994,236 3,692,380 449,135 296,281 745,416 3,260,608 2,281,630 5,542,238 9,980,034 22.86
2017 698,181 2,984,964 3,683,145 447,745 212,138 659,883 3,152,855 2,468,658 5,621,513 9,964,541 24.77
N. Sorbara COO, Head of COG 2018 414,746 1,258,979 1,673,725 188,847 62,003 250,850 964,220 884,910 1,849,130 3,773,705 23.45
2017 386,356 998,852 1,385,208 149,828 28,367 178,195 759,931 932,470 1,692,401 3,255,804 28.64
P.C. Upfold CRO, Head of RMG 2018 552,795 1,667,830 2,220,625 250,174 94,799 344,973 1,606,089 990,798 2,596,887 5,162,485 19.19
2017 565,634 1,594,365 2,159,999 239,155 41,971 281,126 1,442,428 835,802 2,278,230 4,719,355 17.71
G.C. Ward Macquarie Group Deputy Managing Director, Head of BFS 2018 692,889 3,123,218 3,816,107 936,965 291,146 1,228,111 2,511,574 2,191,456 4,703,030 9,747,248 22.48
2017 690,458 3,012,845 3,703,303 903,853 140,936 1,044,789 2,283,535 2,294,326 4,577,861 9,325,953 24.60
S. Wikramanayake Head of MAM 2018 94,598 407,394 501,992 475,293 161,557 636,850 306,122 196,518 502,640 1,641,482 11.97
2017 104,339 203,028 307,367 152,271 30,152 182,423 105,937 87,667 193,604 683,394 12.83
Total Remuneration – Comparable Executive KMP(1) 2018 4,737,285 23,655,611 28,392,896 4,924,741 2,902,130 7,826,871 27,335,296 13,803,893 41,139,189 77,358,956
2017 5,056,837 23,524,646 28,581,483 4,583,878 1,812,378 6,396,256 25,224,119 13,617,444 38,841,563 73,819,302
New Executives
A. Harvey(2) CFO, Head of FMG 2018 107,279 433,811 541,090 65,072 21,131 86,203 367,481 69,200 436,681 1,063,974 6.50
2017 – – – – – – – – – – –
N. O’Kane(2) Head of CMF 2018 298,543 4,050,098 4,348,641 607,515 303,968 911,483 4,323,099 410,528 4,733,627 9,993,751 4.11
2017 – – – – – – – – – – –
Former Executives
S.D. Allen(3) Former CRO, Head of RMG 2018 394,537 1,028,682 1,423,219 154,302 104,953 259,255 1,068,115 645,039 1,713,154 3,395,628 19.00
2017 514,182 1,600,124 2,114,306 240,019 86,412 326,431 1,374,770 1,150,466 2,525,236 4,965,973 23.17
M. McLaughlin(3) Former Country Head, USA 2018 111,416 – 111,416 – 47,027 47,027 126,973 66,450 193,423 351,866 18.89
2017 523,213 342,764 865,977 51,415 102,350 153,765 552,993 241,098 794,091 1,813,833 13.29
S. Vrcelj(3) Former Head of MSG 2018 – – – – – – – – – – –
2017 73,043 167,265 240,308 39,028 22,708 61,736 695,774 813,866 1,509,640 1,811,684 44.92
Total Remuneration – Executive KMP (including new and former executives)
2018 5,649,060 29,168,202 34,817,262 5,751,630 3,379,209 9,130,839 33,220,964 14,995,110 48,216,074 92,164,175
2017 6,167,275 25,634,799 31,802,074 4,914,340 2,023,848 6,938,188 27,847,656 15,822,874 43,670,530 82,410,792

38 macquarie.com2018 Annual ReportMacquarie Bank Limited and its subsidiaries
DIRECTORS’ REPORT SCHEDULE 2 REMUNERATION REPORTCONTINUED
APPENDIX 2: STATUTORY REMUNERATION DISCLOSURES CONTINUED Additional information in regards to the statutory remuneration disclosures set out in this AppendixThe remuneration disclosures set out in this appendix have been prepared in accordance with Australian Accounting standards. Under the requirements of AASB 124 Related Party Disclosures, the remuneration disclosures for the years ended 31 March 2018 and 31 March 2017 only include remuneration relating to the portion of the relevant periods that each person was an Executive KMP.
The following information provides more detail in regards to some of the column headings in this appendix:
(1) Short-term employee benefits:a) Salary: includes superannuation and an accrual for long service leaveb) Performance-related remuneration: this represents the cash portion of each person’s profit share allocation for the reporting period as an
Executive KMP.
(2) Long-term employee benefits:a) Restricted profit share: this represents the amount of retained profit share that is deferred to future periods and held as a notional
investment in Macquarie-managed fund equity (Post-2009 DPS Plan). b) Earnings on prior years restricted profit share: Profit share amounts retained under the Post-2009 DPS Plan are notionally invested
in Macquarie-managed funds, providing Executive Directors with an economic exposure to the underlying investments. Executive Directors are each entitled to amounts equivalent to the investment earnings (dividends/distributions and security price appreciation) on the underlying securities. The notional returns are calculated based on total shareholder return. Where these amounts are positive, they may be paid to Executive Directors and are included in these remuneration disclosures as part of ‘Earnings on prior year restricted profit share’. If there is a notional loss, this loss will be offset against any future notional income until the loss is completely offset, and is reported as a negative amount in the same column. These earnings reflect the investment performance of the assets in which prior year retained amounts have been notionally invested. Their inclusion in the individual remuneration disclosures on the following pages may, therefore, cause distortions when year-on-year remuneration trends are examined. They do not reflect remuneration review decisions made about the individual’s current year performance.
(3) Share-based payments:a) Equity awards including shares: This represents the current year expense for retained profit share that is invested in Macquarie ordinary
shares under the MEREP as described on page 26. This is recognised as an expense over the respective vesting periods as described on page 26 and includes amounts that relates to prior year equity awards that have been previously disclosed. Equity awards in respect of FY2018 performance will be granted during FY2019, however Macquarie begins recognising an expense for these awards (based on an initial estimate) from 1 April 2017. The expense is estimated using the price of MGL ordinary shares as at 31 March 2018 and the number of equity awards expected to vest. In the following financial year, Macquarie will adjust the accumulated expense recognised for the final determination of fair value for each equity award when granted and will use this validation for recognising the expense over the remaining vesting period.
b) PSUs: This represents the current year expense for PSUs that is recognised over the vesting period as described on page 28. This includes amounts that relate to prior year PSU awards. PSUs will be granted during FY2019, however Macquarie begins recognising an expense for these awards (based on an initial estimate) from 1 April 2017. The expense is estimated using the price of MGL ordinary shares as at 31 March 2018 and the number of equity instruments expected to vest. The estimate also incorporates an interest rate to maturity of 2.45% per annum, expected vesting dates of PSUs of 1 July 2021 and 1 July 2022, and a dividend yield of 4.96% per annum. In the following financial year, Macquarie will adjust the accumulated expense recognised for the final determination of fair value for each PSU when granted and will use this validation for recognising the expense over the remaining vesting period.

39FURTHER INFORMATIONOFR DIRECTORS’ REPORT FINANCIAL REPORT
Directors’ ReportSchedule 1 – Directors’ experience and special responsibilitiesSchedule 2 – Remuneration Report
APPENDIX 2: STATUTORY REMUNERATION DISCLOSURES CONTINUED Non-Executive Director RemunerationThe remuneration arrangements for all of the persons listed below as NEDs are described on page 33 of this Remuneration Report.
YearFees
$AOther benefits
$A(7)
Total Compensation
$A
G.R. Banks 2018 72,500 – 72,500
2017 72,500 – 72,500
G.M. Cairns 2018 72,500 – 72,500
2017 72,500 – 72,500
M.J. Coleman 2018 72,500 – 72,500
2017 72,500 3,000 75,500
P.A. Cross 2018 72,500 – 72,500
2017 72,500 – 72,500
D.J. Grady 2018 72,500 – 72,500
2017 72,500 – 72,500
M.J. Hawker 2018 72,500 – 72,500
2017 72,500 – 72,500
G. R. Stevens(8) 2018 30,208 – 30,208
2017 – – –
N.M. Wakefield Evans 2018 72,500 – 72,500
2017 72,500 – 72,500
P.H. Warne 2018 250,000 – 250,000
2017 250,000 – 250,000
Total Remuneration – Non-Executive KMP 2018 787,708 – 787,708
2017 757,500 3,000 760,500
(7) Other benefits for NEDs include due diligence committee fees paid to Mr Coleman of $A3,000 in FY2017.(8) Mr Stevens was appointed to the MBL Board as an Independent Voting Director effective 1 November 2017.
APPENDIX 3: LOAN DISCLOSURESLoans to Key Management Personnel and their related partiesDetails of loans provided by the Macquarie Group to KMP and their related parties(1) are disclosed in the following table:
Balance at1 April 2017
$A’000
Interestcharged(2)
$A’000Write downs
$A’000
Balance at 31 March 2018
$A’000
Highest balanceduring the year
$A’000
Name and position
Non-Executive Directors
D.J. Grady (related party) – 3 – 464 498
(1) There were no other loans provided by the Macquarie Group to KMP and their related parties during the financial year ended 31 March 2018.(2) Alls loans provided by Macquarie Group to Directors and Executives are made in the ordinary course of business on an arm’s length basis and are
entered into under normal terms and conditions consistent with other customers and employees. There have been non write-downs or allowances for doubtful debts.
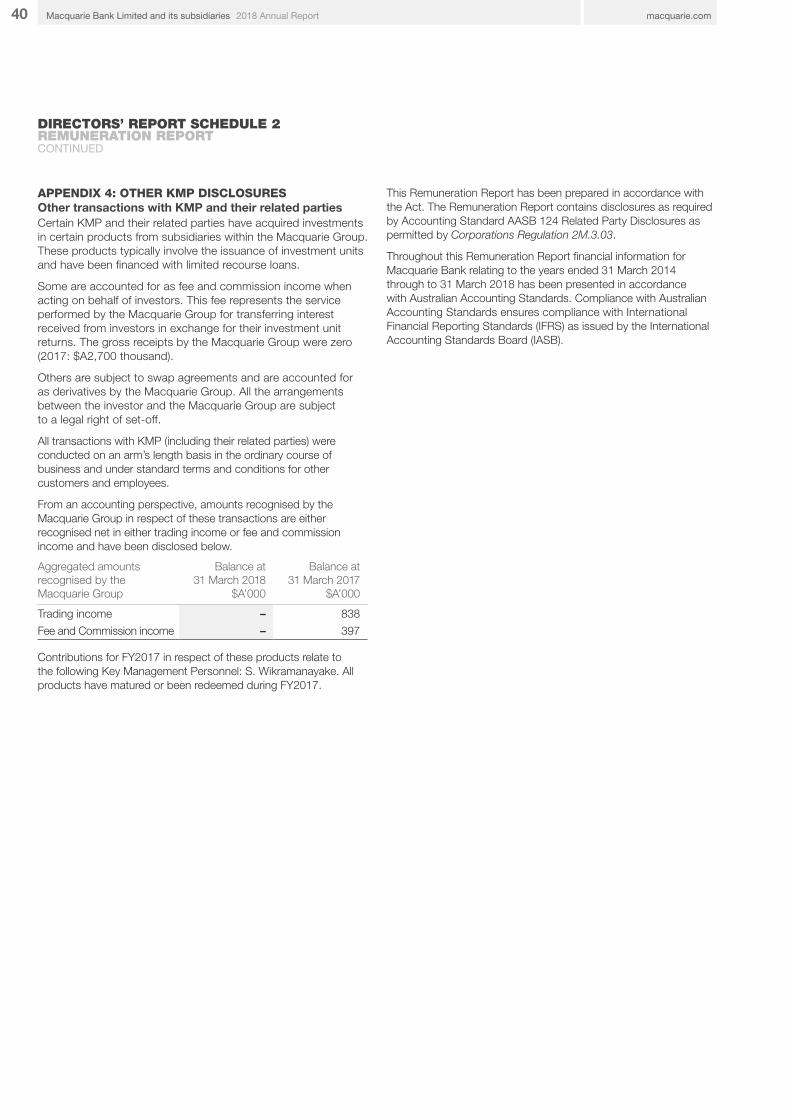
40 macquarie.com2018 Annual ReportMacquarie Bank Limited and its subsidiaries
DIRECTORS’ REPORT SCHEDULE 2 REMUNERATION REPORTCONTINUED
APPENDIX 4: OTHER KMP DISCLOSURESOther transactions with KMP and their related partiesCertain KMP and their related parties have acquired investments in certain products from subsidiaries within the Macquarie Group. These products typically involve the issuance of investment units and have been financed with limited recourse loans.
Some are accounted for as fee and commission income when acting on behalf of investors. This fee represents the service performed by the Macquarie Group for transferring interest received from investors in exchange for their investment unit returns. The gross receipts by the Macquarie Group were zero (2017: $A2,700 thousand).
Others are subject to swap agreements and are accounted for as derivatives by the Macquarie Group. All the arrangements between the investor and the Macquarie Group are subject to a legal right of set-off.
All transactions with KMP (including their related parties) were conducted on an arm’s length basis in the ordinary course of business and under standard terms and conditions for other customers and employees.
From an accounting perspective, amounts recognised by the Macquarie Group in respect of these transactions are either recognised net in either trading income or fee and commission income and have been disclosed below.
Aggregated amounts recognised by the Macquarie Group
Balance at 31 March 2018
$A’000
Balance at31 March 2017
$A’000
Trading income – 838
Fee and Commission income – 397
Contributions for FY2017 in respect of these products relate to the following Key Management Personnel: S. Wikramanayake. All products have matured or been redeemed during FY2017.
This Remuneration Report has been prepared in accordance with the Act. The Remuneration Report contains disclosures as required by Accounting Standard AASB 124 Related Party Disclosures as permitted by Corporations Regulation 2M.3.03.
Throughout this Remuneration Report financial information for Macquarie Bank relating to the years ended 31 March 2014 through to 31 March 2018 has been presented in accordance with Australian Accounting Standards. Compliance with Australian Accounting Standards ensures compliance with International Financial Reporting Standards (IFRS) as issued by the International Accounting Standards Board (IASB).

3FINANCIAL REPORT
Income StatementsStatements of comprehensive incomeStatements of financial positionStatements of changes in equityStatements of cash flowsNotes to the financial statementsDirectors’ declaration Independent auditor’s report
41FINANCIAL REPORT FURTHER INFORMATIONOFR DIRECTORS’ REPORT
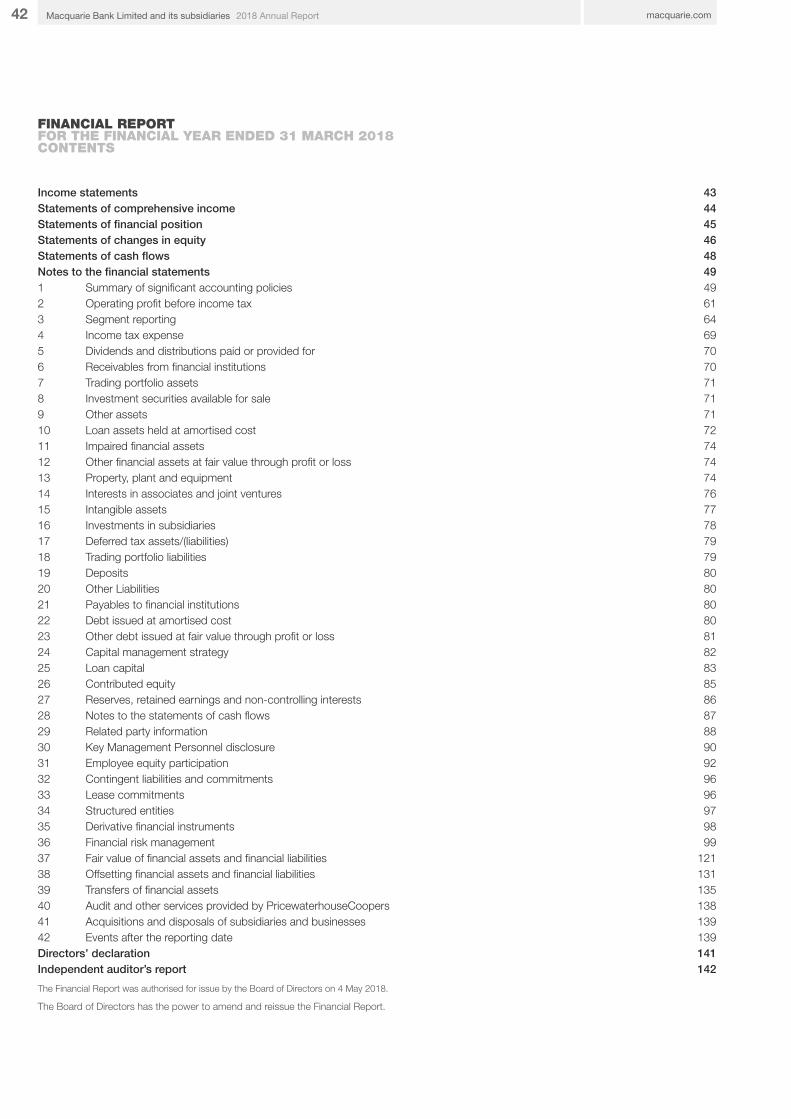
42 macquarie.com2018 Annual ReportMacquarie Bank Limited and its subsidiaries
FINANCIAL REPORTFOR THE FINANCIAL YEAR ENDED 31 MARCH 2018CONTENTS
Income statements 43Statements of comprehensive income 44Statements of financial position 45Statements of changes in equity 46Statements of cash flows 48Notes to the financial statements 491 Summary of significant accounting policies 492 Operating profit before income tax 613 Segment reporting 644 Income tax expense 695 Dividends and distributions paid or provided for 706 Receivables from financial institutions 707 Trading portfolio assets 718 Investment securities available for sale 719 Other assets 7110 Loan assets held at amortised cost 7211 Impaired financial assets 7412 Other financial assets at fair value through profit or loss 7413 Property, plant and equipment 7414 Interests in associates and joint ventures 7615 Intangible assets 7716 Investments in subsidiaries 7817 Deferred tax assets/(liabilities) 7918 Trading portfolio liabilities 7919 Deposits 8020 Other Liabilities 8021 Payables to financial institutions 8022 Debt issued at amortised cost 8023 Other debt issued at fair value through profit or loss 8124 Capital management strategy 8225 Loan capital 8326 Contributed equity 8527 Reserves, retained earnings and non-controlling interests 8628 Notes to the statements of cash flows 8729 Related party information 8830 Key Management Personnel disclosure 9031 Employee equity participation 9232 Contingent liabilities and commitments 9633 Lease commitments 9634 Structured entities 9735 Derivative financial instruments 9836 Financial risk management 9937 Fair value of financial assets and financial liabilities 12138 Offsetting financial assets and financial liabilities 13139 Transfers of financial assets 13540 Audit and other services provided by PricewaterhouseCoopers 13841 Acquisitions and disposals of subsidiaries and businesses 13942 Events after the reporting date 139Directors’ declaration 141Independent auditor’s report 142
The Financial Report was authorised for issue by the Board of Directors on 4 May 2018.
The Board of Directors has the power to amend and reissue the Financial Report.
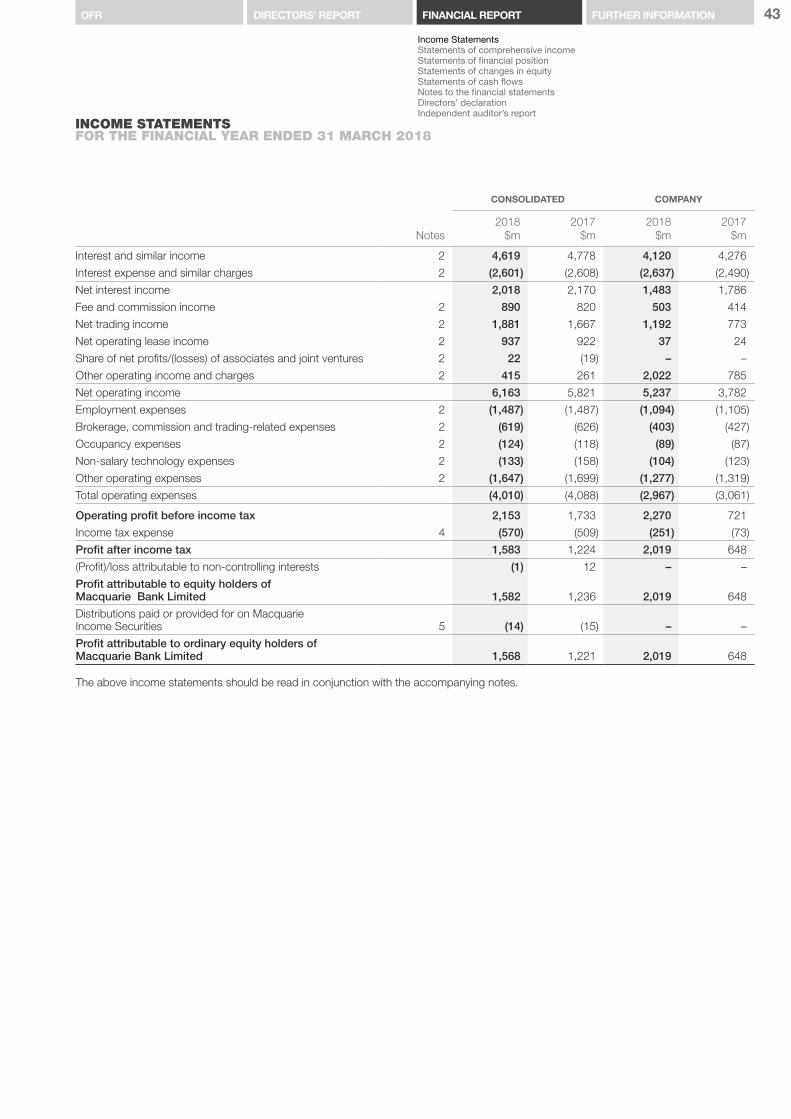
43FURTHER INFORMATIONOFR DIRECTORS’ REPORT FINANCIAL REPORT
Income StatementsStatements of comprehensive incomeStatements of financial positionStatements of changes in equityStatements of cash flowsNotes to the financial statementsDirectors’ declaration Independent auditor’s report
INCOME STATEMENTSFOR THE FINANCIAL YEAR ENDED 31 MARCH 2018
CONSOLIDATED COMPANY
Notes2018
$m2017
$m2018
$m2017
$m
Interest and similar income 2 4,619 4,778 4,120 4,276
Interest expense and similar charges 2 (2,601) (2,608) (2,637) (2,490)
Net interest income 2,018 2,170 1,483 1,786
Fee and commission income 2 890 820 503 414
Net trading income 2 1,881 1,667 1,192 773
Net operating lease income 2 937 922 37 24
Share of net profits/(losses) of associates and joint ventures 2 22 (19) – –
Other operating income and charges 2 415 261 2,022 785
Net operating income 6,163 5,821 5,237 3,782
Employment expenses 2 (1,487) (1,487) (1,094) (1,105)
Brokerage, commission and trading-related expenses 2 (619) (626) (403) (427)
Occupancy expenses 2 (124) (118) (89) (87)
Non-salary technology expenses 2 (133) (158) (104) (123)
Other operating expenses 2 (1,647) (1,699) (1,277) (1,319)
Total operating expenses (4,010) (4,088) (2,967) (3,061)
Operating profit before income tax 2,153 1,733 2,270 721
Income tax expense 4 (570) (509) (251) (73)
Profit after income tax 1,583 1,224 2,019 648
(Profit)/loss attributable to non-controlling interests (1) 12 – –
Profit attributable to equity holders of Macquarie Bank Limited 1,582 1,236 2,019 648
Distributions paid or provided for on Macquarie Income Securities 5 (14) (15) – –
Profit attributable to ordinary equity holders of Macquarie Bank Limited 1,568 1,221 2,019 648
The above income statements should be read in conjunction with the accompanying notes.
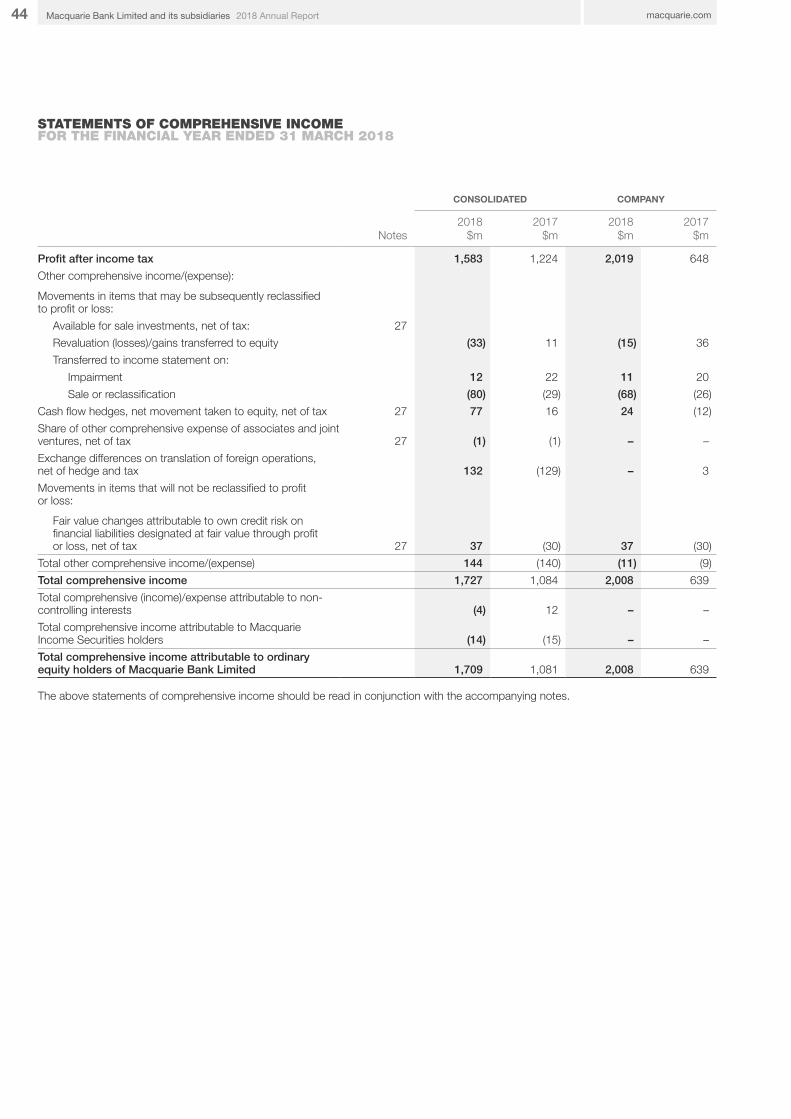
44 macquarie.com2018 Annual ReportMacquarie Bank Limited and its subsidiaries
STATEMENTS OF COMPREHENSIVE INCOMEFOR THE FINANCIAL YEAR ENDED 31 MARCH 2018
CONSOLIDATED COMPANY
Notes2018
$m2017
$m2018
$m2017
$m
Profit after income tax 1,583 1,224 2,019 648
Other comprehensive income/(expense):
Movements in items that may be subsequently reclassified to profit or loss:
Available for sale investments, net of tax: 27
Revaluation (losses)/gains transferred to equity (33) 11 (15) 36
Transferred to income statement on:
Impairment 12 22 11 20
Sale or reclassification (80) (29) (68) (26)
Cash flow hedges, net movement taken to equity, net of tax 27 77 16 24 (12)
Share of other comprehensive expense of associates and joint ventures, net of tax 27 (1) (1) – –
Exchange differences on translation of foreign operations, net of hedge and tax 132 (129) – 3
Movements in items that will not be reclassified to profit or loss:
Fair value changes attributable to own credit risk on financial liabilities designated at fair value through profit or loss, net of tax 27 37 (30) 37 (30)
Total other comprehensive income/(expense) 144 (140) (11) (9)
Total comprehensive income 1,727 1,084 2,008 639
Total comprehensive (income)/expense attributable to non-controlling interests (4) 12 – –
Total comprehensive income attributable to Macquarie Income Securities holders (14) (15) – –
Total comprehensive income attributable to ordinary equity holders of Macquarie Bank Limited 1,709 1,081 2,008 639
The above statements of comprehensive income should be read in conjunction with the accompanying notes.

45FURTHER INFORMATIONOFR DIRECTORS’ REPORT FINANCIAL REPORT
Income StatementsStatements of comprehensive incomeStatements of financial positionStatements of changes in equityStatements of cash flowsNotes to the financial statementsDirectors’ declaration Independent auditor’s report
STATEMENTS OF FINANCIAL POSITIONAS AT 31 MARCH 2018
CONSOLIDATED COMPANY
Notes2018
$m2017
$m2018
$m2017
$m
Assets
Receivables from financial institutions 6 36,629 25,565 35,085 23,907
Trading portfolio assets 7 14,894 26,637 11,823 20,609
Derivative assets 12,695 12,067 10,668 10,788
Investment securities available for sale 8 5,322 5,182 5,158 4,801
Other assets 9 9,287 8,646 5,583 5,179
Loan assets held at amortised cost 10 80,143 75,550 54,542 52,680
Other financial assets at fair value through profit or loss 12 707 760 542 594
Due from related body corporate entities 1,383 1,733 1,212 1,535
Due from subsidiaries 29 – – 27,841 31,071
Property, plant and equipment 13 11,074 10,743 1,127 568
Interests in associates and joint ventures 14 727 203 432 53
Intangible assets 15 214 193 91 104
Investments in subsidiaries 16 – – 7,390 9,331
Deferred tax assets 17 143 162 139 319
Total assets 173,218 167,441 161,633 161,539
Liabilities
Trading portfolio liabilities 18 7,938 4,922 8,286 5,143
Derivative liabilities 11,788 11,101 10,043 10,280
Deposits 19 59,379 57,682 57,919 56,298
Other liabilities 20 8,845 9,375 5,712 6,216
Payables to financial institutions 21 11,653 14,236 9,011 11,212
Due to related body corporate entities 29 13,993 7,367 11,830 5,959
Due to subsidiaries 29 – – 10,549 17,480
Debt issued at amortised cost 22 39,685 43,137 30,674 29,691
Other debt issued at fair value through profit or loss 23 1,992 1,934 1,839 3,921
Deferred tax liabilities 17 586 484 114 131
Total liabilities excluding loan capital 155,859 150,238 145,977 146,331
Loan capital 25 4,256 4,615 4,256 4,615
Total liabilities 160,115 154,853 150,233 150,946
Net assets 13,103 12,588 11,400 10,593
Equity
Contributed equity 26 9,928 9,911 9,821 9,812
Reserves 27 477 373 (3) 45
Retained earnings 27 2,686 2,296 1,582 736
Total capital and reserves attributable to equity holders of Macquarie Bank Limited 13,091 12,580 11,400 10,593
Non-controlling interests 27 12 8 – –
Total equity 13,103 12,588 11,400 10,593
The above statements of financial position should be read in conjunction with the accompanying notes.
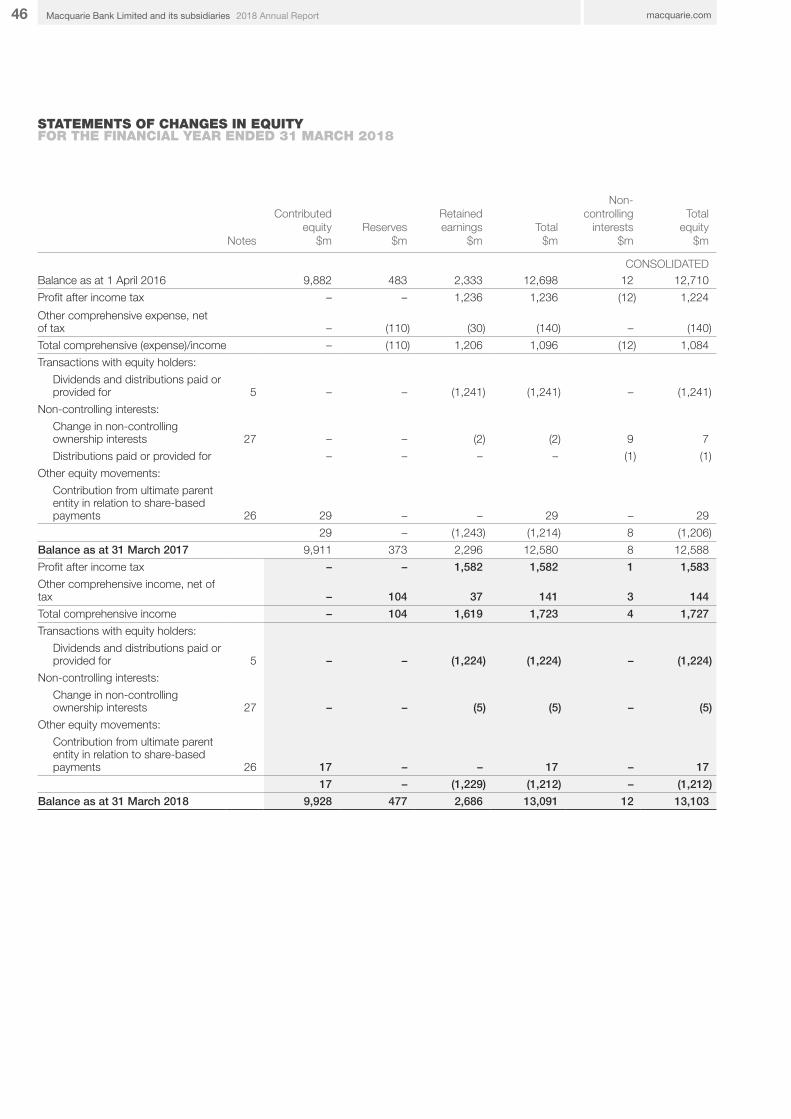
46 macquarie.com2018 Annual ReportMacquarie Bank Limited and its subsidiaries
STATEMENTS OF CHANGES IN EQUITYFOR THE FINANCIAL YEAR ENDED 31 MARCH 2018
Notes
Contributedequity
$mReserves
$m
Retainedearnings
$mTotal
$m
Non-controlling
interests$m
Totalequity
$m
CONSOLIDATEDBalance as at 1 April 2016 9,882 483 2,333 12,698 12 12,710
Profit after income tax – – 1,236 1,236 (12) 1,224
Other comprehensive expense, net of tax – (110) (30) (140) – (140)
Total comprehensive (expense)/income – (110) 1,206 1,096 (12) 1,084
Transactions with equity holders:
Dividends and distributions paid or provided for 5 – – (1,241) (1,241) – (1,241)
Non-controlling interests:
Change in non-controlling ownership interests 27 – – (2) (2) 9 7
Distributions paid or provided for – – – – (1) (1)
Other equity movements:
Contribution from ultimate parent entity in relation to share-based payments 26 29 – – 29 – 29
29 – (1,243) (1,214) 8 (1,206)
Balance as at 31 March 2017 9,911 373 2,296 12,580 8 12,588
Profit after income tax – – 1,582 1,582 1 1,583
Other comprehensive income, net of tax – 104 37 141 3 144
Total comprehensive income – 104 1,619 1,723 4 1,727
Transactions with equity holders:
Dividends and distributions paid or provided for 5 – – (1,224) (1,224) – (1,224)
Non-controlling interests:
Change in non-controlling ownership interests 27 – – (5) (5) – (5)
Other equity movements:
Contribution from ultimate parent entity in relation to share-based payments 26 17 – – 17 – 17
17 – (1,229) (1,212) – (1,212)
Balance as at 31 March 2018 9,928 477 2,686 13,091 12 13,103
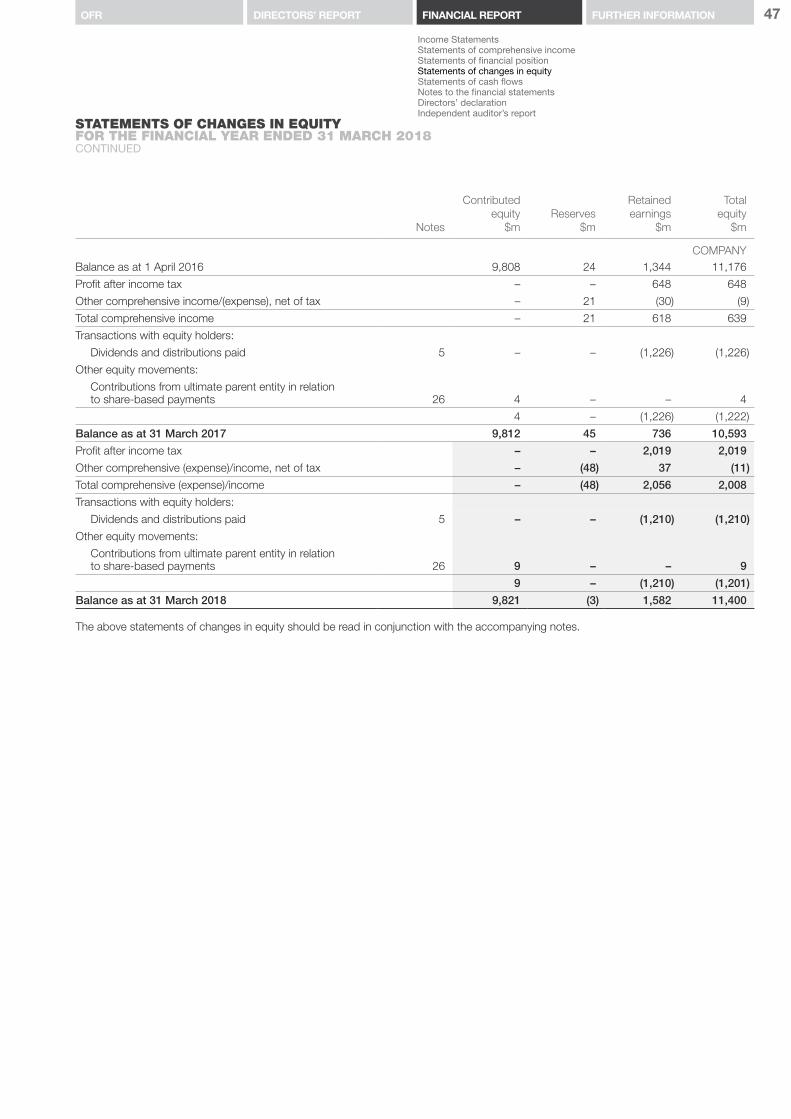
47FURTHER INFORMATIONOFR DIRECTORS’ REPORT FINANCIAL REPORT
Income StatementsStatements of comprehensive incomeStatements of financial positionStatements of changes in equityStatements of cash flowsNotes to the financial statementsDirectors’ declaration Independent auditor’s report
Notes
Contributed equity
$mReserves
$m
Retainedearnings
$m
Totalequity
$m
COMPANYBalance as at 1 April 2016 9,808 24 1,344 11,176
Profit after income tax – – 648 648
Other comprehensive income/(expense), net of tax – 21 (30) (9)
Total comprehensive income – 21 618 639
Transactions with equity holders:
Dividends and distributions paid 5 – – (1,226) (1,226)
Other equity movements:
Contributions from ultimate parent entity in relation to share-based payments 26 4 – – 4
4 – (1,226) (1,222)
Balance as at 31 March 2017 9,812 45 736 10,593
Profit after income tax – – 2,019 2,019
Other comprehensive (expense)/income, net of tax – (48) 37 (11)
Total comprehensive (expense)/income – (48) 2,056 2,008
Transactions with equity holders:
Dividends and distributions paid 5 – – (1,210) (1,210)
Other equity movements:
Contributions from ultimate parent entity in relation to share-based payments 26 9 – – 9
9 – (1,210) (1,201)
Balance as at 31 March 2018 9,821 (3) 1,582 11,400
The above statements of changes in equity should be read in conjunction with the accompanying notes.
STATEMENTS OF CHANGES IN EQUITYFOR THE FINANCIAL YEAR ENDED 31 MARCH 2018CONTINUED
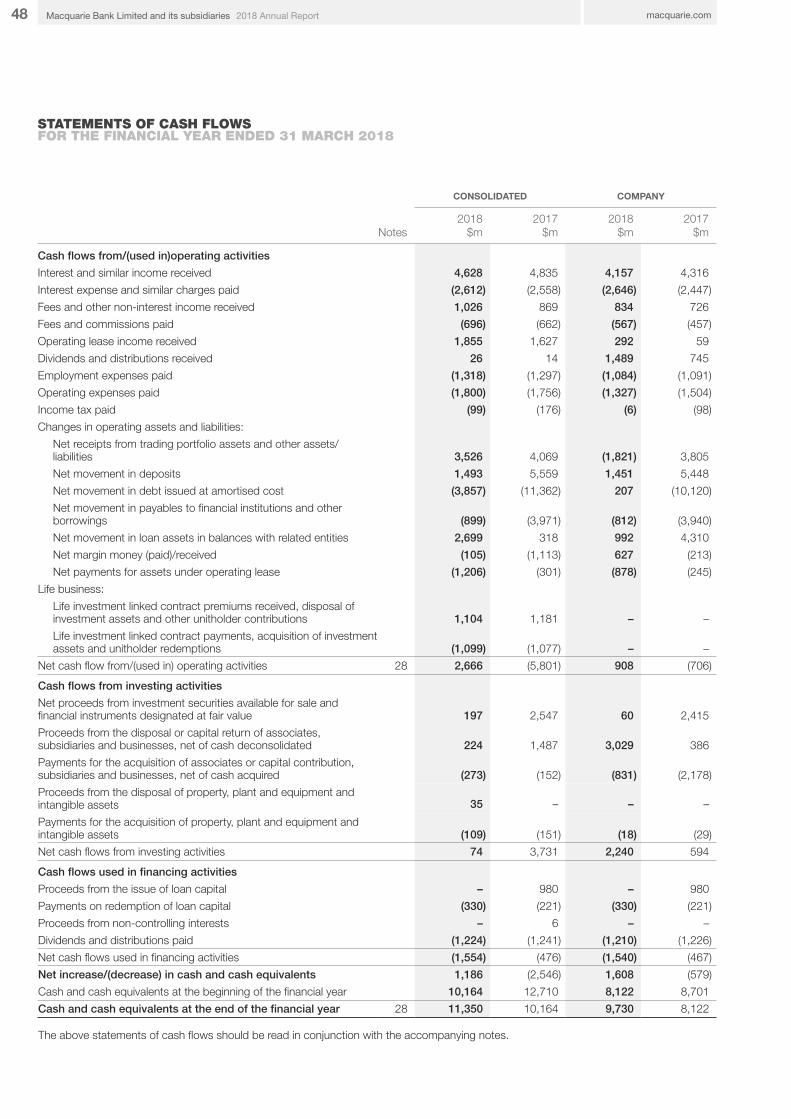
48 macquarie.com2018 Annual ReportMacquarie Bank Limited and its subsidiaries
STATEMENTS OF CASH FLOWSFOR THE FINANCIAL YEAR ENDED 31 MARCH 2018
CONSOLIDATED COMPANY
Notes2018
$m2017
$m2018
$m2017
$m
Cash flows from/(used in)operating activities
Interest and similar income received 4,628 4,835 4,157 4,316
Interest expense and similar charges paid (2,612) (2,558) (2,646) (2,447)
Fees and other non-interest income received 1,026 869 834 726
Fees and commissions paid (696) (662) (567) (457)
Operating lease income received 1,855 1,627 292 59
Dividends and distributions received 26 14 1,489 745
Employment expenses paid (1,318) (1,297) (1,084) (1,091)
Operating expenses paid (1,800) (1,756) (1,327) (1,504)
Income tax paid (99) (176) (6) (98)
Changes in operating assets and liabilities:
Net receipts from trading portfolio assets and other assets/liabilities 3,526 4,069 (1,821) 3,805
Net movement in deposits 1,493 5,559 1,451 5,448
Net movement in debt issued at amortised cost (3,857) (11,362) 207 (10,120)
Net movement in payables to financial institutions and other borrowings (899) (3,971) (812) (3,940)
Net movement in loan assets in balances with related entities 2,699 318 992 4,310
Net margin money (paid)/received (105) (1,113) 627 (213)
Net payments for assets under operating lease (1,206) (301) (878) (245)
Life business:
Life investment linked contract premiums received, disposal of investment assets and other unitholder contributions 1,104 1,181 – –
Life investment linked contract payments, acquisition of investment assets and unitholder redemptions (1,099) (1,077) – –
Net cash flow from/(used in) operating activities 28 2,666 (5,801) 908 (706)
Cash flows from investing activities
Net proceeds from investment securities available for sale and financial instruments designated at fair value 197 2,547 60 2,415
Proceeds from the disposal or capital return of associates, subsidiaries and businesses, net of cash deconsolidated 224 1,487 3,029 386
Payments for the acquisition of associates or capital contribution, subsidiaries and businesses, net of cash acquired (273) (152) (831) (2,178)
Proceeds from the disposal of property, plant and equipment and intangible assets 35 – – –
Payments for the acquisition of property, plant and equipment and intangible assets (109) (151) (18) (29)
Net cash flows from investing activities 74 3,731 2,240 594
Cash flows used in financing activities
Proceeds from the issue of loan capital – 980 – 980
Payments on redemption of loan capital (330) (221) (330) (221)
Proceeds from non-controlling interests – 6 – –
Dividends and distributions paid (1,224) (1,241) (1,210) (1,226)
Net cash flows used in financing activities (1,554) (476) (1,540) (467)
Net increase/(decrease) in cash and cash equivalents 1,186 (2,546) 1,608 (579)
Cash and cash equivalents at the beginning of the financial year 10,164 12,710 8,122 8,701
Cash and cash equivalents at the end of the financial year 28 11,350 10,164 9,730 8,122
The above statements of cash flows should be read in conjunction with the accompanying notes.
49FURTHER INFORMATIONOFR DIRECTORS’ REPORT FINANCIAL REPORT
Income StatementsStatements of comprehensive incomeStatements of financial positionStatements of changes in equityStatements of cash flowsNotes to the financial statementsDirectors’ declaration Independent auditor’s report
NOTE 1 Summary of significant accounting policies(i) Basis of preparationThe principal accounting policies adopted in the preparation of this Financial Report are set out below. These policies have been consistently applied to all the financial years presented, unless otherwise stated.
This Financial Report is a General Purpose Financial Report which has been prepared in accordance with Australian Accounting Standards and the Corporations Act 2001 (Cth). Macquarie Bank is a for-profit entity for the purpose of preparing the financial statements.
Compliance with IFRS as issued by the IASB
Compliance with Australian Accounting Standards ensures that the Financial Report complies with International Financial Reporting Standards (IFRS) as issued by the International Accounting Standards Board (IASB). Consequently, this Financial Report has also been prepared in accordance with and complies with IFRS as issued by the IASB.
Historical cost convention
This Financial Report has been prepared under the historical cost convention except for the following items:
Fair value measurement basis – derivative financial instruments, trading portfolio assets and liabilities, investment securities available for sale, other financial assets and other financial liabilities designated at fair value through profit or loss, and non current assets and disposal groups held for sale where the fair value less cost of disposal is less than their carrying value.
Amortised cost adjusted for changes in fair value attributable to the risk being hedged – recognised financial assets and liabilities designated as hedged items in qualifying fair value hedge relationships.
Critical accounting estimates and significant judgements
The preparation of the Financial Report in conformity with Australian Accounting Standards requires the use of certain critical accounting estimates. It also requires management to exercise judgement in the process of applying the accounting policies. The notes to the financial statements set out areas involving a higher degree of judgement or complexity, or areas where assumptions are significant to Macquarie Bank Limited and its subsidiaries (Consolidated Entity) and the consolidated Financial Report such as:
– fair value of financial assets and financial liabilities including accounting for day 1 profit or loss (Note 37)
– impairment of loan assets held at amortised cost, investment securities available for sale, interests in associates and joint ventures and assets under operating lease (Notes 1(xiii), 1(xv), 1(xvii), 8, 10, 13, 14)
– distinguishing between whether assets or a business is acquired under a business combination (Note 1(iii))
– determination of control of subsidiaries and structured entities (Notes 1(ii) and 34)
– determination of significant influence over associates and joint control over joint ventures (Note 1(ii))
– recoverability of deferred tax assets and measurement of current and deferred tax liabilities (Notes 1(vii), 4 and 17)
– the impairment of goodwill and other identifiable intangible assets with indefinite useful lives (Notes 1(xviii) and 15)
– recognition and measurement of supplemental income, maintenance liabilities and end of lease compensation (Note 1(xx), 9 and 20).
Estimates and judgements are continually evaluated and are based on historical experience and other factors, including reasonable expectations of future events.
Management believes the estimates used in preparing the Financial Report are reasonable. Actual results in the future may differ from those reported and therefore it is reasonably possible, on the basis of existing knowledge, that outcomes within the next financial year that are different from management’s assumptions and estimates could require an adjustment to the carrying amounts of the assets and liabilities reported
New Australian Accounting Standards and amendments to Accounting Standards that are not yet effective
AASB 9 Financial Instruments
AASB 9 results in changes to accounting policies for financial assets and financial liabilities covering Classification and Measurement, Impairment and Hedge accounting. The Consolidated Entity will first apply AASB 9 in the financial year beginning 1 April 2018 and it will be applied retrospectively in respect of Classification and Measurement and Impairment, with no requirement to restate comparatives. The cumulative effect of initially applying the standard is recognised as an adjustment to the opening balance sheet.
Classification and Measurement:
Financial assets
AASB 9 has three classification categories for financial assets; amortised cost, fair value through other comprehensive income (FVTOCI) and fair value through profit or loss (FVTPL). The classification is based on the business model under which the financial instrument is managed and its contractual cash flows.
Compared to AASB 139, the FVTOCI and amortised cost categories will be added and held-to-maturity, loans and receivables and available-for-sale classification categories will be removed.
Under AASB 9, financial assets with embedded derivatives are classified in their entirety, without separating any derivative element.
The Consolidated Entity will apply the following policies for the newly adopted classification categories under AASB 9.
Amortised cost
A financial asset will be measured at amortised cost if both of the following conditions are met:
(i) the financial asset is held within a business model whose objective is to hold financial assets in order to collect contractual cash flows
(ii) the contractual terms of the financial asset give rise on specified dates to cash flows that are solely payments of principal and interest on the principal amount outstanding.
FVTOCI
A financial asset will be measured at FVTOCI if both of the following conditions are met:
(i) the financial asset is held within a business model whose objective is achieved by both collecting contractual cash flows and selling financial assets
(ii) the contractual terms of the financial asset give rise on specified dates to cash flows that are solely payments of principal and interest on the principal amount outstanding.
NOTES TO THE FINANCIAL STATEMENTS FOR THE FINANCIAL YEAR ENDED 31 MARCH 2018
50 macquarie.com2018 Annual ReportMacquarie Bank Limited and its subsidiaries
NOTES TO THE FINANCIAL STATEMENTS FOR THE FINANCIAL YEAR ENDED 31 MARCH 2018CONTINUED
NOTE 1 Summary of significant accounting policies continued(i) Basis of preparation continuedFVTPL
All financial assets that are not measured at amortised cost or FVTOCI will be measured at FVTPL. All financial assets that are equity instruments will be measured at FVTPL unless the Consolidated Entity irrevocably elects to present subsequent changes in the fair value in other comprehensive income. The Consolidated Entity does not expect to make this election.
The Consolidated Entity may also irrevocably elect to designate a financial asset as measured at FVTPL on initial recognition if doing so eliminates or significantly reduces an accounting mismatch.
Business model assessment
The Consolidated Entity will determine the business model at the level that reflects how groups of financial assets are managed. In determining the business model, all relevant evidence that is available at the date of the assessment is used including:
(i) how the performance of financial assets held within that business model are evaluated and reported to the Consolidated Entity’s key management personnel;
(ii) the risks that affect the performance of the business model (and the financial assets held within that business model) and, in particular, the way in which those risks are managed; and
(iii) how managers of the business are compensated (for example, whether the compensation is based on the fair value of the assets managed or on the contractual cash flows collected).
Financial liabilities:
The component of change in fair value of financial liabilities designated at fair value through profit or loss due to the Consolidated Entity’s own credit risk is presented in other comprehensive income, unless this creates an accounting mismatch. If a mismatch is created or enlarged, all changes in fair value (including the effects of credit risk) are presented in profit or loss. Under AASB 139, this component was recognised in profit or loss. This treatment was early adopted prospectively from 1 October 2016.
Impairment:
AASB 9 replaces the incurred loss model of AASB 139 with an expected loss model, resulting in an acceleration of impairment recognition.
The impairment requirements apply to financial assets measured at amortised cost and FVTOCI, lease receivables, amounts receivable from contracts with customers as defined in AASB 15 Revenue from Contracts with Customers, loan commitments, certain letters of credit and financial guarantee contracts.
Under the expected credit loss model, the Consolidated Entity will apply a three-stage approach to measuring the expected credit loss (ECL) based on credit migration between the stages. Where ECL is modelled collectively for portfolios of exposures, it is modelled as the product of the probability of default (PD), the loss given default (LGD) and the exposure at default (EAD).
The assessment of credit risk, and the estimation of ECL, will be unbiased and probability weighted, and incorporate all relevant available information relevant to the assessment, including information about past events, current conditions and reasonable and supportable information about future events and economic conditions at the reporting date.
The impairment allowance is intended to be more forward looking under AASB 9.
(i) Stage 1 – 12 month ECL
At initial recognition, ECL is measured as the product of the 12 month PD, LGD and EAD, adjusted for forward-looking information.
(ii) Stage 2 – Lifetime ECL not credit-impaired
When there has been a significant increase in credit risk (SICR), the ECL is increased to reflect the product of the lifetime PD, LGD and EAD, adjusted for forward-looking information.
(iii) Stage 3 – Lifetime ECL credit-impaired
An ECL is generally measured as the difference between the contractual and expected cash flows from the individual exposure, discounted using the effective interest rate (EIR) for that exposure. For credit-impaired exposures that are modelled collectively, ECL is measured as the product of the lifetime PD, LGD and EAD, adjusted for forward-looking information.
(iv) Purchased or originated credit-impaired
The ECL is measured as the product of the lifetime PD, LGD and EAD adjusted for forward-looking information or by discounting the difference between the contractual and expected cash flows from the individual exposure using the credit-adjusted effective interest rate, with increases and decreases in the measured ECL from the date of origination or purchase being recognised in profit or loss as an impairment expense or gain.
Credit impaired assets generally match the Australian Prudential Regulatory Authority (APRA) definition of default which includes exposures that are at least 90 days past due and where the obligor is unlikely to pay without recourse against available collateral.
Hedge accounting:
The new hedge accounting requirements under AASB 9 simplify hedge accounting by more closely aligning hedge relationships with Macquarie Bank’s risk management activities. Hedge accounting may be applied to a greater variety of hedging instruments and related hedged risks. Hedge effectiveness testing will be less prescriptive under the new standard and make achieving hedge accounting more likely.
The new standard does not explicitly address the accounting for macro hedging activities and includes the choice to retain the current hedge accounting requirements of AASB 139 until an amended standard as an outcome of the IASB’s project on macro hedge accounting is effective. The Consolidated Entity has early adopted the hedge accounting requirements under AASB 9 prospectively for the reporting period beginning 1 April 2018. Enhanced disclosures required by amendments to AASB 7 Financial Instruments Disclosures relating to hedge accounting will be required in the Consolidated Entity’s Financial Report for the financial year beginning 1 April 2018.
51
Income StatementsStatements of comprehensive incomeStatements of financial positionStatements of changes in equityStatements of cash flowsNotes to the financial statementsDirectors’ declaration Independent auditor’s report
FURTHER INFORMATIONOFR DIRECTORS’ REPORT FINANCIAL REPORT
NOTE 1 Summary of significant accounting policies continued(i) Basis of preparation continuedTransition:
The Consolidated Entity will record a transition adjustment to opening balance sheet, retained earnings and other comprehensive income at 1 April 2018 for the impact of the adoption of the classification and measurement, and impairment requirements of AASB 9.
The transition adjustment will reduce the Consolidated Entity’s shareholders’ equity by approximately $125 million after tax and will not have a material impact on the Consolidated Entity’s minimum regulatory capital requirements. The estimated transition adjustment relates primarily to the implementation of the impairment requirements, which will reduce opening retained earnings by $150 million after tax. The Consolidated Entity will not restate comparatives.
The Consolidated Entity will continue to refine and validate components of the ECL impairment models and develop related technology solutions and controls during the financial year ending 31 March 2019.
The adoption of the Classification and Measurement requirements of the standard will result in measurement differences when compared to those under AASB 139. The most significant change is approximately $17,000 million of financial assets measured at amortised cost will be recognised at FVTPL on adoption. The impacted instruments are primarily short-term reverse repurchase agreements and the fair value re-measurement is included in the above. There are no other material changes in measurement categories expected.
In the separate financial statements of the Company, adoption will result in additional credit provisioning in relation to amounts due from subsidiaries. In addition, the Company will measure certain loan assets and amounts due from subsidiaries, currently measured at amortised costs, at FVOCI and FVTPL respectively. The total transition impact to the Company’s shareholders’ equity on transition is a reduction of approximately $100 million.
AASB 7 Financial Instruments: Disclosures
AASB 7 has been amended to include more extensive qualitative and quantitative disclosure relating to AASB 9, such as new financial instrument classification categories which will impact disclosures related to the statement of financial performance as well as introducing new qualitative and quantitative disclosure requirements for the three stage impairment model. The amendment also includes new hedge accounting disclosures and transition disclosures related to the adoption of AASB 9.
AASB 2017-6 Amendments to Australian Accounting Standards – Prepayments features with negative compensation.
AASB 2017-6 amends AASB 9 to permit entities to measure at amortised cost or fair value through other comprehensive income, particular financial assets that would otherwise have contractual cash flows that are solely payments of principal and interest but do not meet that condition only as a result of a prepayment feature. This is subject to meeting other conditions, such as the nature of the business model relevant to the financial asset. Otherwise, the financial assets would be measured at fair value through profit or loss.
AASB 2017-6 is effective for annual periods beginning on or after 1 January 2019. The Consolidated Entity will early adopt the amendment from 1 April 2018. The impact of this amendment is included in the transition adjustment for AASB 9.
AASB 2017-7 Amendments to Australian Accounting Standards – Long-term interests in associates and joint ventures.
AASB 2017-7 clarifies the accounting for long-term interests in an associate or joint venture, which in substance form part of the net investment in the associate or joint venture, but to which the equity method is not applied. Such long term interests are accounted under AASB 9 before applying the loss allocation and impairment requirements in AASB 128 Investments in Associates and Joint Ventures. These long term interests are in the nature of debt instruments. Macquarie will calculate the expected credit losses on these long-term interests under the AASB 9 impairment model.
AASB 2017-6 is effective for annual periods beginning on or after 1 January 2019. The Consolidated Entity will early adopt the amendment in the financial year beginning 1 April 2018. The impact of this amendment is included in the transition adjustment for AASB 9.
AASB 15 Revenue from Contracts with Customers
AASB 15 replaces all current guidance on revenue recognition from contracts with customers. It requires identification of discrete performance obligations within a transaction and an associated transaction price allocation to these obligations. Revenue is recognised upon satisfaction of these performance obligations, which occur when control of the goods or services are transferred to the customer. Revenue received for a contract that includes a variable amount is subject to revised conditions for recognition, whereby it must be highly probable that no significant reversal of the variable component will occur when the uncertainties around its measurement are removed.
AASB 15 also specifies the accounting treatment for costs incurred to obtain or fulfil a contract. Costs are recognised as an asset only if the entity expects to recover them. Any capitalised contract costs are amortised on a systematic basis that is consistent with the transfer of the related goods and services.
In 2016, the AASB issued clarifying amendments to AASB 15. These amendments provided additional application guidance but did not alter the underlying requirements of the standard.
The Consolidated Entity will first apply AASB 15 in the financial year beginning 1 April 2018, retrospectively, recognising the cumulative effect of initially applying the standard as an adjustment to the opening balance of retained earnings, with no comparatives restatement.
AASB 15 specifically excludes financial instruments recognised under AASB 9 Financial Instruments. As such, the impacted revenue streams for Macquarie Bank are limited to fee-based revenue items such as brokerage and commissions and portfolio administration fees.
Macquarie Bank’s assessment of revenue streams existing at transition has concluded. Based on this assessment, neither the Consolidated Entity or the Company will be materially impacted upon adoption and no transition adjustment is required. The application of the requirements of AASB 15 are broadly consistent with Macquarie Bank’s current accounting policies.
The Consolidated Entity and the Company expects presentation changes in the income statements relating to certain charges from subsidiaries and related body corporate entities under fee sharing and other arrangements, previously recognised net of any associated revenue.

52 macquarie.com2018 Annual ReportMacquarie Bank Limited and its subsidiaries
NOTES TO THE FINANCIAL STATEMENTS FOR THE FINANCIAL YEAR ENDED 31 MARCH 2018CONTINUED
NOTE 1 Summary of significant accounting policies continued(i) Basis of preparation continuedAASB 16 Leases
AASB 16 replaces the current AASB 117 Leases standard and sets out a comprehensive model for identifying lease arrangements and the subsequent measurement. A contract contains a lease if it conveys the right to control the use of an identified asset for a period of time. The majority of leases from the lessee perspective within the scope of AASB 16 will require the recognition of a ‘right-of-use’ asset and a related lease liability, being the present value of future lease payments. This will result in an increase in the recognised assets and liabilities in the statement of financial position as well as a change in expense recognition, with interest and depreciation replacing operating lease expense. Classification of leases from the Consolidated Entity’s perspective as lessor remains unchanged under AASB 16.
Unless early adopted, AASB 16 is effective for the Consolidated Entity for the annual periods beginning 1 April 2019.The Consolidated Entity is expected to apply the standard retrospectively, recognising the cumulative effect of initially applying the standard as an adjustment to the opening balance of retained earnings. Alternative methods of calculating the ‘right-of-use’ asset are allowed under AASB 16 which impact the size of the transition adjustment. The Consolidated Entity is still evaluating which method to apply.
An initial assessment has been performed based on operating leases that exist in the current reporting period. Based on this assessment it is not anticipated that there will be a material impact to retained earnings. This assessment is subject to the composition of operating leases at the date of transition. A schedule of current operating lease commitments is disclosed in Note 33.
AASB 2016-5 Amendments to Australian Accounting Standards – Classification and Measurement of Share-based Payment Transactions
The amendment addresses the accounting for cash-settled share-based payments and equity-settled awards that include a ‘net settlement’ feature in respect of withholding taxes. The amendment clarifies the measurement basis for cash-settled share-based payments and the accounting for modifications that change an award from cash-settled to equity-settled. It also introduces an exception that will require an award to be treated as if it was wholly equity-settled, where an employer is obliged to withhold an amount for the employee’s tax obligation associated with a share-based payment and pay that amount to the tax authority.
The requirements would be effective for the Consolidated Entity on 1 April 2018. The Consolidated Entity has early adopted this amendment from 1 April 2017. Retrospective application did not have a material impact on the financial position nor performance of the Consolidated Entity or the Company.
AASB Interpretation 23 (Interpretation 23) Uncertainty over Income Tax Treatments
Interpretation 23 clarifies the application of the recognition and measurement criteria in AASB 112 Income Taxes where there is uncertainty over income tax treatments. It requires assessment of each uncertain tax position as to whether it is probable that a taxation authority will accept the position. Where it is not probable, the effect of the uncertainty will be reflected in determining the relevant taxable profit or loss, tax bases, unused tax losses, unused tax credits or tax rates. The amount will be determined as either the single most likely amount or the sum of the probability weighted amounts in a range of possible outcomes, whichever better predicts the resolution of the uncertainty. Judgements will be reassessed as and when new facts and circumstances come to light.
Interpretation 23 will apply to the Consolidated Entity from 1 April 2019. An initial assessment has been performed and based on this assessment it is not expected that the implementation of Interpretation 23 will materially impact the Consolidated Entity’s or the Company’s statement of financial position or income statement. This assessment is subject to the matters relevant at the date of transition.
(ii) Principles of consolidationSubsidiaries
The consolidated financial report comprises the financial report of the Consolidated Entity. Subsidiaries are all those entities (including structured entities) in relation to which the Consolidated Entity has:
(i) power to direct the relevant activities(ii) exposure to significant variable returns(iii) the ability to utilise power to affect the Consolidated Entity’s
own returns.
The determination of control is based on current facts and circumstances and is continuously assessed.
The Consolidated Entity has power over an entity when it has existing substantive rights that give it the current ability to direct the entity’s relevant activities. Relevant activities are those activities that significantly affect the entity’s returns. The Consolidated Entity evaluates whether it has the power to direct the relevant activities. The Consolidated Entity also considers the entity’s purpose and design. If the Consolidated Entity determines that it has power over an entity, the Consolidated Entity then evaluates whether it has exposure or rights to variable returns that, in aggregate, are significant. All variable returns are considered including, but not limited to, returns from debt or equity investments, guarantees, liquidity arrangements, variable fees and certain derivative contracts.
Structured entities
Structured entities (SEs) are those entities where voting rights do not have a significant effect on its investors’ returns, including where voting rights relate to administrative tasks only and contractual arrangements dictate how the entity should carry out its activities. When assessing whether the Consolidated Entity controls (and therefore consolidates) a SE, judgement is required as to whether the Consolidated Entity has power over the relevant activities as well as exposure to significant variable returns of the SE.
Where the Consolidated Entity has power over, is exposed to significant variable returns through the residual risk associated with its involvement in SEs and is able to affect its returns, the underlying assets, liabilities, revenues and expenses of these SEs are reported in the consolidated financial statements.
53
Income StatementsStatements of comprehensive incomeStatements of financial positionStatements of changes in equityStatements of cash flowsNotes to the financial statementsDirectors’ declaration Independent auditor’s report
FURTHER INFORMATIONOFR DIRECTORS’ REPORT FINANCIAL REPORT
NOTE 1 Summary of significant accounting policies continued(ii) Principles of consolidation continuedConsolidation
The effects of all transactions between entities in the Consolidated Entity are eliminated in full. Non-controlling interests (NCI) in the results and equity of subsidiaries, where the Consolidated Entity owns less than 100% of the issued capital, are shown separately in the consolidated income statements, consolidated statements of comprehensive income and consolidated statements of financial position.
Where control of an entity was obtained during the financial year, its results are included in the consolidated income statements from the date on which control commenced. Where control of an entity ceased during the financial year, its results are included for that part of the financial year during which control existed.
The Consolidated Entity determines the dates of obtaining control (i.e. acquisition date) and losing control (i.e. disposal date) of another entity based on an assessment of all pertinent facts and circumstances that affect the ability to direct the relevant activities and the capacity to influence returns of that entity. Facts and circumstances that have the most impact include the contractual arrangements agreed with the counterparty, the manner in which those arrangements are expected to operate in practice and whether regulatory approval is required to complete. The acquisition or disposal date does not necessarily occur when the transaction is closed or finalised under law.
Subsidiaries held by the Company are carried in its financial statements at cost less impairment in accordance with AASB 127 Separate Financial Statements.
Interests in associates and joint ventures
Associates and joint ventures are entities over which the Consolidated Entity has significant influence or joint control, but not control. Investment in associates and joint ventures that are accounted for under the equity method except those which are classified as held for sale and loans to associates and joint ventures are accounted for under effective interest rate method. The equity method of accounting is applied in the consolidated financial report and involves the recognition of the Consolidated Entity’s share of its associates’ and joint ventures’ post-acquisition profits or loss in the consolidated income statements, and the share of the post-acquisition movements in reserves in the consolidated statements of comprehensive income. Dividends or distributions from associates or joint ventures reduce the carrying amount of the investment.
The Consolidated Entity determines the dates of obtaining or losing significant influence or joint control of another entity based on an assessment of all pertinent facts and circumstances that affect the ability to significantly influence or jointly control the financial and operating policies of that entity. Facts and circumstances that have the most impact include the contractual arrangements agreed with the counterparty, the manner in which those arrangements are expected to operate in practice, and whether regulatory approval is required to complete. The acquisition or disposal date does not necessarily occur when the transaction is closed or finalised under law.
(iii) Business combinationsBusiness combinations are accounted for using the acquisition method. Cost is measured as the aggregate of the fair values (at the acquisition date) of assets acquired, equity instruments issued or liabilities incurred or assumed at the date of acquisition. Transaction costs arising on the issue of equity instruments are recognised
directly in equity, and those arising on borrowings are capitalised and included in interest expense using the effective interest method.
Identifiable assets acquired and liabilities and contingent liabilities assumed in a business combination are measured at their fair values on the acquisition date. The Consolidated Entity can elect, on a transaction-by-transaction basis, to measure NCI relating to ordinary shares either at fair value or at the NCI’s proportionate share of the fair values of the identifiable assets and liabilities. The excess of the consideration over the Consolidated Entity’s share of the fair value of the identifiable net assets acquired is recorded as goodwill. If the consideration is less than the Consolidated Entity’s share of the fair value of the identifiable net assets of the business acquired, the difference is recognised directly in the consolidated income statements, but only after a reassessment of the identification and measurement of the net assets acquired. For contingent consideration provided, the amount is subsequently remeasured to its fair value with changes recognised in the consolidated income statement.
Where settlement of any part of cash consideration is deferred, the amounts payable in the future are discounted to their present values as at the date of exchange. The discount rate used is the entity’s incremental borrowing rate, being the rate at which a similar borrowing could be obtained from an independent financier under comparable terms and conditions.
Distinguishing between whether assets or a business is acquired involves judgement. Some of the factors that the Consolidated Entity uses in identifying a business combination are:
– the nature of the Consolidated Entity’s industry and business model, which affects the nature of an input, process or output
– whether the acquisition included at least a majority of the critical inputs (for example tangible or intangible assets, and intellectual property) and a majority of the critical processes (for example strategic processes, skilled and experienced workforce)
– the relative ease of replacing the critical processes not acquired by either integrating within the Consolidated Entity’s existing processes or sub-contracting them to third parties
– the presence of goodwill.
(iv) Segment reporting Operating segments are identified on the basis of internal reports to senior management about components of the Consolidated Entity that are regularly reviewed by senior management who have been identified as the chief operating decision makers, in order to allocate resources to the segment and to assess its performance. Information reported to senior management for the purposes of resource allocation and assessment of performance is specifically focused on core products and services offered, comprising five reportable segments as disclosed in Note 3. Information about products and services and geographical segments is based on the financial information used to produce the Consolidated Entity’s financial statements.
(v) Foreign currency translation Functional and presentation currency
Items included in the Group financial statements of foreign operations for each of the Groups’ entities are measured using the currency of the primary economic environment in which the entity operates (the functional currency). The Consolidated Entity’s and the Company’s financial statements are presented in Australian dollars (the presentation currency), which is also the Company’s functional currency.

54 macquarie.com2018 Annual ReportMacquarie Bank Limited and its subsidiaries
NOTES TO THE FINANCIAL STATEMENTS FOR THE FINANCIAL YEAR ENDED 31 MARCH 2018CONTINUED
NOTE 1 Summary of significant accounting policies continuedTransactions and balances
Foreign currency transactions are translated into the functional currency using the exchange rates prevailing at the transaction date. Foreign exchange gain and loss resulting from the settlement of such transactions and from the translation at year end exchange rates of monetary assets and liabilities denominated in foreign currencies are recognised in the income statement, except when deferred in other comprehensive income (OCI) as a result of meeting cash flow hedge or net investment hedge accounting requirements (see Note 1(xii)).
Non-monetary items (such as equities) held at fair value through profit or loss, are reported as part of the fair value gain or loss in the income statement. Translation differences on non-monetary items classified as available for sale financial assets are included in the available for sale reserve in equity, unless they form part of fair value hedge relationships in which case the translation differences are recognised in the income statement (see Note 1(xii)).
Subsidiaries and other entities
The results and financial position of all entities that have a functional currency other than Australian dollars are translated into Australian dollars as follows:
– assets and liabilities for each statement of financial position presented are translated at the closing exchange rate at the date of that statement of financial position
– income and expenses for each income statement are translated at actual exchange rates at the dates of the transactions, and
– all resulting exchange differences are recognised in OCI within a separate component of equity, being the foreign currency translation reserve.
On consolidation, exchange differences arising from the translation of any net investment in foreign operations and of borrowings and other foreign currency instruments designated as hedges of such investments, are taken to the foreign currency translation reserve through OCI. When a foreign operation is disposed of or any borrowings forming part of the net investment are repaid, such exchange differences are recognised in the income statement as part of the gain or loss on disposal.
Goodwill and fair value adjustments arising on the acquisition of a foreign entity are treated as assets and liabilities of the foreign entity and translated at the closing rate.
(vi) Revenue and expense recognition Revenue is measured at the fair value of the consideration received or receivable. Revenue is recognised for each major revenue stream as follows:
Net interest income
Interest income and interest expense are brought to account using the effective interest rate method. The effective interest rate method calculates the amortised cost of a financial instrument and allocates the interest income or interest expense over the relevant period. The effective interest rate is the rate that discounts estimated future cash receipts or payments through the expected life of the financial instrument or, when appropriate, a shorter period, to the net carrying amount of the financial asset or liability. Fees and transaction costs associated with loans are capitalised and included in the effective interest rate and recognised in the income statement
over the expected life of the instrument. Interest income on finance leases is brought to account progressively over the life of the lease consistent with the outstanding investment balance.
Fee and commission income
Fee and commission income includes fees from fund management, brokerage, account servicing, underwriting and securitisation arrangements and is recognised as the related services are performed. Where commissions and fees are subject to clawback or meeting certain performance hurdles, they are recognised as income when it is highly probable those conditions will not affect the outcome.
Fee and commission income and expenses that are integral to the effective interest rate on a financial asset or liability are capitalised and included in the effective interest rate and recognised in the income statement over the expected life of the instrument.
Net trading income
Net trading income comprises gains and losses related to trading assets and liabilities and include all realised and unrealised fair value changes, dividends, ineffective hedge accounting movements and foreign exchange differences.
Net operating lease income
Operating lease income is recognised on a straight-line basis over the lease term. It comprises operating lease income and supplemental rent and is presented net of depreciation expense.
Dividends and distributions
Dividends and distributions are recognised as income when the Consolidated Entity becomes entitled to the dividend or distribution. Dividends or distributions from subsidiaries, associates and joint ventures are recognised in the income statement of the Company when the right to receive the dividend or distribution is established.
(vii) TaxationThe principles of the balance sheet method of tax effect accounting have been adopted whereby the income tax expense for the financial year is the tax payable on the current year’s taxable income adjusted for changes in deferred tax assets and liabilities attributable to temporary differences between the tax bases of assets and liabilities and their carrying amounts in the financial statements and unused tax losses.
Deferred tax assets are recognised when temporary differences arise between the tax bases of assets and liabilities and their respective carrying amounts which give rise to a future tax benefit, or when a benefit arises due to unused tax losses. In both cases, deferred tax assets are recognised only to the extent that it is probable that future taxable amounts will be available to utilise those temporary differences or tax losses. Deferred tax liabilities are recognised when such temporary differences will give rise to taxable amounts that are payable in future periods. Deferred tax assets and liabilities are recognised at the tax rates expected to apply when the assets are recovered or the liabilities are settled under enacted or substantively enacted tax law.
Deferred tax assets and liabilities are offset when there is a legally enforceable right to offset current tax assets and liabilities and when the deferred tax balances relate to the same taxation authority. Current tax assets and liabilities are offset when there is a legally enforceable right to offset and an intention to either settle on a net basis, or realise the asset and settle the liability simultaneously. Current and deferred taxes attributable to amounts recognised directly in equity are also recognised directly in equity.
55
Income StatementsStatements of comprehensive incomeStatements of financial positionStatements of changes in equityStatements of cash flowsNotes to the financial statementsDirectors’ declaration Independent auditor’s report
FURTHER INFORMATIONOFR DIRECTORS’ REPORT FINANCIAL REPORT
NOTE 1 Summary of significant accounting policies continued(vii) Taxation continuedThe Consolidated Entity and the Company exercise judgement in determining whether deferred tax assets, particularly in relation to tax losses, are probable of recovery. Factors considered include the ability to offset tax losses within the tax consolidated group in Australia or groups of entities in overseas jurisdictions, the nature of the tax loss, the length of time that tax losses are eligible for carry forward to offset against future taxable profits and whether future taxable profits are expected to be sufficient to allow recovery of deferred tax assets.
The Consolidated Entity undertakes transactions in the ordinary course of business where the income tax treatment requires the exercise of judgement. The Consolidated Entity estimates the amount expected to be paid to/(recovered from) tax authorities based on its understanding of the law.
Tax consolidation
The Consolidated Entity’s Australian tax liabilities are determined according to tax consolidation legislation. All eligible Australian resident wholly-owned subsidiaries of Macquarie Group comprise a tax consolidated group with MGL as the head entity. As a consequence, the Company and the relevant subsidiaries are not liable to make income tax payments and do not recognise any current tax balances or any deferred tax assets arising from unused tax losses. Under the terms and conditions of a tax funding agreement, MGL charges each subsidiary for all current tax liabilities incurred in respect of their activities and reimburses each subsidiary for any tax assets arising from unused tax losses.
Should MGL be in default of its tax payment obligations, or a default is probable, the current tax balances of the subsidiaries will be determined in accordance with the terms and conditions of a tax sharing agreement between MGL and entities in the tax consolidated group.
Goods and services tax (GST)
Where GST (or other value added tax) is not recoverable from global tax authorities, it is either capitalised to the statement of financial position as part of the cost of the asset or expensed to the income statement.
Where GST (or other value added tax) is recoverable from or payable to global tax authorities, the amount is recorded as a separate asset or liability in the statement of financial position.
Cash flows are presented on a gross basis in the statement of cash flows.
(viii) Cash collateral on securities borrowed/lent and reverse repurchase/repurchase agreementsAs part of its trading activities, the Consolidated Entity borrows and lends securities on a collateralised basis. The securities subject to the borrowing or lending are not derecognised from the statements of financial position of the relevant parties, as the risks and rewards of ownership remain with the initial holder.
Reverse repurchase transactions, where the Consolidated Entity purchases securities under an agreement to resell, and repurchase transactions, where the Consolidated Entity sells securities under an agreement to repurchase, are also conducted on a collateralised basis. The securities subject to the reverse repurchase and repurchase agreements are not derecognised from the statements of financial position of the relevant parties, as the risks and rewards of ownership remain with the initial holder.
Cash provided as collateral on securities borrowed or on the reverse repurchase agreement is included in receivables from financial institution or other assets based on the counterparty, while cash received from third parties on securities lent or repurchase agreement is included in payables to financial institutions or other liabilities based on the counterparty.
The Consolidated Entity continually reviews the fair values of the securities on which the above transactions are based and, where appropriate, requests or provides additional collateral to support the transactions, in accordance with the underlying agreements.
(ix) Recognition and derecognition of financial instrumentsFinancial instruments are recognised when the Consolidated Entity becomes a party to the contractual provisions of the instrument. Specific policies are provided for the various financial instrument categories below.
Financial assets are derecognised from the statement of financial position when the rights to cash flows have expired (for example because the borrower repays its obligations), the loan is sold and substantially all the risks and rewards of ownership are transferred.
Financial liabilities are derecognised from the statement of financial position when the Consolidated Entity’s obligation has been discharged, cancelled or has expired.
Where an existing financial instrument is replaced by another with the same counterparty on substantially different terms, or the terms of an existing instrument are substantially modified, the exchange or modification is treated as a derecognition of the original instrument and the recognition of a new instrument, with the difference in the respective carrying amounts recognised in the income statement.
(x) Trading portfolio assets and liabilitiesTrading portfolio assets (long positions) comprise debt and equity securities, bank bills, treasury notes, bullion and commodities purchased with the intent of being actively traded. Trading portfolio liabilities (short positions) comprise obligations to deliver assets across the same trading categories, which the Consolidated Entity has short-sold with the intent of being actively traded.
Assets and liabilities included in the trading portfolio are carried at fair value (see Note 37). Commodities are measured at fair value less costs to sell, in accordance with the broker-trader exception. Realised and unrealised gains and losses arising from changes in the fair value of the trading portfolio are recognised as net trading income in the income statement in the period in which they arise.
Dividend income or expense on the trading portfolio is recognised in the income statement as net trading income.
The Consolidated Entity uses trade date accounting when recording regular way purchases and sales of trading portfolio financial assets. At the date a purchase transaction is entered into (trade date), the Consolidated Entity recognises the resulting financial asset and any subsequent unrealised profit or loss arising from revaluing that contract to fair value is recognised in the income statement. When the Consolidated Entity becomes party to a sale contract of a financial asset, and the derecognition criteria are met, it derecognises the asset and recognises a trade receivable from trade date until settlement date. The same trade date accounting applies for available for sale financial instruments and financial instruments designated at fair value through profit or loss.
56 macquarie.com2018 Annual ReportMacquarie Bank Limited and its subsidiaries
NOTES TO THE FINANCIAL STATEMENTS FOR THE FINANCIAL YEAR ENDED 31 MARCH 2018CONTINUED
NOTE 1 Summary of significant accounting policies continuedThe Consolidated Entity uses trade date accounting when accounting for purchases and sales of trading portfolio financial liabilities.
(xi) Derivative instruments Derivative instruments entered into by the Consolidated Entity include futures, forwards and forward rate agreements, swaps and options in the interest rate, foreign exchange, commodity and equity markets. These derivative instruments are principally used for the risk management of existing financial assets and financial liabilities.
All derivatives, including those held for hedging purposes, are recognised on the statement of financial position and are disclosed as an asset where they have a positive fair value at balance date or as a liability where the fair value at balance date is negative.
Derivatives are initially recognised at fair value on the date a derivative contract is entered into and subsequently re-measured to their fair value. Fair values are obtained from quoted market prices in active markets including recent market transactions, and valuation techniques including discounted cash flow models and option pricing models, as appropriate. Movements in the fair values of derivatives are recognised in the income statement in net trading income, unless the derivative meets the requirements for hedge accounting.
The best evidence of a derivative’s fair value at initial recognition is its transaction price, unless its fair value is evidenced by comparison with other observable current market transactions in the same instrument, or based on a valuation technique for which variables include only data from observable markets. Where such alternative evidence exists, the Consolidated Entity recognises profit or loss immediately when the derivative is recognised (‘day 1 profit or loss’). When significant unobservable inputs are used to determine fair value, the day 1 profit or loss is deferred and is recognised in the income statement over the life of the transaction or when the inputs become observable.
(xii) Hedge accountingThe Consolidated Entity designates certain derivatives or financial instruments as hedging instruments in qualifying hedge relationships. On initial designation of the hedge, the Consolidated Entity documents the hedge relationship between hedging instruments and hedged items, as well as its risk management objectives and strategies. The Consolidated Entity also documents its assessment, both at hedge inception and on an ongoing basis, of whether hedging relationships have been and will continue to be highly effective. Derivatives or financial instruments can be designated in one of three types of hedge relationships.
Cash flow hedges
For a derivative or financial instrument designated as hedging the variability in cash flows attributable to a particular risk associated with a recognised asset or liability (or a highly probable forecast transaction), the gain or loss on the derivative or financial instrument associated with the effective portion of the hedge is initially recognised in the cash flow hedging reserve through OCI and subsequently released to the income statement when the hedged item affects the income statement. The gain or loss relating to the ineffective portion of the hedge is recognised immediately in the income statement under net trading income.
Fair value hedges
For a derivative or financial instrument designated as hedging the change in fair value of a recognised asset or liability (or an unrecognised firm commitment), the gain or loss on the derivative or financial instrument is recognised in the income statement immediately, together with the loss or gain on the hedged asset or liability that is attributable to the hedged risk.
Net investment hedges
For a derivative or borrowing designated as hedging a net investment in a foreign operation, the gain or loss on revaluing the derivative or borrowing associated with the effective portion of the hedge is recognised in the foreign currency translation reserve and subsequently released to the income statement when the foreign operation is disposed of. The ineffective portion is recognised in the income statement immediately.
The fair values of various financial instruments used for hedging purposes are disclosed in Note 35 – Derivative Financial Instruments. Movements in the cash flow hedging reserve in equity are shown in Note 27 – Reserves, retained earnings and non-controlling interests.
(xiii) Investments and other financial assetsWith the exception of trading portfolio assets and derivatives, which are classified separately in the statement of financial position, the remaining investments in financial assets are classified into the following categories: loans and receivables, other financial assets at fair value through profit or loss and investment securities available for sale. The classification depends on the purpose for which the financial asset was acquired, which is determined at initial recognition and, except for other financial assets at fair value through profit or loss, is re-evaluated at each balance date.
Loans and receivables
This category includes loan assets held at amortised cost, other receivables and amounts due from subsidiaries, which are non derivative financial assets with fixed or determinable payments that are not quoted in an active market. Loans and receivables are recognised on settlement date, when cash is advanced to the borrower.
Other financial assets at fair value through profit or loss
This category includes only those financial assets which have been designated by management as held at fair value through profit or loss on initial recognition.
Management may elect to designate a financial asset as such if:
– the asset contains embedded derivatives which must otherwise be separated and carried at fair value
– it is part of a group of financial assets and financial liabilities managed and evaluated on a fair value basis in accordance with a documented risk management or investment strategy, and reporting is provided on that basis to key management personnel, or
– doing so eliminates or significantly reduces a measurement or recognition inconsistency that would otherwise arise.
Interest income on debt securities designated as at fair value through profit or loss is recognised in the income statement in interest income using the effective interest method as disclosed in Note 1(vi).
57
Income StatementsStatements of comprehensive incomeStatements of financial positionStatements of changes in equityStatements of cash flowsNotes to the financial statementsDirectors’ declaration Independent auditor’s report
FURTHER INFORMATIONOFR DIRECTORS’ REPORT FINANCIAL REPORT
NOTE 1 Summary of significant accounting policies continued(xiii) Investments and other financial assets continuedInvestment securities available for sale
Investment securities in this category are available for sale and may be sold should the need arise, including for purposes of liquidity, or due to fair value movements resulting from the impacts of changes in interest rates, foreign exchange rates or equity prices.
Investment securities available for sale are initially carried at fair value plus transaction costs. Gains and losses arising from subsequent changes in fair values are recognised through OCI in the available for sale reserve in equity until the asset is derecognised or impaired, at which time the cumulative gain or loss is recognised in the income statement. Fair values of quoted investments in active markets are based on current bid prices.
If the relevant market is not considered active (or the securities are unlisted), fair value is established by valuation techniques, including recent arm’s length transactions, discounted cash flow analysis and other valuation techniques commonly used by market participants.
Interest income on debt securities available for sale is recognised in the income statement in interest income using the effective interest method as disclosed in Note 1(vi).
Dividends from equity securities available for sale are recognised in the income statement when the Consolidated Entity becomes entitled to the dividend or distribution as disclosed in Note 1(vi).
Life investment linked assets and liabilities
Life investment policies consist of two components: a financial instrument and an investment management fee. The investment management fee is recognised through the income statement over the period for which the service is provided, while the deposit component is designated at fair value through the profit or loss. Life investment contracts are directly linked to the performance and market value of the assets that back them and the fair value is measured as the minimum current surrender value. Withdrawals and surrenders of life investment contracts are treated as a reduction in the investment contract liability. Life investment linked assets are measured at fair value through the profit or loss, with any changes in fair value recognised in the income statement in the period in which they occur.
(xiv) Non-current assets and disposal groups classified as held for saleThis category includes interests in businesses, subsidiaries and associates and joint ventures for which their carrying amount will be recovered principally through a sale or distribution transaction rather than continuing use, and subsidiaries held exclusively with a view to sale or distribute. These assets and disposal groups are classified as held for sale when it is highly probable that the asset will be sold or distributed within 12 months subsequent to being classified as such.
Where there is a planned partial disposal of a subsidiary resulting in loss of control, all of the assets and liabilities of the subsidiary are classified as held for sale.
Non-current assets and assets of disposal groups classified as held for sale are measured at the lower of their carrying amount and fair value less costs to sell. These assets have not been equity accounted and depreciated.
An impairment loss is recognised for any initial or subsequent write down of the asset to fair value less costs to sell. A gain is recognised for any subsequent increase in fair value less costs to sell, limited by the cumulative impairment loss previously recognised. A gain or loss not previously recognised by the date of sale is recognised at the date of sale.
(xv) Impairment Loan assets held at amortised cost
Loan assets are subject to regular review and assessment for possible impairment. Provisions for impairment on loan assets are recognised based on an incurred loss model and re-assessed at each balance date. A provision for impairment is recognised when there is objective evidence of impairment, and is calculated based on the present value of expected future cash flows, discounted using the original effective interest rate.
Individually assessed provisions for impairment are recognised where impairment of individual loans are identified. Where individual loans are found not to be impaired, they are placed into pools of assets with similar risk profiles and collectively assessed for losses that have been incurred but are not yet specifically identifiable.
The Consolidated Entity makes judgements as to whether there is any observable data indicating that there is a significant decrease in the estimated future cash flows from a portfolio of loans before the decrease can be identified with an individual loan in that portfolio. This evidence may include observable data indicating that there has been an adverse change in the payment status of the borrowers in a group, or national or local economic conditions that correlate with defaults on assets in the group. Management uses estimates based on historical loss experience for assets with credit risk characteristics and objective evidence of impairment similar to those in the portfolio when scheduling its future cash flows. The methodology and assumptions used for estimating both the amount and timing of future cash flows are reviewed regularly to reduce any differences between loss estimates and actual loss experience.
Changes in assumptions used for estimating future cash flows could result in a change in the estimated provisions for impairment on loan assets at the end of a reporting period.
If, in a subsequent period, the amount of impairment loss decreases and the decrease can be related objectively to an event occurring after the impairment loss was recognised, the previously recognised impairment loss is reversed through the income statement to the extent of what the amortised cost would have been had the impairment not been recognised.
When the Consolidated Entity concludes that there is no reasonable expectation of recovering cash flows from the loan asset and all possible collateral has been realised, the loan is written off, either partially or in full, against the related provision. Recoveries of loans previously written off are recorded based on the cash received.
Investment securities available for sale
The Consolidated Entity performs an assessment at each balance date to determine whether there is any objective evidence that available for sale financial assets have been impaired. Impairment exists if there is objective evidence of impairment as a result of one or more events (loss event) which have an impact on the estimated future cash flows of the financial asset that can be reliably estimated.
For equity securities classified as available for sale, the main indicators of impairment are: significant changes in the market, economic or legal environment and a significant or prolonged decline in fair value below cost. In making this judgement, the Consolidated Entity evaluates, among other factors, the normal volatility in share price and the period of time for which fair value has been below cost.
58 macquarie.com2018 Annual ReportMacquarie Bank Limited and its subsidiaries
NOTES TO THE FINANCIAL STATEMENTS FOR THE FINANCIAL YEAR ENDED 31 MARCH 2018CONTINUED
NOTE 1 Summary of significant accounting policies continued(xv) Impairment continuedIn the case of debt securities classified as available for sale, observable data that relates to loss events are considered, including adverse changes in the payment status of the issuer and national or local economic conditions that correlate with defaults on those assets.
In addition, impairment may be appropriate when there is evidence of deterioration in the financial condition of the investee, industry and sector performance, operational and financing cash flows or changes in technology.
When the fair value of an available for sale financial asset is less than its initial carrying amount and there is objective evidence that the asset is impaired, the cumulative loss recognised directly in OCI is removed from equity and recognised in the income statement.
Impairment losses recognised in the income statement for equity securities classified as available for sale are not subsequently reversed through the income statement. However impairment losses recognised for debt investment securities classified as available for sale are subsequently reversed through the income statement if the fair value increases and the increase can be objectively related to an event after the impairment loss was recognised in the income statement.
Interests in associates and joint ventures
The Consolidated Entity performs an assessment at each balance date to determine whether there is any objective evidence that its interests in associates and joint ventures are impaired. The entire carrying amount of each investment in associate and joint venture is considered in the assessment. The main indicators of impairment are as for equity securities classified as available for sale, disclosed above.
If there is an indication that an investment in an associate or joint venture may be impaired, then the entire carrying amount of the investment in the associate or joint venture is tested for impairment by comparing the recoverable amount (higher of value in use and fair value less costs to sell) with its carrying amount. Impairment losses recognised in the income statement for investments in associates and joint ventures are subsequently reversed through the income statement if there has been a change in the estimates used to determine the recoverable amount since the impairment loss was recognised.
(xvi) Investments in subsidiariesInvestments in subsidiaries are reviewed annually for indicators of impairment or more frequently if events or changes in circumstances indicate that the carrying amount may not be recoverable. An impairment loss recognised for the amount by which the investment’s carrying amount exceeds its recoverable amount (which is the higher of fair value less costs to sell and value in use). At each reporting date, investments in subsidiaries that have been impaired are reviewed for possible reversal of the impairment recognised in income statement.
(xvii) Property, plant and equipmentProperty, plant and equipment are stated at historical cost (which includes directly attributable borrowing costs) less accumulated depreciation and accumulated impairment losses, if any. Property, plant and equipment are reviewed for indicators of impairment (or possible reversal of previous impairment losses) at each reporting date. Historical cost includes expenditure directly attributable to the acquisition of the asset. Property, plant and equipment includes assets leased out under operating leases.
Depreciation on aviation assets is calculated on a diminishing balance method and depreciation on all other assets is calculated on a straight line basis to allocate the difference between cost and residual values over their estimated useful lives, at the following rates:
Buildings 2 to 3.3%
Furniture, fittings and leasehold improvements(1) 10 to 20%
Equipment 33 to 50%
Infrastructure assets 2 to 10%
Aviation(2) 2 to 8%
Meters 5 to 15%
Rail cars 3 to 5%
Telecommunications 33%
Other operating lease assets 2 to 50%
(1) Where remaining lease terms are less than five years, leasehold improvements are depreciated over the remaining lease term.
(2) Includes aircraft, for which depreciation is calculated on a diminishing-value basis.
Useful lives and residual values are reviewed annually and reassessed in light of commercial and technological developments. If an asset’s carrying value is greater than its recoverable amount, the carrying amount is written down immediately to its recoverable amount. Adjustments arising from such items and on disposal of property, plant and equipment are recognised in the income statement.
Gains and losses on disposal are determined by comparing proceeds with the asset’s carrying amount and are recognised in the income statement.
(xviii) Goodwill and other identifiable intangible assetsGoodwill
Goodwill represents the excess of the consideration over the Consolidated Entity’s share of the fair value of the identifiable net assets of the acquired entity or business at the date of acquisition. Goodwill arising from business combinations is included in intangible assets in the statement of financial position.
Other identifiable intangible assets
An intangible asset is considered to have an indefinite useful life where it is expected to contribute to the Consolidated Entity’s net cash inflows indefinitely.
Licences and trading rights are generally carried at cost less accumulated impairment loss. Where no contractual or legal limitation exists, these assets are not amortised because they are considered to have an indefinite useful life.
Management rights have a finite useful life and are carried at cost less accumulated amortisation and accumulated impairment loss. Amortisation is calculated using the straight-line method to allocate the cost of management rights over the estimated useful life, usually a period not exceeding 20 years.
Customer and servicing contracts acquired with a finite useful life are carried at cost less accumulated amortisation and accumulated impairment loss. Amortisation is calculated over the period for which the customer relationship is expected to exist.
Customer and servicing contracts with an indefinite useful life are carried at cost less accumulated impairment loss.
59
Income StatementsStatements of comprehensive incomeStatements of financial positionStatements of changes in equityStatements of cash flowsNotes to the financial statementsDirectors’ declaration Independent auditor’s report
FURTHER INFORMATIONOFR DIRECTORS’ REPORT FINANCIAL REPORT
NOTE 1 Summary of significant accounting policies continued(xviii) Goodwill and other identifiable intangible assets continuedSoftware
Certain internal and external costs directly incurred in acquiring and developing certain software are capitalised and amortised over the estimated useful life, usually a period of three to seven years. Cost incurred on software maintenance is expensed as incurred.
Impairment
Goodwill and intangible assets that have an indefinite useful life are not subject to amortisation but are tested annually for impairment, or more frequently if events or changes in circumstances indicate that the carrying amount may not be recoverable. For intangible assets that have a finite useful life, an assessment is made at each reporting date for indications of impairment. An impairment loss is recognised for the amount by which the asset’s carrying amount exceeds its recoverable amount. The recoverable amount is the higher of the asset’s fair value less costs to sell and value in use. For the purposes of assessing impairment, assets are grouped at the lowest levels for which there are separately identifiable cash inflows which are largely independent of the cash inflows from other assets or groups of assets (cash-generating units). Intangible assets (other than goodwill) that suffered impairment are reviewed for possible reversal of the impairment at each reporting date.
In relation to businesses acquired and held for disposal, the individual business is treated as a cash generating unit. Assets associated with strategic business acquisitions are allocated to each of the operating segments (see Note 3 – Segment reporting) and assessed for impairment.
(xix) Financial liabilitiesThe Consolidated Entity has on issue debt securities and instruments which are initially recognised on settlement date at fair value net of transaction costs incurred, and subsequently measured at amortised cost. Any difference between the proceeds (net of transaction costs) and the redemption amount is recognised in the income statement over the period of the borrowing using the effective interest method.
Other debt issued at fair value through profit or lossThis category includes only those financial liabilities which have been designated by management as held at fair value through profit or loss on initial recognition. Management may elect to designate a financial liability as such if:
– the liability contains embedded derivatives which must otherwise be separated and carried at fair value
– the liability is part of a group of financial assets and financial liabilities managed and evaluated on a fair value basis in accordance with a documented risk management or
– investment strategy, and reporting is provided on that basis to key management personnel, or
– doing so eliminates or significantly reduces a measurement or recognition inconsistency that would otherwise arise.
For financial liabilities designated at fair value through profit or loss, the Consolidated Entity uses trade date accounting on recognition and settlement date accounting on derecognition of the obligation.
Interest expense on such items is recognised in the income statement as interest expense using the effective interest method. Changes in fair value due to the change in the Consolidated Entity’s own credit are recognised in Other Comprehensive Income.
(xx) Supplemental rent, maintenance liability and end of lease compensationUnder certain leases, the Consolidated Entity requires lessees to make regular additional rent payments based on aircraft utilisation to contribute towards maintenance expenditure related to Major Maintenance Events (MMEs). These payments are typically calculated on the basis of hourly utilisation, calendar time or the number of cycles operated at an agreed rate specified in the lease. These payments are recorded as supplemental rent revenue in the period in which it is earned.
In certain circumstances, the Consolidated Entity agrees to an alternative mechanism to earn supplemental rent known as end of lease compensation. This compensation is typically calculated on the basis of the condition of each major component at the end of the lease relative to the commencement of the lease measured by hours, number of cycles or calendar time at an agreed rate specified in the lease. The Consolidated Entity accrues the expected lessee’s compensation for the use of the aircraft over the term of the lease and agrees to defer the receipt of this compensation until the lease end.
At the beginning and throughout the term of each lease, the Consolidated Entity estimates the maintenance liability for MMEs which are expected to occur during the lease and accrues for this over the same term. Management determines this estimate based on quantitative and qualitative information including aircraft utilisation, area of operation, costs and timing of MMEs. Maintenance expenses are recorded in the income statement net of supplemental rent revenue. Maintenance liabilities are recognised separately and disclosed in Note 20 – Other liabilities.
(xxi) ProvisionsEmployee benefits
A liability for employee benefits is recognised by the entity that has the obligation to the employee. Generally, this is consistent with the legal position of the parties to the employment contract.
Liabilities for unpaid salaries, salary related costs and provisions for annual leave are recorded in the statement of financial position at the salary rates which are expected to be paid when the liability is settled. Provisions for long service leave and other long-term benefits are recognised at the present value of expected future payments to be made.
In determining this amount, consideration is given to expected future salary levels and employee service histories. Expected future payments are discounted to their net present value using discount rates on high quality corporate bonds, except where there is no deep market, in which case rates on Commonwealth Government securities are used. Such discount rates have terms that match as closely as possible the expected future cash flows.
Provisions for unpaid employee benefits are derecognised when the benefit is settled, or is transferred to another entity and the Company and Consolidated Entity are legally released from the obligation and do not retain a constructive obligation.
Dividends
Provisions for dividends to be paid by the Company are recognised in the statement of financial position as a liability and a reduction in retained earnings when the dividend has been declared.
60 macquarie.com2018 Annual ReportMacquarie Bank Limited and its subsidiaries
NOTES TO THE FINANCIAL STATEMENTS FOR THE FINANCIAL YEAR ENDED 31 MARCH 2018CONTINUED
NOTE 1 Summary of significant accounting policies continued(xxii) Performance based remunerationShare-based payments
The ultimate parent company, MGL operates share-based compensation plans, which include awards (including those delivered through the MEREP) granted to employees under share acquisition plans. Information relating to these schemes is set out in Note 31. The Consolidated Entity recognises an expense and a corresponding increase in equity in case of equity settled awards or a corresponding increase in liability in case of cash settled awards granted to employees. The awards are measured at the grant dates based on their fair value and using the number of equity instruments expected to vest. This amount is recognised as an expense over the respective vesting periods.
Performance hurdles attached to PSUs under the MEREP are not taken into account when determining the fair value of the PSUs at grant date. Instead, these vesting conditions are taken into account by adjusting the number of equity instruments expected to vest.
Profit share remuneration
The Consolidated Entity recognises a liability and an expense for profit share remuneration to be paid in cash.
(xxiii) Cash and cash equivalentsCash and cash equivalents comprise of:
– cash and short-term amounts included in receivables from financial institutions and loan assets at amortised cost with original contractual maturity of three months or less, and
– certain trading portfolio assets and debt securities with original contractual maturity of three months or less.
(xxiv) Investment propertyInvestment properties are initially recognised at cost and subsequently stated at fair value at each balance date. Any change in fair value is recognised in the consolidated income statement.
(xxv) LeasesLeases where the lessee has substantially all the risks and rewards incidental to ownership of the leased assets are classified as finance leases. All other leases are operating leases.
Where finance leases are granted to third parties, the present value of the minimum lease payments plus an estimate of the value of any unguaranteed residual value is recognised as a receivable and included in loan assets held at amortised cost. The difference between the gross receivable and the present value of the receivable is unearned interest income. Lease receipts are discounted using the interest rate implicit in the lease. Lease income is recognised over the term of the lease using the effective interest method, which reflects a constant rate of return.
Leases entered into by the Consolidated Entity as lessee are primarily operating leases. The total fixed payments made under operating leases are charged to the income statement on a straight-line basis over the period of the lease.
Purchased assets, where the Consolidated Entity is the lessor under operating leases, are carried at cost and depreciated over their useful lives which vary depending on each class of asset and range from 2 to 50 years. Operating lease income is recognised on a straight-line basis over the period of the lease unless another systematic basis is more appropriate. Assets leased out under operating leases are included in property, plant and equipment.
(xxvi) Offsetting financial instrumentsFinancial assets and financial liabilities are offset and the net amount reported on the statement of financial position when there is a legally enforceable right to offset the amounts and either there is an intention to settle on a net basis, or realise the financial asset and settle the financial liability simultaneously.
(xxvii) Loan capitalLoan capital is debt issued by the Consolidated Entity with terms and conditions that qualify for inclusion as capital under APRA Prudential Standards. For compound instruments that have both equity and liability features, the liability component is initially measured at fair value plus directly attributable transaction costs and thereafter at amortised cost using the effective interest method. Capital instruments with conversion features (i.e. Common Equity Capital Trigger Event or Non-Viability Trigger Events) are considered to contain embedded derivatives and are accounted for separately at fair value through profit and loss if the derivative is deemed to not be closely related to the capital instrument.
(xxviii) Contributed equityOrdinary shares are classified as equity. Incremental costs directly attributable to the issue of new shares are shown in equity as a deduction, net of tax, from the proceeds.
(xxix) Changes in ownership interestsWhen acquiring additional interests of a financial asset (such that it becomes an associate, joint venture or subsidiary) or an investment in an associate or joint venture (such that it becomes a subsidiary), previously held interests are revalued to their current fair value and any gain or loss is immediately recognised in the income statement.
Similarly, when selling ownership interests of a subsidiary (such that control is lost), or an investment in an associate or joint venture (such that it becomes a financial asset), retained ownership interests are revalued to their current fair value and any gain or loss is immediately recognised in the income statement.
When increasing or decreasing the ownership interests of a subsidiary that remains a subsidiary afterwards, the consideration exchanged is recognised directly in equity. Any changes in ownership of an associate that remains an associate only impacts the investment and does not create any profit or loss.
(xxx) Discontinued operationsA discontinued operation is a component of the entity’s business that represents a separate major line of business or area of operation that has been disposed of or is classified as held for sale. Classification as a discontinued operation occurs upon disposal or when the operation meets the criteria to be classified as held for sale, if earlier. When an operation is classified as a discontinued operation, the comparative income statement is re-presented as if the operation had been discontinued from the start of the comparative period. The results of the discontinued operations, if any, are presented separately on the face of the income statements.
(xxxi) Comparatives Where necessary, comparative information has been restated to conform to changes in presentation in the current year.
(xxxii) Rounding of amountsIn accordance with ASIC Corporations (Rounding in Financial/Directors’ Reports) Instrument 2016/191, amounts in the Directors’ Report and Financial Report have been rounded off to the nearest million Australian dollars unless otherwise indicated.
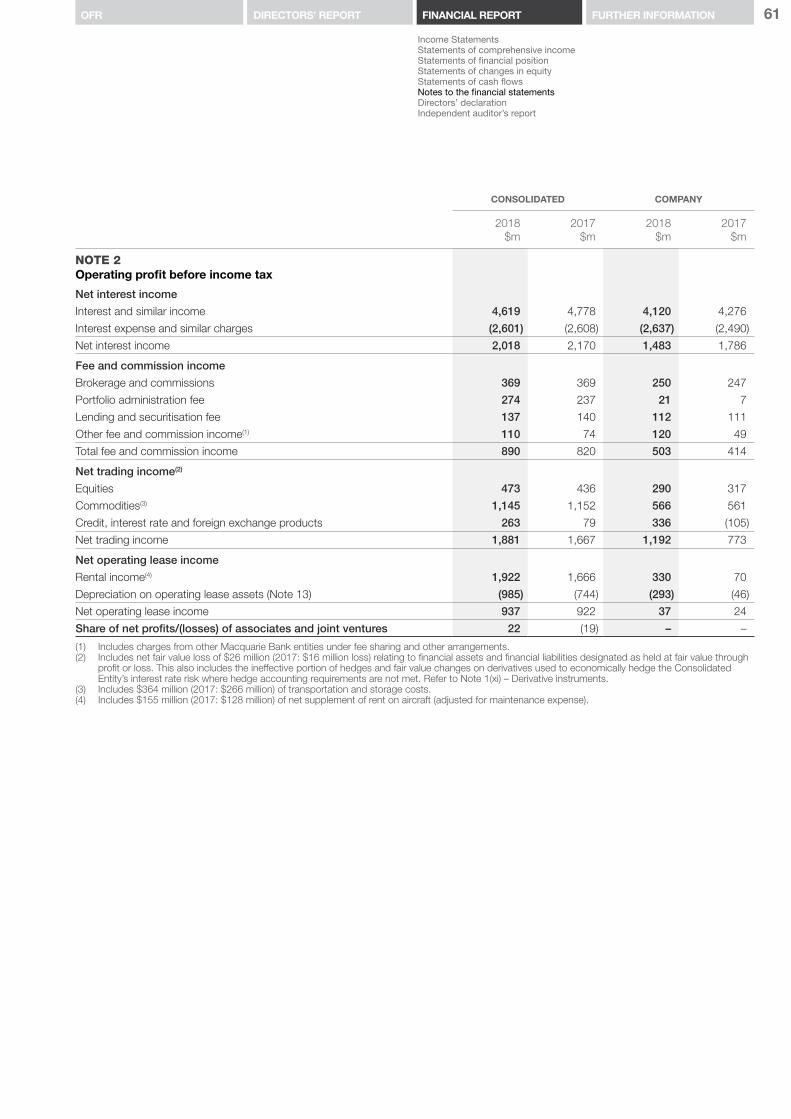
61
Income StatementsStatements of comprehensive incomeStatements of financial positionStatements of changes in equityStatements of cash flowsNotes to the financial statementsDirectors’ declaration Independent auditor’s report
FURTHER INFORMATIONOFR DIRECTORS’ REPORT FINANCIAL REPORT
CONSOLIDATED COMPANY
2018$m
2017 $m
2018$m
2017$m
NOTE 2Operating profit before income tax
Net interest income
Interest and similar income 4,619 4,778 4,120 4,276
Interest expense and similar charges (2,601) (2,608) (2,637) (2,490)
Net interest income 2,018 2,170 1,483 1,786
Fee and commission income
Brokerage and commissions 369 369 250 247
Portfolio administration fee 274 237 21 7
Lending and securitisation fee 137 140 112 111
Other fee and commission income(1) 110 74 120 49
Total fee and commission income 890 820 503 414
Net trading income(2)
Equities 473 436 290 317
Commodities(3) 1,145 1,152 566 561
Credit, interest rate and foreign exchange products 263 79 336 (105)
Net trading income 1,881 1,667 1,192 773
Net operating lease income
Rental income(4) 1,922 1,666 330 70
Depreciation on operating lease assets (Note 13) (985) (744) (293) (46)
Net operating lease income 937 922 37 24
Share of net profits/(losses) of associates and joint ventures 22 (19) – –
(1) Includes charges from other Macquarie Bank entities under fee sharing and other arrangements.(2) Includes net fair value loss of $26 million (2017: $16 million loss) relating to financial assets and financial liabilities designated as held at fair value through
profit or loss. This also includes the ineffective portion of hedges and fair value changes on derivatives used to economically hedge the Consolidated Entity’s interest rate risk where hedge accounting requirements are not met. Refer to Note 1(xi) – Derivative instruments.
(3) Includes $364 million (2017: $266 million) of transportation and storage costs.(4) Includes $155 million (2017: $128 million) of net supplement of rent on aircraft (adjusted for maintenance expense).

62 macquarie.com2018 Annual ReportMacquarie Bank Limited and its subsidiaries
NOTES TO THE FINANCIAL STATEMENTS FOR THE FINANCIAL YEAR ENDED 31 MARCH 2018CONTINUED
CONSOLIDATED COMPANY
2018$m
2017 $m
2018$m
2017 $m
NOTE 2Operating profit before income tax continued
Other operating income and chargesInvestment income
Net gain on sale of investment securities available for sale 31 39 16 34
Net gain on sale of interests in associates and joint ventures 27 110 26 57
Net fair value gains on financial instruments designated at fair value 46 – 46 –
Net gain on acquisition, disposal, reclassification and change in ownership interest of investments, associates and businesses and assets held for sale 168 377 79 51
Dividend/distributions from investment securities available for sale 6 10 3 11
Dividends/distributions from Subsidiaries (Note 29) – – 1,485 734
Total investment income 278 536 1,655 887
Impairment (charge)/reversal
Investment securities available for sale (16) (32) (15) (28)
Intangible assets and other non-financial assets (26) (45) – (18)
Interests in associates and joint ventures (8) (6) (1) (11)
Investment in subsidiaries – – 19 (164)
Total impairment (charge)/reversal (50) (83) 3 (221)
(Provision)/recovery on loans and other receivables
Individually assessed provisions (93) (173) (80) (142)
Recovery of individually assessed provisions 33 23 23 12
Collective allowance for credit losses reversed 134 – 112 25
Amounts written off (134) (147) (60) (92)
Recovery of amounts previously written off 41 44 22 25
Total (provision)/recovery on loan and other receivables (19) (253) 17 (172)
Other income 206 61 347 291
Total other operating income and charges 415 261 2,022 785
Net operating income(1) 6,163 5,821 5,237 3,782
(1) Prior comparative financial year has been reclassified to conform to current financial year presentation.
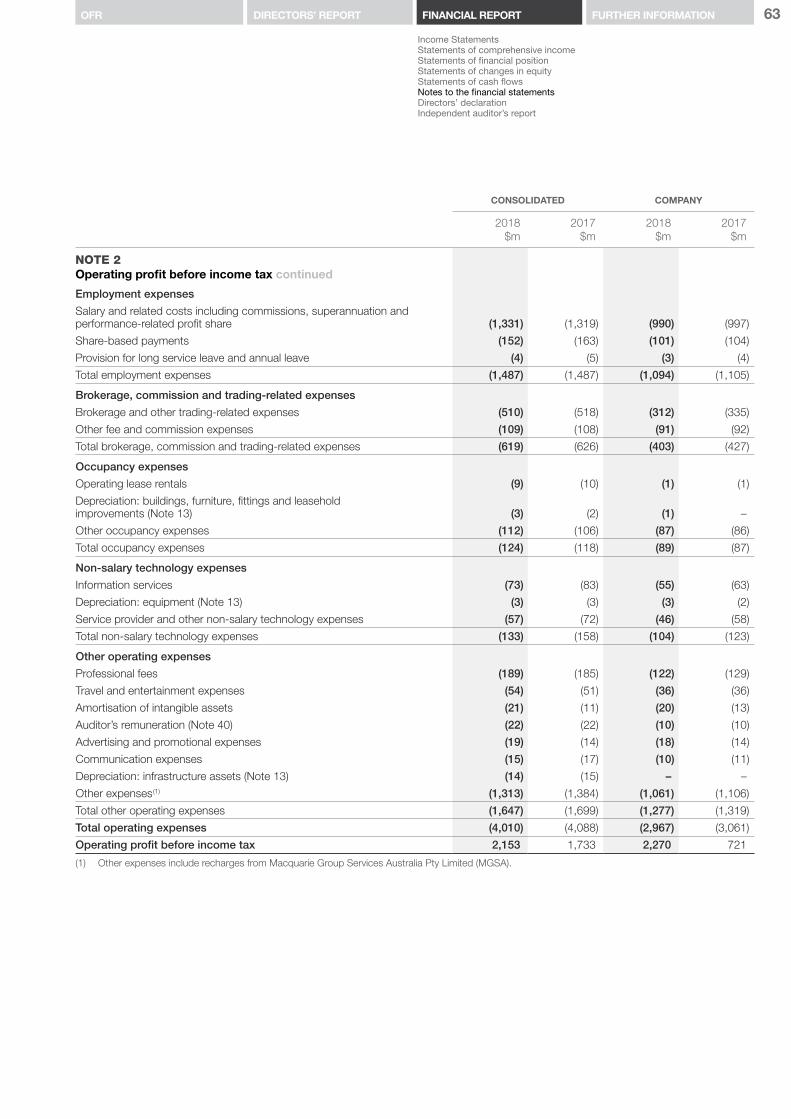
63
Income StatementsStatements of comprehensive incomeStatements of financial positionStatements of changes in equityStatements of cash flowsNotes to the financial statementsDirectors’ declaration Independent auditor’s report
FURTHER INFORMATIONOFR DIRECTORS’ REPORT FINANCIAL REPORT
CONSOLIDATED COMPANY
2018$m
2017 $m
2018$m
2017 $m
NOTE 2Operating profit before income tax continued
Employment expenses
Salary and related costs including commissions, superannuation and performance-related profit share (1,331) (1,319) (990) (997)
Share-based payments (152) (163) (101) (104)
Provision for long service leave and annual leave (4) (5) (3) (4)
Total employment expenses (1,487) (1,487) (1,094) (1,105)
Brokerage, commission and trading-related expenses
Brokerage and other trading-related expenses (510) (518) (312) (335)
Other fee and commission expenses (109) (108) (91) (92)
Total brokerage, commission and trading-related expenses (619) (626) (403) (427)
Occupancy expenses
Operating lease rentals (9) (10) (1) (1)
Depreciation: buildings, furniture, fittings and leasehold improvements (Note 13) (3) (2) (1) –
Other occupancy expenses (112) (106) (87) (86)
Total occupancy expenses (124) (118) (89) (87)
Non-salary technology expenses
Information services (73) (83) (55) (63)
Depreciation: equipment (Note 13) (3) (3) (3) (2)
Service provider and other non-salary technology expenses (57) (72) (46) (58)
Total non-salary technology expenses (133) (158) (104) (123)
Other operating expenses
Professional fees (189) (185) (122) (129)
Travel and entertainment expenses (54) (51) (36) (36)
Amortisation of intangible assets (21) (11) (20) (13)
Auditor’s remuneration (Note 40) (22) (22) (10) (10)
Advertising and promotional expenses (19) (14) (18) (14)
Communication expenses (15) (17) (10) (11)
Depreciation: infrastructure assets (Note 13) (14) (15) – –
Other expenses (1) (1,313) (1,384) (1,061) (1,106)
Total other operating expenses (1,647) (1,699) (1,277) (1,319)
Total operating expenses (4,010) (4,088) (2,967) (3,061)
Operating profit before income tax 2,153 1,733 2,270 721
(1) Other expenses include recharges from Macquarie Group Services Australia Pty Limited (MGSA).
64 macquarie.com2018 Annual ReportMacquarie Bank Limited and its subsidiaries
NOTES TO THE FINANCIAL STATEMENTS FOR THE FINANCIAL YEAR ENDED 31 MARCH 2018CONTINUED
NOTE 3 Segment reporting(i) Operating segmentsAASB 8 Operating Segments requires the ‘management approach’ to disclosing information about the Consolidated Entity’s reportable segments. The financial information is reported on the same basis as used internally by senior management for evaluating operating segment performance and for deciding how to allocate resources to operating segments. Such information may be produced using different measures to that used in preparing the statutory income statement.
For internal reporting, performance measurement and risk management purposes, the Consolidated Entity is divided into four Operating Groups and a Corporate segment. These segments have been set up based on the different core products and services offered. There were previously five Operating Groups and during the prior year ended Commodities and Financial Markets merged with Macquarie Securities to form CGM. Segment information has been prepared in accordance with the basis of preparation described below.
The Operating Groups comprise:
MAM offers a range of investment solutions with an alternate fixed income focus, for its fiduciary clients within the infrastructure debt sector and balance sheet lending to shipping, export credit agency backed debt, hedge funds and private equity investors.
CAF operates in selected international markets, providing specialist financing, investing and asset management solutions. CAF has expertise in flexible primary financing, secondary market investing and asset finance including aircraft, vehicles, technology, healthcare, manufacturing, industrial, energy, rail and mining equipment.
BFS provides a diverse range of personal banking, wealth management and business banking products and services to retail clients, advisers, brokers and business clients.
CGM provides clients with an integrated, end-to-end offering across global markets including equities, fixed income, foreign exchange and commodities.
The Operating Groups are grouped into annuity-style businesses and capital markets facing businesses:
– Annuity-style businesses comprise of MAM, CAF and BFS – Capital markets facing businesses comprise of CGM only.
The Corporate segment, which is not considered an Operating Group, includes head office and central service groups including Group Treasury. The Corporate segment also holds certain legacy investments, assets and businesses that are no longer core for strategic reasons and not allocated to any of the Operating Groups.
Items of income and expense within the Corporate segment include the net impact of managing liquidity for the Consolidated Entity, earnings on capital, non-trading derivative volatility, earnings from investments, central overlay on impairment, provisions or valuation of assets, unallocated head office costs and, costs of central service groups, the Consolidated Entity’s performance-related profit share and share based payments expense, income tax expense and certain distributions attributable to non-controlling interests and holders of loan capital.
All transactions and transfers between segments are generally determined on an arm’s length basis and are included within the relevant categories of income or expense. These transactions eliminate on aggregation/consolidation.
Below is a selection of key policies applied in determining operating segment results.

65
Income StatementsStatements of comprehensive incomeStatements of financial positionStatements of changes in equityStatements of cash flowsNotes to the financial statementsDirectors’ declaration Independent auditor’s report
FURTHER INFORMATIONOFR DIRECTORS’ REPORT FINANCIAL REPORT
NOTE 3 Segment reporting continued(i) Operating segments continuedInternal funding arrangements
Group Treasury has the responsibility for managing funding for the Consolidated Entity, and Operating Groups obtain their funding from Group Treasury. The interest rates charged by Group Treasury are determined by the currency and term of the funding. Break costs are charged to Operating Groups for the early repayment of term funding.
In certain cases, Operating Groups may source funding directly from external sources – typically where the funding is secured by the assets of the Operating Group. In such cases the Operating Group bears the funding costs directly and Group Treasury may levy additional charges where appropriate.
Deposits are a funding source for the Consolidated Entity. BFS receives a deposit premium from Group Treasury on deposits they generate. This deposit premium is included within net interest and trading income for segment reporting purposes.
Transactions between Operating Groups
Operating Groups that enter into arrangements with other Operating Groups must do so on commercial terms or as agreed by the Consolidated Entity’s CEO or CFO. There is a requirement for accounting symmetry in such transactions.
Internal transactions are recognised in each of the relevant categories of income and expense as appropriate.
Accounting for derivatives that economically hedge interest rate risk
For businesses that predominately earn income from lending activities (CAF and BFS), derivatives that economically hedge interest rate risk are required to be carried at fair value through net trading income unless they form part of a qualifying hedge relationship. Hedge relationships are generally only recognised at a Consolidated Entity level; however for segment reporting, derivatives are accounted for on an accruals basis in the Operating Group segments and changes in fair value are recognised within the Corporate segment offset by the effect of hedge relationships at the total Consolidated Entity level.
Central service groups
Central service groups recover their costs from Operating Groups generally on either a time and effort allocation basis or a fee for service basis. Central service groups include COG, FMG, RMG, Legal and Governance and Central Executive.
Performance-related profit share and share based payments expense
Performance-related profit share and share based payments expense relating to the MEREP is recognised in the Corporate segment and not allocated to Operating Groups.
Income tax
Income tax expense and benefits are recognised in the Corporate segment and not allocated to Operating Groups. However, to recognise an Operating Group’s contribution to permanent income tax differences, an internal management revenue or charge is used. These internal management revenue/charges are offset by an equal and opposite amount recognised in the Corporate segment such that they are eliminated on aggregation.

66 macquarie.com2018 Annual ReportMacquarie Bank Limited and its subsidiaries
NOTES TO THE FINANCIAL STATEMENTS FOR THE FINANCIAL YEAR ENDED 31 MARCH 2018CONTINUED
Macquarie AssetManagement
$m
Corporate andAsset Finance
$m
Banking andFinancialServices
$m
Commoditiesand Global
Markets$m
Corporate$m
Total$m
NOTE 3Segment reporting continued(i) Operating segments continuedThe following is an analysis of the Consolidated Entity’s revenue and results by reportable segment CONSOLIDATED 2018
Net interest and trading income 108 569 1,182 1,874 166 3,899
Fee and commission income/(expense) 65 43 463 390 (71) 890
Net operating lease income 3 929 – – 5 937
Share of net (losses)/profits of associates and joint ventures accounted for using the equity method – (3) 3 22 – 22
Other operating income and charges
Impairment charges, write-offs and provisions, net of recoveries – (15) (26) (90) 62 (69)
Other operating income and charges 106 351 13 45 (31) 484
Internal management revenue/(charge) 8 4 3 4 (19) –
Net operating income 290 1,878 1,638 2,245 112 6,163
Total operating expenses (147) (676) (1,081) (1,379) (727) (4,010)
Operating profit/(loss) before income tax 143 1,202 557 866 (615) 2,153
Income tax expense – – – – (570) (570)
Operating profit/(loss) after income tax 143 1,202 557 866 (1,185) 1,583
Profit/(loss) attributable to non-controlling interests – (4) – – 3 (1)
Profit/(loss) attributable to equity holders 143 1,198 557 866 (1,182) 1,582
Distributions paid or provided for on MIS – – – – (14) (14)
Net profit/(loss) attributable to ordinary equity holders 143 1,198 557 866 (1,196) 1,568
Reportable segment assets 3,279 36,690 42,318 84,047 6,884 173,218
CONSOLIDATED 2017Net interest and trading income 104 694 1,049 1,982 8 3,837
Fee and commission income/(expense) 65 58 469 339 (111) 820
Net operating lease income 13 904 – – 5 922
Share of net profits/(losses) of associates and joint ventures accounted for using the equity method – – 6 – (25) (19)
Other operating income and charges:
Impairment charges, write-offs and provisions, net of recoveries 1 (111) (91) (157) 22 (336)
Other operating income and charges (13) 233 205 148 24 597
Internal management revenue/(charge) 1 40 5 11 (57) –
Net operating income 171 1,818 1,643 2,323 (134) 5,821
Total operating expenses (117) (631) (1,133) (1,447) (760) (4,088)
Profit/(loss) before income tax 54 1,187 510 876 (894) 1,733
Income tax expense – – – – (509) (509)
Profit/(loss) after income tax 54 1,187 510 876 (1,403) 1,224
Loss/(profit) attributable to non-controlling interests – 1 – (1) 12 12
Profit/(loss) attributable to equity holders 54 1,188 510 875 (1,391) 1,236
Distributions paid or provided for on MIS – – – – (15) (15)
Net profit/(loss) attributable to ordinary equity holders 54 1,188 510 875 (1,406) 1,221
Reportable segment assets 2,742 37,959 38,096 81,366 7,278 167,441
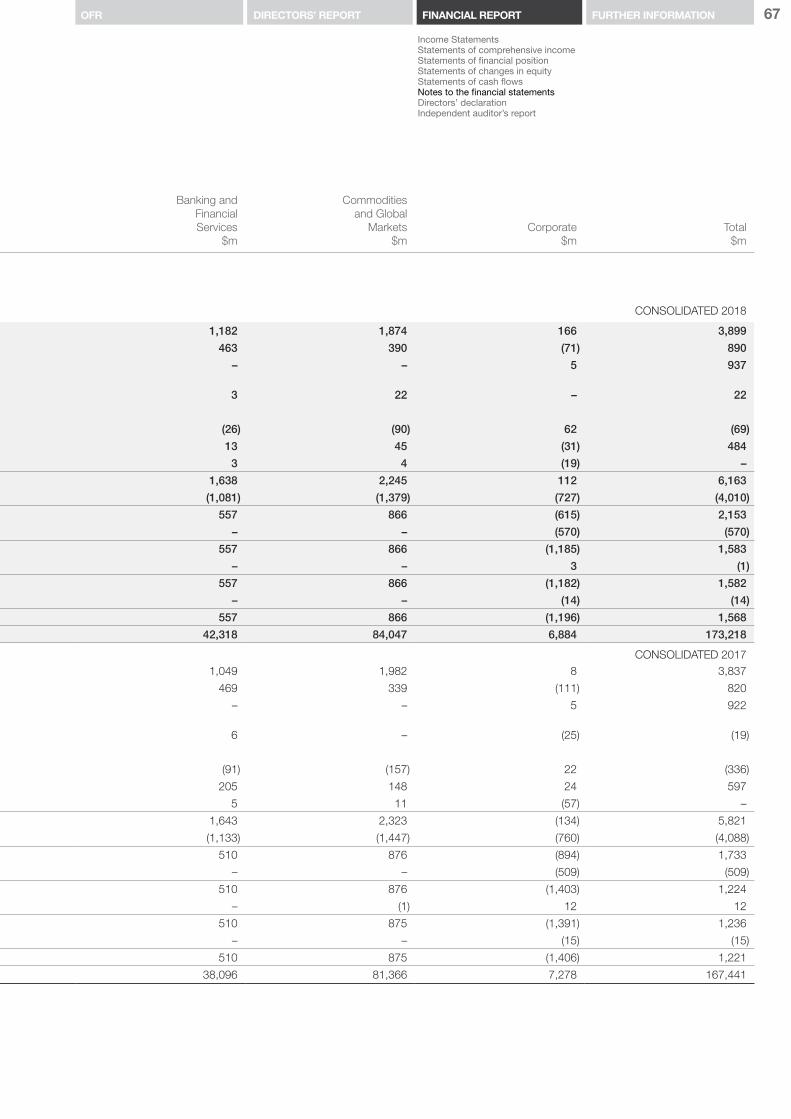
67
Income StatementsStatements of comprehensive incomeStatements of financial positionStatements of changes in equityStatements of cash flowsNotes to the financial statementsDirectors’ declaration Independent auditor’s report
FURTHER INFORMATIONOFR DIRECTORS’ REPORT FINANCIAL REPORT
Macquarie AssetManagement
$m
Corporate andAsset Finance
$m
Banking andFinancialServices
$m
Commoditiesand Global
Markets$m
Corporate$m
Total$m
NOTE 3Segment reporting continued(i) Operating segments continuedThe following is an analysis of the Consolidated Entity’s revenue and results by reportable segment CONSOLIDATED 2018
Net interest and trading income 108 569 1,182 1,874 166 3,899
Fee and commission income/(expense) 65 43 463 390 (71) 890
Net operating lease income 3 929 – – 5 937
Share of net (losses)/profits of associates and joint ventures accounted for using the equity method – (3) 3 22 – 22
Other operating income and charges
Impairment charges, write-offs and provisions, net of recoveries – (15) (26) (90) 62 (69)
Other operating income and charges 106 351 13 45 (31) 484
Internal management revenue/(charge) 8 4 3 4 (19) –
Net operating income 290 1,878 1,638 2,245 112 6,163
Total operating expenses (147) (676) (1,081) (1,379) (727) (4,010)
Operating profit/(loss) before income tax 143 1,202 557 866 (615) 2,153
Income tax expense – – – – (570) (570)
Operating profit/(loss) after income tax 143 1,202 557 866 (1,185) 1,583
Profit/(loss) attributable to non-controlling interests – (4) – – 3 (1)
Profit/(loss) attributable to equity holders 143 1,198 557 866 (1,182) 1,582
Distributions paid or provided for on MIS – – – – (14) (14)
Net profit/(loss) attributable to ordinary equity holders 143 1,198 557 866 (1,196) 1,568
Reportable segment assets 3,279 36,690 42,318 84,047 6,884 173,218
CONSOLIDATED 2017Net interest and trading income 104 694 1,049 1,982 8 3,837
Fee and commission income/(expense) 65 58 469 339 (111) 820
Net operating lease income 13 904 – – 5 922
Share of net profits/(losses) of associates and joint ventures accounted for using the equity method – – 6 – (25) (19)
Other operating income and charges:
Impairment charges, write-offs and provisions, net of recoveries 1 (111) (91) (157) 22 (336)
Other operating income and charges (13) 233 205 148 24 597
Internal management revenue/(charge) 1 40 5 11 (57) –
Net operating income 171 1,818 1,643 2,323 (134) 5,821
Total operating expenses (117) (631) (1,133) (1,447) (760) (4,088)
Profit/(loss) before income tax 54 1,187 510 876 (894) 1,733
Income tax expense – – – – (509) (509)
Profit/(loss) after income tax 54 1,187 510 876 (1,403) 1,224
Loss/(profit) attributable to non-controlling interests – 1 – (1) 12 12
Profit/(loss) attributable to equity holders 54 1,188 510 875 (1,391) 1,236
Distributions paid or provided for on MIS – – – – (15) (15)
Net profit/(loss) attributable to ordinary equity holders 54 1,188 510 875 (1,406) 1,221
Reportable segment assets 2,742 37,959 38,096 81,366 7,278 167,441

68 macquarie.com2018 Annual ReportMacquarie Bank Limited and its subsidiaries
NOTES TO THE FINANCIAL STATEMENTS FOR THE FINANCIAL YEAR ENDED 31 MARCH 2018CONTINUED
NOTE 3 Segment reporting continued(ii) Products and servicesFor the purpose of preparing a segment report based on products and services, the activities of the Consolidated Entity have been divided into four areas:
Lending: corporate and structured finance, banking activities, mortgages and leasing
Financial Markets: trading in fixed income securities, equities, currency, commodities and derivative products
Asset and Wealth Management: manufacture and distribution of fund management products, and
Capital Markets: underwriting, facilitation, broking.
CONSOLIDATED
2018$m
2017 $m
Revenue from external customers
Lending 6,069 5,720
Financial Markets 3,475 3,238
Asset and Wealth Management 510 778
Capital Markets 102 151
Total revenue from external customers(1) 10,156 9,887
(1) Revenue from external customers includes interest and similar income, fee and commission income, net trading income, operating lease income, income associated with investing activities and other income.
(iii) Geographical areasGeographical segments have been determined based upon where the transactions have been recorded. The operations of the Consolidated Entity are headquartered in Australia.
CONSOLIDATED 2018 CONSOLIDATED 2017
Revenuefrom external
customers $m
Non currentassets(1)
$m
Revenuefrom external
customers$m
Non currentassets(1)
$m
Australia 4,613 1,350 4,731 784
Europe, Middle East and Africa(2) 2,909 9,528 2,689 9,266
Americas(3) 1,909 1,081 1,699 1,350
Asia Pacific 725 97 768 117
Total 10,156 12,056 9,887 11,517
(1) Non-current assets consist of intangible assets, interests in associates and joint ventures, property, plant and equipment and investment property. (2) Includes external revenue generated in the United Kingdom of $2,172 million (2017: $1,956 million).(3) Includes external revenue generated in the United States of America of $1,815 million (2017: $1,605 million)
(iv) Major customersThe Consolidated Entity does not rely on any major customers.

69
Income StatementsStatements of comprehensive incomeStatements of financial positionStatements of changes in equityStatements of cash flowsNotes to the financial statementsDirectors’ declaration Independent auditor’s report
FURTHER INFORMATIONOFR DIRECTORS’ REPORT FINANCIAL REPORT
CONSOLIDATED COMPANY
2018$m
2017 $m
2018$m
2017$m
NOTE 4 Income tax expense(i) Income tax (expense)/benefit
Current tax expense (426) (387) (73) (109)
Deferred tax (expense)/benefit (144) (122) (178) 36
Total income tax expense (570) (509) (251) (73)
(ii) Numerical reconciliation of income tax (expense)/benefit to prima facie tax payable
Prima facie income tax expense on operating profit(1) (646) (520) (681) (217)
Tax effect of amounts which are (not deductible)/non-assessable in calculating taxable income:
Rate differential on offshore income 77 4 (16) (43)
Impairment charge on subsidiaries – – (4) (40)
Intra-group dividends – – 455 220
Other items (1) 7 (5) 7
Total income tax expense (570) (509) (251) (73)
(iii) Tax benefit/(expense) relating to items of other comprehensive income
Available for sale reserve 32 19 17 –
Cash flow hedge reserve (19) (14) (2) 1
Foreign currency translation reserve (1) 2 – –
Own credit risk (3) – – –
Total tax benefit/(expense) relating to items of other comprehensive income 9 7 15 1
(iv) Deferred tax (expense)/benefit represents movements in deferred tax assets/liabilitiesFixed assets (22) (1) (13) 17
Intangible assets – (1) – (1)
Investments 17 (15) (1) (20)
Tax losses (49) (27) 26 (7)
Leasing and financial instruments 81 (115) (112) (14)
Other assets and liabilities (171) 37 (78) 61
Total deferred tax (expense)/benefit represents movements in deferred tax assets/liabilities (144) (122) (178) 36
(1) Prima facie income tax on operating profit is calculated at the rate of 30% (2017: 30%).
Revenue authorities undertake risk reviews and audits as part of their normal activities. The Consolidated Entity has assessed these and other taxation claims and litigation, including seeking advice where appropriate, and considers that it holds appropriate positions.
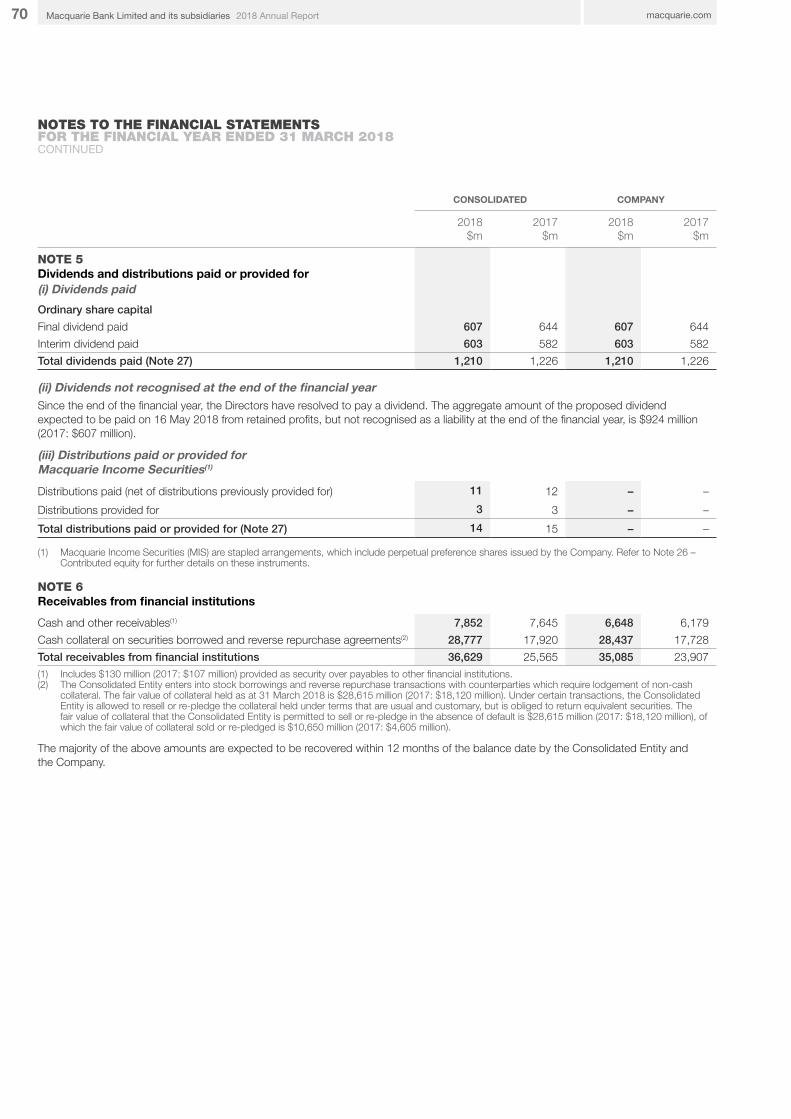
70 macquarie.com2018 Annual ReportMacquarie Bank Limited and its subsidiaries
NOTES TO THE FINANCIAL STATEMENTS FOR THE FINANCIAL YEAR ENDED 31 MARCH 2018CONTINUED
CONSOLIDATED COMPANY
2018$m
2017 $m
2018$m
2017 $m
NOTE 5 Dividends and distributions paid or provided for(i) Dividends paid
Ordinary share capital
Final dividend paid 607 644 607 644
Interim dividend paid 603 582 603 582
Total dividends paid (Note 27) 1,210 1,226 1,210 1,226
(ii) Dividends not recognised at the end of the financial yearSince the end of the financial year, the Directors have resolved to pay a dividend. The aggregate amount of the proposed dividend expected to be paid on 16 May 2018 from retained profits, but not recognised as a liability at the end of the financial year, is $924 million (2017: $607 million).
(iii) Distributions paid or provided for Macquarie Income Securities(1)
Distributions paid (net of distributions previously provided for) 11 12 – –
Distributions provided for 3 3 – –
Total distributions paid or provided for (Note 27) 14 15 – –
(1) Macquarie Income Securities (MIS) are stapled arrangements, which include perpetual preference shares issued by the Company. Refer to Note 26 – Contributed equity for further details on these instruments.
NOTE 6 Receivables from financial institutions
Cash and other receivables(1) 7,852 7,645 6,648 6,179
Cash collateral on securities borrowed and reverse repurchase agreements(2) 28,777 17,920 28,437 17,728
Total receivables from financial institutions 36,629 25,565 35,085 23,907(1) Includes $130 million (2017: $107 million) provided as security over payables to other financial institutions.(2) The Consolidated Entity enters into stock borrowings and reverse repurchase transactions with counterparties which require lodgement of non-cash
collateral. The fair value of collateral held as at 31 March 2018 is $28,615 million (2017: $18,120 million). Under certain transactions, the Consolidated Entity is allowed to resell or re-pledge the collateral held under terms that are usual and customary, but is obliged to return equivalent securities. The fair value of collateral that the Consolidated Entity is permitted to sell or re-pledge in the absence of default is $28,615 million (2017: $18,120 million), of which the fair value of collateral sold or re-pledged is $10,650 million (2017: $4,605 million).
The majority of the above amounts are expected to be recovered within 12 months of the balance date by the Consolidated Entity and the Company.

71
Income StatementsStatements of comprehensive incomeStatements of financial positionStatements of changes in equityStatements of cash flowsNotes to the financial statementsDirectors’ declaration Independent auditor’s report
FURTHER INFORMATIONOFR DIRECTORS’ REPORT FINANCIAL REPORT
CONSOLIDATED COMPANY
2018$m
2017 $m
2018$m
2017 $m
NOTE 7 Trading portfolio assets
Equities
Listed 4,429 12,003 3,837 8,796
Unlisted 391 10 1 2
Debt securities
Commonwealth and Foreign government securities 5,846 6,310 5,722 6,241
Corporate loans and securities 798 1,620 588 863
Treasury notes 611 1,061 222 474
Other debt securities 323 31 2 6
Commodities 2,496 5,602 1,451 4,227
Total trading portfolio assets(1) 14,894 26,637 11,823 20,609
(1) Includes $2,837 million (2017: $5,124 million) pledged as collateral to secure liabilities under repurchase agreements and stock lending arrangements.
The above amounts are expected to be recovered within 12 months of the balance date by the Consolidated Entity and the Company.
NOTE 8 Investment securities available for sale
Debt securities(1) 5,244 4,585 5,113 4,334
Equity securities
Listed 18 56 15 49
Unlisted 60 541 30 418
Total investment securities available for sale 5,322 5,182 5,158 4,801
(1) Includes $517 million (2017: $509 million) provided as security against payables to financial institutions.
Of the above amounts, $2,850 million (2017: $1,831 million) is expected to be recovered within 12 months of the balance date by the Consolidated Entity and $2,850 million (2017: $1,636 million) by the Company.
NOTE 9Other assets
Debtors and prepayments 4,766 4,475 2,728 2,928
Security settlements 3,108 2,315 2,729 2,105
Life investment linked contracts and other unitholder assets 648 722 – –
Assets of disposal groups classified as held for sale 345 477 – –
Income tax receivable 234 254 117 133
Other 186 403 9 13
Total other assets(1) 9,287 8,646 5,583 5,179
(1) Includes $510 million (2017: $434 million) provided as security over payables to financial institutions.
Of the above amounts, $8,938 million (2017: $7,917 million) is expected to be recovered within 12 months of the balance date by the Consolidated Entity and $5,183 million (2017:$4,766 million) by the Company.
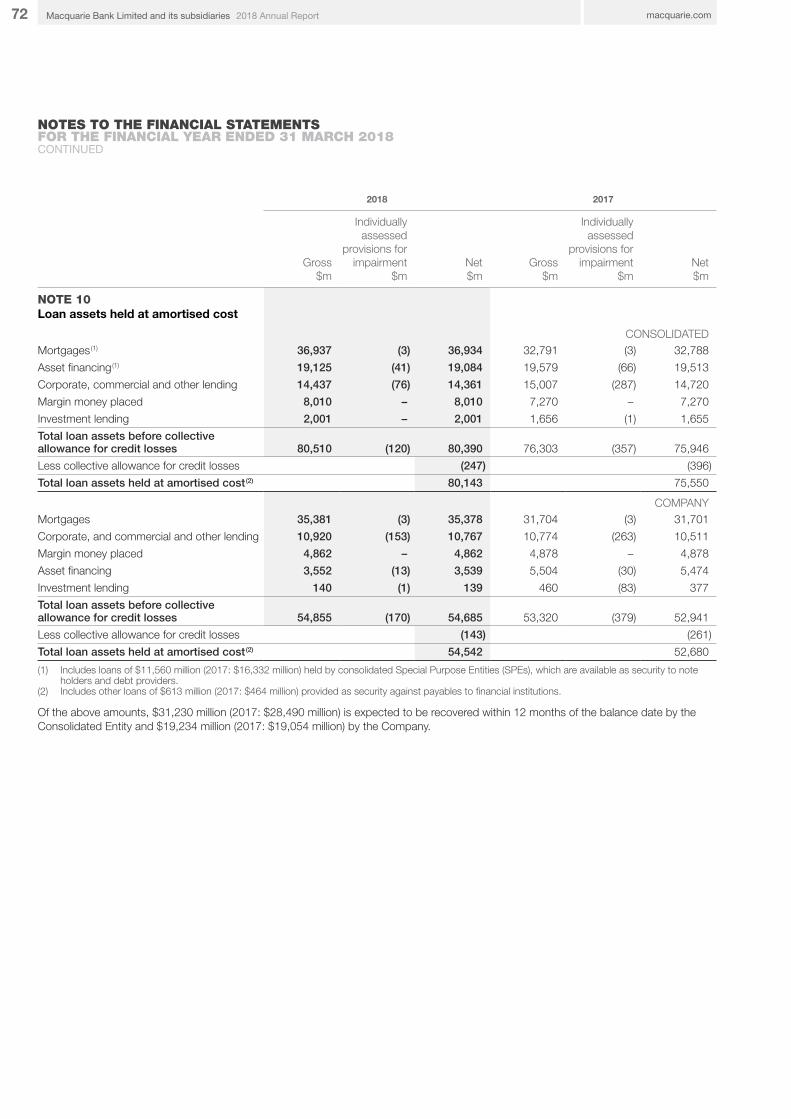
72 macquarie.com2018 Annual ReportMacquarie Bank Limited and its subsidiaries
NOTES TO THE FINANCIAL STATEMENTS FOR THE FINANCIAL YEAR ENDED 31 MARCH 2018CONTINUED
2018 2017
Gross$m
Individuallyassessed
provisions forimpairment
$mNet$m
Gross$m
Individuallyassessed
provisions forimpairment
$mNet$m
NOTE 10 Loan assets held at amortised cost
CONSOLIDATEDMortgages (1) 36,937 (3) 36,934 32,791 (3) 32,788
Asset financing (1) 19,125 (41) 19,084 19,579 (66) 19,513
Corporate, commercial and other lending 14,437 (76) 14,361 15,007 (287) 14,720
Margin money placed 8,010 – 8,010 7,270 – 7,270
Investment lending 2,001 – 2,001 1,656 (1) 1,655
Total loan assets before collective allowance for credit losses 80,510 (120) 80,390 76,303 (357) 75,946
Less collective allowance for credit losses (247) (396)
Total loan assets held at amortised cost (2) 80,143 75,550
COMPANYMortgages 35,381 (3) 35,378 31,704 (3) 31,701
Corporate, and commercial and other lending 10,920 (153) 10,767 10,774 (263) 10,511
Margin money placed 4,862 – 4,862 4,878 – 4,878
Asset financing 3,552 (13) 3,539 5,504 (30) 5,474
Investment lending 140 (1) 139 460 (83) 377
Total loan assets before collective allowance for credit losses 54,855 (170) 54,685 53,320 (379) 52,941
Less collective allowance for credit losses (143) (261)
Total loan assets held at amortised cost (2) 54,542 52,680
(1) Includes loans of $11,560 million (2017: $16,332 million) held by consolidated Special Purpose Entities (SPEs), which are available as security to note holders and debt providers.
(2) Includes other loans of $613 million (2017: $464 million) provided as security against payables to financial institutions.
Of the above amounts, $31,230 million (2017: $28,490 million) is expected to be recovered within 12 months of the balance date by the Consolidated Entity and $19,234 million (2017: $19,054 million) by the Company.
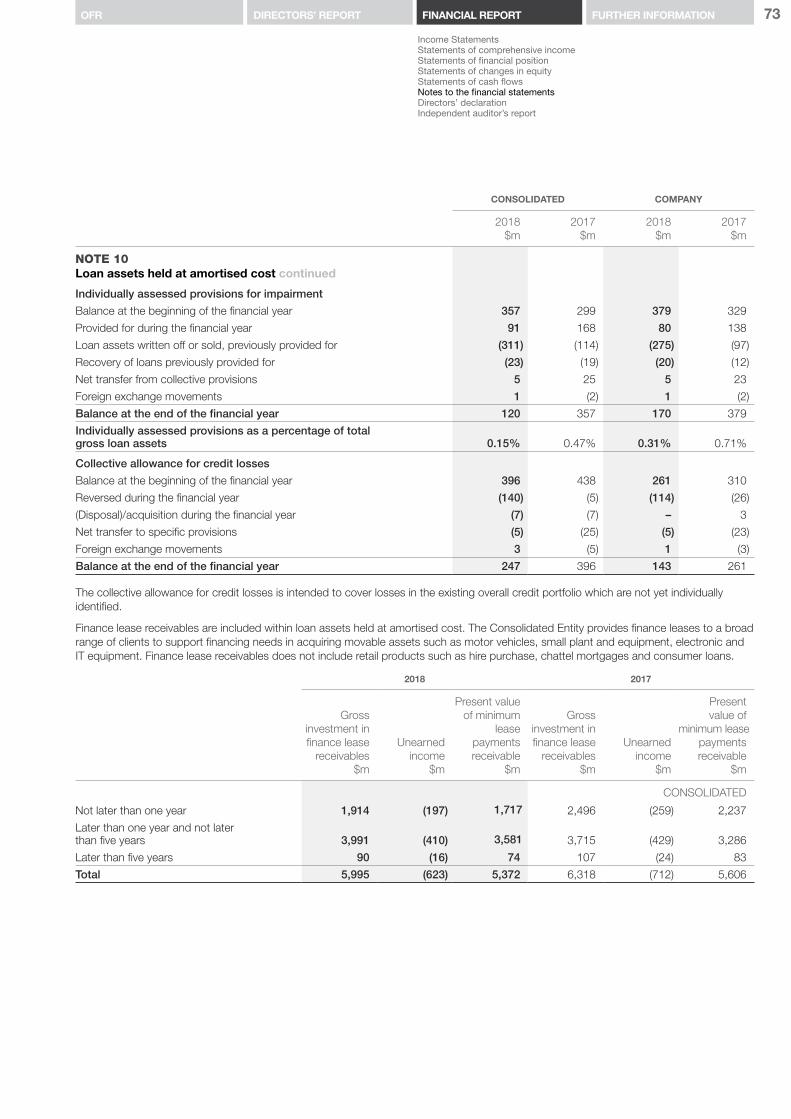
73
Income StatementsStatements of comprehensive incomeStatements of financial positionStatements of changes in equityStatements of cash flowsNotes to the financial statementsDirectors’ declaration Independent auditor’s report
FURTHER INFORMATIONOFR DIRECTORS’ REPORT FINANCIAL REPORT
CONSOLIDATED COMPANY
2018$m
2017$m
2018$m
2017 $m
NOTE 10 Loan assets held at amortised cost continued
Individually assessed provisions for impairment
Balance at the beginning of the financial year 357 299 379 329
Provided for during the financial year 91 168 80 138
Loan assets written off or sold, previously provided for (311) (114) (275) (97)
Recovery of loans previously provided for (23) (19) (20) (12)
Net transfer from collective provisions 5 25 5 23
Foreign exchange movements 1 (2) 1 (2)
Balance at the end of the financial year 120 357 170 379
Individually assessed provisions as a percentage of total gross loan assets 0.15% 0.47% 0.31% 0.71%
Collective allowance for credit losses
Balance at the beginning of the financial year 396 438 261 310
Reversed during the financial year (140) (5) (114) (26)
(Disposal)/acquisition during the financial year (7) (7) – 3
Net transfer to specific provisions (5) (25) (5) (23)
Foreign exchange movements 3 (5) 1 (3)
Balance at the end of the financial year 247 396 143 261
The collective allowance for credit losses is intended to cover losses in the existing overall credit portfolio which are not yet individually identified.
Finance lease receivables are included within loan assets held at amortised cost. The Consolidated Entity provides finance leases to a broad range of clients to support financing needs in acquiring movable assets such as motor vehicles, small plant and equipment, electronic and IT equipment. Finance lease receivables does not include retail products such as hire purchase, chattel mortgages and consumer loans.
2018 2017
Grossinvestment infinance lease
receivables$m
Unearnedincome
$m
Present valueof minimum
lease paymentsreceivable
$m
Grossinvestment infinance lease
receivables$m
Unearnedincome
$m
Presentvalue of
minimum leasepaymentsreceivable
$m
CONSOLIDATED
Not later than one year 1,914 (197) 1,717 2,496 (259) 2,237
Later than one year and not later than five years 3,991 (410) 3,581 3,715 (429) 3,286
Later than five years 90 (16) 74 107 (24) 83
Total 5,995 (623) 5,372 6,318 (712) 5,606
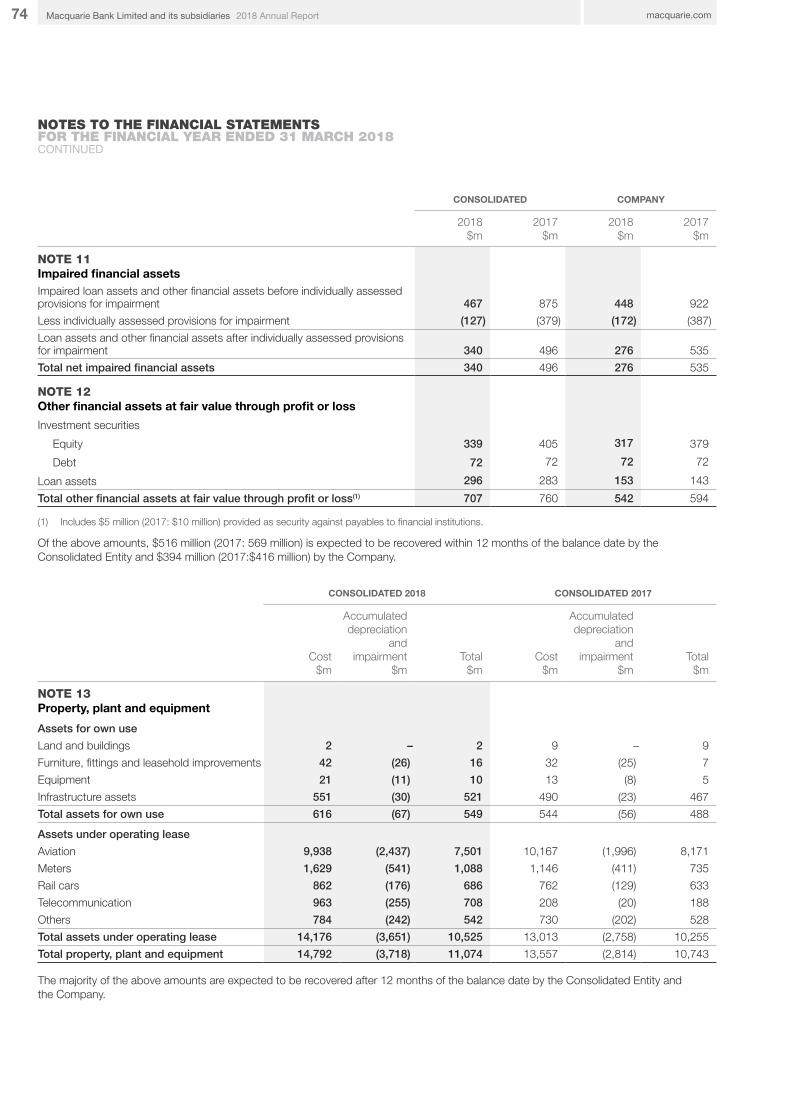
74 macquarie.com2018 Annual ReportMacquarie Bank Limited and its subsidiaries
NOTES TO THE FINANCIAL STATEMENTS FOR THE FINANCIAL YEAR ENDED 31 MARCH 2018CONTINUED
CONSOLIDATED COMPANY
2018$m
2017 $m
2018$m
2017 $m
NOTE 11Impaired financial assetsImpaired loan assets and other financial assets before individually assessed provisions for impairment 467 875 448 922
Less individually assessed provisions for impairment (127) (379) (172) (387)
Loan assets and other financial assets after individually assessed provisions for impairment 340 496 276 535
Total net impaired financial assets 340 496 276 535
NOTE 12Other financial assets at fair value through profit or loss
Investment securities
Equity 339 405 317 379
Debt 72 72 72 72
Loan assets 296 283 153 143
Total other financial assets at fair value through profit or loss(1) 707 760 542 594
(1) Includes $5 million (2017: $10 million) provided as security against payables to financial institutions.
Of the above amounts, $516 million (2017: 569 million) is expected to be recovered within 12 months of the balance date by the Consolidated Entity and $394 million (2017:$416 million) by the Company.
CONSOLIDATED 2018 CONSOLIDATED 2017
Cost$m
Accumulateddepreciation
and impairment
$mTotal
$mCost
$m
Accumulateddepreciation
and impairment
$mTotal
$m
NOTE 13 Property, plant and equipment
Assets for own use
Land and buildings 2 – 2 9 – 9
Furniture, fittings and leasehold improvements 42 (26) 16 32 (25) 7
Equipment 21 (11) 10 13 (8) 5
Infrastructure assets 551 (30) 521 490 (23) 467
Total assets for own use 616 (67) 549 544 (56) 488
Assets under operating lease
Aviation 9,938 (2,437) 7,501 10,167 (1,996) 8,171
Meters 1,629 (541) 1,088 1,146 (411) 735
Rail cars 862 (176) 686 762 (129) 633
Telecommunication 963 (255) 708 208 (20) 188
Others 784 (242) 542 730 (202) 528
Total assets under operating lease 14,176 (3,651) 10,525 13,013 (2,758) 10,255
Total property, plant and equipment 14,792 (3,718) 11,074 13,557 (2,814) 10,743
The majority of the above amounts are expected to be recovered after 12 months of the balance date by the Consolidated Entity and the Company.

75
Income StatementsStatements of comprehensive incomeStatements of financial positionStatements of changes in equityStatements of cash flowsNotes to the financial statementsDirectors’ declaration Independent auditor’s report
FURTHER INFORMATIONOFR DIRECTORS’ REPORT FINANCIAL REPORT
COMPANY 2018 COMPANY 2017
Cost$m
Accumulateddepreciation
and impairment
$mTotal
$mCost
$m
Accumulateddepreciation
and impairment
$mTotal
$m
NOTE 13 Property, plant and equipment continued
Assets for own use
Furniture, fittings and leasehold improvements 17 (9) 8 11 (9) 2
Equipment 11 (5) 6 7 (3) 4
Total assets for own use 28 (14) 14 18 (12) 6
Assets under operating lease
Telecommunication 963 (255) 708 208 (20) 188
Meters 33 (4) 29 – – –
Others 474 (98) 376 445 (71) 374
Total assets under operating lease 1,470 (357) 1,113 653 (91) 562
Total property, plant and equipment 1,498 (371) 1,127 671 (103) 568
Movement in the Consolidated Entity’s property, plant and equipment at their written down value:
Assets for own use
Land andbuildings
$m
Furniture,fittings and
leaseholdimprovements
$mEquipment
$m
Infrastructureassets
$mTotal
$m
Balance as at 1 April 2016 9 7 5 419 440
Acquisitions – 3 3 122 128
Foreign exchange movements – (1) – (59) (60)
Depreciation expense (Note 2) – (2) (3) (15) (20)
Balance as at 31 March 2017 9 7 5 467 488
Acquisitions – 13 8 80 101
Disposals (2) (1) – – (3)
Reclassification and other adjustments (5) (1) – (64) (70)
Foreign exchange movements – 1 – 52 53
Depreciation expense (Note 2) – (3) (3) (14) (20)
Balance as at 31 March 2018 2 16 10 521 549
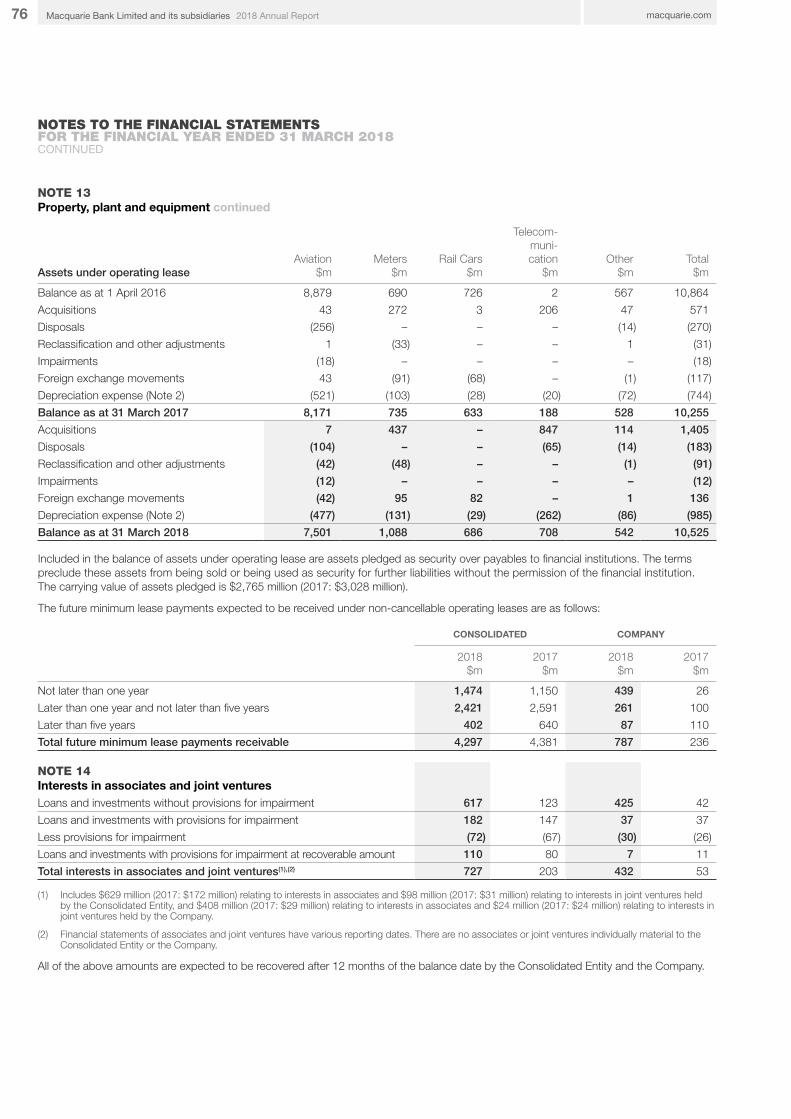
76 macquarie.com2018 Annual ReportMacquarie Bank Limited and its subsidiaries
NOTES TO THE FINANCIAL STATEMENTS FOR THE FINANCIAL YEAR ENDED 31 MARCH 2018CONTINUED
NOTE 13 Property, plant and equipment continued
Assets under operating leaseAviation
$mMeters
$mRail Cars
$m
Telecom-muni-cation
$mOther
$mTotal
$m
Balance as at 1 April 2016 8,879 690 726 2 567 10,864
Acquisitions 43 272 3 206 47 571
Disposals (256) – – – (14) (270)
Reclassification and other adjustments 1 (33) – – 1 (31)
Impairments (18) – – – – (18)
Foreign exchange movements 43 (91) (68) – (1) (117)
Depreciation expense (Note 2) (521) (103) (28) (20) (72) (744)
Balance as at 31 March 2017 8,171 735 633 188 528 10,255
Acquisitions 7 437 – 847 114 1,405
Disposals (104) – – (65) (14) (183)
Reclassification and other adjustments (42) (48) – – (1) (91)
Impairments (12) – – – – (12)
Foreign exchange movements (42) 95 82 – 1 136
Depreciation expense (Note 2) (477) (131) (29) (262) (86) (985)
Balance as at 31 March 2018 7,501 1,088 686 708 542 10,525
Included in the balance of assets under operating lease are assets pledged as security over payables to financial institutions. The terms preclude these assets from being sold or being used as security for further liabilities without the permission of the financial institution. The carrying value of assets pledged is $2,765 million (2017: $3,028 million).
The future minimum lease payments expected to be received under non-cancellable operating leases are as follows:
CONSOLIDATED COMPANY
2018$m
2017$m
2018$m
2017 $m
Not later than one year 1,474 1,150 439 26
Later than one year and not later than five years 2,421 2,591 261 100
Later than five years 402 640 87 110
Total future minimum lease payments receivable 4,297 4,381 787 236
NOTE 14 Interests in associates and joint venturesLoans and investments without provisions for impairment 617 123 425 42
Loans and investments with provisions for impairment 182 147 37 37
Less provisions for impairment (72) (67) (30) (26)
Loans and investments with provisions for impairment at recoverable amount 110 80 7 11
Total interests in associates and joint ventures(1),(2) 727 203 432 53
(1) Includes $629 million (2017: $172 million) relating to interests in associates and $98 million (2017: $31 million) relating to interests in joint ventures held by the Consolidated Entity, and $408 million (2017: $29 million) relating to interests in associates and $24 million (2017: $24 million) relating to interests in joint ventures held by the Company.
(2) Financial statements of associates and joint ventures have various reporting dates. There are no associates or joint ventures individually material to the Consolidated Entity or the Company.
All of the above amounts are expected to be recovered after 12 months of the balance date by the Consolidated Entity and the Company.
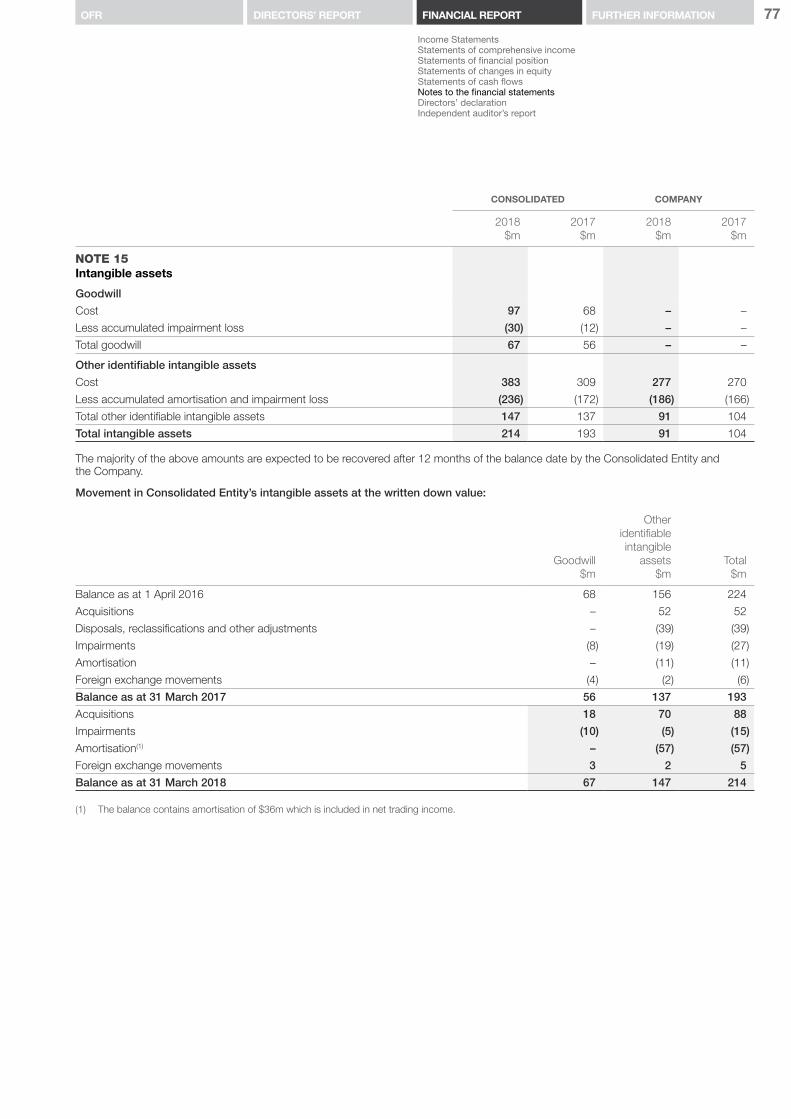
77
Income StatementsStatements of comprehensive incomeStatements of financial positionStatements of changes in equityStatements of cash flowsNotes to the financial statementsDirectors’ declaration Independent auditor’s report
FURTHER INFORMATIONOFR DIRECTORS’ REPORT FINANCIAL REPORT
CONSOLIDATED COMPANY
2018$m
2017$m
2018$m
2017 $m
NOTE 15 Intangible assets
Goodwill
Cost 97 68 – –
Less accumulated impairment loss (30) (12) – –
Total goodwill 67 56 – –
Other identifiable intangible assets
Cost 383 309 277 270
Less accumulated amortisation and impairment loss (236) (172) (186) (166)
Total other identifiable intangible assets 147 137 91 104
Total intangible assets 214 193 91 104
The majority of the above amounts are expected to be recovered after 12 months of the balance date by the Consolidated Entity and the Company.
Movement in Consolidated Entity’s intangible assets at the written down value:
Goodwill$m
Otheridentifiableintangible
assets$m
Total$m
Balance as at 1 April 2016 68 156 224
Acquisitions – 52 52
Disposals, reclassifications and other adjustments – (39) (39)
Impairments (8) (19) (27)
Amortisation – (11) (11)
Foreign exchange movements (4) (2) (6)
Balance as at 31 March 2017 56 137 193
Acquisitions 18 70 88
Impairments (10) (5) (15)
Amortisation(1) – (57) (57)
Foreign exchange movements 3 2 5
Balance as at 31 March 2018 67 147 214
(1) The balance contains amortisation of $36m which is included in net trading income.
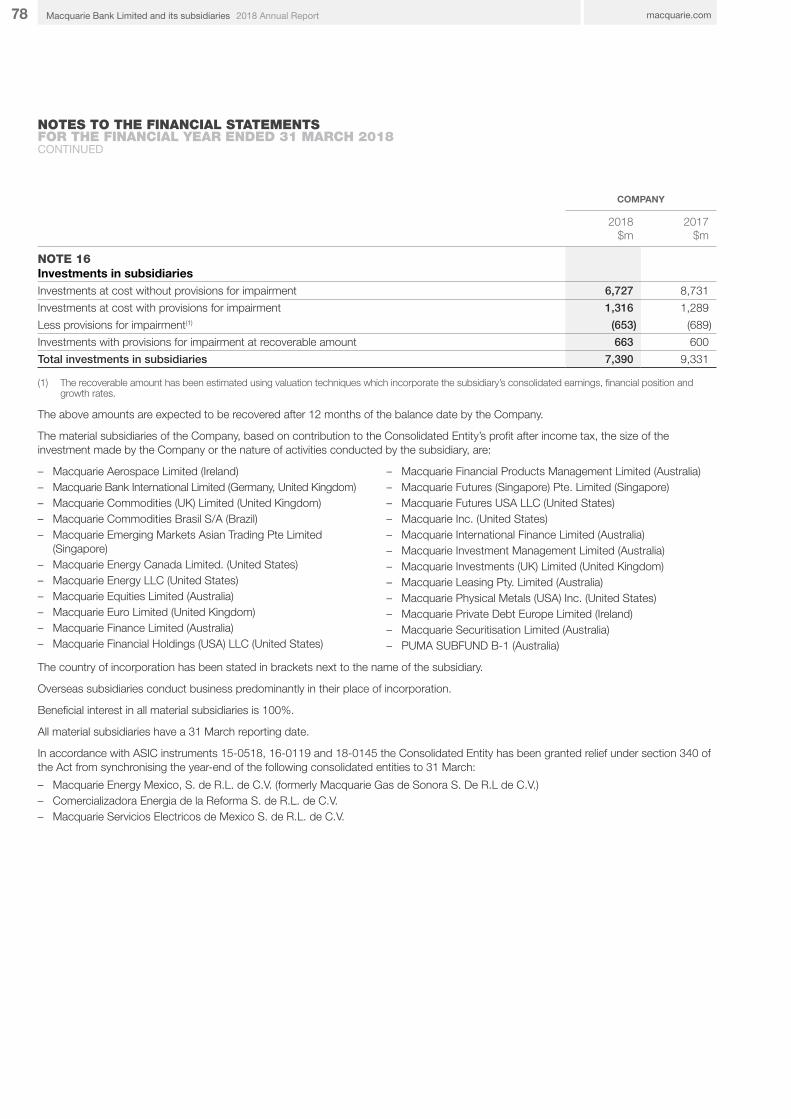
78 macquarie.com2018 Annual ReportMacquarie Bank Limited and its subsidiaries
NOTES TO THE FINANCIAL STATEMENTS FOR THE FINANCIAL YEAR ENDED 31 MARCH 2018CONTINUED
COMPANY
2018$m
2017 $m
NOTE 16 Investments in subsidiariesInvestments at cost without provisions for impairment 6,727 8,731
Investments at cost with provisions for impairment 1,316 1,289
Less provisions for impairment(1) (653) (689)
Investments with provisions for impairment at recoverable amount 663 600
Total investments in subsidiaries 7,390 9,331
(1) The recoverable amount has been estimated using valuation techniques which incorporate the subsidiary’s consolidated earnings, financial position and growth rates.
The above amounts are expected to be recovered after 12 months of the balance date by the Company.
The material subsidiaries of the Company, based on contribution to the Consolidated Entity’s profit after income tax, the size of the investment made by the Company or the nature of activities conducted by the subsidiary, are:
– Macquarie Aerospace Limited (Ireland) – Macquarie Bank International Limited (Germany, United Kingdom) – Macquarie Commodities (UK) Limited (United Kingdom) – Macquarie Commodities Brasil S/A (Brazil) – Macquarie Emerging Markets Asian Trading Pte Limited
(Singapore) – Macquarie Energy Canada Limited. (United States) – Macquarie Energy LLC (United States) – Macquarie Equities Limited (Australia) – Macquarie Euro Limited (United Kingdom) – Macquarie Finance Limited (Australia) – Macquarie Financial Holdings (USA) LLC (United States)
– Macquarie Financial Products Management Limited (Australia) – Macquarie Futures (Singapore) Pte. Limited (Singapore) – Macquarie Futures USA LLC (United States) – Macquarie Inc. (United States) – Macquarie International Finance Limited (Australia) – Macquarie Investment Management Limited (Australia) – Macquarie Investments (UK) Limited (United Kingdom) – Macquarie Leasing Pty. Limited (Australia) – Macquarie Physical Metals (USA) Inc. (United States) – Macquarie Private Debt Europe Limited (Ireland) – Macquarie Securitisation Limited (Australia) – PUMA SUBFUND B-1 (Australia)
The country of incorporation has been stated in brackets next to the name of the subsidiary.
Overseas subsidiaries conduct business predominantly in their place of incorporation.
Beneficial interest in all material subsidiaries is 100%.
All material subsidiaries have a 31 March reporting date.
In accordance with ASIC instruments 15-0518, 16-0119 and 18-0145 the Consolidated Entity has been granted relief under section 340 of the Act from synchronising the year-end of the following consolidated entities to 31 March:
– Macquarie Energy Mexico, S. de R.L. de C.V. (formerly Macquarie Gas de Sonora S. De R.L de C.V.) – Comercializadora Energia de la Reforma S. de R.L. de C.V. – Macquarie Servicios Electricos de Mexico S. de R.L. de C.V.
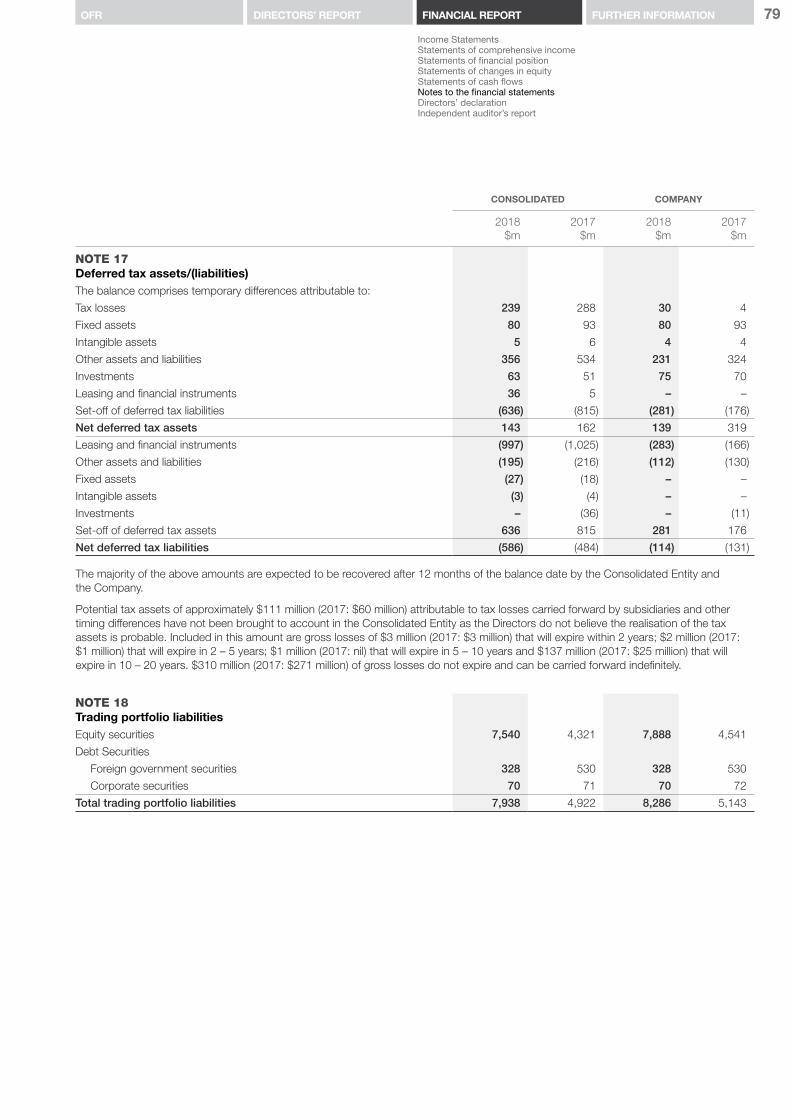
79
Income StatementsStatements of comprehensive incomeStatements of financial positionStatements of changes in equityStatements of cash flowsNotes to the financial statementsDirectors’ declaration Independent auditor’s report
FURTHER INFORMATIONOFR DIRECTORS’ REPORT FINANCIAL REPORT
CONSOLIDATED COMPANY
2018$m
2017 $m
2018$m
2017$m
NOTE 17Deferred tax assets/(liabilities)The balance comprises temporary differences attributable to:
Tax losses 239 288 30 4
Fixed assets 80 93 80 93
Intangible assets 5 6 4 4
Other assets and liabilities 356 534 231 324
Investments 63 51 75 70
Leasing and financial instruments 36 5 – –
Set-off of deferred tax liabilities (636) (815) (281) (176)
Net deferred tax assets 143 162 139 319
Leasing and financial instruments (997) (1,025) (283) (166)
Other assets and liabilities (195) (216) (112) (130)
Fixed assets (27) (18) – –
Intangible assets (3) (4) – –
Investments – (36) – (11)
Set-off of deferred tax assets 636 815 281 176
Net deferred tax liabilities (586) (484) (114) (131)
The majority of the above amounts are expected to be recovered after 12 months of the balance date by the Consolidated Entity and the Company.
Potential tax assets of approximately $111 million (2017: $60 million) attributable to tax losses carried forward by subsidiaries and other timing differences have not been brought to account in the Consolidated Entity as the Directors do not believe the realisation of the tax assets is probable. Included in this amount are gross losses of $3 million (2017: $3 million) that will expire within 2 years; $2 million (2017: $1 million) that will expire in 2 – 5 years; $1 million (2017: nil) that will expire in 5 – 10 years and $137 million (2017: $25 million) that will expire in 10 – 20 years. $310 million (2017: $271 million) of gross losses do not expire and can be carried forward indefinitely.
NOTE 18Trading portfolio liabilitiesEquity securities 7,540 4,321 7,888 4,541
Debt Securities
Foreign government securities 328 530 328 530
Corporate securities 70 71 70 72
Total trading portfolio liabilities 7,938 4,922 8,286 5,143
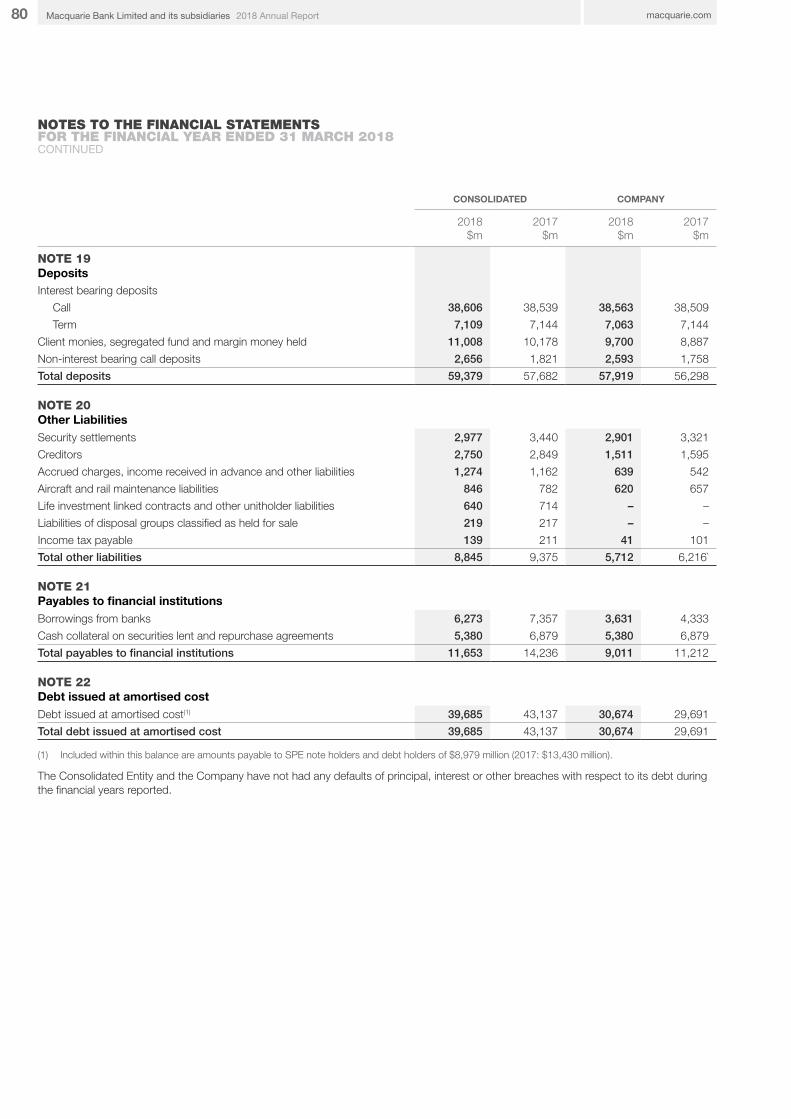
80 macquarie.com2018 Annual ReportMacquarie Bank Limited and its subsidiaries
NOTES TO THE FINANCIAL STATEMENTS FOR THE FINANCIAL YEAR ENDED 31 MARCH 2018CONTINUED
CONSOLIDATED COMPANY
2018$m
2017 $m
2018$m
2017$m
NOTE 19DepositsInterest bearing deposits
Call 38,606 38,539 38,563 38,509
Term 7,109 7,144 7,063 7,144
Client monies, segregated fund and margin money held 11,008 10,178 9,700 8,887
Non-interest bearing call deposits 2,656 1,821 2,593 1,758
Total deposits 59,379 57,682 57,919 56,298
NOTE 20Other Liabilities Security settlements 2,977 3,440 2,901 3,321
Creditors 2,750 2,849 1,511 1,595
Accrued charges, income received in advance and other liabilities 1,274 1,162 639 542
Aircraft and rail maintenance liabilities 846 782 620 657
Life investment linked contracts and other unitholder liabilities 640 714 – –
Liabilities of disposal groups classified as held for sale 219 217 – –
Income tax payable 139 211 41 101
Total other liabilities 8,845 9,375 5,712 6,216`
NOTE 21Payables to financial institutions Borrowings from banks 6,273 7,357 3,631 4,333
Cash collateral on securities lent and repurchase agreements 5,380 6,879 5,380 6,879
Total payables to financial institutions 11,653 14,236 9,011 11,212
NOTE 22Debt issued at amortised cost Debt issued at amortised cost(1) 39,685 43,137 30,674 29,691
Total debt issued at amortised cost 39,685 43,137 30,674 29,691
(1) Included within this balance are amounts payable to SPE note holders and debt holders of $8,979 million (2017: $13,430 million).
The Consolidated Entity and the Company have not had any defaults of principal, interest or other breaches with respect to its debt during the financial years reported.

81
Income StatementsStatements of comprehensive incomeStatements of financial positionStatements of changes in equityStatements of cash flowsNotes to the financial statementsDirectors’ declaration Independent auditor’s report
FURTHER INFORMATIONOFR DIRECTORS’ REPORT FINANCIAL REPORT
CONSOLIDATED COMPANY
2018$m
2017 $m
2018$m
2017$m
NOTE 22Debt issued at amortised cost continuedReconciliation of debt issued at amortised cost by major currency(In Australian dollar equivalent):
United States dollar 19,087 18,379 18,641 17,032
Australian dollar 12,082 14,877 3,687 3,148
Euro 4,945 5,650 4,774 5,282
Swiss franc 1,487 1,912 1,487 1,912
Great British pound 727 767 727 767
Japanese yen 579 715 579 715
Yuan renminbi 225 218 225 218
Norwegian krone 163 153 163 153
Hong Kong dollar 152 222 152 222
Canadian dollar 126 125 127 123
Korean won 112 107 112 107
Others – 12 – 12
Total 39,685 43,137 30,674 29,691
The Consolidated Entity’s and the Company’s primary sources for domestic and international debt funding are their multi-currency, multi-jurisdictional Debt Instrument Program and domestic Negotiable Certificate of Deposits (NCD) issuance.
NOTE 23Other debt issued at fair value through profit or loss Structured notes(1),(2) 1,992 1,934 1,839 3,921
Total Other debt issued at fair value through profit or loss 1,992 1,934 1,839 3,921
(1) Includes debt instruments on which the return is linked to commodities, equities, currencies, interest rates or other assets.(2) Includes cumulative fair value gain of $25 million (2017: $12 million losses) due to changes in the Consolidated Entity’s credit risk.
The amount that would be contractually required to be paid at maturity to the holders of the financial liabilities designated at fair value through profit or loss for the Consolidated Entity is $2,822 million (2017: $2,684 million) and for the Company is $2,668 million (2017: $4,672 million)
Reconciliation of Other debt issued at fair value through profit or loss by major currency(In Australian dollar equivalent):
United States dollar 1,901 1,813 1748 1,813
Australian dollar 70 56 70 2,061
South African rand – 42 – 42
Others 21 23 21 5
Total 1,992 1,934 1,839 3,921

82 macquarie.com2018 Annual ReportMacquarie Bank Limited and its subsidiaries
NOTES TO THE FINANCIAL STATEMENTS FOR THE FINANCIAL YEAR ENDED 31 MARCH 2018CONTINUED
NOTE 24Capital management strategyThe Consolidated Entity’s and the Company’s capital management strategy is to maximise shareholder value through optimising the level and use of capital resources, whilst also providing the flexibility to take advantage of opportunities as they may arise.
The Consolidated Entity’s capital management objectives are to:
– continue to support the Consolidated Entity’s credit rating – ensure sufficient capital resources to support the Consolidated
Entity’s business and operational requirements – maintain sufficient capital to exceed externally imposed capital
requirements – safeguard the Consolidated Entity’s ability to continue as a
going concern.
The Consolidated Entity’s capital management strategy uses both internal and external measures of capital. Internally, the Consolidated Entity has developed an Economic Capital Adequacy Model (ECAM) that is used to quantify the Company’s aggregate level of risk. The economic capital framework complements the management of specific risk types such as equity, credit, market and operational risk by providing an aggregate view of the Company’s risk profile. The economic capital model is used to support business decision-making and has three main applications:
– capital adequacy assessment – risk appetite setting, and – risk-adjusted performance measurement.
The Consolidated Entity is subject to minimum capital requirements externally imposed by APRA, following the guidelines developed by the Basel Committee on Banking Supervision. APRA requires the Consolidated Entity to have an Internal Capital Adequacy Assessment Process (ICAAP) that is Board approved and which meets a range of minimum requirements. The Consolidated Entity reports to APRA under Basel III capital requirements and is accredited under the Foundation Internal Ratings Based Approach (FIRB) for credit risk, the Advanced Measurement Approach (AMA) for operational risk, the internal model approach for market risk and the internal model approach for interest rate risk in the banking book (IRRBB). The capital ratios disclosed in this report are relevant for comparisons with banks regulated by APRA.
Regulatory capital requirements are measured for the Company and certain subsidiaries which meet the definition of Extended Licensed Entities (Level 1 reporting), and for the Banking Group (Level 2 reporting). Level 2 consists of the Company, its subsidiaries and its immediate parent less certain subsidiaries of the Company which are deconsolidated for APRA reporting purposes. These include mortgage and leasing special purpose vehicles (SPVs) and entities conducting insurance, funds management and non-financial operations.
Under Basel III rules, APRA requires Authorised Deposit-taking Institutions (ADIs) to have a minimum ratio of Tier 1 capital to risk weighted assets (RWA) of 8.5% including 2.5% of capital conservation buffer, with at least 7.0% in the form of Common Equity Tier 1 capital. In addition APRA may impose ADI-specific minimum capital ratios which may be higher than these levels.
The Consolidated Entity’s Common Equity Tier 1 capital consists of share capital, retained earnings, and certain reserves, net of deductions. Additional Tier 1 capital consists of hybrid instruments. The hybrid instruments include Macquarie Additional Capital Securities, Macquarie Income Securities and Macquarie Bank Capital Notes. Information on details of capital instruments is available in the Regulatory Disclosures section of the Macquarie public website. Deductions from Common Equity Tier 1 capital include intangibles, certain capitalised expenses and deferred tax assets. In addition, APRA’s Basel III rules require that equity investments and investments in subsidiaries that are insurance entities, fund management entities, special purpose securitisation entities and non-financial entities are fully deducted from Common Equity Tier 1 capital. The Consolidated Entity’s Tier 2 capital includes term subordinated debt, certain reserves and applicable deductions.
The Consolidated Entity and the Company have complied with all internal and external capital management requirements throughout the financial year.

83
Income StatementsStatements of comprehensive incomeStatements of financial positionStatements of changes in equityStatements of cash flowsNotes to the financial statementsDirectors’ declaration Independent auditor’s report
FURTHER INFORMATIONOFR DIRECTORS’ REPORT FINANCIAL REPORT
NOTE 25Loan capitalSubordinated debtAgreements between the Consolidated Entity and the lenders provide that, in the event of liquidation, entitlement of such lenders to repayment of the principal sum and interest thereon is and shall at all times be and remain subordinated to the rights of all other present and future creditors of the Consolidated Entity. Details of selected capital instruments with conditional repayment obligations are discussed below.
Macquarie Bank Capital Notes (BCN)On 8 October 2014, the Company issued 4.3 million BCN at face value of $100 each. These instruments are non-cumulative and unsecured and may be redeemed at face value on 24 March 2020, 24 September 2020 or 24 March 2021 (subject to certain conditions being satisfied) or earlier in specified circumstances at the discretion of the Company, subject to APRA’s written approval.
BCN may also be exchanged into a variable number of MGL ordinary shares (subject to certain conditions being satisfied) on these redemption dates or mandatorily exchanged on 24 March 2023. The BCN may also be exchanged earlier on an acquisition event (where a person acquires control of MGL or the Company) or where APRA determines the Company would be non-viable without an exchange or a public sector injection of capital (or equivalent support).
In the event of an exchange, BCN Holders will receive up to approximately $101 worth of MGL ordinary shares per BCN held. The total number of ordinary shares that would be issued if all BCN were exchanged at 31 March 2018 would be 4,151,492 (31 March 2017: 4,923,360). The maximum number of ordinary shares that can be issued on an exchange is 37,056,481.
The BCN pay discretionary, floating rate cash distributions equal to 180-day BBSW plus a fixed margin of 3.30% per annum, adjusted for franking credits, paid semi-annually in arrears. If interest is not paid on the BCN, the Company will be restricted from paying dividends or returning capital on ordinary shares until the next interest payment date.
Macquarie Additional Capital Securities (MACS)On 8 March 2017, the Company, acting through its London Branch, issued $US750 million of MACS.
The MACS, being unsecured subordinated notes, pay discretionary, non-cumulative interest of 6.125% per annum, payable semi-annually in arrears, with the rate to be reset on the tenth anniversary (and each fifth anniversary thereafter), if the MACS remain outstanding after this time. If interest is not paid on the MACS, the Company will be restricted from paying dividends or returning capital on its ordinary shares until the next interest payment date.
The MACS may be exchanged on an acquisition event (where a person acquires control of the Company or MGL), where the Company’s common equity Tier 1 capital ratio falls below 5.125%, or where APRA determines MBL would be non-viable without an exchange or a public sector injection of capital (or equivalent support).
If exchange occurs, a variable number of MGL ordinary shares will be issued at a 1% discount to the share price, as quoted on the ASX and converted to US dollars, determined over a period immediately prior to the date of that exchange.
No MACS were exchanged during the financial year. The total number of MGL ordinary shares that would be issued if all MACS were exchanged at 31 March 2018 would be 9,469,528 (31 March 2017: 11,189,774). The maximum number of ordinary shares that can be issued on an exchange is 56,947,286.
The MACS will only be redeemable, subject to APRA’s written approval, at the discretion of MBL in limited circumstances, including following a change in law that has an impact on the regulatory or tax treatment of the MACS.
Exchangeable Capital Securities (ECS)On 26 March 2012, MBL, acting through its London Branch, issued $US250 million of ECS. During the current financial year, MBL bought back ECS and extinguished the entire $US250 million.
Under its terms, the ECS, being unsecured subordinated notes, paid discretionary, non-cumulative interest of 10.25% per annum, payable semi-annually in arrears.
The ECS were exchangeable for a variable number of fully paid ordinary shares of the Company.
No ECS were exchanged during the period before their buyback.
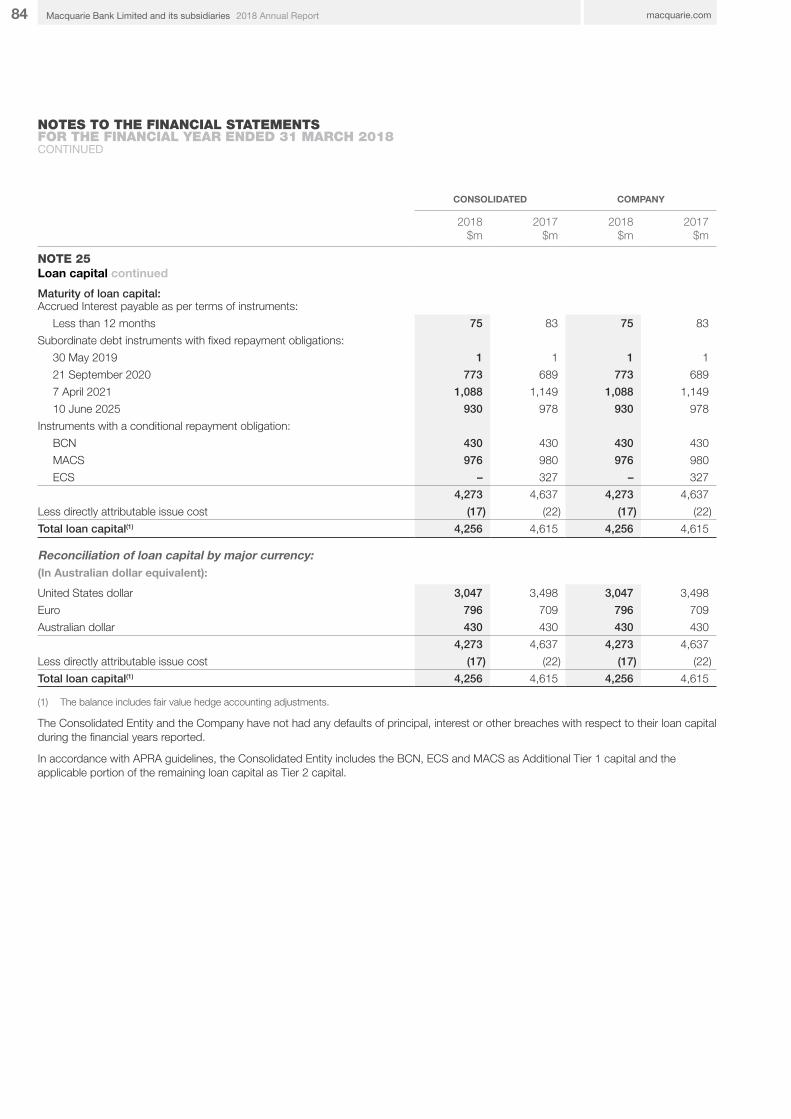
84 macquarie.com2018 Annual ReportMacquarie Bank Limited and its subsidiaries
NOTES TO THE FINANCIAL STATEMENTS FOR THE FINANCIAL YEAR ENDED 31 MARCH 2018CONTINUED
CONSOLIDATED COMPANY
2018$m
2017 $m
2018$m
2017 $m
NOTE 25Loan capital continued
Maturity of loan capital: Accrued Interest payable as per terms of instruments:
Less than 12 months 75 83 75 83
Subordinate debt instruments with fixed repayment obligations:
30 May 2019 1 1 1 1
21 September 2020 773 689 773 689
7 April 2021 1,088 1,149 1,088 1,149
10 June 2025 930 978 930 978
Instruments with a conditional repayment obligation:
BCN 430 430 430 430
MACS 976 980 976 980
ECS – 327 – 327
4,273 4,637 4,273 4,637
Less directly attributable issue cost (17) (22) (17) (22)
Total loan capital(1) 4,256 4,615 4,256 4,615
Reconciliation of loan capital by major currency: (In Australian dollar equivalent):
United States dollar 3,047 3,498 3,047 3,498
Euro 796 709 796 709
Australian dollar 430 430 430 430
4,273 4,637 4,273 4,637
Less directly attributable issue cost (17) (22) (17) (22)
Total loan capital(1) 4,256 4,615 4,256 4,615
(1) The balance includes fair value hedge accounting adjustments.
The Consolidated Entity and the Company have not had any defaults of principal, interest or other breaches with respect to their loan capital during the financial years reported.
In accordance with APRA guidelines, the Consolidated Entity includes the BCN, ECS and MACS as Additional Tier 1 capital and the applicable portion of the remaining loan capital as Tier 2 capital.

85
Income StatementsStatements of comprehensive incomeStatements of financial positionStatements of changes in equityStatements of cash flowsNotes to the financial statementsDirectors’ declaration Independent auditor’s report
FURTHER INFORMATIONOFR DIRECTORS’ REPORT FINANCIAL REPORT
CONSOLIDATED AND COMPANY
2018Number
of shares
2017Number
of shares2018
$m2017
$m
NOTE 26Contributed equity
Ordinary share capital(1)
Opening balance of fully paid ordinary shares 589,276,303 589,276,303 9,328 9,328
Closing balance of fully paid ordinary shares 589,276,303 589,276,303 9,328 9,328
(1) Ordinary shares have no par value.
Equity contribution from ultimate parent entity
Balance at the beginning of the financial year 192 163 93 89
Additional paid up capital 17 29 9 4
Balance at the end of the financial year 209 192 102 93
MEREP awards are primarily settled in MGL ordinary shares. Where MEREP Awards are issued by MGL to employees of the Consolidated Entity, and MGL is not subsequently reimbursed by the Consolidated Entity, the Consolidated Entity recognises the grant date fair value of the award net of tax as a capital contribution from MGL. If issued awards expire, the reversal of the original contribution is recognised as a return of capital. For further information regarding the terms and conditions of MEREP refer to Note 31 – Employee equity participation.
Macquarie Income Securities
4,000,000 Macquarie Income Securities of $100 each 400 400 400 400
Less transaction costs for original placement (9) (9) (9) (9)
Total Macquarie Income Securities 391 391 391 391
Contributed equity 9,928 9,911 9,821 9,812
The MIS are redeemable (in whole or in part) at the Company’s discretion. They are classified as equity in accordance with AASB 132 Financial Instruments: Presentation. Interest is paid quarterly at a floating rate of Bank Bill Swap Rate (BBSW) plus 1.7% p.a. Payment of interest to holders is subject to certain conditions, including the profitability of the Company. They are a perpetual instrument with no conversion rights.
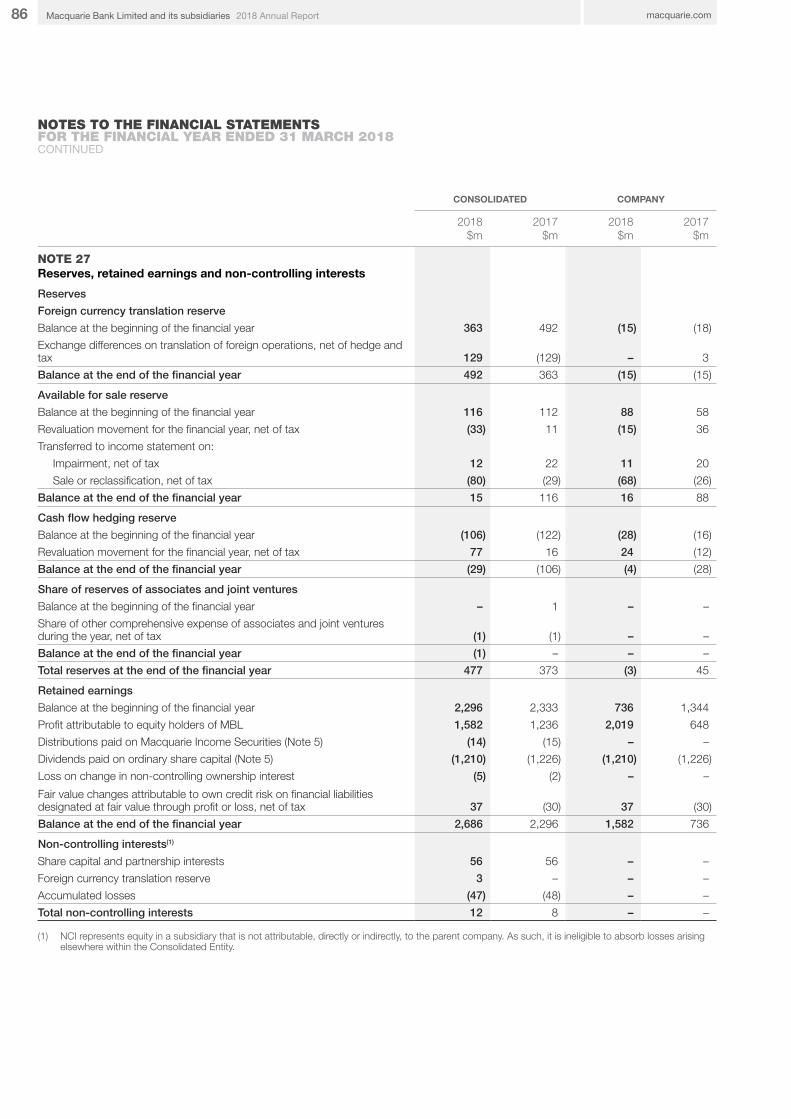
86 macquarie.com2018 Annual ReportMacquarie Bank Limited and its subsidiaries
NOTES TO THE FINANCIAL STATEMENTS FOR THE FINANCIAL YEAR ENDED 31 MARCH 2018CONTINUED
CONSOLIDATED COMPANY
2018$m
2017 $m
2018$m
2017 $m
NOTE 27Reserves, retained earnings and non-controlling interests
Reserves
Foreign currency translation reserve
Balance at the beginning of the financial year 363 492 (15) (18)
Exchange differences on translation of foreign operations, net of hedge and tax 129 (129) – 3
Balance at the end of the financial year 492 363 (15) (15)
Available for sale reserve
Balance at the beginning of the financial year 116 112 88 58
Revaluation movement for the financial year, net of tax (33) 11 (15) 36
Transferred to income statement on:
Impairment, net of tax 12 22 11 20
Sale or reclassification, net of tax (80) (29) (68) (26)
Balance at the end of the financial year 15 116 16 88
Cash flow hedging reserve
Balance at the beginning of the financial year (106) (122) (28) (16)
Revaluation movement for the financial year, net of tax 77 16 24 (12)
Balance at the end of the financial year (29) (106) (4) (28)
Share of reserves of associates and joint ventures
Balance at the beginning of the financial year – 1 – –
Share of other comprehensive expense of associates and joint ventures during the year, net of tax (1) (1) – –
Balance at the end of the financial year (1) – – –
Total reserves at the end of the financial year 477 373 (3) 45
Retained earnings
Balance at the beginning of the financial year 2,296 2,333 736 1,344
Profit attributable to equity holders of MBL 1,582 1,236 2,019 648
Distributions paid on Macquarie Income Securities (Note 5) (14) (15) – –
Dividends paid on ordinary share capital (Note 5) (1,210) (1,226) (1,210) (1,226)
Loss on change in non-controlling ownership interest (5) (2) – –
Fair value changes attributable to own credit risk on financial liabilities designated at fair value through profit or loss, net of tax 37 (30) 37 (30)
Balance at the end of the financial year 2,686 2,296 1,582 736
Non-controlling interests(1)
Share capital and partnership interests 56 56 – –
Foreign currency translation reserve 3 – – –
Accumulated losses (47) (48) – –
Total non-controlling interests 12 8 – –
(1) NCI represents equity in a subsidiary that is not attributable, directly or indirectly, to the parent company. As such, it is ineligible to absorb losses arising elsewhere within the Consolidated Entity.

87
Income StatementsStatements of comprehensive incomeStatements of financial positionStatements of changes in equityStatements of cash flowsNotes to the financial statementsDirectors’ declaration Independent auditor’s report
FURTHER INFORMATIONOFR DIRECTORS’ REPORT FINANCIAL REPORT
NOTE 28Notes to the statements of cash flows Reconciliation of cash and cash equivalentsCash and cash equivalents at the end of the financial year are reflected in the related items in the statements of financial position as follows:
CONSOLIDATED COMPANY
2018$m
2017 $m
2018$m
2017 $m
Receivables from financial institutions (1) 7,793 7,606 6,594 6,162
Trading portfolio assets (2) 611 1,061 222 474
Debt investment securities available for sale (3) 1,141 324 1,141 324
Loan assets held at amortised cost(4) 1,805 1,173 1,773 1,162
Cash and cash equivalents at the end of the financial year (5) 11,350 10,164 9,730 8,122
Reconciliation of profit after income tax to net cash flows from/(used in) operating activitiesProfit after income tax 1,583 1,224 2,019 648
Adjustments to profit after income tax:
Depreciation and amortisation 1,063 775 317 61
Unrealised foreign exchange and fair value movements on financial assets and liabilities 276 (733) (296) (972)
Credit losses and impairment charges 110 337 (1) 418
Investment income and gain on sale of operating lease assets and other non-financial assets (292) (526) (129) (131)
Share of net (profits)/losses of associates and joint ventures (22) 19 – –
Changes in assets and liabilities:
Change in interest receivable and payable – 105 27 83
Change in carrying values of associates and joint ventures due to dividends received 19 9 – –
Change in fees and non-interest income receivable 41 13 (11) 12
Change in fees and commissions payable (78) (36) (164) (29)
Change in tax balances 471 333 245 (25)
Change in operating lease assets (1,206) (301) (878) (245)
Change in loan assets and balances with related entities 2,699 318 992 4,310
Change in margin money (105) (1,113) 627 (213)
Change in debtors, prepayments, accrued charges and creditors 163 418 93 (27)
Change in net trading portfolio assets and liabilities and net derivative financial instruments(6) 1,207 3,131 (2,779) 4,014
Change in payable to financial institutions and other borrowings (899) (3,971) (812) (3,939)
Change in debt issued at amortised cost (3,857) (11,362) 207 (10,119)
Change in deposits 1,493 5,559 1,451 5,448
Net cash flows from/(used in) operating activities 2,666 (5,801) 908 (706)
(1) Includes cash at bank, overnight cash at bank, other loans to banks and amounts due from clearing houses.(2) Includes certificates of deposit, bank bills, treasury notes and other short-term debt securities.(3) Includes short-term debt securities. (4) Includes margin balances at call.(5) Cash and cash equivalents include $4,330 million (31 March 2017: $5,011 million) in the Consolidated Entity and $3,478 million (31 March 2017: $3,656
million) in the Company in escrow accounts which are restricted for use or held by collateralised securitisation vehicles in segregated deposit fund.
(6) Includes unrealised foreign exchange movements relating to derivatives which largely offsets the unrealised foreign exchange movements on financial assets and liabilities.
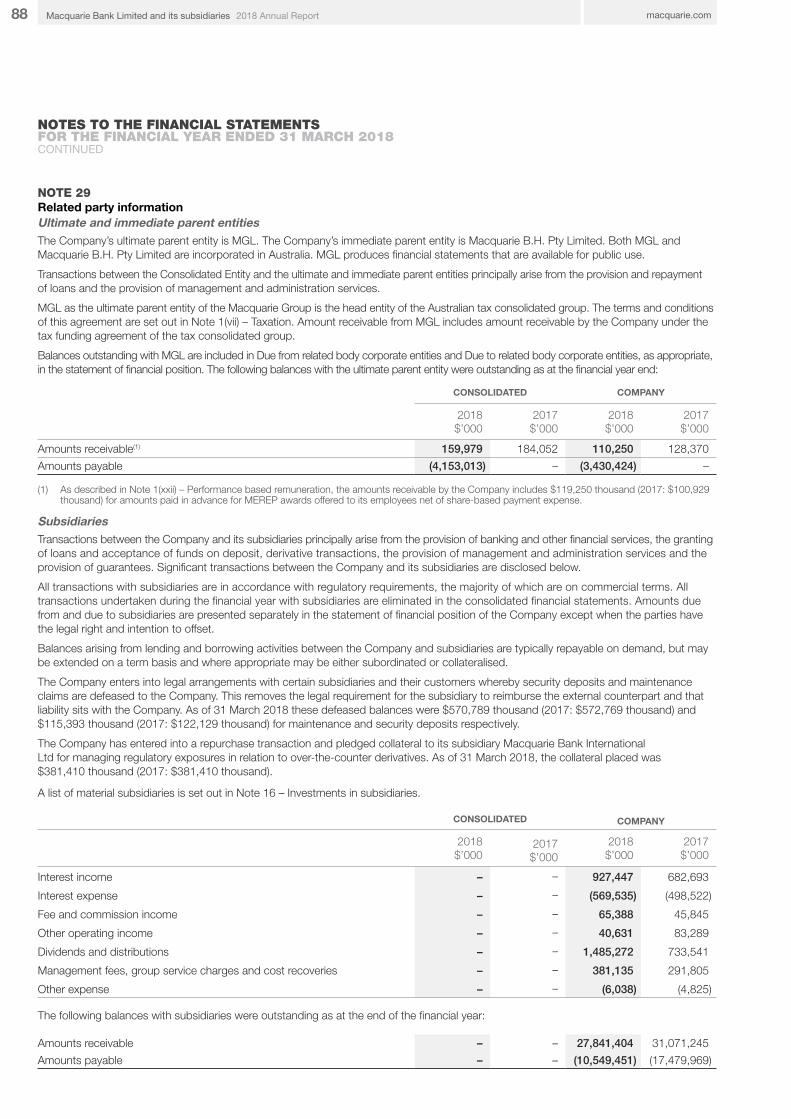
88 macquarie.com2018 Annual ReportMacquarie Bank Limited and its subsidiaries
NOTES TO THE FINANCIAL STATEMENTS FOR THE FINANCIAL YEAR ENDED 31 MARCH 2018CONTINUED
NOTE 29Related party informationUltimate and immediate parent entitiesThe Company’s ultimate parent entity is MGL. The Company’s immediate parent entity is Macquarie B.H. Pty Limited. Both MGL and Macquarie B.H. Pty Limited are incorporated in Australia. MGL produces financial statements that are available for public use.
Transactions between the Consolidated Entity and the ultimate and immediate parent entities principally arise from the provision and repayment of loans and the provision of management and administration services.
MGL as the ultimate parent entity of the Macquarie Group is the head entity of the Australian tax consolidated group. The terms and conditions of this agreement are set out in Note 1(vii) – Taxation. Amount receivable from MGL includes amount receivable by the Company under the tax funding agreement of the tax consolidated group.
Balances outstanding with MGL are included in Due from related body corporate entities and Due to related body corporate entities, as appropriate, in the statement of financial position. The following balances with the ultimate parent entity were outstanding as at the financial year end:
CONSOLIDATED COMPANY
2018$’000
2017 $’000
2018$’000
2017 $’000
Amounts receivable(1) 159,979 184,052 110,250 128,370
Amounts payable (4,153,013) – (3,430,424) –
(1) As described in Note 1(xxii) – Performance based remuneration, the amounts receivable by the Company includes $119,250 thousand (2017: $100,929 thousand) for amounts paid in advance for MEREP awards offered to its employees net of share-based payment expense.
SubsidiariesTransactions between the Company and its subsidiaries principally arise from the provision of banking and other financial services, the granting of loans and acceptance of funds on deposit, derivative transactions, the provision of management and administration services and the provision of guarantees. Significant transactions between the Company and its subsidiaries are disclosed below.
All transactions with subsidiaries are in accordance with regulatory requirements, the majority of which are on commercial terms. All transactions undertaken during the financial year with subsidiaries are eliminated in the consolidated financial statements. Amounts due from and due to subsidiaries are presented separately in the statement of financial position of the Company except when the parties have the legal right and intention to offset.
Balances arising from lending and borrowing activities between the Company and subsidiaries are typically repayable on demand, but may be extended on a term basis and where appropriate may be either subordinated or collateralised.
The Company enters into legal arrangements with certain subsidiaries and their customers whereby security deposits and maintenance claims are defeased to the Company. This removes the legal requirement for the subsidiary to reimburse the external counterpart and that liability sits with the Company. As of 31 March 2018 these defeased balances were $570,789 thousand (2017: $572,769 thousand) and $115,393 thousand (2017: $122,129 thousand) for maintenance and security deposits respectively.
The Company has entered into a repurchase transaction and pledged collateral to its subsidiary Macquarie Bank International Ltd for managing regulatory exposures in relation to over-the-counter derivatives. As of 31 March 2018, the collateral placed was $381,410 thousand (2017: $381,410 thousand).
A list of material subsidiaries is set out in Note 16 – Investments in subsidiaries.
CONSOLIDATED COMPANY
2018$’000
2017$’000
2018$’000
2017$’000
Interest income – – 927,447 682,693
Interest expense – – (569,535) (498,522)
Fee and commission income – – 65,388 45,845
Other operating income – – 40,631 83,289
Dividends and distributions – – 1,485,272 733,541
Management fees, group service charges and cost recoveries – – 381,135 291,805
Other expense – – (6,038) (4,825)
The following balances with subsidiaries were outstanding as at the end of the financial year:
Amounts receivable – – 27,841,404 31,071,245
Amounts payable – – (10,549,451) (17,479,969)

89
Income StatementsStatements of comprehensive incomeStatements of financial positionStatements of changes in equityStatements of cash flowsNotes to the financial statementsDirectors’ declaration Independent auditor’s report
FURTHER INFORMATIONOFR DIRECTORS’ REPORT FINANCIAL REPORT
NOTE 29Related party information continuedOther related body corporate entitiesTransactions between the Consolidated Entity and other related body corporate entities under common control principally arise from the provision of banking and other financial services, the granting of loans and acceptance of funds on deposit, the provision of management and administration services, facilities and accommodation and the provision of guarantees.
Balances arising from lending and borrowing activities between the Consolidated Entity and other related body corporate entities are typically repayable on demand, but may be extended on a term basis and where appropriate may be either subordinated or collateralised.
The following income/(expense) resulted from transactions with other related body corporate entities during the financial year:
CONSOLIDATED COMPANY
2018$’000
2017 $’000
2018$’000
2017 $’000
Interest income 5,709 3,396 8,604 2,019
Interest expense (269,389) (232,263) (210,589) (181,643)
Rental income 21,168 21,169 21,168 21,169
Fee and commission expense (157,562) (220,674) (142,179) (196,975)
Other operating expenses (1,228,199) (1,312,102) (1,011,496) (1,084,432)
Other income/(expense) 1,881 (471) 1,684 (1,284)
The following balances with other related body corporate entities were outstanding as at financial year end:
Amounts receivable 1,222,857 1,548,724 1,101,575 1,406,923
Amounts payable (9,840,305) (7,367,119) (8,399,667) (5,959,434)
Associates and joint venturesTransactions between the Consolidated Entity and its associates and joint ventures principally arise from the provision of corporate advisory services, the granting of loans, derivative transactions and the provision of management services. All unrealised transactions undertaken with associates and joint ventures are eliminated in the consolidated income statement to the extent of ownership interests held by the Consolidated Entity. During the financial year, the following amounts of income/(expense) resulted from transactions with associates and joint ventures:
Interest income 64,853 19,287 62,596 18,502
Fee and commission expense (47,806) (38,539) (47,481) (37,964)
Brokerage and commission expense (6,015) (4,812) (5,529) (3,937)
Dividends and distributions(1) 19,075 9,000 – –
(1) Dividends and distributions are shown as gross amounts. Under the equity method, these amounts are not included as income but are recorded as a reduction from the carrying amount of the investment.
The following balances with associates and joint ventures were outstanding as at financial year end (these exclude amounts which in substance form part of the Consolidated Entity’s net investment in associates, disclosed in Note 14 – Interests in associates and joint ventures):
Amounts receivable 82,504 242,262 46,546 228,272
Amounts payable (3,636) (3,488) (3,636) (3,488)
Balances arising from lending and borrowing activities between the Consolidated Entity and its associates and joint ventures are typically extended on a term basis and where appropriate may be either subordinated or collateralised.

90 macquarie.com2018 Annual ReportMacquarie Bank Limited and its subsidiaries
NOTES TO THE FINANCIAL STATEMENTS FOR THE FINANCIAL YEAR ENDED 31 MARCH 2018CONTINUED
NOTE 30Key Management Personnel disclosure Key Management PersonnelThe following persons were Directors of the Bank during the financial years ended 31 March 2018 and 31 March 2017, unless indicated:
Executive Voting Directors(1)
N.W. Moore Macquarie Group CEO
M.J. Reemst Macquarie Bank CEO
Non-Executive Directors
P.H. Warne(2) Chairman
G.R. Banks AO
G.M. Cairns
M.J. Coleman
P.A. Cross
D.J. Grady AM
M.J. Hawker AM
G.R Stevens AC (appointed effective 1 November 2017)
N.M. Wakefield Evans
In addition to the Executive Voting Directors listed above, the following persons also had authority and responsibility for planning, directing and controlling the activities of the Consolidated Entity during the past two financial years ended 31 March 2018 and 31 March 2017, unless otherwise indicated.
Current Executives(1)
B.A. Brazil Co-Head of CAF
A.J. Downe Head of CGM
G.A. Farrell Co-Head of CAF
A. Harvey CFO, Head of FMG (appointed effective 1 January 2018)
N. O’Kane Head of CMF (appointed effective 15 June 2017)
N. Sorbara COO, Head of COG
P.C. Upfold(3) CRO, Head of RMG
G.C. Ward Macquarie Group Deputy Managing Director and Head of BFS
S. Wikramanayake Head of MAM
Former Executive
S.D Allen Former CRO, Head of RMG (ceased to be a member of the Executive Committee on 31 December 2017).
M. McLaughlin Former Country Head, United States of America (ceased to be a member of the Executive Committee on 15 June 2017)
S. Vrcelj Former Head of MSG (ceased to be a member of the Executive Committee on 29 November 2016)
The remuneration arrangements for all of the persons listed above are described on pages 29 to 36 of the Remuneration Report, contained in the Directors’ Report.
(1) Except whereas indicated otherwise, the Executive Voting Directors and all Current Executives listed above are members of the Company’s Executive Committee as at 4 May 2018.
(2) P.H. Warne commenced as Chairman of the MBL Board effective 1 April 2016.(3) Mr. Upfold was an Executive KMP for FY2018 but changed roles during the year, commencing as CRO, Head of RMG on 1 January 2018. He was
formally CFO, Head of FMG.
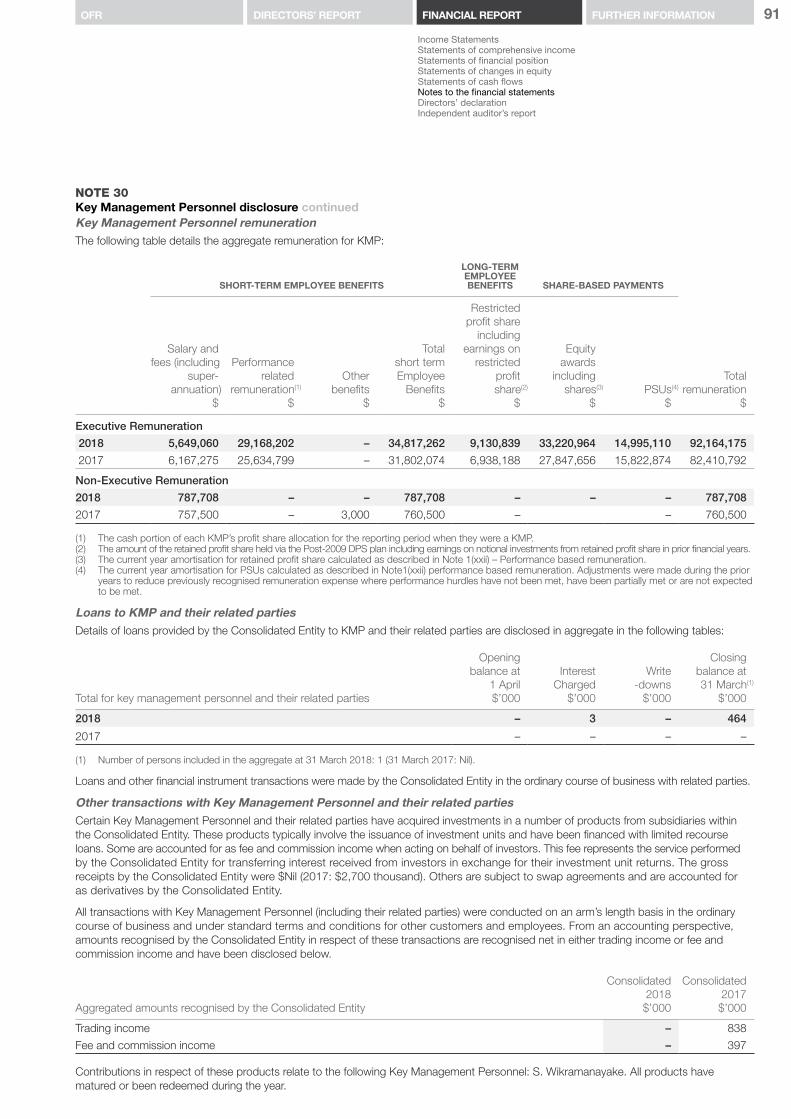
91
Income StatementsStatements of comprehensive incomeStatements of financial positionStatements of changes in equityStatements of cash flowsNotes to the financial statementsDirectors’ declaration Independent auditor’s report
FURTHER INFORMATIONOFR DIRECTORS’ REPORT FINANCIAL REPORT
NOTE 30Key Management Personnel disclosure continuedKey Management Personnel remunerationThe following table details the aggregate remuneration for KMP:
SHORT-TERM EMPLOYEE BENEFITS
LONG-TERM EMPLOYEE BENEFITS SHARE-BASED PAYMENTS
Salary andfees (including
super-annuation)
$
Performancerelated
remuneration(1)
$
Other benefits
$
Total short termEmployee
Benefits$
Restrictedprofit share
includingearnings on
restrictedprofitshare(2)
$
Equityawards
includingshares(3)
$PSUs(4)
$
Totalremuneration
$
Executive Remuneration
2018 5,649,060 29,168,202 – 34,817,262 9,130,839 33,220,964 14,995,110 92,164,175
2017 6,167,275 25,634,799 – 31,802,074 6,938,188 27,847,656 15,822,874 82,410,792
Non-Executive Remuneration
2018 787,708 – – 787,708 – – – 787,708
2017 757,500 – 3,000 760,500 – – 760,500
(1) The cash portion of each KMP’s profit share allocation for the reporting period when they were a KMP.(2) The amount of the retained profit share held via the Post-2009 DPS plan including earnings on notional investments from retained profit share in prior financial years.(3) The current year amortisation for retained profit share calculated as described in Note 1(xxii) – Performance based remuneration.(4) The current year amortisation for PSUs calculated as described in Note1(xxii) performance based remuneration. Adjustments were made during the prior
years to reduce previously recognised remuneration expense where performance hurdles have not been met, have been partially met or are not expected to be met.
Loans to KMP and their related parties Details of loans provided by the Consolidated Entity to KMP and their related parties are disclosed in aggregate in the following tables:
Total for key management personnel and their related parties
Openingbalance at
1 April $’000
InterestCharged
$’000
Write-downs
$’000
Closingbalance at 31 March(1)
$’000
2018 – 3 – 464
2017 – – – –
(1) Number of persons included in the aggregate at 31 March 2018: 1 (31 March 2017: Nil).
Loans and other financial instrument transactions were made by the Consolidated Entity in the ordinary course of business with related parties.
Other transactions with Key Management Personnel and their related parties Certain Key Management Personnel and their related parties have acquired investments in a number of products from subsidiaries within the Consolidated Entity. These products typically involve the issuance of investment units and have been financed with limited recourse loans. Some are accounted for as fee and commission income when acting on behalf of investors. This fee represents the service performed by the Consolidated Entity for transferring interest received from investors in exchange for their investment unit returns. The gross receipts by the Consolidated Entity were $Nil (2017: $2,700 thousand). Others are subject to swap agreements and are accounted for as derivatives by the Consolidated Entity.
All transactions with Key Management Personnel (including their related parties) were conducted on an arm’s length basis in the ordinary course of business and under standard terms and conditions for other customers and employees. From an accounting perspective, amounts recognised by the Consolidated Entity in respect of these transactions are recognised net in either trading income or fee and commission income and have been disclosed below.
Aggregated amounts recognised by the Consolidated Entity
Consolidated2018
$’000
Consolidated2017$’000
Trading income – 838
Fee and commission income – 397
Contributions in respect of these products relate to the following Key Management Personnel: S. Wikramanayake. All products have matured or been redeemed during the year.

92 macquarie.com2018 Annual ReportMacquarie Bank Limited and its subsidiaries
NOTES TO THE FINANCIAL STATEMENTS FOR THE FINANCIAL YEAR ENDED 31 MARCH 2018CONTINUED
NOTE 31Employee equity participationMEREPMGL continues to operate the MEREP in conjunction with other remuneration arrangements.
Award Types under the MEREPRestricted Share Units (RSUs)
A RSU is a beneficial interest in a MGL ordinary share held on behalf of a MEREP participant by the plan trustee (Trustee).
The participant is entitled to receive dividends on the share and direct the Trustee how to exercise voting rights of the share. The participant also has the right to request the release of the share from the Trust, subject to the vesting and forfeiture provisions of the MEREP.
Deferred Share Units (DSUs)
A DSU represents the right to receive on exercise of the DSU either a share held in the Trust or a newly issued share (as determined by MGL in its absolute discretion) for no cash payment, subject to the vesting and forfeiture provisions of the MEREP. A MEREP participant holding a DSU has no right or interest in any share until the DSU is exercised. MGL may issue shares to the Trustee or direct the Trustee to acquire shares on-market, or via a share acquisition arrangement for potential future allocations to holders of DSUs. Generally, where permitted by law, DSUs will provide for cash payments in lieu of dividends paid on
MGL ordinary shares before the DSU is exercised. Further, the number of shares underlying a DSU will be adjusted upon any bonus issue or other capital reconstruction of MGL in accordance with the ASX Listing Rules, so that the holder of a DSU does not receive a benefit that holders of MGL shares do not generally receive. These provisions are intended to provide the holders of DSUs, as far as possible, with the same benefits and risks as holders of RSUs. However, holders of DSUs will have no voting rights with respect to any underlying MGL ordinary shares. DSUs will only be offered in jurisdictions where legal or tax rules make the grant of RSUs impractical, or where PSUs are structured as DSUs (see PSUs). DSUs have been granted with an expiry period of up to eight years.
Performance Share Units (PSUs)
All PSUs currently on issue are structured as DSUs with performance hurdles that must be met before the underlying share or cash equivalent (as the case may be) will be delivered. PSU holders have no right to dividend equivalent payments before the PSUs vest.
Restricted Shares
A Restricted Share is a Macquarie share transferred from the MEREP Trust and held by a MEREP participant subject to restrictions on disposal, vesting and forfeiture rules. The participant is entitled to receive dividends on, and to exercise the right of, the Restricted Shares. Restricted Shares are only offered in jurisdictions where legal or tax rules make RSU/DSU awards impractical.
The following is a summary of Awards which have been granted to the employees of the Consolidated Entity pursuant to the MEREP:
NUMBER OF RSU AWARDS
2018 2017
RSUs on issue at the beginning of the financial year 6,619,655 7,184,674
Granted during the financial year 1,571,969 1,970,285
Forfeited during the financial year (1,815,730) (135,300)
Vested RSUs withdrawn or sold from the MEREP during the financial year (180,167) (2,293,701)
Transfers to related body corporate entities (533,341) (106,303)
RSUs on issue at the end of the financial year 5,662,386 6,619,655
RSUs vested and not withdrawn from the MEREP at the end of the financial year 1,979 2,637
The weighted average fair value of the RSU awards granted during the financial year was $90.20 (2017: $72.74).
NUMBER OF DSU AWARDS
2018 2017
DSUs on issue at the beginning of the financial year 1,281,176 1,290,490
Granted during the financial year 453,383 464,300
Forfeited during the financial year (358,627) (767)
Exercised during the financial year (55,598) (468,409)
Transfers to related body corporate entities (7,287) (4,438)
DSUs on issue at the end of the financial year 1,313,047 1,281,176
DSUs exercisable at the end of the financial year 197,274 153,422
The weighted average fair value of the DSU awards granted during the financial year was $90.21 (2017: $72.86).
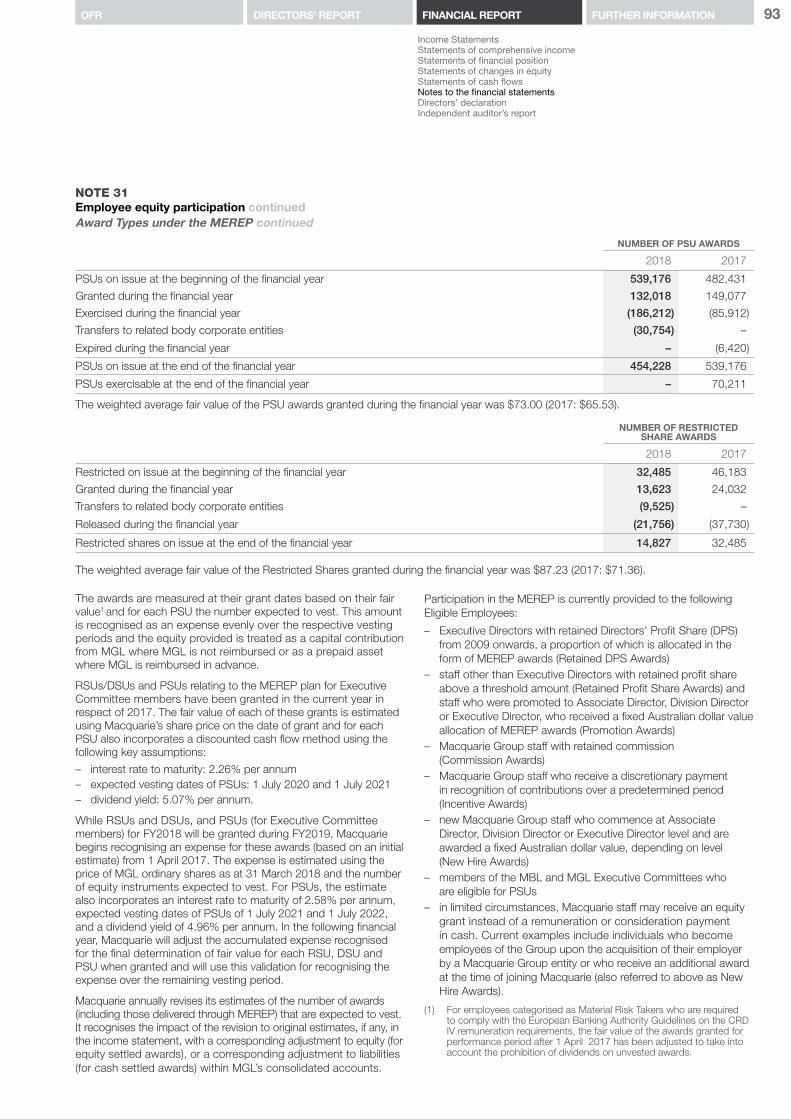
93
Income StatementsStatements of comprehensive incomeStatements of financial positionStatements of changes in equityStatements of cash flowsNotes to the financial statementsDirectors’ declaration Independent auditor’s report
FURTHER INFORMATIONOFR DIRECTORS’ REPORT FINANCIAL REPORT
NOTE 31Employee equity participation continued Award Types under the MEREP continued
NUMBER OF PSU AWARDS
2018 2017
PSUs on issue at the beginning of the financial year 539,176 482,431
Granted during the financial year 132,018 149,077
Exercised during the financial year (186,212) (85,912)
Transfers to related body corporate entities (30,754) –
Expired during the financial year – (6,420)
PSUs on issue at the end of the financial year 454,228 539,176
PSUs exercisable at the end of the financial year – 70,211
The weighted average fair value of the PSU awards granted during the financial year was $73.00 (2017: $65.53).
NUMBER OF RESTRICTED SHARE AWARDS
2018 2017
Restricted on issue at the beginning of the financial year 32,485 46,183
Granted during the financial year 13,623 24,032
Transfers to related body corporate entities (9,525) –
Released during the financial year (21,756) (37,730)
Restricted shares on issue at the end of the financial year 14,827 32,485
The weighted average fair value of the Restricted Shares granted during the financial year was $87.23 (2017: $71.36).
The awards are measured at their grant dates based on their fair value1 and for each PSU the number expected to vest. This amount is recognised as an expense evenly over the respective vesting periods and the equity provided is treated as a capital contribution from MGL where MGL is not reimbursed or as a prepaid asset where MGL is reimbursed in advance.
RSUs/DSUs and PSUs relating to the MEREP plan for Executive Committee members have been granted in the current year in respect of 2017. The fair value of each of these grants is estimated using Macquarie’s share price on the date of grant and for each PSU also incorporates a discounted cash flow method using the following key assumptions:
– interest rate to maturity: 2.26% per annum – expected vesting dates of PSUs: 1 July 2020 and 1 July 2021 – dividend yield: 5.07% per annum.
While RSUs and DSUs, and PSUs (for Executive Committee members) for FY2018 will be granted during FY2019, Macquarie begins recognising an expense for these awards (based on an initial estimate) from 1 April 2017. The expense is estimated using the price of MGL ordinary shares as at 31 March 2018 and the number of equity instruments expected to vest. For PSUs, the estimate also incorporates an interest rate to maturity of 2.58% per annum, expected vesting dates of PSUs of 1 July 2021 and 1 July 2022, and a dividend yield of 4.96% per annum. In the following financial year, Macquarie will adjust the accumulated expense recognised for the final determination of fair value for each RSU, DSU and PSU when granted and will use this validation for recognising the expense over the remaining vesting period.
Macquarie annually revises its estimates of the number of awards (including those delivered through MEREP) that are expected to vest. It recognises the impact of the revision to original estimates, if any, in the income statement, with a corresponding adjustment to equity (for equity settled awards), or a corresponding adjustment to liabilities (for cash settled awards) within MGL’s consolidated accounts.
Participation in the MEREP is currently provided to the following Eligible Employees:
– Executive Directors with retained Directors’ Profit Share (DPS) from 2009 onwards, a proportion of which is allocated in the form of MEREP awards (Retained DPS Awards)
– staff other than Executive Directors with retained profit share above a threshold amount (Retained Profit Share Awards) and staff who were promoted to Associate Director, Division Director or Executive Director, who received a fixed Australian dollar value allocation of MEREP awards (Promotion Awards)
– Macquarie Group staff with retained commission (Commission Awards)
– Macquarie Group staff who receive a discretionary payment in recognition of contributions over a predetermined period (Incentive Awards)
– new Macquarie Group staff who commence at Associate Director, Division Director or Executive Director level and are awarded a fixed Australian dollar value, depending on level (New Hire Awards)
– members of the MBL and MGL Executive Committees who are eligible for PSUs
– in limited circumstances, Macquarie staff may receive an equity grant instead of a remuneration or consideration payment in cash. Current examples include individuals who become employees of the Group upon the acquisition of their employer by a Macquarie Group entity or who receive an additional award at the time of joining Macquarie (also referred to above as New Hire Awards).
(1) For employees categorised as Material Risk Takers who are required to comply with the European Banking Authority Guidelines on the CRD IV remuneration requirements, the fair value of the awards granted for performance period after 1 April 2017 has been adjusted to take into account the prohibition of dividends on unvested awards.
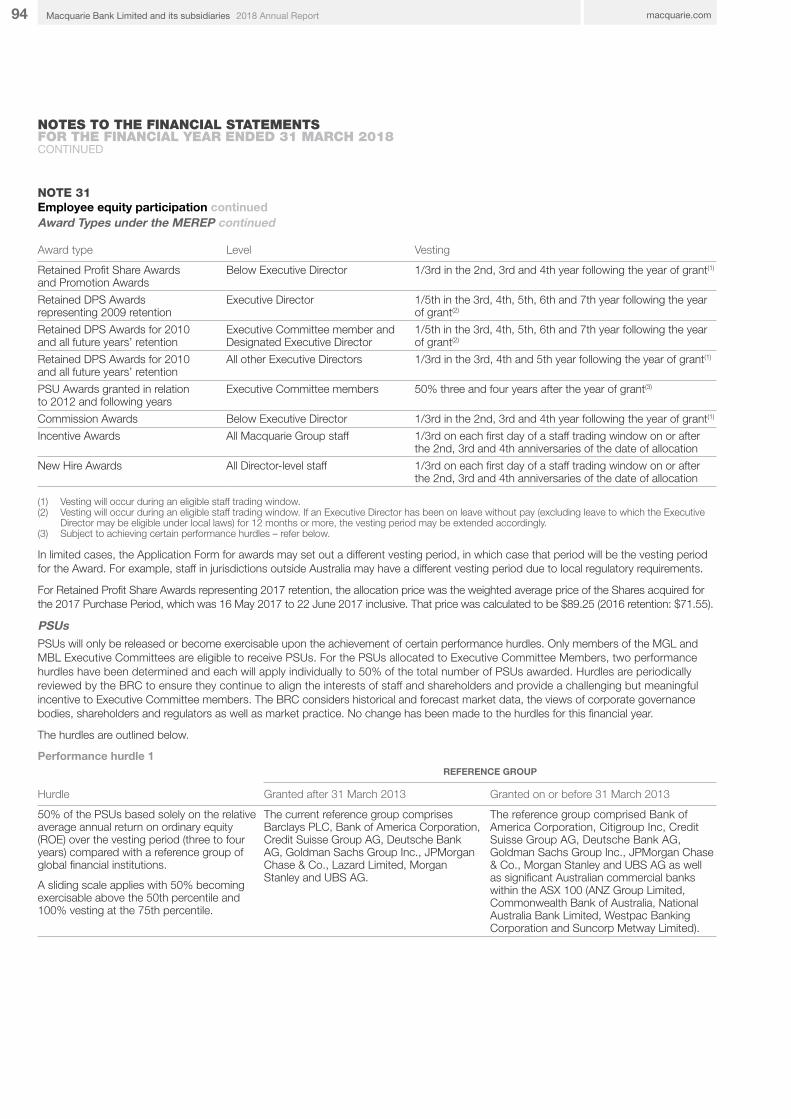
94 macquarie.com2018 Annual ReportMacquarie Bank Limited and its subsidiaries
NOTES TO THE FINANCIAL STATEMENTS FOR THE FINANCIAL YEAR ENDED 31 MARCH 2018CONTINUED
NOTE 31Employee equity participation continuedAward Types under the MEREP continued
Award type Level Vesting
Retained Profit Share Awards and Promotion Awards
Below Executive Director 1/3rd in the 2nd, 3rd and 4th year following the year of grant(1)
Retained DPS Awards representing 2009 retention
Executive Director 1/5th in the 3rd, 4th, 5th, 6th and 7th year following the year of grant(2)
Retained DPS Awards for 2010 and all future years’ retention
Executive Committee member and Designated Executive Director
1/5th in the 3rd, 4th, 5th, 6th and 7th year following the year of grant(2)
Retained DPS Awards for 2010 and all future years’ retention
All other Executive Directors 1/3rd in the 3rd, 4th and 5th year following the year of grant(1)
PSU Awards granted in relation to 2012 and following years
Executive Committee members 50% three and four years after the year of grant(3)
Commission Awards Below Executive Director 1/3rd in the 2nd, 3rd and 4th year following the year of grant(1)
Incentive Awards All Macquarie Group staff 1/3rd on each first day of a staff trading window on or after the 2nd, 3rd and 4th anniversaries of the date of allocation
New Hire Awards All Director-level staff 1/3rd on each first day of a staff trading window on or after the 2nd, 3rd and 4th anniversaries of the date of allocation
(1) Vesting will occur during an eligible staff trading window.(2) Vesting will occur during an eligible staff trading window. If an Executive Director has been on leave without pay (excluding leave to which the Executive
Director may be eligible under local laws) for 12 months or more, the vesting period may be extended accordingly. (3) Subject to achieving certain performance hurdles – refer below.
In limited cases, the Application Form for awards may set out a different vesting period, in which case that period will be the vesting period for the Award. For example, staff in jurisdictions outside Australia may have a different vesting period due to local regulatory requirements.
For Retained Profit Share Awards representing 2017 retention, the allocation price was the weighted average price of the Shares acquired for the 2017 Purchase Period, which was 16 May 2017 to 22 June 2017 inclusive. That price was calculated to be $89.25 (2016 retention: $71.55).
PSUsPSUs will only be released or become exercisable upon the achievement of certain performance hurdles. Only members of the MGL and MBL Executive Committees are eligible to receive PSUs. For the PSUs allocated to Executive Committee Members, two performance hurdles have been determined and each will apply individually to 50% of the total number of PSUs awarded. Hurdles are periodically reviewed by the BRC to ensure they continue to align the interests of staff and shareholders and provide a challenging but meaningful incentive to Executive Committee members. The BRC considers historical and forecast market data, the views of corporate governance bodies, shareholders and regulators as well as market practice. No change has been made to the hurdles for this financial year.
The hurdles are outlined below.
Performance hurdle 1REFERENCE GROUP
Hurdle Granted after 31 March 2013 Granted on or before 31 March 2013
50% of the PSUs based solely on the relative average annual return on ordinary equity (ROE) over the vesting period (three to four years) compared with a reference group of global financial institutions.
A sliding scale applies with 50% becoming exercisable above the 50th percentile and 100% vesting at the 75th percentile.
The current reference group comprises Barclays PLC, Bank of America Corporation, Credit Suisse Group AG, Deutsche Bank AG, Goldman Sachs Group Inc., JPMorgan Chase & Co., Lazard Limited, Morgan Stanley and UBS AG.
The reference group comprised Bank of America Corporation, Citigroup Inc, Credit Suisse Group AG, Deutsche Bank AG, Goldman Sachs Group Inc., JPMorgan Chase & Co., Morgan Stanley and UBS AG as well as significant Australian commercial banks within the ASX 100 (ANZ Group Limited, Commonwealth Bank of Australia, National Australia Bank Limited, Westpac Banking Corporation and Suncorp Metway Limited).
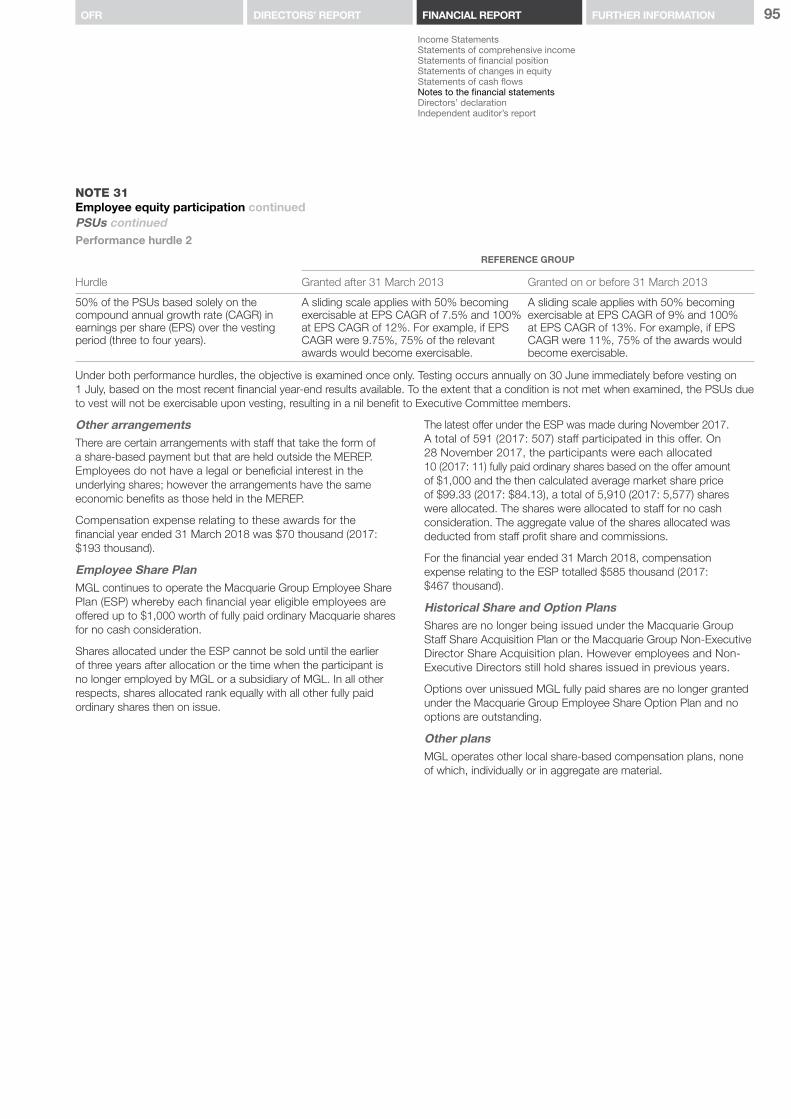
95
Income StatementsStatements of comprehensive incomeStatements of financial positionStatements of changes in equityStatements of cash flowsNotes to the financial statementsDirectors’ declaration Independent auditor’s report
FURTHER INFORMATIONOFR DIRECTORS’ REPORT FINANCIAL REPORT
NOTE 31Employee equity participation continuedPSUs continuedPerformance hurdle 2
REFERENCE GROUP
Hurdle Granted after 31 March 2013 Granted on or before 31 March 2013
50% of the PSUs based solely on the compound annual growth rate (CAGR) in earnings per share (EPS) over the vesting period (three to four years).
A sliding scale applies with 50% becoming exercisable at EPS CAGR of 7.5% and 100% at EPS CAGR of 12%. For example, if EPS CAGR were 9.75%, 75% of the relevant awards would become exercisable.
A sliding scale applies with 50% becoming exercisable at EPS CAGR of 9% and 100% at EPS CAGR of 13%. For example, if EPS CAGR were 11%, 75% of the awards would become exercisable.
Under both performance hurdles, the objective is examined once only. Testing occurs annually on 30 June immediately before vesting on 1 July, based on the most recent financial year-end results available. To the extent that a condition is not met when examined, the PSUs due to vest will not be exercisable upon vesting, resulting in a nil benefit to Executive Committee members.
Other arrangementsThere are certain arrangements with staff that take the form of a share-based payment but that are held outside the MEREP. Employees do not have a legal or beneficial interest in the underlying shares; however the arrangements have the same economic benefits as those held in the MEREP.
Compensation expense relating to these awards for the financial year ended 31 March 2018 was $70 thousand (2017: $193 thousand).
Employee Share PlanMGL continues to operate the Macquarie Group Employee Share Plan (ESP) whereby each financial year eligible employees are offered up to $1,000 worth of fully paid ordinary Macquarie shares for no cash consideration.
Shares allocated under the ESP cannot be sold until the earlier of three years after allocation or the time when the participant is no longer employed by MGL or a subsidiary of MGL. In all other respects, shares allocated rank equally with all other fully paid ordinary shares then on issue.
The latest offer under the ESP was made during November 2017. A total of 591 (2017: 507) staff participated in this offer. On 28 November 2017, the participants were each allocated 10 (2017: 11) fully paid ordinary shares based on the offer amount of $1,000 and the then calculated average market share price of $99.33 (2017: $84.13), a total of 5,910 (2017: 5,577) shares were allocated. The shares were allocated to staff for no cash consideration. The aggregate value of the shares allocated was deducted from staff profit share and commissions.
For the financial year ended 31 March 2018, compensation expense relating to the ESP totalled $585 thousand (2017: $467 thousand).
Historical Share and Option PlansShares are no longer being issued under the Macquarie Group Staff Share Acquisition Plan or the Macquarie Group Non-Executive Director Share Acquisition plan. However employees and Non-Executive Directors still hold shares issued in previous years.
Options over unissued MGL fully paid shares are no longer granted under the Macquarie Group Employee Share Option Plan and no options are outstanding.
Other plansMGL operates other local share-based compensation plans, none of which, individually or in aggregate are material.
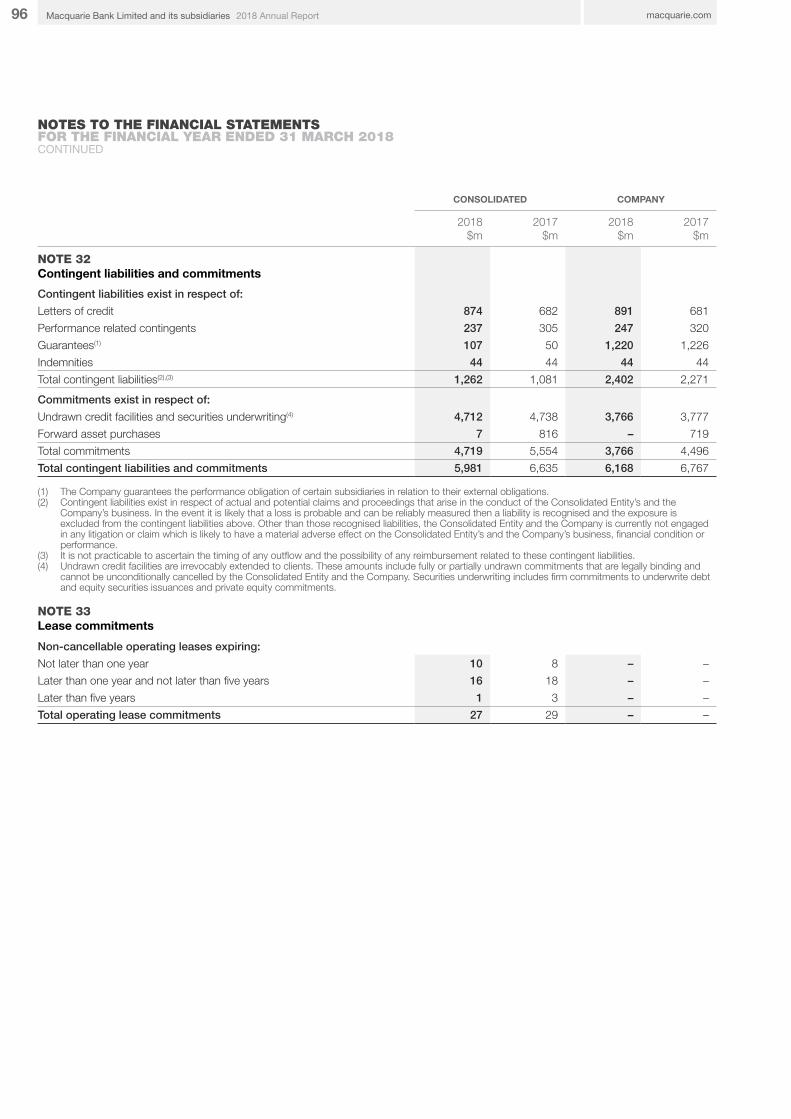
96 macquarie.com2018 Annual ReportMacquarie Bank Limited and its subsidiaries
NOTES TO THE FINANCIAL STATEMENTS FOR THE FINANCIAL YEAR ENDED 31 MARCH 2018CONTINUED
CONSOLIDATED COMPANY
2018$m
2017 $m
2018$m
2017 $m
NOTE 32Contingent liabilities and commitments
Contingent liabilities exist in respect of:
Letters of credit 874 682 891 681
Performance related contingents 237 305 247 320
Guarantees(1) 107 50 1,220 1,226
Indemnities 44 44 44 44
Total contingent liabilities(2),(3) 1,262 1,081 2,402 2,271
Commitments exist in respect of:
Undrawn credit facilities and securities underwriting(4) 4,712 4,738 3,766 3,777
Forward asset purchases 7 816 – 719
Total commitments 4,719 5,554 3,766 4,496
Total contingent liabilities and commitments 5,981 6,635 6,168 6,767
(1) The Company guarantees the performance obligation of certain subsidiaries in relation to their external obligations.(2) Contingent liabilities exist in respect of actual and potential claims and proceedings that arise in the conduct of the Consolidated Entity’s and the
Company’s business. In the event it is likely that a loss is probable and can be reliably measured then a liability is recognised and the exposure is excluded from the contingent liabilities above. Other than those recognised liabilities, the Consolidated Entity and the Company is currently not engaged in any litigation or claim which is likely to have a material adverse effect on the Consolidated Entity’s and the Company’s business, financial condition or performance.
(3) It is not practicable to ascertain the timing of any outflow and the possibility of any reimbursement related to these contingent liabilities. (4) Undrawn credit facilities are irrevocably extended to clients. These amounts include fully or partially undrawn commitments that are legally binding and
cannot be unconditionally cancelled by the Consolidated Entity and the Company. Securities underwriting includes firm commitments to underwrite debt and equity securities issuances and private equity commitments.
NOTE 33Lease commitments
Non-cancellable operating leases expiring:
Not later than one year 10 8 – –
Later than one year and not later than five years 16 18 – –
Later than five years 1 3 – –
Total operating lease commitments 27 29 – –
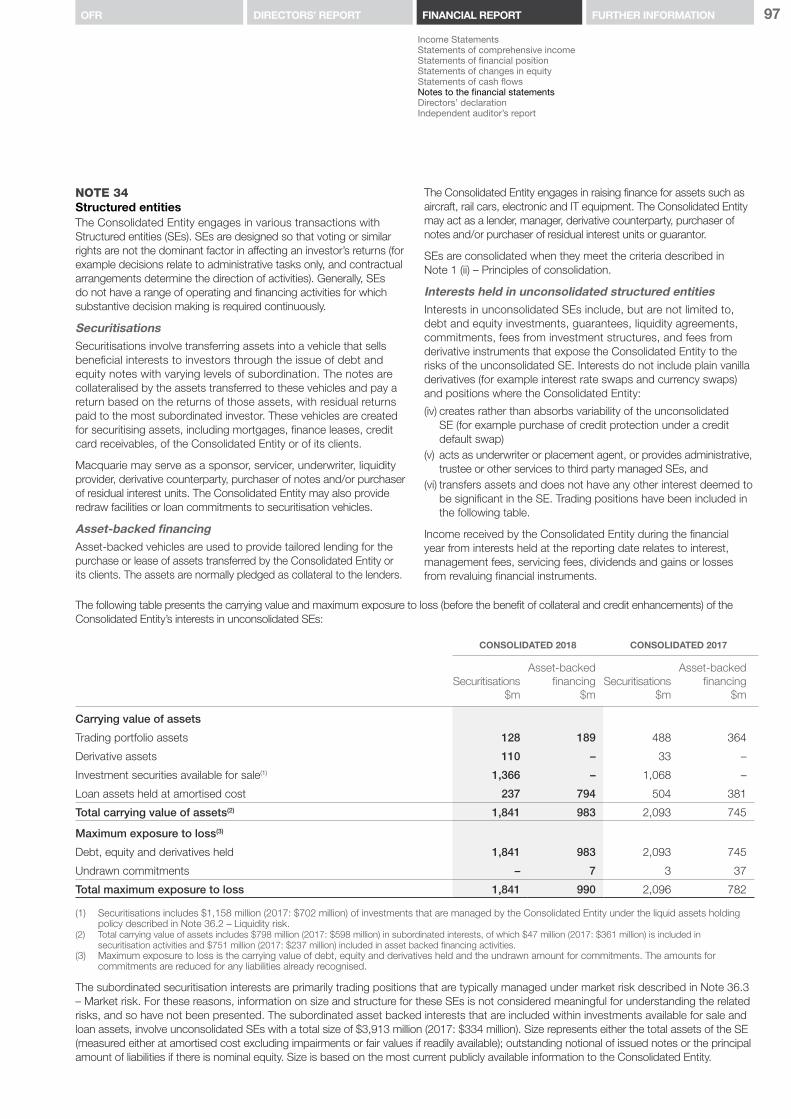
97
Income StatementsStatements of comprehensive incomeStatements of financial positionStatements of changes in equityStatements of cash flowsNotes to the financial statementsDirectors’ declaration Independent auditor’s report
FURTHER INFORMATIONOFR DIRECTORS’ REPORT FINANCIAL REPORT
NOTE 34Structured entitiesThe Consolidated Entity engages in various transactions with Structured entities (SEs). SEs are designed so that voting or similar rights are not the dominant factor in affecting an investor’s returns (for example decisions relate to administrative tasks only, and contractual arrangements determine the direction of activities). Generally, SEs do not have a range of operating and financing activities for which substantive decision making is required continuously.
SecuritisationsSecuritisations involve transferring assets into a vehicle that sells beneficial interests to investors through the issue of debt and equity notes with varying levels of subordination. The notes are collateralised by the assets transferred to these vehicles and pay a return based on the returns of those assets, with residual returns paid to the most subordinated investor. These vehicles are created for securitising assets, including mortgages, finance leases, credit card receivables, of the Consolidated Entity or of its clients.
Macquarie may serve as a sponsor, servicer, underwriter, liquidity provider, derivative counterparty, purchaser of notes and/or purchaser of residual interest units. The Consolidated Entity may also provide redraw facilities or loan commitments to securitisation vehicles.
Asset-backed financingAsset-backed vehicles are used to provide tailored lending for the purchase or lease of assets transferred by the Consolidated Entity or its clients. The assets are normally pledged as collateral to the lenders.
The Consolidated Entity engages in raising finance for assets such as aircraft, rail cars, electronic and IT equipment. The Consolidated Entity may act as a lender, manager, derivative counterparty, purchaser of notes and/or purchaser of residual interest units or guarantor.
SEs are consolidated when they meet the criteria described in Note 1 (ii) – Principles of consolidation.
Interests held in unconsolidated structured entitiesInterests in unconsolidated SEs include, but are not limited to, debt and equity investments, guarantees, liquidity agreements, commitments, fees from investment structures, and fees from derivative instruments that expose the Consolidated Entity to the risks of the unconsolidated SE. Interests do not include plain vanilla derivatives (for example interest rate swaps and currency swaps) and positions where the Consolidated Entity:
(iv) creates rather than absorbs variability of the unconsolidated SE (for example purchase of credit protection under a credit default swap)
(v) acts as underwriter or placement agent, or provides administrative, trustee or other services to third party managed SEs, and
(vi) transfers assets and does not have any other interest deemed to be significant in the SE. Trading positions have been included in the following table.
Income received by the Consolidated Entity during the financial year from interests held at the reporting date relates to interest, management fees, servicing fees, dividends and gains or losses from revaluing financial instruments.
The following table presents the carrying value and maximum exposure to loss (before the benefit of collateral and credit enhancements) of the Consolidated Entity’s interests in unconsolidated SEs:
CONSOLIDATED 2018 CONSOLIDATED 2017
Securitisations$m
Asset-backedfinancing
$mSecuritisations
$m
Asset-backedfinancing
$m
Carrying value of assets
Trading portfolio assets 128 189 488 364
Derivative assets 110 – 33 –
Investment securities available for sale(1) 1,366 – 1,068 –
Loan assets held at amortised cost 237 794 504 381
Total carrying value of assets(2) 1,841 983 2,093 745
Maximum exposure to loss(3)
Debt, equity and derivatives held 1,841 983 2,093 745
Undrawn commitments – 7 3 37
Total maximum exposure to loss 1,841 990 2,096 782
(1) Securitisations includes $1,158 million (2017: $702 million) of investments that are managed by the Consolidated Entity under the liquid assets holding policy described in Note 36.2 – Liquidity risk.
(2) Total carrying value of assets includes $798 million (2017: $598 million) in subordinated interests, of which $47 million (2017: $361 million) is included in securitisation activities and $751 million (2017: $237 million) included in asset backed financing activities.
(3) Maximum exposure to loss is the carrying value of debt, equity and derivatives held and the undrawn amount for commitments. The amounts for commitments are reduced for any liabilities already recognised.
The subordinated securitisation interests are primarily trading positions that are typically managed under market risk described in Note 36.3 – Market risk. For these reasons, information on size and structure for these SEs is not considered meaningful for understanding the related risks, and so have not been presented. The subordinated asset backed interests that are included within investments available for sale and loan assets, involve unconsolidated SEs with a total size of $3,913 million (2017: $334 million). Size represents either the total assets of the SE (measured either at amortised cost excluding impairments or fair values if readily available); outstanding notional of issued notes or the principal amount of liabilities if there is nominal equity. Size is based on the most current publicly available information to the Consolidated Entity.
98 macquarie.com2018 Annual ReportMacquarie Bank Limited and its subsidiaries
NOTES TO THE FINANCIAL STATEMENTS FOR THE FINANCIAL YEAR ENDED 31 MARCH 2018CONTINUED
NOTE 35Derivative financial instrumentsObjectives of holding and issuing derivative financial instrumentsThe Consolidated Entity is an active price-maker in derivatives on interest rates, foreign exchange, commodities and equities. Its objective is to earn profits from the price-making spread and from managing the residual exposures on hedged positions. Proprietary position taking is a small part of the Consolidated Entity’s trading activities. Risks on derivatives are managed together with all other trading positions in the same market.
All trading positions, including derivatives, are marked to fair value daily.
The Consolidated Entity also uses derivatives to hedge banking operations and for asset/liability management. Certain derivative transactions may qualify as cash flow, fair value or net investment in foreign operations hedges, if they meet the appropriate strict hedge criteria outlined in Note 1(xii) – Hedge accounting:
Cash flow hedges: The Consolidated Entity is exposed to volatility in future interest cash flows arising from the consolidated securitisation vehicles and floating rate issued debt used to fund fixed rate asset positions. The aggregate principal balances and interest cash flows across these portfolios form the basis for identifying the non–trading interest rate risk of the consolidated entity, which is hedged with interest rate swaps. The Consolidated Entity is also exposed to foreign exchange risk from foreign currency denominated issued debt and foreign currency denominated assets which are hedged with cross-currency swaps.
At 31 March 2018, the fair value of outstanding derivatives held by the Company and designated as cash flow hedges was $3 million positive value (2017: $20 million negative value).
During the financial year the Consolidated Entity recognised $3 million of gains (2017: $3 million gains) in the income statement due to hedge ineffectiveness on cash flow hedges. At 31 March 2018, the fair value of outstanding derivatives held by the Consolidated Entity and designated as cash flow hedges was $60 million negative value (2017: $161 million negative value).
Fair value hedges: The Consolidated Entity’s fair value hedges consist of:
– interest rate swaps used to hedge against changes in the fair value of fixed rate assets and liabilities as a result of movements in benchmark interest rates, and
– foreign exchange forward contracts used to hedge against changes in the fair value of foreign denominated equity instruments as a result of movements in market foreign exchange rates.
As at 31 March 2018, the fair value of outstanding derivatives held by the Consolidated Entity and designated as fair value hedges was $178 million negative value (2017: $12 million negative value).
During the financial year fair value loss on the hedging instruments of $166 million have been recognised (2017: $329 million loss), offset by $152 million gains (2017: $313 million gains) on the hedged items.
Net investment in foreign operations hedges: The Consolidated Entity has designated derivatives and borrowings as hedges of its net investment for foreign exchange risk arising from its foreign operations.
At 31 March 2018, the fair value of outstanding derivatives held by the Consolidated Entity and designated as net investment in foreign operations hedges was $63 million negative value (2017: $171 million positive value). During the financial year the Consolidated Entity recognised $nil (2017: $nil) in the income statement due to hedge ineffectiveness on net investment hedges.
A proportion of the Consolidated Entity’s borrowings amounting to $5,525 million (2017: $4,927 million) is designated as a hedge of its net investment in foreign operations. The foreign exchange loss of $93 million (2017: $11 million loss) on translation of the foreign currency borrowing to Australian dollars at the end of the reporting period is recognised in other comprehensive income.
The types of derivatives which the Consolidated Entity trades and uses for hedging purposes are – Futures, Forwards and forward rate agreements, Swaps, Options.
99
Income StatementsStatements of comprehensive incomeStatements of financial positionStatements of changes in equityStatements of cash flowsNotes to the financial statementsDirectors’ declaration Independent auditor’s report
FURTHER INFORMATIONOFR DIRECTORS’ REPORT FINANCIAL REPORT
NOTE 36Financial risk managementRisk Management Group (RMG)Risk is an integral part of the Consolidated Entity’s businesses. The main risks faced by the Consolidated Entity are credit, liquidity, market, equity, conduct, regulatory and compliance, reputation, operational, legal, tax, model, cyber and information security, environmental and social, and data risk. Further details on the risks faced by the Consolidated Entity can be found in the Risk Management Report of the MGL Annual Report.
Primary responsibility for risk management lies at the business level. Part of the role of all business managers throughout Macquarie is to ensure they manage risks appropriately.
RMG is independent of all other areas of the Consolidated Entity. RMG approval is required for all material risk acceptance decisions. RMG identifies, quantifies and assesses all material risks and sets prudential limits. Where appropriate, these limits are approved by the Executive Committee and the Board. The Head of RMG, as Macquarie’s CRO, is a member of the Executive Committee of MGL and MBL and reports directly to the MGL CEO with a secondary reporting line to the Board Risk Committee.
NOTE 36.1Credit risk Credit risk is the risk of a counterparty failing to complete its contractual obligations when they fall due. The consequent loss is either the amount of the loan not repaid or the loss incurred in replicating a trading contract with a new counterparty.
Analysis and limit approvalResponsibility for approval of credit exposures is delegated to specific individuals by the Board or CRO. Credit risk analysis is focused on ensuring that risks have been fully identified and that the downside risk is properly understood and acceptable. After this analysis is undertaken, limits are set for an acceptable level of potential exposure. All wholesale limits and ratings are reviewed at least once a year or more frequently if required. Retail credit exposures are monitored on a portfolio basis.
All credit exposures are monitored regularly against limits. Credit exposures for loans are evaluated as either the full current face value or, for distressed debt, the acquisition cost when acquired in the secondary market. Derivative exposures are measured using high confidence potential future underlying asset prices. To mitigate credit risk, where appropriate, the Consolidated Entity makes use of margining and other forms of collateral or credit enhancement techniques (including guarantees, letters of credit, the purchase of credit default swaps and mortgage insurance).
Ratings and reviewsAll wholesale exposures are allocated to a Macquarie rating on a scale that broadly corresponds to Standard & Poor’s and Moody’s Investor Services credit ratings. Each Macquarie rating maps to a Probability of Default estimate. All wholesale counterparties and certain individual facilities are assigned a Loss Given Default estimate which reflects the estimated economic loss in the event of default occurring.
Macquarie wholesale ratings broadly correspond to Standard & Poor’s credit ratings as follows:
Credit Grading Internal Rating External Equivalent
Investment Grade MQ1 to MQ8 AAA to BBB-
Below Investment Grade
MQ9 to MQ16 BB+ to C
Default(1) MQ99 Default
(1) The Default category primarily correlates to the ‘past due more than 90 days not impaired’ and ‘individually impaired’ balances disclosed in the following pages.
Retail pools are mapped to the corresponding rating grade based on their probability of default. All loan assets are subject to recurring review and assessment for possible impairment. Where there is a deteriorating credit risk profile, the exposures are monitored on a monthly basis through the CreditWatch reports. The business remains responsible for the management of the counterparty and of the risk position, but RMG oversight is increased to ensure that positions are managed for optimal outcomes. When counterparties default, RMG and the business work together to resolve the issues and ensure specific provisioning is adequate.
Portfolio and country riskA review of the credit portfolio that involves monitoring credit concentrations by counterparty, country, risk type, industry and credit quality is carried out quarterly and reported to the Board semi-annually. Policies are in place to regulate large exposures to single counterparties or groups of counterparties.
The Consolidated Entity has a country risk management framework which covers the assessment of country risk and the approval of country risk limits. Where appropriate the country risk is mitigated by political risk insurance.
100 macquarie.com2018 Annual ReportMacquarie Bank Limited and its subsidiaries
NOTES TO THE FINANCIAL STATEMENTS FOR THE FINANCIAL YEAR ENDED 31 MARCH 2018CONTINUED
NOTE 36.1Credit risk continued The balances disclosed in the credit risk tables below exclude financial assets that are subject to risks other than credit risk, such as equity investments, commodities, interests in associates and joint ventures or bank notes and coins.
Maximum exposure to credit risk The table below details the concentration of maximum exposure to credit risk of the Consolidated Entity’s financial assets, credit commitments and contingent liabilities by significant geographical locations and counterparty type. The maximum credit exposure is to each counterparty and does not take into consideration collateral or other credit enhancements (refer to section on collateral and credit enhancements). The geographical location is determined by the domicile and industry type of the counterparty.
Receivablesfrom
financialinstitutions(1)
$m
Trading portfolio
assets$m
Derivativeassets
$m
Debtinvestment
securitiesavailable
forsale $m
Otherfinancial
assets(2)
$m
Loanassetsheld at
amortisedcost$m
Otherfinancial
assets atfair valuethrough
profit or loss
$m
Due fromrelated
bodycorporate
$m
Creditcommit-
ments andcontingent
liabilities$m
Total$m
CONSOLIDATED 2018Australia
Governments – 4,415 356 365 3 66 – – – 5,205
Financial institutions 6,941 160 979 3,941 908 2,205 2 – 139 15,275
Other – 1 757 42 332 57,094 154 256 2,481 61,177
Total Australia 6,941 4,576 2,092 4,348 1,243 59,365 156 256 2,620 81,597
Asia Pacific
Governments – 1,191 7 165 286 3 70 – – 1,722
Financial institutions 5,690 377 295 450 567 548 – – 4 7,931
Other – 292 379 – 865 1,157 2 269 76 3,040
Total Asia Pacific 5,690 1,860 681 615 1,718 1,708 72 269 80 12,693
Europe, Middle East and Africa
Governments – 130 2 – 134 19 – – 13 298
Financial institutions 14,250 32 3,163 78 560 2,178 – – 186 20,447
Other – 68 1,187 – 1,334 6,449 – 697 951 10,686
Total Europe, Middle East and Africa 14,250 230 4,352 78 2,028 8,646 – 697 1,150 31,431
Americas
Governments – 863 155 – 29 11 – – 6 1,064
Financial institutions 9,748 32 2,433 201 171 3,105 3 – 845 16,538
Other – 17 2,982 2 1,650 7,308 137 161 1,280 13,537
Total Americas 9,748 912 5,570 203 1,850 10,424 140 161 2,131 31,139
Total gross credit risk 36,629 7,578 12,695 5,244 6,839 80,143 368 1,383 5,981 156,860
(1) Includes reverse repurchase agreements where the classification is based on the underlying collateral of the agreement.(2) This balance excludes other non-financial assets of $1,800 million and Life Investment Linked contracts and other unitholder assets $648 million which
are included in Note 9 – Other assets.
101
Income StatementsStatements of comprehensive incomeStatements of financial positionStatements of changes in equityStatements of cash flowsNotes to the financial statementsDirectors’ declaration Independent auditor’s report
FURTHER INFORMATIONOFR DIRECTORS’ REPORT FINANCIAL REPORT
NOTE 36.1Credit risk continued Maximum exposure to credit risk continued
Receivablesfrom
financialinstitutions(1)
$m
Trading portfolio
assets$m
Derivativeassets
$m
Debtinvestment
securitiesavailable
forsale $m
Otherfinancial assets(2)
$m
Loanassetsheld at
amortisedcost$m
Otherfinancial
assets atfair valuethrough
profit or loss
$m
Due fromrelated
bodycorporate
$m
Creditcommit-
ments andcontingent
liabilities$m
Total$m
CONSOLIDATED 2017Australia
Governments – 4,868 460 853 9 56 – – – 6,246
Financial institutions 6,320 126 1,755 2,581 601 1,805 1 – 213 13,402
Other – 3 1,195 57 210 52,959 121 283 2,214 57,042
Total Australia 6,320 4,997 3,410 3,491 820 54,820 122 283 2,427 76,690
Asia Pacific
Governments – 1,065 3 54 472 4 75 – – 1,673
Financial institutions 1,481 383 173 394 135 565 – – 8 3,139
Other – 315 326 – 898 754 7 598 10 2,908
Total Asia Pacific 1,481 1,763 502 448 1,505 1,323 82 598 18 7,720
Europe, Middle East and Africa
Governments – 508 3 42 52 2 – – 12 619
Financial institutions 5,181 160 3,191 310 317 2,666 – – 94 11,919
Other – 78 1,576 – 1,639 5,842 10 686 2,180 12,011
Total Europe, Middle East and Africa 5,181 746 4,770 352 2,008 8,510 10 686 2,286 24,549
Americas
Governments – 671 143 – 34 11 – – 2 861
Financial institutions 12,583 60 2,122 207 279 2,600 – – 280 18,131
Other – 785 1,120 87 1,285 8,286 141 166 1,622 13,492
Total Americas 12,583 1,516 3,385 294 1,598 10,897 141 166 1,904 32,484
Total gross credit risk 25,565 9,022 12,067 4,585 5,931 75,550 355 1,733 6,635 141,443
(1) Includes reverse repurchase agreements where the classification is based on the underlying collateral of the agreement.(2) This balance excludes other non-financial assets of $1,993 million and Life Investment Linked contracts and other unitholder assets $722 million which
are included in Note 9 – Other assets.
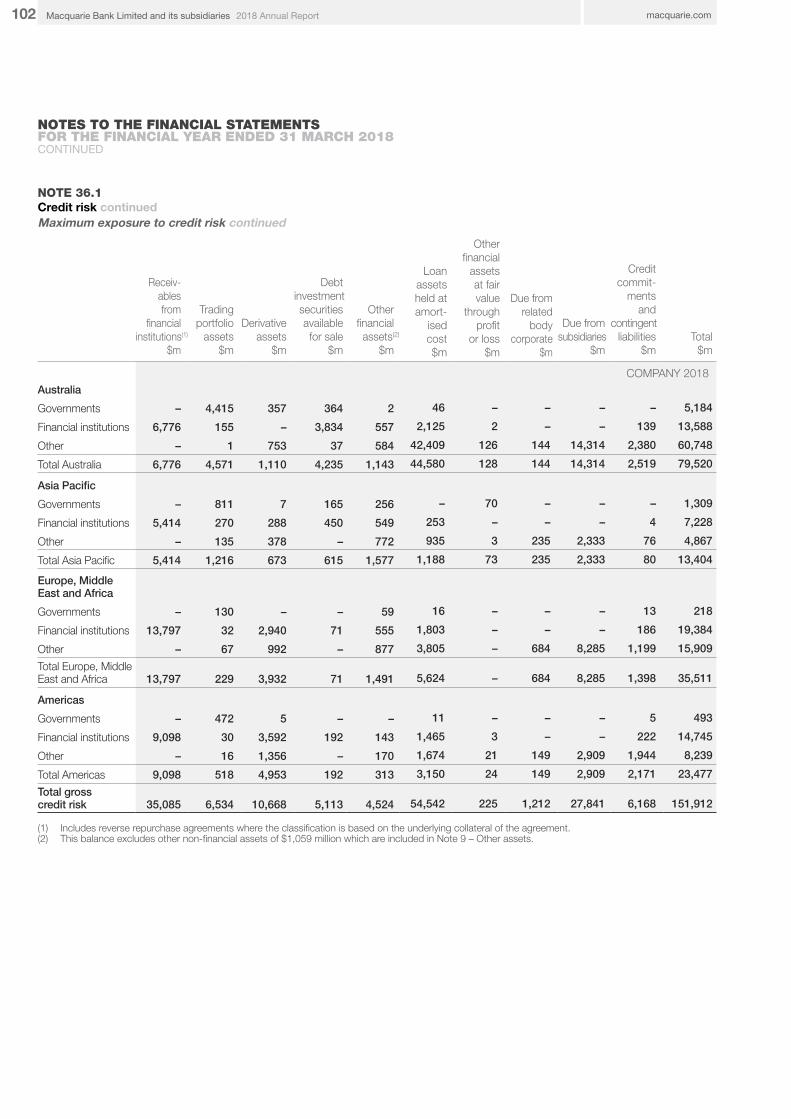
102 macquarie.com2018 Annual ReportMacquarie Bank Limited and its subsidiaries
NOTES TO THE FINANCIAL STATEMENTS FOR THE FINANCIAL YEAR ENDED 31 MARCH 2018CONTINUED
NOTE 36.1Credit risk continuedMaximum exposure to credit risk continued
Receiv-ablesfrom
financialinstitutions(1)
$m
Trading portfolio
assets$m
Derivativeassets
$m
Debtinvestmentsecuritiesavailablefor sale
$m
Other financial assets(2)
$m
Loanassetsheld atamort-
isedcost$m
Otherfinancial
assetsat fairvalue
throughprofit
or loss$m
Due fromrelated
bodycorporate
$m
Due fromsubsidiaries
$m
Creditcommit-
mentsand
contingentliabilities
$mTotal
$m
COMPANY 2018Australia
Governments – 4,415 357 364 2 46 – – – – 5,184
Financial institutions 6,776 155 – 3,834 557 2,125 2 – – 139 13,588
Other – 1 753 37 584 42,409 126 144 14,314 2,380 60,748
Total Australia 6,776 4,571 1,110 4,235 1,143 44,580 128 144 14,314 2,519 79,520
Asia Pacific
Governments – 811 7 165 256 – 70 – – – 1,309
Financial institutions 5,414 270 288 450 549 253 – – – 4 7,228
Other – 135 378 – 772 935 3 235 2,333 76 4,867
Total Asia Pacific 5,414 1,216 673 615 1,577 1,188 73 235 2,333 80 13,404
Europe, Middle East and Africa
Governments – 130 – – 59 16 – – – 13 218
Financial institutions 13,797 32 2,940 71 555 1,803 – – – 186 19,384
Other – 67 992 – 877 3,805 – 684 8,285 1,199 15,909
Total Europe, Middle East and Africa 13,797 229 3,932 71 1,491 5,624 – 684 8,285 1,398 35,511
Americas
Governments – 472 5 – – 11 – – – 5 493
Financial institutions 9,098 30 3,592 192 143 1,465 3 – – 222 14,745
Other – 16 1,356 – 170 1,674 21 149 2,909 1,944 8,239
Total Americas 9,098 518 4,953 192 313 3,150 24 149 2,909 2,171 23,477
Total gross credit risk 35,085 6,534 10,668 5,113 4,524 54,542 225 1,212 27,841 6,168 151,912
(1) Includes reverse repurchase agreements where the classification is based on the underlying collateral of the agreement.(2) This balance excludes other non-financial assets of $1,059 million which are included in Note 9 – Other assets.
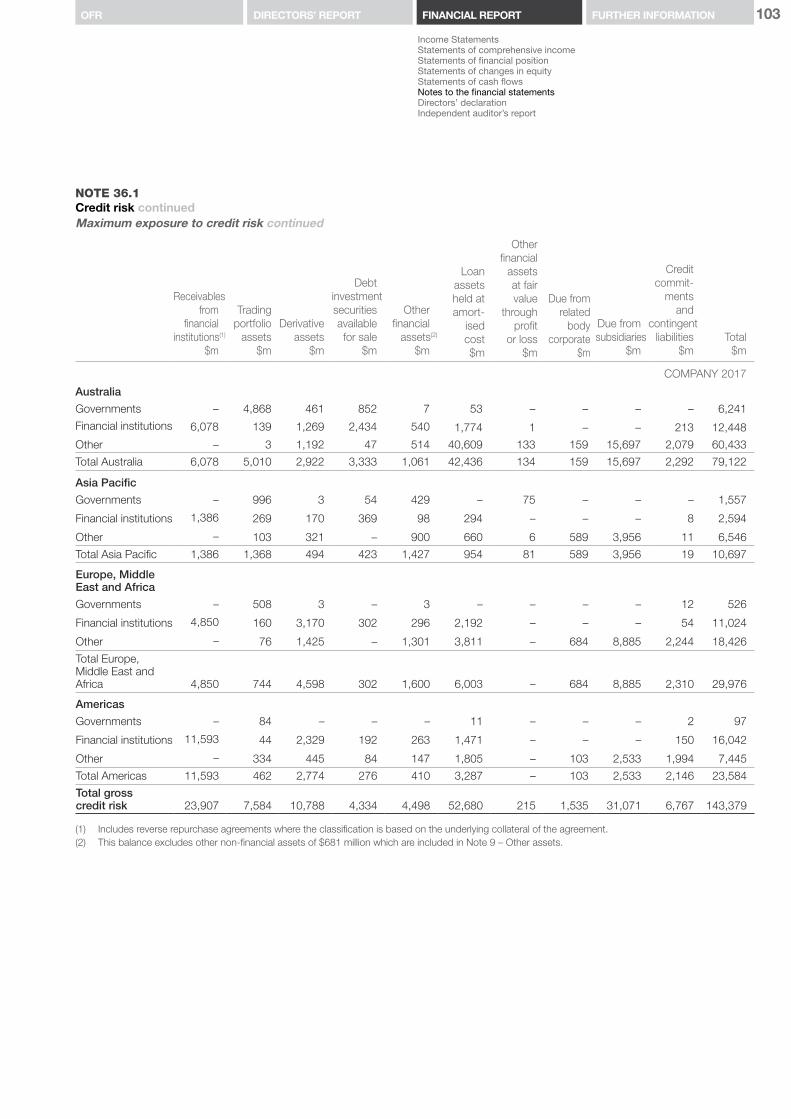
103
Income StatementsStatements of comprehensive incomeStatements of financial positionStatements of changes in equityStatements of cash flowsNotes to the financial statementsDirectors’ declaration Independent auditor’s report
FURTHER INFORMATIONOFR DIRECTORS’ REPORT FINANCIAL REPORT
NOTE 36.1Credit risk continuedMaximum exposure to credit risk continued
Receivablesfrom
financialinstitutions(1)
$m
Trading portfolio
assets$m
Derivativeassets
$m
Debtinvestmentsecuritiesavailablefor sale
$m
Other financial
assets(2)
$m
Loanassetsheld atamort-
isedcost$m
Otherfinancial
assetsat fairvalue
throughprofit
or loss$m
Due fromrelated
bodycorporate
$m
Due fromsubsidiaries
$m
Creditcommit-
mentsand
contingentliabilities
$mTotal
$m
COMPANY 2017
Australia
Governments – 4,868 461 852 7 53 – – – – 6,241
Financial institutions 6,078 139 1,269 2,434 540 1,774 1 – – 213 12,448
Other – 3 1,192 47 514 40,609 133 159 15,697 2,079 60,433
Total Australia 6,078 5,010 2,922 3,333 1,061 42,436 134 159 15,697 2,292 79,122
Asia Pacific
Governments – 996 3 54 429 – 75 – – – 1,557
Financial institutions 1,386 269 170 369 98 294 – – – 8 2,594
Other – 103 321 – 900 660 6 589 3,956 11 6,546
Total Asia Pacific 1,386 1,368 494 423 1,427 954 81 589 3,956 19 10,697
Europe, Middle East and Africa
Governments – 508 3 – 3 – – – – 12 526
Financial institutions 4,850 160 3,170 302 296 2,192 – – – 54 11,024
Other – 76 1,425 – 1,301 3,811 – 684 8,885 2,244 18,426
Total Europe, Middle East and Africa 4,850 744 4,598 302 1,600 6,003 – 684 8,885 2,310 29,976
Americas
Governments – 84 – – – 11 – – – 2 97
Financial institutions 11,593 44 2,329 192 263 1,471 – – – 150 16,042
Other – 334 445 84 147 1,805 – 103 2,533 1,994 7,445
Total Americas 11,593 462 2,774 276 410 3,287 – 103 2,533 2,146 23,584
Total gross credit risk 23,907 7,584 10,788 4,334 4,498 52,680 215 1,535 31,071 6,767 143,379
(1) Includes reverse repurchase agreements where the classification is based on the underlying collateral of the agreement.(2) This balance excludes other non-financial assets of $681 million which are included in Note 9 – Other assets.

104 macquarie.com2018 Annual ReportMacquarie Bank Limited and its subsidiaries
NOTES TO THE FINANCIAL STATEMENTS FOR THE FINANCIAL YEAR ENDED 31 MARCH 2018CONTINUED
NOTE 36.1Credit risk continuedCredit quality of financial assetsThe table below details the credit quality of the Consolidated Entity’s financial assets for the maximum exposure to credit risk. The credit quality is based on the individual counterparty’s credit rating and industry type using the Consolidated Entity’s credit rating system and excludes the benefit of collateral and credit enhancements (refer to section on collateral and credit enhancements).
Investment Grade
$m
BelowInvestment
Grade$m
Past due but not
individuallyimpaired(4)
$m
Individuallyimpaired
$mTotal
$m
CONSOLIDATED 2018Receivables from financial institutions(1) 32,359 4,270 – – 36,629
Trading portfolio assets 7,578
Governments 6,515 84 – – 6,599
Financial institutions 573 28 – – 601
Other 158 187 33 – 378
Derivative assets 12,695
Governments 520 – – – 520
Financial institutions 6,221 649 – – 6,870
Other 3,072 2,233 – – 5,305
Debt investment securities available for sale 5,244
Governments 530 – – – 530
Financial institutions 4,638 32 – – 4,670
Other 7 37 – – 44
Other financial assets(2) 6,839
Governments 401 – 51 – 452
Financial institutions 1,561 627 18 – 2,206
Other 2,463 1,639 70 9 4,181
Loan assets held at amortised cost(3) 80,143
Governments 68 31 – – 99
Financial institutions 6,638 1,397 1 – 8,036
Other 32,669 36,772 2,236 331 72,008
Other financial assets at fair value through profit or loss 368
Governments 70 – – – 70
Financial institutions – 5 – – 5
Other 74 194 25 – 293
Due from related body corporate entities 1,383
Other 1,383 – – – 1,383
Total 99,920 48,185 2,434 340 150,879
(1) Includes reverse repurchase agreements where the credit quality classification is based on the underlying collateral of the agreement.(2) Excludes other non-financial assets of $1,800 million and Life Investment Linked contracts and other unitholder assets $648 million which are included
in Note 9 – Other assets(3) Mortgages are classified as investment grade when the Consolidated Entity has taken insurance from investment grade LMI counterparties and classified
as below investment grade based on probability of default rating either when not insured or the Consolidated Entity bears first loss on the portfolio.(4) Included in the past due category are balances which were overdue by one day or more.
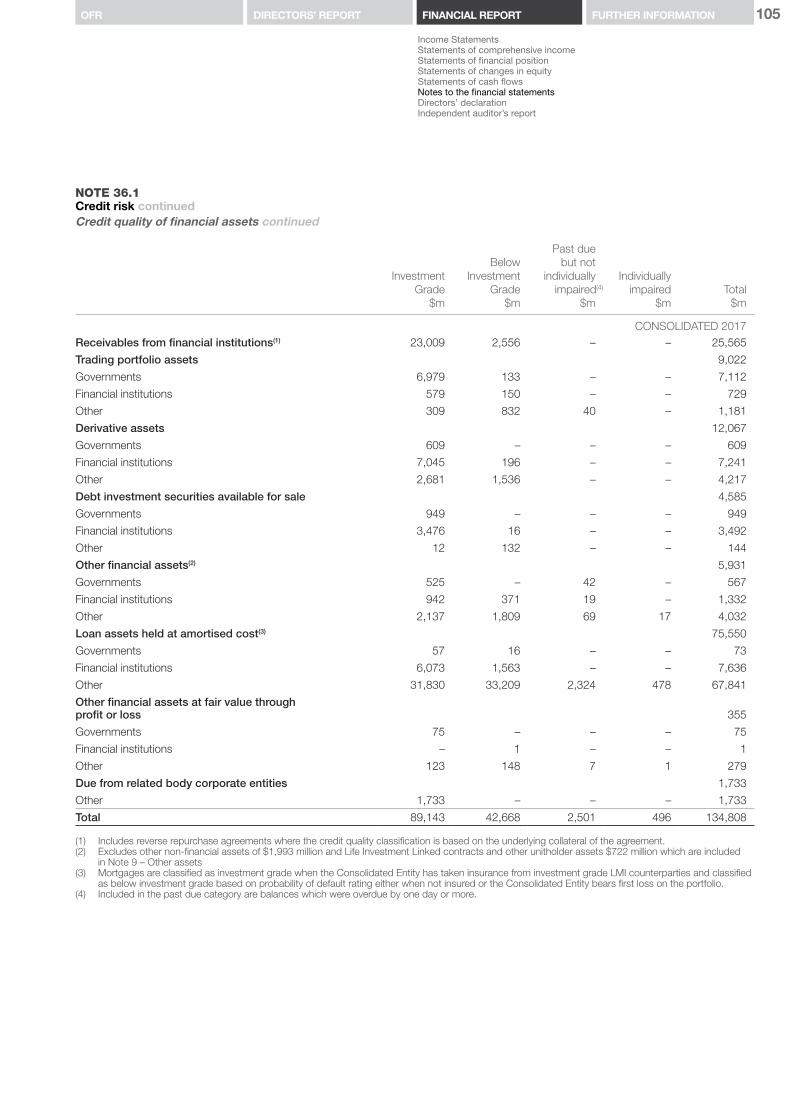
105
Income StatementsStatements of comprehensive incomeStatements of financial positionStatements of changes in equityStatements of cash flowsNotes to the financial statementsDirectors’ declaration Independent auditor’s report
FURTHER INFORMATIONOFR DIRECTORS’ REPORT FINANCIAL REPORT
NOTE 36.1Credit risk continuedCredit quality of financial assets continued
Investment Grade
$m
BelowInvestment
Grade$m
Past duebut not
individuallyimpaired(4)
$m
Individuallyimpaired
$mTotal
$m
CONSOLIDATED 2017Receivables from financial institutions(1) 23,009 2,556 – – 25,565
Trading portfolio assets 9,022
Governments 6,979 133 – – 7,112
Financial institutions 579 150 – – 729
Other 309 832 40 – 1,181
Derivative assets 12,067
Governments 609 – – – 609
Financial institutions 7,045 196 – – 7,241
Other 2,681 1,536 – – 4,217
Debt investment securities available for sale 4,585
Governments 949 – – – 949
Financial institutions 3,476 16 – – 3,492
Other 12 132 – – 144
Other financial assets(2) 5,931
Governments 525 – 42 – 567
Financial institutions 942 371 19 – 1,332
Other 2,137 1,809 69 17 4,032
Loan assets held at amortised cost(3) 75,550
Governments 57 16 – – 73
Financial institutions 6,073 1,563 – – 7,636
Other 31,830 33,209 2,324 478 67,841
Other financial assets at fair value through profit or loss 355
Governments 75 – – – 75
Financial institutions – 1 – – 1
Other 123 148 7 1 279
Due from related body corporate entities 1,733
Other 1,733 – – – 1,733
Total 89,143 42,668 2,501 496 134,808
(1) Includes reverse repurchase agreements where the credit quality classification is based on the underlying collateral of the agreement.(2) Excludes other non-financial assets of $1,993 million and Life Investment Linked contracts and other unitholder assets $722 million which are included
in Note 9 – Other assets(3) Mortgages are classified as investment grade when the Consolidated Entity has taken insurance from investment grade LMI counterparties and classified
as below investment grade based on probability of default rating either when not insured or the Consolidated Entity bears first loss on the portfolio.(4) Included in the past due category are balances which were overdue by one day or more.
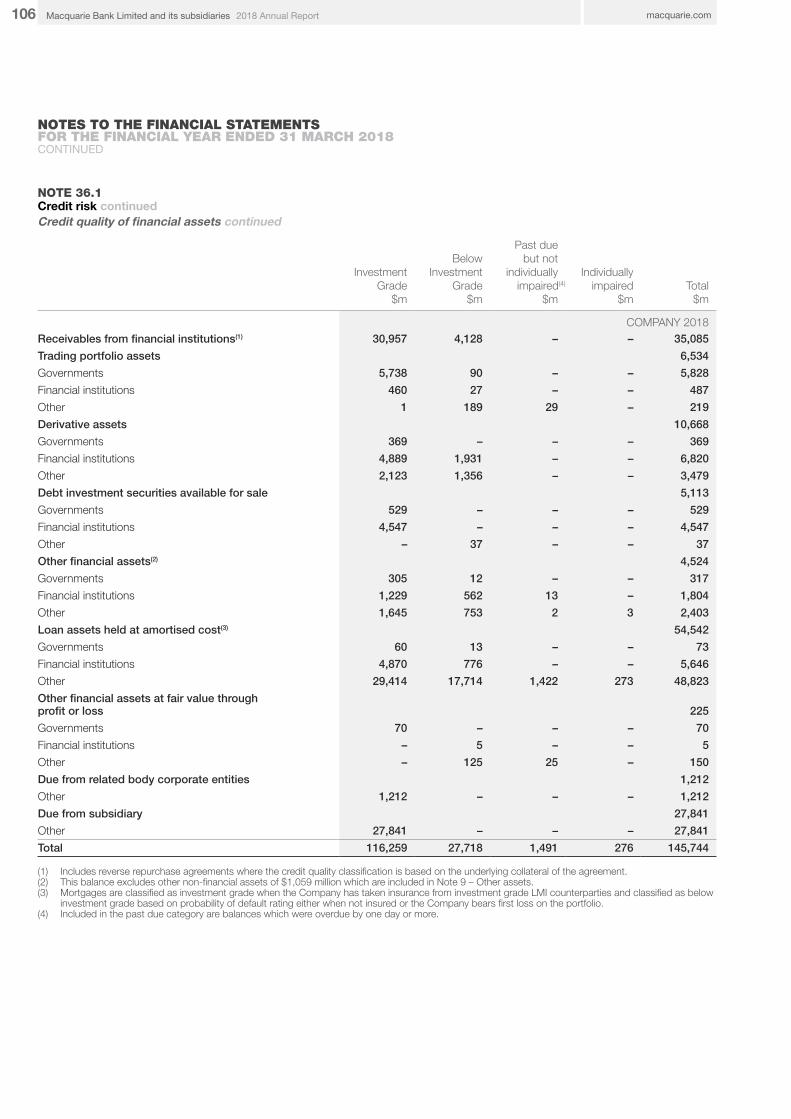
106 macquarie.com2018 Annual ReportMacquarie Bank Limited and its subsidiaries
NOTES TO THE FINANCIAL STATEMENTS FOR THE FINANCIAL YEAR ENDED 31 MARCH 2018CONTINUED
NOTE 36.1Credit risk continuedCredit quality of financial assets continued
Investment Grade
$m
BelowInvestment
Grade$m
Past duebut not
individuallyimpaired(4)
$m
Individuallyimpaired
$mTotal
$m
COMPANY 2018Receivables from financial institutions(1) 30,957 4,128 – – 35,085
Trading portfolio assets 6,534
Governments 5,738 90 – – 5,828
Financial institutions 460 27 – – 487
Other 1 189 29 – 219
Derivative assets 10,668
Governments 369 – – – 369
Financial institutions 4,889 1,931 – – 6,820
Other 2,123 1,356 – – 3,479
Debt investment securities available for sale 5,113
Governments 529 – – – 529
Financial institutions 4,547 – – – 4,547
Other – 37 – – 37
Other financial assets(2) 4,524
Governments 305 12 – – 317
Financial institutions 1,229 562 13 – 1,804
Other 1,645 753 2 3 2,403
Loan assets held at amortised cost(3) 54,542
Governments 60 13 – – 73
Financial institutions 4,870 776 – – 5,646
Other 29,414 17,714 1,422 273 48,823
Other financial assets at fair value through profit or loss 225
Governments 70 – – – 70
Financial institutions – 5 – – 5
Other – 125 25 – 150
Due from related body corporate entities 1,212
Other 1,212 – – – 1,212
Due from subsidiary 27,841
Other 27,841 – – – 27,841
Total 116,259 27,718 1,491 276 145,744
(1) Includes reverse repurchase agreements where the credit quality classification is based on the underlying collateral of the agreement.(2) This balance excludes other non-financial assets of $1,059 million which are included in Note 9 – Other assets.(3) Mortgages are classified as investment grade when the Company has taken insurance from investment grade LMI counterparties and classified as below
investment grade based on probability of default rating either when not insured or the Company bears first loss on the portfolio.(4) Included in the past due category are balances which were overdue by one day or more.

107
Income StatementsStatements of comprehensive incomeStatements of financial positionStatements of changes in equityStatements of cash flowsNotes to the financial statementsDirectors’ declaration Independent auditor’s report
FURTHER INFORMATIONOFR DIRECTORS’ REPORT FINANCIAL REPORT
NOTE 36.1Credit risk continuedCredit quality of financial assets continued
Investment Grade
$m
BelowInvestment
Grade$m
Past duebut not
individuallyimpaired(4)
$m
Individuallyimpaired
$mTotal
$m
COMPANY 2017Receivables from financial institutions(1) 21,460 2,447 – – 23,907
Trading portfolio assets 7,584
Governments 6,342 114 – – 6,456
Financial institutions 505 107 – – 612
Other 98 389 29 – 516
Derivative assets 10,788
Governments 466 1 – – 467
Financial institutions 6,492 446 – – 6,938
Other 2,220 1,163 – – 3,383
Debt investment securities available for sale 4,334
Governments 906 – – – 906
Financial institutions 3,297 – – – 3,297
Other – 131 – – 131
Other financial assets(2) 4,498
Governments 428 11 – – 439
Financial institutions 906 277 14 – 1,197
Other 1,409 1,429 14 10 2,862
Loan assets held at amortised cost(3) 52,680
Governments 52 12 – – 64
Financial institutions 4,784 947 – – 5,731
Other 25,492 19,333 1,536 524 46,885
Other financial assets at fair value through profit or loss 215
Governments 75 – – – 75
Financial institutions – 1 – – 1
Other – 131 7 1 139
Due from related body corporate entities 1,535
Other 1,535 – – – 1,535
Due from subsidiaries 31,071
Other 31,071 – – – 31,071
Total 107,538 26,939 1,600 535 136,612
(1) Includes reverse repurchase agreements where the credit quality classification is based on the underlying collateral of the agreement.(2) This balance excludes other non-financial assets of $681 million which are included in Note 9 – Other assets.(3) Mortgages are classified as investment grade when the Company has taken insurance from investment grade LMI counterparties and classified as below
investment grade based on probability of default rating either when not insured or the Company bears first loss on the portfolio.(4) Included in the past due category are balances which were overdue by one day or more.

108 macquarie.com2018 Annual ReportMacquarie Bank Limited and its subsidiaries
NOTES TO THE FINANCIAL STATEMENTS FOR THE FINANCIAL YEAR ENDED 31 MARCH 2018CONTINUED
NOTE 36.1Credit risk continuedAgeing analysis of assets past due but not individually impaired and individually impaired assets:
PAST DUE BUT NOT INDIVIDUALLY IMPAIRED
Class of financial asset
Less than 30 days
$m
31 to 60 days
$m
61 to 90 days
$m
More than 90 days
$m
Total past due
but notindividually
impaired$m
Individually impaired
$mTotal
$m
CONSOLIDATED 2018Other financial assets
Government 26 3 2 20 51 – 51
Financial institutions 6 2 1 9 18 – 18
Other 41 10 7 12 70 9 79
Loan assets held at amortised cost
Financial institutions 1 – – – 1 – 1
Other 1,329 333 130 444 2,236 331 2,567
Trading portfolio assets
Other – – – 33 33 – 33
Other financial assets at fair value through profit or loss
Other – 25 – – 25 – 25
Total 1,403 373 140 518 2,434 340 2,774
CONSOLIDATED 2017Other financial assets
Government 12 4 3 23 42 – 42
Financial institutions 7 2 1 9 19 – 19
Other 48 10 2 9 69 17 86
Loan assets held at amortised cost
Other 1,323 312 131 558 2,324 478 2,802
Trading portfolio assets
Other – – – 40 40 – 40
Other financial assets at fair value through profit or loss
Other – 7 – – 7 1 8
Total 1,390 335 137 639 2,501 496 2,997
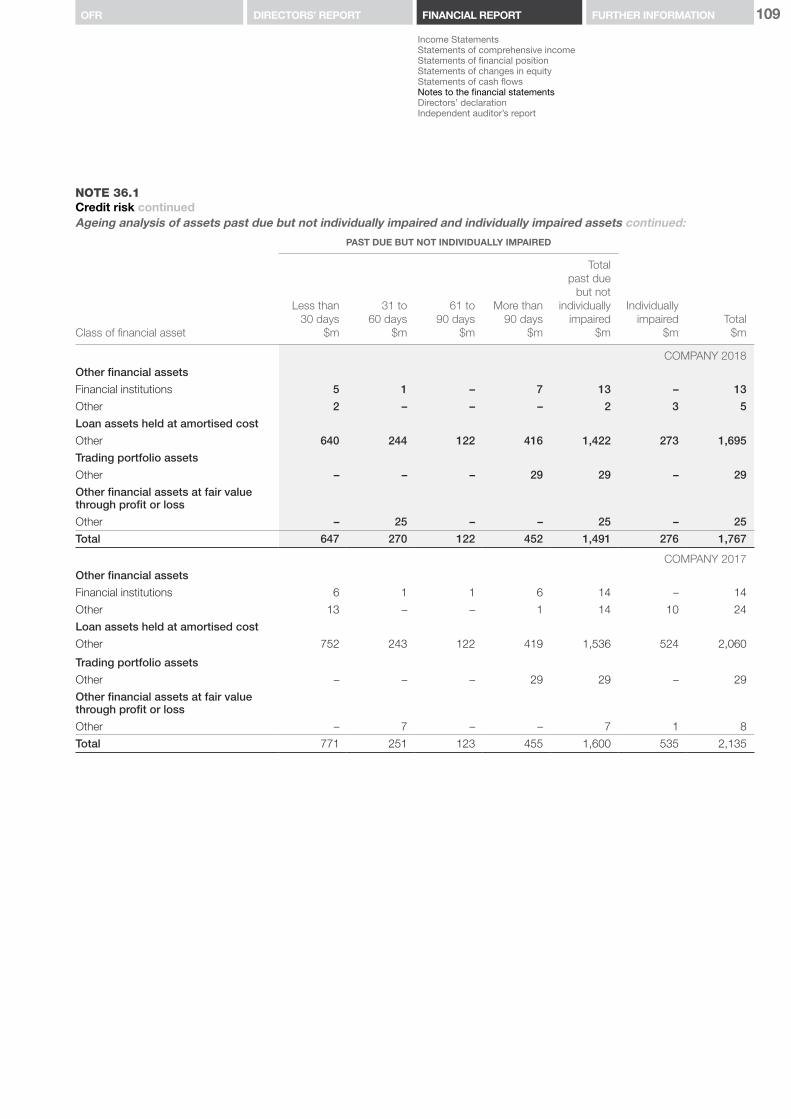
109
Income StatementsStatements of comprehensive incomeStatements of financial positionStatements of changes in equityStatements of cash flowsNotes to the financial statementsDirectors’ declaration Independent auditor’s report
FURTHER INFORMATIONOFR DIRECTORS’ REPORT FINANCIAL REPORT
NOTE 36.1Credit risk continuedAgeing analysis of assets past due but not individually impaired and individually impaired assets continued:
PAST DUE BUT NOT INDIVIDUALLY IMPAIRED
Class of financial asset
Less than 30 days
$m
31 to 60 days
$m
61 to 90 days
$m
More than 90 days
$m
Total past due
but notindividually
impaired$m
Individually impaired
$mTotal
$m
COMPANY 2018Other financial assets
Financial institutions 5 1 – 7 13 – 13
Other 2 – – – 2 3 5
Loan assets held at amortised cost
Other 640 244 122 416 1,422 273 1,695
Trading portfolio assets
Other – – – 29 29 – 29
Other financial assets at fair value through profit or loss
Other – 25 – – 25 – 25
Total 647 270 122 452 1,491 276 1,767
COMPANY 2017Other financial assets
Financial institutions 6 1 1 6 14 – 14
Other 13 – – 1 14 10 24
Loan assets held at amortised cost
Other 752 243 122 419 1,536 524 2,060
Trading portfolio assets
Other – – – 29 29 – 29
Other financial assets at fair value through profit or loss
Other – 7 – – 7 1 8
Total 771 251 123 455 1,600 535 2,135
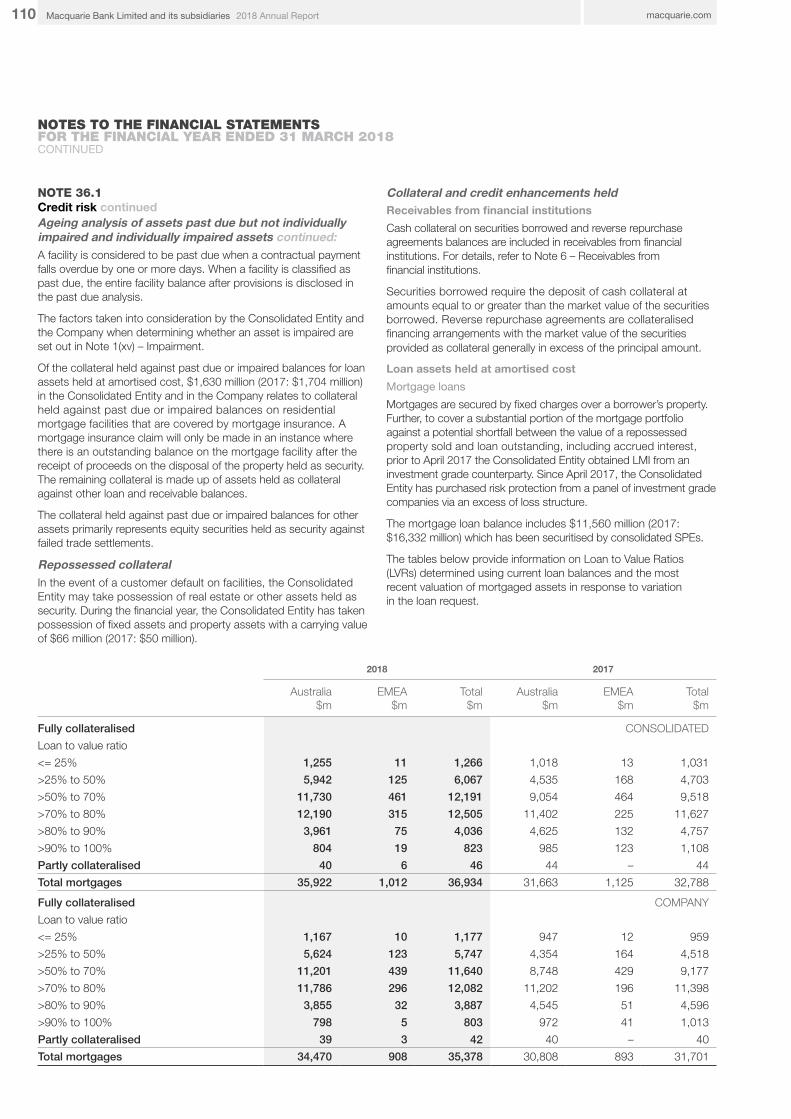
110 macquarie.com2018 Annual ReportMacquarie Bank Limited and its subsidiaries
NOTES TO THE FINANCIAL STATEMENTS FOR THE FINANCIAL YEAR ENDED 31 MARCH 2018CONTINUED
NOTE 36.1Credit risk continuedAgeing analysis of assets past due but not individually impaired and individually impaired assets continued:A facility is considered to be past due when a contractual payment falls overdue by one or more days. When a facility is classified as past due, the entire facility balance after provisions is disclosed in the past due analysis.
The factors taken into consideration by the Consolidated Entity and the Company when determining whether an asset is impaired are set out in Note 1(xv) – Impairment.
Of the collateral held against past due or impaired balances for loan assets held at amortised cost, $1,630 million (2017: $1,704 million) in the Consolidated Entity and in the Company relates to collateral held against past due or impaired balances on residential mortgage facilities that are covered by mortgage insurance. A mortgage insurance claim will only be made in an instance where there is an outstanding balance on the mortgage facility after the receipt of proceeds on the disposal of the property held as security. The remaining collateral is made up of assets held as collateral against other loan and receivable balances.
The collateral held against past due or impaired balances for other assets primarily represents equity securities held as security against failed trade settlements.
Repossessed collateralIn the event of a customer default on facilities, the Consolidated Entity may take possession of real estate or other assets held as security. During the financial year, the Consolidated Entity has taken possession of fixed assets and property assets with a carrying value of $66 million (2017: $50 million).
Collateral and credit enhancements heldReceivables from financial institutions
Cash collateral on securities borrowed and reverse repurchase agreements balances are included in receivables from financial institutions. For details, refer to Note 6 – Receivables from financial institutions.
Securities borrowed require the deposit of cash collateral at amounts equal to or greater than the market value of the securities borrowed. Reverse repurchase agreements are collateralised financing arrangements with the market value of the securities provided as collateral generally in excess of the principal amount.
Loan assets held at amortised cost
Mortgage loans
Mortgages are secured by fixed charges over a borrower’s property. Further, to cover a substantial portion of the mortgage portfolio against a potential shortfall between the value of a repossessed property sold and loan outstanding, including accrued interest, prior to April 2017 the Consolidated Entity obtained LMI from an investment grade counterparty. Since April 2017, the Consolidated Entity has purchased risk protection from a panel of investment grade companies via an excess of loss structure.
The mortgage loan balance includes $11,560 million (2017: $16,332 million) which has been securitised by consolidated SPEs.
The tables below provide information on Loan to Value Ratios (LVRs) determined using current loan balances and the most recent valuation of mortgaged assets in response to variation in the loan request.
2018 2017
Australia$m
EMEA$m
Total$m
Australia$m
EMEA$m
Total$m
Fully collateralised CONSOLIDATED
Loan to value ratio
<= 25% 1,255 11 1,266 1,018 13 1,031
>25% to 50% 5,942 125 6,067 4,535 168 4,703
>50% to 70% 11,730 461 12,191 9,054 464 9,518
>70% to 80% 12,190 315 12,505 11,402 225 11,627
>80% to 90% 3,961 75 4,036 4,625 132 4,757
>90% to 100% 804 19 823 985 123 1,108
Partly collateralised 40 6 46 44 – 44
Total mortgages 35,922 1,012 36,934 31,663 1,125 32,788
Fully collateralised COMPANY
Loan to value ratio
<= 25% 1,167 10 1,177 947 12 959
>25% to 50% 5,624 123 5,747 4,354 164 4,518
>50% to 70% 11,201 439 11,640 8,748 429 9,177
>70% to 80% 11,786 296 12,082 11,202 196 11,398
>80% to 90% 3,855 32 3,887 4,545 51 4,596
>90% to 100% 798 5 803 972 41 1,013
Partly collateralised 39 3 42 40 – 40
Total mortgages 34,470 908 35,378 30,808 893 31,701

111
Income StatementsStatements of comprehensive incomeStatements of financial positionStatements of changes in equityStatements of cash flowsNotes to the financial statementsDirectors’ declaration Independent auditor’s report
FURTHER INFORMATIONOFR DIRECTORS’ REPORT FINANCIAL REPORT
NOTE 36.1Credit risk continuedCollateral and credit enhancements held continuedAsset financing
The Consolidated Entity leases assets and provides asset-related financing, predominantly motor vehicles, to corporate and retail clients. Titles to the underlying assets are held by the Consolidated Entity as collateral. For the Consolidated Entity, of the asset finance portfolio of $19,084 million (2017: $19,513 million), the credit exposure after considering the depreciated value of collateral is $8,414 million (2017: $8,483 million). For the Company, of the asset finance portfolio of $3,539 million (2017: $5,474 million), the credit exposure after considering the depreciated value of collateral is $1,487 million (2017: $2,513 million).
The collateralised value is based on standard recovery rates for the underlying assets of retail and corporate clients.
Corporate, commercial and other lending
Collateral held against corporate, commercial and other lending consists of secured positions over assets of the counterparty, often in the form of corporate assets. For the Consolidated Entity, of the term lending of $14,361 million (2017: $14,720 million), the credit exposure after considering the estimated value of collateral and credit enhancements is $3,207 million (2017: $3,527 million). For the Company, of the term lending of $10,767 million (2017: $10,511 million), the credit exposure after the estimated value of collateral and credit enhancements is $2,464 million (2017: $2,564 million).
Investment lending
The Consolidated Entity lends to clients for investment lending, where it holds the underlying investment and/or alternative acceptable assets as collateral, or holds security by way of a registered pledge over the underlying investment. For the Consolidated Entity, of the investment lending portfolio of $2,001 million (2017: $1,655 million), $2,001 million (2017: $1,655 million) is fully collateralised. For the Company, of the investment lending portfolio of $139 million (2017: $377 million), $139 million (2017: $195 million) is fully collateralised.
Additional collateral
The Consolidated Entity and the Company also holds other types of collateral, such as unsupported guarantees. While such mitigants have value, as a credit risk mitigant, often providing rights in insolvency, their assignable values are uncertain and therefore are assigned no value for disclosure purposes.
Other financial assets at fair value through profit or loss
Other financial assets at fair value through profit or loss include financing provided to clients for investing. Financing may be unsecured or secured (partially or fully). Collateral is generally comprised of underlying securities investments or cash deposits of the investors.
Derivative financial instruments
Derivatives may be traded on an exchange (exchange traded) or they may be privately negotiated contracts, which are referred to as Over The Counter (OTC) derivatives. The Consolidated Entity’s and Company’s OTC derivatives are cleared and settled either through central clearing counterparties (OTC-cleared), or bilateral contracts between two counterparties.
Exchange traded and OTC-cleared derivative contracts have reduced credit risk as the Consolidated Entity’s counterparty is a clearing house. The clearing house is responsible for managing the risk associated with the process on behalf of their members and ensuring it has adequate resources to fulfil its obligations when they become due. Members are required to provide initial margins in accordance with the exchange rules in the form of cash or securities, and provide daily variation margins in cash to cover changes in market values. Further, all members are generally required to contribute to (and guarantee) the compensation or reserve fund which may be used in the event of default and shortfall of a member. The Consolidated Entity held exchange traded derivatives with positive replacement values as at 31 March 2018 of $658 million (2017: $1,414 million). The Company held exchange traded derivatives with positive replacement values as at 31 March 2018 of $554 million (2017: $1,269 million).
For OTC derivative contracts, the Consolidated Entity and Company often have master netting agreements (usually ISDA Master Agreements) with certain counterparties to manage the credit risk. The credit risk associated with positive replacement value contracts is reduced by master netting arrangements. In the event of default, they require balances with a particular counterparty covered by the agreement (for example derivatives and cash margins) to be terminated and settled on a net basis. The Consolidated Entity and Company also often execute a Credit Support Annex in conjunction with a master netting agreement. This facilitates the transfer of margin between parties during the term of arrangements and mitigates counterparty risk arising from changes in market values of the derivatives.
As at 31 March 2018, the Consolidated Entity held OTC contracts with a positive replacement value of $12,037 million (2017: $10,653 million). The credit risk of these contracts is reduced due to master netting agreements covering negative OTC contracts of $6,589 million (2017: $6,651 million) and margins held (excluding the impact of over-collateralisation) of $1,377 million (2017: $1,340 million).
As at 31 March 2018, the Company held OTC contracts with a positive replacement value of $10,114 million (2017: $9,519 million). The credit risk of these contracts is reduced due to master netting agreements covering negative OTC contracts of $5,549 million (2017: $5,972 million) and margins held (excluding the impact of over-collateralisation) of $1,159 million (2017: $1,203 million).

112 macquarie.com2018 Annual ReportMacquarie Bank Limited and its subsidiaries
NOTES TO THE FINANCIAL STATEMENTS FOR THE FINANCIAL YEAR ENDED 31 MARCH 2018CONTINUED
NOTE 36.1Credit risk continuedCollateral and credit enhancements held continuedDebt investments securities available for sale
This classification mainly includes debt securities held by Group Treasury for liquidity management purposes as well as certain asset-backed securities.
The Consolidated Entity utilises Credit Default Swaps (CDS), Guarantees, other forms of credit enhancements or collateral in order to minimise the exposure to credit risk.
Other assets
Security settlement of $3,108 million (2017: $2,315 million) in the Consolidated Entity and $2,729 million (2017: $2,105 million), in the Company are included in Other assets, which represent amounts owed by an exchange (or a client) for equities sold (or bought on behalf of a client). Security settlements are collateralised with the underlying equity securities or cash held by the Consolidated Entity until date of settlement.
Credit commitments
Undrawn facilities and lending commitments of $2,747 million (2017: $2,636million) in the Consolidated Entity and $2,437 million (2017: $2,350 million) in the Company are secured through collateral and credit enhancement out of total undrawn facilities and lending commitments of $4,712 million (2017: $4,738 million) in the Consolidated Entity and $3,766 million (2017: $3,777 million) in the Company.
NOTE 36.2Liquidity riskGovernance and oversightMacquarie Group’s liquidity risk management framework is designed to ensure that it is able to meet its funding requirements as they fall due under a range of market conditions.
Liquidity management is performed centrally by Group Treasury, with oversight from the Asset and Liability Committee (ALCO) and RMG. Macquarie Group’s liquidity policy is approved by the MGL and MBL Boards after endorsement by the ALCO and liquidity reporting is provided to the Boards on a monthly basis. The ALCO includes the MGL CEO, MBL CEO, CFO, CRO, Group Treasurer, Head of Balance Sheet Management and Operating Group Heads.
RMG provides independent oversight of liquidity risk management, including ownership of liquidity policies and key limits and approval of material liquidity scenario assumptions.
Liquidity policy and risk appetiteThe MGL and MBL Liquidity Policy is designed so that each of the Macquarie Group, the Bank Group and the Non-Bank Group maintains sufficient liquidity to meet its obligations as they fall due.
Macquarie Group’s liquidity risk appetite is set to ensure that Macquarie Group is able to meet all of its liquidity obligations during a period of liquidity stress: a twelve month period with constrained access to funding markets for MBL, no access to funding markets for MGL and with only a limited reduction in Macquarie Group’s franchise businesses.
MBL is an ADI and is funded mainly with capital, long-term liabilities and deposits.
Liquidity contingency planGroup Treasury maintains a Liquidity Contingency Plan, which outlines how a liquidity crisis would be managed. The plan defines roles and responsibilities and actions to be taken in a liquidity event, including identifying key information requirements and appropriate communication plans with both internal and external parties.
Specifically, the plan details:
– factors that may constitute a crisis – the officer responsible for enacting the contingency management – a committee of senior executives responsible for managing a crisis – the information required to effectively manage a crisis – a communications strategy – a high level checklist of possible actions to conserve or raise
additional liquidity – contact lists to facilitate prompt communication with all key
internal and external stakeholders.
In addition, Macquarie Group monitors a range of early warning indicators on a daily basis that might assist in identifying emerging risks in Macquarie Group’s liquidity position. These indicators are reviewed by Senior Management and are used to inform any decisions regarding invoking the plan.
The Liquidity Contingency Plan is subject to regular review by both Group Treasury and RMG. It is submitted to the ALCO and MGL and MBL Boards for approval.
Macquarie Group is a global financial institution, with branches and subsidiaries in a variety of countries. Regulations in certain countries may require some branches or subsidiaries to have specific local contingency plans. Where that is the case, the Liquidity Contingency Plan contains a supplement providing the specific information required for those branches or subsidiaries.
113
Income StatementsStatements of comprehensive incomeStatements of financial positionStatements of changes in equityStatements of cash flowsNotes to the financial statementsDirectors’ declaration Independent auditor’s report
FURTHER INFORMATIONOFR DIRECTORS’ REPORT FINANCIAL REPORT
NOTE 36.2Liquidity risk continuedFunding strategyMacquarie Group prepares a Funding Strategy on an annual basis and monitors progress against the strategy throughout the year. The Funding Strategy aims to maintain Macquarie Group’s diversity of current and projected funding sources, ensure ongoing compliance with all liquidity policy requirements and facilitate forecast asset growth. The Funding Strategy is reviewed by the ALCO and approved by the respective Boards.
Scenario analysisScenario analysis is central to Macquarie Group’s liquidity risk management framework. In addition to regulatory defined scenarios, Group Treasury models a number of additional liquidity scenarios covering both market-wide and Macquarie Group name-specific crises.
The scenarios are run over a number of timeframes and a range of conservative assumptions are used regarding the level of access to capital markets, deposit outflows, contingent funding requirements and asset sales.
As an example, one internal scenario projects the expected cash and liquid asset position during a combined market-wide and Macquarie Group name-specific crisis over a twelve month time frame. This scenario assumes no access to new funding sources, a significant loss of customer deposits and contingent funding outflows resulting from undrawn commitments, market moves impacting derivatives and other margined positions combined with a multiple notch credit rating downgrade. Macquarie Group’s cash and liquid asset portfolio must exceed the minimum requirement as calculated in this scenario at all times.
Liquid asset holdingsGroup Treasury centrally maintains a portfolio of highly liquid unencumbered assets to ensure adequate liquidity is available in all funding environments, including worst case wholesale and retail market conditions. The minimum level of cash and liquid assets is calculated with reference to internal scenario projections and regulatory requirements.
The cash and liquid asset portfolio contains only unencumbered assets that can be relied on to maintain their liquidity in a crisis scenario. Specifically, cash and liquid assets held to meet minimum internal and regulatory requirements must be held in cash, qualifying High Quality Liquid Assets (HQLA) or be an asset type that is eligible as collateral in the Reserve Bank of Australia’s (RBA) Committed Liquidity Facility (CLF) – so called ‘Alternative Liquid Assets’ (ALA). Composition constraints are also applied to ensure appropriate diversity and quality of the assets in the portfolio. The cash and liquid asset portfolio is held in a range of currencies to ensure Macquarie Group’s liquidity requirements are broadly matched by currency.
Funds transfer pricingAn internal funds transfer pricing framework is in place that has been designed to produce appropriate incentives for business decision-making by reflecting the true funding costs arising from business actions. Under this framework, each business is allocated the full cost of the funding required to support its products and business lines, recognising the actual and contingent funding-related exposures their activities create for Macquarie Group as a whole. Businesses that raise funding are compensated at a level that is appropriate for the liquidity benefit provided by the funding.
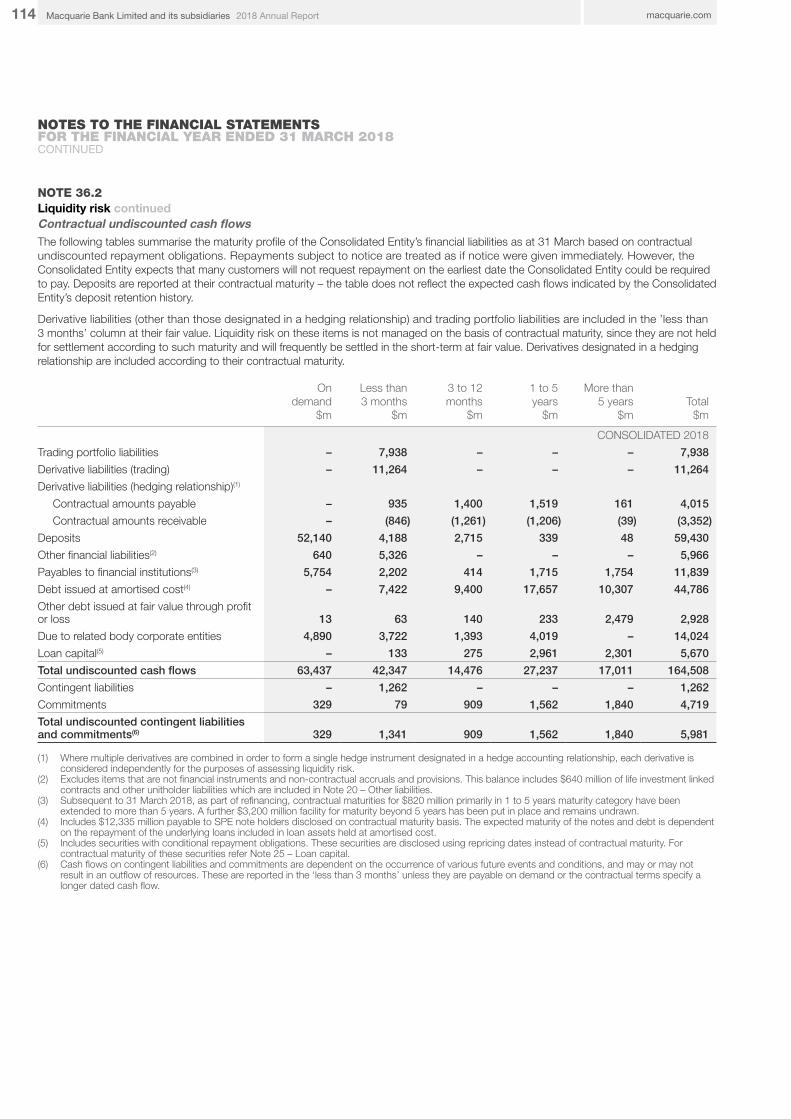
114 macquarie.com2018 Annual ReportMacquarie Bank Limited and its subsidiaries
NOTES TO THE FINANCIAL STATEMENTS FOR THE FINANCIAL YEAR ENDED 31 MARCH 2018CONTINUED
NOTE 36.2Liquidity risk continuedContractual undiscounted cash flowsThe following tables summarise the maturity profile of the Consolidated Entity’s financial liabilities as at 31 March based on contractual undiscounted repayment obligations. Repayments subject to notice are treated as if notice were given immediately. However, the Consolidated Entity expects that many customers will not request repayment on the earliest date the Consolidated Entity could be required to pay. Deposits are reported at their contractual maturity – the table does not reflect the expected cash flows indicated by the Consolidated Entity’s deposit retention history.
Derivative liabilities (other than those designated in a hedging relationship) and trading portfolio liabilities are included in the ’less than 3 months’ column at their fair value. Liquidity risk on these items is not managed on the basis of contractual maturity, since they are not held for settlement according to such maturity and will frequently be settled in the short-term at fair value. Derivatives designated in a hedging relationship are included according to their contractual maturity.
On demand
$m
Less than 3 months
$m
3 to 12months
$m
1 to 5years
$m
More than5 years
$mTotal
$m
CONSOLIDATED 2018
Trading portfolio liabilities – 7,938 – – – 7,938
Derivative liabilities (trading) – 11,264 – – – 11,264
Derivative liabilities (hedging relationship)(1)
Contractual amounts payable – 935 1,400 1,519 161 4,015
Contractual amounts receivable – (846) (1,261) (1,206) (39) (3,352)
Deposits 52,140 4,188 2,715 339 48 59,430
Other financial liabilities(2) 640 5,326 – – – 5,966
Payables to financial institutions(3) 5,754 2,202 414 1,715 1,754 11,839
Debt issued at amortised cost(4) – 7,422 9,400 17,657 10,307 44,786
Other debt issued at fair value through profit or loss 13 63 140 233 2,479 2,928
Due to related body corporate entities 4,890 3,722 1,393 4,019 – 14,024
Loan capital(5) – 133 275 2,961 2,301 5,670
Total undiscounted cash flows 63,437 42,347 14,476 27,237 17,011 164,508
Contingent liabilities – 1,262 – – – 1,262
Commitments 329 79 909 1,562 1,840 4,719
Total undiscounted contingent liabilities and commitments(6) 329 1,341 909 1,562 1,840 5,981
(1) Where multiple derivatives are combined in order to form a single hedge instrument designated in a hedge accounting relationship, each derivative is considered independently for the purposes of assessing liquidity risk.
(2) Excludes items that are not financial instruments and non-contractual accruals and provisions. This balance includes $640 million of life investment linked contracts and other unitholder liabilities which are included in Note 20 – Other liabilities.
(3) Subsequent to 31 March 2018, as part of refinancing, contractual maturities for $820 million primarily in 1 to 5 years maturity category have been extended to more than 5 years. A further $3,200 million facility for maturity beyond 5 years has been put in place and remains undrawn.
(4) Includes $12,335 million payable to SPE note holders disclosed on contractual maturity basis. The expected maturity of the notes and debt is dependent on the repayment of the underlying loans included in loan assets held at amortised cost.
(5) Includes securities with conditional repayment obligations. These securities are disclosed using repricing dates instead of contractual maturity. For contractual maturity of these securities refer Note 25 – Loan capital.
(6) Cash flows on contingent liabilities and commitments are dependent on the occurrence of various future events and conditions, and may or may not result in an outflow of resources. These are reported in the ‘less than 3 months’ unless they are payable on demand or the contractual terms specify a longer dated cash flow.
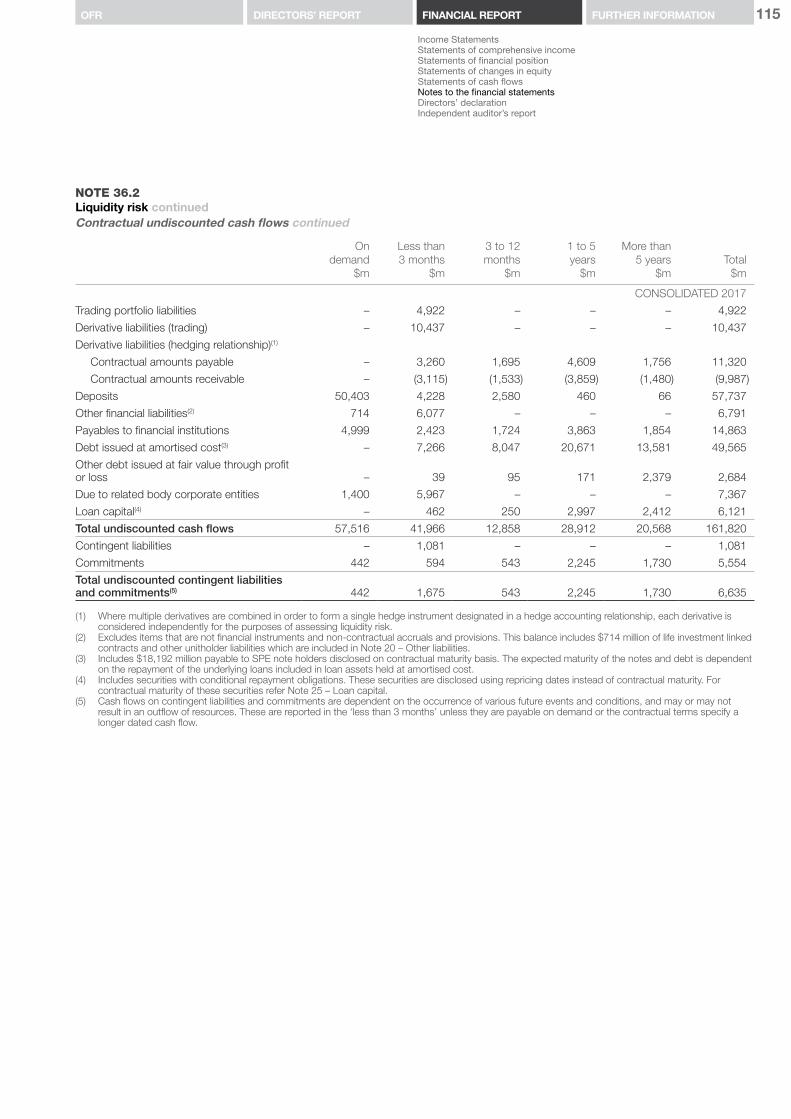
115
Income StatementsStatements of comprehensive incomeStatements of financial positionStatements of changes in equityStatements of cash flowsNotes to the financial statementsDirectors’ declaration Independent auditor’s report
FURTHER INFORMATIONOFR DIRECTORS’ REPORT FINANCIAL REPORT
NOTE 36.2Liquidity risk continuedContractual undiscounted cash flows continued
On demand
$m
Less than 3 months
$m
3 to 12months
$m
1 to 5years
$m
More than5 years
$mTotal
$m
CONSOLIDATED 2017
Trading portfolio liabilities – 4,922 – – – 4,922
Derivative liabilities (trading) – 10,437 – – – 10,437
Derivative liabilities (hedging relationship)(1)
Contractual amounts payable – 3,260 1,695 4,609 1,756 11,320
Contractual amounts receivable – (3,115) (1,533) (3,859) (1,480) (9,987)
Deposits 50,403 4,228 2,580 460 66 57,737
Other financial liabilities(2) 714 6,077 – – – 6,791
Payables to financial institutions 4,999 2,423 1,724 3,863 1,854 14,863
Debt issued at amortised cost(3) – 7,266 8,047 20,671 13,581 49,565
Other debt issued at fair value through profit or loss – 39 95 171 2,379 2,684
Due to related body corporate entities 1,400 5,967 – – – 7,367
Loan capital(4) – 462 250 2,997 2,412 6,121
Total undiscounted cash flows 57,516 41,966 12,858 28,912 20,568 161,820
Contingent liabilities – 1,081 – – – 1,081
Commitments 442 594 543 2,245 1,730 5,554
Total undiscounted contingent liabilities and commitments(5) 442 1,675 543 2,245 1,730 6,635
(1) Where multiple derivatives are combined in order to form a single hedge instrument designated in a hedge accounting relationship, each derivative is considered independently for the purposes of assessing liquidity risk.
(2) Excludes items that are not financial instruments and non-contractual accruals and provisions. This balance includes $714 million of life investment linked contracts and other unitholder liabilities which are included in Note 20 – Other liabilities.
(3) Includes $18,192 million payable to SPE note holders disclosed on contractual maturity basis. The expected maturity of the notes and debt is dependent on the repayment of the underlying loans included in loan assets held at amortised cost.
(4) Includes securities with conditional repayment obligations. These securities are disclosed using repricing dates instead of contractual maturity. For contractual maturity of these securities refer Note 25 – Loan capital.
(5) Cash flows on contingent liabilities and commitments are dependent on the occurrence of various future events and conditions, and may or may not result in an outflow of resources. These are reported in the ‘less than 3 months’ unless they are payable on demand or the contractual terms specify a longer dated cash flow.
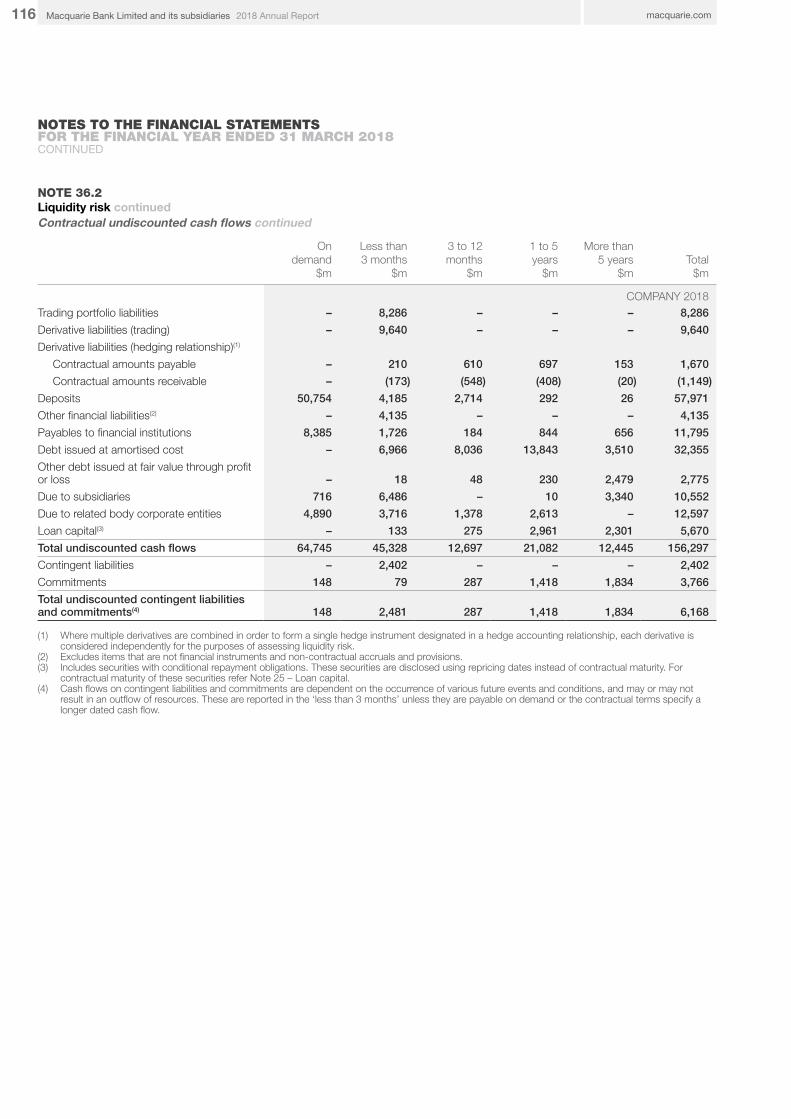
116 macquarie.com2018 Annual ReportMacquarie Bank Limited and its subsidiaries
NOTES TO THE FINANCIAL STATEMENTS FOR THE FINANCIAL YEAR ENDED 31 MARCH 2018CONTINUED
NOTE 36.2Liquidity risk continuedContractual undiscounted cash flows continued
On demand
$m
Less than 3 months
$m
3 to 12months
$m
1 to 5years
$m
More than5 years
$mTotal
$m
COMPANY 2018Trading portfolio liabilities – 8,286 – – – 8,286
Derivative liabilities (trading) – 9,640 – – – 9,640
Derivative liabilities (hedging relationship)(1)
Contractual amounts payable – 210 610 697 153 1,670
Contractual amounts receivable – (173) (548) (408) (20) (1,149)
Deposits 50,754 4,185 2,714 292 26 57,971
Other financial liabilities(2) – 4,135 – – – 4,135
Payables to financial institutions 8,385 1,726 184 844 656 11,795
Debt issued at amortised cost – 6,966 8,036 13,843 3,510 32,355
Other debt issued at fair value through profit or loss – 18 48 230 2,479 2,775
Due to subsidiaries 716 6,486 – 10 3,340 10,552
Due to related body corporate entities 4,890 3,716 1,378 2,613 – 12,597
Loan capital(3) – 133 275 2,961 2,301 5,670
Total undiscounted cash flows 64,745 45,328 12,697 21,082 12,445 156,297
Contingent liabilities – 2,402 – – – 2,402
Commitments 148 79 287 1,418 1,834 3,766
Total undiscounted contingent liabilities and commitments(4) 148 2,481 287 1,418 1,834 6,168
(1) Where multiple derivatives are combined in order to form a single hedge instrument designated in a hedge accounting relationship, each derivative is considered independently for the purposes of assessing liquidity risk.
(2) Excludes items that are not financial instruments and non-contractual accruals and provisions.(3) Includes securities with conditional repayment obligations. These securities are disclosed using repricing dates instead of contractual maturity. For
contractual maturity of these securities refer Note 25 – Loan capital.(4) Cash flows on contingent liabilities and commitments are dependent on the occurrence of various future events and conditions, and may or may not
result in an outflow of resources. These are reported in the ‘less than 3 months’ unless they are payable on demand or the contractual terms specify a longer dated cash flow.

117
Income StatementsStatements of comprehensive incomeStatements of financial positionStatements of changes in equityStatements of cash flowsNotes to the financial statementsDirectors’ declaration Independent auditor’s report
FURTHER INFORMATIONOFR DIRECTORS’ REPORT FINANCIAL REPORT
NOTE 36.2Liquidity risk continuedContractual undiscounted cash flows continued
On demand
$m
Less than 3 months
$m
3 to 12months
$m
1 to 5years
$m
More than5 years
$mTotal
$m
COMPANY 2017Trading portfolio liabilities – 5,143 – – – 5,143
Derivative liabilities (trading) – 9,883 – – – 9,883
Derivative liabilities (hedging relationship)(1)
Contractual amounts payable – 1,324 138 1,806 1,734 5,002
Contractual amounts receivable – (1,265) (192) (1,471) (1,423) (4,351)
Deposits 49,096 4,225 2,579 430 22 56,352
Other financial liabilities(2) – 4,856 – – – 4,856
Payables to financial institutions 4,999 1,929 1,465 2,739 239 11,371
Debt issued at amortised cost – 6,599 5,951 14,783 4,040 31,373
Other debt issued at fair value through profit or loss – 2,021 101 171 2,379 4,672
Due to subsidiaries – 9,719 5 2,671 5,333 17,728
Due to related body corporate entities 1,400 4,559 – – – 5,959
Loan capital(3) – 462 250 2,997 2,412 6,121
Total undiscounted cash flows 55,495 49,455 10,297 24,126 14,736 154,109
Contingent liabilities – 2,271 – – – 2,271
Commitments 290 354 437 1,753 1,662 4,496
Total undiscounted contingent liabilities and commitments(4) 290 2,625 437 1,753 1,662 6,767
(1) Where multiple derivatives are combined in order to form a single hedge instrument designated in a hedge accounting relationship, each derivative is considered independently for the purposes of assessing liquidity risk.
(2) Excludes items that are not financial instruments and non-contractual accruals and provisions.(3) Included in this balance are securities with conditional repayment obligations. These securities are disclosed using repricing dates instead of contractual
maturity. For contractual maturity of these securities refer Note 25 – Loan capital.(4) Cash flows on contingent liabilities and commitments are dependent on the occurrence of various future events and conditions, and may or may not
result in an outflow of resources. These are reported in the ‘less than 3 months’ unless they are payable on demand or the contractual terms specify a longer dated cash flow.
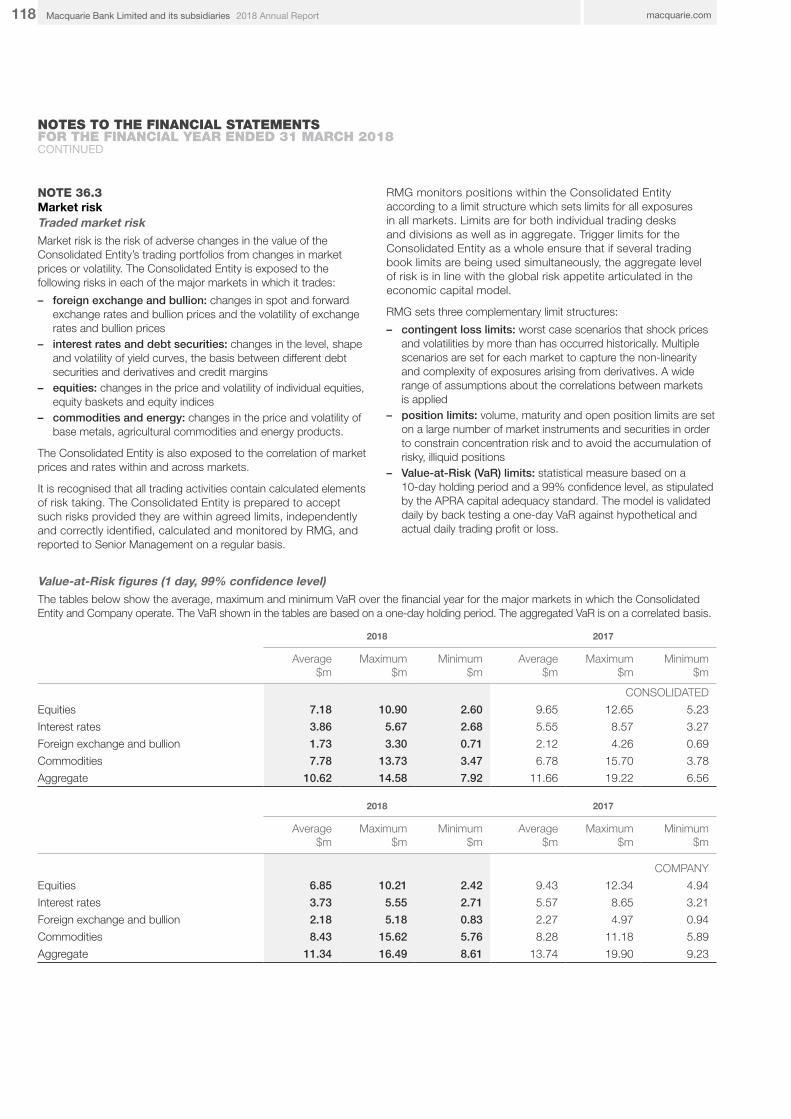
118 macquarie.com2018 Annual ReportMacquarie Bank Limited and its subsidiaries
NOTES TO THE FINANCIAL STATEMENTS FOR THE FINANCIAL YEAR ENDED 31 MARCH 2018CONTINUED
NOTE 36.3Market risk Traded market riskMarket risk is the risk of adverse changes in the value of the Consolidated Entity’s trading portfolios from changes in market prices or volatility. The Consolidated Entity is exposed to the following risks in each of the major markets in which it trades:
– foreign exchange and bullion: changes in spot and forward exchange rates and bullion prices and the volatility of exchange rates and bullion prices
– interest rates and debt securities: changes in the level, shape and volatility of yield curves, the basis between different debt securities and derivatives and credit margins
– equities: changes in the price and volatility of individual equities, equity baskets and equity indices
– commodities and energy: changes in the price and volatility of base metals, agricultural commodities and energy products.
The Consolidated Entity is also exposed to the correlation of market prices and rates within and across markets.
It is recognised that all trading activities contain calculated elements of risk taking. The Consolidated Entity is prepared to accept such risks provided they are within agreed limits, independently and correctly identified, calculated and monitored by RMG, and reported to Senior Management on a regular basis.
RMG monitors positions within the Consolidated Entity according to a limit structure which sets limits for all exposures in all markets. Limits are for both individual trading desks and divisions as well as in aggregate. Trigger limits for the Consolidated Entity as a whole ensure that if several trading book limits are being used simultaneously, the aggregate level of risk is in line with the global risk appetite articulated in the economic capital model.
RMG sets three complementary limit structures:
– contingent loss limits: worst case scenarios that shock prices and volatilities by more than has occurred historically. Multiple scenarios are set for each market to capture the non-linearity and complexity of exposures arising from derivatives. A wide range of assumptions about the correlations between markets is applied
– position limits: volume, maturity and open position limits are set on a large number of market instruments and securities in order to constrain concentration risk and to avoid the accumulation of risky, illiquid positions
– Value-at-Risk (VaR) limits: statistical measure based on a 10-day holding period and a 99% confidence level, as stipulated by the APRA capital adequacy standard. The model is validated daily by back testing a one-day VaR against hypothetical and actual daily trading profit or loss.
Value-at-Risk figures (1 day, 99% confidence level)The tables below show the average, maximum and minimum VaR over the financial year for the major markets in which the Consolidated Entity and Company operate. The VaR shown in the tables are based on a one-day holding period. The aggregated VaR is on a correlated basis.
2018 2017
Average$m
Maximum$m
Minimum$m
Average$m
Maximum$m
Minimum$m
CONSOLIDATED
Equities 7.18 10.90 2.60 9.65 12.65 5.23
Interest rates 3.86 5.67 2.68 5.55 8.57 3.27
Foreign exchange and bullion 1.73 3.30 0.71 2.12 4.26 0.69
Commodities 7.78 13.73 3.47 6.78 15.70 3.78
Aggregate 10.62 14.58 7.92 11.66 19.22 6.56
2018 2017
Average$m
Maximum$m
Minimum$m
Average$m
Maximum$m
Minimum$m
COMPANY
Equities 6.85 10.21 2.42 9.43 12.34 4.94
Interest rates 3.73 5.55 2.71 5.57 8.65 3.21
Foreign exchange and bullion 2.18 5.18 0.83 2.27 4.97 0.94
Commodities 8.43 15.62 5.76 8.28 11.18 5.89
Aggregate 11.34 16.49 8.61 13.74 19.90 9.23
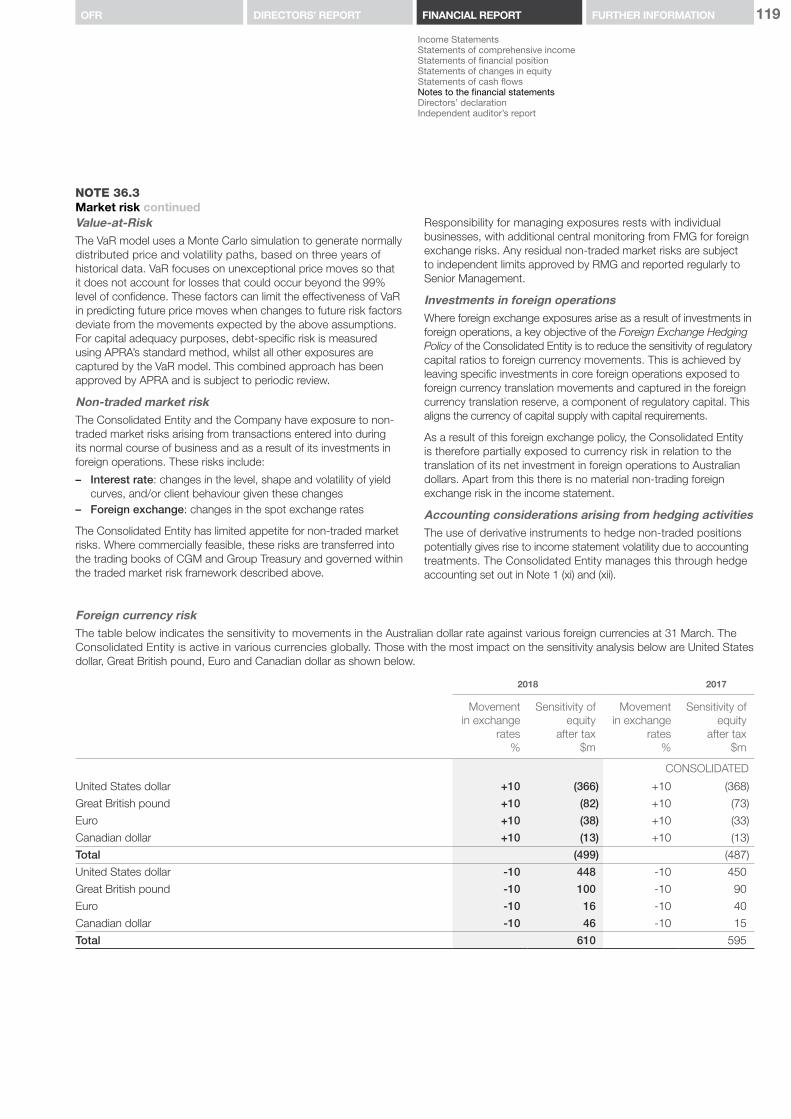
119
Income StatementsStatements of comprehensive incomeStatements of financial positionStatements of changes in equityStatements of cash flowsNotes to the financial statementsDirectors’ declaration Independent auditor’s report
FURTHER INFORMATIONOFR DIRECTORS’ REPORT FINANCIAL REPORT
NOTE 36.3Market risk continuedValue-at-RiskThe VaR model uses a Monte Carlo simulation to generate normally distributed price and volatility paths, based on three years of historical data. VaR focuses on unexceptional price moves so that it does not account for losses that could occur beyond the 99% level of confidence. These factors can limit the effectiveness of VaR in predicting future price moves when changes to future risk factors deviate from the movements expected by the above assumptions. For capital adequacy purposes, debt-specific risk is measured using APRA’s standard method, whilst all other exposures are captured by the VaR model. This combined approach has been approved by APRA and is subject to periodic review.
Non-traded market risk The Consolidated Entity and the Company have exposure to non-traded market risks arising from transactions entered into during its normal course of business and as a result of its investments in foreign operations. These risks include:
– Interest rate: changes in the level, shape and volatility of yield curves, and/or client behaviour given these changes
– Foreign exchange: changes in the spot exchange rates
The Consolidated Entity has limited appetite for non-traded market risks. Where commercially feasible, these risks are transferred into the trading books of CGM and Group Treasury and governed within the traded market risk framework described above.
Responsibility for managing exposures rests with individual businesses, with additional central monitoring from FMG for foreign exchange risks. Any residual non-traded market risks are subject to independent limits approved by RMG and reported regularly to Senior Management.
Investments in foreign operationsWhere foreign exchange exposures arise as a result of investments in foreign operations, a key objective of the Foreign Exchange Hedging Policy of the Consolidated Entity is to reduce the sensitivity of regulatory capital ratios to foreign currency movements. This is achieved by leaving specific investments in core foreign operations exposed to foreign currency translation movements and captured in the foreign currency translation reserve, a component of regulatory capital. This aligns the currency of capital supply with capital requirements.
As a result of this foreign exchange policy, the Consolidated Entity is therefore partially exposed to currency risk in relation to the translation of its net investment in foreign operations to Australian dollars. Apart from this there is no material non-trading foreign exchange risk in the income statement.
Accounting considerations arising from hedging activitiesThe use of derivative instruments to hedge non-traded positions potentially gives rise to income statement volatility due to accounting treatments. The Consolidated Entity manages this through hedge accounting set out in Note 1 (xi) and (xii).
Foreign currency riskThe table below indicates the sensitivity to movements in the Australian dollar rate against various foreign currencies at 31 March. The Consolidated Entity is active in various currencies globally. Those with the most impact on the sensitivity analysis below are United States dollar, Great British pound, Euro and Canadian dollar as shown below.
2018 2017
Movementin exchange
rates%
Sensitivity of equity
after tax$m
Movementin exchange
rates%
Sensitivity of equity
after tax$m
CONSOLIDATED
United States dollar +10 (366) +10 (368)
Great British pound +10 (82) +10 (73)
Euro +10 (38) +10 (33)
Canadian dollar +10 (13) +10 (13)
Total (499) (487)
United States dollar -10 448 -10 450
Great British pound -10 100 -10 90
Euro -10 16 -10 40
Canadian dollar -10 46 -10 15
Total 610 595

120 macquarie.com2018 Annual ReportMacquarie Bank Limited and its subsidiaries
NOTES TO THE FINANCIAL STATEMENTS FOR THE FINANCIAL YEAR ENDED 31 MARCH 2018CONTINUED
NOTE 36.3Market risk continuedEquity price riskThe tables below indicate the equity markets to which the Consolidated Entity and the Company had significant exposure at 31 March on their non-trading investment portfolio. This excludes interests in associates and joint ventures. The effect on equity (as a result of a change in the fair value of equity instruments held as available for sale at 31 March) and the income statement (as a result of a change in the fair value of financial assets designated at fair value) due to a reasonably possible change in equity prices, with all other variables held constant, is as follows:
2018 2017
Geographic Region
Movementin equity
price%
Sensitivityof profitafter tax
$m
Sensitivityof equityafter tax
$m
Movementin equity
price%
Sensitivityof profitafter tax
$m
Sensitivityof equityafter tax
$m
CONSOLIDATED
Listed
Australia +10 – 1 +10 – 3
Americas +10 2 – +10 2 1
Europe, Middle East and Africa +10 – – +10 1 –
Unlisted +10 – 4 +10 1 41
Total 2 5 4 45
Listed
Australia -10 – (1) –10 – (3)
Americas -10 (2) – –10 (2) (1)
Europe, Middle East and Africa -10 – – –10 (1) –
Unlisted -10 – (4) –10 (1) (41)
Total (2) (5) (4) (45)
COMPANY
Listed
Australia +10 – 1 +10 1 3
Americas +10 – – +10 – –
Europe, Middle East and Africa +10 – – +10 1 –
Unlisted +10 – 2 +10 1 33
Total – 3 3 36
Listed
Australia -10 – (1) –10 (1) (3)
Americas -10 – – –10 – –
Europe, Middle East and Africa -10 – – –10 (1) –
Unlisted -10 – (2) –10 (1) (33)
Total – (3) (3) (36)
NOTE 37Fair value of financial assets and financial liabilitiesFair value reflects the price that would be received to sell an asset or paid to transfer a liability in an orderly transaction between market participants at the measurement date.
Quoted prices or rates are used to determine fair value where an active market exists. If the market for a financial instrument is not active, fair values are estimated using present value or other valuation techniques, using inputs based on market conditions prevailing on the measurement date.
The values derived from applying these techniques are affected by the choice of valuation model used and the underlying assumptions made regarding inputs such as timing and amounts of future cash flows, discount rates, credit risk, volatility and correlation.
Financial instruments measured at fair value are categorised in their entirety, in accordance with the levels of the fair value hierarchy as outlined below:

121
Income StatementsStatements of comprehensive incomeStatements of financial positionStatements of changes in equityStatements of cash flowsNotes to the financial statementsDirectors’ declaration Independent auditor’s report
FURTHER INFORMATIONOFR DIRECTORS’ REPORT FINANCIAL REPORT
NOTE 37Fair value of financial assets and financial liabilities continued
Financial instruments measured at fair value are categorised in their entirety, in accordance with the levels of the fair value hierarchy as outlined below:
Level 1: quoted prices (unadjusted) in active markets for identical assets or liabilities
Level 2: inputs other than quoted prices included within Level 1 that are observable for the asset or liability, either directly (i.e. as prices) or indirectly (i.e. derived from prices)
Level 3: inputs for the asset or liability that are not based on observable market data (unobservable inputs).
The appropriate level for an instrument is determined on the basis of the lowest level input that is significant to the fair value measurement.
AASB 13 Fair value management requires use of the price within the bid-offer spread that is most representative of fair value. Valuation systems will typically generate mid-market prices. The bid-offer adjustment reflects the extent to which bid-offer costs would be incurred if substantially all residual net portfolio market risks were closed using available hedging instruments.
The following methods and significant assumptions have been applied in determining the fair values of financial instruments which are carried at amortised cost:
– the fair values of liquid assets and other instruments maturing within three months are approximate to their carrying amounts. This assumption is applied to liquid assets and the short-term elements of all other financial assets and financial liabilities
– the fair value of demand deposits with no fixed maturity is approximately their carrying amount as they are short-term in nature or are payable on demand
– the fair values of variable rate financial instruments, including certain loan assets and liabilities carried at amortised cost, cash collateral on securities borrowed/cash collateral on securities lent and reverse repurchase/repurchase agreements included within receivables from financial institutions and payables to financial institutions, are approximate to their carrying amounts. The fair value of loan assets repayable without penalty is approximated by their carrying value. Fair values of all loan assets is determined with reference to changes in credit markets as well as interest rates
– the fair value of fixed rate loans and debt carried at amortised cost is estimated by reference to current market rates offered on similar loans and the creditworthiness of the borrower
– the fair value of debt issued and loan capital issued at amortised cost is based on market prices where available. Where market prices are not available the fair value is based on discounted cash flows using rates appropriate to the term and issue and incorporates changes in the Consolidated Entity’s own credit spread
– substantially all of the Consolidated Entity’s commitments to extend credit are at variable rates. As such, there is no significant exposure to fair value fluctuations resulting from interest rate movements relating to these commitments, and
– in the financial statements of the Consolidated Entity, the fair value of balances due from/to related body corporate entities is approximated by their carrying amount as the balances are generally receivable/payable on demand.
The following methods and significant assumptions have been applied in determining the fair values of financial instruments which are measured at fair value:
– trading portfolio assets and liabilities, financial assets and liabilities at fair value through profit or loss, derivative financial instruments and other transactions undertaken for trading purposes are measured at fair value by reference to quoted market prices when available (for example listed securities). If quoted market prices are not available, then fair values are estimated on the basis of pricing models or other recognised valuation techniques
– investment securities classified as available for sale are measured at fair value by reference to active quoted market prices when available (for example listed securities). If quoted market prices are not available, then fair values are estimated on the basis of pricing models or other recognised valuation techniques. Unrealised gain and loss, excluding impairment write-downs, are recorded in the available for sale reserve in equity until the asset is sold, collected or otherwise disposed of
– fair values of fixed rate loans and issued debt classified as at fair value through profit or loss is estimated by reference to current market rates offered on similar loans and issued debt
– for financial assets carried at fair value, in order to measure counterparty credit risk, a Credit Valuation Adjustment (CVA) is incorporated into the valuation. The CVA is calculated at a counterparty level taking into account all exposures to that counterparty
– for financial liabilities carried at fair value, in order to measure the Consolidated Entity’s own credit risk, a Debit Valuation Adjustment (DVA) is incorporated into the valuations, and
– for uncollateralised derivative positions, the Consolidated Entity has incorporated the market implied funding costs for these uncollateralised derivative positions as a Funding Valuation Adjustment (FVA). FVA is determined by calculating the net expected exposures at a counterparty level and applying MGL’s internal Treasury lending rates as an input into the calculation. The approach takes into account the probability of default of each counterparty, as well as any mandatory break clauses.
Where valuation techniques are used to determine fair values, they are validated and periodically reviewed by qualified personnel independent of the area that created them. All models are certified before they are used, and models are calibrated periodically to test that outputs reflect prices from observable current market transactions in the same instrument or other available observable market data. To the extent possible, models use only observable market data (for example for OTC derivatives), however management is required to make assumptions for certain inputs that are not supported by prices from observable current market transactions in the same instrument, such as volatility and correlation.
The fair values calculated for financial assets which are carried in the statement of financial position at amortised cost are for disclosure purposes only. The methods and assumptions applied to derive these fair values, as described below, can require significant judgement by management and therefore may not necessarily be comparable to other financial institutions.
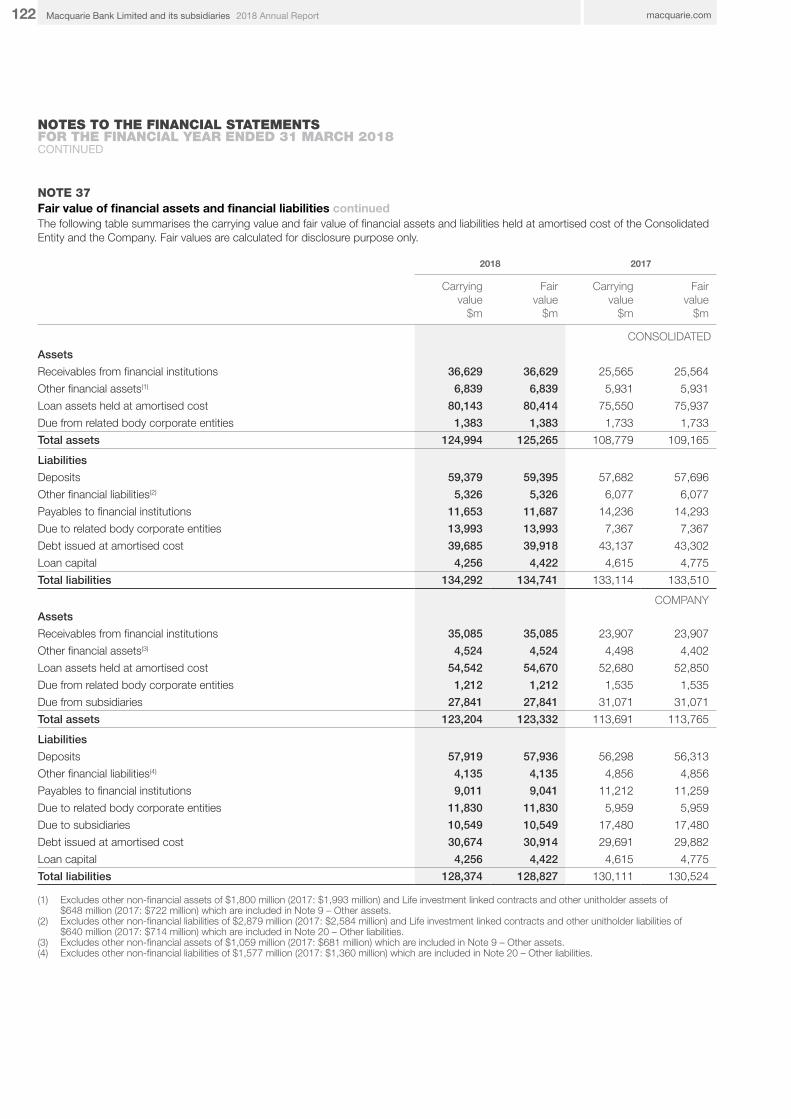
122 macquarie.com2018 Annual ReportMacquarie Bank Limited and its subsidiaries
NOTES TO THE FINANCIAL STATEMENTS FOR THE FINANCIAL YEAR ENDED 31 MARCH 2018CONTINUED
NOTE 37Fair value of financial assets and financial liabilities continuedThe following table summarises the carrying value and fair value of financial assets and liabilities held at amortised cost of the Consolidated Entity and the Company. Fair values are calculated for disclosure purpose only.
2018 2017
Carryingvalue
$m
Fairvalue
$m
Carryingvalue
$m
Fairvalue
$m
CONSOLIDATED
Assets
Receivables from financial institutions 36,629 36,629 25,565 25,564
Other financial assets(1) 6,839 6,839 5,931 5,931
Loan assets held at amortised cost 80,143 80,414 75,550 75,937
Due from related body corporate entities 1,383 1,383 1,733 1,733
Total assets 124,994 125,265 108,779 109,165
Liabilities
Deposits 59,379 59,395 57,682 57,696
Other financial liabilities(2) 5,326 5,326 6,077 6,077
Payables to financial institutions 11,653 11,687 14,236 14,293
Due to related body corporate entities 13,993 13,993 7,367 7,367
Debt issued at amortised cost 39,685 39,918 43,137 43,302
Loan capital 4,256 4,422 4,615 4,775
Total liabilities 134,292 134,741 133,114 133,510
COMPANYAssets
Receivables from financial institutions 35,085 35,085 23,907 23,907
Other financial assets(3) 4,524 4,524 4,498 4,402
Loan assets held at amortised cost 54,542 54,670 52,680 52,850
Due from related body corporate entities 1,212 1,212 1,535 1,535
Due from subsidiaries 27,841 27,841 31,071 31,071
Total assets 123,204 123,332 113,691 113,765
Liabilities
Deposits 57,919 57,936 56,298 56,313
Other financial liabilities(4) 4,135 4,135 4,856 4,856
Payables to financial institutions 9,011 9,041 11,212 11,259
Due to related body corporate entities 11,830 11,830 5,959 5,959
Due to subsidiaries 10,549 10,549 17,480 17,480
Debt issued at amortised cost 30,674 30,914 29,691 29,882
Loan capital 4,256 4,422 4,615 4,775
Total liabilities 128,374 128,827 130,111 130,524
(1) Excludes other non-financial assets of $1,800 million (2017: $1,993 million) and Life investment linked contracts and other unitholder assets of $648 million (2017: $722 million) which are included in Note 9 – Other assets.
(2) Excludes other non-financial liabilities of $2,879 million (2017: $2,584 million) and Life investment linked contracts and other unitholder liabilities of $640 million (2017: $714 million) which are included in Note 20 – Other liabilities.
(3) Excludes other non-financial assets of $1,059 million (2017: $681 million) which are included in Note 9 – Other assets.(4) Excludes other non-financial liabilities of $1,577 million (2017: $1,360 million) which are included in Note 20 – Other liabilities.
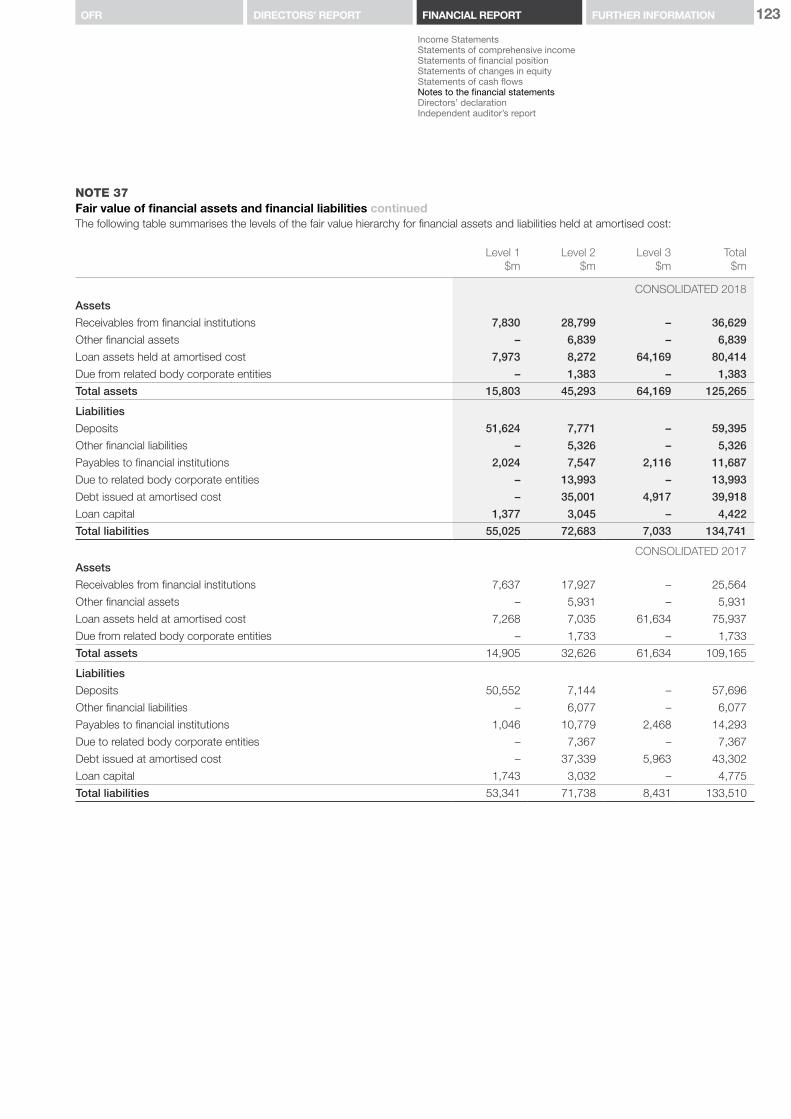
123
Income StatementsStatements of comprehensive incomeStatements of financial positionStatements of changes in equityStatements of cash flowsNotes to the financial statementsDirectors’ declaration Independent auditor’s report
FURTHER INFORMATIONOFR DIRECTORS’ REPORT FINANCIAL REPORT
NOTE 37Fair value of financial assets and financial liabilities continuedThe following table summarises the levels of the fair value hierarchy for financial assets and liabilities held at amortised cost:
Level 1$m
Level 2$m
Level 3$m
Total$m
CONSOLIDATED 2018Assets
Receivables from financial institutions 7,830 28,799 – 36,629
Other financial assets – 6,839 – 6,839
Loan assets held at amortised cost 7,973 8,272 64,169 80,414
Due from related body corporate entities – 1,383 – 1,383
Total assets 15,803 45,293 64,169 125,265
Liabilities
Deposits 51,624 7,771 – 59,395
Other financial liabilities – 5,326 – 5,326
Payables to financial institutions 2,024 7,547 2,116 11,687
Due to related body corporate entities – 13,993 – 13,993
Debt issued at amortised cost – 35,001 4,917 39,918
Loan capital 1,377 3,045 – 4,422
Total liabilities 55,025 72,683 7,033 134,741
CONSOLIDATED 2017Assets
Receivables from financial institutions 7,637 17,927 – 25,564
Other financial assets – 5,931 – 5,931
Loan assets held at amortised cost 7,268 7,035 61,634 75,937
Due from related body corporate entities – 1,733 – 1,733
Total assets 14,905 32,626 61,634 109,165
Liabilities
Deposits 50,552 7,144 – 57,696
Other financial liabilities – 6,077 – 6,077
Payables to financial institutions 1,046 10,779 2,468 14,293
Due to related body corporate entities – 7,367 – 7,367
Debt issued at amortised cost – 37,339 5,963 43,302
Loan capital 1,743 3,032 – 4,775
Total liabilities 53,341 71,738 8,431 133,510

124 macquarie.com2018 Annual ReportMacquarie Bank Limited and its subsidiaries
NOTES TO THE FINANCIAL STATEMENTS FOR THE FINANCIAL YEAR ENDED 31 MARCH 2018CONTINUED
NOTE 37Fair value of financial assets and financial liabilities continuedThe following table summarises the levels of the fair value hierarchy for financial assets and liabilities held at amortised cost:
Level 1$m
Level 2$m
Level 3$m
Total$m
COMPANY 2018Assets
Receivables from financial institutions 6,626 28,459 – 35,085
Other financial assets – 4,524 – 4,524
Loan assets held at amortised cost 4,871 3,921 45,878 54,670
Due from related body corporate entities – 1,212 – 1,212
Due from subsidiaries – 27,841 – 27,841
Total assets 11,497 65,957 45,878 123,332
Liabilities
Deposits 50,174 7,762 – 57,936
Other financial liabilities – 4,135 – 4,135
Payables to financial institutions 2,022 7,019 – 9,041
Due to related body corporate entities – 11,830 – 11,830
Due to subsidiaries – 10,549 – 10,549
Debt issued at amortised cost – 30,914 – 30,914
Loan capital 1,378 3,044 – 4,422
Total liabilities 53,574 75,253 – 128,827
COMPANY 2017Assets
Receivables from financial institutions 6,173 17,734 – 23,907
Other financial assets – 4,402 – 4,402
Loan assets held at amortised cost 4,877 3,679 44,294 52,850
Due from related body corporate entities – 1,535 – 1,535
Due from subsidiaries – 31,071 – 31,071
Total assets 11,050 58,421 44,294 113,765
Liabilities
Deposits 49,182 7,131 – 56,313
Other financial liabilities – 4,856 – 4,856
Payables to financial institutions 1,046 10,213 – 11,259
Due to related body corporate entities – 5,959 – 5,959
Due to subsidiaries – 17,480 – 17,480
Debt issued at amortised cost – 29,882 – 29,882
Loan capital 1,743 3,032 – 4,775
Total liabilities 51,971 78,553 – 130,524

125
Income StatementsStatements of comprehensive incomeStatements of financial positionStatements of changes in equityStatements of cash flowsNotes to the financial statementsDirectors’ declaration Independent auditor’s report
FURTHER INFORMATIONOFR DIRECTORS’ REPORT FINANCIAL REPORT
NOTE 37Fair value of financial assets and financial liabilities continuedThe following table summarises the levels of the fair value hierarchy for financial instruments measured at fair value:
Level 1$m
Level 2$m
Level 3$m
Total$m
CONSOLIDATED 2018Assets
Trading portfolio assets 10,015 4,709 170 14,894
Derivative assets 451 11,628 616 12,695
Investment securities available for sale 3,923 1,279 120 5,322
Other financial assets at fair value through profit or loss 2 687 18 707
Other financial assets(1) 31 616 1 648
Total assets 14,422 18,919 925 34,266
Liabilities
Trading portfolio liabilities 6,377 1,561 – 7,938
Derivative liabilities 632 10,810 346 11,788
Other debt issued at fair value through profit or loss – 1,986 6 1,992
Other financial liabilities(2) – 639 1 640
Total liabilities 7,009 14,996 353 22,358
CONSOLIDATED 2017Assets
Trading portfolio assets 17,923 8,386 328 26,637
Derivative assets 770 10,949 348 12,067
Investment securities available for sale 3,176 1,628 378 5,182
Other financial assets at fair value through profit or loss 5 742 13 760
Other financial assets(1) 24 691 7 722
Total assets 21,898 22,396 1,074 45,368
Liabilities
Trading portfolio liabilities 3,105 1,817 – 4,922
Derivative liabilities 686 10,214 201 11,101
Other debt issued at fair value through profit or loss – 1,877 57 1,934
Other financial liabilities(2) – 707 7 714
Total liabilities 3,791 14,615 265 18,671
(1) This balance represents $648 million (2017: $722 million) of life investment linked contracts and other unitholder assets which are included in Note 9 – Other assets.
(2) This balance represents $640 million (2017: $714 million) of life investment linked contracts and other unitholder liabilities which are included in Note 20 – Other liabilities.

126 macquarie.com2018 Annual ReportMacquarie Bank Limited and its subsidiaries
NOTES TO THE FINANCIAL STATEMENTS FOR THE FINANCIAL YEAR ENDED 31 MARCH 2018CONTINUED
NOTE 37Fair value of financial assets and financial liabilities continued
Level 1$m
Level 2$m
Level 3$m
Total$m
COMPANY 2018Assets
Trading portfolio assets 9,175 2,518 130 11,823
Derivative assets 445 9,945 278 10,668
Investment securities available for sale 3,920 1,151 87 5,158
Other financial assets at fair value through profit or loss 2 525 15 542
Total assets 13,542 14,139 510 28,191
Liabilities
Trading portfolio liabilities 6,703 1,583 – 8,286
Derivative liabilities 483 9,429 131 10,043
Other debt issued at fair value through profit or loss – 1,833 6 1,839
Total liabilities 7,186 12,845 137 20,168
COMPANY 2017Assets
Trading portfolio assets 14,398 5,972 239 20,609
Derivative assets 759 9,796 233 10,788
Investment securities available for sale 3,128 1,418 255 4,801
Other financial assets at fair value through profit or loss 5 579 10 594
Total assets 18,290 17,765 737 36,792
Liabilities
Trading portfolio liabilities 3,233 1,910 – 5,143
Derivative liabilities 549 9,612 119 10,280
Other debt issued at fair value through profit or loss – 3,865 56 3,921
Total liabilities 3,782 15,387 175 19,344
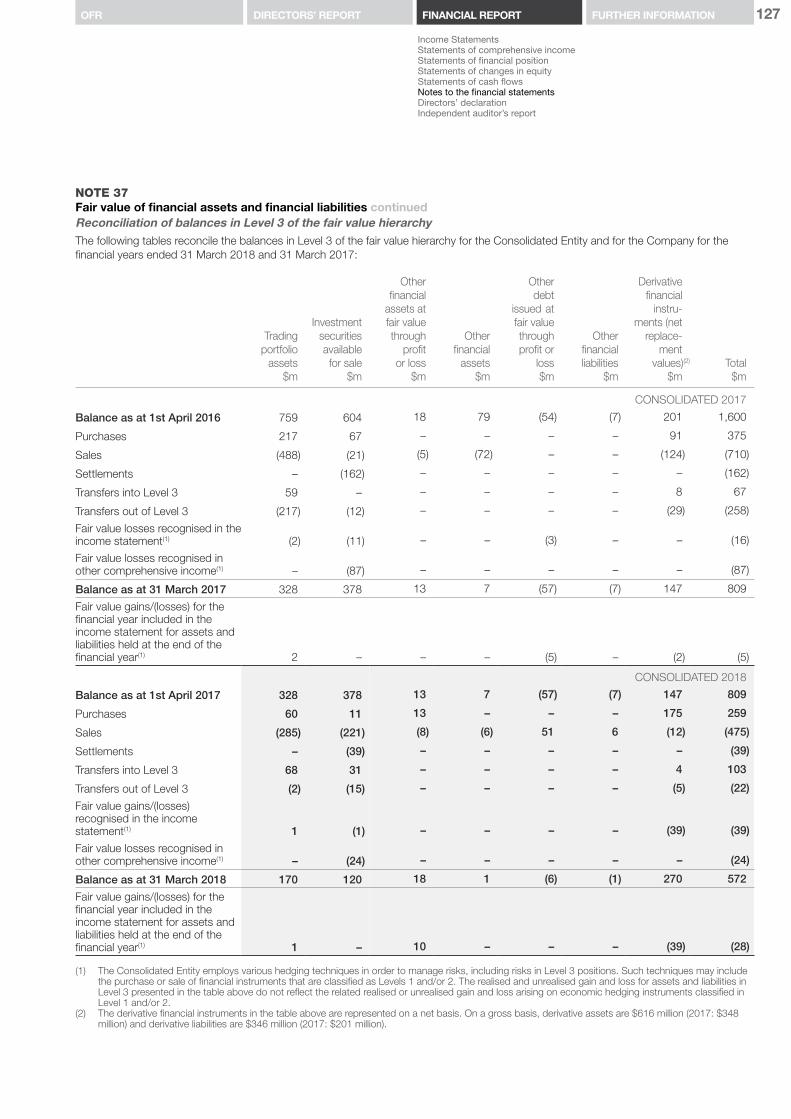
127
Income StatementsStatements of comprehensive incomeStatements of financial positionStatements of changes in equityStatements of cash flowsNotes to the financial statementsDirectors’ declaration Independent auditor’s report
FURTHER INFORMATIONOFR DIRECTORS’ REPORT FINANCIAL REPORT
NOTE 37Fair value of financial assets and financial liabilities continuedReconciliation of balances in Level 3 of the fair value hierarchyThe following tables reconcile the balances in Level 3 of the fair value hierarchy for the Consolidated Entity and for the Company for the financial years ended 31 March 2018 and 31 March 2017:
Tradingportfolio
assets$m
Investment securitiesavailablefor sale
$m
Otherfinancial
assets atfair valuethrough
profitor loss
$m
Otherfinancial
assets$m
Otherdebt
issued atfair valuethroughprofit or
loss$m
Otherfinancialliabilities
$m
Derivativefinancial
instru-ments (net
replace-ment
values) (2)
$mTotal
$m
CONSOLIDATED 2017
Balance as at 1st April 2016 759 604 18 79 (54) (7) 201 1,600
Purchases 217 67 – – – – 91 375
Sales (488) (21) (5) (72) – – (124) (710)
Settlements – (162) – – – – – (162)
Transfers into Level 3 59 – – – – – 8 67
Transfers out of Level 3 (217) (12) – – – – (29) (258)
Fair value losses recognised in the income statement(1) (2) (11) – – (3) – – (16)
Fair value losses recognised in other comprehensive income(1) – (87) – – – – – (87)
Balance as at 31 March 2017 328 378 13 7 (57) (7) 147 809
Fair value gains/(losses) for the financial year included in the income statement for assets and liabilities held at the end of the financial year(1) 2 – – – (5) – (2) (5)
CONSOLIDATED 2018
Balance as at 1st April 2017 328 378 13 7 (57) (7) 147 809
Purchases 60 11 13 – – – 175 259
Sales (285) (221) (8) (6) 51 6 (12) (475)
Settlements – (39) – – – – – (39)
Transfers into Level 3 68 31 – – – – 4 103
Transfers out of Level 3 (2) (15) – – – – (5) (22)
Fair value gains/(losses) recognised in the income statement(1) 1 (1) – – – – (39) (39)
Fair value losses recognised in other comprehensive income(1) – (24) – – – – – (24)
Balance as at 31 March 2018 170 120 18 1 (6) (1) 270 572
Fair value gains/(losses) for the financial year included in the income statement for assets and liabilities held at the end of the financial year(1) 1 – 10 – – – (39) (28)
(1) The Consolidated Entity employs various hedging techniques in order to manage risks, including risks in Level 3 positions. Such techniques may include the purchase or sale of financial instruments that are classified as Levels 1 and/or 2. The realised and unrealised gain and loss for assets and liabilities in Level 3 presented in the table above do not reflect the related realised or unrealised gain and loss arising on economic hedging instruments classified in Level 1 and/or 2.
(2) The derivative financial instruments in the table above are represented on a net basis. On a gross basis, derivative assets are $616 million (2017: $348 million) and derivative liabilities are $346 million (2017: $201 million).
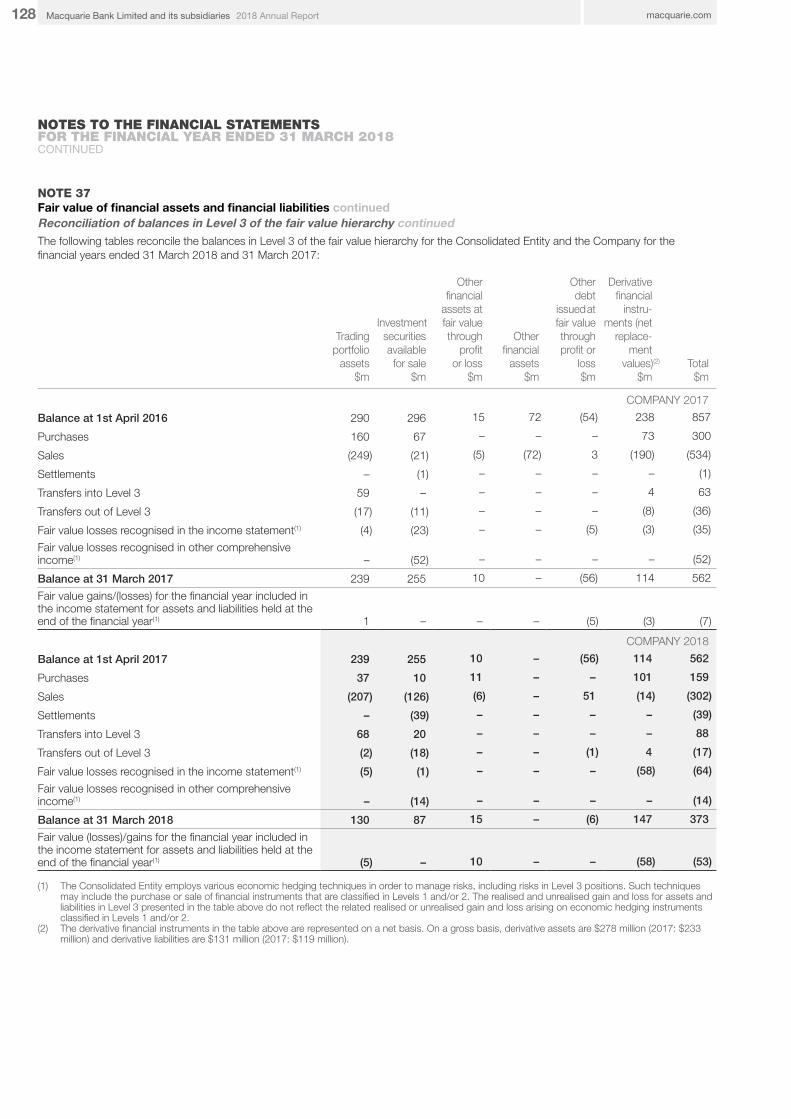
128 macquarie.com2018 Annual ReportMacquarie Bank Limited and its subsidiaries
NOTES TO THE FINANCIAL STATEMENTS FOR THE FINANCIAL YEAR ENDED 31 MARCH 2018CONTINUED
NOTE 37Fair value of financial assets and financial liabilities continuedReconciliation of balances in Level 3 of the fair value hierarchy continuedThe following tables reconcile the balances in Level 3 of the fair value hierarchy for the Consolidated Entity and the Company for the financial years ended 31 March 2018 and 31 March 2017:
Tradingportfolio
assets$m
Investment securitiesavailablefor sale
$m
Other financial
assets at fair value through
profit or loss
$m
Otherfinancial
assets$m
Otherdebt
issued atfair valuethroughprofit or
loss$m
Derivativefinancial
instru-ments (net
replace-ment
values) (2)
$mTotal
$m
COMPANY 2017
Balance at 1st April 2016 290 296 15 72 (54) 238 857
Purchases 160 67 – – – 73 300
Sales (249) (21) (5) (72) 3 (190) (534)
Settlements – (1) – – – – (1)
Transfers into Level 3 59 – – – – 4 63
Transfers out of Level 3 (17) (11) – – – (8) (36)
Fair value losses recognised in the income statement(1) (4) (23) – – (5) (3) (35)
Fair value losses recognised in other comprehensive income(1) – (52) – – – – (52)
Balance at 31 March 2017 239 255 10 – (56) 114 562
Fair value gains/(losses) for the financial year included in the income statement for assets and liabilities held at the end of the financial year(1) 1 – – – (5) (3) (7)
COMPANY 2018
Balance at 1st April 2017 239 255 10 – (56) 114 562
Purchases 37 10 11 – – 101 159
Sales (207) (126) (6) – 51 (14) (302)
Settlements – (39) – – – – (39)
Transfers into Level 3 68 20 – – – – 88
Transfers out of Level 3 (2) (18) – – (1) 4 (17)
Fair value losses recognised in the income statement(1) (5) (1) – – – (58) (64)
Fair value losses recognised in other comprehensive income(1) – (14) – – – – (14)
Balance at 31 March 2018 130 87 15 – (6) 147 373
Fair value (losses)/gains for the financial year included in the income statement for assets and liabilities held at the end of the financial year(1) (5) – 10 – – (58) (53)
(1) The Consolidated Entity employs various economic hedging techniques in order to manage risks, including risks in Level 3 positions. Such techniques may include the purchase or sale of financial instruments that are classified in Levels 1 and/or 2. The realised and unrealised gain and loss for assets and liabilities in Level 3 presented in the table above do not reflect the related realised or unrealised gain and loss arising on economic hedging instruments classified in Levels 1 and/or 2.
(2) The derivative financial instruments in the table above are represented on a net basis. On a gross basis, derivative assets are $278 million (2017: $233 million) and derivative liabilities are $131 million (2017: $119 million).
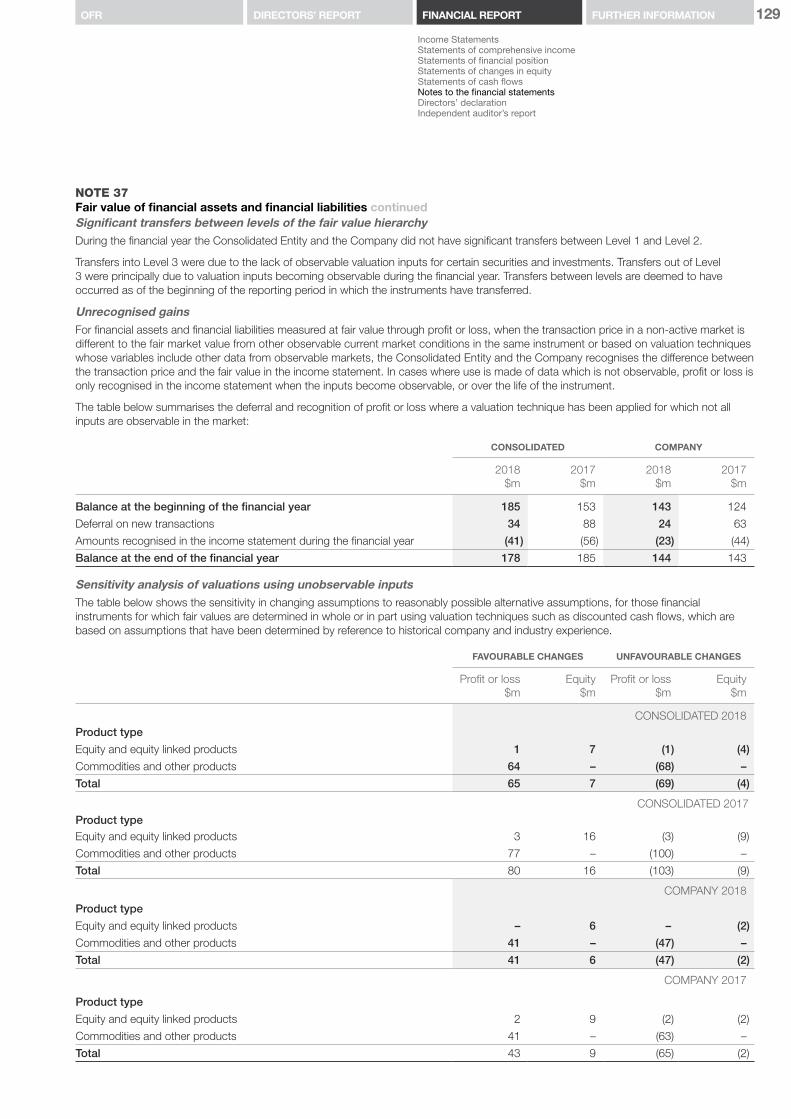
129
Income StatementsStatements of comprehensive incomeStatements of financial positionStatements of changes in equityStatements of cash flowsNotes to the financial statementsDirectors’ declaration Independent auditor’s report
FURTHER INFORMATIONOFR DIRECTORS’ REPORT FINANCIAL REPORT
NOTE 37Fair value of financial assets and financial liabilities continuedSignificant transfers between levels of the fair value hierarchy During the financial year the Consolidated Entity and the Company did not have significant transfers between Level 1 and Level 2.
Transfers into Level 3 were due to the lack of observable valuation inputs for certain securities and investments. Transfers out of Level 3 were principally due to valuation inputs becoming observable during the financial year. Transfers between levels are deemed to have occurred as of the beginning of the reporting period in which the instruments have transferred.
Unrecognised gainsFor financial assets and financial liabilities measured at fair value through profit or loss, when the transaction price in a non-active market is different to the fair market value from other observable current market conditions in the same instrument or based on valuation techniques whose variables include other data from observable markets, the Consolidated Entity and the Company recognises the difference between the transaction price and the fair value in the income statement. In cases where use is made of data which is not observable, profit or loss is only recognised in the income statement when the inputs become observable, or over the life of the instrument.
The table below summarises the deferral and recognition of profit or loss where a valuation technique has been applied for which not all inputs are observable in the market:
CONSOLIDATED COMPANY
2018$m
2017 $m
2018$m
2017 $m
Balance at the beginning of the financial year 185 153 143 124
Deferral on new transactions 34 88 24 63
Amounts recognised in the income statement during the financial year (41) (56) (23) (44)
Balance at the end of the financial year 178 185 144 143
Sensitivity analysis of valuations using unobservable inputsThe table below shows the sensitivity in changing assumptions to reasonably possible alternative assumptions, for those financial instruments for which fair values are determined in whole or in part using valuation techniques such as discounted cash flows, which are based on assumptions that have been determined by reference to historical company and industry experience.
FAVOURABLE CHANGES UNFAVOURABLE CHANGES
Profit or loss$m
Equity$m
Profit or loss$m
Equity$m
CONSOLIDATED 2018Product type
Equity and equity linked products 1 7 (1) (4)
Commodities and other products 64 – (68) –
Total 65 7 (69) (4)
CONSOLIDATED 2017Product typeEquity and equity linked products 3 16 (3) (9)
Commodities and other products 77 – (100) –
Total 80 16 (103) (9)
COMPANY 2018
Product type
Equity and equity linked products – 6 – (2)
Commodities and other products 41 – (47) –
Total 41 6 (47) (2)
COMPANY 2017
Product type
Equity and equity linked products 2 9 (2) (2)
Commodities and other products 41 – (63) –
Total 43 9 (65) (2)
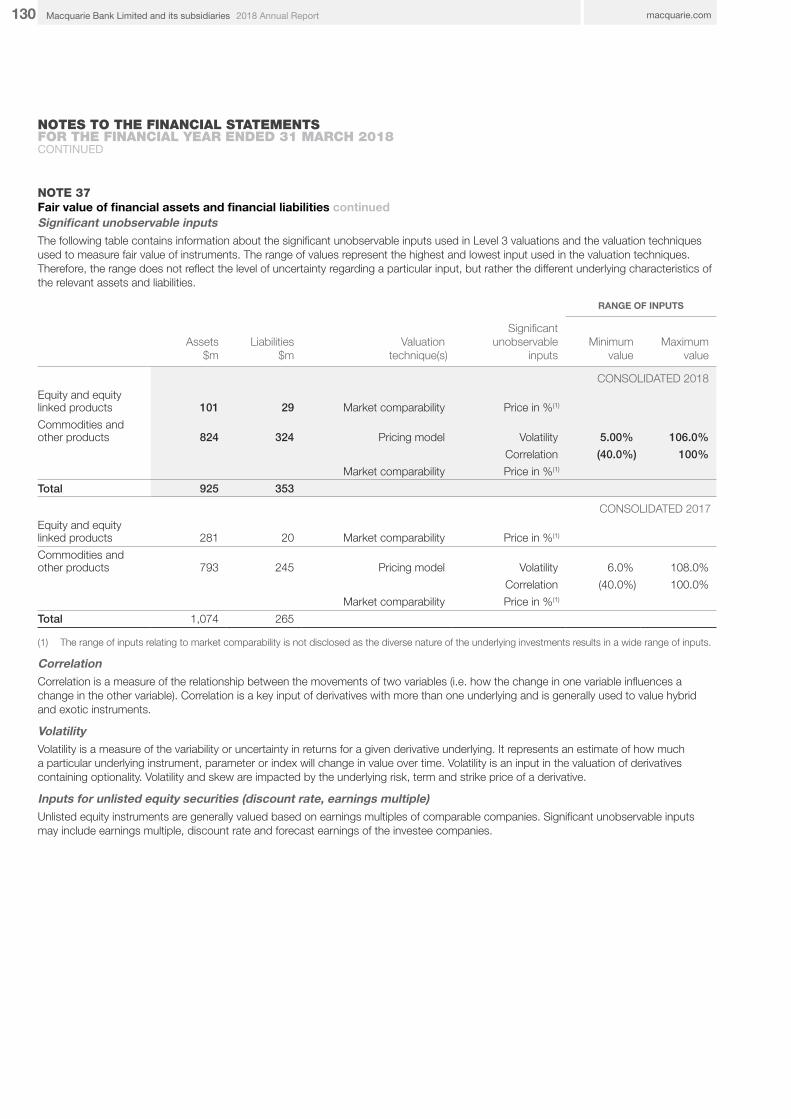
130 macquarie.com2018 Annual ReportMacquarie Bank Limited and its subsidiaries
NOTES TO THE FINANCIAL STATEMENTS FOR THE FINANCIAL YEAR ENDED 31 MARCH 2018CONTINUED
NOTE 37Fair value of financial assets and financial liabilities continuedSignificant unobservable inputsThe following table contains information about the significant unobservable inputs used in Level 3 valuations and the valuation techniques used to measure fair value of instruments. The range of values represent the highest and lowest input used in the valuation techniques. Therefore, the range does not reflect the level of uncertainty regarding a particular input, but rather the different underlying characteristics of the relevant assets and liabilities.
RANGE OF INPUTS
Assets$m
Liabilities$m
Valuationtechnique(s)
Significantunobservable
inputsMinimum
valueMaximum
value
CONSOLIDATED 2018Equity and equity linked products 101 29 Market comparability Price in %(1)
Commodities and other products 824 324 Pricing model Volatility 5.00% 106.0%
Correlation (40.0%) 100%
Market comparability Price in %(1)
Total 925 353
CONSOLIDATED 2017Equity and equity linked products 281 20 Market comparability Price in %(1)
Commodities and other products 793 245 Pricing model Volatility 6.0% 108.0%
Correlation (40.0%) 100.0%
Market comparability Price in %(1)
Total 1,074 265
(1) The range of inputs relating to market comparability is not disclosed as the diverse nature of the underlying investments results in a wide range of inputs.
CorrelationCorrelation is a measure of the relationship between the movements of two variables (i.e. how the change in one variable influences a change in the other variable). Correlation is a key input of derivatives with more than one underlying and is generally used to value hybrid and exotic instruments.
VolatilityVolatility is a measure of the variability or uncertainty in returns for a given derivative underlying. It represents an estimate of how much a particular underlying instrument, parameter or index will change in value over time. Volatility is an input in the valuation of derivatives containing optionality. Volatility and skew are impacted by the underlying risk, term and strike price of a derivative.
Inputs for unlisted equity securities (discount rate, earnings multiple)Unlisted equity instruments are generally valued based on earnings multiples of comparable companies. Significant unobservable inputs may include earnings multiple, discount rate and forecast earnings of the investee companies.
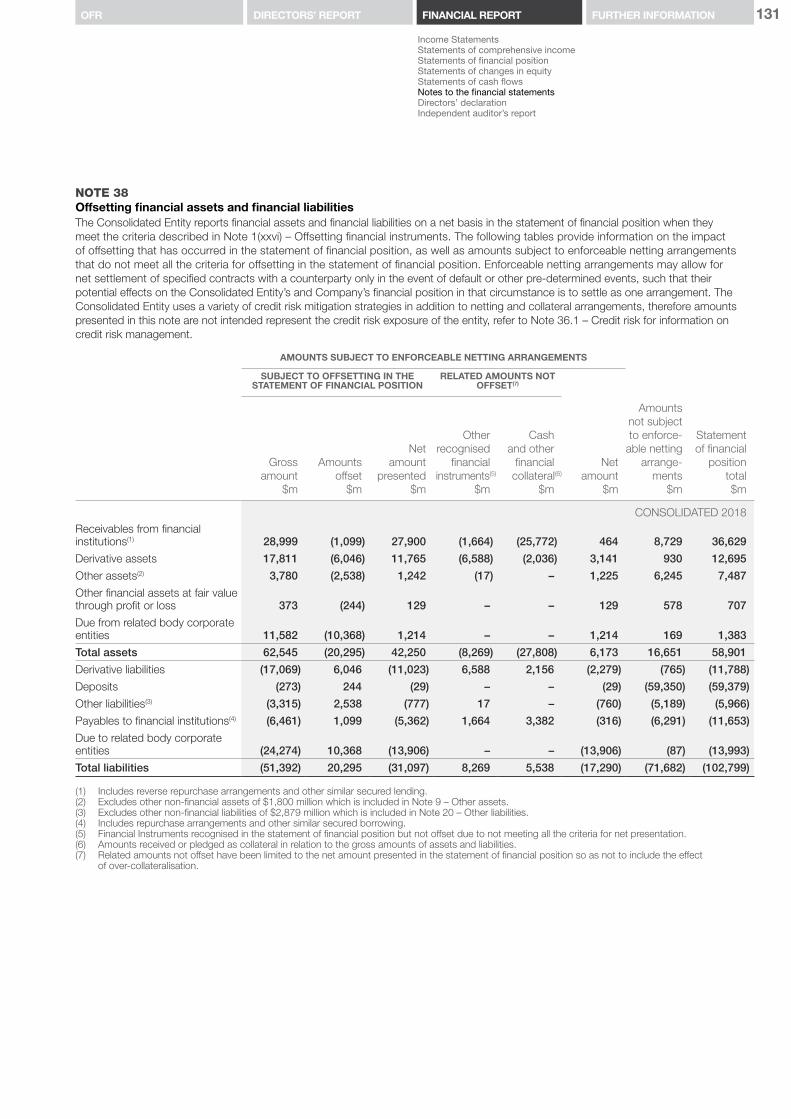
131
Income StatementsStatements of comprehensive incomeStatements of financial positionStatements of changes in equityStatements of cash flowsNotes to the financial statementsDirectors’ declaration Independent auditor’s report
FURTHER INFORMATIONOFR DIRECTORS’ REPORT FINANCIAL REPORT
NOTE 38Offsetting financial assets and financial liabilitiesThe Consolidated Entity reports financial assets and financial liabilities on a net basis in the statement of financial position when they meet the criteria described in Note 1(xxvi) – Offsetting financial instruments. The following tables provide information on the impact of offsetting that has occurred in the statement of financial position, as well as amounts subject to enforceable netting arrangements that do not meet all the criteria for offsetting in the statement of financial position. Enforceable netting arrangements may allow for net settlement of specified contracts with a counterparty only in the event of default or other pre-determined events, such that their potential effects on the Consolidated Entity’s and Company’s financial position in that circumstance is to settle as one arrangement. The Consolidated Entity uses a variety of credit risk mitigation strategies in addition to netting and collateral arrangements, therefore amounts presented in this note are not intended represent the credit risk exposure of the entity, refer to Note 36.1 – Credit risk for information on credit risk management.
AMOUNTS SUBJECT TO ENFORCEABLE NETTING ARRANGEMENTS
SUBJECT TO OFFSETTING IN THE STATEMENT OF FINANCIAL POSITION
RELATED AMOUNTS NOT OFFSET(7)
Grossamount
$m
Amountsoffset
$m
Net amount
presented$m
Otherrecognised
financialinstruments(5)
$m
Cash and other
financial collateral(6)
$m
Net amount
$m
Amountsnot subjectto enforce-
able nettingarrange-
ments$m
Statement of financial
positiontotal$m
CONSOLIDATED 2018Receivables from financial institutions(1) 28,999 (1,099) 27,900 (1,664) (25,772) 464 8,729 36,629
Derivative assets 17,811 (6,046) 11,765 (6,588) (2,036) 3,141 930 12,695
Other assets(2) 3,780 (2,538) 1,242 (17) – 1,225 6,245 7,487
Other financial assets at fair value through profit or loss 373 (244) 129 – – 129 578 707
Due from related body corporate entities 11,582 (10,368) 1,214 – – 1,214 169 1,383
Total assets 62,545 (20,295) 42,250 (8,269) (27,808) 6,173 16,651 58,901
Derivative liabilities (17,069) 6,046 (11,023) 6,588 2,156 (2,279) (765) (11,788)
Deposits (273) 244 (29) – – (29) (59,350) (59,379)
Other liabilities(3) (3,315) 2,538 (777) 17 – (760) (5,189) (5,966)
Payables to financial institutions(4) (6,461) 1,099 (5,362) 1,664 3,382 (316) (6,291) (11,653)
Due to related body corporate entities (24,274) 10,368 (13,906) – – (13,906) (87) (13,993)
Total liabilities (51,392) 20,295 (31,097) 8,269 5,538 (17,290) (71,682) (102,799)
(1) Includes reverse repurchase arrangements and other similar secured lending.(2) Excludes other non-financial assets of $1,800 million which is included in Note 9 – Other assets.(3) Excludes other non-financial liabilities of $2,879 million which is included in Note 20 – Other liabilities.(4) Includes repurchase arrangements and other similar secured borrowing.(5) Financial Instruments recognised in the statement of financial position but not offset due to not meeting all the criteria for net presentation.(6) Amounts received or pledged as collateral in relation to the gross amounts of assets and liabilities.(7) Related amounts not offset have been limited to the net amount presented in the statement of financial position so as not to include the effect
of over-collateralisation.

132 macquarie.com2018 Annual ReportMacquarie Bank Limited and its subsidiaries
NOTES TO THE FINANCIAL STATEMENTS FOR THE FINANCIAL YEAR ENDED 31 MARCH 2018CONTINUED
NOTE 38Offsetting financial assets and financial liabilities continued
AMOUNTS SUBJECT TO ENFORCEABLE NETTING ARRANGEMENTS
SUBJECT TO OFFSETTING IN THE STATEMENT OF FINANCIAL POSITION
RELATED AMOUNTS NOT OFFSET(7)
Grossamount
$m
Amountsoffset
$m
Net amount
presented$m
Otherrecognised
financialinstruments(5)
$m
Cash and other
financial collateral(6)
$m
Net amount
$m
Amountsnot subjectto enforce-
able nettingarrange-
ments$m
Statement of financial
positiontotal$m
CONSOLIDATED 2017Receivables from financial institutions(1) 17,464 – 17,464 (1,069) (16,131) 264 8,101 25,565
Derivative assets 16,859 (5,339) 11,520 (6,651) (2,754) 2,115 547 12,067
Other assets(2) 4,187 (2,328) 1,859 (29) – 1,830 4,794 6,653
Other financial assets at fair value through profit or loss 442 (314) 128 – – 128 632 760
Due from related body corporate entities 10,748 (9,206) 1,542 – – 1,542 191 1,733
Total assets 49,700 (17,187) 32,513 (7,749) (18,885) 5,879 14,265 46,778
Derivative liabilities (15,334) 5,339 (9,995) 6,651 2,343 (1,001) (1,106) (11,101)
Deposits (246) 219 (27) – – (27) (57,655) (57,682)
Other liabilities(3) (4,017) 2,328 (1,689) 29 – (1,660) (5,102) (6,791)
Payables to financial institutions(4) (6,884) – (6,884) 1,069 5,565 (250) (7,352) (14,236)
Other debt issued at fair value through profit or loss (97) 95 (2) – – (2) (1,932) (1,934)
Due to related body corporate entities (16,509) 9,206 (7,303) – – (7,303) (64) (7,367)
Total liabilities (43,087) 17,187 (25,900) 7,749 7,908 (10,243) (73,211) (99,111)
(1) Includes reverse repurchase arrangements and other similar secured lending.(2) Excludes other non-financial assets of $1,993 million which is included in Note 9 – Other assets.(3) Excludes other non-financial liabilities of $2,584 million which is included in Note 20 – Other liabilities.(4) Includes repurchase arrangements and other similar secured borrowing.(5) Financial Instruments recognised in the statement of financial position but not offset due to not meeting all the criteria for net presentation.(6) Amounts received or pledged as collateral in relation to the gross amounts of assets and liabilities.(7) Related amounts not offset have been limited to the net amount presented in the statement of financial position so as not to include the effect
of over-collateralisation.
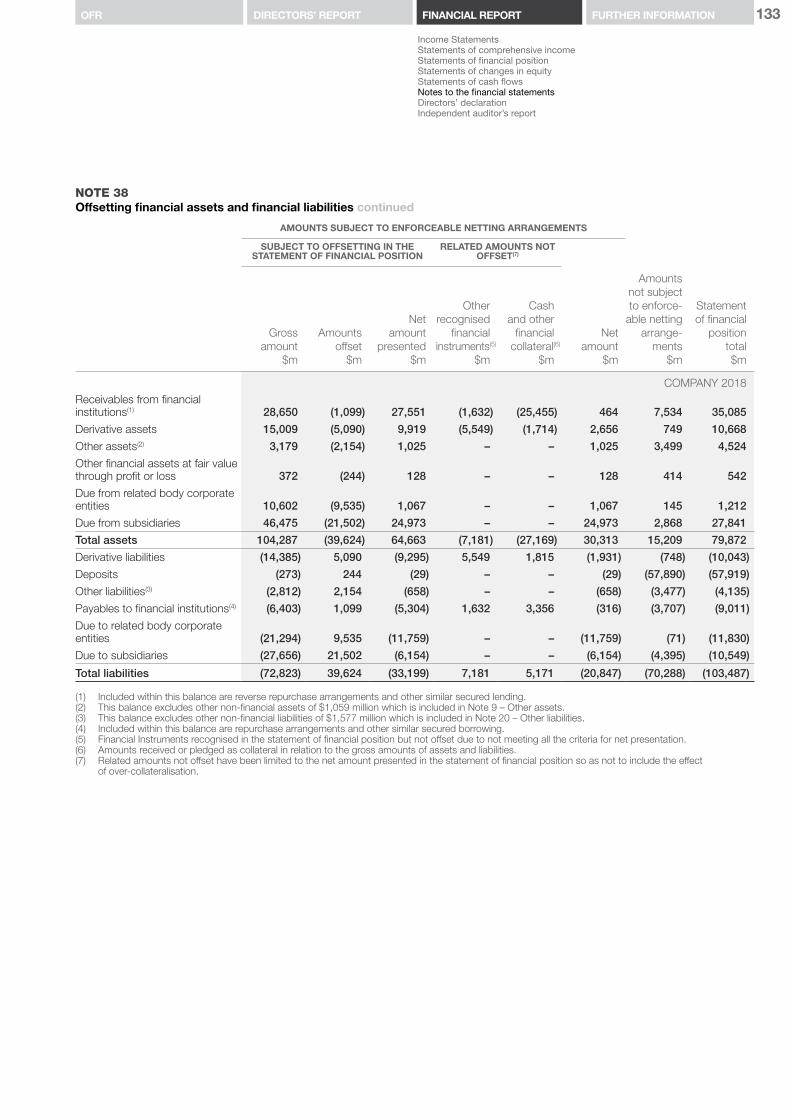
133
Income StatementsStatements of comprehensive incomeStatements of financial positionStatements of changes in equityStatements of cash flowsNotes to the financial statementsDirectors’ declaration Independent auditor’s report
FURTHER INFORMATIONOFR DIRECTORS’ REPORT FINANCIAL REPORT
NOTE 38Offsetting financial assets and financial liabilities continued
AMOUNTS SUBJECT TO ENFORCEABLE NETTING ARRANGEMENTS
SUBJECT TO OFFSETTING IN THE STATEMENT OF FINANCIAL POSITION
RELATED AMOUNTS NOT OFFSET(7)
Grossamount
$m
Amountsoffset
$m
Net amount
presented$m
Otherrecognised
financialinstruments(5)
$m
Cash and other
financial collateral(6)
$m
Net amount
$m
Amountsnot subjectto enforce-
able nettingarrange-
ments$m
Statement of financial
positiontotal$m
COMPANY 2018Receivables from financial institutions(1) 28,650 (1,099) 27,551 (1,632) (25,455) 464 7,534 35,085
Derivative assets 15,009 (5,090) 9,919 (5,549) (1,714) 2,656 749 10,668
Other assets(2) 3,179 (2,154) 1,025 – – 1,025 3,499 4,524
Other financial assets at fair value through profit or loss 372 (244) 128 – – 128 414 542
Due from related body corporate entities 10,602 (9,535) 1,067 – – 1,067 145 1,212
Due from subsidiaries 46,475 (21,502) 24,973 – – 24,973 2,868 27,841
Total assets 104,287 (39,624) 64,663 (7,181) (27,169) 30,313 15,209 79,872
Derivative liabilities (14,385) 5,090 (9,295) 5,549 1,815 (1,931) (748) (10,043)
Deposits (273) 244 (29) – – (29) (57,890) (57,919)
Other liabilities(3) (2,812) 2,154 (658) – – (658) (3,477) (4,135)
Payables to financial institutions(4) (6,403) 1,099 (5,304) 1,632 3,356 (316) (3,707) (9,011)
Due to related body corporate entities (21,294) 9,535 (11,759) – – (11,759) (71) (11,830)
Due to subsidiaries (27,656) 21,502 (6,154) – – (6,154) (4,395) (10,549)
Total liabilities (72,823) 39,624 (33,199) 7,181 5,171 (20,847) (70,288) (103,487)
(1) Included within this balance are reverse repurchase arrangements and other similar secured lending.(2) This balance excludes other non-financial assets of $1,059 million which is included in Note 9 – Other assets.(3) This balance excludes other non-financial liabilities of $1,577 million which is included in Note 20 – Other liabilities.(4) Included within this balance are repurchase arrangements and other similar secured borrowing.(5) Financial Instruments recognised in the statement of financial position but not offset due to not meeting all the criteria for net presentation.(6) Amounts received or pledged as collateral in relation to the gross amounts of assets and liabilities.(7) Related amounts not offset have been limited to the net amount presented in the statement of financial position so as not to include the effect
of over-collateralisation.

134 macquarie.com2018 Annual ReportMacquarie Bank Limited and its subsidiaries
NOTES TO THE FINANCIAL STATEMENTS FOR THE FINANCIAL YEAR ENDED 31 MARCH 2018CONTINUED
NOTE 38Offsetting financial assets and financial liabilities continued
AMOUNTS SUBJECT TO ENFORCEABLE NETTING ARRANGEMENTS
SUBJECT TO OFFSETTING IN THE STATEMENT OF FINANCIAL POSITION
RELATED AMOUNTS NOT OFFSET(7)
Grossamount
$m
Amountsoffset
$m
Net amount
presented$m
Otherrecognised
financialinstruments(5)
$m
Cash and other
financial collateral(6)
$m
Net amount
$m
Amountsnot subjectto enforce-
able nettingarrange-
ments$m
Statement of financial
positiontotal$m
COMPANY 2017
Receivables from financial institutions(1) 17,249 – 17,249 (1,057) (15,928) 264 6,658 23,907
Derivative assets 15,138 (4,792) 10,346 (5,972) (2,472) 1,902 442 10,788
Other assets(2) 3,756 (2,116) 1,640 – – 1,640 2,858 4,498
Other financial assets at fair value through profit or loss 346 (219) 127 – – 127 467 594
Due from related body corporate entities 9,709 (8,354) 1,355 – – 1,355 180 1,535
Due from subsidiaries 45,233 (17,222) 28,011 – – 28,011 3,060 31,071
Total assets 91,431 (32,703) 58,728 (7,029) (18,400) 33,299 13,665 72,393
Derivative liabilities (13,721) 4,792 (8,929) 5,972 2,103 (854) (1,351) (10,280)
Deposits (246) 219 (27) – – (27) (56,271) (56,298)
Other liabilities(3) (3,565) 2,116 (1,449) – – (1,449) (3,407) (4,856)
Payables to financial institutions(4) (6,831) – (6,831) 1,057 5,526 (248) (4,381) (11,212)
Due to related body corporate entities (14,263) 8,354 (5,909) – – (5,909) (50) (5,959)
Due to subsidiaries (28,240) 17,222 (11,018) – – (11,018) (6,462) (17,480)
Total liabilities (66,866) 32,703 (34,163) 7,029 7,629 (19,505) (71,922) (106,085)
(1) Included within this balance are reverse repurchase arrangements and other similar secured lending.(2) This balance excludes other non-financial assets of $681 million which is included in Note 9 – Other assets.(3) This balance excludes other non-financial liabilities of $1,360 million which is included in Note 20 – Other liabilities.(4) Included within this balance are repurchase arrangements and other similar secured borrowing.(5) Financial Instruments recognised in the statement of financial position but not offset due to not meeting all the criteria for net presentation.(6) Amounts received or pledged as collateral in relation to the gross amounts of assets and liabilities.(7) Related amounts not offset have been limited to the net amount presented in the statement of financial position so as not to include the effect
of over-collateralisation.

135
Income StatementsStatements of comprehensive incomeStatements of financial positionStatements of changes in equityStatements of cash flowsNotes to the financial statementsDirectors’ declaration Independent auditor’s report
FURTHER INFORMATIONOFR DIRECTORS’ REPORT FINANCIAL REPORT
NOTE 39Transfers of financial assetsThe Consolidated Entity may enter into transactions in the normal course of business that transfer financial assets recognised in the statement of financial position to other entities. Depending on the criteria discussed in Note 1 (ix) – Recognition and derecognition of financial assets and financial liabilities the Consolidated Entity may be unable to derecognise the transferred asset, be able to derecognise the transferred assets in full or continue to recognise the asset to the extent of continuing involvement.
Transferred financial assets that are derecognisedWhen financial assets are derecognised, some continuing involvement may be retained in the assets through liquidity support, financial guarantees, certain derivatives or certain securitisation interests. For the financial years ending 31 March 2018 and 31 March 2017, there were no material transfers of financial assets where the Consolidated Entity or Company retained continuing involvement in the transferred asset.
Transferred financial assets that are not derecognisedThe Consolidated Entity and the Company did not recognise financial assets only to the extent of continuing involvement in the years ending 31 March 2018 and 31 March 2017. The following transactions typically result in the transferred assets continuing to be recognised in full.
Repurchase and securities lending agreementsSecurities sold under agreement to repurchase and securities subject to lending agreements continue to be recognised in the statement of financial position and an associated liability is recognised for the consideration received. In certain arrangements, the securities transferred cannot otherwise be pledged or sold, however the assets may be substituted if the collateral is maintained.
Asset swapsFinancial assets sold, while concurrently entering into an asset swap with the counterparty, continue to be recognised along with an associated liability for the consideration received. The Consolidated Entity and Company do not have legal rights to these assets but have full economic exposure to them. The transferred assets cannot otherwise be pledged or sold.
Interests in securitisationsFinancial assets (principally mortgage loans and finance lease receivables) are packaged and securities issued to investors. Securitisation vehicles used to achieve this purpose are consolidated when the rights to the residual income of the vehicles, after all payments to investors and costs of the program have been met, is retained. When the Company is entitled to any residual income of a securitisation vehicle, the Company continues to recognise the financial assets. The transferred assets cannot otherwise be pledged or sold
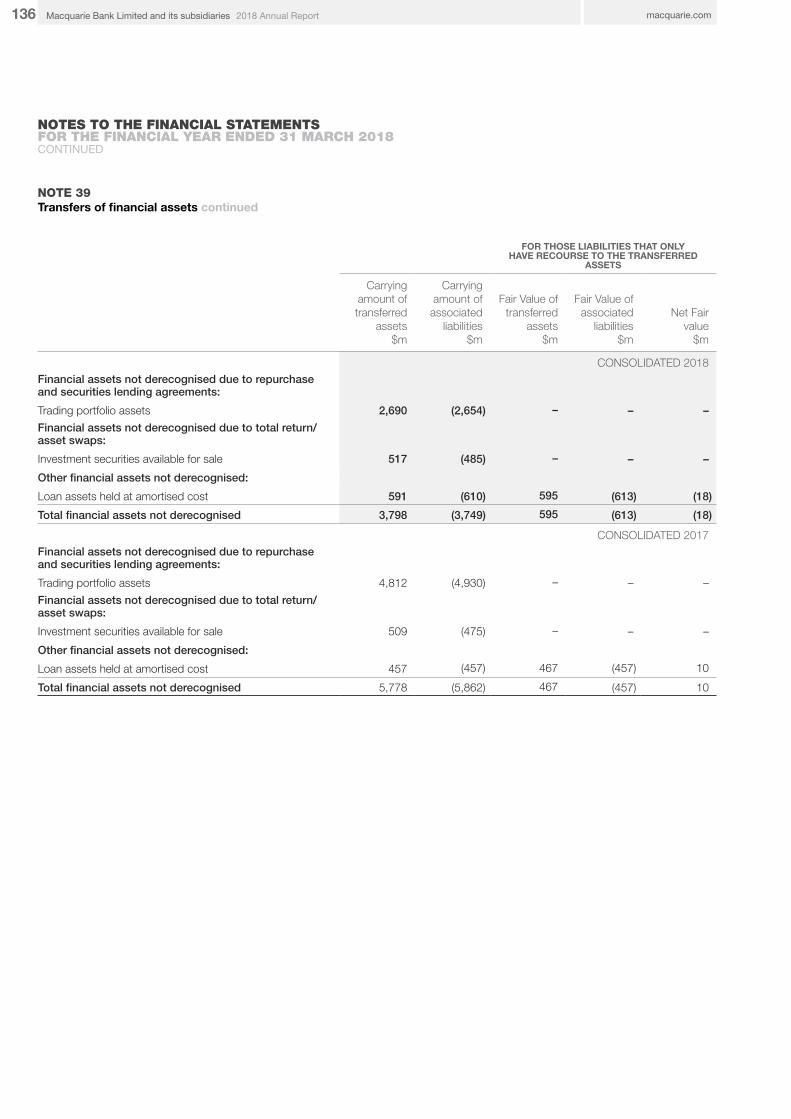
136 macquarie.com2018 Annual ReportMacquarie Bank Limited and its subsidiaries
NOTES TO THE FINANCIAL STATEMENTS FOR THE FINANCIAL YEAR ENDED 31 MARCH 2018CONTINUED
NOTE 39Transfers of financial assets continued
FOR THOSE LIABILITIES THAT ONLY HAVE RECOURSE TO THE TRANSFERRED
ASSETS
Carryingamount oftransferred
assets$m
Carrying amount of
associatedliabilities
$m
Fair Value oftransferred
assets$m
Fair Value ofassociated
liabilities$m
Net Fair value
$m
CONSOLIDATED 2018Financial assets not derecognised due to repurchase and securities lending agreements:
Trading portfolio assets 2,690 (2,654) – – –
Financial assets not derecognised due to total return/asset swaps:
Investment securities available for sale 517 (485) – – –
Other financial assets not derecognised:
Loan assets held at amortised cost 591 (610) 595 (613) (18)
Total financial assets not derecognised 3,798 (3,749) 595 (613) (18)
CONSOLIDATED 2017Financial assets not derecognised due to repurchase and securities lending agreements:
Trading portfolio assets 4,812 (4,930) – – –
Financial assets not derecognised due to total return/asset swaps:
Investment securities available for sale 509 (475) – – –
Other financial assets not derecognised:
Loan assets held at amortised cost 457 (457) 467 (457) 10
Total financial assets not derecognised 5,778 (5,862) 467 (457) 10

137
Income StatementsStatements of comprehensive incomeStatements of financial positionStatements of changes in equityStatements of cash flowsNotes to the financial statementsDirectors’ declaration Independent auditor’s report
FURTHER INFORMATIONOFR DIRECTORS’ REPORT FINANCIAL REPORT
NOTE 39Transfers of financial assets continuedThe following table presents information about transfers of financial assets recognised by the Company as at 31 March 2018 and 31 March 2017:
FOR THOSE LIABILITIES THAT ONLY HAVE RECOURSE TO THE TRANSFERRED
ASSETS
Carryingamount oftransferred
assets$m
Carrying amount of
associatedliabilities
$m
Fair Value oftransferred
assets$m
Fair Value ofassociated
liabilities$m
Net Fair value
$m
COMPANY 2018Financial assets not derecognised due to repurchase and securities lending agreements:
Trading portfolio assets 2,690 (2,654) – – –
Financial assets not derecognised due to total return/asset swaps:
Investment securities available for sale 517 (485) – – –
Financial assets not derecognised due to securitisation:
Loan assets held at amortised cost 4,593 (4,593) 4,593 (4,600) (7)
Total financial assets not derecognised 7,800 (7,732) 4,593 (4,600) (7)
COMPANY 2017Financial assets not derecognised due to repurchase and securities lending agreements:
Trading portfolio assets 4,812 (4,930) – – –
Financial assets not derecognised due to total return/asset swaps:
Investment securities available for sale 509 (475) – – –
Financial assets not derecognised due to other:
Loan assets held at amortised cost 241 (241) 241 (241) –
Financial assets not derecognised due to securitisation:
Loan assets held at amortised cost(1) 7,136 (7,136) 7,136 (7,112) 24
Total financial assets not derecognised 12,698 (12,782) 7,377 (7,353) 24
(1) Excludes $15,899 million (2017: $16,950 million) of securitised assets where the Company holds all of the notes issued from trusts.

138 macquarie.com2018 Annual ReportMacquarie Bank Limited and its subsidiaries
NOTES TO THE FINANCIAL STATEMENTS FOR THE FINANCIAL YEAR ENDED 31 MARCH 2018CONTINUED
NOTE 40Audit and other services provided by PricewaterhouseCoopersDuring the financial year, the auditor of the Consolidated Entity and the Company, PwC, and its network firms earned the following remuneration:
CONSOLIDATED COMPANY
2018$’000
2017 $’000
2018$’000
2017 $’000
PwC – Australia
Audit of the Group and controlled entities 8,781 7,659 7,597 6,627
Other assurance services(1) 3,658 2,729 713 1,060
Advisory services 214 32 – –
Taxation 11 168 – –
Total non-audit services 3,883 2,929 713 1,060
Total remuneration paid to PwC Australia 12,664 10,588 8,310 7,687
Network firms of PwC Australia
Audit of the Group and controlled entities 8,180 9,342 2,070 2,364
Other assurance services(1) 299 161 – –
Advisory services 604 268 – –
Taxation 682 1,293 – –
Total non-audit services 1,585 1,722 – –
Total remuneration paid to network firms of PwC Australia 9,765 11,064 2,070 2,364
Total Audit Services remuneration paid to PwC 16,961 17,001 9,667 8,991
Total Non-Audit Services remuneration paid to PwC 5,468 4,651 713 1,060
Total remuneration paid to PwC (Note 2) 22,429 21,652 10,380 10,051
(1) Other assurance services consist of engagements in relation to an audit that are not the direct audit or review of financial reports. These services include regulatory compliance, accounting advice, comfort letters on debt issuance programs, certifications, due diligence and reviews of controls and other agreed upon procedures.
Use of PwC’s services for engagements other than audit and assurance is restricted in accordance with the Company’s Auditor Independence Policy. It is the Consolidated Entity’s policy to seek competitive tenders for all major advisory projects.
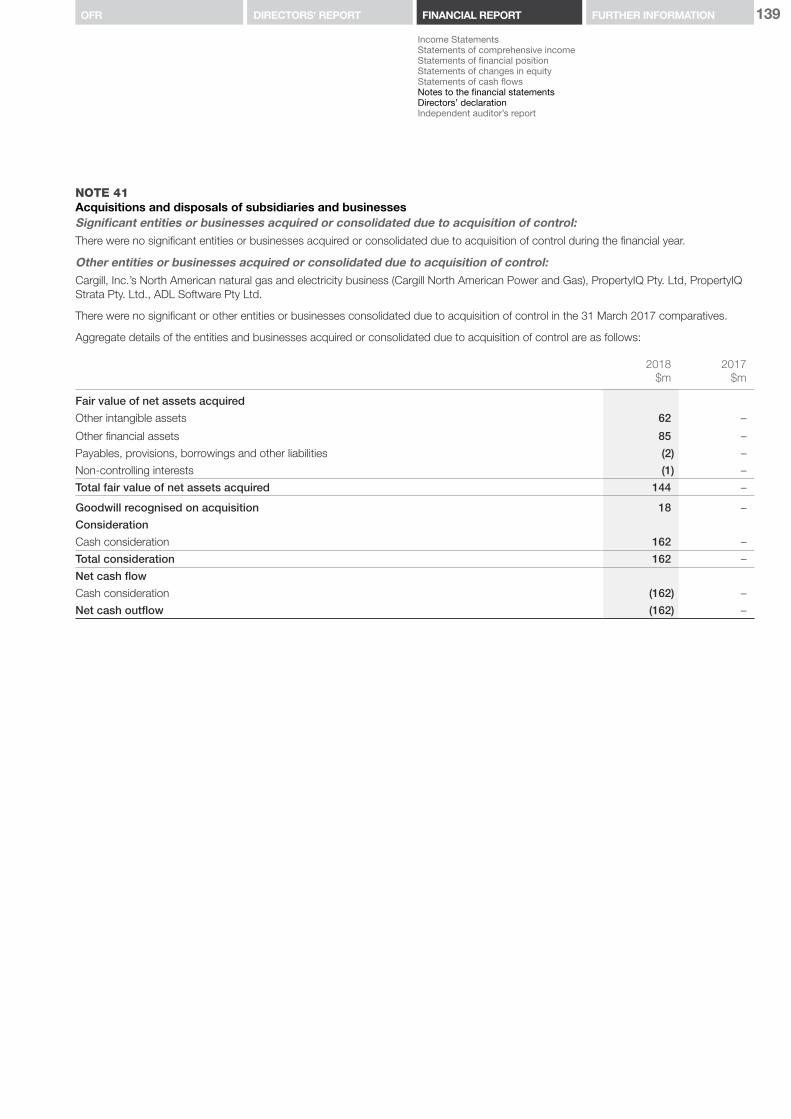
139FURTHER INFORMATIONOFR DIRECTORS’ REPORT FINANCIAL REPORT
Income StatementsStatements of comprehensive incomeStatements of financial positionStatements of changes in equityStatements of cash flowsNotes to the financial statementsDirectors’ declaration Independent auditor’s report
NOTE 41Acquisitions and disposals of subsidiaries and businessesSignificant entities or businesses acquired or consolidated due to acquisition of control:There were no significant entities or businesses acquired or consolidated due to acquisition of control during the financial year.
Other entities or businesses acquired or consolidated due to acquisition of control:Cargill, Inc.’s North American natural gas and electricity business (Cargill North American Power and Gas), PropertyIQ Pty. Ltd, PropertyIQ Strata Pty. Ltd., ADL Software Pty Ltd.
There were no significant or other entities or businesses consolidated due to acquisition of control in the 31 March 2017 comparatives.
Aggregate details of the entities and businesses acquired or consolidated due to acquisition of control are as follows:
2018$m
2017$m
Fair value of net assets acquired
Other intangible assets 62 –
Other financial assets 85 –
Payables, provisions, borrowings and other liabilities (2) –
Non-controlling interests (1) –
Total fair value of net assets acquired 144 –
Goodwill recognised on acquisition 18 –
Consideration
Cash consideration 162 –
Total consideration 162 –
Net cash flow
Cash consideration (162) –
Net cash outflow (162) –

140 macquarie.com2018 Annual ReportMacquarie Bank Limited and its subsidiaries
NOTES TO THE FINANCIAL STATEMENTS FOR THE FINANCIAL YEAR ENDED 31 MARCH 2018CONTINUED
NOTE 41Acquisitions and disposals of subsidiaries and businesses continuedSignificant entities or businesses disposed of or deconsolidated due to loss of control:There were no significant entities or businesses disposed of or deconsolidated due to loss of control during the financial year.
Other entities or businesses disposed of or deconsolidated due to loss of control:Advantage Funding Management Co. Inc., Levantera Development Limited and Macquarie Financial Ltd.
During the financial year ended 31 March 2017, other entities or businesses disposed of or deconsolidated due to loss of control were:
Macquarie Life’s risk insurance business, International Life Solutions Proprietary Limited and US Mortgages
Aggregate details of the entities or businesses disposed of or deconsolidated are as follows:
2018$m
2017$m
Carrying value of assets and liabilities disposed of or deconsolidated
Receivables from financial institutions 48 36
Property, plant and equipment 66 –
Other assets 31 131
Other financial assets 1,003 504
Payables, provisions, borrowings and other liabilities (751) (126)
Total carrying value of net assets disposed of or deconsolidated 397 545
Consideration
Cash consideration (net of cost of disposal) 116 768
Consideration receivable 351 1
Total consideration 467 769
Direct costs relating to disposal (2) (21)
Net cash flow
Cash consideration 116 768
Less: Cash and cash equivalents disposed of or deconsolidated (48) (36)
Cash outflow on direct costs related to disposal – (10)
Net cash inflow 68 722
NOTE 42Events after the reporting dateThere were no material events subsequent to 31 March 2018 that have not been reflected in the financial statements.
141
Income StatementsStatements of comprehensive incomeStatements of financial positionStatements of changes in equityStatements of cash flowsNotes to the financial statementsDirectors’ declaration Independent auditor’s report
FURTHER INFORMATIONOFR DIRECTORS’ REPORT FINANCIAL REPORT
In the Directors’ opinion:
a) the financial statements and notes set out on pages 42 to 140 are in accordance with the Corporations Act 2001 (Cth), including:(i) complying with the Australian accounting standards, and
(ii) giving a true and fair view of the Company’s and the Consolidated Entity’s financial positions as at 31 March 2018 and their performance for the financial year ended on that date, and
b) there are reasonable grounds to believe that the Company will be able to pay its debts as and when they become due and payable.
Note 1(i) includes a statement that the financial report complies with International Financial Reporting Standards.
The Directors have been given the declarations by the CEO and CFO required by section 295A of the Corporations Act 2001 (Cth).
This declaration is made in accordance with a resolution of the Directors.
Peter WarneIndependent Director and Chairman
Mary ReemstManaging Director and Chief Executive Officer
Sydney
4 May 2018
MACQUARIE BANK LIMITEDDIRECTORS’ DECLARATION
142 macquarie.com2018 Annual ReportMacquarie Bank Limited and its subsidiaries
INDEPENDENT AUDITOR’S REPORTTO THE MEMBERS OF MACQUARIE BANK LIMITED
REPORT ON THE AUDIT OF THE FINANCIAL REPORTOur opinionIn our opinion:
The accompanying financial report of Macquarie Bank Limited (the Bank) and its controlled entities (together the Consolidated Entity) is in accordance with the Corporations Act 2001 (Cth), including:
(a) giving a true and fair view of the Bank’s and the Consolidated Entity’s financial position as at 31 March 2018 and of their financial performance for the year then ended; and
(b) complying with Australian Accounting Standards and the Corporations Regulations 2001 (Cth).
What we have auditedMacquarie Bank Limited financial report comprises:
– the Bank and the Consolidated Entity statements of financial position as at 31 March 2018
– the Bank and the Consolidated Entity income statements for the year then ended
– the Bank and the Consolidated Entity statements of comprehensive income for the year then ended
– the Bank and the Consolidated Entity statements of changes in equity for the year then ended
– the Bank and the Consolidated Entity statements of cash flows for the year then ended
– the notes to the financial statements, which include a summary of significant accounting policies, and
– the directors’ declaration.
Basis for opinionWe conducted our audit in accordance with Australian Auditing Standards. Our responsibilities under those standards are further described in the Auditor’s responsibilities for the audit of the financial report section of our report.
We believe that the audit evidence we have obtained is sufficient and appropriate to provide a basis for our opinion.
IndependenceWe are independent of the Consolidated Entity in accordance with the auditor independence requirements of the Corporations Act 2001 (Cth) and the ethical requirements of the Accounting Professional and Ethical Standards Board’s APES 110 Code of Ethics for Professional Accountants (the Code) that are relevant to our audit of the financial report in Australia. We have also fulfilled our other ethical responsibilities in accordance with the Code.
Our audit approachAn audit is designed to provide reasonable assurance about whether the financial report is free from material misstatement. Misstatements may arise due to fraud or error. They are considered material if individually or in aggregate, they could reasonably be expected to influence the economic decisions of users taken on the basis of the financial report.
The Consolidated Entity is structured into four global operating groups and a corporate segment. The Consolidated Entity has operations in multiple overseas locations, including sites in Gurugram, Jacksonville and Manila which undertake operational activities that are important to the financial reporting processes. The Consolidated Entity’s financial report is a consolidation of the four global operating groups and the corporate segment.
We tailored the scope of our audit to ensure that we performed enough work to be able to give an opinion on the financial report as a whole, taking into account the geographic and management
structure of the Consolidated Entity, its accounting processes and controls and the industry in which it operates.
Consolidated Entity materialityFor the purpose of our Consolidated Entity audit we used overall materiality of $105 million, which represents approximately 1% of the Consolidated Entity’s net assets. We applied this threshold, together with qualitative considerations, to determine the scope of our audit and the nature, timing and extent of our audit procedures and to evaluate the effect of misstatements on the financial report as a whole.
We chose net assets as the benchmark and, in our view, as the Consolidated Entity is a wholly owned subsidiary with listed debt, net assets represents an important benchmark against which the performance of the Consolidated Entity is measured by relevant stakeholders. We selected 1% based on our professional judgement, noting it is within the range of commonly accepted thresholds.
Consolidated Entity audit scopeOur overall approach to setting our audit scope was to focus our audit in areas where we identified a higher risk of material misstatement to the financial report, including areas where the directors made subjective judgements; for example, significant accounting estimates involving assumptions and inherently uncertain future events. To conduct this risk assessment, we considered the inherent risks facing the Consolidated Entity, including those arising from its respective business operations, and how the Consolidated Entity manages these risks. We also considered a number of other factors including the design and implementation of the Consolidated Entity’s control environment relevant to the audit, the appropriateness of the use of the going concern basis of accounting in the preparation of the financial report and the risk of management override of key controls.
We aligned our audit to the Consolidated Entity’s structure by instructing a component audit team for each of the four global operating groups and the corporate segment. These component audit teams established an audit strategy tailored for each operating group and the corporate segment, in consultation with the group audit team.
Given the extent of the overseas operations of the Consolidated Entity, the component audit teams instructed a number of other PwC firms in overseas locations to perform audit procedures ranging from an audit of financial information to specified risk focussed audit procedures. The group audit team determined the level of supervision and direction it needed to have over the audit work performed by the component audit teams, including over the component audit teams’ review and supervision of the overseas audit teams they, in turn, instructed. As part of the overall
143FURTHER INFORMATIONOFR DIRECTORS’ REPORT FINANCIAL REPORT
Income StatementsStatements of comprehensive incomeStatements of financial positionStatements of changes in equityStatements of cash flowsNotes to the financial statementsDirectors’ declaration Independent auditor’s report
supervision of our audit and to develop our understanding of the Consolidated Entity’s global operations, the group audit team or the component audit teams also visited overseas locations, including Geneva, Gurugram, Hong Kong, Houston, Jacksonville, London, Manila, New York, San Francisco, Singapore and Tokyo.
The work performed by the component audit teams and the overseas audit teams, together with additional audit procedures performed by the group audit team such as procedures over the Consolidated Entity’s consolidation and the financial report disclosures, provided us with the information we needed for our opinion on the Consolidated Entity’s financial report as a whole.
Key audit mattersKey audit matters are those matters that, in our professional judgement, were of most significance in our audit of the financial report for the current period. We have communicated the key audit matters to the Board Audit Committee. The key audit matters were addressed in the context of our audit of the financial report as a whole, and in forming our opinion thereon, and we do not provide a separate opinion on these matters. Further, any commentary on the outcomes of a particular audit procedure is made in that context. The key audit matters identified below relate to both the Bank and the Consolidated Entity audits conducted.
Key audit matter How our audit addressed the key audit matter
Provisions for loan losses Refer to Note 10
The Consolidated Entity holds both specific and collective impairment provisions over loan assets. Specific impairment provisions are created when the impairment of an individual loan is recognised. The collective impairment provision is intended to cover losses in the existing overall loan portfolio which have not yet been individually identified.
The identification of loans that are deteriorating and the assessment of the present value of expected future cash flows from the loans in determining specific impairment provisions are inherently uncertain, involving various assumptions and judgments.
In estimating the collective impairment provisions, judgement is required in the design of the models used and the selection of assumptions adopted, such as the estimate of the likelihood of default and the potential loss given default. A management overlay is also included in the overall collective provision to reflect emerging trends or particular situations which are not captured by these models.
Given the extent of judgment involved, we considered this to be a key audit matter.
Our procedures included assessing the design and operating effectiveness of certain controls relating to the timely recognition and measurement of impairments for loan losses.For specific loan loss provisions, we examined a sample of individual loan exposures. We applied judgment in selecting this sample, including consideration of sectors that may pose an increased risk of uncertainty and certain geographic regions of the Australian property market. We also evaluated a sample of loan assets written off or disposed of to assess, with the benefit of hindsight, the Consolidated Entity’s ability to accurately estimate specific loan loss provisions. For the collective provisions, assisted by our experts, we tested on a sample basis:
– the appropriateness of the design and use of the models used by the Consolidated Entity, and
– the appropriateness of the assumptions adopted and data used in the models, by using our knowledge of industry developments and the actual loss experience of the Consolidated Entity.
We also examined and assessed the analysis performed by the Consolidated Entity in determining the management overlay.We assessed the appropriateness of the Consolidated Entity’s disclosure in the financial report.
Valuation of financial assets and liabilities held at fair value Refer to Note 37
The Consolidated Entity exercises judgement in valuing certain assets and liabilities at fair value where there are significant unobservable inputs for the valuation of these assets and liabilities. These assets and liabilities are known as Level 3 financial instruments.For the Consolidated Entity, these Level 3 financial instruments predominantly consist of derivatives and unlisted equity and debt investments. Judgement is required in estimating the fair value of these financial instruments in determining appropriate models, assumptions and inputs.Given the extent of judgement involved in valuing these Level 3 financial instruments, we considered this to be a key audit matter.
Our procedures included assessing the design and testing the operating effectiveness of certain controls relating to Level 3 financial instruments, including controls over:
– approval and validation of the models adopted – accuracy of data feeds and inputs to models – the Consolidated Entity’s process for testing valuations, and – governance and review.
For derivatives, we assessed a sample of valuations by considering the modelling approaches and inputs, assisted by PwC valuation experts. We also considered a sample of collateral disputes, gains and losses on disposals and other events to help assess the appropriateness of the valuations.For a sample of unlisted equity and debt investments, we assessed the appropriateness of the valuation methodologies applied, and assessed the sensitivity of the Consolidated Entity’s valuations to alternative methodologies and assumptions where appropriate. We also evaluated a sample of disposals to assess, with the benefit of hindsight, the Consolidated Entity’s ability to estimate fair values.We assessed the appropriateness of the Consolidated Entity’s disclosure in the financial report.
144 macquarie.com2018 Annual ReportMacquarie Bank Limited and its subsidiaries
INDEPENDENT AUDITOR’S REPORTTO THE MEMBERS OF MACQUARIE BANK LIMITEDCONTINUED
Key audit matter How our audit addressed the key audit matter
Impairment of assets Refer to Note 2 and 13
The Consolidated Entity holds certain assets where the recoverable amount is required to be considered under AASB 136. At year end, the Consolidated Entity considered whether there were any indicators that these assets might be impaired. Where indicators existed, the Consolidated Entity then compared carrying amounts of the relevant assets to the higher of their estimated value-in-use and fair value less costs of disposal in accordance with AASB 136. Value-in-use is the calculation of the net present value of the cash flows expected from the Consolidated Entity’s use of an asset. This calculation requires an estimation of the expected future cash flows associated with the use of an asset and the determination of certain assumptions such as discount rates and growth rates. In respect of its portfolio of aircraft assets, the Consolidated Entity also obtained independent valuation reports for certain aircraft from external appraisers to assist in developing their estimates of the recoverable amounts of these assets.Given the extent of judgement required in respect of impairment of assets we considered this to be a key audit matter.
Our procedures included:
– updating our understanding of prevailing market conditions and factors that could materially affect the fair value and usage of the relevant assets, and considering whether these may represent indicators of impairment.
– evaluating the appropriateness of the impairment assessment methodology and the assumptions applied in the value-in-use calculations, and
– engaging PwC valuation experts where relevant.
In respect of the aircraft assets, our procedures also included:
– assessing the competency, capability and objectivity of external appraisers, as well as the appropriateness of methodologies and assumptions used by the appraisers, and
– comparing the realised value of certain aircraft sold during the year against the carrying value to assess, with the benefit of hindsight, the Consolidated Entity’s ability to accurately make estimates.
We assessed the appropriateness of the Consolidated Entity’s disclosure in the financial report.
IT systems and controls over financial reporting
The Consolidated Entity’s operations and financial reporting systems are heavily dependent on IT systems, including automated accounting procedures and IT dependent manual controls. The Consolidated Entity’s controls over IT systems include:
– the framework of governance over IT systems – controls over program development and changes – access to programs, data and IT operations, and – governance over generic and privileged user accounts.
Given the reliance on the IT systems in the financial reporting process, we considered this to be a key audit matter.
Our procedures included evaluating and testing the design and operating effectiveness of certain controls over the continued integrity of the IT systems that are relevant to financial reporting. We also carried out direct tests, on a sample basis, of system functionality that was key to our audit testing in order to assess the accuracy of certain system calculations, the generation of certain reports and the operation of certain system enforced access controls. When considered appropriate we performed alternative audit procedures on the financial information that was key to our audit testing produced by the IT systems.
Provisions for tax payable and deferred tax liabilities Refer to Note 17 and 20
The Consolidated Entity is subject to taxation in a number of jurisdictions. The assessment of the amounts expected to be paid to tax authorities is considered initially by the Consolidated Entity at a local level and then reviewed centrally, with consideration given to particular tax positions in certain jurisdictions. In some cases, the treatment of tax positions requires judgement to estimate the ultimate amounts of tax that will be paid.Given the extent of judgement involved, we considered this to be a key audit matter.
Our procedures included evaluating the analysis conducted by the Consolidated Entity which sets out the basis for judgements made in respect of the ultimate amounts expected to be paid to tax authorities. Assisted by PwC tax experts, we read a risk focused selection of correspondence with tax authorities and external advice obtained by the Consolidated Entity and used our understanding of the business to assess and challenge the completeness and quantum of the provisions for tax. We independently considered the likelihood of additional tax exposures occurring based on our knowledge of tax legislation, applicable precedent and industry developments, noting the level of judgement involved.We assessed the appropriateness of the Consolidated Entity’s disclosure in the financial report.
145FURTHER INFORMATIONOFR DIRECTORS’ REPORT FINANCIAL REPORT
Income StatementsStatements of comprehensive incomeStatements of financial positionStatements of changes in equityStatements of cash flowsNotes to the financial statementsDirectors’ declaration Independent auditor’s report
Key audit matter How our audit addressed the key audit matter
Disclosure of the impact of AASB 9 Refer to Note 1
On 1 April 2018 the Consolidated Entity transitioned to financial instruments accounting standard AASB 9 which replaced AASB 139. AASB 9 relates to impairment, classification and measurement of financial instruments and hedge accounting. Disclosure has been included in these 31 March 2018 financial statements which is intended to provide users with an understanding of the estimated transition impact of the new standard. As required, further disclosure will be included in the 2019 financial statements.Under the new AASB 9 impairment model, losses are recognised on an Expected Credit Loss (ECL) basis. ECLs are required to incorporate forward-looking information, reflecting the Consolidated Entity’s view of potential future economic environments. The complexity involved required the Consolidated Entity to develop new models involving the use of significant judgements, post model adjustments and a large increase in the data inputs required by these models.Separately, the standard introduces new requirements around the classification and measurement of financial instruments, and the qualifying criteria for hedge accounting.Given this is a new and complex accounting standard which requires considerable judgement, we considered the transition disclosure to be a key audit matter.
Our procedures included assessing the design and testing the operating effectiveness of certain controls supporting the Consolidated Entity’s estimate of the impairment transition adjustment focusing on:
– model development, validation and approval to support compliance with AASB 9 requirements
– review and approval of key assumptions, judgements and forward looking information prior to use in the models
– the integrity of data used as input into the models including the transfer of data between source systems and the models
– review and approval of post model adjustments, and – review and approval of the output of the models and related
transition impacts.
We examined and assessed the ECL models developed by the Consolidated Entity, including using PwC credit modelling experts in our assessment of judgements and assumptions supporting the ECL requirements of AASB 9. We assessed the reasonableness of forward looking information incorporated into the impairment calculations by using PwC experts to challenge the multiple economic scenarios chosen by the Consolidated Entity and the weighting applied to capture non-linear losses. We assessed the post model adjustments in the context of key model and data limitations identified by the Consolidated Entity, considered their rationale and recalculated where necessary.We examined and assessed the controls and judgements relating to the classification and measurement of financial instruments.We also examined the controls and judgements relating to the designation and documentation of the eligible hedging relationships and their prospective hedging effectiveness. We assessed the appropriateness of the Consolidated Entity’s transition disclosure in the financial statements.

146 macquarie.com2018 Annual ReportMacquarie Bank Limited and its subsidiaries
INDEPENDENT AUDITOR’S REPORTTO THE MEMBERS OF MACQUARIE BANK LIMITEDCONTINUED
Other informationThe directors are responsible for the other information. The other information comprises the information included in the Consolidated Entity’s annual report for the year ended 31 March 2018, including the Operating and Financial Review, Directors’ Report, Additional Investor Information and Glossary, but does not include the financial report and our auditor’s report thereon.
Our opinion on the financial report does not cover the other information and accordingly we do not express any form of assurance conclusion thereon.
In connection with our audit of the financial report, our responsibility is to read the other information identified above and, in doing so, consider whether the other information is materially inconsistent with the financial report or our knowledge obtained in the audit, or otherwise appears to be materially misstated.
If, based on the work we have performed, we conclude that there is a material misstatement of this other information, we are required to report that fact. We have nothing to report in this regard.
Responsibilities of the directors for the financial reportThe directors of the Bank are responsible for the preparation of the financial report that gives a true and fair view in accordance with Australian Accounting Standards and Corporations Act 2001 (Cth) and for such internal control as the directors determine is necessary to enable the preparation of the financial report that gives a true and fair view and is free from material misstatement, whether due to fraud or error.
In preparing the financial report, the directors are responsible for assessing the ability of the Consolidated Entity to continue as a going concern, disclosing, as applicable, matters related to going concern and using the going concern basis of accounting unless the directors either intend to liquidate the Consolidated Entity or to cease operations, or have no realistic alternative but to do so.
Auditor’s responsibilities for the audit of the financial reportOur objectives are to obtain reasonable assurance about whether the financial report as a whole is free from material misstatement, whether due to fraud or error, and to issue an auditor’s report that includes our opinion. Reasonable assurance is a high level of assurance, but is not a guarantee that an audit conducted in accordance with the Australian Auditing Standards will always detect a material misstatement when it exists. Misstatements can arise from fraud or error and are considered material if, individually or in the aggregate, they could reasonably be expected to influence the economic decisions of users taken on the basis of the financial report.
A further description of our responsibilities for the audit of the financial report is located at the Auditing and Assurance Standards Board website at: w ww.auasb.gov.au/auditors_responsibilities/ar1.pdf. This description forms part of our audit report.
REPORT ON THE REMUNERATION REPORTOur opinion on the remuneration reportWe have audited the remuneration report included in pages 24 to 40 of the Directors’ Report for the year ended 31 March 2018.
In our opinion, the remuneration report of Macquarie Bank Limited for the year ended 31 March 2018 complies with section 300A of the Corporations Act 2001 (Cth).
ResponsibilitiesThe directors of the Bank are responsible for the preparation and presentation of the remuneration report in accordance with section 300A of the Corporations Act 2001 (Cth). Our responsibility is to express an opinion on the remuneration report, based on our audit conducted in accordance with Australian Auditing Standards.
PricewaterhouseCoopers
K.G. SmithPartner
Sydney
4 May 2018
PricewaterhouseCoopers, ABN 52 780 433 757One International Towers Sydney, Watermans Quay, Barangaroo, GPO BOX 2650, SYDNEY NSW 2001T: +61 2 8266 0000, F: +61 2 8266 9999, w ww.pwc.com.au
Liability limited by a scheme approved under Professional Standards Legislation.

147FURTHER INFORMATION
Additional investor informationGlossary
4FURTHER INFORMATION
OFR DIRECTORS’ REPORT FINANCIAL REPORT

148 macquarie.com2018 Annual ReportMacquarie Bank Limited and its subsidiaries
ADDITIONAL INVESTOR INFORMATION
SHAREHOLDER CALENDAR 2018
Date Event
16 July Payment date for MIS distribution
26 July AGM
24 September Payment date for BCN distribution
30 September Financial half-year end
15 October Payment date for MIS distribution
2 November(1) Half-year result announcement
(1) These dates are subject to change.
2019
Date Event
15 January Payment date for MIS distribution
25 March Payment date for BCN distribution
31 March Financial year end
15 April Payment date for MIS distribution
2018 ANNUAL GENERAL MEETINGMacquarie Bank Limited’s 2018 Annual General Meeting (AGM) will be held in the Auditorium of Macquarie’s Sydney Office, Level 10, 50 Martin Place, Sydney NSW 2000, after the MGL AGM but not before 2:00pm on Thursday 26 July 2018. Details of the business of the meeting will be forwarded to shareholders separately.
DISTRIBUTION DETAILSMacquarie Bank LimitedMBL makes distribution payments twice annually in arrears in respect of the BCN on or about 24 March and September each year.
Macquarie Finance LimitedMFL makes interest payments quarterly in arrears in respect of MIS on or about 15 January, April, July and October each year.
Dates and payment rates are listed at macquarie.com/investors
STOCK EXCHANGE LISTING
Equity or hybrid security
Stock exchange listing
Trading code
Macquarie Income Securities (MIS)
ASX MBLHB
Macquarie Bank Capital Notes (BCN)
ASX MBLPA
Macquarie Additional Capital Securities (MACS)
SGX 6F6B
Macquarie Bank also has debt securities quoted on the London Stock Exchange, Luxembourg Stock Exchange (LuxSE), SIX Swiss Exchange (Switzerland), SGX, Tokyo Stock Exchange and the Taipei Exchange (GreTai Securities Market). Macquarie Bank also has warrants quoted on the LuxSE, SGX, Hong Kong Stock Exchange and the ASX.
SECURITIES ON ISSUEThe following information is correct as at 31 March 2018.
Fully paid ordinary sharesVoting RightsAt meetings of members or classes of members, each member may vote in person or by proxy, attorney or (if the member is a body corporate) corporate representative. On a show of hands, every person present who is a member or a proxy, attorney or corporate representative of a member has one vote and on a poll every member present in person or by proxy, attorney or corporate representative has:
i) one vote for each fully paid share held by the member, and
ii) that proportion of a vote for any partly paid ordinary share held that the amount paid on the partly paid share bears to the total issue price of the share.
Macquarie Income SecuritiesVoting RightsHolders of MIS, as holders of a stapled security that includes a preference share, have the right to vote at any general meeting of members of MBL only in one or more of the following circumstances and in no others:
i) during a period when two consecutive Semi-Annual Dividends (as defined in the preference share terms) due and payable on the preference shares have not been paid in full, and no optional Dividend (as defined in the preference share terms) has been paid
ii) on any proposal to reduce MBL’s share capital
iii) on any resolution to approve the terms of a buy-back agreement
iv) on any proposal that affects the rights attaching to the preference shares
v) on a proposal to wind up MBL
vi) on any proposal for the disposal of the whole of MBL’s property, business and undertaking
vii) during the winding up of MBL.
In these circumstances, holders of MIS have the same rights as to attendance and voting (in respect of each preference share) as those conferred on holders of ordinary shares of MBL.

149FURTHER INFORMATIONOFR DIRECTORS’ REPORT FINANCIAL REPORT
Additional investor informationGlossary
20 largest holders
Registered holderNumber of
MIS held % of MIS
HSBC Custody Nominees (Australia) Limited 506,798 12.67
National Nominees Limited 94,538 2.36
JP Morgan Nominees Australia Limited 90,162 2.25
Navigator Australia Ltd <MLC Investment Sett A/C> 70,965 1.77
Aust Executor Trustees Ltd <DDH Preferred Income Fund> 66,337 1.66
BNP Paribas Noms Pty Ltd <DRP> 65,620 1.64
Nulis Nominees (Australia) Limited <Navigator Mast Plan Sett A/C> 62,071 1.55
IOOF Investment Management Limited <IPS Super A/C> 53,029 1.33
Citicorp Nominees Pty Limited 48,220 1.21
Jilliby Pty Ltd 37,500 0.94
Twenty Second Natro Pty Ltd <Cap Superannuation Fund A/C> 22,500 0.56
Bond Street Custodians Limited <CAJ – D09461 A/C> 20,000 0.50
Australian Executor Trustees Limited <No 1 Account> 15,081 0.38
Netwealth Investments Limited <Super Services A/C> 15,042 0.38
Catholic Church Endowment Society Inc 15,000 0.38
Pullington Investments Pty Ltd 15,000 0.38
Aaron (Qld) Pty Ltd <Aaron Qld A/C> 14,924 0.37
HSBC Custody Nominees (Australia) Limited – A/C 2 12,991 0.32
Beth Maclaren Smallwood Foundation P/L 12,250 0.31
Easn Pty Ltd <Penance A/C> 11,920 0.30
1,249,948 31.25
Spread of shareholdings
RangeNumber of
MIS holders Number of MIS
1 – 1,000 5,070 1,489,195
1,001 – 5,000 494 960,568
5,001 – 10,000 32 236,213
10,001 – 100,000 25 807,226
100,001 securities and over 1 506,798
Total 5,622 4,000,000
There were 7 securityholders (representing 16 MIS) who held less than a marketable parcel.
150 macquarie.com2018 Annual ReportMacquarie Bank Limited and its subsidiaries
MACQUARIE BANK CAPITAL NOTES (BCN)Voting RightsBCN are unsecured, subordinated notes issued by MBL. They are non-cumulative and mandatorily convertible. BCN holders have no voting rights in respect of MBL or MGL.
20 largest holders
Registered holderNumber of BCN held % of BCN
HSBC Custody Nominees (Australia) Limited 203,090 4.73
Navigator Australia Ltd <MLC Investment Sett A/C> 118,387 2.76
Nulis Nominees (Australia) Limited <Navigator Mast Plan Sett A/C> 102,197 2.38
IOOF Investment Management Limited <IPS Super A/C> 83,034 1.93
Netwealth Investments Limited <Wrap Services A/C> 78,322 1.82
Citicorp Nominees Pty Limited 72,376 1.69
JP Morgan Nominees Australia Limited 72,265 1.68
Mutual Trust Pty Ltd 51,935 1.21
Citicorp Nominees Pty Limited <DPSL A/C> 51,157 1.19
National Nominees Limited 43,356 1.01
BNP Paribas Noms Pty Ltd <DRP> 30,626 0.71
Netwealth Investments Limited <Super Services A/C> 29,665 0.69
Federation University Australia 25,826 0.60
Pacific Development Corporation Pty Ltd 22,600 0.53
Pelatron Pty Ltd 22,500 0.52
IOOF Investment Management Limited <IPS IDPS A/C> 21,482 0.50
HSBC Custody Nominees (Australia) Limited – A/C 2 20,177 0.47
VIP Finance Pty Ltd 18,000 0.42
Australian Executor Trustees Limited <No 1 Account> 16,549 0.39
Cremorne Co Pty Ltd <Cremorne Co A/C> 15,000 0.35
Total 1,098,544 25.58
Spread of noteholdings
RangeNumber of
BCN holders Number of BCN
1 – 1,000 6,387 1,959,488
1,001 – 5,000 449 930,910
5,001 – 10,000 32 257,360
10,001 – 100,000 21 722,673
100,001 notes and over 3 423,674
Total 6,892 4,294,105
There were 4 noteholders (representing 8 BCN) who held less than a marketable parcel.
ADDITIONAL INVESTOR INFORMATIONCONTINUED

151FURTHER INFORMATIONOFR DIRECTORS’ REPORT FINANCIAL REPORT
Additional investor informationGlossary
Macquarie Income Preferred Securities (MIPS)Voting RightsUnpaid preference shares were issued by MBL as part of the MIPS issue. MIPS have now been fully redeemed, although the unpaid preference shares remain on issue and are held by Macquarie B.H. Pty Limited, the immediate parent of MBL. While these preference shares remain unpaid, they have no voting rights in respect of meetings of members of MBL. If paid up, these preference shares will have the same voting rights as holders of MIS, except that instead of having a right to vote in situation i) above, they have a right to vote at any general meeting of members of MBL during a period in which a dividend has been declared on the preference shares but the dividend has not been paid in full by the relevant dividend payment date.
Register of holdersMBL issued convertible debentures and 350,000 unpaid preference shares as part of the MIPS. The convertible debentures were fully redeemed on 22 June 2015. The unpaid preference shares are held by Macquarie B.H. Pty Limited. The register in respect of the preference shares is kept at MBL’s principal administrative office at 50 Martin Place, Sydney NSW 2000; telephone number +61 2 8232 3333.
Macquarie Additional Capital Securities (MACS)Voting RightsMACS are unsecured subordinated notes issued by MBL, acting through its London Branch that may be exchanged for MGL ordinary shares in certain limited circumstances. MACS holders have no voting rights in respect of meetings of members of MBL and have no voting rights in respect of meetings of members of MGL in the absence of such an exchange.
Single ShareholderAs at 31 March 2018, the $US250 million of MACS were held by one holder, Cede & Co, as authorised representative for the Depository Trust Company being the common depository for the MACS global security. The Bank of New York Mellon as Registrar keeps the register in respect of MACS.
ENQUIRIESShare RegistryInvestors who wish to enquire about any administrative matter relating to their MIS or BCN securityholding are invited to contact the Share Registry at:
Link Market Services LimitedLevel 12, 680 George Street Sydney NSW 2000 Australia
Telephone: +61 1300 554 096 Email: [email protected] Website: linkmarketservices.com.au
All other enquiries related to a MIS or BCN holding can be directed to:
Investor Relations:Macquarie GroupLevel 6, 50 Martin Place Sydney NSW 2000 Australia
Telephone: +61 2 8232 3333 Email: [email protected] Website: macquarie.com/investors
Macquarie Bank’s Company Secretary, Dennis Leong, can be contacted on the above number and email address.
Website To view the Annual Reports, presentations, distribution
information and other investor information is available at macquarie.com/investors
152 macquarie.com2018 Annual ReportMacquarie Bank Limited and its subsidiaries
Defined term Definition
A
AASB Australian Accounting Standards Board
the Act Corporations Act 2001 (Cth)
ADI authorised deposit-taking institution
AGM Annual General Meeting
AICD Australian Institute of Company Directors
AMA Advanced Measurement Approach
Annual Report MBL’s 2018 Annual Report
ANZ Australia and New Zealand
APRA Australian Prudential Regulation Authority
ASIC Australian Securities & Investments Commission
ASX Australian Securities Exchange or ASX Limited ABN 98 008 624 691 and the market operated by ASX Limited
B
BAC Board Audit Committee
Bank Group MBL and its subsidiaries
BBSW Australian Financial Markets Association’s bank-bill rate published daily on AAP Reuters website. The Australian equivalent of LIBOR, SIBOR, etc
BCN Macquarie Bank Capital Notes
BFS Banking and Financial Services Group
the Board, Macquarie Bank Board
The Board of Voting Directors of Macquarie Bank Limited
BRC MGL’s Board Remuneration Committee
BRiC MGL’s Board Risk Committee
Businesses the areas within the Operating Groups carrying out various operations
C
CAF Corporate and Asset Finance Group
CAGR compound annual growth rate
Central Service Groups
the Central Service Groups consist of RMG, LGL, FMG and COG
CEO Managing Director and Chief Executive Officer
CGM Commodities and Global Markets Group
CFO Chief Financial Officer
COG Corporate Operations Group
the Company, MBL Macquarie Bank Limited ABN 46 008 583 542
Defined term Definition
Comparable Key Management Personnel (Comparable KMP)
Executive KMP who were members of the Executive Committee for the full year in both FY2017 and FY2016
the Consolidated Entity, Macquarie Bank
MBL and its subsidiaries
Corporate head office and central support functions including Group Treasury
CVA credit valuation adjustments
D
Deed Deed of Access, Indemnity, Insurance and Disclosure
Deed Poll Indemnity and Insurance Deed Poll dated 12 September 2007
Directors the Voting Directors of MBL (unless the context indicates otherwise)
Divisions named divisions within the Macquarie Group
DPS Plan Directors’ Profit Share Plan
DSU Deferred Share Unit issued under the MEREP
DVA debit valuation adjustments
E
ECAM Economic Capital Adequacy Model
ECS, Macquarie ECS
Macquarie Exchangeable Capital Securities
EMEA Europe, Middle East and Africa
EPS earnings per share
ESP Macquarie Group Employee Share Plan
Executive Director Macquarie Group’s most senior employees including Group Heads, Division Heads and senior business unit managers
Executive Key Management Personnel (Executive KMP)
Members of the Executive Committee of MBL
Executive Voting Director
an executive Board member
F–H
FIRB Foundation Internal Ratings Based Approach
FMG Financial Management Group
FVA funding value adjustment
GLOSSARY
153FURTHER INFORMATIONOFR DIRECTORS’ REPORT FINANCIAL REPORT
Additional investor informationGlossary
Defined term Definition
I–J
IASB International Accounting Standards Board
ICAAP Internal Capital Adequacy Standards Board
IFRS International Financial Reporting Standards
K
Key Management Personnel (KMP)
all Voting Directors and members of the Executive Committee of MBL
L
LMI lender’s mortgage insurance
LuxSE Luxembourg Stock Exchange
LVRs loan to value ratios
M
Macquarie Bank, the Consolidated Entity
MBL and its subsidiaries
MBL, the Company Macquarie Bank Limited ABN 46 008 583 542
Macquarie Board the Board of Voting Directors of MGL
Macquarie ECS, ECS
Macquarie Exchangeable Capital Securities
MGL ordinary shares, MQG
MGL fully paid ordinary shares
Macquarie Group MGL and its subsidiaries
MACS Macquarie Additional Capital Securities
Malus The discretion of the MGL Board (from 2012) to reduce or eliminate unvested profit share amounts where it determines that an employee’s action or inaction has caused the Macquarie Group significant reputational harm, caused a significant or unexpected financial loss or caused the Macquarie Group to make a material financial restatement
MAM Macquarie Asset Management Group
Management Division Directors and Executive Directors who have management or risk responsibility for a Division or business area
MCN Macquarie Group Capital Notes
MCN2 Macquarie Group Capital Notes 2
MEREP Macquarie Group Employee Retained Equity Plan
Defined term Definition
MFL Macquarie Finance Limited
MFL Note An unsecured debt obligation of MFL, issued to a trustee on behalf of the holders of the MIS
MGL Macquarie Group Limited, ABN 94 122 169 279
MGSA Macquarie Group Services Australia Pty Limited
MIM Macquarie Investment Management
MIPS Macquarie Income Preferred Securities
MIS Macquarie Income Securities
N
NCD negotiable certificates of deposit
NCI non-controlling interests
NED Non-Executive Director
Non-Bank Group MGL, MFHPL and its subsidiaries
NPAT net profit after tax
O
OCI other comprehensive income
OECD Organisation for Economic Co-operation and Development
Operating Groups The Operating Groups consist of MAM, CAF, BFS, CGM and Macquarie Capital
OTC over-the-counter
P–Q
Post-2009 DPS retained directors’ profit share which is deferred to future periods and held as a notional investment in Macquarie managed-fund equity
PSU Performance Share Unit issued under the MEREP
PwC PricewaterhouseCoopers
R
RAS Risk Appetite Statement
RMG Risk Management Group
ROE return on ordinary equity
RSU Restricted Share Unit issued under the MEREP
154 macquarie.com2018 Annual ReportMacquarie Bank Limited and its subsidiaries
Defined term Definition
S
Senior Executive Macquarie Group’s combined Division Director and Executive Director population
Senior Management Members of Macquarie Group’s Executive Committee and Executive Directors who have a significant management or risk responsibility in the organisation
SEs structured entities
SFE Sydney Futures Exchange
SGX Singapore Stock Exchange
Statutory Remuneration
statutory remuneration disclosures are prepared in accordance with Australian Accounting Standards and as disclosed throughout the Remuneration Report
T–U
TSR total shareholder return
V–Z
VaR Value-at-Risk
Voting Directors the Voting Directors of MBL as defined in the MBL Constitution
GLOSSARYCONTINUED

155
Additional investor informationGlossary
FURTHER INFORMATIONOFR DIRECTORS’ REPORT FINANCIAL REPORT
This page has been intentionally left blank.

156 macquarie.com2018 Annual ReportMacquarie Bank Limited and its subsidiaries
This page has been intentionally left blank.

C
Additional investor informationGlossary
FURTHER INFORMATIONOFR DIRECTORS’ REPORT FINANCIAL REPORT
Contact detailsMacquarie Bank Principal Administrative Office
50 Martin Place Sydney NSW 2000 Australia
Tel: +61 2 8232 3333
Registered Office Macquarie Bank Limited
Level 6, 50 Martin Place Sydney NSW 2000 Australia
Tel: +61 2 8232 3333