2018 Annual Report - Continental USA
220
Networking 2018 Annual Report
Transcript of 2018 Annual Report - Continental USA

Networking2018 Annual Report

4
2018 Highlights >
Key Figures >
Overview of the Corporation >

› Sales up to €44.4 billion› Net indebtedness drops to €1.7 billion› Dividend rises to €4.75
Key Figures for the Continental Corporation€ millions 2018 2017 Δ in %
Sales 44,404.4 44,009.5 0.9
EBITDA 6,235.7 6,678.9 –6.6
in % of sales 14.0 15.2
EBIT 4,027.7 4,561.5 –11.7
in % of sales 9.1 10.4
Net income attributable to the shareholders of the parent 2,897.3 2,984.6 –2.9
Basic earnings per share in € 14.49 14.92 –2.9
Diluted earnings per share in € 14.49 14.92 –2.9
Adjusted sales1 44,249.2 43,978.5 0.6
Adjusted operating result (adjusted EBIT)2 4,118.1 4,748.5 –13.3
in % of adjusted sales 9.3 10.8
Free cash flow 1,351.0 1,752.8 –22.9
Net indebtedness 1,661.3 2,047.6 –18.9
Gearing ratio in % 9.1 12.6
Total equity 18,333.3 16,290.3 12.5
Equity ratio in % 45.3 43.5
Number of employees as at December 313 243,226 235,473 3.3
Dividend per share in € 4.754 4.50
Share price at year end5 in € 120.75 225.05 –46.3
Share price at year high5 in € 257.40 228.85
Share price at year low5 in € 119.10 180.70
1 Before changes in the scope of consolidation.2 Before amortization of intangible assets from purchase price allocation (PPA), changes in the scope of consolidation, and special effects.3 Excluding trainees.4 Subject to the approval of the Annual Shareholders’ Meeting on April 26, 2019.5 Price quotations of the Continental share in the Xetra system of Deutsche Börse AG.
2018 Highlights

Key figures for the core business areas
Automotive Group Rubber Group
€ millions 2018 2017 in % 2018 2017 in %
Sales 26,855.8 26,565.4 1.1 17,603.1 17,494.7 0.6
EBITDA 3,177.1 3,296.4 –3.6 3,196.6 3,499.6 –8.7
in % of sales 11.8 12.4 18.2 20.0
EBIT 1,890.4 2,086.8 –9.4 2,278.3 2,593.5 –12.2
in % of sales 7.0 7.9 12.9 14.8
Adjusted sales1 26,840.7 26,546.3 1.1 17,463.0 17,482.7 –0.1
Adjusted operating result (adjusted EBIT)2 1,886.3 2,180.7 –13.5 2,372.8 2,686.6 –11.7
in % of adjusted sales 7.0 8.2 13.6 15.4
1 Before changes in the scope of consolidation.2 Before amortization of intangible assets from purchase price allocation (PPA), changes in the scope of consolidation, and special effects.
Structure of the corporation
Continental CorporationSales: €44.4 billion; Employees: 243,226
Automotive GroupSales: €26.9 billion; Employees: 140,016
Rubber GroupSales: €17.6 billion; Employees: 102,763
Chassis & SafetySales: €9.6 billion
Employees: 49,509
PowertrainSales: €7.7 billion
Employees: 42,601
InteriorSales: €9.7 billion
Employees: 47,906
TiresSales: €11.4 billion
Employees: 55,840
ContiTechSales: €6.3 billion
Employees: 46,923
› Advanced Driver Assistance Systems
› Hydraulic Brake Systems
› Passive Safety & Sensorics
› Vehicle Dynamics
› Engine Systems
› Fuel & Exhaust Management
› Hybrid Electric Vehicle
› Sensors & Actuators
› Transmission
› Body & Security
› Commercial Vehicles & Aftermarket
› Infotainment & Connectivity
› Instrumentation & Driver HMI
› Passenger and Light Truck Tire Original Equipment
› Passenger and Light Truck Tire Replace-ment Business, EMEA
› Passenger and Light Truck Tire Replace-ment Business, The Americas
› Passenger and Light Truck Tire Replace-ment Business, APAC
› Commercial Vehicle Tires
› Two-Wheel Tires
› Air Spring Systems
› Benecke-Hornschuch Surface Group
› Conveyor Belt Group
› Industrial Fluid Solutions
› Mobile Fluid Systems
› Power Transmission Group
› Vibration Control
Overview of the Corporation and Key Figures

“
Dr. Elmar Degenhart Chairman of the Executive Board
Learn more about this and get networked with our online magazine.
mag.continental.com
When people, cultures, partners and systems are linked, sustainable solutions can be found that deliver greater value.
We bring different people and cultures together, creating networks throughout the automotive industry and other sectors. What we learn along the way helps us attain the best-possible results. After all, the systems in the vehicle are becoming ever more connected as well – with each other, with those in other vehicles, and with the infrastructure.
Our network culture mirrors the mobility of tomorrow, enabling us to master complex tasks that no one can master alone.”

15
Key Figures for the Continental Corporation C3
Overview of the Corporation and Key Figures C4
Chairman’s Letter 4
Members of the Executive Board 6
Continental Shares and Bonds 8
Corporate Governance 12 Report of the Supervisory Board 12Corporate Governance Report and Declaration Pursuant to Section 289f of the German Commercial Code (HGB) 16Compliance 21Remuneration Report 22
Glossary of Financial Terms 36 Corporate Profile 38 Structure of the Corporation 38Corporate Strategy 41Corporate Management 43Research and Development 46Combined Corporate Non-FinancialStatement 48 Sustainable Product Portfolio and Quality 48 Workforce Interests and Employees 49 Human Rights and Fair Working Conditions 51 Environment 51 Compliance 52 Purchasing and Responsibility in the Supply Chain 53 Social Responsibility and Commitment 53 Information on Non-Financial Disclosures 54
Economic Report 55 General Conditions 55 Macroeconomic Development 55 Development of Key Customer Sectors 56 Development of Raw Materials Markets 59Earnings, Financial and Net Assets Position 61 Earnings Position 62 Financial Position 68 Net Assets Position 70Automotive Group 74 Development of the Chassis & Safety Division 75 Development of the Powertrain Division 77 Development of the Interior Division 79Rubber Group 82 Development of the Tire Division 83 Development of the ContiTech Division 86
Contents
35
Management Report
C3
To Our Shareholders

16
Continental AG – Short Version in Accordance with HGB 88
Other Information 90 Dependent Company Report 90Additional Disclosures and Notes Pursuant to Section 289a and Section 315a HGB 90 Remuneration of the Executive Board 91 Corporate Governance Declaration Pursuant to Section 289f HGB 92
Report on Risks and Opportunities 93
Risk and Opportunity Management and Internal Control System 93 Material Risks 95 Financial Risks 95 Risks Related to the Markets in which
Continental Operates 96 Risks Related to Continental’s
Business Operations 97 Legal and Environmental Risks 99 Material Opportunities 101 Statement on Overall Risk and Opportunities Situation 102
Report on Expected Developments 103
Future General Conditions 103 Forecast of Macroeconomic Development 103 Forecast for Key Customer Sectors 104 Outlook for the Continental Corporation 105
Statement of the Executive Board 109
Independent Auditor’s Report 110
Consolidated Statement of Income 115
Consolidated Statement of Comprehensive Income 116
Consolidated Statement of Financial Position 117
Consolidated Statement of Cash Flows 119
Consolidated Statement of Changes in Equity 120
Notes to the Consolidated Financial Statements 121 Segment Reporting 121General Information and Accounting Principles 128New Accounting Pronouncements 140Companies Consolidated and Information on Subsidiaries and Investments 144Acquisition and Disposal of Companies and Business Operations 145Notes to the Consolidated Statement of Income 147Notes to the Consolidated Statement of Financial Position 158Other Disclosures 200
208
Further Information
Responsibility Statement by the Company’s Legal Representatives 209
Members of the Executive Board and Their Directorships 210
Members of the Supervisory Board and Their Directorships 211
Ten-Year Review – Corporation 213
Financial Calendar 214
Publication Details 215
108
Consolidated Financial Statements

4
Our 2018 business year was by no means an easy one. The economic environment for all major markets – in China, the U.S.A. and Europe – worsened significantly around the middle of the year. This was due in part to our customers’ lengthy transition to the new WLTP exhaust-gas test procedure, as well as to the U.S. trade conflicts with China and Europe. As a result, global automotive production – which had been expected to grow by two million passenger cars and light commercial vehicles in 2018 – was down by some one million vehicles.
On top of this, there were some challenges of our own making. For example, development costs in our Automotive Group were higher than expected. This was caused by the high order intake over the previous two to three years, which once again reached the record level of around €40 billion in 2018. Additional negative effects resulted from warranty cases as well as start-up costs for new products and plants. In the powertrain area, the changeover to products and systems for hybrid and electric vehicles increased our costs. This led us to lower our sales and earnings expectations once again in August 2018.
In response to weaker markets, we implemented additional measures in 2018 to optimize our production and process costs. We reviewed our planned investments and adjusted our expenses in line with the lower sales. And we strategically realigned the corresponding business areas and implemented personnel changes at the management level.
Against this backdrop, we achieved sound results in 2018, with all members of the global Continental team doing their part to make this possible. On behalf of my colleagues on the Executive Board, I wish to thank all employees.
I would also like to express my special thanks to my colleague José A. Avila, who left the Executive Board as at September 30, 2018. He took on the management of the Powertrain division in 2010 during a very dif ficult business phase, successfully establishing it as one of the world’s leading providers.
We continue to be geared for lasting growth. Our goal for the Automotive Group is to grow 3 to 5 percent faster than the respective markets, now and in the future. Our favorable order intake in 2018 confirms our expectations.
The first half of 2019 has gotten off to a turbulent start because of the persistently difficult market environment. As we look ahead to the second half of the year, we are cautiously optimistic, seeing potential for stabilization and slight upward trends.
Technologically, we are well positioned in the race for the future of mobility. Environmental protection, electric drive systems, automated driving, connectivity and new services for mobility and transportation are fundamental growth areas for us. Our customers will set the course for these technologies of the future in 2019. But to do this, they need strong and reliable partners like us.
Backed by our strong position, we are helping shape the extensive reorganization of our relevant industries. Our order books are well filled, and that is encouraging. So, despite the prevailing uncertainties, we will continue to maintain a high level of investment in profitable growth and in the future of your company.
We prepared for the transformation of our relevant industries early on, which is why we initiated our own transformation years ago. By the beginning of 2020, we will have realigned our organization with this in mind. Our structures will be clearer, simpler and more flexible, while our decision-making channels will be shorter and our processes faster.
Chairman’s Letter
Continental AG 2018 Annual Report > To Our Shareholders > Chairman’s Letter

5
The transformation of our powertrain business into an independent group of legal entities took place as at January 1, 2019. Preparations for a potential partial IPO in the second half of 2019 are on schedule. All of this gives us greater freedom in our business activities.
We are pooling a significant part of our research and development in the future Automotive area. Our goal is to be able to respond to customer demands in a faster, more flexible and more precise manner. We are doing this by developing software modules for similar systems centrally and then using them multiple times. Additional benefits are expected to result from standardized development processes and from the use of similar methods and tools. All in all, we are creating a technological development center to attract talented individuals, now and in the future. We are thus following a uniform roadmap and providing all business areas with globally competitive expertise in the architecture of systems and functions.
In this way, your Continental is underscoring its aspiration to be permanently in the lead when it comes to quality, innovation and financial performance, and to be seen as a pioneering technology company and an attractive and progressive employer.
We have set our sights high. Your global Continental team is extremely motivated. Fully committed and brimming with confidence, we are setting the course in 2019 and 2020 for the lasting success and future viability of your company.
Dr. Elmar Degenhart Chairman of the Executive Board
Continental AG 2018 Annual Report > To Our Shareholders > Chairman’s Letter

6 Continental AG 2018 Annual Report > To Our Shareholders > Members of the Executive Board
Members of the Executive Board
Frank Jourdan
born in 1960 in Groß-Gerau, Germany;
Chassis & Safety Division;
appointed until September 2021
Dr. Ariane Reinhart
born in 1969 in Hamburg, Germany;
Human Relations and Sustainability,
Director of Labor Relations;
appointed until September 2022
Hans-Jürgen Duensing
born in 1958 in Hanover, Germany;
ContiTech Division;
appointed until April 2023

7Continental AG 2018 Annual Report > To Our Shareholders > Members of the Executive Board
Dr. Elmar Degenhart
born in 1959 in Dossenheim, Germany;
Chairman of the Executive Board,
Corporate Communications,
Corporate Quality and Environment,
Continental Business System,
Automotive Central Functions;
appointed until August 2024
Nikolai Setzer
born in 1971 in Groß-Gerau, Germany;
Tire Division,
Corporate Purchasing;
appointed until August 2022
Wolfgang Schäfer
born in 1959 in Hagen, Germany;
Finance, Controlling, Compliance,
Law and IT;
appointed until December 2019
Helmut Matschi
born in 1963 in Viechtach, Germany;
Interior Division;
appointed until August 2022
8 Continental AG 2018 Annual Report To Our Shareholders Continental Shares and Bonds
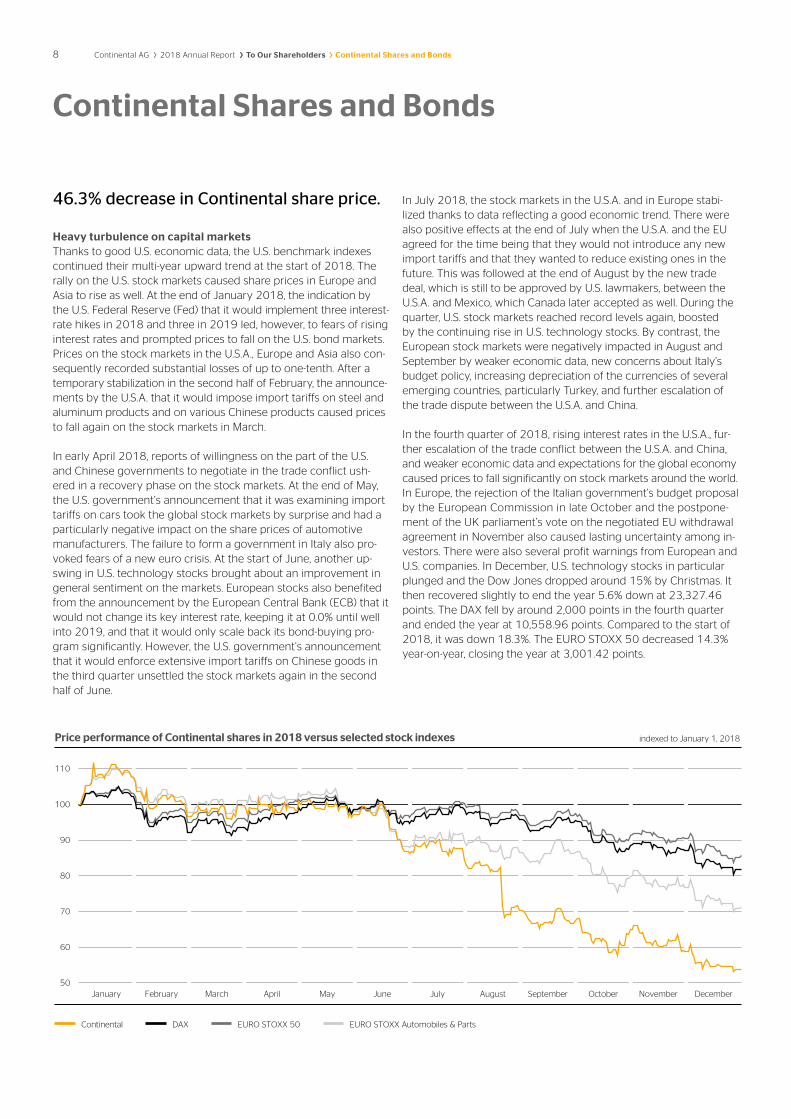
46.3% decrease in Continental share price.
Heavy turbulence on capital markets Thanks to good U.S. economic data, the U.S. benchmark indexes continued their multi-year upward trend at the start of 2018. The rally on the U.S. stock markets caused share prices in Europe and Asia to rise as well. At the end of January 2018, the indication by the U.S. Federal Reserve (Fed) that it would implement three interest-rate hikes in 2018 and three in 2019 led, however, to fears of rising interest rates and prompted prices to fall on the U.S. bond markets. Prices on the stock markets in the U.S.A., Europe and Asia also con-sequently recorded substantial losses of up to one-tenth. After a temporary stabilization in the second half of February, the announce-ments by the U.S.A. that it would impose import tariffs on steel and aluminum products and on various Chinese products caused prices to fall again on the stock markets in March.
In early April 2018, reports of willingness on the part of the U.S. and Chinese governments to negotiate in the trade conflict ush-ered in a recovery phase on the stock markets. At the end of May, the U.S. government’s announcement that it was examining import tariffs on cars took the global stock markets by surprise and had a particularly negative impact on the share prices of automotive manufacturers. The failure to form a government in Italy also pro-voked fears of a new euro crisis. At the start of June, another up-swing in U.S. technology stocks brought about an improvement in general sentiment on the markets. European stocks also benefited from the announcement by the European Central Bank (ECB) that it would not change its key interest rate, keeping it at 0.0% until well into 2019, and that it would only scale back its bond-buying pro-gram significantly. However, the U.S. government’s announcement that it would enforce extensive import tariffs on Chinese goods in the third quarter unsettled the stock markets again in the second half of June.
In July 2018, the stock markets in the U.S.A. and in Europe stabi-lized thanks to data reflecting a good economic trend. There were also positive effects at the end of July when the U.S.A. and the EU agreed for the time being that they would not introduce any new import tariffs and that they wanted to reduce existing ones in the future. This was followed at the end of August by the new trade deal, which is still to be approved by U.S. lawmakers, between the U.S.A. and Mexico, which Canada later accepted as well. During the quarter, U.S. stock markets reached record levels again, boosted by the continuing rise in U.S. technology stocks. By contrast, the European stock markets were negatively impacted in August and September by weaker economic data, new concerns about Italy’s budget policy, increasing depreciation of the currencies of several emerging countries, particularly Turkey, and further escalation of the trade dispute between the U.S.A. and China.
In the fourth quarter of 2018, rising interest rates in the U.S.A., fur-ther escalation of the trade conflict between the U.S.A. and China, and weaker economic data and expectations for the global economy caused prices to fall significantly on stock markets around the world. In Europe, the rejection of the Italian government’s budget proposal by the European Commission in late October and the postpone-ment of the UK parliament’s vote on the negotiated EU withdrawal agreement in November also caused lasting uncertainty among in-vestors. There were also several profit warnings from European and U.S. companies. In December, U.S. technology stocks in particular plunged and the Dow Jones dropped around 15% by Christmas. It then recovered slightly to end the year 5.6% down at 23,327.46 points. The DAX fell by around 2,000 points in the fourth quarter and ended the year at 10,558.96 points. Compared to the start of 2018, it was down 18.3%. The EURO STOXX 50 decreased 14.3% year-on-year, closing the year at 3,001.42 points.
50
60
70
80
90
100
110
ContinentalDAXEURO STOXX 50EURO STOXX Automobiles & Parts
Price performance of Continental shares in 2018 versus selected stock indexes indexed to January 1, 2018
Continental DAX EURO STOXX 50 EURO STOXX Automobiles & Parts
January February March April May June July August September October November December
Continental Shares and Bonds
Continental AG 2018 Annual Report To Our Shareholders Continental Shares and Bonds 9
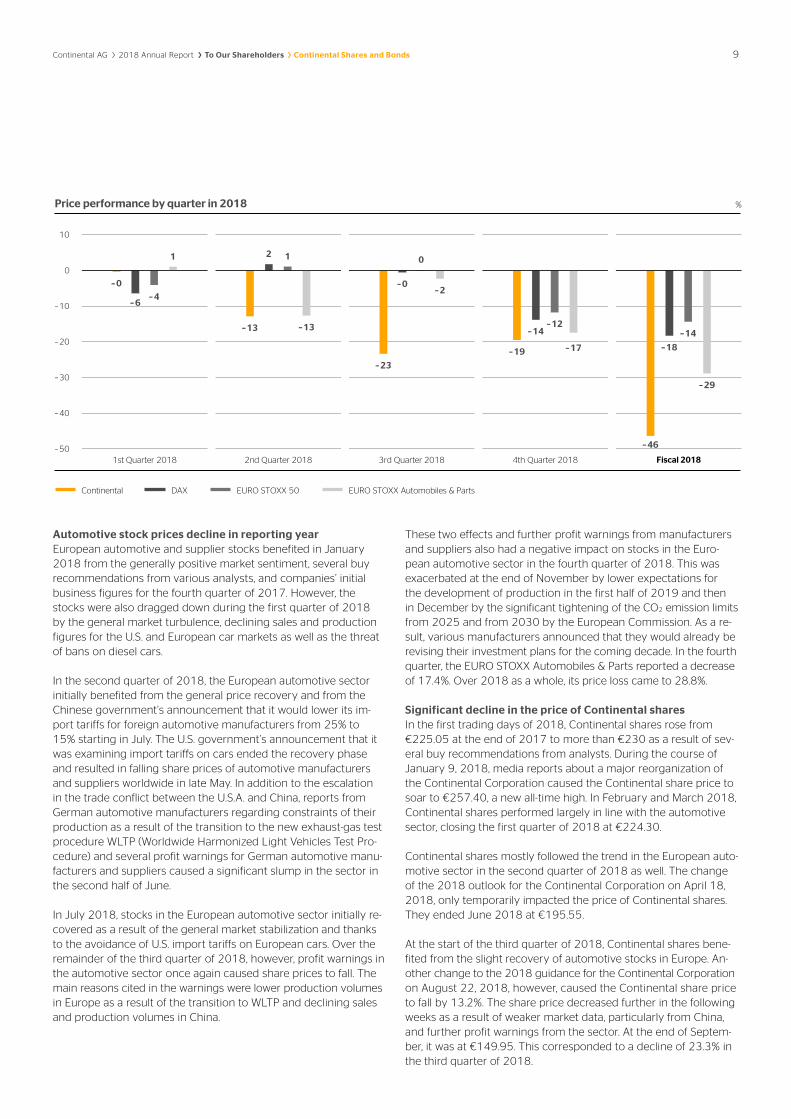
Automotive stock prices decline in reporting year European automotive and supplier stocks benefited in January 2018 from the generally positive market sentiment, several buy recommendations from various analysts, and companies’ initial business figures for the fourth quarter of 2017. However, the stocks were also dragged down during the first quarter of 2018 by the general market turbulence, declining sales and production figures for the U.S. and European car markets as well as the threat of bans on diesel cars.
In the second quarter of 2018, the European automotive sector initially benefited from the general price recovery and from the Chinese government’s announcement that it would lower its im-port tariffs for foreign automotive manufacturers from 25% to 15% starting in July. The U.S. government’s announcement that it was examining import tariffs on cars ended the recovery phase and resulted in falling share prices of automotive manufacturers and suppliers worldwide in late May. In addition to the escalation in the trade conflict between the U.S.A. and China, reports from German automotive manufacturers regarding constraints of their production as a result of the transition to the new exhaust-gas test procedure WLTP (Worldwide Harmonized Light Vehicles Test Pro-cedure) and several profit warnings for German automotive manu-facturers and suppliers caused a significant slump in the sector in the second half of June.
In July 2018, stocks in the European automotive sector initially re-covered as a result of the general market stabilization and thanks to the avoidance of U.S. import tariffs on European cars. Over the remainder of the third quarter of 2018, however, profit warnings in the automotive sector once again caused share prices to fall. The main reasons cited in the warnings were lower production volumes in Europe as a result of the transition to WLTP and declining sales and production volumes in China.
These two effects and further profit warnings from manufacturers and suppliers also had a negative impact on stocks in the Euro-pean automotive sector in the fourth quarter of 2018. This was exacerbated at the end of November by lower expectations for the development of production in the first half of 2019 and then in December by the significant tightening of the CO2 emission limits from 2025 and from 2030 by the European Commission. As a re-sult, various manufacturers announced that they would already be revising their investment plans for the coming decade. In the fourth quarter, the EURO STOXX Automobiles & Parts reported a decrease of 17.4%. Over 2018 as a whole, its price loss came to 28.8%.
Significant decline in the price of Continental shares In the first trading days of 2018, Continental shares rose from €225.05 at the end of 2017 to more than €230 as a result of sev-eral buy recommendations from analysts. During the course of January 9, 2018, media reports about a major reorganization of the Continental Corporation caused the Continental share price to soar to €257.40, a new all-time high. In February and March 2018, Continental shares performed largely in line with the automotive sector, closing the first quarter of 2018 at €224.30.
Continental shares mostly followed the trend in the European auto-motive sector in the second quarter of 2018 as well. The change of the 2018 outlook for the Continental Corporation on April 18, 2018, only temporarily impacted the price of Continental shares. They ended June 2018 at €195.55.
At the start of the third quarter of 2018, Continental shares bene-fited from the slight recovery of automotive stocks in Europe. An-other change to the 2018 guidance for the Continental Corporation on August 22, 2018, however, caused the Continental share price to fall by 13.2%. The share price decreased further in the following weeks as a result of weaker market data, particularly from China, and further profit warnings from the sector. At the end of Septem-ber, it was at €149.95. This corresponded to a decline of 23.3% in the third quarter of 2018.
– 50
– 40
– 30
– 20
– 10
0
10
–0
–13
–23
–19
–46
–6
2
–0
–14
–18
–4
1 0
–12–14
1
–13
–2
–17
–29
ContinentalDAXEURO STOXX 50EURO STOXX Automobiles & Parts
Price performance by quarter in 2018 %
1st Quarter 2018 2nd Quarter 2018 3rd Quarter 2018 4th Quarter 2018 Fiscal 2018
Continental DAX EURO STOXX 50 EURO STOXX Automobiles & Parts

10 Continental AG 2018 Annual Report To Our Shareholders Continental Shares and Bonds
Outstanding bonds as at December 31, 2018
WKN/ISIN Coupon Maturity Volume in € millions
Issue price Price as at
Dec. 31, 2018 Price as at
Dec. 31, 2017
A1Z7C3/DE000A1Z7C39 0,500% February 19, 2019 500.0 99.739% 100.070% 100.776%
A2DARM/XS1529561182 0,000% February 5, 2020 600.0 99.410% 100.041% 100.227%
A1X3B7/XS0969344083 3,125% September 9, 2020 750.0 99.228% 104.985% 108.272%
In the fourth quarter of 2018, Continental shares were negatively impacted by weak market data, further profit warnings from the sector, and concerns about production volumes in 2019. They ended the reporting year down 46.3% at €120.75.
In terms of its share-price performance, Continental was at the bottom end in the annual ranking of the 30 DAX shares in 2018, taking 28th place (PY: 10th place). Allowing for an immediate reinvestment of the dividend distribution of €4.50, Continental shares generated a total return of -45.2% in 2018. In 2018, the DAX achieved a return of -18.3%, the EURO STOXX 50 of -11.4% and the EURO STOXX Automobiles & Parts of -26.5% (including reinvested dividends in each case).
Continental bonds continue at low yield level As in the previous year, Continental bonds persisted at a low yield level in 2018. The fluctuations on the bond markets and the slight rise in interest rates for corporate bonds in Europe over the course of the year had only a marginal impact on the prices of Continental bonds. The 3.125% euro bond maturing on September 9, 2020, was down by 328.7 basis points due to the reduction in its remain-ing maturity.
3.0% euro bond redeemed on July 16, 2018 The price of the 3.0% euro bond of Continental AG, which matured on July 16, 2018, continued to fall toward the 100% mark over its remaining term. The nominal value of €750.0 million was repaid on the maturity date.
Earnings per share reach their second-highest level In the year under review, the net income attributable to the share-holders of the parent fell by 2.9% to €2.90 billion (PY: €2.98 billion). The reason for this was the Continental Corporation’s weaker oper-ating performance. However, a lower tax rate meant that this de-crease was less significant than the decline in the operating result. Earnings per share fell by 2.9% to €14.49 (PY: €14.92) and thus represented Continental AG’s second-highest earnings per share to date after the previous year’s record-breaking figure.
Dividend proposal of €4.75 per share Despite the weaker operating performance, the Executive Board and the Supervisory Board have resolved to propose a dividend distribution of €4.75 per share for the past fiscal year to the Annual Shareholders’ Meeting to be held in Hanover on April 26, 2019. This proposal corresponds to €950.0 million or a dividend payout ratio of 32.8% of net income attributable to the shareholders of the par-ent. Based on the dividend proposal and the annual average Conti-nental share price, this results in a dividend yield of 2.5% for 2018.
A dividend of €4.50 per share was paid for fiscal 2017, amounting to a total payout of €900.0 million. The dividend payout ratio was 30.2%, and the dividend yield was 2.2%.
Free float unchanged at 54.0% As in the previous year, free float as defined by Deutsche Börse AG amounted to 54.0% as at the end of 2018. The most recent change took place on September 17, 2013, when our major shareholder, the IHO Group, Herzogenaurach, Germany, announced the sale of 7.8 million Continental shares, reducing the shareholding in Conti-nental AG from 49.9% to 46.0%.
As at the end of 2018, the market capitalization of Continental AG amounted to €24.2 billion (PY: €45.0 billion). Market capitalization on the basis of free float in accordance with Deutsche Börse AG averaged €13.6 billion over the last 20 trading days of 2018 (PY: €24.3 billion). The trading volume, which is also relevant to index selection, amounted to €28.9 billion from January to December 2018 (PY: €19.9 billion). As at the end of 2018, Continental shares were ranked 24th (PY: 17th) in terms of free-float market capitalization and 16th (PY: 20th) in terms of stock exchange turnover among the 30 DAX shares in Deutsche Börse AG’s index ranking.
Increased share of free float in the U.S.A. As at the end of the year, we determined the distribution of free float of Continental shares by way of shareholder identification (SID). We were able to assign 93.4 million of the 108.0 million shares held in the form of shares or alternatively as American depositary receipts (ADRs) in the U.S.A. to institutional and private investors. The identi-fication ratio was 86.5% (PY: 84.7%).
A total of 85.6 million shares were attributable to more than 600 institutional investors in 43 countries. Private shareholders in Ger-many, other European countries and the U.S.A. held an estimated 7.8 million shares as at the end of the year.
According to the SID, the identified level of Continental shares held in Europe remained roughly the same as in the previous year at 56.8% (PY: 57.7%). The identified level of shares held by institutional investors from the United Kingdom and Ireland increased to 25.3% (PY: 24.3%). The identified holdings of German institutional investors dropped to 10.0% in the year under review (PY: 13.1%). At 5.7%, shareholdings of private German shareholders were slightly lower than the previous year’s level of 6.3%. Shareholdings of French in-stitutional investors decreased slightly to 5.9% (PY: 6.0%). Scandina-vian investors held 3.2% (PY: 3.0%) of Continental shares at the end of 2018. Shareholdings in other European countries climbed to 6.7% (PY: 5.0%).
Continental AG 2018 Annual Report To Our Shareholders Continental Shares and Bonds 11
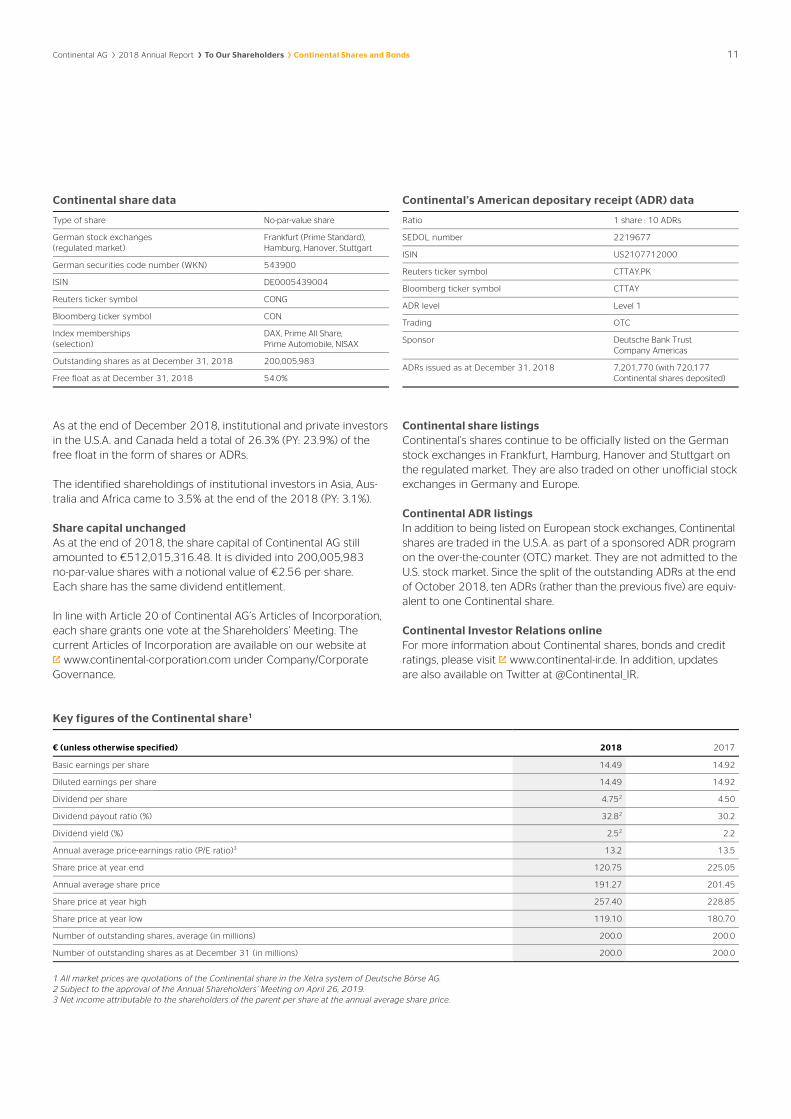
Continental share data
Type of share No-par-value share
German stock exchanges (regulated market)
Frankfurt (Prime Standard), Hamburg, Hanover, Stuttgart
German securities code number (WKN) 543900
ISIN DE0005439004
Reuters ticker symbol CONG
Bloomberg ticker symbol CON
Index memberships (selection)
DAX, Prime All Share, Prime Automobile, NISAX
Outstanding shares as at December 31, 2018 200,005,983
Free float as at December 31, 2018 54.0%
Continental’s American depositary receipt (ADR) data
Ratio 1 share : 10 ADRs
SEDOL number 2219677
ISIN US2107712000
Reuters ticker symbol CTTAY.PK
Bloomberg ticker symbol CTTAY
ADR level Level 1
Trading OTC
Sponsor Deutsche Bank Trust Company Americas
ADRs issued as at December 31, 2018 7,201,770 (with 720,177 Continental shares deposited)
As at the end of December 2018, institutional and private investors in the U.S.A. and Canada held a total of 26.3% (PY: 23.9%) of the free float in the form of shares or ADRs.
The identified shareholdings of institutional investors in Asia, Aus-tralia and Africa came to 3.5% at the end of the 2018 (PY: 3.1%).
Share capital unchanged As at the end of 2018, the share capital of Continental AG still amounted to €512,015,316.48. It is divided into 200,005,983 no-par-value shares with a notional value of €2.56 per share. Each share has the same dividend entitlement.
In line with Article 20 of Continental AG’s Articles of Incorporation, each share grants one vote at the Shareholders’ Meeting. The current Articles of Incorporation are available on our website at
www.continental-corporation.com under Company/Corporate Governance.
Continental share listings Continental’s shares continue to be officially listed on the German stock exchanges in Frankfurt, Hamburg, Hanover and Stuttgart on the regulated market. They are also traded on other unofficial stock exchanges in Germany and Europe.
Continental ADR listings In addition to being listed on European stock exchanges, Continental shares are traded in the U.S.A. as part of a sponsored ADR program on the over-the-counter (OTC) market. They are not admitted to the U.S. stock market. Since the split of the outstanding ADRs at the end of October 2018, ten ADRs (rather than the previous five) are equiv-alent to one Continental share.
Continental Investor Relations online For more information about Continental shares, bonds and credit ratings, please visit www.continental-ir.de. In addition, updates are also available on Twitter at @Continental_IR.
Key figures of the Continental share1
€ (unless otherwise specified) 2018 2017
Basic earnings per share 14.49 14.92
Diluted earnings per share 14.49 14.92
Dividend per share 4.752 4.50
Dividend payout ratio (%) 32.82 30.2
Dividend yield (%) 2.52 2.2
Annual average price-earnings ratio (P/E ratio)3 13.2 13.5
Share price at year end 120.75 225.05
Annual average share price 191.27 201.45
Share price at year high 257.40 228.85
Share price at year low 119.10 180.70
Number of outstanding shares, average (in millions) 200.0 200.0
Number of outstanding shares as at December 31 (in millions) 200.0 200.0
1 All market prices are quotations of the Continental share in the Xetra system of Deutsche Börse AG. 2 Subject to the approval of the Annual Shareholders’ Meeting on April 26, 2019. 3 Net income attributable to the shareholders of the parent per share at the annual average share price.

12
Continental faced a wide range of challenges in 2018. These also influenced the work of the Supervisory Board and its committees in the past fiscal year, which we report on below. In this context, there were two especially significant topics: the company’s business development with the profit warnings that Continental had to release in April and August 2018; and the considerations with regard to adjusting the corporate structure, which led in particular to the decision in July 2018 to transform the Powertrain division into an independent group of legal entities and prepare it for a possible partial IPO. It was particularly due to these topics that the Super-visory Board met more frequently than usual in 2018 to discuss them in depth together with the Executive Board.
We also comprehensively fulfilled all other tasks incumbent upon the Supervisory Board under applicable law, the Articles of Incor- poration and our By-Laws. We closely supervised, carefully moni-tored and advised the Executive Board in the management of the company. We have satisfied ourselves of the legality and expedi-ency of management. We were directly involved in a timely man-ner in all decisions of fundamental importance to the company.
The Executive Board provided the Supervisory Board with regular, timely and comprehensive updates at its meetings and in writing on all issues of relevance to the company. In particular, these include the business performance, planning, business strategy, significant business transactions in the company and the corporation, and the related risks and opportunities, as well as compliance issues. The members of the Supervisory Board were also available to the Executive Board for consultation outside the meetings. As chairman of the Supervisory Board, I had regular contact with the Executive Board and its chairman and discussed current company issues and developments with them.
Meetings of the Supervisory Board and the committeesThe Supervisory Board held four ordinary meetings and two ex tra-ordinary meetings in 2018, as well as the strategy meeting and two telephone conferences. It adopted one resolution by means of a written procedure. At two meetings, the Supervisory Board conferred part of the time in the absence of the Executive Board. The Chairman’s Committee held two meetings and one telephone conference in the year under review. The Audit Committee met four times in 2018. Meetings of the Nomination Committee or the Mediation Committee in accordance with Section 27 (3) of the German Co-determination Act (Mitbestimmungsgesetz – MitbestG) were not required in 2018. There are no other committees. All committees report to the plenary session on a regular basis. The Corporate Governance Report starting on page 16 describes their responsibilities in more detail and names their members.
Most members of the Supervisory Board attended all meetings in person. Maria Elisabeth Schaeffler-Thumann was unable to attend two meetings, the strategy meeting and two telephone conferences of the plenary session. Francesco Grioli, who had been appointed as Peter Hausmann’s successor on the Supervisory Board and elected as a member of the Audit Committee as at November 1, 2018, was
not yet available for the committee meeting on November 5, 2018. All other members of the Supervisory Board attended more than half of the meetings of the plenary session and also of the committees to which they belonged in the past fiscal year. A detailed account of each Supervisory Board member’s meeting attendance will be published in the Investors section of our website on March 20, 2019, with the invitation to the Annual Shareholders’ Meeting.
Key topics dealt with by the Supervisory Board and the Chairman’s CommitteeAt each meeting of the plenary session, the Executive Board in- formed the Supervisory Board in detail of the sales, results and employment development in the corporation and individual divisions as well as the financial situation of the company. Where the actual course of business deviated from the defined plans and targets, the Executive Board provided detailed explanations. It discussed the reasons for these deviations and the measures introduced in depth with the Supervisory Board. In addition, the Executive Board regularly informed us about the situation on the corporation’s main raw materials and sales markets and about Continental AG’s share price performance.
At an extraordinary meeting of the Supervisory Board on Febru-ary 6, 2018, the Executive Board presented initial considerations with regard to modifying the company’s organizational structure. In particular, we discussed in depth the initiation of a review with regard to transforming the Powertrain division into an independent group of legal entities. We addressed this topic again at the meeting to approve the annual financial statements on March 13, 2018. Another focus of this meeting was the company’s annual financial statements and the consolidated financial statements for 2017, which we discussed and approved in the presence of the auditor. In addition, we resolved to grant the 2018/2021 long-term incentive tranche to the members of the Executive Board and approved the establishment of a joint venture with Osram Licht AG, Munich, Germany, that combines the two companies’ expertise in the field of lights, light control and electronics. The discussions at the Supervisory Board meeting before the Annual Shareholders’ Meeting on April 27, 2018, were limited to the current business performance.
On July 26, 2018, an extraordinary Supervisory Board meeting was held to discuss the proposals for changes to the structure of the company and the corporation that had been announced by the Executive Board in an ad-hoc disclosure on July 18, 2018. This had been preceded by extensive preliminary talks on the employee and the shareholder side, in which the results of a review by an independent financial consultant specially commissioned by the Supervisory Board were also discussed. The Supervisory Board approved the proposals, including the transformation of the Powertrain division into an independent group of legal entities as at January 1, 2019. In a telephone conference on August 9, 2018, we dealt with and approved the acquisition of Tyre and Auto Pty Ltd., Melbourne, Australia, with the aim of expanding tire sales in Australia.
Corporate GovernanceReport of the Supervisory Board
Continental AG 2018 Annual Report > To Our Shareholders > Corporate Governance
13
At the full-day strategy meeting on September 26, 2018, the Executive Board and the Supervisory Board once again discussed at length the strategic objectives and strategic planning of the corporation and the divisions, as well as the HR strategy. The topics included in particular automated driving and connectivity, mobility services, clean combustion engines and electrification, industrial business, the growth strategy for tire business, and the development of Industry 4.0. At the strategy meeting, the Executive Board once again informed the Supervisory Board extensively about the reasons for the profit warning published on August 22, 2018, and explained the measures taken as a result. The ordinary meeting on the following day was largely devoted to discussions without the Executive Board. In addition to other current topics, we discussed succession planning for the Executive Board and resolved to terminate José Avila’s mandate as a member of the Executive Board by mutual agreement and to reappoint Dr. Elmar Degenhart (see “Personnel changes in the Supervisory Board and Executive Board”). In addition, the head of the Compliance department submitted its annual report to the plenary session on the department’s work and significant compliance cases. On October 26, 2018, another telephone conference was held during which we discussed and approved the ContiTech division’s acquisition of Cooper Standard’s anti- vibration systems business and the Interior division’s acquisition of Kathrein Automotive.
At its meeting on December 11, 2018, the Supervisory Board discussed the annual planning for 2019 and long-term planning. It also approved the planning and the investment plans for fiscal 2019. In addition, Continental’s top representative in China informed us in detail about the economic situation and the activities of the company there.
In a telephone conference on January 31, 2018, the Chairman’s Committee dealt with and approved the establishment of a joint venture for the production of 48-volt battery systems with the Chinese automotive supplier and battery manufacturer CITC (Sichuan Chengfei Integration Technology Co., Ltd., Chengdu, China). The Chairman’s Committee approved the update to the Debt Issuance Program at its meeting on March 13, 2018. In addition, this meeting and the meeting on September 26, 2018, involved in particular preparatory discussions regarding the plenary session’s decisions on remuneration for Executive Board members and on personnel matters relating to the Executive Board. Before conducting another review of Executive Board remuneration and the remuneration system, the Supervisory Board intends to wait until the German Act for the Implementation of the 2nd EU Shareholder Rights Directive (ARUG II) and a new version of the German Corporate Governance Code take effect, which is ex-pected to happen in mid-2019 and will have a significant impact on the review.
Continental AG 2018 Annual Report > To Our Shareholders > Corporate Governance

14
Key topics dealt with by the Audit CommitteeThe Audit Committee was also informed by the Executive Board in detail and on an ongoing basis about sales, results and employ-ment development in the corporation and individual divisions as well as the financial situation of the company. The Executive Board is assisted by the heads of Accounting and Corporate Controlling, who can provide the Audit Committee directly with information at its meetings. In addition, the chairman of the Audit Committee is in contact with the chief financial officer and the auditor of the corporation outside of the meetings on a regular basis.
As a focus of each of its quarterly meetings, the Audit Committee talks with the Executive Board about the accounting as at the end of the previous quarter and the outlook for the year as a whole as well as the quarterly and half-year financial reports prior to their publication. At its meeting on February 28, 2018, the Audit Com-mittee discussed the company’s annual financial statements and the consolidated financial statements for 2017 with the Executive Board and the auditor and recommended their approval to the plenary session of the Supervisory Board. The interim financial statements as at June 30, 2018, were reviewed by KPMG AG Wirtschaftsprüfungsgesellschaft, Hanover (KPMG), on behalf of the Audit Committee. The work of the Compliance and Corporate Audit departments and reporting on significant incidents are also regular topics at each meeting. These included in particular the matters described in more detail in the Report on Risks and Opportunities and in the Notes to the Consolidated Financial Statements. The head of the Compliance department and the head of Corporate Audit are also available to provide information directly to the Audit Committee and its chairman in coordination with the Executive Board. The chairman of the Audit Committee shares key information as part of his regular reporting to the ple-nary session. In addition, the Executive Board reports to the Audit Committee on the material risks covered by the risk management system and the corresponding measures resolved. The Audit Committee has satisfied itself of the effectiveness of the internal control system, the risk management system and the internal audit system.
In addition to these recurring topics, the Audit Committee also dealt with product compliance at Continental and investor relations activities at its meeting on May 2, 2018. On July 31, 2018, the Audit Committee heard information on the progress of major acquisition and investment projects, as it does regularly every year. In 2018, this related to the acquisition of the Hornschuch Group by Conti-Tech, the acquisition of Hoosier Tires and the estab lishment of a joint venture by the Chassis & Safety division with HASCO in China. The Audit Committee also dealt with the selection process for the change in auditor required in 2021 and the governance, risk and compliance (GRC) system. At the meeting on November 5, 2018, the Audit Committee issued the mandate for the audit of the 2018 annual and consolidated financial statements and the Dependent Company Report to the auditor appointed by the Annual Shareholders’ Meeting, KPMG, after obtaining the necessary Dependent Company Report, and coordinated key audit matters with the auditor. KPMG was also
commissioned to audit the combined corporate non-financial statement, which is being issued as part of the management report rather than as a separate report as in the previous year. In addition, the Audit Committee defined an approval framework for commissioning the auditor with permissible non-audit services in accordance with the EU Audit Regulation. The Executive Board regularly informs the Audit Committee about the use of this frame-work. Other topics at this meeting included tax compliance and the potential effects of Brexit.
Corporate governanceAt its meeting in December 2018, the Supervisory Board agreed to an updated declaration in accordance with Section 161 of the German Stock Corporation Act (Aktiengesetz – AktG) on the recommendations of the German Corporate Governance Code. There were no conflicts of interest for members of the Supervisory Board in the reporting year. In its opinion, the Supervisory Board also had an appropriate number of independent members as defined in the German Corporate Governance Code at all times in the period under review. Further information on corporate gover-nance is included in the Corporate Governance Report starting on page 16.
Annual and consolidated financial statements; combinedcorporate non-financial statement for 2018KPMG audited the annual financial statements as at December 31, 2018, prepared by the Executive Board in accordance with the provisions of the German Commercial Code (Handelsgesetzbuch – HGB), the 2018 consolidated financial statements and the combined management report for the corporation and Continental AG, includ-ing the accounts, the accounting-related internal control system and the system for early risk recognition. The 2018 consolidated financial statements of Continental AG were prepared in accor-dance with the International Financial Reporting Standards (IFRS). The auditor issued unqualified opinions. In terms of the system for early risk recognition, the auditor found that the Executive Board had taken the necessary measures under Section 91 (2) AktG and that the company’s system for early risk recognition is suitable for identifying developments at an early stage that pose a risk to the company as a going concern. In addition, KPMG audited the Executive Board’s report on relations with affiliated companies pursuant to Section 312 AktG (Dependent Company Report). KPMG issued the following unqualified opinion on this report in accordance with Section 313 (3) AktG:
“Based on the results of our statutory audit and evaluation we confirm that:
› the actual information included in the report is correct,
› with respect to the transactions listed in the report, payments by the company were not unduly high or that detrimental effects had been compensated for, and
› there are no circumstances in favor of a significantly different assessment than that made by the Executive Board in regard to the measures listed in the report.”
Continental AG 2018 Annual Report > To Our Shareholders > Corporate Governance

15
The Audit Committee discussed the documents relating to the annual financial statements, including the Dependent Company Report, and the audit reports with the Executive Board and the auditor on February 27, 2019, and March 1, 2019. Furthermore, the plenary session of the Supervisory Board discussed these at length at its meeting to approve the annual financial statements on March 14, 2019. The discussions also concerned the combined corporate nonfinancial statement for the Continental Corporation and for Continental AG according to Section 289b and Section 315b HGB. The required documents were distributed to all mem-bers of the Audit Committee and the Supervisory Board in good time before these meetings so that the members had sufficient opportunity to review them. The auditor was present at these discussions. The auditor reported on the main results of the audits and was available to provide additional information to the Audit Committee and the Supervisory Board. Based on its own review of the annual financial statements, the consolidated financial state-ments, the company management report, the combined manage-ment report of Continental AG and of the corporation, as well as the Dependent Company Report including the final declaration of the Executive Board, and based on the report and the recommen-dation of the Audit Committee, the Supervisory Board concurred with the results of the auditor’s audit. There were no objections. The Supervisory Board approved the annual financial statements and the consolidated financial statements. The annual financial state- ments are thereby adopted. KPMG issued an unqualified opinion for the combined corporate non-financial statement. Based on the Supervisory Board’s own review, the Audit Committee’s report on its preliminary examination and its recommendation, and KMPG’s audit and unqualified opinion on the combined corporate non- financial statement, the Supervisory Board finds that the combined corporate non-financial statement is correct and appropriate and was prepared in accordance with Sections 315b and 315c in con-junction with Sections 289c to 289e HGB.
The Supervisory Board together with the Executive Board will propose a dividend distribution of €4.75 per share for the past fiscal year at the Annual Shareholders’ Meeting on April 26, 2019.
Personnel changes in the Supervisory Board andExecutive BoardIn 2018, there were two personnel changes in the Supervisory Board: As of February 28, 2018, Hartmut Meine, who up to that point had been the vice chairman of the Supervisory Board, stepped down to begin his retirement. The Supervisory Board would like to thank Hartmut Meine once again for his constructive contribution to the work of the Supervisory Board. On February 8, 2018, the Hanover Local Court (Amtsgericht) named Christiane Benner, vice president of IG Metall, as his successor from March 1, 2018. Peter Hausmann stepped down as a member of the Supervisory Board as at October 31, 2018, likewise in order to retire. The Supervisory Board would also like to thank Peter Hausmann for his many years of good and successful cooperation on the Supervisory Board. On October 15, 2018, the Hanover Local Court (Amtsgericht) appointed Francesco Grioli, a member of the Central Board of Executive Directors of Industriegewerkschaft Bergbau, Chemie, Energie, as his successor from November 1, 2018.
Further information on the members of the Supervisory Board and its committees who were in office in the year under review can be found starting on page 17, and on pages 211 and 212.
At its meeting on September 27, 2018, the Supervisory Board reappointed Dr. Elmar Degenhart as a member of the Executive Board for another five years starting from August 12, 2019, and confirmed his appointment as Chairman of the Executive Board. At the same time, the Supervisory Board terminated José A. Avila’s mandate as a member of the Executive Board by mutual agreement as at September 30, 2018. Until the scheduled end of his employ-ment contract on December 31, 2019, he will take on advisory duties, including primarily the further development and imple-mentation of Continental’s strategy in the fields of battery tech-nology and electrification technologies. The Supervisory Board would like to thank José A. Avila for his valuable contribution to the successful turnaround of the Powertrain division, which under his leadership has once again been back on track for success since 2010.
The Supervisory Board would like to thank the Executive Board, all the employees and the employee representatives for their good work overall in the past year. They took on the wide range of challenges in an environment characterized by great uncertainty, and we are confident that, together, we will successfully rise to these challenges.
Hanover, March 14, 2019
For the Supervisory Board,
Prof. Dr.-Ing. Wolfgang Reitzle Chairman
Continental AG 2018 Annual Report > To Our Shareholders > Corporate Governance

16 Continental AG 2018 Annual Report To Our Shareholders Corporate Governance
Responsible corporate governance geared toward sustainable, long-term value creation is what governs the actions of the Executive Board and the Supervisory Board.
Good, responsible corporate governance geared toward sustain-able, long-term value creation and in the interests of all stakeholder groups is the measure that governs the actions of the Executive Board and Supervisory Board of Continental AG, and the basis of the company’s success. Below, the Supervisory Board and Execu-tive Board report on corporate governance at Continental. This Corporate Governance Declaration pursuant to Section 289f of the German Commercial Code (Handelsgesetzbuch – HGB) is simulta-neously the Corporate Governance Report as recommended by Section 3.10 of the German Corporate Governance Code. It is sup-plemented by the remuneration report of Continental AG, which is a part of the company’s Management Report.
Declaration pursuant to Section 161 AktG and deviations from the German Corporate Governance Code In December 2018, the Executive Board and the Supervisory Board issued the following annual declaration in accordance with Section 161 of the German Stock Corporation Act (Aktiengesetz – AktG):
“In accordance with Section 161 AktG, the Executive Board and the Supervisory Board of Continental AG declare that the Company has complied with and will comply with the recommendations issued by the Government Commission on the German Corporate Gover-nance Code (as amended on February 7, 2017; published by the German Federal Ministry of Justice in the official section of the electronic Federal Gazette (Bundesanzeiger) on April 24, 2017), subject to the qualifications set forth below. Reference is made to the declaration of the Executive Board and the Supervisory Board of December 2017, as well as to the previous declarations pursu-ant to Section 161 AktG and the qualifications regarding the rec-ommendations of the German Corporate Governance Code ex-plained therein.
› Pursuant to Section 5.4.1 para. 2 of the Code, the SupervisoryBoard shall specify concrete objectives regarding its composition,which take into account, inter alia, an age limit to be establishedfor members of the Supervisory Board. The Supervisory Board hasspecified such objectives. However, the Supervisory Board did notestablish an age limit because it is of the opinion that such a gen-eral criterion is not suitable for evaluating the qualifications of anindividual candidate for membership on the Supervisory Board.
Hanover, December 2018
Prof. Dr.-Ing. Wolfgang Reitzle Chairman of the Supervisory Board
Dr. Elmar Degenhart Chairman of the Executive Board”
The declaration was made permanently available to shareholders in the Company/Corporate Governance section of Continental’s website . Earlier declarations in accordance with Section 161 AktG can also be found there.
Continental AG also complies with all suggestions of the Code with the following exception:
› Section 3.7 para. 3 of the Code suggests that the Executive Boardshould convene an extraordinary Shareholders’ Meeting in allcases of takeover bids. The Executive Board and the SupervisoryBoard consider it more expedient to decide in each specific situa-tion whether it is advisable to convene a Shareholders’ Meeting.
Key corporate governance practices Corporate governance at Continental is fundamentally based on Continental AG’s Corporate Governance Principles, which are closely modeled on the German Corporate Governance Code and are published in the Company/Corporate Governance section of Continental’s website .
In addition to the Corporate Governance Principles, the following principles are also key to our sustainable and responsible corporate governance:
› The BASICS – Continental AG’s corporate guidelines. The BASICShave reflected the vision, values and self-image of the corporationsince 1989, and are available in the Company/Corporate Strategysection of Continental’s website .
› The Corporate Social Responsibility Principles; available in theSustainability/Downloads section of Continental’s website .
› Compliance with the binding Code of Conduct for all Continentalemployees. For more information, see the Compliance section onpage 21 or the Sustainability/Downloads section of Continental’swebsite .
Corporate bodies In line with the law and the Articles of Incorporation, the company’s corporate bodies are the Executive Board, the Supervisory Board and the Shareholders’ Meeting. As a German stock corporation, Continental AG has a dual management system characterized by a strict personnel division between the Executive Board as the man-agement body and the Supervisory Board as the monitoring body. The cooperation between the Executive Board, Supervisory Board and Shareholders’ Meeting is depicted on the next page.
The Executive Board and its practices The Executive Board has sole responsibility for managing the com-pany free from instructions from third parties in accordance with the law, the Articles of Incorporation and the Executive Board’s By-Laws, while taking into account the resolutions of the Shareholders’ Meet-ing. All members of the Executive Board share responsibility for the management of the company jointly. Regardless of this principle of joint responsibility, each Executive Board member is individually
Corporate Governance Report and Declaration Pursuant to Section 289f of the German Commercial Code (HGB)

Continental AG 2018 Annual Report To Our Shareholders Corporate Governance 17
responsible for the areas entrusted to him or her. The chairman of the Executive Board is responsible for the company’s over-all man-agement and business policy. He ensures management coordina-tion and uniformity on the Executive Board and represents the company to the public. The Executive Board currently has seven members. The first time a person is appointed to the Executive Board, his or her term is three years only. As a rule, a member of the Executive Board is not appointed beyond the statutory retire-ment age.
The Executive Board has By-Laws that regulate in particular the allocation of duties among the Executive Board members, key matters pertaining to the company and its subsidiaries that require a decision to be made by the Executive Board, the duties of the Executive Board chairman, and the process in which the Executive Board passes resolutions. The Executive Board By-Laws are avail-able in the Company/Corporate Governance section of Continental’s website . The Articles of Incorporation and the Supervisory Board By-Laws require the consent of the Supervisory Board for significant actions taken by management.
The Supervisory Board and its practices The Supervisory Board appoints the members of the Executive Board and supervises and advises the board in managing the company.
The Supervisory Board is directly involved in decisions of material importance to the company. As specified by law, the Articles of In-corporation or the Supervisory Board By-Laws, certain corporate management matters require the approval of the Supervisory Board. The chairman of the Supervisory Board coordinates its work and represents it vis-à-vis third parties. Within reasonable limits, he is prepared to talk to investors about issues specific to the Super-visory Board. He maintains regular contact between meetings with
the Executive Board, and in particular with its chairman, to discuss issues relating to the company’s strategy, business development, risk management and compliance.
Composition of the Supervisory Board The Supervisory Board comprises 20 members in accordance with the German Co-determination Act (Mitbestimmungsgesetz – MitbestG) and the company’s Articles of Incorporation. Half the members of the Supervisory Board are elected individually by the shareholders in the Shareholders’ Meeting (shareholder represent-atives), while the other half are elected by the employees of Conti-nental AG and its German subsidiaries (employee representatives). Both the shareholder representatives and the employee represent-atives have an equal duty to act in the interests of the company. The Supervisory Board’s chairman must be a shareholder repre-sentative. He has the casting vote in the event of a tie.
The company has set up an informational program that provides newly elected members of the Supervisory Board with a thorough overview of product and technologies as well as finances, control-ling and corporate governance at Continental. The current term of office of the Supervisory Board members lasts until the end of the 2019 Annual Shareholders’ Meeting.
The Supervisory Board has drawn up its own By-Laws that supple-ment the law and the Articles of Incorporation with more detailed provisions, including provisions on Supervisory Board meetings, the duty of confidentiality, the handling of conflicts of interest and the Executive Board’s reporting obligations, and a list of transactions and measures that require the approval of the Supervisory Board. The Supervisory Board By-Laws are available in the Company/Cor-porate Governance section of Continental’s website . The Super-visory Board consults, in the absence of the Executive Board, on a regular basis. Before each regular meeting of the Supervisory
Corporate bodies of the company

18 Continental AG 2018 Annual Report To Our Shareholders Corporate Governance
Board, the representatives of the shareholders and of the employees each meet separately with members of the Executive Board to dis-cuss the upcoming meeting.
The Supervisory Board reviews the efficiency of its activities every two to three years. The Supervisory Board recently carried out such a review in 2016 with the help of an external consultant. This once again confirmed the positive development of the Supervisory Board’s work in the past years. The Supervisory Board has adopted the rec-ommendations that resulted from the 2016 efficiency review. The next efficiency review is to be performed after the constitution of the Supervisory Board to be elected in 2019.
Profile of skills and expertise for the Supervisory Board In accordance with Section 5.4.1 of the German Corporate Gover-nance Code, the Supervisory Board has prepared a profile of skills and expertise and specified targets for its composition.
The Supervisory Board as a whole should possess the skills and expertise described below. It is not expected that all Supervisory Board members possess all skills and expertise. Instead, each area of expertise must be covered by at least one Supervisory Board member. The profile of skills and expertise assumes that all Super-visory Board members possess the knowledge and skills required for the proper performance of their duties and the characteristics necessary for successful Supervisory Board work. In particular, these include integrity, commitment, capacity for discussion and teamwork, sufficient availability and discretion.
› Internationality: Due to Continental AG’s global activities, its Super-visory Board requires international professional or business expe-rience. This means professional training or work abroad or with a strong connection to foreign markets. International professional and business experience with regard to Asian markets is also de-sirable.
› Industry experience: The Supervisory Board should have profes-sional experience in the automotive industry or other industries in which the company operates. In particular, the Supervisory Board wants to increase its expertise in the new business areas that are an important part of the company’s strategy. Therefore, professional knowledge or experience of digitalization, information technology, telecommunications, mobility services, electric mobility, or related areas should be available.
› Management experience: The Supervisory Board should include members with management experience. In particular, this includes experience in corporate management or as a senior manager of a business or experience in a managerial role at other large organ-izations or associations.
› Financial experience: The Supervisory Board should possess finan-cial knowledge and experience, namely in the areas of accounting, control and risk management systems, and the audit of financial statements. The Chairman of the Audit Committee must have in-depth knowledge in these areas.
› Corporate governance and board experience: Members of the Supervisory Board should have experience as a member of the supervisory board or executive board of a German listed com-pany or as a member of such a body of a foreign listed company.
The Supervisory Board has specified the following targets for its composition:
› The number of members of the Supervisory Board who have the required international experience should at a minimum remain constant. At least seven members currently have international skills and expertise.
› An appropriate number of members with industry experience should be maintained. Far more than half of the Supervisory Board members cover this area of expertise.
› The Supervisory Board should have an appropriate number of members who are deemed independent by the Supervisory Board as defined in the German Corporate Governance Code. At least five shareholder representatives should be independent as defined in the Code. The independent shareholder representa-tives are:
› Prof. Dr.-Ing. Wolfgang Reitzle
› Dr. Gunter Dunkel
› Prof. Dr. Klaus Mangold
› Sabine Neuß
› Prof. Dr. Rolf Nonnenmacher
› Prof. KR Ing. Siegfried Wolf
› In its nominations for election to the Supervisory Board, as a rule, the Supervisory Board does not nominate candidates who have already held this position for three full terms of office at the time of the election.
› The Supervisory Board has not stipulated an age limit as recom-mended in Section 5.4.1 of the Code. It does not consider such a general criterion to be suitable for deciding whether a candidate is eligible to be a member of the Supervisory Board.
According to Section 96 (2) AktG, the Supervisory Board of Conti-nental AG is also subject to the requirement that at least 30% of its members be women and at least 30% be men. The company reports on this on page 20, in accordance with Section 289f (2) No. 4 to 6 HGB.
The Supervisory Board will continue to provide regular updates on the status of the implementation of the targets in the Corporate Governance Report.
The Supervisory Board’s proposals to the Annual Shareholders’ Meeting on April 26, 2019, will consider the requirements of the profile of skills and expertise for the board as a whole as well as the aforementioned targets.

Continental AG 2018 Annual Report To Our Shareholders Corporate Governance 19
Committees of the Supervisory Board The Supervisory Board currently has four committees: the Chair-man’s Committee, the Audit Committee, the Nomination Commit-tee and the committee formed in accordance with Section 27 (3) of the MitbestG (Mediation Committee).
The members of the Mediation Committee also form the Chairman’s Committee, which comprises the chairman of the Supervisory Board, Prof. Dr.-Ing. Wolfgang Reitzle (chairman); his vice chairwoman, Christiane Benner (since March 1, 2018; until February 28, 2018, Hartmut Meine); Georg F. W. Schaeffler; and Jörg Schönfelder. Key responsibilities of the Chairman’s Committee are preparing the ap-pointment of Executive Board members and concluding, terminat-ing and amending their employment contracts and other agree-ments with them. However, the plenum of the Supervisory Board alone is responsible for establishing the total remuneration of the Executive Board. Another key responsibility of the Chairman’s Committee is deciding on the approval of certain transactions and measures by the company as specified in the Supervisory Board By-Laws. The Supervisory Board has conferred some of these par-ticipation rights on the Chairman’s Committee, each member of which may however, in individual cases, demand that a matter again be submitted to the plenary session for decision.
The Audit Committee’s tasks relate to the company’s accounting, the audit of the financial statements, risk management and compli-ance. In particular, the committee monitors the accounting process and the effectiveness of the internal control system, the risk man-agement system, the internal audit system and compliance; and performs a preliminary examination of Continental AG’s annual financial statements and the consolidated financial statements. The committee makes its recommendation to the plenary session of the Supervisory Board, which then passes resolutions pursuant to Section 171 AktG. Furthermore, the committee discusses the company’s draft interim financial reports. It is also responsible for ensuring the necessary independence of auditors and deals with additional services performed by the auditors. The committee en-gages the auditors, determines the focus of the report as necessary and negotiates the fee. It also gives its recommendation for the Supervisory Board’s proposal to the Annual Shareholders’ Meeting for the election of the auditor. Since 2017, the committee has also been responsible for the preliminary audit of non-financial report-ing and for the engagement of an auditor for its review, if any. The chairman of the Audit Committee is Prof. Dr. Rolf Nonnenmacher. He is independent and, as an auditor, has special knowledge and experience in the application of accounting principles and internal control procedures. Another committee member, Klaus Rosenfeld, is also a financial expert. The other members are Francesco Grioli (since November 1, 2018; until October 31, 2018: Peter Hausmann), Dirk Nordmann, Georg F. W. Schaeffler and Michael Iglhaut. Neither a former Executive Board member nor the chairman of the Super-visory Board may act as chairman of the Audit Committee.
The Nomination Committee is responsible for nominating suitable candidates for the Supervisory Board to propose to the Annual Shareholders’ Meeting for election. In addition, the Committee must propose targets for the Supervisory Board’s composition and pro-file of skills and expertise and review both regularly. The Nomina-tion Committee consists entirely of shareholder representatives, specifically the two shareholder representatives on the Chairman’s
Committee, Prof. Dr.-Ing. Wolfgang Reitzle (chairman) and Georg F. W. Schaeffler, the chairman of the Audit Committee, Prof. Dr. Rolf Nonnenmacher, and Maria-Elisabeth Schaeffler-Thumann as an additional member.
In accordance with Section 31 (3) Sentence 1 of the MitbestG, the Mediation Committee becomes active only if the first round of voting on a proposal to appoint a member of the Executive Board or to remove a member by consent does not achieve the legally required two-thirds majority. This committee must then attempt mediation before a new vote is taken.
More information on the members of the Supervisory Board and its committees can be found starting on page 211. Current resumes, which are updated annually, are available in the Company/Corporate Governance section of Continental’s website .
Shareholders and the Shareholders’ Meeting The company’s shareholders exercise their rights of participation and control in the Shareholders’ Meeting. The Annual Shareholders’ Meeting, which must be held in the first eight months of every fiscal year, decides on all issues assigned to it by law, such as the appropriation of profits, election of the shareholder representatives in the Supervisory Board, the discharging of Supervisory Board and Executive Board members, appointment of auditors and amend-ments to the company’s Articles of Incorporation. Each Continental AG share entitles the holder to one vote. There are no shares con-ferring multiple or preferential voting rights and no limitations on voting rights.
All shareholders who register in a timely manner and prove their entitlement to participate in the Shareholders’ Meeting and to exer-cise their voting rights are entitled to participate in the Sharehold-ers’ Meeting. To facilitate the exercise of their rights and to prepare them for the Shareholders’ Meeting, the shareholders are fully in-formed about the past fiscal year and the points on the upcoming agenda before the Shareholders’ Meeting by means of the Annual Report and the invitation to the meeting. All documents and infor-mation on the Shareholders’ Meeting, including the Annual Report, are also published on the company’s website in German and English. Moreover, the whole Annual Shareholders’ Meeting can also be watched on the company’s website. To make it easier for shareholders to exercise their rights, the company offers all share-holders who cannot or do not want to exercise their voting rights themselves the opportunity to vote at the Shareholders’ Meeting via a proxy who is bound by instructions. Voting instructions can also be issued to the proxy via an internet service before the end of the general debate on the day of the Shareholders’ Meeting. In addition, the service provider that assists the company with con-ducting the Shareholders’ Meeting is instructed not to forward the individual voting instructions to Continental until the day before the Shareholders’ Meeting.
Accounting and auditing of financial statements The Continental Corporation’s accounting is prepared in accordance with International Financial Reporting Standards (IFRS) as adopted by the European Union (EU). The annual financial statements of Continental AG are prepared in accordance with the accounting regulations of the German Commercial Code (Handelsgesetzbuch – HGB). The Annual Shareholders’ Meeting on April 27, 2018, elected
20 Continental AG 2018 Annual Report To Our Shareholders Corporate Governance
KPMG AG Wirtschaftsprüfungsgesellschaft, Hanover (KPMG) to au-dit the consolidated financial statements for fiscal 2018 as well as the interim financial reports of the company. KPMG has audited the consolidated financial statements and the separate financial statements for more than 30 years. Dirk Papenberg has been the auditor responsible at KPMG since the financial statements for fiscal 2012.
Internal control system and risk management Careful corporate management and good corporate governance also require that the company deal with risks responsibly. Continen-tal has a corporation-wide internal control and risk management system, especially in terms of the accounting process, that helps analyze and manage the company’s risk situation. The risk man-agement system serves to identify and evaluate developments that could result in significant disadvantages and to avoid risks that would jeopardize the continued existence of the company. We report on this in detail in the Report on Risks and Opportunities, which forms part of the management report for the consolidated financial statements.
Transparent and prompt reporting As part of our investor relations and corporate communications, we regularly report to shareholders, analysts, shareholders’ associations, the media and interested members of the public in equal measure on significant developments in the corporation and its situation. All shareholders have instant access to all the information that is also available to financial analysts and similar parties. The website of Continental AG provides the latest information, including the com-pany’s financial reports, presentations held at analyst and investor conferences, press releases and ad-hoc disclosures. The dates of key periodic publications (annual and interim reports) and events as well as of the Annual Shareholders’ Meeting and the annual fi-nancial press conference are announced well in advance in a finan-cial calendar on the website of Continental AG. For the scheduled dates for 2019 and 2020, see the Investors/Events section .
Report pursuant to Section 289f (2) No. 4 to 6 HGB Pursuant to Section 96 (2) AktG, the Supervisory Board of Conti-nental AG as a listed stock corporation subject to the German Co-determination Act consists of at least 30% women and at least 30% men. These minimum quotas have been mandatory since January 1, 2016. However, existing appointments may continue to be held until their regular end in accordance with Section 25 (2) Sentence 3 of the German Introductory Act to the Stock Corpora-tion Act (Einführungsgesetz zum Aktiengesetz – EGAktG). Women made up 30% of the Supervisory Board of Continental AG as at December 31, 2018.
In accordance with Section 111 (5) AktG, the Supervisory Board must set a target quota of women on the Executive Board and a deadline for achieving this target. If the ratio of women is less than 30% at the time this is set, the target must not subsequently fall below the ratio achieved. Based on the current composition of the Executive Board, the Supervisory Board does not anticipate any significant personnel changes in the coming years. In December 2016, the Supervisory Board therefore set a target for the ratio of
women on the Executive Board of Continental AG of at least 11% for the period up until December 31, 2021. At the same time, the Supervisory Board resolved to review the defined target as at December 31, 2019, to determine whether a target of higher than 11% can be set in view of the measures resolved. Women made up 14.3% of the Executive Board of Continental AG as at December 31, 2018, and at the time this report was prepared.
In accordance with Section 76 (4) AktG, the Executive Board of Continental AG is required to set targets for the ratio of women in the first two management levels below the Executive Board and a deadline for achieving these targets. In November 2016, the Execu-tive Board set the following target quotas for women in the first two management levels below the Executive Board at Continental AG for the period up until December 31, 2021: 26% for the first man-agement level and 33% for the second management level. As at December 31, 2018, the ratio of women was 29% at the first man-agement level and 35% at the second management level. As a global company, Continental continues to attach high priority to the goal of steadily increasing the proportion of women in manage-ment positions throughout the corporation, above and beyond the legal requirements in Germany.
Diversity concept Continental counts on the diversity of its employees. Activities to promote diversity are currently focused on internationality and a balanced gender ratio.
The Supervisory Board also pays attention to the diversity of the composition of the Executive Board. The Executive Board does the same when appointing people to management positions. As a basic principle, the Executive Board aims to achieve a balanced ratio of domestic to international managers everywhere. The proportion of local and international managers varies according to region. In 2018, a total of about 46% of the corporation’s managers came from other countries.
Continental AG is also working on increasing the proportion of women in management positions. The proportion is to be in-creased to at least 16% by 2020 and to 25% by 2025.
In drawing up the Executive Board’s succession plan, the Super- visory Board together with the Executive Board makes use of the measures and programs to promote internationality and women in management positions, thus making it possible to identify and develop potential international and female candidates for positions on the Executive Board. The aim in the medium term is to use these measures to increase the diversity of the Executive Board even further.
The Supervisory Board also pays attention to the diversity of its own composition. For the Supervisory Board, diversity refers to age, gender, background and professional experience, among other things. The Supervisory Board is convinced that it will achieve diversity in its composition in particular by fulfilling the profile of skills and expertise and meeting the targets for its composition.

Continental AG 2018 Annual Report To Our Shareholders Corporate Governance 21
One of our four values is trust. Trust requires integrity, honesty and incorruptibility. Compliance with all the legal requirements that apply to Continental AG and its subsidiaries and its internal regulations by management and employees has therefore long been a goal of the company and an integral part of its corporate culture. In addition to our corporate guidelines, the BASICS, and the Corporate Governance Principles, this is reflected in particular in our Corporate Social Re-sponsibility Principles and the Code of Conduct that is binding for all employees. The Executive Board is firmly committed to these principles and that of “zero tolerance,” particularly with regard to corruption and antitrust violations.
The basis of our Compliance Management System (CMS) is a com-prehensive analysis of the compliance risks to which the company is exposed. The company and its business activities are examined in terms of potential compliance risks that can arise, for example, from its structures and processes, a specific market situation or even operations in certain geographic regions. This takes into ac-count, for example, the results of regular corporation-wide report-ing on compliance risks in the governance, risk and compliance (GRC) system, the findings of investigations by the Corporate Audit department, and external sources such as Transparency Interna-tional’s Corruption Perception Index. This analysis is substantiated and expanded primarily by a series of discussions with manage-ment and employees at all levels and at our training events. The risk analysis is not a one-off procedure, but rather a process requir-ing constant review and updates.
The head of the Compliance department manages the compliance organization in operational terms. The person holding this position is subordinate to the corporate compliance officer, who reports directly to the chief financial officer. The focal area of the work of the Compliance department is preventing violations of antitrust and competition law, corruption, fraud and other property offenses, and infringements of regulations for the prevention of money laun-dering. For other areas in which there is a risk of compliance viola-tions, responsibility for compliance management lies with the re-spective functions that have performed these duties competently for a long time and are supported in these tasks by the Compliance department.
The CMS consists of the three pillars of prevention, detection and response:
› The first pillar of CMS – prevention – includes employee training, in particular, in addition to the risk analysis. Here, we attach great importance to in-person events at which we can address employ-ees personally and directly and discuss their questions. We use e-learning programs as well. Prevention is also fostered by consul-tation on specific matters with the Compliance department and by the internal publication of guidelines on topics such as anti-trust law and contact with competitors, giving and receiving gifts, and sponsoring. Continental introduced a Business Partner Code of Conduct to prevent compliance violations by suppliers, service providers or similar third parties that could have negative repercus-sions for Continental, or that could be attributed to the company
under laws such as the U.K. Bribery Act. This must be recognized as a basic requirement for doing business with Continental. If nec-essary, third-party due diligence can be performed with regard to compliance issues. Another key element of preventive compliance is communication measures, which are carried out on a regular basis. These include video tutorials on compliance, as well as Compliance Days and Compliance Games that are organized by the individual locations with the support of the compliance organ-ization.
› The second pillar of CMS – detection – comprises regular and ad hoc audits. In addition, compliance is always a subject of audits carried out by Corporate Audit. Continental has set up a Compli-ance & Anti-Corruption Hotline to give employees and third parties outside the corporation the opportunity to report violations of legal regulations, its fundamental values and ethical standards. Information on any kind of potential violations, such as bribery or antitrust behavior, but also other offenses or accounting manipu-lation, can be reported anonymously via the hotline where per-missible by law. Corporate Audit and the Compliance department investigate and pursue all tips received by this hotline. The hotline is available worldwide in many different languages. The number of tips received by the hotline has risen steadily over the past few years. We see this as a sign of increased awareness of compliance topics and as a success in our compliance work.
› The third pillar of CMS – response – deals with the consequences of compliance violations that have been identified. The Compliance department is involved in decisions on measures that may be re-quired, including any individual sanctions. Furthermore, the Com-pliance department conducts a thorough analysis of such events to ensure that isolated incidents are not symptoms of failings in the system and to close any gaps in prevention.
The design, implementation and effectiveness of Continental AG’s CMS for the areas of anti-corruption, competition/antitrust law, fraud and other property offenses are audited by Ernst & Young GmbH Wirtschaftsprüfungsgesellschaft (EY) in accordance with Audit Standard 980 of the Institut der Wirtschaftsprüfer e. V. (IDW). In 2016, EY issued an unqualified review opinion.
Material compliance-related matters and risks are described in more detail in the Report on Risks and Opportunities starting on page 93, and in the Notes to the Consolidated Financial Statements (Note 34).
Compliance

22 Continental AG 2018 Annual Report To Our Shareholders Corporate Governance
This Remuneration Report is a part of the Management Report.
Basic elements of the Executive Board remuneration system In accordance with the German Stock Corporation Act (Aktiengesetz – AktG), the plenary session of the Supervisory Board is responsible for determining the remuneration for the Executive Board.
The Supervisory Board reviews the Executive Board’s remuneration regularly. It most recently commissioned an independent consultant in 2016 to review the remuneration system in place since January 1, 2014, and the structure and amount of remuneration for the Executive Board. Based on the results of this review, and after per-forming its own detailed review and discussions, the Supervisory Board resolved on the adjustments described hereinafter, which took effect as at January 1, 2017. In determining the remuneration of the Executive Board, the Supervisory Board also took account of the remuneration structure that applies in the rest of the corpo-ration and the ratio of the Executive Board remuneration to the remuneration of senior executives and the workforce in Germany as a whole, including its development over time. The Annual Share-
holders’ Meeting on April 28, 2017, approved the remuneration system in accordance with Section 120 (4) AktG. It was applied in 2018 to all Executive Board members in office in this fiscal year.
Before conducting another review of Executive Board remunera-tion and the remuneration system, the Supervisory Board intends to wait until the German Act for the Implementation of the 2nd EU Shareholder Rights Directive (ARUG II) and the new version of the German Corporate Governance Code take effect, which is expected to happen in mid-2019 and will have a significant impact on the review.
Remuneration for Executive Board members consists of the following:
› Fixed remuneration
› Variable remuneration elements
› Additional benefits
› Retirement benefits
The chart below shows an example of the composition of the remuneration for an Executive Board member with responsibility for a division, based on 100% target achievement.
1 Average figure. 2 Based on a target bonus (here: €1.167 million), for 100% achievement of defined CVC and ROCE targets, maximum of 150% of the target bonus (including achieving any
additional strategic targets as well as any correction of the target achievement of +/- 20% by the Supervisory Board), divided into an immediate payment (60%) and deferral (40%).
3 The possible increase in the value of the deferral is capped at 250% of the initial value. The maximum amount shown relates to the maximum payment in the performance bonus at 150% target achievement.
4 Based on achieving average CVC versus planned CVC (max. 200%), multiplied by the degree of achieving the total shareholder return, maximum payment of 200%.
Remuneration Report
Remuneration of an Executive Board member responsible for a division (example)

Continental AG 2018 Annual Report To Our Shareholders Corporate Governance 23
1. Fixed remuneration Each Executive Board member receives fixed annual remuneration paid in 12 monthly installments. The fixed remuneration of the chairman of the Executive Board was raised as at January 1, 2017, to bring it in line with market development. The fixed remuneration of the other Executive Board members has remained unchanged since 2013. The fixed remuneration, with 100% target achieve-ment, makes up around one-third of the direct remuneration.
2. Variable remuneration elements The Executive Board members also receive variable remuneration in the form of a performance bonus and a share-based long-term incentive (LTI). A key criterion for measuring variable remuneration is the Continental Value Contribution (CVC), which is a central cor-porate management instrument (please refer to the Corporate Management section in the Management Report, page 43). The variable remuneration elements, with 100% target achievement, make up around two-thirds of the direct remuneration. The struc-ture of the variable remuneration is geared toward sustainable de-velopment of the company as defined in the German Stock Corpo-ration Act and the German Corporate Governance Code, with a fu-ture oriented assessment basis that generally covers several years. The share of long-term components amounts to 60% or more of var-iable remuneration on the basis of the target values.
a) Performance bonus The performance bonus is based on a target amount that the Supervisory Board determines for each Executive Board member for 100% target achievement. Target criteria are the year-on-year change in the CVC and the return on capital employed (ROCE). For Executive Board members who are responsible for a particular divi-sion, these criteria relate to the relevant division; for other Executive Board members, they relate to the corporation. The CVC target is 100% achieved if the CVC is unchanged compared to the previous year. If the CVC has fallen or risen by a defined percentage, this ele-ment is reduced to zero or reaches a maximum of 150%. In the case of negative CVC in the previous year, target achievement is based on the degree of improvement. The criteria for the ROCE target are guided by planning targets. This component can also be omitted if a certain minimum value is not achieved. Because of the link with planning, more specific disclosures regarding the target values are not in the company’s interests.
The CVC target is weighted at 60% and the ROCE target at 40% in the calculation of the performance bonus. In addition to the CVC and ROCE targets, the Supervisory Board can determine a strategic target at the beginning of each fiscal year, which is weighted at 20% – reducing the weighting of the other two targets accordingly. The Supervisory Board did not set an additional target for 2018. In order to take into account extraordinary factors that have influenced the degree to which targets are achieved, the Supervisory Board has the right – as it sees fit – to retroactively adjust the established at-tainment of goals on which the calculation of the performance bonus is based by up to 20% downward or upward. The Supervisory Board considers this adjustment option necessary to account in particular for positive and negative effects on target achievement over which a member of the Executive Board has no influence. It has not yet made use of the discretionary power. In any event, the performance
bonus is capped at 150% of the target bonus. This applies irrespec-tive of whether an additional strategic target is resolved.
The performance bonus achieved in a fiscal year is divided into a lump sum, which is paid out as an annual bonus (immediate pay-ment), and a deferred payment (deferral). Under the agreements applicable until December 31, 2013, the immediate payment amounted to 40% of the performance bonus while the deferral amounted to 60%. Since 2014, the immediate payment has amounted to 60% and the deferral 40%. The deferral is converted into virtual shares of Continental AG. Following a holding period of three years after the end of the fiscal year for which variable remu-neration is awarded, the value of these virtual shares is paid out to-gether with the value of the dividends that were distributed for the fiscal years of the holding period. The conversion of the deferral into virtual shares and payment of their value after the holding period are based on the average share price for the three-month period immediately preceding the Annual Shareholders’ Meeting in the year of conversion or payment. However, the amount of a deferral relating to a fiscal year up to and including 2013 that is paid after the holding period may not fall below 50% of the value at the time of conversion or exceed three times the same value. In addition, the Supervisory Board may retroactively revise the amount paid out for such deferrals by up to 20% upward or downward to balance out extraordinary developments. For deferrals acquired in 2014 or subsequent years, there is no guarantee that at least 50% of the initial value of the deferral will be paid out at the end of the holding period, and it is no longer possible for the Supervisory Board to change the amount to be paid out retroactively. Further-more, the possible increase in the value of the deferral is capped at 250% of the initial value.
In addition to the performance bonus, a special bonus can be agreed upon for special projects in individual cases or a recognition bonus can be granted. However, a recognition or special bonus of this kind and the performance bonus together must not exceed 150% of the target bonus, and it is also included in the division into immediate payment and deferral. No special or recognition bonus has been granted since 2013.
The amount of the performance bonus to be paid out for fiscal 2018 in the event of 100% target achievement is shown – divided into immediate payment and deferral – in the “remuneration granted” column in the remuneration tables for the Executive Board members for 2018.
b) Long-term incentive (LTI) The LTI plan is resolved by the Supervisory Board on an annual basis with a term of four years in each case. It determines the target bonus to be paid for 100% target achievement for each Executive Board member, taking into account the corporation’s earnings and the member’s individual performance.
The first criterion for target achievement is the average CVC that the corporation actually generates in the four fiscal years during the term, starting with the fiscal year in which the tranche is issued. This value is compared to the average CVC, which is set in the stra-tegic plan for the respective period. The degree to which this target

24 Continental AG 2018 Annual Report To Our Shareholders Corporate Governance
is achieved can vary between 0% and a maximum of 200%. The other target criterion is the total shareholder return (TSR) on Conti-nental shares during the term of the tranche. To determine the TSR, the average price of the Continental share in the months from Oc-tober to December is set in relation to the beginning and the end of the respective LTI tranche. In addition, all dividends paid during the term of the LTI tranche are taken into account for the TSR (please refer to Note 30 of the Notes to the Consolidated Financial Statements, starting on page 180). The degree to which this target is achieved is multiplied by the degree to which the CVC target is achieved to determine the degree of target achievement on which the LTI that will actually be paid after the end of the term is based. The maximum amount to be paid out is capped at 200% of the tar-get bonus.
In 2013, in anticipation of the plan to be implemented from 2014, the Supervisory Board already granted an LTI to the Executive Board members in office, with the exception of Frank Jourdan. Its conditions correspond to those that applied to the 2013 LTI plan for the senior executives. In addition to a CVC target, this plan did not have a share-based target but did have a target relating to free cash flow in the last year of the term. The 2013 LTI plan is described in detail in the Notes to the Consolidated Financial Statements in the section on employee benefits (Note 26). Frank Jourdan and Hans-Jürgen Duensing remain entitled to LTI that were granted to them as senior executives between 2010 and 2013, and between 2011 and 2014, respectively.
Starting from January 1, 2017, the target amounts for the perfor-mance bonus and the LTI were increased to raise the total remu-neration of the Executive Board members to the middle of a remu-neration range of comparable companies in each case.
The amount of the LTI to be paid out at the end of the plan’s term for fiscal 2018 in the event of 100% target achievement is shown in the “remuneration granted” column in the remuneration tables for the Executive Board members for 2018.
3. Additional benefits Executive Board members also receive additional benefits, primarily the reimbursement of expenses, including any relocation expenses and payments – generally for a limited time – for a job-related sec-ond household, the provision of a company car, and premiums for group accident and directors’ and officers’ (D&O) liability insurance. The D&O insurance policy provides for an appropriate deductible in line with the requirements of Section 93 (2) Sentence 3 AktG. As a rule, members of the Executive Board must pay taxes on these additional benefits.
Continued remuneration payments have also been agreed for a certain period in the event of employment disability through no fault of the Executive Board member concerned.
4. Retirement benefits All members of the Executive Board have been granted post-employ-ment benefits that are paid starting at the age of 63 (but not before they leave the service of the company) or in the event of disability.
From January 1, 2014, the company pension for the members of the Executive Board was changed from a purely defined benefit to a defined contribution commitment. A capital component is cred-ited to the Executive Board member’s pension account each year. To determine this, an amount equivalent to 20% of the sum of the fixed remuneration and the target value of the performance bonus is multiplied by an age factor representing an appropriate return. The future benefit rights accrued until December 31, 2013, have been converted into a starting component in the capital account. When the insured event occurs, the benefits are paid out as a lump sum, in installments or – as is normally the case due to the expected amount of the benefits – as a pension. Post-employment benefits are adjusted after commencement of such benefit payments in ac-cordance with Section 16 of the German Company Pensions Law (Betriebsrentengesetz – BetrAVG).
In the employment contracts, it has been agreed that, in the event of premature termination of Executive Board work, payments to the Executive Board member that are to be agreed, including the addi-tional benefits, shall not exceed the value of two annual salaries or the value of remuneration for the remaining term of the employ-ment contract for the Executive Board member. There are no com-pensation agreements with the members of the Executive Board in the event of a takeover bid or a change of control at the company. Dr. Ralf Cramer, who stepped down from the Executive Board on August 11, 2017, received compensation for non-competition in an amount of €1,396 thousand in 2018 for a post-contractual non-compete covenant that was still in place in that year. Heinz-Gerhard Wente, who retired on April 30, 2015, still received back payments of compensation for non-competition in an amount of €551 thou-sand in 2018 for a non-compete covenant in place from 2015 to 2017. José A. Avila, who left the Executive Board on September 30, 2018, still receives remuneration on the basis of his employment contract that was due to end on December 31, 2019. On this basis, he received payments of €205 thousand from October 1 to De-cember 31, 2018, while another €88 thousand was paid out in 2019 as an immediate component of the performance bonus. In addition, €59 thousand will be converted into virtual shares of the company in 2019 as a long-term component of the performance bonus.

Continental AG 2018 Annual Report To Our Shareholders Corporate Governance 25
Individual remuneration In the tables below, the benefits, inflows and service costs granted to the members of the Executive Board are shown separately in ac-cordance with the recommendations of Section 4.2.5 para. 3 of the German Corporate Governance Code.
Remuneration granted Inflows
€ thousands 2017 2018 2018 (min.) 2018 (max.) 2017 2018
Payment in
2017 Payment in
2018
Dr. E. Degenhart (Board chairman; Board member since August 12, 2009)
Fixed remuneration 1,450 1,450 1,450 1,450 1,450 — 1,450
Additional benefits 13 35 35 35 13 — 35
Total 1,463 1,485 1,485 1,485 1,463 — 1,485
Performance bonus (immediate payment) 1,500 1,500 0 2,250 — 2,098 750
Multiannual variable remuneration 2,550 2,550 0 5,600 2,702 1,684 1,947
Performance bonus (deferral) [3 years] 1,000 1,000 0 2,500 1,264 — 1,073
Long-term incentive [4 years] until 2013 — — — — 1,438 — —
Long-term incentive [4 years] from 2014 1,550 1,550 0 3,100 — 1,684 874
Total 5,513 5,535 1,485 9,335 4,165 3,782 4,182
Service costs 1,123 1,166 1,166 1,166 1,123 — 1,166
Total remuneration 6,636 6,701 2,651 10,501 5,288 3,782 5,348
J. A. Avila (Board member for Powertrain; Board member from Jan. 1, 2010, to Sept. 30, 2018)
Fixed remuneration 800 600 600 600 800 — 600
Additional benefits 19 24 24 24 19 — 24
Total 819 624 624 624 819 — 624
Performance bonus (immediate payment) 700 524 0 785 — 1,050 188
Multiannual variable remuneration 1,250 1,132 0 2,439 1,643 772 546
Performance bonus (deferral) [3 years] 467 349 0 873 990 — 145
Long-term incentive [4 years] until 2013 — — — — 653 — —
Long-term incentive [4 years] from 2014 783 783 0 1,566 — 772 401
Total 2,769 2,280 624 3,849 2,462 1,822 1,358
Service costs 607 442 442 442 607 — 442
Total remuneration 3,376 2,722 1,066 4,291 3,069 1,822 1,800
Dr. R. Cramer (Board member for Continental China; Board member from Aug. 12, 2009, to Aug. 11, 2017)
Fixed remuneration 493 0 0 0 493 — —
Additional benefits 254 26 26 26 254 — 26
Total 747 26 26 26 747 — 26
Performance bonus (immediate payment) 428 0 0 0 — 599 —
Multiannual variable remuneration 405 0 0 0 1,252 697 900
Performance bonus (deferral) [3 years] 285 — — — 599 — 638
Long-term incentive [4 years] until 2013 — — — — 653 — —
Long-term incentive [4 years] from 2014 120 0 0 0 — 697 262
Total 1,580 26 26 26 1,999 1,296 926
Service costs 787 0 0 0 787 — —
Total remuneration 2,367 26 26 26 2,786 1,296 926

26 Continental AG 2018 Annual Report To Our Shareholders Corporate Governance
Remuneration granted Inflows
€ thousands 2017 2018 2018 (min.) 2018 (max.) 2017 2018
Payment in
2017 Payment in
2018
H.-J. Duensing (Board member for ContiTech; Board member since May 1, 2015)
Fixed remuneration 800 800 800 800 800 — 800
Additional benefits 21 29 29 29 21 — 29
Total 821 829 829 829 821 — 829
Performance bonus (immediate payment) 700 700 0 1,050 — 828 146
Multiannual variable remuneration 1,250 1,250 0 2,734 105 141 401
Performance bonus (deferral) [3 years] 467 467 0 1,168 — — —
Long-term incentive [4 years] until 2013 — — — — 105 — —
Long-term incentive [4 years] from 2014 783 783 0 1,566 — 141 401
Total 2,771 2,779 829 4,613 926 969 1,376
Service costs 645 634 634 634 645 — 634
Total remuneration 3,416 3,413 1,463 5,247 1,571 969 2,010
F. Jourdan (Board member for Chassis & Safety; Board member since September 25, 2013)
Fixed remuneration 800 800 800 800 800 — 800
Additional benefits 28 39 39 39 28 — 39
Total 828 839 839 839 828 — 839
Performance bonus (immediate payment) 700 700 0 1,050 — 1,050 315
Multiannual variable remuneration 1,250 1,250 0 2,734 219 772 1,090
Performance bonus (deferral) [3 years] 467 467 0 1,168 88 — 689
Long-term incentive [4 years] until 2013 — — — — 131 — —
Long-term incentive [4 years] from 2014 783 783 0 1,566 — 772 401
Total 2,778 2,789 839 4,623 1,047 1,822 2,244
Service costs 663 657 657 657 663 — 657
Total remuneration 3,441 3,446 1,496 5,280 1,710 1,822 2,901
H. Matschi (Board member for Interior; Board member since August 12, 2009)
Fixed remuneration 800 800 800 800 800 — 800
Additional benefits 8 18 18 18 8 — 18
Total 808 818 818 818 808 — 818
Performance bonus (immediate payment) 700 700 0 1,050 — 905 1,001
Multiannual variable remuneration 1,250 1,250 0 2,734 1,643 772 1,065
Performance bonus (deferral) [3 years] 467 467 0 1,168 990 — 664
Long-term incentive [4 years] until 2013 — — — — 653 — —
Long-term incentive [4 years] from 2014 783 783 0 1,566 — 772 401
Total 2,758 2,768 818 4,602 2,451 1,677 2,884
Service costs 731 600 600 600 731 — 600
Total remuneration 3,489 3,368 1,418 5,202 3,182 1,677 3,484

Continental AG 2018 Annual Report To Our Shareholders Corporate Governance 27
Remuneration granted Inflows
€ thousands 2017 2018 2018 (min.) 2018 (max.) 2017 2018
Payment in
2017 Payment in
2018
Dr. A. Reinhart (Board member for Human Relations; Board member since October 1, 2014)
Fixed remuneration 800 800 800 800 800 — 800
Additional benefits 6 20 20 20 6 — 20
Total 806 820 820 820 806 — 820
Performance bonus (immediate payment) 700 700 0 1,050 — 979 350
Multiannual variable remuneration 1,250 1,250 0 2,734 — — 562
Performance bonus (deferral) [3 years] 467 467 0 1,168 — — 161
Long-term incentive [4 years] until 2013 — — — — — — —
Long-term incentive [4 years] from 2014 783 783 0 1,566 — — 401
Total 2,756 2,770 820 4,604 806 979 1,732
Service costs 861 813 813 813 861 — 813
Total remuneration 3,617 3,583 1,633 5,417 1,667 979 2,545
W. Schäfer (Board member for Finance; Board member since January 1, 2010)
Fixed remuneration 1,100 1,100 1,100 1,100 1,100 — 1,100
Additional benefits 9 19 19 19 9 — 19
Total 1,109 1,119 1,119 1,119 1,109 — 1,119
Performance bonus (immediate payment) 700 700 0 1,050 — 979 350
Multiannual variable remuneration 1,360 1,360 0 2,954 1,756 912 1,112
Performance bonus (deferral) [3 years] 467 467 0 1,168 972 — 638
Long-term incentive [4 years] until 2013 — — — — 784 — —
Long-term incentive [4 years] from 2014 893 893 0 1,786 — 912 474
Total 3,169 3,179 1,119 5,123 2,865 1,891 2,581
Service costs 783 683 683 683 783 — 683
Total remuneration 3,952 3,862 1,802 5,806 3,648 1,891 3,264
N. Setzer (Board member for Tires; Board member since August 12, 2009)
Fixed remuneration 800 800 800 800 800 — 800
Additional benefits 18 40 40 40 18 — 40
Total 818 840 840 840 818 — 840
Performance bonus (immediate payment) 700 700 0 1,050 — 632 476
Multiannual variable remuneration 1,250 1,250 0 2,734 1,522 772 1,029
Performance bonus (deferral) [3 years] 467 467 0 1,168 869 — 628
Long-term incentive [4 years] until 2013 — — — — 653 — —
Long-term incentive [4 years] from 2014 783 783 0 1,566 — 772 401
Total 2,768 2,790 840 4,624 2,340 1,404 2,345
Service costs 966 699 699 699 966 — 699
Total remuneration 3,734 3,489 1,539 5,323 3,306 1,404 3,044

28 Continental AG 2018 Annual Report To Our Shareholders Corporate Governance
Remuneration granted Inflows
€ thousands 2017 2018 2018 (min.) 2018 (max.) 2017 2018
Payment in
2017 Payment in
2018
H.-G. Wente (Board member for ContiTech; Board member from May 3, 2007 to April 30, 2015)
Fixed remuneration — — — — — — —
Additional benefits — — — — — — —
Total — — — — — — —
Performance bonus (immediate payment) — — — — — — —
Multiannual variable remuneration — — — — 1,125 256 509
Performance bonus (deferral) [3 years] — — — — 822 — 476
Long-term incentive [4 years] until 2013 — — — — 303 — —
Long-term incentive [4 years] from 2014 — — — — — 256 33
Total — — — — 1,125 256 509
Service costs — — — — — — —
Total remuneration — — — — 1,125 256 509
Heinz-Gerhard Wente, who retired on April 30, 2015, was paid commitments of €256 thousand from the 2014 long-term incen-tive plan and €476 thousand from the long-term component of the 2014 performance bonus in 2018. Dr. Ralf Cramer, who left the Executive Board on August 11, 2017, still received subsequent additional benefits of €26 thousand, payments from the 2014 long-term incentive plan of €697 thousand and payments from the long-term component of the 2014 performance bonus in the amount of €638 thousand in 2018.
The disclosures on benefits granted and inflows are broken down into fixed and variable remuneration components and supple-mented by disclosures on the service costs. The fixed remunera-tion components include the non-performance-related fixed remu-neration and additional benefits. The variable performance-related remuneration components consist of the immediate payment from the performance bonus as a short-term remuneration com-ponent and the two long-term components: the deferral of the performance bonus and the LTI.
The immediate payment, the deferral (taking into account the reference tables as recommended in Section 4.2.5, para. 3 of the German Corporate Governance Code) and the LTI are each recog-
nized as remuneration granted at the value of the commitment at the time it is granted (equivalent to 100% target achievement). The remuneration elements are supplemented by disclosures on individually attainable maximum and minimum remuneration.
The inflow recognized in the year under review comprises the fixed remuneration components actually received plus the amounts of the immediate payment to be received in the following year that had been determined at the time the remuneration report was pre-pared. Disclosures on the two long-term components – the deferral and the 2013/17 LTI tranche – relate to actual payments in the previous year. Inflows from multiannual variable remuneration that was scheduled to end in the period under review, but would not be paid until the following year, apply to the LTI tranches from 2014/ 2017 onward. In line with the recommendations of Section 4.2.5 para. 3 of the German Corporate Governance Code, service costs in the disclosures on inflows correspond to the amounts granted, although they do not represent actual inflows in a stricter sense.
In fiscal 2018, the members of the Executive Board neither received nor were promised payments by a third party with respect to their activities on the Executive Board.

Continental AG 2018 Annual Report To Our Shareholders Corporate Governance 29
Remuneration of the Executive Board in 2018
Remuneration components
€ thousands Fixed1 Variable,
short-term Variable,
long-term2 Total Share-based
payment3
Dr. E. Degenhart 1,485 750 2,050 4,285 –5,821
J. A. Avila (until September 30, 2018)4 624 188 909 1,721 –2,966
H.-J. Duensing 829 146 880 1,855 –2,094
F. Jourdan 839 315 993 2,147 –2,767
H. Matschi 818 1,001 1,451 3,270 –2,264
Dr. A. Reinhart 820 350 1,016 2,186 –2,079
W. Schäfer 1,119 350 1,126 2,595 –3,251
N. Setzer 840 476 1,100 2,416 –2,729
Total 7,374 3,576 9,525 20,475 –23,971
1 In addition to cash components, the fixed remuneration includes non-cash elements, such as benefits relating to international assignments and in particular any related taxes paid, company cars and insurance.
2 Long-term component of the variable remuneration that is converted into virtual shares of Continental AG to ensure a focus on sustainable development of the company and benefits granted under the 2018 long-term incentive plan.
3 Long-term component of the variable remuneration that is converted into virtual shares of Continental AG to ensure a focus on sustainable development of the company, the granting of the 2018 long-term incentive plan, as well as the changes in the value of the virtual shares granted in previous years and in the value of the 2015 to 2018 long-term incentive plans.
4 Because Mr. J. A. Avila left the Executive Board as at September 30, 2018, the remuneration is reported pro rata up until this date. The commitment from the 2018 long-term incentive plan is reported in full in variable long-term remuneration and in share-based remuneration, as Mr. J. A. Avila is still entitled under his existing employment contract.
Remuneration of the Executive Board in 2017
Remuneration components
€ thousands Fixed1 Variable,
short-term Variable,
long-term2 Total Share-based
payment3
Dr. E. Degenhart 1,463 2,098 4,387 7,948 4,979
J. A. Avila 819 1,050 2,136 4,005 2,433
Dr. R. Cramer (until August 11, 2017) 747 599 1,172 2,518 735
H.-J. Duensing 821 828 1,440 3,089 1,951
F. Jourdan 828 1,050 1,614 3,492 2,441
H. Matschi 808 905 2,039 3,752 2,392
Dr. A. Reinhart 806 979 1,436 3,221 2,158
W. Schäfer 1,109 979 2,330 4,418 2,707
N. Setzer 818 632 1,857 3,307 2,262
Total 8,219 9,120 18,411 35,750 22,058
1 In addition to cash components, the fixed remuneration includes non-cash elements, such as benefits relating to international assignments and in particular any related taxes paid, company cars and insurance.
2 Long-term component of the variable remuneration that is converted into virtual shares of Continental AG to ensure a focus on sustainable development of the company and benefits granted under the 2017 long-term incentive plan.
3 Long-term component of the variable remuneration that is converted into virtual shares of Continental AG to ensure a focus on sustainable development of the company, the granting of the 2017 long-term incentive plan, as well as the changes in the value of the virtual shares granted in previous years and in the value of the 2014 to 2017 long-term incentive plans.

30 Continental AG 2018 Annual Report To Our Shareholders Corporate Governance
Share-based payment – performance bonus (deferral) The amounts of variable remuneration converted into virtual shares of Continental AG for members of the Executive Board changed as follows:
units
Number of shares as at
Dec. 31, 2016 Payment Commitments
Number of shares as at
Dec. 31, 2017 Payment Commitments
Number of shares as at
Dec. 31, 2018
Dr. E. Degenhart 16,480 –6,123 4,252 14,609 –4,520 6,218 16,307
J. A. Avila (until September 30, 2018) 8,874 –4,794 2,188 6,268 –609 3,112 8,771
Dr. R. Cramer (until August 11, 2017) 9,063 –2,904 2,528 8,687 –2,688 1,773 7,772
H.-J. Duensing 465 — 3,293 3,758 0 2,453 6,211
F. Jourdan 6,799 –427 1,036 7,408 –2,901 3,112 7,619
H. Matschi 11,060 –4,794 963 7,229 –2,795 2,681 7,115
Dr. A. Reinhart 4,148 — 2,528 6,676 –677 2,902 8,901
W. Schäfer 10,869 –4,710 2,528 8,687 –2,688 2,902 8,901
N. Setzer 10,167 –4,208 3,023 8,982 –2,643 1,873 8,212
E. Strathmann (until April 25, 2014) 4,239 –4,239 — — — — —
H.-G. Wente (until April 30, 2015) 6,211 –3,981 — 2,230 –2,002 — 228
Total 88,375 –36,180 22,339 74,534 –21,523 27,026 80,037
€ thousands
Fair value as at
Dec. 31, 2016 Fair value of distribution
Change in fair value
Fair value of commitments
Fair value as at
Dec. 31, 2017 Fair value of distribution
Change in fair value
Fair value of commitments
Fair value as at
Dec. 31, 2018
Dr. E. Degenhart 3,151 –1,264 545 976 3,408 –1,073 –995 841 2,181
J. A. Avila (until September 30, 2018) 1,699 –990 245 502 1,456 –145 –561 421 1,171
Dr. R. Cramer (until August 11, 2017) 1,731 –599 314 581 2,027 –638 –592 240 1,037
H.-J. Duensing 88 — 21 756 865 0 –368 331 828
F. Jourdan 1,292 –88 292 237 1,733 –689 –446 421 1,019
H. Matschi 2,117 –990 344 221 1,692 –664 –439 363 952
Dr. A. Reinhart 785 — 186 581 1,552 –161 –593 393 1,191
W. Schäfer 2,082 –972 338 581 2,029 –638 –591 393 1,193
N. Setzer 1,945 –869 322 694 2,092 –628 –624 253 1,093
E. Strathmann (until April 25, 2014) 820 –875 55 — — — — — —
H.-G. Wente (until April 30, 2015) 1,196 –822 152 — 526 –476 –21 — 29
Total 16,906 –7,469 2,814 5,129 17,380 –5,112 –5,230 3,656 10,694
Heinz-Gerhard Wente, who retired on April 30, 2015, was paid commitments of €476 thousand (equivalent to 2,002 units) in 2018. As at December 31, 2018, there were commitments with a fair value of €29 thousand (equivalent to 228 units). Dr. Ralf Cramer, who was a member of the Executive Board until August 11, 2017, was paid commitments of €638 thousand (equivalent to 2,688 units) in 2018. As at December 31, 2018, there were commitments with a fair value of €1,037 thousand (equivalent to 7,772 units).
Owing to the individual arrangements specific to the company, there are certain features of the virtual shares as compared to standard options that must be taken into account in their measurement.
A Monte Carlo simulation is used in the measurement of stock op-tions. This means that log-normal distributed processes are simu-lated for the price of Continental shares. The measurement model also takes into account the average value accumulation of share prices in the respective reference period, the dividends paid, and the floor and cap for the distribution amount.

Continental AG 2018 Annual Report To Our Shareholders Corporate Governance 31
The following parameters for the performance bonus were used as at the measurement date of December 31, 2018:
› Constant zero rates as at the measurement date of December 31, 2018: 2015 tranche: -0.73% as at the due date and as at the expected payment date; 2016 tranche: -0.69% as at the due date and as at the expected payment date; 2017 tranche: -0.62% as at the due date and as at the expected payment date.
› Interest rate based on the yield curve for government bonds.
› Dividend payments as the arithmetic mean based on publicly available estimates for 2019 and 2020; the paid dividend of Continental AG amounted to €4.50 per share in 2018, and Conti-nental AG distributed a dividend of €4.25 per share in 2017.
› Historic volatilities on the basis of daily Xetra closing rates for Continental shares based on the respective remaining term for virtual shares. The volatility for the 2015 tranche is 33.10%, for the 2016 tranche 27.20% and for the 2017 tranche 23.84%.
Share-based payment – long-term incentive (LTI plans starting with 2016) The LTI plans starting with 2016 developed as follows:
€ thousands Fair value as at Dec. 31, 2016
Commitment LTI Plan 2017
Change in fair value
Fair value as at Dec. 31, 20171
Commitment LTI Plan 2018
Change in fair value
Fair value as at Dec. 31, 2018
Dr. E. Degenhart 3,578 1,550 1,339 6,467 1,550 –6,318 1,699
J. A. Avila (until September 30, 2018)3 1,640 783 630 3,053 783 –3,036 800
Dr. R. Cramer (until August 11, 2017) 1,640 120 –1842 1,576 — –1,218 357
H.-J. Duensing 1,138 783 482 2,403 783 –2,386 800
F. Jourdan 1,640 783 630 3,053 783 –3,036 800
H. Matschi 1,640 783 630 3,053 783 –3,036 800
Dr. A. Reinhart 1,026 783 449 2,258 783 –2,241 800
W. Schäfer 1,938 893 737 3,568 893 –3,525 936
N. Setzer 1,640 783 630 3,053 783 –3,036 800
H.-G. Wente (until April 30, 2015) 251 — 74 325 — –293 33
Total 16,131 7,261 5,417 28,809 7,141 –28,125 7,825
1 As at the end of the reporting period, the 2018 tranche was vested at 25%, the 2017 tranche at 50%, the 2016 tranche at 75%. The 2015 tranche was vested at 100%. 2 With the departure of Dr. R. Cramer from the company as at August 11, 2017, a portion of the commitments of the 2014, 2015 and 2016 LTI plans expired. The commitment
in 2014 of €550 thousand decreased to €497 thousand, resulting in a fair value of €717 thousand as at December 31, 2017, down by €77 thousand. The commitment in 2015 of €550 thousand decreased to €359 thousand, resulting in a fair value of €490 thousand as at December 31, 2017, down by €260 thousand. The commitment in 2016 of €550 thousand decreased to €222 thousand, resulting in a fair value of €222 thousand as at December 31, 2017, down by €327 thousand. As part of the 2017 LTI plan, a partial commitment of €120 thousand remains for Dr. R. Cramer, with a fair value of €147 thousand as at the measurement date.
3 The commitments from long-term incentive plans are reported in full for Mr. J. A. Avila, as he is still entitled under his existing employment contract.
A Monte Carlo simulation is used in the measurement of the TSR target criterion. This means that log-normal distributed processes are simulated for the price of Continental shares. The Monte Carlo simulation takes into account the average value accumulation of share prices in the respective reference period, the TSR dividends paid and the restriction for the distribution amount.
The following TSR parameters were used as at the measurement date of December 31, 2018:
› Constant zero rates as at the measurement date of December 31, 2018: 2015 LTI plan: -0.81% as at the due date and -0.71% as at the expected payment date; 2016 LTI plan: -0.70% as at the due date and -0.68% as at the expected payment date;
2017 LTI plan: -0.65% as at the due date and -0.59% as at the expected payment date; 2018 LTI plan: -0.55% as at the due date and -0.48% as at the expected payment date.
› Interest rate based on the yield curve for government bonds.
› Dividend payments as the arithmetic mean based on publicly available estimates for the years 2019 to 2021; the paid dividend of Continental AG amounted to €4.50 per share in 2018.
› Historic volatilities on the basis of daily Xetra closing rates for Continental shares based on the respective remaining term for virtual shares. The volatility for the 2015 LTI plan is 30.56%, for the 2016 LTI plan 30.03%, for the 2017 LTI plan 24.30% and for the 2018 LTI plan 25.90%.
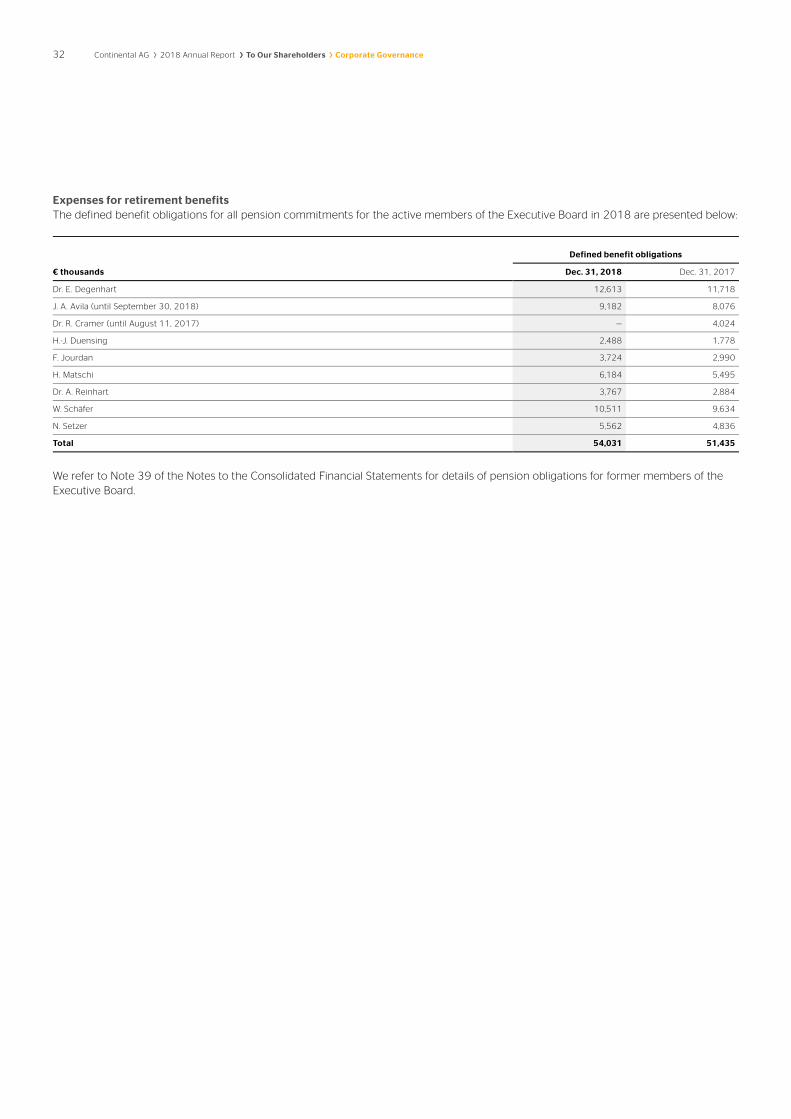
32 Continental AG 2018 Annual Report To Our Shareholders Corporate Governance
Expenses for retirement benefits The defined benefit obligations for all pension commitments for the active members of the Executive Board in 2018 are presented below:
Defined benefit obligations
€ thousands Dec. 31, 2018 Dec. 31, 2017
Dr. E. Degenhart 12,613 11,718
J. A. Avila (until September 30, 2018) 9,182 8,076
Dr. R. Cramer (until August 11, 2017) — 4,024
H.-J. Duensing 2,488 1,778
F. Jourdan 3,724 2,990
H. Matschi 6,184 5,495
Dr. A. Reinhart 3,767 2,884
W. Schäfer 10,511 9,634
N. Setzer 5,562 4,836
Total 54,031 51,435
We refer to Note 39 of the Notes to the Consolidated Financial Statements for details of pension obligations for former members of the Executive Board.
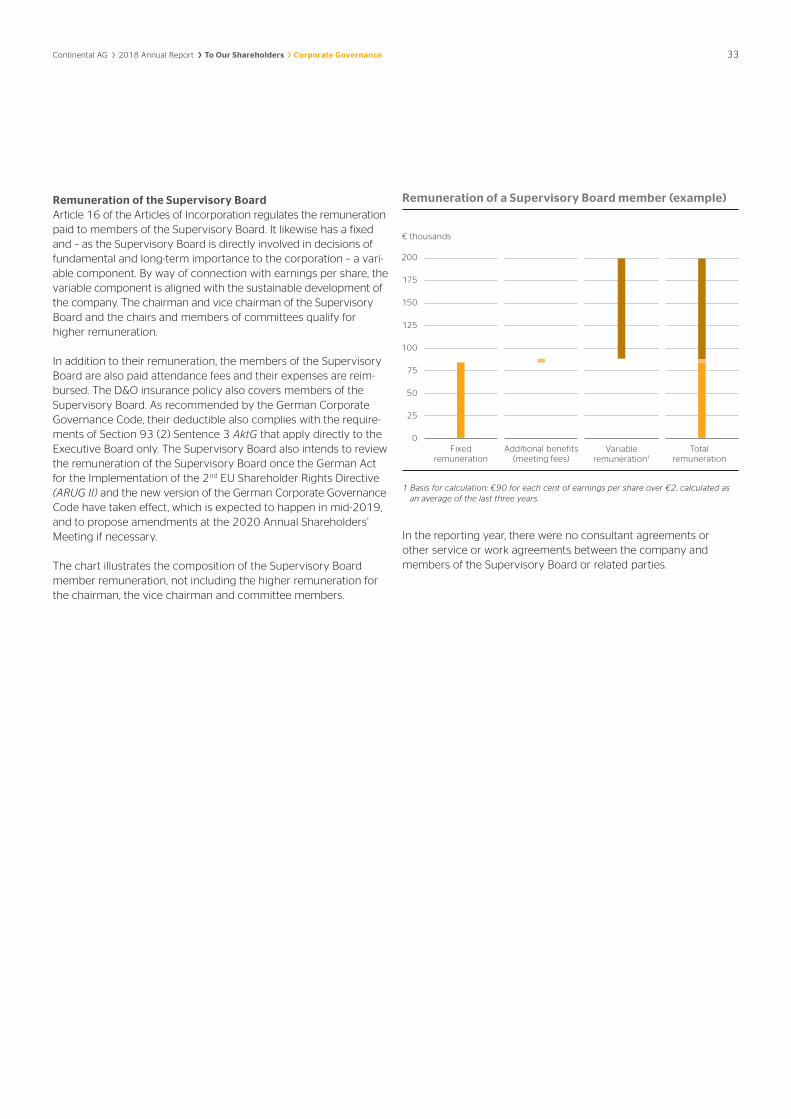
Continental AG 2018 Annual Report To Our Shareholders Corporate Governance 33
Remuneration of the Supervisory Board Article 16 of the Articles of Incorporation regulates the remuneration paid to members of the Supervisory Board. It likewise has a fixed and – as the Supervisory Board is directly involved in decisions of fundamental and long-term importance to the corporation – a vari-able component. By way of connection with earnings per share, the variable component is aligned with the sustainable development of the company. The chairman and vice chairman of the Supervisory Board and the chairs and members of committees qualify for higher remuneration.
In addition to their remuneration, the members of the Supervisory Board are also paid attendance fees and their expenses are reim-bursed. The D&O insurance policy also covers members of the Supervisory Board. As recommended by the German Corporate Governance Code, their deductible also complies with the require-ments of Section 93 (2) Sentence 3 AktG that apply directly to the Executive Board only. The Supervisory Board also intends to review the remuneration of the Supervisory Board once the German Act for the Implementation of the 2nd EU Shareholder Rights Directive (ARUG II) and the new version of the German Corporate Governance Code have taken effect, which is expected to happen in mid-2019, and to propose amendments at the 2020 Annual Shareholders’ Meeting if necessary.
The chart illustrates the composition of the Supervisory Board member remuneration, not including the higher remuneration for the chairman, the vice chairman and committee members.
1 Basis for calculation: €90 for each cent of earnings per share over €2, calculated as an average of the last three years.
In the reporting year, there were no consultant agreements or other service or work agreements between the company and members of the Supervisory Board or related parties.
Remuneration of a Supervisory Board member (example)
Fixed remuneration
Additional b s (meeting fees)
Total remuneration
Variable remuneration1
200
175
150
125
100
75
50
25
0
€ thousands

34 Continental AG 2018 Annual Report To Our Shareholders Corporate Governance
The remuneration of individual Supervisory Board members in 2018 as provided for under these arrangements is shown in the following table.
Remuneration of the Supervisory Board
Remuneration components
2018 2017
€ thousands Fixed1 Variable Fixed1 Variable
Prof. Dr.-Ing. Wolfgang Reitzle 239 337 237 329
Christiane Benner (from March 1, 2018)2 101 141 — —
Hartmut Meine (until February 28, 2018)2 20 27 123 164
Dr. Gunter Dunkel 84 112 82 110
Francesco Grioli (from November 1, 2018)2 20 28 — —
Prof. Dr.-Ing. Peter Gutzmer 82 112 82 110
Peter Hausmann (until October 31, 2018)2 105 140 121 164
Michael Iglhaut2 123 169 123 164
Prof. Dr. Klaus Mangold 84 112 82 110
Sabine Neuß 83 112 82 110
Prof. Dr. Rolf Nonnenmacher 200 281 197 275
Dirk Nordmann2 125 169 123 164
Klaus Rosenfeld 126 169 123 164
Georg F. W. Schaeffler 127 169 126 164
Maria-Elisabeth Schaeffler-Thumann 79 112 80 110
Jörg Schönfelder2 121 168 123 164
Stefan Scholz2 84 112 82 110
Gudrun Valten2 84 112 82 110
Kirsten Vörkel2 84 112 82 110
Elke Volkmann2 84 112 82 110
Erwin Wörle2 84 112 82 110
Prof. KR Ing. Siegfried Wolf 84 112 80 110
Total 2,223 3,030 2,194 2,962
1 Including meeting-attendance fees. 2 In accordance with the guidelines issued by the German Federation of Trade Unions, these employee representatives have declared that their board remuneration is transferred
to the Hans Böckler Foundation and in one case to other institutions as well.

17
Management Report
The following management report is a combined management report as defined in Section 315 (3) of the German Commercial Code (Handelsgesetzbuch – HGB), as the future opportunities and risks of the Continental Corporation and of the parent company, Continental AG, are inextricably linked.
Glossary of Financial Terms 36 Corporate Profile 38 Structure of the Corporation 38Corporate Strategy 41Corporate Management 43Research and Development 46Combined Corporate Non-FinancialStatement 48 Sustainable Product Portfolio and Quality 48 Workforce Interests and Employees 49 Human Rights and Fair Working Conditions 51 Environment 51 Compliance 52 Purchasing and Responsibility in the Supply Chain 53 Social Responsibility and Commitment 53 Information on Non-Financial Disclosures 54
Economic Report 55 General Conditions 55 Macroeconomic Development 55 Development of Key Customer Sectors 56 Development of Raw Materials Markets 59Earnings, Financial and Net Assets Position 61 Earnings Position 62 Financial Position 68 Net Assets Position 70Automotive Group 74 Development of the Chassis & Safety Division 75 Development of the Powertrain Division 77 Development of the Interior Division 79Rubber Group 82 Development of the Tire Division 83 Development of the ContiTech Division 86
Continental AG – Short Version in Accordance with HGB 88
Other Information 90 Dependent Company Report 90Additional Disclosures and Notes Pursuant to Section 289a and Section 315a HGB 90 Remuneration of the Executive Board 91 Corporate Governance Declaration Pursuant to Section 289f HGB 92
Report on Risks and Opportunities 93
Risk and Opportunity Management and Internal Control System 93 Material Risks 95 Financial Risks 95 Risks Related to the Markets in which
Continental Operates 96 Risks Related to Continental’s
Business Operations 97 Legal and Environmental Risks 99 Material Opportunities 101 Statement on Overall Risk and Opportunities Situation 102
Report on Expected Developments 103
Future General Conditions 103 Forecast of Macroeconomic Development 103 Forecast for Key Customer Sectors 104 Outlook for the Continental Corporation 105
36 Continental AG 2018 Annual Report Management Report Glossary of Financial Terms
The following glossary of financial terms applies to the Management Report and the Consolidated Financial Statements.
Adjusted EBIT. EBIT before amortization of intangible assets from purchase price allocation (PPA), changes in the scope of consolida-tion, and special effects (e.g. impairment, restructuring, and gains and losses from disposals of companies and business operations). Since it eliminates one-off effects, it can be used to compare opera-tional profitability between periods.
Adjusted sales. Sales adjusted for changes in the scope of consoli-dation.
American depositary receipts (ADRs). ADRs securitize the own-ership of shares and can refer to one, several or even a portion of a share. ADRs are traded on U.S. stock exchanges in the place of for-eign shares or shares that may not be listed on U.S. stock exchanges.
Capital employed. The funds used by the company to generate its sales.
Changes in the scope of consolidation. Changes in the scope of consolidation include additions and disposals as part of share and asset deals. Adjustments were made for additions in the reporting year and for disposals in the comparative period of the prior year.
Continental Value Contribution (CVC). The absolute amount of additional value created. The delta CVC represents the change in absolute value creation compared to the prior year. Delta CVC al-lows us to monitor the extent to which management units generate value-creating growth or employ resources more efficiently.
The CVC is measured by subtracting the weighted average cost of capital (WACC) from the return on capital employed (ROCE) and multiplying this by the average operating assets for the fiscal year. The WACC calculated for the Continental Corporation corresponds to the required minimum return. The cost of capital is calculated as the weighted average ratio of the cost of equity and borrowing costs.
Currency swap. Swap of principal payable or receivable in one currency into similar terms in another currency. Often used when issuing loans denominated in a currency other than the functional currency of the lender.
Derivative instruments. Transactions used to manage interest rate and/or currency risks.
Dividend payout ratio. The ratio between the dividend for the fiscal year and the earnings per share.
EBIT. Earnings before interest and tax. In Continental’s financial re-ports, this abbreviation is defined as earnings before financial result and tax. It is the result of ordinary business activities and is used to assess operational profitability.
EBITDA. Earnings before interest, tax, depreciation and amortiza-tion. In Continental’s financial reports, this abbreviation is defined as earnings before financial result, tax, depreciation and amortiza-tion. It equals the sum of EBIT; depreciation of property, plant and equipment; amortization of intangible assets; and impairment, ex-cluding impairment on financial investments. This key figure is used to assess operational profitability.
Finance lease. Under a finance lease, the lessor transfers the in-vestment risk to the lessee. This means that the lessor bears only the credit risk and any agreed services. The lessee is the beneficial owner of the leased asset. Finance leases are characterized by a fixed basic term during which the lease may not be terminated by the lessee.
Financial result. The financial result is defined as the sum of inter-est income, interest expense, the effects from currency translation (resulting from financial transactions), the effects from changes in the fair value of derivative instruments, and other valuation effects. The financial result is the result of financial activities.
Free cash flow. The sum of cash flow arising from operating activi-ties and cash flow arising from investing activities. Also referred to as cash flow before financing activities. Free cash flow is used to assess financial performance.
Gearing ratio. Net indebtedness divided by equity. Also known as the debt-to-equity ratio. This key figure is used to assess the financ-ing structure.
Gross domestic product (GDP). A measure of the economic per-formance of a national economy. It specifies the value of all goods and services produced within a country in a year.
Hedging. Securing a transaction against risks, such as fluctuations in exchange rates, by entering into an offsetting hedge transaction, typically in the form of a forward contract.
IAS. International Accounting Standards. Accounting standards developed and resolved by the IASB.
IASB. International Accounting Standards Board. Independent standardization committee.
IFRIC. International Financial Reporting Interpretations Committee (predecessor of the IFRS IC).
IFRS. International Financial Reporting Standards. The standards are developed and resolved by the IASB. In a broad sense, they also include the IAS, the interpretations of the IFRS IC or of the prede-cessor IFRIC as well as the former SIC.
IFRS IC. International Financial Reporting Standards Interpretations Committee.
Interest-rate swap. The exchange of interest payments between two parties. For example, this allows variable interest rates to be exchanged for fixed interest or vice versa.
Glossary of Financial Terms

Continental AG 2018 Annual Report Management Report Glossary of Financial Terms 37
Net indebtedness. The net amount of interest-bearing financial liabilities as recognized in the statement of financial position, the fair values of the derivative instruments, cash and cash equivalents, as well as other interest-bearing investments. This figure is the basis for calculating key figures of the capital structure.
Operating assets. The assets less liabilities as reported in the statement of financial position, without recognizing the net indebt-edness, sale of trade accounts receivable, deferred tax assets, income tax receivables and payables, as well as other financial assets and debts. Average operating assets are calculated as at the end of the quarterly periods and, according to our definition, correspond to the capital employed.
Operating lease. A form of lease that is largely similar to rental. Leased assets are recognized in the lessor’s statement of financial position and capitalized.
PPA. Purchase price allocation. The process of breaking down the purchase price and assigning the values to the identified assets, liabilities and contingent liabilities following a business combina-tion. Subsequent adjustments to the opening statement of financial position – resulting from differences between the preliminary and final fair values at the date of initial consolidation – are also recog-nized as PPA.
Rating. Standardized indicator for the international finance markets that assesses and classifies the creditworthiness of a debtor. The classification is the result of an economic analysis of the debtor by specialist rating companies.
Research and development expenses (net). Research and devel-opment expenses (net) are defined as expenses for research and development less reimbursements and subsidies that we received in this context.
Return on capital employed (ROCE). The ratio of EBIT to average operating assets for the fiscal year. ROCE corresponds to the rate of return on the capital employed and is used to assess the company’s profitability and efficiency.
SIC. Standing Interpretations Committee (predecessor to the IFRIC).
Tax rate. The ratio of income tax expense to the earnings before tax. It can be used to estimate the company’s tax burden.
Weighted average cost of capital (WACC). The weighted average cost of the required return on equity and net interest-bearing liabili-ties.
Working capital. Inventories plus trade accounts receivable less trade accounts payable. It does not include receivables from and liabilities to related parties or sale of trade accounts receivable.

38 Continental AG 2018 Annual Report Management Report Corporate Profile
Corporate structure focused on flexibility and sustainable value creation.
Market- and customer-oriented corporate structure In 1871, Continental Aktiengesellschaft (AG) was founded in Hanover as Continental-Caoutchouc- und Gutta-Percha Compagnie. Today, Continental AG, still headquartered in Hanover, Germany, is the parent company of the Continental Corporation. The Continental Corpora-tion comprises 572 companies, including non-controlled companies, in addition to the parent company Continental AG. The Continental team is made up of 243,226 employees at a total of 544 locations in 60 countries and markets. The postal addresses of companies under our control are defined as locations.
Overall responsibility for management is borne by the Executive Board of Continental AG. In the reporting year, each division was represented by one Executive Board member until September 30, 2018. Since October 1, 2018, the Powertrain division has been under new management as a result of its transformation into an independent group of legal entities from 2019. With the exception of Corporate Purchasing, the central functions of Continental AG are represented by the chairman of the Executive Board, the chief financial officer and the Executive Board member responsible for Human Relations. They take on the functions required on a cross-divisional basis to manage the corporation. These include, in partic-ular, finance, controlling, compliance, law, IT, sustainability, quality and environment.
The effective and efficient cooperation of divisions, business units and central functions is governed by our “Balance of Cooperation.” It defines the framework of our activities across organizational, hier-archical and geographic boundaries and promotes our corporate culture on the basis of our corporate values: Trust, For One Another, Freedom To Act and Passion To Win.
With a 72% share of our consolidated sales, the automotive industry (original equipment) is our largest customer group. The importance of this industry is accordingly high for growth in the Automotive Group. In the Rubber Group, the tire business with end customers is predominant. At ContiTech, other key industries in addition to the automotive industry play a major role as well, such as railway engi-neering, machine and plant construction, mining and the replace-ment sector. We deliver high-quality, innovative and established products, systems and services. Focusing on the market and on customers is a key success factor. The global corporate structure is thus based upon a balance of decentralized structures and central functions.
In the reporting year, the corporation consisted of the Automotive Group and the Rubber Group, which comprised five divisions with 26 business units. A division or business unit is classified according to products, product groups and services or according to regions. Differences result primarily from technological product requirements, innovation and product cycles; the raw materials base; and produc-tion technology. The divisions and business units have overall re-sponsibility for their business, including their results.
Automotive Group: The Chassis & Safety division develops, produces and markets intelligent systems to improve driving safety and vehicle dynamics. Integral active and passive safety technologies and products that support vehicle dynamics provide greater safety, comfort and con-venience. The goal here is to implement “Vision Zero,” the vision of accident-free driving. The Chassis & Safety division is divided into four business units:
› Advanced Driver Assistance Systems
› Hydraulic Brake Systems
› Passive Safety & Sensorics
› Vehicle Dynamics
Corporate Profile Structure of the Corporation
World 243,226 employees
544 locations
139,972 Europe
269
Australia 1,359
4
Asia 47,140
104
44,887 North America
117
1,685 Africa
19
8,183 South America
31
544 locations in 60 countries and markets

Continental AG 2018 Annual Report Management Report Corporate Profile 39
The Powertrain division focuses on efficient and clean vehicle drive systems. Here, the division works to improve the performance of injection systems, turbochargers, transmission control units, sensors, actuator systems and exhaust-gas aftertreatment. At the same time, it paves the way for the electrification of vehicles with efficient sys-tems technology and economical vehicle integration. In the report-ing year, the division was divided into five business units:
› Engine Systems
› Fuel & Exhaust Management
› Hybrid Electric Vehicle
› Sensors & Actuators
› Transmission At the beginning of 2019, the Powertrain division was transformed into an independent group of legal entities. Since then, it has com-prised three business units:
› Engine & Drivetrain Systems
› Powertrain Components
› Hybrid & Electric Vehicles For more information, see the Corporate Strategy and the Research and Development sections.
The Interior division specializes in information management. It develops and produces network, information and communication solutions and services for cars and commercial vehicles. This en-ables and optimizes the control of the complex flow of information between the driver, passengers and the vehicle as well as mobile devices, other vehicles and the outside world. The focus is on sys-tems integration. In addition, the Interior division is involved in cross-sector collaborations with leading companies. Since December 1, 2018, the Intelligent Transportation Systems business unit has been integrated as a segment into the Commercial Vehicles & Aftermarket business unit. The division is now divided into four business units:
› Body & Security
› Commercial Vehicles & Aftermarket
› Infotainment & Connectivity
› Instrumentation & Driver HMI
Rubber Group: The Tire division is known for maximizing safety through short braking distances and excellent grip as well as reducing fuel con-sumption by minimizing rolling resistance. Tires are the vehicle’s only link with the road. They transmit all forces onto the road. It is the tire technology that determines whether a vehicle is able to stop in time and stay in the correct lane during cornering maneu-vers. 28% of sales in the Tire division relates to business with vehi-cle manufacturers, and 72% relates to the replacement business. The division is divided into six business units:
› Passenger and Light Truck Tire Original Equipment
› Passenger and Light Truck Tire Replacement Business, EMEA (Europe, the Middle East and Africa)
› Passenger and Light Truck Tire Replacement Business, The Americas (North, Central and South America)
› Passenger and Light Truck Tire Replacement Business, APAC (Asia and Pacific region)
› Commercial Vehicle Tires
› Two-Wheel Tires
The ContiTech division develops, manufactures and markets products, systems and intelligent components made of rubber, plastic, metal and fabric. They are used in machine and plant engi-neering, mining, agriculture, the automotive industry and other im-portant sectors of the future. 51% of sales in the ContiTech division relates to business with vehicle manufacturers, and 49% relates to business with other industries and in the replacement market. The division is divided into seven business units:
› Air Spring Systems
› Benecke-Hornschuch Surface Group
› Conveyor Belt Group
› Industrial Fluid Solutions
› Mobile Fluid Systems
› Power Transmission Group
› Vibration Control
Structure of the corporation
Continental CorporationSales: €44.4 billion; Employees: 243,226
Automotive GroupSales: €26.9 billion; Employees: 140,016
Rubber GroupSales: €17.6 billion; Employees: 102,763
Chassis & Safety Sales: €9.6 billion
Employees: 49,509
PowertrainSales: €7.7 billion
Employees: 42,601
InteriorSales: €9.7 billion
Employees: 47,906
TiresSales: €11.4 billionEmployees: 55,840
ContiTechSales: €6.3 billion
Employees: 46,923

40 Continental AG 2018 Annual Report Management Report Corporate Profile
Interconnected value creation Research and development (R&D) takes place at 82 locations, pre-dominantly in close proximity to our customers to ensure that we can respond flexibly to their various requirements and to regional market conditions. This applies particularly to projects of the Auto-motive Group and the ContiTech division. The product requirements governing tires are largely similar all around the world. They are adapted according to the specific requirements of each market. In this respect, R&D has a largely centralized structure in the Tire division. Continental invests about 7% of sales in R&D each year. For more information, see the Research and Development section.
Continental processes a wide range of raw materials and semi- finished products. The purchasing volume in the reporting year was €29.9 billion in total, €20.3 billion of which was for production materials. The Automotive Group uses primarily steel, aluminum, precious metals, copper and plastics. Key areas when it comes to purchasing materials and semifinished products include electronics and electromechanical components, which together make up
about 44% of the corporation’s purchasing volume of production materials. Furthermore, mechanical components account for nearly a quarter of production materials. Natural rubber and oil-based chemicals such as synthetic rubber and carbon black are key raw materials for the Rubber Group. The total purchasing volume for these materials amounts to around a sixth of the total volume for production material. For more information, see the Development of Raw Materials Markets section in the Economic Report.
Production and sales in the divisions of the Automotive Group and in the ContiTech division are organized across regions. Our tire pro-duction activities, in which economies of scale play a key role, are represented with major locations in the three dominant automotive markets in terms of production and vehicle numbers, namely Europe, the U.S.A. and China. Low production costs coupled with large vol-umes or high rates of regional growth constitute key success factors. Sales activities in the Tire division are performed worldwide via our dealer network with tire outlets and franchises as well as through tire trading in general.
Globally interconnected value creation
Purchasing
Diverse€29.9 billion in volumes
Innovative€3.2 billion in expenditure
Local€44.4 billion in sales
Global233 locations
R&D Sales & DistributionProduction

Continental AG 2018 Annual Report Management Report Corporate Profile 41
New organizational structure for strategic flexibility and long-term success.
Continental will be reorganizing itself until 2020 in order to actively shape the mobility of the future. We will therefore be able to respond even more flexibly to the requirements of various customers, mar-kets, government agencies, and companies and make faster and more efficient use of our opportunities.
A holding structure will be set up under a new umbrella brand. This will be divided into two group sectors, in addition to the Powertrain division. The reporting structure is to be used starting 2020.
› The Chassis & Safety and Interior divisions will be reorganized by the beginning of 2020. The two areas will be supported by a newly created central Automotive Research and Development function, which will bundle basic research and applications as an independent unit.
› The two current divisions Tires and ContiTech will remain un-changed in terms of their independent organizational structure and will form the second group sector.
As part of the realignment, the Powertrain division was transformed into an independent group of legal entities at the beginning of 2019. In addition to the combustion engine business, its activities will continue to include all future business involving hybrid and electric drive systems and all current battery activities. At the same time, we are preparing a partial initial public offering (IPO) for Powertrain, which will be possible in the second half of 2019. However, control over the new company is not to be relinquished in the medium to long term. The reason for the transformation into an independent group of legal entities is the change in the drive business, the de-velopment of which is determined chiefly by regulatory emission limit requirements, which vary in the markets that are important to us. Rapid adaptability is therefore essential in order to succeed in this business. Another reason is the increased focus on electric mo-bility. Considerable investments have already been made here and will continue to be necessary in the future. Furthermore, a legally independent business is in an even better position to actively sup-port the expected long-term consolidation process in these markets.
Seven strategic dimensions for enhancing the value of the corporation on a sustainable basis Our seven strategic dimensions will not be affected by the reorga-nization. They complement each other and are geared toward sus-tainably creating value for all stakeholders and ensuring the future viability of the company.
1. Value creation – enhancing the value of the corporation on a long-term basis
For us, enhancing the value of the corporation on a long-term basis means sustainable success while taking into consideration the cost of capital. Our long-term target is at least 20% ROCE. We did not reach this target in the reporting year. After 20.6% in 2017, we achieved 17.0% in 2018.
2. Regional sales balance – globally balanced distribution of sales Another aim is a globally balanced distribution of regional sales, which will allow us to become less dependent on individual regional sales markets and on market and economic fluctuations. In this way, we can take advantage of the opportunities available to us on the promising markets in Asia and North America, while also bolstering our strong market position in Europe. We aim to gradually increase the share of our consolidated sales in the Asian markets to 30%. In China, we want to grow at an above-average rate in the next few years. The total share of our sales in the North and South American markets should be maintained at a minimum of 25%.
In 2018, we achieved a 22% share of sales in Asia. The share of our sales in the North and South American markets was 28% in total.
We substantially reinforced our dealer network in Australia in 2018 by acquiring Tyre and Auto Pty Ltd., based in Melbourne, Australia, one of Australia’s largest tire and auto service suppliers. With cur-rently 258 branches, the company is well represented above all in the country’s densely populated coastal regions. The company, which has more than 1,200 employees, is headquartered in Mel-bourne. Its core business comprises the sale of tires for passenger cars and light commercial vehicles as well as tire services, inspec-tion and maintenance.
3. Top market position – among the three leading suppliers in all relevant markets
We want to shape our future based on a leading position and thus play a major role in advancing technological development in individ-ual sectors. We therefore want to be among the world’s three lead-ing suppliers with regard to customer focus, quality and market share in the long term.
In terms of sales in their respective markets, the Automotive Group’s divisions and the ContiTech division are among the leading provid-ers with the majority of their products. We are number four in the world in the tire business. Furthermore, we hold top positions in individual segments and markets.
Among suppliers with sales of more than €3 billion, we play a lead-ing role in digitalization. The digital products include, for example, sensors, electronics and software products.
4. In the market for the market – high degree of localization Our global business model is based on a high degree of localiza-tion, with numerous product applications developed and produced locally. In this way, we are best able to meet the respective market conditions and requirements of our customers. The aim is for at least eight out of 10 application developments to be carried out locally, and for the percentage of local production to be just as high. Through our development and production teams worldwide, we offer solutions and products for high-quality cars and affordable vehicles, as well as customized industrial applications. At the same time, we are purchasing locally – insofar as this is possible and cost-effective – as well as marketing locally.
Corporate Strategy

42 Continental AG 2018 Annual Report Management Report Corporate Profile
We have production locations in 38 of the 60 countries and markets in which we are represented. In 2018, we expanded our production in various countries. In Hungary, the production of hoses and air sleeves was expanded and a new plant was planned for automotive electronics. In Lithuania, we laid the foundations for the production of electronic components. In the U.S.A., we expanded production capacity for high-quality synthetic leather materials, which are used in transportation, the leisure sector and the hospitality industry.
We are still working on being able to count one of the Asian manu-facturers among our five largest automotive customers. We aim to achieve this with a high degree of localization. Two Asian manufac-turers are among our 10 largest customers.
5. Balanced customer portfolio – balance between automotive and other industries
In order to reduce dependence on the automotive industry, business is to be increased in industries outside of the automotive original equipment sector while at the same time achieving further growth with carmakers. In the medium to long term, we want to lift the share of sales with end users and industrial customers outside of the automotive original equipment sector toward a figure of 40%. This will be based on our Tire and ContiTech divisions.
Our activities relating to software products for the end-user market will have an increasing effect on our customer portfolio. Examples include advanced traffic management, intelligent payment systems, maintenance management and new technologies that go beyond the vehicle.
The share of sales with end users and industrial customers devel-oped steadily at 30% in 2018.
6. Technological balance – combination of established and pioneering technologies
Our product portfolio should consist of a profitable and viable mix of established and pioneering technologies. We set and follow new trends and standards in high-growth markets and market segments. In our established core markets, we ensure that our position as one of the leading automotive suppliers and industrial partners keeps on developing. This allows us to be represented and competitive in all phases of the respective product life cycles.
We are now working on getting highly automated driving ready for production and at the same time on systems for fully automated driving on the highway in 2025. Highly automated driving will allow drivers to temporarily focus on activities other than driving. With fully automated driving, this should be possible for sections of the route without the driver having to act as a fallback mode. We are also focusing on autonomous driving. Firstly, we are testing compo-nents and systems for driverless robot taxis in cities with our Conti-nental Urban Mobility Experience (CUbE) test platform. Secondly, we are already pursuing the development of vehicle systems for autonomous vehicle fleets as a conceptual idea for the more distant future.
We are expanding our portfolio with software-based and mobility services that complement existing products and benefit our cus-tomers.
7. Great people culture – a culture of inspiration An inspiring management culture, in which employees can enjoy demonstrating their full commitment and achieving top perfor-mance, is a requirement for a successful business. We promote a culture of trust and personal responsibility, one in which we openly deal with and tolerate our mistakes and turn them into lessons learned. Our working conditions are intended to make it easy for our employees to focus on what is important and to strike the right work-life balance. We keep in regular contact with our employees, for example through our worldwide survey, OUR BASICS Live, which is carried out annually with a representative sample of the workforce. This gives our employees the chance to tell us about how satisfied they are in general, the quality of management in the company and their attitude toward Continental. Participation is voluntary and anonymous.
More than 50,000 employees took part in the survey in the report-ing year. At 86%, agreement with our four corporate values remains high. This high percentage is particularly pleasing since we are cur-rently seeing extremely radical changes in the industries relevant to us. For the automotive industry alone, digitalization, automation, connectivity and electrification represent the greatest upheaval in its more-than-130-year history. For more information on the em-ployee survey, see page 50.

Continental AG 2018 Annual Report Management Report Corporate Profile 43
The goal is the sustained increase in the corporation’s value.
Value management Key financial performance indicators for Continental relate to the development of sales, capital employed and adjusted EBIT margin, as well as the amount of capital expenditure and free cash flow. To allow us to use the financial performance indicators for manage-ment purposes as well, and to map the interdependencies between these indicators, we summarize them as key figures as part of a value-driver system. Our corporate objectives center on the sus-tainable enhancement of the value of each individual business unit. This goal is achieved by generating a positive return on the capital employed in each respective business unit. At the same time, this return must always exceed the equity and debt financing costs of acquiring the operating capital. It is also crucial that the absolute contribution to value (Continental Value Contribution, CVC) increases year for year. This can be achieved by increasing the return on cap-ital employed (with the costs of capital remaining constant), lower-ing the costs of capital (while maintaining the return on capital em-ployed), or decreasing capital employed over time. The performance indicators used are EBIT, capital employed, and the weighted aver-age cost of capital (WACC), which is calculated from the proportional weight of equity and debt costs.
EBIT is calculated from the ongoing sales process. The figure is the net total of sales, other income and expenses plus income from equity-accounted investees and from investments but before finan-cial result and income tax expense. Consolidated EBIT amounted to €4.0 billion in 2018.
Capital employed is the funds used by the company to generate its sales. At Continental, this figure is calculated as the average of oper-ating assets as at the end of the quarterly reporting periods. In 2018, average operating assets amounted to €23.6 billion.
The return on capital employed (ROCE) represents the ratio of these two calculated values. Comparing a figure from the state-ment of income (EBIT) with one from the statement of financial position (capital employed) produces an integral analysis. We deal with the problem of the different periods of analysis by calculating the capital employed as an average figure over the ends of quarterly reporting periods. ROCE amounted to 17.0% in 2018 and was thus below 20% for the first time since 2013, but still significantly ex-ceeded the weighted average cost of capital.
The weighted average cost of capital (WACC) is calculated to deter-mine the cost of financing the capital employed. Equity costs are based on the return from a risk-free alternative investment plus a market risk premium, taking into account Continental’s specific risk. Borrowing costs are calculated based on Continental’s weighted debt-capital cost rate. Based on the long-term average, the weighted average cost of capital for our company is about 10%.
Value is added only if ROCE exceeds the weighted average cost of capital (WACC). We call this value added, produced by subtracting WACC from ROCE multiplied by average operating assets, the Con-tinental Value Contribution (CVC). In 2018, the CVC amounted to €1,654.8 million.
According to our definition, the value of the company increases when the CVC demonstrates positive growth in value.
ROCE by division (in %) 2018 2017
Chassis & Safety 16.0 19.9
Powertrain 3.3 13.2
Interior 17.6 14.9
Tires 29.1 35.0
ContiTech 12.6 13.9
Continental Corporation 17.0 20.6
Financing strategy Our financing strategy aims to support value-adding growth of the Continental Corporation while at the same time complying with an equity and liabilities structure adequate for the risks and rewards of our business.
The corporate function Finance & Treasury provides the necessary financial framework to finance corporate growth and secure the long-term existence of the company. The company’s annual invest-ment requirements will be 7% to 8% of sales in the coming years. The reasons for this are the continuing increase in incoming orders in the Automotive Group and the successful implementation of Vision 2025 in our Tire division, which will mean the expansion of tire production capacity, particularly in North America and Asia.
Continental Value Contribution (CVC) € millions ROCE %
1,673
2,145 2,045
2,350
1,655
20.0%20.9%
20.0% 20.6%
17.0%
2014 2015 2016 2017 2018
Corporate Management

44 Continental AG 2018 Annual Report Management Report Corporate Profile
Our goal is to finance ongoing investment requirements from the operating cash flow. Other investment projects, for example acqui-sitions, should be financed from a balanced mix of equity and debt depending on the ratio of net indebtedness to equity (gearing ratio) and the liquidity situation to achieve constant improvement in the respective capital market environment. In general, the gearing ratio should remain below 20% in the coming years and not exceed 60% in general. If justified by extraordinary financing grounds or specific market circumstances, we can rise above this maximum level under certain conditions. The equity ratio should exceed 35%. In the reporting year, it was 45.3% and the gearing ratio 9.1%.
Our gross indebtedness should be a balanced mix of liabilities to banks and other sources of financing on the capital market. For short-term financing in particular, we use a wide range of financing instruments. As at the end of 2018, this mix consisted of bonds (41%), syndicated loan (3%), other bank liabilities (24%) and other indebtedness (32%) based on the gross indebtedness of €4,606.9 million. The committed volume of the syndicated loan, which con-sists of the revolving tranche, remained unchanged at €3.0 billion. The tranche will run until April 2021. The financing mix will not change significantly. Starting in 2019, however, all liabilities from leases will be recognized under gross indebtedness due to the ap-plication of IFRS 16, Leases, starting from January 1, 2019. This will accordingly lead to an increase in gross indebtedness.
The corporation strives to have at its disposal unrestricted liquidity of about €1.5 billion. This is supplemented by committed, unutilized credit lines from banks in order to cover liquidity requirements at all times. These requirements fluctuate during a calendar year owing in particular to the seasonal nature of some business areas. In addi-tion, the amount of liquidity required is also influenced by corpo-rate growth. Unrestricted cash and cash equivalents amounted to €2,587.7 million as at December 31, 2018. There were also com-mitted and unutilized credit lines of €3,504.1 million.
Gross indebtedness amounted to €4,606.9 million as at Decem-ber 31, 2018. Key financing instruments are the syndicated loan with a revolving credit line of €3.0 billion that has been granted until April 2021 and bonds issued on the capital market.
The carrying amount drawn under the revolving line of credit was €154.3 million as at December 31, 2018. Around 40% of gross in-debtedness is financed on the capital market in the form of bonds maturing between February 2019 and September 2020. The interest coupons vary between 0.0% and 3.125%. The repayment amounts are €500.0 million in 2019, and €600.0 million and €750.0 million in 2020. In addition to the forms of financing already mentioned, there were also bilateral credit lines with various banks in the amount of €1,799.5 million as at December 31, 2018. Conti-nental’s corporate financing instruments currently also include sale-of-receivables programs and commercial paper programs. In the second half of 2018, the existing commercial paper programs were supplemented with an additional U.S. $500.0 million commercial paper program in the U.S.A.
Maturity profile Continental always strives for a balanced maturity profile of its liabilities in order to be able to repay the amounts due each year from free cash flow as far as possible. Other than short-term maturi-ties, which are usually rolled on to the next year, the repayment of the €500.0 million bond maturing in February 2019 and of the €600.0 million and €750.0 million bonds maturing in February and September 2020 is also on the agenda for 2019 and 2020.
Composition of gross indebtedness (€4,607 million)
Other bankliabilities
Syndicatedloan
Otherindebtedness
Bonds
1,085
154
1,473
1,895
Maturities of gross indebtedness (€4,607 million)
3,158
1,368
7 7 67
2019 2020 2021 2022 from 2023

Continental AG 2018 Annual Report Management Report Corporate Profile 45
Continental’s credit rating unchanged In the reporting period, Continental AG was rated by the three rat-ing agencies Standard & Poor’s, Fitch and Moody’s, each of which maintained their credit ratings for Continental AG during 2018.
Credit rating for Continental AG
December 31, 2018 December 31, 2017
Standard & Poor’s1
Long-term BBB+ BBB+
Short-term A-2 A-2
Outlook stable stable
Fitch2
Long-term BBB+ BBB+
Short-term F2 F2
Outlook stable stable
Moody’s3
Long-term Baa1 Baa1
Short-term no rating no rating
Outlook stable stable
1 Contracted rating since May 19, 2000. 2 Contracted rating since November 7, 2013. 3 Non-contracted rating since February 1, 2014.
46 Continental AG 2018 Annual Report Management Report Corporate Profile
Automated driving, electric mobility, connectivity and digitalization are our core topics.
Our research and development (R&D) activities focus on develop-ing innovative and sustainable products, systems and services for our customers in a wide variety of industries.
As part of the preparations for the new organizational structure, which will be implemented from 2020 onwards, we have been working on the design of the new central Automotive R&D function since the beginning of 2019. This new area will incorporate the development functions of our present Interior and Chassis & Safety divisions as well as those of our current central functions. By the end of the year, autonomous driving and connected mobility tech-nologies will be combined under the roof of Automotive R&D. Our software and hardware engineers will form a global center for pre-development and application development.
The new area will strengthen our cross-organizational collaboration, shorten innovation cycles and further enhance the flexibility of our innovation processes – particularly in relation to software develop-ment. Our customers and end users will benefit from state-of-the-art, affordable solutions that help to prevent accidents, bypass traffic jams and increase driving comfort.
The Powertrain division’s R&D locations have stayed virtually the same. Their areas of focus include combustion engine, hybrid and all-electric drive systems – including battery activities.
The R&D organizations of the Tire and ContiTech divisions will re-main unchanged by the future organizational structure. R&D activi-ties in the ContiTech division have a largely decentralized structure by virtue of the different product segments. The central Innovation
& Digitalization unit and the central Business Development unit that the ContiTech division set up over the course of the reporting year have the goal of fostering innovative products and enhancing the existing portfolio with new services including mobility services. Product requirements for tires are very similar worldwide, which is why R&D has a mostly centralized structure. For example, our R&D site in Hanover-Stöcken has around 1,400 employees working on the development of up to 9,000 different tires to meet various re-quirements with regard to speed rating approvals, rolling resistance optimization, inch dimensions and application purpose. Our inter-national scouting system ensures that we pay sufficient attention to the requirements of local markets.
Machine-learning advanced driver assistance system We completed an exceptionally complex project during the reporting year: PRORETA 4, a three-and-a-half-year research project carried out in partnership with the Technical University of Darmstadt. The project’s aim was to develop a machine-learning vehicle system (City Assist System) to help drivers navigate inner-city traffic. The system is already being used as a prototype. Radar sensor data helps the system to assess the traffic situation when making a left turn, entering a roundabout or approaching a right-before-left inter-section. Machine-learning technology played an instrumental part in the project.
To enable an assistance system in a complex driving situation to give the driver a recommendation that the driver will accept – and to become familiar with the driver as a good passenger would – the system needs to analyze the driver’s driving style and subjective perception of safety and risk. Using a machine learning method is a quick and reliable way of developing this kind of driving profile in which the system analyzes data that is recorded during the process of driving. Acceleration, direction of movement, braking maneuvers and lateral acceleration are all things that provide the algorithm with information on the type of driver it is dealing with.
2018 2017
Research and development expenses (net) € millions % of sales € millions % of sales
Chassis & Safety 1,023.2 10.7 913.8 9.4
Powertrain 672.6 8.7 699.0 9.1
Interior 1,064.7 11.0 1,062.7 11.4
Tires 299.4 2.6 289.8 2.6
ContiTech 149.1 2.3 138.4 2.2
Continental Corporation 3,209.0 7.2 3,103.7 7.1
Capitalization of research and development expenses 158.0 92.1
in % of research and development expenses 4.7 2.9
Depreciation on research and development expenses 90.0 74.5
Research and Development

Continental AG 2018 Annual Report Management Report Corporate Profile 47
Extensive test drives with test subjects have revealed that the algo-rithms used in the City Assist System are able to make conclusions about the driver’s current driving style after three to five driving maneuvers. The driver is then assigned to one or several clusters of driving profiles, which allows the City Assist System to personal-ize its driving recommendations.
Continental’s global research network for artificial intelligence (AI) continued to expand in the year under review. After the University of Oxford, DFKI (German Research Center for Artificial Intelligence) and other organizations, Continental signed an agreement with the AI research group Berkeley DeepDrive (BDD) at the University of California. This partnership focuses on optimizing the speed of neural networks in cars, as well as protecting AI systems in safety-critical applications. The AI research results should make their way into production as quickly as possible.
Research and testing laboratory for dandelion rubber opened During the reporting year, we opened the Anklam Taraxagum Lab – a research and development laboratory in Anklam, Germany. The lab will continue its research into the cultivation and processing of the Russian dandelion plant as an alternative raw material source to rubber harvested from rubber trees. The plan is to be using dan-delion rubber in volume production and generating a growing per-centage of our natural rubber supply from dandelion plants within a ten-year timeframe. We see the Russian dandelion plant as an im-portant alternative and supplement to conventional natural rubber as it will enable us not only to meet the growing global demand for rubber by reliable means, but also to make tire production more sustainable and environmentally friendly.
First self-driving tire-testing vehicle Our first self-driving vehicle for testing tires on a variety of surfaces is now operational at our test track in Uvalde, Texas, U.S.A. Our aim is to further enhance the validity of test results for Continental pas-senger and light truck tires and minimize the impact of the test process on the results themselves. The new test vehicle is controlled with the help of a satellite-based positioning system and is based on Continental’s Cruising Chauffeur, which was developed for auto-mated driving on freeways. Automated vehicles allow us to repro-duce processes accurately so that every tire undergoing testing is subjected to exactly the same conditions. This means that we can reliably determine that any differences in the test results are actually due to the tires themselves and not to the test procedure.
Intelligent solutions for conveyor belts To demonstrate the different conveyor belt service options that ex-ist for bulk materials and piece goods, we have developed a model that illustrates the latest market trends for belt monitoring as well as full-service applications. Our solutions are equipped with sensors that monitor every movement the conveyor belt and the conveyed material make. They inspect surfaces, report load levels and identify mistracking belts in real time. The information is stored in databases and analyzed by algorithms, which know when the belt needs ser-vicing. Furthermore, there are monitoring systems in place to inspect the belts’ safety-related properties.
The technology also meets the conditions required for new busi-ness models like “pay per ton” and anticipatory maintenance of components and systems.
We are already in a position where our customers are able not only to purchase a belt, but also to put together an end-to-end package comprising conveyor belts and services.
2,812
2,431
381
3,104
2,676
428
3,209
2,761
449
2016 2017 2018 2016 2017 2018 2016 2017 2018
Continental CorporationAutomotive GroupRubber Group
6.9% 7.1% 7.2%
9.9% 10.1% 10.3%
2.4% 2.4% 2.5%
R&D expenses (net) € millions R&D ratio %
Continental Corporation Automotive Group Rubber Group

48 Continental AG 2018 Annual Report Management Report Corporate Profile
For Continental, sustainable business practices mean having a positive impact on society.
For Continental, sustainable business practices mean having a posi-tive impact on society. We thus want to secure our long-term success in the interest of all stakeholders and make important contributions to the future viability of our industries. Especially in the current dy-namic transformation of the automotive industry, it is vital to sys-tematically weigh up the various perspectives on our value creation. Dialogue with investors, customers, politicians and other stakehold-ers – for example, on clean and safe mobility, connected vehicles or automated driving – is a central element of this approach.
At Continental, sustainability is a strategic task for corporate develop-ment and therefore a task for the Executive Board. Dr. Ariane Rein-hart is the head of Human Relations and Sustainability. She is there-fore also responsible for the Sustainability department, which was newly created in the reporting year and coordinates the sustainabil-ity strategy, its development and an interdepartmental Sustainabil-ity Committee. All relevant business units and central functions are represented on the Sustainability Committee alongside Dr. Reinhart and another Executive Board member.
Continental is committed to the United Nations Global Compact and is a member of the sustainability associations econsense, World Business Council for Sustainable Development (WBCSD) and other initiatives.
Sustainable Product Portfolio and Quality
The global automotive industry is undergoing the greatest and most profound transformation in its history of over 130 years. Con-nectivity, automated driving, new safety solutions and clean mobil-ity concepts are changing the industry at astonishing speed. At the same time, manufacturers and suppliers are increasing the com-plexity and diversity of models and speeding up development cy-cles. This is continuously increasing quality expectations.
Management approach For Continental, the combination of pioneering innovations with high product quality is laying the foundation for sustainable prod-ucts and solutions. As part of our quality policy, we have set our-selves the objective of being recognized by our customers as a benchmark in quality. This means that we want to develop innova-tive products at the high quality that our customers expect from us. Together with our customers, we can thus make a contribution to more sustainable mobility. In accordance with our corporate strat-egy, we implement the quality policy with a close connection to the local markets through our worldwide development centers and quality labs as well as quality officers and certified quality manage-ment systems at our locations. This decentralized implementation is coordinated and supported by the Global Quality Leadership Team, which comprises representatives of the central functions, divisions and countries. Standardized product life cycle processes,
adapted to the needs of the various business fields, ensure system-atic and high-quality product development across all stages – from innovation to the end of parts supply. These processes are continu-ously being developed and optimized.
Results and performance indicators We already offer our customers a broad range of products that contribute to safe and clean mobility, for example the following solutions:
› Virtual A-pillar: Forward blind spots are eliminated thanks to anintegrated OLED display and the combination of head-movementtracking and live images of the exterior environment.
› EcoContact 6: This high-tech summer tire for passenger carsdelivers the highest standards of safety, precise handling, long tirelife and low fuel consumption. It offers a 20% longer tire life anda 15% lower rolling resistance, and is currently certified under EUlabel A/A in about 40 sizes.
› Super Clean Electrified Diesel: A Continental research vehicle isproving that “super clean” diesel is possible. Specialists from thecorporation have equipped a production vehicle of the Euro 6bemissions standard with Continental technologies already avail-able, thus reducing its nitrogen oxide emissions to such an extentthat it keeps well within even future limits from 2020 in everydayuse.
› People’s hybrid: A 48-volt electric motor, which entered productionin 2018, forms the core of an electrified powertrain. The combi-nation of zero-emission coasting, early activation of the start-stopfunction and improved brake energy regeneration is proven to re-duce consumption by as much as 21% in real driving conditions.
› Electronic air spring damping solution: When a commercial vehicleis traveling on the highway, its air resistance and thus fuel con-sumption can be reduced by lowering the vehicle’s entire cab.
In the reporting year, products that are energy efficient or help to reduce pollutant or carbon dioxide emissions accounted for nearly 40% of consolidated sales, by our own estimates.
The foundation for the industrial implementation of these solutions is laid by anchoring quality in the development and production processes. At the end of 2018, over 250 Continental development and production locations had certified quality management systems according to IATF 16949 or ISO 9001 or similar. This represents the major development and production locations and encompasses nearly 90% of the total workforce. The IATF 16949 standard is the quality management standard adapted specifically to the require-ments of the automotive industry.
You will find more information on product innovations and quality aspects in the Research and Development section, the Report on Risks and Opportunities, “Other Disclosures” in the Notes to the Consolidated Financial Statements and online under the Prod-ucts & Innovations heading.
Combined Corporate Non-Financial Statement
Continental AG 2018 Annual Report Management Report Corporate Profile 49
Workforce Interests and Employees
Our people, our culture, our future – in our eyes, employees and corporate culture guarantee the success of our company. Ground-breaking solutions and pioneering technologies can only be created in an inspiring environment that allows freedom and encourages trusting cooperation across national, business and departmental borders. As at December 31, 2018, Continental had a total of 243,226 employees of more than 150 nationalities in 60 countries and markets. Their performance and satisfaction are key compo-nents of our business success.
Management approach Our ambition for our relationship with our employees is based on a holistic perspective, whereby they are to be respected, their achievements appreciated, and their skills and abilities developed to the best possible extent.
The supreme principles for HR work and the treatment of employees are provided by Continental’s four corporate values:
› Trust: We give and receive trust.
› Passion To Win: We want to win.
› Freedom To Act: We grow by exercising freedom responsibly.
› For One Another: We create the highest value by being there for one another.
The corporate values are complemented by a Code of Conduct, which includes fair working conditions and is a globally binding directive for all employees.
We bundle the strategic activities of HR work in two strategic areas:
› We group projects and initiatives that help us meet our consider-able need for employees with the right skills and abilities – now and in the future – under “Industrialize Best Fit.”
› “Enable Transformation” bundles projects and initiatives with which we support the digital transformation at Continental in order to make the most of the opportunities presented by digitalization.
Local HR (Human Relations) departments at the individual locations, experts at our global centers of expertise, and HR specialists work-ing in the divisions and business units comprise a global HR network that works toward the attainment of these goals. They are coordi-nated via global committees comprising central HR functions, the HR managers of the divisions, the HR managers of the countries and the Executive Board member responsible for Human Relations.
We are proud of the diversity that our employees bring to our com-pany worldwide. Together, we want to use diversity – for example, in terms of gender, culture and religion – to gain different perspec-tives on innovation and performance. To this end, we must find, recruit, inspire and develop talented individuals.
Key elements include the aim to increase the proportion of female managers to 16% by 2020 and to 25% by 2025. Another element for both transformation and employer attractiveness is making work more flexible. Since 2016, we have laid the foundations for flexible working conditions, which are developed locally. These include mobile working, part-time and flextime, and sabbaticals. Potential can thus be used more appropriately, professional and private lives unified more individually and, ultimately, employees better motivated and acquired. More satisfied employees are also usually healthier and more productive. This is also helped by the various occupational health and safety activities, which are imple-mented in particular in local management systems.
Significant projects and processes that we advanced in the report-ing year were
› the enhancement of the global process for strategic workforce planning,
› the certification of leadership development in accordance with ISO 29990,
› the worldwide introduction of Microsoft Office 365 and new tools and platforms for digital and mobile collaboration,
› the global implementation of talent management conferences for salaried employees,
› the introduction of a global digital platform for learning and train-ing (Learning Management Solution), such as for software engi-neers as part of a Software Academy, and
› the simultaneous increase in certifications for occupational safety management systems and the transfer to the new ISO 45001 standard.
For the upcoming changes at Continental, the Executive Board, Corporate Works Council, the corporate committee of executive representatives (Konzernsprecherausschuss der leitenden Angestellten), and the trade unions IG BCE and IG Metall adopted “Continental in Motion,” a key benchmark paper and alliance for the future for Germany, which is the common basis for the organi-zational realignment. A comparable paper was also adopted at European level. For more information on reorganization, see the Structure of the Corporation and Corporate Strategy sections.

50 Continental AG 2018 Annual Report Management Report Corporate Profile
Results and performance indicators In the reporting year, the number of employees worldwide rose by 3% to 243,226. Germany and India posted the largest absolute growth rates. Despite the difficult market environment in the years to come, Continental’s workforce will keep on growing through ac-quisitions and organic growth. Long-term workforce planning is based on the corporation’s strategic workforce planning system, which is conducted on the basis of the employees recorded in the HR data system and covers 97% of the total workforce. Over a five-year horizon, the strategic HR planning system analyzes how em-ployee numbers will develop and which disciplines will be required – including where and to what extent they will be required. For exam-ple, Continental’s software and IT functions will thus be growing substantially. At present, we already have about 19,000 employees in this area. We prioritize further training, development and place-ment of our own employees via the internal job market. In order to retain and develop our own talented employees, talent manage-ment conferences were held for over 80,000 salaried employees, at which individual potential and areas for development were as-sessed and measures defined. A target-group-specific approach is essential to additionally find and recruit the right external candi-dates in areas where they are needed. At the end of 2018, Conti-nental used over 40 career-related social media accounts in 14 net-works and 15 countries for this purpose. In addition, the selection processes use a range of diagnostic methods such as interviews, assessment centers, personality scales, cognitive tests and simula-tions to assist the selection of candidates. Around 240,000 online assessment centers were carried out around the world.
We are systematically increasing our efforts to make work more flexible. In the 21 largest countries, with over 95% of the workforce, employees can make their ways of working more flexible. The range
of opportunities is determined by the specific operational possibili-ties of the respective workplace. In the reporting year, various mod-els began to be developed at 22 production locations to expand these opportunities more specifically in the production environ-ment, including flextime regulations and mobile work.
A comprehensive overview of the results achieved from the employ-ees’ perspective is also provided by the annual employee survey OUR BASICS Live, which asks a representative sample of our em-ployees about various topics. In the reporting year, the participation rate was on a par with the previous year at 74%. 82% (PY: 84%) of those surveyed said they were proud to work at Continental. 86%, and thus the same proportion as in the previous year, identify with our corporate values. 64% (PY: 63%) agreed that our values are put into practice every day, and 85% (PY: 86%) indicated that they have enough energy for their everyday work. As in the previous year, 71% stated that professional and private lives are easily compatible at Continental, for example, thanks to flexible working models. How-ever, the feedback also includes aspects that are assessed critically, which the Executive Board takes very seriously. Trust in the deci-sions of the top management fell slightly compared with the previ-ous year to 67% (PY: 70%). The findings of the employee survey are analyzed at various levels in order to derive improvement measures.
The percentage of occupational safety management system certifi-cations (ISO 45001 or similar) was already at a level of around two-thirds of the total workforce as at December 31, 2018.
For more information on employees, see the Economic Report, the Report on Risks and Opportunities, and the “Employee Benefits” section in the Notes to the Consolidated Financial Statements.
Key figures Dec. 31, 2018 Dec. 31, 20171
Total number of employees (total workforce)2 243,226 235,473
thereof own employees (permanent staff) 228,922 219,687
in Germany 59,230 56,854
outside Germany 169,692 162,833
Apprentices in Germany 2,180 2,155
Average age3 38.5 38.4
Female employees in the total workforce3 27.5% 27.2%
Female employees in management positions3, 4 14.8% 13.4%
Average years of service to the company3, 5, 6 9.1 9.1
Fluctuation, unforced5 6.3% 5.7%
Sickness rate5 3.3% 3.2%
Accidents per million working hours5, 7, 8 3.4 3.2
1 According to previous year’s reporting (only partially assured). 2 Excluding apprentices. 3 Based on the employees recorded in the HR data system (approx. 97%). 4 Executives and higher. 5 Permanent staff only (own employees). 6 For acquisitions, this includes years of service with previous company. 7 Counted from more than one lost day. 8 Excluding Continental Tire Sales (approx. 2% of the total workforce).
Continental AG 2018 Annual Report Management Report Corporate Profile 51
Human Rights and Fair Working Conditions
In accordance with the United Nations Guiding Principles on Busi-ness and Human Rights, we as a company bear a responsibility to respect human rights.
Management approach We fulfill this responsibility and would like to make an active contri-bution to the implementation of human rights and fair working conditions by treating our employees, future employees, suppliers, customers and everyone else with whom we do business with fair-ness and respect. We have publicly committed ourselves to this by participating in the United Nations Global Compact and signing the Women’s Empowerment Principles. This commitment is enshrined in important guidelines and processes. The binding Code of Con-duct for all employees was expanded at the start of 2019 by a sec-tion on human rights and fair working conditions. We also commit our suppliers to these principles with our Business Partner Code of Conduct and our Natural Rubber Sourcing Policy. Remarks on the management approach and on results in dealings with business partners can be found under Purchasing and Responsibility in the Supply Chain.
The Compliance and Human Relations departments are responsible for training employees on the Code of Conduct. Training on the content of the Code of Conduct is a compulsory element in the induction and further training of our employees. There is a Compli-ance & Anti-Corruption Hotline, which any individual can call directly and anonymously to report violations of the Code of Conduct or suspected cases. The review and handling of information is man-aged by the Compliance and Corporate Audit departments and is supported in the countries by internal experts on labor relations from the Human Relations department.
Results and performance indicators In the reporting period, the internal network comprising experts on labor relations and working conditions was further expanded. The network now provides fixed contact persons in 11 countries, who
coordinate the work at the respective locations. This covers more than 70% of employees. For communication on specific cases in this area and to train the expert network, a workshop with repre-sentatives from 10 countries has been carried out for the second time. The handling of human rights issues, both at our own locations and in our supply chain, is also supported by newly established central sustainability coordination.
Environment
For Continental and its markets, the business relevance of environ-mental protection – for example, in the form of society’s expectations, customers’ standards and regulatory requirements – is increasing continuously.
Management approach Environmental protection at Continental is based on the global policy for environment, safety, security, health and fire protection (ESH policy) which, among other things, stipulates that we want to use our processes and products to make a material contribution to sustainable environmental protection – especially climate protec-tion – over the entire product life cycle. Overall responsibility for en-vironmental management is borne by the Corporate Quality and En-vironment department, which reports directly to the chairman of the Executive Board and develops strategic targets for environmental protection in the corporation as a whole. These are broken down by division, and ultimate responsibility for the resulting strategic re-quirements, objectives and programs at each location lies with the respective ESH managers. We continuously improve our environ-mental performance through the systematic application of manage-ment systems. We have set clear targets for the corporation. By 2020, we want to reduce our specific CO2 emissions, energy and water consumption, and waste generation by 20% in relation to ad-justed sales, using 2013 as a basis. We also intend to improve our waste recycling and reuse rate by two percentage points a year. New locations are being integrated into these processes and pro-grams incrementally.
Key environmental data1 2018 20172
Energy use3 TWh 9.9 9.5
CO2 emissions (Scope 1+2)4 million metric tons CO2 3.3 3.2
Water demand million m3 20.6 19.8
Waste generation metric tons 419,426 379,992
Waste recycled % 78 81
1 According to the environmental data system, which covers all major production and development locations, not including fleet consumption. Definitions of the data are based on the Global Reporting Initiative (GRI).
2 According to previous year’s reporting. 3 Fossil energy sources, electricity and steam. 4 According to Greenhouse Gas Protocol Scope 2 (location-based) on the basis of the reported energy use and emission factors included in Defra (2016) and IEA (2017)
databases.

52 Continental AG 2018 Annual Report Management Report Corporate Profile
Key performance indicators1 2018 Change compared to
20132
Energy use MWh/€ million 223 -3%
CO2 emissions (Scope 1+2)3 metric tons CO2/€ million 74 -2%
Water demand m3/€ million 465 -5%
Waste generation metric tons/€ million 9.5 13%
1 In terms of adjusted sales in the respective year, according to environmental data system. 2 On the basis of figures reported for 2013 (only partially assured externally). 3 According to Greenhouse Gas Protocol Scope 2 (location-based) on the basis of the reported energy use and emission factors included in Defra (2016) and IEA (2017)
databases.
Results and performance indicators In the production units, we are working on making processes more efficient and more sustainable. Because of Continental’s growth in past years, the absolute values for energy use, CO2 emissions, waste generation and water demand have increased continuously. Com-pared with 2013, there was an improvement in the specific perfor-mance indicators of 3% for energy, 2% for CO2 and 5% for water. The specific figures for waste, however, were 13% higher than in 2013. The increases in efficiency and measures for improvement in the plants were balanced out by changes in the portfolio, sales effects, increasing vertical integration, more energy-intensive pro-duction technologies, and higher quality requirements.
At the end of 2018, the more than 200 major production and development locations were certified according to ISO 14001 (en-vironmental management) and more than 90 locations were already certified according to ISO 50001 (energy management). This corre-sponds to over 80% and roughly half of the total workforce respec-tively. The focus of environmental management is efficiency and thus the improvement of each specific type of consumption.
You can find more information on aspects relating to environmental protection in the Report on Risks and Opportunities.
Compliance
Compliance with all the legal requirements that apply to Continen-tal AG and its subsidiaries and its internal regulations by manage-ment and employees is an integral part of our corporate culture. Bribery and anti-competitive behavior are strictly forbidden. Conti-nental’s Executive Board is firmly committed to the zero-tolerance principle with regard to corruption and antitrust violations.
Management approach This stance is a fixed component of our corporate culture and is reflected in our corporate guidelines, corporate governance princi-ples and social responsibility principles. Important documents at corporation level are the Code of Conduct for employees, the anti-
corruption policy, the antitrust manual and the Global ESH Policy. The Business Partner Code of Conduct lays down requirements for our suppliers in terms of responsible business.
In order to discharge its duties, the Executive Board has established the global compliance organization with regional departments, es-pecially to prevent corruption and antitrust violations. The compli-ance organization reports directly to the Executive Board member for Finance, Controlling, Compliance, Law and IT.
Continental has a compliance management system, which is based on a comprehensive analysis of potential compliance risks for the core areas of antitrust law and corruption prevention. Its effective-ness was certified in 2016 in accordance with IDW PS 980 audit standard. When it comes to company mergers and acquisitions, we meet our due diligence obligations with extensive risk audits, which also include compliance due diligence. The audits carried out by the Corporate Audit department include reviewing whether compli-ance-related requirements are being met.
Both employees and external third parties can report all kinds of compliance-related incidents via the Compliance & Anti-Corruption Hotline, which can be reached around the clock by telephone or e-mail, anonymously and in the respective national language. The Compliance department analyzes the information together with Corporate Audit and then decides on necessary measures, involv-ing other departments in a structured process. In addition, employ-ees can contact their superiors or report directly to the Compliance department and the compliance coordinators in the countries and locations.
Results and performance indicators Compliance training is provided according to a risk-based and target-group-specific classroom training plan. In addition, employees who have a Continental e-mail address are regularly trained via e-learning programs. In 2018, employees were trained online and in some 360 classroom training sessions in compliance, antitrust law and corrup-tion prevention. For the online training, we aim for a completion rate of at least 95%, which we achieved again in 2018 with about 85,000 participants.

Continental AG 2018 Annual Report Management Report Corporate Profile 53
Compliance training in 2018
Online training conducted ~85,000
Classroom training sessions conducted ~360
Online training completion rate >95%
For more information, consult the Report on Risks and Opportunities and the “Other Disclosures” section in the Notes to the Consolidated Financial Statements.
Purchasing and Responsibility in the Supply Chain
Continental processes a wide range of raw materials and semi- finished products. The manufacture of these goods is associated with economic, ecological and social impacts along the global supply chain.
Management approach At Continental, purchasing is organized by product group and busi-ness unit with teams in various countries. The aim of the purchasing organization is to create added value for the operating units with market expertise and sustainable procurement solutions. There is therefore close coordination between the purchasing, development and production units.
Supplier relationships are based on the General Conditions of Pur-chase, which define quality and handling requirements, among other things. Since 2011, we have also required suppliers and service providers to sign the Business Partner Code of Conduct which covers ethical, social and ecological aspects. In addition, we expect our business partners to work toward the implementation of the Code of Conduct or similar values in their own supply chains. Compliance with this Code of Conduct is assessed primarily with self-assessments via the generally accepted sustainability platforms Ecovadis and NQC. In addition, subject-specific audits, such as for environmental protection, are carried out for some suppliers. Viola-tions can also be reported via the Compliance & Anti-Corruption Hotline. In the case of non-compliance with the Code of Conduct, Continental reserves the right to demand corresponding improve-ments or ultimately to terminate the business relationship.
Results and performance indicators The purchasing volume in the reporting year was €29.9 billion in total, €20.3 billion of which was for production materials. The Auto-motive Group uses primarily steel, aluminum, precious metals, cop-per and plastics. Key areas when it comes to purchasing materials and semi-finished products include electronics and electromechani-cal components, which together make up about 44% of the corpo-ration’s purchasing volume of production materials. Mechanical
components account for just under a quarter of production materi-als. Natural rubber and oil-based chemicals such as synthetic rubber and carbon black are key raw materials for the Rubber Group. The total purchasing volume for these materials amounts to around a sixth of the total volume for production materials. For more infor-mation, see the Development of Raw Materials Markets section in the Economic Report.
The integration of sustainability into our procurement processes was enhanced in the reporting year. As at December 31, 2018, the two sustainability platforms Ecovadis and NQC contained valid self-disclosures for more than 750 suppliers. This corresponds to a completion rate of over 60% of suppliers selected for this process on a rolling basis.
For natural rubber, a strategic purchasing issue, the “Continental Sustainable Natural Rubber Sourcing Policy” was published in the reporting year with the involvement of various stakeholders, which formulates specific requirements for Continental itself and for busi-ness partners in this supply chain. In Indonesia, the first implemen-tation steps on the way to more sustainable natural rubber are be-ing defined in a development partnership between Continental and Deutsche Gesellschaft für Internationale Zusammenarbeit (GIZ). The aim is to compile a list of criteria for the sustainable production of natural rubber, to train farmers in sustainable farming methods in accordance with these criteria, and to enable the traceability of rubber from the small farmers to its use in production at Continen-tal. In addition, Continental has participated in industry activities for sustainable natural rubber, which were initiated among others by the World Business Council for Sustainable Development (WBCSD) together with the industry and various stakeholders.
Social Responsibility and Engagement
We see ourselves as part of the local communities at our locations. The jobs we create directly in our plants and indirectly at our sup-pliers are important local contributions. In addition, Continental also selectively promotes and supports social initiatives, activities and projects.
Management approach Our social activities are based on our four corporate values, internal directives and local laws. For example, fundraising activities are governed by a corporate directive that defines priorities and pro-cesses. We not only donate money and goods, but also support our employees’ volunteer work and participate in collaborations all around the world. Our efforts are largely organized on a decentral-ized basis in order to meet local needs. Our social commitment is supplemented by centrally managed activities. A global coordina-tion process is currently being set up.
54 Continental AG 2018 Annual Report Management Report Corporate Profile
Results and performance indicators Around the world, a large number of projects, campaigns and fund-raising activities took place that prove that we are there for the local communities at our locations and include the following activities:
› Employees from the Tire division in Hanover donated the proceeds of their winter festival, around €15,000, to three local charitable institutions.
› Continental Youth Safe-Driving Program: In Chongqing, China, we held a program day on safe driving for young drivers in coopera-tion with several local partners, such as the local government and associations.
› In India, Hungary, Mexico and Romania, Continental employees helped to renovate or equip schools and daycare centers close to their locations.
› In Germany, the Continental pilot project “We l.o.v.e. Europe” has resulted in the “Experiencing Europe” initiative, which has been joined by other companies. In cooperation with the German Fed-eral Employment Agency and Caritas, selected participants in pre-vocational training (unemployed young people) are given the op-portunity to complete internships throughout the rest of Europe. Continental has already hired some of the first participants.
Information on Non-Financial Disclosures
The preceding section constitutes the relevant mandatory disclo-sures according to Sections 289 (3) and 315 (3) of the German Commercial Code (HGB) and the combined corporate non-financial statement for fiscal 2018. The information applies to both the Conti-nental Corporation and Continental AG, and is identical unless other-wise indicated. In accordance with Sections 315b and 315c in con-junction with Sections 289b to 289e HGB, the combined corporate non-financial statement presents the main information that is re-quired in order to understand the business development, business performance and position, and the effects of business operations on non-financial aspects. There are no additional reportable risks in accordance with HGB besides those presented in the Report on Risks and Opportunities. The business model is explained in the Corporate Profile section. As a framework for the descriptions in the combined corporate non-financial statement, for some key figures the company used not only HGB and IFRS, but also GRI (Global Reporting Initiative) and Greenhouse Gas Protocol requirements.
You can find more information on sustainability and all important documents online under the Sustainability heading.
References to content not contained in the combined management report are to be classed as further information and not as mandatory components required under the German Commercial Code (HGB).

Continental AG 2018 Annual Report Management Report Economic Report 55
Macroeconomic Development
Economic growth in Germany slowed over the course of the report-ing year. According to initial calculations by the German Federal Statistical Office, gross domestic product (GDP) increased by 1.5% in 2018 compared with 2017 when adjusted for prices, after 2.2% in each of the two preceding years. This fell considerably short of the forecast of 2.3% issued by the International Monetary Fund (IMF) in January 2018. The decline in growth was attributable to lower-than-expected increases in consumer and public spending and a slightly lower positive contribution from foreign trade in comparison to the previous year.
According to the latest figures from the statistical agency Eurostat, the eurozone economy achieved GDP growth of 1.8% in 2018 and thus likewise fell short of the IMF forecast of 2.2% from January 2018. In addition to lower growth in Germany, the rate of expansion in the major economies of France, Italy and Spain also slowed. All in all, consumer and public spending was lower than expected. Eco-nomic development was still boosted by the monetary policy of the European Central Bank (ECB), which continued to adhere to its expansionary measures in the reporting year. It terminated its bond-buying program at the end of 2018 as announced.
The U.S. economy picked up momentum during 2018 and is ex-pected to have achieved GDP growth of 2.9%, slightly exceeding the IMF’s forecast of 2.7% from January 2018. This was due chiefly to an increase in private investment and higher government spend-ing. In each of the months March, June, September and December
2018, the U.S. Federal Reserve (Fed) increased its key interest rate by 25 basis points.
After reaching 1.9% in the previous year, Japan’s economic growth fell to 0.9% in 2018 according to the IMF, despite the continuing expansionary monetary policy of the Japanese central bank. At the start of the year, the IMF had forecast a rise of 1.2%. Growth in con-sumer spending slowed considerably and the foreign trade surplus also increased only slightly. An increase in public spending and higher private investment only partly compensated for these effects.
According to the IMF’s World Economic Outlook (WEO) Update from January 2019, emerging and developing economies achieved growth totaling 4.6% in 2018 (PY: 4.7%). At the start of the report-ing year, the IMF had forecast an increase of 4.9%. China and India were the main growth drivers once again. However, growth in the Chinese economy slowed slightly, as expected by the IMF at the be-ginning of 2018, to 6.6% (PY: 6.9%). With GDP growth of 7.3%, India developed almost to the extent estimated by the IMF with its fore-cast of 7.4%. Russia grew by 1.7%, as the IMF had anticipated. With a 1.3% increase in GDP, Brazil fell short of the forecast growth of 1.9%. In addition, growth in some African countries and in the Mid-dle East was lower than expected at the start of the year as a result of lower revenue from raw material exports.
The IMF’s January 2019 WEO Update indicates that the global economy grew by 3.7% in 2018 after 3.8% in the previous year. As a result of the slowdown in many countries over the course of the year, the IMF’s forecast of 3.9% growth from January 2018 was not achieved.
Sources: IMF – World Economic Outlook Update January 2019, Eurostat, statistical offices of the respective countries, Bloomberg.
Economic Report General Conditions
World 3.7% Economic growth (GDP) 2018
3.8% Economic growth (GDP) 2017
1.8% Eurozone
2.4%
Russia 1.7%
1.5%
Japan 0.9%
1.9%China 6.6%
6.9%India 7.3%
6.7%
1.3% Brazil
1.1%
1.5% Germany
2.2%
2.9% U.S.A.
2.2%
Year-on-year economic growth (GDP) in 2018

56 Continental AG 2018 Annual Report Management Report Economic Report
Development of Key Customer Sectors
The most important market segment for Continental is the global supply business with the manufacturers of passenger cars and commercial vehicles, accounting for 72% of sales in fiscal 2018 as in the previous year. The second-biggest market segment for Conti-nental is global replacement-tire business for passenger cars and commercial vehicles. Because passenger cars and light commercial vehicles weighing less than 6 metric tons make up a considerably higher share of vehicle production and replacement-tire business, their development is particularly important to our economic success. Continental’s biggest sales region is still Europe, which accounted for 49% of sales in the year under review, followed by North Amer-ica with 25% and Asia with 22%, all of which were unchanged from the previous year.
Development of new passenger-car registrations On the basis of preliminary data from the German Association of the Automotive Industry (Verband der Automobilindustrie, VDA), new passenger-car registrations in Europe (EU-28 and EFTA) re-mained stable year-on-year in 2018. High demand for replacements could be seen in Greece, the Netherlands, Spain and several East-ern European countries. In France, new passenger-car registrations rose by 3%. In contrast, the United Kingdom, Norway and Sweden each saw a 7% decline. Sales volumes were also down slightly year-on-year in Italy, Ireland, Austria and Switzerland. In Germany, the months of July and August saw a significant increase in new regis-trations of vehicles that could still be produced and registered in accordance with the New European Driving Cycle (NEDC) exhaust-gas test procedure applicable until August 31, 2018. The introduc-tion of the new test procedure WLTP resulted in considerably lower production and a decline in new vehicle registrations in Germany in particular between September and December 2018. All in all, new passenger-car registrations in Germany stagnated in 2018.
In the U.S.A., consumers’ preference for light commercial vehicles and pickup trucks continued in 2018. Sales volumes of these vehi-cles grew by 8%, or around 855,000 units, in spite of higher fuel prices and increased lending rates. By contrast, demand for sedans fell by 13%, or around 775,000 units. Overall, new registrations in the U.S.A. increased slightly by around 80,000 units year-on-year in the reporting year.
In Japan, demand for passenger cars picked up in the second half of 2018, compensating for the slight decrease in sales volumes in the first half of the year. Overall, sales volumes of passenger cars in 2018 were up marginally year-on-year at 4.4 million units, corre-sponding to the average level of the past five years.
According to the VDA, demand for passenger cars in China in-creased by almost 6% in the first half of 2018 as a result of the good economic situation. However, the escalating trade conflict with the U.S.A. and the resulting uncertainty among consumers led to a 7% decline in demand for passenger cars in the third quarter and a 15% decline in the fourth quarter. Overall, China posted a 4% decline in sales volumes of passenger cars in the reporting year. The other BRIC countries saw very substantial growth in de-mand in 2018. In Brazil and Russia, demand continued to recover, with increases of 14% and 13% respectively, compared with the weak equivalent period of the previous year. In India, new vehicle registrations rose by 5%.
According to preliminary data, global new passenger-car registra-tions fell by around 300,000 units to 92.9 million units in 2018. The growth in sales volumes in Brazil, Russia, India and the U.S.A. only partly compensated for the reduced demand in China.
Development of production of passenger cars and light commercial vehicles In Europe, the production of passenger cars and light commercial vehicles weighing less than 6 metric tons decreased in 2018 by 2% on the basis of preliminary figures. From September onward, the introduction of the new exhaust-gas test procedure WLTP put a noticeable dent in production volumes. German manufacturers in particular had to significantly limit their production, because not all models and their engine versions could be tested in advance in ac-cordance with WLTP. In the year as a whole, production decreased in Germany, the United Kingdom and Turkey in particular. Without the higher production figures in Portugal, Russia and several East-ern European countries, the decrease in Europe would have been considerably larger.
In North America, the production of passenger cars and light com-mercial vehicles decreased by 1% to 17.0 million units in the report-ing year on the basis of preliminary figures. Production declined in Canada, whereas the U.S.A. posted a slight increase in production. In Mexico, volumes remained at the previous year’s level.
New registrations/sales of passenger cars
millions of units 1st Quarter 2nd Quarter 3rd Quarter 4th Quarter 2018 Total Prior Year
Europe (EU–28 and EFTA) 4.3 4.4 3.6 3.3 15.6 0%
U.S.A. 4.1 4.5 4.3 4.4 17.2 0%
Japan 1.3 1.0 1.1 1.0 4.4 0%
Brazil 0.5 0.6 0.7 0.7 2.5 14%
Russia 0.4 0.5 0.4 0.5 1.8 13%
India 0.9 0.9 0.9 0.8 3.4 5%
China 6.0 5.5 5.4 6.3 23.3 –4%
Worldwide 23.6 23.9 22.1 23.2 92.9 0%
Sources: VDA (countries/regions) and Renault (worldwide).

Continental AG 2018 Annual Report Management Report Economic Report 57
Production of passenger cars and light commercial vehicles
millions of units 2018 2017 2016 2015 2014
Europe1 21.7 22.1 21.4 20.8 19.9
North America 17.0 17.1 17.8 17.5 17.0
South America 3.4 3.3 2.7 3.1 3.8
Asia2 50.6 51.6 50.0 46.4 45.8
Other markets 1.3 1.1 1.1 1.0 0.9
Worldwide 94.0 95.2 93.1 88.8 87.4
Source: IHS Inc., preliminary figures and own estimates. 1 Western, Central and Eastern Europe, including Russia and Turkey. 2 Asia including Kazakhstan, Uzbekistan, Middle East and Oceania with Australia.
In Asia, the development of passenger-car and light-commercial- vehicle production varied considerably in the year under review. There were substantial increases in production in India, Indonesia and Thailand. By contrast, China saw a significant decline in pro-duction in the second half of the year, partly as a result of the trade conflict with the U.S.A. Japan recorded marginal growth in produc-tion, while volumes in Iran and South Korea decreased. On the basis of preliminary figures, Asia recorded an overall year-on-year decline in production of 2% in 2018, which was primarily due to the decline in China.
In South America, demand continued to recover and production of passenger cars and light commercial vehicles saw a further increase in 2018. Production in South America grew by 4% in the reporting year, according to preliminary figures. This was particularly due to the increase in Brazilian production of around 100,000 units.
On the basis of preliminary figures, global production of passenger cars and light commercial vehicles fell by 1% to 94.0 million units in 2018 as a result of declining production in the major markets.
Development of production of medium and heavy commercial vehicles In Europe, an increase in the transportation of goods by road in Central and Eastern Europe boosted demand for trucks in 2018. Preliminary figures indicate that overall there was a 3% year-on-year increase in the production of commercial vehicles weighing more than 6 metric tons in the reporting year.
In North America, production of medium and heavy commercial vehicles picked up significantly as a result of the high order volume and the good economic situation. Based on preliminary figures, production of commercial vehicles weighing more than 6 metric tons increased by 18% as compared to the weak prior-year figure.
In Asia, production of medium and heavy commercial vehicles was around 3% below the previous year’s level in the reporting year, based on the information currently available. In China in particular, there was a significant decline in the production of medium-weight commercial vehicles.
In South America, the economic recovery in the reporting year led to rising demand for trucks and an increase in the production of medium and heavy commercial vehicles of more than 40% com-pared to the very weak prior-year basis, according to preliminary data.
Preliminary figures indicate that global production of medium and heavy commercial vehicles rose overall by 2% in the year under review.
Development of replacement-tire markets for passenger cars and light commercial vehicles In Europe – Continental’s most important market for replacement tires – sales volumes of replacement tires for passenger cars and light commercial vehicles weighing less than 6 metric tons rose by 2% year-on-year in the reporting year according to preliminary data. In the fourth quarter of 2018, momentum slowed due to weaker demand in Turkey.
Production of medium and heavy commercial vehicles
thousands of units 2018 2017 2016 2015 2014
Europe1 663 646 605 602 568
North America 638 542 474 581 551
South America 155 110 85 106 184
Asia2 2,240 2,316 1,896 1,646 1,851
Other markets 0 0 0 0 0
Worldwide 3,695 3,614 3,060 2,935 3,154
Source: IHS Inc., preliminary figures and own estimates. 1 Western, Central and Eastern Europe, including Russia and Turkey. 2 Asia including Kazakhstan, Uzbekistan, Middle East and Oceania with Australia.

58 Continental AG 2018 Annual Report Management Report Economic Report
Sales of replacement tires for passenger cars and light commercial vehicles
millions of units 2018 2017 2016 2015 2014
Europe 358 350 340 328 324
North America 296 288 285 278 277
South America 67 71 66 65 64
Asia 450 447 431 409 397
Other markets 49 48 46 44 42
Worldwide 1,220 1,204 1,168 1,124 1,104
Source: LMC International Ltd., preliminary figures and own estimates.
In North America, sales volumes of replacement tires for passenger cars and light commercial vehicles picked up considerably in the second half of 2018 after a relatively weak first half of the year. This was partly attributable to purchases brought forward due to the price increases announced by some manufacturers for the end of 2018/the start of 2019. According to preliminary figures, demand for replacement tires for passenger cars and light commercial vehi-cles increased by 3% overall in the reporting year.
In China, a sell-off of tire dealers’ stocks resulted in a sharp decrease in sales volumes in the second half of 2018 as compared to the high comparative figures from the previous year. By contrast, India and Indonesia in particular recorded growing demand. In Asia as a whole, demand for replacement tires for passenger cars and light commercial vehicles grew 1% in 2018 according to preliminary figures.
In South America, the temporarily uncertain political situation in Brazil led to considerably subdued demand for replacement tires for passenger cars and light commercial vehicles in the second half of 2018. Preliminary figures indicate that the decline over the re-porting year as a whole came to around 6% in comparison to the strong prior-year basis.
Based on preliminary figures, global sales volumes of replacement tires for passenger cars and light commercial vehicles grew by 1% in 2018.
Development of replacement tire markets for medium and heavy commercial vehicles In Europe, preliminary figures indicate that demand for replacement tires for commercial vehicles weighing more than 6 metric tons dropped by 1% in 2018. The decline in demand in the United King-dom and Turkey was offset only partially by volume growth in Russia and other Eastern European countries.
According to preliminary figures, demand for replacement tires for medium and heavy commercial vehicles in North America, our other core market for replacement commercial-vehicle tires along-side Europe, increased by 7% year-on-year thanks to a strong fourth quarter.
In Asia, sales volumes of replacement tires for medium and heavy commercial vehicles decreased by 1% in 2018 according to prelim-inary figures. The main reason for the weaker development was a decline in demand in China, which primarily resulted from the re-duction of tire dealers’ stocks in the second half of the year.
In South America, preliminary figures indicate that sales volumes of replacement tires for commercial vehicles were up 2% in the report-ing year, despite the high prior-year basis. This was primarily due to the positive development in demand for replacement truck tires in Brazil.
Overall, global demand for replacement tires for medium and heavy commercial vehicles in the reporting year remained at the previous year’s level according to preliminary figures.
Sales of replacement tires for medium and heavy commercial vehicles
millions of units 2018 2017 2016 2015 2014
Europe 25.8 26.1 24.5 23.0 23.4
North America 26.5 24.8 23.6 22.8 22.0
South America 14.8 14.5 13.7 13.5 14.0
Asia 87.0 88.2 86.6 83.7 85.2
Other markets 7.9 7.8 7.5 7.2 6.9
Worldwide 162.0 161.4 155.9 150.2 151.6
Source: LMC International Ltd., preliminary figures and own estimates.
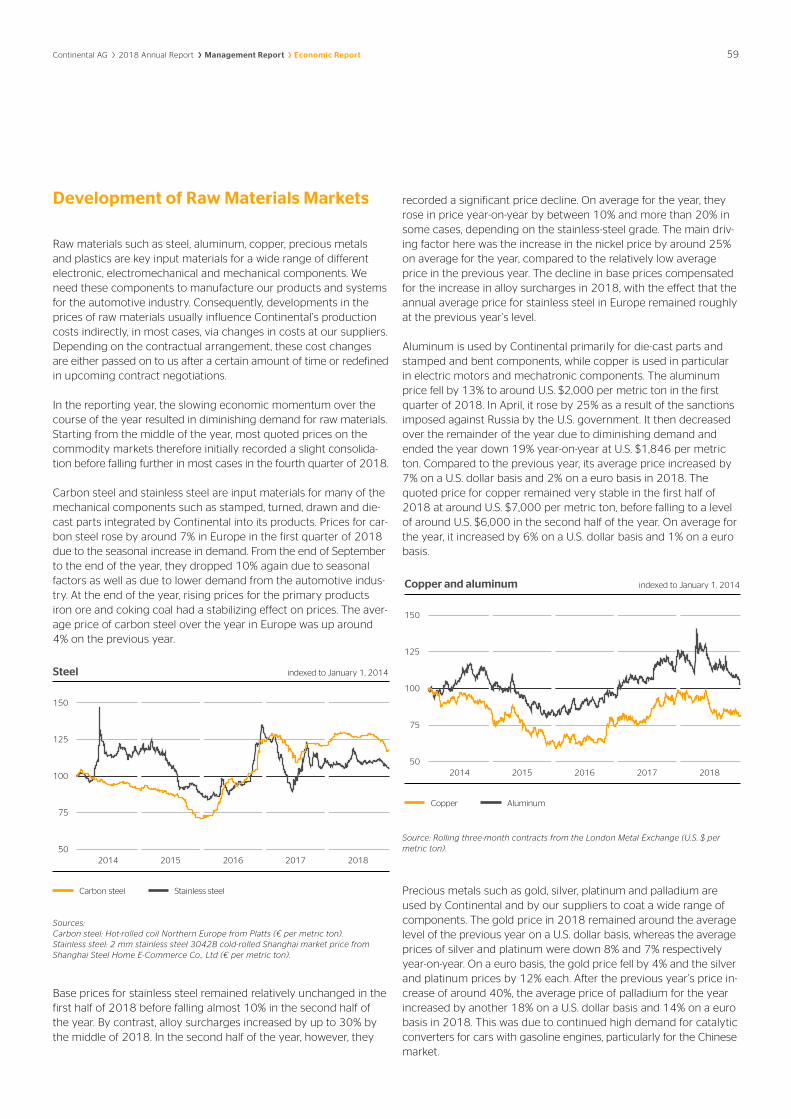
Continental AG 2018 Annual Report Management Report Economic Report 59
Development of Raw Materials Markets
Raw materials such as steel, aluminum, copper, precious metals and plastics are key input materials for a wide range of different electronic, electromechanical and mechanical components. We need these components to manufacture our products and systems for the automotive industry. Consequently, developments in the prices of raw materials usually influence Continental’s production costs indirectly, in most cases, via changes in costs at our suppliers. Depending on the contractual arrangement, these cost changes are either passed on to us after a certain amount of time or redefined in upcoming contract negotiations.
In the reporting year, the slowing economic momentum over the course of the year resulted in diminishing demand for raw materials. Starting from the middle of the year, most quoted prices on the commodity markets therefore initially recorded a slight consolida-tion before falling further in most cases in the fourth quarter of 2018.
Carbon steel and stainless steel are input materials for many of the mechanical components such as stamped, turned, drawn and die-cast parts integrated by Continental into its products. Prices for car-bon steel rose by around 7% in Europe in the first quarter of 2018 due to the seasonal increase in demand. From the end of September to the end of the year, they dropped 10% again due to seasonal factors as well as due to lower demand from the automotive indus-try. At the end of the year, rising prices for the primary products iron ore and coking coal had a stabilizing effect on prices. The aver-age price of carbon steel over the year in Europe was up around 4% on the previous year.
Sources: Carbon steel: Hot-rolled coil Northern Europe from Platts (€ per metric ton). Stainless steel: 2 mm stainless steel 3042B cold-rolled Shanghai market price from Shanghai Steel Home E-Commerce Co., Ltd (€ per metric ton).
Base prices for stainless steel remained relatively unchanged in the first half of 2018 before falling almost 10% in the second half of the year. By contrast, alloy surcharges increased by up to 30% by the middle of 2018. In the second half of the year, however, they
recorded a significant price decline. On average for the year, they rose in price year-on-year by between 10% and more than 20% in some cases, depending on the stainless-steel grade. The main driv-ing factor here was the increase in the nickel price by around 25% on average for the year, compared to the relatively low average price in the previous year. The decline in base prices compensated for the increase in alloy surcharges in 2018, with the effect that the annual average price for stainless steel in Europe remained roughly at the previous year’s level.
Aluminum is used by Continental primarily for die-cast parts and stamped and bent components, while copper is used in particular in electric motors and mechatronic components. The aluminum price fell by 13% to around U.S. $2,000 per metric ton in the first quarter of 2018. In April, it rose by 25% as a result of the sanctions imposed against Russia by the U.S. government. It then decreased over the remainder of the year due to diminishing demand and ended the year down 19% year-on-year at U.S. $1,846 per metric ton. Compared to the previous year, its average price increased by 7% on a U.S. dollar basis and 2% on a euro basis in 2018. The quoted price for copper remained very stable in the first half of 2018 at around U.S. $7,000 per metric ton, before falling to a level of around U.S. $6,000 in the second half of the year. On average for the year, it increased by 6% on a U.S. dollar basis and 1% on a euro basis.
Source: Rolling three-month contracts from the London Metal Exchange (U.S. $ per metric ton).
Precious metals such as gold, silver, platinum and palladium are used by Continental and by our suppliers to coat a wide range of components. The gold price in 2018 remained around the average level of the previous year on a U.S. dollar basis, whereas the average prices of silver and platinum were down 8% and 7% respectively year-on-year. On a euro basis, the gold price fell by 4% and the silver and platinum prices by 12% each. After the previous year’s price in-crease of around 40%, the average price of palladium for the year increased by another 18% on a U.S. dollar basis and 14% on a euro basis in 2018. This was due to continued high demand for catalytic converters for cars with gasoline engines, particularly for the Chinese market.
50
75
100
125
150
Carbon steel
Stainless steel
Steel indexed to January 1, 2014
Carbon steel Stainless steel
2014 2015 2016 2017 2018
50
75
100
125
150
Copper
Aluminum
Copper and aluminum indexed to January 1, 2014
Copper Aluminum
2014 2015 2016 2017 2018
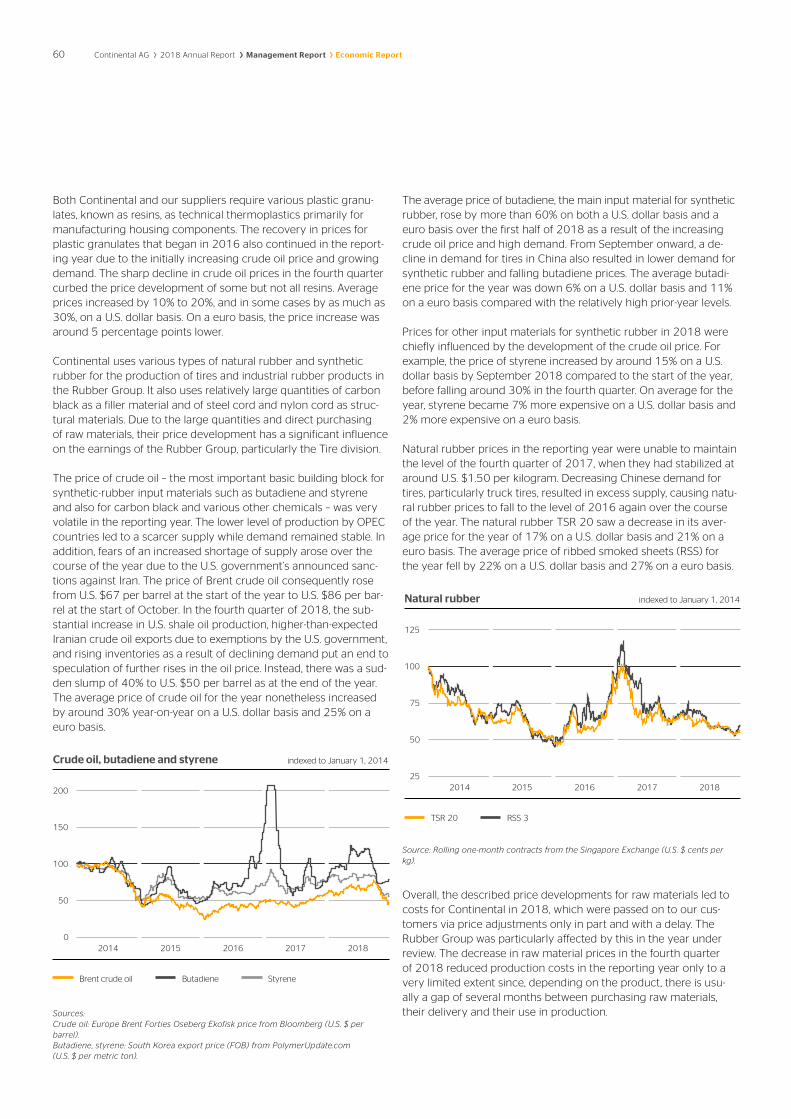
60 Continental AG 2018 Annual Report Management Report Economic Report
Both Continental and our suppliers require various plastic granu-lates, known as resins, as technical thermoplastics primarily for manufacturing housing components. The recovery in prices for plastic granulates that began in 2016 also continued in the report-ing year due to the initially increasing crude oil price and growing demand. The sharp decline in crude oil prices in the fourth quarter curbed the price development of some but not all resins. Average prices increased by 10% to 20%, and in some cases by as much as 30%, on a U.S. dollar basis. On a euro basis, the price increase was around 5 percentage points lower.
Continental uses various types of natural rubber and synthetic rubber for the production of tires and industrial rubber products in the Rubber Group. It also uses relatively large quantities of carbon black as a filler material and of steel cord and nylon cord as struc-tural materials. Due to the large quantities and direct purchasing of raw materials, their price development has a significant influence on the earnings of the Rubber Group, particularly the Tire division.
The price of crude oil – the most important basic building block for synthetic-rubber input materials such as butadiene and styrene and also for carbon black and various other chemicals – was very volatile in the reporting year. The lower level of production by OPEC countries led to a scarcer supply while demand remained stable. In addition, fears of an increased shortage of supply arose over the course of the year due to the U.S. government’s announced sanc-tions against Iran. The price of Brent crude oil consequently rose from U.S. $67 per barrel at the start of the year to U.S. $86 per bar-rel at the start of October. In the fourth quarter of 2018, the sub-stantial increase in U.S. shale oil production, higher-than-expected Iranian crude oil exports due to exemptions by the U.S. government, and rising inventories as a result of declining demand put an end to speculation of further rises in the oil price. Instead, there was a sud-den slump of 40% to U.S. $50 per barrel as at the end of the year. The average price of crude oil for the year nonetheless increased by around 30% year-on-year on a U.S. dollar basis and 25% on a euro basis.
Sources: Crude oil: Europe Brent Forties Oseberg Ekofisk price from Bloomberg (U.S. $ per barrel). Butadiene, styrene: South Korea export price (FOB) from PolymerUpdate.com (U.S. $ per metric ton).
The average price of butadiene, the main input material for synthetic rubber, rose by more than 60% on both a U.S. dollar basis and a euro basis over the first half of 2018 as a result of the increasing crude oil price and high demand. From September onward, a de-cline in demand for tires in China also resulted in lower demand for synthetic rubber and falling butadiene prices. The average butadi-ene price for the year was down 6% on a U.S. dollar basis and 11% on a euro basis compared with the relatively high prior-year levels.
Prices for other input materials for synthetic rubber in 2018 were chiefly influenced by the development of the crude oil price. For example, the price of styrene increased by around 15% on a U.S. dollar basis by September 2018 compared to the start of the year, before falling around 30% in the fourth quarter. On average for the year, styrene became 7% more expensive on a U.S. dollar basis and 2% more expensive on a euro basis.
Natural rubber prices in the reporting year were unable to maintain the level of the fourth quarter of 2017, when they had stabilized at around U.S. $1.50 per kilogram. Decreasing Chinese demand for tires, particularly truck tires, resulted in excess supply, causing natu-ral rubber prices to fall to the level of 2016 again over the course of the year. The natural rubber TSR 20 saw a decrease in its aver-age price for the year of 17% on a U.S. dollar basis and 21% on a euro basis. The average price of ribbed smoked sheets (RSS) for the year fell by 22% on a U.S. dollar basis and 27% on a euro basis.
Source: Rolling one-month contracts from the Singapore Exchange (U.S. $ cents per kg).
Overall, the described price developments for raw materials led to costs for Continental in 2018, which were passed on to our cus-tomers via price adjustments only in part and with a delay. The Rubber Group was particularly affected by this in the year under review. The decrease in raw material prices in the fourth quarter of 2018 reduced production costs in the reporting year only to a very limited extent since, depending on the product, there is usu-ally a gap of several months between purchasing raw materials, their delivery and their use in production.
0
50
100
150
200
Brent crude oilButadieneStyrene
Crude oil, butadiene and styrene indexed to January 1, 2014
Brent crude oil Butadiene Styrene
2014 2015 2016 2017 2018
25
50
75
100
125
TSR 20
RSS 3
Natural rubber indexed to January 1, 2014
TSR 20 RSS 3
2014 2015 2016 2017 2018
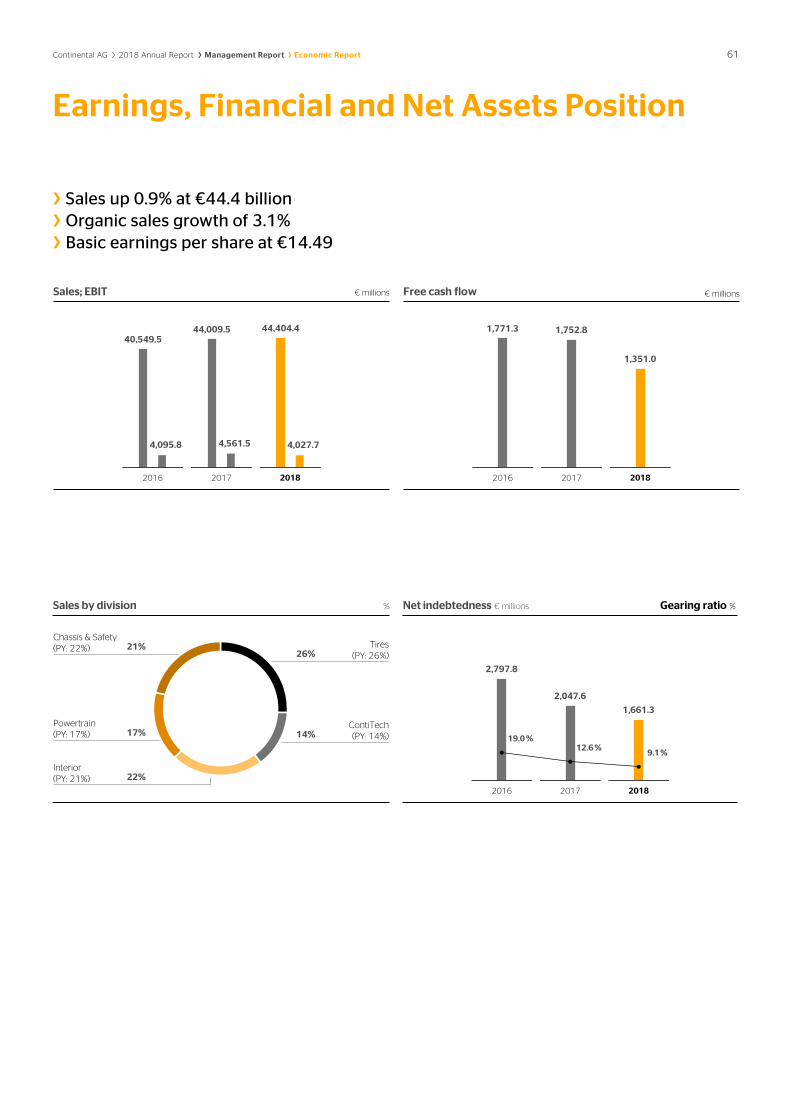
Continental AG 2018 Annual Report Management Report Economic Report 61
› Sales up 0.9% at €44.4 billion › Organic sales growth of 3.1% › Basic earnings per share at €14.49
Sales; EBIT € millions
40,549.544,009.5 44,404.4
4,095.8 4,561.5 4,027.7
2016 2017 2018
Sales by division %
Tires(PY: 26%)
ContiTech(PY: 14%)
Interior(PY: 21%)
Powertrain(PY: 17%)
Chassis & Safety(PY: 22%)
26%
14%
22%
17%
21%
Free cash flow € millions
1,771.3 1,752.8
1,351.0
2016 2017 2018
2,797.8
2,047.6
1,661.3
19.0 %12.6 %
9.1 %
Net indebtedness € millions Gearing ratio %
2016 2017 2018
Earnings, Financial and Net Assets Position

62 Continental AG 2018 Annual Report Management Report Economic Report
Earnings Position
› Sales up 0.9%
› Sales up 3.1% before changes in the scope of consolidation and exchange-rate effects
› Adjusted EBIT down 13.3%
Continental Corporation in € millions 2018 2017 in %
Sales 44,404.4 44,009.5 0.9
EBITDA 6,235.7 6,678.9 –6.6
in % of sales 14.0 15.2
EBIT 4,027.7 4,561.5 –11.7
in % of sales 9.1 10.4
Net income attributable to the shareholders of the parent 2,897.3 2,984.6 –2.9
Basic earnings per share in € 14.49 14.92 –2.9
Diluted earnings per share in € 14.49 14.92 –2.9
Research and development expenses (net) 3,209.0 3,103.7 3.4
in % of sales 7.2 7.1
Depreciation and amortization1 2,208.0 2,117.4 4.3
thereof impairment2 20.7 40.2
Operating assets as at December 31 23,753.7 22,213.6 6.9
Operating assets (average) 23,640.5 22,172.4 6.6
ROCE 17.0 20.6
Capital expenditure3 3,124.4 2,854.4 9.5
in % of sales 7.0 6.5
Number of employees as at December 314 243,226 235,473 3.3
Adjusted sales5 44,249.2 43,978.5 0.6
Adjusted operating result (adjusted EBIT)6 4,118.1 4,748.5 –13.3
in % of adjusted sales 9.3 10.8
1 Excluding impairment on financial investments. 2 Impairment also includes necessary reversal of impairment losses. 3 Capital expenditure on property, plant and equipment, and software. 4 Excluding trainees. 5 Before changes in the scope of consolidation. 6 Before amortization of intangible assets from purchase price allocation (PPA), changes in the scope of consolidation, and special effects.
Sales up 0.9% Sales up 3.1% before changes in the scope of consolidation and exchange-rate effects Consolidated sales climbed by €394.9 million or 0.9% year-on-year in 2018 to €44,404.4 million (PY: €44,009.5 million). Before changes in the scope of consolidation and exchange-rate effects, sales rose by 3.1%. The further sales increase resulted from business develop-ment in both the Automotive Group and the Rubber Group. Sales growth was thus significantly greater than the increase in the pro-duction of passenger cars, station wagons and light commercial
vehicles. Consolidated sales grew fastest in Asia, especially in Japan. Changes in the scope of consolidation contributed to the increase in sales, but were considerably more than offset by negative exchange-rate effects.
Adjusted EBIT down 13.3% The corporation’s adjusted EBIT declined by €630.4 million or 13.3% year-on-year in 2018 to €4,118.1 million (PY: €4,748.5 million), equivalent to 9.3% (PY: 10.8%) of adjusted sales.

Continental AG 2018 Annual Report Management Report Economic Report 63
The regional distribution of sales in 2018 was as follows:
Sales by region in % 2018 2017
Germany 20 20
Europe excluding Germany 29 29
North America 25 25
Asia 22 22
Other countries 4 4
The corporation’s adjusted EBIT for the fourth quarter of 2018 decreased by €187.3 million or 14.3% compared with the same quarter of the previous year to €1,126.1 million (PY: €1,313.4 mil-lion), equivalent to 10.1% (PY: 11.7%) of adjusted sales.
EBIT down 11.7% EBIT was down by €533.8 million year-on-year in 2018 to €4,027.7 million (PY: €4,561.5 million), a decrease of 11.7%. The return on sales fell to 9.1% (PY: 10.4%).
The amortization of intangible assets from purchase price alloca-tion (PPA) reduced EBIT by €173.0 million (PY: €170.7 million) in the year under review.
ROCE amounted to 17.0% (PY: 20.6%).
Special effects in 2018 Overall, impairment on property, plant and equipment resulted in expense of €20.0 million (Chassis & Safety €1.5 million; Powertrain €16.0 million; Interior €1.2 million; Tires €1.2 million; ContiTech €0.1 million).
In addition, restructuring expenses and the reversal of restructuring provisions no longer required resulted in a negative special effect of €20.0 million overall (Powertrain €22.8 million; Interior income of €3.0 million; ContiTech €0.2 million). This included impairment on property, plant and equipment in the amount of €3.5 million (Powertrain €3.3 million, ContiTech €0.2 million) and a reversal of impairment losses in the Interior division in the amount of €2.8 million.
Following the successful conclusion of all negotiations and the granting of the required merger control authorizations, OSRAM CONTINENTAL GmbH, Munich, Germany, commenced global oper-ations on July 2, 2018. The contribution of net assets, including intangible assets, resulted in income of €183.7 million for the Interior division.
In addition, disposals of companies and business operations resulted in an expense totaling €25.5 million (Chassis & Safety income of €3.0 million; Interior €28.9 million; ContiTech income of €0.4 million).
The transformation of the Powertrain division into an independent group of legal entities resulted in expense totaling €40.9 million (Chassis & Safety €4.3 million; Powertrain €32.3 million; Interior €4.3 million).
In addition, an asset deal in the Interior division resulted in income of €2.9 million.
Total consolidated income from special effects in 2018 amounted to €80.2 million.
Special effects in 2017 Overall, impairment and a reversal of impairment losses on property, plant and equipment resulted in expense of €22.2 million (Chassis & Safety €0.5 million; Powertrain €18.8 million; Tires €0.5 million; ContiTech €2.4 million).
In addition, restructuring expenses and the reversal of restructuring provisions no longer required resulted in a total positive special effect of €16.4 million (Chassis & Safety €0.1 million; Powertrain €0.7 million; Interior €5.4 million; Tires €10.0 million; ContiTech €0.2 million). This included €5.0 million from reversal of impair-ment losses on property, plant and equipment (Powertrain €0.2 million; Interior €4.8 million).
In the Interior division, goodwill totaling €23.0 million that arose in connection with the expansion of our mobility-services activities was impaired, outside the scope of the annual impairment test.
In addition, the acquisition of the remaining shares in a joint venture resulted in income of €1.9 million in the Interior division from the adjustment of the market value of the previously held shares.
In the Tire division, the disposal of equity interests held as financial assets resulted in income totaling €14.0 million.
Moreover, a first-time consolidation resulted in a gain of €0.5 million in the Tire division.
In the ContiTech division, disposals of companies and assets resulted in an expense totaling €1.6 million.
Total consolidated expense from special effects in 2017 amounted to €14.0 million.

64 Continental AG 2018 Annual Report Management Report Economic Report
Procurement The purchasing volume rose by around 1% year-on-year to €29.9 billion in 2018, of which approximately €20.3 billion was attribut-able to production materials. Prices for the Automotive Group’s pro-duction materials were lower than in the previous year. The prices of key input materials and many raw materials for the Rubber Group peaked around the middle of 2018. However, the price of natural
rubber fell steadily over the course of the year. Average prices for the Tire division’s raw materials during the year were roughly on par with the previous year. Exchange-rate effects and the time lag between procurement, delivery and deployment resulted, however, in minor costs for the Tire division compared to the previous year. For the ContiTech division, raw material prices increased year-on-year.
Reconciliation of EBIT to net income
€ millions 2018 2017 in %
Chassis & Safety 782.5 897.7 –12.8
Powertrain 119.8 439.9 –72.8
Interior 988.1 749.2 31.9
Tires 1,882.1 2,151.3 –12.5
ContiTech 396.2 442.2 –10.4
Other/consolidation –141.0 –118.8 18.7
EBIT 4,027.7 4,561.5 –11.7
Financial result –177.8 –285.7 –37.8
Earnings before tax 3,849.9 4,275.8 –10.0
Income tax expense –891.6 –1,227.5 –27.4
Net income 2,958.3 3,048.3 –3.0
Non-controlling interests –61.0 –63.7 –4.2
Net income attributable to the shareholders of the parent 2,897.3 2,984.6 –2.9
Basic earnings per share in € 14.49 14.92 –2.9
Diluted earnings per share in € 14.49 14.92 –2.9

Continental AG 2018 Annual Report Management Report Economic Report 65
Reconciliation of sales to adjusted sales and of EBITDA to adjusted operating result (adjusted EBIT) in 2018
€ millions Chassis & Safety Powertrain Interior Tires ContiTech Other/
consolidation Continental
Corporation
Sales 9,588.0 7,741.0 9,707.2 11,352.2 6,344.7 –328.7 44,404.4
Changes in the scope of consolidation1 –1.4 — –13.9 –47.3 –92.8 0.2 –155.2
Adjusted sales 9,586.6 7,741.0 9,693.3 11,304.9 6,251.9 –328.5 44,249.2
EBITDA 1,213.3 574.6 1,389.2 2,495.2 701.4 –138.0 6,235.7
Depreciation and amortization2 –430.8 –454.8 –401.1 –613.1 –305.2 –3.0 –2,208.0
EBIT 782.5 119.8 988.1 1,882.1 396.2 –141.0 4,027.7
Amortization of intangible assets from purchase price allocation (PPA) 0.0 11.4 51.1 19.3 91.2 — 173.0
Changes in the scope of consolidation1 –0.4 — 15.1 –2.6 –14.5 — –2.4
Special effects
Impairment3 1.5 16.0 1.2 1.2 0.1 — 20.0
Restructuring4 — 22.8 –3.0 — 0.2 — 20.0
Gains and losses from disposals of companies and business operations –3.0 — –154.8 0.0 –0.4 — –158.2
Other 4.3 32.3 1.4 — — — 38.0
Adjusted operating result (adjusted EBIT) 784.9 202.3 899.1 1,900.0 472.8 –141.0 4,118.1
Reconciliation of sales to adjusted sales and of EBITDA to adjusted operating result (adjusted EBIT) in 2017
€ millions Chassis & Safety Powertrain Interior Tires ContiTech Other/
consolidation Continental
Corporation
Sales 9,767.8 7,660.9 9,305.2 11,325.8 6,246.4 –296.6 44,009.5
Changes in the scope of consolidation1 — — –19.1 — –12.0 0.1 –31.0
Adjusted sales 9,767.8 7,660.9 9,286.1 11,325.8 6,234.4 –296.5 43,978.5
EBITDA 1,301.6 854.8 1,140.0 2,748.7 750.9 –117.1 6,678.9
Depreciation and amortization2 –403.9 –414.9 –390.8 –597.4 –308.7 –1.7 –2,117.4
EBIT 897.7 439.9 749.2 2,151.3 442.2 –118.8 4,561.5
Amortization of intangible assets from purchase price allocation (PPA) 0.0 11.9 46.1 19.5 93.2 — 170.7
Changes in the scope of consolidation1 — — 1.7 — 0.6 — 2.3
Special effects
Impairment3 0.5 18.8 23.0 0.5 2.4 — 45.2
Restructuring5 –0.1 –0.7 –5.4 –10.0 –0.2 — –16.4
Gains and losses from disposals of companies and business operations — — — –14.0 1.6 — –12.4
Other — — –1.9 –0.5 — — –2.4
Adjusted operating result (adjusted EBIT) 898.1 469.9 812.7 2,146.8 539.8 –118.8 4,748.5
1 Changes in the scope of consolidation include additions and disposals as part of share and asset deals. Adjustments were made for additions in the reporting year and for disposals in the comparative period of the prior year.
2 Excluding impairment on financial investments. 3 Impairment also includes necessary reversal of impairment losses. This item does not include impairment that arose in connection with a restructuring and impairment on
financial investments. 4 This includes impairment losses totaling €3.5 million (Powertrain €3.3 million; ContiTech €0.2 million) and a reversal of impairment losses of €2.8 million in the Interior division. 5 This includes reversal of impairment losses totaling €5.0 million (Powertrain €0.2 million; Interior €4.8 million).

66 Continental AG 2018 Annual Report Management Report Economic Report
Research and development Research and development expenses (net) rose by €105.3 million or 3.4% year-on-year to €3,209.0 million (PY: €3,103.7 million), cor-responding to 7.2% (PY: 7.1%) of sales.
In the Powertrain and Interior divisions, costs in connection with initial product development projects in the original equipment business are capitalized. Costs are capitalized as at the time at which we are named as a supplier and have successfully achieved a specific pre-release stage. Capitalization ends with the approval for unlimited volume production. The costs of customer-specific applications, pre-production prototypes and testing for products already being sold do not qualify as development expenditure that may be recognized as an intangible asset. Capitalized development expenses are amortized on a straight-line basis over a useful life of three to seven years and recognized in the cost of sales. In Conti-nental’s opinion, the assumed useful life reflects the period for which an economic benefit is likely to be derived from the corresponding development projects. €158.0 million (PY: €92.1 million) of the de-velopment costs incurred in the two divisions in 2018 qualified for recognition as an asset.
The requirements for the capitalization of development activities were not met in the Chassis & Safety, Tire and ContiTech divisions in the year under review or the previous year.
This results in a capitalization ratio of 4.7% (PY: 2.9%) for the corpo-ration.
Depreciation and amortization Depreciation and amortization increased by €90.6 million to €2,208.0 million (PY: €2,117.4 million), equivalent to 5.0% of sales. This included impairment totaling €20.7 million (PY: €40.2 million).
Financial result The negative financial result improved by €107.9 million year-on-year to €177.8 million (PY: €285.7 million) in 2018. This was primar-ily attributable to interest and similar income as well as the sum of the effects from changes in the fair value of derivative instruments and from currency translation.
Interest income in 2018 rose by €28.5 million year-on-year to €122.9 million (PY: €94.4 million). This was mainly due to the fact that, from the reporting year onward, interest income in connection with income tax liabilities, which was previously reported in income tax expense, is also reported in the financial result. Expected income from long-term employee benefits and pension funds totaled €64.6 million in 2018 (PY: €67.8 million). This did not include the interest income from the plan assets of the pension contribution funds.
Interest expense totaled €276.2 million in 2018 and was thus €5.3 million lower than the previous year’s figure of €281.5 million. At €130.3 million, interest expense resulting from bank borrowings,
capital market transactions and other financing instruments was €0.3 million higher than the prior-year figure of €130.0 million. The major portion related to expense of €54.6 million (PY: €70.7 million) from the bonds issued by Continental AG and Continental Rubber of America, Corp., Wilmington, Delaware, U.S.A. The year-on-year de-cline in this expense was attributable mainly to the repayment of the €750.0 million euro bond from Continental AG on July 16, 2018. The five-year bond bore interest at a rate of 3.0% p.a. The in-terest expense from long-term employee benefits totaled €145.9 million (PY: €151.5 million) in 2018. This did not include the inter-est expense from the defined benefit obligations of the pension contribution funds. In addition, from the reporting year onward, in-terest expense in connection with income tax liabilities, which was previously reported under income tax expense, is also reported in the financial result.
The effects from currency translation resulted in a negative contri-bution to earnings of €30.4 million (PY: €138.8 million) in 2018. This was countered by effects from changes in the fair value of de-rivative instruments, and other valuation effects, which resulted in earnings of €5.9 million (PY: €40.2 million) in 2018. Exchange-rate effects accounted for €0.0 million (PY: €1.8 million) of this. Taking into account the sum of the effects from currency translation and changes in the fair value of derivative instruments, earnings in 2018 were negatively impacted by €24.5 million (PY: €100.4 mil-lion). This was attributable mainly to the development of the Brazil-ian real in relation to the euro and the U.S. dollar. In the previous year, by contrast, the effects were primarily attributable to the de-velopment of the Mexican peso in relation to the U.S. dollar and of the Brazilian real in relation to the euro.
Income tax expense Income tax expense for fiscal 2018 amounted to €891.6 million (PY: €1,227.5 million). The tax rate was 23.2% after 28.7% in the previous year.
As in the previous year, foreign tax rate differences, incentives and tax holidays had positive effects in the year under review. The tax rate was negatively impacted by non-cash allowances on deferred tax assets totaling €79.6 million (PY: €91.0 million), of which €16.4 million (PY: €40.2 million) was for previous years. Furthermore, as in the previous year, the tax rate was negatively affected by non-de-ductible expenses and non-imputable foreign withholding tax. The tax rate in fiscal 2018 was also impacted positively by the effects of U.S. tax reform and influenced by tax refunds for previous years as a result of a supreme court ruling in Germany.
Net income attributable to the shareholders of the parent Net income attributable to the shareholders of the parent declined by €87.3 million in 2018 to €2,897.3 million (PY: €2,984.6 million). Basic earnings per share amounted to €14.49 (PY: €14.92), the same amount as diluted earnings per share.

Continental AG 2018 Annual Report Management Report Economic Report 67
Employees The number of employees in the Continental Corporation rose by 7,753 from 235,473 in 2017 to 243,226. The number of employ-ees in the Automotive Group rose by 5,730, as a result in particular of increased production volumes and the continuous expansion of
research and development. In the Rubber Group, the increase in the number of employees by 2,014 was chiefly attributable to the acquisition of the retail company Tyre and Auto Pty Ltd, Melbourne, Australia, and the adjustment to demand-driven production in the Tire division.
Employees by region in % 2018 2017
Germany 26 26
Europe excluding Germany 32 32
North America 18 19
Asia 20 19
Other countries 4 4

68 Continental AG 2018 Annual Report Management Report Economic Report
Financial Position
› Free cash flow before acquisitions at €1.8 billion
› Cash flow arising from investing activities at €3.6 billion
› Net indebtedness at €1.7 billion
Reconciliation of cash flow EBIT declined by €533.8 million to €4,027.7 million after €4,561.5 million in 2017.
Interest payments resulting in particular from bonds decreased by €16.0 million to €115.5 million (PY: €131.5 million).
Income tax payments fell by €261.3 million to €860.8 million (PY: €1,122.1 million).
The cash-effective decrease in working capital led to a cash inflow of €136.6 million (PY: cash outflow of €483.8 million). This resulted from the €358.4 million increase in inventories (PY: €484.3 million). The decline in operating receivables in the amount of €38.3 million (PY: increase of €737.1 million) contrasted with the increase in op-erating liabilities in the amount of €456.7 million (PY: €737.6 million).
Cash flow from operating activities fell by €243.3 million year-on-year to €4,977.2 million (PY: €5,220.5 million) in 2018, correspond-ing to 11.2% (PY: 11.9%) of sales.
Cash flow arising from investing activities amounted to an outflow of €3,626.2 million (PY: €3,467.7 million). Capital expenditure on property, plant and equipment, and software was up €274.7 million from €2,849.7 million to €3,124.4 million before finance leases and the capitalization of borrowing costs. The net amount from the ac-quisition and disposal of companies and business operations re-sulted in a total cash outflow of €404.8 million (PY: €575.9 million) in 2018. This cash outflow was mainly attributable to the acquisition of Tyre and Auto Pty Ltd, Melbourne, Australia.
Taking into account reduced tax payments as a result of U.S. tax reform, the additional funding of U.S. pension plans generated a negative cash flow effect of around €167.4 million.
Free cash flow for fiscal 2018 amounted to €1,351.0 million (PY: €1,752.8 million). This corresponds to a decrease of €401.8 million compared with the previous year.
Capital expenditure (additions) Capital expenditure for property, plant and equipment, and soft-ware amounted to €3,124.4 million in 2018. Overall, there was an increase of €270.0 million compared with the previous year’s level of €2,854.4 million, to which the Interior, Chassis & Safety, Power-train and ContiTech divisions contributed. Capital expenditure amounted to 7.0% (PY: 6.5%) of sales.
Financing and indebtedness As at the end of 2018, gross indebtedness amounted to €4,606.9 million (PY: €4,090.0 million), up €516.9 million on the previous year’s level.
Based on quarter-end values, 54.7% (PY: 59.6%) of gross indebted-ness after hedging measures had fixed interest rates on average over the year.
The carrying amount of the bonds fell by €744.2 million from €2,639.4 million in the previous year to €1,895.2 million as at the end of fiscal 2018. This decrease was attributable to the repayment of the Continental AG euro bond that matured on July 16, 2018, and was redeemed at its nominal value of €750.0 million. The five-year bond bore interest at a rate of 3.0% p.a.
Bank loans and overdrafts amounted to €1,239.0 million (PY: €859.7 million) as at December 31, 2018, and were therefore up €379.3 million on the previous year’s level.
The syndicated loan comprises a revolving tranche of €3,000.0 million. This credit line is available to Continental until April 2021 and had not been utilized by Continental Rubber of America, Corp., Wilmington, Delaware, U.S.A., in the amount of €157.2 million as at December 31, 2018 (PY: —).
Other indebtedness increased by €881.8 million to €1,472.7 million (PY: €590.9 million) as at the end of 2018. This increase was chiefly due to commercial paper issuances with a carrying amount of €814.5 million (PY: €12.6 million). At the end of 2018, the utiliza-tion of sale-of-receivables programs amounted to €469.2 million, down from the previous year’s €513.7 million. As at the end of 2018, four (PY: five) sale-of-receivables programs with a total financing volume of €665.0 million (PY: €894.5 million) were used within the Continental Corporation.
Cash and cash equivalents, derivative instruments and interest-bearing investments were up by €903.2 million at €2,945.6 million (PY: €2,042.4 million).
Net indebtedness decreased by a considerable €386.3 million as compared to the end of 2017 to €1,661.3 million (PY: €2,047.6 million). The gearing ratio also continued to improve year-on-year to 9.1% (PY: 12.6%).
As at December 31, 2018, Continental had liquidity reserves totaling €6,265.5 million (PY: €5,568.3 million), consisting of cash and cash equivalents of €2,761.4 million (PY: €1,881.5 million) and committed, unutilized credit lines totaling €3,504.1 million (PY: €3,686.8 million).
The restrictions that may impact the availability of capital are also understood as comprising all existing restrictions on the cash and cash equivalents. In the Continental Corporation, the aforemen-tioned cash and cash equivalents are restricted with regard to pledged amounts and balances in countries with foreign-exchange restrictions or other barriers to accessing liquidity. Taxes to be paid on the transfer of cash assets from one country to another are not usually considered to represent a restriction on cash and cash equivalents. As at December 31, 2018, unrestricted cash and cash equivalents totaled €2,587.7 million (PY: €1,726.7 million).

Continental AG 2018 Annual Report Management Report Economic Report 69
Reconciliation of net indebtedness
€ millions Dec. 31, 2018 Dec. 31, 2017
Long-term indebtedness 1,449.0 2,017.8
Short-term indebtedness 3,157.9 2,072.2
Long-term derivative instruments and interest-bearing investments –32.4 –113.3
Short-term derivative instruments and interest-bearing investments –151.8 –47.6
Cash and cash equivalents –2,761.4 –1,881.5
Net indebtedness 1,661.3 2,047.6
Reconciliation of change in net indebtedness
€ millions 2018 2017
Net indebtedness at the beginning of the reporting period 2,047.6 2,797.8
Cash flow arising from operating activities 4,977.2 5,220.5
Cash flow arising from investing activities –3,626.2 –3,467.7
Cash flow before financing activities (free cash flow) 1,351.0 1,752.8
Dividends paid –900.0 –850.0
Dividends paid to and cash changes from equity transactions with non-controlling interests –45.4 –46.5
Non-cash changes 24.9 16.5
Other –19.3 –151.6
Exchange-rate effects –24.9 29.0
Change in net indebtedness 386.3 750.2
Net indebtedness at the end of the reporting period 1,661.3 2,047.6

70 Continental AG 2018 Annual Report Management Report Economic Report
Net Assets Position
› Equity at €18.3 billion
› Equity ratio at 45.3%
› Gearing ratio at 9.1%
Total assets At €40,445.4 million (PY: €37,440.5 million), total assets as at De-cember 31, 2018, were €3,004.9 million higher than on the same date in the previous year. Goodwill, at €7,233.4 million, was up by €223.3 million compared to the previous year’s figure of €7,010.1 million. Other intangible assets decreased by €41.0 million to €1,566.3 million (PY: €1,607.3 million). Property, plant and equip-ment increased by €1,173.4 million to €12,375.5 million (PY: €11,202.1 million). Deferred tax assets were down €52.8 million at €1,464.4 million (PY: €1,517.2 million). Inventories rose by €392.9 million to €4,521.1 million (PY: €4,128.2 million), while trade ac-counts receivable fell by €37.4 million to €7,631.9 million (PY: €7,669.3 million). Short-term other assets decreased by €62.6 mil-lion to €1,124.2 million (PY: €1,186.8 million). At €2,761.4 million, cash and cash equivalents were up €879.9 million from €1,881.5 million on the same date in the previous year.
Non-current assets Non-current assets rose by €1,620.3 million year-on-year to €23,658.7 million (PY: €22,038.4 million). In relation to the individual items of the statement of financial position, this was due primarily to the €223.3 million increase in goodwill to €7,233.4 million (PY: €7,010.1 million), the €230.1 million rise in investments in equity-accounted investees to €644.9 million (PY: €414.8 million), the €1,173.4 million increase in property, plant and equipment to €12,375.5 million (PY: €11,202.1 million) and the €80.9 million decrease in long-term derivative instruments and interest-bearing investments to €32.4 million (PY: €113.3 million).
Current assets At €16,786.7 million, current assets were €1,384.6 million higher than the previous year’s figure of €15,402.1 million. In the year un-der review, inventories rose by €392.9 million to €4,521.1 million (PY: €4,128.2 million), while trade accounts receivable fell by €37.4 million to €7,631.9 million (PY: €7,669.3 million). Cash and cash equivalents increased by €879.9 million to €2,761.4 million (PY: €1,881.5 million).
Equity Equity was €2,043.0 million higher than in the previous year at €18,333.3 million (PY: €16,290.3 million). This was due primarily to the increase in retained earnings of €2,027.9 million. The gearing ratio improved from 12.6% to 9.1%. The equity ratio rose from 43.5% to 45.3% in the period under review.
Non-current liabilities At €6,398.2 million, non-current liabilities were down €563.3 million from €6,961.5 million in the previous year. This was attributable mainly to the €568.8 million reduction in long-term indebtedness to €1,449.0 million (PY: €2,017.8 million). This in turn resulted from the repayment of a Continental AG euro bond with a nominal volume of €750.0 million.
Current liabilities At €15,713.9 million, current liabilities were up €1,525.2 million from €14,188.7 million in the previous year. Short-term indebtedness increased by €1,085.7 million to €3,157.9 million (PY: €2,072.2 million) and trade accounts payable by €494.5 million to €7,293.0 million (PY: €6,798.5 million). By contrast, other current liabilities decreased by €151.3 million to €566.6 million (PY: €717.9 million) and income tax liabilities by €139.0 million to €750.7 million (PY: €889.7 million).
Operating assets Operating assets increased by €1,540.1 million year-on-year to €23,753.7 million (PY: €22,213.6 million) as at December 31, 2018.
Total working capital was down €122.1 million at €5,083.9 million (PY: €5,206.0 million). This development was due to the €494.5 million increase in operating liabilities to €7,293.0 million (PY: €6,798.5 million) and the €20.5 million decline in operating receiv-ables to €7,855.8 million (PY: €7,876.3 million), in contrast to the €392.9 million rise in inventories to €4,521.1 million (PY: €4,128.2 million).
Non-current operating assets were up €1,744.8 million year-on-year at €22,132.0 million (PY: €20,387.2 million). Goodwill increased by €223.3 million to €7,233.4 million (PY: €7,010.1 million). This change resulted primarily from additions of €189.8 million, which were countered by exchange-rate effects of €33.5 million. Property, plant and equipment increased by €1,173.4 million to €12,375.5 million (PY: €11,202.1 million) due to investing activities. Other in-tangible assets declined by €41.0 million to €1,566.3 million (PY: €1,607.3 million). Amortization of intangible assets from purchase price allocation (PPA) in the amount of €173.0 million (PY: €170.7 million) reduced the value of intangible assets.
The acquisition of Tyre and Auto Pty Ltd, Melbourne, Australia, con-tributed €226.6 million to the increase in the Tire division’s operat-ing assets.
The disposal of a company resulted in a decline in operating assets by a total of €17.8 million in the Interior and Powertrain divisions.

Continental AG 2018 Annual Report Management Report Economic Report 71
Consolidated statement of financial position
Assets in € millions Dec. 31, 2018 Dec. 31, 2017
Goodwill 7,233.4 7,010.1
Other intangible assets 1,566.3 1,607.3
Property, plant and equipment 12,375.5 11,202.1
Investments in equity-accounted investees 644.9 414.8
Long-term miscellaneous assets 1,838.6 1,804.1
Non-current assets 23,658.7 22,038.4
Inventories 4,521.1 4,128.2
Trade accounts receivable 7,631.9 7,669.3
Short-term miscellaneous assets 1,872.3 1,723.1
Cash and cash equivalents 2,761.4 1,881.5
Current assets 16,786.7 15,402.1
Total assets 40,445.4 37,440.5
Equity and liabilities in € millions Dec. 31, 2018 Dec. 31, 2017
Total equity 18,333.3 16,290.3
Non-current liabilities 6,398.2 6,961.5
Trade accounts payable 7,293.0 6,798.5
Short-term other provisions and liabilities 8,420.9 7,390.2
Current liabilities 15,713.9 14,188.7
Total equity and liabilities 40,445.4 37,440.5
Net indebtedness 1,661.3 2,047.6
Gearing ratio in % 9.1 12.6
Other changes in the scope of consolidation did not result in any notable additions to or disposal of operating assets at corporation level.
While exchange-rate effects reduced the corporation’s total operat-ing assets by €900.7 million in the previous year, they increased them by €61.7 million in the year under review.
Average operating assets rose by €1,468.1 million to €23,640.5 million as compared to the previous year (€22,172.4 million).

72 Continental AG 2018 Annual Report Management Report Economic Report
Reconciliation to operating assets in 2018
€ millions Chassis & Safety Powertrain Interior Tires ContiTech Other/
consolidation Continental
Corporation
Total assets 7,668.6 5,797.3 8,313.9 9,083.9 4,412.5 5,169.2 40,445.4
Cash and cash equivalents — — — — — 2,761.4 2,761.4
Short- and long-term derivative instruments, interest-bearing investments — — — — — 184.2 184.2
Other financial assets 9.9 20.4 14.5 20.1 5.9 4.1 74.9
Less financial assets 9.9 20.4 14.5 20.1 5.9 2,949.7 3,020.5
Less other non-operating assets –41.4 –53.6 –90.0 –25.8 14.8 470.5 274.5
Deferred tax assets — — — — — 1,464.4 1,464.4
Income tax receivables — — — — — 208.2 208.2
Less income tax assets — — — — — 1,672.6 1,672.6
Segment assets 7,700.1 5,830.5 8,389.4 9,089.6 4,391.8 76.4 35,477.8
Total liabilities and provisions 3,856.1 3,131.0 3,283.8 3,433.9 1,822.3 6,585.0 22,112.1
Short- and long-term indebtedness — — — — — 4,606.9 4,606.9
Interest payable and other financial liabilities — — — — — 75.8 75.8
Less financial liabilities — — — — — 4,682.7 4,682.7
Deferred tax liabilities — — — — — 315.7 315.7
Income tax payables — — — — — 750.7 750.7
Less income tax liabilities — — — — — 1,066.4 1,066.4
Less other non-operating liabilities 1,146.5 858.2 682.5 779.6 551.4 620.7 4,638.9
Segment liabilities 2,709.6 2,272.8 2,601.3 2,654.3 1,270.9 215.2 11,724.1
Operating assets 4,990.5 3,557.7 5,788.1 6,435.3 3,120.9 –138.8 23,753.7

Continental AG 2018 Annual Report Management Report Economic Report 73
Reconciliation to operating assets in 2017
€ millions Chassis & Safety Powertrain Interior Tires ContiTech Other/
consolidation Continental
Corporation
Total assets 7,330.8 5,413.4 7,619.0 8,421.1 4,348.0 4,308.2 37,440.5
Cash and cash equivalents — — — — — 1,881.5 1,881.5
Short- and long-term derivative instruments, interest-bearing investments — — — — — 160.9 160.9
Other financial assets 10.0 39.4 18.7 23.3 6.6 2.9 100.9
Less financial assets 10.0 39.4 18.7 23.3 6.6 2,045.3 2,143.3
Less other non-operating assets –30.1 –56.1 –69.1 –34.3 –1.4 535.5 344.5
Deferred tax assets — — — — — 1,517.2 1,517.2
Income tax receivables — — — — — 178.2 178.2
Less income tax assets — — — — — 1,695.4 1,695.4
Segment assets 7,350.9 5,430.1 7,669.4 8,432.1 4,342.8 32.0 33,257.3
Total liabilities and provisions 4,003.1 2,835.8 3,083.3 3,315.4 1,797.7 6,114.9 21,150.2
Short- and long-term indebtedness — — — — — 4,090.0 4,090.0
Interest payable and other financial liabilities — — — — — 81.8 81.8
Less financial liabilities — — — — — 4,171.8 4,171.8
Deferred tax liabilities — — — — — 348.5 348.5
Income tax payables — — — — — 889.7 889.7
Less income tax liabilities — — — — — 1,238.2 1,238.2
Less other non-operating liabilities 1,197.8 806.5 654.7 879.0 532.8 625.7 4,696.5
Segment liabilities 2,805.3 2,029.3 2,428.6 2,436.4 1,264.9 79.2 11,043.7
Operating assets 4,545.6 3,400.8 5,240.8 5,995.7 3,077.9 –47.2 22,213.6

74 Continental AG 2018 Annual Report Management Report Economic Report
Automotive Group in € millions 2018 2017 in %
Sales 26,855.8 26,565.4 1.1
EBITDA 3,177.1 3,296.4 –3.6
in % of sales 11.8 12.4
EBIT 1,890.4 2,086.8 –9.4
in % of sales 7.0 7.9
Research and development expenses (net) 2,760.5 2,675.5 3.2
in % of sales 10.3 10.1
Depreciation and amortization1 1,286.7 1,209.6 6.4
thereof impairment2 19.2 37.3
Operating assets as at December 31 14,336.3 13,187.2 8.7
Operating assets (average) 14,095.6 12,874.1 9.5
ROCE 13.4 16.2
Capital expenditure3 2,019.1 1,789.5 12.8
in % of sales 7.5 6.7
Number of employees as at December 314 140,016 134,286 4.3
Adjusted sales5 26,840.7 26,546.3 1.1
Adjusted operating result (adjusted EBIT)6 1,886.3 2,180.7 –13.5
in % of adjusted sales 7.0 8.2
1 Excluding impairment on financial investments. 2 Impairment also includes necessary reversal of impairment losses. 3 Capital expenditure on property, plant and equipment, and software. 4 Excluding trainees. 5 Before changes in the scope of consolidation. 6 Before amortization of intangible assets from purchase price allocation (PPA), changes in the scope of consolidation, and special effects.
The Automotive Group comprises three divisions:
› The Chassis & Safety division (21% of consolidated sales) devel-ops, produces and markets intelligent systems to improve driving safety and vehicle dynamics.
› The Powertrain division (17% of consolidated sales) combines innovative and efficient system solutions for the powertrains of today and tomorrow.
› The Interior division (22% of consolidated sales) specializes in information management. It develops and produces information, communication and network solutions and services for cars and commercial vehicles.
The 13 business units in total generated 60% of consolidated sales in the year under review.
Key raw materials for the Automotive Group are steel, aluminum, precious metals, copper and plastics. One point of focus when it comes to purchasing materials and semifinished products is elec-tronics and electromechanical components, which together make up roughly 44% of the corporation’s purchasing volume for pro-duction material.
Automotive Group

Continental AG 2018 Annual Report Management Report Economic Report 75
Development of the Chassis & Safety Division
› Sales down 1.8%
› Sales up 0.5% before changes in the scope of consolidation and exchange-rate effects
› Adjusted EBIT down 12.6%
Sales volumes In the Vehicle Dynamics business unit, the number of electronic brake systems sold in 2018 fell by 1.8% year-on-year. In the Hy-draulic Brake Systems business unit, sales figures for brake boosters were down 2.2% compared to the previous year. Sales of brake cali-pers with integrated electric parking brakes increased by 17% year-on-year, more than compensating for the decline in sales figures for conventional brake calipers, which decreased by 13% year-on-year. In the Passive Safety & Sensorics business unit, the sales volume of air-bag control units fell by 4% year-on-year. Unit sales of advanced driver assistance systems were up 31%.
Sales down 1.8% Sales up 0.5% before changes in the scope of consolidation and exchange-rate effects Sales in the Chassis & Safety division declined by 1.8% year-on-year to €9,588.0 million (PY: €9,767.8 million) in 2018. Before changes in the scope of consolidation and exchange-rate effects, sales rose by 0.5%.
Adjusted EBIT down 12.6% The Chassis & Safety division’s adjusted EBIT declined by €113.2 million or 12.6% year-on-year in 2018 to €784.9 million (PY: €898.1 million), equivalent to 8.2% (PY: 9.2%) of adjusted sales.
EBIT down 12.8% In comparison to the previous year, the Chassis & Safety division posted a decrease in EBIT of €115.2 million, or 12.8%, to €782.5 million (PY: €897.7 million) in 2018. The return on sales fell to 8.2% (PY: 9.2%).
ROCE amounted to 16.0% (PY: 19.9%).
Special effects in 2018 Impairment on property, plant and equipment in the Chassis & Safety division resulted in expense of €1.5 million.
In addition, there was income of €3.0 million from the disposal of shares in two companies.
The transformation of the Powertrain division into an independent group of legal entities resulted in expense of €4.3 million.
Special effects in 2018 had a negative impact totaling €2.8 million in the Chassis & Safety division.
Special effects in 2017 An impairment loss and a reversal of impairment loss on property, plant and equipment resulted in total expense of €0.5 million in the Chassis & Safety division.
In addition, the reversal of a restructuring provision resulted in income of €0.1 million.
Special effects in 2017 had a negative impact totaling €0.4 million in the Chassis & Safety division.
Procurement The procurement market for Chassis & Safety saw stable develop-ment in 2018. The supply was ensured at all times. However, mar-ket-driven supply bottlenecks for discrete and passive electronic components resulted in significant additional expense to ensure delivery capacity. In the raw materials sector, prices increased in the first half of the year as a result of strong global demand and tariff restrictions on aluminum and steel imports. This trend was intensified by impending U.S. sanctions against Russia. In the fourth quarter of 2018, declining demand in China resulted in a reversal of the price trend for most raw materials.
Research and development Research and development expenses (net) rose by €109.4 million or 12.0% year-on-year to €1,023.2 million (PY: €913.8 million), cor-responding to 10.7% (PY: 9.4%) of sales.
Depreciation and amortization Depreciation and amortization rose by €26.9 million compared to fiscal 2017 to €430.8 million (PY: €403.9 million) and amounted to 4.5% (PY: 4.1%) of sales. This included impairment totaling €1.5 million in 2018 (PY: €0.5 million).
Sales € millions
8,977.69,767.8 9,588.0
2016 2017 2018
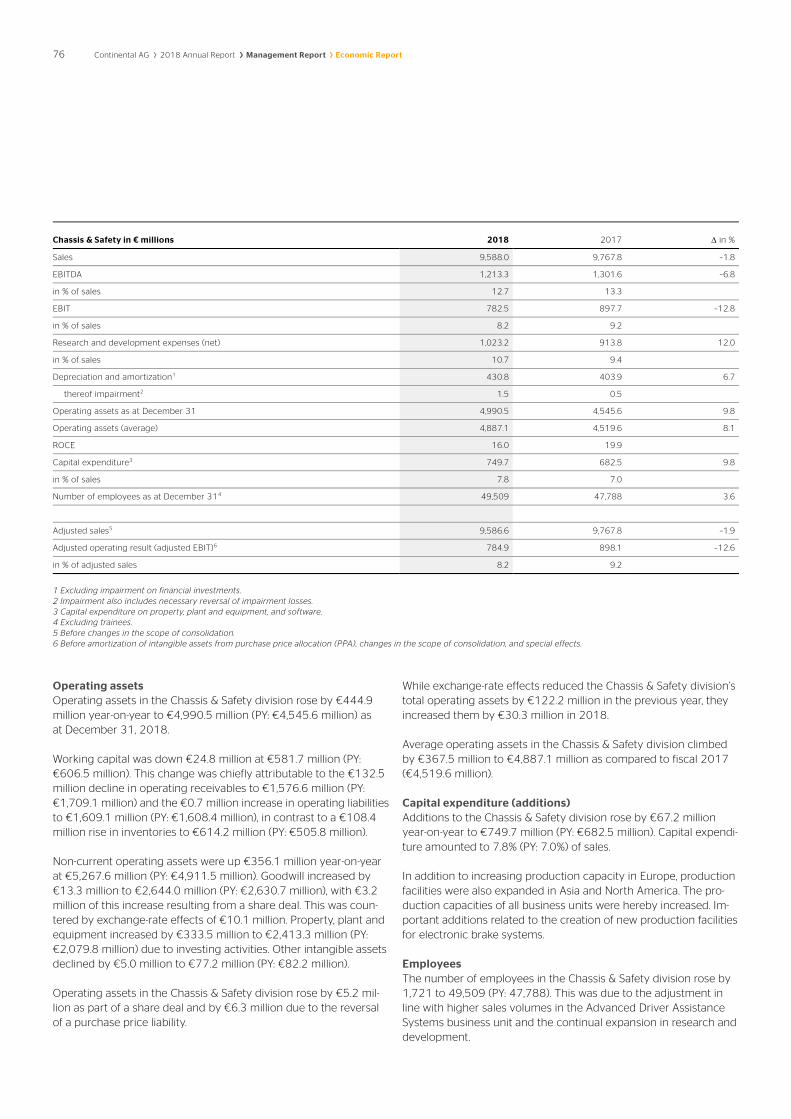
76 Continental AG 2018 Annual Report Management Report Economic Report
Chassis & Safety in € millions 2018 2017 in %
Sales 9,588.0 9,767.8 –1.8
EBITDA 1,213.3 1,301.6 –6.8
in % of sales 12.7 13.3
EBIT 782.5 897.7 –12.8
in % of sales 8.2 9.2
Research and development expenses (net) 1,023.2 913.8 12.0
in % of sales 10.7 9.4
Depreciation and amortization1 430.8 403.9 6.7
thereof impairment2 1.5 0.5
Operating assets as at December 31 4,990.5 4,545.6 9.8
Operating assets (average) 4,887.1 4,519.6 8.1
ROCE 16.0 19.9
Capital expenditure3 749.7 682.5 9.8
in % of sales 7.8 7.0
Number of employees as at December 314 49,509 47,788 3.6
Adjusted sales5 9,586.6 9,767.8 –1.9
Adjusted operating result (adjusted EBIT)6 784.9 898.1 –12.6
in % of adjusted sales 8.2 9.2
1 Excluding impairment on financial investments. 2 Impairment also includes necessary reversal of impairment losses. 3 Capital expenditure on property, plant and equipment, and software. 4 Excluding trainees. 5 Before changes in the scope of consolidation. 6 Before amortization of intangible assets from purchase price allocation (PPA), changes in the scope of consolidation, and special effects.
Operating assets Operating assets in the Chassis & Safety division rose by €444.9 million year-on-year to €4,990.5 million (PY: €4,545.6 million) as at December 31, 2018.
Working capital was down €24.8 million at €581.7 million (PY: €606.5 million). This change was chiefly attributable to the €132.5 million decline in operating receivables to €1,576.6 million (PY: €1,709.1 million) and the €0.7 million increase in operating liabilities to €1,609.1 million (PY: €1,608.4 million), in contrast to a €108.4 million rise in inventories to €614.2 million (PY: €505.8 million).
Non-current operating assets were up €356.1 million year-on-year at €5,267.6 million (PY: €4,911.5 million). Goodwill increased by €13.3 million to €2,644.0 million (PY: €2,630.7 million), with €3.2 million of this increase resulting from a share deal. This was coun-tered by exchange-rate effects of €10.1 million. Property, plant and equipment increased by €333.5 million to €2,413.3 million (PY: €2,079.8 million) due to investing activities. Other intangible assets declined by €5.0 million to €77.2 million (PY: €82.2 million).
Operating assets in the Chassis & Safety division rose by €5.2 mil-lion as part of a share deal and by €6.3 million due to the reversal of a purchase price liability.
While exchange-rate effects reduced the Chassis & Safety division’s total operating assets by €122.2 million in the previous year, they increased them by €30.3 million in 2018.
Average operating assets in the Chassis & Safety division climbed by €367.5 million to €4,887.1 million as compared to fiscal 2017 (€4,519.6 million).
Capital expenditure (additions) Additions to the Chassis & Safety division rose by €67.2 million year-on-year to €749.7 million (PY: €682.5 million). Capital expendi-ture amounted to 7.8% (PY: 7.0%) of sales.
In addition to increasing production capacity in Europe, production facilities were also expanded in Asia and North America. The pro-duction capacities of all business units were hereby increased. Im-portant additions related to the creation of new production facilities for electronic brake systems.
Employees The number of employees in the Chassis & Safety division rose by 1,721 to 49,509 (PY: 47,788). This was due to the adjustment in line with higher sales volumes in the Advanced Driver Assistance Systems business unit and the continual expansion in research and development.

Continental AG 2018 Annual Report Management Report Economic Report 77
Development of the Powertrain Division
› Sales up 1.0%
› Sales up 2.9% before changes in the scope of consolidation and exchange-rate effects
› Adjusted EBIT down 56.9%
Sales volumes In the Engine Systems business unit, sales volumes of engine con-trol units, injectors, pumps and turbochargers increased in fiscal 2018. The Sensors & Actuators business unit is continuing to record growth. Emissions legislation has resulted in rising sales of exhaust-gas sensors in particular. The Hybrid Electric Vehicle business unit started to deliver 48-volt drive systems. The sales volume of power electronics was up year-on-year, whereas that of battery and on-board power supply systems was down year-on-year. Sales figures of the Transmission business unit were down slightly year-on-year. In the Fuel & Exhaust Management business unit, the sales volume of electronic control units for fuel delivery modules, catalytic con-verters and SCR systems increased year-on-year, while the sales volume of fuel delivery modules was slightly lower than in the pre-vious year.
Sales up 1.0% Sales up 2.9% before changes in the scope of consolidation and exchange-rate effects Sales in the Powertrain division rose by 1.0% year-on-year to €7,741.0 million (PY: €7,660.9 million) in 2018. Before changes in the scope of consolidation and exchange-rate effects, sales rose by 2.9%.
Adjusted EBIT down 56.9% The Powertrain division’s adjusted EBIT was down by €267.6 mil-lion or 56.9% year-on-year in 2018 to €202.3 million (PY: €469.9 million), equivalent to 2.6% (PY: 6.1%) of adjusted sales.
EBIT down 72.8% In comparison to the previous year, the Powertrain division posted a decline in EBIT of €320.1 million, or 72.8%, to €119.8 million (PY: €439.9 million) in 2018. The return on sales fell to 1.5% (PY: 5.7%).
The amortization of intangible assets from purchase price allocation (PPA) reduced EBIT by €11.4 million (PY: €11.9 million).
ROCE amounted to 3.3% (PY: 13.2%).
Special effects in 2018 In the Powertrain division, there were restructuring expenses of €14.2 million for the location in Roding, Germany. This included impairment on property, plant and equipment in the amount of €3.3 million.
In addition, there were restructuring expenses of €8.6 million for the location in Gifhorn, Germany.
Impairment and a reversal of impairment losses on property, plant and equipment resulted in expense totaling €16.0 million.
The transformation into an independent group of legal entities resulted in expense of €32.3 million.
Special effects in 2018 had a negative impact totaling €71.1 million in the Powertrain division.
Special effects in 2017 Impairment on property, plant and equipment resulted in expense totaling €18.8 million in the Powertrain division.
In addition, the reversal of restructuring provisions no longer re-quired resulted in income totaling €0.7 million, which included €0.2 million from a reversal of impairment losses on property, plant and equipment.
Special effects in 2017 had a negative impact totaling €18.1 million in the Powertrain division.
Procurement The procurement market was characterized by a tight supply situa-tion in 2018. As a result of high market-driven demand for compo-nents, particularly for gasoline engines, and the associated addi-tional demand for steel long products, there were longer delivery times in the steel industry. Average prices for precious and indus-trial metals traded in U.S. dollars were somewhat higher than the previous year’s level. Despite the shortages in the semiconductor market, the supply was ensured. At the end of the year, initial signs of an easing in raw material prices could be observed. The procure-ment cooperation with the Schaeffler Group was again successfully continued.
Research and development Research and development expenses (net) fell by €26.4 million or 3.8% year-on-year to €672.6 million (PY: €699.0 million), correspond-ing to 8.7% (PY: 9.1%) of sales.
Sales € millions
7,319.57,660.9 7,741.0
2016 2017 2018

78 Continental AG 2018 Annual Report Management Report Economic Report
Powertrain in € millions 2018 2017 in %
Sales 7,741.0 7,660.9 1.0
EBITDA 574.6 854.8 –32.8
in % of sales 7.4 11.2
EBIT 119.8 439.9 –72.8
in % of sales 1.5 5.7
Research and development expenses (net) 672.6 699.0 –3.8
in % of sales 8.7 9.1
Depreciation and amortization1 454.8 414.9 9.6
thereof impairment2 19.3 18.6
Operating assets as at December 31 3,557.7 3,400.8 4.6
Operating assets (average) 3,582.2 3,325.6 7.7
ROCE 3.3 13.2
Capital expenditure3 691.0 653.7 5.7
in % of sales 8.9 8.5
Number of employees as at December 314 42,601 40,492 5.2
Adjusted sales5 7,741.0 7,660.9 1.0
Adjusted operating result (adjusted EBIT)6 202.3 469.9 –56.9
in % of adjusted sales 2.6 6.1
1 Excluding impairment on financial investments. 2 Impairment also includes necessary reversal of impairment losses. 3 Capital expenditure on property, plant and equipment, and software. 4 Excluding trainees. 5 Before changes in the scope of consolidation. 6 Before amortization of intangible assets from purchase price allocation (PPA), changes in the scope of consolidation, and special effects.
Depreciation and amortization Depreciation and amortization rose by €39.9 million compared to fiscal 2017 to €454.8 million (PY: €414.9 million) and amounted to 5.9% (PY: 5.4%) of sales. This included impairment totaling €19.3 million in 2018 (PY: €18.6 million).
Operating assets Operating assets in the Powertrain division increased by €156.9 million year-on-year to €3,557.7 million (PY: €3,400.8 million) as at December 31, 2018.
Working capital was down €4.1 million at €368.5 million (PY: €372.6 million). Inventories increased by €105.0 million to €575.4 million (PY: €470.4 million). Operating receivables rose by €18.5 million to €1,373.8 million (PY: €1,355.3 million) as at the reporting date. Total operating liabilities were up €127.6 million at €1,580.7 million (PY: €1,453.1 million).
Non-current operating assets were up €282.3 million year-on-year at €3,736.9 million (PY: €3,454.6 million). Goodwill increased by €7.5 million to €993.8 million (PY: €986.3 million) as a result of exchange-rate effects. At €2,456.1 million, property, plant and equipment was €267.3 million above the previous year’s level of €2,188.8 million. Other intangible assets climbed by €13.7 million to €191.7 million (PY: €178.0 million). Amortization of intangible assets from purchase price allocation (PPA) in the amount of €11.4 million (PY: €11.9 million) reduced the value of intangible assets.
While exchange-rate effects reduced the Powertrain division’s total operating assets by €97.6 million in the previous year, they increased them by €19.0 million in 2018.
Average operating assets in the Powertrain division climbed by €256.6 million to €3,582.2 million as compared to fiscal 2017 (€3,325.6 million).
Capital expenditure (additions) Additions to the Powertrain division increased by €37.3 million year-on-year to €691.0 million (PY: €653.7 million). Capital expendi-ture amounted to 8.9% (PY: 8.5%) of sales.
In the Powertrain division, production capacity was increased at the German locations and in China, Czechia, the U.S.A. and Romania. Important additions related to the Engine Systems and Sensors & Actuators business units. In the Engine Systems business unit, man-ufacturing capacity for engine injection systems was expanded.
Employees The number of employees in the Powertrain division rose by 2,109 compared with the previous year to 42,601 (PY: 40,492). This was due to the adjustment in line with higher sales volumes and the expansion in research and development.

Continental AG 2018 Annual Report Management Report Economic Report 79
Development of the Interior Division
› Sales up 4.3%
› Sales up 6.3% before changes in the scope of consolidation and exchange-rate effects
› Adjusted EBIT up 10.6%
Sales volumes Sales volumes in the Body & Security business unit were slightly below the previous year’s level in fiscal 2018. There was slight growth in Europe, but this was not enough to fully offset the de-cline in the North America and Asia regions. Sales figures in the Infotainment & Connectivity business unit considerably exceeded the previous year’s figure. The multimedia and connectivity areas posted a significant increase, while the audio area was somewhat weaker than in 2017. Sales volumes in the Commercial Vehicles & Aftermarket business unit were above the previous year’s level overall. This was attributable mainly to growing demand in replace-ment parts and aftermarket business. By contrast, sales volumes in commercial-vehicles business decreased slightly. In the Instrumen-tation & Driver HMI business unit, sales volumes in 2018 were higher than in the previous year. Increases were mainly achieved with European and Chinese carmakers, particularly for instrument cluster and display solutions.
Sales up 4.3% Sales up 6.3% before changes in the scope of consolidation and exchange-rate effects In 2018, sales in the Interior division rose by 4.3% year-on-year to €9,707.2 million (PY: €9,305.2 million). Before changes in the scope of consolidation and exchange-rate effects, sales rose by 6.3%.
Adjusted EBIT up 10.6% The Interior division’s adjusted EBIT increased by €86.4 million or 10.6% year-on-year in 2018 to €899.1 million (PY: €812.7 million), equivalent to 9.3% (PY: 8.8%) of adjusted sales.
EBIT up 31.9% In comparison to the previous year, the Interior division posted an increase in EBIT of €238.9 million, or 31.9%, to €988.1 million (PY: €749.2 million) in 2018. The return on sales climbed to 10.2% (PY: 8.1%).
The amortization of intangible assets from purchase price allocation (PPA) reduced EBIT by €51.1 million (PY: €46.1 million).
ROCE amounted to 17.6% (PY: 14.9%).
Special effects in 2018 Following the successful conclusion of all negotiations and the granting of the required merger control authorizations, OSRAM CONTINENTAL GmbH, Munich, Germany, commenced global oper-ations on July 2, 2018. The contribution of net assets, including in-tangible assets, resulted in income of €183.7 million for the Interior division.
In addition, the disposal of a company resulted in expense of €28.9 million.
Impairment on property, plant and equipment resulted in expense of €1.2 million.
The reversal of restructuring provisions no longer required resulted in income of €3.0 million, which included €2.8 million from a reversal of impairment losses on property, plant and equipment.
In addition, an asset deal resulted in income of €2.9 million.
The transformation of the Powertrain division into an independent group of legal entities resulted in expense of €4.3 million.
Special effects in 2018 had a positive impact totaling €155.2 million in the Interior division.
Special effects in 2017 In the Interior division, goodwill totaling €23.0 million that arose in connection with the expansion of our mobility-services activities was impaired, outside the scope of the annual impairment test.
The reversal of restructuring provisions no longer required resulted in income totaling €5.4 million, which included €4.8 million from a reversal of impairment losses on property, plant and equipment.
In addition, the acquisition of the remaining shares in a joint venture resulted in income of €1.9 million from the adjustment of the mar-ket value of the previously held shares.
Special effects in 2017 had a negative impact totaling €15.7 million in the Interior division.
Sales € millions
8,324.7
9,305.29,707.2
2016 2017 2018

80 Continental AG 2018 Annual Report Management Report Economic Report
Interior in € millions 2018 2017 in %
Sales 9,707.2 9,305.2 4.3
EBITDA 1,389.2 1,140.0 21.9
in % of sales 14.3 12.3
EBIT 988.1 749.2 31.9
in % of sales 10.2 8.1
Research and development expenses (net) 1,064.7 1,062.7 0.2
in % of sales 11.0 11.4
Depreciation and amortization1 401.1 390.8 2.6
thereof impairment2 –1.6 18.2
Operating assets as at December 31 5,788.1 5,240.8 10.4
Operating assets (average) 5,626.3 5,028.9 11.9
ROCE 17.6 14.9
Capital expenditure3 578.4 453.3 27.6
in % of sales 6.0 4.9
Number of employees as at December 314 47,906 46,006 4.1
Adjusted sales5 9,693.3 9,286.1 4.4
Adjusted operating result (adjusted EBIT)6 899.1 812.7 10.6
in % of adjusted sales 9.3 8.8
1 Excluding impairment on financial investments. 2 Impairment also includes necessary reversal of impairment losses. 3 Capital expenditure on property, plant and equipment, and software. 4 Excluding trainees. 5 Before changes in the scope of consolidation. 6 Before amortization of intangible assets from purchase price allocation (PPA), changes in the scope of consolidation, and special effects.
Procurement For the Interior division, the year 2018 was dominated by supply problems as a result of the allocation on the semiconductor mar-ket. The need for passive and discrete components could only be covered with great effort and high costs in the supply chain. Pro-duction downtime due to component shortages was successfully avoided. In the interests of active risk management, the process of nominating alternative supply options for key components was fur-ther advanced. The share of displays in total procurement volumes for the Interior division and the size of the displays have both in-creased further. Overall, the quality level for purchased parts was further improved.
Research and development Research and development expenses (net) rose by €2.0 million or 0.2% year-on-year to €1,064.7 million (PY: €1,062.7 million), corre-sponding to 11.0% (PY: 11.4%) of sales.
Depreciation and amortization Depreciation and amortization rose by €10.3 million compared to fiscal 2017 to €401.1 million (PY: €390.8 million) and amounted to 4.1% (PY: 4.2%) of sales. This included reversals of impairment losses totaling €1.6 million in 2018 (PY: impairment of €18.2 million).
Operating assets Operating assets in the Interior division increased by €547.3 million year-on-year to €5,788.1 million (PY: €5,240.8 million) as at Decem-ber 31, 2018.
Working capital was down €85.9 million at €693.0 million (PY: €778.9 million). Inventories increased by €58.6 million to €882.3 million (PY: €823.7 million). Operating receivables fell by €8.2 mil-lion to €1,587.7 million (PY: €1,595.9 million) as at the reporting date. Operating liabilities were up €136.3 million at €1,777.0 mil-lion (PY: €1,640.7 million).
Non-current operating assets were up €628.6 million year-on-year at €5,705.0 million (PY: €5,076.4 million). Goodwill increased by €8.3 million to €2,709.7 million (PY: €2,701.4 million) as a result of exchange-rate effects. At €1,782.1 million, property, plant and equipment was €263.1 million above the previous year’s level of €1,519.0 million. Other intangible assets climbed by €11.4 million to €696.2 million (PY: €684.8 million). Amortization of intangible assets from purchase price allocation (PPA) in the amount of €51.1 million (PY: €46.1 million) reduced the value of intangible assets.
Overall, an asset deal resulted in a €3.9 million increase in operating assets in the Interior division.

Continental AG 2018 Annual Report Management Report Economic Report 81
The disposal of a company resulted in an overall decline in operating assets of €17.6 million in the Interior division.
While exchange-rate effects reduced the Interior division’s total op-erating assets by €131.8 million in the previous year, they increased them by €13.0 million in the year under review.
Average operating assets in the Interior division climbed by €597.4 million to €5,626.3 million as compared to fiscal 2017 (€5,028.9 million).
Capital expenditure (additions) Additions to the Interior division rose by €125.1 million year-on-year to €578.4 million (PY: €453.3 million). Capital expenditure amounted to 6.0% (PY: 4.9%) of sales.
In addition to the expansion of production capacity at the German locations, investments were also made in China, Romania, Czechia, Mexico and the U.S.A. Investments focused primarily on the expan-sion of manufacturing capacity for the Instrumentation & Driver HMI and Body & Security business units. In the Instrumentation & Driver HMI business unit, manufacturing capacity for operation and display solutions was expanded.
Employees The number of employees in the Interior division rose by 1,900 to 47,906 (PY: 46,006). The rise in staff numbers was due to the con-tinuing expansion in research and development and the adjustment in line with greater volumes.

82 Continental AG 2018 Annual Report Management Report Economic Report
Rubber Group in € millions 2018 2017 in %
Sales 17,603.1 17,494.7 0.6
EBITDA 3,196.6 3,499.6 –8.7
in % of sales 18.2 20.0
EBIT 2,278.3 2,593.5 –12.2
in % of sales 12.9 14.8
Research and development expenses (net) 448.5 428.2 4.7
in % of sales 2.5 2.4
Depreciation and amortization1 918.3 906.1 1.3
thereof impairment2 1.5 2.9
Operating assets as at December 31 9,556.2 9,073.6 5.3
Operating assets (average) 9,618.1 9,325.1 3.1
ROCE 23.7 27.8
Capital expenditure3 1,087.3 1,060.2 2.6
in % of sales 6.2 6.1
Number of employees as at December 314 102,763 100,749 2.0
Adjusted sales5 17,463.0 17,482.7 –0.1
Adjusted operating result (adjusted EBIT)6 2,372.8 2,686.6 –11.7
in % of adjusted sales 13.6 15.4
1 Excluding impairment on financial investments. 2 Impairment also includes necessary reversal of impairment losses. 3 Capital expenditure on property, plant and equipment, and software. 4 Excluding trainees. 5 Before changes in the scope of consolidation. 6 Before amortization of intangible assets from purchase price allocation (PPA), changes in the scope of consolidation, and special effects.
The Rubber Group comprises two divisions:
› The Tire division (26% of consolidated sales) is known for maximi-zing safety through short braking distances and excellent grip as well as reducing fuel consumption by minimizing rolling resistance.
› The ContiTech division (14% of consolidated sales) develops, manufactures and markets functional parts, intelligent compo-nents and systems made of rubber, plastic, metal and fabric for machine and plant engineering, mining, agriculture, the automo-tive industry and other important sectors of the future.
In the year under review, the 13 business units in total generated 40% of consolidated sales.
Around the middle of 2018, the Rubber Group faced significantly higher prices for crude oil and for butadiene, an input material for synthetic rubber. Shortages of chemicals and high import duties on steel in the U.S.A. led to additional price increases. By contrast, the market for natural rubber eased in comparison to the previous year.
Rubber Group

Continental AG 2018 Annual Report Management Report Economic Report 83
Development of the Tire Division
› Sales up 0.2%
› Sales up 3.1% before changes in the scope of consolidation and exchange-rate effects
› Adjusted EBIT down 11.5%
Sales volumes Sales figures for passenger and light truck tires in 2018 were slightly below the previous year’s level in original equipment busi-ness and slightly above the previous year’s figure by 1% in the tire replacement business. Sales figures in commercial-vehicle tire busi-ness were 5% higher than the level of the previous year. The Tire division therefore sold 155 million tires again in 2018.
Sales up 0.2% Sales up 3.1% before changes in the scope of consolidation and exchange-rate effects Sales in the Tire division rose by 0.2% year-on-year to €11,352.2 million (PY: €11,325.8 million) in 2018. Before changes in the scope of consolidation and exchange-rate effects, sales rose by 3.1%.
Adjusted EBIT down 11.5% The Tire division’s adjusted EBIT fell by €246.8 million or 11.5% year-on-year in 2018 to €1,900.0 million (PY: €2,146.8 million), equivalent to 16.8% (PY: 19.0%) of adjusted sales.
EBIT down 12.5% In comparison to the previous year, the Tire division posted a decline in EBIT of €269.2 million, or 12.5%, to €1,882.1 million (PY: €2,151.3 million) in 2018. The return on sales fell to 16.6% (PY: 19.0%).
The amortization of intangible assets from purchase price allocation (PPA) reduced EBIT by €19.3 million (PY: €19.5 million).
ROCE amounted to 29.1% (PY: 35.0%).
Special effects in 2018 Special effects in 2018 had a negative impact totaling €1.2 million in the Tire division; this resulted from impairment on property, plant and equipment.
Special effects in 2017 In the Tire division, the disposal of equity interests held as financial assets resulted in income totaling €14.0 million.
In addition, a first-time consolidation resulted in a gain of €0.5 million.
Moreover, the reversal of restructuring provisions no longer required resulted in income of €10.0 million.
Impairment on property, plant and equipment resulted in expense totaling €0.5 million.
Special effects in 2017 had a positive impact totaling €24.0 million in the Tire division.
Procurement Prices for key raw materials rose steadily from the end of the first quarter onward. In particular, the prices of input materials such as butadiene and crude oil were very volatile because of both increased demand and speculation. At the end of the third quarter, the oil price reached its highest level in the past few years. The increase in the oil price also caused prices for other oil-based input materials such as carbon black to rise. In the fourth quarter of 2018, prices for oil and butadiene were quoted much lower again. Prices for steel and some textiles were up significantly at the end of the year due to increased import duties in the U.S.A. By contrast, the natural rub-ber price recorded a downward trend throughout the year. On aver-age, the price level in 2018 as a whole was roughly the same as in the previous year. However, exchange-rate effects and the time lag between procurement, delivery and deployment resulted in minor costs for the Tire division compared to the previous year.
Research and development Expenses for research and development (net) rose by €9.6 million or 3.3% year-on-year to €299.4 million (PY: €289.8 million), corre-sponding to 2.6% of sales as in the previous year.
Depreciation and amortization Depreciation and amortization rose by €15.7 million compared to fiscal 2017 to €613.1 million (PY: €597.4 million) and amounted to 5.4% (PY: 5.3%) of sales. This included an impairment loss totaling €1.2 million in 2018 (PY: €0.5 million).
Sales € millions
10,717.411,325.8 11,352.2
2016 2017 2018

84 Continental AG 2018 Annual Report Management Report Economic Report
Tires in € millions 2018 2017 in %
Sales 11,352.2 11,325.8 0.2
EBITDA 2,495.2 2,748.7 –9.2
in % of sales 22.0 24.3
EBIT 1,882.1 2,151.3 –12.5
in % of sales 16.6 19.0
Research and development expenses (net) 299.4 289.8 3.3
in % of sales 2.6 2.6
Depreciation and amortization1 613.1 597.4 2.6
thereof impairment2 1.2 0.5
Operating assets as at December 31 6,435.3 5,995.7 7.3
Operating assets (average) 6,471.2 6,143.0 5.3
ROCE 29.1 35.0
Capital expenditure3 837.1 847.0 –1.2
in % of sales 7.4 7.5
Number of employees as at December 314 55,840 53,811 3.8
Adjusted sales5 11,304.9 11,325.8 –0.2
Adjusted operating result (adjusted EBIT)6 1,900.0 2,146.8 –11.5
in % of adjusted sales 16.8 19.0
1 Excluding impairment on financial investments. 2 Impairment also includes necessary reversal of impairment losses. 3 Capital expenditure on property, plant and equipment, and software. 4 Excluding trainees. 5 Before changes in the scope of consolidation. 6 Before amortization of intangible assets from purchase price allocation (PPA), changes in the scope of consolidation, and special effects.
Operating assets Operating assets in the Tire division increased by €439.6 million year-on-year to €6,435.3 million (PY: €5,995.7 million) as at De-cember 31, 2018.
Working capital was down €33.6 million at €2,440.6 million (PY: €2,474.2 million). This development was due primarily to the €190.1 million increase in operating liabilities to €1,487.3 million (PY: €1,297.2 million), which was in contrast to a €36.8 million rise in inventories to €1,645.0 million (PY: €1,608.2 million) and a €119.7 million increase in operating receivables to €2,282.9 million (PY: €2,163.2 million).
Non-current operating assets were up €505.7 million year-on-year at €4,998.5 million (PY: €4,492.8 million). Goodwill increased by €187.0 million to €392.2 million (PY: €205.2 million). This increase resulted from the acquisition of Tyre and Auto Pty Ltd, Melbourne, Australia, in the amount of €180.5 million, from a share deal of €6.2 million and from exchange-rate effects of €0.3 million. Prop-erty, plant and equipment increased by €263.7 million to €4,287.1 million (PY: €4,023.4 million). Other intangible assets climbed by €16.6 million to €145.9 million (PY: €129.3 million). This increase was attributable to the acquisition of Tyre and Auto Pty Ltd, Mel-bourne, Australia, with a share of €45.0 million and two assets deals with a share totaling €2.1 million. This was countered by amortization of intangible assets from purchase price allocation (PPA) in the amount of €19.3 million (PY: €19.5 million).
Overall, the acquisition of Tyre and Auto Pty Ltd, Melbourne, Aus-tralia, contributed €226.6 million to the increase in operating as-sets in the Tire division, while €8.3 million came from a share deal, a total of €3.2 million from two asset deals and €0.4 million from the reversal of a purchase price liability.
Exchange-rate effects reduced the Tire division’s total operating assets by €14.8 million in the fiscal year (PY: €353.7 million).
Average operating assets in the Tire division increased by €328.2 million to €6,471.2 million compared with fiscal 2017 (€6,143.0 million).
Capital expenditure (additions) Additions to the Tire division decreased by €9.9 million year-on-year to €837.1 million (PY: €847.0 million). Capital expenditure amounted to 7.4% (PY: 7.5%) of sales.
In the Tire division, production capacity was expanded in Europe, North America and Asia. There were major additions relating to the new plant buildings in Rayong, Thailand, and Clinton, Mississippi, U.S.A. Production capacity was also increased at existing plants in Hefei, China; Sumter, South Carolina, U.S.A.; and Lousado, Portugal. Quality assurance and cost-cutting measures were implemented as well.

Continental AG 2018 Annual Report Management Report Economic Report 85
Employees The number of employees in the Tire division increased by 2,029 to 55,840 (PY: 53,811). At the production companies, the adjust-ment to demand-driven production at the plants in Lousado, Portu-gal; Otrokovice, Czechia; Púchov, Slovakia; Rayong, Thailand; Sum-ter, South Carolina, U.S.A.; and Mount Vernon, Illinois, U.S.A., led to
an increase in staff numbers. In addition, the increase in the number of employees at distribution and retail companies was attributable in particular to the acquisition of Tyre and Auto Pty Ltd, Melbourne, Australia, and the expansion of research and development activities worldwide.
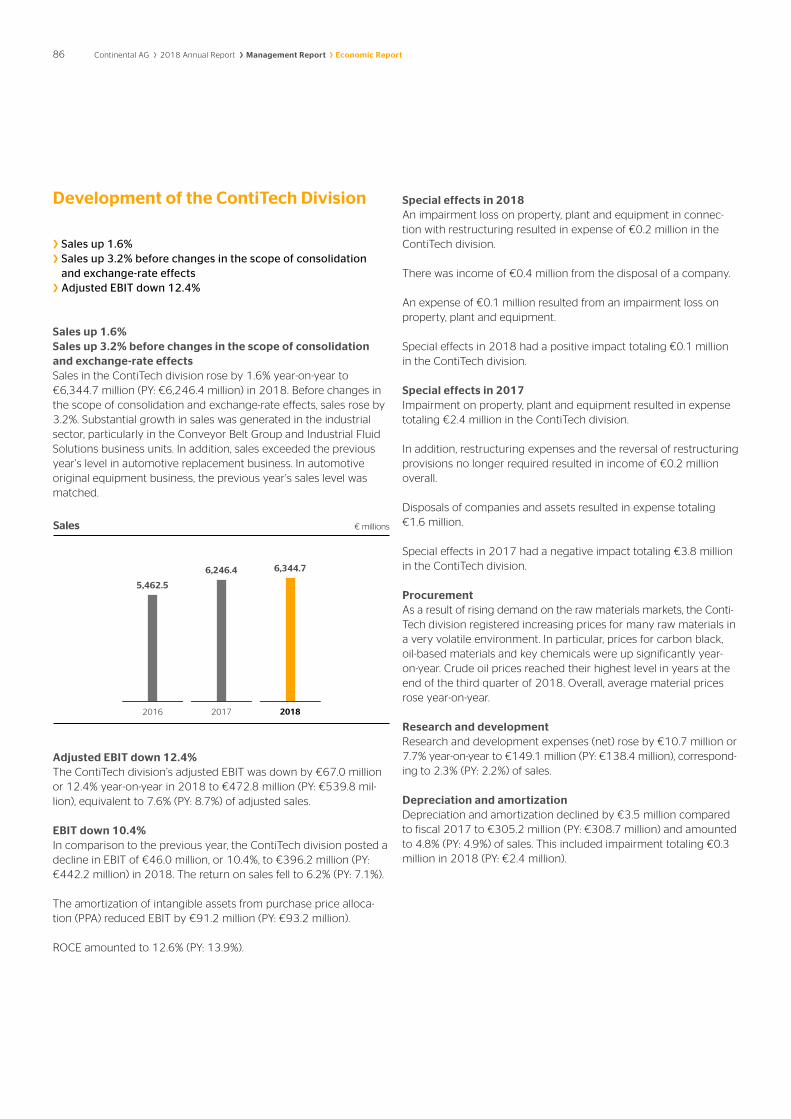
86 Continental AG 2018 Annual Report Management Report Economic Report
Development of the ContiTech Division
› Sales up 1.6%
› Sales up 3.2% before changes in the scope of consolidation and exchange-rate effects
› Adjusted EBIT down 12.4%
Sales up 1.6% Sales up 3.2% before changes in the scope of consolidation and exchange-rate effects Sales in the ContiTech division rose by 1.6% year-on-year to €6,344.7 million (PY: €6,246.4 million) in 2018. Before changes in the scope of consolidation and exchange-rate effects, sales rose by 3.2%. Substantial growth in sales was generated in the industrial sector, particularly in the Conveyor Belt Group and Industrial Fluid Solutions business units. In addition, sales exceeded the previous year’s level in automotive replacement business. In automotive original equipment business, the previous year’s sales level was matched.
Adjusted EBIT down 12.4% The ContiTech division’s adjusted EBIT was down by €67.0 million or 12.4% year-on-year in 2018 to €472.8 million (PY: €539.8 mil-lion), equivalent to 7.6% (PY: 8.7%) of adjusted sales.
EBIT down 10.4% In comparison to the previous year, the ContiTech division posted a decline in EBIT of €46.0 million, or 10.4%, to €396.2 million (PY: €442.2 million) in 2018. The return on sales fell to 6.2% (PY: 7.1%).
The amortization of intangible assets from purchase price alloca-tion (PPA) reduced EBIT by €91.2 million (PY: €93.2 million).
ROCE amounted to 12.6% (PY: 13.9%).
Special effects in 2018 An impairment loss on property, plant and equipment in connec-tion with restructuring resulted in expense of €0.2 million in the ContiTech division.
There was income of €0.4 million from the disposal of a company.
An expense of €0.1 million resulted from an impairment loss on property, plant and equipment.
Special effects in 2018 had a positive impact totaling €0.1 million in the ContiTech division.
Special effects in 2017 Impairment on property, plant and equipment resulted in expense totaling €2.4 million in the ContiTech division.
In addition, restructuring expenses and the reversal of restructuring provisions no longer required resulted in income of €0.2 million overall.
Disposals of companies and assets resulted in expense totaling €1.6 million.
Special effects in 2017 had a negative impact totaling €3.8 million in the ContiTech division.
Procurement As a result of rising demand on the raw materials markets, the Conti-Tech division registered increasing prices for many raw materials in a very volatile environment. In particular, prices for carbon black, oil-based materials and key chemicals were up significantly year-on-year. Crude oil prices reached their highest level in years at the end of the third quarter of 2018. Overall, average material prices rose year-on-year.
Research and development Research and development expenses (net) rose by €10.7 million or 7.7% year-on-year to €149.1 million (PY: €138.4 million), correspond-ing to 2.3% (PY: 2.2%) of sales.
Depreciation and amortization Depreciation and amortization declined by €3.5 million compared to fiscal 2017 to €305.2 million (PY: €308.7 million) and amounted to 4.8% (PY: 4.9%) of sales. This included impairment totaling €0.3 million in 2018 (PY: €2.4 million).
5,462.5
6,246.4 6,344.7
Sales € millions
2016 2017 2018
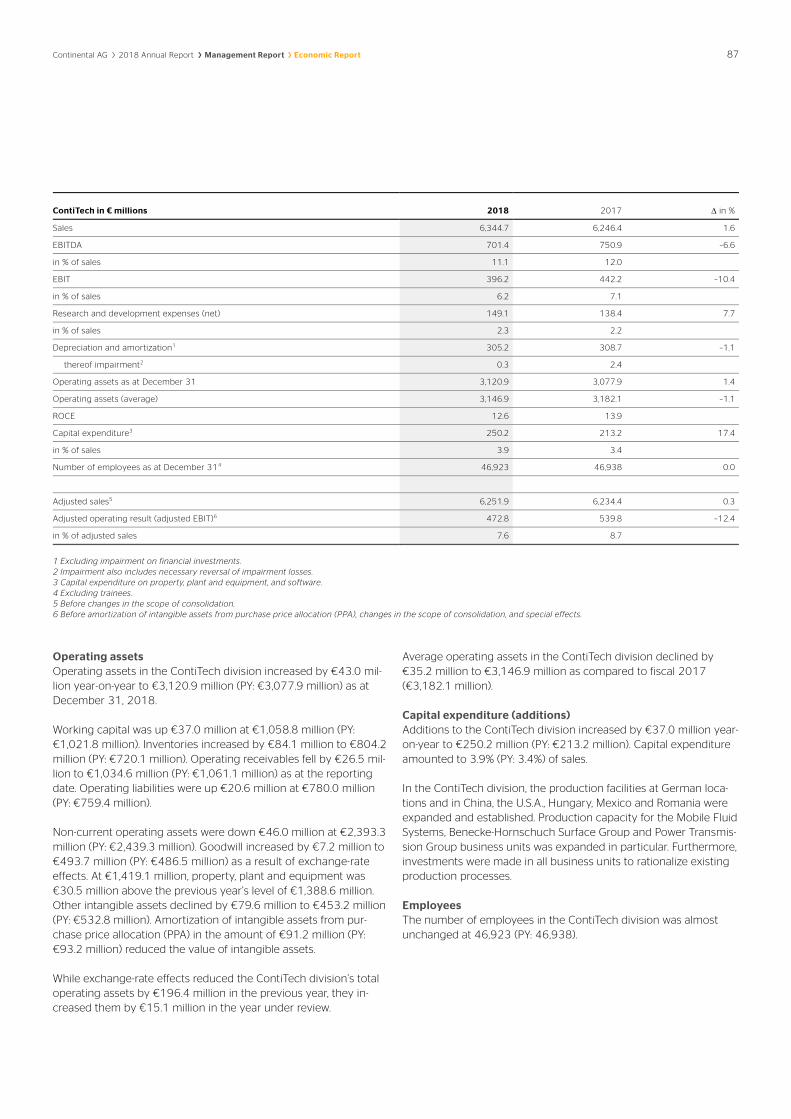
Continental AG 2018 Annual Report Management Report Economic Report 87
ContiTech in € millions 2018 2017 in %
Sales 6,344.7 6,246.4 1.6
EBITDA 701.4 750.9 –6.6
in % of sales 11.1 12.0
EBIT 396.2 442.2 –10.4
in % of sales 6.2 7.1
Research and development expenses (net) 149.1 138.4 7.7
in % of sales 2.3 2.2
Depreciation and amortization1 305.2 308.7 –1.1
thereof impairment2 0.3 2.4
Operating assets as at December 31 3,120.9 3,077.9 1.4
Operating assets (average) 3,146.9 3,182.1 –1.1
ROCE 12.6 13.9
Capital expenditure3 250.2 213.2 17.4
in % of sales 3.9 3.4
Number of employees as at December 314 46,923 46,938 0.0
Adjusted sales5 6,251.9 6,234.4 0.3
Adjusted operating result (adjusted EBIT)6 472.8 539.8 –12.4
in % of adjusted sales 7.6 8.7
1 Excluding impairment on financial investments. 2 Impairment also includes necessary reversal of impairment losses. 3 Capital expenditure on property, plant and equipment, and software. 4 Excluding trainees. 5 Before changes in the scope of consolidation. 6 Before amortization of intangible assets from purchase price allocation (PPA), changes in the scope of consolidation, and special effects.
Operating assets Operating assets in the ContiTech division increased by €43.0 mil-lion year-on-year to €3,120.9 million (PY: €3,077.9 million) as at December 31, 2018.
Working capital was up €37.0 million at €1,058.8 million (PY: €1,021.8 million). Inventories increased by €84.1 million to €804.2 million (PY: €720.1 million). Operating receivables fell by €26.5 mil-lion to €1,034.6 million (PY: €1,061.1 million) as at the reporting date. Operating liabilities were up €20.6 million at €780.0 million (PY: €759.4 million).
Non-current operating assets were down €46.0 million at €2,393.3 million (PY: €2,439.3 million). Goodwill increased by €7.2 million to €493.7 million (PY: €486.5 million) as a result of exchange-rate effects. At €1,419.1 million, property, plant and equipment was €30.5 million above the previous year’s level of €1,388.6 million. Other intangible assets declined by €79.6 million to €453.2 million (PY: €532.8 million). Amortization of intangible assets from pur-chase price allocation (PPA) in the amount of €91.2 million (PY: €93.2 million) reduced the value of intangible assets.
While exchange-rate effects reduced the ContiTech division’s total operating assets by €196.4 million in the previous year, they in-creased them by €15.1 million in the year under review.
Average operating assets in the ContiTech division declined by €35.2 million to €3,146.9 million as compared to fiscal 2017 (€3,182.1 million).
Capital expenditure (additions) Additions to the ContiTech division increased by €37.0 million year-on-year to €250.2 million (PY: €213.2 million). Capital expenditure amounted to 3.9% (PY: 3.4%) of sales.
In the ContiTech division, the production facilities at German loca-tions and in China, the U.S.A., Hungary, Mexico and Romania were expanded and established. Production capacity for the Mobile Fluid Systems, Benecke-Hornschuch Surface Group and Power Transmis-sion Group business units was expanded in particular. Furthermore, investments were made in all business units to rationalize existing production processes.
Employees The number of employees in the ContiTech division was almost unchanged at 46,923 (PY: 46,938).
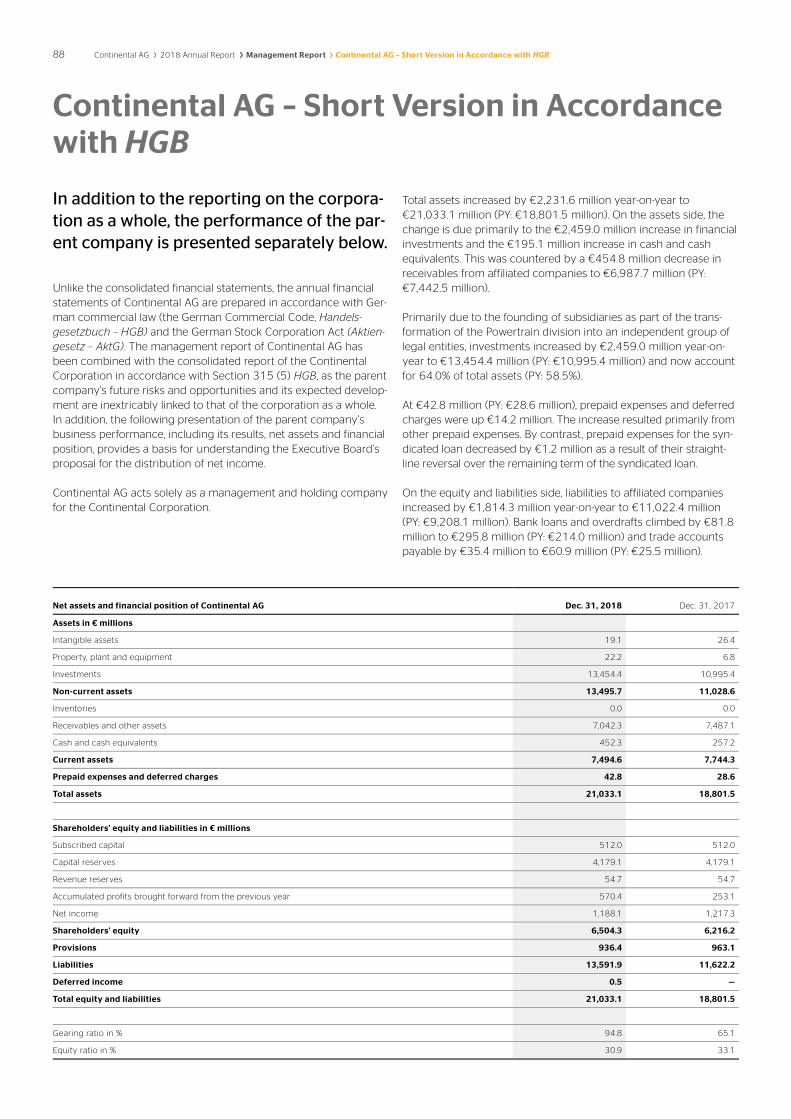
88 Continental AG 2018 Annual Report Management Report Continental AG – Short Version in Accordance with HGB
In addition to the reporting on the corpora-tion as a whole, the performance of the par-ent company is presented separately below.
Unlike the consolidated financial statements, the annual financial statements of Continental AG are prepared in accordance with Ger-man commercial law (the German Commercial Code, Handels- gesetzbuch – HGB) and the German Stock Corporation Act (Aktien-gesetz – AktG). The management report of Continental AG has been combined with the consolidated report of the Continental Corporation in accordance with Section 315 (5) HGB, as the parent company’s future risks and opportunities and its expected develop-ment are inextricably linked to that of the corporation as a whole. In addition, the following presentation of the parent company’s business performance, including its results, net assets and financial position, provides a basis for understanding the Executive Board’s proposal for the distribution of net income.
Continental AG acts solely as a management and holding company for the Continental Corporation.
Total assets increased by €2,231.6 million year-on-year to €21,033.1 million (PY: €18,801.5 million). On the assets side, the change is due primarily to the €2,459.0 million increase in financial investments and the €195.1 million increase in cash and cash equivalents. This was countered by a €454.8 million decrease in receivables from affiliated companies to €6,987.7 million (PY: €7,442.5 million).
Primarily due to the founding of subsidiaries as part of the trans- formation of the Powertrain division into an independent group of legal entities, investments increased by €2,459.0 million year-on-year to €13,454.4 million (PY: €10,995.4 million) and now account for 64.0% of total assets (PY: 58.5%).
At €42.8 million (PY: €28.6 million), prepaid expenses and deferred charges were up €14.2 million. The increase resulted primarily from other prepaid expenses. By contrast, prepaid expenses for the syn-dicated loan decreased by €1.2 million as a result of their straight-line reversal over the remaining term of the syndicated loan.
On the equity and liabilities side, liabilities to affiliated companies increased by €1,814.3 million year-on-year to €11,022.4 million (PY: €9,208.1 million). Bank loans and overdrafts climbed by €81.8 million to €295.8 million (PY: €214.0 million) and trade accounts payable by €35.4 million to €60.9 million (PY: €25.5 million).
Net assets and financial position of Continental AG Dec. 31, 2018 Dec. 31, 2017
Assets in € millions
Intangible assets 19.1 26.4
Property, plant and equipment 22.2 6.8
Investments 13,454.4 10,995.4
Non-current assets 13,495.7 11,028.6
Inventories 0.0 0.0
Receivables and other assets 7,042.3 7,487.1
Cash and cash equivalents 452.3 257.2
Current assets 7,494.6 7,744.3
Prepaid expenses and deferred charges 42.8 28.6
Total assets 21,033.1 18,801.5
Shareholders' equity and liabilities in € millions
Subscribed capital 512.0 512.0
Capital reserves 4,179.1 4,179.1
Revenue reserves 54.7 54.7
Accumulated profits brought forward from the previous year 570.4 253.1
Net income 1,188.1 1,217.3
Shareholders' equity 6,504.3 6,216.2
Provisions 936.4 963.1
Liabilities 13,591.9 11,622.2
Deferred income 0.5 —
Total equity and liabilities 21,033.1 18,801.5
Gearing ratio in % 94.8 65.1
Equity ratio in % 30.9 33.1
Continental AG – Short Version in Accordance with HGB

Continental AG 2018 Annual Report Management Report Continental AG – Short Version in Accordance with HGB 89
Bonds increased by €39.7 million year-on-year to €2,207.9 million (PY: €2,168.2 million). This increase is due primarily to issuances of short-term commercial papers with a total nominal value of €800.0 million. By contrast, the repayment of the 3.0% euro bond with a nominal value of €750.0 million that matured on July 16, 2018, resulted in a decrease in the bonds’ carrying amount.
Provisions decreased by €26.7 million to €936.4 million (PY: €963.1 million) due to the decline in tax provisions of €72.6 million to €624.4 million (PY: €697.0 million). This was countered by a €35.3 million increase in pension provisions to €210.6 million (PY: €175.3 million). Other provisions likewise rose by €10.6 million to €101.4 million in the year under review.
Equity increased from €6,216.2 million in the previous year to €6,504.3 million. The decrease as a result of the dividend payment for 2017 in the amount of €900.0 million was offset by the net in-come of €1,188.1 million generated in fiscal 2018. The equity ratio fell from 33.1% to 30.9% as a result of the increased total assets.
Sales increased by €22.7 million to €260.4 million (PY: €237.7 mil-lion), primarily due to the increase in sales from corporate services.
Net investment income decreased by €274.4 million year-on-year to €1,462.7 million (PY: €1,737.1 million). As in the previous year, it mainly consisted of profit and loss transfers from the subsidiaries. The income from profit transfers resulted particularly from Conti-nental Caoutchouc-Export-GmbH, Hanover, in the amount of €644.9 million; Continental Automotive GmbH, Hanover, in the amount of €471.3 million; UMG Beteiligungsgesellschaft mbH, Hanover, in the amount of €188.9 million; and Formpolster GmbH, Hanover, in the amount of €131.0 million.
The negative net interest result improved by €20.1 million year-on-year to €65.5 million in fiscal 2018 (PY: €85.6 million). Interest ex-penses fell by €10.2 million to €108.1 million (PY: €118.3 million), chiefly due to the repayment of the euro bond with a nominal value of €750.0 million and an interest rate of 3.0% p.a. on July 16, 2018.
Interest income climbed by €9.9 million year-on-year to €42.6 million (PY: €32.7 million). This increase was attributable to interest and similar income from other companies in the amount of €20.4 million. By contrast, interest and similar income from affiliated companies declined by €10.5 million.
The tax income of €0.2 million (PY: tax expense of €265.6 million) resulted primarily from tax refunds and the reversal of provisions for previous years, which was due in particular to the resolution of a legal dispute in the fiscal year. Current expenses in Germany and non-imputable foreign withholding tax offset this income by nearly the same amount.
After taking income tax expense into account, Continental AG posted net income for the year of €1,188.1 million (PY: €1,217.3 million). The after-tax return on equity was 18.3% (PY: 19.6%).
Taking into account the accumulated profits brought forward from the previous year of €570.4 million, retained earnings amount-ed to €1,758.5 million. The Supervisory Board and the Executive Board will propose to the Annual Shareholders’ Meeting the distri-bution of a dividend of €4.75 per share. With 200,005,983 shares entitled to dividends, the total distribution will thus amount to €950,028,419.25. The remaining amount is to be carried forward to new account.
We expect stable income from profit and loss transfers and invest-ment income from the subsidiaries in fiscal 2019.
Earnings position of Continental AG in € millions 2018 2017
Sales 260.4 237.7
Cost of sales –252.9 –230.9
Gross margin on sales 7.5 6.8
General administrative expenses –193.7 –182.3
Other operating income 25.5 35.8
Other operating expenses –59.4 –39.2
Net investment income 1,462.7 1,737.1
Income from other securities and long-term loans 11.6 10.3
Amortization of investments and of securities under current assets –0.8 —
Net interest result –65.5 –85.6
Result from activities 1,187.9 1,482.9
Income tax expense 0.2 –265.6
Net income 1,188.1 1,217.3
Accumulated profits brought forward from the previous year 570.4 253.1
Retained earnings 1,758.5 1,470.4

90 Continental AG 2018 Annual Report Management Report Other Information
Final declaration from the Executive Board’s report on relations with affiliated companies pursuant to Section 312 of the German Stock Corporation Act (Aktiengesetz – AktG) In fiscal 2018, Continental AG was a dependent company of INA-Holding Schaeffler GmbH & Co. KG, Herzogenaurach, Germany, as defined under Section 312 AktG. In line with Section 312 (1) AktG, the Executive Board of Continental AG has prepared a report on re-lations with affiliated companies, which contains the following final declaration:
“We declare that the company received an appropriate considera-tion for each transaction and measure listed in the report on rela-tions with affiliated companies from January 1 to December 31, 2018, under the circumstances known to us at the time the trans-actions were made or the measures taken or not taken. To the ex-tent the company suffered any detriment thereby, the company was granted the right to an appropriate compensation before the end of the 2018 fiscal year. The company did not suffer any detri-ment because of taking or refraining from measures.”
Additional Disclosures and Notes Pursuant to Section 289a and Section 315a HGB 1. Composition of subscribed capital As of the end of the reporting period, the subscribed capital of the company amounted to €512,015,316.48 and is divided into 200,005,983 no-par-value shares. These shares are, without excep-tion, common shares; different classes of shares have not been issued and have not been provided for in the Articles of Incorpora-tion. Each share bears voting and dividend rights from the time it is issued. Each share entitles the holder to one vote at a Shareholders’ Meeting (Article 20 (1) of the Articles of Incorporation). There are no shares with privileges.
2. Shareholdings exceeding 10% of voting rights For details of the equity interests exceeding 10% of the voting rights (reported level of equity interest), please refer to the notice in accordance with the German Securities Trading Act (Wertpapier-handelsgesetz – WpHG) under Note 37 to the consolidated financial statements.
3. Bearers of shares with privileges There are no shares with privileges granting control.
4. Type of voting right control for employee shareholdings The company is not aware of any employees with shareholdings not directly exercising control of their voting rights.
5. Provisions for the appointment and dismissal of members of the Executive Board and for the amendment of the Articles of Incorporation a) In accordance with the Articles of Incorporation, the Executive
Board consists of at least two members; beyond this the num-ber of members of the Executive Board is determined by the Supervisory Board. Members of the Executive Board are ap-pointed and dismissed in accordance with Section 84 of the German Stock Corporation Act (Aktiengesetz – AktG) in con-junction with Section 31 of the German Co-determination Act
(Mitbestimmungsgesetz – MitbestG). In line with this, the Supervisory Board is responsible for the appointment and dis-missal of members of the Executive Board. It passes decisions with a majority of two-thirds of its members. If this majority is not reached in the event of an appointment, the so-called Mediation Committee must submit a nomination to the Super-visory Board for the appointment within one month of voting. Other nominations can also be submitted to the Supervisory Board in addition to the Mediation Committee’s nomination. A simple majority of the votes is sufficient when voting on these nominations submitted to the Supervisory Board. In the event that voting results in a tie, a new vote takes place in which the Chairman of the Supervisory Board has the casting vote in ac-cordance with Section 31 (4) MitbestG.
b) Amendments to the Articles of Incorporation are made by the Shareholders’ Meeting. In Article 20 (3) of the Articles of Incorporation, the Shareholders’ Meeting has exercised the option granted in Section 179 (1) Sentence 2 AktG to confer on the Supervisory Board the power to make amendments affecting only the wording of the Articles of Incorporation.
In accordance with Article 20 (2) of the Articles of Incorpora-tion, resolutions of the Shareholders’ Meeting to amend the Articles of Incorporation are usually adopted by a simple ma-jority and, insofar as a capital majority is required, by a simple majority of the capital represented unless otherwise stipulated by mandatory law or particular provisions of the Articles of Incorporation. The law prescribes a mandatory majority of three-quarters of the share capital represented when resolu-tions are made, for example, for amendments to the Articles of Incorporation involving substantial capital measures, such as resolutions concerning the creation of authorized or con-tingent capital.
Other Information Dependent Company Report

Continental AG 2018 Annual Report Management Report Other Information 91
6. Authorizations of the Executive Board, particularly with regard to its options for issuing or withdrawing shares a) The Executive Board can issue new shares only on the basis
of resolutions by the Shareholders’ Meeting. As at the end of the reporting period, the Executive Board has not been au-thorized to issue new shares in connection with a capital in-crease (authorized capital) or to issue convertible bonds, warrant-linked bonds, or other financial instruments that could entitle the bearers to subscribe to new shares.
b) The Executive Board may only buy back shares under the conditions codified in Section 71 AktG. The Shareholders’ Meeting has not authorized the Executive Board to acquire treasury shares in line with Section 71 (1) No. 8 AktG.
7. Material agreements of the company subject to a change of control following a takeover bid and their consequences
The following material agreements are subject to a change of con-trol at Continental AG:
a) As at the reporting date, the agreement concluded on April 24, 2014, for a syndicated loan originally amounting to €4.5 bil-lion consists only of a revolving tranche of €3.0 billion. This agreement grants each creditor the right to terminate the agreement prematurely and to demand repayment of the loans granted by it if one person or several persons acting in concert acquire control of Continental AG and subsequent negotiations concerning a continuation of the loan do not lead to an agreement. The term “control” is defined as the holding of more than 50% of the voting rights or if Continen-tal AG concludes a domination agreement as defined under Section 291 AktG with Continental AG as the company dom-inated.
b) The bonds issued by Continental AG in 2013 at a nominal amount of €750 million, the bond issued by another subsidi-ary of Continental AG, Continental Rubber of America, Corp., Wilmington, Delaware, U.S.A., in November 2015 at a nominal amount totaling €500 million, and the bond of €600 million issued by Continental AG in November 2016 entitle each bondholder to demand that the respective issuer redeem or acquire the bonds held by the bondholder at a price estab-lished in the bond conditions in the event of a change of control at Continental AG. The bond conditions define a change of control as the sale of all or substantially all of the company’s assets to third parties that are not affiliated with the company, or as one person or several persons acting in concert, pursuant to Section 2 (5) of the German Takeover Act (Wertpapiererwerbs- und Übernahmegesetz – WpÜG), holding more than 50% of the voting rights in Continental AG by means of acquisition or as a result of a merger or
other form of combination with the participation of Conti-nental AG. The holding of voting rights by Schaeffler GmbH (operating as IHO Verwaltungs GmbH following legal re-structuring within the corporation in 2015), its legal succes-sors, or its affiliated companies does not constitute a change of control within the meaning of the bond conditions.
If a change of control occurs as described in the agreements above and a contractual partner or bondholder exercises its respective rights, it is possible that required follow-up financ-ing may not be approved under the existing conditions, which could therefore lead to higher financing costs.
c) In 1996, Compagnie Financière Michelin SCmA, Granges-Paccot, Switzerland, and Continental AG founded MC Projects B.V., Maastricht, Netherlands, with each owning 50%. Mich-elin contributed the rights to the Uniroyal brand for Europe to the company. MC Projects B.V. licenses these rights to Continental. According to the agreements, this license can be terminated without notice if a major competitor in the tire business acquires more than 50% of the voting rights of Continental. In this case Michelin also has the right to ac-quire a majority in MC Projects B.V. and to have MC Projects B.V. increase its minority stake in the manufacturing com-pany of Continental Barum s.r.o. in Otrokovice, Czechia, to 51%. In the case of such a change of control and the exer-cise of these rights, there could be losses in sales of the Tire division and a reduction in the production capacity available to it.
8. Compensation agreements of the company with members of the Executive Board or employees in the event of a take-over bid
No compensation agreements have been concluded between the company and the members of the Executive Board or employees providing in the event of a takeover bid.
Remuneration of the Executive Board
The total remuneration of the members of the Executive Board comprises a number of remuneration components. Specifically, these components comprise fixed remuneration, variable remuner-ation elements including components with a long-term incentive effect, additional benefits and retirement benefits. Further details in-cluding individual remuneration are specified in the Remuneration Report contained in the Corporate Governance Report starting on page 22. The Remuneration Report is a part of the Management Report.

92 Continental AG 2018 Annual Report Management Report Other Information
The Corporate Governance Declaration pursuant to Section 289f of the German Commercial Code (Handelsgesetzbuch – HGB) is available to our shareholders online in the Company/Corporate Governance section.
Corporate Governance Declaration Pursuant to Section 289f HGB

Continental AG 2018 Annual Report Management Report Report on Risks and Opportunities 93
Continental’s overall situation is analyzed and managed corporation-wide using the risk and opportunity management system.
The management of the Continental Corporation is geared toward creating added value. For us, this means sustainably increasing the value of each individual business unit and the corporation as a whole. We evaluate risks and opportunities responsibly and on an ongoing basis in order to achieve our goal of adding value.
We define risk as the possibility of internal or external events occur-ring that can have a negative influence on the attainment of our strategic and operational targets. As a global corporation, Continen-tal is exposed to a number of different risks that could impair busi-ness and, in extreme cases, endanger the company’s existence. We accept manageable risks if the resulting opportunities lead us to ex-pect to achieve sustainable growth in value. We consider growth in value in terms of the Continental Value Contribution (CVC) system described in the Corporate Management section.
Risk and Opportunity Management and Internal Control System In order to operate successfully as a company in a complex business sector and to ensure the effectiveness, efficiency and propriety of accounting and compliance with the relevant legal and sub-legisla-tive regulations, Continental has created a governance system that encompasses all relevant business processes. The governance sys-tem comprises the internal control system, the risk management system and the compliance management system, which is described in detail in the Corporate Governance Declaration on page 21. The risk management system in turn also includes the early risk identifi-cation system in accordance with Section 91 (2) of the German Stock Corporation Act (Aktiengesetz – AktG).
The Executive Board is responsible for the governance system, which includes all subsidiaries. The Supervisory Board and the Audit Committee monitor its effectiveness.
Pursuant to Sections 289 (4) and 315 (4) of the German Commer-cial Code (Handelsgesetzbuch – HGB), the main characteristics of the internal control and risk management system with respect to the accounting process must be described. All parts of the risk management system and internal control system that could have a material effect on the annual and consolidated financial statements must be included in the reporting.
Key elements of the corporation-wide control systems are the clear allocation of responsibilities and controls inherent in the system when preparing the financial statements. The two-person rule and separation of functions are fundamental principles of this organiza-tion. In addition, Continental’s management ensures accounting that complies with the requirements of law via guidelines on the preparation of financial statements and on accounting, access au-thorizations for IT systems and regulations on the involvement of internal and external specialists.
The effectiveness of the financial reporting internal control system (Financial Reporting ICS) is evaluated in major areas by testing the effectiveness of the reporting units on a quarterly basis. If any weaknesses are identified, the corporation’s management initiates the necessary measures.
As part of our opportunity management activities, we assess mar-ket and economic analyses and changes in legal requirements (e.g. with regard to fuel consumption and emission standards, safety regulations). In addition, we deal with the corresponding effects on the automotive sector and other relevant markets, our production factors and the composition and further development of our prod-uct portfolio.
Governance, risk and compliance (GRC) In the GRC policy adopted by the Executive Board, Continental defines the general conditions for integrated GRC as a key element of the risk management system, which regulates the identification, assessment, reporting and documentation of risks. In addition, this also further increases corporate-wide risk awareness and establishes the framework for a uniform risk culture. The GRC Committee en-sures that this policy is adhered to and implemented.
The GRC system incorporates all components of risk reporting and the examination of the effectiveness of the Financial Reporting ICS. Risks are identified, assessed and reported at the organizational level that is also responsible for managing the identified risks. A multi-stage assessment process is used to involve also the higher-level organizational units. The GRC system thus includes all report-ing levels, from the company level to the top corporate level.
Report on Risks and Opportunities

94 Continental AG 2018 Annual Report Management Report Report on Risks and Opportunities
At the corporate level, the responsibilities of the GRC Committee – chaired by the Executive Board member responsible for Finance, Controlling, Compliance, Law and IT – include identifying which risks are significant for the corporation. The GRC Committee regu-larly informs the Executive Board and the Audit Committee of the Supervisory Board of the major risks, any weaknesses in the control system and measures taken. Moreover, the auditor of the corpora-tion is required to report to the Audit Committee of the Supervisory Board regarding any major weaknesses in the Financial Reporting ICS which the auditor identified as part of their audit activities.
Risk assessment and reporting A period under consideration of one year is always applied when evaluating risks and opportunities. The risks and their effects are assessed primarily according to quantitative criteria and assigned to different categories in line with the net principle, i.e. after risk mit-igation measures. If a risk cannot be assessed quantitatively, then it is assessed qualitatively based on the potential negative effects its occurrence would have on achieving strategic corporate goals and based on other qualitative criteria such as the impact on Continen-tal’s reputation.
Significant individual risks for the corporation are identified from all the reported risks based on the probability of occurrence and the
amount of damage that would be caused in the period under con-sideration. The individual risks that Continental has classified as ma-terial and the aggregated risks that have been assigned to risk cate-gories are all described in the Report on Risks and Opportunities, provided the potential negative EBIT effect of an individual risk or the sum of risks included in a category exceeds €100 million in the period under consideration or there is a significant negative impact on the strategic corporate goals.
Local management can utilize various instruments for risk assess-ment, such as predefined risk categories (e.g. exchange-rate risks, product-liability risks, legal risks) and assessment criteria, a centrally developed function-specific questionnaire as well as the Financial Reporting ICS’s process and control descriptions. The key controls in business processes (purchase to pay, order to cash, asset man-agement, HR, IT authorizations and the financial statement closing process) are thus tested with respect to their effectiveness.
All major subsidiaries carry out a semiannual assessment of busi-ness-related risks and an annual assessment of compliance risks in the GRC system’s IT-aided risk management application. Any quality, legal and compliance cases that have actually occurred are also taken into account when assessing these risks. The quarterly Finan-cial Reporting ICS completes regular GRC reporting.
General RiskManagement
› Business-related risks
Quality Case Management
› Quality cases
GRC Committee
› Consolidates and monitors risks
› I s material risks › Recommends further
measures
Executive Board
› Responsible for integrated GRC
› D risk appetite › Monitors material risks
Audit Committee
› Monitors integrated GRC
Financial Reporting ICS
› Accounting-related internal controls
Compliance Case Management
› Compliance cases
Compliance Risk Management
› Compliance risks
Legal Case Management
› Legal cases
Reporting Unforeseen Risks
› Unforeseen risks
SWOT Analysis
› Strategic risks
› ›
Integrated GRC
GRC System
›
Risk reporting

Continental AG 2018 Annual Report Management Report Report on Risks and Opportunities 95
Furthermore, the GRC Committee identifies and assesses strategic risks, for example as part of a SWOT analysis. Any new material risks arising unexpectedly between regular reporting dates have to be reported immediately and considered by the GRC Committee. This also includes risks identified in the audits by corporate functions.
In addition to the risk analyses carried out by the reporting units as part of integrated GRC, audits are also performed by the Corporate Audit department. Furthermore, the central controlling function an-alyzes the key figures provided as part of this reporting process at corporation and division level in order to assess the effects of po-tential risks.
Continental has set up a Compliance & Anti-Corruption Hotline to give employees and third parties outside the corporation the op-portunity to report violations of legal regulations, its fundamental values, and ethical standards. Information on any kind of potential violations, such as bribery or antitrust behavior, but also accounting
manipulations, can be reported anonymously, where permissible by law, via the hotline. Tips received by the hotline are examined, pur-sued and dealt with fully by Corporate Audit and the Compliance department, as required, with the assistance of other departments.
Risk management The responsible management initiates suitable countermeasures that are also documented in the GRC system for each risk identified and assessed as material. The GRC Committee monitors and con-solidates the identified risks and suitable countermeasures at the corporation level. It regularly reports to the Executive Board and recommends further measures if needed. The Executive Board dis-cusses and resolves the measures, and reports to the Supervisory Board’s Audit Committee. The responsible bodies continually moni-tor the development of all identified risks and the progress of ac-tions initiated. Corporate Audit regularly audits the risk manage-ment process, thereby continually monitoring its effectiveness and further development.
Material Risks The order of the risk categories and individual risks presented within the four risk groups reflects the current assessment of the relative risk exposure for Continental and thus provides an indication of the current significance of these risks. If no quantitative information on the amount of damage is provided, the assessment is carried out on the basis of qualitative criteria. Unless the emphasis is placed on a specific division, then the risks apply to all divisions.
Financial Risks
Continental is exposed to risks in connection with its financing agreements and the syndicated loan. Continental is subject to risks in connection with its financing agreements. Risks arise from the bonds that Continental AG or its subsidiaries issued as part of its Debt Issuance Programme. These financing agreements contain covenants that could limit Continen-tal’s capacity to take action as well as change-of-control provisions.
In order to finance its current business activities as well as its in-vestments and payment obligations, Continental concluded a syn-dicated loan agreement in April 2014 from which risks may arise. This loan agreement was last renegotiated in April 2016. Under the terms of the syndicated loan agreement, the lenders have the right to demand repayment of the loan in the event of a change of con-trol at Continental AG. The requirements for and consequences of a
change in control in accordance with the terms of the bonds or the syndicated loan agreement are described in detail in the Further Disclosures and Notes section, pursuant to Sections 289a and 315a HGB, on pages 90 and 91. The loans and bonds cited here could also immediately become due and payable if other financing agreements of more than €75.0 million are not repaid on time or are prematurely called for repayment.
Furthermore, in addition to other obligations, this syndicated loan agreement also requires Continental to comply with a financial cov-enant. This provides for a maximum leverage ratio (calculated from the ratio of Continental’s consolidated net indebtedness to consoli-dated adjusted EBITDA) of 3.00.
Owing to the market and operational risks presented below, it can-not be ruled out that under certain extreme circumstances it may not be possible for Continental to comply with the ratio described previously. If Continental fails in this obligation, the creditors are en-titled to declare the loan and bonds immediately due and payable. The committed volume of the syndicated loan consists of a revolving tranche of €3.0 billion (due in April 2021). This had been utilized by Continental Rubber of America, Corp., Wilmington, Delaware, U.S.A., in the amount of €157.2 million as at the end of fiscal 2018.
The leverage ratio was 0.19 as at December 31, 2018. The finan-cial covenant was complied with at all times.

96 Continental AG 2018 Annual Report Management Report Report on Risks and Opportunities
Continental is exposed to risks associated with changes in currency exchange rates and hedging. Continental operates worldwide and is therefore exposed to finan-cial risks that arise from changes in exchange rates. This could re-sult in losses if assets denominated in currencies with a falling ex-change rate lose value and/or liabilities denominated in currencies with a rising exchange rate appreciate. In addition, fluctuations in exchange rates could intensify or reduce fluctuations in the prices of raw materials in euros, as Continental sources a considerable portion of its raw materials in foreign currency. As a result of these factors, fluctuations in exchange rates can influence Continental’s earnings situation.
External and internal transactions involving the delivery of prod-ucts and services to third parties and companies of the Continental Corporation can result in cash inflows and outflows that are de-nominated in currencies other than the functional currency of the respective subsidiary of the Continental Corporation (transaction risk). To the extent that cash outflows of the respective subsidiary of the Continental Corporation in any one foreign currency are not offset by cash flows resulting from operational business in the same currency, the remaining net exchange-rate risk is hedged against on a case-by-case basis using the appropriate derivative instruments, particularly currency forwards, currency swaps and currency options with a term of up to 12 months.
Moreover, Continental is exposed to exchange-rate risks arising from external and internal loan agreements, which result from cash inflows and outflows in currencies that are denominated in curren-cies other than the functional currency of the respective subsidiary of the Continental Corporation. These exchange-rate risks are in general hedged against by using appropriate derivative instruments, particularly currency forwards, currency swaps and cross-currency interest-rate swaps. Any hedging transactions executed in the form of derivative instruments can result in losses. Continental’s net for-eign investments are, as a rule, not hedged against exchange-rate fluctuations. In addition, a number of Continental’s consolidated companies report their results in currencies other than the euro, which requires Continental to convert the relevant items into euros when preparing Continental’s consolidated financial statements (translation risk). Translation risks are generally not hedged.
In order to quantify the possible effects of transaction-related ex-change-rate risks from financial instruments on the earnings posi-tion of the Continental Corporation, transaction currencies with a significant exchange-rate risk within the next 12 months were iden-tified using a mathematical model based on historical volatility. If the exchange rates of these currencies all develop disadvanta-geously for Continental at the same time, then the hypothetical negative effect on the corporation’s earnings position, calculated based on a 10% change in the current closing rate, would amount to between €100 million and €200 million.
Risks Related to the Markets in which Continental Operates
Continental could be exposed to material risks in connection with a global financial and economic crisis. Continental generates a large percentage (72%) of its sales from automobile manufacturers (original equipment manufacturers, OEMs). The remainder of Continental’s sales is generated from the replacement or industrial markets, mainly in the replacement mar-kets for passenger-car and truck tires, and to a lesser extent in the non-automotive end markets of the other divisions.
The automotive markets in Europe and North America, as well as in China, are currently developing much more weakly than in the past, while also displaying increasing volatility and uncertainty. If this rep-resents a prolonged weakness of the market or is intensified by a general economic downturn, it would likely adversely affect Conti-nental’s sales and results of operations. Furthermore, Continental’s five largest OEM customers (Daimler, Fiat-Chrysler, Ford, Renault-Nissan-Mitsubishi and VW) generated approximately 40% of the Continental Corporation’s sales in 2018. If one or more of Conti-nental’s OEM customers is lost or terminates a supply contract prematurely, the original investments made by Continental to pro-vide such products or outstanding claims against such customers could be wholly or partially lost.
Based on a scenario analysis that assumes a 20% decrease in vol-umes in fiscal 2019, and taking account of restructuring measures required as a result, we anticipate a decline of around 8 percentage points in the EBIT margin and of 5 to 6 percentage points in the adjusted EBIT margin.
Continental operates in a cyclical industry. Global production of vehicles and, as a result, sales to OEMs (from whom Continental currently generates 72% of its sales) are sub-jected to major fluctuations in some cases. They depend, among other things, on general economic conditions, disposable income and household consumer spending and preferences, which can be affected by a number of factors, including fuel costs as well as the availability and cost of consumer financing. As the volume of auto-motive production fluctuates, the demand for Continental’s prod-ucts also fluctuates, as OEMs generally do not commit to purchas-ing minimum quantities from their suppliers or to fixed prices. It is difficult to predict future developments in the markets Continental serves, which also makes it harder to estimate the requirements for production capacity. As Continental’s business is characterized by high fixed costs, it is thus exposed to the risk that fixed costs are not fully covered in the event of falling demand and the resulting underutilization of its facilities (particularly in the Automotive Group). Conversely, should the markets in which Continental oper-ates grow faster than anticipated, there could be insufficient capacity to meet customer demand. To reduce the impact of the potential risk resulting from this dependence on the automotive industry, Continental is strengthening its replacement business and industrial business, including by means of acquisitions.

Continental AG 2018 Annual Report Management Report Report on Risks and Opportunities 97
Continental is reliant on certain markets. In 2018, Continental generated 49% of its total sales in Europe and 20% in Germany alone. By comparison, 25% of Continental’s total sales in 2018 were generated in North America, 22% in Asia, and 4% in other countries. Therefore, in the event of an economic down-turn in Europe, particularly in Germany, for example, Continental’s business and earnings situation could be affected more extensively than that of its competitors’. Furthermore, the automotive and tire markets in Europe and North America are largely saturated. To min-imize these risks, Continental is therefore striving to improve the re-gional sales balance, particularly by generating more sales in emerg-ing markets and especially in Asia, as described in the corporate strategy. However, the established markets in Europe and North America as well as the growth markets, particularly in China, are currently developing much more weakly than in the past while also displaying increasing volatility and uncertainty, which makes it more difficult to plan and implement suitable measures to reduce regional market dependencies.
Continental is exposed to risks associated with the market trends and developments that could affect the vehicle mix sold by OEMs. Continental currently generates 72% of its sales from OEMs, mainly in its Automotive Group. Global production of vehicles and, as a re-sult, business with OEM customers are currently subject to a number of market trends and technical developments that may affect the vehicle mix sold by OEMs.
› Due to increasingly stringent consumption and emission standards throughout the industrial world, including the EU and Asia, car manufacturers are increasingly being forced to develop environ-mentally compatible technologies aimed at lowering fuel con-sumption as well as CO2 and particulate emissions. These devel-opments are causing a trend toward lower-consumption vehicles. The emerging markets are focusing strongly on the small-car seg-ment as their introduction to mobility.
› In recent years, the market segment of affordable cars has grown steadily, particularly in emerging markets such as China, India and Brazil, as well as in Eastern Europe.
› Over the past decade, hybrid electric vehicles, which combine a conventional internal-combustion-engine drive system with an electric drive system, have become increasingly popular. Their market share will increase further in the coming years. Further-more, the first purely electric vehicles that use one or more electric motors for propulsion have already been launched. If the industry is able to develop electric vehicles in line with con-sumers’ expectations, these could gain a considerable market share in the medium to long term.
As a result of the market trends and technical developments describ-ed previously, the vehicle mix sold by Continental’s customers has shifted considerably in the last few years and may also change fur-ther in the future. As a technology leader, Continental is reacting to this development with a balanced and innovative product portfolio.
Continental is exposed to risks associated with additional or higher tariffs. Due to the current increase in protectionist tendencies around the world as well as political developments such as Brexit, Continental sees itself at risk from additional or higher tariffs on automobiles and on the products, components and raw materials it supplies or purchases. These tariffs could cause demand for Continental’s products to drop and costs to increase, which would have an ad-verse effect on Continental’s business and earnings situation.
Continental is exposed to fluctuations in the prices of raw materials and electronic components. For the divisions of the Automotive Group, higher prices for raw materials and electronic components in particular can result in cost increases. The divisions of the Rubber Group mainly depend on the development of oil, natural rubber and synthetic rubber prices. The prices for these raw materials and components are exposed to sometimes considerable fluctuations worldwide. At present, Conti-nental does not actively hedge against the risk of rising prices of electronic components or raw materials by using derivative instru-ments. If the company is not able to compensate for the increased costs or to pass them on to customers, the price increases could reduce Continental’s income by €100 million to €200 million.
Risks Related to Continental’s Business Operations
Continental is exposed to risks in connection with its pension commitments. Continental provides defined benefit pension plans in Germany, the U.S.A., the U.K. and certain other countries. As of December 31, 2018, the pension obligations amounted to €6,595.3 million. These existing obligations are financed predominantly through ex-ternally invested pension plan assets. In 2006, Continental estab-lished legally independent trust funds under contractual trust ar-rangements (CTAs) for the funding of pension obligations of certain subsidiaries in Germany. In 2007, Continental assumed additional CTAs in connection with the acquisition of Siemens VDO. As of De-cember 31, 2018, Continental’s net pension obligations (defined benefit obligations less the fair value of plan assets) amounted to €3,866.8 million.
Continental’s externally invested plan assets are funded by exter-nally managed funds and insurance companies. While Continental generally prescribes the investment strategies applied by these funds and takes this into account when selecting external fund managers, it does not have any influence over their individual in-vestment decisions. The assets are invested in different asset classes including equity, fixed-income securities, real estate and other in-vestment vehicles. The values attributable to the externally invested plan assets are subject to fluctuations in the capital markets that are beyond Continental’s influence. Unfavorable developments in the capital markets could result in a substantial coverage shortfall for these pension obligations, resulting in a significant increase in Continental’s net pension obligations.

98 Continental AG 2018 Annual Report Management Report Report on Risks and Opportunities
Any such increase in Continental’s net pension obligations could adversely affect Continental’s financial condition due to an in-creased additional outflow of funds to finance the pension obliga-tions. Also, Continental is exposed to risks associated with longevity and interest-rate changes in connection with its pension commit-ments, as an interest-rate decrease could have an adverse effect on Continental’s liabilities under these pension plans. Furthermore, cer-tain U.S.-based subsidiaries of Continental have entered into obliga-tions to make contributions to healthcare costs of former employ-ees and retirees. Accordingly, Continental is exposed to the poten-tial risk that these costs may increase in the future.
If the discount rates used to calculate net pension obligations were to decrease by 0.5 percentage points at the end of the year, ceteris paribus, this would lead to a rise in net pension obligations in a range from €600 million to €700 million, which would not be re-duced by taking measures to minimize risk. However, this would not affect EBIT.
Continental is exposed to warranty and product liability claims. Continental is constantly subject to product liability claims and pro-ceedings alleging violations of due care, violation of warranty obli-gations or material defects, and claims arising from breaches of contract due to recalls or government proceedings. Any such law-suits, proceedings and other claims could result in increased costs for Continental. Moreover, defective products could result in loss of sales and loss of customer and market acceptance. Such risks are insured up to levels considered economically reasonable by Conti-nental, but its insurance coverage could prove insufficient in indi-vidual cases. Additionally, any defect in one of Continental’s prod-ucts (in particular tires and other safety-related products) could also have a considerable adverse effect on the company’s reputation and market perception. This could in turn have a negative impact on Continental’s sales and income. Moreover, vehicle manufactur-ers are increasingly requiring a contribution from their suppliers for potential product liability, warranty and recall claims. In addition, Continental has long been subject to continuing efforts by its cus-tomers to change contract terms and conditions concerning the contribution to warranty and recall cost. Furthermore, Continental manufactures many products pursuant to OEM customer specifica-tions and quality requirements. If the products manufactured and delivered by Continental do not meet the requirements stipulated by its OEM customers at the agreed date of delivery, production of the relevant products is generally discontinued until the cause of the product defect has been identified and remedied. Under certain circumstances, this could lead to losses of sales and earnings. Fur-thermore, Continental’s OEM customers could potentially claim damages, even if the cause of the defect is remedied at a later point in time. Moreover, failure to fulfill quality requirements could have an adverse effect on the market acceptance of Continental’s other products and its market reputation in various market segments.
The quantifiable risks from warranty and product liability claims as at December 31, 2018, taking into account provisions, amounted to between €200 million and €300 million.
Continental depends on a limited number of key suppliers for certain products. Continental is subject to the potential risk of unavailability of certain raw materials and production materials. Although Continental’s gen-eral policy is to source input products from a number of different suppliers, single sourcing cannot always be avoided and, conse-quently, Continental is dependent on certain suppliers in the Rubber Group as well as with respect to certain products manufactured in the Automotive Group. Since Continental’s procurement logistics are mostly organized on a just-in-time or just-in-sequence basis, supply delays, cancellations, strikes, insufficient quantities or inade-quate quality can lead to interruptions in production and, therefore, have a negative impact on Continental’s business operations in these areas. Continental tries to limit these risks by endeavoring to select suppliers carefully and monitor them regularly. However, if one of Continental’s suppliers is unable to meet its delivery obliga-tions for any reason (e.g. insolvency, destruction of production plants as a result of natural disasters, or refusal to perform follow-ing a change in control), Continental may be unable to source input products from other suppliers on short notice at the required vol-ume. Such developments and events can therefore cause delays in the delivery or completion of Continental products or projects and could result in Continental having to purchase products or services from third parties at higher costs or even to financially support its own suppliers. Furthermore, in many cases OEM customers have approval rights with respect to the suppliers used by Continental, which could make it impossible for Continental to source input products from other suppliers upon short notice if the relevant OEM customer has not already approved other suppliers at an ear-lier point in time. All of this could lead to order cancellations or even claims for damages. Furthermore, Continental’s reputation amongst OEM customers could suffer, with the possible conse-quence that they select a different supplier.
Continental could be adversely affected by property loss and business interruption. Fire, natural hazards, terrorism, power failures or other disturbances at Continental’s production facilities or within Continental’s supply chain – with customers and with suppliers – can result in severe damage and loss. Such far-reaching negative consequences can also arise from political unrest or instability. The risks arising from business interruption, loss of production, or the financing of facilities are insured up to levels considered economically reasonable by Continental, but its insurance coverage could prove insufficient in individual cases. Furthermore, such events could injure or damage individuals, third-party property or the environment, which could, among other things, lead to considerable financial costs for Conti-nental.

Continental AG 2018 Annual Report Management Report Report on Risks and Opportunities 99
Continental is exposed to information-technology risks. With regard to its business and production processes as well as its internal and external communication, Continental is highly depen-dent on centralized and standardized information-technology sys-tems and networks. These systems and networks are potentially exposed to the risk of various forms of cybercrime as well as dam-age and disruption that can have a wide range of other causes. In hacker attacks, third parties could attempt to gain unauthorized access to confidential information that is stored, processed or communicated in the systems and networks. In addition, data and systems could be blocked, damaged or destroyed as a result of becoming infected with viruses or malware.
Although Continental has taken appropriate precautions to manage the risks associated with system and network disruptions and cor-responding attacks, a prolonged outage in a computer center or telecommunication network or a comparable incident could result in systems or networks becoming unexpectedly unavailable over an extended period. The measures taken to minimize such risks in-clude technical and organizational precautions such as duplicated data storage and contingency plans, as well as suitable training measures that are continuously expanded, particularly to raise awareness of the growing threat from cybercrime.
Should the precautions taken prove insufficient to adequately pro-tect the systems, networks and information, Continental could suf-fer considerable damage and disadvantages as a result of outages or the knowledge and use of its information by third parties.
Continental is exposed to risks in connection with its interest in MC Projects B.V. Continental and Compagnie Financière Michelin SCmA, Granges-Paccot, Switzerland (Michelin), each hold a 50% stake in MC Proj-ects B.V., Maastricht, Netherlands, a company to which Michelin contributed the rights to the Uniroyal brand for Europe as well as for certain countries outside Europe. In turn, MC Projects B.V. li-censed to Continental certain rights to use the Uniroyal brand on or in connection with tires in Europe and elsewhere. Under the terms of the agreement concluded in this connection, both the agreement and the Uniroyal license can be terminated if a major competitor in the tire business acquires more than 50% of the vot-ing rights of Continental AG or of its tire business. Furthermore, in this case Michelin also has the right to acquire a majority in MC Projects B.V. and to have MC Projects B.V. increase its minority stake in the manufacturing company Continental Barum s.r.o., Otrokovice, Czechia – one of Continental’s largest tire plants in Europe – to 51%. These events could have an adverse effect on the business and earnings position of Continental’s Tire division.
Legal and Environmental Risks
Continental could become subject to additional burdensome environmental or safety regulations and additional regulations could adversely affect demand for Continental’s products and services. As a corporation that operates worldwide, Continental must ob-serve a large number of different regulatory systems in numerous countries that change frequently and are continuously evolving and becoming more stringent, particularly with respect to the envi-ronment, chemicals and hazardous materials, as well as health reg-ulations. This also applies to air, water and soil pollution regulations and to waste legislation, all of which have recently become more stringent through new laws, particularly in the EU and the U.S.A. Moreover, Continental’s sites and operations necessitate various permits and the requirements specified therein must be complied with. In the past, adjusting to new requirements has necessitated significant investments and Continental assumes that further signif-icant investments in this regard will be required in the future.
Continental could be unsuccessful in adequately protecting its intellectual property and technical expertise. Continental’s products and services are highly dependent upon its technological know-how and the scope and limitations of its propri-etary rights therein. Continental has obtained or applied for a large number of patents and other industrial property rights that are of considerable importance to its business. The process of obtaining patent protection can be lengthy and expensive. Furthermore, pat-ents may not be granted on currently pending or future applications or may not be of sufficient scope or strength to provide Continental with meaningful protection or commercial advantage. In addition, although there is a presumption that patents are valid, this does not necessarily mean that the patent concerned is effective or that pos-sible patent claims can be enforced to the degree necessary or de-sired.
A major part of Continental’s know-how and trade secrets is not patented or cannot be protected through industrial property rights. Consequently, there is a risk that certain parts of Continental’s know-how and trade secrets could be transferred to collaboration partners, customers and suppliers, including Continental’s machin-ery suppliers or plant vendors. This poses a risk that competitors will copy Continental’s know-how without incurring any expenses of their own. Moreover, Continental has concluded a number of license, cross-license, collaboration and development agreements with its customers, competitors and other third parties under which Continental is granted rights to industrial property and/or know-how of such third parties. It is possible that license agreements could be terminated under certain circumstances in the event of the licensing partner’s insolvency or bankruptcy and/or in the event of a change-of-control in either party, leaving Continental with reduced access to intellectual property rights to commercialize its own technologies.

100 Continental AG 2018 Annual Report Management Report Report on Risks and Opportunities
There is a risk that Continental could infringe on the industrial property rights of third parties. There is a risk that Continental could infringe on industrial property rights of third parties, since its competitors, suppliers and custom-ers also submit a large number of inventions for industrial property protection. It is not always possible to determine with certainty whether there are effective and enforceable third-party industrial property rights to certain processes, methods or applications. Therefore, third parties could assert claims (including illegitimate ones) of alleged infringements of industrial property rights against Continental. As a result, Continental could be required to cease manufacturing, using or marketing the relevant technologies or products in certain countries or be forced to make changes to manufacturing processes and/or products. In addition, Continental could be liable to pay compensation for infringements or could be forced to purchase licenses to continue using technology from third parties. In addition, Continental is subject to efforts by its cus-tomers to change contract terms and conditions concerning the participation in disputes regarding alleged infringements of intellec-tual property rights.
Continental could be threatened with fines and claims for damages for alleged or actual antitrust behavior. In May 2005, the Brazilian competition authorities opened investi-gations against Continental’s Brazilian subsidiary Continental Brasil Indústria Automotiva Ltda., Guarulhos, Brazil (CBIA), following a complaint of anticompetitive behavior in the area of commercializa-tion of tachographs. On August 18, 2010, the Brazilian antitrust au-thorities determined an “invitation to cartel” and imposed a fine of BRL 12 million (around €2.7 million) on CBIA, which was then re-duced to BRL 10.8 million (around €2.4 million). CBIA denies the accusation that it has infringed Brazilian antitrust law. Although the court of first instance appealed to by CBIA upheld the decision, on CBIA’s further appeal the next higher court annulled this decision and remanded the matter. In case an infringement of Brazilian anti-trust law is found, third parties may, in addition, claim damages from CBIA.
On October 2, 2006, South African antitrust authorities received a complaint from a third party accusing several South African tire manufacturers of alleged antitrust behavior, including Continental Tyre South Africa (Pty.) Ltd., Port Elizabeth (CTSA), a subsidiary of Continental. On August 31, 2010, the South African antitrust author-ities came to the conclusion that CTSA had violated South African antitrust law and referred the matter to the responsible antitrust court for a decision. CTSA denies the allegation of infringements of South African antitrust law. However, the tribunal could impose a fine of up to 10% of CTSA’s sales. In addition, third parties may also claim damages from CTSA in case of an infringement of South African competition law.
In October 2012, Continental Automotive Systems US, Inc., Auburn Hills, Michigan, U.S.A., and two of Continental’s South Korean sub-sidiaries became aware of investigations by the U.S. Department of
Justice (DOJ) and the Korean Fair Trade Commission (KFTC) in connection with the suspected involvement in violations of U.S. and South Korean antitrust law in instrument cluster business. On December 23, 2013, the KFTC announced that it had imposed a fine of KRW 45,992 million (around €36 million) on Continental Automotive Electronics LLC, Bugan-myeon, South Korea (CAE). On June 25, 2015, the Seoul High Court, Seoul, South Korea, vacated the administrative fine imposed by the KFTC on CAE’s appeal against the amount of the fine. The Supreme Court of South Korea rejected KFTC’s appeal against this decision on May 31, 2017. On May 21, 2018, the KFTC adjusted the fine to KRW 32,101 million (around €25 million). This decision is final. On November 24, 2014, CAE and Continental Automotive Korea Ltd., Seongnam-si, South Korea, entered into an agreement with the DOJ that was confirmed by the competent U.S. court on April 1, 2015. Under this agreement, the two companies admitted to charges of violating U.S. antitrust law and agreed to pay a fine of U.S. $4.0 million (around €3.5 million). In the proceedings relating to class action lawsuits filed in the U.S.A. for alleged damages resulting from the antitrust violations, settle-ments totaling U.S. $5.0 million (around €4.4 million) were concluded in 2018. The risk of investigations by other antitrust authorities into this matter and further claims for damages by further alleged victims remain unaffected by the fines imposed. Continental has conducted internal audits in certain business units to check compliance with antitrust law. These audits revealed anticompetitive behavior with respect to product groups. Continental took measures to end this behavior. There is a risk that antitrust authorities may conduct in-vestigations due to this behavior and impose fines and that third parties, especially customers, may file claims for damages. The amount of such fines and any subsequent claims is unknown from the current perspective, but could be significant. It also cannot be ruled out that future internal audits may reveal further actual or po-tential violations of antitrust law that in turn could result in fines and claims for damages. In addition, alleged or actual antitrust behavior could seriously disrupt the relationships with business partners.
In September 2014, the European Commission conducted a search at a subsidiary of Continental. On February 21, 2018, the Commission imposed a fine of €44.0 million on Continental AG; Continental Teves AG & Co. oHG, Frankfurt, Germany; and Conti-nental Automotive GmbH, Hanover, Germany; for the unlawful ex-change of information. This involved specific brake components. Continental has set aside provisions that cover this fine. Continental cannot rule out the possibility that customers will claim for dam-ages with reference to the commission’s decision. At this point in time, it is not possible to say whether such claims will be submitted and, if they are, how much the damages will be – irrespective of whether or not the claims are justified. As a result, it cannot be ruled out that the resulting expenses will exceed the provisions that have been set aside for this purpose. In accordance with IAS 37.92 and GAS 20.154, no further disclosures will be made with regard to the proceedings and the related measures so as not to adversely affect the company’s interests.

Continental AG 2018 Annual Report Management Report Report on Risks and Opportunities 101
Continental is exposed to risks from legal disputes. Companies from the Continental Corporation are involved in a number of legal and arbitration proceedings and could become in-volved in other such proceedings in the future. These proceedings
could involve substantial claims for damages or payments, particu-larly in the U.S.A. For more information on legal disputes, see Note 34 of the Notes to the Consolidated Financial Statements.
Material Opportunities Unless the emphasis is placed on a specific division, then the op-portunities apply to all divisions.
There are opportunities for Continental if macroeconomic development is better than anticipated. If the general economic conditions develop better than we have anticipated, we expect that global demand for vehicles, replace-ment tires and industrial products will also develop better than we have anticipated. Due to the increased demand for Continental’s products among vehicle manufacturers and industrial clients and in the replacement business that would be expected as a consequence, sales could rise more significantly than expected and there could be positive effects with regard to fixed cost coverage.
There are opportunities for Continental if the sales markets develop better than anticipated. If demand for automobiles and replacement tires develops better than we have anticipated, particularly on the European market, this would have positive effects on Continental’s sales and earnings due to the high share of sales generated in this region (49%).
There are opportunities for Continental if there is a stable price level on the raw materials markets relevant to us. Continental’s earnings situation is affected to a significant extent by the cost of raw materials, electronic components and energy. For the Automotive Group divisions, this particularly relates to the cost of steel and electronic components. If we succeed even better than before in offsetting possible cost increases or compensating for them through higher prices for our products, this would then have a positive effect on Continental’s earnings. The earnings situation of the Rubber Group divisions is significantly impacted by the cost of oil and of natural and synthetic rubber. If prices for natural and syn-thetic rubber in particular settle down at the level of the second half of 2018, this could have a positive impact on Continental’s earnings. We currently anticipate that prices, particularly of rubber, will rise again over the course of 2019 as a result of the assumed increase in demand on the global tire-replacement and industrial markets.
There are opportunities for Continental from changes in the legal framework. The further tightening of the regulatory provisions on fuel con-sumption and emission standards for motor vehicles in developing markets, too, could trigger higher demand for Continental’s prod-ucts. With our comprehensive portfolio of gasoline and diesel sys-tems including sensors, actuators, exhaust-gas aftertreatment and tailor-made electronics, through to fuel supply systems, engine
management and transmission control units, down to systems and components for hybrid and electric drives, as well as with tires with optimized rolling resistance and tires for hybrid vehicles, we are already providing solutions that enable compliance with such changes in the legal framework and can therefore respond quickly to changes that arise in the regulatory provisions. An increase in the installation rates for these products due to increased regulatory provisions would have a positive influence on our sales and earnings.
Additional legal regulations with the aim of further improving traffic safety would also provide an opportunity for a rise in demand for Continental’s products. We are already among the leading provid-ers of electronic brake systems as well as control electronics for air-bags and seat belts. Based on our broad product portfolio for active vehicle safety, we have developed more advanced safety systems over the past years, including emergency brake assist, lane depar-ture warning and blind spot detection systems, as well as the head-up display. At present, these systems are mainly optionally installed in luxury vehicles.
There are opportunities for Continental from an intensified trend toward vehicle electrification. If the trend toward vehicle electrification intensifies, with the effect that electric drive or hybrid drive systems are more cost-effective alternatives than previously expected due to economies of scale, this would have a positive impact for Continental. Continental is already well positioned on these future markets with its products.
There are opportunities for Continental from digitalization and particularly from the intelligent interconnection of vehicles with each other and with the internet. By intelligently connecting advanced driver assistance systems and driver information systems with each other and with the internet, we are laying the foundations for gradually making automated driv-ing possible in the coming years. We also plan to implement fully automated driving in the coming decade by means of collabora-tions with leading providers from the technology and internet sector. To this end, we are developing new cross-divisional system, service and software solutions that can offer substantial growth potential for Continental with positive effects on its future sales and attainable margins. External studies estimate the market potential of connecting vehicles with each other and with the internet at U.S. $70 billion to U.S. $110 billion in 2025. This also includes the intelli-gent use of automotive data. This digitalization is opening up a new market for mobility services that enables Continental to tap new business areas with its Continental.cloud and eHorizon, which are paving the way for such services.

102 Continental AG 2018 Annual Report Management Report Report on Risks and Opportunities
In addition, the increasing digitalization of our products gives us the opportunity to offer our customers software-based services as well as the product itself (servitization). Additional sales in these fields would bring Continental closer to achieving its strategic goal of greater independence from the automotive industry.
The trend toward automated driving presents Continental with opportunities. In recent years, the trend from assisted driving to fully automated driving has intensified considerably. Some OEMs expect to be able to provide this function in just a few years. A key requirement for fully automated driving is that vehicles be equipped with sensors. Today, an average of one sensor for assisted driving is installed per vehicle. Merely for partly automated driving, an average of 16 sen-sors are required, including radar, laser and camera sensors. OEMs estimate that up to 44 sensors are needed in order to realize fully automated driving. Continental is already one of the leading provid-ers of advanced driver assistance systems. According to our own estimate, the market volume for sensors for assisted/automated driving in 2025 will be more than €20 billion. However, this estimate
is based on far fewer sensors per vehicle than is currently assumed by our customers. Should the trend toward automated driving con-tinue to accelerate in the years to come and the data we assume for sensor equipment per vehicle prove too conservative, this would result in considerable sales and earnings opportunities for Continental.
Urbanization presents Continental with opportunities. Forecasts predict that by 2050 more than two-thirds of the world’s population will live in large cities. The vehicle fleet will then have grown to over two billion vehicles by that time, and the majority of these vehicles will be used in large cities. This will pose huge challenges in terms of infrastructure, safety and vehicle emissions. In view of our broad portfolio of safety technologies, products for zero-emission and low-emission mobility, and solutions for intelli-gently connecting vehicles with one another and with the infra-structure, this trend will bring opportunities to generate sales in the future. At the same time, it will also enhance the opportunities arising from digitalization, electrification and automated driving.
Statement on Overall Risk and Opportunities Situation In the opinion of the Executive Board, the risk situation of the Conti-nental Corporation has not changed significantly in the past fiscal year.
In the current year, it remains to be seen how further political devel-opments in North America, Europe (e.g. Brexit) and China will affect the economy and our business development – and how the prevail-ing volatile situation will affect our company.
However, despite the changes in individual risks, the analysis in the corporation-wide risk management system for the year under review did not reveal any risks that, individually or collectively, pose a threat to the company or the corporation as a going concern. In the opinion of the Executive Board, there are also no discernible risks to the corporation as a going concern in the foreseeable future.
Considering the material opportunities, the overall risk assessment for the Continental Corporation presents a reasonable risk and op-portunities situation to which our strategic goals have been aligned accordingly.

Continental AG 2018 Annual Report Management Report Report on Expected Developments 103
Forecast of Macroeconomic Development
In its January 2019 World Economic Outlook Update, the Interna-tional Monetary Fund (IMF) predicts that growth in Germany and the eurozone will slow slightly again in the current fiscal year due to subdued consumer spending, flagging growth in private invest-ment and weaker foreign demand. For 2019, the IMF is now pro-jecting that the gross domestic product (GDP) of Germany and the eurozone will grow by 1.3% and 1.6% respectively.
For the U.S.A., the IMF expects a decline in GDP growth to 2.5% this year. Above all, economic activity could be curbed by further interest- rate hikes by the U.S. Federal Reserve (Fed). The IMF also expects the effects from the U.S. fiscal policy to decrease. As a result of the in-crease in the exchange rate of the U.S. dollar to many currencies, the trade deficit is also likely to increase due to rising imports.
For Japan, the IMF is forecasting growth of 1.1% in 2019. The IMF anticipates an expansion of fiscal policy measures here to mitigate the effects of the rise in consumption tax planned for October 2019. Low interest rates, which are boosting private investment,
continue to have a positive effect. However, the fact that the ex-change rate of the Japanese yen to many other currencies has recently increased means that the contribution of Japanese foreign trade in 2019 could be lower than in 2018.
According to the IMF, emerging and developing economies are ex-pected to record a 4.5% increase in GDP in 2019. The main reason for the lower level of growth in comparison to 2018 has to do with China, for which the IMF anticipates a slowdown in growth to 6.2% as a result of the continuing trade conflict with the U.S.A. The IMF also anticipates somewhat lower growth of 1.6% for Russia. By con-trast, it is once again forecasting strong growth of 7.5% for India. For Brazil, the IMF expects a slight increase in growth to 2.5%.
Based on its estimates for the individual countries and regions, the IMF expects global economic growth to fall by 0.2 percentage points year-on-year to 3.5% in 2019. The IMF cites an escalation of the various trade conflicts as a key source of risk to its outlook. Given the high levels of public and private debt, general risk senti-ment and financial conditions could also deteriorate further. The potential triggers mentioned by the IMF include a “no-deal” with-drawal of the United Kingdom from the European Union and a greater-than-envisaged slowdown in China.
Sources: IMF – World Economic Outlook Update January 2019, Eurostat, statistical offices of the respective countries, Bloomberg.
Report on Expected Developments Future General Conditions
World 3.5% Economic growth (GDP) 2019
3.7% Economic growth (GDP) 2018
1.6% Eurozone
1.8%
Russia 1.6%
1.7%
Japan 1.1%
0.9%China 6.2%
6.6%India 7.5%
7.3%
2.5% Brazil
1.3%
1.3% Germany
1.5%
2.5% U.S.A.
2.9%
Year-on-year economic growth (GDP) in 2019

104 Continental AG 2018 Annual Report Management Report Report on Expected Developments
Forecast for Key Customer Sectors
Forecast for production of passenger cars and light commercial vehicles For the global production of passenger cars and light commercial vehicles weighing less than 6 metric tons, we currently expect production volumes in 2019 to be at the previous year’s level of 94 million units.
In the first half of 2019, there is likely to be a decline in global production of passenger cars and light commercial vehicles, which should be compensated by production increases in the second half of the year along with lower prior-year figures. In our estimation, Brazil, India, Indonesia and Russia in particular are likely to record rises in production volumes. We expect the production volume in Europe to remain at the previous year’s level, as the effects from the introduction of the WLTP emissions testing procedure will also impact the first half of 2019 in our view. In North America, we ex-pect production to be at the previous year’s level. While Mexico is likely to record growth in production, we anticipate declining vol-umes in Canada and the U.S.A. We also expect production in Asia to remain at the previous year’s level. This is due mainly to the development of demand in China and the effects of the Chinese government’s purchase incentive program. In South America, we expect production to increase by 4% as a result of the anticipated economic recovery.
Forecast for production of medium and heavy commercial vehicles According to our estimates, global production of commercial vehi-cles weighing more than 6 metric tons will go down 1% year-on-year in 2019.
We expect production in China and India to decline. As a result, we expect a 3% fall in production in Asia. For Western Europe, we antic-ipate generally modest demand and a slight decrease in production volumes, although this should be more than compensated by stronger demand in Russia and in other Eastern European coun-tries. Following the strong growth in North America in the previous
year and the recent decline in incoming orders, we expect produc-tion volumes here to stagnate. By contrast, the continuing eco-nomic recovery in South America should lead to a 10% increase in production here.
Forecast for replacement-tire markets for passenger cars and light commercial vehicles The positive trend in demand for replacement tires for passenger cars and light commercial vehicles weighing less than 6 metric tons is expected to continue in all regions in 2019. On a global level, we anticipate an increase of 2%.
The Asian market is expected to contribute around half of this with projected growth of 3%. This will probably be driven mainly by in-creasing demand in China as a result of further growth in vehicle numbers and replenishment of stocks. Demand is also likely to grow in India, Indonesia and South Korea. In Europe, we expect a 2% increase in demand for replacement tires for passenger cars and light commercial vehicles in 2019. We anticipate continued strong growth rates for Russia in particular. In our view, demand in North America will likely increase by 2% in 2019. In South America, we also currently expect a 2% increase in sales volumes of replace-ment tires for passenger cars and light commercial vehicles.
Forecast for replacement-tire markets for medium and heavy commercial vehicles Thanks to the growing world economy, global demand for replace-ment tires for commercial vehicles weighing more than 6 metric tons is likely to continue increasing and to rise by 2% overall in 2019.
Asia is likely to account for the majority of the anticipated increase in demand. We expect demand for replacement tires for medium and heavy commercial vehicles to increase by 2% in this region as a result of rising transport volumes and the replenishment of stocks in China. In Europe, we anticipate a 2% rise in sales volumes of replacement tires. In North America, we consider a slowdown in the positive trend to 2% to be realistic. In South America, we also expect demand for replacement tires for medium and heavy com-mercial vehicles to go up by 2%.
Forecast for vehicle production and sales volumes in the tire-replacement business
Vehicle production Replacement sales of tires
of passenger cars and light commercial vehicles
in millions of units
of medium and heavy commercial vehicles in thousands of units
for passenger cars and light commercial vehicles
in millions of units
for medium and heavy commercial vehicles
in millions of units
2019 2018 2019 2018 2019 2018 2019 2018
Europe 21.7 21.7 663 663 364 358 26.3 25.8
North America 17.0 17.0 638 638 301 296 27.0 26.5
South America 3.6 3.4 170 155 68 67 15.1 14.8
Asia 50.5 50.6 2,170 2,240 465 450 89.0 87.0
Other markets 1.3 1.3 0 0 50 49 8.0 7.9
Worldwide 94.0 94.0 3,641 3,695 1,248 1,220 165.4 162.0
Sources: Vehicle production: IHS Inc. (Europe with Western, Central and Eastern Europe incl. Russia and Turkey; Asia incl. Kazakhstan, Uzbekistan, Middle East and Oceania with Australia). Tire replacement business: LMC International Ltd. Preliminary figures and own estimates.
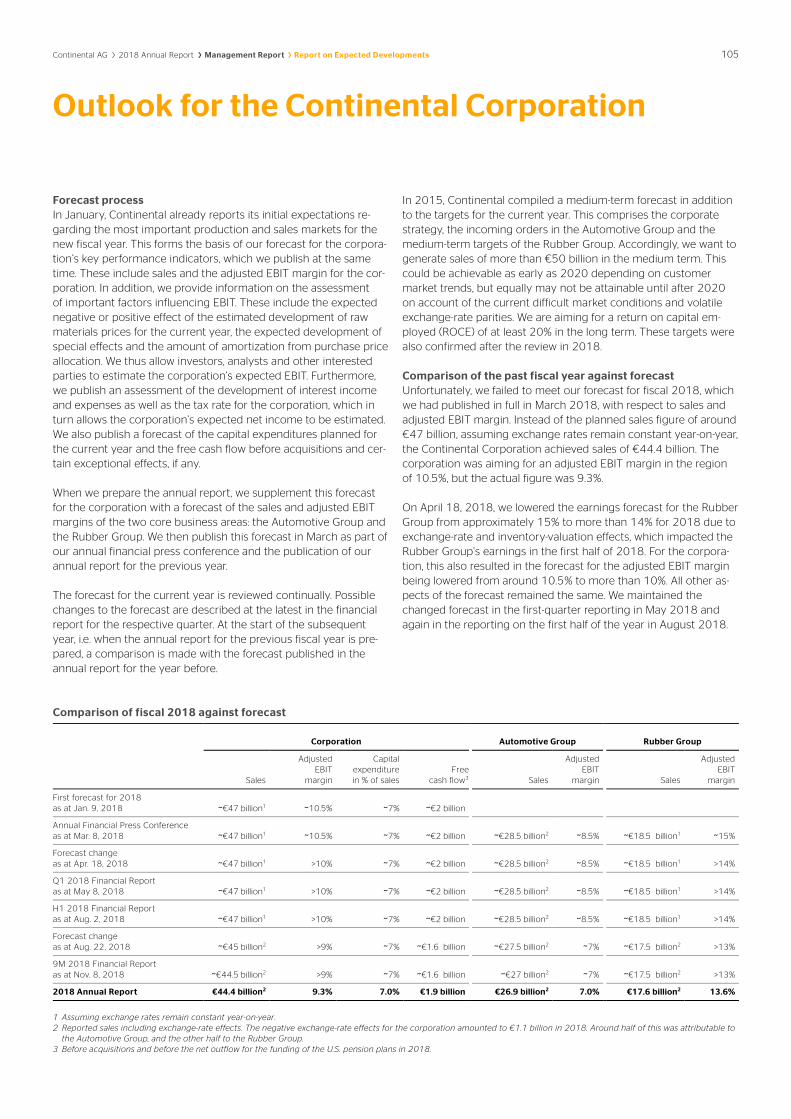
Continental AG 2018 Annual Report Management Report Report on Expected Developments 105
Forecast process In January, Continental already reports its initial expectations re-garding the most important production and sales markets for the new fiscal year. This forms the basis of our forecast for the corpora-tion’s key performance indicators, which we publish at the same time. These include sales and the adjusted EBIT margin for the cor-poration. In addition, we provide information on the assessment of important factors influencing EBIT. These include the expected negative or positive effect of the estimated development of raw materials prices for the current year, the expected development of special effects and the amount of amortization from purchase price allocation. We thus allow investors, analysts and other interested parties to estimate the corporation’s expected EBIT. Furthermore, we publish an assessment of the development of interest income and expenses as well as the tax rate for the corporation, which in turn allows the corporation’s expected net income to be estimated. We also publish a forecast of the capital expenditures planned for the current year and the free cash flow before acquisitions and cer-tain exceptional effects, if any.
When we prepare the annual report, we supplement this forecast for the corporation with a forecast of the sales and adjusted EBIT margins of the two core business areas: the Automotive Group and the Rubber Group. We then publish this forecast in March as part of our annual financial press conference and the publication of our annual report for the previous year.
The forecast for the current year is reviewed continually. Possible changes to the forecast are described at the latest in the financial report for the respective quarter. At the start of the subsequent year, i.e. when the annual report for the previous fiscal year is pre-pared, a comparison is made with the forecast published in the annual report for the year before.
In 2015, Continental compiled a medium-term forecast in addition to the targets for the current year. This comprises the corporate strategy, the incoming orders in the Automotive Group and the medium-term targets of the Rubber Group. Accordingly, we want to generate sales of more than €50 billion in the medium term. This could be achievable as early as 2020 depending on customer market trends, but equally may not be attainable until after 2020 on account of the current difficult market conditions and volatile exchange-rate parities. We are aiming for a return on capital em-ployed (ROCE) of at least 20% in the long term. These targets were also confirmed after the review in 2018.
Comparison of the past fiscal year against forecast Unfortunately, we failed to meet our forecast for fiscal 2018, which we had published in full in March 2018, with respect to sales and adjusted EBIT margin. Instead of the planned sales figure of around €47 billion, assuming exchange rates remain constant year-on-year, the Continental Corporation achieved sales of €44.4 billion. The corporation was aiming for an adjusted EBIT margin in the region of 10.5%, but the actual figure was 9.3%.
On April 18, 2018, we lowered the earnings forecast for the Rubber Group from approximately 15% to more than 14% for 2018 due to exchange-rate and inventory-valuation effects, which impacted the Rubber Group’s earnings in the first half of 2018. For the corpora-tion, this also resulted in the forecast for the adjusted EBIT margin being lowered from around 10.5% to more than 10%. All other as-pects of the forecast remained the same. We maintained the changed forecast in the first-quarter reporting in May 2018 and again in the reporting on the first half of the year in August 2018.
Comparison of fiscal 2018 against forecast
Corporation Automotive Group Rubber Group
Sales
Adjusted EBIT
margin
Capital expenditure in % of sales
Free cash flow3 Sales
Adjusted EBIT
margin Sales
Adjusted EBIT
margin
First forecast for 2018 as at Jan. 9, 2018 ~€47 billion1 ~10.5% ~7% ~€2 billion
Annual Financial Press Conference as at Mar. 8, 2018 ~€47 billion1 ~10.5% ~7% ~€2 billion ~€28.5 billion2 ~8.5% ~€18.5 billion1 ~15%
Forecast change as at Apr. 18, 2018 ~€47 billion1 >10% ~7% ~€2 billion ~€28.5 billion2 ~8.5% ~€18.5 billion1 >14%
Q1 2018 Financial Report as at May 8, 2018 ~€47 billion1 >10% ~7% ~€2 billion ~€28.5 billion2 ~8.5% ~€18.5 billion1 >14%
H1 2018 Financial Report as at Aug. 2, 2018 ~€47 billion1 >10% ~7% ~€2 billion ~€28.5 billion2 ~8.5% ~€18.5 billion1 >14%
Forecast change as at Aug. 22, 2018 ~€45 billion2 >9% ~7% ~€1.6 billion ~€27.5 billion2 ~7% ~€17.5 billion2 >13%
9M 2018 Financial Report as at Nov. 8, 2018 ~€44.5 billion2 >9% ~7% ~€1.6 billion ~€27 billion2 ~7% ~€17.5 billion2 >13%
2018 Annual Report €44.4 billion2 9.3% 7.0% €1.9 billion €26.9 billion2 7.0% €17.6 billion2 13.6%
1 Assuming exchange rates remain constant year-on-year. 2 Reported sales including exchange-rate effects. The negative exchange-rate effects for the corporation amounted to €1.1 billion in 2018. Around half of this was attributable to
the Automotive Group, and the other half to the Rubber Group. 3 Before acquisitions and before the net outflow for the funding of the U.S. pension plans in 2018.
Outlook for the Continental Corporation

106 Continental AG 2018 Annual Report Management Report Report on Expected Developments
On August 22, 2018, lower sales expectations, cost increases and warranty cases forced us to announce another change to our fore-cast. The main reasons for this were the decline in original equip-ment business in the major sales markets of Europe and China dur-ing the second half of 2018 and weak demand in the tire market in these regions. This was exacerbated by higher-than-anticipated de-velopment costs in the Automotive Group as a result of high in-coming orders and start-up costs for new products and plants.
The forecast for consolidated sales in 2018 – including negative exchange-rate effects – was reduced to around €45 billion, while the forecast for the corporation’s adjusted EBIT margin was lowered to more than 9%. The guidance for the Automotive Group’s sales – including negative exchange-rate effects – was reduced to around €27.5 billion with an adjusted EBIT margin of around 7%. The sales forecast for the Rubber Group – including negative exchange-rate effects – was lowered to around €17.5 billion and the adjusted EBIT margin was revised to more than 13%. The guidance for free cash flow before acquisitions and before the net outflow for the funding of the U.S. pension plans was reduced to approximately €1.6 billion for the current year. Almost all aspects of the revised forecast were confirmed in November 2018 in the reporting on the first nine months of the year. The corporation’s sales guidance was the only aspect to be lowered slightly to around €44.5 billion due to weaker development in China.
Continental achieved consolidated sales of €44.4 billion and a con-solidated adjusted EBIT margin of 9.3% in fiscal 2018. The Automo-tive Group generated sales of €26.9 billion and an adjusted EBIT margin of 7.0%. The Rubber Group generated sales of €17.6 billion and an adjusted EBIT margin of 13.6%.
The negative financial result decreased to €177.8 million in 2018, which was in line with our expectations. In January 2018, we had forecast a negative financial result of less than €190 million before effects from currency translation, effects from changes in the fair value of derivative instruments, and other valuation effects. In March 2018, we lowered this forecast to less than €180 million.
The tax rate for fiscal 2018 went down to 23.2%. In January 2018, like at the start of the previous year, we had assumed a figure of less than 30%. In the reporting on the first half of the year in Au-gust, we lowered this figure to around 25%. This was due primarily to the effects of the tax reform in the U.S. and to tax refunds for pre-vious years on the back of a supreme court ruling in Germany. In November, we slightly adjusted our guidance for the tax rate to around 24%.
The capital expenditure ratio increased to 7.0% in 2018, as had been forecast in January 2018. Free cash flow before acquisitions and before the net outflow for the funding of the U.S. pension plans amounted to €1.9 billion in 2018, a figure between the guidance of January 9, 2018, and the lowered forecast of August 22, 2018.
Order situation The order situation in the Automotive Group was extremely positive in the past fiscal year, as it was in the previous year. As such, incom-ing orders for the three Automotive divisions remained on par with the previous year’s record level. Altogether, the Chassis & Safety, Powertrain and Interior divisions again acquired orders for a total value of roughly €40 billion for the entire duration of the deliveries. These lifetime sales are based primarily on assumptions regarding production volumes of the respective vehicle or engine platforms, the agreed cost reductions and the development of key raw materi-als prices. The volume of orders calculated in this way represents a reference point for the resultant sales achievable in the medium term that may, however, be subject to deviations if these factors change. Should the assumptions prove to be accurate, the lifetime sales are a good indicator for the sales volumes that can be achieved in the Automotive Group in four to five years.
The replacement tire business accounts for a large portion of the Tire division’s sales, which is why it is not possible to calculate a reli-able figure for order volumes. The same applies to the ContiTech division, which since January 2018 has comprised seven business units operating in various markets and industrial sectors, each in turn with their own relevant factors. Consolidating the order figures from the various ContiTech business units would thus be meaning-ful only to a limited extent.
Outlook for fiscal 2019 For fiscal 2019, we currently anticipate that global production of passenger cars and light commercial vehicles will be at roughly the same level as the previous year. The declining market performance we experienced over the second half of last year looks set to con-tinue unabated in the first half of 2019. For the second half of the year, we anticipate slight increases in production compared with the low prior-year basis. The positive trend in demand for replace-ment tires for passenger cars and light commercial vehicles is expected to continue in all regions in 2019. On a global level, we expect it to increase by 2%.
Based on these market assumptions and in light of what continues to be a highly volatile market environment – and provided that exchange rates remain constant – we anticipate total sales of be-tween around €45 billion and €47 billion and an adjusted EBIT margin of approximately 8% to 9% in fiscal 2019.
For the Automotive Group, assuming constant exchange rates, we anticipate sales of approximately €27 billion to €28 billion with an adjusted EBIT margin of around 6% to 7%. For the Rubber Group, assuming constant exchange rates, we anticipate sales of approxi-mately €18 billion to €19 billion with an adjusted EBIT margin of around 12% to 13%.
For the Rubber Group, we anticipate increased fixed costs in the Tire division in 2019. This increase in fixed costs has resulted primarily from the considerable expansion of capacity over recent years. The utilization of the new capacity and the generation of related sales will not positively impact the cost situation until 2020 onwards.

Continental AG 2018 Annual Report Management Report Report on Expected Developments 107
If demand for tires increases worldwide over the course of the year, as we expect it to, this is likely to be reflected in rubber prices at a commensurately fast rate. We are anticipating an average price of U.S. $1.46 per kilogram (2018: U.S. $1.36 per kilogram) for natural rubber (TSR 20) and U.S. $1.43 per kilogram (2018: U.S. $1.41 per kilogram) for butadiene, a base material for synthetic rubber. More-over, we expect the import tariffs that have been levied by various countries to increase the costs of steel cord. We do not expect the recent resurgent price of crude oil to produce a positive impact on the cost of carbon black and other chemicals year-on-year. Gener-ally speaking, every U.S. $10 increase in the average price of crude oil equates to a negative gross effect of around U.S. $50 million on the Rubber Group’s operating earnings. Overall, we expect rising raw material prices to have a negative effect of approximately €50 million on the Rubber Group in 2019.
In 2019, we expect the negative financial result before effects from currency translation, effects from changes in the fair value of deriv-ative instruments, and other valuation effects to be in the region of €220 million. The fact that this figure is higher than in the previous year can be attributed primarily to the new standard IFRS 16, Leases, which has to be applied starting in the 2019 fiscal year. It stipulates that interest expenses resulting from the measurement of lease liabilities are to be reported in the financial result.
The tax rate – including the tax effects from the transformation of the Powertrain division into an independent group of legal entities – is expected to be around 27% in 2019.
For 2019, taking into account expenses relating to the transfor-mation of the Powertrain division into an independent group of le-gal entities, we expect negative special effects to total €200 million.
Amortization from purchase price allocations, resulting primarily from the acquisitions of Veyance Technologies (acquired in 2015), Elektrobit Automotive (acquired in 2015) and the Hornschuch Group (acquired in 2017), is expected to total approximately €200 million and to affect mainly the ContiTech and Interior divisions.
In fiscal 2019, the capital expenditure ratio before financial invest-ments will increase to around 8% of sales. This increase is chiefly attributable to the recognition of leases as a result of the first-time adoption of IFRS 16. Approximately 60% of capital expenditure will be attributable to the Automotive Group and 40% to the Rubber Group.
The largest projects within the Chassis & Safety division in 2019 re-main the global expansion of production capacity for the new gen-erations of electronic brake systems in the Vehicle Dynamics busi-ness unit. Further extensive capital expenditure is planned for the global expansion of production capacity for sensors. The Powertrain division will continue its investments in a new plant in China. Invest-ments in the Hybrid Electric Vehicle business unit are also a priority for capital expenditure. The Interior division is continuing to invest in the construction of new plants in Eastern Europe, North America and China and in the industrialization of new display technologies in 2019.
This year, like last year, investments in the Tire division will focus on the expansion of passenger tire production in Asia, North America, and Southern and Eastern Europe. In the area of commercial-vehicle tires, the emphasis will be on the expansion of production capacity in North America and Eastern Europe. In 2019, the ContiTech divi-sion will be directing its investments toward expanding production in the Benecke-Hornschuch Surface Group business unit in Asia, predominantly in China and India.
As at the end of 2018, Continental’s net indebtedness amounted to €1.7 billion. The first-time adoption of IFRS 16, Leases, will approxi-mately double net indebtedness as at January 1, 2019. In the future, we intend to continue strengthening the industrial business in par-ticular, in line with our objective of reducing our dependency on the automotive original equipment sector. The acquisition of fur-ther companies for this purpose has not been ruled out. Another focus will be the selective reinforcement of our technological exper-tise in future-oriented fields within the Automotive Group.
In 2019, we are planning on free cash flow of approximately €1.4 billion to €1.6 billion, before acquisitions and before the effects of transforming the Powertrain division into an independent group of legal entities. This year-on-year decline is due mainly to the mar-ket environment on an operational level. We also expect a portion of the warranty provisions recognized in 2018 to flow out.
The start to 2019 has so far confirmed our forecast for the full year. As anticipated, market conditions are proving very challeng-ing – particularly in China but also in Europe.
18
Consolidated Financial Statements
Statement of the Executive Board 109
Independent Auditor’s Report 110
Consolidated Statement of Income 115
Consolidated Statement of Comprehensive Income 116
Consolidated Statement of Financial Position 117
Consolidated Statement of Cash Flows 119
Consolidated Statement of Changes in Equity 120
Notes to the Consolidated Financial Statements 121 Segment Reporting 121General Information and Accounting Principles 128New Accounting Pronouncements 140Companies Consolidated and Information on Subsidiaries and Investments 144Acquisition and Disposal of Companies and Business Operations 145Notes to the Consolidated Statement of Income 147Notes to the Consolidated Statement of Financial Position 158Other Disclosures 200

Continental AG 2018 Annual Report Consolidated Financial Statements Statement of the Executive Board 109
The Executive Board of Continental AG is responsible for the prep-aration, completeness and integrity of the consolidated financial statements and the management report for the corporation and Continental AG, as well as for the other information provided in the annual report. The consolidated financial statements were pre-pared in accordance with International Financial Reporting Stan-dards (IFRS), as adopted by the EU, and include any necessary and appropriate estimates. The management report for the corporation and Continental AG contains an analysis of the earnings, financial and net assets position of the corporation, as well as further infor-mation provided in accordance with the provisions of the German Commercial Code (Handelsgesetzbuch – HGB).
An effective internal management and control system is employed to ensure that the information used for the preparation of the con-solidated financial statements, including the management report for the corporation and Continental AG, as well as for internal report-ing, is reliable. This includes standardized guidelines at corporation level for accounting and risk management in accordance with Sec-tion 91 (2) of the German Stock Corporation Act (Aktiengesetz – AktG) and an integrated financial control system as part of the cor-poration’s value-oriented management, plus audits by Corporate Audit. The Executive Board is thus in a position to identify significant risks at an early stage and to take countermeasures.
KPMG AG Wirtschaftsprüfungsgesellschaft, Hanover, Germany, was engaged as the auditor for fiscal 2018 by the Annual Shareholders’ Meeting of Continental AG. The audit mandate was issued by the Audit Committee of the Supervisory Board. KPMG audited the con-solidated financial statements prepared in accordance with IFRS and the management report for the corporation and Continental AG. The auditor will issue the independent auditor’s report.
The consolidated financial statements, the management report for the corporation and Continental AG, the auditor’s report and the risk management system in accordance with Section 91 (2) AktG are discussed in detail by the Audit Committee of the Supervisory Board together with the auditor. These documents relating to the annual financial statements and these reports will then be discussed with the entire Supervisory Board, also in the presence of the audi-tor, at the meeting of the Supervisory Board held to approve the financial statements.
Hanover, March 1, 2019
The Executive Board
Statement of the Executive Board

110 Continental AG 2018 Annual Report Consolidated Financial Statements Independent Auditor’s Report
To Continental Aktiengesellschaft, Hanover
Report on the Audit of the Consolidated Financial Statements and the Corporate Management Report
Opinions We have audited the consolidated financial statements of Continen-tal Aktiengesellschaft and its subsidiaries (the corporation), which comprise the Consolidated Statement of Financial Position as at De-cember 31, 2018, and the Consolidated Statement of Income, Con-solidated Comprehensive Income, the Consolidated Statement of Changes in Equity, and the Consolidated Statement of Cash Flows for the financial year from January 1, 2018, to December 31, 2018, and Notes to the Consolidated Financial Statements, including a summary of significant accounting policies. In addition, we have audited the Corporate Management Report of Continental Aktien-gesellschaft for the financial year from January 1, 2018, to Decem-ber 31, 2018. In line with the German legal regulations, we have not audited the content of the combined corporate non-financial statement, which is included in the corresponding section of the management report.
In our opinion, on the basis of the knowledge obtained in the audit,
› the accompanying consolidated financial statements comply, in all material respects, with IFRS as adopted by the EU and the ad-ditional requirements of German commercial law pursuant to Sec-tion 315e (1) of the German Commercial Code (Handelsgesetz-buch – HGB) and, in compliance with these requirements, give a true and fair view of the assets, liabilities and financial position of the corporation as at December 31, 2018, and of its financial per-formance for the financial year from January 1, 2018, to Decem-ber 31, 2018, and
› the accompanying Corporate Management Report as a whole provides an appropriate view of the corporation’s position. In all material respects, this Corporate Management Report is consistent with the consolidated financial statements, complies with German legal requirements and appropriately presents the opportunities and risks of future development.
Pursuant to Section 322 (3) sentence 1 HGB, we declare that our audit has not led to any reservations relating to the legal compliance of the consolidated financial statements and of the Corporate Man-agement Report.
Basis for the opinions We conducted our audit of the consolidated financial statements and of the Corporate Management Report in accordance with Sec-tion 317 HGB and the EU Audit Regulation No. 537/2014 (referred to subsequently as “EU Audit Regulation”) and in compliance with German Generally Accepted Standards for Financial Statement Au-dits promulgated by the Institut der Wirtschaftsprüfer (Institute of Public Auditors in Germany, IDW). Our responsibilities under those requirements and principles are further described in the “Auditor’s responsibilities for the audit of the consolidated financial statements
and of the Corporate Management Report” section of our auditor’s report. We are independent of the corporation’s entities in accor-dance with the requirements of European law and German com-mercial and professional law, and we have fulfilled our other Ger-man professional responsibilities in accordance with these require-ments. In addition, in accordance with Art. 10 (2) point (f) of the EU Audit Regulation, we declare that we have not provided non-audit services prohibited under Art. 5 (1) of the EU Audit Regulation. We believe that the evidence we have obtained is sufficient and appro-priate to provide a basis for our opinions on the consolidated finan-cial statements and on the Corporate Management Report.
Key audit matters in the audit of the consolidated financial statements Key audit matters are those matters that, in our professional judg-ment, were of most significance in our audit of the consolidated fi-nancial statements for the financial year from January 1, 2018, to December 31, 2018. These matters were addressed in the context of our audit of the consolidated financial statements as a whole and in forming our opinion thereon. We do not provide a separate opinion on these matters.
Recoverability of the carrying amount of goodwill The accounting policies as well as the assumptions made are dis-closed in Note 2 of the Notes to the Consolidated Financial State-ments. Disclosure of the amount of goodwill is provided in the Notes to the Consolidated Financial Statements in Note 13.
THE FINANCIAL STATEMENT RISK As at December 31, 2018, goodwill totaled €7,233 million, thus comprising a substantial portion of net assets at approximately 18%.
Goodwill is tested for impairment annually at the level of the cash-generating units. The carrying amount is thereby compared with the recoverable amount of the respective cash-generating unit. If the carrying amount exceeds the recoverable amount, an impair-ment is recorded. The recoverable amount is the higher of the fair value less costs to sell and value in use of the cash-generating unit. The impairment test was carried out as at November 30, 2018.
The goodwill impairment test is complex and is based on a number of judgmental assumptions. These include, among others, the ex-pected business and earnings development of the cash-generating units for the upcoming five years, the assumed long-term growth rates and the discount rate used.
On the basis of the impairment test carried out, the company has not identified any need to record an impairment. The company’s sensitivity analysis has shown that reasonably possible changes in the discount rate, in the long-term growth rate or in the sales in per-petuity would not lead to an impairment to the recoverable amount.
There is a risk for the financial statements that existing impairment as at the reporting date may not have been identified. In addition, there is a risk that the disclosures in the notes associated herewith may not be appropriate.
OUR AUDIT APPROACH With the support of our valuation specialists, we assessed, among other things, the appropriateness of the significant assumptions as
Independent Auditor’s Report

Continental AG 2018 Annual Report Consolidated Financial Statements Independent Auditor’s Report 111
well as the company’s valuation model. This included a discussion of the expected development of the business and results as well as of the assumed underlying long-term growth rates with those responsible for the planning process. Furthermore, reconciliations were made with the annual planning prepared by the Executive Board which was approved by the Supervisory Board and the long-term planning of which the Supervisory Board took note. We also assessed the consistency of the assumptions with external market expectations.
We also assessed the company’s planning accuracy by comparing projections for previous financial years with the actual results real-ized and analyzing deviations. Since small changes in the discount rate can have a substantial impact on the results of the impairment test, we compared the assumptions and parameters underlying the discount rate – the risk-free rate, the market risk premium and the beta factor – with own assumptions and publicly available infor-mation.
To ensure the calculative correctness of the valuation model utilized, we verified the company’s calculations on the basis of elements se-lected in a risk-oriented manner.
To reflect the existing uncertainty with respect to forecasts as well as the earlier valuation date for the impairment test, we assessed reasonably possible changes of the sales, the discount rate respec-tively EBIT margin on the recoverable amount (sensitivity analysis) by calculating alternative scenarios and comparing these with the company’s valuation results. The risk-oriented focal point of our analysis was on four cash-generating units, for which we performed detailed analyses.
Finally, we assessed whether the disclosures in the notes with re-spect to the recoverability of the carrying amount of the goodwill are appropriate.
OUR OBSERVATIONS The underlying valuation model used in the impairment test of good-will is appropriate and consistent with the applicable accounting principles.
The company’s assumptions and parameters underlying the valua-tion are within an acceptable bandwidth and are, on the whole, bal-anced.
The disclosures in the notes associated herewith are appropriate.
Accrual of sales by period in accordance with IFRS 15 The accounting policies as well as the assumptions made are dis-closed in the Notes to the Consolidated Financial Statements in Notes 2 and 6.
THE FINANCIAL STATEMENT RISK Corporate sales amounted to €44,404 million in the 2018 fiscal year.
Sales revenue is recognized when the entity satisfies a performance obligation by transferring a promised good or service to a customer. An asset is transferred when (or as) the customer obtains control of that asset. Based on the transfer of control, sales revenue shall be
recognized either at a point in time or over time at the amount at which there is expected to be a claim.
Based on the identification of the following criteria, it was deter-mined that the performance obligation will now be satisfied over time – rather than at a point in time according to IAS 18 – for por-tions of the sales revenue and that recognition of sales revenue will therefore be related to a time period:
› The customer simultaneously receives and consumes the bene-fits provided by the corporation’s performance as the corporation performs.
› The corporation’s performance does not create an asset with alternative use to the corporation and the corporation has an enforceable right to payment for performance completed to date, including an appropriate margin.
The transition effect resulting from the change to sales revenue recognition of €22 million as at January 1, 2018, including de-ferred taxes, was recognized in revenue reserves.
Due to the variety of different complex contractual agreements for the global corporation companies and the existing discretion when it comes to judging the criteria for assessing the timing of the trans-fer of control within the scope of the introduction of IFRS 15, there is a financial statement risk that sales revenue may be incorrectly accrued as at the reporting date.
OUR AUDIT APPROACH Given the introduction of IFRS 15, we made the assessment of the legal representatives’ interpretation of criteria for sales revenue recognition based on IFRS 15 a priority of our audit. We acknowl-edged the corresponding structure of the corporate-wide account-ing policies based on our knowledge of the transactions.
We assessed the appropriateness of significant judgments, such as the identification of distinct performance obligations, the existence of alternative use of the asset to the corporation, the existence of a legally enforceable right to payment including an appropriate mar-gin for services completed to date, the determination of the degree of progress and the assessment of the degree of performance prog-ress achieved, based on agreements selected in a risk-oriented manner.
OUR OBSERVATIONS The approach to accruing sales revenue based on IFRS 15 is appro-priate. The assumptions underlying the accounting are appropriate.
Measurement of the investment in OSRAM CONTINENTAL GmbH The accounting policies as well as the assumptions made are dis-closed in Note 2 of the Notes to the Consolidated Financial State-ments.
THE FINANCIAL STATEMENT RISK As part of the set-up of a new business partnership with OSRAM, parts of a business unit were transferred in capital reserves to the associate OSRAM CONTINENTAL GmbH on July 2, 2018, and a cash payment made. In addition, further parts of the same business

112 Continental AG 2018 Annual Report Consolidated Financial Statements Independent Auditor’s Report
unit were sold to the company and subsidiaries of OSRAM CONTI-NENTAL GmbH. A total carrying amount of €189 million and a pos-itive earnings effect of €184 million was reported on the acquisition date after intercompany profits were eliminated on a pro rata basis.
The cost of acquisition of the investment in the associate is based on the cash payment and the fair value of the parts of the business unit that were transferred. The sales price for the other parts of the business unit is also measured based on the fair value of these sold parts of the business unit. Continental enlisted an external assessor to assess the transferred and sold parts of the business unit and to determine and measure the identifiable assets acquired on a pro rata basis to continue the investment based on the equity method and the measurement of OSRAM CONTINENTAL GmbH.
The measurement of the investment in the associate is complex and based on discretionary assumptions by the Executive Board. The significant assumptions relate to sales planning and margin development for the business and costs of capital.
There is a risk for the consolidated financial statements that the measurement of the associate may be incorrect. In addition, there is a risk that the disclosures in the Notes to the Consolidated Finan-cial Statements may not be appropriate.
OUR AUDIT APPROACH With the support of our own measurement specialists, we assessed, among other things, the appropriateness of the significant assump-tions as well as the assessment and measurement methods. To do this, we initially obtained an understanding of the transaction on the basis of employee inquiries and an appraisal of the relevant agreements.
We assessed the expertise, capabilities and objectivity of the inde-pendent assessors engaged by Continental AG. We also acknowl-edged the process used to determine the assets acquired on a pro rata basis based on our knowledge of the OSRAM CONTINENTAL GmbH business model. We evaluated the measurement methods used to check that they were consistent with the accounting policies.
We discussed the expected sales and margin development with those responsible for the planning process. We also assessed the consistency of the assumptions with external market expectations. We compared the assumptions and parameters underlying the cost of capital – in particular the risk-free interest rate, the market risk premium and the beta factor – with own assumptions and data that is publicly available.
To assess calculative correctness, we verified selected calculations in a risk-oriented manner. We also assessed whether the disclosures in the notes are appropriate.
OUR OBSERVATIONS The underlying method used to measure the associate is appropri-ate and consistent with the applicable accounting policies. The presentation in the notes to the consolidated financial statements is appropriate.
Other information The Executive Board is responsible for the other information. The other information comprises:
› the combined corporate non-financial statement and
› the remaining parts of the annual report, with the exception of the audited consolidated financial statements and Corporate Management Report and our auditor’s report.
Our opinions on the consolidated financial statements and on the Corporate Management Report do not cover the other information, and consequently we do not express an opinion or any other form of assurance conclusion thereon.
In connection with our audit, our responsibility is to read the other information and, in so doing, to consider whether the other infor-mation
› is materially inconsistent with the consolidated financial statements, the Corporate Management Report or our knowledge obtained in the audit, or
› otherwise appears to be materially misstated.
In accordance with our engagement, we performed a separate op-erational audit of the combined corporate non-financial statement. The type, scope and results of this operational audit are disclosed in our unqualified audit opinion dated February 20, 2019.
Responsibilities of the Executive Board and the Supervisory Board for the consolidated financial statements and the Corporate Management Report The Executive Board is responsible for the preparation of the con-solidated financial statements that comply, in all material respects, with IFRS as adopted by the EU and the additional requirements of German commercial law pursuant to Section 315e (1) HGB and that the consolidated financial statements, in compliance with these requirements, give a true and fair view of the assets, liabilities, finan-cial position and financial performance of the corporation. In addi-tion, the Executive Board is responsible for internal controls that it deems necessary to enable the preparation of consolidated finan-cial statements that are free from material misstatement, whether due to fraud or error.
In preparing the consolidated financial statements, the Executive Board is responsible for assessing the corporation’s ability to con-tinue as a going concern. It also is responsible for disclosing, as ap-plicable, matters related to the going concern. In addition, the Exec-utive Board is responsible for financial reporting based on the go-ing concern basis of accounting unless there is an intention to liqui-date the corporation or to cease operations, or there is no realistic alternative but to do so.
Furthermore, the Executive Board is responsible for the preparation of the Corporate Management Report that, as a whole, provides an appropriate view of the corporation’s position and is, in all material respects, consistent with the consolidated financial statements, complies with German legal requirements and appropriately presents the opportunities and risks of future development. In addition, the

Continental AG 2018 Annual Report Consolidated Financial Statements Independent Auditor’s Report 113
Executive Board is responsible for arrangements and measures (systems) that it considers necessary to enable the preparation of the Corporate Management Report that is in accordance with the applicable German legal requirements and to be able to provide sufficient appropriate evidence for the assertions in the Corporate Management Report.
The Supervisory Board is responsible for overseeing the corpora-tion’s financial reporting process for the preparation of the consoli-dated financial statements and of the Corporate Management Re-port.
Auditor’s responsibilities for the audit of the consolidated financial statements and of the Corporate Management Report Our objectives are to obtain reasonable assurance about whether the consolidated financial statements as a whole are free from material misstatement, whether due to fraud or error, and whether the Corporate Management Report as a whole provides an appro-priate view of the corporation’s position and, in all material re-spects, is consistent with the consolidated financial statements and the knowledge obtained in the audit, complies with the German le-gal requirements, and appropriately presents the opportunities and risks of future development, as well as to issue an auditor’s report that includes our opinions on the consolidated financial statements and on the Corporate Management Report.
Reasonable assurance is a high level of assurance, but it is not a guarantee that an audit conducted in accordance with Section 317 HGB and the EU Audit Regulation and in compliance with German Generally Accepted Standards for Financial Statement Audits pro-mulgated by the Institut der Wirtschaftsprüfer (IDW) will always de-tect a material misstatement. Misstatements can arise from fraud or error and are considered material if, individually or in the aggre-gate, they could reasonably be expected to influence the economic decisions of users taken on the basis of these consolidated financial statements and this Corporate Management Report.
We exercise professional judgment and maintain professional skep-ticism throughout the audit. We also:
› Identify and assess the risks of material misstatement of the con-solidated financial statements and of the Corporate Management Report, whether due to fraud or error; design and perform audit procedures responsive to those risks; and obtain audit evidence that is sufficient and appropriate to provide a basis for our opin-ions. The risk of not detecting a material misstatement resulting from fraud is higher than for one resulting from error, as fraud may involve collusion, forgery, intentional omissions, misrepresen-tations or the override of internal control.
› Obtain an understanding of internal control relevant to the audit of the consolidated financial statements and of arrangements and measures (systems) relevant to the audit of the Corporate Management Report in order to design audit procedures that are appropriate in the circumstances, but not for the purpose of ex-pressing an opinion on the effectiveness of these systems.
› Evaluate the appropriateness of accounting policies used by the Executive Board and the reasonableness of estimates made by the Executive Board and related disclosures.
› Conclude on the appropriateness of the Executive Board’s use of the going concern basis of accounting and, based on the audit evidence obtained, whether a material uncertainty exists related to events or conditions that may cast significant doubt on the corporation’s ability to continue as a going concern. If we con-clude that a material uncertainty exists, we are required to draw attention in the auditor’s report to the related disclosures in the consolidated financial statements and in the Corporate Manage-ment Report or, if such disclosures are inadequate, to modify our respective opinions. Our conclusions are based on the audit evi-dence obtained up to the date of our auditor’s report. However, future events or conditions may cause the corporation to cease to be able to continue as a going concern.
› Evaluate the overall presentation, structure and content of the consolidated financial statements, including the disclosures, and whether the consolidated financial statements present the under-lying transactions and events in such a manner that the consoli-dated financial statements give a true and fair view of the assets, liabilities, financial position and financial performance of the cor-poration in compliance with IFRS as adopted by the EU and the additional requirements of German commercial law pursuant to Section 315e (1) HGB.
› Obtain sufficient appropriate audit evidence regarding the finan-cial information of the entities or business activities within the corporation to express opinions on the consolidated financial statements and on the Corporate Management Report. We are responsible for the direction, supervision and performance of the corporate audit. We remain solely responsible for our opinions.
› Evaluate the consistency of the Corporate Management Report with the consolidated financial statements, its conformity with German law and the view of the corporation’s position it provides.
› Perform audit procedures on the prospective information pre-sented by the Executive Board in the Corporate Management Report. On the basis of sufficient appropriate audit evidence we evaluate, in particular, the significant assumptions used by the Executive Board as a basis for the prospective information, and evaluate the proper derivation of the prospective information from these assumptions. We do not express a separate opinion on the prospective information and on the assumptions used as a basis. There is a substantial unavoidable risk that future events will differ materially from the prospective information.
We communicate with those charged with governance regarding, among other matters, the planned scope and timing of the audit and significant audit findings, including any significant deficiencies in internal control that we identify during our audit.
We also provide those charged with governance with a statement that we have complied with the relevant independence require-ments, and communicate with them all relationships and other matters that may reasonably be thought to bear on our indepen-dence, and where applicable, the related safeguards.

114 Continental AG 2018 Annual Report Consolidated Financial Statements Independent Auditor’s Report
From the matters communicated with those charged with gover-nance, we determine those matters that were of most significance in the audit of the consolidated financial statements of the current period and are therefore the key audit matters. We describe these matters in our auditor’s report unless law or regulation precludes public disclosure about the matter.
Other Legal and Regulatory Requirements
Further information pursuant to Art. 10 of the EU Audit Regulation We were elected as corporate auditor by the Annual Shareholders’ Meeting on April 27, 2018. We were engaged by the Supervisory Board on December 27, 2018. We have been the corporate auditor of Continental Aktiengesellschaft without interruption for more than 30 years.
We declare that the opinions expressed in this auditor’s report are consistent with the additional report to the audit committee pursu-ant to Art. 11 of the EU Audit Regulation (long-form audit report).
We have provided to the corporation’s entities the following services that are not disclosed in the consolidated financial statements or the Corporate Management Report:
In addition to the audit of the consolidated and annual financial statements as well as the review of the half-year financial statements
of Continental Aktiengesellschaft, we conducted various audits of financial statements as well as reviews of half-year financial state-ments of subsidiaries. Audit-related IT services, audits of various IT systems and IT processes as well as migration tests were carried out. We have also provided other attestation services, such as the granting of a comfort letter, and legal or contractual attestation ser-vices, such as audits according to the EEG, EMIR audits in accor-dance with Section 20 WpHG, the audit of the combined corporate non-financial statement and performance indicators regarding sus-tainability, the audit of transfer prices, the audit of the treasury management process, and audits of the use of funds. We have is-sued confirmations of compliance with contractual arrangements. Related to the first-time adoption of new accounting standards, such as IFRS 9, IFRS 15 and IFRS 16, we supported the implemen-tation of regulatory requirements in a quality-assured manner. Fur-thermore, workshops on accounting-related issues and tax issues were conducted. Tax advisory services provided by us also include support services in the preparation of tax returns and in tax audits, as well as income tax and sales tax advice on individual matters.
German public auditor responsible for the engagement The German public auditor responsible for the engagement is Dirk Papenberg.
Hanover, March 5, 2019
KPMG AG Wirtschaftsprüfungsgesellschaft
Ufer Papenberg Wirtschaftsprüfer Wirtschaftsprüfer

Continental AG 2018 Annual Report Consolidated Financial Statements Consolidated Statement of Income 115
Due to the application of the modified retrospective approach during the first-time adoption of IFRS 9, Financial Instruments, and IFRS 15, Revenue from Contracts with Customers, as at January 1, 2018, all the following figures from comparative periods are shown unadjusted.
€ millions See Note 2018 2017
Sales 44,404.4 44,009.5
Cost of sales –33,299.5 –32,635.0
Gross margin on sales 11,104.9 11,374.5
Research and development expenses1 7 –4,280.2 –3,103.7
Selling and logistics expenses –2,494.3 –2,430.2
Administrative expenses –1,149.0 –1,144.3
Other income1 8 1,803.4 584.5
Other expenses 8 –1,027.5 –796.6
Income from equity-accounted investees 10 69.6 76.8
Other income from investments 10 0.8 0.5
EBIT 4,027.7 4,561.5
Interest income 11 122.9 94.4
Interest expense 11 –276.2 –281.5
Effects from currency translation 11 –30.4 –138.8
Effects from changes in the fair value of derivative instruments, and other valuation effects 11 5.9 40.2
Financial result 11 –177.8 –285.7
Earnings before tax 3,849.9 4,275.8
Income tax expense 12 –891.6 –1,227.5
Net income 2,958.3 3,048.3
Non-controlling interests –61.0 –63.7
Net income attributable to the shareholders of the parent 2,897.3 2,984.6
Basic earnings per share in € 36 14.49 14.92
Diluted earnings per share in € 36 14.49 14.92
1 Please see the “Revenue from contracts with customers” section in Note 6 regarding the changes in these items resulting from the first-time adoption of new IFRS standards.
Consolidated Statement of Income

116 Continental AG 2018 Annual Report Consolidated Financial Statements Consolidated Statement of Comprehensive Income
€ millions 2018 2017
Net income 2,958.3 3,048.3
Reclassification within equity not affecting net income –0.3 —
Items that will not be reclassified to profit or loss
Remeasurement of defined benefit plans1 –105.7 64.1
Fair value adjustments1 –93.8 117.4
Reclassification from disposals of pension obligations 0.3 —
Investment in equity-accounted investees2 0.0 0.0
Currency translation1 –12.2 39.6
Tax on other comprehensive income n. a. –92.9
Other investments –3.9 —
Fair value adjustments1 –3.9 —
Tax on other comprehensive income 30.7 n. a.
Items that may be reclassified subsequently to profit or loss
Currency translation1 107.7 –641.6
Difference from currency translation1 103.0 –639.0
Reclassification adjustments to profit and loss 14.5 1.1
Investment in equity-accounted investees2 –9.8 –3.7
Available-for-sale financial assets n. a. 2.1
Fair value adjustments n. a. 3.9
Reclassification adjustments to profit and loss n. a. –1.8
Cash flow hedges –2.3 0.2
Fair value adjustments –24.9 63.3
Reclassification adjustments to profit and loss 22.6 –63.1
Investment in equity-accounted investees2 — 0.0
Tax on other comprehensive income 2.7 –21.2
Other comprehensive income 29.2 –596.4
Comprehensive income 2,987.2 2,451.9
Attributable to non-controlling interests –70.3 –42.1
Attributable to the shareholders of the parent 2,916.9 2,409.8
1 Including non-controlling interests. 2 Including taxes.
Consolidated Statement of Comprehensive Income

Continental AG 2018 Annual Report Consolidated Financial Statements Consolidated Statement of Financial Position 117
Assets
€ millions See Note Dec. 31, 2018 Dec. 31, 2017
Goodwill 13 7,233.4 7,010.1
Other intangible assets 13 1,566.3 1,607.3
Property, plant and equipment 14 12,375.5 11,202.1
Investment property 15 12.0 10.5
Investments in equity-accounted investees 16 644.9 414.8
Other investments 17 192.9 51.0
Deferred tax assets 18 1,464.4 1,517.2
Defined benefit assets 26 27.8 16.0
Long-term contract assets 6 0.1 n. a.
Long-term derivative instruments and interest-bearing investments 30 32.4 113.3
Long-term other financial assets 19 81.4 68.8
Long-term other assets 20 27.6 27.3
Non-current assets 23,658.7 22,038.4
Inventories 21 4,521.1 4,128.2
Trade accounts receivable 22 7,631.9 7,669.3
Short-term contract assets 6 67.4 n. a.
Short-term other financial assets1 19 320.7 297.0
Short-term other assets1 20 1,124.2 1,186.8
Income tax receivables 208.2 178.2
Short-term derivative instruments and interest-bearing investments 30 151.8 47.6
Cash and cash equivalents 23 2,761.4 1,881.5
Assets held for sale 24 — 13.5
Current assets 16,786.7 15,402.1
Total assets 40,445.4 37,440.5
1 From the 2018 reporting year, the presentation of financial assets is made more transparent by reclassifying deferred costs from the sale of customer tooling from short-term other financial assets to short-term other assets among these items of the statement of financial position. The figures from the comparative periods have been adjusted accordingly.
Consolidated Statement of Financial Position

118 Continental AG 2018 Annual Report Consolidated Financial Statements Consolidated Statement of Financial Position
Equity and liabilities
€ millions See Note Dec. 31, 2018 Dec. 31, 2017
Subscribed capital 512.0 512.0
Capital reserves 4,155.6 4,155.6
Retained earnings 15,697.2 13,669.3
Other comprehensive income –2,514.4 –2,508.5
Equity attributable to the shareholders of the parent 17,850.4 15,828.4
Non-controlling interests 482.9 461.9
Total equity 25 18,333.3 16,290.3
Long-term employee benefits 26 4,407.0 4,394.1
Deferred tax liabilities 18 315.7 348.5
Long-term provisions for other risks and obligations 27 163.7 139.6
Long-term indebtedness 29 1,449.0 2,017.8
Long-term other financial liabilities 31 38.4 36.1
Long-term contract liabilities 6 11.0 n. a.
Long-term other liabilities 33 13.4 25.4
Non-current liabilities 6,398.2 6,961.5
Short-term employee benefits 26 1,454.2 1,490.6
Trade accounts payable 32 7,293.0 6,798.5
Short-term contract liabilities 6 150.2 n. a.
Income tax payables 28 750.7 889.7
Short-term provisions for other risks and obligations 27 1,066.1 943.0
Short-term indebtedness 29 3,157.9 2,072.2
Short-term other financial liabilities 31 1,275.2 1,276.8
Short-term other liabilities 33 566.6 717.9
Current liabilities 15,713.9 14,188.7
Total equity and liabilities 40,445.4 37,440.5

Continental AG 2018 Annual Report Consolidated Financial Statements Consolidated Statement of Cash Flows 119
€ millions See Note 2018 2017
Net income 2,958.3 3,048.3
Income tax expense 12 891.6 1,227.5
Financial result 11 177.8 285.7
EBIT 4,027.7 4,561.5
Interest paid –115.5 –131.5
Interest received 36.7 26.1
Income tax paid 12, 28 –860.8 –1,122.1
Dividends received 45.0 40.7
Depreciation, amortization, impairment and reversal of impairment losses 8, 13, 14, 15 2,208.0 2,117.4
Income from equity-accounted investees and other investments, incl. impairment and reversal of impairment losses 10, 16 –70.4 –77.3
Gains/losses from the disposal of assets, companies and business operations –176.0 –34.6
Changes in
inventories 21 –358.4 –484.3
trade accounts receivable 22 38.3 –737.1
trade accounts payable 32 456.7 737.6
employee benefits and other provisions 26 –232.1 94.4
other assets and liabilities –22.0 229.7
Cash flow arising from operating activities 4,977.2 5,220.5
Cash flow from the disposal of property, plant and equipment, and intangible assets 13, 14 64.0 59.3
Capital expenditure on property, plant and equipment, and software 13, 14 –3,124.4 –2,849.7
Capital expenditure on intangible assets from development projects and miscellaneous 13 –161.0 –101.4
Cash flow from the disposal of companies and business operations 5 13.1 20.4
Acquisition of companies and business operations 5 –417.9 –596.3
Cash flow arising from investing activities –3,626.2 –3,467.7
Cash flow before financing activities (free cash flow) 1,351.0 1,752.8
Net cash change in short-term indebtedness 29 453.7 –879.0
Cash change in long-term indebtedness 29 13.9 –117.8
Other cash changes 23.7 14.1
Successive purchases –19.2 –0.7
Dividends paid –900.0 –850.0
Dividends paid to and cash changes from equity transactions with non-controlling interests –45.4 –46.5
Cash and cash equivalents arising from the first-time consolidation of subsidiaries 2.0 0.7
Cash flow arising from financing activities –471.3 –1,879.2
Change in cash and cash equivalents 879.7 –126.4
Cash and cash equivalents as at January 1 1,881.5 2,107.0
Effect of exchange-rate changes on cash and cash equivalents 0.2 –99.1
Cash and cash equivalents as at December 31 23 2,761.4 1,881.5
Consolidated Statement of Cash Flows
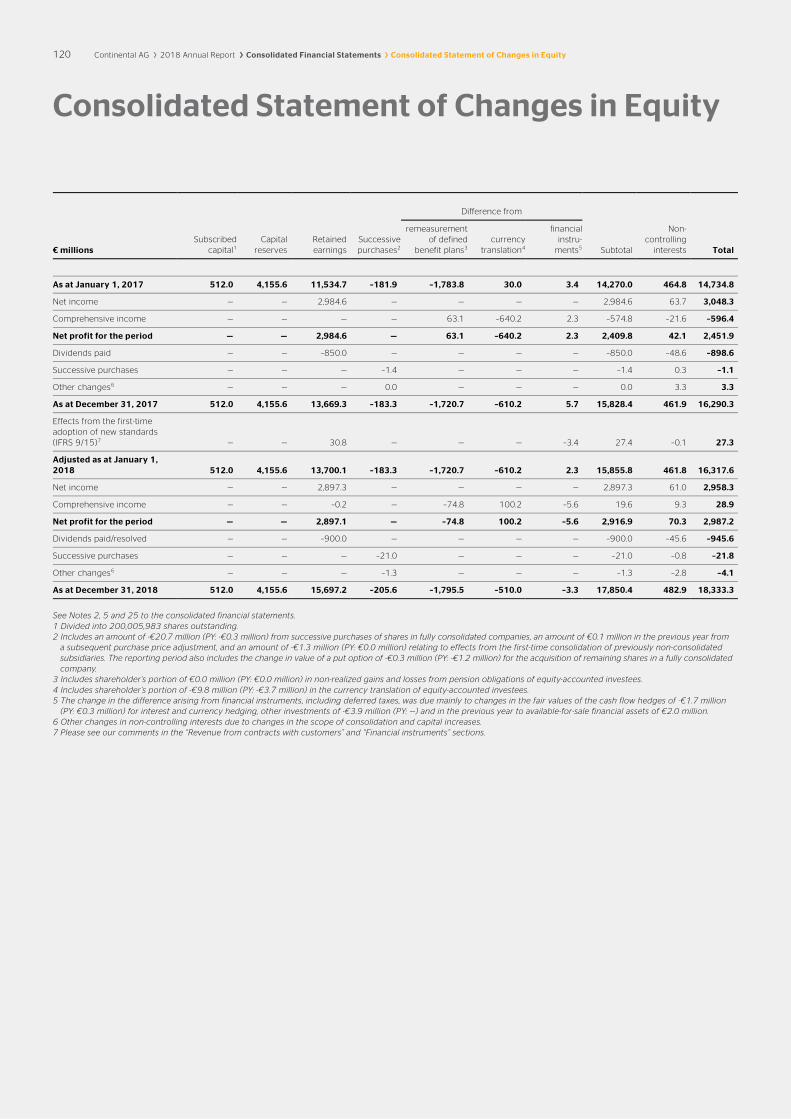
120 Continental AG 2018 Annual Report Consolidated Financial Statements Consolidated Statement of Changes in Equity
Difference from
€ millions Subscribed
capital1 Capital
reserves Retained earnings
Successive purchases2
remeasurement of defined
benefit plans3 currency
translation4
financial instru-
ments5 Subtotal
Non- controlling
interests Total
As at January 1, 2017 512.0 4,155.6 11,534.7 –181.9 –1,783.8 30.0 3.4 14,270.0 464.8 14,734.8
Net income — — 2,984.6 — — — — 2,984.6 63.7 3,048.3
Comprehensive income — — — — 63.1 –640.2 2.3 –574.8 –21.6 –596.4
Net profit for the period — — 2,984.6 — 63.1 –640.2 2.3 2,409.8 42.1 2,451.9
Dividends paid — — –850.0 — — — — –850.0 –48.6 –898.6
Successive purchases — — — –1.4 — — — –1.4 0.3 –1.1
Other changes6 — — — 0.0 — — — 0.0 3.3 3.3
As at December 31, 2017 512.0 4,155.6 13,669.3 –183.3 –1,720.7 –610.2 5.7 15,828.4 461.9 16,290.3
Effects from the first-time adoption of new standards (IFRS 9/15)7 — — 30.8 — — — –3.4 27.4 –0.1 27.3
Adjusted as at January 1, 2018 512.0 4,155.6 13,700.1 –183.3 –1,720.7 –610.2 2.3 15,855.8 461.8 16,317.6
Net income — — 2,897.3 — — — — 2,897.3 61.0 2,958.3
Comprehensive income — — –0.2 — –74.8 100.2 –5.6 19.6 9.3 28.9
Net profit for the period — — 2,897.1 — –74.8 100.2 –5.6 2,916.9 70.3 2,987.2
Dividends paid/resolved — — –900.0 — — — — –900.0 –45.6 –945.6
Successive purchases — — — –21.0 — — — –21.0 –0.8 –21.8
Other changes6 — — — –1.3 — — — –1.3 –2.8 –4.1
As at December 31, 2018 512.0 4,155.6 15,697.2 –205.6 –1,795.5 –510.0 –3.3 17,850.4 482.9 18,333.3
See Notes 2, 5 and 25 to the consolidated financial statements. 1 Divided into 200,005,983 shares outstanding. 2 Includes an amount of -€20.7 million (PY: -€0.3 million) from successive purchases of shares in fully consolidated companies, an amount of €0.1 million in the previous year from
a subsequent purchase price adjustment, and an amount of -€1.3 million (PY: €0.0 million) relating to effects from the first-time consolidation of previously non-consolidated subsidiaries. The reporting period also includes the change in value of a put option of -€0.3 million (PY: -€1.2 million) for the acquisition of remaining shares in a fully consolidated company.
3 Includes shareholder’s portion of €0.0 million (PY: €0.0 million) in non-realized gains and losses from pension obligations of equity-accounted investees. 4 Includes shareholder’s portion of -€9.8 million (PY: -€3.7 million) in the currency translation of equity-accounted investees. 5 The change in the difference arising from financial instruments, including deferred taxes, was due mainly to changes in the fair values of the cash flow hedges of -€1.7 million
(PY: €0.3 million) for interest and currency hedging, other investments of -€3.9 million (PY: —) and in the previous year to available-for-sale financial assets of €2.0 million. 6 Other changes in non-controlling interests due to changes in the scope of consolidation and capital increases. 7 Please see our comments in the “Revenue from contracts with customers” and “Financial instruments” sections.
Consolidated Statement of Changes in Equity

Continental AG 2018 Annual Report Consolidated Financial Statements Notes to the Consolidated Financial Statements 121
1. Segment Reporting
Notes to segment reporting In accordance with the provisions of IFRS 8, Operating Segments, Continental AG’s segment reporting is based on the management approach with regard to segment identification, under which infor-mation regularly provided to the chief operating decision maker for decision-making purposes is considered decisive.
Given the affinity of certain products, these have been combined as segments. This can mainly be seen in product requirements, market trends, customer groups and distribution channels.
The activities of the Continental Corporation are divided into the following segments:
Chassis & Safety develops, produces and markets intelligent sys-tems to improve driving safety and vehicle dynamics.
Powertrain combines innovative and efficient system solutions for the powertrains of today and tomorrow.
Interior specializes in information management. It develops and produces information, communication and network solutions and services for cars and commercial vehicles.
Tires is known for maximizing safety through short braking dis-tances and excellent grip as well as reducing fuel consumption by minimizing rolling resistance.
ContiTech develops, manufactures and markets functional parts, intelligent components and systems made of rubber, plastic, metal and fabric for machine and plant engineering, mining, agriculture, the automotive industry and other important sectors of the future.
Other/consolidation This comprises centrally managed subsidiaries and affiliates, such as holding, financing and insurance companies, as well as the hold-ing function of Continental AG and certain effects of consolidation. It also contains the effects on earnings of uncertain risks, particu-larly those in connection with contractual and similar claims or obli-gations representing, among other things, risks from investments that cannot currently be assigned to the individual operating units.
Internal control and reporting within the Continental Corporation are based on International Financial Reporting Standards (IFRS) as described in Note 2. The corporation measures the performance of its segments on the basis of their adjusted operating result (ad-
justed EBIT). Their performance is expressed as the return on sales (adjusted EBIT divided by adjusted sales) and as the return on capi-tal employed (ROCE), which represents EBIT as a percentage of av-erage operating assets. Intersegment sales and other proceeds are determined at arm’s length prices. For administrative services per-formed by centrally operated companies or by the corporation’s management, costs are calculated on an arm’s length basis in line with utilization. Where direct allocation is not possible, costs are assigned according to the services performed.
The segment assets comprise the operating assets of the assets side of the statement of financial position as at the end of the re-porting period. The segment liabilities show the operating asset parts on the liabilities side of the statement of financial position.
Capital expenditure relates to additions to property, plant and equip-ment, and software, as well as additions to capitalized finance leases and capitalized borrowing costs in line with IAS 23, Borrowing Costs. Depreciation and amortization include the scheduled diminution of and the impairment on intangible assets, property, plant and equip-ment, and investment properties as well as the impairment on good-will. This figure does not include impairment on financial investments.
Non-cash expenses/income mainly include the changes in provisions for pension liabilities – except for contributions to or withdrawals from the associated funds – and the profit or loss from impairment and reversal of impairment losses on the value of equity-accounted investees.
In the segment information broken down by country and region, sales are allocated on the basis of the domicile of the respective customers; in contrast, capital expenditure and segment assets are allocated on the basis of the domicile of the respective companies.
Viewed across all segments, Continental recorded sales totaling €6,295.8 million (PY: €6,179.9 million) with a group of companies under common control in the year under review.
In 2018, 20% (PY: 20%) of sales were generated in Germany. Other than this, there were no countries except the U.S.A. and China in which more than 10% of sales were achieved in the period under review, as was also the case in the previous year.
For information on the objectives, policies and processes for man-aging capital, please see the Corporate Management section of the Management Report.
Notes to the Consolidated Financial Statements

122 Continental AG 2018 Annual Report Consolidated Financial Statements Notes to the Consolidated Financial Statements
Segment report for 2018
€ millions Chassis & Safety Powertrain Interior Tires ContiTech Other/
consolidation Continental
Corporation
External sales 9,559.3 7,612.0 9,668.9 11,315.9 6,248.3 — 44,404.4
Intercompany sales 28.7 129.0 38.3 36.3 96.4 –328.7 —
Sales (total) 9,588.0 7,741.0 9,707.2 11,352.2 6,344.7 –328.7 44,404.4
EBIT (segment result) 782.5 119.8 988.1 1,882.1 396.2 –141.0 4,027.7
in % of sales 8.2 1.5 10.2 16.6 6.2 — 9.1
thereof income from equity-accounted investees 18.8 0.2 34.1 15.7 0.2 0.6 69.6
Capital expenditure1 749.7 691.0 578.4 837.1 250.2 18.0 3,124.4
in % of sales 7.8 8.9 6.0 7.4 3.9 — 7.0
Depreciation and amortization2 430.8 454.8 401.1 613.1 305.2 3.0 2,208.0
thereof impairment3 1.5 19.3 –1.6 1.2 0.3 0.0 20.7
Internally generated intangible assets 0.0 55.5 102.4 0.0 0.0 0.1 158.0
Significant non-cash expenses/income 4.5 –37.0 14.0 –2.2 –21.2 10.0 –31.9
Segment assets 7,700.1 5,830.5 8,389.4 9,089.6 4,391.8 76.4 35,477.8
thereof investments in equity-accounted investees 124.5 61.0 336.6 112.1 2.0 8.7 644.9
Segment liabilities 2,709.6 2,272.8 2,601.3 2,654.3 1,270.9 215.2 11,724.1
Operating assets as at December 31 4,990.5 3,557.7 5,788.1 6,435.3 3,120.9 –138.8 23,753.7
Operating assets (average) 4,887.1 3,582.2 5,626.3 6,471.2 3,146.9 –73.2 23,640.5
ROCE 16.0 3.3 17.6 29.1 12.6 — 17.0
Number of employees as at December 314 49,509 42,601 47,906 55,840 46,923 447 243,226
Adjusted sales5 9,586.6 7,741.0 9,693.3 11,304.9 6,251.9 –328.5 44,249.2
Adjusted operating result (adjusted EBIT)6 784.9 202.3 899.1 1,900.0 472.8 –141.0 4,118.1
in % of adjusted sales 8.2 2.6 9.3 16.8 7.6 — 9.3
1 Capital expenditure on property, plant and equipment, and software. 2 Excluding impairment on financial investments. 3 Impairment also includes necessary reversal of impairment losses. 4 Excluding trainees. 5 Before changes in the scope of consolidation. 6 Before amortization of intangible assets from purchase price allocation (PPA), changes in the scope of consolidation, and special effects.

Continental AG 2018 Annual Report Consolidated Financial Statements Notes to the Consolidated Financial Statements 123
Segment report for 2017
€ millions Chassis & Safety Powertrain Interior Tires ContiTech Other/
consolidation Continental
Corporation
External sales 9,743.7 7,535.8 9,276.4 11,303.4 6,150.2 — 44,009.5
Intercompany sales 24.1 125.1 28.8 22.4 96.2 –296.6 —
Sales (total) 9,767.8 7,660.9 9,305.2 11,325.8 6,246.4 –296.6 44,009.5
EBIT (segment result) 897.7 439.9 749.2 2,151.3 442.2 –118.8 4,561.5
in % of sales 9.2 5.7 8.1 19.0 7.1 — 10.4
thereof income from equity-accounted investees 22.2 4.7 30.5 18.5 0.1 0.8 76.8
Capital expenditure1 682.5 653.7 453.3 847.0 213.2 4.7 2,854.4
in % of sales 7.0 8.5 4.9 7.5 3.4 — 6.5
Depreciation and amortization2 403.9 414.9 390.8 597.4 308.7 1.7 2,117.4
thereof impairment3 0.5 18.6 18.2 0.5 2.4 — 40.2
Internally generated intangible assets — 51.8 40.2 — — 0.1 92.1
Significant non-cash expenses/income 9.7 –37.1 –4.2 3.4 –20.8 7.4 –41.6
Segment assets 7,350.9 5,430.1 7,669.4 8,432.1 4,342.8 32.0 33,257.3
thereof investments in equity-accounted investees 112.4 59.9 132.3 100.2 1.7 8.3 414.8
Segment liabilities 2,805.3 2,029.3 2,428.6 2,436.4 1,264.9 79.2 11,043.7
Operating assets as at December 31 4,545.6 3,400.8 5,240.8 5,995.7 3,077.9 –47.2 22,213.6
Operating assets (average) 4,519.6 3,325.6 5,028.9 6,143.0 3,182.1 –26.8 22,172.4
ROCE 19.9 13.2 14.9 35.0 13.9 — 20.6
Number of employees as at December 314 47,788 40,492 46,006 53,811 46,938 438 235,473
Adjusted sales5 9,767.8 7,660.9 9,286.1 11,325.8 6,234.4 –296.5 43,978.5
Adjusted operating result (adjusted EBIT)6 898.1 469.9 812.7 2,146.8 539.8 –118.8 4,748.5
in % of adjusted sales 9.2 6.1 8.8 19.0 8.7 — 10.8
1 Capital expenditure on property, plant and equipment, and software. 2 Excluding impairment on financial investments. 3 Impairment also includes necessary reversal of impairment losses. 4 Excluding trainees. 5 Before changes in the scope of consolidation. 6 Before amortization of intangible assets from purchase price allocation (PPA), changes in the scope of consolidation, and special effects.

124 Continental AG 2018 Annual Report Consolidated Financial Statements Notes to the Consolidated Financial Statements
Reconciliation of sales to adjusted sales and of EBITDA to adjusted operating result (adjusted EBIT) in 2018
€ millions Chassis & Safety Powertrain Interior Tires ContiTech Other/
consolidation Continental
Corporation
Sales 9,588.0 7,741.0 9,707.2 11,352.2 6,344.7 –328.7 44,404.4
Changes in the scope of consolidation1 –1.4 — –13.9 –47.3 –92.8 0.2 –155.2
Adjusted sales 9,586.6 7,741.0 9,693.3 11,304.9 6,251.9 –328.5 44,249.2
EBITDA 1,213.3 574.6 1,389.2 2,495.2 701.4 –138.0 6,235.7
Depreciation and amortization2 –430.8 –454.8 –401.1 –613.1 –305.2 –3.0 –2,208.0
EBIT 782.5 119.8 988.1 1,882.1 396.2 –141.0 4,027.7
Amortization of intangible assets from purchase price allocation (PPA) 0.0 11.4 51.1 19.3 91.2 — 173.0
Changes in the scope of consolidation1 –0.4 — 15.1 –2.6 –14.5 — –2.4
Special effects
Impairment3 1.5 16.0 1.2 1.2 0.1 — 20.0
Restructuring4 — 22.8 –3.0 — 0.2 — 20.0
Gains and losses from disposals of companies and business operations –3.0 — –154.8 0.0 –0.4 — –158.2
Other 4.3 32.3 1.4 — — — 38.0
Adjusted operating result (adjusted EBIT) 784.9 202.3 899.1 1,900.0 472.8 –141.0 4,118.1
Reconciliation of sales to adjusted sales and of EBITDA to adjusted operating result (adjusted EBIT) in 2017
€ millions Chassis & Safety Powertrain Interior Tires ContiTech Other/
consolidation Continental
Corporation
Sales 9,767.8 7,660.9 9,305.2 11,325.8 6,246.4 –296.6 44,009.5
Changes in the scope of consolidation1 — — –19.1 — –12.0 0.1 –31.0
Adjusted sales 9,767.8 7,660.9 9,286.1 11,325.8 6,234.4 –296.5 43,978.5
EBITDA 1,301.6 854.8 1,140.0 2,748.7 750.9 –117.1 6,678.9
Depreciation and amortization2 –403.9 –414.9 –390.8 –597.4 –308.7 –1.7 –2,117.4
EBIT 897.7 439.9 749.2 2,151.3 442.2 –118.8 4,561.5
Amortization of intangible assets from purchase price allocation (PPA) 0.0 11.9 46.1 19.5 93.2 — 170.7
Changes in the scope of consolidation1 — — 1.7 — 0.6 — 2.3
Special effects
Impairment3 0.5 18.8 23.0 0.5 2.4 — 45.2
Restructuring5 –0.1 –0.7 –5.4 –10.0 –0.2 — –16.4
Gains and losses from disposals of companies and business operations — — — –14.0 1.6 — –12.4
Other — — –1.9 –0.5 — — –2.4
Adjusted operating result (adjusted EBIT) 898.1 469.9 812.7 2,146.8 539.8 –118.8 4,748.5
1 Changes in the scope of consolidation include additions and disposals as part of share and asset deals. Adjustments were made for additions in the reporting year and for disposals in the comparative period of the prior year.
2 Excluding impairment on financial investments. 3 Impairment also includes necessary reversal of impairment losses. This item does not include impairment that arose in connection with a restructuring and impairment on financial
investments. 4 This includes impairment losses totaling €3.5 million (Powertrain €3.3 million; ContiTech €0.2 million) and a reversal of impairment losses of €2.8 million in the Interior division. 5 This includes reversal of impairment losses totaling €5.0 million (Powertrain €0.2 million; Interior €4.8 million).

Continental AG 2018 Annual Report Consolidated Financial Statements Notes to the Consolidated Financial Statements 125
Reconciliation of EBIT to net income
€ millions 2018 2017
Chassis & Safety 782.5 897.7
Powertrain 119.8 439.9
Interior 988.1 749.2
Tires 1,882.1 2,151.3
ContiTech 396.2 442.2
Other/consolidation –141.0 –118.8
EBIT 4,027.7 4,561.5
Financial result –177.8 –285.7
Earnings before tax 3,849.9 4,275.8
Income tax expense –891.6 –1,227.5
Net income 2,958.3 3,048.3
Non-controlling interests –61.0 –63.7
Net income attributable to the shareholders of the parent 2,897.3 2,984.6
Segment report by region
€ millions Germany
Europe excluding Germany North America Asia
Other countries
Continental Corporation
External sales 2018 8,826.8 13,046.1 10,975.1 9,888.7 1,667.7 44,404.4
External sales 2017 8,927.2 12,839.0 10,823.2 9,618.5 1,801.6 44,009.5
Capital expenditure 20181 775.1 925.6 594.1 771.9 57.7 3,124.4
Capital expenditure 20171 690.5 818.7 589.0 685.3 70.9 2,854.4
Segment assets as at December 31, 2018 11,231.8 8,702.0 7,707.2 7,241.0 595.8 35,477.8
Segment assets as at December 31, 2017 10,717.3 8,298.2 6,944.9 6,627.9 669.0 33,257.3
Number of employees as at December 31, 20182 63,396 76,576 44,887 48,499 9,868 243,226
Number of employees as at December 31, 20172 61,029 75,186 43,585 45,683 9,990 235,473
1 Capital expenditure on property, plant and equipment, and software. 2 Excluding trainees.
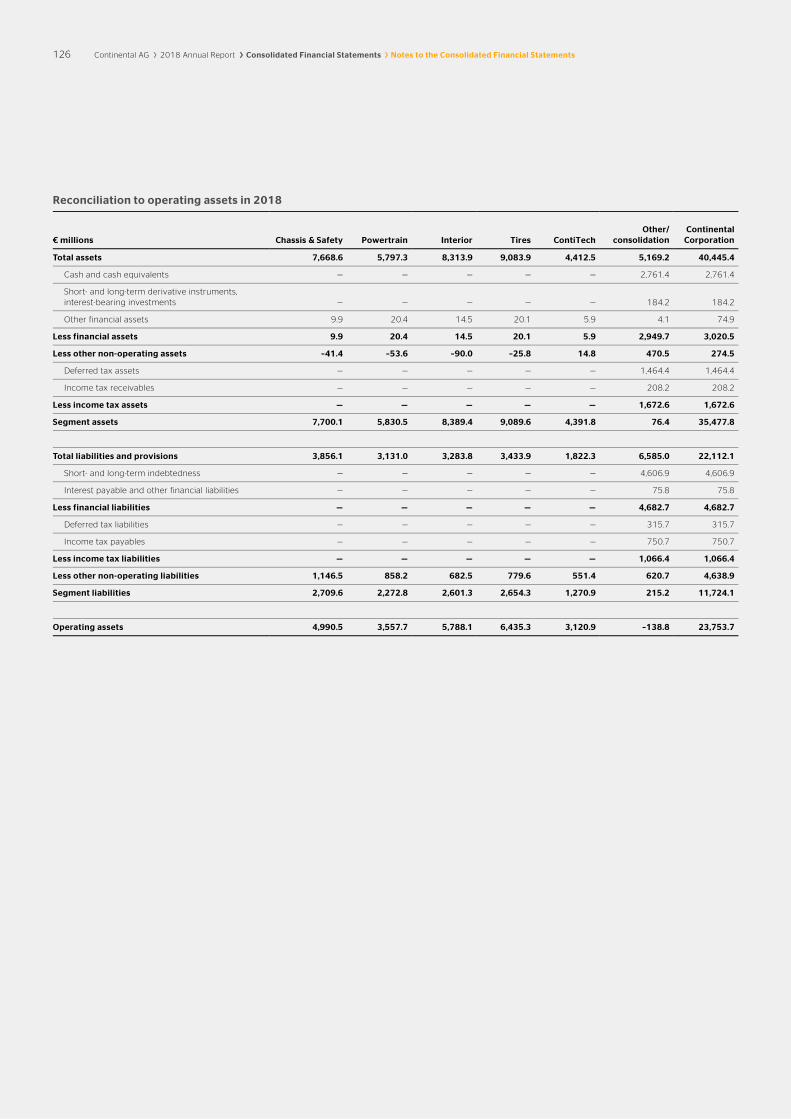
126 Continental AG 2018 Annual Report Consolidated Financial Statements Notes to the Consolidated Financial Statements
Reconciliation to operating assets in 2018
€ millions Chassis & Safety Powertrain Interior Tires ContiTech Other/
consolidation Continental
Corporation
Total assets 7,668.6 5,797.3 8,313.9 9,083.9 4,412.5 5,169.2 40,445.4
Cash and cash equivalents — — — — — 2,761.4 2,761.4
Short- and long-term derivative instruments, interest-bearing investments — — — — — 184.2 184.2
Other financial assets 9.9 20.4 14.5 20.1 5.9 4.1 74.9
Less financial assets 9.9 20.4 14.5 20.1 5.9 2,949.7 3,020.5
Less other non-operating assets –41.4 –53.6 –90.0 –25.8 14.8 470.5 274.5
Deferred tax assets — — — — — 1,464.4 1,464.4
Income tax receivables — — — — — 208.2 208.2
Less income tax assets — — — — — 1,672.6 1,672.6
Segment assets 7,700.1 5,830.5 8,389.4 9,089.6 4,391.8 76.4 35,477.8
Total liabilities and provisions 3,856.1 3,131.0 3,283.8 3,433.9 1,822.3 6,585.0 22,112.1
Short- and long-term indebtedness — — — — — 4,606.9 4,606.9
Interest payable and other financial liabilities — — — — — 75.8 75.8
Less financial liabilities — — — — — 4,682.7 4,682.7
Deferred tax liabilities — — — — — 315.7 315.7
Income tax payables — — — — — 750.7 750.7
Less income tax liabilities — — — — — 1,066.4 1,066.4
Less other non-operating liabilities 1,146.5 858.2 682.5 779.6 551.4 620.7 4,638.9
Segment liabilities 2,709.6 2,272.8 2,601.3 2,654.3 1,270.9 215.2 11,724.1
Operating assets 4,990.5 3,557.7 5,788.1 6,435.3 3,120.9 –138.8 23,753.7

Continental AG 2018 Annual Report Consolidated Financial Statements Notes to the Consolidated Financial Statements 127
Reconciliation to operating assets in 2017
€ millions Chassis & Safety Powertrain Interior Tires ContiTech Other/
consolidation Continental
Corporation
Total assets 7,330.8 5,413.4 7,619.0 8,421.1 4,348.0 4,308.2 37,440.5
Cash and cash equivalents — — — — — 1,881.5 1,881.5
Short- and long-term derivative instruments, interest-bearing investments — — — — — 160.9 160.9
Other financial assets 10.0 39.4 18.7 23.3 6.6 2.9 100.9
Less financial assets 10.0 39.4 18.7 23.3 6.6 2,045.3 2,143.3
Less other non-operating assets –30.1 –56.1 –69.1 –34.3 –1.4 535.5 344.5
Deferred tax assets — — — — — 1,517.2 1,517.2
Income tax receivables — — — — — 178.2 178.2
Less income tax assets — — — — — 1,695.4 1,695.4
Segment assets 7,350.9 5,430.1 7,669.4 8,432.1 4,342.8 32.0 33,257.3
Total liabilities and provisions 4,003.1 2,835.8 3,083.3 3,315.4 1,797.7 6,114.9 21,150.2
Short- and long-term indebtedness — — — — — 4,090.0 4,090.0
Interest payable and other financial liabilities — — — — — 81.8 81.8
Less financial liabilities — — — — — 4,171.8 4,171.8
Deferred tax liabilities — — — — — 348.5 348.5
Income tax payables — — — — — 889.7 889.7
Less income tax liabilities — — — — — 1,238.2 1,238.2
Less other non-operating liabilities 1,197.8 806.5 654.7 879.0 532.8 625.7 4,696.5
Segment liabilities 2,805.3 2,029.3 2,428.6 2,436.4 1,264.9 79.2 11,043.7
Operating assets 4,545.6 3,400.8 5,240.8 5,995.7 3,077.9 –47.2 22,213.6

128 Continental AG 2018 Annual Report Consolidated Financial Statements Notes to the Consolidated Financial Statements
2. General Information and Accounting Principles
Continental Aktiengesellschaft (Continental AG), whose registered office is Vahrenwalder Strasse 9, Hanover, Germany, is the parent company of the Continental Corporation and a listed stock corpora-tion. It is registered in the commercial register (HR B No. 3527) of the Hanover Local Court (Amtsgericht). Continental AG is a supplier to the automotive industry, with worldwide operations. The areas of business and main activities in which Continental AG is engaged are described in more detail in the Segment Reporting section. By way of resolution of the Executive Board of March 1, 2019, the consolidated financial statements of Continental AG for fiscal 2018 were approved and will be submitted to the German Federal Gazette (Bundesanzeiger) and published there. Continental AG is included in the consolidated financial statements of INA-Holding Schaeffler GmbH & Co. KG, Herzogenaurach, Germany, which is published in the German Federal Gazette.
The consolidated financial statements of Continental AG as at December 31, 2018, have been prepared under International Financial Reporting Standards (IFRS) as adopted by the European Union, in accordance with EU Regulation (EC) No. 1606/2002 in conjunction with Section 315e (1) of the German Commercial Code (Handelsgesetzbuch – HGB). The term IFRS also includes the International Accounting Standards (IAS) and the interpretations issued by the International Financial Reporting Standards Interpre-tations Committee or its predecessor the International Financial Reporting Interpretations Committee (IFRIC) and the former Stand-ing Interpretations Committee (SIC). All International Financial Reporting Standards mandatory for fiscal 2018 have been applied, subject to endorsement by the European Union.
The consolidated financial statements were prepared on the basis of historical cost, with the exception of certain financial assets and liabilities (including derivative instruments), which are measured at fair value; asset held for sale, which are measured at fair value less costs to sell; and defined benefit pension plans, for which the plan assets are measured at fair value.
The annual financial statements of companies included in the corporation have been prepared using accounting principles con-sistently applied throughout the corporation, in accordance with IFRS 10, Consolidated Financial Statements. The end of the report-ing period for the subsidiary financial statements is the same as the end of the reporting period for the consolidated financial statements.
The first-time adoption of IFRS 9, Financial Instruments, and IFRS 15, Revenue from Contracts with Customers, affected the reporting period.
The consolidated financial statements have been prepared in euros. Unless otherwise stated, all amounts are shown in millions of euros. Please note that differences may arise as a result of the use of rounded amounts and percentages.
Companies consolidated All major subsidiaries that Continental AG controls in accordance with the provisions of IFRS 10 have been included in the consoli-dated financial statements and fully consolidated. To meet this defi-nition, Continental AG must have the decision-making power to control the relevant activities and a right to variable returns from the associated company. Furthermore, it must be able to use its decision-making power to determine the amount of these returns. The companies consolidated may therefore also include companies that are controlled by Continental AG irrespective of the share of voting rights by way of other substantial rights such as contractual agreements, as is the case with structured units included in the consolidated financial statements.
The consolidation of subsidiaries is based on the purchase method by offsetting the acquisition cost against the proportion of net assets attributed to the parent company at fair value at the date of acqui-sition. Intangible assets not previously recognized in the separate financial statements of the acquired company are carried at fair value. Intangible assets identified in the course of a business com-bination – including, for example, brand names, patents, technology, customer relationships and order backlogs – are recognized sepa-rately at the date of acquisition only if the requirements under IAS 38, Intangible Assets, for an intangible asset are met. Measure-ment at the time of acquisition is usually provisional only. Increases or reductions of assets and liabilities that become necessary within 12 months after the acquisition are adjusted retrospectively to the date of acquisition accordingly. Significant adjustments are presented in the notes to the financial statements.
Any positive remaining amount is capitalized as goodwill. The share of non-controlling interests is measured using the pro rata (remeas-ured) net assets of the subsidiary. In order to ensure the recover-ability of goodwill arising from an as yet incomplete measurement and the corresponding purchase price allocation, the goodwill is al-located provisionally to the affected business units as at the end of the reporting period. This provisional allocation can deviate signifi-cantly from the final allocation. Any negative difference that arises is recognized in other income after the fair value of the acquired assets and liabilities has again been reviewed.
Non-controlling interests in the net assets of subsidiaries that are not attributable to the corporation are shown under “non-controlling interests” as a separate component of total equity.
Once control has been obtained, any differences arising from suc-cessive purchases of shares from non-controlling interests between the purchase price and the carrying amount of those non-controlling interests are recognized in other comprehensive income.
Where there are successive purchases of shares resulting in control, the difference between the carrying amount and the fair value at the time of first-time consolidation for those shares already held is recognized in profit and loss under other income and expenses.

Continental AG 2018 Annual Report Consolidated Financial Statements Notes to the Consolidated Financial Statements 129
Significant investments where Continental AG can exert significant influence on the associated companies (associates) are accounted for using the equity method. The carrying amount of these associ-ates is adjusted to reflect the share in the associates’ net equity. If the annual financial statements of the associates are not available, the pro rata earnings or losses are recognized as necessary based on estimated amounts. Goodwill arising from first-time consolida-tion is reported using the equity method. Goodwill is not amortized but the carrying amount of investments in associates consolidated using the equity method is tested for impairment if there are rele-vant indications.
Companies that are dormant or have only a low level of business activity and therefore no significant impact on the earnings, financial and net assets position of the Continental Corporation are not in-cluded in the consolidated financial statements. These are accounted for as other investments at fair value (FVOCI).
Intercompany receivables and liabilities, in addition to income and expenses, are eliminated on consolidation. Intercompany profits arising from internal transactions and dividend payments made within the corporation are eliminated on consolidation. Deferred taxes on the elimination of intercompany transactions are carried in the amount derived from the average income tax rate for the corporation.
Currency translation The assets and liabilities of foreign subsidiaries with a functional currency other than the euro are translated into euros at the year-end middle rates (closing rate). The statement of comprehensive income is translated at the average exchange rates for the year. Differences resulting from currency translation are recognized in the difference from currency translation in equity until the disposal of the subsidiary, without recognizing deferred taxes.
In the separate financial statements of Continental AG and its sub-sidiaries, foreign-currency receivables and liabilities are measured on recognition at the transaction rate and adjusted at the end of the reporting period to the related spot rates. Gains and losses aris-ing on currency translation are recognized in profit or loss, except for certain loans. Exchange-rate adjustments relating to the transla-tion of intercompany financing made in the functional currency of one of the parties are recognized in the difference from currency translation in equity if repayment of these intercompany loans is not expected in the foreseeable future.
Goodwill is recognized directly as an asset of the subsidiary acquired and therefore also translated into euros for subsidiaries whose functional currencies are not the euro at the end of the reporting period using the middle rate (closing rate). Differences resulting from currency translation are recognized in the difference from currency translation in equity.
The following table summarizes the exchange rates used in currency translation that had a material effect on the consolidated financial statements:
Currencies Closing rate Average rate for the year
€1 in Dec. 31, 2018 Dec. 31, 2017 2018 2017
Brazil BRL 4.44 3.97 4.31 3.61
Switzerland CHF 1.13 1.17 1.16 1.11
China CNY 7.88 7.80 7.80 7.63
Czechia CZK 25.71 25.56 25.64 26.33
United Kingdom GBP 0.90 0.89 0.88 0.88
Hungary HUF 321.05 310.45 318.74 309.30
Japan JPY 126.02 134.83 130.43 126.67
South Korea KRW 1,276.08 1,277.29 1,299.44 1,275.94
Mexico MXN 22.49 23.60 22.71 21.34
Malaysia MYR 4.73 4.86 4.76 4.85
Philippines PHP 60.11 59.69 62.26 56.95
Romania RON 4.67 4.66 4.65 4.57
U.S.A. USD 1.14 1.20 1.18 1.13
South Africa ZAR 16.47 14.74 15.60 15.05

130 Continental AG 2018 Annual Report Consolidated Financial Statements Notes to the Consolidated Financial Statements
Revenue recognition Only sales of products and services resulting from the ordinary business activities of the company are shown as revenue.
In accordance with IFRS 15, Continental recognizes the amount as revenue from contracts with customers, which is received for the transfer of promised goods or services to customers in exchange for those goods or services. The relevant point in time or period of time is the transfer of control of the goods or services (control approach).
To determine when to recognize revenue and at what amount, the five-step model has to be applied. By applying the five-step model in the Continental Corporation for contracts with customers, distinct performance obligations are identified. The transaction price is determined – and allocated to the performance obligations – accor-ding to the requirements of IFRS 15. Variable consideration in con-tracts with customers, such as rebates, bonus agreements or other kinds of price concessions, is analyzed, measured and included in the revenue recognition. The allocation of the transaction price in the case of more than one performance obligation at hand would be performed by using observable prices if possible. Otherwise the allocation would be performed using the adjusted market assess-ment approach or the approach of cost plus a margin. For every performance obligation that, in accordance with IFRS 15, is distinct within the context of the contract, the revenue recognition is deter-mined to be at a point in time or to be satisfied over time.
Multi-component contracts that contain distinct performance obligations with different timing of revenue recognition are not currently material.
Research and development expenses Research and development expenses comprise expenditure on re-search and development and expenses for customer-specific appli-cations, prototypes and testing. If research and development ex-penses are planned, these costs are recognized in inventories until control is transferred. When control is transferred, they are stated under other income. In addition, the expenses are reduced by the amount relating to the application of research results from the de-velopment of new or substantially improved products, if the related activity fulfills the recognition criteria for internally generated intan-gible assets set out in IAS 38. This portion of the expenses is capi-talized as an asset and amortized over a period of three to seven years from the date that the developed products become market-able. However, expenses for customer-specific applications, pre- production prototypes or tests for products already being marketed (application engineering) do not qualify as development expendi-ture which may be recognized as an intangible asset. Furthermore, expenses incurred directly in connection with the launch of new production operations and plants are recognized directly in profit or loss.
New developments for the original equipment business are not marketable until Continental AG has been nominated as the sup-plier for the particular vehicle platform or model and, furthermore, has successfully fulfilled pre-production release stages. Moreover, these release stages serve as the prerequisite to demonstrate the technical feasibility of the product, especially given the high de-mands imposed on comfort and safety technology. Accordingly, development costs are recognized as an asset only as at the date of nomination as supplier and upon fulfillment of a specific pre- production release stage. The development is considered to be completed once the final approval for the unlimited production is granted. Only very few development projects fulfill the recognition criteria.
Although suppliers are nominated by original equipment manufac-turers with the general obligation to supply products over the entire life of the particular model or platform, these supply agreements constitute neither long-term contracts nor firm commitments, in particular because the original equipment manufacturers make no commitments in regard of the purchase quantities. For this reason, all pre-production expenses – with the exception of the capitalized development costs as previously described – are recognized imme-diately in profit or loss.
Product-related expenses Costs for advertising, sales promotion and other sales-related items are expensed as incurred. Provisions are recognized for probable warranty claims on sold products on the basis of past experience, as well as legal and contractual terms. Additional provisions are recognized for specific known cases.
Financial result and investment income Interest income and expenses are recognized for the period to which they relate. Distributions are recognized at the time of payment.
Dividends receivable are recognized upon the legal entitlement to payment.
Earnings per share Basic earnings per share are calculated on the basis of the weighted average number of shares outstanding. Treasury stock is deducted for the period it is held. Diluted earnings per share also include shares from the potential exercise of option or conversion rights. The cor-responding expenses that would no longer be incurred after the conversion or exchange are eliminated.
Continental AG 2018 Annual Report Consolidated Financial Statements Notes to the Consolidated Financial Statements 131
Statement of financial position classification Assets and liabilities are reported as non-current assets and liabilities in the statement of financial position if they have a remaining term of over one year and, conversely, as current assets and liabilities if the remaining term is shorter. Liabilities are treated as current if there is no unconditional right to defer settlement of the liability for at least 12 months after the end of the reporting period. Provisions for pensions and other post-employment benefits, other employee benefits, as well as deferred tax assets and liabilities are accounted for as non-current. If assets and liabilities have both current and non-current portions, the amounts are classified separately and shown as current and non-current assets or liabilities.
Goodwill Goodwill corresponds to the difference between the purchase cost and the fair value of the acquired assets and liabilities of the business combination. Goodwill is not subject to amortization; it is tested for impairment at least annually and, if necessary, impaired.
Intangible assets Purchased intangible assets are carried at acquisition costs and in-ternally generated intangible assets at their production costs, pro-vided that the conditions for recognition of an internally generated intangible asset are met in accordance with IAS 38. If intangible assets have finite useful lives, they are amortized on a straight-line basis over a useful life of three to eight years in general. Intangible assets with indefinite useful lives are tested at least annually for impairment and, if necessary, impaired.
Property, plant and equipment Property, plant and equipment is carried at cost less straight-line depreciation. If necessary, additional impairment is recognized on the affected items.
Production cost consists of the direct costs and attributable mate-rial and manufacturing overheads, including depreciation.
Under certain conditions, portions of the borrowing costs are capi-talized as part of the acquisition cost. This also applies to finance leases and investment property.
As soon as an asset is available for its intended use, subsequent cost is capitalized only to the extent the related modification changes the function of the asset or increases its economic value and the cost can be clearly identified. All other subsequent expenditure is recognized as current maintenance expense.
Property, plant and equipment is broken down into the lowest level of the components that have significantly different useful lives and, to the extent integrated in other assets, when they are likely to be replaced or overhauled during the overall life of the related main asset. Maintenance and repair costs are recognized in profit or loss as incurred. The corporation has no property, plant or equipment that by the nature of its operation and deployment can be repaired and serviced only in intervals over several years. The useful lives are up to 25 years for buildings and land improvements; up to 20 years for technical equipment and machinery; and up to 12 years for operating and office equipment.
Government grants Government grants are reported if there is reasonable assurance that the conditions in place in connection with the grants will be fulfilled and that the grants will be awarded.
Monetary government grants that are directly attributable to depre-ciable fixed assets are deducted from the cost of the assets in ques-tion. All other monetary grants are recognized as income in line with planning and are presented alongside the corresponding expenses. Non-monetary government grants are recognized at fair value.
Investment property Land and buildings held for the purpose of generating rental in-come instead of production or administrative purposes are carried at depreciated cost. Depreciation is charged on a straight-line basis over the useful lives, which correspond to those for real estate in use by the company.
Leases Continental leases property, plant and equipment, especially build-ings. If the substantial risks and rewards from the use of the leased asset are controlled by Continental, the agreement is treated as a finance lease and an asset and related financial liability are recog-nized. In the case of an operating lease, where the economic own-ership remains with the lessor, only the lease payments are recog-nized as incurred and charged to income. Other arrangements, particularly service contracts, are also treated as leases to the ex-tent they require the use of a particular asset to fulfill the arrange-ment and the arrangement conveys a right to control the use of the asset.

132 Continental AG 2018 Annual Report Consolidated Financial Statements Notes to the Consolidated Financial Statements
Impairment The corporation immediately reviews intangible assets and prop-erty, plant and equipment, investment property and goodwill as soon as there is an indication of impairment (triggering event). Im-pairment is assessed by comparing the carrying amount with the recoverable amount. The recoverable amount is the higher of the fair value less cost of disposal and the present value of the expected future cash flows from the continued use of the asset (value in use). If the carrying amount is higher than the recoverable amount, the difference is recognized as impairment. If the indications for the prior recognition of impairment no longer apply, the impairment losses are reversed for intangible assets, property, plant and equip-ment, and investment property.
Capitalized goodwill is tested for impairment once per year as at November 30 at the level of cash-generating units (CGUs). CGUs are units that come below the segments and are the smallest iden-tifiable group of assets that generates cash inflows that are largely independent of the cash inflows from other assets or groups of assets. This represents the lowest level at which goodwill is moni-tored for internal management purposes. The impairment test is performed by comparing the carrying amount of the business unit including its goodwill and the recoverable amount of this business unit. The recoverable amount in this case is the value in use calcu-lated on the basis of discounted cash flows before interest and tax. Impairment is recognized to the extent the carrying amount exceeds the recoverable amount for a business unit. If the reasons for this cease to apply in future, impairment losses on goodwill are not reversed.
The expected cash flows for the business units are derived from long-term planning that covers the next five years and is approved by the management. The plans are based in particular on assump-tions for macroeconomic developments, as well as trends in sales prices, raw materials prices and exchange rates. In addition to these current market forecasts, past developments and experience are also taken into account. The perpetuity beyond the period of five years is extrapolated using the expected long-term growth rates for the individual business units. For the two cash-generating units High Voltage Power Applications and Low Voltage & Control Unit Applications of the Hybrid Electric Vehicle (HEV) business unit, a detailed model with long-term detailed planning was used as a basis due to the specific situation of a startup.
The main assumptions when calculating the value in use of a CGU are the free cash flows, the discount rate and its parameters, and the long-term growth rate.
Annual impairment testing was performed on the basis of the bot-tom-up business plan for the next five years approved by manage-ment in the period under review. In the year under review, for the CGUs of the Automotive Group, the cash flows were discounted with an interest rate before tax of 10.7% (PY: 11.3%); for the Rubber Group the interest rate was 9.8% (PY: 9.6%). These two pre-tax WACCs are based on the capital structure of the respective relevant peer group on average over the last five years. The risk-free interest rate is 1.1% (PY: 1.2%) and the market risk premium 6.75% (PY: 6.50%) in both cases. Borrowing costs were calculated as the total of the risk-free interest rate plus the credit spreads of peer group companies rated by Standard & Poor’s, Moody’s or Fitch. The sources of this infor-mation were data from Bloomberg.
The long-term growth rate for the CGUs of the Interior, Chassis & Safety and Powertrain segments was 1.5% in the year under review (PY: 1.5%). For the CGUs of the Tire and ContiTech segments, the long-term growth rate was 0.5% (PY: 0.5%). These growth rates do not exceed the long-term average growth rates for the fields of business in which the CGUs operate.
The annual impairment testing of goodwill determined no require-ments for impairment for 2018.
Assuming a 0.5 percentage point increase in the discount rate to 11.2% before tax for the Automotive Group and 10.3% before tax for the Rubber Group would not result in goodwill impairment. There would be no asset impairment. Reducing long-term growth rates by 0.5 percentage points would not have resulted in goodwill impairment. There would be no asset impairment. If sales in perpe-tuity would decline by 5.0%, consequently reducing free cash flow as a key planning parameter, this would not result in goodwill im-pairment. There would be no asset impairment.

Continental AG 2018 Annual Report Consolidated Financial Statements Notes to the Consolidated Financial Statements 133
Assets held for sale and related liabilities Individual non-current assets or a group of non-current assets and related liabilities are classified separately as held for sale in the statement of financial position if their disposal has been resolved and is probable. Assets held for sale are recognized at the lower of their carrying amount and their fair value less costs to sell, and are no longer depreciated once they are classified as held for sale.
Financial instruments A financial instrument in accordance with IAS 32, Financial Instru-ments: Presentation, is any contract that gives rise to a financial asset of one entity and a financial liability or equity instrument of another entity.
In the Continental Corporation, a purchase or sale of financial assets is recognized or derecognized at the settlement date.
Financial assets Financial assets are recognized in the statement of financial position as at the date Continental becomes a contractual party to the finan-cial instrument. At the date of acquisition, they must be classified into measurement categories that determine the subsequent ac-counting.
Receivables from the receivables factoring programs carried out in the corporation are recognized in the statement of financial position when the risks and rewards, in particular credit and default risk, have not been essentially transferred. The repayment obligations there-from are, as a rule, then shown as short-term financial liabilities.
The classification and measurement of financial assets is based on the business model in which assets are managed and on their cash flow characteristics. These conditions are cumulative criteria whose audit sequence is irrelevant.
It is therefore necessary to analyze the business model in which the asset to be classified is held. This relates to the investigation of the way in which financial assets held in order to collect cash flows are managed. The corporation reclassifies debt instruments only if the corresponding business model changes.
IFRS 9, Financial Instruments, distinguishes between three business models.
› Hold-to-collect: The objective of this business model is to hold the financial assets and generate the contractual cash flows. This model is the prevalent business model in the Continental Corpo-ration.
› Hold-to-collect and sale: This business model aims to collect the contractual cash flows or sell the financial assets. This business model does occur – for example, in connection with notes receiv-able – but is fundamentally of subordinate importance in the Con-tinental Corporation.
› Other: This business model constitutes a catch-all category. This model occurs in the corporation in connection with recognized trade accounts receivable from third parties which will probably be sold under a true sale-of-receivables factoring agreement; however, it is fundamentally of subordinate importance in the Continental Corporation.
In addition to the analysis of the business model, the contractual terms applicable on acquisition of the financial instrument must also be assessed (SPPI (solely payments of principal and interest) criterion). The SPPI criterion is met when the contractual terms of the financial asset give rise on specified dates to cash flows that are solely payments of principal and interest on the principal amount outstanding. Contractual cash flows that are solely payments of principal and interest on the principal amount outstanding are consistent with a basic lending arrangement.
On the basis of these two conditions, a distinction is drawn between the following measurement categories:
› Measured at cost: The financial asset, which constitutes a debt instrument, is held within a business model whose objective is to hold assets in order to collect contractual cash flows. Furthermore, the contractual cash flows can be characterized as payments of principal and interest on the principal amount outstanding. Inter-est income is recognized in the financial result using the effective interest method. Gains or losses arising from derecognition are recognized in profit or loss together with the foreign-currency gains and losses. Impairment losses are likewise recognized separately in the income statement.
› Measured at fair value through other comprehensive income with reclassification (FVOCIwR): The financial asset, which constitutes a debt instrument, is held within a business model whose objec-tive is achieved by both collecting contractual cash flows and sell-ing financial assets. Furthermore, the contractual cash flows can be characterized as payments of principal and interest on the principal amount outstanding. Changes in the carrying amount are recognized in other comprehensive income. Income or ex-penses from impairment, interest income and foreign-currency gains and losses are recognized in profit or loss. The cumulative gain or loss stated in other comprehensive income is reclassified from equity to the income statement when the financial asset is derecognized. Interest income is recognized in the financial result using the effective interest method. Foreign-currency gains and losses are recognized in other income and expenses.

134 Continental AG 2018 Annual Report Consolidated Financial Statements Notes to the Consolidated Financial Statements
› Measured at fair value through profit or loss (FVPL): The financial asset, which constitutes a debt instrument, is not to be measured at cost or at fair value through other comprehensive income with reclassification (FVOCIwR), as either the SPPI criterion was not met or the “Other” business model applies. Classification to the “measured at fair value through profit or loss (FVPL)” category can also be appropriate if the fair value option is applied to debt instruments that should actually be classified as measured at cost or at fair value through other comprehensive income with reclas-sification (FVOCIwR). However, the Continental Corporation does not currently intend to apply the fair value option to debt instru-ments. The financial asset, which constitutes an equity instrument, is to be measured at fair value through profit or loss if there is a trading intention or if there is no trading intention and the fair value option is not used. Income or expenses from a financial asset measured at fair value through profit or loss are recognized in the income statement.
› Measured at fair value through other comprehensive income with-out reclassification (FVOCIwoR): In the case of a financial asset that constitutes an equity instrument and is not held for trading, changes in the carrying amount are recognized in other compre-hensive income if the fair value option is used. The Continental Corporation regularly exercises this option. The cumulative gain or loss in other comprehensive income is not reclassified to the income statement when the financial asset is derecognized. Divi-dends are recognized in other income from investments.
Investments that fall within the scope of IFRS 9, Financial Instru-ments, and meet the definition of equity must generally be meas-ured at fair value. For equity instruments that are neither held for trading nor constitute contingent consideration accounted for by the acquirer in a business combination according to IFRS 3, Busi-ness Combinations, the Continental Corporation regularly exercises the option at the acquisition date of recognizing changes in fair value in other comprehensive income without later reclassification. Dividends are an exception to this and continue to be recognized in profit or loss when the legal entitlement is established, unless this relates to a partial restitution of acquisition costs. Equity instru-ments held for trading are without exception recognized at fair value through profit or loss.
On initial recognition, the corporation measures a financial asset at fair value plus the transaction costs directly attributable to the acquisition, with the exception of financial assets measured at fair value through profit or loss, for which associated transaction costs are recognized as expense in the income statement.
Impairment is recognized using the expected loss model. The im-pairment model applies to financial assets measured at amortized cost or at fair value through other comprehensive income (FVOCI) (except for investments in equity instruments), contract assets that result from IFRS 15, Revenue from Contracts with Customers, lease receivables, loan commitments and financial guarantee contracts.
Loss allowances are measured on the basis of 12-month expected credit losses or on the basis of lifetime expected credit losses. 12-month expected credit losses result from possible default events within 12 months after the reporting date. Lifetime expected credit
losses result from all possible default events over the expected life of a financial instrument.
Lifetime expected credit loss measurement applies if the credit risk of a financial asset at the reporting date has increased significantly since initial recognition, and 12-month expected credit loss meas-urement applies if it has not. The credit risk of a financial asset has increased significantly since initial recognition when contractual payments are more than 30 days past due on the reporting date.
For trade accounts receivable and contract assets with and without significant financing components, lease payments receivable and current receivables from related parties, only lifetime expected credit loss measurement is applied. Under this approach, the life-time expected credit losses must be recognized from the initial recognition of the receivable.
A financial asset is in default or credit-impaired if one of the follow-ing criteria is met:
› Insolvency or a similar event that indicates significant financial difficulty and a probable default of the counterparty.
› Probable debt waiver.
› A breach of contract that leads to the assumption that it is more probable that one or more receivables are not collectible.
› Other reasons in the assessment of credit management that lead to the assumption that it is more probable that the receivables are not collectible.
If there is evidence of uncollectibility, the financial asset is derecog-nized. If creditworthiness improves, the allowance is reversed.
Financial liabilities Financial liabilities are recognized in the statement of financial posi-tion as at the date Continental becomes a contractual party to the financial instrument.
Financial liabilities are generally measured at amortized cost using the effective interest method. Instruments that are held for trading are classified as “financial liabilities measured at fair value through profit or loss.” For financial liabilities not held for trading, the fair value option can be used. If the fair value option is used, the portion of the change in the fair value due to changes in the entity’s own credit risk is recognized in other comprehensive income. The fair value option is not currently exercised in the corporation. In the consoli-dated financial statements of Continental AG, all non-derivative financial liabilities are measured at amortized cost, which as a rule comprises the remaining principal balance and issuing costs, net of any unamortized premium or discount. Liabilities from finance leases are shown at the present value of the remaining lease pay-ments based on the implicit lease interest rate. Financial obligations with fixed or determinable payments that comprise neither finan-cial liabilities nor derivative financial liabilities and are not quoted in an active market are reported in the statement of financial position under other financial liabilities in accordance with their term.

Continental AG 2018 Annual Report Consolidated Financial Statements Notes to the Consolidated Financial Statements 135
In the case of information reported in accordance with IFRS 7, Financial Instruments: Disclosures, classification is in line with the items disclosed in the statement of financial position and/or the measurement category used in accordance with IFRS 9.
Derivative financial instruments and hedge accounting Derivative financial instruments are measured at fair value through profit or loss (FVPL). The fair value is generally the market or ex-change price. In the absence of an active market, the fair value is determined using financial models.
Fair values of currency forwards are calculated by way of future cash flows being translated into one of the two currencies using forward rates, netted, discounted with risk-free interest rates and then translated into the functional currency of the respective sub-sidiary at current spot exchange rates if applicable (par method).
The value of options is determined by applying recognized option pricing models.
To calculate the fair value of interest-rate swaps and cross-currency interest-rate swaps, the future cash flows are discounted with the interest rates for the respective maturities, with primarily deposit or IBOR rates used as short-term interest rates while long-term interest rates are based on the swap rates in the respective currency. Future cash flows are forecast using interest-rate curves with an appropri-ate payment tenor. When discounting, currency basis spreads or, if applicable, tenor basis spreads are taken into account.
The measurement of derivative instruments takes into account the credit spread in general.
Derivative instruments are recognized at the date when the obliga-tion to buy or sell the instrument arises.
Hedge accounting is currently applied only to hedge future cash flows using derivative instruments as hedges, provided the condi-tions for this are met. Continental designates the hedges in their entirety only. Continental prepares documentation on the designa-tion of the hedges and on the documentation of the fulfillment of the conditions for the application of hedge accounting.
Changes in the fair values of derivative instruments that are desig-nated to hedge cash flows where effectiveness is demonstrated are recognized in the cash flow hedge reserve in the difference from financial instruments in equity. If these cumulative fair value changes from inception of the hedge exceed the cumulative pres-
ent value changes of the hedged items, the excess amounts are recognized directly in the income statement. The cash flow hedge reserve is reclassified to profit or loss in the same period or periods during which the hedged cash flows affect profit or loss. If the hedged cash flows are no longer expected to occur, that amount is immediately reclassified from the reserve to profit or loss.
Hedge accounting under these separate rules is discontinued if the criteria for this are no longer met or the hedging instrument expires or is sold, terminated or exercised. In this case, the cash flow hedge reserve in place at the time of discontinuation is reclassified to profit or loss in the same period or periods during which the hedged cash flows affect profit or loss, as long as the hedged future cash flows are still expected to occur. If they are not expected to occur, the cash flow hedge reserve is reclassified to profit or loss immediately.
The amount of the effective portion of the change in value of the hedges remaining from the hedging of foreign-currency risks from net investments in foreign operations is still recognized together with the effect from the currency translation of the net investment in the difference from currency translation in equity. The accumu-lated currency effects are not reclassified in profit and loss until the foreign operations are sold or liquidated.
Embedded derivatives An embedded derivative is a component of a hybrid contract alongside a non-derivative host contract. A portion of the cash flows of the hybrid contract is therefore subject to similar variability as a separate derivative.
Non-derivative host contracts, with the exception of financial assets, are regularly inspected for embedded derivatives.
If the host contract does not fall under the scope of IFRS 9 or if the host contract is a financial liability, embedded derivatives must be separated from the host contract if the assessment finds that the economic characteristics and risks of the embedded derivative are not closely related to the economic characteristics and risks of the host contract, a separate instrument with the same terms would meet the definition of a derivative and Continental does not exercise the option to measure the entire hybrid instrument at fair value through profit or loss.
If separation is appropriate, the host contract is accounted for in accordance with the relevant IFRSs. The embedded derivative is recognized at fair value through profit or loss (FVPL).
136 Continental AG 2018 Annual Report Consolidated Financial Statements Notes to the Consolidated Financial Statements
Inventories Inventories are recognized at the lower of cost and net realizable value. Acquisition cost is generally determined using the weighted-average method. Production cost includes direct costs, production-related material costs, overheads and depreciation. Inventory risks resulting from decreased marketability or excessive storage periods are accounted for with write-downs.
Other assets Other assets are recognized at amortized cost. Allowances are rec-ognized as appropriate to reflect any possible risk related to recov-erability.
Accounting for income taxes Income taxes are measured using the concept of the statement of financial position liability method in accordance with IAS 12. Tax ex-penses and refunds that relate to income are recognized as income taxes. Late payment fines and interest arising from subsequently assessed taxes are not reported as tax expenses but as financial expenses.
Current taxes owed on income are recognized as expenses when they are incurred.
Deferred taxes include expected tax payments and refunds from temporary differences between the carrying amounts in the con-solidated financial statements and the related tax bases, as well as from the utilization of loss carryforwards. No deferred tax is recog-nized for non-tax-deductible goodwill. The deferred tax assets and liabilities are measured at the applicable tax rates related to the period when the temporary differences are expected to reverse. Changes in tax rates are recognized once the rate has been sub-stantially enacted. Deferred tax assets are not recognized if it is not probable that they will be realized in the future.
Income tax receivables and liabilities are recognized as current items, as they are due immediately and this due date often cannot be deferred.
Employee benefits The retirement benefits offered by the corporation comprise both defined benefit and defined contribution plans.
Pension liabilities under defined benefit plans are actuarially mea-sured pursuant to IAS 19, Employee Benefits (revised 2011), using the projected unit credit method that reflects salary, pension and employee fluctuation trends. The discount rate to determine the present value is based on long-term loans in the respective capital market. Actuarial gains and losses are recognized in other compre-hensive income. Expenses from interest cost on pension liabilities and income from pension funds are reported separately in the financial result.
Accordingly, the interest effects of other long-term employee bene-fits are reported in the financial result. Pension liabilities for some companies of the corporation are covered by pension funds. Fur-thermore, plan assets comprise all assets, as well as claims from insurance contracts, that are held exclusively toward payments to those entitled to pensions and are not available to meet the claims of other creditors. Pension obligations and plan assets are reported on a net basis in the statement of financial position.
The other post-employment benefits also shown under the em-ployee benefits relate to obligations to pay for health costs for retired workers in the U.S.A. and Canada in particular.
Defined contribution plans represent retirement benefits where the company only contributes contractually fixed amounts for current service entitlements, which are generally invested by independent, external asset managers until the date of retirement of the employee. The fixed amounts are partly dependent on the level of the em-ployee’s own contribution. The company gives no guarantees of the value of the asset after the fixed contribution, either at the re-tirement date or beyond. The entitlement is therefore settled by the contributions paid in the year.
Provisions for other risks and obligations Provisions are recognized when a legal or constructive obligation has arisen that is likely to result in a future cash outflow to third par-ties and the amount can be reliably determined or estimated. The provisions are recognized as at the end of the reporting period at the value at which the obligations could probably be settled or transferred to a third party. Non-current provisions such as those for litigation or environmental risks are discounted to their present value. The resulting periodic interest charge for the provisions is shown under the financial result including an effect from a change in interest.

Continental AG 2018 Annual Report Consolidated Financial Statements Notes to the Consolidated Financial Statements 137
Non-financial liabilities Current non-financial liabilities are carried at their payable amount. Non-current non-financial liabilities are measured at amortized cost.
Share-based remuneration Cash-settled share-based remuneration is measured at fair value using a Monte Carlo simulation. The liabilities are recognized under other financial liabilities until the end of the holding period.
Estimates Proper and complete preparation of the consolidated financial statements requires management to make estimates and assump-tions affecting the assets, liabilities and disclosures in the notes, as well as the income and expenses for the period.
The most important estimates relate to the determination of the useful lives of intangible assets and property, plant and equipment; the impairment testing of goodwill and non-current assets, in par-ticular the underlying cash flow forecasts and discount rates; the recoverability of amounts receivable and other assets as well as in-come tax receivable; the financial modeling parameters for stock option plans; the recognition and measurement of liabilities and provisions, especially the actuarial parameters for pensions and other post-employment obligations; and the probabilities of claims and amounts of settlements for warranty, litigation or environmen-tal risks.
The assumptions and estimates are based on the information cur-rently available at the date of preparation of the consolidated finan-cial statements. The underlying information is regularly reviewed and updated to reflect actual developments as necessary.
Consolidated statement of cash flows The statement of cash flows shows the sources during the period that generated cash and cash equivalents as well as the application of cash and cash equivalents. This includes all cash and cash equiv-alents and demand deposits. Cash equivalents are short-term, highly liquid financial investments that can be readily converted into known cash amounts and are subject to an insignificant risk of changes in value.
The restrictions that may impact the availability of capital are also understood as comprising all existing restrictions on the cash and cash equivalents. In the Continental Corporation, the cash and cash equivalents are restricted with regard to pledged amounts and bal-ances in countries with foreign-exchange restrictions or other barri-ers to accessing liquidity. Taxes to be paid on the transfer of cash assets from one country to another are not usually considered to represent a restriction on cash and cash equivalents.
Financial investments are considered to be cash equivalents only if they have a remaining term not exceeding three months.

138 Continental AG 2018 Annual Report Consolidated Financial Statements Notes to the Consolidated Financial Statements
Accounting policies applied until December 31, 2017 The corporation has applied IFRS 9, Financial Instruments, and IFRS 15, Revenue from Contracts with Customers, retrospectively, using the exemption not to restate comparative information retrospec-tively. The comparative information is therefore still reported in ac-cordance with the corporation's previous accounting policies. The basis is therefore IAS 39, Financial Instruments: Recognition and Measurement, and its related interpretations which have been re-placed by IFRS 9 and the standards IAS 18, Revenue, IAS 11, Con-struction Contracts, and their related interpretations which have been replaced by IFRS 15. Following the consolidated financial statements for 2017 the previous accounting methods relevant for the comparative period are explained below.
Consolidation principles Companies that are dormant or have only a low level of business activity and therefore no significant impact on the earnings, finan-cial and net assets position of the Continental Corporation are not included in the consolidated financial statements. Such companies are recognized in the consolidated financial statements at cost un-less there are listings for these shares on the capital markets and unless the calculation of fair value is expected to provide a signifi-cant improvement of the presentation of financial statements.
Revenue recognition Only sales of products and services resulting from the ordinary business activities of the company are shown as revenue. Conti-nental recognizes revenue for product sales when there is proof or an agreement to the effect that delivery has been made and the risks have been transferred to the customer. In addition, it must be possible to reliably measure the amount of revenue and the recov-erability of the receivable must be assumed.
Revenues from made-to-order production are recognized using the percentage-of-completion method. The ratio of costs already incurred to the estimated total costs associated with the contract serves as the basis of calculation. Expected losses from these con-tracts are recognized in the reporting period in which the current estimated total costs exceed the sales expected from the respec-tive contract. The percentage-of-completion method is of no signifi-cance to the Continental Corporation.
Research and development expenses Advances and reimbursements from customers are netted against expenses at the time they are invoiced.
Financial instruments A financial instrument in accordance with IAS 32, Financial Instru-ments: Presentation, is any contract that gives rise to a financial asset of one entity and a financial liability or equity instrument of another entity. Financial instruments include non-derivative finan-cial instruments such as trade accounts receivable and payable, securities and financial receivables or liabilities and other financial liabilities. They also include derivative instruments that are used to hedge against risks from changes in exchange rates and interest rates.
Non-derivative financial instruments Non-derivative financial instruments are recognized at the settle-ment date, i.e. the date at which the asset is delivered to or by Con-tinental AG.
Non-derivative financial assets are classified under one of the fol-lowing four categories according to the purpose for which they are held. The classification is reviewed at the end of each reporting pe-riod and affects whether the financial asset is reported as non-cur-rent or current as well as determining whether measurement is at cost or fair value.
› Changes in the fair value of financial assets at fair value through profit and loss – which are either designated as such (fair value option) on initial recognition or are classified as held for trading – are recognized immediately in the income statement. In addition, they are reported as current financial assets if they are either held for trading purposes or are expected to be realized within 12 months of the end of the reporting period. The fair value option is not applied in the Continental Corporation.
› Held-to-maturity financial assets – which have fixed or determin-able payments as well as a fixed maturity and are intended to be held until that maturity, together with the ability to retain these assets until maturity – are recognized at amortized cost and re-ported as non-current or current financial assets in accordance with their term. Any impairment is reported in profit or loss. No financial assets are classified as held-to-maturity at present.
› Loans and receivables – which have fixed or determinable pay-ments and are not quoted in an active market – are measured at amortized cost less any necessary impairment. They are reported in the statement of financial position in accordance with their term as non-current or current financial assets.
› Financial assets – which were categorized as available for sale – are measured at fair value and reported as non-current or current financial assets according to the expected date of sale. Unrealized gains or losses are recognized in other reserves in equity, net of tax effects, until the date of derecognition. In the event of a signifi-cant or long-lasting decline in fair value to below cost, the impair-ment is recognized immediately in profit or loss. Reversal of im-pairment losses on equity instruments is recognized outside profit or loss. Reversal of impairment losses on debt instruments is rec-ognized in profit or loss. Unless there is a price quoted on an ac-tive market and unless the calculation of fair value is expected to provide a significant improvement of the presentation of financial statements, for example in the case of investments in unconsoli-dated affiliated companies or other equity investments, the assets are measured at cost.
Liabilities arising from non-derivative financial instruments may be recognized either at amortized cost or at fair value through profit and loss. In the consolidated financial statements of Continental AG, all non-derivative financial liabilities are generally measured at amortized cost, which as a rule comprises the remaining principal

Continental AG 2018 Annual Report Consolidated Financial Statements Notes to the Consolidated Financial Statements 139
balance and issuing costs, net of any unamortized premium or dis-count. Liabilities from finance leases are shown at the present value of the remaining lease payments based on the implicit lease inter-est rate. Financial obligations with fixed or determinable payments that comprise neither financial liabilities nor derivative financial liabilities and are not quoted in an active market are reported in the statement of financial position under other financial liabilities in accordance with their term.
In the case of information reported in accordance with IFRS 7, classification is in line with the items disclosed in the statement of financial position and/or the measurement category used in accor-dance with IAS 39.
Hybrid financial instruments Financial instruments that have both a debt and an equity compo-nent are classified and measured separately by those components. Instruments under this heading primarily include bonds with war-rants and convertible bonds. In the case of convertible bonds, the fair value of the share conversion rights is recognized separately in capital reserves at the date the bond is issued and therefore deducted from the liability incurred by the bond. Fair values of conversion rights from bonds with below-market interest rates are calculated based on the present value of the difference between the coupon rate and the market rate of interest. The interest expense for the debt component is calculated for the term of the bond based on the market interest rate at the date of issue for a compa-rable bond without conversion rights. The difference between the deemed interest and the coupon rate increases the carrying amount of the bond indebtedness. In the event of maturity or conversion, the equity component previously recognized in capital reserves at the date of issue is offset against the accumulated retained earnings in accordance with the option permitted by IAS 32.
Derivative instruments Derivative instruments are only used to hedge statement of finan-cial position items or forecast cash flows, and are measured at their fair values. The fair value is generally the market or exchange price. In the absence of an active market, the fair value is determined using financial models, for example by discounting expected future cash flows at the market rate of interest or by applying recognized option pricing models. Derivative instruments are recognized at the date when the obligation to buy or sell the instrument arises.
Changes in the fair values of derivative instruments used for fair value hedging purposes to offset fluctuations in the market value of recognized assets or liabilities are charged to income together with the changes in value of the hedged item. Changes in the fair values of derivative instruments used to hedge future cash flows where effectiveness is demonstrated are recognized in the differ-ence from financial instruments in equity until the associated hedged transaction is settled.
In the hedging of foreign-currency risks from net investments in foreign operations, the effective portion of the change in value of the hedges together with the effect from the currency translation of the net investment is recognized in the difference from currency translation in equity. The accumulated currency effects are not reclassified in profit and loss until the foreign operations are sold or liquidated.
If the criteria for hedge accounting are not met or the hedge be-comes ineffective, the changes in fair value of the specific deriva-tive instrument are recognized in net income as incurred, inde-pendently of the hedged item.
A sensitivity analysis was performed to prospectively measure ef-fectiveness. Effectiveness was demonstrated retrospectively using the dollar offset method by comparing the changes in the value of the hedging instruments with the changes in the value of the hedged transactions. If the results of retrospective effectiveness testing fell within a range of 80% to 125%, the hedges used by the corporation were considered highly effective.
Embedded derivatives Non-derivative host contracts are regularly inspected for embed-ded derivatives, for example, contractual payment terms neither in the functional currency of one of the contractual partners nor in a typical trading currency. Embedded derivatives must be separated from the host contract if the assessment finds that the economic characteristics and risks of the embedded derivative are not closely related to the economic characteristics and risks of the host con-tract. Embedded derivatives to be separated are measured at fair value and corresponding changes in value are charged to income.
Receivables Receivables are carried at their nominal value. Valuation allowances on special items are recognized in specific cases where default is known or based on experience. Default risks leading to lower pay-ment inflows usually manifest themselves in financial difficulties, non-fulfillment, probable insolvency or breach of contract on the part of the customer.
Continental sells some of its trade accounts receivable under sale-of-receivables programs with banks. Receivables are recognized in the statement of financial position when the risks and rewards, in particular credit and default risk, have not been essentially trans-ferred. The repayment obligations from these sales are, as a rule, then shown as short-term financial liabilities.

140 Continental AG 2018 Annual Report Consolidated Financial Statements Notes to the Consolidated Financial Statements
3. New Accounting Pronouncements
In accordance with EU Regulation (EC) No. 1606/2002 in conjunc-tion with Section 315e (1) of the German Commercial Code (Han-delsgesetzbuch – HGB), Continental AG has prepared its consoli-dated financial statements in compliance with the IFRS as adopted by the European Union under the endorsement procedure. Thus, IFRS are only required to be applied following endorsement of a new standard by the European Union.
The following endorsed standards, interpretations issued in relation to published standards and amendments that were applicable to the consolidated financial statements of Continental AG became effective in 2018 and have been adopted accordingly: The amendments to IAS 40, Investment Property (Transfers of In-vestment Property), clarify that a transfer into or out of investment property should be made only when there has been a change in use of the property. A change in use occurs when the property meets or ceases to meet the definition of investment property, and there is evidence of the change in use. The amendments clarify that the list of evidence in the standard is a non-exhaustive list of examples. The amendments are required to be applied for annual periods beginning on or after January 1, 2018. The amendments had no significant effect on the consolidated financial statements of Continental AG.
The amendments to IFRS 2, Share-based Payment (Classification and Measurement of Share-based Payment Transactions), address the measurement for cash-settled share-based payments and the accounting for modifications that change an award from cash-set-tled to equity settled. Furthermore, the amendments introduce an exemption for cases in which an employer is obliged to withhold an amount for the employee’s tax obligation associated with a share-based payment. The employer has to pay that amount to the tax authority. The amendments clarify that those transactions would be classified as equity-settled in its entirety if it would have been so classified had it not included the net settlement feature. The amend-ments are required to be applied for annual periods beginning on or after January 1, 2018. The amendments had no significant ef-fect on the consolidated financial statements of Continental AG.
The amendments to IFRS 4, Insurance Contracts (Applying IFRS 9, Financial Instruments with IFRS 4, Insurance Contracts), addresses the concerns about the different effective dates of IFRS 9 and the new insurance contract standard. The amendments introduce two possible optional solutions: the temporary exemption from IFRS 9 in limited circumstances and the overlay approach. The latter per-mits insurers to reclassify from profit or loss to other comprehen-sive income any changes in the fair value of financial assets held in respect of an activity that is connected with contracts within the scope of IFRS 4, if these changes are recognized in profit or loss under IFRS 9 but not under IAS 39. With respect to the temporary exemption from IFRS 9, the amendment is effective for annual peri-ods beginning on or after January 1, 2018. Both approaches are to be applied at the latest as of the effective date of the new standard for insurance contracts. The amendments had no effect on the consolidated financial statements of Continental AG.
IFRS 9, Financial Instruments, replaces IAS 39, Financial Instruments: Recognition and Measurement. IFRS 9 includes new requirements on the classification and measurement of financial instruments, es-pecially financial assets, based on the business model in which as-sets are managed and on their cash flow characteristics. IFRS 9 su-persedes the present categories of IAS 39 for financial assets (held to maturity, loans and receivables, available for sale and held for trading) by the measurement categories at amortised cost, at fair value through profit or loss (FVTPL) and at fair value through other comprehensive income (FVOCI). In the last measurement category, there are differences regarding the reclassification of other compre-hensive income, which depend on the financial instrument. Deriva-tive instruments embedded in financial assets are not accounted for separately anymore under IFRS 9. Instead, it will be assessed for classification as whole. The existing requirements of IAS 39 regard-ing the classification of financial liabilities are largely adopted by IFRS 9. In contrast to IAS 39 with application of the fair value op-tion under IFRS 9, the portion of the change in the fair value due to changes in the entity’s own credit risk should be presented in other comprehensive income. For calculating impairment the standard replaces the incurred loss model with an expected credit loss model. The new impairment model will apply to financial assets measured at amortized cost or at fair value through other compre-hensive income (except for investments in equity instruments), contract assets that result from IFRS 15, Revenue from Contracts with Customers, lease receivables, loan commitments and financial guarantee contracts. Under IFRS 9, loss allowances will be meas-ured on the basis of 12-month expected credit losses or on the basis of lifetime expected credit losses. 12-month expected credit losses result from possible default events within 12 months after the reporting date. Lifetime expected credit losses result from all possible default events over the expected life of a financial instru-ment. Lifetime expected credit loss measurement applies if the credit risk of a financial asset at the reporting date has increased significantly since initial recognition, and 12-month expected credit loss measurement applies if it has not. There are exceptions for trade receivables, contract assets according to IFRS 15 and lease receivables. For these items the lifetime expected credit loss mea-surement has to be applied (trade receivables and contract assets according to IFRS 15 without a significant financing component) or may be applied (trade receivables and contract assets according to IFRS 15 with a significant financing component and lease receiv-ables). The regulation of IFRS 9 introduces a new (general) hedge accounting model with the aim of aligning risk management more closely with accounting. IFRS 9 includes new requirements regard-ing rebalancing of hedge relationships and prohibits voluntary dis-continuations of hedge accounting. Furthermore, in the future it is possible that additional risk management strategies, which involve hedging a risk component (other than foreign-currency risk) of a non-financial item, will likely qualify for hedge accounting. With the application of IFRS 9, an entity may also occasionally elect at incep-tion of the hedging relationship that forward points and the cross-currency basis spread of the hedging instrument can be separately accounted for as a cost of hedging. IFRS 9 introduces new presen-tation requirements and new disclosures, especially about hedge accounting, credit risk and expected credit losses. IFRS 9 and the

Continental AG 2018 Annual Report Consolidated Financial Statements Notes to the Consolidated Financial Statements 141
consequential amendments to other standards and interpretations (in particular, IFRS 7, Disclosures) are required to be applied for an-nual periods beginning on or after January 1, 2018. The standard and the consequential amendments had no significant effect on the classification and measurement of the financial assets and financial liabilities of the corporation and the hedge accounting. However, the new impairment requirements had an effect on the consolidated financial statements of Continental AG.
IFRS 15, Revenue from Contracts with Customers, replaces the pre-vious revenue recognition guidance and supersedes IAS 11, Con-struction Contracts, IAS 18, Revenue, IFRIC 13, Customer Loyalty Programmes, IFRIC 15, Agreements for the Construction of Real Estate, IFRIC 18, Transfers of Assets from Customers, and SIC 31, Revenue – Barter Transactions Involving Advertising Services. In ac-cordance with IFRS 15, the amount is to be recognized as revenue from contracts with customers, which is received for the transfer of promised goods or services to customers in exchange for those goods or services. The relevant point in time or period of time is the transfer of control of the goods or services (control approach). To determine when to recognize revenue and at what amount, a five-step model has to be applied in accordance with the core prin-ciple. The standard and the consequential amendments to other standards and interpretations are required to be applied for annual periods beginning on or after January 1, 2018. The standard and the consequential amendments had no significant effect on the consolidated financial statements of Continental AG.
With the clarifications to IFRS 15, Revenue from Contracts with Customers, the IASB makes targeted amendments to IFRS 15 with respect to the topics – identifying performance obligations, princi-pal versus agent considerations and licensing. The clarifications are required to be applied for annual periods beginning on or after January 1, 2018. The clarifications had no significant effect on the consolidated financial statements of Continental AG.
IFRIC 22, Foreign Currency Transactions and Advance Considera-tion, addresses the question of how to determine the exchange rate to use on initial recognition of the related asset, expense or in-come (or part of it) on the derecognition of a non-monetary asset or non-monetary liability arising from the payment or receipt of ad-vance consideration in a foreign currency. The interpretation clari-fies that for the purpose of determining the exchange rate the date of transaction is the date on which an entity initially recognizes the non-monetary asset or non-monetary liability arising from the pay-ment or receipt of advance consideration. If there are multiple pay-ments or receipts in advance, the entity shall determine a date of the transaction for each payment or receipt of advance considera-tion. The interpretation is required to be applied for annual periods beginning on or after January 1, 2018. The interpretation had no significant effect on the consolidated financial statements of Conti-nental AG.
Under the IASB’s annual improvements project, Improvements to IFRSs, December 2016, Cycle 2014–2016, the following amend-ments are effective:
› The amendments to IFRS 1, First-time Adoption of International Financial Reporting Standards (Deletion of short-term exemptions for first-time adopters), delete some of the short-term exemptions from IFRS that are not relevant anymore through the passage of time.
› The amendments to IAS 28, Investment in Associates and Joint Ventures (Measuring an associate or joint venture at fair value), address the question whether an entity has an investment-by- investment choice for measuring investments in an associate or a joint venture at fair value through profit or loss. The option is applicable for investments in associates or joint ventures that are held by an entity that is a venture capital organization or a mutual fund, unit trust or similar entities including investment-linked in-surance funds. The amendments clarify that an entity shall make the election separately for each associate or joint venture at initial recognition of the associate or joint venture. Furthermore, the amendments deal with the accounting for cases in which an en-tity that is not itself an investment entity has an interest in an as-sociate or joint venture that is an investment entity. The election to retain fair value measurement applied by that investment en-tity associate or joint venture to the investment entity associate’s or joint venture’s interests in subsidiaries is made separately for each investment entity associate or joint venture at the later of the date on which the investment entity associate or joint venture is initially recognized, the associate or joint venture becomes an investment entity, or the investment entity associate or joint ven-ture first become a parent.
The amendments are required to be applied for annual periods beginning on or after January 1, 2018. The amendments had no significant effect on the consolidated financial statements of Conti-nental AG.
The following standards, interpretations issued in relation to published standards and amendments have already been endorsed by the EU but will not take effect until a later date: The amendments to IAS 28, Investments in Associates and Joint Ventures (Long-term Interests in Associates and Joint Ventures), clarify that IFRS 9, Financial Instruments, applies to an entity’s long-term interest in an associate or joint venture to which the equity method is not applied but that, in substance, form part of the entity’s net investment in an associate or joint venture. The amendments clarify that an entity has to apply the IFRS 9 requirements before applying the loss allocation and impairment requirements in IAS 28. Furthermore, in applying IFRS 9, an entity does not take account of any adjustments to the carrying amount of long-term interests that result from the application of IAS 28. Planned as proposed amend-ments to the IASB’s annual improvements project, Improvements to IFRSs, December 2017, Cycle 2015–2017, it was finally decided to issue these amendments to IAS 28 separately. The amendments are required to be applied for annual periods beginning on or after January 1, 2019. The amendments are not expected to have any significant effect on the future consolidated financial statements of Continental AG.

142 Continental AG 2018 Annual Report Consolidated Financial Statements Notes to the Consolidated Financial Statements
The amendments to IFRS 9, Financial Instruments (Prepayment Features with Negative Compensation), state that particular finan-cial assets with prepayment features that may result in reasonable negative compensation for the early termination of the contract are eligible to be measured at amortized cost or at fair value through other comprehensive income. Regarding the accounting for a mod-ification or exchange of a financial liability measured at amortized costs that does not result in the derecognition of the financial liabil-ity, the amendments clarify in the basis for conclusion that any ad-justment to the amortized cost should be recognized in profit or loss at the date of the modification or exchange. The amendments are required to be applied for annual periods beginning on or after January 1, 2019. The amendments are not expected to have any significant effect on the future consolidated financial statements of Continental AG.
IFRS 16, Leases, replaces the existing guidance for the accounting of leases and supersedes IAS 17, Leases; IFRIC 4, Determining Whether an Arrangement Contains a Lease; SIC-15, Operating Leases – Incentives; and SIC-27, Evaluating the Substance of Transactions Involving the Legal Form of a Lease. IFRS 16 sets out the principles for the recognition, measurement, presentation and disclosure of leases for the lessee and the lessor. IFRS 16 includes significant changes to lessee accounting with the removal of the distinction between finance lease and operating lease and the general recog-nition of all leases in the statement of financial position. In accor-dance with IFRS 16, the lessee shall recognize a right-of-use asset and a corresponding lease liability, which displays the obligation to lease payment. IFRS 16 allows exceptions for short-term leases and leases for which the underlying assets are of low value. Continental will apply these exceptions. Regarding the lessor accounting, the standard maintains the requirements of IAS 17. Accordingly, a lessor will continue to classify its leases as finance or operating leases. The standard and the consequential amendments to other standards shall be applied for annual periods beginning on or after January 1, 2019. When adapting to the new lease standard, the company can select either the full retrospective approach or the modified retro-spective approach including optional practical expedients. Continen-tal AG will select the modified retrospective approach as the transi-tion method for initially applying IFRS 16 as of January 1, 2019. It is expected that the standard and the consequential amendments to other standards will have a significant effect on the future con-solidated financial statements of Continental AG. In the analysis to determine the effects on its consolidated financial statements the most significant impact that has been identified is that Continental AG as lessor will account for new assets and liabilities based on op-erating leases of administration and production buildings as well as warehouses. To a small extent, Continental as lessor will account for assets and liabilities for operating leases of other facilities, operating and office equipment. Moreover, there will be impacts on the con-solidated income statement due to the substitution of the straight-line expenses from operating leases with the depreciation charges of the right-of-use assets and the interest expenses resulting from the measurement of lease liabilities. As a result, a positive effect on EBIT at the expense of the financial result is expected. The first-time adoption of IFRS 16 is expected to result in a significant effect. Ini-tial recognition of the right-of-use assets from leases and the corre-sponding lease liabilities will result in quantitative effects on the net assets position of around €1.8 billion.
IFRIC 23, Uncertainty over Income Tax Treatments, clarifies how to apply the recognition and measurement requirements in IAS 12, In-come Taxes, when there is uncertainty over income tax treatments. According to IFRIC 23, uncertain tax treatments shall be considered separately or together with one or more other uncertain tax treat-ments depending on which approach better predicts the resolution of the uncertainty. For the assessment, it shall be assumed that a taxation authority will examine amounts it has a right to examine and have full knowledge of all related information when making those examinations. Depending on which method the entity expects to better predict the resolution of the uncertainty, the most likely amount or the expected value can be used to reflect the effect of uncertainty for each uncertain tax treatment. If an uncertain tax treatment affects current tax and deferred tax, consistent judgments and estimates shall be made for both current and deferred tax. Fur-thermore, the interpretation contains a guideline for the considera-tion of changes in facts and circumstances and refers to existing disclosure requirements for uncertain tax positions. The interpreta-tion and the consequential amendment to IFRS 1, First-time Adop-tion of International Financial Reporting Standards, are required to be applied for annual periods beginning on or after January 1, 2019. The interpretation and the consequential amendment are not ex-pected to have a significant effect on the future consolidated finan-cial statements of Continental AG.
The following standards, interpretations issued in relation to published standards and amendments are not yet endorsed by the EU and will become effective at a later date: The amendments to IAS 1, Presentation of Financial Statements, and IAS 8, Accounting Policies, Changes in Accounting Estimates and Errors (Definition of Material), clarify the definition of material-ity and standardize it in all standards and the Conceptual Frame-work of the IFRS. The amendments and the consequential amend-ments to other IFRS standards and publications are required to be applied for annual periods beginning on or after January 1, 2020. The amendments are not expected to have any significant effect on the future consolidated financial statements of Continental AG.
The amendments to IAS 19, Employee Benefits (Plan Amendment, Curtailment or Settlement), clarify the accounting for plan amend-ments, curtailments and settlements. When there is a plan amend-ment, curtailment or settlement, the net defined benefit liability (as-set) shall be remeasured using the current fair value of plan assets and current actuarial assumptions in order to determine past service cost or a gain or loss on settlement. In such cases, the amendments specify that current service cost and net interest for the remainder of the annual reporting period after the plan amendment, curtail-ment and settlement shall be determined using the updated actu-arial assumptions as well. The net interest for the remainder of the annual reporting period after the plan amendment, curtailment and settlement shall be determined on the basis of the remeasured net defined benefit liability (asset). The amendments are required to be applied for annual periods beginning on or after January 1, 2019. The amendments are not expected to have any significant effect on the future consolidated financial statements of Continental AG.

Continental AG 2018 Annual Report Consolidated Financial Statements Notes to the Consolidated Financial Statements 143
The amendments to IFRS 3, Business Combinations (Definition of a Business), clarify the definition of a business with the objective to identify uniquely whether a transaction should be accounted for as a business combination or as an asset acquisition. An acquired set of activities and assets have to include an input and a substantive process that together significantly contribute to the ability to create outputs in order to be considered a business. The amendments add guidance and illustrative examples to assess whether a sub-stantive process has been acquired and narrow the definition of business and outputs by removing reference to an ability to reduce costs. An assessment whether market participants are capable of replacing missing elements or integrating the acquired activities and assets is no longer necessary. Furthermore, an optional con-centration test was added to permit a simplified assessment of whether an acquired set of activities and assets is not a business. Under this optional test where substantially all of the fair values of gross assets acquired is concentrated in a single asset (or a group of similar assets), the assets acquired would not represent a busi-ness. The amendments are required to be applied to acquisitions for which the acquisition date is on or after the beginning of the first annual reporting periods beginning on or after January 1, 2020. The amendments are not expected to have any significant effect on the future consolidated financial statements of Continental AG.
The amendments to IFRS 10, Consolidated Financial Statements, and IAS 28, Investments in Associates and Joint Ventures (Sale or Contribution of Assets between an Investor and its Associate or Joint Venture), eliminate an inconsistency between both standards. The amendments clarify that the accounting treatment for sales or contribution of assets between an investor and its associates or joint venture depends on whether the non-monetary assets sold or contributed to an associate or joint venture constitute a business in accordance with IFRS 3, Business Combinations. In case the non-monetary assets constitute a business, full gain or loss will be rec-ognized by the investor. If the definition of a business is not met, the gain or loss is recognized by the investor to the extent of the other investor’s interests. With the amendments to IFRS 10 and IAS 28, Effective Date of Amendments to IFRS 10 and IAS 28, the IASB has decided to defer indefinitely the effective date of the amendments. The amendments are not expected to have any sig-nificant effect on the future consolidated financial statements of Continental AG.
IFRS 17, Insurance Contracts, replaces IFRS 4, Insurance Contracts, and establishes principles for the recognition, measurement, presentation and disclosure of insurance contracts issued. The standard and the consequential amendments to other standards are required to be applied for annual periods beginning on or after January 1, 2021. The standard and the consequential amendments to other standards are not expected to have any significant effect on the future consolidated financial statements of Continental AG.
Under the IASB’s annual improvements project, Improvements to IFRSs, December 2017, Cycle 2015–2017, the following amend-ments will become effective at a later date:
› The amendments to IFRS 3, Business Combinations (Previously held interest in a joint operation), clarify that, if control of a busi-ness that is a joint operation is obtained, the previously held inter-est in a joint operation is remeasured. Such a transaction is a busi-ness combination achieved in stages. In this context IFRS 11, Joint Arrangements, was also amended to make clear that previ-ously held interests in the joint operation are not remeasured in case an entity obtains joint control of a business that is a joint operation. This transaction is similar to an investment in an asso-ciate becoming an investment in a joint venture and vice versa.
› The amendments to IAS 12, Income Taxes (Income tax conse-quences of payments on financial instruments classified as equity), specify that income tax consequences of dividends on financial instruments classified as equity should be recognized according to where the past transactions or events that generate distribut-able profits were recognized originally. These requirements apply to all income tax consequences of dividends. In the context of the amendments to IAS 12, the basis for conclusion on IAS 32, Finan-cial Instruments: Presentation, was extended.
› The amendments to IAS 23, Borrowing Costs (Borrowing costs eligible for capitalization), clarify that specific borrowings that re-main outstanding after the related qualifying asset is ready for its intended use or sale become part of the funds an entity borrows generally. Thus, these borrowings are included in the calculation of the capitalization rate for qualifying assets for which no specific funds were borrowed.
The amendments are required to be applied for annual periods beginning on or after January 1, 2019. The amendments are not expected to have any significant effect on the future consolidated financial statements of Continental AG.
The Amendments to References to the Conceptual Framework in IFRS Standards, set out amendments to IFRS Standards, the accom-panying documents and IFRS practice statements to reflect the is-sue of the revised Conceptual Framework (2018). The amendments are required to be applied for annual periods beginning on or after January 1, 2020. The amendments are not expected to have any significant effect on the future consolidated financial statements of Continental AG.

144 Continental AG 2018 Annual Report Consolidated Financial Statements Notes to the Consolidated Financial Statements
4. Companies Consolidated and Information on Subsidiaries and Investments
Companies consolidated In addition to the parent company, the consolidated financial state-ments include 572 (PY: 527) domestic and foreign companies that Continental Aktiengesellschaft incorporates according to the regu-lations of IFRS 10 or that are classified as joint arrangements or as-sociated companies. Of these, 442 (PY: 412) are fully consolidated and 130 (PY: 115) are accounted for using the equity method.
The number of consolidated companies has increased by a total of 45 since the previous year. 38 companies were formed, 18 were acquired and three previously unconsolidated entities were included in consolidation for the first time. Six structured entities were also fully consolidated according to IFRS 10. Nine companies were liqui-dated and four were sold. In addition, the number of companies consolidated was reduced by seven as a result of mergers.
The additions to the scope of consolidation in 2018 resulted mainly from companies newly founded for the corporate restruc-turing.
A total of 35 (PY: 45) companies whose assets and liabilities, ex-penses and income – individually and combined – are not material for the earnings, financial and net assets position of the corpora-tion, are not included in consolidation. 34 (PY: 44) of these are affili-ated companies, three (PY: three) of which are currently inactive. As in the previous year, one further company not included in consoli-dation is an associated company. This unit is active.
Information on subsidiaries and investments As at December 31, 2018, non-controlling interests were not of sig-nificance to the corporation. There are no significant restrictions in terms of access to or the use of assets of the corporation due to statutory, contractual or regulatory restrictions or property rights of non-controlling interests.
Noisetier SAS, Paris, France; Continental Teves Taiwan Co., Ltd., Tainan, Taiwan; and e.solutions GmbH, Ingolstadt, Germany, each of which with a 51% share of voting rights, and Carrel Grundstücksver-waltungsgesellschaft mbH & Co. Vermietungs KG, Mainz, Germany, with a share of voting rights of 94%, are not fully consolidated as, under the companies’ statutes, these interests are not enough to direct the relevant activities of these investments.
EasyMile SAS, Toulouse, France, with a 13% share of voting rights, is classified as an associated company, as significant influence can be exerted on the basis of the company’s Articles of Incorporation. Continental AG consolidates 18 (PY: 12) structured entities. These structured entities are characterized, among other things, by lim-ited activities and a narrowly defined business purpose. Continental holds no voting rights or investments in the fully consolidated structured entities. However, Continental directs the business activi-ties of these entities on the basis of contractual rights. The share-holders therefore have no influence. Furthermore, Continental is also exposed to variable returns from these entities and can influ-ence these by directing business activities. There are no significant shares or rights in non-consolidated structured entities.
Further information on equity investments and an overview of the German corporations and partnerships that utilized the exemption provisions of Sections 264 (3) and 264b of the German Commer-cial Code (Handelsgesetzbuch – HGB) can be found in Note 40.

Continental AG 2018 Annual Report Consolidated Financial Statements Notes to the Consolidated Financial Statements 145
5. Acquisition and Disposal of Companies and Business Operations
Acquisition of companies and business operations On November 1, 2018, Conti Trade Australia Pty Ltd, Bundoora, Australia, acquired 100% of the shares in Tyre and Auto Pty Ltd, Melbourne, Australia. Tyre and Auto Pty Ltd is a leading tire dealer and provider of automotive and repair services in Australia. In the 2017 fiscal year, it generated sales of AUD 323.9 million (€219.8 million) with over 1,200 employees at 258 locations in Australia. The purchase price for Tyre and Auto Pty Ltd is AUD 357.5 million (€223.7 million) and has been paid in cash in the amount of AUD 350 million (€219.0 million). The remaining amount is recorded as a purchase price liability of AUD 7.5 million (€4.7 million). The to-tal incidental acquisition costs incurred in the amount of AUD 2.6 million (€1.6 million) were recognized as other expenses in fiscal 2018. The provisional purchase price allocation resulted in good-will of €180.5 million and intangible assets of €45.0 million for the Tire segment. With this acquisition, the Tire segment intends to tap new sales markets in Australia. If the transaction had already been completed on January 1, 2018, net income after tax would have been €4.8 million lower and sales would have been up by €178.6 million. The transaction was closed on November 1, 2018. Since then, Tyre and Auto Pty Ltd has generated sales of €37.1 million and, taking into account the effects of purchase price allocation, contributed net income after tax of €5.2 million. Other than this, there was no material effect on the earnings, financial and net assets position of the Continental Corporation as at December 31, 2018.
Two asset deals took place in the Tire segment. €2.7 million of the purchase prices totaling €2.9 million was paid in cash. The remain-ing amount is recorded as a purchase price liability of €0.2 million. The purchase price allocations resulted in intangible assets of €2.1
million. Other than this, there was no material effect on the earnings, financial and net assets position of the Continental Corporation as at December 31, 2018.
Another share deal took place in the Tire segment. The purchase price of €10.7 million was paid in cash. The purchase price alloca-tion resulted in goodwill of €6.2 million. Other than this, there was no material effect on the earnings, financial and net assets position of the Continental Corporation as at December 31, 2018.
One asset deal took place in the Interior segment. The purchase price of €0.0 million was paid in cash. The purchase price allocation resulted in a bargain purchase effect of €2.9 million, which was rec-ognized in profit or loss under other income. Other than this, there was no material effect on the earnings, financial and net assets po-sition of the Continental Corporation as at December 31, 2018.
In the ContiTech segment, there was an acquisition of remaining shares for a purchase price of €2.6 million. The resulting difference of €2.5 million between the purchase price and the carrying amount of the acquired shares was recognized in other comprehensive in-come.
One share deal took place in the Chassis & Safety segment. The purchase price of €3.5 million was fully paid in cash. The provi-sional purchase price allocation resulted in goodwill of €3.1 million and intangible assets of €0.2 million. Other than this, there was no material effect on the earnings, financial and net assets position of the Continental Corporation as at December 31, 2018.
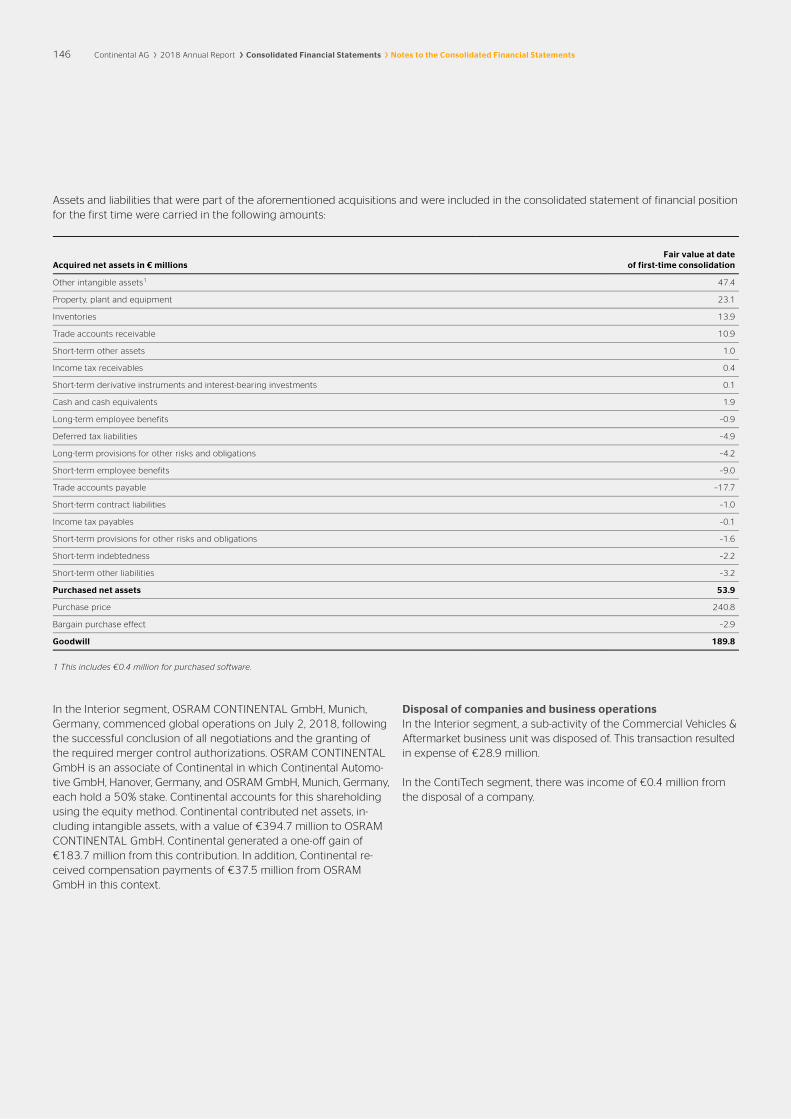
146 Continental AG 2018 Annual Report Consolidated Financial Statements Notes to the Consolidated Financial Statements
Assets and liabilities that were part of the aforementioned acquisitions and were included in the consolidated statement of financial position for the first time were carried in the following amounts:
Acquired net assets in € millions Fair value at date
of first-time consolidation
Other intangible assets1 47.4
Property, plant and equipment 23.1
Inventories 13.9
Trade accounts receivable 10.9
Short-term other assets 1.0
Income tax receivables 0.4
Short-term derivative instruments and interest-bearing investments 0.1
Cash and cash equivalents 1.9
Long-term employee benefits –0.9
Deferred tax liabilities –4.9
Long-term provisions for other risks and obligations –4.2
Short-term employee benefits –9.0
Trade accounts payable –17.7
Short-term contract liabilities –1.0
Income tax payables –0.1
Short-term provisions for other risks and obligations –1.6
Short-term indebtedness –2.2
Short-term other liabilities –3.2
Purchased net assets 53.9
Purchase price 240.8
Bargain purchase effect –2.9
Goodwill 189.8
1 This includes €0.4 million for purchased software.
In the Interior segment, OSRAM CONTINENTAL GmbH, Munich, Germany, commenced global operations on July 2, 2018, following the successful conclusion of all negotiations and the granting of the required merger control authorizations. OSRAM CONTINENTAL GmbH is an associate of Continental in which Continental Automo-tive GmbH, Hanover, Germany, and OSRAM GmbH, Munich, Germany, each hold a 50% stake. Continental accounts for this shareholding using the equity method. Continental contributed net assets, in-cluding intangible assets, with a value of €394.7 million to OSRAM CONTINENTAL GmbH. Continental generated a one-off gain of €183.7 million from this contribution. In addition, Continental re-ceived compensation payments of €37.5 million from OSRAM GmbH in this context.
Disposal of companies and business operations In the Interior segment, a sub-activity of the Commercial Vehicles & Aftermarket business unit was disposed of. This transaction resulted in expense of €28.9 million.
In the ContiTech segment, there was income of €0.4 million from the disposal of a company.

Continental AG 2018 Annual Report Consolidated Financial Statements Notes to the Consolidated Financial Statements 147
6. Revenue from Contracts with Customers
In addition to the comments in Note 2 (General Information and Accounting Principles) and Note 3 (New Accounting Principles), the disclosure requirements that arise in relation to IFRS 15, Revenue from Contracts with Customers, are grouped together in this Note.
Information on the transition to IFRS 15 and its first-time adoption IFRS 15 was first applied in the Continental Corporation as at Janu-ary 1, 2018. As the transition method, the effects of the first-time adoption of IFRS 15 starting from January 1, 2018, on contracts for which the performance obligations have not yet been satisfied were recorded as a cumulative effect in the opening balance sheet as at the same date. As a practical expedient for the transition to IFRS 15, the corporation applied IFRS 15.C5 (c), under which the transaction price from fiscal 2017 – which is attributable to perfor-mance obligations not yet satisfied – is not required to be disclosed. With the clarifications to IFRS 15, Revenue from Contracts with Customers, the IASB made targeted amendments to IFRS 15 with respect to the following topics: identifying performance obligations, principal versus agent considerations, and licensing. The clarifica-tions were likewise required to be applied for annual periods begin-ning on or after January 1, 2018.
The first-time adoption of IFRS 15, Revenue from Contracts with Customers, resulted in the following effects on the earnings, finan-cial and net assets position:
› Due to the application of the modified retrospective approach in accordance with IFRS 15.C3 (b), the cumulative effect of the first-time adoption of IFRS 15 in the amount of €30.3 million before taxes (€21.9 million after taxes) was recognized as an increase in the opening carrying amount of the retained earnings as of the date of the first-time adoption. The values of comparative periods are based on the accounting principles of IAS 18, Revenue, and IAS 11, Construction Contracts, and are shown unadjusted.
If IFRS 15 had not been applied, the application of the former accounting methods would have had the following effects in the current reporting period:
› Net income would have amounted to €2,871.6 million (€2,958.3 million with IFRS 15 applied).
› Sales would have amounted to €44,374.9 million (€44,404.4 mil-lion with IFRS 15 applied) and the cost of sales would have come to €33,288.1 million (€33,299.5 million with IFRS 15 applied).
› Research and development expenses (net) would have amounted to €3,209.0 million. With IFRS 15 applied, research and develop-ment expenses amounted to €4,280.2 million. These figures in-clude the capitalization of development costs in inventories in the amount of €105.0 million. By contrast, other income would have totaled €732.3 million (€1,803.4 million with IFRS 15 applied). Information on the changes in accounting is provided later in this Note in the section on “Material changes in accounting policies due to IFRS 15” and in the following comments.
› Income tax expense would have amounted to €855.2 million (€891.6 million with IFRS 15 applied).
› Not taking into account contract assets, trade accounts receivable would have been reported in the amount of €7,642.1 million (€7,631.9 million with IFRS 15 applied) and inventories, not in-cluding the capitalization of development costs, would have been reported in the amount of €4,424.2 million (€4,521.1 million with IFRS 15 applied). In connection with the changes in accounting, contract assets of €67.5 million are reported as at the end of the reporting period. These are chiefly attributable firstly to the recog-nition of project business – please refer to the following section “Information on revenues in smaller business areas” in this regard. Secondly, there were reclassifications from trade accounts receiv-able and inventories due to the application of IFRS 15.
› Contract liabilities of €161.2 million would have been recognized under other liabilities. Overall, this would therefore have resulted in other liabilities of €741.2 million (€580.0 million with IFRS 15 applied). Information on the changes in accounting is provided later in this Note in the section “Information on revenues in smaller business areas.”
Consolidated equity would have amounted to €18,224.9 million if IFRS 15 had not been applied (€18,333.3 million with IFRS 15 applied).
Notes to the Consolidated Statement of Income
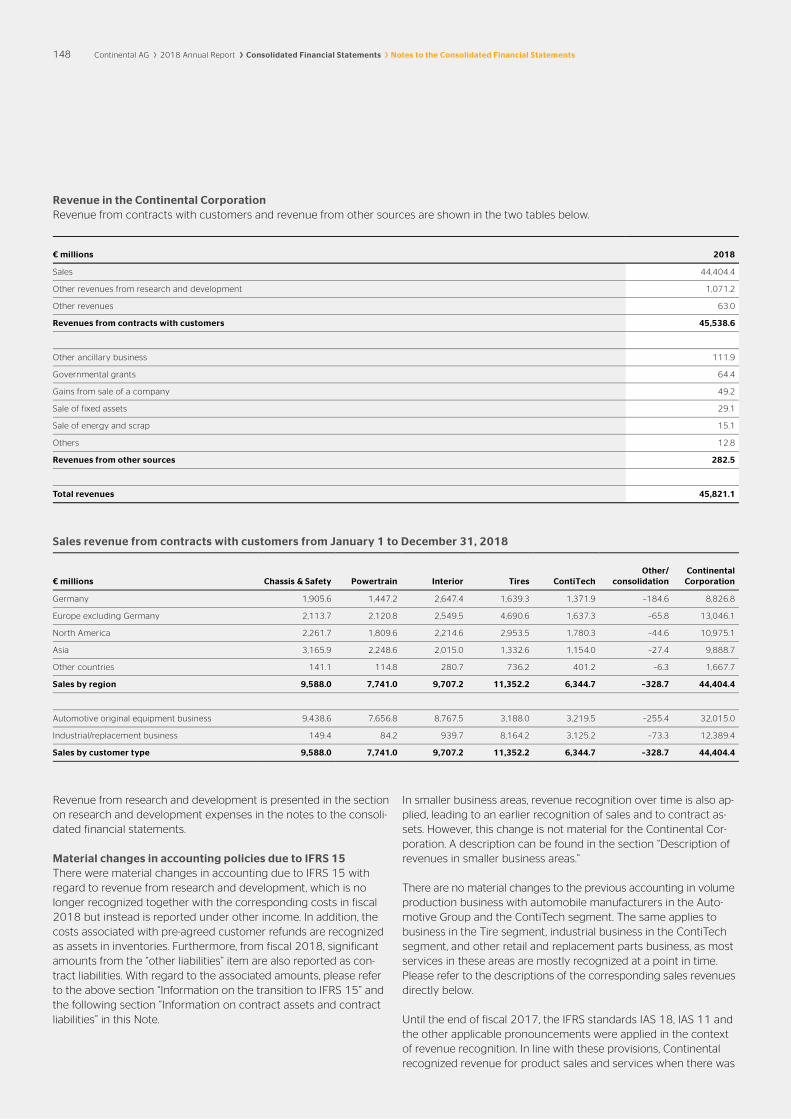
148 Continental AG 2018 Annual Report Consolidated Financial Statements Notes to the Consolidated Financial Statements
Revenue in the Continental Corporation Revenue from contracts with customers and revenue from other sources are shown in the two tables below.
€ millions 2018
Sales 44,404.4
Other revenues from research and development 1,071.2
Other revenues 63.0
Revenues from contracts with customers 45,538.6
Other ancillary business 111.9
Governmental grants 64.4
Gains from sale of a company 49.2
Sale of fixed assets 29.1
Sale of energy and scrap 15.1
Others 12.8
Revenues from other sources 282.5
Total revenues 45,821.1
Sales revenue from contracts with customers from January 1 to December 31, 2018
€ millions Chassis & Safety Powertrain Interior Tires ContiTech Other/
consolidation Continental
Corporation
Germany 1,905.6 1,447.2 2,647.4 1,639.3 1,371.9 –184.6 8,826.8
Europe excluding Germany 2,113.7 2,120.8 2,549.5 4,690.6 1,637.3 –65.8 13,046.1
North America 2,261.7 1,809.6 2,214.6 2,953.5 1,780.3 –44.6 10,975.1
Asia 3,165.9 2,248.6 2,015.0 1,332.6 1,154.0 –27.4 9,888.7
Other countries 141.1 114.8 280.7 736.2 401.2 –6.3 1,667.7
Sales by region 9,588.0 7,741.0 9,707.2 11,352.2 6,344.7 –328.7 44,404.4
Automotive original equipment business 9,438.6 7,656.8 8,767.5 3,188.0 3,219.5 –255.4 32,015.0
Industrial/replacement business 149.4 84.2 939.7 8,164.2 3,125.2 –73.3 12,389.4
Sales by customer type 9,588.0 7,741.0 9,707.2 11,352.2 6,344.7 –328.7 44,404.4
Revenue from research and development is presented in the section on research and development expenses in the notes to the consoli-dated financial statements.
Material changes in accounting policies due to IFRS 15 There were material changes in accounting due to IFRS 15 with regard to revenue from research and development, which is no longer recognized together with the corresponding costs in fiscal 2018 but instead is reported under other income. In addition, the costs associated with pre-agreed customer refunds are recognized as assets in inventories. Furthermore, from fiscal 2018, significant amounts from the “other liabilities” item are also reported as con-tract liabilities. With regard to the associated amounts, please refer to the above section “Information on the transition to IFRS 15” and the following section “Information on contract assets and contract liabilities” in this Note.
In smaller business areas, revenue recognition over time is also ap-plied, leading to an earlier recognition of sales and to contract as-sets. However, this change is not material for the Continental Cor-poration. A description can be found in the section “Description of revenues in smaller business areas.”
There are no material changes to the previous accounting in volume production business with automobile manufacturers in the Auto-motive Group and the ContiTech segment. The same applies to business in the Tire segment, industrial business in the ContiTech segment, and other retail and replacement parts business, as most services in these areas are mostly recognized at a point in time. Please refer to the descriptions of the corresponding sales revenues directly below.
Until the end of fiscal 2017, the IFRS standards IAS 18, IAS 11 and the other applicable pronouncements were applied in the context of revenue recognition. In line with these provisions, Continental recognized revenue for product sales and services when there was

Continental AG 2018 Annual Report Consolidated Financial Statements Notes to the Consolidated Financial Statements 149
proof or an agreement to the effect that delivery had been made or the services performed and that the risks had been transferred to the customer. Revenues from made-to-order production were recognized using the percentage-of-completion method. The ratio of costs already incurred to the estimated total costs associated with the contract served as the basis of calculation. The percent-age-of-completion method was of immaterial to the Continental Corporation.
Multi-component contracts that contain distinct performance obli-gations with different timing of revenue recognition are also not currently material in the Continental Corporation.
Description of sales revenues in automotive original equipment business The type of performance obligations to customers in automotive original equipment business relates to the diverse and predominantly customer-specific products of the Automotive Group, the ContiTech segment and the original equipment business of the Tire segment; please also refer to the descriptions of the divisions in the Corpo-rate Management Report. Invoices are generally prepared once a month, while the payment terms average 60 days and differ mostly on a regional basis only. Payments are made by bank transfer in the vast majority of cases and no significant discounts on the in-voice amount are granted; however, customer bonuses and other price reductions are included in the transaction price as variable price components in line with expectations. The customers do not usually make any significant advance payments. Revenue is almost always recognized over time using an output-based measurement method, and sales revenues are measured based on the products that leave the production plant, as the products are produced and delivered “just in time.” There are no significant obligations from the right of customers to return products, or from reimbursements to customers or similar obligations, or from warranty commitments that include a service component.
Description of sales revenues in industrial and replacement business The type of performance obligations to customers in industrial and replacement business relates to the replacement tire and retail business of the Tire segment, the industrial and retail business of the ContiTech segment, and the replacement parts and retail busi-ness of the Automotive Group; please also refer to the descriptions of the divisions in the Corporate Management Report. Invoices are generally prepared once a month, while the payment terms average 60 days and differ mostly depending on the region and/or product group. Payments are made by bank transfer in the vast majority of cases, with the exception of business with end customers and con-sumers, who often pay in cash. No significant discounts on the in-voice amount are granted; however, customer bonuses and other price reductions are included in the transaction price as variable price components in line with expectations. The customers do not usually make any significant advance payments. Revenue is recog-nized at the point in time when control is transferred to the cus-tomer, also taking account of the agreed incoterms. There are no significant obligations from the right of customers to return prod-ucts, or from reimbursements to customers or similar obligations, or from warranty commitments that include a service component.
Description of revenues in smaller business areas Revenues in smaller business areas are included in the sales of the automotive original equipment business, in the sales of the indus-trial and replacement business, and in other revenues. On the one hand, services are provided and, on the other, project business is conducted in which developments for customers are made, goods produced or services provided over a medium-term or longer pe-riod. Except in the case of revenues from research and develop-ment, as also shown above in the section on significant changes in accounting, these smaller business areas are only of minor signifi-cance for Continental. For all of these revenues, there are no signifi-cant obligations from the right of customers to return products, or from reimbursements to customers or similar obligations, or from warranty commitments that include a service component.
The largest component of these revenues relates to revenues from research and development, which are recognized at a point in time, either when the entire development is completed or when identifi-able milestones within a development are reached. Invoices are generally prepared after completion – of an entire development or a milestone – and acceptance by the customer. Payments are made by bank transfer in the vast majority of cases. No significant dis-counts on the invoice amount are granted. The customers do not usually make any significant advance payments.
In addition and in smaller amounts, services that are performed alongside the main business lead to revenue recognition over time. Both input- and output-based measurement methods are used and sales are measured either based on the hours or days worked or the costs incurred (input), or based on the goods or services pro-vided (output). Invoices are generally prepared at least once a month and payments are made by bank transfer in the vast major-ity of cases. No significant discounts on the invoice amount are granted. The customers do not usually make any significant ad-vance payments.
In addition, project business is conducted, in which generally cus-tomer-specific goods or services are produced or provided for cus-tomers over a medium-term or longer period. Revenue from this is likewise recognized over time and sales are mostly measured using input-based measurement methods, taking account of the costs in-curred. Invoices are generally issued as contractually agreed. Ad-vance payments averaging 30% are usually made by the custom-ers before the start of a project. Payments are made by bank trans-fer in the vast majority of cases. No significant discounts on the in-voice amount are granted.
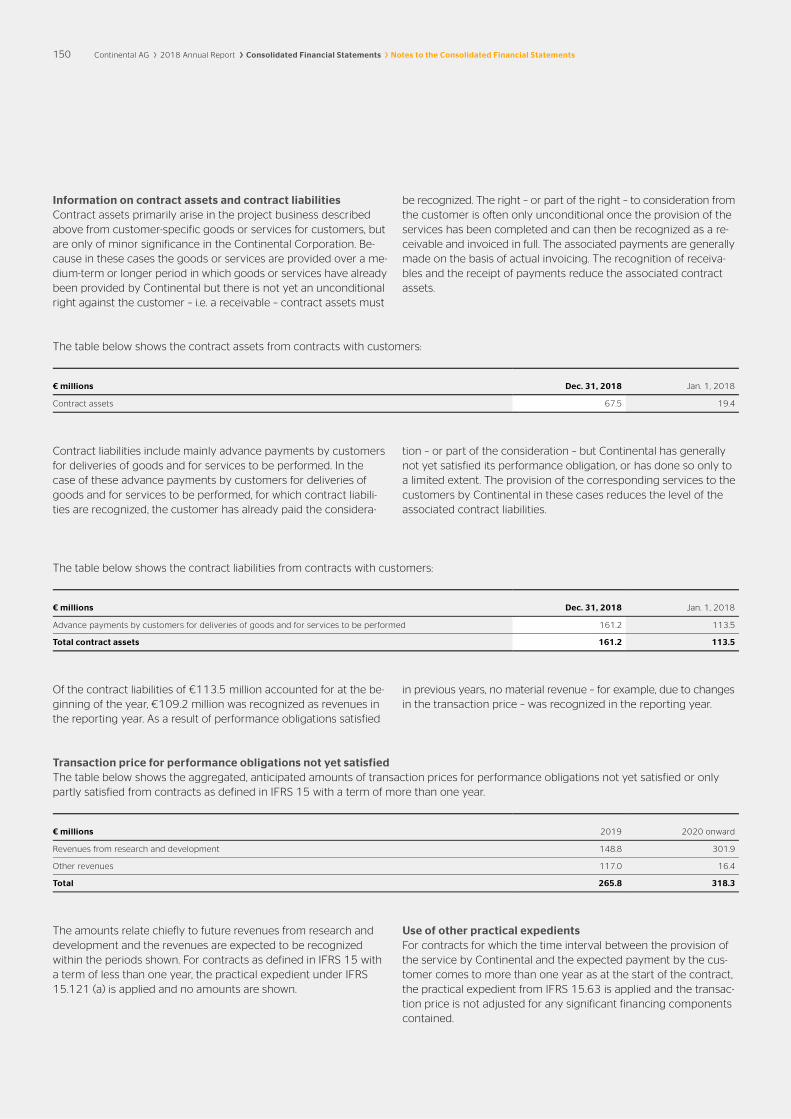
150 Continental AG 2018 Annual Report Consolidated Financial Statements Notes to the Consolidated Financial Statements
Information on contract assets and contract liabilities Contract assets primarily arise in the project business described above from customer-specific goods or services for customers, but are only of minor significance in the Continental Corporation. Be-cause in these cases the goods or services are provided over a me-dium-term or longer period in which goods or services have already been provided by Continental but there is not yet an unconditional right against the customer – i.e. a receivable – contract assets must
be recognized. The right – or part of the right – to consideration from the customer is often only unconditional once the provision of the services has been completed and can then be recognized as a re-ceivable and invoiced in full. The associated payments are generally made on the basis of actual invoicing. The recognition of receiva-bles and the receipt of payments reduce the associated contract assets.
The table below shows the contract assets from contracts with customers:
€ millions Dec. 31, 2018 Jan. 1, 2018
Contract assets 67.5 19.4
Contract liabilities include mainly advance payments by customers for deliveries of goods and for services to be performed. In the case of these advance payments by customers for deliveries of goods and for services to be performed, for which contract liabili-ties are recognized, the customer has already paid the considera-
tion – or part of the consideration – but Continental has generally not yet satisfied its performance obligation, or has done so only to a limited extent. The provision of the corresponding services to the customers by Continental in these cases reduces the level of the associated contract liabilities.
The table below shows the contract liabilities from contracts with customers:
€ millions Dec. 31, 2018 Jan. 1, 2018
Advance payments by customers for deliveries of goods and for services to be performed 161.2 113.5
Total contract assets 161.2 113.5
Of the contract liabilities of €113.5 million accounted for at the be-ginning of the year, €109.2 million was recognized as revenues in the reporting year. As a result of performance obligations satisfied
in previous years, no material revenue – for example, due to changes in the transaction price – was recognized in the reporting year.
Transaction price for performance obligations not yet satisfied The table below shows the aggregated, anticipated amounts of transaction prices for performance obligations not yet satisfied or only partly satisfied from contracts as defined in IFRS 15 with a term of more than one year.
€ millions 2019 2020 onward
Revenues from research and development 148.8 301.9
Other revenues 117.0 16.4
Total 265.8 318.3
The amounts relate chiefly to future revenues from research and development and the revenues are expected to be recognized within the periods shown. For contracts as defined in IFRS 15 with a term of less than one year, the practical expedient under IFRS 15.121 (a) is applied and no amounts are shown.
Use of other practical expedients For contracts for which the time interval between the provision of the service by Continental and the expected payment by the cus-tomer comes to more than one year as at the start of the contract, the practical expedient from IFRS 15.63 is applied and the transac-tion price is not adjusted for any significant financing components contained.
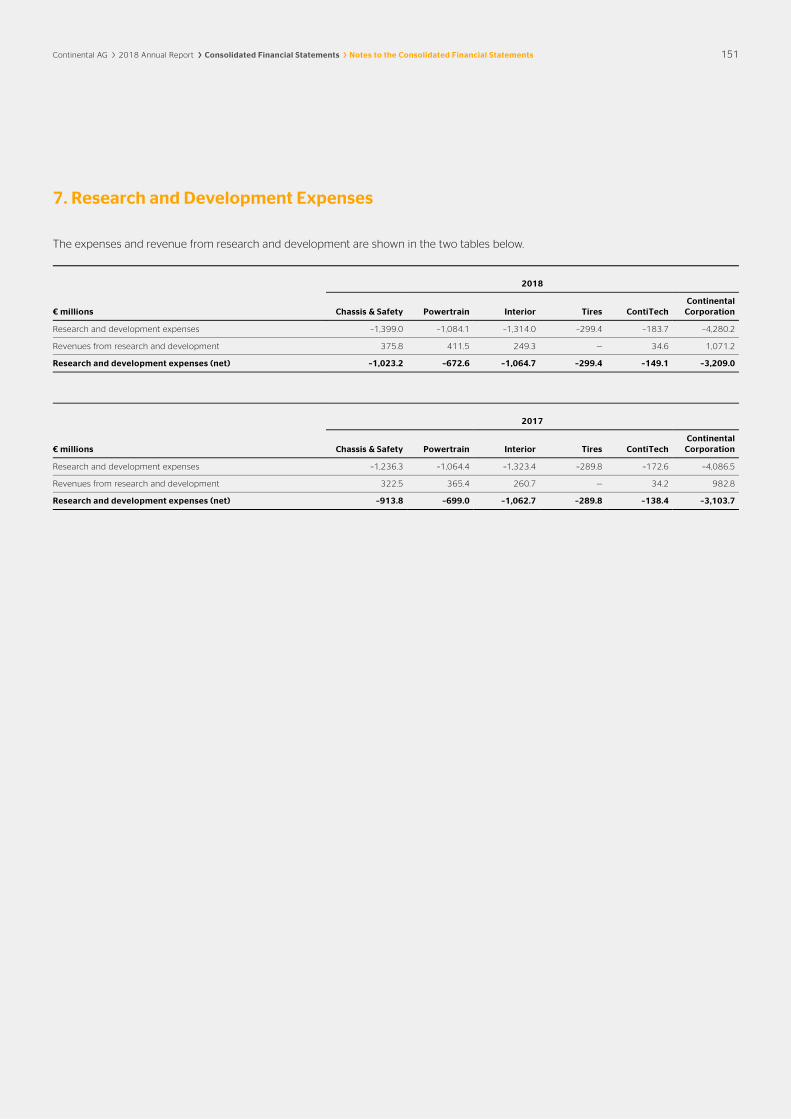
Continental AG 2018 Annual Report Consolidated Financial Statements Notes to the Consolidated Financial Statements 151
7. Research and Development Expenses
The expenses and revenue from research and development are shown in the two tables below.
2018
€ millions Chassis & Safety Powertrain Interior Tires ContiTech Continental
Corporation
Research and development expenses –1,399.0 –1,084.1 –1,314.0 –299.4 –183.7 –4,280.2
Revenues from research and development 375.8 411.5 249.3 — 34.6 1,071.2
Research and development expenses (net) –1,023.2 –672.6 –1,064.7 –299.4 –149.1 –3,209.0
2017
€ millions Chassis & Safety Powertrain Interior Tires ContiTech Continental
Corporation
Research and development expenses –1,236.3 –1,064.4 –1,323.4 –289.8 –172.6 –4,086.5
Revenues from research and development 322.5 365.4 260.7 — 34.2 982.8
Research and development expenses (net) –913.8 –699.0 –1,062.7 –289.8 –138.4 –3,103.7

152 Continental AG 2018 Annual Report Consolidated Financial Statements Notes to the Consolidated Financial Statements
8. Other Income and Expenses
€ millions 2018 2017
Other income 1,803.4 584.5
Other expenses –1,027.5 –796.6
Other income and expenses 775.9 –212.1
Other income
€ millions 2018 2017
Income from research and development 1,071.2 —
Income from the disposal of companies and business operations 187.1 14.4
Compensation from customers and suppliers 90.2 31.9
Income from the reversal of provisions 83.5 194.6
Income from the reimbursement of customer tooling expenses 63.0 81.2
Income from the reversal of impairment on financial assets and contract assets1 29.8 25.0
Income from the disposal of property, plant and equipment 29.1 28.1
Income from the reversal of provisions for litigation and environmental risks 26.6 29.7
Income from the reversal of provisions for severance payments 8.5 2.5
Bargain purchase effect 2.9 —
Reversal of impairment losses on property, plant and equipment 2.8 5.9
Miscellaneous 208.7 171.2
Other income 1,803.4 584.5
1 The previous year’s figure shows the reversal of allowances on receivables in accordance with IAS 39.
Other income increased by €1,218.9 million to €1,803.4 million (PY: €584.5 million) in the reporting period.
Income from research and development in the amount of €1,071.2 million (PY: —) is attributable to the first-time adoption of IFRS 15. For more information, please see Note 6.
Disposals of companies and business operations resulted in income of €187.1 million (PY: €14.4 million) in 2018.
Compensation for claims against customers and suppliers resulted in income totaling €90.2 million (PY: €31.9 million) in the reporting period.
The reversal of specific warranty provisions and provisions for restructuring measures resulted in income of €83.5 million (PY: €194.6 million) in the reporting period.
Reimbursements for customer tooling resulted in income of €63.0 million (PY: €81.2 million) in 2018.
The income from the reversal of allowances on receivables was €29.8 million (PY: €25.0 million).
Income of €29.1 million (PY: €28.1 million) was generated from the disposal of property, plant and equipment in the period under review.
The reversal of provisions for litigation and environmental risks resulted in income totaling €26.6 million (PY: €29.7 million).
Income of €8.5 million (PY: €2.5 million) arose from the reversal of provisions for severance payments in 2018.
An acquisition in the reporting period resulted in a bargain purchase effect of €2.9 million (PY: —).
Reversal of impairment losses on property, plant and equipment resulted in total income of €2.8 million (PY: €5.9 million).
The “Miscellaneous” item includes proceeds from license agree-ments and income from insurance compensation due to damage to property, plant and equipment caused by force majeure. In addition, government grants amounting to €8.7 million (PY: €12.9 million) that were not intended for investments in non-current as-sets were received and recognized in profit or loss in the “Miscella-neous” item.

Continental AG 2018 Annual Report Consolidated Financial Statements Notes to the Consolidated Financial Statements 153
Other expenses
€ millions 2018 2017
Additions to specific warranty provisions and provisions for restructuring measures 348.4 326.0
Additions to provisions for litigation and environmental risks 91.6 101.8
Expenses from currency translation 86.7 29.7
Compensation to customers and suppliers 71.8 4.3
Expenses from severance payments 63.9 51.2
Expenses from impairment on financial assets and contract assets1 41.6 38.5
Expenses from customer tooling 38.8 59.2
Losses on the disposal of companies and business operations 28.9 2.0
Impairment on property, plant and equipment, and intangible assets 23.5 23.1
Losses on the disposal of property, plant and equipment, and from scrapping 22.2 14.1
Incidental acquisition costs from acquisitions of companies and business operations 2.0 3.3
Impairment on goodwill — 23.0
Miscellaneous 208.1 120.4
Other expenses 1,027.5 796.6
1 The previous year’s figure shows the expenses resulting from valuation allowances on receivables in accordance with IAS 39.
Other expenses increased by €230.9 million to €1,027.5 million (PY: €796.6 million) in the reporting period.
Additions to specific warranty provisions and provisions for re-structuring measures resulted in expenses totaling €348.4 million (PY: €326.0 million).
In connection with provisions for litigation and environmental risks, there were expenses of €91.6 million (PY: €101.8 million).
In the year under review, expenses of €86.7 million (PY: €29.7 mil-lion) were incurred as a result of currency translations from operat-ing receivables and liabilities in foreign currencies not classified as indebtedness.
Compensation for customer and supplier claims that are not war-ranties resulted in expenses of €71.8 million (PY: €4.3 million) in the reporting period.
Personnel adjustments not related to restructuring led to expenses from severance payments of €63.9 million (PY: €51.2 million).
The expenses resulting from valuation allowances for doubtful accounts were €41.6 million (PY: €38.5 million).
Expenses from customer tooling of €38.8 million (PY: €59.2 million) arose in 2018.
Disposals of companies and business operations resulted in losses of €28.9 million (PY: €2.0 million).
Impairment on property, plant and equipment, and intangible assets amounted to €23.5 million (PY: €23.1 million) in the reporting period.
Losses of €22.2 million (PY: €14.1 million) arose from the disposal of property, plant and equipment, and from scrapping activities in 2018.
Incidental acquisition costs of €2.0 million (PY: €3.3 million) were incurred for the acquisition of companies and business operations.
In the Interior segment, goodwill totaling €23.0 million that arose in the previous year in connection with the expansion of our mobility-services activities in the Intelligent Transportation Systems business unit was impaired, outside the scope of the annual impairment test.
The “Miscellaneous” item also includes expenses from other taxes and losses due to force majeure.

154 Continental AG 2018 Annual Report Consolidated Financial Statements Notes to the Consolidated Financial Statements
9. Personnel Expenses
The following total personnel expenses are included in function costs in the income statement:
€ millions 2018 2017
Wages and salaries 9,074.4 8,641.2
Social security contributions 1,704.5 1,685.4
Pension and post-employment benefit costs 346.4 360.7
Personnel expenses 11,125.3 10,687.3
Compared to the 2017 reporting year, personnel expenses rose by €438.0 million to €11,125.3 million (PY: €10,687.3 million). This rise is due in particular to global recruitment activities.
The average number of employees in 2018 was 242,797 (PY: 230,656). As at the end of the year, there were 243,226 (PY: 235,473) employees in the Continental Corporation. Please also see the comments in the Management Report.
10. Income from Investments
€ millions 2018 2017
Income from equity-accounted investees 69.6 76.8
Other income from investments 0.8 0.5
Income from investments 70.4 77.3
Net investment income includes, in particular, the share of earnings of companies accounted for using the equity method in the amount of €69.6 million (PY: €76.8 million).
11. Financial Result
€ millions 2018 2017
Interest and similar income 58.3 26.6
Expected income from long-term employee benefits and from pension funds 64.6 67.8
Interest income 122.9 94.4
Interest and similar expenses –124.4 –123.3
Finance lease expenses –0.8 –1.1
Interest expense for long-term provisions and liabilities –5.1 –5.6
Interest expense from long-term employee benefits –145.9 –151.5
Interest expense –276.2 –281.5
Effects from currency translation –30.4 –138.8
Effects from changes in the fair value of derivative instruments 5.9 38.4
Other valuation effects 0.0 1.8
Effects from changes in the fair value of derivative instruments, and other valuation effects 5.9 40.2
Financial result –177.8 –285.7

Continental AG 2018 Annual Report Consolidated Financial Statements Notes to the Consolidated Financial Statements 155
The negative financial result improved by €107.9 million year-on-year to €177.8 million (PY: €285.7 million) in 2018. This was primar-ily attributable to interest and similar income as well as the sum of the effects from changes in the fair value of derivative instruments and from currency translation.
Interest income in 2018 rose by €28.5 million year-on-year to €122.9 million (PY: €94.4 million). This was mainly due to the fact that, from the reporting year onward, interest income in connection with income tax liabilities, which was previously reported in income tax expense, is also reported in the financial result. Expected income from long-term employee benefits and pension funds totaled €64.6 million in 2018 (PY: €67.8 million). This does not include the inter-est income from the plan assets of the pension contribution funds.
Interest expense totaled €276.2 million in 2018 and was thus €5.3 million lower than the previous year’s figure of €281.5 million. At €130.3 million, interest expense resulting from bank borrowings, capital market transactions and other financing instruments was €0.3 million higher than the prior-year figure of €130.0 million. The major portion related to expense of €54.6 million (PY: €70.7 million) from the bonds issued by Continental AG and Continental Rubber of America, Corp., Wilmington, Delaware, U.S.A. The year-on-year decline in this expense was attributable mainly to the repayment
of the €750.0 million euro bond from Continental AG on July 16, 2018. The five-year bond bore interest at a rate of 3.0% p.a. The interest expense from long-term employee benefits totaled €145.9 million (PY: €151.5 million) in 2018. This does not include the inter-est expense from the defined benefit obligations of the pension contribution funds. In addition, from the reporting year onward, in-terest expense in connection with income tax liabilities, which was previously reported under income tax expense, is also reported in the financial result.
The effects from currency translation resulted in a negative contri-bution to earnings of €30.4 million (PY: €138.8 million) in 2018. This was countered by effects from changes in the fair value of de-rivative instruments, and other valuation effects, which resulted in earnings of €5.9 million (PY: €40.2 million) in 2018. Other valuation effects accounted for €0.0 million (PY: €1.8 million) of this. Taking into account the sum of the effects from currency translation and changes in the fair value of derivative instruments, earnings in 2018 were negatively impacted by €24.5 million (PY: €100.4 million). This was attributable mainly to the development of the Brazilian real in relation to the euro and the U.S. dollar. In the previous year, by contrast, the effects were primarily attributable to the develop-ment of the Mexican peso in relation to the U.S. dollar and of the Brazilian real in relation to the euro.
12. Income Tax Expense
The domestic and foreign income tax expense of the corporation is as follows:
€ millions 2018 2017
Current taxes (domestic) –86.2 –335.5
Current taxes (foreign) –757.0 –852.4
Deferred taxes (domestic) –44.1 46.6
Deferred taxes (foreign) –4.3 –86.2
Income tax expense –891.6 –1,227.5

156 Continental AG 2018 Annual Report Consolidated Financial Statements Notes to the Consolidated Financial Statements
The following table shows the reconciliation of the expected tax expense to the reported tax expense:
€ millions 2018 2017
Earnings before tax 3,849.9 4,275.8
Expected tax expense at the domestic tax rate –1,178.1 –1,308.4
Foreign tax rate differences 277.5 253.3
Non-deductible expenses and non-imputable withholding taxes –146.1 –171.7
Incentives and tax holidays 134.6 133.5
Taxes for previous years 100.0 –59.7
Non-recognition of deferred tax assets unlikely to be realized –79.6 –91.0
Change in permanent differences –28.6 5.5
Realization of previously non-recognized deferred taxes 27.0 11.3
Tax effect from equity-accounted investees 16.0 22.5
Local income tax with different tax base –12.3 –19.5
Effects from changes in enacted tax rate –6.9 5.1
Other1 4.9 –8.4
Income tax expense –891.6 –1,227.5
Effective tax rate in % 23.2 28.7
1 The previous year’s figures have been adjusted in line with the structure in 2018.
The average domestic tax rate in 2018 was 30.6% (PY: 30.6%). This takes into account a corporate tax rate of 15.0% (PY: 15.0%), a soli-darity surcharge of 5.5% (PY: 5.5%) and a trade tax rate of 14.8% (PY: 14.8%).
The reduction in the tax expense from the difference in foreign tax rates primarily reflects the volume of activities in Eastern Europe and Asia.
As in the previous year, foreign tax rate differences, incentives and tax holidays had positive effects in the year under review. The tax rate was negatively impacted by non-cash allowances on deferred tax assets totaling €79.6 million (PY: €91.0 million), of which €16.4 million (PY: €40.2 million) was for previous years. Furthermore, as in the previous year, the tax rate was negatively affected by non- deductible expenses and non-imputable foreign withholding tax. The tax rate in fiscal 2018 was also impacted positively by the effects of U.S. tax reform and influenced by tax refunds for previous years as a result of a supreme court ruling in Germany. Please see Note 18.
The tax effects from government incentives and tax holidays in-creased in comparison to the previous year. In addition to the on-going utilization of incentives in Europe and Asia as in the previous year, the utilization of government incentives in the U.S.A. had a fur-ther positive impact in the reporting year. In the year under review, local income taxes of €12.3 million (PY: €19.5 million) were incurred with a different tax base, mainly in Hungary and the U.S.A.
The result of equity-accounted investees included in net income re-sulted in tax income of €16.0 million (PY: €22.5 million) in the year under review.
The effects of the change in tax rate relate to the remeasurement of deferred tax assets and liabilities due to changes in the law already taking effect with regard to future applicable tax rates.

Continental AG 2018 Annual Report Consolidated Financial Statements Notes to the Consolidated Financial Statements 157
The following table shows the total income tax expense, also including the items reported under reserves recognized directly in equity:
€ millions Dec. 31, 2018 Dec. 31, 2017
Income tax expense (acc. to Consolidated Statement of Income) –891.6 –1,227.5
Tax income on other comprehensive income 33.4 –114.0
Remeasurement of defined benefit plans 30.7 –92.9
Investment in equity-accounted investees 0.0 0.1
Currency translation 2.2 –21.6
Cash flow hedges 0.5 0.4
Total income tax expense –858.2 –1,341.5

158 Continental AG 2018 Annual Report Consolidated Financial Statements Notes to the Consolidated Financial Statements
13. Goodwill and Other Intangible Assets
€ millions Goodwill
Capitalized development
expenses
Other intangible
assets Advances
to suppliers
Total other intangible
assets
As at January 1, 2017
Cost 9,429.1 310.1 2,446.1 19.8 2,776.0
Accumulated amortization –2,571.8 –102.0 –1,159.9 — –1,261.9
Book value 6,857.3 208.1 1,286.2 19.8 1,514.1
Net change in 2017
Book value 6,857.3 208.1 1,286.2 19.8 1,514.1
Exchange-rate changes –123.4 –3.3 –95.2 –0.2 –98.7
Additions — 92.1 51.7 13.0 156.8
Additions from the first-time consolidation of subsidiaries1 299.2 — 359.3 — 359.3
Reclassification to assets held for sale — — –0.1 — –0.1
Transfers — — 15.2 –15.2 —
Disposals — — –1.7 –0.1 –1.8
Amortization — –74.5 –247.8 — –322.3
Impairment –23.0 — 0.0 — 0.0
Book value 7,010.1 222.4 1,367.6 17.3 1,607.3
As at December 31, 2017
Cost 9,597.7 393.5 2,705.7 17.3 3,116.5
Accumulated amortization –2,587.6 –171.1 –1,338.1 — –1,509.2
Book value 7,010.1 222.4 1,367.6 17.3 1,607.3
Net change in 2018
Book value 7,010.1 222.4 1,367.6 17.3 1,607.3
Exchange-rate changes 33.5 1.2 17.2 1.2 19.6
Additions — 157.9 54.5 19.4 231.8
Additions from the first-time consolidation of subsidiaries 189.8 — 47.4 — 47.4
Amounts disposed of through disposal of subsidiaries — — 0.0 — 0.0
Transfers — — 7.5 –7.8 –0.3
Disposals — — –0.2 –0.3 –0.5
Amortization — –90.0 –249.0 — –339.0
Impairment — — 0.0 — 0.0
Book value 7,233.4 291.5 1,245.0 29.8 1,566.3
As at December 31, 2018
Cost 9,823.5 552.1 2,818.5 29.8 3,400.4
Accumulated amortization –2,590.1 –260.6 –1,573.5 — –1,834.1
Book value 7,233.4 291.5 1,245.0 29.8 1,566.3
1 Including subsequent adjustment from purchase price allocations. Included in the additions from the first-time consolidation of subsidiaries are additions from other intangible assets in the amount of €1.4 million from a previously unconsolidated entity that was included in the consolidation for the first time.
Acquisitions of companies in 2018 resulted in an addition to good-will totaling €189.8 million (PY: €299.2 million). The carrying amount of goodwill relates principally to the acquisitions of Siemens VDO
(2007), Continental Teves (1998), the automotive electronics busi-ness from Motorola (2006), Elektrobit Automotive (2015), Veyance Technologies (2015) and Continental Temic (2001).
Notes to the Consolidated Statement of Financial Position
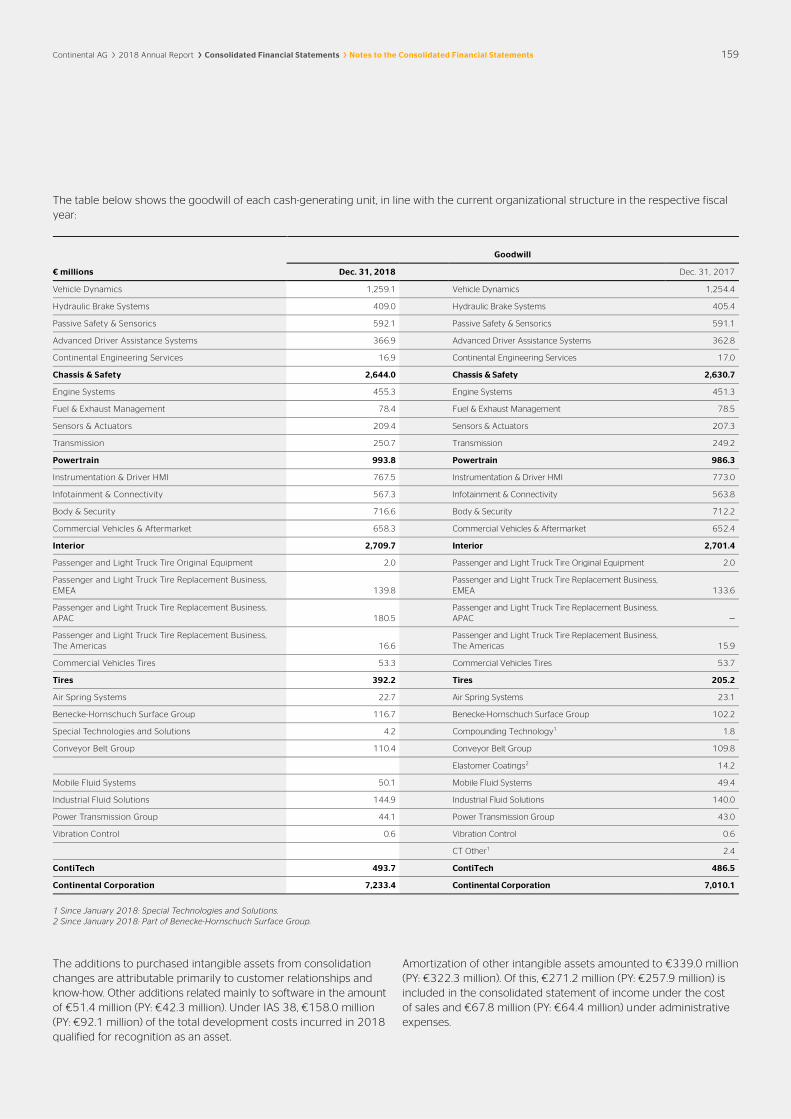
Continental AG 2018 Annual Report Consolidated Financial Statements Notes to the Consolidated Financial Statements 159
The table below shows the goodwill of each cash-generating unit, in line with the current organizational structure in the respective fiscal year:
Goodwill
€ millions Dec. 31, 2018 Dec. 31, 2017
Vehicle Dynamics 1,259.1 Vehicle Dynamics 1,254.4
Hydraulic Brake Systems 409.0 Hydraulic Brake Systems 405.4
Passive Safety & Sensorics 592.1 Passive Safety & Sensorics 591.1
Advanced Driver Assistance Systems 366.9 Advanced Driver Assistance Systems 362.8
Continental Engineering Services 16.9 Continental Engineering Services 17.0
Chassis & Safety 2,644.0 Chassis & Safety 2,630.7
Engine Systems 455.3 Engine Systems 451.3
Fuel & Exhaust Management 78.4 Fuel & Exhaust Management 78.5
Sensors & Actuators 209.4 Sensors & Actuators 207.3
Transmission 250.7 Transmission 249.2
Powertrain 993.8 Powertrain 986.3
Instrumentation & Driver HMI 767.5 Instrumentation & Driver HMI 773.0
Infotainment & Connectivity 567.3 Infotainment & Connectivity 563.8
Body & Security 716.6 Body & Security 712.2
Commercial Vehicles & Aftermarket 658.3 Commercial Vehicles & Aftermarket 652.4
Interior 2,709.7 Interior 2,701.4
Passenger and Light Truck Tire Original Equipment 2.0 Passenger and Light Truck Tire Original Equipment 2.0
Passenger and Light Truck Tire Replacement Business, EMEA 139.8
Passenger and Light Truck Tire Replacement Business, EMEA 133.6
Passenger and Light Truck Tire Replacement Business, APAC 180.5
Passenger and Light Truck Tire Replacement Business, APAC —
Passenger and Light Truck Tire Replacement Business, The Americas 16.6
Passenger and Light Truck Tire Replacement Business, The Americas 15.9
Commercial Vehicles Tires 53.3 Commercial Vehicles Tires 53.7
Tires 392.2 Tires 205.2
Air Spring Systems 22.7 Air Spring Systems 23.1
Benecke-Hornschuch Surface Group 116.7 Benecke-Hornschuch Surface Group 102.2
Special Technologies and Solutions 4.2 Compounding Technology1 1.8
Conveyor Belt Group 110.4 Conveyor Belt Group 109.8
Elastomer Coatings2 14.2
Mobile Fluid Systems 50.1 Mobile Fluid Systems 49.4
Industrial Fluid Solutions 144.9 Industrial Fluid Solutions 140.0
Power Transmission Group 44.1 Power Transmission Group 43.0
Vibration Control 0.6 Vibration Control 0.6
CT Other1 2.4
ContiTech 493.7 ContiTech 486.5
Continental Corporation 7,233.4 Continental Corporation 7,010.1
1 Since January 2018: Special Technologies and Solutions. 2 Since January 2018: Part of Benecke-Hornschuch Surface Group.
The additions to purchased intangible assets from consolidation changes are attributable primarily to customer relationships and know-how. Other additions related mainly to software in the amount of €51.4 million (PY: €42.3 million). Under IAS 38, €158.0 million (PY: €92.1 million) of the total development costs incurred in 2018 qualified for recognition as an asset.
Amortization of other intangible assets amounted to €339.0 million (PY: €322.3 million). Of this, €271.2 million (PY: €257.9 million) is included in the consolidated statement of income under the cost of sales and €67.8 million (PY: €64.4 million) under administrative expenses.

160 Continental AG 2018 Annual Report Consolidated Financial Statements Notes to the Consolidated Financial Statements
The other intangible assets include carrying amounts adjusted for translation-related exchange-rate effects and not subject to amorti-zation in the amount of €112.2 million (PY: €112.2 million).
These relate in particular to the VDO brand name in the amount of €71.2 million, the Elektrobit brand name in the amount of €30.4 million, the Phoenix brand name in the amount of €4.2 million and the Matador brand name in the amount of €3.2 million. The pur-chased intangible assets also include the carrying amounts of soft-ware amounting to €102.7 million (PY: €114.4 million), which are amortized on a straight-line basis as scheduled.
14. Property, Plant and Equipment
The additions to property, plant and equipment from changes in the scope of consolidation in the amount of €23.1 million essen-tially resulted from the acquisition of Tyre and Auto Pty Ltd, Mel-bourne, Australia. Please see Note 5.
Investments in the Chassis & Safety segment focused on both in-creasing production capacity in Europe and expanding the locations in Asia and North America. Production capacity was hereby in-creased for all business units. Important additions related to the creation of new production facilities for electronic brake systems.
In the Powertrain segment, production capacity was increased at the German locations and in China, Czechia, the U.S.A. and Romania. Important additions related to the Engine Systems and Sensors & Actuators business units. In the Engine Systems business unit, man-ufacturing capacity for engine injection systems was expanded.
In the Interior segment, there were major investments in expanding production capacity at the German locations and in China, Roma-nia, Czechia, Mexico and the U.S.A. Investments focused primarily on the expansion of manufacturing capacity for the Instrumenta-tion & Driver HMI and Body & Security business units. In the Instru-mentation & Driver HMI business unit, manufacturing capacity for operation and display solutions was expanded.
In the Tire segment, production capacity was expanded in Europe, North America and Asia. There were major additions relating to the new plant buildings in Rayong, Thailand, and Clinton, Mississippi, U.S.A. Production capacity was also increased at existing plants in Hefei, China; Sumter, South Carolina, U.S.A.; and Lousado, Portugal. Quality assurance and cost-cutting measures were implemented as well.
Investments in the ContiTech segment focused on the expansion of production facilities at the German locations and in China, the U.S.A., Hungary, Mexico and Romania. Production capacity for the Mobile Fluid Systems, Benecke-Hornschuch Surface Group and Power Transmission Group business units was expanded in particu-lar. Furthermore, investments were made in all business units to rationalize existing production processes. Please see Note 8 for information on impairment and reversal of impairment losses.
Government investment grants of €84.6 million (PY: €37.5 million) were deducted directly from cost, primarily for the plant in Clinton, Mississippi, U.S.A.
As in the previous year, no borrowing costs were capitalized when applying IAS 23.
Please see Note 24 for information on reclassifications during the period to assets held for sale.
Property, plant and equipment includes buildings, technical equip-ment and other facilities assigned to the corporation as the benefi-cial owner on the basis of the lease agreement. These relate primar-ily to administration and manufacturing buildings. The leases have an average term of up to 19 years for buildings and five to ten years for technical equipment. The effective interest rate of the main leases is between 2.0% and 5.4% (PY: 2.7% and 9.8%). Some of the main leases include prolongation or purchase options.
There are restrictions on title and property, plant and equipment pledged as security for liabilities in the amount of €13.5 million (PY: €14.1 million).
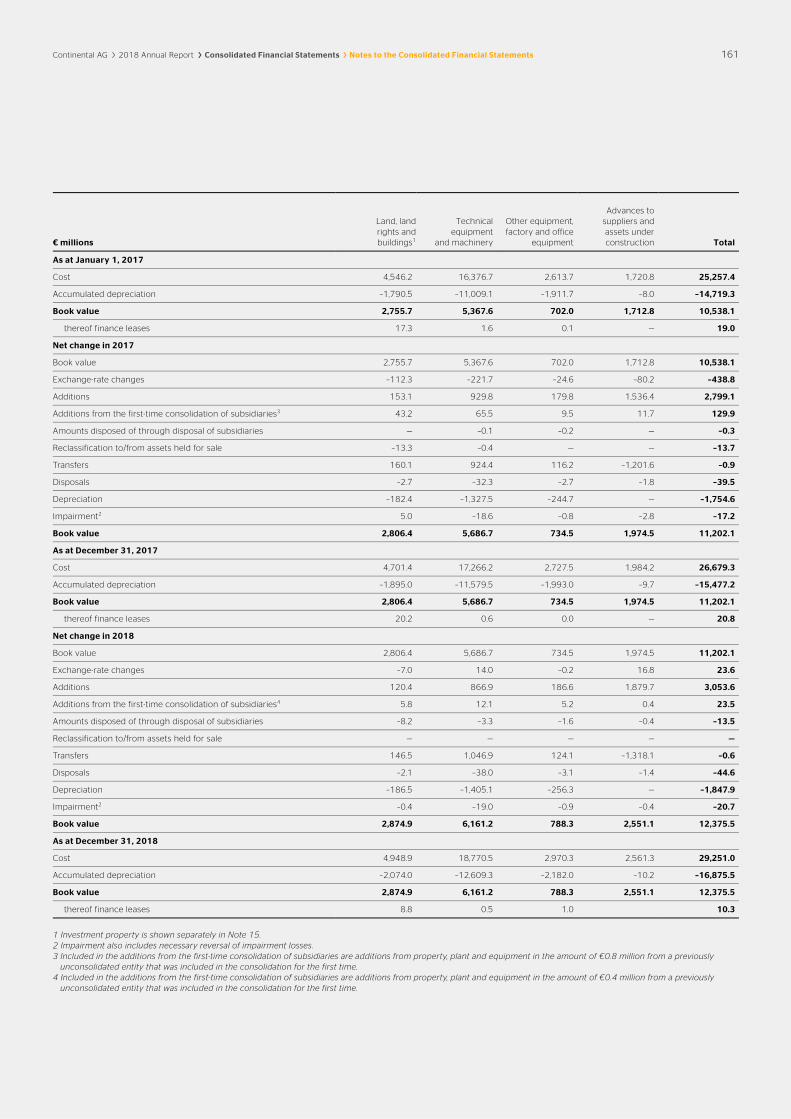
Continental AG 2018 Annual Report Consolidated Financial Statements Notes to the Consolidated Financial Statements 161
€ millions
Land, land rights and buildings1
Technical equipment
and machinery
Other equipment, factory and office
equipment
Advances to suppliers and assets under construction Total
As at January 1, 2017
Cost 4,546.2 16,376.7 2,613.7 1,720.8 25,257.4
Accumulated depreciation –1,790.5 –11,009.1 –1,911.7 –8.0 –14,719.3
Book value 2,755.7 5,367.6 702.0 1,712.8 10,538.1
thereof finance leases 17.3 1.6 0.1 — 19.0
Net change in 2017
Book value 2,755.7 5,367.6 702.0 1,712.8 10,538.1
Exchange-rate changes –112.3 –221.7 –24.6 –80.2 –438.8
Additions 153.1 929.8 179.8 1,536.4 2,799.1
Additions from the first-time consolidation of subsidiaries3 43.2 65.5 9.5 11.7 129.9
Amounts disposed of through disposal of subsidiaries — –0.1 –0.2 — –0.3
Reclassification to/from assets held for sale –13.3 –0.4 — — –13.7
Transfers 160.1 924.4 116.2 –1,201.6 –0.9
Disposals –2.7 –32.3 –2.7 –1.8 –39.5
Depreciation –182.4 –1,327.5 –244.7 — –1,754.6
Impairment2 5.0 –18.6 –0.8 –2.8 –17.2
Book value 2,806.4 5,686.7 734.5 1,974.5 11,202.1
As at December 31, 2017
Cost 4,701.4 17,266.2 2,727.5 1,984.2 26,679.3
Accumulated depreciation –1,895.0 –11,579.5 –1,993.0 –9.7 –15,477.2
Book value 2,806.4 5,686.7 734.5 1,974.5 11,202.1
thereof finance leases 20.2 0.6 0.0 — 20.8
Net change in 2018
Book value 2,806.4 5,686.7 734.5 1,974.5 11,202.1
Exchange-rate changes –7.0 14.0 –0.2 16.8 23.6
Additions 120.4 866.9 186.6 1,879.7 3,053.6
Additions from the first-time consolidation of subsidiaries4 5.8 12.1 5.2 0.4 23.5
Amounts disposed of through disposal of subsidiaries –8.2 –3.3 –1.6 –0.4 –13.5
Reclassification to/from assets held for sale — — — — —
Transfers 146.5 1,046.9 124.1 –1,318.1 –0.6
Disposals –2.1 –38.0 –3.1 –1.4 –44.6
Depreciation –186.5 –1,405.1 –256.3 — –1,847.9
Impairment2 –0.4 –19.0 –0.9 –0.4 –20.7
Book value 2,874.9 6,161.2 788.3 2,551.1 12,375.5
As at December 31, 2018
Cost 4,948.9 18,770.5 2,970.3 2,561.3 29,251.0
Accumulated depreciation –2,074.0 –12,609.3 –2,182.0 –10.2 –16,875.5
Book value 2,874.9 6,161.2 788.3 2,551.1 12,375.5
thereof finance leases 8.8 0.5 1.0 10.3
1 Investment property is shown separately in Note 15. 2 Impairment also includes necessary reversal of impairment losses. 3 Included in the additions from the first-time consolidation of subsidiaries are additions from property, plant and equipment in the amount of €0.8 million from a previously
unconsolidated entity that was included in the consolidation for the first time. 4 Included in the additions from the first-time consolidation of subsidiaries are additions from property, plant and equipment in the amount of €0.4 million from a previously
unconsolidated entity that was included in the consolidation for the first time.

162 Continental AG 2018 Annual Report Consolidated Financial Statements Notes to the Consolidated Financial Statements
15. Investment Property
€ millions 2018 2017
Cost as at January 1 20.7 20.2
Accumulated depreciation as at January 1 –10.2 –9.9
Net change
Book value as at January 1 10.5 10.3
Exchange-rate changes 0.1 –0.2
Reclassifications 1.7 0.7
Depreciation –0.3 –0.3
Book value as at December 31 12.0 10.5
Cost as at December 31 22.3 20.7
Accumulated depreciation as at December 31 –10.3 –10.2
The fair value – determined using the gross rental method – of land and buildings accounted for as investment property as at Decem-ber 31, 2018, amounted to €16.3 million (PY: €16.0 million). Rental
income in 2018 amounted to €3.3 million (PY: €2.7 million), while associated maintenance costs of €1.4 million (PY: €1.2 million) were incurred.
16. Investments in Equity-Accounted Investees
€ millions 2018 2017
As at January 1 414.8 384.8
Additions 215.2 7.6
Changes in the consolidation method, and transfers –1.2 –7.6
Share of income 69.6 76.8
Dividends received –44.2 –40.2
Changes in other comprehensive income –9.8 –3.8
Exchange-rate changes 0.5 –2.8
As at December 31 644.9 414.8
Investments in equity-accounted investees include carrying amounts of joint ventures in the amount of €273.5 million (PY: €260.4 mil-lion) and of associates in the amount of €371.4 million (PY: €154.4 million).
A significant joint venture of the Tire segment in the Passenger and Light Truck Tire Original Equipment business unit is MC Projects B.V., Maastricht, Netherlands, plus its subsidiaries. The company is jointly controlled by Continental Global Holding Netherlands B.V., Maastricht, Netherlands, and Compagnie Financière Michelin SCmA, Granges-Paccot, Switzerland, which each hold 50% of the voting rights; and essentially operates in the field of delivering tire-wheel assemblies for automotive manufacturers. Michelin contrib-uted the rights to the Uniroyal brand for Europe to the joint venture. MC Projects B.V. licenses these rights to Continental.
The following shares were held in significant joint ventures in the Automotive Group:
› Continental AG, Hanover, holds 49% of the voting rights in Shang-hai Automotive Brake Systems Co., Ltd., Shanghai, China, which is jointly controlled with Huayu Automotive Systems Co., Ltd., Shanghai, China. The key business purpose of the company is the production of hydraulic braking systems for the Chinese market; it is assigned to the Hydraulic Brake Systems and Vehicle Dynam-ics business units.
› SAS Autosystemtechnik GmbH & Co. KG, Karlsruhe, Germany, is jointly controlled by Continental Automotive GmbH, Hanover, Germany, and Faurecia Automotive GmbH, Stadthagen, Germany. Both shareholders hold 50% of the voting rights. The object of

Continental AG 2018 Annual Report Consolidated Financial Statements Notes to the Consolidated Financial Statements 163
the company and its subsidiaries is essentially the development, assembly and distribution of cockpits and other modules for the automotive industry. The company therefore belongs to the Instrumentation & Driver HMI business unit.
The figures taken from the last two available sets of IFRS annual financial statements (2017 and 2016) for the main joint ventures above are as follows. Amounts are stated at 100%. Furthermore, the pro rata net assets have been reconciled to the respective car-rying amount. All shares are accounted for using the equity method.
MC Projects B.V. Shanghai Automotive Brake
Systems Co., Ltd. SAS Autosystemtechnik
GmbH & Co. KG
€ millions 2017 2016 2017 2016 2017 2016
Dividends received 5.0 6.0 21.0 18.3 10.0 15.0
Current assets 180.1 166.7 316.4 308.6 406.3 393.7
thereof cash and cash equivalents 37.5 39.6 59.2 64.3 72.9 127.8
Non-current assets 94.7 77.6 105.4 105.1 131.0 89.3
Total assets 274.8 244.3 421.8 413.7 537.4 483.0
Current liabilities 122.6 109.9 220.8 209.3 410.7 368.5
thereof other short-term financial liabilities 0.0 0.0 — — 0.0 0.6
Non-current liabilities 7.4 5.9 14.1 20.2 5.7 4.6
thereof long-term financial liabilities 1.3 1.3 — — — —
Total liabilities 129.9 115.8 234.8 229.5 416.4 373.1
Sales 170.3 153.5 591.6 527.6 3,169.5 3,315.6
Interest income 0.1 0.2 0.9 1.2 0.4 0.5
Interest expense 0.3 0.5 — — 0.1 0.3
Depreciation and amortization 10.8 9.9 14.3 13.0 18.5 19.7
Earnings from continued operations 25.7 23.6 57.2 50.7 37.0 34.0
Other comprehensive income 0.7 –0.5 — — –5.9 –2.3
Income tax expense 7.3 9.1 8.9 7.7 11.2 10.5
Earnings after tax 26.4 23.0 57.2 50.7 31.1 31.7
Net assets 144.9 128.5 187.0 184.2 121.0 109.9
Share of net assets 72.4 64.3 91.6 90.3 60.5 55.0
Goodwill — — 10.6 10.6 20.3 20.3
Exchange-rate changes — — –5.0 –10.7 — —
Change in other comprehensive income for the prior year — — — 3.0 3.0 1.1
Share earnings for prior years –4.8 –6.5 0.0 0.0 —
Carrying amount 67.6 57.8 97.3 93.2 83.7 76.3

164 Continental AG 2018 Annual Report Consolidated Financial Statements Notes to the Consolidated Financial Statements
IAV GmbH Ingenieurgesellschaft Auto und Verkehr, Berlin, Germany, is a material associate. Continental Automotive GmbH, Hanover, Germany, holds 20% of the shares and voting rights. The company, together with its subsidiaries, essentially performs development services for the automotive industry and is assigned to the Engine Systems business unit.
OSRAM CONTINENTAL GmbH, Munich, Germany, along with its subsidiaries was founded in the reporting year and is a material as-sociate of Continental in the Interior segment. Continental Automo-tive GmbH, Hanover, Germany, and OSRAM GmbH, Munich, Ger-
many, each hold a 50% stake in it. The company operates in the field of lights, light control and electronics.
The figures taken from the last two available sets of IFRS annual financial statements for IAV GmbH Ingenieurgesellschaft Auto und Verkehr, Berlin, Germany, (2016 and 2017) and for OSRAM CONTI-NENTAL GmbH, Munich, Germany, (2018) are as follows. Amounts are stated at 100%. Furthermore, the pro rata net assets have been reconciled to the respective carrying amount, which is accounted for using the equity method.
IAV GmbH Ingenieurgesellschaft Auto und Verkehr
OSRAM CONTINENTAL GmbH
€ millions 2017 2016 2018
Dividends received 0.2 0.2 —
Current assets 281.9 289.6 108.5
Non-current assets 239.4 230.0 211.0
Total assets 521.3 519.6 319.5
Current liabilities 226.3 213.7 106.9
Non-current liabilities 71.9 94.7 3.6
Total liabilities 298.1 308.4 110.5
Sales 798.1 734.1 130.6
Earnings from continued operations 14.7 20.6 –10.1
Other comprehensive income –2.0 0.3 –10.5
Earnings after tax 12.7 20.9 –20.6
Net assets 223.2 211.2 209.0
Share of net assets 44.6 42.2 104.5
Goodwill 12.7 12.7 256.5
Elimination of non-realized gains from downstream sales –186.0
Change in other comprehensive income for the prior year 0.4 –0.1
Other adjustments 1.0 –0.8 5.5
Carrying amount 58.9 54.3 180.5
The financial information results from sample accounting for the as-sociated company, in which all hidden reserves of the contributed and sold net assets of OSRAM AG, Munich, Germany, and Continen-tal AG, Hanover, Germany, were disclosed.
The financial information relates to the period from the date of the investment in the associated company, July 2, 2018, to Decem-ber 31, 2018.
The figures taken from the last two available sets of annual financial statements (2017 and 2016) for the joint ventures and associates that are not material to the corporation are summarized as follows. Amounts are stated in line with the investment ratio.

Continental AG 2018 Annual Report Consolidated Financial Statements Notes to the Consolidated Financial Statements 165
Associates Joint ventures
€ millions 2017 2016 2017 2016
Earnings from continued operations 14.4 13.2 –6.4 –4.1
Earnings after tax 14.4 13.2 –6.4 –4.1
17. Other Investments
€ millions Dec. 31, 2018 Dec. 31, 2017
Investments in unconsolidated affiliated companies 9.5 14.3
Other participations 183.4 36.7
Other investments 192.9 51.0
Other investments are accounted for at fair value. Changes are rec-ognized in other comprehensive income. The amount recognized in other comprehensive income from changes in fair value came to -€3.9 million in the reporting year (PY: —).
With regard to the year-on-year change in the carrying amount, €149.7 million (PY: €9.3 million) results from additions, €4.5 million (PY: €0.7 million) from disposals, -€3.9 million (PY: —) from changes
in fair value and €0.6 million (PY: -€0.7 million) from exchange-rate effects.
Dividends received from other investments amounted to €0.8 mil-lion in the reporting year (PY: €0.5 million).
There is currently no intention to sell any of the other investments.
18. Deferred Taxes
Deferred tax assets and liabilities are composed of the following items:
Dec. 31, 2018 Dec. 31, 2017
€ millions Assets Liabilities Assets Liabilities
Other intangible assets and goodwill — 475.5 — 397.1
Property, plant and equipment 206.5 266.6 190.4 261.2
Inventories 302.4 85.8 310.0 81.5
Other assets 229.0 280.3 215.7 257.5
Employee benefits less defined benefit assets 961.8 13.7 947.3 6.6
Provisions for other risks and obligations 142.7 14.1 137.7 9.9
Indebtedness and other financial liabilities 214.7 22.3 215.5 32.3
Other differences 209.8 196.6 193.9 213.9
Allowable tax credits 19.3 — 18.0 —
Tax losses carried forward and limitation of interest deduction 217.4 — 200.2 —
Offsetting (IAS 12.74) –1,039.2 –1,039.2 –911.5 –911.5
Amount recognized in statement of financial position 1,464.4 315.7 1,517.2 348.5
Net deferred taxes 1,148.7 — 1,168.7 —
Deferred taxes are measured in accordance with IAS 12 at the tax rate applicable for the periods in which they are expected to be re-alized. Since 2008, there has been a limit on the deductible interest
that can be carried forward in Germany; the amount deductible un-der tax law is limited to 30% of taxable income before depreciation, amortization and interest.

166 Continental AG 2018 Annual Report Consolidated Financial Statements Notes to the Consolidated Financial Statements
In particular, the development of deferred taxes was influenced by various acquisitions and by the change in actuarial gains and losses from pensions and similar obligations in the year under review. Please see Notes 5 and 26.
Deferred tax assets were down €52.8 million to €1,464.4 million (PY: €1,517.2 million). This was chiefly due to an increase in net de-ferred taxes of €127.7 million, which was partly offset by a €17.2 million increase in tax losses and interest carried forward and a €16.1 million increase in deferred taxes from property, plant and equipment. Deferred tax liabilities declined by €32.8 million year-
on-year to €315.7 million (PY: decline of €23.0 million). This change particularly resulted from offsetting deferred taxes against a coun-teracting effect from deferred taxes on other intangible assets and goodwill.
As at December 31, 2018, the corporate tax losses, in Germany and abroad, carried forward amounted to €2,647.2 million (PY: €2,294.1 million). The majority of the corporation’s tax losses car-ried forward relates to foreign subsidiaries and is mostly limited in terms of the time period for which they can be carried forward.
Deferred tax assets were not recognized in relation to the following items because it is currently not deemed sufficiently likely that they will be utilized.
€ millions Dec. 31, 2018 Dec. 31, 2017
Temporary differences 56.5 54.2
Tax losses carried forward and limitation of interest deduction 388.1 362.0
Allowable tax credits 49.1 46.1
Total unrecognized deferred tax assets 493.7 462.3
As at December 31, 2018, some corporation companies and tax groups that reported a loss recognized total deferred tax assets of €48.2 million (PY: €69.0 million), which arose from current losses, tax losses carried forward and a surplus of deferred tax assets. Given that future taxable income is expected, it is sufficiently probable that these deferred tax assets can be realized.
The temporary differences from retained earnings of foreign com-panies amount to a total of €639.1 million (PY: €587.2 million). Deferred tax liabilities were not taken into account, since remittance to the parent company is not planned in the short or medium term.
The measurement differences from assets or liabilities held for sale are included in the “Other assets” and “Other differences” items.
19. Other Financial Assets
Dec. 31, 2018 Dec. 31, 2017
€ millions Short-term Long-term Short-term Long-term
Amounts receivable from related parties 226.3 1.4 176.4 1.8
Loans to third parties — 76.5 — 60.5
Amounts receivable from employees 19.1 — 19.7 —
Other amounts receivable 75.3 3.5 100.9 6.5
Other financial assets1 320.7 81.4 297.0 68.8
1 Starting from the 2018 reporting year, deferred costs from the sale of customer tooling are no longer included in order to make the presentation of other financial assets more transparent. The figures as at December 31, 2017, have been adjusted accordingly.
The receivables from related parties were mainly attributable to re-ceivables from operating service business with equity-accounted investees and shareholders, as well as loans to associates.
Loans to third parties mainly related to tenants’ loans for individual properties and loans to customers with various maturities.
Receivables from employees related mainly to preliminary payments for hourly wages and for other advances.
In particular, other financial receivables include investment subsi-dies for research and development expenses not yet utilized and amounts receivable from suppliers. The carrying amounts of the other financial assets are essentially their fair values.
Please see Note 30 for information on the default risks in relation to other financial assets.

Continental AG 2018 Annual Report Consolidated Financial Statements Notes to the Consolidated Financial Statements 167
20. Other Assets
Dec. 31, 2018 Dec. 31, 2017
€ millions Short-term Long-term Short-term Long-term
Trade accounts receivable from the sale of customer tools 241.5 — 232.4 —
Tax refund claims (incl. VAT and other taxes) 453.3 — 530.8 —
Prepaid expenses 191.9 — 199.4 —
Miscellaneous 237.5 27.6 224.2 27.3
Other assets1 1,124.2 27.6 1,186.8 27.3
1 Starting from the 2018 reporting year, deferred costs from the sale of customer tooling are included in order to make the presentation of other assets more transparent. The figures as at December 31, 2017, have been adjusted accordingly.
The tax refund claims primarily resulted from VAT receivables from the purchase of production materials.
The receivables from the sale of customer tooling related to costs that have not yet been invoiced. The year-on-year increase of €9.1 million mainly resulted from the Rubber Group.
In particular, prepaid expenses include rent and maintenance services paid for in advance and license fees.
Among other things, the “Miscellaneous” item includes other deferred or advanced costs.
Impairment totaling €12.5 million (PY: €15.5 million) was recog-nized for the probable default risk on other assets. Income of €3.0 million (PY: expense of €8.3 million) arose in the reporting period.
21. Inventories
€ millions Dec. 31, 2018 Dec. 31, 2017
Raw materials and supplies 1,528.3 1,415.4
Work in progress 712.1 563.2
Finished goods and merchandise 2,280.7 2,149.6
Inventories 4,521.1 4,128.2
Write-downs recognized on inventories increased by €15.3 million to €450.5 million (PY: €435.2 million).

168 Continental AG 2018 Annual Report Consolidated Financial Statements Notes to the Consolidated Financial Statements
22. Trade Accounts Receivable
€ millions Dec. 31, 2018 Dec. 31, 2017
Trade accounts receivable 7,736.0 7,779.7
Allowances for doubtful accounts –104.1 –110.4
Trade accounts receivable 7,631.9 7,669.3
The carrying amounts of the trade accounts receivable, net of allowances for doubtful accounts, are their fair values. Please see Note 30 for information on the default risks in relation to trade accounts receivable.
The Continental Corporation uses several programs for the sale of receivables. When the risks and rewards of receivables, in particular credit and default risks, have mostly not been transferred, the re-ceivables are still recognized as assets in the statement of financial position.
Under the existing sale-of-receivables programs, the contractual rights to the receipt of payment inflows have been assigned to the corresponding contractual parties. The transferred receivables have short remaining terms. As a rule, therefore, the carrying amounts as at the reporting date in the amount of €745.5 million (PY: €1,799.2 million) are approximately equivalent to their fair value. The respec-tive liabilities with a carrying amount of €469.2 million (PY: €513.7 million) represent the liquidation proceeds from the sale of the re-ceivables. As in the previous year, this was approximately equiva-lent to their fair value. The committed financing volume under these sale-of-receivables programs amounts to €665.0 million (PY: €894.5 million).
23. Cash and Cash Equivalents
Cash and cash equivalents include all liquid funds and demand deposits. Cash equivalents are short-term, highly liquid financial in-vestments that can be readily converted into known cash amounts and are subject to an insignificant risk of changes in value. As at the reporting date, cash and cash equivalents amounted to
€2,761.4 million (PY: €1,881.5 million). Of that, €2,587.7 million (PY: €1,726.7 million) was unrestricted.
For information on the interest-rate risk and the sensitivity analysis for financial assets and liabilities, please see Note 30.
24. Assets Held for Sale
€ millions Dec. 31, 2018 Dec. 31, 2017
Individual assets held for sale — 13.5
Assets of a disposal group — —
Assets held for sale — 13.5
There were no assets held for sale as at the end of the reporting period. In the previous year, the assets held for sale had mainly in-cluded assets from the plant closure in Melbourne, Australia, of €11.4 million.
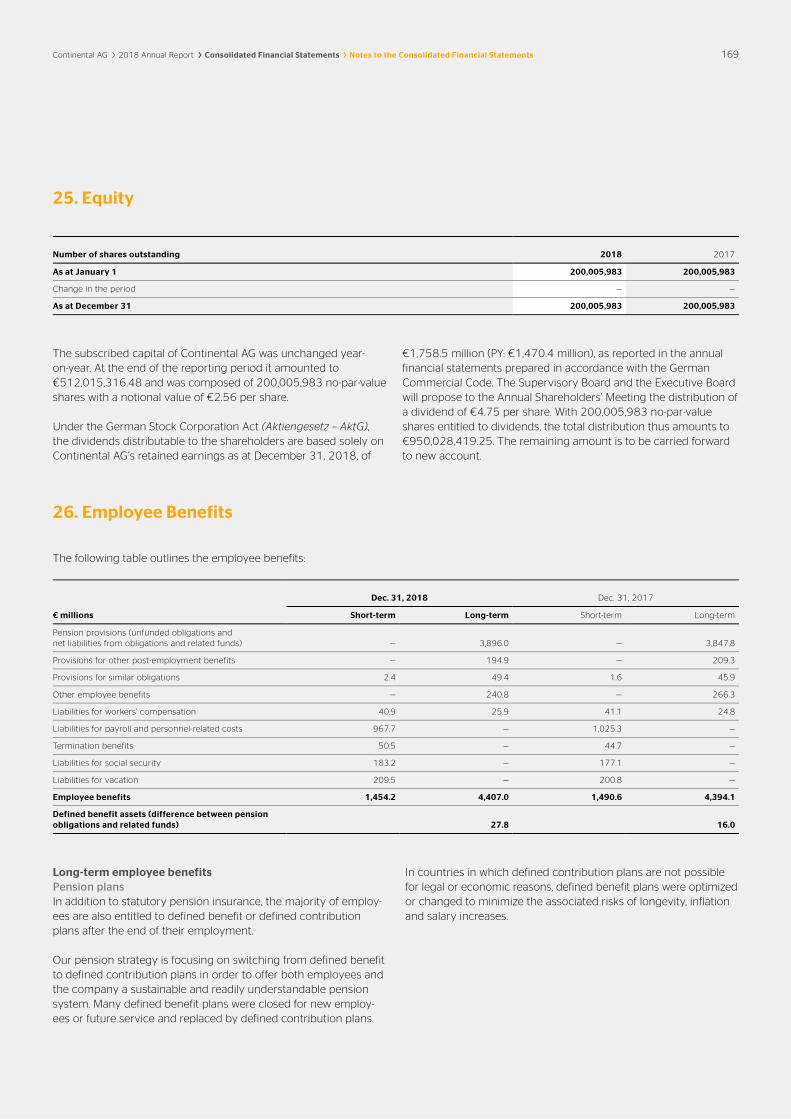
Continental AG 2018 Annual Report Consolidated Financial Statements Notes to the Consolidated Financial Statements 169
25. Equity
Number of shares outstanding 2018 2017
As at January 1 200,005,983 200,005,983
Change in the period — —
As at December 31 200,005,983 200,005,983
The subscribed capital of Continental AG was unchanged year- on-year. At the end of the reporting period it amounted to €512,015,316.48 and was composed of 200,005,983 no-par-value shares with a notional value of €2.56 per share.
Under the German Stock Corporation Act (Aktiengesetz – AktG), the dividends distributable to the shareholders are based solely on Continental AG’s retained earnings as at December 31, 2018, of
€1,758.5 million (PY: €1,470.4 million), as reported in the annual financial statements prepared in accordance with the German Commercial Code. The Supervisory Board and the Executive Board will propose to the Annual Shareholders’ Meeting the distribution of a dividend of €4.75 per share. With 200,005,983 no-par-value shares entitled to dividends, the total distribution thus amounts to €950,028,419.25. The remaining amount is to be carried forward to new account.
26. Employee Benefits
The following table outlines the employee benefits:
Dec. 31, 2018 Dec. 31, 2017
€ millions Short-term Long-term Short-term Long-term
Pension provisions (unfunded obligations and net liabilities from obligations and related funds) — 3,896.0 — 3,847.8
Provisions for other post-employment benefits — 194.9 — 209.3
Provisions for similar obligations 2.4 49.4 1.6 45.9
Other employee benefits — 240.8 — 266.3
Liabilities for workers’ compensation 40.9 25.9 41.1 24.8
Liabilities for payroll and personnel-related costs 967.7 — 1,025.3 —
Termination benefits 50.5 — 44.7 —
Liabilities for social security 183.2 — 177.1 —
Liabilities for vacation 209.5 — 200.8 —
Employee benefits 1,454.2 4,407.0 1,490.6 4,394.1
Defined benefit assets (difference between pension obligations and related funds) 27.8 16.0
Long-term employee benefits Pension plans In addition to statutory pension insurance, the majority of employ-ees are also entitled to defined benefit or defined contribution plans after the end of their employment.
Our pension strategy is focusing on switching from defined benefit to defined contribution plans in order to offer both employees and the company a sustainable and readily understandable pension system. Many defined benefit plans were closed for new employ-ees or future service and replaced by defined contribution plans.
In countries in which defined contribution plans are not possible for legal or economic reasons, defined benefit plans were optimized or changed to minimize the associated risks of longevity, inflation and salary increases.

170 Continental AG 2018 Annual Report Consolidated Financial Statements Notes to the Consolidated Financial Statements
Defined benefit plans Defined benefit plans include pension plans, termination indemni-ties regardless of the reason for the end of employment and other post-employment benefits. As a result of the significant increase in the number of employees in recent years and the high level of ac-quisition activity, pension obligations essentially relate to active employees. The defined benefit pension plans cover 164,490 ben-eficiaries, including 121,392 active employees, 16,822 former em-ployees with vested benefits, and 26,276 retirees and surviving dependents. The pension obligations are concentrated in four countries: Germany, the U.S.A., the U.K. and Canada, which account for more than 90% of total pension obligations.
The weighted average term of the defined benefit pension obliga-tions is around 19 years. This term is based on the present value of the obligations.
Germany In Germany, Continental provides pension benefits through the cash balance plan, prior commitments and deferred compensation.
The retirement plan regulation applicable to active members is based primarily on the cash balance plan and thus on benefit modules. When the insured event occurs, the retirement plan as-sets are paid out as a lump-sum benefit, in installments or as a pension, depending on the amount of the retirement plan assets. There are no material minimum guarantees in relation to a particu-lar amount of retirement benefits.
Pension plans transferred to or assumed by Continental in the con-text of acquisitions (Siemens VDO, Temic, Teves, Phoenix) were in-cluded in the cash balance plans. For the main German companies, the cash balance plan is partly covered by funds in contractual trust arrangements (CTAs). In Germany, there are no legal or regu-latory minimum allocation obligations.
The CTAs are legally independent from the company and manage the plan assets as trustees in accordance with the respective CTAs.
Some prior commitments were granted through two legally inde-pendent pension contribution funds. Pensionskasse für Angestellte der Continental Aktiengesellschaft VVaG and Pensionskasse von 1925 der Phoenix AG VVaG have been closed since March 1, 1984 and July 1, 1983, respectively. The pension contribution funds are smaller associations within the meaning of Section 53 of the Ger-man Insurance Supervision Act (Versicherungsaufsichtsgesetz – VAG) and are subject to the supervision of the German Federal Financial Supervisory Authority (Bundesanstalt für Finanzdienst- leistungsaufsicht). The investment regulations are in accordance with the legal requirements and risk structure of the obligations. The pension contribution funds have tariffs with an interest rate of 2.6%. Under the German Company Pensions Law (Betriebsrenten-gesetz – BetrAVG), Continental is ultimately liable for the imple-mentation path of the pension contribution fund. In accordance with IAS 19, the pension obligations covered by the pension con-tribution fund are therefore defined benefit pension plans. The
pension contribution funds met their minimum net funding re-quirement as at December 31, 2018. However, given that only the plan members are entitled to the assets and amounts generated, the benefit obligations are recognized in the same amount as the existing assets at fair value.
Continental also supports private contribution through deferred compensation schemes.
Deferred compensation is essentially offered through a fully funded multi-employer plan (Höchster Pensionskasse VVaG) for contributions up to 4% of the assessment ceiling in social security. The pension contribution fund ensures guaranteed minimum inter-est for which Continental is ultimately liable under the German Company Pensions Law. The company is not liable for guarantees to employees of other companies. As Höchster Pensionskasse VVaG is a combined defined benefit plan for several companies and Continental has no right to the information required for ac-counting for this defined benefit plan, this plan is recognized as a defined contribution plan.
Entitled employees can use the cash balance plan for deferred compensation contributions above the 4% assessment ceiling. This share is funded by insurance annuity contracts.
U.S.A. Owing to its acquisition history, Continental has various defined benefit plans in the U.S.A., which were closed to new entrants and frozen to accretion of further benefits in a period from April 1, 2005, to December 31, 2011. Acquisitions in the previous year also in-cluded an open defined benefit plan for unionized employees.
The closed defined benefit plans are commitments on the basis of the average final salary for employees of the Automotive and Tire segments and cash balance commitments for former Siemens VDO employees. The defined benefit plans for unionized and non-unionized employees are based on a pension multiplier per year of service.
Closed defined benefit plans were replaced by defined contribu-tion plans. Defined contribution plans apply to the majority of ac-tive employees in the U.S.A.
The plan assets of the defined benefit plans are managed in a mas-ter trust. Investment supervision was delegated to the Pension Committee, a body appointed within the corporation. The legal and regulatory framework for the plans is based on the U.S. Em-ployee Retirement Income Security Act (ERISA). The valuation of the financing level is required on the basis of this law. The interest rate used for this calculation is the average rate over a period of 25 years and therefore currently higher than the interest rate used to discount obligations under IAS 19. The statutory valuation therefore gives rise to a lower obligation than that in line with IAS 19. There is a regulatory requirement to ensure minimum funding of 80% in the defined benefit plans to prevent benefit curtailments.

Continental AG 2018 Annual Report Consolidated Financial Statements Notes to the Consolidated Financial Statements 171
In 2018, an extraordinary allocation to the U.S. pension plans of U.S. $245.5 million was made and the investment strategy was modified. The share of equities was reduced, while the share of fixed-income securities was increased.
United Kingdom Continental maintains four defined benefit plans as a result of its history of acquisitions in the United Kingdom. All plans are com-mitments on the basis of the average or final salary. The four plans were closed to new employees in the period between April 1, 2002, and November 30, 2004. Continental offers defined contri-bution plans for all employees who have joined the company since that time.
As at April 5, 2016, the Continental Group Pension and Life Assur-ance Scheme was frozen to accretion of further benefits. It was re-placed by a defined contribution plan as at April 6, 2016.
As at July 31, 2017, the Mannesmann UK Pension Scheme was frozen to accretion of further benefits. It was replaced by a defined contribution plan as at August 1, 2017.
Our pension strategy in the U.K. focuses on reducing risks and in-cludes the option of partially or completely funding by purchasing annuities.
The funding conditions are defined by the U.K. Pensions Regulator and the corresponding laws and regulations. The defined benefit plans are managed by trust companies. The boards of trustees of these companies have an obligation solely to the good of the ben-eficiaries on the basis of the trust agreement and the law.
The necessary funding is determined every three years through technical valuations in line with local provisions. The obligations are measured using a discount rate based on government bonds and other conservatively selected actuarial assumptions. Compared to IAS 19, which derives the discount rate from senior corporate bonds, this usually results in a higher obligation. Three of the four defined benefit plans had a funding deficit on the basis of the most recent technical valuation. The trustees and the company have agreed on a recovery plan that provides for additional temporary annual payments. The valuation process must be completed within 15 months of the valuation date. The technical valuations were completed in 2016 for two plans and in 2017 for the other two plans.
The most recent technical valuations of the four defined benefit pension plans took place with their valuation dates between December 2014 and March 2016 and led to the following result:
› Continental Teves UK Employee Benefit Scheme (assessment as at December 31, 2014): As part of the assessment, an agree-ment on a minimum annual endowment of GBP 1.4 million over a period of five years was resolved.
› Continental Group Pension and Life Assurance Scheme (assess-ment as at April 5, 2015): As part of the assessment and in con-nection with the pension plan being frozen to accretion of fur-ther benefits, a one-time contribution of GBP 15.0 million was made in 2016 and an agreement was concluded to enable the pension plan to fund a full buyout by purchasing annuities in the next five years.
› Mannesmann UK Pension Scheme (assessment as at March 31, 2016): As part of the assessment, an agreement was resolved on a minimum monthly endowment of GBP 75,000 for the period from October 1, 2017, to September 30, 2019, and on a mini-mum monthly endowment of GBP 100,000 for the period from October 1, 2019, to May 31, 2025.
› Phoenix Dunlop Oil & Marine Pension Scheme (assessment as at December 31, 2015): As part of the assessment, an agreement was resolved on a minimum annual endowment of GBP 2.2 mil-lion and an annual adjustment of 3.5% over a period of four years. Thereafter, there will be an annual payment of GBP 1.4 million and an annual adjustment of 3.5% over a period of another three years.
Canada Continental maintains various defined benefit plans as a result of its history of acquisitions. The pension plans are based mainly on a pension multiplier per year of service. In 2017, three plans (Bow-manville, Collingwood and Owen Sound) were fully funded by the purchase of annuities, so there are no longer any pension obliga-tions from these plans for Continental companies.
Fluctuations in the amount of the pension obligation resulting from exchange-rate effects are subject to the same risks as overall business development. These fluctuations relate mainly to the cur-rencies of the U.S.A., Canada and the U.K. and have no material im-pact on Continental. For information on the effects of interest-rate risks and longevity risk on the pension obligations, please refer to the sensitivities described later on in this section.
The pension obligations for Germany, the U.S.A., Canada, the U.K. and other countries, as well as the amounts for the Continental Corporation as a whole, are shown in the following tables.

172 Continental AG 2018 Annual Report Consolidated Financial Statements Notes to the Consolidated Financial Statements
The reconciliation of the changes in the defined benefit obligations from the beginning to the end of the year is as follows:
2018 2017
€ millions Ger-
many U.S.A. CAN U.K. Other Total Ger-
many U.S.A. CAN U.K. Other Total
Defined benefit obligations as at January 1 4,518.5 1,067.0 110.7 386.4 297.1 6,379.7 4,416.5 1,247.0 151.3 402.2 311.7 6,528.7
Exchange-rate differences — 46.8 –3.9 –4.3 1.3 39.9 — –147.3 –7.5 –13.7 –7.9 –176.4
Current service cost 198.8 5.2 1.6 2.1 22.9 230.6 223.2 5.5 1.5 2.5 24.2 256.9
Service cost from plan amendments — — — 3.0 3.1 6.1 — — — — 0.0 0.0
Curtailments/settlements — — — — –0.3 –0.3 — –4.8 1.6 –0.1 –1.8 –5.1
Interest on defined benefit obligations 83.1 39.0 3.6 9.3 9.5 144.5 77.2 48.0 5.4 10.0 7.7 148.3
Actuarial gains/losses from changes in demographic assumptions 39.2 –3.5 0.6 –2.4 0.9 34.8 20.5 5.8 — –11.3 –0.9 14.1
Actuarial gains/losses from changes in financial assumptions 0.0 –74.8 –3.0 –23.8 2.0 –99.6 –89.2 74.3 7.0 10.5 –27.2 –24.6
Actuarial gains/losses from experience adjustments 42.7 11.7 1.3 1.1 5.6 62.4 –44.9 13.8 –0.6 –0.7 3.8 –28.6
Net changes in the scope of consolidation — — — — — 0.0 12.2 — — — 0.2 12.4
Employee contributions — — 0.3 0.2 –0.3 0.2 — — 0.3 0.2 0.2 0.7
Other changes — — — –0.4 –1.2 –1.6 — — — –0.5 0.1 –0.4
Benefit payments –100.5 –60.0 –4.8 –15.5 –20.6 –201.4 –97.0 –175.3 –48.3 –12.7 –13.0 –346.3
Defined benefit obligations as at December 31 4,781.8 1,031.4 106.4 355.7 320.0 6,595.3 4,518.5 1,067.0 110.7 386.4 297.1 6,379.7
The reconciliation of the changes in the fund assets from the beginning to the end of the year is as follows:
2018 2017
€ millions Ger-
many U.S.A. CAN U.K. Other Total Ger-
many U.S.A. CAN U.K. Other Total
Fair value of fund assets as at January 1 1,189.0 746.6 90.7 378.5 144.3 2,549.1 1,123.0 904.4 133.9 391.5 131.6 2,684.4
Exchange-rate differences — 39.2 –3.3 –4.5 0.6 32.0 — –105.2 –6.3 –13.4 –4.2 –129.1
Interest income from pension funds 15.9 30.7 3.0 9.4 5.0 64.0 29.8 34.5 4.9 10.1 3.7 83.0
Actuarial gains/losses from fund assets –32.5 –52.2 0.6 –17.4 –3.0 –104.5 15.9 71.7 –0.5 –15.4 5.5 77.2
Employer contributions 46.5 222.7 2.3 18.8 18.8 309.1 45.7 17.8 7.2 18.7 16.0 105.4
Employee contributions — 0.0 0.3 0.2 0.2 0.7 — — 0.3 0.2 0.2 0.7
Net changes in the scope of consolidation — — — — — 0.0 — — — — — —
Other changes — –1.3 –0.4 –0.5 –0.1 –2.3 –2.2 –1.3 –0.5 –0.5 –0.2 –4.7
Benefit payments –23.7 –60.0 –4.8 –15.5 –15.6 –119.6 –23.2 –175.3 –48.3 –12.7 –8.3 –267.8
Fair value of fund assets as at December 31 1,195.2 925.7 88.4 369.0 150.2 2,728.5 1,189.0 746.6 90.7 378.5 144.3 2,549.1

Continental AG 2018 Annual Report Consolidated Financial Statements Notes to the Consolidated Financial Statements 173
The carrying amount of pension provisions fell by €36.4 million as compared to the previous year. This was due mainly to the increase in plan assets as a result of a one-off allocation in the U.S.A. and to currency translation effects. The positive balance from pension val-uation increased by €11.8 million year-on-year. This was due chiefly to the increase in plan assets in the U.K. as a result of currency translation effects.
€6,488.8 million (PY: €6,262.5 million) of the defined benefit obli-gations as at December 31, 2018, related to plans that are fully or partially funded, and €106.5 million (PY: €117.2 million) related to plans that are unfunded.
The €215.6 million increase in the defined benefit obligation as compared to December 31, 2017, resulted in particular from cur-rency translation effects in the U.S.A. and from plan settlements al-ready completed in the previous year and the resulting lower pen-sion payments in the U.S.A.
The plan assets in Germany include the CTA assets amounting to €838.1 million (PY: €815.2 million), pension contribution fund as-sets of €242.7 million (PY: €264.0 million), insurance annuity con-tracts amounting to €114.0 million (PY: €109.5 million) and further plan assets of €0.4 million (PY: €0.3 million).
In the year under review, fund assets increased by €179.4 million to €2,728.5 million. Owing to the change in U.S. tax laws, it was possible for the corporation to fund most of the plan assets for pensions in the U.S.A. while benefiting from tax breaks. On July 11, 2018, €209.2 million was transferred to the corresponding plan assets.
Actuarial gains and losses on fund assets in Germany resulted from actuarial losses of €32.5 million (PY: income of €15.9 million) from the CTA.
In the Continental Corporation, there are pension contribution funds for previously defined contributions in Germany that have been closed to new entrants since July 1, 1983, and March 1, 1984, respectively. As at December 31, 2018, the minimum net funding requirement was exceeded; Continental AG has no require-ment to make additional contributions. The pension fund assets had a fair value of €242.7 million as at December 31, 2018 (PY: €264.0 million). The pension contribution funds have tariffs with an interest rate of 2.6%, for which Continental AG is ultimately liable under the German Company Pensions Law. Under this law, the pen-sion obligations constitute a defined benefit pension plan, which is why this plan must be reported in line with the development of pension provisions. However, given that only the plan members are entitled to the assets and income generated, the benefit obligations are recognized in the same amount as the existing assets at fair value.
The following table shows the reconciliation of the funded status to the amounts contained in the statement of financial position:
Dec. 31, 2018 Dec. 31, 2017
€ millions Ger-
many U.S.A. CAN U.K. Other Total Ger-
many U.S.A. CAN U.K. Other Total
Funded status1 –3,586.6 –105.7 –18.0 13.3 –169.8 –3,866.8 –3,329.5 –320.4 –20.0 –7.9 –152.8 –3,830.6
Asset ceiling — — –0.4 — –1.0 –1.4 — — 0.0 — –1.2 –1.2
Carrying amount –3,586.6 –105.7 –18.4 13.3 –170.8 –3,868.2 –3,329.5 –320.4 –20.0 –7.9 –154.0 –3,831.8
1 Difference between fund assets and defined benefit obligations.
The carrying amount comprises the following items of the statement of financial position:
Dec. 31, 2018 Dec. 31, 2017
€ millions Ger-
many U.S.A. CAN U.K. Other Total Ger-
many U.S.A. CAN U.K. Other Total
Defined benefit assets — — 1.4 23.9 2.5 27.8 — — 1.1 11.7 3.2 16.0
Pension provisions –3,586.6 –105.7 –19.8 –10.6 –173.3 –3,896.0 –3,329.5 –320.4 –21.1 –19.6 –157.2 –3,847.8
Carrying amount –3,586.6 –105.7 –18.4 13.3 –170.8 –3,868.2 –3,329.5 –320.4 –20.0 –7.9 –154.0 –3,831.8
The assumptions used to measure the pension obligations – in par-ticular, the discount factors for determining the interest on expected pension obligations and the expected return on fund assets, as well
as the long-term salary growth rates and the long-term pension trend – are specified for each country.

174 Continental AG 2018 Annual Report Consolidated Financial Statements Notes to the Consolidated Financial Statements
In the principal pension plans, the following weighted-average valuation factors as at December 31 of the year have been used:
2018 2017
% Germany1 U.S.A. CAN U.K. Other Germany1 U.S.A. CAN U.K. Other
Discount rate 1.90 4.35 3.60 2.80 3.41 1.90 3.70 3.40 2.45 3.17
Long-term salary growth rate 3.00 0.00 2.86 3.79 3.30 3.00 0.00 2.85 3.80 3.49
1 Not including the pension contribution funds.
Another parameter for measuring the pension obligation is the long-term pension trend. The following weighted average long-term pension trend was used as at December 31, 2018, for the key countries: Germany 1.75% (PY: 1.75%), Canada 1.6% (PY: 1.6%)
and the United Kingdom 3.8% (PY: 3.4%). For the U.S.A., the long-term pension trend does not constitute a significant measurement parameter.
Net pension cost can be summarized as follows:
2018 2017
€ millions Ger-
many U.S.A. CAN U.K. Other Total Ger-
many U.S.A. CAN U.K. Other Total
Current service cost 198.8 5.2 1.6 2.1 22.9 230.6 223.2 5.5 1.5 2.5 24.2 256.9
Service cost from plan amendments — — — 3.0 3.1 6.1 — — — — 0.0 0.0
Curtailments/settlements — — — — –0.3 –0.3 — –4.8 1.6 –0.1 –1.8 –5.1
Interest on defined benefit obligations 83.1 39.0 3.6 9.3 9.5 144.5 77.2 48.0 5.4 10.0 7.7 148.3
Expected return on the pension funds –15.9 –30.7 –3.0 –9.4 –5.0 –64.0 –29.8 –34.5 –4.9 –10.1 –3.7 –83.0
Effect of change of asset ceiling — — — — 0.1 0.1 — — 0.1 — 0.2 0.3
Other pension income and expenses 1.2 0.3 — –0.3 1.2 — 1.2 0.5 — –0.1 1.6
Net pension cost 266.0 14.7 2.5 5.0 30.0 318.2 270.6 15.4 4.2 2.3 26.5 319.0
These were no special effects in the development of net pension cost in the reporting year. Curtailments and settlements in the pre-vious year related in particular to settlements in the U.S.A. and the resulting reduction in the defined benefit pension obligation.
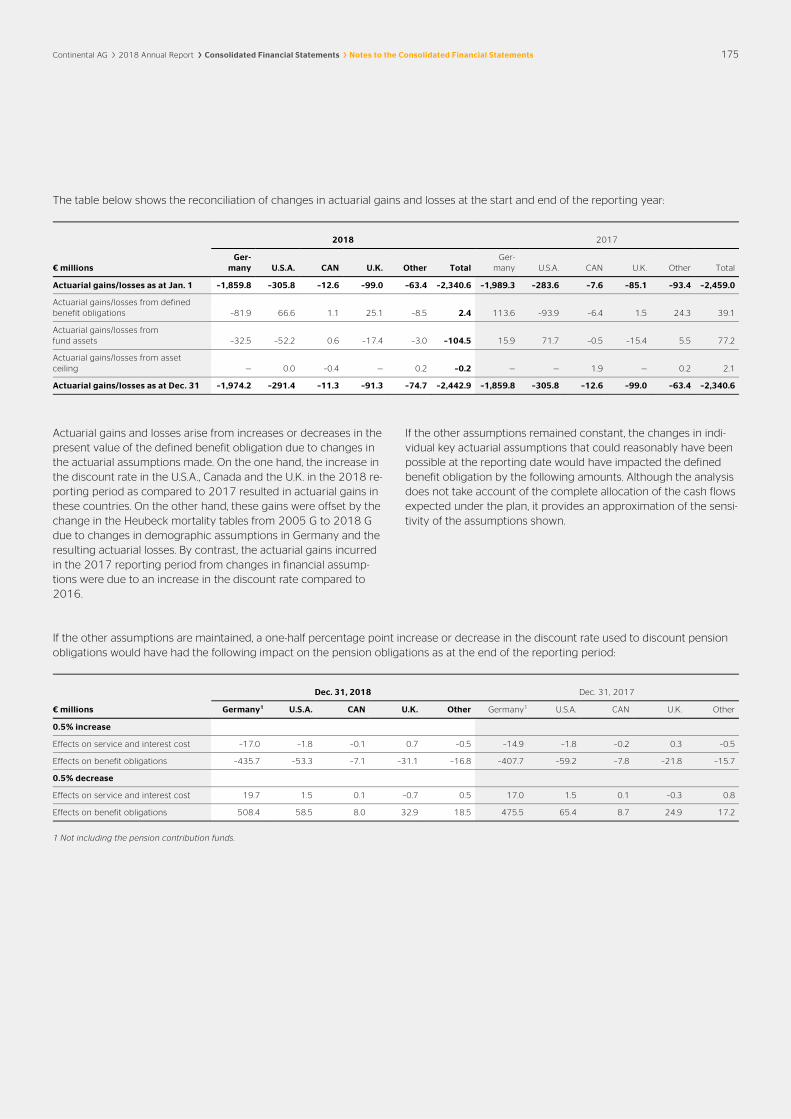
Continental AG 2018 Annual Report Consolidated Financial Statements Notes to the Consolidated Financial Statements 175
The table below shows the reconciliation of changes in actuarial gains and losses at the start and end of the reporting year:
2018 2017
€ millions Ger-
many U.S.A. CAN U.K. Other Total Ger-
many U.S.A. CAN U.K. Other Total
Actuarial gains/losses as at Jan. 1 –1,859.8 –305.8 –12.6 –99.0 –63.4 –2,340.6 –1,989.3 –283.6 –7.6 –85.1 –93.4 –2,459.0
Actuarial gains/losses from defined benefit obligations –81.9 66.6 1.1 25.1 –8.5 2.4 113.6 –93.9 –6.4 1.5 24.3 39.1
Actuarial gains/losses from fund assets –32.5 –52.2 0.6 –17.4 –3.0 –104.5 15.9 71.7 –0.5 –15.4 5.5 77.2
Actuarial gains/losses from asset ceiling — 0.0 –0.4 — 0.2 –0.2 — — 1.9 — 0.2 2.1
Actuarial gains/losses as at Dec. 31 –1,974.2 –291.4 –11.3 –91.3 –74.7 –2,442.9 –1,859.8 –305.8 –12.6 –99.0 –63.4 –2,340.6
Actuarial gains and losses arise from increases or decreases in the present value of the defined benefit obligation due to changes in the actuarial assumptions made. On the one hand, the increase in the discount rate in the U.S.A., Canada and the U.K. in the 2018 re-porting period as compared to 2017 resulted in actuarial gains in these countries. On the other hand, these gains were offset by the change in the Heubeck mortality tables from 2005 G to 2018 G due to changes in demographic assumptions in Germany and the resulting actuarial losses. By contrast, the actuarial gains incurred in the 2017 reporting period from changes in financial assump-tions were due to an increase in the discount rate compared to 2016.
If the other assumptions remained constant, the changes in indi-vidual key actuarial assumptions that could reasonably have been possible at the reporting date would have impacted the defined benefit obligation by the following amounts. Although the analysis does not take account of the complete allocation of the cash flows expected under the plan, it provides an approximation of the sensi-tivity of the assumptions shown.
If the other assumptions are maintained, a one-half percentage point increase or decrease in the discount rate used to discount pension obligations would have had the following impact on the pension obligations as at the end of the reporting period:
Dec. 31, 2018 Dec. 31, 2017
€ millions Germany1 U.S.A. CAN U.K. Other Germany1 U.S.A. CAN U.K. Other
0.5% increase
Effects on service and interest cost –17.0 –1.8 –0.1 0.7 –0.5 –14.9 –1.8 –0.2 0.3 –0.5
Effects on benefit obligations –435.7 –53.3 –7.1 –31.1 –16.8 –407.7 –59.2 –7.8 –21.8 –15.7
0.5% decrease
Effects on service and interest cost 19.7 1.5 0.1 –0.7 0.5 17.0 1.5 0.1 –0.3 0.8
Effects on benefit obligations 508.4 58.5 8.0 32.9 18.5 475.5 65.4 8.7 24.9 17.2
1 Not including the pension contribution funds.

176 Continental AG 2018 Annual Report Consolidated Financial Statements Notes to the Consolidated Financial Statements
A one-half percentage point increase or decrease in the long-term salary growth rate would have had the following impact on the pension obligations as at the end of the reporting period:
Dec. 31, 2018 Dec. 31, 2017
€ millions Germany U.S.A.1 CAN U.K. Germany U.S.A.1 CAN U.K.
0.5% increase
Effects on benefit obligations 5.8 — 0.8 2.3 6.8 — 0.8 2.3
0.5% decrease
Effects on benefit obligations –5.5 — –0.7 –2.2 –6.2 — –0.7 –2.2
1 Any change in the long-term salary growth rate would have no effect on the value of the benefit obligations.
A one-half percentage point increase or decrease in the long-term pension trend would have had the following impact on the pension obligations as at the end of the reporting period:
Dec. 31, 2018 Dec. 31, 2017
€ millions Germany U.S.A.1 CAN U.K. Germany U.S.A.1 CAN U.K.
0.5% increase
Effects on benefit obligations 166.9 — 3.8 22.4 162.2 — 3.8 24.4
0.5% decrease
Effects on benefit obligations –151.5 — –3.4 –21.0 –147.2 — –3.5 –22.9
1 Any change in the long-term pension trend would have no effect on the value of the benefit obligations.
Changes in the discount rate and the salary and pension trends do not have a linear effect on the defined benefit obligations (DBO) owing to the financial models used (particularly due to the com-pounding of interest rates). For this reason, the net periodic pen-sion cost derived from the pension obligations does not change by the same amount as a result of an increase or decrease in the actu-arial assumptions.
In addition to the aforementioned sensitivities, the impact of a one-year-longer life expectancy on the value of benefit obligations was computed for the key countries. A one-year increase in life expec-tancy would lead to a €215.4 million (PY: €206.1 million) increase in the value of the benefit obligations, and that figure would be bro-ken down as follows: Germany €173.3 million (PY: €160.9 million), U.S.A. €27.2 million (PY: €28.8 million), U.K. €12.3 million (PY: €13.8
million) and Canada €2.6 million (PY: €2.6 million). In Germany, in-creased payments in the form of pensions rather than capital were assumed in the actuarial valuation, which has the effect of increas-ing the benefit obligations. For the calculation of pension obliga-tions for domestic plans, life expectancy is based on the 2018 G mortality tables by Prof. Klaus Heubeck. For foreign pension plans, comparable criteria are used for the respective country.
Pension funds The structure of the corporation’s plan assets is reviewed by the in-vestment committees on an ongoing basis taking into account the forecast pension obligations. In doing so, the investment commit-tees regularly review the investment decisions taken, the underly-ing expected returns of the individual asset classes reflecting em-pirical values and the selection of the external fund managers.

Continental AG 2018 Annual Report Consolidated Financial Statements Notes to the Consolidated Financial Statements 177
The portfolio structures of the pension funds at the measurement date for the fiscal years 2018 and 2017 are as follows:
% 2018 2017
Asset class Germany1 U.S.A. CAN U.K. Other Germany1 U.S.A. CAN U.K. Other
Equity instruments 2 20 51 7 9 1 54 55 17 11
Debt securities 54 79 48 44 76 60 45 43 43 72
Real estate 15 — — 1 1 7 — — 1 2
Absolute return2 18 1 1 23 2 16 — — 17 14
Cash, cash equivalents and other3 11 — — 3 12 16 1 2 1 1
Annuities3 — — — 22 — — — — 21 —
Total 100 100 100 100 100 100 100 100 100 100
1 The portfolio structure of the fund assets in Germany excludes the pension contribution funds whose assets are invested mainly in fixed-income securities and shares. 2 This refers to investment products that aim to achieve a positive return regardless of market fluctuations. 3 Annuities are insurance contracts that guarantee pension payments.
The following table shows the cash contributions made by the company to the pension funds for 2018 and 2017 as well as the expected contributions for 2019:
€ millions 2019 (expected) 2018 2017
Germany 41.4 46.5 45.7
U.S.A. 12.4 222.7 17.8
CAN 2.2 2.3 7.2
U.K. 18.8 18.8 18.7
Other 18.2 18.8 16.0
Total 93.0 309.1 105.4
The following overview contains the pension benefit payments made in the reporting year and the previous year, as well as the undis-counted, expected pension benefit payments for the next 10 years:
€ millions Germany U.S.A. CAN U.K. Other Total
Benefits paid
2017 97.0 175.3 48.3 12.7 13.0 346.3
2018 100.5 60.0 4.8 15.5 15.6 196.4
Benefit payments as expected
2019 123.5 65.1 5.0 9.4 13.8 216.8
2020 118.9 65.1 5.2 9.9 14.8 213.9
2021 126.7 66.4 5.1 10.9 15.5 224.6
2022 134.9 66.8 5.3 11.0 19.9 237.9
2023 138.6 66.9 5.8 11.9 20.0 243.2
Total of years 2024 to 2028 814.4 335.0 30.9 71.1 132.3 1,383.7
The pension payments from 2017 onwards relate to lump-sum amounts in connection with fixed service cost benefit plans, as well as annual pension benefits. Furthermore, the earliest eligible date for retirement has been assumed when determining future pension
payments. The actual retirement date could occur later. Therefore the actual payments in future years for present plan members could be lower than the amounts assumed.

178 Continental AG 2018 Annual Report Consolidated Financial Statements Notes to the Consolidated Financial Statements
For the current and four preceding reporting periods, the amounts of the defined benefit obligations, fund assets, funded status, as well as the experience adjustments to plan liabilities and to plan assets are as follows:
€ millions 2018 2017 2016 2015 2014
Defined benefit obligations 6,595.3 6,379.7 6,528.7 5,807.4 5,265.6
Fund assets 2,728.5 2,549.1 2,684.4 2,571.9 2,035.7
Funded status –3,866.8 –3,830.6 –3,844.3 –3,235.5 –3,229.9
Experience adjustments to plan liabilities –2.4 –39.1 596.3 51.9 981.6
Experience adjustments to plan assets –104.5 77.2 65.4 –21.6 55.5
Other post-employment benefits Certain subsidiaries – primarily in the U.S.A. and Canada – grant eli-gible employees healthcare and life insurance on retirement if they have fulfilled certain conditions relating to age and years of service. The amount and entitlement can be altered. Certain retirement benefits, in particular for pensions and healthcare costs, are pro-vided in the U.S.A. for hourly paid workers at unionized tire plants
under the terms of collective pay agreements. No separate fund assets have been set up for these obligations.
The weighted average term of the defined benefit pension obliga-tion is 10 years. This term is based on the present value of the obligation.
The reconciliation of the changes in the defined benefit obligations and the financing status from the beginning to the end of the year is as follows:
€ millions 2018 2017
Defined benefit obligations as at January 1 209.3 232.6
Exchange-rate differences 5.7 –25.1
Current service cost 1.3 1.4
Service cost from plan amendments 0.1 —
Curtailments/settlements 0.4 –0.1
Interest on healthcare and life insurance benefit obligations 7.5 8.9
Actuarial gains/losses from changes in demographic assumptions –2.7 –1.6
Actuarial gains/losses from changes in financial assumptions –10.6 10.7
Actuarial gains/losses from experience adjustments –2.3 –2.8
Net changes in the scope of consolidation — —
Benefit payments –13.8 –14.7
Defined benefit obligations/net amount recognized as at December 31 194.9 209.3
The assumptions used for the discount rate and cost increases to calculate the healthcare and life insurance benefits vary according to conditions in the U.S.A. and Canada. The following weighted average valuation factors as at December 31 of the year have been used:
% 2018 2017
Discount rate 4.24 3.71
Rate of increase in healthcare and life insurance benefits in the following year 4.94 4.77
Long-term rate of increase in healthcare and life insurance benefits 3.78 3.77

Continental AG 2018 Annual Report Consolidated Financial Statements Notes to the Consolidated Financial Statements 179
The net cost of healthcare and life insurance benefit obligations can be broken down as follows:
€ millions 2018 2017
Current service cost 1.3 1.4
Service cost from plan amendments 0.1 —
Curtailments/settlements 0.4 –0.1
Interest on healthcare and life insurance benefit obligations 7.5 8.9
Net loss/income 9.3 10.2
If the other assumptions remained constant, the changes in indi-vidual key actuarial assumptions that could reasonably have been possible at the reporting date would have impacted the defined benefit obligation by the following amounts. Although the analysis
does not take account of the complete allocation of the cash flows expected under the plan, it provides an approximation of the sensi-tivity of the assumptions shown.
The following table shows the effects of a 0.5% increase or decrease in the cost trend for healthcare and life insurance obligations:
€ millions 2018 2017
0.5% increase
Effects on service and interest cost 0.1 0.1
Effects on benefit obligations 2.2 2.6
0.5% decrease
Effects on service and interest cost –0.1 –0.1
Effects on benefit obligations –2.0 –2.4
A one-half percentage point increase or decrease in the discount rate specified above for calculating the net cost of healthcare and life insurance benefit obligations would have had the following effect on net cost:
€ millions 2018 2017
0.5% increase
Effects on service and interest cost 0.5 0.5
Effects on benefit obligations –8.8 –10.2
0.5% decrease
Effects on service and interest cost –0.5 –0.5
Effects on benefit obligations 9.7 11.3

180 Continental AG 2018 Annual Report Consolidated Financial Statements Notes to the Consolidated Financial Statements
The following table shows the payments made for other post-employment benefits in the reporting year and the previous year, as well as the undiscounted, expected benefit payments for the next 10 years:
€ millions
Benefits paid
2017 14.7
2018 13.8
Benefit payments as expected
2019 15.0
2020 15.1
2021 15.1
2022 15.1
2023 15.1
Total of years 2024 to 2028 74.6
The amounts for the defined benefit obligations, funded status and experience adjustments to plan liabilities for the current and four pre-ceding reporting periods are as follows:
€ millions 2018 2017 2016 2015 2014
Defined benefit obligations 194.9 209.3 232.6 229.9 212.0
Funded status –194.9 –209.3 –232.6 –229.9 –212.0
Experience adjustments to plan liabilities –15.6 6.3 –2.1 –22.2 21.2
Provisions for obligations similar to pensions Some companies of the corporation have made commitments to employees for a fixed percentage of the employees’ compensation. These entitlements are paid out when the employment relationship is terminated. In the year under review, expenses from these obliga-tions amounted to €3.7 million (PY: €1.3 million).
Defined contribution pension plans The Continental Corporation offers its employees pension plans in the form of defined contribution plans, particularly in the U.S.A., the U.K., Japan and China. Not including social security contributions, expenses from defined contribution pension plans amounted to €80.1 million (PY: €86.6 million) in the fiscal year. This year-on-year decline was due mainly to the development of the U.S. stock market.
Other employee benefits Other employee benefits include provisions for partial early retire-ment programs and anniversary and other long-service benefits. The provisions for partial early retirement are calculated using a discount rate of 1.05% (PY: 0.98%). Provisions for anniversary and other long-service benefits were calculated using a discount rate of 1.9% (PY: 1.9%). In accordance with the option under IAS 19, the in-terest component is reported in the financial result.
Long-term incentive plans (LTI plans) Liabilities for payroll and personnel-related costs also include long-term incentive (LTI) plans as well as the amounts of variable remu-neration converted into virtual shares of Continental AG for mem-bers of the Executive Board (performance bonus, deferral).
All LTI plans up to 2013 are classified and assessed as “other long-term employee benefits” under IAS 19. The LTI plans for the years starting from 2014 and the deferral are classified as cash-settled share-based remuneration; hence they are recognized at fair value in accordance with IFRS 2.
Income from the reversal of provisions from LTI plans, amounting to €21.9 million (PY: expenses from LTI plans of €45.5 million), was recognized in the respective function costs.
› 2013 LTI plan: In 2013, the 2013/17 tranche, with a term of four years, was issued to the senior executives of the Continental Cor-poration and the members of the Executive Board. The term com-mences on the date of the Executive Board resolution concerning the issue of the respective tranche. The 2013/17 tranche was re-solved on June 24, 2013, by the Executive Board for senior exec-utives and on September 25, 2013, by the Supervisory Board for the members of the Executive Board.

Continental AG 2018 Annual Report Consolidated Financial Statements Notes to the Consolidated Financial Statements 181
› For each beneficiary of the 2013/17 LTI tranche, the Executive Board of Continental AG specifies the amount of a target bonus in euros to be paid out upon 100% target achievement. The actual LTI bonus paid out on expiry of the LTI tranche depends on the degree of target achievement, which can lie between 0% (no pay-ment) and 300% (maximum payment). The degree of achieve-ment of two target criteria is decisive for the payment and amount of the LTI bonus. The first target criterion consists of the weighted average of the Continental Value Contribution (CVC) of the Continental Corporation over a period of four fiscal years, starting from the fiscal year in which the LTI tranche is issued. The weighted average in terms of the LTI is calculated by adding together 10% of the CVC of the first fiscal year of the LTI tranche, 20% of the CVC of the second fiscal year of the LTI tranche, 30% of the CVC of the third fiscal year of the LTI tranche and 40% of the CVC of the fourth fiscal year of the LTI tranche. The second target criterion comprises the ratio of free cash flow in the Conti-nental Corporation to consolidated sales. The key variable for measuring this target criterion is based on the last full fiscal year prior to expiry of the LTI tranche. The degree of target achieve-ment for both target criteria can lie between 0% and 300%. The key variables for determining the degree of target achievement are defined for each target criterion upon issue of an LTI tranche. The ultimate degree of target achievement used to calculate the LTI bonus to be paid out is determined through the addition of the two equally weighted target criteria. The basis for calculating the LTI bonus comprises the individual bonus amount in the event of 100% target achievement promised upon issue of an LTI tranche. The LTI bonus is paid as a gross one-off payment nor-mally at the end of the second full calendar month following ex-piry of the LTI tranche at the latest but not before the end of July.
› After the expiry of the 2013/17 LTI tranche in June 2017, the bonus was paid out in August 2017.
› 2014 to 2018 LTI plan: Since 2014, senior executives of the Continental Corporation and members of the Executive Board have been granted a new bonus, the basic structure of which has been altered. This bonus is intended to allow for participation in the long-term, sustainable increase in the corporation’s value and profitability. The LTI bonus still depends on job grade and degree of target achievement and is issued in annual tranches.
› The term of the 2014/17 tranche, which was resolved on March 12, 2014, by the Supervisory Board for the members of the Executive Board and on June 23, 2014, by the Executive Board for senior executives, begins retroactively as at January 1, 2014, and is four years. After the expiry of the 2014/17 LTI tranche in December 2017, the bonus was paid out in July 2018.
› The term of the 2015/18 tranche, which was resolved on March 18, 2015, by the Supervisory Board for the members of the Executive Board and on June 4, 2015, by the Executive Board for senior executives, begins retroactively as at January 1, 2015, and is four years.
› The term of the 2016/19 tranche, which was resolved on March 18, 2016, by the Supervisory Board for the members of the Executive Board and on April 21, 2016, by the Executive Board for senior executives, begins retroactively as at January 1, 2016, and is four years.
› The term of the 2017/20 tranche, which was resolved on Janu-ary 27, 2017, by the Supervisory Board for the members of the Executive Board and on June 2, 2017, by the Executive Board for senior executives, begins retroactively as at January 1, 2017, and is four years.
› The term of the 2018/21 tranche, which was resolved on March 13, 2018, by the Supervisory Board for the members of the Executive Board and on May 28, 2018, by the Executive Board for senior executives, begins retroactively as at January 1, 2018, and is four years.
For each beneficiary of an LTI tranche, the Supervisory Board (for the members of the Executive Board) or the Executive Board (for senior executives) of Continental AG specifies the amount of a target bonus in euros to be paid out upon 100% target achieve-ment. The actual LTI bonus paid out on expiry of the LTI tranche depends on the degree of target achievement. The LTI bonus can range between 0% (no payment) and 200% (maximum payment).
The degree of achievement of two target criteria is decisive for the payment and amount of the LTI bonus. The first target crite-rion is the equally weighted average of the Continental Value Contribution (CVC) of the Continental Corporation over a period of four fiscal years, starting from the fiscal year in which the LTI tranche is issued. The equally weighted average is calculated by adding together 25% of the CVC of the four fiscal years of the term of the LTI tranche. The second target criterion is the total shareholder return (TSR) on Continental shares as at the end of the term in relation to the beginning of the LTI tranche. The share price used in calculating the TSR is the arithmetic mean of clos-ing prices in XETRA trading on the Frankfurt Stock Exchange (or a successor system) on the trading days in the three months from October to December before the issue and expiry of the LTI tranche. In addition, all dividends paid during the term of the LTI tranche are taken into account for the TSR.
The scale for determining the degree of target achievement is de-fined by the Supervisory Board or the Executive Board when the respective LTI tranche is issued. These key data are identical for the members of the Executive Board and senior executives. The degree of target achievement for the first target criterion can lie between 0% and 200%. Target achievement is calculated on a straight-line basis between 0% and the maximum level. There is no cap for the second target criterion. The ultimate degree of tar-get achievement used to calculate the LTI bonus to be paid out is determined by multiplying the two target criteria. The LTI bonus to be paid out is determined by multiplying the degree of target achievement by the target bonus. The total maximum achievable LTI bonus is 200% of the target bonus.

182 Continental AG 2018 Annual Report Consolidated Financial Statements Notes to the Consolidated Financial Statements
A Monte Carlo simulation is used in the measurement of the TSR target criterion. This means that log-normal distributed processes are simulated for the price of Continental shares. The Monte Carlo simulation takes into account the average value accumulation of share prices in the respective reference period, the TSR dividends and the restriction for the distribution amount.
The following TSR parameters were used as at the measurement date of December 31, 2018:
› Constant zero rates as at the measurement date of December 31, 2018: 2015 LTI plan: -0.81% as at the due date and -0.71% as at the expected payment date; 2016 LTI plan: -0.70% as at the due date and -0.68% as at the expected payment date; 2017 LTI plan: -0.65% as at the due date and -0.59% as at the expected payment date; 2018 LTI plan: -0.55% as at the due date and -0.48% as at the expected payment date.
› Interest rate based on the yield curve for government bonds.
› Dividend payments as the arithmetic mean based on publicly available estimates for the years 2019 to 2021; the Continental AG dividend amounted to €4.50 per share in 2018.
› Historic volatilities on the basis of daily XETRA closing rates for Continental shares based on the respective remaining term for virtual shares. The volatility for the 2015 LTI plan is 30.56%, for the 2016 LTI plan 30.03%, for the 2017 LTI plan 24.30% and for the 2018 LTI plan 25.90%.
› The fair values of the tranches developed as follows: 2015 LTI plan: €19.2 million (PY: €36.3 million), the vesting level is 100%; 2016 LTI plan: €8.5 million (PY: €27.6 million), the vesting level is 75%; 2017 LTI plan: €6.7 million (PY €37.2 million), the vesting level is 50%; 2018 LTI plan: €2.1 million, the vesting level is 25%.
The reduced liabilities for payroll and personnel-related costs for LTI resulted in income of €8.0 million for the 2015 LTI plan (PY: expenses of €11.5 million), €7.4 million for the 2016 LTI plan (PY: expenses of €7.2 million), €5.9 million for the 2017 LTI plan (PY: expenses of €9.3 million) and expenses of €0.5 million for the 2018 LTI plan in the period under review.
› Performance bonus (deferral): A Monte Carlo simulation is used in the measurement of stock options. This means that log-normal distributed processes are simulated for the price of Continental shares. The measurement model also takes into account the aver-age value accumulation of share prices in the respective reference period and the floor and cap for the distribution amount.
› Income from the reversal of provisions from virtual shares, amount-ing to €7.7 million (PY: expenses from virtual shares of €3.6 mil-lion), were recognized in the respective function costs.
The following parameters were used as at the measurement date of December 31, 2018:
› Constant zero rates as at the measurement date of December 31, 2018: 2015 tranche: -0.73% as at the due date and as at the expected payment date; 2016 tranche: -0.69% as at the due date and as at the expected payment date; 2017 tranche: -0.62% as at the due date and as at the expected payment date.
› Interest rate based on the yield curve for government bonds.
› Dividend payments as the arithmetic mean based on publicly available estimates for 2019 and 2020; the Continental AG divi-dend amounted to €4.50 per share in 2018, and Continental AG distributed a dividend of €4.25 per share in 2017.
› Historic volatilities on the basis of daily XETRA closing rates for Continental shares based on the respective remaining term for virtual shares. The volatility for the 2015 tranche is 33.10%, for the 2016 tranche 27.20% and for the 2017 tranche 23.84%.
As at December 31, 2018, commitments with a fair value of €8.5 million (PY: €14.8 million) are attributable to Executive Board mem-bers active at the end of the reporting period; this is equivalent to 63,266 virtual shares (PY: 63,617 virtual shares).
Short-term employee benefits Liabilities for payroll and personnel-related costs The Continental value sharing bonus is a program that allows Con-tinental employees to share in net income. The amount of profits shared is calculated on the basis of key internal figures. A provision of €153.1 million (PY: €184.2 million) was recognized in liabilities for staff costs for the period under review.
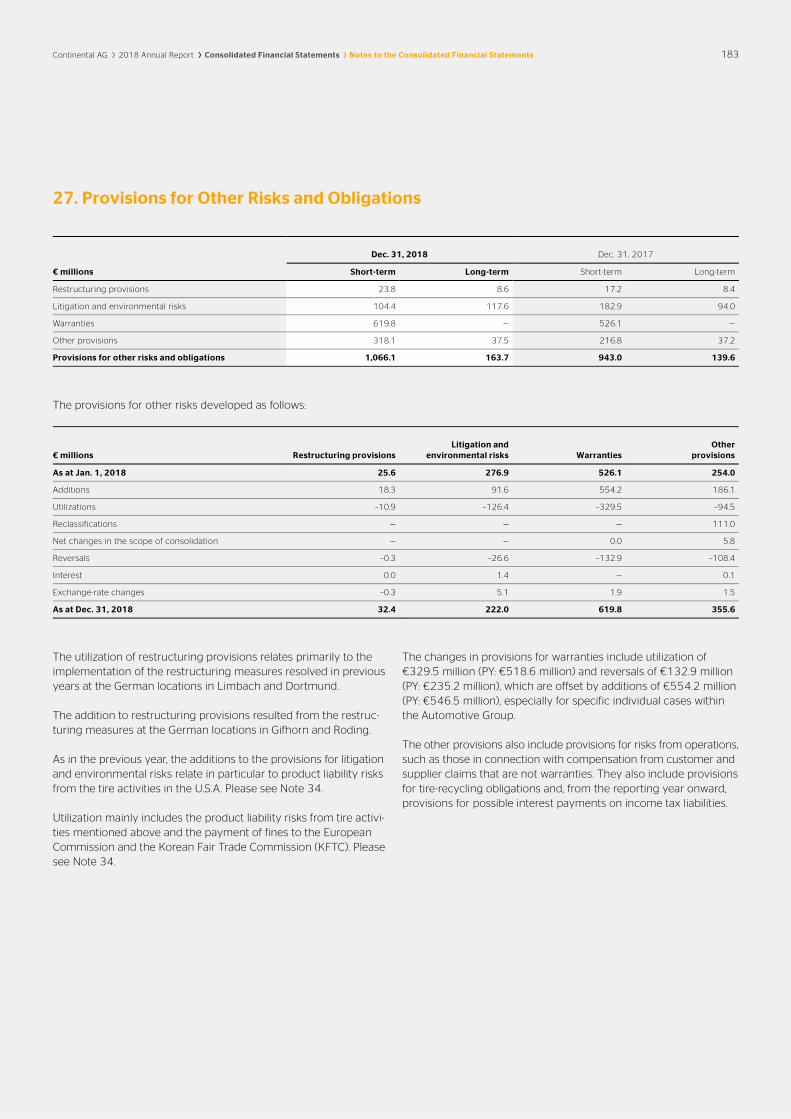
Continental AG 2018 Annual Report Consolidated Financial Statements Notes to the Consolidated Financial Statements 183
27. Provisions for Other Risks and Obligations
Dec. 31, 2018 Dec. 31, 2017
€ millions Short-term Long-term Short-term Long-term
Restructuring provisions 23.8 8.6 17.2 8.4
Litigation and environmental risks 104.4 117.6 182.9 94.0
Warranties 619.8 — 526.1 —
Other provisions 318.1 37.5 216.8 37.2
Provisions for other risks and obligations 1,066.1 163.7 943.0 139.6
The provisions for other risks developed as follows:
€ millions Restructuring provisions Litigation and
environmental risks Warranties Other
provisions
As at Jan. 1, 2018 25.6 276.9 526.1 254.0
Additions 18.3 91.6 554.2 186.1
Utilizations –10.9 –126.4 –329.5 –94.5
Reclassifications — — — 111.0
Net changes in the scope of consolidation — — 0.0 5.8
Reversals –0.3 –26.6 –132.9 –108.4
Interest 0.0 1.4 — 0.1
Exchange-rate changes –0.3 5.1 1.9 1.5
As at Dec. 31, 2018 32.4 222.0 619.8 355.6
The utilization of restructuring provisions relates primarily to the implementation of the restructuring measures resolved in previous years at the German locations in Limbach and Dortmund.
The addition to restructuring provisions resulted from the restruc-turing measures at the German locations in Gifhorn and Roding.
As in the previous year, the additions to the provisions for litigation and environmental risks relate in particular to product liability risks from the tire activities in the U.S.A. Please see Note 34.
Utilization mainly includes the product liability risks from tire activi-ties mentioned above and the payment of fines to the European Commission and the Korean Fair Trade Commission (KFTC). Please see Note 34.
The changes in provisions for warranties include utilization of €329.5 million (PY: €518.6 million) and reversals of €132.9 million (PY: €235.2 million), which are offset by additions of €554.2 million (PY: €546.5 million), especially for specific individual cases within the Automotive Group.
The other provisions also include provisions for risks from operations, such as those in connection with compensation from customer and supplier claims that are not warranties. They also include provisions for tire-recycling obligations and, from the reporting year onward, provisions for possible interest payments on income tax liabilities.

184 Continental AG 2018 Annual Report Consolidated Financial Statements Notes to the Consolidated Financial Statements
28. Income Tax Liabilities
Income tax liabilities developed as follows:
€ millions 2018 2017
As at January 1 889.7 783.6
Additions 653.5 733.5
Utilizations and advance payments for the current fiscal year –664.8 –567.1
Reversals –19.3 –49.7
Additions from the first-time consolidation of subsidiaries –110.8 2.5
Exchange-rate changes 2.4 –13.1
As at December 31 750.7 889.7
When reconciling the income tax liabilities with the income taxes paid in the statement of cash flows, the cash changes in income tax receivables must be included in addition to the utilizations and current advance payments shown here.
Starting from the year under review, liabilities from interest payments on income taxes are reported under other provisions.
29. Indebtedness and Additional Notes on the Statement of Cash Flows
Dec. 31, 2018 Dec. 31, 2017
€ millions Total Short-term Long-term Total Short-term Long-term
Bonds 1,895.2 499.9 1,395.3 2,639.4 748.5 1,890.9
Bank loans and overdrafts1 1,239.0 1,223.7 15.3 859.7 757.6 102.1
Derivative instruments 8.2 8.1 0.1 16.9 16.9 0.0
Finance lease liabilities 12.3 2.4 9.9 16.4 4.2 12.2
Liabilities from sale-of-receivables programs 469.2 469.2 — 513.7 513.7 —
Other indebtedness2 983.0 954.6 28.4 43.9 31.3 12.6
Indebtedness 4,606.9 3,157.9 1,449.0 4,090.0 2,072.2 2,017.8
1 Thereof €13.5 million (PY: €13.9 million) secured by land charges, mortgages and similar securities. 2 Other indebtedness in 2018 included a carrying amount of €814.5 million (PY: €12.6 million) from commercial paper issuances.
Continental’s key bond issues
€ millions Issuer/type
Amount of issue
Dec. 31, 2018
Carrying amount
Dec. 31, 2018
Stock market value
Dec. 31, 2018
Amount of issue
Dec. 31, 2017
Carrying amount
Dec. 31, 2017
Stock market value
Dec. 31, 2017 Coupon
p.a.
Issue/maturity and fixed
interest until Issue price
CAG euro bond — — — 750.0 748.5 763.3 3.000% 2013/07.2018 98.950%
CRoA euro bond 500.0 499.9 500.4 500.0 498.9 503.9 0.500% 2015/02.2019 99.739%
CAG euro bond 600.0 598.1 600.2 600.0 596.3 601.4 0.000% 2016/02.2020 99.410%
CAG euro bond 750.0 747.2 787.4 750.0 745.7 812.0 3.125% 2013/09.2020 99.228%
Total 1,850.0 1,845.2 1,888.0 2,600.0 2,589.4 2,680.6
Abbreviations › CAG, Continental Aktiengesellschaft, Hanover
› CRoA, Continental Rubber of America, Corp., Wilmington, Delaware, U.S.A.

Continental AG 2018 Annual Report Consolidated Financial Statements Notes to the Consolidated Financial Statements 185
The carrying amount of the bonds fell by €744.2 million from €2,639.4 million in the previous year to €1,895.2 million as at the end of fiscal 2018. This decline is attributable to the repayment of the €750.0 million euro bond from Continental AG. The five-year bond bore interest at a rate of 3.0% p.a. and was redeemed at a rate of 100.00% at its maturity on July 16, 2018.
Cross-currency interest-rate swaps were concluded for the euro bond with a nominal volume of €500.0 million issued by Conti-nental Rubber of America, Corp., Wilmington, Delaware, U.S.A., in November 2015. These swaps are used to hedge against the cur-rency risks arising from the bond’s denomination in euros, on the one hand, and involve exchanging the euro-based fixed interest rate of 0.5% p.a. for a U.S.-dollar-based fixed interest rate averaging 2.365% p.a., on the other (please see Note 30 for further information on the accounting for the cross-currency interest-rate swaps).
The carrying amount of the bonds also includes a private place-ment issued by Continental AG at 100.0% at the end of August 2013 with a volume of €50.0 million, an interest rate of 3.9% p.a. and a term of 12 years.
Credit lines and available financing from banks Bank loans and overdrafts amounted to €1,239.0 million (PY: €859.7 million) as at December 31, 2018, and were therefore up €379.3 million on the previous year’s level. On December 31, 2018, there were credit lines and available financing from banks in the
amount of €4,799.5 million (PY: €4,556.5 million). A nominal amount of €3,504.1 million of this had not been utilized as at the end of the reporting period (PY: €3,686.8 million). As in the previous year, €3,000.0 million of this relates to the revolving tranche of the syndicated loan, which had been utilized in the amount of €157.2 million (PY: —) as at December 31, 2018. In the year under review, the Continental Corporation utilized its commercial paper programs, its sale-of-receivables programs and its various bank lines to meet short-term credit requirements. In the second half of 2018, the ex-isting commercial paper programs were supplemented with an ad-ditional U.S. $500.0 million commercial paper program in the U.S.A.
The syndicated loan comprises a revolving tranche of €3,000.0 million. This credit line is available to Continental until April 2021. This tranche can be utilized both in euros and in other currencies on the basis of variable interest rates. Depending on the currency, interest is accrued at either the Euribor rate or the corresponding Libor rate plus a margin in each case.
Besides the syndicated loan, the major portion of the credit lines and available financing from banks related, as in the previous year, to predominantly floating-rate short-term borrowings.
As in the previous year, the agreed financial covenants were also complied with as at the end of the respective quarter in 2018. Please see Note 30 for the maturity structure of indebtedness.
Finance lease liabilities The future payment obligations resulting from finance leases are shown in the table below:
Dec. 31, 2018/€ millions 2019 2020 2021 2022 2023 from 2024 Total
Minimum lease payments 2.7 2.6 2.6 2.4 1.6 1.3 13.2
Interest component 0.3 0.2 0.2 0.1 0.0 0.1 0.9
Finance lease liabilities 2.4 2.4 2.4 2.3 1.6 1.2 12.3
Dec. 31, 2017/€ millions 2018 2019 2020 2021 2022 from 2023 Total
Minimum lease payments 4.8 2.9 2.5 2.5 2.3 3.0 18.0
Interest component 0.6 0.3 0.2 0.2 0.1 0.2 1.6
Finance lease liabilities 4.2 2.6 2.3 2.3 2.2 2.8 16.4
The fair value of the lease liabilities is €12.3 million (PY: €16.6 million). The effective interest rate of the main leases is between 2.0% and 5.4% (PY: between 2.7% and 9.8%).
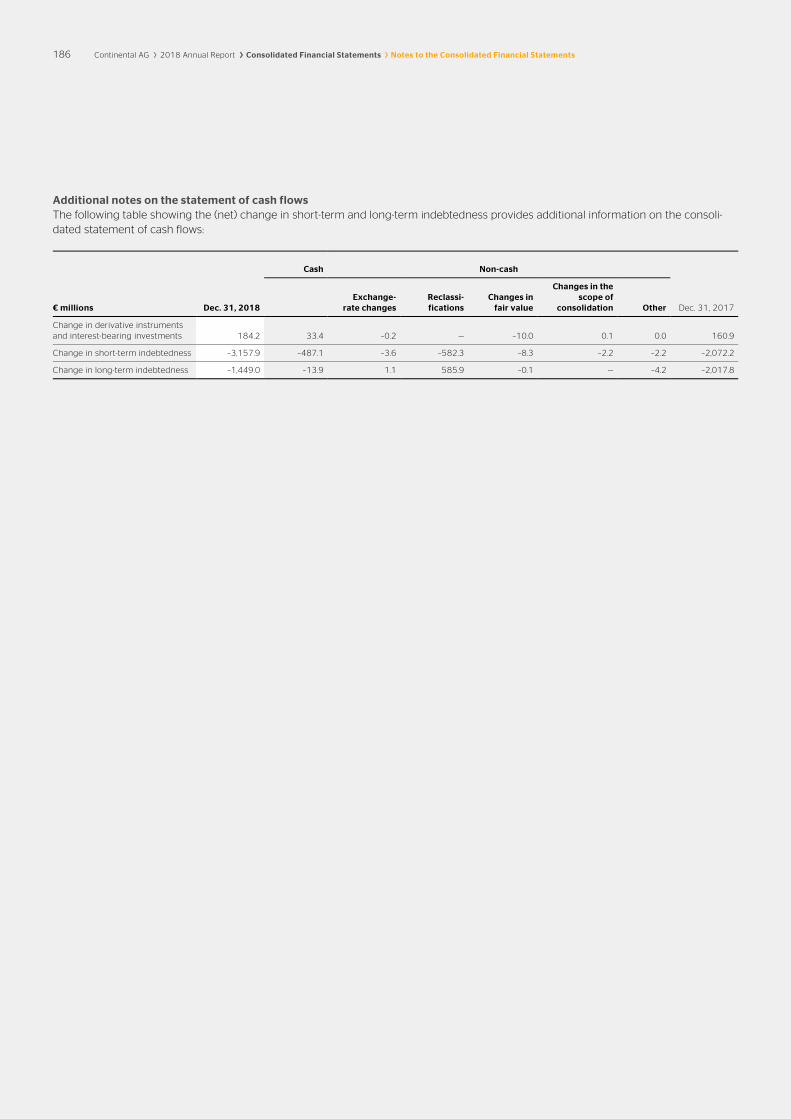
186 Continental AG 2018 Annual Report Consolidated Financial Statements Notes to the Consolidated Financial Statements
Additional notes on the statement of cash flows The following table showing the (net) change in short-term and long-term indebtedness provides additional information on the consoli-dated statement of cash flows:
Cash Non-cash
€ millions Dec. 31, 2018 Exchange-
rate changes Reclassi- fications
Changes in fair value
Changes in the scope of
consolidation Other Dec. 31, 2017
Change in derivative instruments and interest-bearing investments 184.2 33.4 –0.2 — –10.0 0.1 0.0 160.9
Change in short-term indebtedness –3,157.9 –487.1 –3.6 –582.3 –8.3 –2.2 –2.2 –2,072.2
Change in long-term indebtedness –1,449.0 –13.9 1.1 585.9 –0.1 — –4.2 –2,017.8

Continental AG 2018 Annual Report Consolidated Financial Statements Notes to the Consolidated Financial Statements 187
30. Financial Instruments
Information on the first-time adoption of IFRS 9 The first-time adoption of IFRS 9, Financial Instruments, resulted in the following effects on the earnings, financial and net assets position:
› In this context, Continental uses the modified retrospective ap-proach. The cumulative effect of the first-time adoption of IFRS 9 in the amount of €10.9 million before taxes (€8.9 million after taxes) as of the date of first-time adoption was recognized as an increase in the opening carrying amount of retained earnings. The cumulative effect resulted from the following matters:
› The cumulated gains of €3.4 million (including related deferred tax effects) in other comprehensive income from the previous measurement category “available-for-sale financial assets” were reclassified to retained earnings.
› In cash and cash equivalents, there was an effect of -€0.1 mil-lion from financial instruments that were measured at amor-tized cost in accordance with IAS 39 and are classified as FVPL (fair value through profit and loss) in accordance with IFRS 9.
› Impairment on financial instruments decreased by a total of €7.6 million before taxes. This was firstly due to the increase in impairment as a result of the impairment model implemented in accordance with IFRS 9, which takes account of expected losses. Secondly, impairment that had been recognized as at December 31, 2017, on the basis of portfolio valuation allow-ances using experience-based values in accordance with IAS 39 was derecognized.
The new regulations for hedge accounting in accordance with IFRS 9, which are generally to be applied prospectively, were applied to the cash flow hedges in place as at December 31, 2017, in accord-ance with IAS 39. There was no accounting effect as at the transi-tion date on January 1, 2018. For more information, please refer to the detailed disclosures on hedge accounting under Financial For-eign-Currency Risks (Cash Flow Hedges) in this section.
As at January 1, 2018, the Continental Corporation measured other investments at FVOCIwoR (fair value through other comprehensive income without reclassification) and classified them accordingly, as these investments are held over a long term for strategic purposes. In 2017, other investments were classified as AfS (available for sale).
The values of comparative periods are based on the accounting principles of IAS 39, Financial Instruments: Recognition and Mea-surement, and are shown unadjusted.
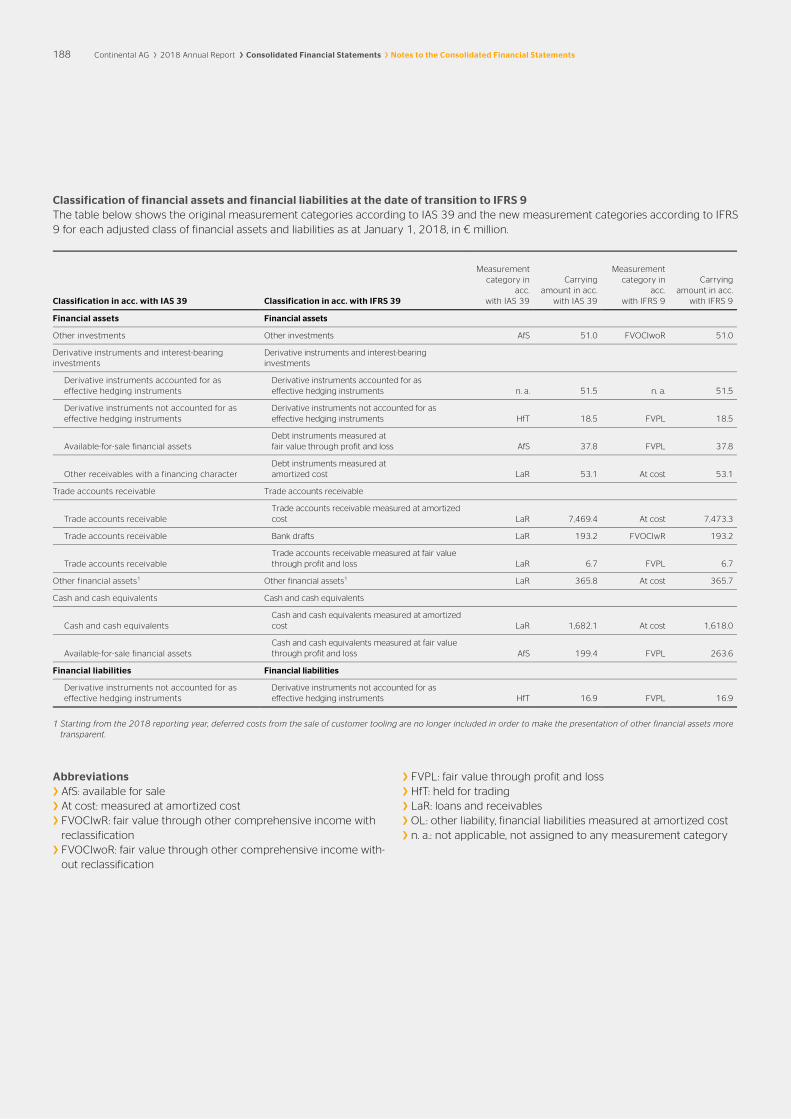
188 Continental AG 2018 Annual Report Consolidated Financial Statements Notes to the Consolidated Financial Statements
Classification of financial assets and financial liabilities at the date of transition to IFRS 9 The table below shows the original measurement categories according to IAS 39 and the new measurement categories according to IFRS 9 for each adjusted class of financial assets and liabilities as at January 1, 2018, in € million.
Classification in acc. with IAS 39 Classification in acc. with IFRS 39
Measurement category in
acc. with IAS 39
Carrying amount in acc.
with IAS 39
Measurement category in
acc. with IFRS 9
Carrying amount in acc.
with IFRS 9
Financial assets Financial assets
Other investments Other investments AfS 51.0 FVOCIwoR 51.0
Derivative instruments and interest-bearing investments
Derivative instruments and interest-bearing investments
Derivative instruments accounted for as effective hedging instruments
Derivative instruments accounted for as effective hedging instruments n. a. 51.5 n. a. 51.5
Derivative instruments not accounted for as effective hedging instruments
Derivative instruments not accounted for as effective hedging instruments HfT 18.5 FVPL 18.5
Available-for-sale financial assets Debt instruments measured at fair value through profit and loss AfS 37.8 FVPL 37.8
Other receivables with a financing character Debt instruments measured at amortized cost LaR 53.1 At cost 53.1
Trade accounts receivable Trade accounts receivable
Trade accounts receivable Trade accounts receivable measured at amortized cost LaR 7,469.4 At cost 7,473.3
Trade accounts receivable Bank drafts LaR 193.2 FVOCIwR 193.2
Trade accounts receivable Trade accounts receivable measured at fair value through profit and loss LaR 6.7 FVPL 6.7
Other financial assets1 Other financial assets1 LaR 365.8 At cost 365.7
Cash and cash equivalents Cash and cash equivalents
Cash and cash equivalents Cash and cash equivalents measured at amortized cost LaR 1,682.1 At cost 1,618.0
Available-for-sale financial assets Cash and cash equivalents measured at fair value through profit and loss AfS 199.4 FVPL 263.6
Financial liabilities Financial liabilities
Derivative instruments not accounted for as effective hedging instruments
Derivative instruments not accounted for as effective hedging instruments HfT 16.9 FVPL 16.9
1 Starting from the 2018 reporting year, deferred costs from the sale of customer tooling are no longer included in order to make the presentation of other financial assets more transparent.
Abbreviations › AfS: available for sale
› At cost: measured at amortized cost
› FVOCIwR: fair value through other comprehensive income with reclassification
› FVOCIwoR: fair value through other comprehensive income with-out reclassification
› FVPL: fair value through profit and loss
› HfT: held for trading
› LaR: loans and receivables
› OL: other liability, financial liabilities measured at amortized cost
› n. a.: not applicable, not assigned to any measurement category

Continental AG 2018 Annual Report Consolidated Financial Statements Notes to the Consolidated Financial Statements 189
Information on the annual financial statements The tables below show the carrying amounts and fair values of financial assets and liabilities, whereby non-current and current items are presented together. In addition, the relevant measure-
ment categories are shown according to IFRS 9 and the levels of the fair value hierarchy relevant for calculating fair value according to IFRS 13, Fair Value Measurement. The structure of the table for the previous year was adapted to the new format.
€ millions
Measurement category in acc.
with IFRS 9
Carrying amount
Dec. 31, 2018
Fair value as at
Dec. 31, 2018 thereof Level 1
thereof Level 2
thereof Level 3
Other investments FVOCIwoR 192.9 192.9 — — 192.9
Derivative instruments and interest-bearing investments
Derivative instruments accounted for as effective hedging instruments n. a. 28.2 28.2 — 28.2 —
Derivative instruments not accounted for as effective hedging instruments1 FVPL 15.1 15.1 — 15.1 —
Debt instruments FVPL 29.4 29.4 19.6 9.8 —
Debt instruments At cost 111.5 111.5 — — —
Trade accounts receivable
Trade accounts receivable At cost 7,516.1 7,516.1 — — —
Bank drafts FVOCIwR 114.9 114.9 — 114.9 —
Trade accounts receivable FVPL 0.9 0.9 — 0.9 —
Other financial assets
Other financial assets FVPL 0.9 0.9 — 0.9 —
Miscellaneous financial assets2 At cost 401.2 401.2 — — —
Cash and cash equivalents
Cash and cash equivalents At cost 2,201.0 2,201.0 — — —
Cash and cash equivalents FVPL 560.4 560.4 458.8 101.6 —
Financial assets 11,172.5 11,172.5 478.4 271.4 192.9
Indebtedness
Derivative instruments not accounted for as effective hedging instruments1 FVPL 8.2 8.2 — 8.2 —
Finance lease liabilities n. a. 12.3 12.3 — 12.3 —
Other indebtedness At cost 4,586.4 4,638.5 1,888.0 283.0 —
Trade accounts payable At cost 7,293.0 7,293.0 — — —
Other financial liabilities
Liabilities to related parties from finance leases n. a. 6.9 6.5 — 6.5 —
Miscellaneous financial liabilities At cost 1,306.7 1,306.7 — 1.6 —
Financial liabilities 13,213.5 13,265.2 1,888.0 311.6 —
Aggregated according to categories as defined in IFRS 9:
Financial assets (FVOCIwR) 114.9
Financial assets (FVOCIwoR) 192.9
Financial assets (FVPL) 606.7
Financial assets (at cost) 10,229.8
Financial liabilities (FVPL) 8.2
Financial liabilities (at cost) 13,186.1
1 Including positive fair values of €0.0 million and negative fair values of €0.1 million for long-term embedded derivatives. 2 Starting from the 2018 reporting year, deferred costs from the sale of customer tooling are no longer included in order to make the presentation of other financial assets more
transparent.

190 Continental AG 2018 Annual Report Consolidated Financial Statements Notes to the Consolidated Financial Statements
€ millions
Measurement category in acc.
with IAS 39
Carrying amount as at
Dec. 31, 2017
Fair value as at
Dec. 31, 2017 thereof Level 1
thereof Level 2
Other investments AfS 51.0 51.0 — —
Derivative instruments and interest-bearing investments
Derivative instruments accounted for as effective hedging instruments n. a. 51.5 51.5 — 51.5
Derivative instruments not accounted for as effective hedging instruments1 HfT 18.5 18.5 — 18.5
Available-for-sale financial assets AfS 37.8 37.8 28.3 9.5
Other receivables with a financing character LaR 53.1 53.1 — —
Trade accounts receivable LaR 7,669.3 7,669.3 — —
Other financial assets2 LaR 365.8 365.8 — —
Cash and cash equivalents
Cash and cash equivalents LaR 1,682.1 1,682.1 — —
Available-for-sale financial assets AfS 199.4 199.4 199.4 —
Financial assets 10,128.5 10,128.5 227.7 79.5
Indebtedness
Derivative instruments not accounted for as effective hedging instruments1 HfT 16.9 16.9 — 16.9
Finance lease liabilities n. a. 16.4 16.6 — 16.6
Other indebtedness OL 4,056.7 4,155.3 2,680.6 298.9
Trade accounts payable OL 6,798.5 6,798.5 — —
Other financial liabilities
Other indebtedness n. a. 7.3 7.1 — 7.1
Miscellaneous financial liabilities OL 1,305.6 1,305.5 — 4.9
Financial liabilities 12,201.4 12,299.9 2,680.6 344.4
Aggregated according to categories as defined in IAS 39:
Financial assets held for trading (HfT) 18.5
Loans and receivables (LaR) 9,770.3
Available-for-sale financial assets (AfS) 288.2
Financial liabilities held for trading (HfT) 16.9
Financial liabilities measured at amortized cost (OL) 12,160.8
1 Including positive fair values of €0.1 million and negative fair values of €0.0 million for long-term embedded derivatives. 2 Starting from the 2018 reporting year, deferred costs from the sale of customer tooling are no longer included in order to make the presentation of other financial assets more
transparent. The figures as at December 31, 2017, have been adjusted accordingly.
Levels of the fair value hierarchy according to IFRS 13: › Level 1: quoted prices on the active market for identical instru-
ments
› Level 2: quoted prices on the active market for a similar instru-ment or a measurement method for which all major input factors are based on observable market data
› Level 3: measurement method for which the major input factors are not based on observable market data
For other investments for which there are no quoted prices on the active market for identical instruments (level 1) or for a similar in-strument, or for which there is no applicable measurement method in which all major input factors are based on observable market data (level 2), the fair value is calculated with a measurement
method for which the major input factors are not based on observ-able market data (level 3). The measurement is performed accor-ding to the measurement method that is deemed appropriate in each case. For the majority of level 3 instruments, the costs are the best estimate. The fair value of other investments is monitored centrally and checked for valuation adjustment using one of the key input factors that is not based on observable market data. There are no indications that non-observable market data has a significant impact on the fair value of other investments.
Derivative instruments that meet the requirements of hedge accounting and finance lease liabilities are not allocated to any IFRS 9 (previous year: IAS 39) measurement category, since they are excluded from the individual measurement categories.

Continental AG 2018 Annual Report Consolidated Financial Statements Notes to the Consolidated Financial Statements 191
In 2017, derivative instruments for which effective hedge account-ing is not applied were classified as financial assets or liabilities held for trading.
Finance lease liabilities are not assigned to a measurement category as they are accounted for under IAS 17.
The accounting policies applied are described in the notes to the consolidated financial statements under General Information and Accounting Principles (Note 2).
Trade accounts receivable and payable, other receivables with a financing character, other financial assets and liabilities, and cash and cash equivalents generally have short remaining maturities. As a result, the carrying amounts as at the end of the reporting period
are, as a rule, approximately their fair values and are not shown in the fair value hierarchy in the table. The fair values of other indebt-edness, other financial liabilities and finance lease liabilities were determined by discounting all future cash flows at the applicable in-terest rates for the corresponding residual maturities, taking into account a company-specific credit spread, provided their carrying amounts as at the reporting date are not approximately equivalent to their fair values.
The corporation recognizes possible reclassifications between the different levels of the fair value hierarchy as at the end of the report-ing period in which a change occurred. In 2018, as in the previous year, there were no transfers between the different levels of the fair value hierarchy.
The following income and expenses from financial instruments were recognized in the consolidated statement of income:
Net gains and losses
from interest Other net gains
and losses Total net gains
and losses
€ millions 2018 2017 2018 2017 2018 2017
Loans and receivables — 26.4 — –64.1 — –37.7
Financial assets (at cost) 28.0 — 26.1 — 54.1 —
Financial assets and liabilities (FVPL) 8.6 — 14.2 — 22.8 —
Available-for-sale financial assets (AfS) — 0.1 — 1.8 — 1.9
Financial assets and financial liabilities held for trading (HfT) — — — 38.3 — 38.3
Financial assets (FVOCI) –1.9 — 0.8 — –1.1 —
Financial liabilities (2018: at cost; 2017 OL) –108.7 –123.3 –62.7 56.7 –171.4 –66.6
Interest income and expense from financial instruments is reported in the financial result (see Note 11).
Dividend income from financial assets measured at fair value with changes in value under other comprehensive income is explained under Income from Investments (Note 10).
The changes in value of available-for-sale financial assets that were recognized directly in equity in accordance with IAS 39 in the pre-vious year amounted to €3.7 million; in addition, a sum of €1.8 mil-lion was recognized in profit or loss.
Collateral As at December 31, 2018, a total of €762.5 million (PY: €1,896.6 million) of financial assets had been pledged as collateral. In the year under review, as in the previous year, collateral mainly consisted of trade accounts receivable; the remainder related to pledged cash or other financial assets.
Risk management of financial instruments Due to its international business activities and the resulting financ-ing requirements, the Continental Corporation is exposed to default risks, risks from changes in exchanges rates and variable interest rates, and liquidity risk. The management of these risks is described in the following sections.
In addition, hedging instruments are used in the corporation. Their use is covered by corporate-wide policies, adherence to which is regularly reviewed by internal auditors. Internal settlement risks are minimized through the clear segregation of functional areas.
Further information about the risks presented below and about risk management can be found in the Report on Risks and Opportunities section of the Corporate Management Report.
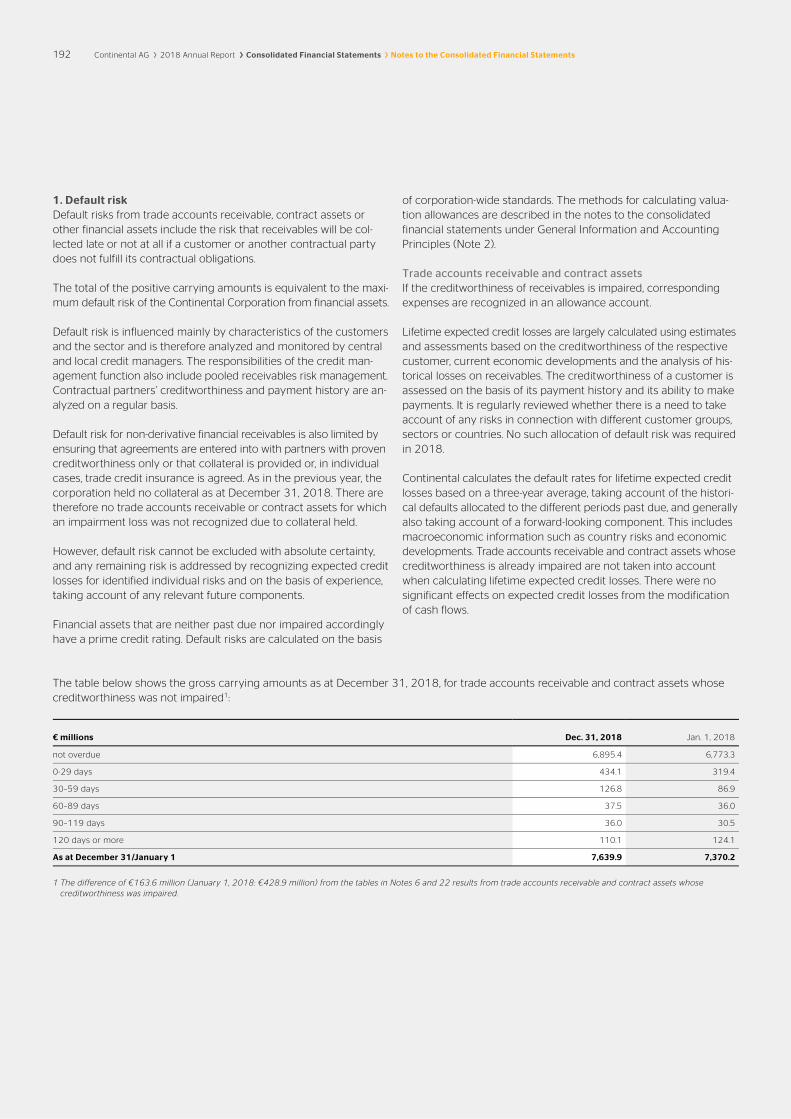
192 Continental AG 2018 Annual Report Consolidated Financial Statements Notes to the Consolidated Financial Statements
1. Default risk Default risks from trade accounts receivable, contract assets or other financial assets include the risk that receivables will be col-lected late or not at all if a customer or another contractual party does not fulfill its contractual obligations.
The total of the positive carrying amounts is equivalent to the maxi-mum default risk of the Continental Corporation from financial assets.
Default risk is influenced mainly by characteristics of the customers and the sector and is therefore analyzed and monitored by central and local credit managers. The responsibilities of the credit man-agement function also include pooled receivables risk management. Contractual partners’ creditworthiness and payment history are an-alyzed on a regular basis.
Default risk for non-derivative financial receivables is also limited by ensuring that agreements are entered into with partners with proven creditworthiness only or that collateral is provided or, in individual cases, trade credit insurance is agreed. As in the previous year, the corporation held no collateral as at December 31, 2018. There are therefore no trade accounts receivable or contract assets for which an impairment loss was not recognized due to collateral held.
However, default risk cannot be excluded with absolute certainty, and any remaining risk is addressed by recognizing expected credit losses for identified individual risks and on the basis of experience, taking account of any relevant future components.
Financial assets that are neither past due nor impaired accordingly have a prime credit rating. Default risks are calculated on the basis
of corporation-wide standards. The methods for calculating valua-tion allowances are described in the notes to the consolidated financial statements under General Information and Accounting Principles (Note 2).
Trade accounts receivable and contract assets If the creditworthiness of receivables is impaired, corresponding expenses are recognized in an allowance account.
Lifetime expected credit losses are largely calculated using estimates and assessments based on the creditworthiness of the respective customer, current economic developments and the analysis of his-torical losses on receivables. The creditworthiness of a customer is assessed on the basis of its payment history and its ability to make payments. It is regularly reviewed whether there is a need to take account of any risks in connection with different customer groups, sectors or countries. No such allocation of default risk was required in 2018.
Continental calculates the default rates for lifetime expected credit losses based on a three-year average, taking account of the histori-cal defaults allocated to the different periods past due, and generally also taking account of a forward-looking component. This includes macroeconomic information such as country risks and economic developments. Trade accounts receivable and contract assets whose creditworthiness is already impaired are not taken into account when calculating lifetime expected credit losses. There were no significant effects on expected credit losses from the modification of cash flows.
The table below shows the gross carrying amounts as at December 31, 2018, for trade accounts receivable and contract assets whose creditworthiness was not impaired1:
€ millions Dec. 31, 2018 Jan. 1, 2018
not overdue 6,895.4 6,773.3
0-29 days 434.1 319.4
30–59 days 126.8 86.9
60–89 days 37.5 36.0
90–119 days 36.0 30.5
120 days or more 110.1 124.1
As at December 31/January 1 7,639.9 7,370.2
1 The difference of €163.6 million (January 1, 2018: €428.9 million) from the tables in Notes 6 and 22 results from trade accounts receivable and contract assets whose creditworthiness was impaired.
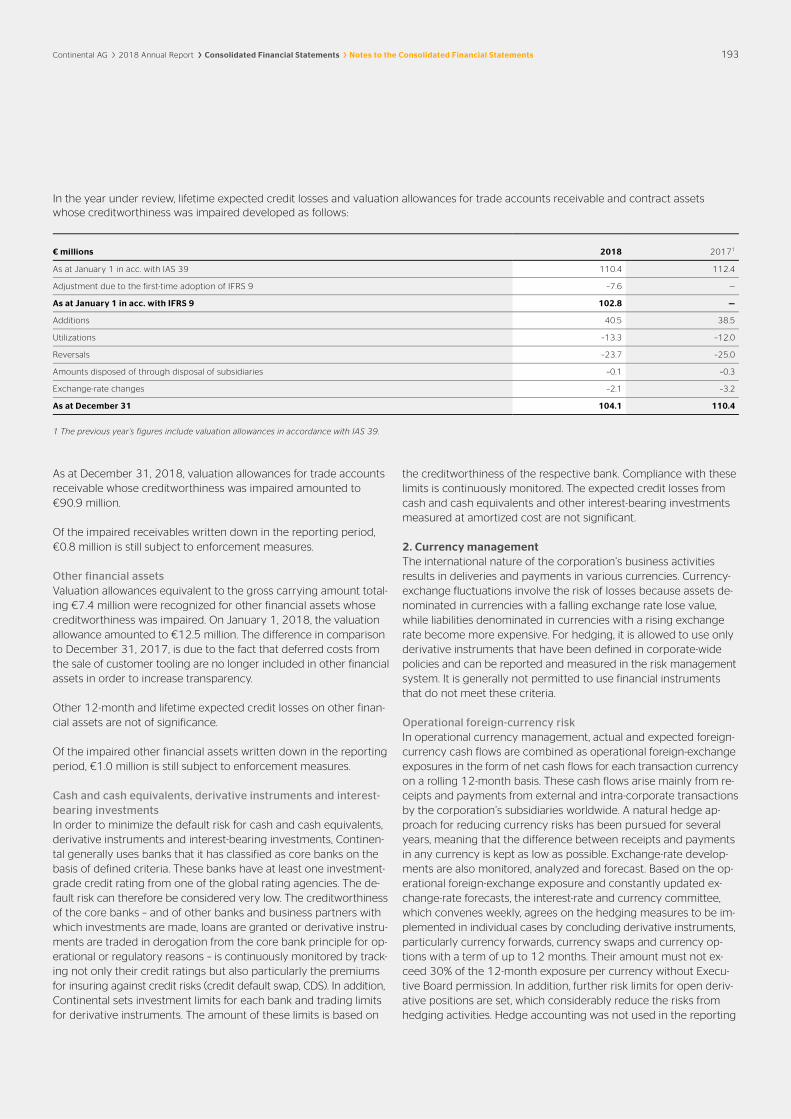
Continental AG 2018 Annual Report Consolidated Financial Statements Notes to the Consolidated Financial Statements 193
In the year under review, lifetime expected credit losses and valuation allowances for trade accounts receivable and contract assets whose creditworthiness was impaired developed as follows:
€ millions 2018 20171
As at January 1 in acc. with IAS 39 110.4 112.4
Adjustment due to the first-time adoption of IFRS 9 –7.6 —
As at January 1 in acc. with IFRS 9 102.8 —
Additions 40.5 38.5
Utilizations –13.3 –12.0
Reversals –23.7 –25.0
Amounts disposed of through disposal of subsidiaries –0.1 –0.3
Exchange-rate changes –2.1 –3.2
As at December 31 104.1 110.4
1 The previous year’s figures include valuation allowances in accordance with IAS 39.
As at December 31, 2018, valuation allowances for trade accounts receivable whose creditworthiness was impaired amounted to €90.9 million.
Of the impaired receivables written down in the reporting period, €0.8 million is still subject to enforcement measures.
Other financial assets Valuation allowances equivalent to the gross carrying amount total-ing €7.4 million were recognized for other financial assets whose creditworthiness was impaired. On January 1, 2018, the valuation allowance amounted to €12.5 million. The difference in comparison to December 31, 2017, is due to the fact that deferred costs from the sale of customer tooling are no longer included in other financial assets in order to increase transparency.
Other 12-month and lifetime expected credit losses on other finan-cial assets are not of significance.
Of the impaired other financial assets written down in the reporting period, €1.0 million is still subject to enforcement measures.
Cash and cash equivalents, derivative instruments and interest-bearing investments In order to minimize the default risk for cash and cash equivalents, derivative instruments and interest-bearing investments, Continen-tal generally uses banks that it has classified as core banks on the basis of defined criteria. These banks have at least one investment-grade credit rating from one of the global rating agencies. The de-fault risk can therefore be considered very low. The creditworthiness of the core banks – and of other banks and business partners with which investments are made, loans are granted or derivative instru-ments are traded in derogation from the core bank principle for op-erational or regulatory reasons – is continuously monitored by track-ing not only their credit ratings but also particularly the premiums for insuring against credit risks (credit default swap, CDS). In addition, Continental sets investment limits for each bank and trading limits for derivative instruments. The amount of these limits is based on
the creditworthiness of the respective bank. Compliance with these limits is continuously monitored. The expected credit losses from cash and cash equivalents and other interest-bearing investments measured at amortized cost are not significant.
2. Currency management The international nature of the corporation’s business activities results in deliveries and payments in various currencies. Currency-exchange fluctuations involve the risk of losses because assets de-nominated in currencies with a falling exchange rate lose value, while liabilities denominated in currencies with a rising exchange rate become more expensive. For hedging, it is allowed to use only derivative instruments that have been defined in corporate-wide policies and can be reported and measured in the risk management system. It is generally not permitted to use financial instruments that do not meet these criteria.
Operational foreign-currency risk In operational currency management, actual and expected foreign-currency cash flows are combined as operational foreign-exchange exposures in the form of net cash flows for each transaction currency on a rolling 12-month basis. These cash flows arise mainly from re-ceipts and payments from external and intra-corporate transactions by the corporation’s subsidiaries worldwide. A natural hedge ap-proach for reducing currency risks has been pursued for several years, meaning that the difference between receipts and payments in any currency is kept as low as possible. Exchange-rate develop-ments are also monitored, analyzed and forecast. Based on the op-erational foreign-exchange exposure and constantly updated ex-change-rate forecasts, the interest-rate and currency committee, which convenes weekly, agrees on the hedging measures to be im-plemented in individual cases by concluding derivative instruments, particularly currency forwards, currency swaps and currency op-tions with a term of up to 12 months. Their amount must not ex-ceed 30% of the 12-month exposure per currency without Execu-tive Board permission. In addition, further risk limits for open deriv-ative positions are set, which considerably reduce the risks from hedging activities. Hedge accounting was not used in the reporting

194 Continental AG 2018 Annual Report Consolidated Financial Statements Notes to the Consolidated Financial Statements
year or in the previous year for hedges concluded in this way. As in the previous year, there were no derivative instruments for hedging against operational foreign-currency risks as at December 31, 2018.
As at December 31, 2018, the net exposure from financial instru-ments that are denominated in a currency other than the functional currency of the respective subsidiary and are not allocated to net indebtedness existed in the major currencies of the euro in the amount of -€211.6 million (PY: -€198.2 million) and the U.S. dollar in the amount of -€525.4 million (PY: -€476.0 million).
Financial foreign-currency risks In addition to operational foreign-currency risk, currency risks also result from the corporation’s external and internal net indebtedness that is denominated in a currency other than the functional currency of the respective subsidiary. The quantity of these instruments is reg-ularly summarized in the form of a financial foreign-currency expo-sure for each transaction currency. As at December 31, 2018, the net exposure in the major currencies amounted to -€1,297.8 million (PY: -€987.8 million) for the euro and €423.7 million (PY: €620.0 million) for the U.S. dollar. These currency risks are generally hedged against through the use of derivative instruments, particu-larly currency forwards, currency swaps and cross-currency inter-est-rate swaps. The corporation’s net foreign investments are, as a rule, not hedged against exchange-rate fluctuations. In the case of highly effective, longer-term and significant hedges, Continental usually applies hedge accounting. The hedged transactions are not divided into their risk components.
Hedging against financial foreign-currency risks without using hedge accounting As at December 31, 2018, there are derivative instruments for hedging against financial foreign-currency risks from intra-corpo-rate receivables and liabilities. Hedge accounting is not used for these instruments. As at December 31, 2018, they are reported in the statement of financial position under the item “Short-term deriv-ative instruments and interest-bearing investments” in the amount of €15.1 million (PY: €18.4 million) and under the item “Short-term financial liabilities” in the amount of €8.1 million (PY: €16.9 million) and are assigned to the measurement category FVPL. Their nomi-nal volume comes to €940.4 million as at December 31, 2018 (PY: €1,452.8 million).
Hedging against financial foreign-currency risks (net investment hedge) In the previous year, the Continental Corporation designated cur-rency swaps as hedging instruments in hedges of net investments in foreign operations in accordance with IAS 39. It terminated these hedges as at August 25, 2017. Based on the decision that currency effects from net investments in a foreign operation and from desig-nated hedges that are accumulated in the currency translation re-serve in equity are to be reclassified to the income statement only if the foreign operation is sold or liquidated, €20.2 million (PY: €20.2 million) from the hedged transactions remains in the cur-rency translation reserve in equity.
Hedging against financial foreign-currency risks (cash flow hedge) In 2015, the Continental Corporation fully designated cross-currency interest-rate swaps as hedging instruments for cash flow hedge ac-counting pursuant to IAS 39. The cash flow hedges are used to se-cure the €500 million bond issued by Continental Rubber of Amer-ica, Corp., Wilmington, Delaware, U.S.A., on November 19, 2015. In doing so, first the currency risks of Continental Rubber of America, Corp., Wilmington, Delaware, U.S.A., are hedged against by the de-nomination in euros and, second, the euro-based fixed interest rate is exchanged for a U.S.-dollar-based fixed interest rate. The new regulations for hedge accounting in accordance with IFRS 9 were applied to these cash flow hedges prospectively as at January 1, 2018. There was no accounting effect as at the transition date on January 1, 2018.
In this context, the fulfillment of hedge effectiveness conditions as required under IFRS 9 was continually demonstrated prospectively in qualitative terms based on matching key parameters of the hedged transaction and the hedge (critical terms match). The fixed interest and capital cash outflows of the euro bond as the hedged transaction and the opposing interest and capital cash inflows from the fixed hedges (euro-swap leg) match and offset each other with regard to their critical terms: nominal amounts, maturities and the measurement methods used for setting interest rates. On this basis, an economically effective, efficient hedge is still assumed and the hedging ratio remains at 1:1. Ineffectiveness is calculated by com-paring the present value development of the hedged transactions and the fair value development of the hedging instruments. Ineffec-tiveness generally results from the recognition of credit risk and of currency basis spreads when measuring cross-currency interest-rate swaps at fair value. These effects are not applied when measur-ing the bond that is carried at amortized cost.
For information on the accounting principles for cash flow hedges, please refer to General Information and Accounting Principles (Note 2).

Continental AG 2018 Annual Report Consolidated Financial Statements Notes to the Consolidated Financial Statements 195
The quantitative information required under IFRS 7 in relation to cash flow hedges is shown in the table below:
€ million (unless otherwise stated) Dec. 31, 2018 Dec. 31, 2017
Carrying amount and item of the statement of financial position of the cross-currency interest-rate swaps
Long-term derivative instruments and interest-bearing investments — 51.5
Short-term derivative instruments and interest-bearing investments 28.2 —
Nominal amounts of cross-currency interest-rate swaps (EUR swap leg) 500.0 500.0
Maturity date Feb. 19, 2019 Feb. 19, 2019
Average exchange rates of nominal amounts of cross-currency interest-rate swaps at maturity date 1,078 1,078
Average interest rate of EUR swap legs (annual payment) in % 0.50% 0.50%
Average interest rate of USD swap legs (semiannual payment) in % 2.37% 2.37%
Changes in fair values of cross-currency interest-rate swaps used as the basis for recognizing hedge ineffectiveness for the period –23.3 60.8
Changes in the fair value of the bond used as the basis for recognizing hedge ineffectiveness for the period 23.3 –60.8
The table below shows the change in the cash flow hedge reserve, which is reported in equity under the “Difference arising from financial instruments” item:
€ millions 2018 2017
As at January 1 2.4 2.1
Fair value changes of cross-currency interest-rate swaps –24.9 63.3
Reclassification adjustments to profit and loss because the hedged item has affected profit or loss1 22.6 –63.1
Deferred taxes 0.5 0.4
Exchange-rate changes 0.1 –0.3
As at December 31 0.7 2.4
1 Shown under the cash flow hedges item in the statement of comprehensive income.
As in the previous year, the cash flow hedges did not result in an ineffectiveness to be recognized in profit or loss in the year under review.
Translation-related foreign-currency risks A large number of the subsidiaries are located outside the euro cur-rency zone. As Continental AG’s reporting currency in the consoli-dated financial statements is the euro, the financial statements of these companies are translated into euros. With regard to manag-ing the risks of translation-related currency effects, it is assumed that investments in foreign companies are entered into for the long term and that earnings are reinvested. Translation-related effects that arise when the value of net asset items translated into euros changes as a result of exchange-rate fluctuations are recognized directly in equity in the consolidated financial statements and are generally not hedged.
Sensitivity analysis IFRS 7 requires a presentation of the effects of hypothetical changes in exchange rates on income and equity using a sensitivity analysis. The changes in the exchange rates are related to all financial instru-ments outstanding as at the end of the reporting period, including the effects of hedges. Forecast transactions and translation-related foreign-currency risks are not included in the sensitivity analysis. To determine the transaction-related net foreign-currency risk, finan-cial instruments with transaction currencies that differ from the functional currencies are identified and a 10% appreciation or de-preciation of the respective functional currency of the subsidiaries in relation to the identified different transaction currencies is as-sumed. The following table shows, before income tax expense, the overall effect as measured using this approach, as well as the indi-vidual effects resulting from the euro and the U.S. dollar, as major transaction currencies, on the difference from currency translation and from financial instruments in equity and on net income.

196 Continental AG 2018 Annual Report Consolidated Financial Statements Notes to the Consolidated Financial Statements
2018 2017
€ millions Total equity Net income Total equity Net income
Local currency +10%
Total –0.3 113.3 50.8 56.6
thereof EUR –0.3 89.6 50.8 14.2
thereof USD — 7.5 — 20.2
Local currency –10%
Total 0.3 –113.3 –50.8 –56.6
thereof EUR 0.3 –89.6 –50.8 –14.2
thereof USD — –7.5 — –20.2
3. Interest-rate management Variable interest agreements result in a risk of rising interest rates for interest-bearing financial liabilities and falling interest rates for interest-bearing financial investments. These interest-rate risks are valuated and assessed as part of our interest-rate management ac-tivities, partly on the basis of continuous monitoring of current and anticipated long-term and short-term interest-rate developments, and are managed by means of derivative interest-rate hedging in-struments as needed. The corporation’s interest-bearing net indebt-edness is the subject of these activities. Interest-rate hedges serve exclusively to manage identified interest-rate risks. Once a year, a
range is determined for the targeted share of fixed-interest indebt-edness in relation to total gross indebtedness. As in the previous year, there were no derivative financial instruments for hedging against interest-rate risks as at December 31, 2018.
The corporation is not exposed to a risk of fluctuation in the fair value of long-term financial liabilities due to market changes in fixed interest rates, as the lenders do not have the right to demand early repayment in the event of changing rates and these liabilities are recognized at amortized cost.
Interest-rate risk The profile of interest-bearing financial instruments allocated to net indebtedness, taking into account the effect of the Continental Corpo-ration’s derivative instruments, is as follows:
€ millions 2018 2017
Fixed-interest instruments
Financial assets 18.4 0.1
Financial liabilities 2,820.9 2,764.3
Floating-rate instruments
Financial assets 2,883.9 1,972.3
Financial liabilities 1,777.8 1,308.7
In accordance with IFRS 7, effects of financial instruments on income and equity resulting from interest-rate changes must be presented using a sensitivity analysis.
Fair value sensitivity analysis The main effects resulted from the changes in the U.S. dollar and euro interest rates. There were no changes in the financial result in 2018 or in the previous year. The effects on equity are presented below; tax effects were not taken into account in the analysis:
› An increase in U.S. dollar interest rates of 100 basis points in 2018 would have increased equity by €0.7 million (PY: €4.9 million).
› A decline in U.S. dollar interest rates of 100 basis points would have reduced equity by €0.7 million (PY: €5.0 million).
› An increase in euro interest rates of 100 basis points in 2018 would have reduced equity by €0.7 million (PY: €5.7 million).
› A decline in euro interest rates of 100 basis points would have increased equity by €0.7 million (PY: €5.8 million).

Continental AG 2018 Annual Report Consolidated Financial Statements Notes to the Consolidated Financial Statements 197
Cash flow sensitivity analysis The following table shows the effects an increase or a decrease in interest rates of 100 basis points would have had on the financial result. The effects would essentially result from floating-rate finan-cial instruments. In the scenario in which there is a decrease in the pertinent interest rates, the effects were calculated for individual groups of financial instruments taking account of their contractual arrangement (particularly the interest-rate floors agreed) and based
on assumptions with regard to changes in the applicable interest rates for these financial instruments depending on changes in mar-ket interest rates. With regard to these assumptions, we consider it realistic, as in the previous year, that only contractually agreed in-terest-rate floors would limit a decrease in the relevant interest rates. As in the previous year, this analysis is based on the assumption that all other variables, and in particular exchange rates, remain un-changed.
Interest-rate increase +100 basis points Interest-rate decline –100 basis points
€ millions 2018 2017 2018 2017
Total 11.2 6.8 –11.7 –7.3
thereof EUR 0.5 0.2 –1.0 –0.7
thereof CNY 5.7 4.8 –5.7 –4.8
thereof USD 1.3 –1.4 –1.3 1.4
thereof INR 0.9 0.7 –0.9 –0.7
thereof JPY 0.7 0.4 –0.7 –0.4
thereof KRW 0.5 0.7 –0.5 –0.7
thereof BRL 0.5 0.3 –0.5 –0.3
thereof CAD –0.8 –0.2 0.8 0.2
4. Liquidity risks Cost-effective, adequate financing is necessary for the subsidiaries’ operating business. A liquidity forecast is therefore prepared by central cash management on a regular basis.
Various marketable financial instruments are used to meet the financial requirements. These comprise overnight money, term borrowing, the commercial paper issue, sale-of-receivables pro-grams, the syndicated loan with a committed nominal amount of €3.0 billion (PY: €3.0 billion) and other bilateral loans. Furthermore,
approximately 41% (PY: 65%) of gross indebtedness is financed on the capital market in the form of long-term bonds. Capital expendi-ture by subsidiaries is primarily financed through equity and loans from banks or subsidiaries. There are also cash-pooling arrange-ments with subsidiaries to the extent they are possible and justifi-able in the relevant legal and tax situation. If events lead to unex-pected financing requirements, the Continental Corporation can draw upon existing liquidity and fixed credit lines from banks. For detailed information on the existing utilized and unutilized commit-ted credit lines, please refer to Note 29.
The financial liabilities of €13,213.5 million (PY: €12,201.4 million) result in the following undiscounted cash outflows in the next five years and thereafter.
Dec. 31, 2018/€ millions 2019 2020 2021 2022 2023 thereafter Total
Other indebtedness incl. interest payments –3,171.0 –1,396.7 –6.6 –6.9 –5.0 –64.8 –4,651.0
Derivative instruments1 –9.3 — — — — — –9.3
Finance lease liabilities –2.7 –2.6 –2.6 –2.4 –1.6 –1.3 –13.2
Trade accounts payable –7,293.0 — — — — — –7,293.0
Other financial liabilities –1,275.6 –33.0 –0.3 –0.3 –0.3 –5.3 –1,314.8
1 Not including embedded derivatives, as they do not give rise to cash outflows.

198 Continental AG 2018 Annual Report Consolidated Financial Statements Notes to the Consolidated Financial Statements
Dec. 31, 2017/€ millions 2018 2019 2020 2021 2022 thereafter Total
Other indebtedness incl. interest payments –2,091.3 –604.8 –1,394.5 –9.5 –5.2 –66.8 –4,172.1
Derivative instruments1 –17.1 — — — — — –17.1
Finance lease liabilities –4.8 –2.9 –2.5 –2.5 –2.3 –3.0 –18.0
Trade accounts payable –6,798.5 — — — — — –6,798.5
Other financial liabilities –1,277.2 –5.6 –25.1 –0.3 –0.3 –5.6 –1,314.1
1 Not including embedded derivatives, as they do not give rise to cash outflows.
In the analysis, foreign-currency amounts were translated into euros using the current spot rate as at the end of the reporting period. For floating-rate non-derivative financial instruments, the future in-terest payment flows were forecast using the most recently contrac-tually fixed interest rates. Forward interest rates were used to deter-mine floating-rate payments for derivative instruments. The analysis only includes cash outflows from financial liabilities. The net pay-ments are reported for derivative instruments that are liabilities as at the end of the reporting period. Cash inflows from financial assets were not included.
The cash outflows in the maturity analysis are not expected to occur at significantly different reference dates or in significantly different amounts.
Global netting agreements and similar agreements Continental AG concludes business in the form of derivative instru-ments on the basis of the German Master Agreement on Financial Derivatives Transactions (Deutscher Rahmenvertrag für Finanz-termingeschäfte). Fundamentally, there is the option to combine the amounts owed by each counterparty under such agreements
on the same day in respect of all outstanding transactions in the same currency into a single net amount to be paid by one party to another.
The German Master Agreement on Financial Derivatives Transac-tions does not meet the criteria for offsetting in the statement of financial position. This is due to the fact that Continental AG has no legal right to the netting of the amounts recognized at the current time. According to the regulations of the German Master Agree-ment, the right to netting can be enforced only when future events occur, such as the insolvency of or default by a contractual party. In such cases, all outstanding transactions under the agreement are ended, the fair value is calculated as at this time, and just a single net amount is paid to settle all transactions.
At some Brazilian and South Korean subsidiaries, there are local framework agreements on the basis of which these companies have concluded derivative instruments. These agreements also do not meet the criteria for offsetting in the statement of financial position.
The following table shows the carrying amounts of the reported stand-alone derivative instruments, their offsetting in the statement of financial position, and any potential arising from the specified agreements subject to the occurrence of certain future events:
Dec. 31, 2018 Dec. 31, 2017
€ millions Carrying amounts1
Respective financial instruments
not netted Net amount Carrying amounts1
Respective financial instruments
not netted Net amount
Financial assets 43.3 –0.7 42.6 69.9 –7.5 62.4
Financial liabilities –8.1 0.7 –7.4 –16.9 7.5 –9.4
1 There were no amounts to be offset in accordance with IAS 32.42 as at the reporting date and as the same date in the previous year.

Continental AG 2018 Annual Report Consolidated Financial Statements Notes to the Consolidated Financial Statements 199
31. Other Financial Liabilities
Dec. 31, 2018 Dec. 31, 2017
€ millions Short-term Long-term Short-term Long-term
Liabilities to related parties 232.6 7.0 261.6 7.4
Interest payable 13.7 — 23.6 —
Liabilities for selling expenses 963.9 — 922.3 —
Purchase prices payable on company acquisitions 8.1 24.5 9.8 24.6
Miscellaneous financial liabilities 56.9 6.9 59.5 4.1
Other financial liabilities 1,275.2 38.4 1,276.8 36.1
The liabilities to related parties relate in particular to liabilities to associates for services provided. The decrease primarily resulted from a corporate company formed in 2010 that sources significant portions of its merchandise from an equity-accounted investee.
Interest payable at the end of 2018 is due mainly to deferred inter-est for the bonds issued. The decline compared to the end of 2017 is due in particular to the repayment on July 16, 2018, of the €750.0 million euro bond issued by Continental AG. Liabilities for
selling expenses relate in particular to obligations from bonus agreements with customers and deferred price reductions granted.
The purchase price obligations from company acquisitions mainly comprise the acquisitions implemented in the current year and pre-vious years in Germany, Czechia, Australia and the U.S.A.
The miscellaneous financial liabilities primarily include the put op-tion for the acquisition of the remaining shares in Zonar Systems, Inc., Seattle, Washington, U.S.A.
32. Trade Accounts Payable
Trade accounts payable amounted to €7,293.0 million (PY: €6,798.5 million) as at the end of the fiscal year. The liabilities are measured at amortized cost. The full amount is due within one year. The liabilities do not include any amounts from the percentage-
of-completion method. For information on liquidity risk, currency risk and the sensitivity analysis for trade accounts payable, please see Note 30.
33. Other Liabilities
Dec. 31, 2018 Dec. 31, 2017
€ millions Short-term Long-term Short-term Long-term
Liabilities for VAT and other taxes 254.8 — 303.6 —
Deferred income1 9.1 8.4 137.9 18.4
Miscellaneous liabilities 302.7 5.0 276.4 7.0
Other liabilities 566.6 13.4 717.9 25.4
1 Please see the “Revenue from contracts with customers” section in Note 6 regarding the changes in this item resulting from the partial reclassification to contract liabilities due to the first-time adoption of new IFRS standards.
Deferred income primarily includes deferrals for government grants.

200 Continental AG 2018 Annual Report Consolidated Financial Statements Notes to the Consolidated Financial Statements
34. Litigation and Compensation Claims
Continental AG and its subsidiaries are involved in lawsuits and reg-ulatory investigations and proceedings worldwide. Such lawsuits, investigations and proceedings could also be initiated or claims as-serted in other ways in the future.
Product liability In particular, Continental is constantly subject to product liability and other claims in which the company is accused of the alleged infringement of its duty of care, violations against warranty obliga-tions or defects of material or workmanship. Claims from alleged breaches of contract resulting from product recalls or government proceedings are also asserted. Among other cases, claimants in the U.S.A. file lawsuits for property damage, personal injury and death caused by alleged defects in our products. Claims for material and non-material damages, and in some cases punitive damages, are being asserted. The outcome of individual proceedings, which are generally decided by a jury in a court of first instance, cannot be predicted with certainty. No assurance can be given that Continen-tal will not incur substantial expenses as a result of the final judg-ments or settlements in some of these cases, or that these amounts will not exceed any provisions set up for these claims. Some subsid-iaries in the U.S.A. are exposed to relatively limited claims for dam-ages from purported health injuries allegedly caused by products containing asbestos. The total costs for dealing with all such claims and proceedings have amounted to less than €50 million per year since 2006.
Proceedings relating to ContiTech AG The actions of rescission and nullification by shareholders of Conti-Tech AG, Hanover, Germany, against resolutions adopted by the An-nual Shareholders’ Meeting of the company on August 22, 2007, regarding the approval of the conclusion of a management and profit and loss transfer agreement between this company as the controlled company and ContiTech-Universe Verwaltungs-GmbH, Hanover, Germany, as the controlling company and regarding the squeeze-out of minority shareholders were concluded in 2009 by a dismissal, which is final. In 2012, partial settlement agreements were entered in the records of the Hanover Regional Court (Land-gericht) in the judicial review proceedings regarding the appropri-ateness of the settlement and compensation payment under the management and profit and loss transfer agreement and the settle-ment for the squeeze-out. Under these settlements, a payment of €3.50 plus interest per share on top of the exit compensation un-der the management and profit and loss transfer agreement and on account of the squeeze-out was agreed, as was – merely declar-atory – a higher compensatory payment under the management and profit and loss transfer agreement. The compensation conse-quently increased to €28.33 per share. In October 2012, the Hano-ver Regional Court had awarded additional payments of the same amount.
Upon appeals by some petitioners, the Celle Higher Regional Court (Oberlandesgericht) had revoked the rulings on July 17, 2013, and remanded the matter to the Regional Court for a new hearing and ruling. On September 19, 2018, the Hanover Regional Court now adjusted the compensation under the management and profit and loss transfer agreement and on account of the squeeze-out to €26.70 per share and also adjusted the compensatory payment under the management and profit and loss transfer agreement on a merely declaratory basis. The rulings are not final.
Regulatory proceedings In May 2005, the Brazilian competition authorities opened investi-gations against Continental’s Brazilian subsidiary Continental Brasil Indústria Automotiva Ltda., Guarulhos, Brazil (CBIA), following a complaint of anticompetitive behavior in the area of commercializa-tion of tachographs. On August 18, 2010, the Brazilian antitrust authorities determined an “invitation to cartel” and imposed a fine of BRL 12.0 million (around €2.7 million) on CBIA, which was then reduced to BRL 10.8 million (around €2.4 million). CBIA denies the accusation that it has infringed Brazilian antitrust law. The court of first instance appealed to by CBIA upheld the decision. However, on CBIA’s further appeal, the next higher court annulled this decision and remanded the matter. In case an infringement of Brazilian anti-trust law is found, third parties may, in addition, claim damages from CBIA.
On October 2, 2006, South African antitrust authorities received a complaint from a third party accusing several South African tire manufacturers of alleged antitrust behavior, including Continental Tyre South Africa (Pty.) Ltd., Port Elizabeth (CTSA), a subsidiary of Continental. On August 31, 2010, the South African antitrust au-thorities came to the conclusion that CTSA had violated South Afri-can antitrust law and referred the matter to the responsible anti-trust court for a decision. CTSA denies the allegation of infringe-ments of South African antitrust law. However, the tribunal could impose a fine of up to 10% of CTSA’s sales. In addition, third parties may also claim damages from CTSA in case of an infringement of South African competition law.
In a case that had come to light at the start of 2010 as a result of searches at several companies, the European Commission imposed fines on a number of automotive suppliers on July 10, 2013, for anti-competitive conduct in the field of supplying wire harnesses for automotive applications. These companies included S-Y Systems Technologies Europe GmbH, Regensburg, Germany (S-Y), and its French subsidiary, which had to pay a fine of €11.1 million due to cartel agreements with regard to one automotive manufacturer. Continental held a 50% share of S-Y until January 29, 2013. Class action lawsuits filed by alleged victims against S-Y and other com-panies are pending in Canada. A claim for damages brought against S-Y was settled out of court. Further claims cannot be ruled out.
Other Disclosures

Continental AG 2018 Annual Report Consolidated Financial Statements Notes to the Consolidated Financial Statements 201
In October 2012, Continental Automotive Systems US, Inc., Auburn Hills, Michigan, U.S.A., and two of Continental’s South Korean sub-sidiaries became aware of investigations by the U.S. Department of Justice (DOJ) and the Korean Fair Trade Commission (KFTC) in connection with the suspected involvement in violations of U.S. and South Korean antitrust law in instrument cluster business. On December 23, 2013, the KFTC announced that it had imposed a fine of KRW 45,992 million (around €36 million) on Continental Automotive Electronics LLC, Bugan-myeon, South Korea (CAE). On June 25, 2015, the Seoul High Court, Seoul, South Korea, vacated the administrative fine imposed by the KFTC on CAE’s appeal against the amount of the fine. The Supreme Court of South Korea rejected KFTC’s appeal against this decision on May 31, 2017. On May 21, 2018, the KFTC adjusted the fine to KRW 32,101 million (around €25 million). This decision is final. On November 24, 2014, CAE and Continental Automotive Korea Ltd., Seongnam-si, South Korea, entered into an agreement with the DOJ that was confirmed by the competent U.S. court on April 1, 2015. Under this agree-ment, the two companies admitted to charges of violating U.S. anti-trust law and agreed to pay a fine of U.S. $4.0 million (around €3.3 million). In the proceedings relating to class action lawsuits filed in the U.S.A. for alleged damages resulting from the antitrust violations,
settlements totaling U.S. $5.0 million (around €4.4 million) were concluded in 2018. The risk of investigations into this matter by other antitrust authorities and claims for damages by further alleged victims remains unaffected by the fines imposed.
In September 2014, the European Commission conducted a search at a subsidiary of Continental. On February 21, 2018, the commission imposed a fine of €44.0 million on Continental AG; Continental Teves AG & Co. oHG, Frankfurt, Germany; and Conti-nental Automotive GmbH, Hanover, Germany; for the unlawful ex-change of information. This involved specific brake components. Continental has set aside provisions that cover this fine. Continental cannot rule out the possibility that customers will claim for damages with reference to the commission’s decision. At this point in time, it is not possible to say whether such claims will be submitted and, if they are, how much the damages will be – irrespective of whether or not the claims are justified. As a result, it cannot be ruled out that the resulting expenses will exceed the provisions that have been set aside for this purpose. In accordance with IAS 37.92, no further disclosures will be made with regard to the proceedings and the re-lated measures so as not to adversely affect the company’s interests.
35. Contingent Liabilities and Other Financial Obligations
€ millions Dec. 31, 2018 Dec. 31, 2017
Liabilities on guarantees 16.9 9.5
Liabilities on warranties 52.9 35.6
Risks from taxation and customs 50.7 10.9
Other financial obligations 17.3 18.7
Other contingent liabilities 15.1 14.6
Contingent liabilities and other financial obligations 152.9 89.3
As in the previous years, the contingent liabilities related to guaran-tees for the liabilities of affiliated companies and third parties not in-cluded in consolidation and to contractual warranties. To the best of our knowledge, the underlying obligations will be fulfilled in all cases. Utilization is not anticipated.
The risks from tax and customs matters partly relate to announced tariffs and import restrictions in the U.S.A. as a result of the trade conflict between the U.S.A. and China for the protection of the U.S. economy.
The other financial obligations relate in part to the acquisition of companies now owned by the corporation.
The Continental Corporation could be subject to obligations relat-ing to environmental issues under governmental laws and regula-tions, or as a result of various claims and proceedings that are pending or that might be made or initiated against it. Estimates of future expenses in this area are naturally subject to many uncer-tainties, such as the enactment of new laws and regulations, the de-velopment and application of new technologies and the identifica-tion of contaminated land or buildings for which the Continental Corporation is legally liable.

202 Continental AG 2018 Annual Report Consolidated Financial Statements Notes to the Consolidated Financial Statements
Open purchase commitments for property, plant and equipment amounted to €743.6 million (PY: €740.0 million).
In 2018, expenses from operating leases and rental agreements amounted to €277.3 million (PY: €255.9 million).
Future liabilities relating to operating leases and rental agreements with an original or remaining term of more than one year as at De-cember 31, 2018, amount to the figures shown in the table below for 2019 and cumulatively for the years 2020 through 2023, and likewise cumulatively from 2024.
Dec. 31, 2018/€ millions 2019 2020–2023 from 2024
Operating leases and rental agreements 291.2 777.8 465.6
Dec. 31, 2017/€ millions 2018 2019–2022 from 2023
Operating leases and rental agreements 277.3 694.1 423.1
36. Earnings per Share
Basic earnings per share fell to €14.49 in 2018 (PY: €14.92), the same amount as diluted earnings per share. In both the period un-der review and the previous year, there were no dilutive effects
such as interest savings on convertible bonds or warrant-linked bonds (after taxes). There were also no dilutive effects from stock option plans or the assumed exercise of convertible bonds.
€ millions/millions of shares 2018 2017
Net income attributable to the shareholders of the parent 2,897.3 2,984.6
Weighted average number of shares issued 200.0 200.0
Basic earnings per share in € 14.49 14.92
37. Events after the End of the Reporting Period
As at the start of 2019, the business units, assets and liabilities be-longing to the Powertrain segment were transferred to a separate legal structure. Because Continental still retains control as defined in IFRS 10, Consolidated Financial Statements, there is no material
effect on the assets and liabilities currently recognized in the consolidated financial statements of Continental AG, except for the calculation of deferred taxes in fiscal 2019.

Continental AG 2018 Annual Report Consolidated Financial Statements Notes to the Consolidated Financial Statements 203
38. Auditor’s Fees
For fiscal 2018, a global fee of €11.8 million (PY: €11.0 million) was agreed for the audit of the consolidated financial statements and the separate financial statements of the subsidiaries.
The following fees were recognized as an expense specifically for the auditor of Continental AG elected by the Annual Shareholders’ Meeting.
The following fees relate only to services directly connected with Continental AG and its German subsidiaries:
€ millions 2018 2017
Audit of financial statements 4.6 4.4
Other assurance services 0.6 0.1
Tax advisory services 0.0 0.5
Other services provided to the parent company or its subsidiaries 0.2 0.4
Total 5.4 5.4
The values to be disclosed according to Section 314 (1) No. 9 HGB are determined pursuant to IDW RS HFA 36 in the new version of
September 8, 2016. KPMG AG Wirtschaftsprüfungsgesellschaft and its registered branches are deemed the auditor.
39. Transactions with Related Parties
Remuneration of the Executive Board and the Supervisory Board The remuneration of the corporation’s key management personnel that must be disclosed in accordance with IAS 24 comprises the re-muneration of the active members of the Executive Board and the Supervisory Board.
The remuneration of the active members of the Executive Board in the respective years was as follows:
€ thousands 2018 2017
Short-term benefits 10,950 17,339
Service cost relating to post-employment benefits 5,694 7,166
Termination benefits 1,947 680
Share-based payment –23,971 22,058
Total –5,380 47,243
The basic elements of the Executive Board remuneration system and the amounts granted to the Executive Board and the Super- visory Board in the year under review are explained in the Remu-neration Report, which supplements the Corporate Governance Report and is part of the combined Management Report with the Continental Corporation.
The total remuneration granted to the Executive Board of Continen-tal AG in 2018 amounted to €20.5 million (PY: €35.8 million). That total remuneration also includes, in addition to short-term benefits of €11.0 million (PY: €17.3 million), a newly granted long-term in-centive plan totaling €7.1 million (PY: €7.3 million) and the long-term component of variable remuneration totaling €2.4 million (PY: €6.1 million), which is converted into virtual shares of the company.
In 2018, this resulted in the long-term component for 2017 being converted into 27,026 virtual shares. Moreover, former members of the Executive Board and their surviving dependents received payments totaling €8.3 million (PY: €6.8 million). Provisions for pen-sion obligations for former members of the Executive Board and their surviving dependents amounted to €131.6 million (PY: €121.5 million).
Remuneration paid to the members of Continental AG’s Supervisory Board, including meeting fees, totaled €5.3 million in the past fiscal year (PY: €5.2 million). As in 2017, no advances or loans were granted to members of Continental AG’s Executive Board or Super-visory Board in 2018.

204 Continental AG 2018 Annual Report Consolidated Financial Statements Notes to the Consolidated Financial Statements
Transactions with related parties other than subsidiaries:
Services rendered Services received Accounts receivable Accounts payable
€ millions 2018 2017 2018 2017 2018 2017 2018 2017
Non-consolidated companies 24.2 23.3 6.1 15.1 11.7 14.7 3.5 10.4
Equity-accounted investees 420.1 317.7 225.1 293.8 193.9 141.5 210.3 236.9
Schaeffler Group 89.5 84.4 118.0 117.5 20.5 20.5 18.8 14.4
Other related parties 2.2 2.9 0.1 0.2 1.6 1.5 7.0 7.3
Total 536.0 428.3 349.3 426.6 227.7 178.2 239.6 269.0
Transactions with related parties other than subsidiaries are at-tributable solely to the ordinary business activities of the respective company and were conducted on an arm’s-length basis.
In addition, short-term derivative instruments and interest-bearing investments include receivables of €33.9 million (PY: —) and short-term indebtedness includes liabilities of €119.6 million (PY: —) from transactions with equity-accounted investees that are attributable to transfers in connection with financing agreements.

Continental AG 2018 Annual Report Consolidated Financial Statements Notes to the Consolidated Financial Statements 205
Notices in Accordance with the German Securities Trading Act (Wertpapierhandelsgesetz – WpHG) From the start of the fiscal year to the time of the preparation of the financial statements, we received the following notifications in accordance with Section 40 (1) WpHG on holdings in Continental AG. In the event of the threshold stated in this provision being reached, exceeded or falling below on multiple occasions by the same party, only the most recent notification has been shown here. Notifications from earlier fiscal years about the existence of voting rights shares of at least 3% are still disclosed as at the end of the reporting period. In these cases, the provisions relate to the version of the WpHG valid until January 2, 2018.
BlackRock, Inc., Wilmington, Delaware, United States, notified us that its share of voting rights in Continental AG on November 22, 2018, amounted to 3.09%.
› 2.99% of these voting rights (5,980,485 voting rights) are at-tributed to the company in accordance with Section 34 WpHG.
› 0.08% of these voting rights (160,558 voting rights) are at-tributed to the company as instruments in accordance with Sec-tion 38 (1) No. 1 WpHG (Lent Securities).
› 0.02% of these voting rights (40,717 voting rights) are attributed to the company as instruments in accordance with Section 38 (1) No. 2 WpHG (Contract for Difference).
Harris Associates L.P., Wilmington, Delaware, United States, notified us that its share of voting rights in Continental AG on November 2, 2018, amounted to 5.02%.
› 5.02% of these voting rights (10,031,823 voting rights) are at-tributed to the company in accordance with Section 34 WpHG.
By way of a letter dated January 4, 2016, we received notification that:
› the share of voting rights in Continental AG held by Schaeffler Familienholding Eins GmbH, Herzogenaurach, Germany, fell be-low the threshold of 3% of voting rights on December 31, 2015, due to restructuring within the corporation and amounted to 0.00% at this time.
› the share of voting rights in Continental AG held by Schaeffler Familienholding Zwei GmbH, Herzogenaurach, Germany, fell be-low the threshold of 3% of voting rights on December 31, 2015, due to restructuring within the corporation and amounted to 0.00% at this time.
› the share of voting rights in Continental AG held by IHO Verwal-tungs GmbH (still operating as Schaeffler Verwaltung Zwei GmbH as at December 31, 2015), Herzogenaurach, Germany, on December 31, 2015, amounted to 35.99%.
› the share of voting rights in Continental AG held by IHO Be-teiligungs GmbH (still operating as Schaeffler Verwaltungs GmbH as at December 31, 2015), Herzogenaurach, Germany, on December 31, 2015, amounted to 10.01%. Another 35.99% of
the voting rights in Continental AG are attributed to the company in accordance with Section 22 (1) Sentence 1 No. 1 WpHG.
› 46.00% of the voting rights in Continental AG are attributed to IHO Holding GmbH & Co. KG (still operating as Schaeffler Holding GmbH & Co. KG as at December 31, 2015), Herzogenaurach, Ger-many, on December 31, 2015, in accordance with Section 22 (1) Sentence 1 No. 1 WpHG.
› 46.00% of the voting rights in Continental AG are attributed to IHO Management GmbH (still operating as Schaeffler Manage-ment GmbH as at December 31, 2015), Herzogenaurach, Ger-many, on December 31, 2015, in accordance with Section 22 (1) Sentence 1 No. 1 WpHG.
› 46.00% of the voting rights in Continental AG are attributed to INA-Holding Schaeffler GmbH & Co. KG, Herzogenaurach, Ger-many, on December 31, 2015, in accordance with Section 22 (1) Sentence 1 No. 1 WpHG.
› 46.00% of the voting rights in Continental AG are attributed to Schaeffler Holding LP, Dallas, Texas, U.S.A., on December 31, 2015, in accordance with Section 22 (1) Sentence 1 No. 1 WpHG.
› 46.00% of the voting rights in Continental AG are attributed to Mrs. Maria-Elisabeth Schaeffler-Thumann on December 31, 2015, in accordance with Section 22 (1) Sentence 1 No. 1 WpHG.
› 46.00% of the voting rights in Continental AG are attributed to Mr. Georg F. W. Schaeffler on December 31, 2015, in accordance with Section 22 (1) Sentence 1 No. 1 WpHG.
As a result of the withdrawal of Schaeffler Familienholding Drei GmbH & Co. KG, Herzogenaurach, Germany, from Schaeffler Be-teiligungsholding GmbH & Co. KG, Herzogenaurach, Germany, on December 31, 2015, the investment held by Schaeffler Beteiligungs-holding GmbH & Co. KG, Herzogenaurach, Germany, in Continental AG accrued to IHO Verwaltungs GmbH (still operating as Schaeffler Verwaltung Zwei GmbH as at December 31, 2015), Herzogenau-rach, Germany. The investment held by Schaeffler Familienholding Drei GmbH & Co. KG, Herzogenaurach, Germany, as well as the in-vestment by its co-owner; by Schaeffler Familienholding Eins GmbH, Herzogenaurach, Germany; and by Schaeffler Familienhold-ing Zwei GmbH, Herzogenaurach, Germany, in Continental AG ac-cordingly ceased to exist. As a result of a subsequent further ac-crual and termination without liquidation of Schaeffler Fami-lienholding Drei GmbH & Co. KG, Herzogenaurach, Germany, this company’s notification obligation in accordance with WpHG ceased to apply on January 1, 2016.
In 2018 and until March 1, 2019, inclusively, the members of the Executive Board held shares representing a total interest of less than 1% of the share capital of the company. Shares representing 46.0% of the share capital of the company were attributable to the members of the Supervisory Board Mrs. Maria-Elisabeth Schaeffler-Thumann and Mr. Georg F. W. Schaeffler. In 2018 and until March 1, 2019, inclusively, the other members of the Supervisory Board held shares representing a total interest of less than 1% of the share capi-tal of the company.

206 Continental AG 2018 Annual Report Consolidated Financial Statements Notes to the Consolidated Financial Statements
40. List of Shareholdings of the Corporation
Further information on equity investments can be found in the list of the corporation’s shareholdings in accordance with Section 313 of the German Commercial Code (Handelsgesetzbuch – HGB), which is published as part of the consolidated financial statements in the German Federal Gazette (Bundesanzeiger). The consolidated financial statements with the list of the corporation’s shareholdings are also made available for inspection by the shareholders in the business premises at the company’s headquarters from the date on which the Annual Shareholders’ Meeting is convened, and from
that point in time are available together with the additional docu-ments and information in accordance with Section 124a of the German Stock Corporation Act (Aktiengesetz – AktG) online at www.continental-ir.com.
Statutory exemption provisions applying to German companies The following German companies and partnerships utilized the ex-emption provisions of Section 264 (3) HGB and Section 264b HGB:
Company Registered office
ADC Automotive Distance Control Systems GmbH Lindau
Alfred Teves Beteiligungsgesellschaft mbH Frankfurt am Main
balance GmbH, Handel und Beratungsservice im Gesundheitswesen Hanover
Benecke-Kaliko AG Hanover
CAS München GmbH Hanover
CAS-One Holdinggesellschaft mbH Hanover
CPT Beteiligungs GmbH Hanover
CPT Group GmbH Hanover
CPT Industriebeteiligungs GmbH & Co. KG Hanover
CPT Verwaltungs GmbH Hanover
CPT Zwei GmbH Hanover
co-pace GmbH Hanover
Conseo GmbH Hamburg
Conti Temic microelectronic GmbH Nuremberg
Conti Versicherungsdienst Versicherungsvermittlungsges. mbH Hanover
Continental Aftermarket GmbH Eschborn
Continental Automotive GmbH Hanover
Continental Automotive Grundstücksges. mbH Frankfurt am Main
Continental Automotive Grundstücksvermietungsges. mbH & Co. KG Frankfurt am Main
Continental Caoutchouc-Export-GmbH Hanover
Continental Emitec GmbH Lohmar
Continental Engineering Services & Products GmbH Ingolstadt
Continental Engineering Services GmbH Frankfurt am Main
Continental Finance GmbH Hanover
Continental Mechanical Components Germany GmbH Roding
Continental Reifen Deutschland GmbH Hanover
Continental Safety Engineering International GmbH Alzenau
Continental Teves AG & Co. oHG Frankfurt am Main
Continental Trading GmbH Schwalbach am Taunus
ContiTech AG Hanover
ContiTech Antriebssysteme GmbH Hanover
ContiTech Elastomer-Beschichtungen GmbH Hanover
ContiTech Kühner Beteiligungsgesellschaft mbH Hanover
ContiTech Kühner GmbH & Cie. KG Oppenweiler
ContiTech Luftfedersysteme GmbH Hanover
ContiTech MGW GmbH Hannoversch Münden
ContiTech Schlauch GmbH Hanover
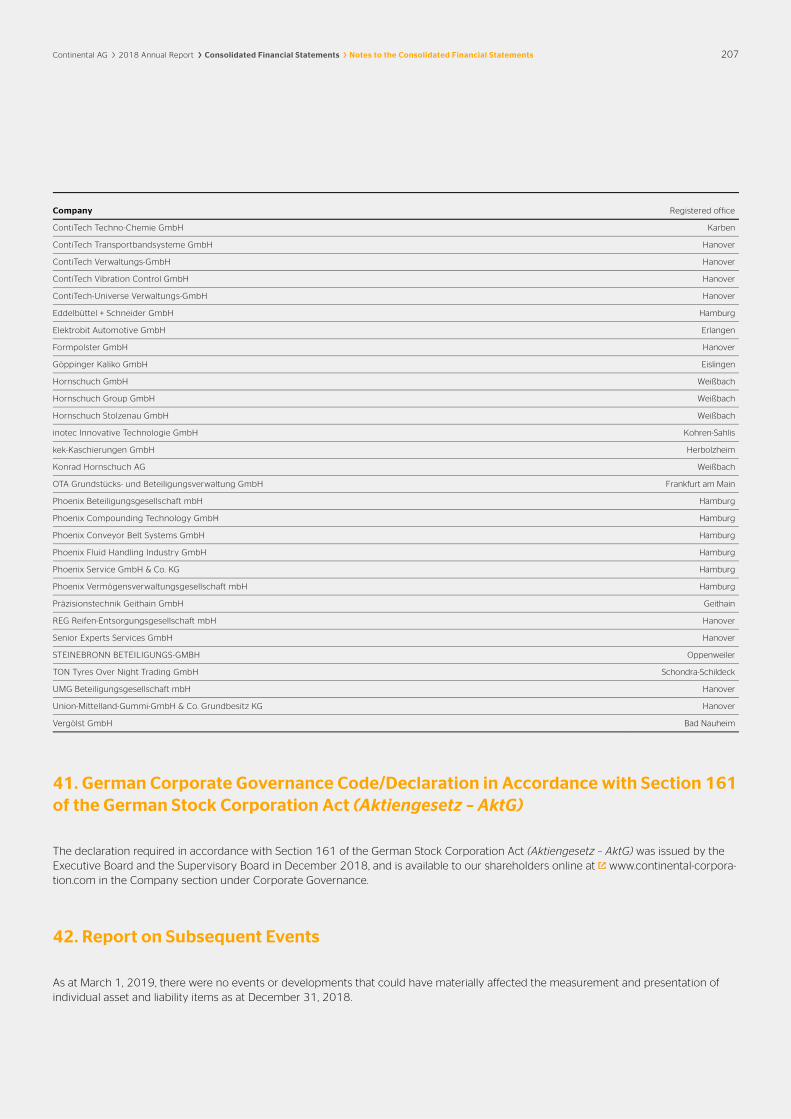
Continental AG 2018 Annual Report Consolidated Financial Statements Notes to the Consolidated Financial Statements 207
Company Registered office
ContiTech Techno-Chemie GmbH Karben
ContiTech Transportbandsysteme GmbH Hanover
ContiTech Verwaltungs-GmbH Hanover
ContiTech Vibration Control GmbH Hanover
ContiTech-Universe Verwaltungs-GmbH Hanover
Eddelbüttel + Schneider GmbH Hamburg
Elektrobit Automotive GmbH Erlangen
Formpolster GmbH Hanover
Göppinger Kaliko GmbH Eislingen
Hornschuch GmbH Weißbach
Hornschuch Group GmbH Weißbach
Hornschuch Stolzenau GmbH Weißbach
inotec Innovative Technologie GmbH Kohren-Sahlis
kek-Kaschierungen GmbH Herbolzheim
Konrad Hornschuch AG Weißbach
OTA Grundstücks- und Beteiligungsverwaltung GmbH Frankfurt am Main
Phoenix Beteiligungsgesellschaft mbH Hamburg
Phoenix Compounding Technology GmbH Hamburg
Phoenix Conveyor Belt Systems GmbH Hamburg
Phoenix Fluid Handling Industry GmbH Hamburg
Phoenix Service GmbH & Co. KG Hamburg
Phoenix Vermögensverwaltungsgesellschaft mbH Hamburg
Präzisionstechnik Geithain GmbH Geithain
REG Reifen-Entsorgungsgesellschaft mbH Hanover
Senior Experts Services GmbH Hanover
STEINEBRONN BETEILIGUNGS-GMBH Oppenweiler
TON Tyres Over Night Trading GmbH Schondra-Schildeck
UMG Beteiligungsgesellschaft mbH Hanover
Union-Mittelland-Gummi-GmbH & Co. Grundbesitz KG Hanover
Vergölst GmbH Bad Nauheim
41. German Corporate Governance Code/Declaration in Accordance with Section 161of the German Stock Corporation Act (Aktiengesetz – AktG)
The declaration required in accordance with Section 161 of the German Stock Corporation Act (Aktiengesetz – AktG) was issued by the Executive Board and the Supervisory Board in December 2018, and is available to our shareholders online at www.continental-corpora-tion.com in the Company section under Corporate Governance.
42. Report on Subsequent Events
As at March 1, 2019, there were no events or developments that could have materially affected the measurement and presentation of individual asset and liability items as at December 31, 2018.
19
Further Information
Responsibility Statement by the Company’s Legal Representatives 209
Members of the Executive Board and Their Directorships 210
Members of the Supervisory Board and Their Directorships 211
Ten-Year Review – Corporation 213
Financial Calendar 214
Publication Details 215

Continental AG 2018 Annual Report Further Information Responsibility Statement by the Company’s Legal Representatives 209
To the best of our knowledge, and in accordance with the applica-ble reporting principles, the consolidated financial statements give a true and fair view of the earnings, financial and net assets position of the corporation, and the management report of the corporation includes a fair review of the development and performance of the business and the position of the corporation, together with a
description of the principal opportunities and risks associated with the expected development of the corporation.
Hanover, March 1, 2019
Continental Aktiengesellschaft The Executive Board
Responsibility Statement by the Company’s Legal Representatives

210 Continental AG 2018 Annual Report Further Information Members of the Executive Board and Their Directorships
List of the positions held by the Executive Board members on statutory supervisory boards and on comparable controlling bodies of companies in Germany and abroad in accordance with Section 285 No. 10 of the German Commercial Code (Handelsgesetzbuch – HGB):
Dr. Elmar Degenhart Chairman Corporate Communications Corporate Quality and Environment Continental Business System Automotive Central Functions › ContiTech AG, Hanover* (Chairman)
José A. Avila Powertrain Division (until September 30, 2018)
Hans-Jürgen Duensing ContiTech Division › Benecke-Kaliko AG, Hanover* (Chairman)
› ContiTech Antriebssysteme GmbH, Hanover* (Chairman)
› ContiTech Elastomer-Beschichtungen GmbH, Hanover* (Vice Chairman)
› ContiTech Luftfedersysteme GmbH, Hanover* (Vice Chairman)
› ContiTech MGW GmbH, Hann. Münden* (Vice Chairman)
› ContiTech Schlauch GmbH, Hanover* (Vice Chairman)
› ContiTech Techno-Chemie GmbH, Karben* (Vice Chairman)
› ContiTech Transportbandsysteme GmbH, Hanover* (Vice Chairman)
› ContiTech Vibration Control GmbH, Hanover* (Vice Chairman)
› Phoenix Compounding Technology GmbH, Hamburg* (Vice Chairman)
› ContiTech North America, Inc., Wilmington, Delaware, U.S.A.*
› EPD Holdings, Inc., Wilmington, Delaware, U.S.A.*
› ContiTech USA, Inc., Fairlawn, Ohio, U.S.A.*
Frank Jourdan Chassis & Safety Division › Continental Automotive Corporation, Yokohama, Japan*
› Continental Automotive Mexicana, S. de R.L. de C.V., Morelos, Mexico*
› Conti Automotive Servicios, S.A. de C.V., Silao Guanajuato, Mexico*
› Continental Automotive Bajio, S.A. de C.V., Silao Guanajuato, Mexico*
› Temic Servicios, S.A. de C.V., Villa de Alaya, Mexico*
› Continental Automotive Maquila Mexico S.A. de C.V., Silao, Mexico*
› ContiTech Fluid Mexicana Servicios, S.A. de C.V., Tlalnepantla, Mexico*
› ContiTech Fluid Monterrey Servicios, S.A. de C.V., Tlajomulco de Zuñiga, Mexico*
Helmut Matschi Interior Division › Continental Automotive GmbH, Hanover* (Chairman)
› Argus Cyber Security Ltd, Tel Aviv, Israel*
Dr. Ariane Reinhart Human Relations and Sustainability Director of Labor Relations › Vonovia SE, Düsseldorf
Wolfgang Schäfer Finance, Controlling, Compliance, Law and IT › Continental Reifen Deutschland GmbH, Hanover*
› Continental Automotive, Inc., Wilmington, Delaware, U.S.A.*
› Continental Automotive Systems, Inc., Wilmington, Delaware, U.S.A.*
› Continental Rubber of America, Corp., Wilmington, Delaware, U.S.A.*
Nikolai Setzer Tire Division Corporate Purchasing › Continental Reifen Deutschland GmbH, Hanover* (Chairman)
› Continental Tire Holding US LLC, Wilmington, Delaware, U.S.A.*
› Continental Tire the Americas, LLC, Columbus, Ohio, U.S.A.*
* Companies pursuant to Section 100 (2) of the German Stock Corporation Act (Aktiengesetz – AktG).
Members of the Executive Board and Their Directorships
Continental AG 2018 Annual Report Further Information Members of the Supervisory Board and Their Directorships 211
Memberships of other statutory supervisory boards and of comparable controlling bodies of companies in Germany and abroad in ac-cordance with Section 285 No. 10 of the German Commercial Code (Handelsgesetzbuch – HGB):
Prof. Dr.-Ing. Wolfgang Reitzle, Chairman Chairman of the Supervisory Board of Linde AG › Ivoclar Vivadent AG, Schaan, Liechtenstein
› Axel Springer SE, Berlin
› Medical Park AG, Amerang (Chairman)
› Willy Bogner GmbH & Co. KGaA, Munich (Chairman, since January 16, 2018)
› Linde plc, Dublin, Ireland (Chairman, since October 22, 2018)
Hartmut Meine*, Vice Chairman (until February 28, 2018) District manager of IG Metall (Metalworkers’ Union) for Lower Saxony and Saxony-Anhalt (until December 31, 2016)
Christiane Benner*, Vice Chairperson (since March 1, 2018) Second Chairperson, IG Metall › BMW AG, Munich
Dr. Gunter Dunkel Chairman European Private Debt, Muzinich & Co, London, United Kingdom
Francesco Grioli* (since November 1, 2018) Member of the Central Board of Executive Directors, IG Bergbau, Chemie, Energie (Mining, Chemical and Energy Industries Union) › Villeroy & Boch AG, Mettlach (until March 23, 2018)
› Villeroy & Boch Fliesen GmbH, Merzig (until May 31, 2018)
› BASF SE, Ludwigshafen (until May 4, 2018)
› Gerresheimer AG, Düsseldorf (Vice Chairman)
Prof. Dr.-Ing. Peter Gutzmer Deputy Chief Executive Officer and Member of the Executive Board, Chief Technology Officer of Schaeffler AG, Herzogenaurach
Peter Hausmann* (until October 31, 2018) Member of the Central Board of Executive Directors, IG Bergbau, Chemie, Energie (Mining, Chemical and Energy Industries Union) › Henkel AG & Co. KGaA, Düsseldorf (until March 31, 2018)
› 50Hertz Transmission GmbH, Berlin (Vice Chairman)
› Vivawest GmbH, Gelsenkirchen (Vice Chairman, until April 30, 2018)
› Covestro AG, Leverkusen
Michael Iglhaut* Chairman of the Works Council for the Frankfurt Location
Prof. Dr. Klaus Mangold Chairman of the Supervisory Board of Knorr-Bremse AG (since September 1, 2018) › Rothschild GmbH (Chairman, until December 31, 2018)
› TUI AG, Hanover (Chairman)
› Alstom S.A., Paris, France
› Baiterek JSC, Astana, Kazakhstan
Sabine Neuß Chief Operation Officer of Kelvion Holding GmbH, Bochum › Juli Motorenwerk, s.r.o., Moravany, Czechia
(until August 27, 2018)
› Linde Xiamen Forklift Truck Corp., Xiamen, China (until November 30, 2018)
› Atlas Copco AB, Nacka, Sweden
Prof. Dr. Rolf Nonnenmacher Certified Accountant, self-employed, Berg › ProSiebenSat.1 Media SE, Unterföhring
› Covestro AG, Leverkusen
› Covestro Deutschland AG, Leverkusen
Dirk Nordmann* Chairman of the Works Council for the Vahrenwald Plant, ContiTech Antriebssysteme GmbH, Hanover › ContiTech Luftfedersysteme GmbH, Hanover
Klaus Rosenfeld Chief Executive Officer of Schaeffler AG, Herzogenaurach › Schaeffler India Limited, Vadodara, India** (until April 24, 2018)
› Siemens Gamesa Renewable Energy S.A., Zamudio, Spain
Georg F. W. Schaeffler Co-owner of INA-Holding Schaeffler GmbH & Co. KG, Herzogenaurach Managing Director, IHO Verwaltungs GmbH, Herzogenaurach › Schaeffler AG, Herzogenaurach** (Chairman)
Maria-Elisabeth Schaeffler-Thumann Co-owner of INA-Holding Schaeffler GmbH & Co. KG, Herzogenaurach Managing Director, IHO Verwaltungs GmbH, Herzogenaurach › Schaeffler AG, Herzogenaurach** (Vice Chairperson)
Jörg Schönfelder* Chairman of the Works Council for the Korbach Plant and Chairman of the European Works Council › Continental Reifen Deutschland GmbH, Hanover
Members of the Supervisory Board and Their Directorships

212 Continental AG 2018 Annual Report Further Information Members of the Supervisory Board and Their Directorships
Stefan Scholz* Head of Finance & Treasury › Phoenix Pensionskasse von 1925, Hamburg (until July 8, 2018)
› Pensionskasse für Angestellte der Continental Aktiengesellschaft VVaG, Hanover
Gudrun Valten* Member of the Works Council of Continental Automotive GmbH, Regensburg
Kirsten Vörkel* Chairperson of the Works Council of CPT Group GmbH, Dortmund Member of the Central Works Council of CPT Group GmbH, Hanover Member of the Corporate Works Council of Continental AG, Hanover
Elke Volkmann* Second Authorized Representative of IG Metall Nordhessen, Administrative Office for North Hesse, Kassel › Krauss-Maffei Wegmann Verwaltungs GmbH, Munich
Erwin Wörle* Engineer in the Development Department, Quality Management of Conti Temic microelectronic GmbH, Ingolstadt › Conti Temic microelectronic GmbH, Nuremberg (Vice Chairman)
Prof. KR Ing. Siegfried Wolf Entrepreneur › Banque Eric Sturdza SA, Geneva, Switzerland
› SBERBANK Europe AG, Vienna, Austria (Chairman)
› UC RUSAL Plc, Moscow, Russia (until June 28, 2018)
› Schaeffler AG, Herzogenaurach
› MIBA AG Mitterbauer Beteiligungs AG, Laakirchen, Austria
* Employee representative. ** Companies pursuant to Section 100 (2) of the German Stock Corporation Act
(Aktiengesetz – AktG).
Members of the Supervisory Board Committees: 1. Chairman’s Committee
› Prof. Dr.-Ing. Wolfgang Reitzle (Chairman)
› Hartmut Meine (until February 28, 2018)
› Christiane Benner (since March 13, 2018)
› Georg F. W. Schaeffler
› Jörg Schönfelder
2. Audit Committee
› Prof. Dr. Rolf Nonnenmacher (Chairman)
› Peter Hausmann (until October 31, 2018)
› Francesco Grioli (since November 1, 2018)
› Michael Iglhaut
› Dirk Nordmann
› Klaus Rosenfeld
› Georg F. W. Schaeffler
3. Nomination Committee
› Prof. Dr.-Ing. Wolfgang Reitzle (Chairman)
› Prof. Dr. Rolf Nonnenmacher
› Georg F. W. Schaeffler
› Maria-Elisabeth Schaeffler-Thumann
4. Mediation Committee required under Section 27 (3) of the German Co-determination Act (Mitbestimmungsgesetz)
› Prof. Dr.-Ing. Wolfgang Reitzle (Chairman)
› Hartmut Meine (until February 28, 2018)
› Christiane Benner (since March 13, 2018)
› Georg F. W. Schaeffler
› Jörg Schönfelder

Continental AG 2018 Annual Report Further Information Ten-Year Review – Corporation 213
20181 2017 2016 2015 2014 2013 20122 2011 2010 2009
Statement of financial position
Non-current assets € millions 23,658.7 22,038.4 21,321.0 19,666.6 16,923.3 15,569.5 15,685.7 15,075.5 14,887.9 14,724.6
Current assets € millions 16,786.7 15,402.1 14,853.9 13,169.1 13,317.8 11,251.3 11,764.4 10,962.9 9,502.6 8,324.6
Total assets € millions 40,445.4 37,440.5 36,174.9 32,835.7 30,241.1 26,820.8 27,450.1 26,038.4 24,390.5 23,049.2
Shareholders’ equity (excl. non-controlling interests) € millions 17,850.4 15,828.4 14,270.0 12,786.3 10,672.1 9,011.2 7,779.0 7,146.1 5,859.6 3,772.6
Non-controlling interests € millions 482.9 461.9 464.8 427.6 352.5 311.0 377.4 397.2 343.3 289.1
Total equity (incl. non-controlling interests) € millions 18,333.3 16,290.3 14,734.8 13,213.9 11,024.6 9,322.2 8,156.4 7,543.3 6,202.9 4,061.7
Equity ratio3 % 45.3 43.5 40.7 40.2 36.5 34.8 29.7 29.0 25.4 17.6
Capital expenditure4 € millions 3,124.4 2,854.4 2,593.0 2,178.8 2,045.4 1,981.1 2,019.4 1,711.3 1,296.4 860.1
Net indebtedness € millions 1,661.3 2,047.6 2,797.8 3,541.9 2,823.5 4,289.3 5,319.9 6,772.1 7,317.0 8,895.5
Gearing ratio % 9.1 12.6 19.0 26.8 25.6 46.0 65.2 89.8 118.0 219.0
Income statement
Sales € millions 44,404.4 44,009.5 40,549.5 39,232.0 34,505.7 33,331.0 32,736.2 30,504.9 26,046.9 20,095.7
Share of foreign sales % 80.1 79.7 79.3 78.6 76.6 76.2 75.4 73.7 72.8 71.0
Cost of sales5 % 75.0 74.2 73.4 74.1 74.9 76.6 78.3 79.0 77.8 80.0
Research and development expenses (net)5 % 7.2 7.1 6.9 6.2 6.2 5.6 5.3 5.3 5.6 6.7
Selling and logistics expenses5 % 5.6 5.5 5.6 5.6 5.3 5.0 4.8 4.7 5.0 5.6
Administrative expenses5 % 2.6 2.6 2.5 2.4 2.2 2.1 2.0 2.1 2.5 3.0
EBITDA € millions 6,235.7 6,678.9 6,057.4 6,001.4 5,133.8 5,095.0 4,967.4 4,228.0 3,587.6 1,591.2
EBITDA5 % 14.0 15.2 14.9 15.3 14.9 15.3 15.2 13.9 13.8 7.9
Personnel expenses € millions 11,125.3 10,687.3 9,695.7 9,164.6 7,757.2 7,124.5 6,813.7 6,354.3 5,891.7 5,199.8
Depreciation and amortization6 € millions 2,208.0 2,117.4 1,961.6 1,885.8 1,789.0 1,831.3 1,781.2 1,631.1 1,652.4 2,631.6
Net income attributable to the shareholders of the parent € millions 2,897.3 2,984.6 2,802.5 2,727.4 2,375.3 1,923.1 1,905.2 1,242.2 576.0 –1,649.2
Dividend and earnings per share
Dividend for the fiscal year € millions 950.07 900.0 850.0 750.0 650.0 500.0 450.0 300.0 — —
Number of shares as at December 31 millions 200.0 200.0 200.0 200.0 200.0 200.0 200.0 200.0 200.0 169.0
Net income (per share) attributable to the shareholders of the parent € 14.49 14.92 14.01 13.64 11.88 9.62 9.53 6.21 2.88 –9.76
Employees
Annual average thousands 242.8 230.7 216.0 204.7 186.0 175.4 169.0 159.7 142.7 133.4
1 Since 2018, IFRS 9, Financial Instruments, and IFRS 15, Revenue from Contracts with Customers, have been applied. 2 IAS 19 (revised 2011), Employee Benefits, has been applied since 2012. 3 Including non-controlling interests. 4 Capital expenditure on property, plant and equipment, and software. 5 As a percentage of sales. 6 Excluding impairment on financial investments. 7 Subject to the approval of the Annual Shareholders’ Meeting on April 26, 2019.
Ten-Year Review – Corporation

214 Continental AG 2018 Annual Report Further Information Financial Calendar
2019
Preliminary figures for fiscal 2018 January 14
Annual Financial Press Conference March 7
Analyst and Investor Conference Call March 7
Annual Shareholders’ Meeting (including key figures for the first quarter of 2019) April 26
Financial Report as at March 31, 2019 May 9
Half-Year Financial Report as at June 30, 2019 August 6
Financial Report as at September 30, 2019 November 12
2020
Preliminary figures for fiscal 2019 January
Annual Financial Press Conference March
Analyst and Investor Conference Call March
Annual Shareholders’ Meeting (including key figures for the first quarter of 2020) April 30
Financial Report as at March 31, 2020 May
Half-Year Financial Report as at June 30, 2020 August
Financial Report as at September 30, 2020 November
Financial Calendar

Publication Details
This Annual Report is also published in German. The financial statements of Continental Aktiengesellschaft are also available in English and German.
If you wish to receive copies of any of these reports, please contact:
Continental AG, Corporate CommunicationsP.O. Box 1 69, 30001 Hanover, GermanyPhone: +49 511 938 - 1146Fax: +49 511 938 - 1055E-mail: [email protected]
The Annual Report and the interim reports are available on the internet at:
www.continental-ir.com
Published by: Continental Aktiengesellschaft, Hanover, Germany
215Continental AG 2018 Annual Report > Further Information > Publication Details

1Continental AktiengesellschaftP.O. Box 1 69, 30001 Hanover, Germany Vahrenwalder Strasse 9, 30165 Hanover, Germany Phone: +49 511 938 - 01, Fax: +49 511 938 - [email protected]