2018 Annual Audited Financial Statements - nutrien.com · Report of Independent Registered Public...
68
2018 Annual Audited Financial Statements
Transcript of 2018 Annual Audited Financial Statements - nutrien.com · Report of Independent Registered Public...

2018Annual Audited Financial Statements

Financial Statements & Notes

Consolidated Statements of94 Earnings95 Comprehensive Income96 Cash Flows97 Changes in Shareholders’ Equity98 Consolidated Balance Sheets
Business and Environment99 Note 1 Description of Business
100 Note 2 Basis of PresentationP, E 100 Note 3 Business Combinations
Earnings, Expenses and Cash FlowsP, E 103 Note 4 Segment InformationP 108 Note 5 Nature of Expenses
109 Note 6 Provincial Mining and Other Taxes109 Note 7 Other Expenses109 Note 8 Finance Costs
P, E 110 Note 9 Income TaxesP, E 113 Note 10 Discontinued Operations
114 Note 11 Net Earnings Per ShareP 115 Note 12 Consolidated Statements of Cash Flows
Operating Assets and LiabilitiesP, E 116 Note 13 Financial Instruments and Related Risk ManagementP, E 121 Note 14 ReceivablesP, E 122 Note 15 InventoriesP, E 123 Note 16 Property, Plant and EquipmentP, E 125 Note 17 Goodwill and Other Intangible Assets
127 Note 18 Other Assets127 Note 19 Payables and Accrued Charges
P, E 128 Note 20 Asset Retirement Obligations and AccruedEnvironmental Costs
Investments, Financing and Capital StructureP, E 130 Note 21 Investments
132 Note 22 Short-Term DebtP 132 Note 23 Long-Term Debt
134 Note 24 Share Capital135 Note 25 Capital Management
P, E 137 Note 26 CommitmentsP 138 Note 27 Guarantees
PersonnelP, E 139 Note 28 Pension and Other Post-Retirement BenefitsP, E 143 Note 29 Share-Based Compensation
OtherP 146 Note 30 Related Party TransactionsP, E 147 Note 31 Contingencies and Other MattersP, E 149 Note 32 Accounting Policies, Estimates and Judgments
154 Note 33 Comparative Figures
P Includes Accounting PoliciesE Includes Accounting Estimates and Judgments

Management’s Responsibility
Management’s Responsibility for Financial Reporting
Management’s Report on FinancialStatementsThe accompanying consolidated financial statementsand related financial information are the responsibility ofNutrien’s management. They have been prepared inaccordance with International Financial Reporting Standards asissued by the International Accounting Standards Board (“IFRS”)and include amounts based on estimates and judgments.Financial information included elsewhere in this report isconsistent with the consolidated financial statements.
The consolidated financial statements are approved by theBoard of Directors on the recommendation of the auditcommittee. The audit committee of the Board of Directorsis composed entirely of independent directors. The auditcommittee discusses and analyzes Nutrien’s interim condensedconsolidated financial statements and Management’sDiscussion & Analysis (“MD&A”) with management before suchinformation is approved by the committee and submitted tosecurities commissions or other regulatory authorities. Theannual consolidated financial statements and MD&A are alsoanalyzed by the audit committee and management and areapproved by the Board of Directors.
In addition, the audit committee has the duty to review criticalaccounting policies and significant estimates and judgmentsunderlying the consolidated financial statements as presentedby management, and to approve the fees of our independentregistered public accounting firm.
Our independent registered public accounting firm, KPMG LLP,performs an audit of the consolidated financial statements, theresults of which are reflected in their report for 2018 includedon Page 92. KPMG LLP have full and independent access to theaudit committee to discuss their audit and related matters.
Management’s Annual Report onInternal Control over Financial ReportingManagement is responsible for establishing and maintainingadequate internal control over financial reporting, as definedin Rules 13a-15(f) and 15d-15(f) of the Exchange Act, asamended, and NI 52-109. Internal control over financialreporting is designed to provide reasonable assuranceregarding the reliability of financial reporting and preparationof financial statements for external purposes in accordancewith IFRS.
On January 1, 2018, Potash Corporation of Saskatchewan Inc.(“PotashCorp”) and Agrium Inc. (“Agrium”) combined theirbusinesses in a transaction by way of a plan of arrangement(the “Merger”) by becoming wholly owned subsidiaries of anew parent company named Nutrien Ltd. (collectively with itssubsidiaries, known as “Nutrien” or the “Company” except tothe extent the context otherwise requires). For the year endedDecember 31, 2018, the Company has designed internalcontrol over financial reporting for Nutrien, while maintainingthe internal control over financial reporting for its subsidiaries,PotashCorp and Agrium.
Under our supervision and with the participation ofmanagement, the Company conducted an evaluation of thedesign and effectiveness of our internal control over financialreporting as of the end of the fiscal year covered by this report,based on the framework issued by the Committee ofSponsoring Organizations of the Treadway Commission(“COSO”) in Internal Control – Integrated Framework (2013).Based on this evaluation, management concluded that, as ofDecember 31, 2018, Nutrien did maintain effective internalcontrol over financial reporting. The effectiveness of theCompany’s internal control over financial reporting as atDecember 31, 2018 has been audited by KPMG LLP, asreflected in their report for 2018 included on page 91.
Chuck MagroPresident and Chief Executive OfficerFebruary 20, 2019
Pedro FarahChief Financial OfficerFebruary 20, 2019
NUTRIEN 2018 90 ANNUAL REPORT

Report of IndependentRegistered Public Accounting Firm – 2018
To the Shareholders and the Board of Directors of Nutrien Ltd.
Opinion on Internal Control over FinancialReportingWe have audited Nutrien Ltd. and subsidiaries’ (the “Company”)internal control over financial reporting as of December 31,2018, based on criteria established in Internal Control—Integrated Framework (2013) issued by the Committee ofSponsoring Organizations of the Treadway Commission. In ouropinion, the Company maintained, in all material respects,effective internal control over financial reporting as ofDecember 31, 2018, based on criteria established in InternalControl—Integrated Framework (2013) issued by theCommittee of Sponsoring Organizations of the TreadwayCommission.
We also have audited, in accordance with the standards ofthe Public Company Accounting Oversight Board (UnitedStates) (“PCAOB”), the consolidated balance sheet of theCompany as of December 31, 2018, the related consolidatedstatements of earnings, comprehensive income, shareholders’equity, and cash flows for the year ended December 31, 2018,and the related notes (collectively, the consolidatedfinancial statements), and our report dated February 20, 2019expressed an unqualified opinion on those consolidatedfinancial statements.
Basis for OpinionThe Company’s management is responsible for maintainingeffective internal control over financial reporting and forits assessment of the effectiveness of internal control overfinancial reporting, included in the accompanyingManagement’s Responsibility Report. Our responsibility is toexpress an opinion on the Company’s internal control overfinancial reporting based on our audit. We are a publicaccounting firm registered with the PCAOB and are requiredto be independent with respect to the Company in accordancewith the U.S. federal securities laws and the applicable rulesand regulations of the Securities and Exchange Commissionand the PCAOB.
We conducted our audit in accordance with the standards ofthe PCAOB. Those standards require that we plan and performthe audit to obtain reasonable assurance about whethereffective internal control over financial reporting wasmaintained in all material respects. Our audit of internal
control over financial reporting included obtaining anunderstanding of internal control over financial reporting,assessing the risk that a material weakness exists, and testingand evaluating the design and operating effectiveness ofinternal control based on the assessed risk. Our audit alsoincluded performing such other procedures as we considerednecessary in the circumstances. We believe that our auditprovides a reasonable basis for our opinion.
Definition and Limitations of InternalControl over Financial ReportingA company’s internal control over financial reporting is aprocess designed to provide reasonable assurance regardingthe reliability of financial reporting and the preparation offinancial statements for external purposes in accordance withgenerally accepted accounting principles. A company’s internalcontrol over financial reporting includes those policies andprocedures that 1) pertain to the maintenance of records that,in reasonable detail, accurately and fairly reflect thetransactions and dispositions of the assets of the Company;2) provide reasonable assurance that transactions are recordedas necessary to permit preparation of financial statements inaccordance with generally accepted accounting principles, andthat receipts and expenditures of the Company are being madeonly in accordance with authorizations of management anddirectors of the Company; and 3) provide reasonable assuranceregarding prevention or timely detection of unauthorizedacquisition, use, or disposition of the Company’s assets thatcould have a material effect on the financial statements.
Because of its inherent limitations, internal control overfinancial reporting may not prevent or detect misstatements.Also, projections of any evaluation of effectiveness tofuture periods are subject to the risk that controls maybecome inadequate because of changes in conditions, orthat the degree of compliance with the policies or proceduresmay deteriorate.
Chartered Professional Accountants
Saskatoon and Calgary, CanadaFebruary 20, 2019
NUTRIEN 2018 91 ANNUAL REPORT
FIN
AN
CIA
L ST
ATE
MEN
TS A
ND
NO
TES

Report of IndependentRegistered Public Accounting Firm – 2018
To the Shareholders and the Board of Directors of Nutrien Ltd.
Opinion on the Consolidated FinancialStatementsWe have audited the accompanying consolidated balancesheet of Nutrien Ltd. and subsidiaries (the “Company”) as ofDecember 31, 2018, the related consolidated statements ofearnings, comprehensive income, changes in shareholders’equity, and cash flows for the year then ended, and the relatednotes (collectively, the “consolidated financial statements”).In our opinion, the consolidated financial statements presentfairly, in all material respects, the financial position of theCompany as of December 31, 2018, and the results of itsoperations and its cash flows for the year then ended, inconformity with International Financial Reporting Standardsas issued by the International Accounting Standards Board.
The accompanying consolidated financial statements ofPotash Corporation of Saskatchewan Inc. and subsidiaries(“PotashCorp”) as of December 31, 2017 and for the yearthen ended were audited by other auditors, whose reportthereon dated February 20, 2018 expressed an unqualifiedopinion on those consolidated financial statements, beforethe retrospective reclassification of certain comparativeinformation as well as additional disclosures within the segmentand capital management financial statement notes, describedin Note 33 to the consolidated financial statements.
We have audited the adjustments described in Note 33 thatwere applied to restate the December 31, 2017 consolidatedfinancial statements including the retrospective reclassificationof certain comparative information as well as additionaldisclosures within the segment and capital managementfinancial statement notes, to conform to the current yearpresentation. In our opinion, such adjustments are appropriateand have been properly applied. We were not engaged to audit,review, or apply any procedures to the 2017 consolidatedfinancial statements of PotashCorp other than with respect tothe adjustments and, accordingly, we do not express an opinionor any other form of assurance on the 2017 consolidatedfinancial statements taken as a whole.
We also have audited, in accordance with the standards of thePublic Company Accounting Oversight Board (United States)(“PCAOB”), the Company’s internal control over financial
reporting as of December 31, 2018, based on criteriaestablished in Internal Control—Integrated Framework (2013)issued by the Committee of Sponsoring Organizations of theTreadway Commission, and our report dated February 20, 2019expressed an unqualified opinion on the effectiveness of theCompany’s internal control over financial reporting.
Basis for OpinionThese consolidated financial statements are the responsibilityof the Company’s management. Our responsibility is to expressan opinion on these consolidated financial statements based onour audit. We are a public accounting firm registered with thePCAOB and are required to be independent with respect to theCompany in accordance with the U.S. federal securities lawsand the applicable rules and regulations of the Securities andExchange Commission and the PCAOB.
We conducted our audit in accordance with the standardsof the PCAOB. Those standards require that we plan andperform the audit to obtain reasonable assurance aboutwhether the consolidated financial statements are freeof material misstatement, whether due to error or fraud.Our audit included performing procedures to assess the risksof material misstatement of the consolidated financialstatements, whether due to error or fraud, and performingprocedures that respond to those risks. Such proceduresincluded examining, on a test basis, evidence regardingthe amounts and disclosures in the consolidated financialstatements. Our audit also included evaluating the accountingprinciples used and significant estimates made bymanagement, as well as evaluating the overall presentationof the consolidated financial statements. We believe that ouraudit provides a reasonable basis for our opinion.
Chartered Professional Accountants
We have served as the Company’s auditor since ourappointment in 2018.
Saskatoon and Calgary, CanadaFebruary 20, 2019
NUTRIEN 2018 92 ANNUAL REPORT

Report of IndependentRegistered Public Accounting Firm – 2017
To the Shareholders and the Board of Directors of Potash Corporation ofSaskatchewan Inc.
Opinion on the Financial StatementsWe have audited, before the effects of the adjustments toretrospectively reclassify certain comparative information andto provide additional disclosures to conform to the current yearpresentation as discussed in Note 33 to the consolidatedfinancial statements, the consolidated statement of financialposition of Potash Corporation of Saskatchewan Inc. andsubsidiaries (“PotashCorp”) as of December 31, 2017, therelated consolidated statements of income, comprehensiveincome, changes in shareholders’ equity, and cash flows, forthe year ended December 31, 2017, and the related notes(collectively referred to as the “financial statements”) (the 2017financial statements before the effects of the retrospectivereclassification and additional disclosures discussed in Note 33to the financial statements are not presented herein). In ouropinion, the 2017 financial statements before the effects of theadjustments to retrospectively reclassify certain comparativeinformation and to provide additional disclosures to conformto the current year presentation as discussed in Note 33 to thefinancial statements, present fairly, in all material respects,the financial position of PotashCorp as of December 31, 2017,and the results of its operations and its cash flows for the yearended December 31, 2017, in conformity with InternationalFinancial Reporting Standards as issued by the InternationalAccounting Standards Board.
We were not engaged to audit, review, or apply any proceduresto the adjustments to retrospectively reclassify certaincomparative information and to provide additional disclosuresto conform to the current year presentation as discussed inNote 33 to the financial statements, and accordingly, we donot express an opinion or any other form of assurance aboutwhether such retrospective adjustments and additionaldisclosures discussed in Note 33 are appropriate and havebeen properly applied. Those retrospective adjustments andadditional disclosures were audited by other auditors.
Basis for OpinionThese financial statements are the responsibility ofPotashCorp’s management. Our responsibility is to expressan opinion on PotashCorp’s financial statements based onour audit. We are a public accounting firm registered with thePublic Company Accounting Oversight Board (“PCAOB”) andare required to be independent with respect to PotashCorpin accordance with the U.S. federal securities laws and theapplicable rules and regulations of the Securities and ExchangeCommission and the PCAOB.
We conducted our audit in accordance with the standardsof the PCAOB. Those standards require that we plan andperform the audit to obtain reasonable assurance aboutwhether the financial statements are free of materialmisstatement, whether due to error or fraud. Our audit includedperforming procedures to assess the risks of materialmisstatement of the financial statements, whether due to erroror fraud, and performing procedures that respond to thoserisks. Such procedures included examining, on a test basis,evidence regarding the amounts and disclosures in the financialstatements. Our audit also included evaluating the accountingprinciples used and significant estimates made bymanagement, as well as evaluating the overall presentationof the financial statements. We believe that our audit providesa reasonable basis for our opinion.
Chartered Professional Accountants
Saskatoon, CanadaFebruary 20, 2018
We began serving as PotashCorp’s auditor in 1977. In 2018,we became the predecessor auditor.
NUTRIEN 2018 93 ANNUAL REPORT
FIN
AN
CIA
L ST
ATE
MEN
TS A
ND
NO
TES
IN MILLIONS OF US DOLLARS EXCEPT AS OTHERWISE NOTED
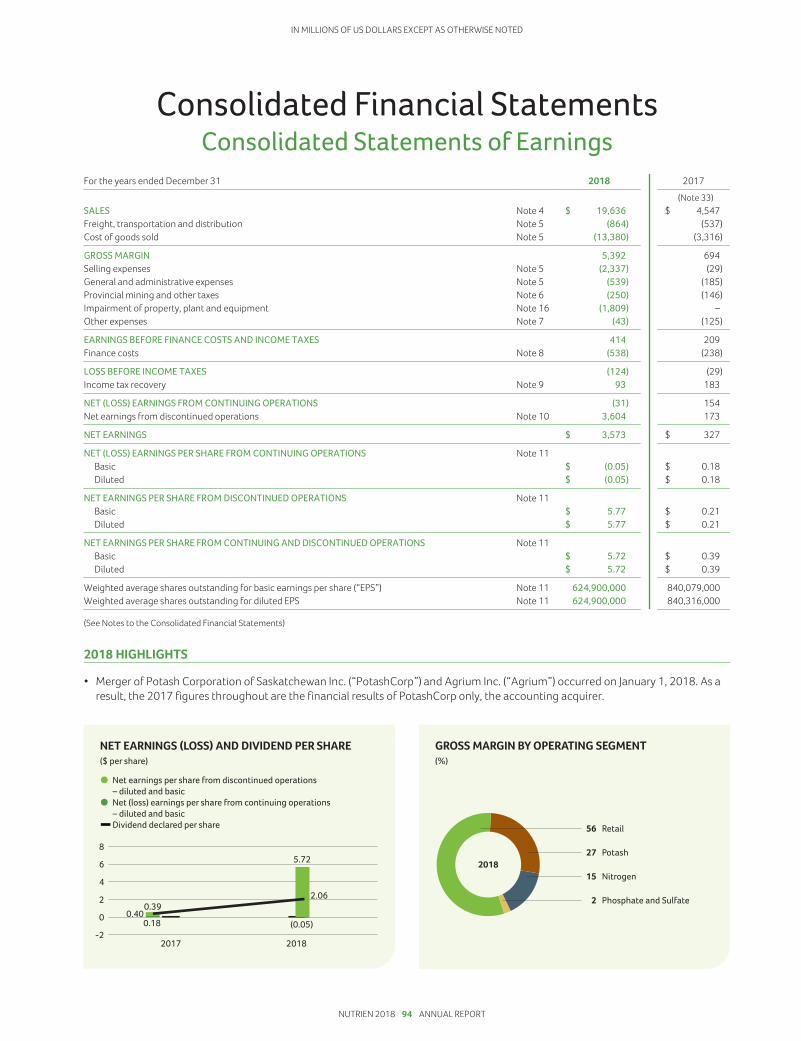
Consolidated Financial StatementsConsolidated Statements of Earnings
For the years ended December 31 2018 2017
(Note 33)SALES Note 4 $ 19,636 $ 4,547Freight, transportation and distribution Note 5 (864) (537)Cost of goods sold Note 5 (13,380) (3,316)
GROSS MARGIN 5,392 694Selling expenses Note 5 (2,337) (29)General and administrative expenses Note 5 (539) (185)Provincial mining and other taxes Note 6 (250) (146)Impairment of property, plant and equipment Note 16 (1,809) –Other expenses Note 7 (43) (125)
EARNINGS BEFORE FINANCE COSTS AND INCOME TAXES 414 209Finance costs Note 8 (538) (238)
LOSS BEFORE INCOME TAXES (124) (29)Income tax recovery Note 9 93 183
NET (LOSS) EARNINGS FROM CONTINUING OPERATIONS (31) 154Net earnings from discontinued operations Note 10 3,604 173
NET EARNINGS $ 3,573 $ 327
NET (LOSS) EARNINGS PER SHARE FROM CONTINUING OPERATIONS Note 11Basic $ (0.05) $ 0.18Diluted $ (0.05) $ 0.18
NET EARNINGS PER SHARE FROM DISCONTINUED OPERATIONS Note 11Basic $ 5.77 $ 0.21Diluted $ 5.77 $ 0.21
NET EARNINGS PER SHARE FROM CONTINUING AND DISCONTINUED OPERATIONS Note 11Basic $ 5.72 $ 0.39Diluted $ 5.72 $ 0.39
Weighted average shares outstanding for basic earnings per share (“EPS”) Note 11 624,900,000 840,079,000Weighted average shares outstanding for diluted EPS Note 11 624,900,000 840,316,000
(See Notes to the Consolidated Financial Statements)
2018 HIGHLIGHTS
• Merger of Potash Corporation of Saskatchewan Inc. (“PotashCorp”) and Agrium Inc. (“Agrium”) occurred on January 1, 2018. As aresult, the 2017 figures throughout are the financial results of PotashCorp only, the accounting acquirer.
-2
0
2
4
6
8
20182017
NUTRIEN 2018 94 ANNUAL REPORT

IN MILLIONS OF US DOLLARS EXCEPT AS OTHERWISE NOTED
Consolidated Statements of Comprehensive IncomeFor the years ended December 31 (net of related income taxes) 2018 2017
(Note 33)NET EARNINGS $ 3,573 $ 327Other comprehensive (loss) income
Items that will not be reclassified to net earnings:Net actuarial gain on defined benefit plans 54 46
Net fair value (loss) gain on investments 1 (99) 30Items that have been or may be subsequently reclassified to net earnings:
Loss on currency translation of foreign operations (249) –Other (8) 20
OTHER COMPREHENSIVE (LOSS) INCOME (302) 96
COMPREHENSIVE INCOME $ 3,271 $ 423
1 As at December 31, 2018 and 2017, financial instruments measured at fair value through other comprehensive income (“FVTOCI”) are comprised of sharesin Sinofert Holdings Limited (“Sinofert”) and other. The Company’s investment in Israel Chemicals Ltd. (“ICL”) was classified as held for sale at December 31,2017 and the divestiture of all equity interests in ICL was completed on January 24, 2018.
(See Notes to the Consolidated Financial Statements)
NUTRIEN 2018 95 ANNUAL REPORT
FIN
AN
CIA
L ST
ATE
MEN
TS A
ND
NO
TES
IN MILLIONS OF US DOLLARS EXCEPT AS OTHERWISE NOTED
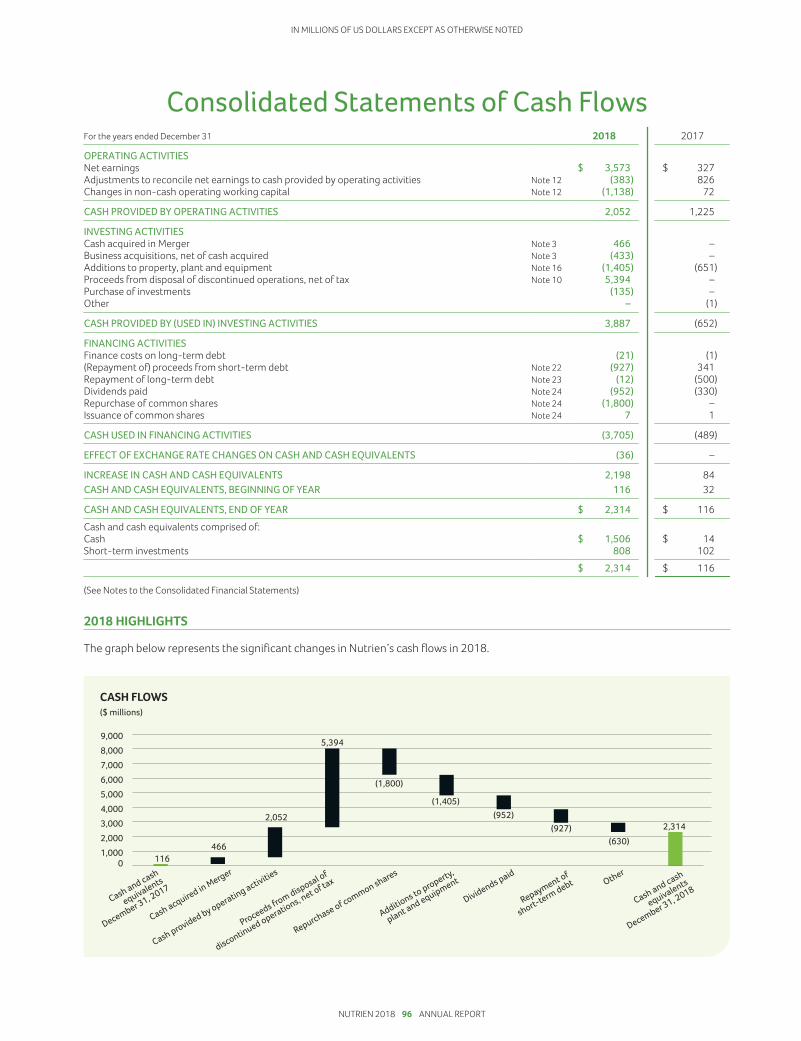
Consolidated Statements of Cash FlowsFor the years ended December 31 2018 2017
OPERATING ACTIVITIESNet earnings $ 3,573 $ 327Adjustments to reconcile net earnings to cash provided by operating activities Note 12 (383) 826Changes in non-cash operating working capital Note 12 (1,138) 72
CASH PROVIDED BY OPERATING ACTIVITIES 2,052 1,225
INVESTING ACTIVITIESCash acquired in Merger Note 3 466 –Business acquisitions, net of cash acquired Note 3 (433) –Additions to property, plant and equipment Note 16 (1,405) (651)Proceeds from disposal of discontinued operations, net of tax Note 10 5,394 –Purchase of investments (135) –Other – (1)
CASH PROVIDED BY (USED IN) INVESTING ACTIVITIES 3,887 (652)
FINANCING ACTIVITIESFinance costs on long-term debt (21) (1)(Repayment of) proceeds from short-term debt Note 22 (927) 341Repayment of long-term debt Note 23 (12) (500)Dividends paid Note 24 (952) (330)Repurchase of common shares Note 24 (1,800) –Issuance of common shares Note 24 7 1
CASH USED IN FINANCING ACTIVITIES (3,705) (489)
EFFECT OF EXCHANGE RATE CHANGES ON CASH AND CASH EQUIVALENTS (36) –
INCREASE IN CASH AND CASH EQUIVALENTS 2,198 84CASH AND CASH EQUIVALENTS, BEGINNING OF YEAR 116 32
CASH AND CASH EQUIVALENTS, END OF YEAR $ 2,314 $ 116Cash and cash equivalents comprised of:Cash $ 1,506 $ 14Short-term investments 808 102
$ 2,314 $ 116
(See Notes to the Consolidated Financial Statements)
2018 HIGHLIGHTS
The graph below represents the significant changes in Nutrien’s cash flows in 2018.
NUTRIEN 2018 96 ANNUAL REPORT

IN MILLIONS OF US DOLLARS EXCEPT AS OTHERWISE NOTED
Consolidated Statements of Changesin Shareholders’ Equity
Accumulated Other Comprehensive (Loss) Income (“AOCI”)
ShareCapital
ContributedSurplus
Net FairValue
Loss onInvestments 1, 2
Net ActuarialGain onDefined
Benefit Plans 3
Loss onCurrency
Translationof ForeignOperations Other
TotalAOCI
RetainedEarnings
TotalEquity 4
(Note 33) (Note 33)BALANCE – DECEMBER 31, 2016 $ 1,798 $ 222 $ 43 $ – $ (2) $ (66) $ (25) $ 6,204 $ 8,199Net earnings – – – – – – – 327 327Other comprehensive income – – 30 46 – 20 96 – 96Dividends declared – – – – – – – (335) (335)Effect of share-based compensation
including issuance of commonshares 2 8 – – – – – – 10
Shares issued for dividendreinvestment plan 6 – – – – – – – 6
Transfer of net actuarial gain ondefined benefit plans – – – (46) – – (46) 46 –
BALANCE – DECEMBER 31, 2017 $ 1,806 $ 230 $ 73 $ – $ (2) $ (46) $ 25 $ 6,242 $ 8,303
Merger impact (Notes 3 and 11) 15,898 7 – – – – – (1) 15,904Net earnings – – – – – – – 3,573 3,573Other comprehensive (loss) income – – (99) 54 (249) (8) (302) – (302)Shares repurchased (Note 24) (998) (23) – – – – – (831) (1,852)Dividends declared – – – – – – – (1,273) (1,273)Effect of share-based compensation
including issuance of commonshares 34 17 – – – – – – 51
Transfer of net actuarial gain ondefined benefit plans – – – (54) – – (54) 54 –
Transfer of net loss on sale ofinvestment – – 19 – – – 19 (19) –
Transfer of net loss on cash flowhedges – – – – – 21 21 – 21
BALANCE – DECEMBER 31, 2018 $16,740 $ 231 $ (7) $ – $ (251) $ (33) $ (291) $ 7,745 $24,425
1 The Company adopted IFRS 9 “Financial Instruments” in 2018 and reclassified available-for-sale investments as financial instruments measured at FVTOCI.2 The Company divested its equity interests in the investment in ICL on January 24, 2018. The loss on sale of ICL of $(19) was transferred to retained earnings
in 2018. The cumulative net unrealized gain at December 31, 2017 was $4.3 Any amounts incurred during a period were closed out to retained earnings at each period-end. Therefore, no balance exists at the beginning or end
of period.4 All equity transactions were attributable to common shareholders.
(See Notes to the Consolidated Financial Statements)
NUTRIEN 2018 97 ANNUAL REPORT
FIN
AN
CIA
L ST
ATE
MEN
TS A
ND
NO
TES
IN MILLIONS OF US DOLLARS EXCEPT AS OTHERWISE NOTED
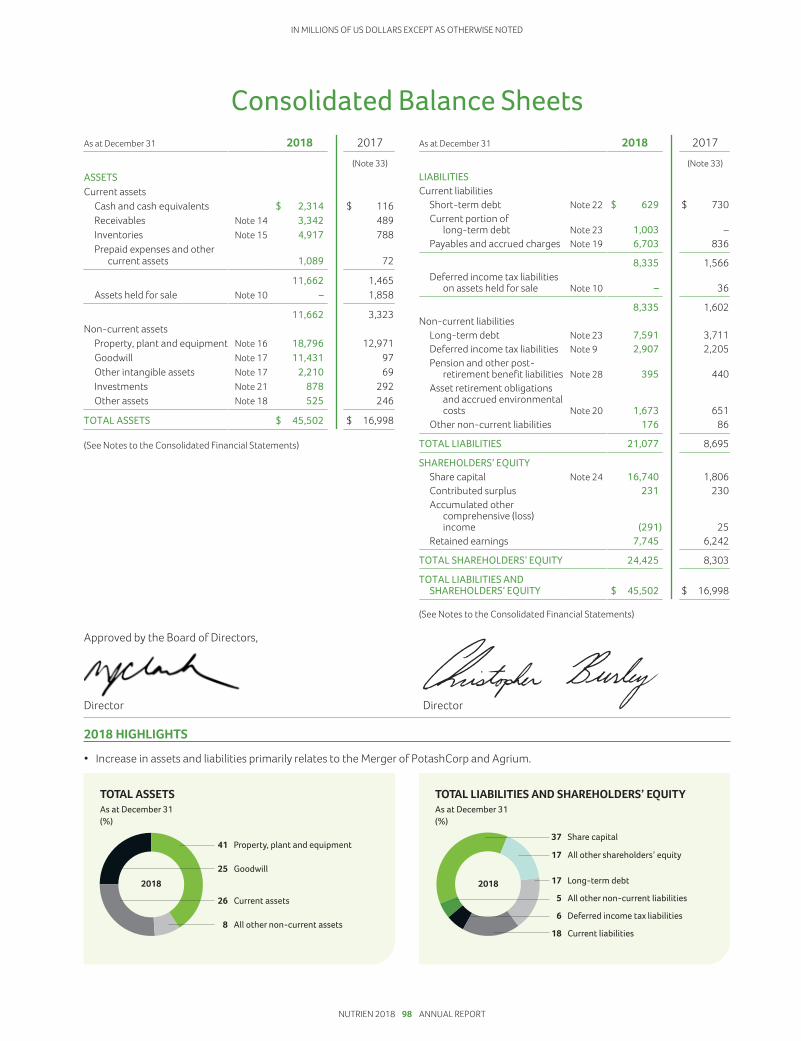
Consolidated Balance SheetsAs at December 31 2018 2017
(Note 33)ASSETSCurrent assets
Cash and cash equivalents $ 2,314 $ 116Receivables Note 14 3,342 489Inventories Note 15 4,917 788Prepaid expenses and other
current assets 1,089 72
11,662 1,465Assets held for sale Note 10 – 1,858
11,662 3,323Non-current assets
Property, plant and equipment Note 16 18,796 12,971Goodwill Note 17 11,431 97Other intangible assets Note 17 2,210 69Investments Note 21 878 292Other assets Note 18 525 246
TOTAL ASSETS $ 45,502 $ 16,998
(See Notes to the Consolidated Financial Statements)
As at December 31 2018 2017
(Note 33)LIABILITIESCurrent liabilities
Short-term debt Note 22 $ 629 $ 730Current portion of
long-term debt Note 23 1,003 –Payables and accrued charges Note 19 6,703 836
8,335 1,566Deferred income tax liabilities
on assets held for sale Note 10 – 36
8,335 1,602Non-current liabilities
Long-term debt Note 23 7,591 3,711Deferred income tax liabilities Note 9 2,907 2,205Pension and other post-
retirement benefit liabilities Note 28 395 440Asset retirement obligations
and accrued environmentalcosts Note 20 1,673 651
Other non-current liabilities 176 86
TOTAL LIABILITIES 21,077 8,695
SHAREHOLDERS’ EQUITYShare capital Note 24 16,740 1,806Contributed surplus 231 230Accumulated other
comprehensive (loss)income (291) 25
Retained earnings 7,745 6,242
TOTAL SHAREHOLDERS’ EQUITY 24,425 8,303
TOTAL LIABILITIES ANDSHAREHOLDERS’ EQUITY $ 45,502 $ 16,998
(See Notes to the Consolidated Financial Statements)
Approved by the Board of Directors,
Director Director
2018 HIGHLIGHTS
• Increase in assets and liabilities primarily relates to the Merger of PotashCorp and Agrium.
NUTRIEN 2018 98 ANNUAL REPORT

IN MILLIONS OF US DOLLARS EXCEPT AS OTHERWISE NOTED
NOTE 1 DESCRIPTION OF BUSINESS
Nutrien Ltd. is an integrated ag solutions provider and plays a critical role in helping growers aroundthe globe increase food production in a sustainable manner. The Company’s Retail segment supplies keyproducts and services directly to growers – including crop nutrients, crop protection and seed, as wellas agronomic and application services. The Company produces the three essential nutrients – potash,nitrogen and phosphate – required to help farmers grow healthier, more abundant crops.
On January 1, 2018, PotashCorp and Agrium combined theirbusinesses in a transaction by way of a plan of arrangement(the “Merger”) by becoming wholly owned subsidiaries of a newparent company named Nutrien Ltd. (collectively with itssubsidiaries, known as “Nutrien” or “the Company” except tothe extent the context otherwise requires).
Nutrien is the world’s largest provider of crop inputs andservices. The Company is a corporation organized under the lawsof Canada and its registered head office is located at Suite 500,122—1st Avenue South, Saskatoon, Saskatchewan, Canada.As at December 31, 2018, the Company had assets as follows:
Retail
• more than 1,700 retail facilities across the US, Canada,Australia and key areas of South America
• capability to formulate and distribute advanced proprietarycrop protection products and nutritionals
• an innovative integrated digital platform for growers andcrop consultants
Production (Owned)
Potash
• six operations in the province of Saskatchewan
Nitrogen
• eight production facilities in North America: four in theprovince of Alberta and one located in each of the states ofTexas, Georgia, Louisiana and Ohio
• one large-scale operation in Trinidad
• seven upgrade facilities in North America: three in theprovince of Alberta and one in each of the states ofWashington, Missouri, Georgia and Alabama
• 50 percent investment in Profertil S.A. (“Profertil”), a nitrogenproducer based in Argentina
• 26 percent investment in Misr Fertilizers Production CompanyS.A.E. (“MOPCO”), a nitrogen producer based in Egypt
Phosphate and Sulfate
• two mines and processing plants: one in each of the statesof North Carolina and Florida
• a production facility in the province of Alberta
• phosphate feed plants in the states of Illinois, Missouri andNebraska
• an industrial phosphoric acid plant in the state of Ohio
Others• investment in Canpotex Ltd. (“Canpotex”), a Canadian potash
export, sales and marketing company owned in equal sharesby Nutrien and another potash producer
• 22 percent investment in Sinofert, a fertilizer supplier anddistributor in China
• a phosphate processing plant in the state of Louisianapermanently shut down in 2018
• one potash operation in the province of New Brunswick thatwill be permanently shut down
Transportation and Distribution(Leased and Owned)• leased or owned approximately 400 terminals and
warehouses relating to the Company’s production operationswithin North America, some of which have multi-productcapability
• leased or owned approximately 15,000 railcars andapproximately 31, 000 retail vehicles and applicationequipment in North America
• ownership in a joint venture that leases a dry bulk fertilizerport terminal in Brazil allowing for timely delivery of product
• leased four vessels for ammonia transportation
• owned one multi-purpose vessel used for molten sulfurand phosphoric acid transportation
NUTRIEN 2018 99 ANNUAL REPORT
FIN
AN
CIA
L ST
ATE
MEN
TS A
ND
NO
TES

IN MILLIONS OF US DOLLARS EXCEPT AS OTHERWISE NOTED
NOTE 2 BASIS OF PRESENTATION
These consolidated financial statements have been preparedin accordance with International Financial Reporting Standardsas issued by the International Accounting Standards Board(“IFRS”). The Company has consistently applied the sameaccounting policies throughout all periods presented, as ifthese policies had always been in effect, with the exception ofIFRS 9 “Financial Instruments” and IFRS 15 “Revenue fromContracts with Customers” which were adopted effectiveJanuary 1, 2018. Figures for 2017 and prior reflect the historicaloperations of PotashCorp, the accounting acquirer. Thefinancial statements and related notes of Nutrien in 2018 andbeyond reflect the operations of Nutrien.
These consolidated financial statements were authorized bythe Board of Directors for issue on February 20, 2019.
Where an accounting policy is applicable to a specific note tothe statements, the policy is described within that note, with
the related financial disclosures by major caption as notedin the table included on page 89. Certain of the Company’saccounting policies that relate to the financial statements asa whole, as well as estimates and judgments it has made andhow they affect the amounts reported in the consolidatedfinancial statements, are disclosed in Note 32. New standardsand amendments or interpretations that were either effectiveand applied by the Company during 2018 or that were notyet effective are described in Note 32. Sensitivity analysesincluded throughout the notes should be used with cautionas the changes are hypothetical and not reflective of futureperformance. The sensitivities have been calculatedindependently of changes in other key variables. Changesin one factor may result in changes in another, which couldamplify or reduce certain sensitivities. These consolidatedfinancial statements were prepared under the historical costbasis, except for items that IFRS requires to be measured atfair value.
NOTE 3 BUSINESS COMBINATIONS
The Company’s business combinations include the Merger between PotashCorp and Agrium and theacquisition of Retail businesses, including farm centers in North America and Australia, digital agriculture,proprietary products and agricultural services. Assets acquired and liabilities assumed are measured atfair value.
Accounting Policies Accounting Estimates and Judgments• The acquisition method is followed.
• Consideration is measured at the aggregate of the fair valuesof assets transferred, liabilities incurred or assumed, andequity instruments issued in exchange for control of theacquiree at the acquisition date.
• The acquisition date is the date the Company obtains controlover the acquiree.
• Identifiable assets acquired and liabilities assumed aregenerally measured at fair value.
• Acquisition-related costs are recognized in net earnings asincurred.
• The excess of total consideration for each acquisition plusnon-controlling interest in the acquiree, over the fair value ofthe identifiable net assets acquired, is recorded as goodwill.
• Purchase price allocation involves judgment in identifyingassets acquired and liabilities assumed and estimation oftheir fair values.
• Judgment is required to determine which entity is theacquirer in a merger of equals. In identifying PotashCorp asthe acquirer, the companies considered the voting rights ofall equity instruments, the intended corporate governancestructure of the combined company, the intendedcomposition of senior management of the combinedcompany and the size of each of the companies. In assessingthe size of each of the companies, the companies evaluatedvarious metrics. No single factor was the sole determinantin the overall conclusion that PotashCorp is the acquirer foraccounting purposes; rather, all factors were considered inarriving at the conclusion.
NUTRIEN 2018 100 ANNUAL REPORT

IN MILLIONS OF US DOLLARS EXCEPT AS OTHERWISE NOTED
NOTE 3 BUSINESS COMBINATIONS CONTINUED
Merger
As described in Note 1, PotashCorp and Agrium combined theirbusinesses in a merger of equals. Benefits of the Merger includeoperating synergies, primarily from the distribution and retailintegration, production and expense optimization, andprocurement savings.
Agrium was a retail distributor of agricultural crop inputs,providing growers with fertilizer, crop protection products, seed,services and solutions. Agrium was also one of the largestmanufacturers of fertilizer in the world, producing and marketingall three major crop nutrients – nitrogen, potash and phosphate.
On January 1, 2018, the acquisition date, shareholders ofPotashCorp received 0.400 common shares of Nutrien for eachPotashCorp share held, and shareholders of Agrium received2.230 common shares of Nutrien for each Agrium share held.The exchange ratios represent the respective closing shareprices of each company’s common shares at market close onthe New York Stock Exchange (“NYSE”) on August 29, 2016, thelast trading day prior to when the companies announced thatthey were in preliminary discussions regarding a merger ofequals, which is consistent with the weighted average pricesthrough that date. The outstanding share-based compensationawards of PotashCorp and Agrium were replaced by Nutrienshare-based compensation awards with substantiallyequivalent terms after adjusting for the applicable exchangeratio (refer to Note 29). Merger and related costs of $170 in2018 were included in other expenses (2017 – $84).
The purchase price was determined based on the numberof Agrium shares outstanding and its trading price onDecember 29, 2017. The share price reflects marketparticipants’ assumptions of the fair value of Agrium as a goingconcern, which exceeds the fair value of the assets acquiredand liabilities assumed. This resulted in the recognition ofgoodwill in the amount of $11,185, none of which is deductiblefor income tax purposes. The value of goodwill is primarilyattributable to: (a) the location and scale of the Retaildistribution network; (b) the proximity of the nitrogenoperations to sources of low-cost natural gas; (c) cost synergiesassociated with the reduction of selling, general andadministrative expenses, in addition to the optimization of therail fleet, distribution and logistics, and procurement; and (d)the assembled workforce, mostly related to the employees inthe Retail distribution network.
Management completed an assessment in identifying andmeasuring all the assets acquired and liabilities assumed priorto the recognition of goodwill. This assessment included athorough review of all internal and external sources ofinformation available on circumstances that existed at theacquisition date. The Company engaged independent valuationexperts to assist in determining the fair value of certain assetsacquired and liabilities assumed and related deferred incometax impacts.
The final values that were allocated to Agrium’s assets andliabilities as at January 1, 2018 based upon fair values wereas follows:
Cash and cash equivalents $ 466Receivables 1 2,600Inventories 3,303Prepaid expenses and other current assets 1,124Assets held for sale 2 95Property, plant and equipment 3 7,459Goodwill 4 11,185Other intangible assets 4 2,348Investments 528Other assets 5 198
Total assets 29,306
Short-term debt 867Payables and accrued charges 6 5,239Long-term debt 4,941Deferred income tax liabilities 934Pension and other post-retirement benefit
liabilities 142Asset retirement obligations and accrued
environmental costs 6 1,094Other non-current liabilities 79
Total liabilities 13,296
Net assets (consideration for the Merger) $ 16,010
1 Includes trade receivables with gross contractual amount of $2,247, ofwhich $80 are considered to be uncollectible.
2 Relates to the assets held at the Company’s Conda Phosphate operationsand North Bend nitric acid operations. The sale was completed onJanuary 12, 2018.
3 Refer to Note 16 for detailed information of property, plant andequipment acquired.
4 Refer to Note 17 for detailed information on other intangible assetsacquired and the allocation of goodwill to groups of cash generatingunits (“CGUs”).
5 Includes deferred income tax assets of $158.6 Refer to Note 20 for detailed information of asset retirement obligations
and accrued environmental costs acquired. Included in payables andaccrued charges is $39 related to the current portion of asset retirementobligations and accrued environmental costs.
The significant fair value considerations included in theallocation of purchase price are discussed below:
Property, Plant and EquipmentThe fair value was primarily determined using a marketapproach for land and certain types of personal property, anda replacement cost approach for the remaining property, plantand equipment. The market approach for land and certain typesof personal property represents a sales comparison thatmeasures the value of an asset through an analysis of sales andofferings of comparable assets. The replacement cost approachused for all other depreciable property, plant and equipmentmeasures the value of an asset by estimating the cost to acquireor construct comparable assets and adjusts for age andcondition of the asset.
NUTRIEN 2018 101 ANNUAL REPORT
FIN
AN
CIA
L ST
ATE
MEN
TS A
ND
NO
TES

IN MILLIONS OF US DOLLARS EXCEPT AS OTHERWISE NOTED
NOTE 3 BUSINESS COMBINATIONS CONTINUED
Other Intangible AssetsOther intangible assets primarily consist of acquiredcustomer relationships, brands, proprietary technology,trademarks and trade names. The fair value of customer-related assets was determined using the excess earningsmethod, an income approach. In determining the fair value ofcustomer relationships, a segment of customers was identifiedwhere the sales from these customers are driven by factorssuch as relationships with the Company and its employees and,as such, fair value was associated with customer relationships.Segmenting customers is a matter of judgment and includesfactors such as the size of the customer and customerbehavior patterns.
Long-Term DebtThe fair value of debentures was determined based oncomparable debt instruments with similar maturities, adjustedwhere necessary to Agrium’s credit spread, based oninformation published by financial institutions.
Asset Retirement Obligations and Accrued Environmental CostsAsset retirement obligations for phosphate sites are expectedto be paid over the next 68 years, while asset retirementobligations for potash and nitrogen sites are expected to bepaid after that time. The fair value for environmental costs wasdetermined using a decision-tree approach of future costs anda risk premium to capture the compensation sought by risk-averse market participants for bearing the uncertainty inherentin the cash flows of the liability. Accrued environmental costsare expected to be paid over a period extending up to 30 yearsand were discounted using a credit adjusted risk-free rate.
Financial Information Related to the AcquiredOperations of Agrium
The following table provides “gross sales” and “net earningsfrom continuing operations before income taxes”:
2018
Summary results of acquired operations ofAgrium 1
Sales $ 14,551Net earnings from continuing operations
before income taxes $ 546
1 Results of acquired operations included in the Company’s consolidatedstatements of earnings for 2018.
Retail Acquisitions
During the year, the Retail segment acquired 53 farm centersin North America and Australia and companies operating withinthe digital agriculture, proprietary products and agriculturalservices business. Benefits of the acquisitions include expansionof geographical coverage for the sale of crop input products,increased customer base and workforce, continued growth inthe digital agricultural field and synergies between Nutrien andthe acquired businesses.
The values allocated to the acquired assets and assumed liabilitiesbased upon fair values were as follows as at December 31:
2018
Working capital $ 116Property, plant and equipment 107Goodwill 1 197Other intangible assets 8Other non-current assets 14Other non-current liabilities (9)
Total consideration $ 433
1 Goodwill was calculated as the difference between the amount ofconsideration transferred and the net identifiable assets acquired.Goodwill resulting from the acquisition is attributed to the assembledworkforce, value of potential increase in customer base and synergiesbetween Nutrien and the acquired companies.
2018
Financial information related to businessacquisitions 1
Sales from date of acquisition $ 213Net earnings from continuing operations before
income taxes from date of acquisition $ 10
1 Estimated annual sales and earnings before finance costs, income taxes,and depreciation and amortization if acquisitions occurred at thebeginning of the year are approximately $441 and $42, respectively.
On February 5, 2019, the Company announced the plannedacquisition of Actagro, LLC, a developer, manufacturer andmarketer of environmentally sustainable soil and plant healthproducts and technologies for an estimated purchase priceof $340. Closing of the transaction is subject to US regulatoryapproval and is expected to be completed in the first halfof 2019.
NUTRIEN 2018 102 ANNUAL REPORT

IN MILLIONS OF US DOLLARS EXCEPT AS OTHERWISE NOTED
NOTE 4 SEGMENT INFORMATION
The Company has four reportable operating segments: Retail, Potash, Nitrogen, and Phosphate andSulfate. The Retail segment distributes crop nutrients, crop protection products, seed and merchandise,and provides services directly to growers through a network of farm centers in North and South Americaand Australia. The Potash, Nitrogen, and Phosphate and Sulfate segments are differentiated by thechemical nutrient contained in the products that each produces.
Accounting Policies Accounting Estimates and JudgmentsOperating SegmentsPrior to the Merger, the Company identified the Chief Executive Officer as theChief Operating Decision Maker (“CODM”) under IFRS and used gross margin tomeasure the segments’ profit or loss. The operating segments were limited to thefollowing: Potash, Nitrogen and Phosphate. The changes in the structure of theCompany’s internal organization as a result of the Merger caused the compositionof the operating segments to change as well as who the Company identified to bethe CODM.
Post-Merger, the Company identified the Executive Leadership Team (“ELT”),comprised of officers at the Executive Vice President level and above, as theCODM. The CODM uses net (loss) earnings before finance costs, income taxes, anddepreciation and amortization (“EBITDA”) to measure performance and allocateresources to the operating segments. The CODM believes EBITDA to be animportant measure as it excludes the effects of items that primarily reflect theimpact of long-term investment and financing decisions, rather than theperformance of the Company’s day-to-day operations.
In 2019, the Company’s CODM reassessed product groupings and decided toevaluate the performance of sulfate products as part of the Nitrogen segment,rather than the Phosphate and Sulfate segment; therefore, future comparativefigures will be restated for the change in the composition of the segments, whichwill result in an increase in the Nitrogen segment and a decrease in the Phosphateand Sulfate segment. For the year ended December 31, 2018, this change will beapproximately $121, $42, and $69 in sales, gross margin and EBITDA, respectively.
Operating SegmentsJudgment is used in determining thecomposition of the reportable segmentsbased on factors including risks and returns,internal organization, and internal reportsreviewed by the CODM.
Certain expenses are allocated acrosssegments based on an appropriate basissuch as production capacities or historicaltrends.
RevenueThe Company recognizes revenue when it transfers control over a good or serviceto a customer.
RevenueFor product sales which contain volumerebates, revenue is recognized to the extentthat it is highly probable that significantreversals will not occur using the most likelymethod and accumulated experience.
Returns and incentives are estimated basedon historical and forecasted data,contractual terms and current conditions.Due to the nature of goods and services sold,any single estimate would have only anegligible impact on revenue recognition.
Retail Potash, Nitrogen, and Phosphate and Sulfate
Transfer of control for the sale of goodsAt the point in time when the product is:• purchased at the Company’s Retail
farm center or• delivered and accepted by customers
at their premises
At the point in time when the product is:• loaded for shipping or• delivered to the customer
Transfer of control for servicesWhen the promised service is rendered When the promised service is rendered
RetailSales revenue consists primarily of:
• Crop nutrients – sales of dry and liquid macronutrient products which includenitrogen, potash and phosphate, proprietary liquid micronutrient products andnutrient application services;
• Crop protection products – sales of various third-party supplier and proprietaryproducts designed to maintain crop quality and manage plant diseases, weeds,and other pests;
NUTRIEN 2018 103 ANNUAL REPORT
FIN
AN
CIA
L ST
ATE
MEN
TS A
ND
NO
TES

IN MILLIONS OF US DOLLARS EXCEPT AS OTHERWISE NOTED
NOTE 4 SEGMENT INFORMATION CONTINUED
Accounting Policies Accounting Estimates and Judgments
• Seed – various third-party supplier seed brands and proprietary seed product lines;
• Merchandise – sales of fencing, feed supplements, livestock-related animalhealth products, storage and irrigation equipment, and other products; and
• Services and other revenues – sales of product application, soil and leaf testing,crop scouting and precision agriculture services, financial services and livestockmarketing.
Provisions for returns, trade discounts and rebates are deducted from sales revenue.
Potash, Nitrogen, and Phosphate and SulfateThe Company manufactures and sells potash, nitrogen, and phosphate and sulfateproducts. While agriculture is the Company’s primary market, it also producesproducts for animal nutrition and industrial uses.
The Company’s sales revenue is recorded and measured based on the “freight onboard” mine, plant, warehouse or terminal price specified in the contract (exceptfor certain vessel sales or specific product sales that are shipped and recorded ona delivered basis), which reflects the consideration the Company expects to beentitled to in exchange for the goods or services, net of any variable consideration(e.g., any trade discounts or estimated volume rebates). Where volume rebates areprovided for in customer contracts, the Company estimates revenue at the earlierof the most likely amount of consideration expected to be received or when theconsideration becomes fixed. The Company’s customer contracts may providecertain product quality specification guarantees but do not generally provide forrefunds or returns.
Sales prices are based on North American and International benchmark market priceswhich are variable and subject to global supply and demand, and competitive factors.
Potash Nitrogen Phosphate and SulfateProducts • North American –
primarily granular• Offshore
(International) –primarily granularand standard
• Ammonia, urea,urea ammoniumnitrate,and industrialgrade ammoniumnitrate
• Solid fertilizer, liquidfertilizer, industrialproducts and feedproducts
Sales pricesimpacted by
• North Americanprices referencedat delivered prices(includingtransportationand distributioncosts)
• Internationalprices referencedat the mine site(excludingtransportationand distributioncosts)
• Global energycosts and supply
• Global ammonia andsulfur costs andsupply
OtherThe Company does not provide general warranties. Intersegment sales are madeunder terms that approximate market value. Transportation costs are generallyrecovered from the customer through sales pricing.
Seasonality in the Company’s business results from increased demand forproducts during planting season. Crop input sales are generally higher in springand fall crop input application seasons. Crop nutrient inventories are normallyaccumulated leading up to each application season. The Company’s cashcollections generally occur after the application season is complete whilecustomer prepayments are concentrated in December and January.
NUTRIEN 2018 104 ANNUAL REPORT

IN MILLIONS OF US DOLLARS EXCEPT AS OTHERWISE NOTED
NOTE 4 SEGMENT INFORMATION CONTINUED
Supporting Information
Financial information on each of these segments is summarized in the following tables:
2018 Retail Potash Nitrogen
Phosphateand
Sulfate Others Eliminations Consolidated
Sales – third party $12,620 $ 2,796 $ 2,651 $ 1,569 $ – $ – $19,636– intersegment 50 220 566 328 – (1,164) –
Sales – total 12,670 3,016 3,217 1,897 – (1,164) 19,636Freight, transportation and distribution – (349) (358) (230) – 73 (864)
Net sales 12,670 2,667 2,859 1,667 – (1,091)Cost of goods sold (9,635) (1,183) (2,079) (1,539) – 1,056 (13,380)
Gross margin 3,035 1,484 780 128 – (35) 5,392Selling expenses (2,303) (14) (32) (10) 22 – (2,337)General and administrative expenses (100) (10) (20) (9) (400) – (539)Provincial mining and other taxes – (244) (3) (1) (2) – (250)Impairment of property, plant and
equipment (Note 16) – (1,809) – – – – (1,809)Other income (expenses) 75 (14) 8 (6) (106) – (43)
Earnings (loss) before finance costs andincome taxes 707 (607) 733 102 (486) (35) 414
Depreciation and amortization 499 404 429 206 54 – 1,592
EBITDA 1 $ 1,206 $ (203) $ 1,162 $ 308 $ (432) $ (35) $ 2,006Assets 2 $17,964 $11,710 $10,009 $ 2,783 $ 3,678 $ (642) $45,502
1 EBITDA is a non-IFRS measure calculated as net (loss) earnings from continuing operations before finance costs, income taxes, and depreciation andamortization. Nutrien uses EBITDA as a supplemental measure. Generally, this measure is a numerical measure of a company’s performance, that eitherexcludes or includes amounts that are not normally excluded or included in the most directly comparable measure calculated and presented in accordancewith IFRS. In evaluating this measure, investors should consider that the methodology applied in calculating this measure may differ among companies andanalysts. The Company uses both IFRS and certain non-IFRS measures to assess performance. Management believes the non-IFRS measures provide usefulsupplemental information to investors in order that they may evaluate Nutrien’s financial performance using the same measures as management.Management believes that, as a result, the investor is afforded greater transparency in assessing the financial performance of the Company. This non-IFRSfinancial measure should not be considered as a substitute for, nor superior to, measures of financial performance prepared in accordance with IFRS.
2 Included in the Nitrogen and Retail segments are $428 and $208 relating to equity-accounted investees, respectively, as described in Note 21.
NUTRIEN 2018 105 ANNUAL REPORT
FIN
AN
CIA
L ST
ATE
MEN
TS A
ND
NO
TES

IN MILLIONS OF US DOLLARS EXCEPT AS OTHERWISE NOTED
NOTE 4 SEGMENT INFORMATION CONTINUED
2017 Potash Nitrogen
Phosphateand
Sulfate Others Eliminations Consolidated
Sales – third party $ 1,868 $ 1,395 $ 1,284 $ – $ – $ 4,547– intersegment – 74 – – (74) –
Sales – total 1,868 1,469 1,284 – (74) 4,547Freight, transportation and distribution (235) (129) (173) – – (537)Net sales 1,633 1,340 1,111 – (74)Cost of goods sold 1 (829) (1,084) (1,477) – 74 (3,316)Gross margin 804 256 (366) – – 694Selling expenses (7) (14) (6) (2) – (29)General and administrative expenses (7) (4) (4) (170) – (185)Provincial mining and other taxes (146) – – – – (146)Other expenses (19) (3) (4) (99) – (125)Earnings (loss) before finance costs and
income taxes 625 235 (380) (271) – 209Depreciation and amortization 232 203 220 37 – 692EBITDA $ 857 $ 438 $ (160) $ (234) $ – $ 901Assets 2 $ 9,756 $ 2,577 $ 1,938 $ 2,727 $ – $ 16,998
1 Included in the Phosphate and Sulfate segment is $305 of impairment of property, plant and equipment as described in Note 16.2 Included in the total assets relating to the Others segment is $1,858 relating to the investments held for sale as described in Note 10.
Financial information by geographic area is summarized in the following tables:
Country of Origin
2018 United States Canada Australia Trinidad Other Consolidated
Sales to customers outside the CompanyUnited States $ 10,488 $ 1,249 $ – $ 153 $ 1 $ 11,891Canada 208 2,582 – – – 2,790Australia 2 – 1,679 – – 1,681Canpotex 1 – 1,657 – – – 1,657Mexico 70 – – 15 – 85Trinidad 9 – – 181 – 190Argentina 9 – – – 378 387Brazil 38 – – – 74 112Colombia 9 – – 42 – 51Other Latin America 20 – – 59 92 171India 151 – – – – 151Europe 11 58 67 93 83 312Other 22 – 100 32 4 158
$ 11,037 $ 5,546 $ 1,846 $ 575 $ 632 $ 19,636Non-current assets 2 $ 14,501 $ 17,100 $ 607 $ 570 $ 621 $ 33,399
1 As described in Note 1, Canpotex executed offshore marketing, sales and distribution functions for certain of the Company’s products. Canpotex’s 2018sales volumes were made to: Latin America 33%, China 18%, India 10%, Other Asian markets 31%, other markets 8% (Note 30).
2 Includes non-current assets other than financial instruments, deferred tax assets and post-employment benefit assets.
NUTRIEN 2018 106 ANNUAL REPORT
IN MILLIONS OF US DOLLARS EXCEPT AS OTHERWISE NOTED
NOTE 4 SEGMENT INFORMATION CONTINUED
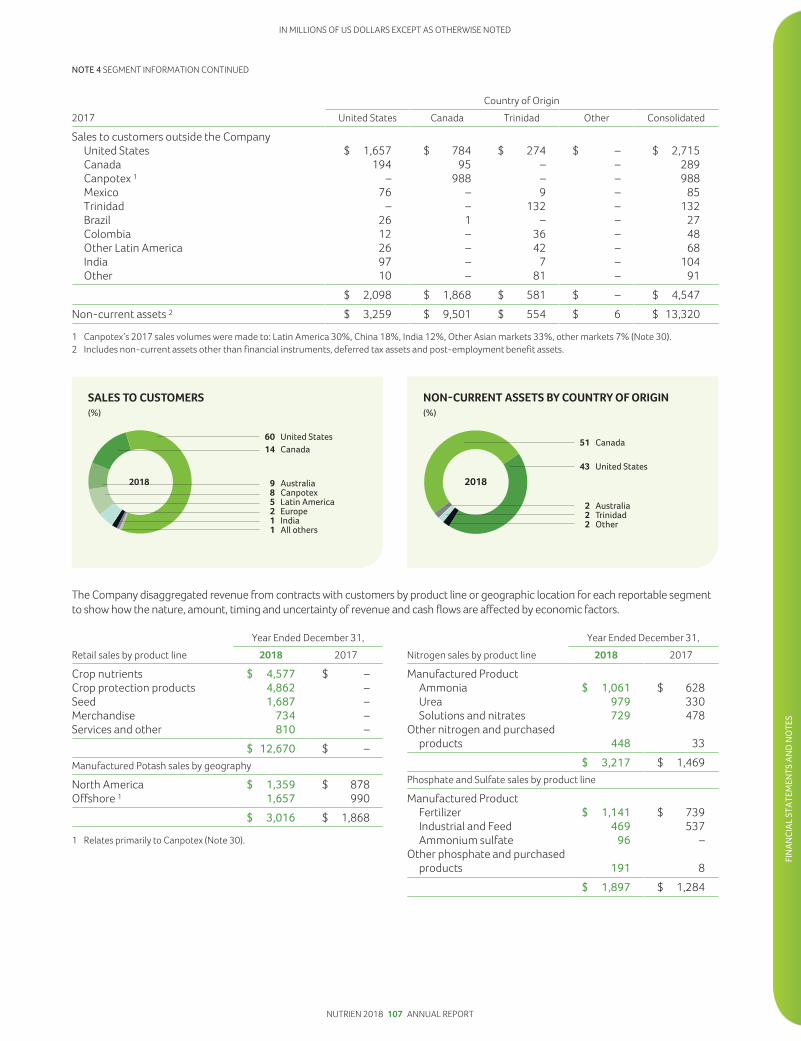
Country of Origin2017 United States Canada Trinidad Other Consolidated
Sales to customers outside the CompanyUnited States $ 1,657 $ 784 $ 274 $ – $ 2,715Canada 194 95 – – 289Canpotex 1 – 988 – – 988Mexico 76 – 9 – 85Trinidad – – 132 – 132Brazil 26 1 – – 27Colombia 12 – 36 – 48Other Latin America 26 – 42 – 68India 97 – 7 – 104Other 10 – 81 – 91
$ 2,098 $ 1,868 $ 581 $ – $ 4,547Non-current assets 2 $ 3,259 $ 9,501 $ 554 $ 6 $ 13,320
1 Canpotex’s 2017 sales volumes were made to: Latin America 30%, China 18%, India 12%, Other Asian markets 33%, other markets 7% (Note 30).2 Includes non-current assets other than financial instruments, deferred tax assets and post-employment benefit assets.
The Company disaggregated revenue from contracts with customers by product line or geographic location for each reportable segmentto show how the nature, amount, timing and uncertainty of revenue and cash flows are affected by economic factors.
Year Ended December 31,Retail sales by product line 2018 2017
Crop nutrients $ 4,577 $ –Crop protection products 4,862 –Seed 1,687 –Merchandise 734 –Services and other 810 –
$ 12,670 $ –Manufactured Potash sales by geography
North America $ 1,359 $ 878Offshore 1 1,657 990
$ 3,016 $ 1,868
1 Relates primarily to Canpotex (Note 30).
Year Ended December 31,Nitrogen sales by product line 2018 2017
Manufactured ProductAmmonia $ 1,061 $ 628Urea 979 330Solutions and nitrates 729 478
Other nitrogen and purchasedproducts 448 33
$ 3,217 $ 1,469Phosphate and Sulfate sales by product line
Manufactured ProductFertilizer $ 1,141 $ 739Industrial and Feed 469 537Ammonium sulfate 96 –
Other phosphate and purchasedproducts 191 8
$ 1,897 $ 1,284
NUTRIEN 2018 107 ANNUAL REPORT
FIN
AN
CIA
L ST
ATE
MEN
TS A
ND
NO
TES

IN MILLIONS OF US DOLLARS EXCEPT AS OTHERWISE NOTED
NOTE 5 NATURE OF EXPENSES
Accounting Policies
Cost of goods sold represents the cost of purchasing products for resale and costs primarily incurred at, and charged to,producing facilities.
The primary components of selling and general and administrative expenses are compensation, other employee costs, depreciationand amortization, other operating leases, and fleet fuel, repairs and maintenance.
Supporting Information
Expenses by nature were comprised of:
Cost of Goods Sold Other Total
2018 2017 2018 2017 2018 2017(Note 33) (Note 33) (Note 33)
Purchased and produced raw materialsand product for resale 1 $ 11,145 $ 1,724 $ – $ – $ 11,145 $ 1,724
Depreciation and amortization 1,038 655 554 37 1,592 692Employee costs 2 713 563 1,236 113 1,949 676Freight (direct and indirect) 303 – 631 372 934 372Impairment of property, plant and
equipment (Note 16) – 305 – – – 305Offsite warehouse costs 3 – – 69 47 69 47Railcar and vessel costs 3 – – 131 102 131 102Merger and related costs – – 170 84 170 84Other operating leases 38 – 110 – 148 –Fleet fuel, repairs and maintenance – – 183 – 183 –Other 143 69 699 121 842 190
Total $ 13,380 $ 3,316 $ 3,783 $ 876 $ 17,163 $ 4,192
Expenses included in:Freight, transportation and distribution $ 864 $ 537Cost of goods sold 13,380 3,316Selling expenses 2,337 29General and administrative expenses 539 185Other expenses 43 125
1 Significant expenses include: contract services, supplies, energy, fuel, purchases of raw material (natural gas – feedstock, sulfur, ammonia and reagents) andproduct for resale (crop nutrients and protection products, and seed).
2 Includes employee benefits and share-based compensation. In 2018, employee costs also include a $157 gain on curtailment of defined benefit pension andother post-retirement benefit plans (“Defined Benefit Plans Curtailment Gain”) as described in Note 28.
3 Includes expenses relating to operating leases.
NUTRIEN 2018 108 ANNUAL REPORT

IN MILLIONS OF US DOLLARS EXCEPT AS OTHERWISE NOTED
NOTE 6 PROVINCIAL MINING AND OTHER TAXES
Under Saskatchewan provincial legislation, the Company is subject to resource taxes, including the potash
production tax and the resource surcharge.
2018 2017(Note 33)
Saskatchewan potash production tax $ 160 $ 95Saskatchewan resource surcharge and other 90 51
$ 250 $ 146
NOTE 7 OTHER EXPENSES
2018 2017(Note 33)
Merger and related costs $ (170) $ (84)Defined Benefit Plans Curtailment Gain (Note 28) 157 –Foreign exchange gain (loss) 10 (21)Other expenses (40) (20)
$ (43) $ (125)
NOTE 8 FINANCE COSTS
2018 2017
Interest expenseShort-term debt $ 129 $ 9Long-term debt 372 206
Unwinding of discount on asset retirement obligations (Note 20) 51 17Interest on net defined benefit pension and other post-retirement plan obligations (Note 28) 15 19Borrowing costs capitalized to property, plant and equipment (12) (11)Interest income (17) (2)
$ 538 $ 238
Borrowing costs capitalized to property, plant and equipment in 2018 were calculated by applying an average capitalization rate of4.4 percent (2017 – 4.4 percent) to expenditures on qualifying assets.
See Note 12 for interest paid.
NUTRIEN 2018 109 ANNUAL REPORT
FIN
AN
CIA
L ST
ATE
MEN
TS A
ND
NO
TES

IN MILLIONS OF US DOLLARS EXCEPT AS OTHERWISE NOTED
NOTE 9 INCOME TAXES
This note explains the Company’s income tax recovery and tax-related balances within the consolidatedfinancial statements. The deferred tax section provides information on expected future tax payments.
Accounting Policies Accounting Estimates and JudgmentsThe Company operates in a specialized industry and in several tax jurisdictions. As aresult, its income is subject to various rates of taxation. Taxation on items recognizedin the consolidated statements of earnings, other comprehensive income (“OCI”) orcontributed surplus is recognized in the same location as those items.
Taxation on (loss) earnings is comprised of current and deferred income tax.
Estimates and judgments to determinethe Company’s taxes are impacted by:• the breadth of the Company’s
operations; and• global complexity of tax regulations.
The final taxes paid, and potentialadjustments to tax assets and liabilities,are dependent upon many factorsincluding:• negotiations with taxation authorities
in various jurisdictions;• outcomes of tax litigation; and• resolution of disputes arising from
federal, provincial, state and local taxaudits.
Estimates and judgments are used torecognize the amount of deferred taxassets, which:• includes the probability that future
taxable profit will be available to usedeductible temporary differences, andcould be reduced if projected earningsare not achieved or increased ifearnings previously not projectedbecome probable.
Current income tax is: Deferred income tax is:• the expected tax payable on the taxable
earnings for the year;• calculated using rates enacted or
substantively enacted at the dates of theconsolidated balance sheets in thecountries where the Company’ssubsidiaries, held for sale investees andequity-accounted investees operate andgenerate taxable earnings; and
• inclusive of any adjustment to income taxpayable or recoverable in respect ofprevious years.
• recognized using the liability method;• based on temporary differences
between financial statements’carrying amounts of assets andliabilities and their respective incometax bases; and
• determined using tax rates that havebeen enacted or substantivelyenacted by the dates of theconsolidated balance sheets and areexpected to apply when the relateddeferred income tax asset is realizedor the deferred income tax liabilityis settled.
Uncertain income tax positions are accounted for using the standards applicable tocurrent income tax liabilities and assets, i.e., both liabilities and assets are recordedwhen probable and measured at the amount expected to be paid to (recovered from)the taxation authorities using the Company’s best estimate of the amount.
Deferred income tax is not accounted for:• with respect to investments in subsidiaries and equity-accounted investees where
the Company is able to control the reversal of the temporary difference and thatdifference is not expected to reverse in the foreseeable future; and
• if arising from initial recognition of an asset or liability in a transaction, other than abusiness combination, that at the time of the transaction affects neither accountingnor taxable profit or loss.
The realized and unrealized excess tax benefits from share-based payment arrangementsare recognized in contributed surplus as current and deferred tax, respectively.
Deferred income tax assets are reviewed at each balance sheet date and amended tothe extent that it is no longer probable that the related tax benefit will be realized.
Income tax assets and liabilities are offset when:
For current income taxes, the Company has: For deferred income taxes:• a legally enforceable right to offset the
recognized amounts 1 ; and• the intention to settle on a net basis or
realize the asset and settle the liabilitysimultaneously.
• the Company has a legallyenforceable right to set off currenttax assets against current taxliabilities; and
• they relate to income taxes levied bythe same taxation authority oneither: 1) the same taxable entity; or2) different taxable entities intendingto settle current tax liabilities andassets on a net basis, or realize assetsand settle liabilities simultaneously ineach future period. 2
1 For income taxes levied by the same taxation authority and the authority permits the Company tomake or receive a single net payment or receipt.
2 In which significant amounts of deferred tax liabilities or assets expected are to be settled or recovered.
NUTRIEN 2018 110 ANNUAL REPORT

IN MILLIONS OF US DOLLARS EXCEPT AS OTHERWISE NOTED
NOTE 9 INCOME TAXES CONTINUED
Supporting Information
Income Taxes included in Net (Loss) Earnings from ContinuingOperationsThe provision for income taxes differs from the amount thatwould have resulted from applying the Canadian statutoryincome tax rates to (loss) earnings before income taxes asfollows:
2018 2017
(Loss) earnings before incometaxesCanada $ (1,195) $ 123United States 619 (271)Trinidad 98 95Australia 96 –Other 258 24
$ (124) $ (29)
Canadian federal and provincialstatutory income tax rate 27% 27%
Income tax at statutory rates $ 33 $ 8Adjusted for the effect of:
Impact of foreign tax rates (US,Trinidad, Australia and other) 58 (25)
Production-related deductions 15 14Non-taxable income 10 –Foreign accrual property income (15) (3)Impact of tax rate changes – 187Other (8) 2
Income tax recovery included in net(loss) earnings from continuingoperations $ 93 $ 183
Total income tax recovery, included in net (loss) earnings fromcontinuing operations, was comprised of the following:
2018 2017
Current income taxTax expense for current year $ (195) $ (70)Adjustments in respect of prior
years 15 (20)
Total current income tax expense (180) (90)
Deferred income taxOrigination and reversal of
temporary differences 283 69Adjustments in respect of prior
years (12) 20Impact of tax rate changes – 187Other 2 (3)
Total deferred income taxrecovery 273 273
Income tax recovery included in net(loss) earnings from continuingoperations $ 93 $ 183
Income Tax BalancesIncome tax balances within the consolidated balance sheets as at December 31 were comprised of the following:
Income Tax Assets (Liabilities) Balance Sheet Location 2018 2017
Current income tax assetsCurrent Receivables (Note 14) $ 248 $ 24Long-term Other assets (Note 18) 36 64
Deferred income tax assets Other assets (Note 18) 216 18
Total income tax assets $ 500 $ 106
Current income tax liabilitiesCurrent Payables and accrued charges (Note 19) $ (47) $ (16)Non-current Other non-current liabilities (64) (43)
Deferred income tax liabilities Deferred income tax liabilities (2,907) (2,205)
Total income tax liabilities $ (3,018) $ (2,264)
NUTRIEN 2018 111 ANNUAL REPORT
FIN
AN
CIA
L ST
ATE
MEN
TS A
ND
NO
TES

IN MILLIONS OF US DOLLARS EXCEPT AS OTHERWISE NOTED
NOTE 9 INCOME TAXES CONTINUED
Deferred Income TaxesIn respect of each type of temporary difference, unused tax loss and unused tax credit, the amounts of deferred tax assets andliabilities recognized in the consolidated balance sheets as at December 31 and the amount of the deferred tax recovery (expense)recognized in net (loss) earnings from continuing operations were:
Deferred Income Tax Assets(Liabilities)
Deferred Income TaxRecovery (Expense)Recognized in Net
Earnings
2018 2017 2018 2017
Deferred income tax assetsAsset retirement obligations and accrued environmental costs $ 412 $ 120 $ (11) $ (56)Tax loss and other carryforwards 261 13 198 (105)Pension and other post-retirement benefit liabilities 130 124 (44) (22)Long-term debt 110 – (10) –Receivables 58 – 3 –Inventories 54 4 13 (2)Derivatives 17 13 (15) –Other assets 57 11 (18) (11)
Deferred income tax liabilitiesProperty, plant and equipment (3,218) (2,441) 132 472Goodwill and other intangible assets (546) (17) 31 –Other liabilities (26) (14) (6) (3)
$ (2,691) $ (2,187) $ 273 $ 273
Reconciliation of net deferred income tax liabilities:
2018 2017
Balance, beginning of year $ (2,187) $ (2,453)Merger impact (Note 3) (776) –Income tax recovery
recognized in net (loss)earnings from continuingoperations 273 273
Income tax recoveryrecognized in net earningsfrom discontinuedoperations 17 –
Income tax charge recognizedin OCI (22) (43)
Reclassified as held for sale – 36Other 4 –
Balance, end of year $ (2,691) $ (2,187)
Amounts and expiry dates of unused tax losses and unused taxcredits as at December 31, 2018 were:
Amount Expiry Date
Unused operating losses $ 1,083 2020 – IndefiniteUnused capital losses $ 795 IndefiniteUnused investment tax
credits $ 46 2019 – 2037
The unused tax losses and credits with no expiry dates can becarried forward indefinitely.
As at December 31, 2018, the Company had $932 of tax lossesfor which it did not recognize deferred tax assets.
The Company has determined that it is probable that allrecognized deferred tax assets will be realized through acombination of future reversals of temporary differences andtaxable income.
The aggregate amount of temporary differences associatedwith investments in subsidiaries and equity-accountedinvestees, for which deferred tax liabilities have not beenrecognized, as at December 31, 2018 was $8,710 (2017 –$5,252).
NUTRIEN 2018 112 ANNUAL REPORT

IN MILLIONS OF US DOLLARS EXCEPT AS OTHERWISE NOTED
NOTE 10 DISCONTINUED OPERATIONS
Held for Sale and Discontinued Operations
Accounting Policies Accounting Estimates and Judgments
The Company classifies assets and liabilities as held for sale if it is highly probablethat the carrying value will be recovered through a sale transaction within one yearrather than through continuing use.
Discontinued operations represent a component of the Company’s business thateither has been disposed of, or is classified as held for sale, and represents aseparate major line of business or geographic area of operations or is a part of asingle coordinated plan to dispose of a separate major line of business orgeographical area of operations.
The Company’s significant policies include:
• cessation of equity accounting for associates and joint ventures at the date theinvestments were classified as held for sale;
• measurement of assets at the lower of carrying amount and fair value less coststo sell, with the exception of financial assets measured at FVTOCI;
• unrealized gains and losses on remeasurement of investments measured atFVTOCI are recorded, net of related income taxes, to OCI;
• dividends received are recorded on the consolidated statements of earnings;and
• the comparative statements of earnings and OCI are restated as if the operationhad been discontinued from the start of the comparative year.
Expected cost to sell the investmentsrequires estimation, which is based onseveral factors such as historical trends ofsimilar types of investments sold, thepercentage of investments held relative tothe total shares in circulation and the type ofthe investment.
Judgment involves determining:
• whether the highly probable standard ismet and the date when equity accountingceases; and
• if the business component for sale ordisposal meets the criteria of adiscontinued operation.
The Company’s investments in SQM, ICL and APC were classified as held for sale and as discontinued operations in December 2017,due to regulatory requirements to dispose of these investments in connection with the Merger.
As of December 31, 2018, the Company completed all required divestitures and retained no residual interests as outlined below:
For the year ended December 31, 2018 Proceeds 1Gain (Loss) on
Sale
Gain (Loss) onSale Net of
IncomeTaxes AOCI
Net Earnings andRetained Earnings
Shares in SQM $ 5,126 $ 4,278 $ 3,366 $ – $ 3,366Shares in ICL 685 (19) (19) (19) –Shares in APC 501 121 126 – 126Conda Phosphate operations 98 – – – –
Total Sale $ 6,410 $ 4,380 $ 3,473 $ (19) $ 3,492
1 Proceeds are net of commissions.
NUTRIEN 2018 113 ANNUAL REPORT
FIN
AN
CIA
L ST
ATE
MEN
TS A
ND
NO
TES

IN MILLIONS OF US DOLLARS EXCEPT AS OTHERWISE NOTED
NOTE 10 DISCONTINUED OPERATIONS CONTINUED
Supporting Information
Assets and liabilities held for sale as at December 31, 2017 werecomprised of:
2017
ASSETSInvestments in SQM and APC $ 1,146Investment in ICL 708Current tax asset 4
Assets held for sale $ 1,858
LIABILITIESPayables and accrued charges $ –Deferred income tax liabilities 36
Liabilities on assets held for sale $ 36
Net earnings from discontinued operations for the years endedDecember 31 were as follows:
2018 2017 1
Gain on disposal of investments inSQM and APC $ 4,399 $ –
Dividend income of SQM, APCand ICL 2 156 24
Share in earnings of SQM and APC 2 – 151Income tax expense 3 (951) (2)
Net earnings from discontinuedoperations $ 3,604 $ 173
1 Share of earnings, dividend income and income tax recovery pertaining tothese investments were reclassified from loss before income taxes andincome tax recovery to net earnings from discontinued operations on theconsolidated statements of earnings.
2 The Company’s investments in SQM and APC were classified asdiscontinued operations in the later part of 2017 and, as a result, equityaccounting in respect of these investments ceased.
3 For 2018, income tax (expense) recovery is comprised of $(912) relating to thedisposals of SQM shares, including the repatriation of the net proceeds, and$(39) relating to earnings from discontinued operations ($(18) for the plannedrepatriation of the remaining excess cash available in Chile, $(26) for therepatriation of dividend income received from SQM and $5 relating to APC).
Cash flows from discontinued operations for the year ended December 31 were as follows:
2018 2017
Cash provided by operating activitiesDividends from discontinued operations $ 156 $ 176Income tax related to the disposal of discontinued operations (26) –
Dividends from discontinued operations, net of tax $ 130 $ 176
Cash provided by investing activitiesProceeds from disposal of discontinued operations 1 $ 6,371 $ –Income tax related to the disposal of discontinued operations (977) –
Proceeds from disposal of discontinued operations, net of tax $ 5,394 $ –
1 Excludes a receivable of $39 to be collected in 2019.
NOTE 11 NET EARNINGS PER SHARE
Basic net earnings per share provides a measure of the interests of each ordinary common share in theCompany’s performance over the year. Diluted net earnings per share adjusts basic net earnings per sharefor the effects of all dilutive potential common shares.
2018 1 2017
WEIGHTED AVERAGE NUMBER OF COMMON SHARES 624,900,000 840,079,000Dilutive effect of stock options 2 – 3 199,000Dilutive effect of share-settled performance share units (“PSUs”) 4 – 3 38,000
Weighted average number of diluted common shares 624,900,000 840,316,000
1 The number of shares, stock options and share-settled PSUs reflect the Merger. Refer to Note 3 for details.2 Diluted effect of stock options assumes exercise of all stock options with exercise prices at or below the average market price for the year would increase the
denominator, and the denominator would be decreased by the number of shares that the Company could have repurchased if it had assumed proceedsfrom the exercise of stock options to repurchase them on the open market at the average share price for the year.
3 The diluted weighted average share calculations excluded an additional 658,000stock options and 137,000equity-settled PSUs due to their anti-dilutive effect.4 Diluted effect of PSUs assumes the denominator would be increased by the total of the additional share-settled PSUs that could be issued if vesting criteria are achieved.
NUTRIEN 2018 114 ANNUAL REPORT

IN MILLIONS OF US DOLLARS EXCEPT AS OTHERWISE NOTED
NOTE 11 NET EARNINGS PER SHARE CONTINUED
Options excluded from the calculation of diluted net earnings per share due to the option exercise prices being greaterthan the average market price of common shares were as follows:
2018 2017
Number of options excluded 5,721,656 12,304,351Performance option plan years fully excluded 2009-2015 2008-2015, 2017Stock option plan years fully excluded 2015, 2018 –
NOTE 12 CONSOLIDATED STATEMENTS OF CASH FLOWS
Accounting Policy
Highly liquid investments with a maturity of three months or less from the date of purchase are considered to be cash equivalents.
Supporting Information
For the years ended December 31 2018 2017
(Note 33)RECONCILIATION OF CASH PROVIDED BY OPERATING ACTIVITIESNet earnings $ 3,573 $ 327Adjustments to reconcile net earnings to cash provided by operating activities
Gain on sale of investments in SQM and APC (4,399) –Income tax related to the sale of the investment in SQM 977 –Depreciation and amortization 1,592 692Impairment of property, plant and equipment (Note 16) 1,809 305Share-based compensation (Note 29) 116 11Recovery of deferred income tax (290) (273)Other long-term liabilities and miscellaneous (188) 91
Subtotal of adjustments (383) 826
CHANGES IN NON-CASH OPERATING WORKING CAPITALReceivables (153) 47Inventories (887) (10)Prepaid expenses and other current assets 561 (13)Payables and accrued charges (659) 48
Subtotal of changes in non-cash operating working capital (1,138) 72
CASH PROVIDED BY OPERATING ACTIVITIES $ 2,052 $ 1,225
SUPPLEMENTAL CASH FLOWS DISCLOSURESInterest paid $ 507 $ 198Income taxes paid $ 1,155 $ 83
NUTRIEN 2018 115 ANNUAL REPORT
FIN
AN
CIA
L ST
ATE
MEN
TS A
ND
NO
TES

IN MILLIONS OF US DOLLARS EXCEPT AS OTHERWISE NOTED
NOTE 12 CONSOLIDATED STATEMENTS OF CASH FLOWS CONTINUED
The following is a summary of changes in liabilities arising from financing activities:
Short-Term Debt andCurrent Portion ofLong-Term Debt 1 Long-Term Debt Total
Balance – December 31, 2017 $ 730 $ 3,711 $ 4,441Debt acquired in Merger (Note 3) 878 4,930 5,808Cash flows 1 (927) (12) (939)Reclassifications 1,023 (1,023) –Foreign currency translation and other non-cash changes (72) (15) (87)
Balance – December 31, 2018 $ 1,632 $ 7,591 $ 9,223
Balance – December 31, 2016 $ 884 $ 3,707 $ 4,591
Cash flows 1 (159) (1) (160)Non-cash changes 5 5 10
Balance – December 31, 2017 $ 730 $ 3,711 $ 4,441
1 Cash inflows and cash outflows arising from short-term debt transactions are presented on a net basis.
NOTE 13 FINANCIAL INSTRUMENTS AND RELATED RISK MANAGEMENT
Outlined below are the Company’s financial instruments, related risk management objectives, policies and
exposure, sensitivity and monitoring strategies to financial risks.
Accounting Policies Accounting Estimates and Judgments
Financial instruments are classified and measured as follows: Judgment is required to determine whether theright to offset is legally enforceable.
Fair ValueThrough Profit or
Loss (“FVTPL”) FVTOCI
Financial Assets andLiabilities atAmortized
Cost 1
For derivatives or embedded derivatives, the mostsignificant area of judgment is whether thecontract can be settled net. This is one of thecriteria used to determine whether a contract for anonfinancial asset is considered a derivative andaccounted for as such. Judgment is also applied indetermining whether an embedded derivative isclosely related to the host contract, in which casebifurcation and separate accounting are notnecessary.
Instrument type Cash and cashequivalents andderivatives
Equityinvestmentsnot held fortrading
Receivables, short-termdebt, payables andaccrued charges, long-term debt, other long-term debt instruments
Measurement Fair value Fair value Amortized costFair value gains and losses Profit or loss OCI 2 –Interest and dividends Profit or loss Profit or
lossProfit or loss: effectiveinterest rate
Impairment of assets – – Profit or lossForeign exchange Profit or loss OCI Profit or lossTransaction costs Profit or loss OCI Included in cost of
instrument
1 Amortized cost is applied if the objective of the business model for the instrument or group ofinstruments is to hold the asset to collect the contractual cash flows and the contractual termsgive rise on specified dates to cash flows that are solely payments of principal and interest.
2 For equity investments not held for trading, the Company may make an irrevocable election atinitial recognition to recognize changes in fair value through OCI rather than profit or loss. TheCompany made this election for its investments in ICL, Sinofert and certain equity investmentsas the investments are held for strategic purposes.
NUTRIEN 2018 116 ANNUAL REPORT

IN MILLIONS OF US DOLLARS EXCEPT AS OTHERWISE NOTED
NOTE 13 FINANCIAL INSTRUMENTS AND RELATED RISK MANAGEMENT CONTINUED
Accounting Policies Accounting Estimates and Judgments
Financial instruments are recognized at trade date when the Company commits topurchase or sell the asset. Financial assets are derecognized when the rights to receivecash flows from the investments have expired or the Company has transferred them,and all the risks and rewards of ownership have been substantially transferred.
Derivatives are used to lock in commodity prices and exchange rates. For designatedand qualified cash flow hedges:• the effective portion of the change in the fair value of the derivative is accumulated
in OCI;• when the hedged forecast transaction occurs, the related gain or loss is removed
from AOCI and included in the cost of inventory;• the hedging gain or loss included in the cost of inventory is recognized in earnings
when the product containing the hedged item is sold or becomes impaired; and• the ineffective portions of hedges are recorded in net earnings in the current period.
The Company also assesses whether the natural gas derivatives used in hedgingtransactions are expected to be or were highly effective, both at the hedge’s inceptionand on an ongoing basis, in offsetting changes in fair values of hedged items. Hedgeeffectiveness related to the Company’s New York Mercantile Exchange (“NYMEX”)natural gas hedges is assessed on a prospective and retrospective basis usingregression analyses. The Company’s Alberta Energy Company (“AECO”) natural gashedges are assessed using a qualitative assessment. Potential sources ofineffectiveness are changes in timing of forecast transactions, changes in volumedelivered or changes in credit risk of the Company or the counterparty.
Financial assets and financial liabilities are offset and the net amount is presented inthe consolidated balance sheets when the Company:• currently has a legally enforceable right to offset the recognized amounts; and• intends either to settle on a net basis, or to realize the assets and settle the liabilities
simultaneously.
See Note 32 for discussion related to the policies, estimates and judgments for fairvalue measurements.
Supporting Information
Financial RisksThe Company is exposed in varying degrees to a variety offinancial risks from its use of financial instruments: credit risk,liquidity risk and market risk. The source of risk exposure andhow each is managed are outlined below.
Credit RiskThe Company’s exposure to credit risk on its cash and cashequivalents, receivables (excluding taxes) and derivativeinstrument assets is the carrying amount of each instrument onthe consolidated balance sheets.
Maximum exposure to credit risk as at December 31:
2018 2017
Cash and cash equivalents $ 2,314 $ 116Receivables 1 3,094 465Other current assets – derivatives 5 7Other non-current assets –
derivatives – 3
$ 5,413 $ 591
1 Excluding income tax receivable.
Credit risk is managed through policies applicable to the following assets:
Acceptable MinimumCounterparty Credit
RatingsExposure Thresholds
by Counterparty
Daily CounterpartySettlement Based on
Prescribed CreditThresholds
Counterpartiesto Contracts are
Investment-GradeQuality
Cash and Cash Equivalents X XNatural Gas Derivatives X X XForeign Currency Derivatives X
NUTRIEN 2018 117 ANNUAL REPORT
FIN
AN
CIA
L ST
ATE
MEN
TS A
ND
NO
TES

IN MILLIONS OF US DOLLARS EXCEPT AS OTHERWISE NOTED
NOTE 13 FINANCIAL INSTRUMENTS AND RELATED RISK MANAGEMENT CONTINUED
Credit risk on trade receivables for the Company’s Retail,Potash, Nitrogen, and Phosphate and Sulfate segments ismanaged through a credit management program whereby:• credit approval policies and procedures are in place to guide
the granting of credit to new customers as well as itscontinued extension to existing customers;
• existing customer accounts are reviewed every12-24 months, depending on the credit limit amounts;
• credit is extended to international customers based upon anevaluation of both customer and country risk;
• the credit period on sales is generally 15 and 30 days forwholesale fertilizer customers, 30 days for industrial and feedcustomers, 30-90 days for Retail customers and up to 180days for select export sales customers; and
• credit agency reports, where available, and an assessment ofother relevant information such as current financialstatements and/or credit references are used beforeassigning credit limits to customers. Those that fail to meetspecified benchmark creditworthiness may transact with theCompany on a prepayment basis or provide another form ofcredit support that the Company approves.
The Company’s trade receivables include a concentration inRetail operations in Australia for advances to the customers topurchase crop inputs and livestock. The Company mitigates riskin these receivables by obtaining security over livestock. In theCompany’s Retail operations in Western Canada, credit risk inaccounts receivable is mitigated through an agency agreementwith a Canadian financial institution wherein the financialinstitution provides credit to qualifying customers to assist infinancing their crop input purchases. Through the agencyagreement, which expires in 2021, customers have loansdirectly with the financial institution while the Company hasonly a limited recourse involvement to the extent of anindemnification of the financial institution for 52 percent of itsfuture bad debts to a maximum of 5 percent of the qualifiedcustomer loans. Outstanding customer credit with the financialinstitution was $571 at December 31, 2018, which is notrecognized in the Company’s consolidated balance sheets.Historical indemnification losses on this arrangement havebeen negligible, and the average aging of the customer loanswith the financial institution is current.
Liquidity RiskLiquidity risk arises from the Company’s general funding needsand the management of its assets, liabilities and optimal capitalstructure. The Company manages its liquidity risk to maintainsufficient liquid financial resources to fund its operations andmeet its commitments and obligations in a cost-effectivemanner. In managing its liquidity risk, the Company has accessto a range of funding options. It has established an externalborrowing policy with the following objectives:• maintain an optimal capital structure;• maintain investment-grade credit ratings that provide ease
of access to the debt capital and commercial paper markets;• maintain sufficient short-term credit availability; and• maintain long-term relationships with a sufficient number
of high-quality and diverse lenders.
The table below outlines the Company’s available creditfacilities as at December 31, 2018.
TotalAmount
Amount Outstandingand Committed
AmountAvailable
Unsecured revolvingterm credit facility $ 4,500 $ 391 $ 4,109
Uncommittedrevolving demandfacility 500 – 500
Accounts receivablesecuritizationprogram 500 – 500
Other credit facilities 520 238 282
The following maturity analysis of the Company’s financial liabilities and gross settled derivative contracts (for which the cash flowsare settled simultaneously) is based on the expected undiscounted contractual cash flows from the date of the consolidated balancesheets to the contractual maturity date.
2018
Carrying Amountof Liability as at
December 31ContractualCash Flows
Within 1Year 1 to 3 Years 3 to 5 Years Over 5 Years
Short-term debt 1 $ 629 $ 629 $ 629 $ – $ – $ –Payables and accrued charges 2 4,695 4,695 4,695 – – –Current portion of long-term
debt and Long-term debt1 8,594 12,818 1,362 1,121 1,583 8,752Derivatives 71 72 44 19 9 –
$ 13,989 $ 18,214 $ 6,730 $ 1,140 $ 1,592 $ 8,752
1 Contractual cash flows include contractual interest payments related to debt obligations. Interest rates on variable rate debt are based on prevailing rates asat December 31, 2018. Disclosures regarding offsetting of certain debt obligations are provided below.
2 Excludes non-financial liabilities and includes trade payables of approximately $500 paid in January 2019 through an arrangement whereby a supplier soldthe right to receive payment to a financial institution.
NUTRIEN 2018 118 ANNUAL REPORT

IN MILLIONS OF US DOLLARS EXCEPT AS OTHERWISE NOTED
NOTE 13 FINANCIAL INSTRUMENTS AND RELATED RISK MANAGEMENT CONTINUED
Market RiskMarket risks, where financial instrument fair values can fluctuate due to changes in market prices, include foreign exchange risk,interest rate risk and price risk (related to commodity and equity securities).
Foreign Exchange RiskTo manage foreign exchange risk (primarily related to Canadian operating and capital expenditures, certain subsidiariesdenominated in currencies other than the functional currency of an operation, taxes and dividends), the Company may enter intoforeign currency derivatives. Treasury risk management policies allow such exposures to be hedged within certain prescribed limitsfor both forecast operating and capital expenditures. The risk management policy is to manage the earnings impact that could occurfrom a reasonably possible strengthening or weakening of the US dollar. The foreign currency derivatives are not currentlydesignated as hedging instruments for accounting purposes. The Company had no material exposure to foreign exchange risk thatcould affect the Company’s net earnings as at December 31, 2018 and 2017.
Interest Rate RiskFluctuations in interest rates impact the future cash flows andfair values of various financial instruments.
Interest rate risk on debt is addressed by:• using a portfolio of fixed and floating rate instruments;• aligning current and long-term assets with demand and
fixed-term debt;• monitoring the effects of market changes in interest rates;
and• using interest rate swaps, if desired.
Related to interest rate risk on investments in marketablesecurities, the Company’s primary objectives are to:• ensure the security of principal amounts invested;• provide for an adequate degree of liquidity; and• achieve a satisfactory return.
Treasury risk management policies specify investmentparameters including eligible types of investment, maximummaturity dates, maximum exposure by counterparty andminimum credit ratings.
The Company had no material exposure to interest rate risk onits financial instruments and earnings as at December 31, 2018and 2017.
Price RiskCommodity price risk exists on the Company’s natural gasderivative instruments. Its natural gas strategy is to diversify itsforecast gas volume requirements, including a portion ofannual requirements purchased at spot market prices, a portionat fixed prices (up to 10 years) and a portion indexed to themarket price of ammonia. Its objective is to acquire a reliablesupply of natural gas feedstock and fuel on a location-adjusted,cost-competitive basis.
Price risk also exists for exchange-traded equity securitiesmeasured at FVTPL or FVTOCI. The Company had no materialexposure to price risk on its financial instruments as atDecember 31, 2018 and 2017.
Fair ValueEstimated fair values for financial instruments are designed to approximate amounts for which the instruments could be exchangedin a current arm’s-length transaction between knowledgeable, willing parties. The valuation policies and procedures for financialreporting purposes are determined by the Company’s finance department.
Financial instruments included in the consolidated balance sheets are measured either at fair value or amortized cost. The tables belowexplain the valuation methods used to determine the fair value of each financial instrument and its associated level in the fair valuehierarchy.
Financial Instruments Measured at Fair Value Fair Value Method
Cash and cash equivalents Carrying amount (approximation to fair value assumed due toshort-term nature)
Equity securities Closing bid price of the common shares as at the balance sheetdate
Debt securities Closing bid price of the debt (Level 2) as at the balance sheetdate
Foreign currency derivatives not traded in an active market Quoted forward exchange rates (Level 2) as at the balancesheet date
NUTRIEN 2018 119 ANNUAL REPORT
FIN
AN
CIA
L ST
ATE
MEN
TS A
ND
NO
TES

IN MILLIONS OF US DOLLARS EXCEPT AS OTHERWISE NOTED
NOTE 13 FINANCIAL INSTRUMENTS AND RELATED RISK MANAGEMENT CONTINUED
Financial Instruments Measured at Fair Value Fair Value Method
Foreign exchange forward contracts, swaps and options andnatural gas swaps not traded in an active market
A discounted cash flow model 1
Market comparison 2
1 Inputs included contractual cash flows based on prices for natural gas futures contracts, fixed prices and notional volumes specified by the swap contracts,the time value of money, liquidity risk, the Company’s own credit risk (related to instruments in a liability position) and counterparty credit risk (related toinstruments in an asset position). Futures contract prices used as inputs in the model were supported by prices quoted in an active market and thereforecategorized in Level 2.
2 Inputs include current market and contractual prices, forward pricing curves, quoted forward prices, basis differentials, volatility factors and interest ratesand therefore categorized in Level 2.
Financial Instruments Measured at Amortized Cost Fair Value Method
Receivables, short-term debt and payables and accrued charges Carrying amount (approximation to fair value assumed due toshort-term nature)
Long-term debt Quoted market prices (Level 1 or 2 depending on the marketliquidity of the debt)
Other long-term debt instruments Carrying amount
The following table presents the Company’s fair value hierarchy for financial assets and financial liabilities carried at fair value on arecurring basis or measured at amortized costs:
Fair Value Measurements at ReportingDates Using:
2018
Carrying Amount ofAsset (Liability) asat December 31
Quoted Prices inActive Markets
for Identical Assets(Level 1) 1
Significant OtherObservable
Inputs (Level 2) 1
Financial instruments measured at fair value on a recurring basisDerivative instrument assets $ 5 $ – $ 5Other current financial assets – marketable securities 2 97 12 85Investments at FVTOCI 3 186 186 –Derivative instrument liabilities (71) – (71)
Financial instruments measured at amortized costCash and cash equivalents $ 2,314 $ – $ 2,314Current portion of long-term debt
Senior notes and debentures 4 (995) – (1,009)Fixed and floating rate debt (8) – (8)
Long-term debtSenior notes and debentures 4 (7,569) (1,004) (6,177)Fixed and floating rate debt (22) – (22)
2017
Derivative instrument assetsNatural gas derivatives $ 9 $ – $ 9
Investments at FVTOCI 3 970 970 –Derivative instrument liabilities
Natural gas derivatives (64) – (64)Long-term debt
Senior notes 4 (3,707) (490) (3,555)
1 During the period ended December 31, 2018, there were no transfers between Level 1 and Level 2 for financial instruments measured at fair value. TheCompany’s policy is to recognize transfers at the end of the reporting period.
2 Marketable securities consist of equity and fixed income securities. The Company determines the fair value of equity securities based on the bid price ofidentical instruments in active markets. The Company values fixed income securities using quoted prices of instruments with similar terms and credit risk.
3 Investments at FVTOCI are comprised of shares in Sinofert and other (Note 21) (2017 – ICL, Sinofert and other). The Company’s investment in ICL was soldduring 2018 (Note 10).
4 Carrying amount of liability includes net unamortized debt issue costs.
NUTRIEN 2018 120 ANNUAL REPORT

IN MILLIONS OF US DOLLARS EXCEPT AS OTHERWISE NOTED
NOTE 13 FINANCIAL INSTRUMENTS AND RELATED RISK MANAGEMENT CONTINUED
2018 2017
Financial assets (liabilities) Gross Offset
NetAmounts
Presented Gross Offset
NetAmountsPresented
Derivative instrument assetsNatural gas derivatives 1 $ 31 $ (27) $ 4 $ 11 $ (2) $ 9
Derivative instrument liabilitiesNatural gas derivatives 2 (92) 26 (66) (74) 10 (64)
Other long-term debt instruments 3 (150) 150 – (150) 150 –
$ (211) $ 149 $ (62) $ (213) $ 158 $ (55)
1 Cash margin deposits of $NIL (2017 – $(1)) were held related to legally enforceable master netting arrangements.2 Cash margin deposits of $18 (2017 – $38) were placed with counterparties related to legally enforceable master netting arrangements.3 Back-to-back loan arrangements that are not subject to any financial test covenants but are subject to certain customary covenants and events of default,
including, for other long-term debt, an event of default for non-payment or other debt in excess of $25. Non-compliance with such covenants could resultin accelerated payment of the related debt. The Company was in compliance with these covenants as at December 31, 2018.
Natural gas derivatives outstanding:
2018 2017
Notional 1 Maturities
AverageContract
Price 2
Fair Valueof Assets
(Liabilities) Notional 1 Maturities
AverageContract
Price 2
Fair Valueof Assets
(Liabilities)
Natural gasNYMEX swaps 22 2019 – 2022 $4.26 $(35) 27 2018 – 2022 $4.89 $(54)AECO swaps 3 26 2019 $1.92 $(25) – – – $ –
1 In millions of British thermal units (“MMBtu”).2 US dollars per MMBtu.3 AECO swaps are only included in 2018 as a result of the Merger as described in Note 3.
NOTE 14 RECEIVABLES
Trade accounts receivable mainly consist of amounts owed to Nutrien by its customers, the largestindividual customer being the related party, Canpotex.
Accounting Policies Accounting Estimates and Judgments
Trade accounts receivable are recognized initially at fair value and subsequentlymeasured at amortized cost less provision for impairment of trade accountsreceivable. When a trade account receivable is uncollectible, it is written offagainst the provision. Subsequent recoveries of amounts previously written offare credited to the consolidated statements of earnings.
Vendors may offer various incentives to purchase products for resale. Vendorrebates and prepay discounts are accounted for as a reduction of the prices ofthe suppliers’ products. Rebates based on the amount of materials purchasedreduce cost of goods sold as inventory is sold. Rebates are offset based on salesvolumes to cost of goods sold if the rebate has been earned based on sales volumesof products.
Rebates that are probable and can be reasonably estimated are accrued.Rebates that are not probable or estimable are accrued when certain milestonesare achieved. Rebates not covered by binding agreements or publishedvendor programs are accrued when conclusive documentation of right of receiptis obtained.
Determining when amounts are deemeduncollectible requires judgment.
Estimation of rebates can be complex innature as vendor arrangements are diverse.The amount of the accrual is determined byanalyzing and reviewing historical trends toapply negotiated rates to estimated andactual purchase volumes. Estimatedamounts accrued throughout the year couldalso be impacted if actual purchase volumesdiffer from projected volumes.
NUTRIEN 2018 121 ANNUAL REPORT
FIN
AN
CIA
L ST
ATE
MEN
TS A
ND
NO
TES

IN MILLIONS OF US DOLLARS EXCEPT AS OTHERWISE NOTED
NOTE 14 RECEIVABLES CONTINUED
Supporting Information
December 31, 2018 December 31, 2017
Trade accounts – third parties $ 2,628 $ 314– Canpotex (Note 30) 208 82
Less provisions for impairment of trade accounts receivable (90) (6)
2,746 390Rebates 169 –Income taxes (Note 9) 248 24Other non-trade accounts 179 75
$ 3,342 $ 489
NOTE 15 INVENTORIES
Inventories consist of Retail inventory (crop nutrients, crop protection products, seed and merchandiseproducts) and products from the Potash, Nitrogen, and Phosphate and Sulfate segments in varying stagesof the production process.
Accounting Policies Accounting Estimates and Judgments
Inventories are valued monthly at the lower of cost and net realizable value. Costsare allocated to inventory using the weighted average cost method and include:direct acquisition costs, direct costs related to units of production and a systematicallocation of fixed and variable production overhead, as applicable.
Net realizable value is based on:
Judgment is used to allocate productionoverhead to inventories and to determinenet realizable value, including theappropriate measure and inputs of acombination of interrelated demand andsupply variables.
For products purchased for resale,finished products, intermediateproducts and raw materials For materials and supplies• selling price of the finished product
(in ordinary course of business);• less the estimated costs of completion;
and• less the estimated costs to make
the sale.
• replacement cost.
A writedown is recognized if carrying amount exceeds net realizable value and maybe reversed if the circumstances which caused it no longer exist.
Supporting InformationDecember 31,
2018December 31,
2017
Purchased for resale $ 3,545 $ –Finished products 501 260Intermediate products 218 202Raw materials 275 62Materials and supplies 378 264
$ 4,917 $ 788
Inventories expensed to cost of goods sold during the year was$13,083 (2017 – $2,791).
NUTRIEN 2018 122 ANNUAL REPORT

IN MILLIONS OF US DOLLARS EXCEPT AS OTHERWISE NOTED
NOTE 16 PROPERTY, PLANT AND EQUIPMENT
The majority of the Company’s tangible assets are the buildings, machinery and equipment used to
produce or distribute its products and render its services. These assets are depreciated over their
estimated useful lives.
Accounting Policies Accounting Estimates and Judgments
Property, plant and equipment (whichinclude certain mine development costs,pre-stripping costs and assets underconstruction) are carried at cost lessaccumulated depreciation and anyrecognized impairment loss.
Cost includes all expenditures directlyattributable to bringing the asset to thelocation and installing it in workingcondition for its intended use, including:
• additions to, and betterments andrenewals of, existing assets;
• borrowing costs incurred duringconstruction using a capitalization ratebased on the weighted average interestrate of the Company’s outstanding debt;and
• a reduction for income derived from theasset during construction.
Each component of an item of property,plant and equipment with a cost that issignificant in relation to the item’s totalcost is depreciated separately. When thecost of replacing part of an item ofproperty, plant and equipment iscapitalized, the carrying amount of thereplaced part is derecognized. The cost ofmajor inspections and overhauls iscapitalized and depreciated over the perioduntil the next major inspection or overhaul.Maintenance and repair expenditures thatdo not improve or extend productive lifeare expensed in the period incurred.
Environmental costs related to currentoperations are also capitalized if:
• property life is extended;
• capacity is increased;
• contamination from future operations ismitigated or prevented; or
• related to legal or constructive assetretirement obligations.
Judgment involves determining:
• costs, including income or expenses derived from an asset underconstruction, that are eligible for capitalization;
• timing to cease cost capitalization, generally when the asset iscapable of operating in the manner intended by management, butalso considering the circumstances and the industry in which theasset is to be operated, normally predetermined by management withreference to such factors as productive capacity;
• the appropriate level of componentization (for individual componentsfor which different depreciation methods or rates are appropriate);
• repairs and maintenance that qualify as major inspections andoverhauls; and
• useful life over which such costs should be depreciated.
Certain property, plant and equipment directly related to the Potash,Nitrogen, and Phosphate and Sulfate segments are depreciated usingthe units-of-production method based on the shorter of estimates ofreserves or service lives. Pre-stripping costs are depreciated on aunits-of-production basis over the ore mined from the mineableacreage stripped. Land is not depreciated. The remaining assets aredepreciated on a straight-line basis.
The following estimated useful lives have been applied to the majority ofproperty, plant and equipment assets as at December 31, 2018:
Useful Life Range(years)
Weighted Average UsefulLife (years) 1
Land improvements 5 to 80 35Buildings and improvements 2 to 60 38Machinery and equipment 1 to 80 251 Weighted by carrying amount as at December 31, 2018.
Estimated useful lives, expected patterns of consumption, depreciationmethod and residual values are reviewed at least annually with theeffect of any changes in estimate being accounted for on a prospectivebasis.
Uncertainties are inherent in estimating reserve quantities, particularlyas they relate to assumptions regarding future prices, the geology of theCompany’s mines, the mining methods used, and the related costsincurred to develop and mine its reserves. Changes in theseassumptions could result in material adjustments to reserve estimates,which could result in impairments or changes to depreciation expense infuture periods.
Accounting policies, estimates and judgments related to impairment of long-lived assets are described in Note 32.
NUTRIEN 2018 123 ANNUAL REPORT
FIN
AN
CIA
L ST
ATE
MEN
TS A
ND
NO
TES

IN MILLIONS OF US DOLLARS EXCEPT AS OTHERWISE NOTED
NOTE 16 PROPERTY, PLANT AND EQUIPMENT CONTINUED
Supporting Information
Land andImprovements
Buildings andImprovements
Machineryand
Equipment
MineDevelopment
CostsAssets UnderConstruction Total
Carrying amount – December 31, 2017 $ 612 $ 4,184 $ 6,744 $ 979 $ 452 $ 12,971Merger impact (Note 3) 396 2,695 4,042 – 326 7,459Other acquisitions 10 31 66 – – 107Additions 41 61 327 42 975 1,446Disposals (3) (14) (30) – – (47)Transfers 10 30 538 18 (596) –Foreign currency translation (9) (16) (15) – (7) (47)Other adjustments – 44 (6) 10 (7) 41Depreciation (33) (195) (1,032) (65) – (1,325)Impairment (6) (776) (752) (275) – (1,809)
Carrying amount – December 31, 2018 $ 1,018 $ 6,044 $ 9,882 $ 709 $ 1,143 $ 18,796
Balance as at December 31, 2018comprised of:Cost $ 1,294 $ 7,617 $ 16,806 $ 1,954 $ 1,143 $ 28,814Accumulated depreciation (276) (1,573) (6,924) (1,245) – (10,018)
Carrying amount $ 1,018 $ 6,044 $ 9,882 $ 709 $ 1,143 $ 18,796
Carrying amount – December 31, 2016 $ 618 $ 4,212 $ 6,859 $ 1,027 $ 602 $ 13,318Additions – – 9 88 528 625Transfers 63 71 521 (21) (634) –Other adjustments – – 5 15 – 20Depreciation (19) (83) (487) (98) – (687)Impairment (50) (16) (163) (32) (44) (305)
Carrying amount – December 31, 2017 $ 612 $ 4,184 $ 6,744 $ 979 $ 452 $ 12,971
Balance as at December 31, 2017comprised of:Cost $ 868 $ 4,837 $ 12,000 $ 1,985 $ 452 $ 20,142Accumulated depreciation (256) (653) (5,256) (1,006) – (7,171)
Carrying amount $ 612 $ 4,184 $ 6,744 $ 979 $ 452 $ 12,971
Depreciation of property, plant and equipment was included inthe following:
December 31,2018
December 31,2017
Freight, transportation anddistribution $ 15 $ –
Cost of goods sold 1,016 668Selling expenses 259 –General and administrative
expenses 35 –
1,325 668Depreciation recorded in
inventory 46 19
$ 1,371 $ 687
NUTRIEN 2018 124 ANNUAL REPORT
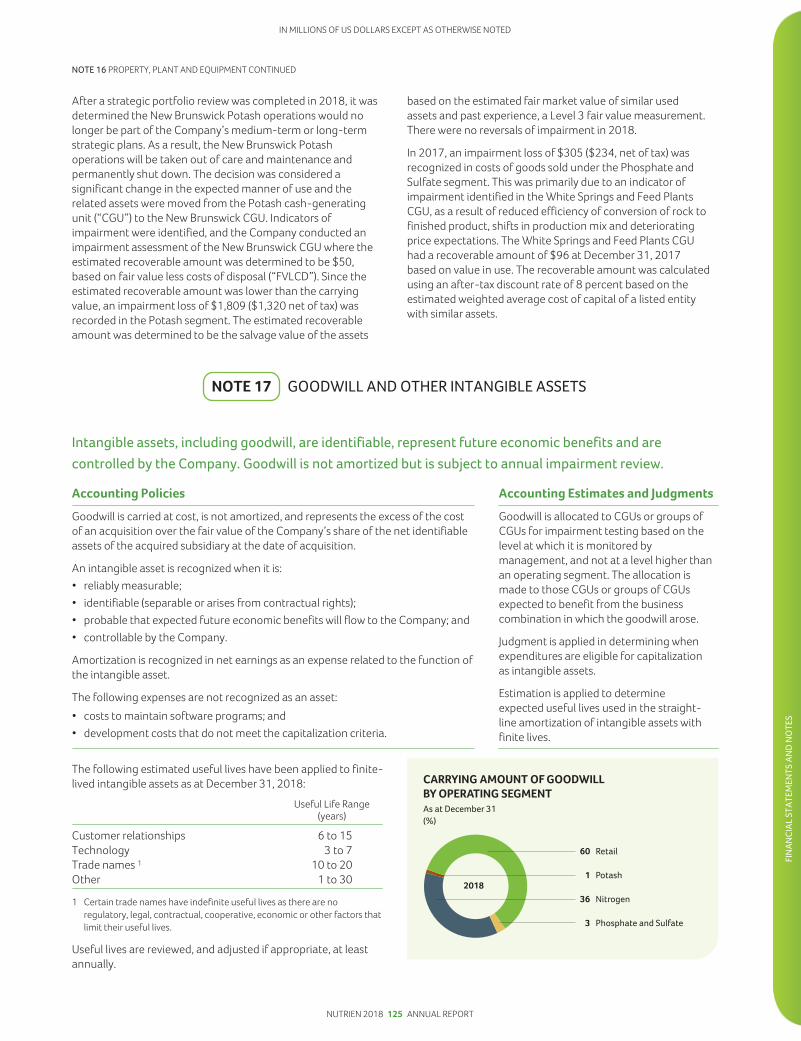
IN MILLIONS OF US DOLLARS EXCEPT AS OTHERWISE NOTED
NOTE 16 PROPERTY, PLANT AND EQUIPMENT CONTINUED
After a strategic portfolio review was completed in 2018, it wasdetermined the New Brunswick Potash operations would nolonger be part of the Company’s medium-term or long-termstrategic plans. As a result, the New Brunswick Potashoperations will be taken out of care and maintenance andpermanently shut down. The decision was considered asignificant change in the expected manner of use and therelated assets were moved from the Potash cash-generatingunit (“CGU”) to the New Brunswick CGU. Indicators ofimpairment were identified, and the Company conducted animpairment assessment of the New Brunswick CGU where theestimated recoverable amount was determined to be $50,based on fair value less costs of disposal (“FVLCD”). Since theestimated recoverable amount was lower than the carryingvalue, an impairment loss of $1,809 ($1,320 net of tax) wasrecorded in the Potash segment. The estimated recoverableamount was determined to be the salvage value of the assets
based on the estimated fair market value of similar usedassets and past experience, a Level 3 fair value measurement.There were no reversals of impairment in 2018.
In 2017, an impairment loss of $305 ($234, net of tax) wasrecognized in costs of goods sold under the Phosphate andSulfate segment. This was primarily due to an indicator ofimpairment identified in the White Springs and Feed PlantsCGU, as a result of reduced efficiency of conversion of rock tofinished product, shifts in production mix and deterioratingprice expectations. The White Springs and Feed Plants CGUhad a recoverable amount of $96 at December 31, 2017based on value in use. The recoverable amount was calculatedusing an after-tax discount rate of 8 percent based on theestimated weighted average cost of capital of a listed entitywith similar assets.
NOTE 17 GOODWILL AND OTHER INTANGIBLE ASSETS
Intangible assets, including goodwill, are identifiable, represent future economic benefits and arecontrolled by the Company. Goodwill is not amortized but is subject to annual impairment review.
Accounting Policies Accounting Estimates and Judgments
Goodwill is carried at cost, is not amortized, and represents the excess of the costof an acquisition over the fair value of the Company’s share of the net identifiableassets of the acquired subsidiary at the date of acquisition.
An intangible asset is recognized when it is:• reliably measurable;• identifiable (separable or arises from contractual rights);• probable that expected future economic benefits will flow to the Company; and• controllable by the Company.
Amortization is recognized in net earnings as an expense related to the function ofthe intangible asset.
The following expenses are not recognized as an asset:• costs to maintain software programs; and• development costs that do not meet the capitalization criteria.
Goodwill is allocated to CGUs or groups ofCGUs for impairment testing based on thelevel at which it is monitored bymanagement, and not at a level higher thanan operating segment. The allocation ismade to those CGUs or groups of CGUsexpected to benefit from the businesscombination in which the goodwill arose.
Judgment is applied in determining whenexpenditures are eligible for capitalizationas intangible assets.
Estimation is applied to determineexpected useful lives used in the straight-line amortization of intangible assets withfinite lives.
The following estimated useful lives have been applied to finite-lived intangible assets as at December 31, 2018:
Useful Life Range(years)
Customer relationships 6 to 15Technology 3 to 7Trade names 1 10 to 20Other 1 to 30
1 Certain trade names have indefinite useful lives as there are noregulatory, legal, contractual, cooperative, economic or other factors thatlimit their useful lives.
Useful lives are reviewed, and adjusted if appropriate, at leastannually.
NUTRIEN 2018 125 ANNUAL REPORT
FIN
AN
CIA
L ST
ATE
MEN
TS A
ND
NO
TES

IN MILLIONS OF US DOLLARS EXCEPT AS OTHERWISE NOTED
NOTE 17 GOODWILL AND OTHER INTANGIBLE ASSETS CONTINUED
Supporting InformationFollowing is a reconciliation of intangible assets:
GoodwillCustomer
Relationships 2 TechnologyTrade
Names OtherTotal OtherIntangibles
Carrying amount – December 31, 2017 $ 97 $ – $ – $ – $ 69 $ 69Merger impact (Note 3) 11,185 1,708 44 122 474 2,348Other acquisitions (Note 3) 197 1 – – 7 8Additions – – 79 – 19 98Disposals – – – – (27) (27)Foreign currency translation (48) (20) 1 (4) (6) (29)Amortization 1 – (135) (7) (28) (87) (257)Carrying amount – December 31, 2018 $ 11,431 $ 1,554 $ 117 $ 90 $ 449 $ 2,210Balance as at December 31, 2018
comprised of:Cost $ 11,438 $ 1,691 $ 124 $ 118 $ 586 $ 2,519Accumulated amortization (7) (137) (7) (28) (137) (309)
Carrying amount $ 11,431 $ 1,554 $ 117 $ 90 $ 449 $ 2,210Carrying amount – December 31, 2016 $ 97 $ – $ – $ – $ 83 $ 83Additions – – – – 1 1Amortization 1 – – – – (15) (15)Carrying amount – December 31, 2017 $ 97 $ – $ – $ – $ 69 $ 69Balance as at December 31, 2017
comprised of:Cost $ 104 $ – $ – $ – $ 123 $ 123Accumulated amortization (7) – – – (54) (54)
Carrying amount $ 97 $ – $ – $ – $ 69 $ 69
1 Amortization of $225 was included in selling expenses during the year ended December 31, 2018 (2017 – $NIL).2 The remaining amortization period of customer relationships at December 31, 2018, was approximately 8 years.
Goodwill Impairment Testing
Goodwill by groups of CGUs as at December 31 is as follows:
2018 2017
Retail $ 6,882 $ –Potash 154 –Nitrogen 4,097 97Phosphate and Sulfate 298 –
$ 11,431 $ 97
The Company performed its annual impairment test ongoodwill during the fourth quarter and did not identify anyimpairment.
In calculating the recoverable amount for goodwill, the Companyused the FVLCD methodology based on discounted cash flows(five-year projections and a terminal year thereafter) andincorporated assumptions an independent market participantwould apply. The Company adjusted discount rates for each groupof CGUs for the risk associated with achieving its forecasts(five-year projections) and for the currency in which the Companyexpects to generate cash flows. FVLCD is a Level 3 measurement.The Company uses its market capitalization and comparativemarket multiples to corroborate discounted cash flow results.
The key assumptions with the greatest influence on thecalculation of the recoverable amounts are the discount rates,terminal growth rates and cash flow forecasts for each group ofCGUs as derived from the Company’s strategic plan. These keyassumptions were based on historical data from internal
sources as well as industry and market trends. For each group ofCGUs, terminal growth rates used and correspondingbreakeven discount rates per annum that equate therecoverable amount to the carrying amount are as follows:
TerminalGrowth Rate
BreakevenDiscount Rate
Retail 2.5% 8.3%Potash 2.5% 13.1%Nitrogen 2.0% 12.8%Phosphate and Sulfate 2.0% 11.2%
For Retail, sensitivities of the key assumptions are as follows:
PercentagePoint Change
Changein Recoverable
Amount
Discount rate +0.1% $ (365)-0.1% 381
Terminal growth rate +0.1% $ 320-0.1% (307)
Forecasted EBITDA overforecast period
+5.0% $ 1,488-5.0% (1,477)
NUTRIEN 2018 126 ANNUAL REPORT

IN MILLIONS OF US DOLLARS EXCEPT AS OTHERWISE NOTED
NOTE 18 OTHER ASSETS
Other assets as at December 31 were comprised of:
2018 2017
Deferred income tax assets (Note 9) $ 216 $ 18Ammonia catalysts – net of accumulated amortization of $79 (2017 – $61) 81 42Long-term income tax receivable (Note 9) 36 64Accrued pension benefit asset (Note 28) 27 24Other – net of accumulated amortization of $38 (2017 – $35) 165 98
$ 525 $ 246
NOTE 19 PAYABLES AND ACCRUED CHARGES
Trade and other payables and accrued charges mainly consist of amounts owed to suppliers andprepayments made by customers planning to purchase the Company’s products for the upcominggrowing season.
Payables and accrued charges as at December 31 were comprised of:
2018 2017
Trade accounts $ 3,053 $ 255Customer prepayments 1,625 –Dividends 526 84Accrued compensation 425 98Current portion of asset retirement obligations and accrued environmental costs (Note 20) 156 72Accrued interest 105 33Current portion of share-based compensation (Note 29) 87 13Current portion of derivatives 45 29Income taxes (Note 9) 47 16Current portion of pension and other post-retirement benefits (Note 28) 13 35Other payables and other accrued charges 621 201
$ 6,703 $ 836
NUTRIEN 2018 127 ANNUAL REPORT
FIN
AN
CIA
L ST
ATE
MEN
TS A
ND
NO
TES

IN MILLIONS OF US DOLLARS EXCEPT AS OTHERWISE NOTED
NOTE 20 ASSET RETIREMENT OBLIGATIONS AND ACCRUED ENVIRONMENTAL COSTS
A provision is an estimated liability with uncertainty over the timing or amount that will be paid. The most
significant asset retirement and environmental remediation provisions relate to costs to restore potash
and phosphate sites to their original, or another specified, condition.
Accounting Policies Accounting Estimates and Judgments
Provisions are:
• recognized for present legal or constructive obligations arising from past eventswhere a future outflow of resources is probable, provided that amount can bereliably estimated;
• measured at the present value of the cash flow expected to be required to settlethe obligation; and
• reviewed at the end of each reporting period for any changes, including thediscount rate, foreign exchange rate and amount or timing of the underlyingcash flows, and adjusted against the carrying amount of the provision and anyrelated asset; otherwise, it is recognized in net earnings.
A gain or loss may be incurred upon settlement of the liability.
As a result of the Merger, the Company recognized contingent liabilities, whichrepresents additional environmental costs that are present obligations of theCompany although cash outflows of resources are not probable. These contingentliabilities are subsequently measured at the higher of the amount initiallyrecognized and the best estimate of the expenditures to be incurred.
Asset retirement obligations and accrued environmental costs include:
• reclamation and restoration costs at the Company’s potash and phosphatemining operations, including management of materials generated by miningand mineral processing, such as various mine tailings and gypsum;
• land reclamation and revegetation programs;
• decommissioning of underground and surface operating facilities;
• general cleanup activities aimed at returning the areas to an environmentallyacceptable condition; and
• post-closure care and maintenance.
Estimates for provisions take into account:
• most provisions will not be settled for anumber of years;
• environmental laws and regulations andinterpretations by regulatory authoritiescould change or circumstances affectingthe Company’s operations could change,either of which could result in significantchanges to current plans; and
• the nature, extent and timing of currentand proposed reclamation and closuretechniques in view of presentenvironmental laws and regulations.
It is reasonably possible that the ultimatecosts could change in the future and thatchanges to these estimates could have amaterial effect on the Company’s financialstatements.
The Company uses appropriate technicalresources, including outside consultants, todevelop specific site closure and post-closure plans in accordance with therequirements of the various jurisdictions inwhich it operates. Other than certain landreclamation programs, settlement of theobligations is typically correlated with minelife estimates.
The pre-tax risk-free discount rate and expected cash flow payments for asset retirement obligations and accrued environmentalcosts at December 31, 2018 were as follows:
Asset Retirement Obligations Accrued Environmental Costs
Risk-FreeRate (%) 1
Cash FlowPayments
(years) 2Risk-FreeRate (%) 1
Cash FlowPayments
(years)
Potash sites 3.64 – 5.00 52 – 430 n/a n/aPhosphate sites 1.60 – 5.43 1 – 483 2.08 – 4.27 1 – 30Other 1.22 – 6.50 1 – 49 2.05 – 4.27 1 – 30
1 Risk-free discount rates reflect current market assessments of the time value of money and the risks specific to the timing and jurisdiction of the obligation.2 Time frame in which payments are expected to principally occur from December 31, 2018, with the majority of phosphate payments taking place over the
next 80 years. Changes in years can result from changes to the mine life and/or changes in the rate of tailing volumes.
n/a = not applicable
NUTRIEN 2018 128 ANNUAL REPORT

IN MILLIONS OF US DOLLARS EXCEPT AS OTHERWISE NOTED
NOTE 20 ASSET RETIREMENT OBLIGATIONS AND ACCRUED ENVIRONMENTAL COSTS CONTINUED
Sensitivity of asset retirement obligations and accrued environmental costs to changes in the discount rate on the recorded liabilityas at December 31, 2018 was as follows:
Discount Rate
UndiscountedCash Flows
DiscountedCash Flows +0.5% -0.5%
Asset retirement obligations $ (88) $ 88Potash sites $ 675 1 $ 130Phosphate sites 1,636 1,125Other 101 40
Accrued environmental costs (12) 15Phosphate sites 321 246Other 318 288
1 Represents total undiscounted cash flows in the first year of decommissioning for operating sites and cash flows for all years for sites that were or would bepermanently shut down. For operating sites, excludes subsequent years of tailings dissolution, fine tails capping, tailings management area reclamation, postreclamation activities and monitoring, and final decommissioning, which are estimated to take an additional 90-375 years.
Supporting Information
Following is a reconciliation of asset retirement and environmental restoration obligations:
AssetRetirementObligations
AccruedEnvironmental
Costs Total
Balance – December 31, 2017 $ 702 $ 21 $ 723Merger impact 1 608 525 1,133Recorded in earnings 64 12 76Capitalized to property, plant and equipment 9 – 9Settled during the year (57) (12) (69)Foreign currency translation (31) (12) (43)
Balance – December 31, 2018 $ 1,295 $ 534 $ 1,829
Balance as at December 31, 2018 comprised of:Current liabilities
Payables and accrued charges (Note 19) $ 122 $ 34 $ 156Non-current liabilities
Asset retirement obligations and accrued environmental costs $ 1,173 $ 500 $ 1,673
1 Asset retirement obligations of $201 and accrued environmental costs of $376 represent contingent liabilities recognized as a result of the Merger. Refer toNote 3.
NUTRIEN 2018 129 ANNUAL REPORT
FIN
AN
CIA
L ST
ATE
MEN
TS A
ND
NO
TES

IN MILLIONS OF US DOLLARS EXCEPT AS OTHERWISE NOTED
NOTE 21 INVESTMENTS
Nutrien holds interests in associates and joint ventures, the most significant being Canpotex, MOPCO,Profertil and Agrichem. The Company’s most significant investment accounted for as FVTOCI is Sinofert.
Accounting Policies Accounting Estimates and Judgments
Investments in Equity-Accounted Investees
Investments in which the Company exercises significant influence (but does notcontrol) or has joint control (as joint ventures) are accounted for using the equitymethod. Significant influence is the power to participate in the financial andoperating policy decisions of the investee, commonly referred to as associates.
The Company’s significant policies include:
Investments in Equity-AccountedInvestees and Investments at FVTOCI
Judgment is necessary in determining:
• when significant influence exists; and
• if objective evidence of impairment existsfor equity-accounted investees and, if so,the amount of impairment.
Significant PolicyStatement of
Comprehensive Income Investment
Proportionate share of net earnings(loss) adjusted for any fair valueadjustments at acquisition date anddifferences in accounting policies
Net earnings (loss) Increase (decrease)
Gain (loss) on disposal Net earnings (loss) Increase (decrease)
Proportionate share of post-acquisitions movements in OCI (loss)
OCI (loss) Increase (decrease)
Impairment (loss) reversal 1 Net earnings (loss) Increase (decrease)
Dividends received – (Decrease)
1 An impairment test is performed when there is objective evidence of impairment, such assignificant adverse changes in the environment in which the equity-accounted investee operatesor a significant or prolonged decline in the fair value of the investment below its carryingamount.
Investments at FVTOCI
The fair value of investments designated as FVTOCI is recorded in the consolidatedbalance sheets, with unrealized gains and losses, net of related income taxes,recorded in AOCI.
The Company’s significant policies include:
• the cost of investments sold is based on the weighted average method; and
• realized gains and losses on these investments remain in OCI, but the cumulativebalance can be transferred to another equity reserve, such as retained earnings.
NUTRIEN 2018 130 ANNUAL REPORT

IN MILLIONS OF US DOLLARS EXCEPT AS OTHERWISE NOTED
NOTE 21 INVESTMENTS CONTINUED
Supporting Information
Equity-accounted investees and investments at FVTOCI as at December 31 were comprised of:
Proportion of OwnershipInterest and Voting Rights Held Carrying Amount
Name Principal Activity
Principal Placeof Business
and Incorporation 2018 2017 2018 2017
EQUITY-ACCOUNTEDINVESTEES
MOPCO 1 Nitrogen Producer Egypt 26% –%3 $ 236 $ –Profertil Nitrogen Producer Argentina 50% –%3 192 –Canpotex Marketing & Logistics Canada 50%2 33% – –Agrichem 4 Fertilizer Producer
& Marketer Brazil 80% –% 103 –Other associates
and joint ventures 161 30
Total equity-accounted investees $ 692 $ 30
INVESTMENTSAT FVTOCI
Sinofert 5 Fertilizer Supplier& Distributor China/Bermuda 22% 22% $ 180 $ 258
Other –% –% 6 4
Total investments at FVTOCI $ 186 $ 262
1 The Company has representation on the MOPCO Board of Directors providing significant influence over MOPCO. The Company recorded its share ofMOPCO’s earnings on a one-quarter lag, adjusted for any material transactions for the current quarter, as the financial statements of MOPCO are notavailable on the date of issuance of the Company’s financial statements. Future conditions, including those related to MOPCO in Egypt, which has beensubject to political instability and civil unrest, may restrict the Company’s ability to obtain dividends from MOPCO. The Company is also exposed to currencyrisk related to fluctuations in the Egyptian pound against the US dollar.
2 Upon closing of the Merger on January 1, 2018 as described in Note 3, the classification of the investment changed from an associate to a joint venture.3 Investments in MOPCO and Profertil were acquired as part of the Merger as described in Note 3.4 As contractually agreed, the Company has joint control with the other shareholder of Agrichem. Subsequent to 2018, the Company acquired the remaining
interest in Agrichem making it a wholly owned subsidiary that will be consolidated.5 The Company’s 22 percent ownership of Sinofert does not constitute significant influence as the Company does not have any representation on the Board
of Directors of Sinofert. The Company elected for this investment to be accounted for as FVTOCI.
Additional financial information of the Company’s proportionate interest in equity-accounted investees for the years endedDecember 31 was as follows:
Associates Joint Ventures2018 2017 2018 2017
Earnings from continuing operations and net earnings $ 24 $ – $ 16 $ 9Other comprehensive income – – – –
Total comprehensive income $ 24 $ – $ 16 $ 9
NUTRIEN 2018 131 ANNUAL REPORT
FIN
AN
CIA
L ST
ATE
MEN
TS A
ND
NO
TES

IN MILLIONS OF US DOLLARS EXCEPT AS OTHERWISE NOTED
NOTE 22 SHORT-TERM DEBT
The Company uses its $4.5 billion commercial paper program for its short-term cash requirements. Thecommercial paper program is backstopped by an unsecured revolving term credit facility. Short-termfacilities are renegotiated periodically.
Short-term debt as at December 31 was comprised of:
2018 2017
Commercial paper $ 391 $ 730Other credit facilities 1 238 –
$ 629 $ 730
1 Credit facilities are unsecured and consist of US dollar-denominated debt of $153, euro-denominated debt of $22 and debt of $63 in other currencydenominations.
The amount available under the commercial paper program islimited to the availability of backup funds under the unsecuredrevolving term credit facility. As at December 31, 2018, theCompany was authorized to issue commercial paper up to$4,500 (2017 – $2,500). The Company also had other facilitiesavailable from which it could draw short-term debt, including a$500 uncommitted revolving demand facility, a $500 accountsreceivable securitization program (limit is reduced to $300 fromJanuary to March each year), and $520 of other facilities mostlydenominated in foreign currencies.
During 2018, the legacy $75 unsecured line of credit wasreplaced with the $500 uncommitted revolving credit facility.
Principal covenants and events of default under the $4,500unsecured revolving term credit facility are described inNote 23.
Under the accounts receivable securitization program, theCompany sells certain trade receivables to a special purchasevehicle, which is a consolidated entity within the Company. TheCompany controls and retains substantially all of the risks andrewards of the receivables sold to the special purchase vehicle.Should the Company wish to draw funds under the program,the sold accounts receivable balances may be used as capacityfor collateralized borrowings from a third-party financialinstitution. At December 31, 2018, no loan drawdowns weremade from this program.
NOTE 23 LONG-TERM DEBT
The Company’s sources of borrowing for funding purposes are primarily senior notes, debenturesand long-term credit facilities. The Company has access to the capital markets through its baseshelf prospectus.
Accounting Policy
Issue costs of long-term debt obligations are capitalized to long-term obligations and are amortized to expense over the term ofthe related liability using the effective interest method.
NUTRIEN 2018 132 ANNUAL REPORT

IN MILLIONS OF US DOLLARS EXCEPT AS OTHERWISE NOTED
NOTE 23 LONG-TERM DEBT CONTINUED
Supporting Information
Long-term debt as at December 31 was comprised of:
Rate of Interest Maturity 2018 2017
Senior notes 1
Notes issued 2009 6.500% May 15, 2019 $ 500 $ 500Notes issued 2009 4.875% March 30, 2020 500 500Notes issued 2014 3.625% March 15, 2024 750 750Notes issued 2015 3.000% April 1, 2025 500 500Notes issued 2016 4.000% December 15, 2026 500 500Notes issued 2006 5.875% December 1, 2036 500 500Notes issued 2010 5.625% December 1, 2040 500 500
Debentures 1
Debentures issued 2008 6.750% January 15, 2019 500 –Debentures issued 2012 3.150% October 1, 2022 500 –Debentures issued 2013 3.500% June 1, 2023 500 –Debentures issued 2015 3.375% March 15, 2025 550 –Debentures issued 1997 7.800% February 1, 2027 125 –Debentures issued 2015 4.125% March 15, 2035 450 –Debentures issued 2006 7.125% May 23, 2036 300 –Debentures issued 2010 6.125% January 15, 2041 500 –Debentures issued 2013 4.900% June 1, 2043 500 –Debentures issued 2014 5.250% January 15, 2045 500 –
Other 30 –
8,205 3,750Add net unamortized fair value adjustments 2 444 –Less net unamortized debt issue costs (55) (43)
8,594 3,707Less current maturities (1,008) –Less current portion of net unamortized fair value adjustments 2 (1) –Add current portion of net unamortized debt issue costs 6 4
(1,003) 4
$ 7,591 $ 3,711
1 Each series of senior notes and debentures is unsecured and has no sinking fund requirements prior to maturity. Each series is redeemable and has variousprovisions that allow redemption prior to maturity, at the Company’s option, at specified prices.
2 Associated with the Merger on January 1, 2018.
During 2018, the Company exchanged an aggregate of $7,578of legacy companies’ senior notes and debentures for the sameamount of new notes issued by Nutrien (the “Nutrien Notes”).The Nutrien Notes have interest rates and maturities identicalto those of the applicable exchanged series of senior notes ordebentures. A small portion of senior notes and debentures,excluding the 7.800 percent debentures due in 2027 (the “2027debentures”), were not exchanged and remain obligations ofthe issuing subsidiary. The indentures governing theseremaining subsidiary senior notes and debentures have beenamended to remove certain covenants and events of defaultprovisions. In addition, none of the 2027 debentures were
exchanged but debt holders consented to amend the financialreporting covenant in the indenture governing the 2027debentures to allow the Company’s financial reports, ratherthan reports of the issuing subsidiary, to satisfy its financialreporting obligations thereunder.
The Nutrien Notes have various provisions that allow forredemption prior to maturity, at the Company’s option, atspecified prices. The Company is subject to certain customarycovenants including limitation on liens, merger and change ofcontrol covenants, and customary events of default. TheCompany was in compliance with these covenants as atDecember 31, 2018.
NUTRIEN 2018 133 ANNUAL REPORT
FIN
AN
CIA
L ST
ATE
MEN
TS A
ND
NO
TES
IN MILLIONS OF US DOLLARS EXCEPT AS OTHERWISE NOTED
NOTE 23 LONG-TERM DEBT CONTINUED
The debt exchange is accounted for as a modification of debt without substantial modification of terms as the financial terms of theNutrien Notes were identical to senior notes and debentures and there is no substantial difference between the present value of cashflows under the Nutrien Notes compared to the notes and debentures. Accordingly, there is no gain or loss on the exchange. Thetransaction costs from the debt exchange of $19 were recorded to the carrying amount of the long-term debt and will be amortizedover the life of the Nutrien Notes.
Details of the Company’s credit facility was as follows:2018 2017
Credit facility $4,500 – maturity April 10, 2023 1 $3,250 – maturity May 31, 2021$250 – maturity May 31, 2020
Borrowings outstanding $ NIL $ NIL
Commercial paper outstanding, backstopped by the credit facility(Note 22) $ 391 $ 730
1 Subject to extensions, at the request of Nutrien, which shall not exceed five years.
During 2018, the Company replaced the legacy $3,500 unsecured revolving credit facility and the legacy $2,500 multi-jurisdictionalunsecured revolving credit facility with a new Nutrien $4,500 unsecured revolving term credit facility (“Nutrien Credit Facility”).Principal covenants and events of default under the Nutrien Credit Facility include a debt to capital ratio of less than or equal to 0.65:1and other customary events of default and covenant provisions. Non-compliance with such covenants could result in acceleratedrepayment and/or termination of the credit facility. The Company was in compliance with all covenants as at December 31, 2018.
NOTE 24 SHARE CAPITAL
AuthorizedThe Company is authorized to issue an unlimited number of common shares without par value and an unlimited number of preferredshares. The common shares are not redeemable or convertible. The preferred shares may be issued in one or more series with rightsand conditions to be determined by the Board of Directors. No preferred shares have been issued.
IssuedNumber of
Common Shares(Pre-Merger)
Number ofCommon Shares
(Post-Merger) Consideration
Balance – December 31, 2017 (Pre-Merger) 840,223,041Conversion ratio 0.40PotashCorp shares converted to Nutrien shares 336,089,216 $ 1,806Agrium shares – December 31, 2017 (Pre-Merger) 138,165,765Conversion ratio 2.23Agrium shares converted to Nutrien shares 308,109,656 15,898Fractional shares cancelled 1 (1,399) –
Balance – January 1, 2018 (Post-Merger) 644,197,473 17,704Issued under option plans and share-settled plans 670,201 34Repurchased (36,332,197) (998)
Balance – December 31, 2018 608,535,477 $ 16,740
1 No fractional shares of Nutrien were issued. Each PotashCorp shareholder and Agrium shareholder that would otherwise have been entitled to receive afraction of a Nutrien share received, in lieu thereof, a cash amount, without interest, determined by reference to the volume weighted average trading priceof Nutrien shares on the Toronto Stock Exchange on the first five trading days on which such shares traded on such exchange following January 2, 2018.
Share Repurchase ProgramOn February 20, 2018, the Company’s Board of Directors approved a share repurchase program of up to 5 percent of the Company’soutstanding common shares over a one-year period through a normal course issuer bid. On December 14, 2018, the normal courseissuer bid was increased to permit the repurchase of up to 8 percent of the Company’s outstanding common shares. Purchases ofcommon shares commenced on February 23, 2018 and will expire on the earlier of February 22, 2019, the date on which theCompany has acquired the maximum number of common shares allowable or the date on which the Company determines not tomake any further repurchases.
NUTRIEN 2018 134 ANNUAL REPORT
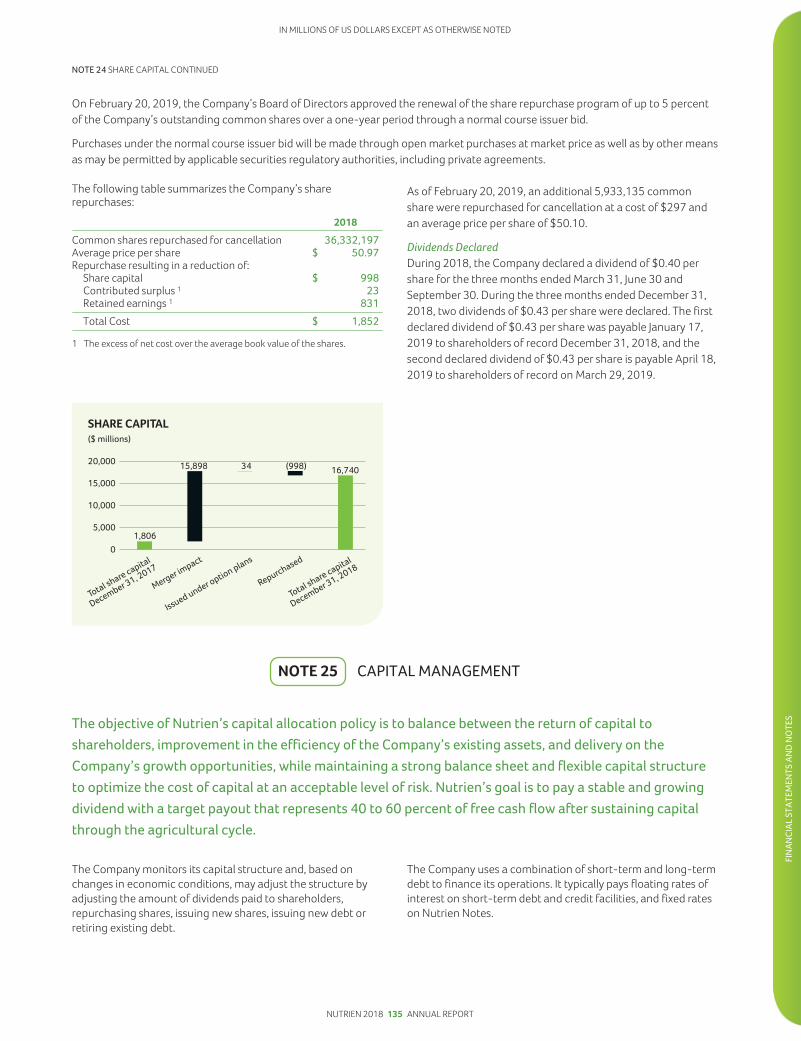
IN MILLIONS OF US DOLLARS EXCEPT AS OTHERWISE NOTED
NOTE 24 SHARE CAPITAL CONTINUED
On February 20, 2019, the Company’s Board of Directors approved the renewal of the share repurchase program of up to 5 percentof the Company’s outstanding common shares over a one-year period through a normal course issuer bid.
Purchases under the normal course issuer bid will be made through open market purchases at market price as well as by other meansas may be permitted by applicable securities regulatory authorities, including private agreements.
The following table summarizes the Company’s sharerepurchases:
2018
Common shares repurchased for cancellation 36,332,197Average price per share $ 50.97Repurchase resulting in a reduction of:
Share capital $ 998Contributed surplus 1 23Retained earnings 1 831Total Cost $ 1,852
1 The excess of net cost over the average book value of the shares.
As of February 20, 2019, an additional 5,933,135 commonshare were repurchased for cancellation at a cost of $297 andan average price per share of $50.10.
Dividends DeclaredDuring 2018, the Company declared a dividend of $0.40 pershare for the three months ended March 31, June 30 andSeptember 30. During the three months ended December 31,2018, two dividends of $0.43 per share were declared. The firstdeclared dividend of $0.43 per share was payable January 17,2019 to shareholders of record December 31, 2018, and thesecond declared dividend of $0.43 per share is payable April 18,2019 to shareholders of record on March 29, 2019.
NOTE 25 CAPITAL MANAGEMENT
The objective of Nutrien’s capital allocation policy is to balance between the return of capital toshareholders, improvement in the efficiency of the Company’s existing assets, and delivery on theCompany’s growth opportunities, while maintaining a strong balance sheet and flexible capital structureto optimize the cost of capital at an acceptable level of risk. Nutrien’s goal is to pay a stable and growingdividend with a target payout that represents 40 to 60 percent of free cash flow after sustaining capitalthrough the agricultural cycle.
The Company monitors its capital structure and, based onchanges in economic conditions, may adjust the structure byadjusting the amount of dividends paid to shareholders,repurchasing shares, issuing new shares, issuing new debt orretiring existing debt.
The Company uses a combination of short-term and long-termdebt to finance its operations. It typically pays floating rates ofinterest on short-term debt and credit facilities, and fixed rateson Nutrien Notes.
NUTRIEN 2018 135 ANNUAL REPORT
FIN
AN
CIA
L ST
ATE
MEN
TS A
ND
NO
TES

IN MILLIONS OF US DOLLARS EXCEPT AS OTHERWISE NOTED
NOTE 25 CAPITAL MANAGEMENT CONTINUED
Adjusted net debt and adjusted shareholders’ equity areincluded as components of the Company’s capital structure.The calculation of adjusted net debt, adjusted shareholders’equity and adjusted capital is set out in the following table:
2018 2017
Short-term debt $ 629 $ 730Current portion of long-term
debt 1,003 –Long-term debt 7,591 3,711
Total debt 9,223 4,441Cash and cash equivalents (2,314) (116)
Net debt 6,909 4,325Unamortized fair value
adjustments (444) –
Adjusted net debt 6,465 4,325
Total shareholders’ equity 24,425 8,303Accumulated other
comprehensive (income) loss 291 (25)
Adjusted shareholders’ equity 24,716 8,278
Adjusted capital $ 31,181 $ 12,603
The Company monitors the following ratios:
2018 2017(Note 33)
RatiosAdjusted net debt to adjusted
EBITDA 1.64 4.28Adjusted EBITDA to adjusted
finance costs 8.15 4.75Adjusted net debt to adjusted
capital 20.7% 34.3%
Other components of ratios above are calculated as follows:
2018 2017(Notes 33)
Net (loss) earnings fromcontinuing operations $ (31) $ 154
Finance costs 538 238Income taxes (93) (183)Depreciation and amortization 1,592 692
EBITDA 2,006 901Impairment of property, plant and
equipment 1,809 –Merger and related costs 170 84Share-based compensation 116 26Defined Benefit Plans Curtailment
Gain (157) –
Adjusted EBITDA $ 3,944 $ 1,011
2018 2017
Finance costs $ 538 $ 238Unwinding of discount on asset
retirement obligations (51) (17)Borrowing costs capitalized to
property, plant and equipment 12 11Interest on net defined benefit
pension and other post-retirement plan obligations (15) (19)
Adjusted finance costs $ 484 $ 213
The Company maintains a base shelf prospectus, which permitsissuance through April 2020 in Canada and the United States,of common shares, debt, and other securities up to $11,000.Issuance of securities under the base shelf prospectus requiresfiling a prospectus supplement and is subject to the availabilityof funding in capital markets. During the year endedDecember 31, 2018, the Company filed a prospectussupplement to exchange $8,175 of the senior notes ofPotashCorp and debentures of Agrium – for the Nutrien Notesissued by the Company, as discussed in Note 23.
NUTRIEN 2018 136 ANNUAL REPORT

IN MILLIONS OF US DOLLARS EXCEPT AS OTHERWISE NOTED
NOTE 26 COMMITMENTS
A commitment is an agreement that is enforceable and legally binding to make a payment in the futurefor the purchase of goods or services. These amounts are not recorded in the consolidated balance sheetssince the Company has not yet received the goods or services from the supplier. The amounts below arewhat the Company is committed to pay based on current expected contract prices.
Accounting Policies Accounting Estimates and Judgments
Leases entered into are classified as either finance or operating leases. Leases thattransfer substantially all of the risks and rewards of ownership of property to theCompany are accounted for as finance leases. They are capitalized at thecommencement of the lease at the lower of the fair value of the leased propertyand the present value of the minimum lease payments. Property acquired undera finance lease is depreciated over the shorter of the period of expected use onthe same basis as other similar property, plant and equipment and the lease term.
Leases in which a significant portion of the risks and rewards of ownershipare retained by the lessor are classified as operating leases. Rental payments underoperating leases are expensed in net earnings on a straight-line basis over theperiod of the lease.
Refer to Note 32 for details pertaining to the impact of the adoption of IFRS 16in 2019.
Judgment is required in considering anumber of factors to ensure that leases towhich the Company is party are classifiedappropriately as operating or financing. Suchfactors include whether the lease term is forthe major part of the asset’s economic lifeand whether the present value of minimumlease payments amounts to substantially allof the fair value of the leased asset.
As at December 31, 2018, substantially allof the leases to which the Company is partyhave been classified as operating leases.
Supporting Information
Lease CommitmentsThe Company has various long-term operating leaseagreements for land, buildings, port and distribution facilities,equipment, ocean-going transportation vessels, railcars,vehicles and application equipment. The majority of leaseagreements are renewable at the end of the lease period atmarket rates. Rental expenses for operating leases for the yearended December 31, 2018 were $301 (2017 – $87).
Purchase CommitmentsIn 2018, the Company entered into a new long-term naturalgas purchase agreement in Trinidad, which will commenceJanuary 1, 2019 and is set to expire December 31, 2023. Thecontract provides for prices that vary primarily with ammoniamarket prices, and annual escalating floor prices. Thecommitments included in the following table are based on floorprices and minimum purchase quantities.
Profertil has long-term gas contracts denominated in US dollarsand expiring in 2019, which account for approximately100 percent of Profertil’s gas requirements. YPF S.A., theCompany’s joint venture partner in Profertil, suppliesapproximately 70 percent of the gas under these contracts.Commitments include the Company’s proportionate share ofthis joint venture.
The Carseland facility has a power co-generation agreement,expiring on December 31, 2026, which provides the Company60 megawatt-hours of power per hour. The price for the power
is based on a fixed charge adjusted for inflation and a variablecharge based on the cost of natural gas provided to the facilityfor power generation.
Agreements for the purchase of sulfur for use in the productionof phosphoric acid provide for specified purchase quantitiesand prices based on market rates at the time of delivery.Commitments included in the following table are based onexpected contract prices.
As part of the agreement to sell the Conda Phosphateoperations (“CPO”), the Company entered into long-termstrategic supply and offtake agreements which extend to 2023.Under the terms of the supply and offtake agreements, theCompany will supply 100 percent of the ammonia requirementsof CPO and purchase 100 percent of the monoammoniumphosphate (“MAP”) product produced at CPO. The MAPproduction is estimated at 330,000 tonnes per year.
Capital CommitmentsThe Company has various long-term contractual commitmentsrelated to the acquisition of property, plant and equipment, thelatest of which expires in 2022. The commitments included inthe following table are based on expected contract prices.
Other CommitmentsOther commitments consist principally of pipeline capacity,technology service contracts, throughput and various rail andvessel freight contracts, the latest of which expires in 2026, andmineral lease commitments, the latest of which expires in 2038.
NUTRIEN 2018 137 ANNUAL REPORT
FIN
AN
CIA
L ST
ATE
MEN
TS A
ND
NO
TES

IN MILLIONS OF US DOLLARS EXCEPT AS OTHERWISE NOTED
NOTE 26 COMMITMENTS CONTINUED
Minimum future commitments under these contractual arrangements were as follows at December 31, 2018:
OperatingLeases
Long-termdebt,
Principal andEstimated
InterestPurchase
CommitmentsCapital
CommitmentsOther
Commitments Total
Within 1 year $ 216 $ 1,341 $ 1,364 $ 37 $ 114 $ 3,0721 to 3 years 316 1,112 949 18 123 2,5183 to 5 years 212 1,576 945 2 61 2,796Over 5 years 343 8,689 138 – 20 9,190
Total $ 1,087 $ 12,718 $ 3,396 $ 57 $ 318 $ 17,576
NOTE 27 GUARANTEES
Accounting Policies
Guarantees are not recognized in the consolidated balancesheets, but are disclosed and include contracts orindemnifications that contingently require the Company tomake payments to the guaranteed party based on:
• changes in an underlying;
• another entity’s failure to perform under an agreement; and
• failure of a third party to pay its indebtedness when due.
Guarantees are recorded by the Company and recognized as afinancial instrument in the consolidated balance sheets whenany of the triggering events above result in the Companybecoming primarily liable to the contract.
Supporting Information
In the normal course of business, the Company providesindemnification agreements to counterparties in transactionssuch as purchase and sale contracts, service agreements,director/officer contracts and leasing transactions. The terms ofthese indemnification agreements:
• may require the Company to compensate counterparties forcosts incurred as a result of various events, includingenvironmental liabilities and changes in (or in theinterpretation of) laws and regulations, or as a result oflitigation claims or statutory sanctions that may be sufferedby a counterparty as a consequence of the transaction;
• will vary based upon the contract, the nature of whichprevents the Company from making a reasonable estimate ofthe maximum potential amount that it could be required topay to counterparties; and
• have not historically resulted in the Company making anysignificant payments and, as at December 31, 2018, noamounts have been accrued in the consolidated financialstatements (except for accruals relating to the underlyingpotential liabilities).
Various commitments (such as railcar leases) related to acertain investee have been directly guaranteed by the Companyunder certain agreements with third parties. The Companywould be required to perform on these guarantees in the eventof default by the guaranteed parties. No material loss isanticipated by reason of such agreements and guarantees. Inrelation to significant guarantees, the Company has guaranteedthe gypsum stack capping, closure and post-closure obligationsof its wholly owned subsidiaries, PCS Phosphate Company, Inc.(“PCS Phosphate”) in White Springs, Florida and PCS NitrogenInc. (“PCS Nitrogen”) in Geismar, Louisiana, respectively,pursuant to the financial assurance regulatory requirements inthose states. In addition to the foregoing guarantees associatedwith US mining operations, the Company has guaranteed theperformance of certain remediation obligations of PCS JointVenture, Ltd., a wholly owned subsidiary, at the Lakeland,Florida and Moultrie, Georgia sites.
The Company has accrued costs associated with the retirementof long-lived tangible assets in the consolidated financialstatements to the extent that a legal or constructive liability toretire such assets exists. See Note 20 for details.
The Company expects to be able to satisfy all applicable creditsupport requirements without disrupting normal businessoperations.
NUTRIEN 2018 138 ANNUAL REPORT
IN MILLIONS OF US DOLLARS EXCEPT AS OTHERWISE NOTED
NOTE 28 PENSION AND OTHER POST-RETIREMENT BENEFITS
The Company offers pension and other post-retirement benefits to qualified employees: defined benefitpension plans; defined contribution pension plans; and health, disability, dental and life insurance (referredto as other defined benefit) plans. Substantially all employees participate in at least one of these plans.
Accounting Policies Accounting Estimates and Judgments
For employee retirement and other defined benefit plans:
• accrued liabilities are recorded net of plan assets;
• costs including current and past service costs, gains or losseson curtailments and settlements, and remeasurements areactuarially determined on a regular basis using the projectedunit credit method; and
• past service cost is recognized in net earnings at the earlier ofwhen i) a plan amendment or curtailment occurs; orii) related restructuring costs or termination benefits arerecognized.
Remeasurements, recognized directly in OCI in the period theyoccur, are comprised of actuarial gains and losses, return onplan assets (excluding amounts included in net interest) and theeffect of the asset ceiling (if applicable).
When a plan amendment occurs before a settlement, theCompany recognizes past service cost before any gain or losson settlement.
Defined contribution plan costs are recognized in net earningsfor services rendered by employees during the period.
Estimates and judgments are required to determine discountrates, health care cost trend rates, projected salary increases,retirement age, longevity and termination rates. Theseassumptions are determined by management and are reviewedannually by the Company’s independent actuaries.
The Company’s discount rate assumption is impacted by:
• the weighted average interest rate at which each pensionand other post-retirement plan liability could be effectivelysettled at the measurement date;
• country specific rates; and
• the use of a yield curve approach. 1
1 Based on the respective plans’ demographics, expected future pensionbenefits and medical claims, payments are measured and discounted todetermine the present value of the expected future cash flows. The cashflows are discounted using yields on high-quality AA-rated non-callablebonds with cash flows of similar timing where there is a deep market forsuch bonds. Where the Company does not believe there is a deep marketfor such bonds (such as for terms in excess of 10 years in Canada), thecash flows are discounted using a yield curve derived from yields onprovincial bonds rated AA or better to which a spread adjustment is addedto reflect the additional risk of corporate bonds.
The significant assumptions used to determine the benefit obligations and expense for the Company’s significant plans as at and forthe year ended December 31 were as follows:
Pension Other2018 2017 2018 2017
Assumptions used to determine the benefit obligations 1 :Discount rate, % 4.22 3.65 4.17 3.65Rate of increase in compensation levels, % 4.75 5.00 n/a n/aMedical cost trend rate – assumed, % n/a n/a 6.10 – 4.502 5.60 – 4.502
Medical cost trend rate – year reaches ultimate trend rate n/a n/a 2037 2037Mortality assumptions 3
Life expectancy at 65 for a male member currently at age 65 20.6 20.7 20.4 20.0Life expectancy at 65 for a female member currently at age 65 22.8 22.7 22.8 22.4
Average remaining service period of active employees (years) 9.7 9.0 5.1 12.2Average duration of the defined benefit obligations 4 (years) 13.7 15.7 15.1 19.0
1 The current year’s expense is determined using the assumptions that existed at the end of the previous year.2 The Company assumed a graded medical cost trend rate starting at 6.10 percent in 2018, moving to 4.50 percent by 2037 (2017 – starting at 5.60 percent,
moving to 4.50 percent by 2037).3 Based on actuarial advice in accordance with the latest available published tables, adjusted where appropriate to reflect future longevity improvements for
each country.4 Weighted average length of the underlying cash flows.
n/a = not applicable
NUTRIEN 2018 139 ANNUAL REPORT
FIN
AN
CIA
L ST
ATE
MEN
TS A
ND
NO
TES

IN MILLIONS OF US DOLLARS EXCEPT AS OTHERWISE NOTED
NOTE 28 PENSION AND OTHER POST-RETIREMENT BENEFITS CONTINUED
Of the most significant assumptions, a change in discount rates has the greatest potential impact on the Company’s pension andother post-retirement benefit plans, with sensitivity to change as follows:
2018 2017
Change inAssumption
BenefitObligations
Expense in IncomeBefore Income Taxes
BenefitObligations
Expense in IncomeBefore Income Taxes
As reported $ 1,797 $ (87) $ 1,831 $ 75
Discount rate 1.0 percentage point_ 271 24 326 201.0 percentage pointa (218) (22) (251) (18)
Supporting Information
Description of Defined Benefit Pension PlansThe Company sponsors defined benefit pension plans as follows:
Plan Type Contributions
United States • non-contributory;• guaranteed annual pension payments for life;• benefits generally depend on years of service and
compensation level in the final years leading up to age 65;• benefits available starting at age 55 at a reduced rate; and• plans provide for maximum pensionable salary and
maximum annual benefit limits.
• made to meet or exceed minimum funding requirementsof the Employee Retirement Income Security Act of 1974(“ERISA”) and associated Internal Revenue Serviceregulations and procedures.
Canada • made to meet or exceed minimum funding requirementsbased on provincial statutory requirements andassociated federal taxation rules.
Supplemental Plansin US and Canada forSenior Management
• non-contributory;• unfunded; and• supplementary pension benefits.
• provided for by charges to earnings sufficient to meetthe projected benefit obligations; and
• payments to plans are made as plan payments to retireesoccur.
The Company’s defined benefit pension plans discussed above are funded with separate funds that are legally separated from theCompany and administered through an employee benefits or management committee in each country, which is composed ofemployees of the Company. The employee benefits or management committee is required by law to act in the best interests of theplan participants and, in the US and Canada, is responsible for the governance of the plans, including setting certain policies(e.g., investment and contribution) of the funds. The current investment policy for each country’s plans generally does not includeany asset/liability matching strategies or currency hedging strategies. Plan assets held in trusts are governed by local regulations andpractice in each country, as is the nature of the relationship between the Company and the trustees and their composition.
Description of Other Post-Retirement PlansThe Company provides health care plans for certain eligibleretired employees in the US, Canada and Trinidad. Eligibility forthese benefits is generally based on a combination of age andyears of service at retirement. Certain terms of the plansinclude:• coordination with government-provided medical insurance
in each country;• certain unfunded cost-sharing features such as
co-insurance, deductibles and co-payments – benefitssubject to change;
• for certain plans, maximum lifetime benefits;• at retirement, the employee’s spouse and certain dependent
children may be eligible for coverage;• benefits are self-insured and are administered through third-
party providers; and• generally, retirees contribute towards annual cost of the plans.
The Company provides non-contributory life insurance plansfor certain retired employees who meet specific age and serviceeligibility requirements.
RisksThe defined benefit pension and other post-retirement plansexpose the Company to broadly similar actuarial risks. The mostsignificant risks as discussed below include investment risk,interest rate risk, longevity risk and salary risk. These plans arenot exposed to any other significant, unusual or specific risks.
Investment RiskA deficit will be created if plan assets underperform thediscount rate used in the defined benefit obligation valuation.To mitigate investment risk, the Company employs:• a total return on investment approach whereby a diversified
mix of equities and fixed income investments is used tomaximize long-term return for a prudent level of risk; and
• risk tolerance established through careful consideration of planliabilities, plan funded status and corporate financial condition.
Other assets such as private equity and hedge funds are not usedat this time. The Company’s policy is not to invest in commodities,precious metals, mineral rights, bullions, or collectibles.Investment risk is measured and monitored on an ongoing basisthrough quarterly investment portfolio reviews, annual liabilitymeasurements and periodic asset/liability studies.
NUTRIEN 2018 140 ANNUAL REPORT

IN MILLIONS OF US DOLLARS EXCEPT AS OTHERWISE NOTED
NOTE 28 PENSION AND OTHER POST-RETIREMENT BENEFITS CONTINUED
Interest Rate RiskA decrease in bond interest rates will increase the pensionliability; however, this is generally expected to be partially offsetby an increase in the return on the plan’s debt investments.
Longevity RiskAn increase in life expectancy of plan participants will increasethe plan’s liability.
Salary RiskAn increase in the salary of the plan’s participants will increasethe plan’s liability.
Financial Information
Movements in the pension and other post-retirement benefit assets (liabilities)
Obligation Plan Assets Net
Balance – December 31, 2017 $ (1,831) $ 1,380 $ (451)Merger impact 1 (347) 205 (142)Components of defined benefit expense recognized in earnings
Current service cost for benefits earned during the year (67) – (67)Interest (expense) income (77) 62 (15)Past service cost, including curtailment gains and settlements 2 157 – 157Foreign exchange rate changes and other 39 (27) 12
Subtotal of components of defined benefit expense recognized in earnings 52 35 87
Remeasurements of the net defined benefit liability recognized in OCIduring the yearActuarial gain arising from:
Changes in financial assumptions 210 – 210Changes in demographic assumptions 11 – 11
Loss on plan assets (excluding amounts included in net interest) – (149) (149)
Subtotal of remeasurements 221 (149) 72
Cash flowsContributions by plan participants (6) 6 –Employer contributions – 53 53Benefits paid 114 (114) –
Subtotal of cash flows 108 (55) 53
Balance – December 31, 2018 3 $ (1,797) $ 1,416 $ (381)
Balance comprised of:Non-current assets
Other assets (Note 18) $ 27Current liabilities
Payables and accrued charges (Note 19) $ (13)Non-current liabilities
Pension and other post-retirement benefit liabilities $ (395)
1 The Company acquired Agrium’s pension and other post-retirement benefit obligations, representing the fair values at the acquisition date as described inNote 3.
2 In 2018, as part of the Company’s continuous assessment of its operations, participation in certain company defined benefit pension and other post-retirement benefit plans was suspended and/or discontinued effective January 1, 2020 based on age and years of service. As a result, the Companyrecognized a Merger-related Defined Benefit Plans Curtailment Gain of $157.
3 Obligations arising from funded and unfunded pension plans are $(1,466) and $(331), respectively. Other post-retirement benefit plans have no plan assetsand are unfunded.
NUTRIEN 2018 141 ANNUAL REPORT
FIN
AN
CIA
L ST
ATE
MEN
TS A
ND
NO
TES
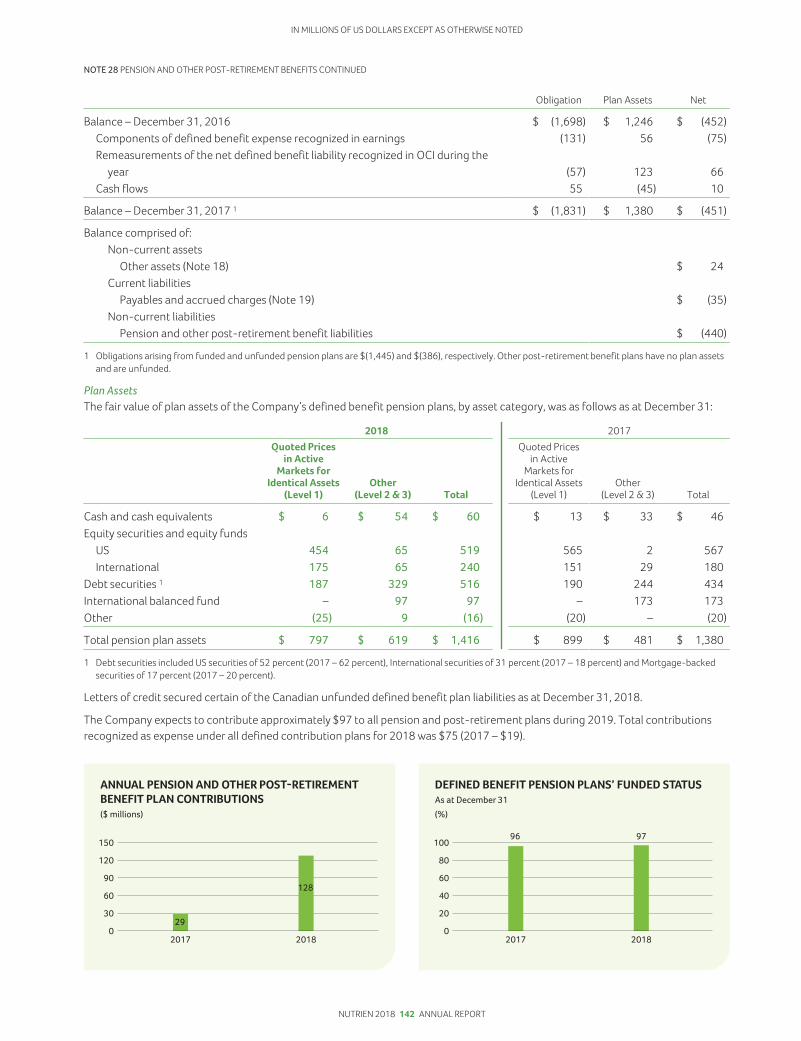
IN MILLIONS OF US DOLLARS EXCEPT AS OTHERWISE NOTED
NOTE 28 PENSION AND OTHER POST-RETIREMENT BENEFITS CONTINUED
Obligation Plan Assets Net
Balance – December 31, 2016 $ (1,698) $ 1,246 $ (452)Components of defined benefit expense recognized in earnings (131) 56 (75)Remeasurements of the net defined benefit liability recognized in OCI during the
year (57) 123 66Cash flows 55 (45) 10
Balance – December 31, 2017 1 $ (1,831) $ 1,380 $ (451)
Balance comprised of:Non-current assets
Other assets (Note 18) $ 24Current liabilities
Payables and accrued charges (Note 19) $ (35)Non-current liabilities
Pension and other post-retirement benefit liabilities $ (440)
1 Obligations arising from funded and unfunded pension plans are $(1,445) and $(386), respectively. Other post-retirement benefit plans have no plan assetsand are unfunded.
Plan AssetsThe fair value of plan assets of the Company’s defined benefit pension plans, by asset category, was as follows as at December 31:
2018 2017Quoted Prices
in ActiveMarkets for
Identical Assets(Level 1)
Other(Level 2 & 3) Total
Quoted Pricesin Active
Markets forIdentical Assets
(Level 1)Other
(Level 2 & 3) Total
Cash and cash equivalents $ 6 $ 54 $ 60 $ 13 $ 33 $ 46Equity securities and equity funds
US 454 65 519 565 2 567International 175 65 240 151 29 180
Debt securities 1 187 329 516 190 244 434International balanced fund – 97 97 – 173 173Other (25) 9 (16) (20) – (20)
Total pension plan assets $ 797 $ 619 $ 1,416 $ 899 $ 481 $ 1,380
1 Debt securities included US securities of 52 percent (2017 – 62 percent), International securities of 31 percent (2017 – 18 percent) and Mortgage-backedsecurities of 17 percent (2017 – 20 percent).
Letters of credit secured certain of the Canadian unfunded defined benefit plan liabilities as at December 31, 2018.
The Company expects to contribute approximately $97 to all pension and post-retirement plans during 2019. Total contributionsrecognized as expense under all defined contribution plans for 2018 was $75 (2017 – $19).
NUTRIEN 2018 142 ANNUAL REPORT

IN MILLIONS OF US DOLLARS EXCEPT AS OTHERWISE NOTED
NOTE 29 SHARE-BASED COMPENSATION
The Company has share-based compensation plans for eligible employees and directors as part of theirremuneration package, including Stock Options, PSUs, Restricted Share Units (“RSUs”) and Deferred ShareUnits (“DSUs”). In addition, in connection with the completion of the Merger, the Company assumed thelegacy compensation plans and outstanding awards of PotashCorp and Agrium, which include StockOptions, PSUs, RSUs and Stock Appreciation Rights (“SARs”).
Accounting Policies Accounting Estimates and Judgments
The accounting for share-based compensation plans is fair value-based.
The grant date is the date the Company and the employee have a sharedunderstanding of the terms and conditions of the arrangement, at which time theCompany confers on the employee the right to cash equity instruments, providedthe specified vesting conditions, if any, are met.
For those awards with performance conditions that determine the numberof options or units to which employees will be entitled, measurement ofcompensation cost is based on the Company’s best estimate of the outcomeof the performance conditions.
For plans settled through the issuance of equity:
• fair value for stock options is determined on grant date using the Black-Scholes-Merton option-pricing model;
• fair value for PSUs is determined on grant date by projecting the outcome ofperformance conditions;
• compensation expense is recorded over the period the plans vest(corresponding increase to contributed surplus);
• forfeitures are estimated throughout the vesting period based on pastexperience and future expectations, and adjusted upon actual vesting; and
• when exercised, the proceeds and amounts recorded in contributed surplus arerecorded in share capital.
For plans settled in cash:
• a liability is recorded based on the fair value of the awards each period;
• expense accrues from the grant date over the vesting period; and
• fluctuations in fair value of the award and related compensation expense arerecognized in the period the fluctuation occurs.
Judgment involves determining:
• the grant date; and
• the fair value of share-basedcompensation awards at the grant date.
Estimation involves determining:
• stock option-pricing model assumptionsas described in the weighted averageassumptions table below;
• forfeiture rate for options granted;
• projected outcome of performanceconditions for PSUs, including the relativeranking of the Company’s totalshareholder return, including expecteddividends, compared with a specified peergroup using a Monte Carlo simulationoption-pricing model and the outcome ofthe Company’s synergies relative to thetarget; and
• the number of dividend equivalent unitsexpected to be earned.
PSUs vest based on the achievement ofperformance conditions over a three-yearperformance cycle. Changes to vestingassumptions may change based onnon-market vesting conditions at the end ofeach reporting period.
RSUs are not subject to performanceconditions and vest at the end of the three-year vesting period.
Changes to vesting assumptions arereflected in earnings immediately forcompensation cost already recognized.
NUTRIEN 2018 143 ANNUAL REPORT
FIN
AN
CIA
L ST
ATE
MEN
TS A
ND
NO
TES

IN MILLIONS OF US DOLLARS EXCEPT AS OTHERWISE NOTED
NOTE 29 SHARE-BASED COMPENSATION CONTINUED
Supporting Information
During the year ended December 31, 2018, the Company issued stock options under its 2018 stock option plan, PSUs and RSUsunder its 2018 PSU/RSU plan and DSUs under its 2018 DSU plan, in each case to eligible employees and directors. In 2018, theoutstanding legacy share-based compensation plans of PotashCorp and Agrium were also assumed by, and settled in or withreference to shares of, Nutrien on the basis of the exchange ratios described in Note 3.
As at December 31, 2018, the Company had the following awards available to be granted under the 2018 stock option plan, the2018 PSU/RSU plan and the 2018 DSU plan:
Plan FeaturesForm of Payment Eligibility Granted Vesting Period Maximum Term Settlement
Stock Options Officers andeligible employees
Annually 25% per year overfour years
10 years Shares
PSUs 1 Officers and othereligible employees
Annually On third anniversaryof grant date
n/a Cash
RSUs 2 Eligible employees Annually On third anniversaryof grant date
n/a Cash
DSUs Non-executivedirectors
At the discretionof the Boardof Directors
Fully vest upongrant
n/a In cash on director’sdeparture fromBoard of Directors
1 PSUs granted vest based on total shareholder return over a three-year performance cycle, compared to average total shareholder return of a peer group ofcompanies over the same period. The value of each PSU granted is based on the average closing price of the Company’s common shares on the NYSE duringthe last month of the three-year cycle.
2 RSUs granted are not subject to performance conditions and vest at the end of the three-year period.n/a = not applicable
In addition, as at December 31, 2018, the Company had the following awards outstanding under one or more assumed legacy plansof PotashCorp and/or Agrium under which no new awards will be granted:
Plan FeaturesForm of Payment Vesting Period Maximum Term Settlement
Stock Options 25% per year over four years 1
On third anniversary of grant date 2
10 years Shares
PSUs 3,4 On third anniversary of grant date n/a Cash /SharesRSUs 5 On third anniversary of grant date n/a CashSARs 6 25% per year over four years 10 years Cash
1 Under the assumed legacy Agrium stock option plan.2 Under the assumed legacy PotashCorp long-term incentive plan and performance option plans.3 Under the assumed legacy PotashCorp long-term incentive plan, PSUs granted in 2017 and 2016 were comprised of three tranches, with each tranche
vesting based on achievement of a combination of performance metrics over separate performance periods ranging from one to three years and such PSUswill be settled in shares for grantees who are subject to the Company’s share ownership guidelines and in cash for all other grantees.
4 Under the assumed legacy Agrium long-term incentive plan, PSUs granted in 2017 and 2016 vest over a three-year performance cycle based on theachievement of performance metrics and will be settled in cash.
5 Under the assumed legacy Agrium long-term incentive plan, RSUs granted in 2017 and 2016 are not subject to performance conditions, vest at the end ofthe three-year period and will be settled in cash.
6 Under the assumed legacy Agrium SARs plan, effective January 1, 2015, tandem stock appreciation rights (“TSARs”) were no longer issued to eligible officersand employees. TSARs granted in Canada prior to January 1, 2015 have similar terms and vesting conditions to SARs and also provide the holder with theability to choose between (a) receiving the price of the Company’s shares on the date of exercise in excess of the exercise price of the right and (b) receivingcommon shares by paying the exercise price of the right. The Company’s past experience and future expectation is that substantially all option holders willelect to exercise their options as a SAR, surrendering their options and receiving settlement in cash. TSARs are included with the SARs disclosure.
n/a = not applicable
NUTRIEN 2018 144 ANNUAL REPORT
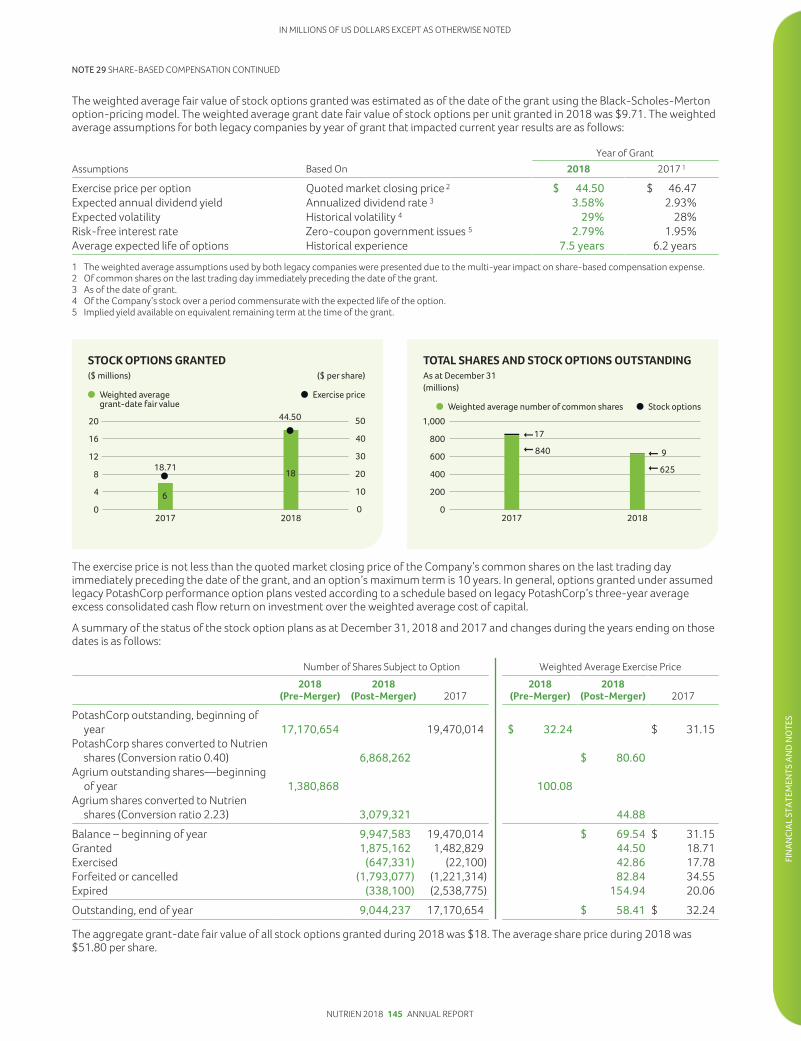
IN MILLIONS OF US DOLLARS EXCEPT AS OTHERWISE NOTED
NOTE 29 SHARE-BASED COMPENSATION CONTINUED
The weighted average fair value of stock options granted was estimated as of the date of the grant using the Black-Scholes-Mertonoption-pricing model. The weighted average grant date fair value of stock options per unit granted in 2018 was $9.71. The weightedaverage assumptions for both legacy companies by year of grant that impacted current year results are as follows:
Year of GrantAssumptions Based On 2018 2017 1
Exercise price per option Quoted market closing price 2 $ 44.50 $ 46.47Expected annual dividend yield Annualized dividend rate 3 3.58% 2.93%Expected volatility Historical volatility 4 29% 28%Risk-free interest rate Zero-coupon government issues 5 2.79% 1.95%Average expected life of options Historical experience 7.5 years 6.2 years
1 The weighted average assumptions used by both legacy companies were presented due to the multi-year impact on share-based compensation expense.2 Of common shares on the last trading day immediately preceding the date of the grant.3 As of the date of grant.4 Of the Company’s stock over a period commensurate with the expected life of the option.5 Implied yield available on equivalent remaining term at the time of the grant.
The exercise price is not less than the quoted market closing price of the Company’s common shares on the last trading dayimmediately preceding the date of the grant, and an option’s maximum term is 10 years. In general, options granted under assumedlegacy PotashCorp performance option plans vested according to a schedule based on legacy PotashCorp’s three-year averageexcess consolidated cash flow return on investment over the weighted average cost of capital.
A summary of the status of the stock option plans as at December 31, 2018 and 2017 and changes during the years ending on thosedates is as follows:
Number of Shares Subject to Option Weighted Average Exercise Price2018
(Pre-Merger)2018
(Post-Merger) 20172018
(Pre-Merger)2018
(Post-Merger) 2017
PotashCorp outstanding, beginning ofyear 17,170,654 19,470,014 $ 32.24 $ 31.15
PotashCorp shares converted to Nutrienshares (Conversion ratio 0.40) 6,868,262 $ 80.60
Agrium outstanding shares—beginningof year 1,380,868 100.08
Agrium shares converted to Nutrienshares (Conversion ratio 2.23) 3,079,321 44.88
Balance – beginning of year 9,947,583 19,470,014 $ 69.54 $ 31.15Granted 1,875,162 1,482,829 44.50 18.71Exercised (647,331) (22,100) 42.86 17.78Forfeited or cancelled (1,793,077) (1,221,314) 82.84 34.55Expired (338,100) (2,538,775) 154.94 20.06
Outstanding, end of year 9,044,237 17,170,654 $ 58.41 $ 32.24
The aggregate grant-date fair value of all stock options granted during 2018 was $18. The average share price during 2018 was$51.80 per share.
NUTRIEN 2018 145 ANNUAL REPORT
FIN
AN
CIA
L ST
ATE
MEN
TS A
ND
NO
TES

IN MILLIONS OF US DOLLARS EXCEPT AS OTHERWISE NOTED
NOTE 29 SHARE-BASED COMPENSATION CONTINUED
The following table summarizes information about stock options outstanding as at December 31, 2018 with expiry dates rangingfrom May 2019 to February 2028:
Options Outstanding Options Exercisable
Range of Exercise Prices Number
WeightedAverage
RemainingLife in Years
WeightedAverageExercise
Price Number
WeightedAverageExercise
Price
$ 37.00 to $ 41.00 2,064,621 7 $ 38.59 966,606 $ 38.22$ 44.00 to $ 52.00 3,996,110 8 46.88 1,542,489 48.75$ 64.00 to $ 75.00 834,091 4 71.57 834,091 71.57$ 80.00 to $ 88.00 959,275 4 82.30 959,275 82.30$ 91.00 to $110.00 1,040,300 4 99.04 1,040,300 99.04$130.00 to $131.00 149,840 2 130.78 149,840 130.78
9,044,237 7 $ 58.41 5,492,601 $ 68.01
Other PlansThe Company offers its 2018 DSU plan to non-employee directors, which allows each to choose to receive, in the form of DSUs, all ora percentage of the director’s fees, which would otherwise be payable in cash. Each DSU fully vests upon award but is distributed onlywhen the director has ceased to be a member of the Board. Vested units are settled in cash based on the common share price at thattime. As at December 31, 2018, the total number of DSUs held by participating directors was 456,848.
For all plans, share-based awards granted in 2018 andoutstanding as at December 31, 2018 were:
Units Granted Units Outstanding
Stock Options 1,875,162 9,044,237PSUs 619,799 1,752,281RSUs 437,474 889,005DSUs 61,062 456,848SARs – 2,388,402
Compensation expense for all employee and director share-based compensation plans was as follows:
2018 2017
Stock Options $ 23 $ 7PSUs 83 16RSUs 14 –DSUs – 3SARs (4) –
$ 116 $ 26
NOTE 30 RELATED PARTY TRANSACTIONS
The Company has a number of related parties with the most significant being Canpotex, key managementpersonnel and post-employment benefit plans.
Accounting Policies Supporting Information
A person or entity is considered a related party if it is:
• an associate or joint venture of Nutrien;
• a member of key management personnel, consisting of theCompany’s directors and executives as disclosed in theCompany’s 2018 Annual Information Form;
• a post-employment benefit plan for the benefit of Nutrienemployees; or
• a person that has significant influence over Nutrien.
Sale of GoodsThe Company sells potash from its Canadian mines for useoutside Canada and the US exclusively to Canpotex. Sales are atprevailing market prices and are settled on normal trade terms.Sales to Canpotex for the year ended December 31, 2018 were$1,657 (2017 – $988). Canpotex’s proportionate sales volumesby geographic area are shown in Note 4.
The receivable outstanding from Canpotex is shown in Note 14and arose from sale transactions described above. It isunsecured and bears no interest. There are no provisions heldagainst this receivable.
NUTRIEN 2018 146 ANNUAL REPORT
IN MILLIONS OF US DOLLARS EXCEPT AS OTHERWISE NOTED
NOTE 30 RELATED PARTY TRANSACTIONS CONTINUED
Key Management Personnel CompensationCompensation to key management personnel was comprised of:
2018 2017
Salaries and other short-term benefits $ 19 $ 14Share-based compensation 53 9Post-employment benefits 3 3Termination benefits 1 23 –
$ 98 $ 261 Primarily includes costs incurred with respect to departure of five key management personnel in 2018 following completion of the Merger.
Transactions with Post-Employment Benefit PlansDisclosures related to the Company’s post-employment benefit plans are shown in Note 28.
NOTE 31 CONTINGENCIES AND OTHER MATTERS
Contingent liabilities, which are not recognized in the consolidated financial statements but may bedisclosed, are possible obligations as a result of uncertain future events outside the control of theCompany, or present obligations not recognized because the amount cannot be sufficiently measured orpayment is not probable.
Accounting Policies Accounting Estimates and Judgments
Generally, a contingent liability arises from past events and is:
• a possible obligation whose existence will be confirmed onlyby one or more uncertain future events or non-eventsoutside the control of the Company; or
• a present obligation not recognized because it is notprobable an outflow of resources will be required to settle theobligation, or a reliable estimate of the amount cannot bemade.
Contingent liabilities are not recognized in the financialstatements but are disclosed unless the possibility of an outflowof resources embodying economic benefits is remote. Wherethe Company is jointly and severally liable for an obligation, thepart of the obligation that is expected to be met by other partiesis treated as a contingent liability.
The following judgments are required to determine theCompany’s exposure to possible losses and gains related toenvironmental matters and other various claims and lawsuitspending:
• prediction of the outcome of uncertain events (i.e., beingvirtually certain, probable, remote or undeterminable);
• determination of whether recognition or disclosure in theconsolidated financial statements is required; and
• estimation of potential financial effects.
Where no amounts are recognized, such amounts arecontingent and disclosure may be appropriate. While theamount disclosed in the consolidated financial statements maynot be material, the potential for large liabilities exists and,therefore, these estimates could have a material impact on theCompany’s consolidated financial statements.
Supporting Information
CanpotexNutrien is a shareholder in Canpotex, which markets Canadianpotash outside of Canada and the United States. Should anyoperating losses or other liabilities be incurred by Canpotex, theshareholders have contractually agreed to reimburse it for suchlosses or liabilities in proportion to each shareholder’sproductive capacity. Through December 31, 2018, there wereno such operating losses or other liabilities.
Mining RiskThe risk of underground water inflows and other undergroundrisks is insured on a limited basis, subject to insurance marketavailability.
Legal and Other MattersThe Company is engaged in ongoing site assessment and/orremediation activities at a number of facilities and sites, andanticipated costs associated with these matters are added toaccrued environmental costs in the manner described in Note 20.
NUTRIEN 2018 147 ANNUAL REPORT
FIN
AN
CIA
L ST
ATE
MEN
TS A
ND
NO
TES

IN MILLIONS OF US DOLLARS EXCEPT AS OTHERWISE NOTED
NOTE 31 CONTINGENCIES AND OTHER MATTERS CONTINUED
Environmental RemediationThe Company has established provisions for environmentalsite assessment and/or remediation matters to the extent thatexpenses associated with those matters are considered likelyto be incurred by the Company. Except for the uncertaintiesdescribed below, the Company does not believe that itsfuture obligations with respect to these matters are reasonablylikely to have a material adverse effect on its consolidatedfinancial statements.
Legal matters with significant uncertainties include thefollowing:
• The US Environmental Protection Agency (“EPA”) has anongoing enforcement initiative directed at the phosphateindustry related to the scope of an exemption for mineralprocessing wastes under the US Resource Conservation andRecovery Act (“RCRA”). This initiative affects the CondaPhosphate plant previously owned by Nu-West Industries, Inc.(“Nu-West”), a wholly owned subsidiary of Agrium, and theNutrien phosphoric acid facilities in Aurora, North Carolina;Geismar, Louisiana; and White Springs, Florida. All of thesefacilities received US EPA notices of violation (“NOVs”) thatremain outstanding for alleged violations of RCRA and variousother environmental laws. Notwithstanding the sale of theConda Phosphate operations in January of 2018, Nu-Westremains responsible for environmental liabilities attributableto its historic activities and for resolution of the NOVs. All ofthe facilities have been and continue to be involved inongoing discussions with the US EPA, the US Department ofJustice (“DOJ”) and the related state agencies to resolve thesematters. Due to the nature of the allegations, Nutrien isuncertain as to how the matters will be resolved. Based onsettlements with other members of the phosphate industry,Nutrien expects that a resolution could involve any or all ofthe following: 1) penalties, which Nutrien currently believeswill not be material; 2) modification of certain operatingpractices; 3) capital improvement projects; 4) providingfinancial assurance for the future closure, maintenance andmonitoring costs for the phosphogypsum stack system; and,5) addressing findings resulting from RCRA section 3013site investigations undertaken voluntarily in response tothe NOVs.
• In August 2015, the US EPA finalized amendments to thehazardous air pollutant emission standards for phosphoricacid manufacturing and phosphate fertilizer production(“Final Rule”). Required emissions testing at the Company’sAurora facility in 2016 indicated alleged exceedances of themercury emission limits that were established by the FinalRule. The Company has communicated with the relevant
agencies about this issue and petitioned the US EPA toreconsider the mercury emission limits. The facility alsoentered into an agreed order with the North CarolinaDepartment of Environmental Quality in November 2016 toresolve the alleged mercury exceedances and provide a planand schedule for evaluating alternative compliance strategies.Given the pending legal issues and the Company’s evaluationof alternative compliance strategies, the resulting cost ofcompliance with the various provisions of the Final Rulecannot be predicted with reasonable certainty at this time.
• The Company operates in countries which are parties to theParis Agreement adopted in December 2015 pursuant to theUnited Nations Framework Convention on Climate Change.Each country that is a party to the Paris Agreement submittedan Intended Nationally Determined Contribution (“INDC”)toward the control of greenhouse gas emissions. The impactson the Company’s operations of these INDCs and other nationaland local efforts to limit or tax greenhouse gas emissionscannot be determined with any certainty at this time.
In addition, various other claims and lawsuits are pendingagainst the Company in the ordinary course of business.While it is not possible to determine the ultimate outcome ofsuch actions at this time, and inherent uncertainties exist inpredicting such outcomes, it is the Company’s belief thatthe ultimate resolution of such actions is not reasonablylikely to have a material adverse effect on its consolidatedfinancial statements.
The breadth of the Company’s operations and the globalcomplexity of tax regulations require assessments ofuncertainties and judgments in estimating the taxes it willultimately pay. The final taxes paid are dependent upon manyfactors, including negotiations with taxing authorities in variousjurisdictions, outcomes of tax litigation and resolution ofdisputes arising from federal, provincial, state and local taxaudits. The resolution of these uncertainties and the associatedfinal taxes may result in adjustments to the Company’stax assets and tax liabilities.
The Company owns facilities that have been eitherpermanently or indefinitely shut down. It expects to incurnominal annual expenditures for site security and othermaintenance costs at certain of these facilities. Should thefacilities be dismantled, certain other shutdown-relatedcosts may be incurred. Such costs are not expected to have amaterial adverse effect on the Company’s consolidatedfinancial statements and would be recognized and recordedin the period in which they are incurred.
NUTRIEN 2018 148 ANNUAL REPORT

IN MILLIONS OF US DOLLARS EXCEPT AS OTHERWISE NOTED
NOTE 32 ACCOUNTING POLICIES, ESTIMATES AND JUDGMENTS
Accounting Policies, Estimates and JudgmentsThe following table discusses the significant accounting policies, estimates, judgments and assumptions, in addition to those disclosedelsewhere in these consolidated financial statements, that the Company has adopted and made and how they affect the amountsreported in the consolidated financial statements. Certain of the Company’s policies involve accounting estimates and judgmentsbecause they require the Company to make subjective or complex judgments about matters that are inherently uncertain and becauseof the likelihood that materially different amounts could be reported under different conditions or using different assumptions.
Topic Accounting Policies Accounting Estimates and Judgments
Principles ofConsolidation
These consolidated financial statements include the accounts of theCompany and entities controlled by it (its subsidiaries). Control is achievedby having each of:
• power over the investee to direct the relevant activities of the investee;• exposure, or rights, to variable returns from involvement with the
investee; and• the ability for the Company to use its power over the investee to affect
the amount of the Company’s returns.
Judgment involves:
• assessing control, including ifthe Company has the power todirect the relevant activities ofthe investee; and
• determining the relevantactivities and which partycontrols them.
The existence and effect of potential voting rights that are currentlyexercisable or convertible are considered when assessing whether theCompany controls another entity.
Subsidiaries are fully consolidated from the date on which control istransferred to the Company. They are deconsolidated from the date thatcontrol ceases.
Consideration is given to:
• voting rights;• the relative size and dispersion
of the voting rights held by othershareholders;
• the extent of participation bythose shareholders in appointingkey management personnel orboard members;
• the right to direct the investee toenter into transactions for theCompany’s benefit; and
• the exposure, or rights, tovariability of returns from theCompany’s involvement with theinvestee.
Principal (wholly owned)Operating Subsidiaries: Location Principal Activity
• Potash Corporation ofSaskatchewan Inc.
Canada Mining and/or processing ofcrop nutrient products andcorporate functions
• Agrium Inc. Canada Manufacturer and distributorof crop nutrients andcorporate functions
• Agrium Canada Partnership Canada Manufacturer and distributorof crop nutrients
• Agrium Potash Ltd. Canada Manufacturer and distributorof crop nutrients
• Agrium U.S. Inc. United States Manufacturer and distributorof crop nutrients
• Nutrien Ag Solutions ArgentinaS.A. (Argentina)
Argentina Crop input retailer
• Cominco Fertilizer Partnership United States Manufacturer and distributorof crop nutrients
• Nutrien Ag Solutions, Inc. United States Crop input retailer• Nutrien Ag Solutions (Canada)
Inc.Canada Crop input retailer
• Landmark Operations Ltd. Australia Crop input retailer• Loveland Products, Inc. United States Crop input developer and
retailer• PCS Sales (Canada), Inc. Canada Marketing and sales of the
Company’s products• PCS Sales (USA), Inc. United States Marketing and sales of the
Company’s products• PCS Phosphate Company, Inc.
– PCS Purified PhosphatesUnited States Mining and/or processing of
phosphate products in thestates of North Carolina,Illinois, Missouri and Nebraska
NUTRIEN 2018 149 ANNUAL REPORT
FIN
AN
CIA
L ST
ATE
MEN
TS A
ND
NO
TES

IN MILLIONS OF US DOLLARS EXCEPT AS OTHERWISE NOTED
Topic Accounting Policies Accounting Estimates and Judgments
• PCS Nitrogen Fertilizer, L.P. United States Production of nitrogenproducts in the states ofGeorgia and Louisiana, and ofphosphate products in thestate of Louisiana
• PCS Nitrogen Ohio, L.P. United States Production of nitrogenproducts in the state of Ohio
• PCS Nitrogen Trinidad Limited Trinidad Production of nitrogenproducts in Trinidad
• White Springs AgriculturalChemicals, Inc.(“White Springs”)
United States Mining and processing ofphosphate products in thestate of Florida
Intercompany balances and transactions are eliminated on consolidation.
Long-Lived AssetImpairment
At the end of each reporting period, the Company reviews conditions todetermine whether there is any indication that an impairment exists thatcould potentially impact the carrying amounts of both its long-lived assetsto be held and used and its identifiable intangible assets with finite lives.When such indicators exist, impairment testing is performed. Regardless,goodwill is tested at least annually (in the fourth quarter).
To assess impairment, assets are grouped at the smallest levels for whichthere are separately identifiable cash inflows that are largely independentof the cash inflows from other assets or groups of assets (this can be at theasset or CGU level).
Where impairment indicators exist for the asset or CGU:
• the recoverable amount is estimated (the higher of FVLCD and valuein use);
• to assess value in use, the estimated future cash flows are discounted totheir present value (using a pre-tax discount rate that reflects currentmarket assessments of the time value of money and the risks specific tothe asset or CGU for which the estimates of future cash flows have notbeen adjusted);
• the impairment loss is the amount by which the carrying amountexceeds its recoverable amount; and
• the impairment loss is allocated first to reduce the carrying amountof any related goodwill and then pro rata to each asset in the unit (onthe basis of the carrying amount).
Non-financial assets, other than goodwill, that previously suffered animpairment loss are reviewed at each reporting date for possible reversalof the impairment.
Judgment involves:
• identifying the appropriate assetor CGU;
• determining the appropriatediscount rate for assessing valuein use; and
• making assumptions aboutfuture sales, margins and marketconditions over the long-termlife of the assets or CGUs.
The Company cannot predict if anevent that triggers impairment willoccur, when it will occur or how itwill affect reported asset amounts.Asset impairment amountspreviously recorded could beaffected if different assumptionswere used or if market andother conditions change. Suchchanges could result in non-cashcharges materially affecting theCompany’s consolidated financialstatements.
Impairments were recognizedduring 2018 and 2017 as shown inNote 16.
NUTRIEN 2018 150 ANNUAL REPORT
NOTE 32 ACCOUNTING POLICIES, ESTIMATES AND JUDGMENTS CONTINUED

IN MILLIONS OF US DOLLARS EXCEPT AS OTHERWISE NOTED
NOTE 32 ACCOUNTING POLICIES, ESTIMATES AND JUDGMENTS CONTINUED
Topic Accounting Policies Accounting Estimates and Judgments
Fair ValueMeasurements
Fair value is the price that would be received to sell an asset or paidto transfer a liability in an orderly transaction between marketparticipants at the measurement date, regardless of whether thatprice is directly observable or estimated using another valuationtechnique.
Fair value measurements are categorized into levels based on thedegree to which inputs are observable and their significance:
Fair value estimates:
• are at a point-in-time and may changein subsequent reporting periods due tomarket conditions or other factors;
• can be determined using multiplemethods, which can cause values (or arange of reasonable values) to differ;and
• may require assumptions about costs/prices over time, discount and inflationrates, defaults and other relevantvariables.
Determination of the level hierarchy isbased on the Company’s assessment ofthe lowest level input that is significant tothe fair value measurement and is subjectto estimation and judgment.
Level 1 Level 2 Level 3
Unadjusted quotedprices (in activemarkets accessibleat the measurementdate for identicalassets or liabilities).
Quoted prices (inmarkets that are notactive or based oninputs that areobservable forsubstantially the fullterm of the asset orliability).
Prices or valuationtechniques thatrequire inputs thatare bothunobservable andsignificant to theoverallmeasurement.
RestructuringCharges
Plant shutdowns, sales of business units or other corporaterestructurings may trigger restructuring costs. Incremental costsfor employee termination, contract termination and other exitcosts are recognized as a liability and an expense when:• a detailed formal plan for restructuring has been demonstrably
committed to;• withdrawal is without realistic possibility; and• a reliable estimate can be made.
Restructuring activities are complex, cantake several months to complete andusually involve reassessing estimatesthroughout the process.
Foreign CurrencyTransactions
Items included in the consolidated financial statements of theCompany and each of its subsidiaries are measured using thecurrency of the primary economic environment in which theindividual entity operates (“the functional currency”).
Foreign exchange gains and losses resulting from the settlementof foreign currency transactions, and from the translation atperiod-end exchange rates of monetary assets and liabilitiesdenominated in foreign currencies, are recognized and presentedin the consolidated statements of earnings within other expenses,as applicable, in the period in which they arise.
Translation differences from non-monetary assets and liabilitiescarried at fair value are recognized as part of changes in fair value.Translation differences on non-monetary financial assets such asinvestments in equity securities classified as FVTOCI are includedin OCI. Non-monetary assets measured at historical cost aretranslated at the average monthly exchange rate prevailing at thetime of the transaction, unless the exchange rate in effect on thedate that the transaction occurred is available and it is apparentthat such rate is a more suitable measurement.
The consolidated financial statementsare presented in US dollars, which wasdetermined to be the functional currencyof the Company and the majority ofits subsidiaries.
NUTRIEN 2018 151 ANNUAL REPORT
FIN
AN
CIA
L ST
ATE
MEN
TS A
ND
NO
TES

IN MILLIONS OF US DOLLARS EXCEPT AS OTHERWISE NOTED
NOTE 32 ACCOUNTING POLICIES, ESTIMATES AND JUDGMENTS CONTINUED
Standards, Amendments and Interpretations Effective and Applied
The International Accounting Standards Board (“IASB”) and IFRS Interpretations Committee (“IFRIC”) have issued certain standardsand amendments or interpretations to existing standards that were effective and applied by the Company. The standards disclosedbelow had a material impact or disclosure impact to the Company’s consolidated financial statements.
Standard Description Impact
IFRS 15, Revenuefrom ContractsWith Customers
Issued to provide guidance on therecognition of revenue from contractswith customers, including multiple-element arrangements andtransactions not previously addressedcomprehensively, and enhancedisclosures about revenue.
Adopted using the modified retrospective method effective January 1,2018, with required disclosures included in Note 4. No cumulativeadjustment is required to the opening balance of retained earnings.
The Company elected to use the practical expedient related to theadjustment of the promised consideration for the effects of asignificant financing component as the expected period betweenwhen control over a promised good or service is transferred and whenthe customer pays for that good or service is less than 12 months.
The Company sells certain retail products to end-customers with aright of return. Therefore, a refund liability and a right to the returnedgoods (included in inventory) are now recognized separately for theproducts expected to be returned.
IFRS 9, FinancialInstruments
Issued to replace InternationalAccounting Standards (“IAS”) 39,providing guidance on theclassification, measurement anddisclosure of financial instruments andintroducing a new hedge accountingmodel.
On adoption of IFRS 9, in accordance with transitional provisions, theCompany has not restated prior periods but has reclassified thefinancial assets held at January 1, 2018, retrospectively, based on thenew classification requirements and the characteristics of eachfinancial instrument at the transition date. For financial liabilities, IFRS9 retains most of the IAS 39 requirements. The Company did notdesignate any financial liabilities at fair value through profit or loss;therefore, the adoption of IFRS 9 did not impact the Company’saccounting policies for financial liabilities. Refer to Note 13 for details.
In addition, there was no change in the classification of the derivativeinstruments. The Company adopted the new general hedgeaccounting model under IFRS 9. This requires the Company to ensurethat the hedge accounting relationships are aligned with its riskmanagement objective and strategy and to apply a more qualitativeand forward-looking approach to assess hedge effectiveness. TheCompany also reclassified realized cash flow hedges as a basisadjustment to finished goods inventory, recorded directly throughaccumulated other comprehensive income (net of income taxes).
Financial Instrument Category under IAS 39 Category under IFRS 9
Financial assetsCash and cash equivalents FVTPL FVTPLReceivables Loans and receivables Amortized costDerivatives FVTPL FVTPLDerivatives designated as hedges FV – hedging
instrumentFV – hedginginstrument
Prepaid expenses and other current assets – marketable securities FVTPL FVTPLInvestments – equity securities Available-for-sale FVTOCIInvestments – equity securities FVTPL FVTPL
Financial liabilitiesShort-term and long-term debt Amortized cost Amortized costPayables and accrued charges, excluding derivatives Amortized cost Amortized cost
IFRS 9 replaces the incurred loss model in IAS 39 with an expected credit loss model. This applies to financial assets measured atamortized cost. Under IFRS 9, credit losses are recognized earlier than under IAS 39. This change did not have a material impact tothe Company’s receivables.
NUTRIEN 2018 152 ANNUAL REPORT

IN MILLIONS OF US DOLLARS EXCEPT AS OTHERWISE NOTED
NOTE 32 ACCOUNTING POLICIES, ESTIMATES AND JUDGMENTS CONTINUED
Standards, Amendments and Interpretations Not Yet Effective and Not Applied
The IASB and IFRIC have issued the following standards, amendments or interpretations to existing standards that were not yeteffective and not applied as at December 31, 2018.
Standard Description Expected Impact Effective Date 1
IFRS 16, Leases Issued to supersede IAS 17 and relatedstandards, this standard requires theCompany to apply a new model forlessee accounting under which allleases will be recorded as aright-of-use (“ROU”) asset on thebalance sheet and a correspondinglease liability. Lease costs will berecognized in the income statementover the lease term as depreciation ofthe ROU asset and finance charges onthe lease liability.
ROU assets represent the right to usean asset for the lease term, and leaseliabilities represent the obligation tomake lease payments arising from alease. ROU assets and liabilities arerecognized at commencement of alease based on the present value oflease payments over the lease term.The standard requires capitalizing thelease payments and expected residualvalue guarantees over the initialnon-cancellable period plus periodscovered by renewal, purchase andtermination options where such arereasonably certain of exercise. Thestandard requires capitalization usingthe interest rate implicit in the lease atcommencement, or if the implicit rateis not available, an incrementalborrowing rate, adjusted for term,security, asset value, and theborrower’s economic environment.
The Company has substantially completed itsimplementation, including review of contracts,aggregation of data to support the evaluationof the accounting impacts of applying the newstandard and assessment of the need forchanges to systems and processes, includinginternal controls. Adoption will have a materialeffect on the consolidated financial statements,resulting in increases in assets and liabilities in asubcategory of property, plant and equipment,ROU, and a new subcategory of long-term debt“Lease Liabilities”.
Compared with the existing accounting foroperating leases, the classification and timing ofexpenses will change, causing a) reclassificationof current operating lease payments out of costof goods sold and expenses to depreciation andfinance costs; and b) reclassification from cashflow from operating activities to cash flow fromfinancing activities. Many commonly usedfinancial ratios and performance metrics ascurrently defined will also change. The Companydoes not expect a material impact toconsolidated net earnings.
The Company’s assessment will not result inrecognition of any material non-leasecomponents, additional lease components,residual value guarantees or purchase ortermination options. The Company’s assessmentincluded: a) assessment of non-lease contractsfor terms that resulted in control by the Companyof an identified asset with a right to obtainsubstantially all the identified asset’s economicbenefits; and b) assessment of all relevant factsand circumstances in determining the lease term,including whether the Company was reasonablycertain to exercise renewal or purchase optionsbased on market and other business conditions,and costs and impacts of renewing.
The adoption will result in an increase toproperty, plant and equipment and long-termdebt of approximately $1 billion at January 1,2019. Impact on future earnings is notexpected to be significant.
January 1, 2019,applied using themodifiedretrospectivemethod (which in theCompany’s caseresults in prospectiveapplication)measuring the ROUasset equal to thelease liability, andusing the Company’sincrementalborrowing rate todetermine thepresent value offuture leasepayments. TheCompany has chosento apply practicalexpedients, includingrecognitionexemptions forshort-term and low-value leases, and tograndfather the leasedefinition ontransition.
1 Effective date for annual periods beginning on or after the stated date.
The following amended standards and interpretations are notexpected to have a material impact on the Company’sconsolidated financial statements:
The following amended standards and interpretations arebeing reviewed by the Company to determine the potentialimpact on the Company’s consolidated financial statements:
• IFRIC 23, Uncertainty Over Income Tax Treatments • Conceptual Framework for Financial Reporting
• Amendments to IAS 28, Long-term Interests in Associates andJoint Ventures
• IFRS 17, Insurance Contracts
• Amendments to IAS 1 and IAS 8, Definition of Material• Amendments to IAS 19, Employee Benefits
• Amendments to IFRS 3, Business Combinations
• Amendments to IAS 12, Income Taxes
• Amendments to IAS 23, Borrowing Costs
NUTRIEN 2018 153 ANNUAL REPORT
FIN
AN
CIA
L ST
ATE
MEN
TS A
ND
NO
TES

IN MILLIONS OF US DOLLARS EXCEPT AS OTHERWISE NOTED
NOTE 33 COMPARATIVE FIGURES
As described in Note 1, the comparative figures are PotashCorp only. To conform with Nutrien’s new methodof presentation, comparative figures were reclassified and additional 2017 information was provided, withno impact to net earnings, total assets and liabilities, and cash provided by operating activities.
The following additional information is retrospectively included in the 2017 comparatives to conform with current year presentation:• Note 4 Segment Information, the first table on page 106 contains an analysis by segment of selling expenses, general and
administrative expenses, other operating expenses and EBITDA.• Note 25 Capital Management includes a line item for EBITDA and adjusted EBITDA was revised to conform with Nutrien’s definition.Refer to Notes 4, 5, 6, 7, 12 and 25 for further information specific to this additional information and the reclassifications withinthe tables.
Consolidated Statement of EarningsFor the Year Ended December 31, 2017
PreviouslyReported
ReclassificationAmounts
Reported afterReclassifications
Cost of goods sold $ (3,335) $ 19 $ (3,316)Selling and
administrativeexpenses (214) 214 –
Selling expenses – (29) (29)General and
administrativeexpenses – (185) (185)
Provincial mining andother taxes (151) 5 (146)
Merger and relatedcosts (84) 84 –
Other expenses (17) (108) (125)$ (3,801) $ – $ (3,801)
Consolidated Statement of Comprehensive IncomeFor the Year Ended December 31, 2017
PreviouslyReported
ReclassificationAmounts
Reported afterReclassifications
Other $ 3 $ 17 $ 20Cash flow hedges
Net fair value lossduring the period (17) 17 –
Reclassification ofnet gain toearnings 34 (34) –
$ 20 $ – $ 20
Consolidated Statement of Cash FlowsFor the Year Ended December 31, 2017
PreviouslyReported
ReclassificationAmounts
Reported afterReclassifications
Pension and otherpost-retirementbenefits $ 64 $ (64) $ –
Net undistributedearnings of equity-accountedinvestees (1) 1 –
Asset retirementobligations andaccruedenvironmental costs 7 (7) –
Other long-termliabilities andmiscellaneous 21 70 91
$ 91 $ – $ 91
Consolidated Statements of Shareholders’ EquityAs at December 31, 2017
PreviouslyReported
ReclassificationAmounts
Reported afterReclassifications
Other $ (5) $ (41) $ (46)Net loss on derivatives
designated as cashflow hedges (43) 43 –
Loss on currencytranslation offoreign operations – (2) (2)
$ (48) $ – $ (48)
As at December 31, 2016PreviouslyReported
ReclassificationAmounts
Reported afterReclassifications
Other $ (8) $ (58) $ (66)Net loss on derivatives
designated as cashflow hedges (60) 60 –
Loss on currencytranslation offoreign operations – (2) (2)
$ (68) $ – $ (68)
Consolidated Balance Sheet
As at December 31, 2017PreviouslyReported
ReclassificationAmounts
Reported afterReclassifications
Intangible assets $ 166 $ (166) $ –Goodwill – 97 97Other intangible
assets – 69 69$ 166 $ – $ 166
Investments in equity-accountedinvestees $ 30 $ (30) $ –
Available-for-saleinvestments 262 (262) –
Investments – 292 292$ 292 $ – $ 292
Short-term debt andcurrent portion oflong-term debt $ 730 $ (730) $ –
Short-term debt – 730 730$ 730 $ – $ 730
Payables and accruedcharges $ 807 $ 29 $ 836
Current portion ofderivativeinstrument liabilities 29 (29) –
$ 836 $ – $ 836Other non-current
liabilities $ 51 $ 35 $ 86Derivative instrument
liabilities 35 (35) –$ 86 $ – $ 86
NUTRIEN 2018 154 ANNUAL REPORT