
2018 2019 OPENING SCHOOL REPORT
12
1 EVANSTON TOWNSHIP HIGH SCHOOL DISTRICT 202 Department of Research, Evaluation & Assessment October 2018 2018 – 2019 OPENING SCHOOL REPORT PART 1 - SEPTEMBER 30 ENROLLMENT PART 2 - SEPTEMBER 30 STAFFING
Transcript of 2018 2019 OPENING SCHOOL REPORT
1
EVANSTON TOWNSHIP HIGH SCHOOL DISTRICT 202
Department of Research, Evaluation & Assessment
October 2018
2018 – 2019 OPENING SCHOOL REPORT
PART 1 - SEPTEMBER 30 ENROLLMENT PART 2 - SEPTEMBER 30 STAFFING
OPENING SCHOOL REPORT TABLE OF CONTENTS
Executive Summary ....................................................................................................................... 1 PART 1 SEPTEMBER 30, 2018 ENROLLMENT A – Official District/School Enrollment as of September 30 ........................................................... 3 B – Official District/School Enrollment with Reclassified Totals as of September 30 .................... 4 C – Enrollment by Grade and Gender as of September 30 ............................................................ 5 D – Special Education Students Attending Private and Public Facilities ........................................ 6
PART 2 SEPTEMBER 30, 2018 ENROLLMENT BY DEPARTMENT A – Class Enrollment by Department as of September 30 ............................................................. 7 B – Special Courses and Programs .................................................................................................. 8 C – Number of Sections by Department of as of September 30 .................................................... 9 D – Average Class Size as of September 30 ................................................................................. 10
1
Executive Summary
Introduction The following report presents the official school enrollment as of September 30, 2018. Enrollment figures are disaggregated by race/ethnicity and gender. The report also includes information on special education students attending private and public facilities, District 202 residents attending non-public schools, class enrollment by department, number of class sections by department, average class size by department, and special courses and programs.
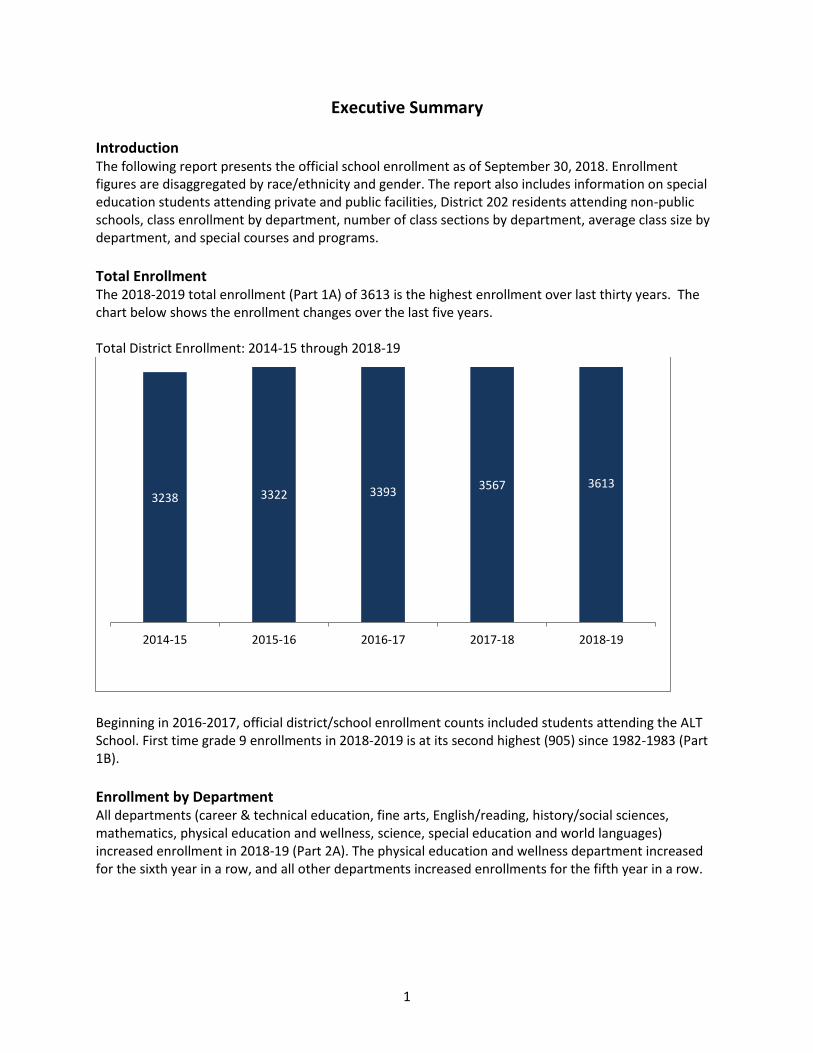
Total Enrollment The 2018-2019 total enrollment (Part 1A) of 3613 is the highest enrollment over last thirty years. The chart below shows the enrollment changes over the last five years. Total District Enrollment: 2014-15 through 2018-19
Beginning in 2016-2017, official district/school enrollment counts included students attending the ALT School. First time grade 9 enrollments in 2018-2019 is at its second highest (905) since 1982-1983 (Part 1B).
Enrollment by Department All departments (career & technical education, fine arts, English/reading, history/social sciences, mathematics, physical education and wellness, science, special education and world languages) increased enrollment in 2018-19 (Part 2A). The physical education and wellness department increased for the sixth year in a row, and all other departments increased enrollments for the fifth year in a row.
3238 3322 33933567 3613
2014-15 2015-16 2016-17 2017-18 2018-19

2
Enrollment in Special Education and Bilingual Program The number of special education students attending private and public facilities is 89, which is a 62% decrease from 2014-15 (143). The number of students enrolled in the special education program decreased from 402 in 2017-2018 to 395 in 2018-2019. In 2018-19 there are 74 students enrolled in the bilingual program, which is more than twice the number of students enrolled in 2014-15 (32). Special Education Program Enrollment
Enrollment by Race/Ethnicity Total student enrollment by race/ethnicity over the past five years is summarized in the table below. In 2018-19 the percentage of Black/African American students is 27.3%. The proportion of Black/African American students has declined over the previous five years. The proportion of Hispanic/Latino students is 18.5% in 2018-2019, which is the highest in ETHS history. The proportion of White students increased to 45.6% in 2018-19. The proportion of Asian students in 2018-19 is 5.6%, which is the second highest in ETHS history. The proportion of students identified as Two or More Races remained relatively the same in 2018-19 at 2.3%, compared to 2.5% in 2017-18.
Percent Enrollment by Race/Ethnicity
Race/Ethnicity 2014-15 2015-16 2016-17 2017-18 2018-19
American Indian/Native Hawaiian 0.4 0.5 0.5 0.5 0.6
Asian 4.8 5.1 5.5 5.7 5.6
Black/African American 30.2 30.3 29.8 27.8 27.3
Hispanic/Latino 16.6 17.5 17.7 18.3 18.5
Two or More Races 4.3 3.4 2.4 2.5 2.3
White 43.7 43.2 44.1 45.3 45.6
All 100 100 100 100 100
383 396 401 402 395
2014-15 2015-16 2016-17 2017-18 2018-19

PART 1A Official District/School Enrollment as of September 30
3
Grade Level and 2014-15 2014-15 2015-16 2015-16 2016-17 2016-17 2017-18 2017-18 2018-19 2018-19
Race/Ethnicity Total n % of Ttl Total n % of Ttl Total n % of Ttl Total n % of Ttl Total n % of Ttl
Grade 9
American Indian 3 0.3 5 0.6 3 0.3 4 0.4 5 0.5
Asian 47 5.4 45 5.2 56 6.1 50 5.0 45 4.7
Black/African Amer 255 29.2 259 29.8 284 31.1 264 26.1 260 27.1 Hispanic/Latino 154 17.6 172 19.8 173 18.9 195 19.3 193 20.1 Native Hawaiian 2 0.2 0 0.0 3 0.3 2 0.2 3 0.3 Two or More Races 34 3.9 9 1.0 20 2.2 30 3.0 30 3.1
White 379 43.4 378 43.6 374 41.0 465 46.0 424 44.2
Total 874 868 913 1010 960
Grade 10
American Indian 2 0.3 1 0.1 5 0.6 1 0.1 3 0.3
Asian 36 4.7 47 5.5 44 5.4 55 6.4 47 4.9
Black/African Amer 237 31.2 254 29.8 245 29.8 250 29.3 254 26.6 Hispanic/Latino 136 17.9 153 18.0 150 18.3 150 17.6 167 17.5 Native Hawaiian 0 0.0 1 0.1 0 0.0 2 0.2 3 0.3 Two or More Races 17 2.2 35 4.1 8 1.0 17 2.0 27 2.8 White 332 43.7 361 42.4 369 44.9 379 44.4 454 47.5 Total 760 852 821 854 955
Grade 11
American Indian 4 0.5 2 0.3 3 0.4 4 0.5 2 0.2 Asian 36 4.8 40 5.3 44 5.4 49 6.0 55 6.8 Black/African Amer 217 28.7 225 30.0 216 26.4 225 27.7 228 28.1 Hispanic/Latino 126 16.7 130 17.3 151 18.4 160 19.7 138 17.0 Native Hawaiian 1 0.1 1 0.1 1 0.1 1 0.1 1 0.1 Two or More Races 48 6.4 15 2.0 32 3.9 9 1.1 18 2.2 White 323 42.8 338 45.0 371 45.3 365 44.9 370 45.6 Total 755 751 818 813 812
Grade 12
American Indian 1 0.1 4 0.5 2 0.3 0 0.0 4 0.5 Asian 31 4.4 34 4.7 42 5.6 44 5.5 52 6.5 Black/African Amer 180 25.8 205 28.4 228 30.5 218 27.2 218 27.4 Hispanic/Latino 110 15.8 117 16.2 117 15.7 135 16.9 150 18.9 Native Hawaiian 0 0.0 1 0.1 0 0.0 0 0.0 1 0.1 Two or More Races 31 4.4 47 6.5 17 2.3 32 4.0 6 0.8 White 344 49.4 315 43.6 341 45.6 372 46.4 364 45.8 Total 697 723 747 801 795
Off Campus/Safe Sch
American Indian 1 0.7 0 0.0 0 0.0 1 1.1 0 0.0 Asian 4 2.6 2 1.6 2 2.1 4 4.5 4 4.4 Black/African Amer 88 57.9 64 50.0 37 39.4 33 37.1 26 28.6 Hispanic/Latino 13 8.6 11 8.6 11 11.7 13 14.6 20 22.0 Native Hawaiian 1 0.7 1 0.8 1 1.1 1 1.1 1 1.1 Two or More Races 8 5.3 8 6.2 3 3.2 1 1.1 3 3.3 White 37 24.3 42 32.8 40 42.6 36 40.4 37 40.7 Total 152 128 94 89 91
Total ETHS*
American Indian 11 0.3 12 0.4 13 0.4 10 0.3 14 0.4 Asian 154 4.8 168 5.1 188 5.5 202 5.7 203 5.6 Black/African Amer 977 30.2 1007 30.3 1010 29.8 990 27.8 986 27.3 Hispanic/Latino 539 16.6 583 17.5 602 17.7 653 18.3 668 18.5 Native Hawaiian 4 0.1 4 0.1 5 0.1 6 0.2 9 0.2 Two or More Races 138 4.3 114 3.4 80 2.4 89 2.5 84 2.3 White 1415 43.7 1434 43.2 1495 44.1 1617 45.3 1649 45.6 Total 3238 3322 3393 3567 3613
*Total ETHS includes students enrolled at the Main Campus, at an Off Campus Placement and at a Safe School/Ombudsman.
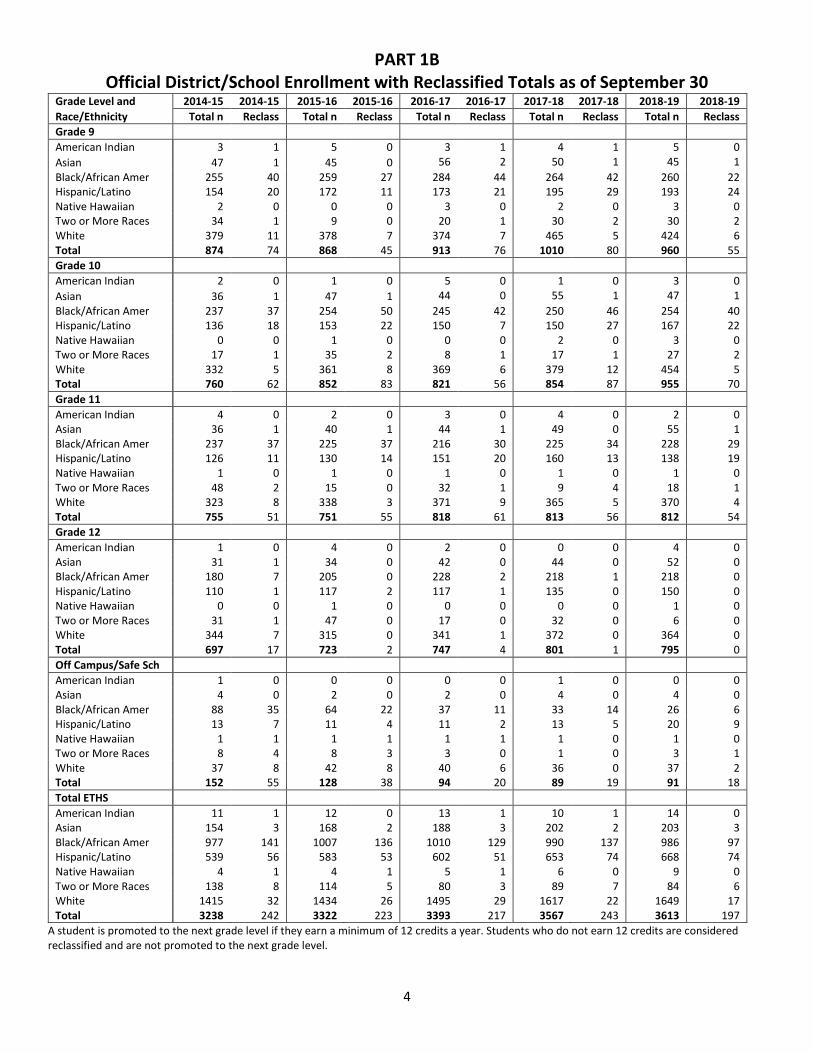
PART 1B Official District/School Enrollment with Reclassified Totals as of September 30
4
Grade Level and 2014-15 2014-15 2015-16 2015-16 2016-17 2016-17 2017-18 2017-18 2018-19 2018-19
Race/Ethnicity Total n Reclass Total n Reclass Total n Reclass Total n Reclass Total n Reclass
Grade 9
American Indian 3 1 5 0 3 1 4 1 5 0
Asian 47 1 45 0 56 2 50 1 45 1
Black/African Amer 255 40 259 27 284 44 264 42 260 22 Hispanic/Latino 154 20 172 11 173 21 195 29 193 24 Native Hawaiian 2 0 0 0 3 0 2 0 3 0 Two or More Races 34 1 9 0 20 1 30 2 30 2 White 379 11 378 7 374 7 465 5 424 6 Total 874 74 868 45 913 76 1010 80 960 55
Grade 10
American Indian 2 0 1 0 5 0 1 0 3 0
Asian 36 1 47 1 44 0 55 1 47 1
Black/African Amer 237 37 254 50 245 42 250 46 254 40 Hispanic/Latino 136 18 153 22 150 7 150 27 167 22 Native Hawaiian 0 0 1 0 0 0 2 0 3 0 Two or More Races 17 1 35 2 8 1 17 1 27 2 White 332 5 361 8 369 6 379 12 454 5 Total 760 62 852 83 821 56 854 87 955 70
Grade 11
American Indian 4 0 2 0 3 0 4 0 2 0 Asian 36 1 40 1 44 1 49 0 55 1 Black/African Amer 237 37 225 37 216 30 225 34 228 29 Hispanic/Latino 126 11 130 14 151 20 160 13 138 19 Native Hawaiian 1 0 1 0 1 0 1 0 1 0 Two or More Races 48 2 15 0 32 1 9 4 18 1 White 323 8 338 3 371 9 365 5 370 4 Total 755 51 751 55 818 61 813 56 812 54
Grade 12
American Indian 1 0 4 0 2 0 0 0 4 0 Asian 31 1 34 0 42 0 44 0 52 0 Black/African Amer 180 7 205 0 228 2 218 1 218 0 Hispanic/Latino 110 1 117 2 117 1 135 0 150 0 Native Hawaiian 0 0 1 0 0 0 0 0 1 0 Two or More Races 31 1 47 0 17 0 32 0 6 0 White 344 7 315 0 341 1 372 0 364 0 Total 697 17 723 2 747 4 801 1 795 0
Off Campus/Safe Sch
American Indian 1 0 0 0 0 0 1 0 0 0 Asian 4 0 2 0 2 0 4 0 4 0 Black/African Amer 88 35 64 22 37 11 33 14 26 6 Hispanic/Latino 13 7 11 4 11 2 13 5 20 9 Native Hawaiian 1 1 1 1 1 1 1 0 1 0 Two or More Races 8 4 8 3 3 0 1 0 3 1 White 37 8 42 8 40 6 36 0 37 2 Total 152 55 128 38 94 20 89 19 91 18
Total ETHS
American Indian 11 1 12 0 13 1 10 1 14 0 Asian 154 3 168 2 188 3 202 2 203 3 Black/African Amer 977 141 1007 136 1010 129 990 137 986 97 Hispanic/Latino 539 56 583 53 602 51 653 74 668 74 Native Hawaiian 4 1 4 1 5 1 6 0 9 0 Two or More Races 138 8 114 5 80 3 89 7 84 6 White 1415 32 1434 26 1495 29 1617 22 1649 17 Total 3238 242 3322 223 3393 217 3567 243 3613 197
A student is promoted to the next grade level if they earn a minimum of 12 credits a year. Students who do not earn 12 credits are considered reclassified and are not promoted to the next grade level.
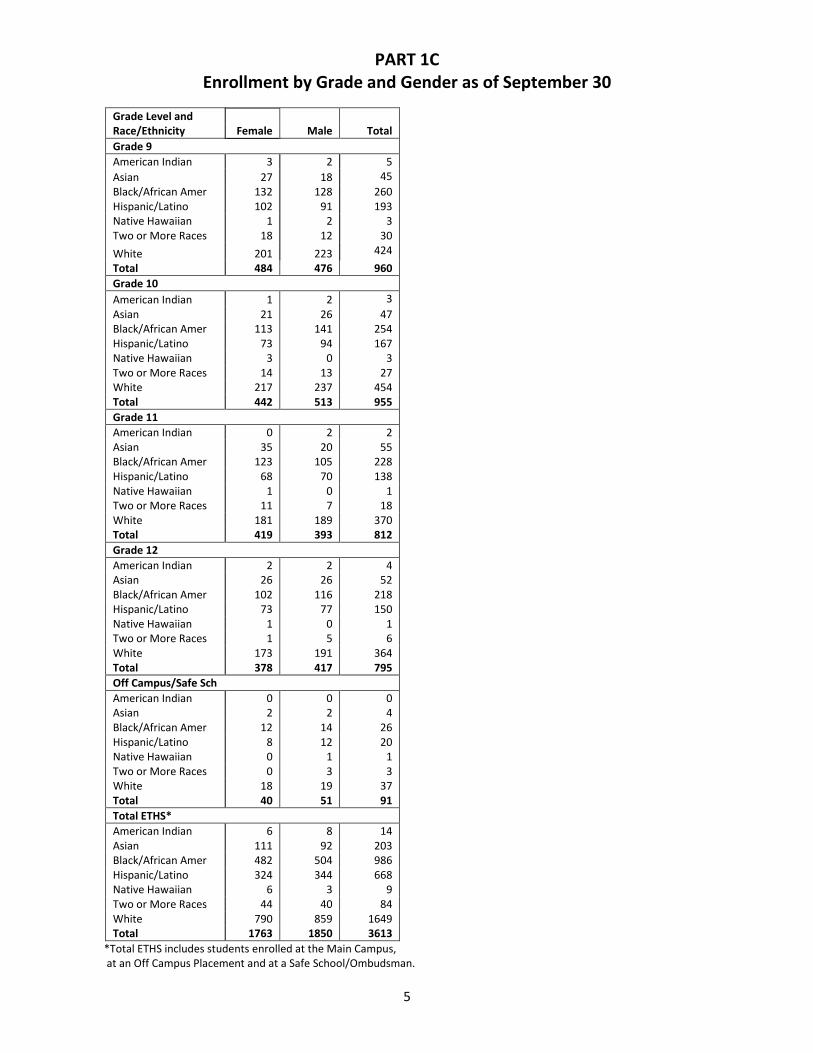
PART 1C Enrollment by Grade and Gender as of September 30
5
Grade Level and Race/Ethnicity Female Male Total
Grade 9
American Indian 3 2 5
Asian 27 18 45
Black/African Amer 132 128 260 Hispanic/Latino 102 91 193 Native Hawaiian 1 2 3 Two or More Races 18 12 30
White 201 223 424
Total 484 476 960
Grade 10
American Indian 1 2 3
Asian 21 26 47 Black/African Amer 113 141 254 Hispanic/Latino 73 94 167 Native Hawaiian 3 0 3 Two or More Races 14 13 27 White 217 237 454 Total 442 513 955
Grade 11
American Indian 0 2 2 Asian 35 20 55 Black/African Amer 123 105 228 Hispanic/Latino 68 70 138 Native Hawaiian 1 0 1 Two or More Races 11 7 18 White 181 189 370 Total 419 393 812
Grade 12
American Indian 2 2 4 Asian 26 26 52 Black/African Amer 102 116 218 Hispanic/Latino 73 77 150 Native Hawaiian 1 0 1 Two or More Races 1 5 6 White 173 191 364 Total 378 417 795
Off Campus/Safe Sch
American Indian 0 0 0 Asian 2 2 4 Black/African Amer 12 14 26 Hispanic/Latino 8 12 20 Native Hawaiian 0 1 1 Two or More Races 0 3 3 White 18 19 37 Total 40 51 91
Total ETHS*
American Indian 6 8 14 Asian 111 92 203 Black/African Amer 482 504 986 Hispanic/Latino 324 344 668 Native Hawaiian 6 3 9 Two or More Races 44 40 84 White 790 859 1649 Total 1763 1850 3613
*Total ETHS includes students enrolled at the Main Campus, at an Off Campus Placement and at a Safe School/Ombudsman.
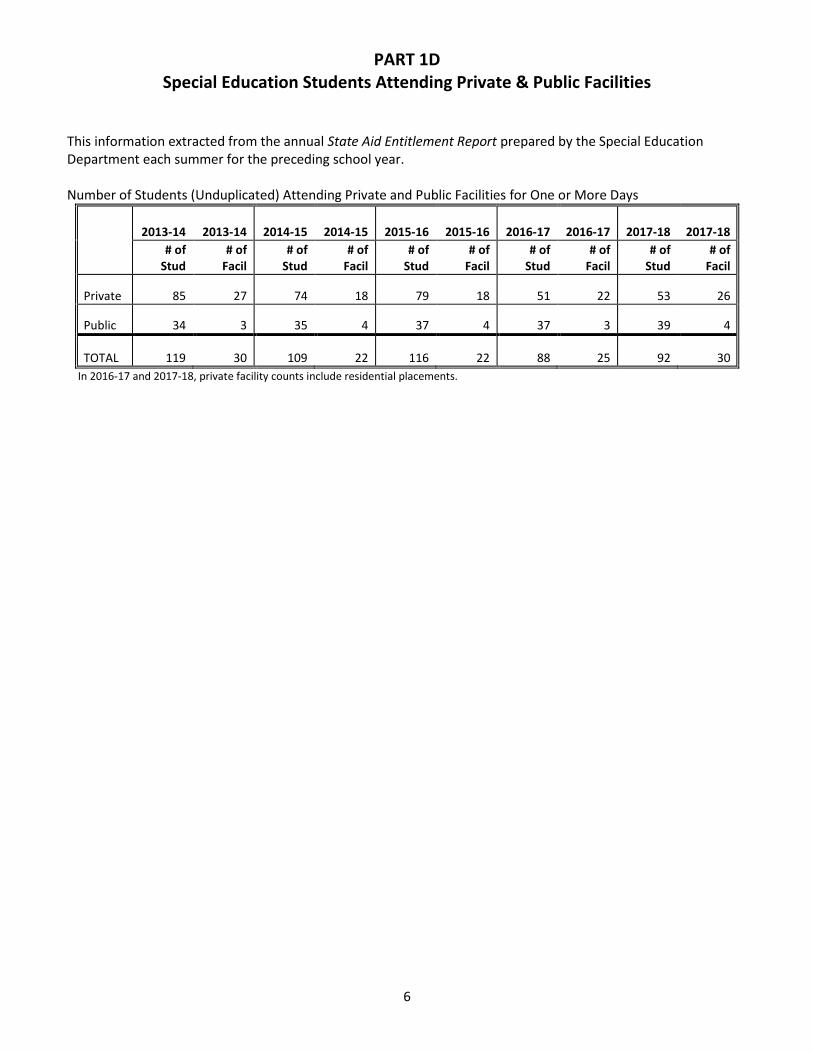
PART 1D Special Education Students Attending Private & Public Facilities
6
This information extracted from the annual State Aid Entitlement Report prepared by the Special Education Department each summer for the preceding school year. Number of Students (Unduplicated) Attending Private and Public Facilities for One or More Days
2013-14 2013-14 2014-15 2014-15 2015-16 2015-16 2016-17 2016-17 2017-18 2017-18
# of Stud
# of Facil
# of Stud
# of Facil
# of Stud
# of Facil
# of Stud
# of Facil
# of Stud
# of Facil
Private 85 27 74 18 79 18 51 22 53 26
Public 34 3 35 4 37 4 37 3 39 4
TOTAL 119 30 109 22 116 22 88 25 92 30
In 2016-17 and 2017-18, private facility counts include residential placements.
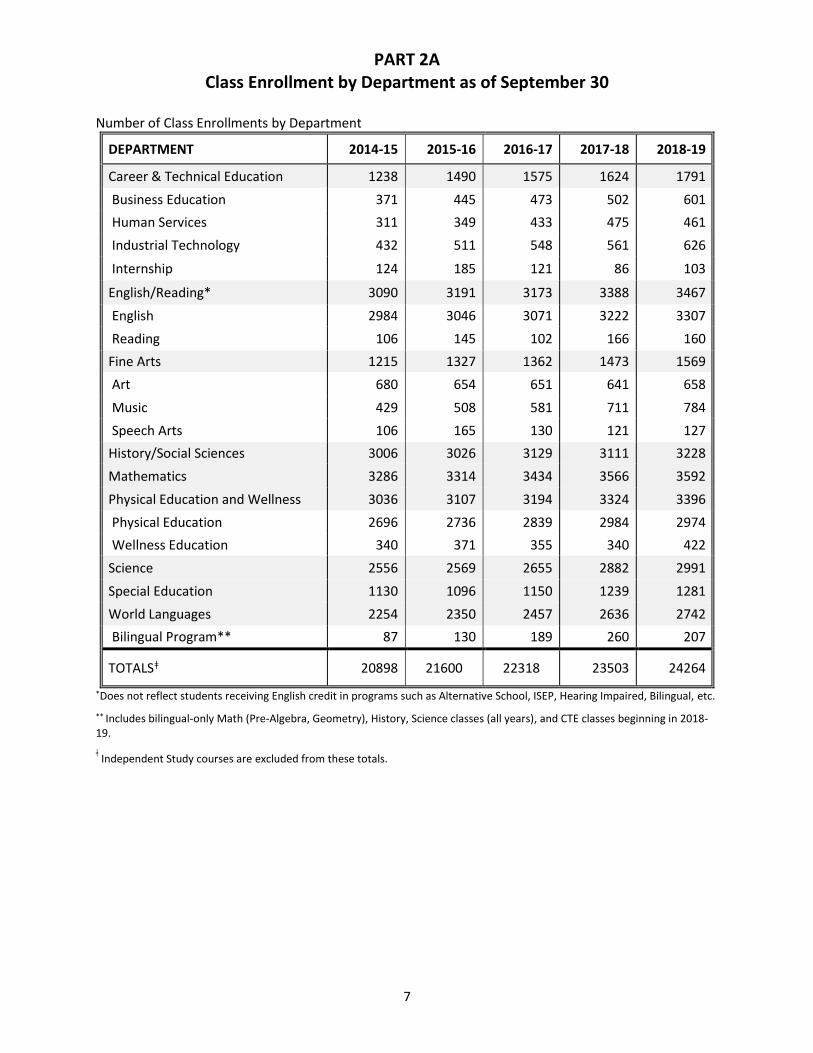
PART 2A Class Enrollment by Department as of September 30
7
Number of Class Enrollments by Department
DEPARTMENT 2014-15 2015-16 2016-17 2017-18 2018-19
Career & Technical Education 1238 1490 1575 1624 1791
Business Education 371 445 473 502 601
Human Services 311 349 433 475 461
Industrial Technology 432 511 548 561 626
Internship 124 185 121 86 103
English/Reading* 3090 3191 3173 3388 3467
English 2984 3046 3071 3222 3307
Reading 106 145 102 166 160
Fine Arts 1215 1327 1362 1473 1569
Art 680 654 651 641 658
Music 429 508 581 711 784
Speech Arts 106 165 130 121 127
History/Social Sciences 3006 3026 3129 3111 3228
Mathematics 3286 3314 3434 3566 3592
Physical Education and Wellness 3036 3107 3194 3324 3396
Physical Education 2696 2736 2839 2984 2974
Wellness Education 340 371 355 340 422
Science 2556 2569 2655 2882 2991
Special Education 1130 1096 1150 1239 1281
World Languages 2254 2350 2457 2636 2742
Bilingual Program** 87 130 189 260 207
TOTALSǂ 20898 21600 22318 23503 24264
*Does not reflect students receiving English credit in programs such as Alternative School, ISEP, Hearing Impaired, Bilingual, etc.
** Includes bilingual-only Math (Pre-Algebra, Geometry), History, Science classes (all years), and CTE classes beginning in 2018-19.
ǂ Independent Study courses are excluded from these totals.
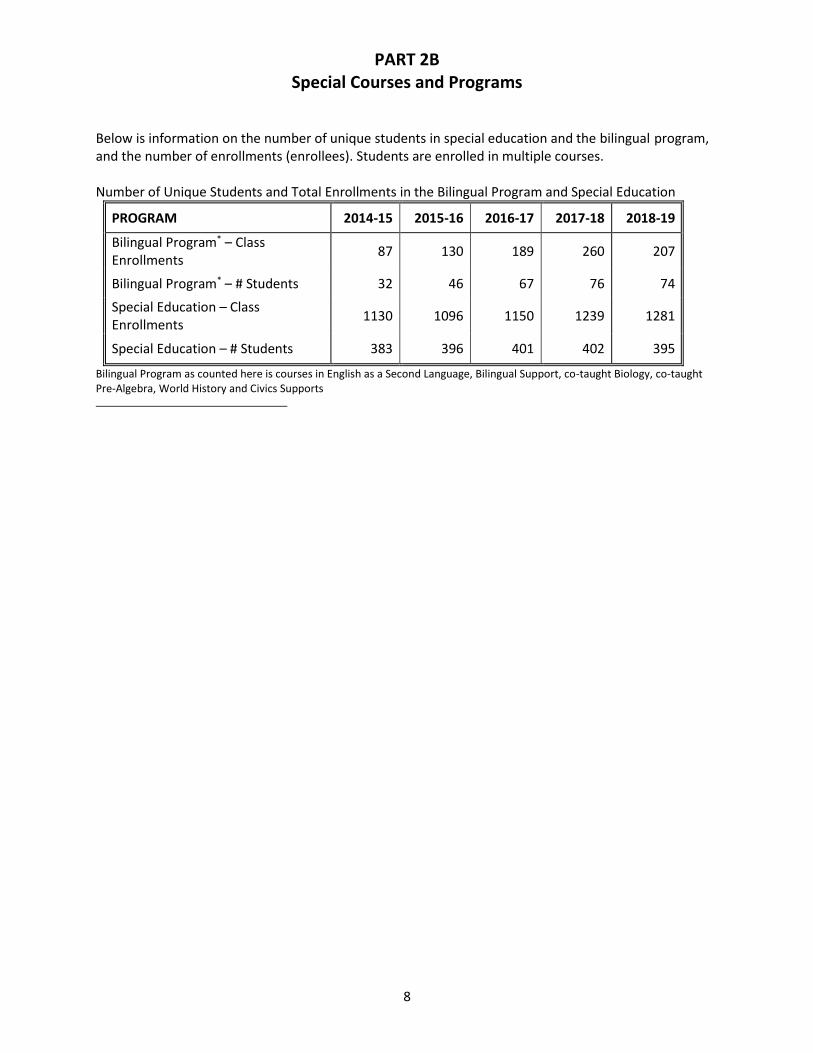
PART 2B Special Courses and Programs
8
Below is information on the number of unique students in special education and the bilingual program, and the number of enrollments (enrollees). Students are enrolled in multiple courses. Number of Unique Students and Total Enrollments in the Bilingual Program and Special Education
PROGRAM 2014-15 2015-16 2016-17 2017-18 2018-19
Bilingual Program* – Class Enrollments
87 130 189 260 207
Bilingual Program* – # Students 32 46 67 76 74
Special Education – Class Enrollments
1130 1096 1150 1239 1281
Special Education – # Students 383 396 401 402 395
Bilingual Program as counted here is courses in English as a Second Language, Bilingual Support, co-taught Biology, co-taught Pre-Algebra, World History and Civics Supports

PART 2C Number of Sections by Department
as of September 30
9
Number of Course Sections by Department
DEPARTMENT 2014-15 2015-16 2016-17 2017-18 2018-19
Career & Technical Education 61 68 73 75 80
Business Education 19 22 22 22 26
Human Services 19 20 23 24 23
Industrial Technology 23 26 28 29 31
English 142 145 150 155 158
Fine Arts 40 41 39 39 37
Art 35 33 32 33 31
Speech Arts 5 8 7 6 6
History/Social Sciences 133 131 142 146 150
Mathematics 163 147 152 154 161
Physical Education and Wellness
114 118 120 121 122
Physical Education 99 102 103 104 105
Wellness Education 15 16 17 17 17
Science 118 119 122 128 136
World Languages 112 114 113 118 122
Total 883 883 911 936 966
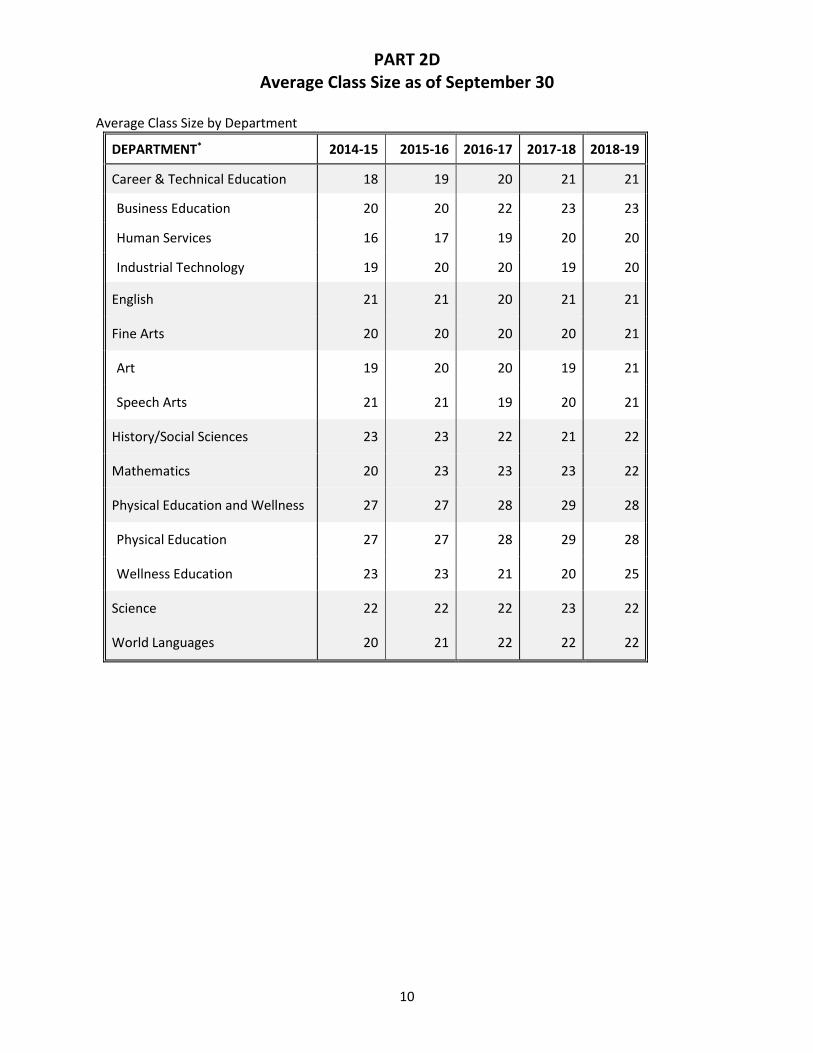
PART 2D Average Class Size as of September 30
10
Average Class Size by Department
DEPARTMENT* 2014-15 2015-16 2016-17 2017-18 2018-19
Career & Technical Education 18 19 20 21 21
Business Education 20 20 22 23 23
Human Services 16 17 19 20 20
Industrial Technology 19 20 20 19 20
English 21 21 20 21 21
Fine Arts 20 20 20 20 21
Art 19 20 20 19 21
Speech Arts 21 21 19 20 21
History/Social Sciences 23 23 22 21 22
Mathematics 20 23 23 23 22
Physical Education and Wellness 27 27 28 29 28
Physical Education 27 27 28 29 28
Wellness Education 23 23 21 20 25
Science 22 22 22 23 22
World Languages 20 21 22 22 22