2018-19 NSW Report on State Finances · 2019-10-08 · Report on State Finances 2018-19 2 - 1 2....
238
Transcript of 2018-19 NSW Report on State Finances · 2019-10-08 · Report on State Finances 2018-19 2 - 1 2....


Report on State Finances
2018-19
TABLE OF CONTENTS Page
Report on State Finances 2018-19
About this Report ............................................................................................................. 1 - 1
2018-19 Overview ........................................................................................................... 2 - 1
Fiscal Context ................................................................................................................. 3 - 1
General Government Sector Results ................................................................................ 4 - 1
Total State Sector Results ............................................................................................... 5 - 1
Annexures ....................................................................................................................... 6 - 1
Total State Sector Accounts: Audited Consolidated Financial Statements of the NSW General Government and Total State Sectors ......................................... 7 - 1
Statement of Compliance ................................................................................................. 7 - 2
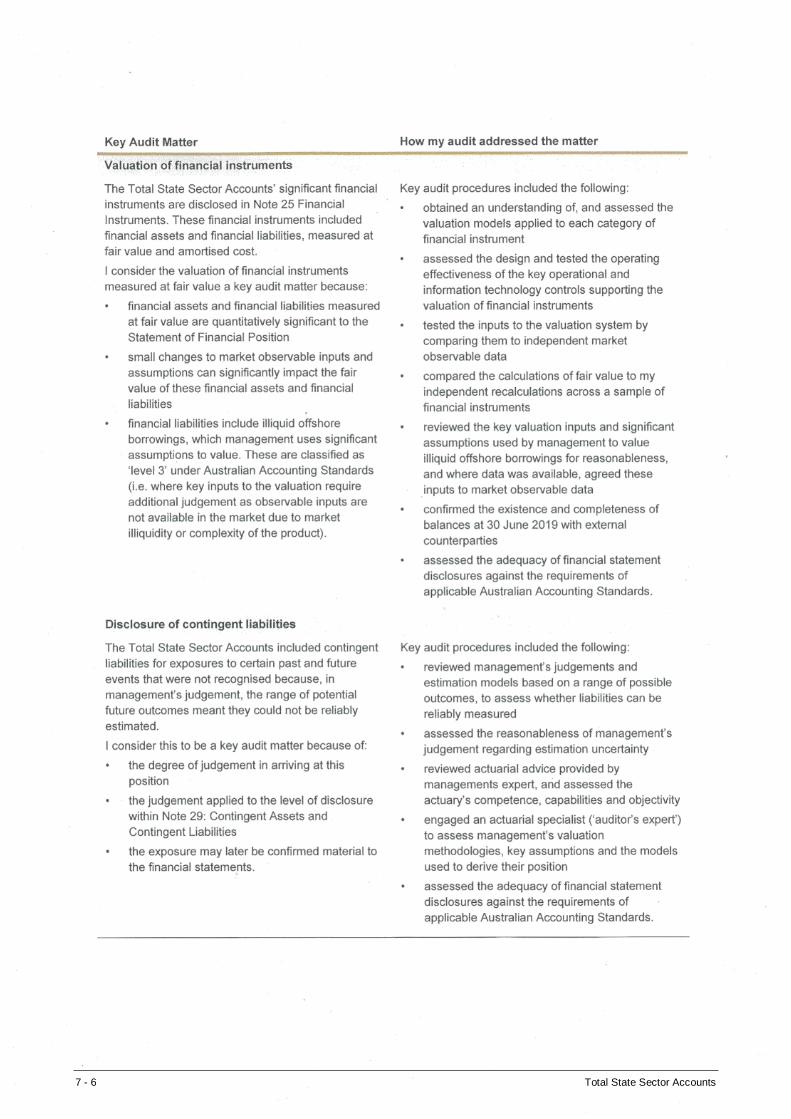
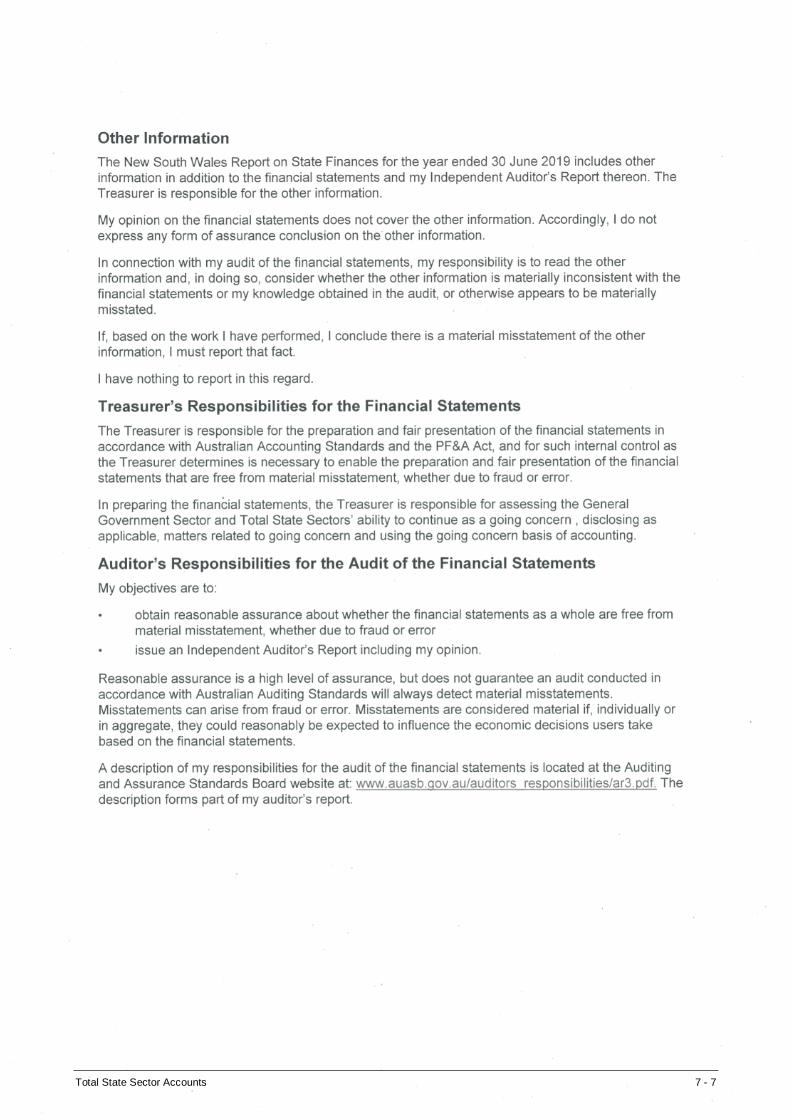
Independent Auditor’s Report Total State Sector Accounts .............................................. 7 - 3
Statements of Comprehensive Income ............................................................................ 7 - 9
Statements of Changes in Equity ..................................................................................... 7 - 11
Statements of Financial Position ...................................................................................... 7 - 12
Statements of Cash Flows ............................................................................................... 7 - 13
Notes to the Financial Statements ................................................................................. 7 - 14
Uniform Presentation Framework: Outcomes Report ................................................ 8 - 1
Statements of Financial Position ...................................................................................... 8 - 3
Sector Reports
General Government Sector ......................................................................................... 8 - 5
Public Non-Financial Corporations Sector ..................................................................... 8 - 17
Non-Financial Public Sector .......................................................................................... 8 - 22
Public Financial Corporations Sector ............................................................................. 8 - 27

Report on State Finances 2018-19 1 - 1
1. ABOUT THIS REPORT
The 2018-19 New South Wales Report on State Finances includes:
• an overview of the financial performance and position of the General Government and Total State
Sectors for 2018-19
• the audited Consolidated Financial Statements of the General Government and Total State Sectors for
2018-19, including a full set of note disclosures required by Australian Accounting Standards
• the Outcomes Report on Government Finances for the general government sector, public non-financial
corporations sector, public financial corporations sector and the non-financial public sector for 2018-19,
prepared in accordance with the Uniform Presentation Framework adopted by all Australian
governments.
These reports and associated commentary provide a comprehensive analysis and review of the State’s
financial performance and position.
The New South Wales total state sector is made up of the general government sector (GGS), the state’s
public non-financial corporations (PNFCs) and public financial corporations (PFCs) whereby:
• general government sector agencies carry out policy, regulatory and service delivery functions.
• PNFCs, other than in the transport and housing sectors, are largely self-funded from user charges and in
most cases have been given a specific charter to run their businesses on commercial lines, including the
achievement of a commercial rate of return on the resources employed. PNFCs are responsible for
supplying public infrastructure services, including electricity, water and public transport.
• PFCs may accept demand, time or savings deposits and/or have the authority to incur liabilities and
acquire financial assets in the market on their own account. An example of a PFC is the New South
Wales Treasury Corporation.
Throughout this report:
• A reference to one billion dollars is one thousand million dollars.
• All figures in tables, charts and text are rounded to the nearest million dollars, except when otherwise
indicated. Discrepancies between totals and the sum of components reflect rounding. Percentages are
based on the underlying unrounded amounts.
• Prior year comparatives have been restated to take account of changes to accounting standards and
corrections of prior period errors.

Report on State Finances 2018-19 2 - 1
2. 2018-19 OVERVIEW
The NSW government continues its strong financial performance in 2018-19, with a continuation of strong
surpluses, low General Government Sector net debt (negative $10.4 billion) and a net worth above
$250 billion.
The following overview highlights the key financial results for the General Government Sector and Total
State Sector for 2018-19. These are discussed in more detail in the subsequent chapters.
General Government Sector
(a) Financial assets exclude the State’s investment in Other Public Sector entities.
Total State Sector
Revenue from taxation, grants
and other sources $81.7 billion
Expenses on provision of services and running costs $80.5 billion
Budget Surplus for the year
$1.2 billion
Net worth = total assets less total
liabilities $250.2 billion
Net financial liabilities = total liabilities less
financial assets(a) $81.2 billion
Net debt = total debt less liquid assets
$-10.4 billion
Revenue from taxation, grants
and other sources $86.1 billion
Expenses on provision of services and running costs $87.9 billion
Budget Deficit for the year
$1.7 billion
Net worth = total assets less total
liabilities $250.2 billion
Net financial liabilities = total liabilities less
financial assets $116.4 billion
Net debt = total debt less liquid assets
$23.9 billion

Report on State Finances 2018-19 3 - 1
3. NSW FISCAL CONTEXT
3.1 Fiscal Targets and Principles
The Government’s fiscal strategy is underpinned by the Fiscal Responsibility Act 2012 (the Act). The object
of the Act is to maintain the State’s triple-A credit rating. This objective is supported by two fiscal targets:
• Maintaining general government sector annual expense growth below long-term average revenue growth
• Eliminating the State’s unfunded superannuation liabilities by 2030.
The Act also requires the Government to pursue its objective in accordance with the following principles of
sound financial management: responsible and sustainable spending, taxation and infrastructure investment,
effective financial and asset management; and achieving intergenerational equity.
In 2018, the Treasurer undertook a statutory review of the Act to ensure that its policy objective remains valid
and the terms remain appropriate for achieving the objective. The review was tabled in each House of
Parliament in 2018 and found:
• the objective to maintain the State’s triple-A credit rating remains valid
• the Government has met the Act’s objective and targets
• a Commonwealth downgrade remains a risk to maintaining the State’s triple-A credit rating because,
there would be a flow on down grade effect
• the current targets support the objective of the Act, but the government should also continue to maintain
a strong operating position and sustainable levels of debt
• the Government should continue to pursue the principles of sound financial management to support the
objective of the Act.
The Government continues to meet the objective, targets and principles of the Act, with both major credit
rating agencies – S&P Global and Moody’s – reaffirming the State’s triple-A credit rating in September 2019.
The State has maintained strong fiscal discipline in 2018-19 as evidenced by:
• its continued triple-A credit rating
• a General government Sector surplus of $1.2 billion
• annual expense growth below the long-term average revenue growth rate
• negative net debt for the fourth consecutive year (negative $10.4 billion).
These financial results have been achieved whilst concurrently increasing expenditure in government service
delivery and continued delivery of a record infrastructure program.
Further information about the Government’s performance against the Act is outlined in Section 6 -
Annexures.

Fiscal Context
3 - 2 Report on State Finances 2018-19
3.2 Economic Context
The New South Wales economy has recorded impressive growth in recent years. Gross state product (GSP)
grew by an above-trend1 rate averaging around 3 per cent a year over the four years to 2017-18 and
experienced the fastest per capita growth of any state, averaging 1.6 per cent a year.
Economic growth eased in 2018-19, driven by softer household income growth, the drought and an easing in
the housing market. These conditions have principally manifested as weakness in household consumption
growth, particularly discretionary spending, and a moderation in dwelling investment. State final demand
(SFD) growth, the major component of GSP growth and most timely broad indicator of state economic
activity was around trend at 2.2 per cent in 2018-19. This result is below the 3 per cent growth expected at
the time of the 2018-19 Budget, and down from the 3.5 per cent growth of 2017-18. GSP is expected to have
grown by 2¼ per cent in 2018-19.2
Growth in the global and national economies has also slowed over the last year, providing a less supportive
backdrop for the NSW economy than expected at the time of the 2018-19 Budget. Globally, economic
downside risks have become more elevated.
Despite near-term challenges, segments of the NSW economy remain resilient. Solid labour market
conditions, the government’s record infrastructure program, rising commercial building activity and a solid
export sector have underpinned the State’s resilience and are expected to partially offset the current
weakness in household consumption and a detraction from dwelling investment.
NSW labour market conditions were exceptionally strong in 2018-19, with employment increasing
3.3 per cent, significantly stronger than the 1¾ per cent anticipated at the time of the 2018-19 Budget. This
strong performance has fostered record workforce participation and has driven the unemployment rate to
around 4¼ per cent. The unemployment rate is close to its lowest level in over four decades, the lowest
among the states and consistent with estimates of full-employment.
Wage pressures gained some traction in 2018-19, with the wage price index rising 2.4 per cent, in line with
the 2½ per cent forecast at the time of the 2018-19 Budget.
The outlook for the NSW economy is for growth to remain around trend in 2019-20 before returning to growth
of 2½ per cent in 2020-21. This will be supported by solid fundamentals, led by exceptionally strong labour
market conditions, a wave of policy stimulus (including recent personal income tax and interest rate cuts),
above-trend population growth, a lower exchange rate and improving global and national economies. A
stabilisation of housing market conditions and a gradual increase in wages growth are also expected to
support consumption growth becoming a key driver in returning economic growth to a trend rate.
Solid economic growth is expected to sustain strength in labour market conditions. Over the next two years,
employment is expected to grow around 1¼ to 1½ per cent, reflecting improved productivity, while the
unemployment rate is expected to remain steady.
1 Trend economic growth is projected at 2½ per cent a year over the medium term driven by the supply capacity of the economy 2 ABS State Accounts, which contains GSP for 2018-19, were not released at the time of publication.

Report on State Finances 2018-19 4 - 1
4. GENERAL GOVERNMENT SECTOR RESULTS
The General Government Sector results reflect a continuation of strong financial performance and the
Government’s commitment to effective financial management.
Significant events in 2018-19 included the WestConnex transaction, which generated gross cash proceeds
including transfer duty to NSW of $9.3 billion, and the continuation of record investments in infrastructure
and other capital projects, which totalled $16.6 billion in the financial year to June 2019.
The 2018-19 Budget Result for the General Government Sector (GGS) was a surplus of $1.2 billion,
$417 million higher than the revised estimates published in the 2019-20 Budget papers. The improved
result was mainly due to marginally higher revenues than forecast across a number of sources including
taxation, sales of goods and services and dividends and distributions.
The $1.2 billion surplus reflects $81.7 billion in revenue, an increase from the previous year of $1.0 billion,
offset by expenses of $80.5 billion, an increase from 2017-18 of $4.2 billion.
Higher revenues relative to 2017-18 were primarily driven by increases in agency sales of goods and
services of $0.5 billion, including higher grants for major rail projects, mining royalties of $0.3 billion,
dividends, income tax equivalents and distributions of $0.2 billion.
Increased expenses over the prior year were mainly due to increased investment in front line services
leading to growth in employee costs of $1.5 billion (which includes the agreed wages policy increase of
2.5 per cent), higher other operating expenses of $1.5 billion, higher grants and subsidies of $0.8 billion and
higher depreciation of $0.4 billion.
Capital expenditure was $16.6 billion in 2018-19, $4.5 billion higher than the prior year ($12.1 billion). This
represents the fourth year of record annual spend in New South Wales and reflects the Government’s
commitment to delivery of infrastructure for NSW communities and strong economic growth.
The General Government Sector net debt was negative $10.4 billion at 30 June 2019, compared to
negative $11.2 billion at 30 June 2018. This net debt result was supported by the budget surplus together
with the proceeds from the WestConnex transaction.
Net financial liabilities at 30 June 2019 were $81.2 billion, which was $12.1 billion higher than the previous
year. This increase was primarily due to the increases in superannuation provisions of $13.5 billion,
resulting from the changes in the discount rate used to calculate the present value of future obligations,
partially offset by budget surplus of $1.2 billion.

General Government Sector Results
4 - 2 Report on State Finances 2018-19
4.1 Operating Result
Table 4.1: General Government Sector Key Financial Indicators – Performance on Operating Result
General Government Sector
Revenue $b 80.7 81.1 81.1 81.7
Expenses $b 76.3 79.7 80.3 80.5
Budget Result (Net Operating Balance) $b 4.4 1.4 0.8 1.2
Comprehensive Result $b 30.6 9.1 7.8 (1.9)
Gross Capital Expenditure $b 12.1 17.3 17.9 16.6
Cash Result $b (2.1) (8.5) (9.6) (10.3)
Net Lending/(Borrowing) $b (2.6) (10.3) (11.5) (9.3)
Key Financial Indicators (GGS) - Statement of Comprehensive Income
Actual
2017-18
Restated(a)
Original
Budget 2018-19
Revised
Estimate(b)
2018-19
Actual
2018-19
(a) Refer Note 31 Restatement/Corrections to Prior Year Comparatives, for details of corrections to prior period. (b) Revised Estimate for 2018-19 as presented in the 2019-20 Budget Papers
4.2 Budget Result
The Budget Result for 2018-19 was a surplus of $1,219 million, which was $207 million below the Original
Budget and $3,206 million lower than prior year. The decreased surplus compared to the prior year largely
reflects lower transfer duties due to lower activity in the residential property market ($1.2 billion) and
increases, largely as budgeted, in frontline service costs across several agencies as reflected in higher
employee and grant expenses, which together increased by $2.3 billion.
The Budget Result was $416 million better than the revised estimate for 2018-19 as presented in the
2019-20 Budget Papers. Revenues were $562 million higher and expenses $145 million higher than the
revised estimate. Marginally higher revenues, compared to the revised estimate, were achieved across a
number of categories including state taxation ($180 million), agencies’ own source revenues for sale of
goods and services ($193 million), fines, fees and other revenues ($89 million) and other dividends and
distributions ($138 million).
An overview of the Budget Result compared to the Original Budget estimates is outlined in detail in Note 33:
‘Budgetary Information on 2018-19 General Government Sector Financial Statements’, in the Total State
Sector Accounts.

General Government Sector Results
Report on State Finances 2018-19 4 - 3
Chart 4.1 shows the main changes between the 2017-18 Budget Result and the 2018-19 Budget Result.
Chart 4.1: Key Changes in Budget Result in 2018-19
-
1,000
2,000
3,000
4,000
5,000
6,000
7,000
2018 CommonwealthGrants
Taxation Revenue Dividends, IncomeTax Equivalents
and OtherDistr ibutions
Other Revenue Grant Expenses EmployeeExpenses
Other Expenses 2019
$ m
illions
Total revenues in 2018-19 increased by $1,018 million (1.3 per cent) compared to the 2017-18 outcome. The
increase in revenues compared to the prior year were mainly due to increases in sale of goods and services
($482 million), mining royalties ($330 million) and taxation revenues ($117 million).
The increase in sales of goods and services were mainly the result of increases in revenues generated by
Transport for NSW ($251 million) and Sydney Metro ($211 million) for major rail projects.
The increase in mining royalties of $330 million was due to the depreciation of the Australian dollar, which
increases the Australian dollar value of exports, and higher coal export volumes.
The rise in expenses was primarily driven by a growth in employee costs of $1,514 million, mainly due to
increases in front line staff, higher other operating expenses of $1,494 million, higher grants and subsidies of
$837 million and increased depreciation and amortisation of $381 million.

General Government Sector Results
4 - 4 Report on State Finances 2018-19
The year-on-year increase in expenses was 5.5% in 2018-19, which is consistent with the Government’s
fiscal target of maintaining annual expense growth below the long-term average revenue growth rate of
5.6%. As illustrated in chart 4.2 average expense growth rate has remained below the long-term average
revenue growth rate since 2012-13.
Chart 4.2: Average Revenue and Expense Growth(a) – 2002-03 to 2018-19 (including the retrospective impact of AASB 119)
0.0
1.0
2.0
3.0
4.0
5.0
6.0
7.0
8.0
Pe
r c
en
t
Long-term average general government revenue growth Average revenue growth (4 year)
0.0
1.0
2.0
3.0
4.0
5.0
6.0
7.0
8.0
9.0
Pe
r c
en
t
Long-term average general government revenue growth Average expenses growth (4 year)
(a) Four-year average per cent change to indicated year.
4.3 Revenue
General Government Sector revenues were $81,690 million and increased by $1,018 million (1.3 per cent)
over 2017-18.
Taxation revenues and Commonwealth grants represent approximately 40 per cent of total revenues each,
with the remaining 20 per cent split between sale of goods and services and other revenues. The makeup of
total revenues is illustrated in Chart 4.3 and has remained broadly the same compared to the prior year.

General Government Sector Results
Report on State Finances 2018-19 4 - 5
Chart 4.3: Components of General Government Sector Revenue 2018-19
State Taxation38.5%
Commonwealth Grants (other than GST)
16.4%
Commonwealth Grants representing GST
21.9%
Sale of Goods and Serv ices
11.0%
Other Rev enues12.2%
Tax Revenues
Tax revenues in 2018-19 were $31,443 million, $117 million higher than 2017-18. Transfer duties decreased
by $1,237 million compared to the prior year reflecting the slowdown in the residential property market. The
decrease in transfer duty revenues was offset by increases in payroll tax of $522 million, land tax of
$481 million, gambling and betting taxes of $284 million and other taxes and levies of $67 million.
The three largest state taxes: stamp duty on property transfers (transfer duty), payroll tax and land tax,
together provided around 73 per cent of state taxation revenue in 2018-19. Transfer duty in 2018-19 (which
is a key component of stamp duty) was lower (-3.4 per cent) than expected in the 2018-19 Budget and
$1,237 million lower than 2017-18 reflecting reductions in residential property transaction volumes and
prices, partially offset by one-off additional transfer duty due to the WestConnex transaction.
Payroll tax increased by $522 million (5.9 per cent) in 2018-19, in comparison to 2017-18, reflecting
continuation of strong NSW employment growth, particularly in full time employment.
Commonwealth and Other Grants
New South Wales receives General Purpose Grants (GST), National Partnership Payments, Specific
Purpose Payments and a small number of other payments from the Commonwealth. Total Commonwealth
grants were $31,282 million in 2018-19, $91 million lower (0.3 per cent) than the prior year.
General Purpose Grants, which are comprised mostly of GST, were $17,907 million in 2018-19, $48 million
(0.3 per cent) lower than 2017-18. GST revenues from the Commonwealth Government are distributed
among States. GST revenues depend on the total amount of GST collected (pool size), population share of
NSW and the relativity calculated by the Commonwealth Grants Commission (CGC). Any change in pool
size, population share or relativity impacts the State’s financial result. GST revenue was marginally lower
than expected due to a downward revision to the GST pool forecast in 2018-19 and minor adjustments to
NSW’s population share.
Grants for National Partnerships and Specific Purpose Payments were $12,961 million in total and broadly in
line with $12,974 million in 2017-18. Grants for National Partnerships were lower by $393 million primarily
due to lower grants for disability care ($217 million) consistent with the Commonwealth-NSW NDIS
agreement and reprofiling of major road projects ($187 million). Special Purpose grants increased by
$380 million mainly due to increased payments under the National Health Reform Agreement.
Other grants and subsidies (excluding Commonwealth grants) were $566 million in 2018-19, which was
$78 million higher than the prior year mainly due to increases in grants and subsidies received by Ministry of
Health.

General Government Sector Results
4 - 6 Report on State Finances 2018-19
Other Revenues
Other revenues include the sales of goods and services, dividends from government businesses, other
dividends and distributions, interest, fines and fees.
Dividends received from government businesses are a return on investment in those businesses.
Government businesses also make tax equivalent payments to the State, which ensure competitive neutrality
with businesses in the private sector.
In total, dividends, tax equivalent payments and other distributions of $3,866 million in 2018-19, were
$174 million higher than the prior year. This included:
• returns from TCorp IM Funds schemes were $1,715 million, which was $29 million higher than the prior
year ($1,686 million in 2017-18)
• dividends and tax equivalent distributions from TCorp were $155 million, $128 million higher than the
prior year. The timing and quantum of TCorp’s dividends is determined in consultation with NSW
Treasury, who take into account returns across all of the State’s commercial assets
• dividends and tax equivalent payments from the water sector were $1,290 million, $337 million higher
than the prior year mainly due to higher dividends and tax distribution from Sydney Water of $330 million
• total distributions from Landcom were $202 million ($316 million in 2017-18)
• dividends and tax distributions from the retained interests in Ausgrid and Endeavour Energy and
Essential Energy were $267 million in 2018-19 which was $34 million lower than the prior year
distributions from energy investments
• dividends from Sydney Motorway Corporation and the State’s retained interest in WestConnex was
$167 million in 2018-19 ($Nil 2017-18).
Sales of goods and services in 2018-19 at $8,990 million were $482 million or 5.7 per cent higher than the
prior year, in part reflecting higher fees for services provided by Transport for NSW to Railcorp to produce
plant and equipment.
Fines, Regulatory fees and other revenue in 2018-19 at $5,051 million in total were $321 million higher than
the prior year, primarily due to the increase in mining royalties of $330 million.

General Government Sector Results
Report on State Finances 2018-19 4 - 7
4.4 Expenses
General Government Sector expenses were $80,471 million which was higher than the original estimate set
out in the 2018-19 Budget by $815 million (1 per cent). Expenses were $4,223 million (5.5 per cent) higher
than 2017-18.
Employee expenses and superannuation together accounted for almost half of the Sector’s total expenditure.
Other operating expenses, which include maintenance expenses, costs incurred by Transport for NSW for
the delivery of major rail projects, utilities, rent, hospital medical equipment and supplies, accounted for
around a quarter of the Sector’s expenses. The remaining expenses related to grants and subsidies,
depreciation and amortisation, and interest.
Chart 4.4: General Government Sector Expenses by Class 2018-19
41.2%Employ ee
18.3%Grants & Subsidies
5.5%Superannuation
6.5%Depreciation &
Amortisation
26.3%Other Operating
2.3%Interest
Chart 4.5: General Government Sector Expenses by Cluster 2018-19
Transport14.2%
Other32.0%
Justice9.2%
Health27.3%
Education17.3%

General Government Sector Results
4 - 8 Report on State Finances 2018-19
Employee Expenses
Employee related costs were $1,514 million (4.8 per cent) higher than 2017-18 reflecting government policy
decisions to invest more in front line services. Government initiatives, spanning 2011 to the present,
including the NSW Public Sector Wages Policy and the Labour Expense Cap continue to help manage
employee expenses growth. Key components of the increase were:
• wage inflation increases ($725 million) in line with the wages policy of 2.5 per cent
• increase in frontline services ($789 million) particularly in Health, Education, Justice and Service NSW
• increased workers’ compensation and long service leave costs ($148 million), which can vary
significantly year on year reflecting the expenses in workers compensation claims paid
• partially offset by lower restructuring and short-term staff costs ($124 million) across a number of
agencies
• superannuation expenses were $4,464 million in 2018-19, which was in line with the prior year
($4,467 million).
Grant Expenses
Recurrent grants and subsidies were $13,595 million, $687 million (5.3 per cent) higher than 2017-18 and
capital grants and subsidies were $1,105 million, $150 million higher than 2017-18. In total grants and
subsidies expenses were $837 million (6 per cent) higher than prior year. This reflected:
• higher grants paid by Family and Community Services of $274 million for services provided by
non-government organisations for the delivery of aging, disability (including NDIS), out of home care and
other community services
• grants from Sydney Metro of $357 million for the transfer of assets to local councils
• increased grants from Department of Education of $126 million for the new non-government schools
funding agreement with Commonwealth
• increased grants from NSW Rural Assistance Authority of $110 million as part of the Emergency Drought
Relief Package.

General Government Sector Results
Report on State Finances 2018-19 4 - 9
Other Expenses
Other expenses comprise depreciation and amortisation, interest and other operating expenses.
Depreciation and amortisation expenses were $5,192 million, $381 million in total higher than in 2017-18.
Depreciation expenses of $4,429 million relate to property, plant and equipment assets with a net carrying
value at 30 June 2019 of $221.8 billion.
Interest expenses in 2018-19 of $1,812 million were in line with 2017-18.
Other operating expenses were $21,146 million, $1,494 million higher than 2017-18. This reflected:
• increases incurred by Transport for NSW of $616 million, mainly in relation to increases in major rail
projects in 2018-19
• Sydney Metro of $229 million (first year operating expenses) mainly due to Railcorp funded projects
• increases incurred by Ministry of Health of $253 million as a result of higher activity and inflation, with
resulting increases in visiting medical officer costs, medical and surgical supplies and information
management expenses
• increase of $213 million incurred by Department of Education reflecting increased investment in school
operating expenses including teaching tools and information technology resources
• General price and volume increases across a range of agencies.
4.5 Comprehensive Result
The General Government Sector Comprehensive Result was a loss of $1,924 million compared to
$30,595 million in 2017-18, a reduction of $32,519 million over the prior year. The comprehensive result
represents the net result of all items of income and expense recognised for the period. It is therefore the
aggregate of the operating result and other movements in equity, within the General Government Sector.
Significant changes in the comprehensive result compared to the prior year were due to:
• a large superannuation actuarial loss in 2018-19 compared to an actuarial gain in the prior year leading
to a year on year change of negative $15,780 million. In 2018-19, decreases in the discount rate, in line
with Government bond rates, used to value superannuation liabilities resulted in a large actuarial loss
compared to a relatively small actuarial gain in the prior year (refer to 4.11 for further details on
superannuation liabilities)
• a loss on equity investments and investments in other sectors in 2018-19 of $7,888 million, compared to
a gain in the prior year of $6,296 million reflecting:
- the 2018-19 loss of $7,888 million, primarily driven by decrease in net worth valuations across a
number of PNFC and PFC entities including TCorp ($2,936 million), Rail Corporation NSW ($1,433
million), Sydney Trains ($754 million) and City West Housing ($680 million)
- the prior year gain of $6,296 million, primarily driven by increase in gains in New South Wales Land
and Housing Corporation ($4,781 million), TCorp ($594 million) and Sydney Water Corporation
($508 million).
• a reduction in the Budget Surplus ($3,206 million)
• increased losses on liabilities ($2,087 million) due to actuarial adjustments on liabilities for long service
and recreation leave and insurance claim provisions
• a reduction in the gain on revaluations of property, plant and equipment assets ($10,383 million)
• an increase in other net gains in the Operating result ($13,629 million) primarily due to the gain on sale
of WestConnex, of $13,201 million.

General Government Sector Results
4 - 10 Report on State Finances 2018-19
4.6 Capital Expenditure
General Government Sector capital expenditure during 2018-19 was $16,623 million. This is $4,502 million
higher than the prior year, an increase of 37.1 per cent. This continues the record level of capital spend in
the General Government sector in New South Wales, reflecting the Government’s commitment to
infrastructure investment.
The capital investment program is designed to provide a strong foundation for economic growth and to
maintain and improve the standard of public services provided to New South Wales residents. Adding to
infrastructure allows New South Wales to better manage the increase in population and economic activity
over the coming decades. The investment also supports jobs and delivers productivity enhancements over
the longer term.
Major projects progressed during 2018-19 included:
• Sydney Metro City and Southwest ($1,841 million)
• Pacific Highway - Woolgoolga to Ballina ($1,268 million)
• Westmead Hospital Redevelopment Stage 1 ($264 million).
In addition, a number of major projects were completed in the year. These included:
• North West Metro
• Newcastle Light Rail
• Broken Hill Water Pipeline
• Northern Beaches Hospital
• Western Sydney Stadium
Chart 4.6: Distribution of Capital Expenditure for 2018-19
Transport62.6%
Other6.8%
Justice7.4%
Health13.4%
Education9.8%
In 2018-19, $5,646 million ($3,593 million in 2017-18) in General Government capital expenditure was
funded from the Restart NSW Fund (Restart NSW). In 2011, the Government established Restart NSW to
improve the economic growth and productivity of the State by enabling high priority infrastructure projects to
be funded by the proceeds of asset sales. Restart NSW is the vehicle for the delivery of the Rebuilding NSW
plan, which is the Government’s 10-year plan to invest $20 billion in new infrastructure funded by the lease of
49 per cent of the NSW electricity network businesses, Commonwealth Government Asset Recycling
Initiative payments, and investment earnings.
Restart NSW had received $33.3 billion in inflows as at 30 June 2019, an increase of $2.5 billion since
30 June 2018. The increase in inflows is primarily due to investment earnings and receipts from Waratah
Bonds. Other sources of Restart NSW inflows include proceeds from asset recycling transactions and GST
refunds.

General Government Sector Results
Report on State Finances 2018-19 4 - 11
As at the 2019-20 Budget, a total of $24.8 billion was committed for infrastructure projects from Restart
NSW, including $17.3 billion for the Rebuilding NSW plan. A further $8.3 billion was reserved in Restart NSW
for identified project and programs. For further information on Restart, refer to Section 3 of 2019-20 Budget
Paper 2.
4.7 Net Lending
The Net Lending Result is a proxy for the annual financing requirement of the Government, taking into
account both recurrent and capital transactions.
The General Government Sector Net Lending/(Borrowing) Result was a borrowing position of $9,280 million
in 2018-19 compared to a net borrowing position of $2,580 million in 2017-18 representing an increase in net
borrowing of $6,700 million from the prior year. This was mainly due to higher net acquisition of non-financial
assets of $3,493 million and the lower budget surplus of $3,206 million relative to 2017-18.
4.8 Cash Result
The Cash Result was a deficit of $10,307 million, a decrease of $8,211 million over the prior year deficit of
$2,096 million. The decrease in the cash result reflects the lower budget surplus and higher net purchases of
non-financial assets due to the commitment to expenditure on key infrastructure investment.
4.9 Balance Sheet
Table 4.2: General Government Sector Key Financial Indicators – Balance Sheet Performance
Total Assets $b 381.5 389.6 403.9 402.3
Total Liabilities $b 129.4 119.5 141.9 152.1
Net Worth $b 252.1 270.1 262.0 250.2
Net Unfunded Superannuation Liability $b 54.2 45.6 61.0 67.7
Net Debt $b (11.2) 2.6 (8.8) (10.4)
Net Debt as a % of GSP(c) % -1.9% 0.4% -1.4% -1.7%
Net Financial Liabilities (NFL) $b 69.1 71.1 73.6 81.2
NFL as a % of GSP(c) % 11.4% 11.3% 11.8% 13.0%
Key Financial Indicators (GGS) - Statement of Financial Position
Actual
2018
Restated(a)
Original
Budget 2019
Revised
Estimate(b)
2019
Actual
2019
(a) Refer Note 31 Restatement/Corrections to Prior Year Comparatives, for details of corrections to Prior Period. (b) Revised Estimate for 2018-19 as presented in the 2019-20 Budget Papers. (c) GSP actuals for 2018-19 not released at the time of publication. Numbers reflect 2018-19 GSP forecasts from the 2019-20 Budget.

General Government Sector Results
4 - 12 Report on State Finances 2018-19
4.10 Total Assets
Assets comprise non-financial and financial assets. The graph below illustrates the breakdown of General
Government asset holdings as at 2018-19.
Chart 4.7: Distribution of Total Assets as at 30 June 2019
Other Non-Financial Assets 2.7%
Cash and Cash Equiv alents 0.5%
Other Financial Assets14.1%
Equity Inv estments27.6%
Property , Plant and Equipment 55.0%
Non-Financial Assets
The main components of the non-financial assets at 30 June 2019 are Property Plant and Equipment
(PP&E). These accounted for 55 per cent of the General Government total assets at 30 June 2019. The
value of PP&E increased by a net amount of $24,864 million relative to 30 June 2018. This mainly reflects
additions of $16,574 million, assets transferred from other sectors of $5,514 million and revaluations of
$7,205 million, partially offset by depreciation of $4,429 million.
Revaluations in 2018-19 of $7,205 million were driven by revaluations of assets which increased the fair
value of the assets.
• Infrastructure Systems held by Roads and Maritime Services ($3,508 million), Sydney Metro
($560 million) and Office of Environment and Heritage ($471 million).
• Land and Buildings held by Ministry of Health ($1,839 million), Fire and Rescue ($147 million), Property
NSW ($101 million) and Department of Industry ($95 million).
Financial Assets
Cash and cash equivalents were $1,969 million in 2018-19 (2017-18: $5,417 million). The lower level of cash
reflects the actions the Government has taken to improve its cash and asset management as set out in
Chapter 7 in Budget Paper 1 of the 2018-19 Budget. Effective management of the State’s liquidity is part of
the Government’s strategy of effective and efficient balance sheet management. Strategies being employed
ensure that the State continues to hold and is able to access an adequate level of liquidity against its future
obligations, and any surplus holdings are put to better use.
Major transactions during the 2018-19 year that impacted on the cash position include the continued record
investment in NSW infrastructure projects, investment in Restart NSW, and Social and Affordable Housing
Fund (SAHF).
The proceeds from certain major asset transactions are deposited in the State’s dedicated infrastructure fund
Restart NSW, to fund the delivery of major capital infrastructure projects across the State. At 30 June 2019,
there was $18,984 million held in Restart NSW (30 June 2018: $21,054 million). Of this, $707 million
(2018: $1,607 million) was held in cash and $18,277 million (2018: $19,447 million) invested in the NSW
Infrastructure Future Fund. The lower holdings in Restart NSW/NIFF are primarily due to funds being drawn
down in support delivery of the Restart NSW/Rebuilding NSW programs/projects.

General Government Sector Results
Report on State Finances 2018-19 4 - 13
In November 2018, the Government established the NSW Generations Fund (NGF), which was seeded with
$10 billion through a combination of WestConnex transaction proceeds and balance sheet reserves. At
30 June 2019, the NGF balance was $10,884 million.
Equity investments were $111,053 million at 30 June 2019, which was $8,567 million lower than the prior
year. The decrease is mainly due to the decreased net worth in PNFCs and PFCs held in the General
Government sector, partially offset by the State’s retained interest in the WestConnex Group. (Refer to Note
10 Equity Investments)
4.11 Total Liabilities
The graph below displays the distribution of the General Government’s liabilities by class. The majority of
these liabilities relate to employee and superannuation provisions, which together accounted for
58.2 per cent of the General Government’s obligations at 30 June 2019. Additionally, the General
Government’s borrowings contributed 24.9 per cent.
Chart 4.8: Distribution of Total Liabilities as at 30 June 2019
Borrowings24.9%
Employ ee Prov isions13.7%
Superannuation Prov ision44.5%
Other Prov isions7.6%
Other Liabilities9.3%
Superannuation Liabilities
Superannuation liabilities represent the actuarially assessed obligations for past and present employees less
the net market value of scheme assets set aside to meet these obligations. During 2018-19, net unfunded
superannuation liabilities increased by $13,496 million to $67,696 million. The increase in the
superannuation liabilities was driven by a significant fall in the 10-year Commonwealth Government bond
rate, from 2.65% on 30 June 2018 to 1.32% on 30 June 2019. This was partially offset by the Government’s
funding contributions and higher than expected investment returns on the fund’s assets.
In accordance with the accounting standard AASB 119 Employee Benefits, the State uses the 10-year
Commonwealth Government bond yields at 30 June (discount rate) to revalue the superannuation liabilities.
The superannuation liabilities are very sensitive to changes in the discount rate. At 30 June 2019, interest
rate level 1 per cent increase in the discount rate can reduce the valuation of the liabilities by around
$14,229 million while a 1 per cent decrease in the discount rate would increase the valuation by an
estimated $17,494 million.
Fund assets are invested for the longer term with the expectation that, while there may be short term
volatility, over time returns will be enhanced.

General Government Sector Results
4 - 14 Report on State Finances 2018-19
The most recent triennial review of the State’s superannuation liabilities was completed in October 2018 by
PWC, with the next actuarial review due before the end of 2021. This review determines the sufficiency of
funding for the State’s defined benefit schemes based on the latest demographic and economic
assumptions. The 2018 review concluded the Government’s current contribution plan is on track to be fully
funded by 2030.
The Government will continue to review the current funding plan to ensure the commitment is met.
Employee Provisions and Other Provisions
Employee provisions include annual and long service leave and self-funded obligations for workers
compensation. The total provision in 2018-19 ($20,802 million) is higher by $2,787 million than the prior year
(2018: $18,015 million). The movement in employee provisions was impacted by the increase in long service
leave provisions of $1,701 million and an increase in the provisions for Self Funded Workers Compensation
by $654 million. The increase in long service leave provisions was primarily due to changes in discount rates
used to calculate the present value of anticipated future payments.
Other provisions in 2018-19 were $11,604 million, an increase of $1,394 million compared to 2017-18. Other
provisions primarily comprise insurance obligations, liabilities for dust disease claims, university
superannuation, and provisions for land remediation and restoration costs. The increase in other provisions
compared to the prior year is largely due to changes to discount rates used to calculate the present value of
future payments.
4.12 Net Worth
Net worth is the difference between total assets and total liabilities. Net worth of the General Government
Sector for the year ended 30 June 2019 was $250,172 million, a decrease of $1,923 million (0.8 per cent)
from the prior year (2018: $252,095 million).
The decrease in net worth is equal to the Comprehensive result of the General Government Sector for
2018-19. As outlined in section 4.5 in this document, the Comprehensive Result was mainly driven by:
• net losses of $23,752 million, driven by Superannuation actuarial adjustments ($13,364 million), equity
investments in the non-GG sector due to fair-value adjustments ($7,888 million), and long service,
recreation leave and insurance claim provisions ($2,500 million) due to actuarial adjustments
• net gains of $20,406 million from the sale of WestConnex ($13,201 million), and revaluations of property,
plant and equipment assets ($7,205 million)
• the Budget Result surplus of $1,219 million for the year.
4.13 Net Debt
The General Government Sector net debt was negative $10,401 million at 30 June 2019, or negative
1.7 per cent of GSP. The negative net debt result was supported by the WestConnex transaction that was
concluded in September 2018 and an increase in financial assets due to better than expected returns from
the State’s investment funds. At 30 June 2018 net debt was negative $11,195 million.
The Government’s strategy for funding its infrastructure program helps ensure that the State maintains
sustainable levels of debt consistent with a triple-A credit rating. This is achieved by utilising a mix of
non-debt funding sources such as net operating cash and the proceeds from asset recycling. In addition, the
continued implementation of the Government’s balance sheet reform agenda ensures it has been able to
minimise the state’s reliance upon borrowings to fund infrastructure.

General Government Sector Results
Report on State Finances 2018-19 4 - 15
Chart 4.9: Net Debt and Net Debt as a percentage of GSP
-2.0%
-1.6%
-1.2%
-0.8%
-0.4%
0.0%
0.4%
0.8%
1.2%
1.6%
2.0%
2.4%
2.8%
3.2%
-12.0
-10.0
-8.0
-6.0
-4.0
-2.0
0.0
2.0
4.0
6.0
8.0
10.0
12.0
14.0
16.0
2010 2011 2012 2013 2014 2015 2016 2017 2018 2019
Net D
ebt as %
of
GS
P
Net D
ebt ($
b)
Net Debt Net Debt as a percentage of Gross State Product
Table 4.3: General Government Sector – Net Debt
Actual
June 2018
Restated(a)
Actual
June 2019
$b $b
Cash and Cash Equivalents 5.4 2.0
Investments, Loans and Placements 38.1 45.9
Advances Paid 1.0 1.2
Deposits Held (0.1) (0.1)
Borrowings and Derivatives at Fair Value (0.0) (0.2)
Borrowings at Amortised Cost (32.4) (37.7)
Advances Received (0.8) (0.8)
Net Debt (11.2) (10.4)
Net Debt as a % of GSP(b) -1.9% -1.7%
(a) Refer Note 31 Restatement/Corrections to Prior Year Comparatives, for details of corrections to Prior Period. (b) GSP actuals for 2018-19 not released at the time of publication. Numbers reflect 2018-19 GSP forecasts from the 2019-20 Budget.

General Government Sector Results
4 - 16 Report on State Finances 2018-19
4.14 Net Financial Liabilities
Net financial liabilities represent total liabilities less financial assets, other than equity in publicly owned
corporations.
This comprises net debt, unfunded superannuation liabilities, employee provisions and other provisions,
including insurance obligations and land remediation, after deducting other net liabilities and financial assets.
Net financial liabilities at 30 June 2019 were $81,194 million, which was $12,126 million higher than the prior
year. This increase was primarily due to the increases in superannuation provisions of $13,496 million,
borrowings of $5,215 million and employee provisions of $2,787 million as explained in Total Liabilities
section of this report, partially offset by increases in financial assets other than equity in publicly owned
corporations of $10,600 million.
As a percentage of forecast GSP, net financial liabilities increased to 13.0 per cent at 30 June 2019, from
11.4 per cent at 30 June 2018 (refer Table 4.4).
Table 4.4: General Government Sector – Net Financial Liabilities
Actual
June 2018
Restated(a)
Actual
June 2019
$b $b
Net Debt (11.2) (10.4)
Superannuation Provision 54.2 67.7
Employee Provisions 18.0 20.8
Insurance Obligations and Other Provisions 10.2 11.6
Other Net Liabilities / (Assets) (2.1) (8.5)
Net Financial Liabilities (NFL) 69.1 81.2
NFL as a % of GSP(b) 11.4% 13.0%
(a) Refer Note 31 Restatement/Corrections to Prior Year Comparatives, for details of corrections to Prior Period. (b) GSP actuals for 2018-19 not released at the time of publication. Numbers reflect 2018-19 GSP forecasts from the 2019-20 Budget.

Report on State Finances 2018-19 5 - 1
5. TOTAL STATE SECTOR RESULTS
The Total State Sector (TSS) comprises the GGS, PNFC and PFC sectors. TSS results reflect the
Government’s ongoing commitment to effective financial management.
The Net Operating Balance in 2018-19 was a deficit of $1.8 billion, representing a decrease of $4.6 billion
compared to 2017-18. This lower budget result was primarily due to increased expenditure on frontline
service delivery and increases in other operating costs in the general government sector.
Total State Sector revenue for 2018-19 was $86.1 billion, $0.6 billion (0.6 per cent) lower than the prior
year, primarily due to lower Sales of Goods and Services ($0.4 billion) and lower interest revenue
($0.3 billion).
Higher expenses of $4.0 billion resulted from increases in employee related costs of $1.5 billion, increases
in other operating costs of $1.5 billion, increases in grants and subsidies of $0.8 billion and increases in
depreciation and amortisation of $0.4 billion.
Capital expenditure of $21.8 billion was $3.9 billion higher than in 2017-18. In addition to the record level of
capital spend in the General Government sector, spend in the PNFC sector reflected significant investments
in major rail projects of $2.1 billion, water utilities of $1.3 billion and Sydney Motor Corporation spend on
WestConnex Motorway of $0.6 billion.
Net debt of the Total State Sector as at 30 June 2019 was $23.9 billion or 3.8 per cent of forecast GSP.
This compares to net debt at 30 June 2018 of $15.8 billion or 2.6 per cent of GSP. The increase in net debt
is largely driven by pre-funding future borrowing requirements for infrastructure investment to take
advantage of historically low interest rates.
Net financial liabilities at 30 June 2019 were $116.4 billion, or 18.6 per cent of forecast GSP, which was
$17.1 billion higher than in 30 June 2018 of $99.3 billion (16.4 per cent of GSP). This was primarily due to
the increase in superannuation provisions of $14.3 billion resulting from the changes in the discount rate
used to calculate the present values of future obligations at 30 June 2019 and the increases in 2018-19 of
employee and other provisions of $5.6 billion, which were also impacted by the change in discount rates.
These increases were partially offset by the state’s investment in WestConnex Motorway (pre sale) of
$6.4 billion.
Net worth of the Total State Sector for the year ended 30 June 2019 was $250.2 billion which was
marginally lower than the prior year by $1.9 billion (2018: $252.1 billion). This net decrease was the result of
the Comprehensive Income in 2018-19 for the Total State Sector.

Total State Sector Results
5 - 2 Report on State Finances 2018-19
5.1 Operating Result
Table 5.1: Total State Sector Key Financial Indicators – Statement of Comprehensive Income
Total State Sector
Revenue $b 86.7 84.8 85.0 86.1
Expenses $b 83.9 87.0 87.3 87.9
Transactions from Discontinued
Operations$b … … (0.0) 0.0
Budget Result (Net Operating Balance) $b 2.8 (2.2) (2.3) (1.8)
Comprehensive Result $b 30.6 9.1 7.8 (1.9)
Gross Capital Expenditure $b 17.9 24.5 23.2 21.8
Cash Result $b (1.6) (13.5) (11.5) (14.0)
Net Lending/(Borrowing) $b (6.7) (17.8) (17.0) (14.6)
Key Financial Indicators (TSS) - Statement of Comprehensive Income
Actual
2017-18
Restated(a)
Original
Budget 2018-19
Revised
Estimate(b)
2018-19
Actual
2018-19
(a) Refer Note 31 Restatement/Corrections to Prior Year Comparatives, for details of corrections to Prior Period. (b) Revised Estimate for 2018-19 as presented in the 2019-20 Budget Submissions.
5.2 Net Operating Balance
The Net Operating Balance for the Total State Sector was a deficit of $1,780 million. The Net Operating
Balance comprises State revenues less expenses from transactions prepared in accordance with Australian
Accounting Standards.
Chart 5.1: Total State Sector Revenue and Expenses – 2009-10 to 2018-19
0.0
10.0
20.0
30.0
40.0
50.0
60.0
70.0
80.0
90.0
2009-10 2010-11 2011-12 2012-13 2013-14 2014-15 2015-16 2016-17 2017-18 2018-19
($b
)
Total Revenue Tota l Expenses
Note: Historic expenditure figures between 2009-10 and 2012-13 have been adjusted to incorporate the retrospective application of the revised standard on employee benefits (AASB 119).

Total State Sector Results
Report on State Finances 2018-19 5 - 3
5.3 Revenue
Total State Sector revenue for 2018-19 was $86,093 million, $604 million (0.6 per cent) lower than 2017-18.
Total State Sector revenues comprised: revenues from taxation $30,940 million; grants from the
Commonwealth Government $31,285 million; sales of goods and services $14,819 million; and other
revenues $9,049 million.
Chart 5.2: Total State Sector Revenue 2018-19
State Taxation35.9%
Commonwealth Grants (other than GST)
20.7%
Commonwealth Grants representing GST
15.6%
Sale of Goods and Serv ices
17.2%
Other Rev enues10.5%
Taxation revenues were $30,940 million, $99 million higher than 2017-18. The key drivers behind this were:
• an increase in payroll tax of $517 million reflecting stronger employment growth particularly in full-time
employment and wages growth,
• an increase in land tax of $469 million reflecting growth in land values supported by the three year
averages utilised for land valuation assessments,
• an increase in gambling, motor vehicle and other taxes of $349 million,
• stamp duty significantly decreased in 2018-19 reflecting lower transaction volumes and prices. The
impact of this was reduced by the transfer duty received on the WestConnex transaction resulting in a
net decrease for the year of $1,237 million.
Commonwealth grants were $31,285 million, a decrease of $92 million (0.3 per cent) on 2017-18. This
variation was related to decreases in National Partnership Payments of $393 million, mainly due to reduced
grants to Department of Family and Community Services for the transfer of care responsibilities, reprofiling of
major Transport projects, decreases in GST revenues of $60 million and decreases in other Commonwealth
payments of $30 million, largely offset by increases in Specific Purpose grants of $380 million due to higher
grants to Ministry of Health in line with increased activity and Education under the National Education Reform
Agreement.
Sales of goods and services were $395 million lower than in 2017-18. This mainly reflects lower revenues in
the PNFC sector of $795 million, mainly due to Westconnex transaction. This loss of revenue was partially
offset by increases in the General Government sector of $482 million.
Other dividends and distributions were $122 million lower than in 2017-18 mainly reflecting marginally lower
investment returns on TCorp IM Fund investments.
Note 2 Revenue to the Consolidated Financial Statements details the revenues by class and their
components.

Total State Sector Results
5 - 4 Report on State Finances 2018-19
5.4 Expenses
Total State Sector expenses were $87,881 million, $4,006 million higher than in 2017-18.
Employee expenses and superannuation together accounts for 46 per cent of the State’s total expenditure.
Other operating expenses, which includes maintenance expenses, utilities, rent, medical equipment and
supplies, accounts for 28 per cent of the State’s expenses. The remaining expenses relate to grants and
subsidies, depreciation and amortisation and interest, account for 26 per cent of the State’s expenses.
Chart 5.3: Total State Sector Expenses 2018-19
Employ ee40.4%
Grants & Subsidies13.3%
Superannuation5.5%
Depreciation & Amortisation
9.1%
Other Operating28.2%
Interest3.6%
Employee expenses (excluding superannuation) were $35,544 million, $1,477 million (4.3 per cent) higher
than 2017-18, which was largely attributable to movements in the General Government sector. Increases in
employee expenses in 2018-19 were a result of wage increases consistent with the Government’s wages
policy of 2.5 per cent and increased front line staff associated with growth in services, particularly in health,
plus increases in workers compensation and long service leave costs.
Depreciation and amortisation expense rose by $437 million (5.8 per cent) to $8,016 million during 2018-19.
5.5 Comprehensive Result
The Comprehensive Result for 2018-19 was a deficit of $1,924 million ($30,595 million surplus in 2017-18).
The decrease of $32,519 million was primarily due to a decrease in the net operating balance of
$4,602 million, increased losses on long service leave and insurance liabilities of $2,530 million due to
discount rate changes, lower revaluation gains of $17,084 million and increased actuarial losses on
Superannuation of $16,680 million, partially offset by the increases in other net gains of $10,161 million
mainly due to the gain on the WestConnex sale, which generated a net gain on sale of $13,225 million.
Revaluation gains in 2018-19 of $7,454 million were $17,084 million lower than the prior year.
2018-19 revaluation gains included:
• Infrastructure Systems held by Roads and Maritime Services ($3,508 million), Sydney Metro
($560 million) and Office of Environment and Heritage ($471 million).
• Land and Buildings held by Ministry of Health ($1,839 million), Fire and Rescue ($147 million), Property
NSW ($101 million) and Department of Industry ($95 million).
Total State Sector Results
Report on State Finances 2018-19 5 - 5
5.6 Capital Expenditure
Capital expenditure of $21,827 million was $3,919 million higher than in 2017-18.
Agencies with significant capital expenditure programs in 2018-19 included:
• Roads and Maritime Services ($5,515 million), including expenditure on Pacific Highway Woolgoolga to
Ballina, WestConnex, M4 Smart Motorway, Western Sydney Infra Package (WSIP) roads and New
England highway projects
• Sydney Metro ($3,720 million)
• Transport for NSW ($1,187 million)
• Ministry of Health ($2,222 million)
• Rail Corporation NSW ($2,105 million)
• Department of Education ($1,632 million)
• Sydney Water Corporation, Water NSW and Hunter Water Corporation combined spend ($1,319 million)
• Department of Justice ($874 million)
• Sydney Motor Corporation spend on the WestConnex Motorway ($622 million)
• NSW Land and Housing Corporation ($329 million).
5.7 Net Lending/(Borrowing)
In 2018-19 the Net Lending Result was a deficit of $14,595 million, an increase in the deficit of $7,894 million
in comparison to 2017-18. This increase is attributable to the decrease in the net operating balance of
$4,602 million and the increase in net acquisition of non-financial assets of $3,293 million.
5.8 Cash Result
In 2018-19, the cash result was a deficit of $13,975 million, an increase in the cash result deficit of
$12,353 million over the prior year. The deficit in cash result reflects the decrease in net cash flows from
operating activities of $7,792 million and the increase in net acquisition costs of non-financial assets of
$4,561 million due to continued record investment in infrastructure projects.
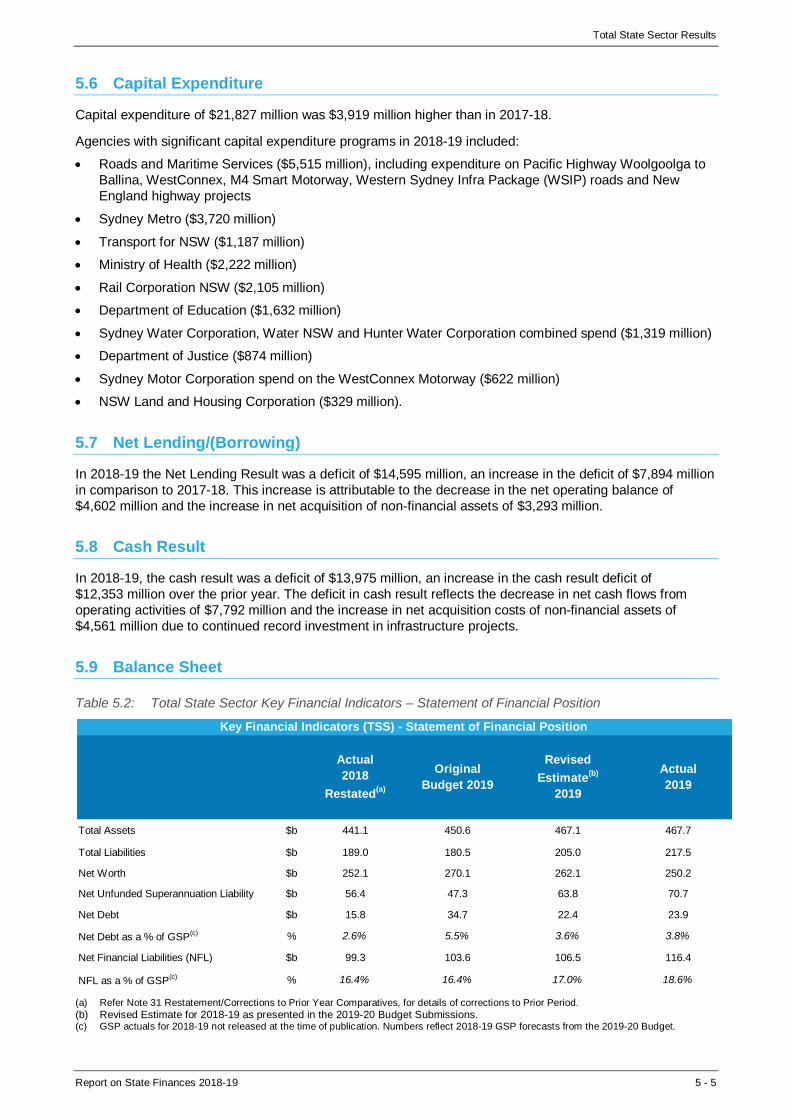
5.9 Balance Sheet
Table 5.2: Total State Sector Key Financial Indicators – Statement of Financial Position
Total Assets $b 441.1 450.6 467.1 467.7
Total Liabilities $b 189.0 180.5 205.0 217.5
Net Worth $b 252.1 270.1 262.1 250.2
Net Unfunded Superannuation Liability $b 56.4 47.3 63.8 70.7
Net Debt $b 15.8 34.7 22.4 23.9
Net Debt as a % of GSP(c) % 2.6% 5.5% 3.6% 3.8%
Net Financial Liabilities (NFL) $b 99.3 103.6 106.5 116.4
NFL as a % of GSP(c) % 16.4% 16.4% 17.0% 18.6%
Key Financial Indicators (TSS) - Statement of Financial Position
Actual
2018
Restated(a)
Original
Budget 2019
Revised
Estimate(b)
2019
Actual
2019
(a) Refer Note 31 Restatement/Corrections to Prior Year Comparatives, for details of corrections to Prior Period.
(b) Revised Estimate for 2018-19 as presented in the 2019-20 Budget Submissions. (c) GSP actuals for 2018-19 not released at the time of publication. Numbers reflect 2018-19 GSP forecasts from the 2019-20 Budget.

Total State Sector Results
5 - 6 Report on State Finances 2018-19
5.10 Net Worth
Net worth represents the difference between total assets and total liabilities. Net worth of the Total State
Sector for the year ended 30 June 2019 was $250,172 million which was lower than the prior year by
$1,923 million (2018: $252,095 million). This variation is equal to the comprehensive result and, in terms of
the balance sheet, is reflected in the net increase in total liabilities less financial assets of $17,140 million
offset by the increase in non-financial assets of $15,216 million.
The net increase in total liabilities less financial assets was largely attributable to the increases in
superannuation provisions of $14,290 million, which was largely the result of changes to discount rates used
to calculate the present value of future obligations.
The increase in non-financial assets was primarily driven by the additions and revaluations to property, plant
and equipment offset by disposals as detailed in Note 13 Property, Plant and Equipment. Non-financial
assets include infrastructure items such as public schools, hospitals, roads, bridges, transport, public
housing, sporting facilities, electricity assets and water assets.
As the Total State Sector consolidates the General Government, PFC and PNFC sectors, it results in the net
worth of the General Government Sector and the Total State Sector being the same.
5.11 Net Debt
Net debt comprises borrowings, advances received and deposits held, less cash and cash equivalent assets,
financial assets at fair value, other financial assets and advances paid.
During 2018-19, the net debt of the Total State Sector increased by $8,147 million. At 30 June 2019, the net
debt was $23,909 million or 3.8 per cent of forecast GSP. At 30 June 2018, net debt was $15,762 million or
2.6 per cent of GSP. The increase in net debt is largely the result of higher borrowings and derivatives at fair
value ($8.9 billion) driven by pre-funding future borrowing requirements to take advantage of historically low
interest rates, additional general government and water utility borrowings and an increase in the market
value of borrowings. This has been partially offset by higher investments, loans and placements
($5.2 billion), largely from the investment of pre-funded amounts.
Table 5.3: Total State Sector – Net Debt
Actual
June 2018
Restated(a)
Actual
June 2019
$b $b
Cash and Cash Equivalents 14.0 9.0
Investments, Loans and Placements 42.1 47.4
Advances Paid 0.6 0.7
Deposits Held (0.4) (0.3)
Borrowings and Derivatives at Fair Value (63.8) (72.8)
Borrowings at Amortised Cost (7.5) (7.2)
Advances Received (0.8) (0.8)
Net Debt 15.8 24.0
Net Debt as a % of GSP(b) 2.6% 3.8%
(a) Refer Note 31 Restatement/Corrections to Prior Year Comparatives, for details of corrections to Prior Period. (b) GSP actuals for 2018-19 not released at the time of publication. Numbers reflect 2018-19 GSP forecasts from the 2019-20 Budget.

Total State Sector Results
Report on State Finances 2018-19 5 - 7
5.12 Net Financial Liabilities
Net financial liabilities at 30 June 2019 were $116,429 million, or 18.6 per cent of forecast GSP, which was
$17,140 million higher than in 30 June 2018 of $99,289 million (16.4 per cent of GSP). This was primarily
due to the increase in superannuation provisions of $14,290 million resulting from actuarial assessments
performed at 30 June 2019 partially offset by the increase of $10,117 million in equity investments, which
increased primarily as a result of the recognition of the State’s 49 per cent share of the WestConnex Group
($6,424 million) and due to the increase in value of the State’s equity investment in the TCorp IM Fund Trust
($4,937 million).
Table 5.4: Total State Sector – Net Financial Liabilities
Actual
June 2018
Restated(a)
Actual
June 2019
$b $b
Net Debt 15.8 23.9
Superannuation Liabilities 56.4 70.7
Employment Provision 19.1 22.0
Insurance Obligations and Other Provisions 15.4 18.2
Other Net Liabilities / (Assets) (7.4) (18.3)
Net Financial Liabilities 99.3 116.4
NFL as a % of GSP(b) 16.4% 18.6%
(a) Refer Note 31 Restatement/Corrections to Prior Year Comparatives, for details of corrections to Prior Period. (b) GSP actuals for 2018-19 not released at the time of publication. Numbers reflect 2018-19 GSP forecasts from the 2019-20 Budget.


Report on State Finances 2018-19 6 - 1
6. ANNEXURES
The Fiscal Responsibility Act 2012 requires the Budget to include: a fiscal strategy statement; a report on
performance against the Act’s objective, targets and principles; an explanation of any departures from the
objective, targets or principles along with a plan to restore compliance; and an assessment of the impact of
Budget measures on the long-term fiscal gap. Every five years, the Budget is to include an updated
Long-Term Fiscal Pressures Report and a reassessment of the long-term fiscal gap. The last report was
released on 26 May 2016 and can be found at http://www.treasury.nsw.gov.au/intergenerational-report - the next
report scheduled for release in 2021.
The financial results for 2018-19 are consistent with the Government’s fiscal strategy, with a budget surplus
in 2018-19 of $1.2 billion.
Performance against the Object, Targets and Principles of the Fiscal Responsibility Act 2012
The 2018-19 actual results have been assessed against the object, targets and principles of the Fiscal
Responsibility Act 2012 to provide a status update against each measure below.
Item 2019-20 Budget Status 2018-19 State Finances (End of Year Status Update)
Maintain the State’s
triple-A credit rating
New South Wales’ triple-A credit ratings were reaffirmed by
international credit rating agencies Moody’s and Standard & Poor’s
in their latest credit opinions prior to the 2019-20 Budget released
in September 2018.
Moody’s reaffirmed the State’s1
triple-A rating on 11th September
2019.
Standard & Poor’s reaffirmed the
State’s triple-A rating on 25th
September 2019.
Maintain annual
expense growth below
long-term average
revenue growth
The Fiscal Responsibility Regulation 2013 defines long-term
average general government revenue growth as 5.6 per cent.
The 2019-20 Budget estimated expense growth of 5.0 per cent in
2018-19.
Expense growth was 5.5 per cent in
2018-19, 0.1 percentage points
below the Act’s target.
Eliminate the State’s
unfunded
superannuation
liabilities by 2030
The most recent triennial actuarial review of superannuation
liabilities was completed in October 2018 by an independent
actuary. The review found that, based on the current Crown
funding plan, New South Wales remains on track to fully fund the
State’s superannuation liabilities by 2030, in line with the target.
The next triennial review will be undertaken in the second half of
2021.
As per the 2019-20 Budget Status.
Responsible and
sustainable spending,
taxation and
infrastructure
investment
The 2019-20 Budget projects budget surpluses to assist in funding
the Government’s record infrastructure program in a sustainable
way. Taxation policies remain stable and predictable, with the ratio
of tax revenue to GSP declining from 5.4 per cent in 2015-16 to
5.0 per cent in 2018-19 and remaining in line with that ratio over
the forward estimates.
The 2019-20 budget projected record capital expenditure of
$71.7 billion over the four years to 2022-23 in the General
Government Sector. Funding this record infrastructure program
while maintaining manageable levels of debt consistent with a
triple-A credit rating is achieved through delivering budget
surpluses and utilising non-debt funding sources such as the
proceeds of asset recycling through Restart NSW.
Expenses were maintained below
revenue in 2018-19, delivering an
net operating surplus to assist in
funding the State’s infrastructure
program.
General Government Sector capital
expenditure was $16.6 billion in
2018-19, with Restart NSW funding
$5.6 billion of this.

Annexures
6 - 2 Report on State Finances 2018-19
Item 2019-20 Budget Status 2018-19 State Finances (End of Year Status Update)
Effective financial and
asset management
The Government has continued its strategy of balance sheet
reform, following the successful creation of specific purpose funds
such as the NSW Generations Fund (NGF) – the State’s dedicated
debt retirement fund, and the NSW Infrastructure Future Fund
(NIFF) – the investment vehicle for the State’s asset recycling
initiative. These reforms of the State’s financial assets are
complemented by further improvements in the management of the
State’s borrowings, cash balances and associated financial risks.
Key reforms include:
• the Government has diversified its funding sources by issuing
its first green bond in November 2018, raising $1.8 billion in
funding.
• implementing a new whole-of-government cash management
policy, which complements the whole-of-government foreign
exchange risk management policy.
• enacting the Government Sector Finance Act 2018 which
supports balance sheet reforms, including a centralised
approach to cash management.
• entering into a multi-provider banking services contract that
covers all Government transactions including payments,
receipts, cross-border banking and purchasing cards.
As at 30 June 2019, the NGF
contained cash and financial assets
valued at $10.9 billion dedicated
towards debt retirement.
Achieving
intergenerational
equity
The effect of government policies on intergenerational equity is
measured by the change in the long-term fiscal gap from one
budget to the next. Each budget reports the impact of budget
measures on the long-term fiscal gap, which is a summary
indicator of the budget’s effect on future generations.
The 2016 Intergenerational Report highlighted that if current trends
continue, a widening fiscal gap will emerge where expenditure
would exceed revenues resulting in a fiscal gap of 3.4 per cent of
GSP by 2055-56. The Report outlines that ageing will contribute to
higher demand for government services and infrastructure, and
this will tend to widen the fiscal gap between revenues and
spending requirements.
The measures in the 2019-20 Budget do not materially impact on
the long-term fiscal gap estimate. Restraining an increase in the
fiscal gap is demonstrated by delivering consecutive operating
surpluses and utilising non-debt sources to help fund the
infrastructure program. This ensures current generations fund the
cost of services used and limits the financial burden shifted from
current to future taxpayers.
Continuing progress towards fully funding the State’s unfunded
superannuation liabilities by 2030 further enhances
intergenerational equity by ensuring the pension liabilities of the
current generation are not being funded by future generations.
To further support intergenerational equity, the Government
became the first state in Australia to create a vehicle to support
intergenerational equity by establishing the NSW Generations
Fund in 2018.
As per the 2019-20 Budget Status.

Total State Sector Accounts 7 - 1
Total State Sector Accounts
2018 – 2019
Audited Consolidated Financial Statements
of the NSW General Government
and Total State Sectors
7 - 2 Total State Sector Accounts
STATEMENT OF COMPLIANCE In our opinion the Total State Sector Accounts:
• have been prepared on the basis of the financial reporting requirements as prescribed in the Public
Finance and Audit Act 1983, and
• are in accordance with AASB 1049 Whole of Government and General Government Sector Financial
Reporting and all other Australian Accounting Standards.
The Hon. Dominic Perrottet MP Michael Pratt AM Stewart Walters Treasurer Secretary Chief Financial and Operations Officer Treasury Treasury
4 October 2019

Total State Sector Accounts 7 - 3

7 - 4 Total State Sector Accounts

Total State Sector Accounts 7 - 5
7 - 6 Total State Sector Accounts
Total State Sector Accounts 7 - 7

7 - 8 Total State Sector Accounts

The NSW Consolidated Statement of Comprehensive Income for the Year Ended 30 June 2019
Total State Sector Accounts 7 - 9
z
General
Government Sector Total State Sector
2018-19 2017-18
Restated(a) 2018-19 2017-18
Restated(a) FROM CONTINUING OPERATIONS Note $m $m $m $m
Revenue from Transactions
Taxation 2 31,443 31,326 30,940 30,841
Grants and Subsidies
Commonwealth General Purpose 2 17,907 17,955 17,907 17,955
Commonwealth Specific Purpose Payments 2 10,224 9,844 10,224 9,844
Commonwealth National Partnership Payments 2 2,737 3,129 2,737 3,129
Other Grants and Subsidies 2 981 931 900 998
Sale of Goods and Services 2 8,990 8,508 14,819 15,214
Interest 2 491 558 801 1,072
Dividend and Income Tax Equivalents from Other Sectors 2 1,932 1,578 ... ...
Other Dividends and Distributions 2 1,934 2,114 2,025 2,147
Fines, Regulatory Fees and Other 2 5,051 4,730 5,739 5,497
Total Revenue from Transactions 81,690 80,672 86,093 86,697
Expenses from Transactions
Employee 3 33,158 31,644 35,544 34,067
Superannuation
Superannuation Interest Cost 3 1,412 1,458 1,466 1,513
Other Superannuation 3 3,052 3,009 3,250 3,222
Depreciation and Amortisation(a) 3 5,192 4,811 8,016 7,579
Interest(a) 3 1,812 1,812 3,137 3,338
Other Operating Expense 3 21,146 19,652 24,805 23,277
Grants and Subsidies
Recurrent Grants and Subsidies 3 13,595 12,908 10,921 10,304
Capital Grants 3 1,105 955 741 576
Total Expenses from Transactions 80,471 76,248 87,881 83,875
Transactions from Discontinuing Operations 5 ... ... 8 ...
NET RESULT FROM TRANSACTIONS - NET OPERATING BALANCE (BUDGET RESULT FOR THE GENERAL GOVERNMENT
SECTOR)
1,219 4,425 (1,780) 2,822
(a) Refer Note 31 Restatement/Corrections to Prior Year Comparatives, for details of corrections to prior period.
The Statements of Comprehensive Income should be read in conjunction with the accompanying notes.

The NSW Consolidated Statement of Comprehensive Income for the Year Ended 30 June 2019
7 - 10 Total State Sector Accounts
General
Government Sector Total State Sector
2018-19 2017-18
Restated(a) 2018-19 2017-18
Restated(a) Note $m $m $m $m
NET OPERATING BALANCE 1,219 4,425 (1,780) 2,822
OTHER ECONOMIC FLOWS - INCLUDED IN THE OPERATING RESULT
Gain/(Loss) from Liabilities(a) 4 (2,500) (413) (3,218) (688)
Other Net Gains/(Losses) 4 13,700 71 11,332 1,171
Share of Earnings/(Losses) from Equity Investments (excl. Dividends) 4 (1) 160 (1) 160
Dividends from Asset Sale Proceeds 4 (0) 0 ... ...
Deferred Income Tax from Other Sectors 4 (97) (17) ... ...
Other 4 14 0 10 0
Discontinuing Operations - Other Economic Flows 5 (0) ... (0) ...
Other Economic Flows - included in Operating Result 11,117 (198) 8,123 643
OPERATING RESULT 12,335 4,226 6,343 3,465
OTHER ECONOMIC FLOWS - OTHER COMPREHENSIVE INCOME
Items that will not be Reclassified to Operating Result
Revaluations 13 7,205 17,588 7,454 24,538
Share of Associate's Other Comprehensive Income/(Loss) that will
not be Reclassified Subsequently to Operating Result (10) (42) (10) (42)
Actuarial Gain/(Loss) from Superannuation 22 (13,364) 2,416 (14,120) 2,560
Net Gain/(Loss) on Equity Instruments at Fair Value through Other
Comprehensive Income (7,888) ... (618) ...
Deferred Tax Direct to Equity 151 96 ... ...
Items that may be Reclassified Subsequently to Operating Result
Net Gain/(Loss) on Equity Investments in Other Sectors ... 6,296 ... 21
Net Gain/(Loss) on Financial Instruments at Fair Value 19 2 16 (6)
Share of Associate's Other Comprehensive Income/(Loss) that may
be Reclassified Subsequently to Operating Result (538) ... (538) ...
Other 166 15 (450) 60
Other Economic Flows - Other Comprehensive Income (14,259) 26,369 (8,267) 27,130
COMPREHENSIVE RESULT - TOTAL CHANGE IN NET WORTH
BEFORE TRANSACTIONS WITH OWNERS AS OWNERS (1,924) 30,595 (1,924) 30,595
KEY FISCAL AGGREGATES
COMPREHENSIVE RESULT - TOTAL CHANGE IN NET WORTH
BEFORE TRANSACTIONS WITH OWNERS AS OWNERS (1,924) 30,595 (1,924) 30,595
Less: Net Other Economic Flows 3,142 (26,171) 144 (27,773)
NET OPERATING BALANCE 1,219 4,425 (1,780) 2,822
Less: Net Acquisition of Non-Financial Assets
Purchases of Non-Financial Assets 16,464 11,969 21,668 17,753
Sales of Non-Financial Assets (966) (437) (1,317) (1,140)
Less: Depreciation and Amortisation(a) (5,192) (4,811) (8,016) (7,579)
Plus: Change in Inventories 38 6 (34) (10)
Plus: Other Movements in Non-Financial Assets
Assets Acquired Using Finance Leases 159 152 159 155
Other (4) 126 357 344
Equals Total Net Acquisition of Non-Financial Assets 10,498 7,005 12,816 9,523
EQUALS: NET LENDING/(BORROWING) (9,280) (2,580) (14,595) (6,701)
(a) Refer Note 31 Restatement/Corrections to Prior Year Comparatives, for details of corrections to prior period.
The Statements of Comprehensive Income should be read in conjunction with the accompanying notes.

The NSW Consolidated Statements of Changes in Equity for the Year Ended 30 June 2019
Total State Sector Accounts 7 - 11
2018-19 Equity at
1 July 2018
Correction to Prior Period(a)
Equity at 1 July 2018
Restated(a)
AASB 9 Transition
adjustment(b) Comprehensive
Result(b)
Transfers between
equity classes
Equity at 30 June
2019 $m $m $m $m $m $m $m
General Government Sector
Accumulated Funds 78,327 (2,084) 76,243 14 (701) (187) 75,368
Reserves
Asset Revaluation Surplus 90,248 ... 90,248 ... 7,205 (250) 97,202
Equity Investment Revaluation
Surplus/Hedge Reserve in Associate 25 ... 25 ... (548) (33) (556)
Hedging Reserve (17) ... (17) ... 19 (0) 1
Available for Sale Reserve 85,597 ... 85,597 (85,597) ... ... ...
Financial Assets at Fair Value through
Other Comprehensive Income ... ... ... 85,573 (7,888) 470 78,155
Other ... ... ... ... ... 0 0
254,179 (2,084) 252,095 (10) (1,914) ... 250,172
Total State Sector
Accumulated Funds 101,764 (2,084) 99,680 (1) (8,217) 977 92,438
Reserves
Asset Revaluation Surplus 152,341 ... 152,341 ... 7,454 (1,503) 158,293
Equity Investment Revaluation
Surplus/Hedge Reserve in Associate 25 ... 25 ... (548) (33) (556)
Hedging Reserve (135) ... (135) ... 16 118 (1)
Available for Sale Reserve 157 ... 157 (157) ... ... ...
Financial Assets at Fair Value through
Other Comprehensive Income ... ... ... 148 (618) 470 ...
Other 28 ... 28 ... ... (28) ...
254,179 (2,084) 252,095 (10) (1,914) ... 250,172
2017-18
Equity at
1 July 2017
Correction to Prior Period(a)
Equity at 1 July 2017
Restated(a) Comprehensive
Result
Transfers between equity
classes
Equity at 30 June
2018 Restated(a)
$m $m $m $m $m $m
General Government Sector
Accumulated Funds 73,520 (2,146) 71,374 6,753 (1,882) 76,243
Reserves
Asset Revaluation Surplus 70,814 ... 70,814 17,588 1,846 90,248
Equity Investment Revaluation
Surplus/Hedge Reserve in Associate 37 ... 37 (42) 30 25
Hedging Reserve (10) ... (10) 2 (9) (17)
Available for Sale Reserve 79,286 ... 79,286 6,296 16 85,597
Other ... ... ... ... ... ...
223,645 (2,146) 221,499 30,595 ... 252,095
Total State Sector
Accumulated Funds 94,501 (2,146) 92,355 6,085 1,240 99,680
Reserves
Asset Revaluation Surplus 129,061 ... 129,061 24,538 (1,259) 152,341
Equity Investment Revaluation
Surplus/Hedge Reserve in Associate 38 ... 38 (42) 29 25
Hedging Reserve (119) ... (119) (6) (10) (135)
Available for Sale Reserve 136 ... 136 21 ... 157
Other 28 ... 28 ... ... 28
223,645 (2,146) 221,499 30,595 ... 252,095
(a) Refer Note 31 Restatement/Corrections to Prior Year Comparatives, for details of corrections to prior period. (b) The Statement of Comprehensive Income includes the AASB 9 transition adjustments in the ‘Other Comprehensive Income'.
The Statements of Changes in Equity should be read in conjunction with the accompanying notes.

The NSW Consolidated Statements of Financial Position as at 30 June 2019
7 - 12 Total State Sector Accounts
General Government Sector Total State Sector
2019 2018 Restated(a)
1 July 2017 Restated(a)
2019 2018 Restated(a)
1 July 2017 Restated(a)
Note $m $m $m $m $m $m
ASSETS
Financial Assets Cash and Cash Equivalents(a) 6 1,969 5,417 8,731 8,979 13,969 13,855
Receivables 7 7,491 6,721 6,216 7,527 6,547 6,722
Investments, Loans and Placements
Financial Assets at Fair Value(a) 8 43,333 32,578 26,561 44,560 37,643 32,557
Other Financial Assets 8 2,591 5,556 6,778 2,793 4,456 7,923
Advances Paid 9 1,193 1,017 1,005 715 644 616
Tax Equivalents Receivable 16 32 128 91 ... ... ...
Deferred Tax Equivalents Asset 16 2,245 2,192 2,049 ... ... ...
Equity Investments
Investments in Other Public Sector Entities 10 98,990 112,911 106,355 ... ... ...
Investments in Associates 10 12,055 5,987 5,870 12,057 5,988 5,872
Other Equity Investments 10 8 722 700 24,468 20,420 17,617
Equity Investments Held for Sale ... ... 4,196 ... ... 4,196
Total Financial Assets
169,907 173,228 168,553 101,099 89,666 89,358
Non-Financial Assets
Inventories 11 399 327 296 873 826 838
Forestry Stock and Other Biological Assets 10 9 10 1,181 993 1,003
Assets Classified as Held for Sale 12 222 320 155 283 430 338
Investment Properties ... ... … 648 644 534
Property, Plant and Equipment
Land and Buildings 13 89,963 83,390 72,752 166,346 161,627 143,394
Plant and Equipment 13 12,088 10,941 10,178 18,075 17,367 15,709
Infrastructure Systems(a) 13 119,291 102,147 90,001 167,936 158,158 144,839
Intangibles 14 3,694 3,691 3,448 4,809 4,745 4,423
Other Non-Financial Assets 15 6,707 7,426 4,935 6,449 6,594 4,909
Total Non-Financial Assets
232,375 208,252 181,775 366,601 351,384 315,988
TOTAL ASSETS 402,282 381,480 350,328 467,699 441,051 405,346
LIABILITIES
Deposits Held 17 67 130 106 293 385 328
Payables 18 7,079 7,251 6,385 8,357 8,833 8,118
Liabilities Directly Associated with Assets Held
for Sale ... ... ... ... ... 4
Borrowings and Derivatives at Fair Value 19 207 5 6 72,757 63,836 63,630
Borrowings at Amortised Cost 20 37,656 32,441 32,808 7,151 7,457 6,963
Advances Received 756 797 812 756 797 812
Employee Provisions 21 20,802 18,015 17,146 21,969 19,106 18,257
Superannuation Provision 22 67,696 54,200 56,285 70,711 56,421 58,601
Tax Equivalents Payable 16 3 3 18 ... ... ...
Deferred Tax Equivalent Provision 16 108 112 59 ... ... ...
Other Provisions 23 11,604 10,210 9,453 18,185 15,400 13,925
Other Liabilities 24 6,134 6,223 5,752 17,350 16,721 13,209
TOTAL LIABILITIES 152,110 129,385 128,829 217,528 188,956 183,847
NET ASSETS 250,172 252,095 221,499 250,172 252,095 221,499
NET WORTH Accumulated Funds(a) 75,367 76,243 71,374 92,438 99,680 92,355
Reserves 174,804 175,852 150,125 157,734 152,415 129,145
TOTAL NET WORTH 250,172 252,095 221,499 250,172 252,095 221,499
OTHER FISCAL AGGREGATES Net Debt (10,401) (11,195) (9,344) 23,909 15,762 16,782
Net Financial Liabilities 81,194 69,068 66,632 116,429 99,289 94,489
(a) Refer Note 31 Restatement/Corrections to Prior Year Comparatives, for details of corrections to prior period.
The Statements of Financial Position should be read in conjunction with the accompanying notes.

The NSW Consolidated Statement of Cash Flow for the Year Ended 30 June 2019
Total State Sector Accounts 7 - 13
General
Government Sector Total State Sector(a)
2018-19 2017-18 2018-19 2017-18 Restated(b)
Note $m $m $m $m
CASH FLOWS FROM OPERATING ACTIVITIES
Receipts
Taxation 31,020 31,218 30,536 30,740
Sale of Goods and Services 9,360 9,334 15,553 15,902
Grants and Subsidies 31,810 31,852 31,723 31,909
Interest 518 457 862 1,288
Dividends and Income Tax Equivalents from Other Sectors 1,897 1,031 ... ...
Other
12,226 12,113 13,880 13,423
Total Receipts 86,830 86,006 92,554 93,263
Payments
Employee Related (31,896) (30,693) (34,235) (33,134)
Superannuation (4,325) (4,262) (4,542) (4,476)
Payments for Goods and Services (20,874) (20,027) (23,747) (22,244)
Grants and Subsidies (13,739) (13,221) (10,701) (10,162)
Interest (1,455) (1,508) (2,897) (3,228)
Other (7,213) (5,588) (7,914) (3,709)
Total Payments (79,502) (75,300) (84,037) (76,954)
NET CASH FLOWS FROM OPERATING ACTIVITIES 6 7,328 10,706 8,517 16,309
CASH FLOWS FROM INVESTING ACTIVITIES
Non-Financial Assets
Proceeds from Sale of Non-Financial Assets 452 521 807 1,229
Purchases (18,087) (13,323) (23,298) (19,160)
Net Cash Flows from Investments in Non-Financial Assets (17,635) (12,802) (22,492) (17,931)
Financial Assets (Policy Purposes) Receipts 18,026 808 17,995 78
Payments (2,341) (1,382) (1,679) (85)
Net Cash Flows from Investments in Financial Assets
(Policy Purposes) 15,685 (574) 16,316 (7)
Financial Assets (Liquidity Purposes)
Proceeds from Sale of Investments 10,029 9,471 12,618 14,709
Purchase of Investments(b) (23,904) (8,988) (28,126) (13,444)
Net Cash Flows from Investments in Financial Assets
(Liquidity Purposes)(b)
(13,875) 482 (15,508) 1,265
NET CASH FLOWS FROM INVESTING ACTIVITIES(b) (15,825) (12,894) (21,684) (16,673)
CASH FLOWS FROM FINANCING ACTIVITIES
Advances Received 56 30 56 30
Advances Repaid (125) (70) (125) (70)
Proceeds from Borrowings 5,561 957 64,090 67,631
Repayments of Borrowings (612) (1,773) (55,885) (67,333)
Deposits Received/(Paid) - Net 19 24 (2) 82
Other - Net 151 94 30 (55)
NET CASH FLOWS FROM FINANCING ACTIVITIES 5,050 (738) 8,164 285
NET INCREASE IN CASH AND CASH EQUIVALENTS(b) (3,448) (2,925) (5,003) (78)
Opening Cash and Cash Equivalents 5,417 8,731 13,969 13,855
Reclassification of Cash Equivalents and Other Adjustments (1) (388) 12 192
CLOSING CASH AND CASH EQUIVALENTS(b) 6 1,969 5,417 8,979 13,969
DERIVATION OF CASH RESULT
Net Cash Flows from Operating Activities 7,328 10,706 8,517 16,309
Net Cash Flows from Investments in Non-Financial Assets (17,635) (12,802) (22,492) (17,931)
CASH SURPLUS/(DEFICIT) (10,307) (2,096) (13,975) (1,622)
(a) The Statement of Cash Flows is presented to include both continuing and discontinued operations; amounts related to discontinued operations are disclosed in Note 5 Discontinued Operations.
(b) Refer Note 31 Restatement/Corrections to Prior Year Comparatives, for details of corrections to prior period.
The Statements of Cash Flows should be read in conjunction with the accompanying notes.

Notes to the Financial Statements
7 - 14 Total State Sector Accounts
Notes to the Financial Statements
Accounting Policies
Note 1: Statement of Significant Accounting Policies .......................................................................... 7 - 15
Statement of Comprehensive Income
Note 2: Revenue ............................................................................................................................... 7 - 27
Note 3: Expenses .............................................................................................................................. 7 - 33
Note 4: Other Economic Flows Included in the Operating Result ......................................................... 7 - 36
Note 5: Discontinued Operations ........................................................................................................ 7 - 37
Assets
Note 6: Cash and Cash Equivalents ................................................................................................... 7 - 38
Note 7: Receivables .......................................................................................................................... 7 - 42
Note 8: Investments, Loans and Placements ...................................................................................... 7 - 43
Note 9: Advances Paid ...................................................................................................................... 7 - 44
Note 10: Equity Investments ................................................................................................................ 7 - 45
Note 11: Inventories ............................................................................................................................ 7 - 49
Note 12: Assets Classified as Held for Sale .......................................................................................... 7 - 50
Note 13: Property, Plant and Equipment............................................................................................... 7 - 51
Note 14: Intangibles............................................................................................................................. 7 - 61
Note 15: Other Non-Financial Assets ................................................................................................... 7 - 64
Note 16: Income Tax Equivalents ......................................................................................................... 7 - 66
Liabilities
Note 17: Deposits Held ........................................................................................................................ 7 - 66
Note 18: Payables ............................................................................................................................... 7 - 67
Note 19: Borrowings and Derivative Liabilities at Fair Value .................................................................. 7 - 68
Note 20: Borrowings at Amortised Cost ................................................................................................ 7 - 69
Note 21: Employee Provisions ............................................................................................................. 7 - 69
Note 22: Superannuation Provisions .................................................................................................... 7 - 70
Note 23: Other Provisions .................................................................................................................... 7 - 82
Note 24: Other Liabilities...................................................................................................................... 7 - 87
Financial Instruments
Note 25: Financial Instruments ............................................................................................................. 7 - 88
Other Information
Note 26: Trusts Under Management .................................................................................................... 7 - 122
Note 27: Finance and Operating Leases .............................................................................................. 7 - 122
Note 28: Expenditure Commitments ..................................................................................................... 7 - 125
Note 29: Contingent Assets and Contingent Liabilities .......................................................................... 7 - 126
Note 30: Events after the Reporting Period ........................................................................................... 7 - 131
Note 31: Restatement/Corrections to Prior Years.................................................................................. 7 - 133
Note 32: Related Party Disclosures ...................................................................................................... 7 - 136
Budgetary Information
Note 33: Budgetary Information on 2018-19 General Government Sector Financial Statements ............. 7 - 137
Government Finance Statistics
Note 34: Disaggregated Financial Statements ...................................................................................... 7 - 146
Note 35: Key Fiscal Aggregates and Reconciliations to Government Finance Statistics ......................... 7 - 161
Note 36: Details of Consolidated Entities .............................................................................................. 7 - 167
Details of Consolidated Entities and Key Terms
Note 37: Key Technical Terms used in the Financial Statements........................................................... 7 - 172

Note 1
Total State Sector Accounts 7 - 15
Note 1: Statement of Significant Accounting Policies
Scope
The Total State Sector comprises the General Government Sector, the Public Non-Financial Corporation
(PNFC) Sector and the Public Financial Corporation (PFC) Sector. These sectors are determined in
accordance with the principles and rules contained in the Australian Bureau of Statistics Australian System of
Government Finance Statistics: Concepts, Sources and Methods 2015 (cat. No.5514) (ABS GFS Manual) as
amended from time to time.
The New South Wales Total State Sector and General Government Sector have applied, where appropriate,
not-for-profit Australian accounting standards.
The financial statements of the Total State Sector and General Government Sector for the year ended
30 June 2019 were authorised for issue by the Treasurer on 4 October 2019. This report was issued from:
Treasury
52 Martin Place
Sydney NSW 2000
AUSTRALIA
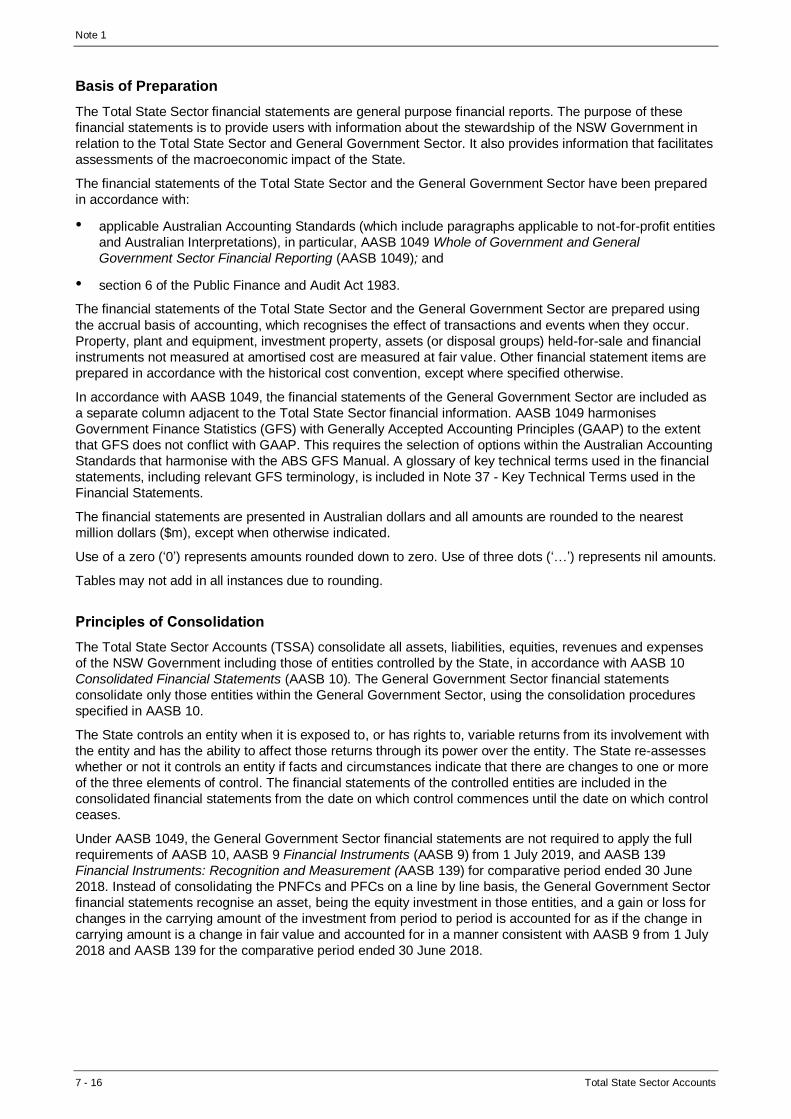
Note 1
7 - 16 Total State Sector Accounts
Basis of Preparation
The Total State Sector financial statements are general purpose financial reports. The purpose of these
financial statements is to provide users with information about the stewardship of the NSW Government in
relation to the Total State Sector and General Government Sector. It also provides information that facilitates
assessments of the macroeconomic impact of the State.
The financial statements of the Total State Sector and the General Government Sector have been prepared
in accordance with:
• applicable Australian Accounting Standards (which include paragraphs applicable to not-for-profit entities
and Australian Interpretations), in particular, AASB 1049 Whole of Government and General
Government Sector Financial Reporting (AASB 1049); and
• section 6 of the Public Finance and Audit Act 1983.
The financial statements of the Total State Sector and the General Government Sector are prepared using
the accrual basis of accounting, which recognises the effect of transactions and events when they occur.
Property, plant and equipment, investment property, assets (or disposal groups) held-for-sale and financial
instruments not measured at amortised cost are measured at fair value. Other financial statement items are
prepared in accordance with the historical cost convention, except where specified otherwise.
In accordance with AASB 1049, the financial statements of the General Government Sector are included as
a separate column adjacent to the Total State Sector financial information. AASB 1049 harmonises
Government Finance Statistics (GFS) with Generally Accepted Accounting Principles (GAAP) to the extent
that GFS does not conflict with GAAP. This requires the selection of options within the Australian Accounting
Standards that harmonise with the ABS GFS Manual. A glossary of key technical terms used in the financial
statements, including relevant GFS terminology, is included in Note 37 - Key Technical Terms used in the
Financial Statements.
The financial statements are presented in Australian dollars and all amounts are rounded to the nearest
million dollars ($m), except when otherwise indicated.
Use of a zero (‘0’) represents amounts rounded down to zero. Use of three dots (‘…’) represents nil amounts.
Tables may not add in all instances due to rounding.
Principles of Consolidation
The Total State Sector Accounts (TSSA) consolidate all assets, liabilities, equities, revenues and expenses
of the NSW Government including those of entities controlled by the State, in accordance with AASB 10
Consolidated Financial Statements (AASB 10). The General Government Sector financial statements
consolidate only those entities within the General Government Sector, using the consolidation procedures
specified in AASB 10.
The State controls an entity when it is exposed to, or has rights to, variable returns from its involvement with
the entity and has the ability to affect those returns through its power over the entity. The State re-assesses
whether or not it controls an entity if facts and circumstances indicate that there are changes to one or more
of the three elements of control. The financial statements of the controlled entities are included in the
consolidated financial statements from the date on which control commences until the date on which control
ceases.
Under AASB 1049, the General Government Sector financial statements are not required to apply the full
requirements of AASB 10, AASB 9 Financial Instruments (AASB 9) from 1 July 2019, and AASB 139
Financial Instruments: Recognition and Measurement (AASB 139) for comparative period ended 30 June
2018. Instead of consolidating the PNFCs and PFCs on a line by line basis, the General Government Sector
financial statements recognise an asset, being the equity investment in those entities, and a gain or loss for
changes in the carrying amount of the investment from period to period is accounted for as if the change in
carrying amount is a change in fair value and accounted for in a manner consistent with AASB 9 from 1 July
2018 and AASB 139 for the comparative period ended 30 June 2018.

Note 1
Total State Sector Accounts 7 - 17
Entities which are not controlled by the State, including local government bodies, universities, certain reserve
trusts created under the Crown Land Management Act 2016, hospitals listed under Schedule 3 of the Health
Services Act 1997, the State's Superannuation Funds, trust funds under management that are not controlled,
the NSW Aboriginal Land Council and most professional registration and marketing authorities, are not
consolidated into the financial statements of the State. In preparing consolidated financial statements, all
transactions and balances between NSW government agencies (for the TSSA) and between General
Government Sector agencies (for the General Government Sector financial statements) have been
eliminated. Where agencies adopt dissimilar accounting policies and their effect is considered material,
adjustments are made to ensure consistent policies are adopted.
If the State loses control over an entity, it derecognises the related assets (including goodwill), liabilities and
other components of equity, while any resultant gain or loss is recognised in the operating result. Any
investment retained is recognised at fair value.
Details of consolidated entities are included in Note 36: Details of Consolidated Entities.
Presentation in the 2018-19 Financial Statements
All amounts are rounded to the nearest one million dollars and are expressed in Australian currency, which is
the State’s presentation and functional currency.
Previous year balances have been reclassified in a number of notes to better reflect the nature of the
transactions. These reclassifications do not have an impact on the presentation of the primary financial
statements.
Revenue
Revenue is recognised to the extent that it is probable that the economic benefits will flow to the State and
the revenue can be reliably measured, regardless of when the payment is received. Revenue is measured at
the fair value of the consideration or contribution received or receivable, taking into account contractually
defined terms of payment. The specific policies adopted for the recognition of significant categories of
revenue are discussed in Note 2: Revenue.
Expenses
Expenses are transactions that result in a reduction of net worth. Expenses are recognised when the
transaction occurs. The specific policies adopted for the recognition of significant categories of expenses are
discussed in Note 3: Expenses.
Volunteer Services
Under AASB 1004 Contributions, contributions of services will be recognised as revenue and expense when
the fair value of those services can be reliably measured, and the services would have been purchased if not
donated.
The operations of volunteer services are dependent on the services provided by volunteer firefighters,
emergency service volunteers, and other volunteers. Their contributions are essential to the provision of a
comprehensive, efficient and effective emergency services through NSW.
The contribution and cost of the volunteer services has not been recognised in the financial statements of
the States as the services donated would not be purchased. The state does not currently purchase
alternative services when volunteer numbers fluctuate.
Statement of Comprehensive Income Presentation
All amounts included in the comprehensive result (total change in net worth before transactions with owners
as owners) are classified as ‘transactions’ or ‘other economic flows’ consistent with the principles in the ABS
GFS Manual and AASB 1049.
‘Transactions’ are a result of mutually agreed interactions between parties. ‘Other economic flows’ result
from a change in the volume or value of an asset or liability that does not result from a ‘transaction’, including
revaluations resulting from changes in market prices and other gains and losses that result from changes in
the volume of assets.

Note 1
7 - 18 Total State Sector Accounts
‘Other economic flows’ are separated between those recognised in the operating result and those
recognised as ‘other comprehensive income’.
Assets
Assets recognised in the Statement of Financial Position are classified into financial and non-financial
assets, in order of liquidity.
Liabilities
Liabilities in the Statement of Financial Position are presented in order of liquidity.
Current/Non-Current Classification
Assets and liabilities are classified as either 'current' or 'non-current' in the associated notes of the Statement
of Financial Position.
Assets are classified as 'current' where their carrying amount is expected to be realised within 12 months
after the reporting date. Liabilities are classified as 'current' when they are due to be settled within 12 months
after the reporting date, or the controlled entity does not have an unconditional right to defer settlement to
beyond 12 months after the reporting date.
All other assets and liabilities are classified as non-current.
Valuation Techniques, Inputs and Processes
A number of the State’s accounting policies and disclosures require the measurement of both financial and
non-financial assets and liabilities at fair value. Agencies are responsible for determining the appropriate
valuation techniques, inputs and processes to be undertaken to determine the fair value of their financial
assets and liabilities in accordance with AASB 13 Fair Value Measurement (AASB 13).
Fair value is the price that would be received to sell an asset or paid to transfer a liability in an orderly
transaction between market participants at the measurement date. The fair value measurement is based on
the presumption that the transaction to sell the asset or transfer the liability takes place either in the principal
market for the asset or liability or in the absence of a principal market, in the most advantageous market for
the asset or liability.
When measuring fair value in accordance with AASB 13, the valuation technique used maximises the use of
relevant observable inputs and minimises the use of unobservable inputs.
Under AASB 13, the entity categorises, for disclosure purposes, the valuation techniques based on the
inputs used in the valuation techniques as follows:
• Level 1 – quoted prices (unadjusted) in active markets for identical assets or liabilities that the entity can
access at the measurement date.
• Level 2 – inputs other than quoted prices included within Level 1 that are observable, either directly or
indirectly.
• Level 3 – inputs that are not based on observable market data (unobservable inputs).
The State recognises transfers between levels of the fair value hierarchy at the end of the reporting period
during which the change has occurred.
Refer to the relevant note for further disclosures regarding fair value measurements of financial and
non-financial assets.
Transfers between levels within the fair value hierarchy during the year are disclosed in Note 13: Property,
Plant and Equipment and Note 25: Financial Instruments.

Note 1
Total State Sector Accounts 7 - 19
Significant Accounting Judgements and Estimates
Judgements, estimates and assumptions are required to be made about the carrying values of assets and
liabilities that are not readily apparent from market observable data. The estimates and associated
assumptions are based on professional judgements derived from historical experience, independent
valuations and/or various other factors that are believed to be reasonable under the circumstances. Actual
results may differ from these estimates.
Judgements, key assumptions and estimations that have been made in the preparation of the financial
statements are outlined below and/or disclosed in the relevant notes to the financial statements.
Revisions to accounting estimates are recognised in the period in which the estimate is revised and also in
future periods that are affected by the revision. Judgements and assumptions made in the application of
Accounting Standards that have significant effects on the financial statements and estimates relate to:
• the accounting of equity investments (refer to Note 10: Equity Investments);
• the classification of non-current assets (or disposal groups) as held for sale (refer to Note 12: Assets
Classified as Held for Sale);
• the fair value of land, buildings, infrastructure, plant and equipment, and useful lives of property, plant
and equipment (PP&E) where applicable (refer to Note 13: Property, Plant and Equipment);
• the impairment of physical and intangible assets, and the associated recoverable amount (refer to
Note 13: Property, Plant and Equipment and Note 14: Intangibles);
• actuarial assumptions for employee benefit provisions and superannuation liabilities that are based on
the likely tenure of existing staff, patterns of leave claims, future salary movements and future discount
rates (refer to Note 21: Employee Provisions and Note 22: Superannuation Provisions);
• an assessment of contingent liabilities, commitments and guarantees (refer Note 29: Contingent Assets
and Contingent Liabilities);
• provisions for outstanding claims (refer to Note 23: Other Provisions); and
• the classification of finance and operating leases (refer to Note 27: Finance and Operating Leases).
Other Significant Accounting Policies
Financial Instruments
Recognition and Initial Measurement
All ‘regular way’ purchases or sales of financial assets are recognised and derecognised on a trade date
basis. Regular way purchases or sales are purchases or sales of financial assets that require delivery of
assets within the time frame established by regulation or convention in the marketplace.
A financial asset, unless it is a trade receivable without a significant financing component, or financial liability
is initially measured at fair value plus, for an item not at fair value through profit and loss (FVTPL),
transaction costs that are directly attributable to its acquisition or issue. A trade receivable without a
significant financing component is initially measured at the transaction price.
Financial Assets - Classification and Subsequent Measurement under AASB 9 (from 1 July 2018)
Financial assets of the State are classified at initial recognition as either measured at:
• amortised cost;
• fair value through other comprehensive income (FVOCI) – debt investment;
• fair value through other comprehensive income (FVOCI) – equity investment; or
• fair value through profit or loss (FVTPL).
Financial assets are classified and measured at amortised cost if they are held for the collection of
contractual cash flows solely representing payments of principal and interest.

Note 1
7 - 20 Total State Sector Accounts
The State measures debt investments at FVOCI when they are held for both collection of contractual cash
flows and for selling the financial assets, and where the asset’s cash flows represent solely payments of
principal and interest.
The State may irrevocably elect to classify equity investments at FVOCI, that would otherwise be measured
at fair value through profit or loss. These equity investments meet the definition of equity instruments under
AASB 132 Financial Instruments: Presentation (AASB 132) and are not held for trading. The classification is
determined on an instrument-by-instrument basis. Equity investments are designated at FVOCI when the
State intends to hold these investments for the medium to long-term or for policy purposes.
Financial assets at FVTPL include financial assets held for trading, financial assets designated upon initial
recognition at fair value through profit or loss, or financial assets mandatorily required to be measured at fair
value under AASB 9. Financial assets are held for trading if acquired for the purpose of selling or
repurchasing in the near term. Derivatives, including separated embedded derivatives, are also classified as
held for trading unless they are designated as effective hedging instruments. Financial assets with cash
flows that are not solely payments of principal and interest are classified and measured at fair value through
profit or loss, irrespective of the business model.
Financial Assets - Subsequent Measurement and Gains and Losses under AASB 9 (from 1 July 2018)
Financial assets at amortised cost are subsequently measured using the effective interest rate method, less
any impairment. Impairment losses are presented in ‘other economic flows – included in the operating result’.
Any gain or loss arising on derecognition is also recognised in ‘other economic flows – included in the
operating result’ together with foreign exchange gains and losses. Interest is presented as ‘revenue in
transactions’ and included in the ‘net operating balance’.
Debt investments at FVOCI are subsequently measured at fair value. Movements in the carrying amount are
taken through ‘other economic flows - other comprehensive income’, except for the recognition of impairment
and foreign exchange gains and losses which are recognised in ‘other economic flows - included in the
operating result’ and interest revenue which is recognised using the effective interest method as ‘revenue
from transactions’. When the financial asset is derecognised, the cumulative gain or loss previously
recognised in ‘other economic flows - other comprehensive income’ is reclassified from equity to ‘other
economic flows - included in the operating result’.
Equity investments at FVOCI are subsequently measured at fair value. Movements in the carrying amount
are taken through ‘other economic flows - other comprehensive income’. Gains and losses on these financial
assets are never recycled to profit or loss. Dividends are recognised as income as part of ‘revenues from
transactions’ when the right of payment has been established.
Financial assets at fair value through profit or loss are subsequently measured at fair value. A gain or loss on
a financial asset that is subsequently measured at fair value through profit or loss is recognised as ‘other
economic flows – included in the operating result’. A change in fair value excludes interest and distributions,
which are recognised as income and included as part of ‘revenues from transactions’.
Financial Assets - Impairment under AASB 9 (from 1 July 2018)
The State recognises an allowance for expected credit losses (ECLs) for all investments, guarantees and
loan commitments not held at fair value through profit and loss. ECLs are based on the difference between
the contractual cash flows and the cash flows that the State expects to receive, discounted at the original
effective interest rate. The expected cash flows will include cash flows from the sale of collateral held or
other credit enhancements that are integral to the contractual terms.
For receivables, including finance leases receivable, the State applies a simplified approach in calculating
ECLs. The State recognises a loss allowance based on lifetime ECLs at each reporting date. The State has
established a provision matrix based on its historical credit loss experience for trade receivables, adjusted for
forward looking factors specific to the receivable.
Where the State has no reasonable expectation of recovering an amount owed by a debtor, the debt is
written-off by directly reducing the receivable against the loss allowance. This occurs when the State has
ceased enforcement activity.

Note 1
Total State Sector Accounts 7 - 21
ECLs for all other debt investments not held at fair value through profit or loss are recognised in two stages.
For credit exposures for which there has not been a significant increase in credit risk since initial recognition,
ECLs are provided for credit losses that result from default events that are possible within the next 12-
months (a 12-month ECL). For those credit exposures for which there has been a significant increase in
credit risk since initial recognition, a loss allowance is required for credit losses expected over the remaining
life of the exposure, irrespective of the timing of the default (a lifetime ECL). In addition, the State considers
that there has been a significant increase in credit risk when contractual payments are more than 30 days
past due.
Equity instruments designated at FVOCI are not subject to impairment assessments.
Financial Assets - Classification and Subsequent Measurement under AASB 139 (for the
Comparative Period Ended 30 June 2018)
The State classified its financial assets into one of the following categories for the comparative period ending
30 June 2018:
• loans and receivables (at amortised cost);
• available for sale; and
• at FVTPL.
Included within financial assets at FVTPL are financial assets held for trading, derivative hedging instruments
and financial assets designated as at FVTPL. Financial assets are classified as 'held-for-trading' if they are
acquired for the purpose of selling or repurchasing in the near term. Derivatives are also classified as held-
for-trading unless they are designated as effective hedging instruments under AASB 139. Financial assets
designated at FVTPL are designated on the basis that these financial assets are managed and their
performance is evaluated on a fair value basis, in accordance with a document risk management strategy,
and information about these assets is provided internally on the basis to key management personnel.
Financial Assets - Subsequent Measurement and Gains and Losses under AASB 139 (for the
Comparative Period Ended 30 June 2018)
Financial assets classified as loans and receivables are measured at amortised cost using the effective
interest method, less any impairment. Changes are recognised in ‘other economic flows – included in the
operating result’ when impaired and derecognised, and in ‘net operating balance’ through the amortisation
process. Interest is presented as ‘revenue from transactions’ and recognised in the ‘net operating balance’.
Equity instruments designated by the State as available for sale financial assets are subsequently measured
at fair value. Gains and losses arising from changes in fair value are recognised in ‘other economic flows –
other comprehensive income’ until disposed, at which time the cumulative gain or loss previously recognised
in ‘other economic flows – other comprehensive income’ is recognised in ‘other economic flows – included in
operating result’. Dividends are recognised as revenue for the year and included in the ‘net operating
balance’.
Financial assets at FVTPL are measured at fair value. Changes in fair value for assets classified or
designated at FVTPL are recognised as ‘other economic flows – included in the operating result’. A change
in fair value excludes interest and distributions, which are recognised as ‘revenue from transactions’ in the
‘net operating balance’.
Financial Assets - Impairment under AASB 139 (for the Comparative Period Ended 30 June 2018)
Financial assets not classified as FVTPL are subject to an annual review for impairment. Financial assets
considered to be impaired when there is objective evidence that, as a result of one or more events that
occurred after the initial recognition of the asset, the estimated future cash flows have been affected.
The State first assesses whether impairment exists individually for financial assets that are individually
significant, or collectively for those that are not individually significant. Further, financial assets are assessed
for impairment on a collective basis if they were assessed not to be impaired individually.
The amount of the allowance is the difference between the asset’s carrying amount and the present value of
estimated future cash flows, discounted at the original effective interest rate. The amount of the impairment
loss is recognised in ‘other economic flows - included in the operating result’. Bad debts are written off as
incurred and are treated as ‘expenses from transactions’ and recorded in the ‘net operating balance’, where
mutually agreed.

Note 1
7 - 22 Total State Sector Accounts
Any reversals of impairment losses are reversed through ‘other economic flows – included in the operating
result’ for the year, if objectively related to an event occurring after the impairment was recognised.
Reversals of impairment losses cannot result in a carrying amount that exceeds what the carrying amount
would have been had there not been an impairment loss.
Financial Liabilities – Classification, Subsequent Measurement, and Gains and Losses
Financial liabilities are initially measured at fair value, net of directly attributable transactions costs. Financial
liabilities are subsequently classified either as measured at amortised cost or at FVTPL.
A financial liability is classified as FVTPL if it is held-for-trading, it is a derivative or it is designated as such
on initial recognition. From 1 July 2018, fair value changes of borrowings designated at FVTPL are recorded
in ‘other economic flows – included in the operating result’, except for movements in fair value due to
changes in the State’s own credit risk which are recorded in ‘other economic flows – other comprehensive
income’ and are not recycled to the operating result. Interest expense is recorded as ‘expenses from
transactions’ and reported in the ‘net operating balance’. Financial liabilities at FVTPL recognised before 1
July 2018 are stated at fair value, with all gains or losses arising on remeasurement, excluding interest,
recognised in ‘other economic flows – included in the operating result’. Interest expense is recorded as
‘expenses from transactions’ and reported in the ‘net operating balance’.
Other financial liabilities are subsequently measured at amortised cost using the effective interest method.
Gains and losses are recognised in ‘other economic flows – included in the operating result’ when the
liabilities are derecognised. Interest expense is recorded as ‘expenses from transactions’ and reported in the
‘net operating balance’.
Derivative Financial Instruments and Hedge Accounting
Derivatives are initially recognised at fair value and are recognised on the Statement of Financial Position at
trade date (the date the State becomes party to the contractual provisions of the financial instrument
concerned).
Derivatives are classified as held for trading unless they are designated as effective hedging instruments.
Where an active market exists, fair values are determined by reference to the specific market quoted
prices/yields at reporting date. If no active market exists, judgement is used to select the valuation technique
which best estimates fair value by discounting the expected future cash flows arising from the financial
instruments to their present value using market yields and margins appropriate to the financial instruments.
These margins take into account credit quality and liquidity of the financial instruments.
Gains and losses from derivatives mandatorily classified as held for trading are recognised in ‘other
economic flows – included in operating result’.
Derivatives designated as hedges are measured at fair value and are accounted for either as a fair value
hedge (i.e. hedge of exposures to changes in fair value) or a cash flow hedge (i.e. hedge of exposure to
variability in cash flows). Gains or losses on fair value hedges are recognised in ‘other economic flows –
included in operating result’. Gains or losses on the effective portion of cash flow hedges are recognised as
in ‘other economic flows – other comprehensive income’, until the forecast transaction affects profit or loss
and it is recycled into ‘other economic flows – included in operating result’. The ineffective portion of cash
flow hedges is also recognised in ‘other economic flows – included in operating result’.
The policy applied for derivatives financial instruments and hedge accounting in the comparative reporting
period ended 30 June 2018 is similar to that applied for the current reporting period ended 30 June 2019.
Financial Assets and Financial Liabilities - Derecognition
A financial asset (or, where applicable, a part of a financial asset or part of a group of similar financial assets)
is derecognised when the contractual rights to the cash flows from the financial assets expire; or if the State
transfers its rights to receive cash flows from the asset or has assumed an obligation to pay the received
cash flows in full without material delay to a third party under a ‘pass-through’ arrangement; and either:
• the State has transferred substantially all the risks and rewards of the asset; or
• the State has neither transferred nor retained substantially all the risks and rewards of the asset but has
transferred control.
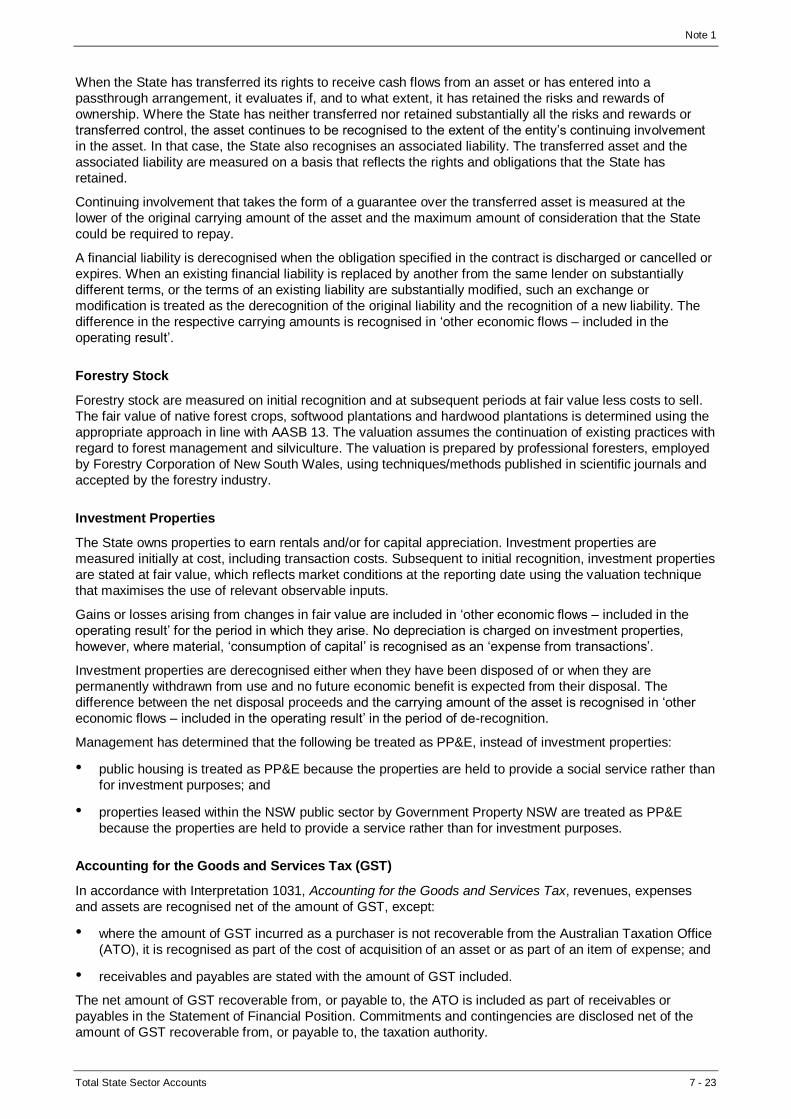
Note 1
Total State Sector Accounts 7 - 23
When the State has transferred its rights to receive cash flows from an asset or has entered into a
passthrough arrangement, it evaluates if, and to what extent, it has retained the risks and rewards of
ownership. Where the State has neither transferred nor retained substantially all the risks and rewards or
transferred control, the asset continues to be recognised to the extent of the entity’s continuing involvement
in the asset. In that case, the State also recognises an associated liability. The transferred asset and the
associated liability are measured on a basis that reflects the rights and obligations that the State has
retained.
Continuing involvement that takes the form of a guarantee over the transferred asset is measured at the
lower of the original carrying amount of the asset and the maximum amount of consideration that the State
could be required to repay.
A financial liability is derecognised when the obligation specified in the contract is discharged or cancelled or
expires. When an existing financial liability is replaced by another from the same lender on substantially
different terms, or the terms of an existing liability are substantially modified, such an exchange or
modification is treated as the derecognition of the original liability and the recognition of a new liability. The
difference in the respective carrying amounts is recognised in ‘other economic flows – included in the
operating result’.
Forestry Stock
Forestry stock are measured on initial recognition and at subsequent periods at fair value less costs to sell.
The fair value of native forest crops, softwood plantations and hardwood plantations is determined using the
appropriate approach in line with AASB 13. The valuation assumes the continuation of existing practices with
regard to forest management and silviculture. The valuation is prepared by professional foresters, employed
by Forestry Corporation of New South Wales, using techniques/methods published in scientific journals and
accepted by the forestry industry.
Investment Properties
The State owns properties to earn rentals and/or for capital appreciation. Investment properties are
measured initially at cost, including transaction costs. Subsequent to initial recognition, investment properties
are stated at fair value, which reflects market conditions at the reporting date using the valuation technique
that maximises the use of relevant observable inputs.
Gains or losses arising from changes in fair value are included in ‘other economic flows – included in the
operating result’ for the period in which they arise. No depreciation is charged on investment properties,
however, where material, ‘consumption of capital’ is recognised as an ‘expense from transactions’.
Investment properties are derecognised either when they have been disposed of or when they are
permanently withdrawn from use and no future economic benefit is expected from their disposal. The
difference between the net disposal proceeds and the carrying amount of the asset is recognised in ‘other
economic flows – included in the operating result’ in the period of de-recognition.
Management has determined that the following be treated as PP&E, instead of investment properties:
• public housing is treated as PP&E because the properties are held to provide a social service rather than
for investment purposes; and
• properties leased within the NSW public sector by Government Property NSW are treated as PP&E
because the properties are held to provide a service rather than for investment purposes.
Accounting for the Goods and Services Tax (GST)
In accordance with Interpretation 1031, Accounting for the Goods and Services Tax, revenues, expenses
and assets are recognised net of the amount of GST, except:
• where the amount of GST incurred as a purchaser is not recoverable from the Australian Taxation Office
(ATO), it is recognised as part of the cost of acquisition of an asset or as part of an item of expense; and
• receivables and payables are stated with the amount of GST included.
The net amount of GST recoverable from, or payable to, the ATO is included as part of receivables or
payables in the Statement of Financial Position. Commitments and contingencies are disclosed net of the
amount of GST recoverable from, or payable to, the taxation authority.

Note 1
7 - 24 Total State Sector Accounts
Cash flows are included in the Statement of Cash Flows on a gross basis and the GST component of cash
flows arising from investing and financing activities, which is recoverable from, or payable to, the ATO is
classified as part of operating cash flows. Therefore, cash flows arising from investing and financing activities
are included net of GST recoverable from or payable to ATO.
Foreign Currency Translation
Transactions in foreign currencies are recorded using the spot rate at the date the transaction first qualifies
for recognition.
Monetary assets and liabilities denominated in foreign currencies are translated at the functional currency
spot rates of exchange at the end of the reporting date.
Differences arising on settlement or translation of monetary items are recognised in ‘other economic flows –
included in the operating result’.
Non-monetary items that are measured in terms of historical cost in a foreign currency are translated using
the exchange rates at the dates of the initial transactions. Non-monetary items measured at fair value in a
foreign currency are translated using the exchange rates at the date when the fair value is determined. The
gain or loss arising on translation of non-monetary items measured at fair value is treated in line with the
recognition of the gain or loss on the change in fair value of the item (i.e., translation differences on items
whose fair value gain or loss is recognised in other comprehensive income or ‘other economic flows –
included in the operating result’ are also recognised in other comprehensive income or ‘other economic flows
– included in the operating result’, respectively).
Changes in Accounting Policy, including New and Amended Standards and Interpretations
The State applied for the first-time standards and amendments which are effective for annual periods beginning on or after 1 July 2018. The State has not early adopted any other standard, interpretation or amendment that has been issued but is not yet effective.
AASB 9 Financial Instruments
The State has adopted AASB 9, which resulted in changes in accounting policies in respect of recognition,
classification and measurement of financial assets and financial liabilities, derecognition of financial
instruments, impairment of financial assets and hedge accounting. AASB 9 also significantly amends other
standards dealing with financial instruments such as the revised AASB 7 Financial Instruments: Disclosures
(AASB 7).
The State applied AASB 9 retrospectively but has not restated the comparative information which is reported
under AASB 139. Any differences arising from the adoption of AASB 9 have been recognised directly in
accumulated funds and other components of equity as at 1 July 2018.
The State applies the hedge accounting requirements of AASB 9 prospectively.
Refer to Note 25: Financial Instruments for information on the effect of adopting AASB 9 on the statement of
financial position as at 1 July 2018.
New Accounting Standards Issued but Not Effective
Certain new accounting standards and interpretations have been published that are not mandatory for the
30 June 2019 reporting period.
• AASB 15 Revenue from Contracts with Customers, AASB 2014-5 Amendments to Australian Accounting
Standards arising from AASB 15 and AASB 1058 Income of Not-for-Profits
– AASB 15 Revenue from Contracts with Customers (AASB 15) is effective from reporting periods
commencing on or after 1 January 2018 for for-profit entities and on or after 1 January 2019 for
not-for-profit entities. AASB 15 establishes a five-step model to account for revenue arising from
contracts with customers. Revenue is recognised when control of goods or services is transferred to
the customer at amounts that reflect the consideration to which the State expects to be entitled in
exchange for transferring the goods or services to the customer. Under AASB 118 Revenue (AASB
118), revenue recognition is currently based on when risks and rewards are transferred.

Note 1
Total State Sector Accounts 7 - 25
– AASB 1058 Income of Not-for-Profits (AASB 1058) is effective for reporting periods commencing on
or after 1 January 2019 and will replace most of the existing requirements in AASB 1004
Contributions (AASB 1004). The scope of AASB 1004 is now limited mainly to parliamentary
appropriations, administrative arrangements and contributions by owners. Under AASB 1058, the
State will need to determine whether a transaction is consideration received below fair value
principally to enable the State to further its objectives (accounted for under AASB 1058) or a revenue
contract with a customer (accounted for under AASB 15).
– The revenue streams of the State will be impacted by the adoption of these standards from 1 July
2019. The standards will result in the identification of separate performance obligations that will
change the timing of recognition for some revenues, including revenues relating to sales of goods
and services and specific purpose grants and subsidies. The adoption of these standards will
primarily result in the recognition of increased liabilities reported on the Statement of Financial
Position, predominately consisting of contract liabilities.
– Under AASB 1058, the State will recognise as liabilities, obligations for funding received where there
is an obligation to construct recognisable non-financial assets controlled by the State.
– The State will adopt AASB 15 and AASB 1058 on 1 July 2019 through application of the full
retrospective transition approach. Recognition and measurement principles of the new standards will
be applied for the current year and comparative year as though AASB 15 and AASB 1058 had
always applied.
– Based on the best available information, the State estimates that the adoption of AASB 15 and
AASB 1058 will impact the State at 1 July 2019 as follows:
▪ the deferral of revenue and recognition of contractual liabilities and capital grant obligations
(unearned revenue) of $493.1 million for the General Government Sector and $493.1 million for
the Total State Sector, with a corresponding decrease in accumulated funds of $493.1 million for
the General Government Sector and $493.1 million for the Total State Sector.
▪ $395.9 million reduction in unearned income liabilities which includes long-term licences, and a
corresponding increase in accumulated funds of $395.9 million for the State.
The impacts to other reported balances resulting from the adoption of AASB 15 and AASB 1058 have
been assessed by the State as not being significant.
• AASB 16 Leases
– AASB 16 Leases (AASB 16) is effective from reporting periods commencing on or after 1 January
2019.
– For lessees, AASB 16 will result in most leases being recognised on the Statement of Financial
Position, as the distinction between operating and finance leases is largely removed. Under the new
standard, an asset (the right to use the leased item) and a financial liability to pay rentals are
recognised at the commencement of the lease. The only exceptions are short-term and low-value
leases. AASB 16 will therefore increase assets and liabilities reported on the Statement of Financial
Position. It will also increase depreciation and interest expenses and reduce operating lease rental
expenses on the Statement of Comprehensive Income. Expenses recognised in the earlier years of
the lease term will be higher as the interest charges will be calculated on a larger lease liability
balance. Existing finance leases are not expected to be significantly impacted from the transition to
AASB 16.
– The accounting for lessors under AASB 16 will not significantly change. The State has however
reviewed the classification of sub-leases in which the State is a lessor and finance lease receivables
will be recognised for sub-leases reclassified as finance leases under AASB 16.
– The State will adopt AASB 16 on 1 July 2019 through application of the partial retrospective
approach, where only the current year is adjusted as though AASB 16 had always applied.
Comparative information will not be restated. The State will also adopt the practical expedient
whereby the fair value of the right-of use asset will be the same as the lease liability at 1 July 2019.

Note 1
7 - 26 Total State Sector Accounts
– Based on the best available information, the State estimates that the General Government Sector
will recognise additional lease liabilities of $4.1 billion and right-of-use assets of $4.1 billion as at
1 July 2019 for leases in which the General Government Sector is a lessee. The State estimates that
the Total State Sector will recognise additional lease liabilities of $4.7 billion and right-of-use assets
of $4.7 billion as at 1 July 2019 for leases in which the Total State Sector is a lessee. Most operating
lease expenses will be replaced by depreciation of the right of use asset and interest on the lease
liability. The impact on the Statement of Comprehensive Income is expected to decrease by
$80.8 million in the General-Government Sector and $106.5 million in the Total State Sector. The
impact represents management’s current best estimate and is still under review. It is possible that
the amount recognised at 1 July 2019 in the Statement of Financial Position and Statement of
Comprehensive Income will differ from this estimate, as a result of further review of underlying lease
data.
– The State will also be required to reclassify sub-leases as either finance leases or operating leases
for leases in which the State is a lessor. The State estimates that sub-leases reclassifications will
result in the recognition of finance leases receivable of $151.8 million for the General Government
Sector and $174.7 million for the Total State Sector as at 1 July 2019.
• AASB 1059 Service Concession Arrangements: Grantors
– AASB 1059 Service Concession Arrangements: Grantors (AASB 1059) is effective from reporting
periods commencing on or after 1 January 2020. Service concession arrangements (SCA) involve
an entity operating a service concession asset to deliver public services on behalf of a public sector
grantor.
– Currently, under TPP 06-8 Privately Financed Projects (TPP 06-8), most SCA in New South Wales
are generally treated as leases or as assets gradually recognised over the concession period.
– AASB 1059 will require service concession assets to be recognised immediately at the start of the
arrangement, with a corresponding liability to reflect any payments due, and/or the grant of a right, to
the operator. Further, AASB 1059 has a broader scope than TPP 06-8, possibly resulting in more
arrangements being recognised in the State’s statement of financial position.
– These changes are expected to increase assets and liabilities in the State’s Statement of Financial
Position and impact in the Statement of Comprehensive Income depreciation and amortisation
expenses and income from the amortisation of grant of right liability. The estimated impact of
AASB 1059 on future estimated financial statements has not been sufficiently identified and
quantified at this stage.
There are no other standards that are not yet effective and that would be expected to have a material impact
on the State’s financial statements in the current or future reporting periods and on foreseeable future
transactions.

Note 2
Total State Sector Accounts 7 - 27
Note 2: Revenue
Taxation
General
Government Sector Total State Sector
2018-19 2017-18 2018-19 2017-18 $m $m $m $m
Taxation Payroll Tax 9,357 8,835 9,203 8,686
Stamp Duties 9,245 10,482 9,245 10,482
Land Tax 4,216 3,735 4,167 3,698
Gambling and Betting 2,634 2,350 2,634 2,350
Motor Vehicle Taxes 2,694 2,719 2,694 2,719
Other 3,296 3,204 2,997 2,907
Total Taxation Revenue 31,443 31,326 30,940 30,841
State taxation is recognised upon assessment as follows:
• Government-assessed revenues (mainly land tax) are recognised when the underlying event that results
in a right to receive revenue has occurred and assessments have been issued, or when the amount can
be reliably measured.
• Taxpayer-assessed revenues (including payroll tax and stamp duty) are recognised when the funds are
received by the tax collecting agency as this is when the revenues can be reliably measured. Additional
revenues, identified after review of taxpayer returns, are recognised upon amended assessment.

Note 2
7 - 28 Total State Sector Accounts
Grants and Subsidies
General
Government Sector Total State Sector
2018-19 2017-18 2018-19 2017-18 $m $m $m $m
Grants and Subsidies Revenue Commonwealth General Purpose 17,907 17,955 17,907 17,955
Commonwealth Specific Purpose Payments 10,224 9,844 10,224 9,844
Commonwealth National Partnership Payments 2,737 3,129 2,737 3,129
Other Grants and Subsidies 981 931 900 998
Total Grants and Subsidies Revenue 31,848 31,860 31,768 31,926
Grants dissected into Current and Capital Components Current Grants and Subsidies Revenue from the Commonwealth General Purpose 17,907 17,955 17,907 17,955
Specific Purpose 10,224 9,844 10,224 9,844
National Partnership Payments 1,027 738 1,027 738
Other Commonwealth Payments 411 444 412 445
Current Grants from the Commonwealth 29,568 28,981 29,568 28,981
Other Grants and Subsidies 500 426 428 480
Total Current Grant Revenue 30,068 29,406 29,997 29,461
Capital Grant Revenue from the Commonwealth Specific Purpose ... ... ... ...
National Partnership Payments 1,710 2,392 1,710 2,392
Other Commonwealth Payments 3 0 6 3
Capital Grants from the Commonwealth 1,714 2,392 1,716 2,395
Other Grants and Subsidies 66 62 54 69
Total Capital Grant Revenue 1,780 2,453 1,771 2,464
Total Grants and Subsidies Revenue 31,848 31,860 31,768 31,926
Commonwealth General Purpose, Specific Purpose, and National Partnership payments are recognised
when the State gains control over the grant or subsidy, it is probable that economic benefits will flow to the
State and amounts can be measured reliably. Control is normally obtained when the cash is received.
General Purpose recurrent grants mainly comprise New South Wales’ share of the GST.
Grant revenue and expenses exclude the following transfer payments from the Commonwealth that New
South Wales on-passes to third parties. They are not recorded as New South Wales’ revenue and expenses
as the State has no control over the amounts that it on-passes.
Transfer Payments from the Commonwealth Government on-passed by NSW to Third Parties
General Government Sector Total State Sector
2018-19 2017-18 2018-19 2017-18 $m $m $m $m
Transfer Receipts Recurrent Transfer Receipts for Specific Purposes 4,845 4,557 4,845 4,557
Total Receipts 4,845 4,557 4,845 4,557
Transfer Payments
Current Transfer Payments to Local Government 778 749 778 749
Current Transfer Payments to the Private and Not-For-Profit Sector 4,067 3,808 4,067 3,808
Total Payments 4,845 4,557 4,845 4,557

Note 2
Total State Sector Accounts 7 - 29
Sale of Goods and Services
General
Government Sector Total State Sector
2018-19 2017-18 2018-19 2017-18 $m $m $m $m
Sale of Goods and Services comprise Revenue from: Sale of Goods 362 359 3,663 4,046
Rentals from Public Housing and Other Non-Investment Properties(a) 255 252 1,153 1,171
Rentals from Investment Properties 3 6 59 65
Rendering of Other Services(b) 8,370 7,891 9,944 9,931
Total Sale of Goods and Services 8,990 8,508 14,819 15,214
(a) Includes revenues from the provision of public housing:
Market Rent and Other Tenant Charges 83 82 2,104 2,120 Less: Rental Subsidies to Tenants (28) (27) (1,234) (1,232)
Rentals from Public Housing 55 54 870 889
(b) ‘Rendering of Other Services’ in the General Government Sector includes $1,733 million (2018: $1,206 million) fee for services provided to RailCorp (TAHE) to produce property plant and equipment.
Sale of goods are recognised when the State transfers to the buyer the significant risks and rewards of
ownership of the assets. Revenue from the rendering of services is recognised when the service is provided
by reference to the stage of completion. Rental revenue (including from public housing and investment
properties) is recognised on a straight-line basis over the lease term (net of rental subsidies) in accordance
with AASB 117 Leases.
Interest
General
Government Sector Total State Sector
2018-19 2017-18 2018-19 2017-18 $m $m $m $m
Interest Revenue comprises: Interest from TCorpIM Cash Funds 13 15 ... ...
Interest from Deposits with TCorp 42 58 ... ...
Interest from Deposits with Other Institutions 278 303 581 723
Interest from Other Financial Assets 159 182 220 349
491 558 801 1,072
Interest revenue is calculated by applying the effective interest rate to the gross carrying amount of a
financial asset except for financial assets that subsequently become credit-impaired. For financial assets that
become credit impaired, the effective interest rate is applied to the amortised cost of the financial asset (i.e.
after deducting the loss allowance for expected credit losses).
Net realised or unrealised gains and losses on the revaluation of investments do not form part of ‘Revenue /
from Transactions’ but are reported as part of ‘Other Economic Flows – included in the Operating Result’.
Refer to Note 25: Financial Instruments for further information on interest income by financial instrument
measurement categories.

Note 2
7 - 30 Total State Sector Accounts
Dividend and Income Tax Equivalents from Other Sectors
General
Government Sector Total State Sector
2018-19 2017-18 2018-19 2017-18 $m $m $m $m
Dividend and Income Tax Equivalents from Other Sectors: Dividends from the PNFC Sector 1,321 1,113 ... ...
Dividends from the PFC Sector 266 ... ... ...
Income Tax Equivalents from the PNFC Sector 309 438 ... ...
Income Tax Equivalents from the PFC Sector 37 27 ... ...
1,932 1,578 ... ...
The General Government Sector receives dividends and tax equivalent payments (pursuant to National
Competition Policy, the National Tax Equivalent Regime and the Tax Equivalent Regime) from some of the
State’s PNFCs and PFCs. On consolidation, dividend and income tax equivalent entries are eliminated for
the Total State Sector.
Dividends are recognised as revenue when the right to receive payment is established. Dividends paid out of
asset sale proceeds are treated as ‘Other Economic Flows – included in the Operating Result’.
Income tax equivalents (represented by the current tax payable/receivable by/from the PNFC and PFC
sector) are recognised as ‘Revenue from Transactions’ in the period when earned. Tax equivalent
receivables /payables from/to the PNFC and PFC sector are also recognised in the General Government
Sector, when controlled.
Other Dividend and Distributions
General
Government Sector Total State Sector
2018-19 2017-18 2018-19 2017-18 $m $m $m $m
Other Dividends and Distributions: Distributions from Managed Funds 1,715 1,686 1,806 1,720
Dividends from Associates 219 428 219 428
1,934 2,114 2,025 2,147
Other dividends include dividends received from investments in entities other than the PNFC and PFC
sectors and are recognised when the right to receive payment is established. The distribution from Managed
Funds are mainly from the State’s investment in TCorpIM Funds.
Fines, Regulatory Fees and Other Revenues
General
Government Sector Total State Sector
2018-19 2017-18 2018-19 2017-18 $m $m $m $m
Other Revenue comprise: Royalties from Mining 2,093 1,763 2,093 1,763
Fines 653 648 653 648
Fees 117 159 125 159
Licences 207 204 207 204
Emerging Right to Receive Privately Financed Infrastructure 315 300 288 277
Developer, Industry and Other Contributions 660 692 1,083 1,034
Other Revenue 1,008 963 1,291 1,413
5,051 4,730 5,739 5,497

Note 2
Total State Sector Accounts 7 - 31
Other Revenues (including Fines and Regulatory Revenue) are recognised when earned if the monetary
amounts can be determined reliably.
• Fines issued by the Courts are recognised when the fine is issued. Traffic infringement fines, such as
those administered by the State Debt Recovery Office, are recognised when the cash is received.
Revenue from enforcement orders is regarded as being reliably measured when the order is issued.
• Regulatory fees, royalty revenue and contributions are generally recognised on an accrual basis in
accordance with the substance of the relevant agreement.
Contributions from the Commonwealth
The following contributions received from the Commonwealth for National Partnership and Specific Purpose
Payments can only be spent on specific agreed items and to a specific timetable agreed with the
Commonwealth (subject to timing variations). Funds not spent as agreed must be returned. These
disclosures relate to revenue recognised for both the General Government and the Total State Sectors.
Conditional Contributions with no Designated Future Expenditure Timetable that were Recognised as
Revenue in 2018-19 and not fully spent
Policy Area Balance $m
2018-19 2017-18
Education 255 270
Police and Emergency Services 17 11
Tourism ... 5
Sport 4 4
Pest, Weed and Plant Management 1 2
Water Initiatives 2 5
Total 279 297
Conditional Contributions as at 30 June 2019 with a Designated Future Expenditure Timetable for the
Provision of Goods and Services (and not included in the above table)
Conditional Contribution
Balance Period to which the amounts relate
Policy Area June 2019 2019-20 2020-21 2021-22 Beyond $m $m $m $m $m
Transport 453 453 ... ... ...
Health 42 24 12 6 ...
Family and Community Services 39 30 9 ... ...
Total 534 507 21 6 ...

Note 2
7 - 32 Total State Sector Accounts
Conditional Contributions as at 30 June 2018 with a Designated Future Expenditure Timetable for the
Provision of Goods and Services(a)
Conditional Contribution
Balance Period to which the amounts relate
Policy Area June 2018 2018-19 2019-20 2020-21 Beyond $m $m $m $m $m
Transport 721 721 ... ... ...
Family and Community Services 55 16 30 9 ...
Total 776 737 30 9 ...
(a) There has been a restatement of balances to reflect revised information available after the release of the 2017-18 Total State Sector accounts.
Listed below are unspent Commonwealth contributions at previous year end, and amounts spent in the
current year from previous year unspent balance.
Contributions Spent in the 2018-19 Financial Year from the previous 30 June Balance(a)
General
Government Sector Total State Sector
Balance Balance
Policy Area as at June
2018 Spent in 2018-19
as at June 2018
Spent in 2018-19
$m $m $m $m
Education 392 281 392 281
Family and Community Services 55 16 55 16
Police and Emergency Services 11 11 11 11
Transport 721 721 721 721
Tourism 5 ... 5 ...
Pest, Weed and Plant Management 6 ... 6 ...
Sport 4 4 4 4
Water Initiatives 39 19 39 19
Total 1,233 1,052 1,233 1,052
(a) Includes all cumulative prior year balances carried forward as unspent.
Contributions Spent in the 2017-18 Financial Year from the previous 30 June Balance(a)
General
Government Sector Total State Sector
Balance Balance
Policy Area as at June
2017 Spent in 2017-18
as at June 2017
Spent in 2017-18
$m $m $m $m
Education 520 399 520 399
Family and Community Services 48 7 48 7
Police and Emergency Services 7 7 7 7
Transport(b) 1,380 1,380 1,380 1,380
Tourism 2 2 2 2
Pest, Weed and Plant Management 6 2 6 2
Water Initiatives 45 11 45 11
Total 2,008 1,808 2,008 1,808
(a) Includes all cumulative prior year balances carried forward as unspent. (b) There has been a restatement of balances to reflect revised information available after the release of the 2017-18 Total State Sector
accounts.

Note 3
Total State Sector Accounts 7 - 33
Note 3: Expenses
Employee Expenses (excluding Superannuation)
` General
Government Sector Total State Sector
2018-19 2017-18 2018-19 2017-18 $m $m $m $m
Employee Expenses comprise: Salaries and Wages (including recreation leave) 30,478 29,005 32,569 31,123
Long Service Leave 1,202 1,221 1,297 1,293
Workers' Compensation 908 741 935 759
Other 570 676 743 892
33,158 31,644 35,544 34,067
The recognition and measurement policy for employee expenses is detailed in Note 21: Employee
Provisions. Some employee-related expenses are capitalised as part of the construction costs of certain
non-current physical assets. Payroll tax paid by NSW General Government Sector agencies is eliminated in
the General Government Sector financial statements, along with the PNFC and PFC amounts, in the Total
State Sector financial statements.
Superannuation Expense
General
Government Sector Total State Sector
2018-19 2017-18 2018-19 2017-18 $m $m $m $m
Superannuation Interest Costs comprise: Net Interest(a) 1,412 1,458 1,466 1,513
1,412 1,458 1,466 1,513
Other Superannuation Expenses comprise:
Defined Benefit Plans, excluding Actuarial Gains/Losses(a) 411 489 445 539
Defined Contribution Plans 2,641 2,520 2,805 2,683
3,052 3,009 3,250 3,222
(a) Refer to Note 22 - Superannuation Provisions for a dissection of Defined Benefit Superannuation Expense by component.
Depreciation and Amortisation Expense
General
Government Sector Total State Sector
2018-19 2017-18 2018-19 2017-18 $m $m $m $m
Depreciation and Amortisation Expense comprise:
Depreciation on(a) Buildings 1,637 1,519 2,582 2,368
Plant and Equipment 872 735 1,257 1,112
Infrastructure Systems(b) 1,920 1,943 3,264 3,266 Amortisation of(a) Leased Property, Plant and Equipment 138 156 153 237
Capital Prepayments - Right to Receive 17 18 17 18
Intangibles 608 440 743 577
5,192 4,811 8,016 7,579
(a) Refer to Note 13 - Property, Plant and Equipment and Note 14 - Intangibles for the basis of useful lives applied to calculate depreciation of Property, Plant and Equipment and amortisation of Intangibles.
(b) Refer to Note 31 Restatement/Corrections to Prior Year Comparatives, for details of corrections to prior period.

Note 3
7 - 34 Total State Sector Accounts
Interest Expense
General
Government Sector Total State Sector
2018-19 2017-18 2018-19 2017-18 $m $m $m $m
Interest Expenses comprise:
Interest on Borrowings 1,331 1,297 2,299 2,453
Interest on Finance Leases 213 240 478 539
Unwinding of Discounts on Provision Liabilities(a) 267 274 360 346
1,812 1,812 3,137 3,338
(a) $182 million (General Government Sector) and $309 million (Total State Sector) was reclassified from ‘Interest’ expense to ‘Gain/(Loss) from Liabilities’ for 2017-18.
Interest costs, including borrowing costs under AASB 123 Borrowing Costs, are recognised as expenses in
the period in which they occur.
Refer to Note 25: Financial Instruments for information on interest expense by financial instrument
measurement categories.
Other Operating Expense
General
Government Sector Total State Sector
2018-19 2017-18 2018-19 2017-18 $m $m $m $m
Other Operating Expenses comprise: Operating Lease Rentals - Minimum Lease Payments 841 712 1,059 928
Contractor Fees(a) 1,199 1,018 2,068 2,005
Consultancy Fees(a) 306 318 353 390
Inventories Used Up 14 11 239 496
Audit Fees(b) ... ... ... ...
Insurance Claims 754 600 1,579 1,041
Supplies, Services and Other(a)(c) 16,015 14,924 16,128 15,038
External Maintenance (excluding Employee Costs associated with Maintenance) 2,016 2,069 3,379 3,379
21,146 19,652 24,805 23,277
(a) In 2017-18 $235 million ‘Contractor Fees’ and $132 million ‘Consultancy Fees’ were reclassified from ‘Supplies, Services and Other’. (b) Fees to the Audit Office of New South Wales have not been recognised as expenses because they have been eliminated in the
consolidation of the NSW Total State and General Government sectors. The fees eliminated are for financial audits: $22 million to the General Government sector (2018: $22 million), and $28 million to the Total State sector (2018: $27 mill ion). In addition, $17 million for General Government and Total State sector performance audits and Auditor-General’s Reports to Parliament (2018: $15 million) have been eliminated.
(c) In 2018-19, there was $1,733 million expenses (2018: $1,206 million) in the General Government Sector related to RailCorp (TAHE) mainly in ‘Supplies, Services and Other’.

Note 3
Total State Sector Accounts 7 - 35
Grants and Subsidies
General
Government Sector Total State Sector
2018-19 2017-18 2018-19 2017-18 $m $m $m $m
Grants, Subsidies and Transfers for Recurrent purposes 13,595 12,908 10,921 10,304
Capital purposes 1,105 955 741 576
14,700 13,862 11,662 10,880
Recurrent and Capital Grants Subsidies and Transfers are provided for(a) Education and Training 1,661 1,535 1,649 1,535
Human Services (Ageing, Disability and Home Care Services, Community Services and Public Housing) 4,874 4,648 4,782 4,525
Health 1,339 1,288 1,339 1,288
Public Transport 2,508 2,452 82 30
First Home Owners Scheme 86 134 86 134
Other Purposes 4,231 3,806 3,723 3,367
14,700 13,862 11,662 10,880
(a) Refer to Note 34 - Disaggregated Financial Statements for information on total expenses (excluding losses) by function.
Grants and subsidy expenses generally comprise cash contributions to local government authorities and
non-government organisations. They are expensed when the State transfers control of the assets. For the
General Government Sector, they also include grants and subsidies paid to PNFCs and PFCs, which are
eliminated in the Total State Sector.

Note 4
7 - 36 Total State Sector Accounts
Note 4: Other Economic Flows Included in the Operating Result
Other Economic Flows mainly comprise gains and losses on re-measurement of assets and liabilities. These
gains or losses are ‘Other Economic Flows’, which are included in the ‘Operating Result’ or ‘Other
Comprehensive Income’.
Refer to Note 25: Financial Instruments for information on financial instruments fair value adjustments by
financial instrument measurement categories.
General
Government Sector Total State Sector
2018-19 2017-18 2018-19 2017-18 $m $m $m $m
Gain/(Loss) from Liabilities Changes in Discount Rates for Long Service Leave Liabilities(a) (1,499) (314) (1,532) (312)
Changes in Discount and Inflation Rates for Insurance Liabilities (b)(c) (1,001) (99) (1,685) (376)
(2,500) (413) (3,218) (688)
Other Net Gains/(Losses) in the Operating Result Net Gains / (Losses) on Financial Assets at Fair Value through
Profit and Loss(d) 13,201 ... 13,225 ...
Disposal of Property, Plant and Equipment (304) 31 (405) 91
Disposal of Intangible Assets (1) (73) (3) (74)
Fair Value Adjustments to: Investment Property ... ... 29 212
Non-Current Assets Classified as Held for Sale 5 (123) 7 (125)
Financial Instruments(e)(f) 1,060 283 (1,349) 1,178
Assets recognised for first time 131 240 133 241
Infrastructure and Other Assets Written Off (237) (236) (326) (288)
Other(f) (155) (52) 21 (62)
13,700 71 11,332 1,171
Share of Earnings from Equity Investments
(excluding Dividends) (1) 160 (1) 160
Dividends from Asset Sales Proceeds (0) 0 ... ...
Deferred Income Tax from Other Sectors (97) (17) ... ...
Other Economic Flows Impairment losses on financial assets (69) (83) (74) (83)
Other 84 83 84 83
14 0 10 0
Discontinuing Operations (0) ... (0) ...
Other Economic Flows - included in Operating Result 11,117 (198) 8,123 643
(a) The increase, during 2018-19, in the loss on revaluation of long service leave liabilities was due to a substantial reduction in the Commonwealth Government 10 Year Bond rate from 2.65 per cent at 30 June 2018 to 1.32 per cent at 30 June 2019.
(b) Change in the discount rate used on outstanding claims liabilities for the NSW Self Insurance Corporation, and Lifetime Care and Support Schemes.
(c) $182 million (General Government Sector) and $309 million (Total State Sector) was reclassified from ‘Interest’ expense to ‘Gain/(Loss) from Liabilities’ for 2017-18.
(d) $13.2 billion in relation to the WestConnex Group transaction during the reporting period ended 30 June 2019 - Refer to Note 5 – Discontinued Operations for further information.
(e) The $777 million (General Government Sector) increase is due to increased investment income, mainly driven by Crown Finance Entity’s newly established NSW Generations Fund (NGF). The $2,527 million (Total State Sector) reduction is due to a reduction in market yields for NSW TCorp bonds.
(f) During 2017-18 Financial instruments gains/losses includes $56 million reclassified from ‘Other’.

Note 5
Total State Sector Accounts 7 - 37
Note 5: Discontinued Operations
During the 2018-19 year, the State of NSW disposed its controlling interest in the WestConnex Group. These
operations have been classified as discontinuing.
In 2017-18, no operations were classified as discontinuing.
The WestConnex Group transaction was finalised as follows:
Operation Purchaser Sale
Consideration Transaction Stamp
Duty $m $m
WestConnex Group Sydney Transport Partners (51 per cent) 8,731 555
WestConnex Group
WestConnex is the largest road infrastructure project in Australia, linking Western and South-Western
Sydney with the City, airport and port in a 33-kilometre continuous motorway. The WestConnex Group is
constructing and operating the road network under concession agreements expiring in 2060.
During the reporting period a Sale and Purchase Agreement was executed between Sydney Transport
Partners (STP) and the State of NSW for the sale of 51 per cent of the State’s interests in the WestConnex
Group. The sale transaction was completed on the 27 September 2018. The State retains a 49 per cent
interest in the WestConnex Group via a controlled entity, Roads Retained Interest Pty Ltd, a corporation
constituted under the Corporations Act 2001.
The Government received cash of $8,731 million for the WestConnex Group transaction from Sydney
Transport Partners. Additionally, stamp duty of $555 million was paid to the Office of State Revenue on
behalf of the purchaser, resulting in total cash proceeds on the sale of $9,286 million.
As the activities of the WestConnex Group have ceased, it is treated as a discontinued operation. The results
of the WestConnex Group’s discontinued operations for the year are presented below.
General
Government Sector Total State Sector
2018-19 2017-18 2018-19 2017-18 Gain/(Loss) from WestConnex Group $m $m $m $m
Cash Proceeds from Sale 8,731 ... 8,731 ...
Fair Value of the State's retained interest held in Roads Retained Interest Pty Ltd 7,549 ... 7,549 ...
Less: Net investment attributed to sold operations (3,079) ... (3,055) ...
Gain/(Loss) recognised in the Comprehensive Result 13,201 ... 13,225 ...

Note 5 and Note 6
7 - 38 Total State Sector Accounts
General
Government Sector Total State Sector
2018-19 2017-18 2018-19 2017-18
$m $m $m $m
Net Operating Result of the Discontinued Operation Revenues from Discontinued Operation Sale of Goods and Services ... ... 48 174
Other Income ... ... 4 22
... ... 52 196
Expenses from Discontinued Operation Expenses ... ... 44 313
... ... 44 313
Net Operating Balance from Discontinued Operation ... ... 8 (117)
Other Economic Flows of the Discontinued Operation ... ... ... 2
Cash Flows of WestConnex Group Discontinued Operation Operating Activities ... ... 7 228
Investing Activities ... ... (1,239) (2,139)
Financing Activities ... ... ... 2,261
The comparative operating results and cash flows for 2017-18, from discontinued operations have not been
restated in the Statement of Comprehensive Income and Statement of Cash Flows as the amounts are not
considered material.
Note 6: Cash and Cash Equivalents
Cash and Cash Equivalents
Cash and cash equivalents comprise cash at bank and in hand, short term deposits and other investments
with an original maturity of three months or less (which are subject to an insignificant risk change in value),
and deposits in NSW Treasury Corporation’s TCorpIM Funds. Cash and cash equivalents are presented net
of outstanding bank overdrafts for the purposes of the Statement of Cash Flows.
General
Government Sector Total State Sector
2019 2018 2019 2018 $m $m $m $m
Cash administered by NSW Treasury Corporation
TCorpIM Funds 279 298 ... ...
Cash and Deposits held at other Financial Institutions (a) 1,690 5,119 8,979 13,969
1,969 5,417 8,979 13,969
(a) TCorp has reassessed its holdings of Reverse Repurchase Agreements which has resulted in a reclassification of $1,002 million from ‘Financial Assets at Fair Value’ to ‘Cash and Deposits’ in 2017-18.
The State’s interest in the TCorpIM Funds is brought to account as cash equivalents because deposits and
withdrawals can be made on a daily basis and are not subject to significant risk of a change in value. Cash
and deposits include net proceeds of asset sales and leases.
TCorpIM Funds investments are available to all NSW public authorities, including universities and local
government authorities. Each TCorpIM Funds investment has been established as an individual unit trust
and each trust has its own investment objective and strategy.

Note 6
Total State Sector Accounts 7 - 39
Total State Sector cash and deposits held at banks and other financial institutions include consolidated
TCorpIM Fund Trust holdings in cash and short-term deposits amounting to $2,817 million (2018:
$3,339 million).
Refer to Note 25: Financial Instruments for the effects of initially applying AASB 9 and details regarding
credit risk and market risk arising from cash and cash equivalents.
Reconciliation of Operating Result to Net Cash Flows from Operating Activities
General
Government Sector Total State Sector
2019 2018 2019 2018 $m $m $m $m
Operating result for the year (a) 12,335 4,226 6,343 3,465
Adjust for: Non-cash Items Added Back: Depreciation and Amortisation (a) 5,192 4,811 8,016 7,579
Donations and Contributions 190 88 577 406
Capital Grant Expense 508 250 508 326
Right to Receive Privately Financed Infrastructure 315 300 288 277
Other Non Cash Operating Activities 286 213 65 74
Other Economic Flows - included in the Operating Result (b) (11,117) 198 (8,123) (643)
Net Change in Operating Assets and Liabilities (381) 620 842 4,825
Net Cash Flows from Operating Activities 7,328 10,706 8,517 16,309
(a) Refer Note 31 Restatement/Corrections to Prior Year Comparatives, for details of corrections to prior period. (b) During 2018-19, the movements of the Other Economic Flows were mainly due to the $13.2 billion gain from the WestConnex Group
transaction.
Reconciliation of Closing Cash and Cash Equivalents to the Statement of Cash Flows
Cash assets in the Statement of Financial Position comprise cash, deposits at call, and other investments.
Deposits in TCorpIM Funds, and TCorp deposits with a maturity of less than 90 days are reported as cash
and deposits at call. Other investments readily convertible to a known cash amount, subject to an
insignificant risk of changes in value, and with maturity of less than 90 days are reported as cash. Cash and
cash equivalents recognised in the Statement of Financial Position are agreed at the end of the financial
year to the Statement of Cash Flows, and are as follows:
General
Government Sector Total State Sector
2019 2018 2019 2018 $m $m $m $m
Cash and Deposits (a) 1,969 5,417 8,979 13,969
1,969 5,417 8,979 13,969
(a) TCorp has reassessed its holdings of Reverse Repurchase Agreements which has resulted in a reclassification of $1,002 million from ‘Financial Assets at Fair Value’ to ‘Cash and Deposits’ in 2017-18.
Restricted Cash Assets
Cash assets in the Statement of Financial Position also comprise cash and term deposits held in Crown
Special Deposit Accounts for Restart NSW of $707 million (2018: $1,607 million) and can only be used in
accordance with the legislation that established the Account. Sales proceeds from major asset transactions
are deposited in the State’s dedicated infrastructure fund Restart NSW and/or New South Wales Generation
Fund (NGF), to fund the delivery of major capital infrastructure projects across the State. The decrease was
due to the increase of infrastructure investment out of the Restart NSW Fund. Conditional contributions
disclosed in Note 2: Revenue are also considered restricted assets. Term deposits disclosed in Note 8:
Investments, Loans and Placements form part of the Crown Special Deposit Accounts.

Note 6
7 - 40 Total State Sector Accounts
Acquisition and Disposal of Entities
Note 5: Discontinued Operations details information on the proceeds from sale of the WestConnex Group
received in the current reporting period ended 30 June 2019.
There were no major acquisitions or disposals of entities throughout the comparative period ended 30 June
2018.
Non-Cash Financing and Investing Activities
During 2018-19:
• In the General Government Sector, a total of $315 million (2018: $300 million) was recognised for
emerging interests in the private sector provided infrastructure. A total of $288 million (2018:
$277 million) was recognised in the Total State Sector and was lower than the General Government
Sector amount due to the elimination of the emerging interest in ANZ Stadium. It includes $263 million
recognised for various road projects (2018: $253 million).
• Other assets acquired free of cost in the Total State Sector amounted to $577 million (2018:
$406 million). In the General Government Sector, these assets amounted to $190 million (2018:
$88 million). They include sub-divider/developer contributions of water assets of $277 million (2018:
$240 million) and electricity assets of $104 million in 2019 (2018: $73 million).
• It is impracticable to report on the numerous other assets donated to NSW public sector agencies
particularly dedicated for transport, health, education and cultural purposes. They are generally reported
in individual agency financial statements.
Reconciliation of Movements of Liabilities to Cash Flows Arising from Financing Activities
The tables below reconcile movements of financial liabilities to cash flows arising from financing activities.
General Government Sector
30 June 2019
Deposits
Held
Other Fair Value
Borrowings
Finance Lease
Liabilities
Other Borrowings
at Amortised Cost
Advances Received Total
Note 17 19 20 20 $m $m $m $m $m $m
Balance at 1 July 2018 130 3 2,984 29,457 797 33,370
Net Financing Cash Flows 19 ... (202) 5,150 (69) 4,899
Leases Additions ... ... 159 ... ... 159
Valuation Adjustments ... ... ... 147 ... 147
Other Movements (82) (3) (352) 312 28 (97)
Balance at 30 June 2019 67 ... 2,590 35,066 756 38,478
30 June 2018
Deposits Held
Other Fair Value
Borrowings
Finance Lease
Liabilities
Other Borrowings at
Amortised Cost
Advances Received Total
Note 17 19 20 20 $m $m $m $m $m $m
Balance at 1 July 2017 106 4 3,088 29,720 812 33,730
Net Financing Cash Flows 24 ... (225) (590) (40) (831)
Leases Additions ... ... 152 ... ... 152
Valuation Adjustments ... ... ... 304 ... 304
Other Movements 0 (1) (31) 23 25 15
Balance at 30 June 2018 130 3 2,984 29,457 797 33,370

Note 6
Total State Sector Accounts 7 - 41
Total State Sector
30 June 2019
Deposits
Held
Bonds and Other
Borrowings Issued Torp
Other Fair Value
Borrowings
Finance Lease
Liabilities
Other Borrowings
at Amortised Cost
Advances Received Total
Note 17 19 19 20 20 $m $m $m $m $m $m $m
Balance at 1 July 2018 385 62,039 1,133 5,302 2,155 797 71,810
Net Financing Cash Flows (2) 6,716 ... (269) 1,758 (69) 8,134
Leases Additions ... ... ... 159 ... ... 159
Gain/Loss on Sale of PNFC/PFC Sector Entities ... ... (1,096) ... (2,149) ... (3,245)
Valuation Adjustments ... 3,128 ... ... ... ... 3,128
Other Movements (89) (106) (38) 94 100 28 (11)
Balance at 30 June 2019 293 71,777 ... 5,287 1,864 756 79,976
30 June 2018
Deposits
Held
Bonds and Other
Borrowings Issued Torp
Other Fair Value
Borrowings
Finance Lease
Liabilities
Other Borrowings
at Amortised Cost
Advances Received Total
Note 17 19 19 20 20 $m $m $m $m $m $m $m
Balance at 1 July 2017 328 62,439 587 6,391 572 812 71,129
Net Financing Cash Flows 82 (650) 617 (1,259) 1,590 (40) 340
Leases Additions ... ... ... 155 ... ... 155
Valuation Adjustments ... (399) ... ... ... ... (399)
Other Movements (26) 648 (71) 16 (7) 25 585
Balance at 30 June 2018 385 62,039 1,133 5,302 2,155 797 71,810

Note 7
7 - 42 Total State Sector Accounts
Note 7: Receivables
Receivables are recognised initially at fair value plus any directly attributable transaction costs. Trade
receivables that do not contain a significant financial component are measured at the transaction price.
Receivables are subsequently measured at amortised cost using the effective interest method, less any
impairment.
Statutory receivables, including taxation, fines and levy receivables, are not classified as financial
instruments for financial reporting purposes.
The effects of initially applying AASB 9 and further information regarding credit risk of receivables are
described in Note 25: Financial Instruments.
General
Government Sector Total State Sector
2019 2018 2019 2018 $m $m $m $m
Current 5,838 5,641 6,058 5,639
Non-current 1,653 1,080 1,469 908
7,491 6,721 7,527 6,547
Receivables comprise: Debtors and accruals from: Sale of Goods and Services 1,527 1,567 1,810 1,859
Dust Disease Insurance Levies Accrued(a) 615 584 615 584
Taxation 2,284 1,881 2,103 1,756
Dividends from Public Corporations 844 863 ... ...
Asset Sales 679 168 680 172
Interest 15 146 39 182
Other 2,008 1,991 2,786 2,494
7,972 7,200 8,033 7,047
Less: Loss Allowance(b) (481) (479) (506) (500)
7,491 6,721 7,527 6,547
(a) Levies receivable under the Workers’ Compensation (Dust Diseases) Act 1942 reflect the full funding of total claim liabilities as estimated by actuaries at the reporting date. This recognises the legislative power given to the State to impose levies to meet the cost of claim obligations under this Act.
(b) The allowance for impairment in the Total State Sector mainly comprises doubtful debts related to the sales of goods and services of $157 million (2018: $154 million), the collection of fees and fines of $266 million (2018: $271 million) and payroll tax of $36 million (2018: $42 million).

Note 8
Total State Sector Accounts 7 - 43
Note 8: Investments, Loans and Placements
Financial Assets at Fair Value
Investments, loans and placements measured at fair value comprise of debt investments, managed fund
investments (including TCorpIM Funds) and derivative assets.
The State’s debt investments and managed fund investments are classified, at initial recognition as
amortised cost, and subsequently measured at FVTPL.
Financial assets with cash flows that are not solely payments of principal and interest are classified and
measured at FVTPL, irrespective of the business model. Debt and managed funds investments are managed
and their performance is evaluated on a fair value basis and therefore the business model is neither to hold
to collect contractual cash flows or sell the financial asset. Hence these investments are mandatorily required
to be measured at FVTPL under AASB 9 for the current reporting period ended 30 June 2019.
Debt and managed funds investments were designated at FVTPL under AASB 139 in the comparative
period ending 30 June 2018. These investments were managed, and their performance was evaluated on a
fair value basis, in accordance with a documented risk management strategy with information about these
investments provided internally on that basis to the key management personnel.
Derivative assets are classified as held for trading and are measured at FVTPL unless they are designated
as effective hedging instruments.
TCorpIM Funds are restricted to NSW public authorities, including universities and local councils. Each
TCorpIM Fund has been established as an individual unit trust and each trust has its own investment
objective and strategy. As the majority unit holder in the TCorpIM Funds, the State has been assessed to
control the Funds under AASB 10. Thus, the TCorpIM Funds’ assets and liabilities are consolidated into the
Statement of Financial Position of the Total State Sector. The State has invested a major component of
Restart NSW money and newly established New South Wales Generation Fund (NGF) in TCorpIM Fund
Trust investments.
Refer to Note 10: Equity Investments for the carrying amounts of equity securities at fair value. The effects of
initially applying AASB 9 and further information regarding fair value measurement, credit risk, and market
risk arising from financial assets at fair value are described in Note 25: Financial Instruments.
General
Government Sector Total State Sector
2019 2018 2019 2018 $m $m $m $m
Current(a)(b) 1,897 1,801 40,617 34,259
Non-current(b) 41,436 30,776 3,943 3,383
43,333 32,578 44,560 37,643
Financial Assets at Fair Value comprise: Financial Assets Held for Trading Derivative Assets 3 0 845 551
3 0 845 551
Designated and Effective Hedging Instruments
Derivative Assets 21 1 25 6
21 1 25 6
Financial Assets at FVTPL(c)
Interest Bearing Securities(a)(d) 267 263 31,891 29,806
TCorpIM Funds(e) 42,984 32,255 (0) ...
Managed Funds and Other Investments 56 58 11,798 7,280
43,308 32,577 43,689 37,086
Total Financial Assets at Fair Value 43,333 32,578 44,560 37,643
(a) TCorp has reassessed its holdings of Reverse Repurchase Agreements which has resulted in a reclassification of $1,002 million from ‘Financial Assets at Fair Value’ to ‘Cash and Deposits’ in 2017-18.
(b) The current and non-current classification is different in the GGS and TSS due to different investment objectives. (c) The State’s financial assets at FVTPL are mandatorily measured at FVTPL under AASB 9 throughout the current reporting period ended
30 June 2019 and designated at FVTPL throughout the comparative reporting period ended 30 June 2018. (d) Interest bearing securities are debt investments and include bonds, certificates of deposit, floating rate notes and other debt securities. (e) During 2018-19, the substantial increase of $10 billion in financial assets is due to the establishment of the NSW Generations Fund (NGF).

Note 8 and Note 9
7 - 44 Total State Sector Accounts
Other Financial Assets
Other Financial Assets are non-derivative financial assets with fixed or determinable payments and fixed
maturity, comprising predominately of term deposits and finance leases receivable. These investments are
initially measured at fair value plus any transaction costs and are subsequently measured at amortised cost
using the effective interest method.
Amounts due from lessees under finance leases are classified at amortised cost and recognised at the
amount of the State’s net investment in the lease. Finance lease income is allocated to accounting periods
so as to reflect a constant periodic rate of return on the State’s net investment outstanding in respect of the
leases.
The majority of term deposits are held as part of Restart NSW for infrastructure investments. Since 2016-17,
a substantial part of these funds were reinvested in TCorpIM Funds. Term deposits with a maturity of less
than 3 months (including those for Restart NSW) are classified as Cash and Cash Equivalents (Note 6: Cash
and Cash Equivalents).
The effects of initially applying AASB 9 and further information regarding fair value measurement, credit risk,
and market risk of other financial assets are described in Note 25: Financial Instruments.
General
Government Sector Total State Sector
2019 2018 2019 2018 $m $m $m $m
Current 1,482 4,548 1,353 3,062
Non-current 1,109 1,007 1,440 1,394
2,591 5,556 2,793 4,456
Financial Assets at Amortised Cost Comprise:
Term Deposits - Maturity Greater Than 3 Months 1,462 4,370 1,274 2,840
Finance Leases Receivable(a) 1,058 981 1,441 1,411
Other 71 205 78 205
2,591 5,556 2,793 4,456
(a) Refer to Note 27: Finance and Operating Leases for an overview of finance lease assets.
Note 9: Advances Paid
Advances paid are loans provided for government policy purposes rather than for liquidity management and
are made with contractual interest rates intentionally set below the market interest rate that would otherwise
apply.
Advances are initially measured at fair value (estimated as the present value of all future cash receipts
discounted using Government bond rate) plus any transactions costs. The difference between the nominal
value of the loan and its estimated fair value is recognised as the discount component, which is expensed
immediately. Subsequent to initial recognition, these financial assets are measured at amortised cost using
the effective interest method, less impairment.
The effects of initially applying AASB 9 and further information regarding credit risk and market risk of
advances paid are described in Note 25: Financial Instruments.
General
Government Sector Total State Sector
2019 2018 2019 2018 $m $m $m $m
Current 116 70 101 54
Non-current 1,077 947 614 590
1,193 1,017 715 644
Advances Comprise: Treasury Advances for Public Housing and Other Purposes 543 465 64 91
Loans for Rural Assistance 473 385 473 385
Loans for Road Transport Infrastructure 178 167 178 167
Other 0 0 1 1
1,193 1,017 715 644

Note 10
Total State Sector Accounts 7 - 45
Note 10: Equity Investments
Equity Investments in Other Public Sector Entities
In the General Government Sector financial statements, the interest in the PNFC and PFC sectors is
accounted for as an equity investment based on the State’s proportional share of the carrying amount of net
assets of those sectors (before consolidation adjustments), in accordance with AASB 1049.
The General Government Sector has irrevocably elected to account for the change in the carrying amount of
these investments in a manner consistent with the treatment of equity instruments measured at FVOCI in
AASB 9 that would otherwise be measured at FVTPL.
The change in the carrying amount of these investments was accounted for as a change in fair value in a
manner consistent with the treatment of ‘Available for Sale’ financial assets in AASB 139 Financial
Instruments: Recognition and Measurement for the comparative period ended 30 June 2018.
Movements in the carrying amount are taken through ‘Other Economic Flows - Other Comprehensive
Income’. Dividends are recognised as income as part of ‘Revenues From Transactions’ when the right of
payment has been established. From 1 July 2018, gains and losses on these investments are never
reclassified to the ‘Operating Result’. Gains and losses accumulated in equity were recycled to the
‘Operating Result’ when these investments were derecognised in the comparative reporting period ended
30 June 2018.
Note 36 - Details of Consolidated Entities details the entities of which the Government has control.
The carrying amounts of the investments at year end is summarised below:
Non-Current Equity Investments General
Government Sector Total State Sector
2019 2018 2019 2018
$m $m $m $m
Investments in Other Public Sector Entities Investments in Public Non-Financial Corporations (PNFC) 103,568 113,348 ... ...
Less Investment in PNFC by Public Financial Corporations ... (2,832) ... ...
Net Investments in Public Non-Financial Corporations 103,568 110,516 ... ...
Consolidation Adjustment to Investment in Net Assets 157 175 ... ...
Investments in Public Financial Corporations 855 4,874 ... ...
Consolidation Adjustment to Investment in Net Assets (5,590) (2,653) ... ...
98,990 112,911 ... ...
The annual movements of the investments are summarised below:
General Government Sector
2019 2018 $m $m
Balance of Investment in Other Public Sector Entities at beginning of Year 112,911 106,355
Net Contributions to/(Returns from) Other Sectors by/(to) Owner (6,627) 281
Revaluation Gain/(Loss) for Period in Other Sectors (4,340) 5,506
Movement for the Period in the Consolidation Adjustment (2,954) 769
Total Investments in Other Sector Entities at end of Year 98,990 112,911

Note 10
7 - 46 Total State Sector Accounts
Investments in Associates
Equity investments in associates are accounted for using the Equity Method.
Movements in the State’s share of profits are recognised in the operating result, split between dividends
recognised as ‘Revenue from Transactions’ and the share of earnings excluding dividends recognised as
‘Other Economic Flows – included in the operating result’ based on the State’s share of ownership.
Revaluation movements in the State’s share of equity are recognised as a change to reserves and
recognised as ‘Other Economic Flows – Other Comprehensive Income’.
Investments in Associates Accounted for Using the Equity Method comprise the State's share in:
General
Government Sector Total State Sector
2019 2018 2019 2018 $m $m $m $m
Ausgrid(a) 3,643 3,954 3,643 3,954
Endeavour Energy(a) 1,978 2,033 1,978 2,033
WestConnex Group(b) 6,424 ... 6,424 ...
Other Entities 10 ... 11 2
12,055 5,987 12,057 5,988
(a) This represents the State’s retained interest of 49.6% in these entities. (b) This represents the State’s retained interest of 49.0% in this entity.
Ausgrid
Ausgrid is the operator of one of the leading electricity networks in Australia, distributing electricity to the
Sydney, Central Coast and Hunter regions of New South Wales.
The State holds 49.6 per cent of Ausgrid via a corporation constituted under the Electricity Retained Interest
Corporations Act 2015, named Electricity Retained Interest Corporation - Ausgrid. The remaining
50.4 per cent is owned by the private sector by IFM Investors and Australian Super in equal shares,
operating the network under a 99-year lease.
As the State does not control the entity, it has applied the equity method to account for its investment in
Ausgrid. The following table summarises information on the State’s investment in Ausgrid.
General
Government Sector Total State Sector
2019 2018 2019 2018 $m $m $m $m
The State's share of Ausgrid's assets and liabilities Current Assets 321 343 321 343
Non-Current Assets 10,537 10,063 10,537 10,063
Current Liabilities (354) (329) (354) (329)
Non-Current Liabilities (6,861) (6,123) (6,861) (6,123)
Net Assets(a) 3,643 3,954 3,643 3,954
The State's share of Ausgrid's profit Revenue 1,289 1,297 1,289 1,297
Profit/(Loss) Before Income Tax 80 256 80 256
Distribution income recognised (166) (196) (166) (196)
Profit After Income Tax (86) 61 (86) 61
Other Comprehensive Income (246) (31) (246) (31)
Total Comprehensive Income (332) 30 (332) 30
(a) During the year, the State invested an additional $21 million in Ausgrid.

Note 10
Total State Sector Accounts 7 - 47
Endeavour Energy
Endeavour Energy is the operator of the electrical distribution network for western Sydney, the Blue
Mountains, the Southern Highlands and the Illawarra region of NSW.
New South Wales holds 49.6 per cent of Endeavour Energy via a corporation constituted under the
Electricity Retained Interest Corporations Act 2015, named Electricity Retained Interest Corporation –
Endeavour Energy. The remaining 50.4 per cent is owned by the private sector by the Edwards partner
consortium, operating the network under a 99-year lease.
As the State does not control the entity, it has applied the equity method to account for its investment in
Endeavour Energy. The following table summarises information on New South Wales’ investment in
Endeavour. The State’s share of Endeavour’s assets and liabilities and profit in the State’s result to 30 June
2018 represents the period from 11 May 2017 when Endeavour Energy commenced the operation under the
99-year lease.
General
Government Sector Total State Sector
2019 2018 2019 2018 $m $m $m $m
The State's share of Endeavour's assets and liabilities
Current Assets 272 211 272 211
Non-Current Assets 5,000 4,789 5,000 4,789
Current Liabilities (171) (165) (171) (165)
Non-Current Liabilities (3,122) (2,802) (3,122) (2,802)
Net Assets 1,978 2,033 1,978 2,033
The State's share of Endeavour's profit
Revenue 633 750 633 750
Profit/(Loss) Before Income Tax 142 (51) 142 (51)
Stamp Duty ... 225 ... 225
Distribution income recognised (33) (74) (33) (74)
Profit After Income Tax 108 100 108 100
Other Comprehensive Income (163) (13) (163) (13)
Total Comprehensive Income (55) 87 (55) 87
WestConnex Group
WestConnex is the largest road infrastructure project in Australia, linking Western and South-Western
Sydney with the City, airport and port in a 33-kilometre continuous motorway.
The State holds 49 per cent of the WestConnex Group via a corporation constituted under the Corporations
Act 2001, named Roads Retained Interest Pty Ltd. The remaining 51 per cent is owned by the private sector
by Sydney Transport Partners Consortium. The WestConnex Group is constructing and operating the road
network under a concession agreement expiring in 2060.
The State’s share of WestConnex’s assets and liabilities and profits in the State’s results to 30 June 2019
represents the period from 27 September 2018 when the State’s interest was acquired by Retained Roads
Interest Pty Ltd.

Note 10
7 - 48 Total State Sector Accounts
As the State does not control the entity, it has applied the equity method to account for its investment in the
WestConnex Group. The following table summarises information on the State’s investment in the
WestConnex Group.
General
Government Sector Total State Sector
2019 2018 2019 2018 $m $m $m $m
The State's share of WestConnex Group's assets and liabilities
Current Assets 684 ... 684 ...
Non-Current Assets 9,798 ... 9,798 ...
Current Liabilities (149) ... (149) ...
Non-Current Liabilities (3,909) ... (3,909) ...
Net Assets 6,424 ... 6,424 ...
The State's share of WestConnex's profit
Revenue 929 ... 929 ...
Profit/(Loss) Before Income Tax (1) ... (1) ...
Income Tax Expense (4) ... (4) ...
Distribution income recognised (19) ... (19) ...
Profit After Income Tax (24) ... (24) ...
Other Comprehensive Income (139) ... (139) ...
Total Comprehensive Income (163) ... (163) ...
Other Equity Investments
The State’s other equity investments comprise of investments in listed and unlisted equity securities.
Other equity investments are classified, at initial recognition, as either measured at FVTPL or are irrevocably
elected by the State to be measured at FVOCI (available-for-sale under AASB 139 for the comparative
period ended 30 June 2018). Other equity investments are measured at their fair value plus, in the case of
an equity investments not at fair value through profit or loss, transaction costs that are directly attributable to
the acquisition of the instrument.
Other equity investments at FVTPL are mandatorily measured at FVTPL under AASB 9 throughout the
current reporting period ended 30 June 2019. Other equity investments managed on a fair value basis were
designated at FVTPL under AASB 139 throughout the comparative reporting period ended 30 June 2018.
The State has not classified any Other Equity Investments at FVOCI as at 30 June 2019.
Other equity investments held by the Total State Sector predominately comprise of TCorpIM Fund Trust
investments in equity securities. In total, TCorpIM Fund Trusts have investments in equity securities
amounting to $24,272 million (2018: $19,531 million). Since 2016-17, the State has invested a major
component of the Restart NSW money in TCorpIM Fund Trust investments.
The effects of initially applying AASB 9 and further information regarding fair value measurement and market
risk of other equity investments are described in Note 25: Financial Instruments.
General
Government Sector Total State Sector
2019 2018 2019 2018 $m $m $m $m
Other Equity Investments Other Equity Investments - At Fair Value through Profit and Loss (a) 8 ... 24,468 19,531
Other Equity Investments - Available for Sale Financial Assets ... 722 ... 889
8 722 24,468 20,420
(a) The State’s equity investments at FVTPL are mandatorily measured at FVTPL under AASB 9 throughout the current reporting period ended 30 June 2019 and designated at FVTPL throughout the comparative reporting period ended 30 June 2018 under AASB 139.

Note 11
Total State Sector Accounts 7 - 49
Note 11: Inventories
Inventories held for distribution are stated at cost, adjusted when applicable for any loss of service potential,
in accordance with AASB 102 Inventories. A loss of service potential is identified and measured when
current replacement costs is lower than carrying amount.
Inventories (other than those held for distribution) are valued at the lower of cost and net realisable value.
Cost is calculated using the weighted average cost or the ‘first in first out’ method.
Land held for resale, for government authorities that trade in land, is recorded taking account of acquisition
costs, development and other costs.
The cost of inventories acquired at no costs or for nominal consideration on the date of acquisition is
recognised at its current replacement cost. The current replacement cost is the cost the State would incur to
acquire the asset on the reporting date.
General
Government Sector Total State Sector
2019 2018 2019 2018 $m $m $m $m
Current 261 263 481 540
Non-current 138 64 392 286
399 327 873 826
Inventories Comprise: Materials Held at Cost
Raw Materials 10 9 43 9
Work in Progress 13 6 17 10
Finished Goods 38 17 41 18
Consumable Stores 183 211 313 316
Consumable Stores Held for Distribution 15 17 15 18
Finished Goods at Net Realisable Value 1 2 1 2
Consumable Stores Held for Distribution at Current Replacement Cost 6 7 9 8
Land Held for Resale 132 58 435 445
399 327 873 826
Land held for resale, for government agencies that trade in land, has been recorded at:
General
Government Sector Total State Sector
2019 2018 2019 2018 $m $m $m $m
Acquisition Cost 81 53 185 163
Development Cost 51 5 250 282
132 58 435 445

Note 12
7 - 50 Total State Sector Accounts
Note 12: Assets Classified as Held for Sale
Non-current assets (or disposal groups) are classified as held for sale, where their carrying amount will be
recovered principally through a sale transaction and not through continuing use.
For this to be the case, the asset (or disposal group) must be available for immediate sale in its present
condition subject only to terms that are usual and customary for sales of such assets (or disposal groups)
and its sale must be highly probable. For the sale to be highly probable, the appropriate level of
management must be committed to a plan to sell the asset (or disposal group), and an active program to
locate a buyer and complete the plan must have been initiated. Further, the asset (or disposal group) must
be actively marketed for sale at a price that is reasonable in relation to its current fair value. In addition, the
sale should be expected to qualify for recognition as a completed sale within one year from the date of
classification.
Non-current assets (or disposal groups) held for sale are recognised at the lower of carrying amount and fair
value less costs to sell. These assets are not depreciated while they are classified as held for sale.
The assets classified as held for sale at 30 June 2019 were:
General
Government Sector Total State Sector
2019 2018 2019 2018 $m $m $m $m
Non-Current Assets Held for Sale Land and Buildings 213 320 274 430
Plant and Equipment 2 0 2 0
Infrastructure Systems 7 0 7 0
222 320 283 430
General
Government Sector Total State Sector
2019 2018 2019 2018 $m $m $m $m
Non-Current Assets Held for Sale Barangaroo Delivery Authority 71 91 71 91
New South Wales Land and Housing Corporation ... ... 56 74
Ministry of Health 56 41 56 41
Department of Finance, Services and Innovation 26 7 26 7
Other(a) 69 181 75 217
222 320 283 430
(a) Amounts in 2018 include $110 million assets held for sale recorded by Department of Family and Community Services for a Disability Services site at Rydalmere.

Note 13
Total State Sector Accounts 7 - 51
Note 13: Property, Plant and Equipment
Property, plant and equipment comprise three asset classes: land and buildings, plant and equipment, and
infrastructure systems.
Property, plant and equipment is initially recognised at cost, in accordance with AASB 116 Property, Plant
and Equipment (AASB 116). Those assets acquired at no cost or for nominal consideration are initially
recognised at their fair value at the date of acquisition. The cost of assets constructed for own use includes
the cost of materials, direct labour, and foreign exchange gains and losses arising during construction, as
well as an appropriate proportion of variable and fixed overhead costs that can be reliably attributed to the
assets.
Property, plant and equipment is subsequently measured at fair value in accordance with AASB 116,
AASB 13 Fair Value Measurement and NSW Treasury Policy Paper 14-01 Accounting Policy: Valuation of
Physical Non-Current Assets at Fair Value.
In general, property, plant and equipment with a value greater than $5,000 is capitalised except for computer
equipment which is normally capitalised irrespective of the $5,000 threshold where it is considered to be part
of a network of assets.
Revaluation of Property, Plant and Equipment
Property, plant and equipment is measured at the highest and best use by market participants that is
physically possible, legally permissible and financially feasible. The highest and best use must take into
account the characteristics of the asset being measured, including any socio-political restrictions imposed by
government. In most cases, after taking into account these considerations, the highest and best use is the
existing use.
The market or income approach is used to fair value the following types of property, plant and equipment:
• Land under roads is valued using a market approach at existing use, based on an englobo valuation
approach or proxy such as open space land (i.e. as such land generally has no feasible alternative use,
is undeveloped and publicly accessible).
• Land under water is valued using a market approach with reference to adjacent land values, having
regard to zoning restrictions, access, location, size, topography and other characteristics or with
reference to land that has a low economic value adjusted for differences in location, restriction and uses.
• Other land, including Crown leasehold land, is valued using a market approach, based on a valuation per
hectare per each land category type.
• Non-specialised buildings, which include commercial and general-purpose buildings for which there is a
secondary market, are valued using either approach.
• Certain heritage assets, including artworks, book collections, philately and coin collections are valued
using a market or cost approach.
• The fair value of cash generating assets is estimated using an income approach.
For assets valued using the income approach or market approach, any accumulated depreciation is
eliminated against the gross carrying amount of the assets to which they relate, and the net asset carrying
amount is increased or decreased by the revaluation increment or decrement.
Revaluation increments increase the revaluation surplus, except that, to the extent that an increment
reverses a revaluation decrement for that class of asset previously recognised as a loss in the operating
result, the increment is recognised as a gain. Revaluation decrements are charged to the revaluation surplus
to the extent that a credit exists in the revaluation surplus in respect of the same class of asset. Any
remaining decrements are recognised as a loss. Where an asset that has previously been revalued is
disposed of, any balance remaining in the revaluation surplus in respect of that asset is transferred to
accumulated funds.
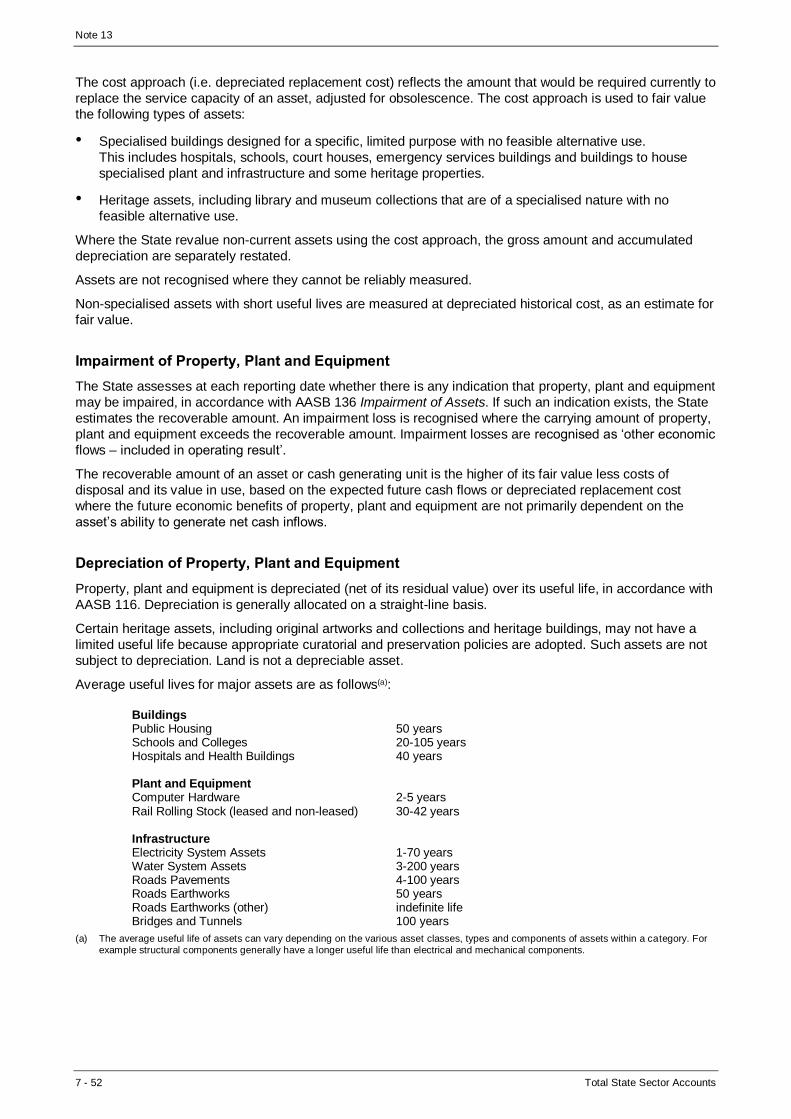
Note 13
7 - 52 Total State Sector Accounts
The cost approach (i.e. depreciated replacement cost) reflects the amount that would be required currently to
replace the service capacity of an asset, adjusted for obsolescence. The cost approach is used to fair value
the following types of assets:
• Specialised buildings designed for a specific, limited purpose with no feasible alternative use.
This includes hospitals, schools, court houses, emergency services buildings and buildings to house
specialised plant and infrastructure and some heritage properties.
• Heritage assets, including library and museum collections that are of a specialised nature with no
feasible alternative use.
Where the State revalue non-current assets using the cost approach, the gross amount and accumulated
depreciation are separately restated.
Assets are not recognised where they cannot be reliably measured.
Non-specialised assets with short useful lives are measured at depreciated historical cost, as an estimate for
fair value.
Impairment of Property, Plant and Equipment
The State assesses at each reporting date whether there is any indication that property, plant and equipment
may be impaired, in accordance with AASB 136 Impairment of Assets. If such an indication exists, the State
estimates the recoverable amount. An impairment loss is recognised where the carrying amount of property,
plant and equipment exceeds the recoverable amount. Impairment losses are recognised as ‘other economic
flows – included in operating result’.
The recoverable amount of an asset or cash generating unit is the higher of its fair value less costs of
disposal and its value in use, based on the expected future cash flows or depreciated replacement cost
where the future economic benefits of property, plant and equipment are not primarily dependent on the
asset’s ability to generate net cash inflows.
Depreciation of Property, Plant and Equipment
Property, plant and equipment is depreciated (net of its residual value) over its useful life, in accordance with
AASB 116. Depreciation is generally allocated on a straight-line basis.
Certain heritage assets, including original artworks and collections and heritage buildings, may not have a
limited useful life because appropriate curatorial and preservation policies are adopted. Such assets are not
subject to depreciation. Land is not a depreciable asset.
Average useful lives for major assets are as follows(a):
Buildings Public Housing 50 years Schools and Colleges 20-105 years Hospitals and Health Buildings 40 years Plant and Equipment Computer Hardware 2-5 years Rail Rolling Stock (leased and non-leased) 30-42 years Infrastructure Electricity System Assets 1-70 years Water System Assets 3-200 years Roads Pavements 4-100 years Roads Earthworks 50 years Roads Earthworks (other) indefinite life Bridges and Tunnels 100 years
(a) The average useful life of assets can vary depending on the various asset classes, types and components of assets within a category. For example structural components generally have a longer useful life than electrical and mechanical components.

Note 13
Total State Sector Accounts 7 - 53
General Government Sector
Fair Value Land and Buildings
Plant and Equipment
Infrastructure Systems Total
$m $m $m $m
At 30 June 2018
Gross Carrying Amount 115,489 16,671 144,024 276,183
Accumulated Depreciation and Impairment (32,099) (5,729) (41,876) (79,704)
Net Carrying Amount 83,390 10,941 102,147 196,479
At 30 June 2019
Gross Carrying Amount 121,939 18,553 163,905 304,397
Accumulated Depreciation and Impairment (31,976) (6,465) (44,614) (83,055)
Net Carrying Amount 89,963 12,088 119,291 221,343
Reconciliation: Land and Buildings
Plant and Equipment
Infrastructure Systems Total
$m $m $m $m
Year Ended 30 June 2019
Net Carrying Amount at Start of Year 83,390 10,941 102,147 196,479
Additions 5,474 1,320 9,779 16,574
Assets Reclassified To Held for Sale (49) (2) ... (50)
Disposals (188) (142) (1,382) (1,712)
Net Revaluations Recognised In Reserves 2,250 (36) 4,992 7,205
Depreciation Expense (1,637) (872) (1,920) (4,429)
Other Movements(a) 723 878 5,675 7,276
Net Carrying Amount at End of Year 89,963 12,088 119,291 221,343
Fair Value Land and Buildings
Plant and Equipment
Infrastructure Systems Total
$m $m $m $m
At 30 June 2017
Gross Carrying Amount 105,448 15,452 138,728 259,628
Accumulated Depreciation and Impairment (32,696) (5,274) (46,581) (84,551)
Net Carrying Amount - as originally reported 72,752 10,178 92,147 175,077
At 30 June 2018
Gross Carrying Amount 115,489 16,671 144,024 276,183
Accumulated Depreciation and Impairment (32,099) (5,729) (41,876) (79,704)
Net Carrying Amount 83,390 10,941 102,147 196,479
Reconciliation: Land and Buildings
Plant and Equipment
Infrastructure Systems Total
$m $m $m $m
Year Ended 30 June 2018
Net Carrying Amount at Start of Year 72,752 10,178 92,147 175,077
Corrections to Prior Period(b) ... ... (2,145) (2,145)
Net Carrying Amount at Start of Year 72,752 10,178 90,002 172,932
Additions 3,496 1,206 7,056 11,758
Assets Reclassified To Held for Sale (236) (3) (0) (239)
Disposals (239) (133) (321) (693)
Net Revaluations Recognised In Reserves 9,087 445 8,056 17,588
Depreciation Expense (1,519) (735) (1,943) (4,197)
Other Movements 50 (16) (702) (669)
Net Carrying Amount at End of Year 83,390 10,941 102,147 196,479
(a) Equity transfers of $4,612 million from RailCorp have been classified in ‘Other Movements’. (b) Refer Note 31 Restatement/Corrections to Prior Year Comparatives, for details of corrections to prior periods.

Note 13
7 - 54 Total State Sector Accounts
Total State Sector
Fair Value Land and Buildings
Plant and Equipment
Infrastructure Systems Total
$m $m $m $m
At 30 June 2018
Gross Carrying Amount 199,388 28,949 226,244 454,582
Accumulated Depreciation and Impairment (37,761) (11,581) (68,087) (117,429)
Net Carrying Amount 161,627 17,367 158,158 337,153
At 30 June 2019
Gross Carrying Amount 204,036 29,668 239,638 473,342
Accumulated Depreciation and Impairment (37,690) (11,594) (71,701) (120,985)
Net Carrying Amount 166,346 18,075 167,936 352,357
Reconciliation: Land and Buildings
Plant and Equipment
Infrastructure Systems Total
$m $m $m $m
Year Ended 30 June 2019
Net Carrying Amount at Start of Year 161,627 17,367 158,158 337,153
Additions 6,431 2,120 13,457 22,008
Assets Reclassified To Held for Sale (401) (24) ... (425)
Disposals (507) (173) (1,465) (2,146)
Net Revaluations Recognised In Reserves 2,484 (576) 5,546 7,454
Depreciation Expense (2,582) (1,257) (3,264) (7,103)
Other Movements(a) (706) 618 (4,496) (4,585)
Net Carrying Amount at End of Year 166,346 18,075 167,936 352,357
Fair Value Land and Buildings
Plant and Equipment
Infrastructure Systems Total
$m $m $m $m
At 30 June 2017
Gross Carrying Amount 181,457 26,882 218,800 427,139
Accumulated Depreciation and Impairment (38,063) (11,173) (71,815) (121,050)
Net Carrying Amount - as originally reported 143,394 15,709 146,985 306,089
At 30 June 2018
Gross Carrying Amount 199,388 28,949 226,244 454,582
Accumulated Depreciation and Impairment (37,761) (11,581) (68,087) (117,429)
Net Carrying Amount 161,627 17,367 158,158 337,153
Reconciliation: Land and Buildings
Plant and Equipment
Infrastructure Systems Total
$m $m $m $m
Year Ended 30 June 2018 Net Carrying Amount at Start of Year 143,394 15,709 146,985 306,089
Corrections to Prior Period(b) ... ... (2,145) (2,145)
Net Carrying Amount at Start of Year 143,394 15,709 144,840 303,944
Additions 5,328 1,410 10,876 17,615
Assets Reclassified To Held for Sale (332) 4 (1) (328)
Disposals (665) (164) (345) (1,174)
Net Revaluations Recognised In Reserves 15,690 477 8,370 24,538
Depreciation Expense (2,368) (1,112) (3,266) (6,747)
Other Movements 579 1,042 (2,316) (694)
Net Carrying Amount at End of Year 161,627 17,367 158,158 337,153
(a) Assets disposed of as part of the discontinued operations have been classified in ‘Other Movements’. (b) Refer Note 31 Restatement/Corrections to Prior Year Comparatives, for details of corrections to prior periods.

Note 13
Total State Sector Accounts 7 - 55
Fair Value Measurement of Non-Financial Assets
The table below sets out the State’s non-financial assets measured at fair value according to the fair value
hierarchy at reporting date.
Fair Value Hierarchy of Non-Financial Assets
General Government Sector
30 June 2019 Level 1 Level 2 Level 3 Historical Cost Total $m $m $m $m $m
Fair Value Hierarchy Property, Plant and Equipment Land and Buildings ... 15,366 74,598 ... 89,963
Plant and Equipment(a) ... 3,704 4,439 3,945 12,088
Infrastructure Systems ... 145 119,147 ... 119,291
Assets Held for Sale (Note 12) ... 204 19 ... 222
... 19,418 198,203 3,945 221,564
30 June 2018 Level 1 Level 2 Level 3 Historical Cost Total $m $m $m $m $m
Fair Value Hierarchy Property, Plant and Equipment Land and Buildings ... 15,737 67,653 ... 83,390
Plant and Equipment(a) ... 4,257 3,182 3,501 10,941
Infrastructure Systems ... 265 101,882 ... 102,147
Assets Held for Sale (Note 12) ... 209 111 ... 320
... 20,469 172,829 3,501 196,798
(a) Assets measured using depreciated historical cost as a surrogate for fair value do not require fair value hierarchy disclosures under AASB 13 Fair Value Measurement.
Total State Sector
30 June 2019 Level 1 Level 2 Level 3 Historical Cost Total $m $m $m $m $m
Fair Value Hierarchy Property, Plant and Equipment Land and Buildings ... 17,386 148,960 ... 166,346
Plant and Equipment(a) ... 3,733 9,875 4,467 18,075
Infrastructure Systems ... 145 167,792 ... 167,937
Assets Held for Sale (Note 12) ... 205 78 ... 283
... 21,468 326,705 4,467 352,640
30 June 2018 Level 1 Level 2 Level 3 Historical Cost Total $m $m $m $m $m
Fair Value Hierarchy Property, Plant and Equipment Land and Buildings ... 17,547 144,080 ... 161,627
Plant and Equipment(a) ... 4,292 9,149 3,926 17,367
Infrastructure Systems ... 298 157,861 ... 158,158
Assets Held for Sale (Note 12) ... 211 218 ... 430
... 22,348 311,308 3,926 337,582
(a) Assets measured using depreciated historical cost as a surrogate for fair value do not require fair value hierarchy disclosures under AASB 13 Fair Value Measurement.

Note 13
7 - 56 Total State Sector Accounts
Reconciliation of Recurring Level 3 Fair Value Measurements
General Government Sector
Land and Buildings
Plant and Equipment
Infrastructure Systems
Assets Held for
Sale
Total Recurring
Level 3 Fair Value
$m $m $m $m $m
Fair Value as at 1 July 2018 67,654 3,182 101,883 111 172,830
Additions 3,708 266 9,841 10 13,824
Revaluations Recognised in Other Comprehensive
Income 2,705 65 3,157 ... 5,927
Transfers into Level 3 532 (0) (1) ... 531
Transfers out of Level 3 (98) (1) 0 ... (99)
Disposals (207) (1) (1,141) (2) (1,351)
Depreciation Expense (1,539) (174) (1,919) ... (3,632)
Other Movements 1,843 1,102 7,327 (100) 10,173
Fair Value as at 30 June 2019 74,598 4,439 119,147 19 198,203
Land and Buildings
Plant and Equipment
Infrastructure Systems
Assets Held for
Sale
Total Recurring
Level 3 Fair Value
$m $m $m $m $m
Fair Value as at 1 July 2017 54,052 1,637 92,030 ... 147,718
Additions 2,630 256 6,803 ... 9,689
Revaluations Recognised in Other Comprehensive
Income 8,714 463 8,033 ... 17,210
Transfers into Level 3 4,789 840 223 ... 5,851
Transfers out of Level 3 (648) ... (54) ... (702)
Disposals (221) (5) (16) ... (242)
Depreciation Expense(a) (1,421) (139) (1,965) (0) (3,525)
Other Movements(a) (241) 130 (3,172) 111 (3,171)
Fair Value as at 30 June 2018 67,654 3,182 101,883 111 172,829
Refer Note 31 Restatement/Corrections to Prior Year Comparatives, for details of corrections to prior period.

Note 13
Total State Sector Accounts 7 - 57
Total State Sector
Land and Buildings
Plant and Equipment
Infrastructure Systems
Assets Held for
Sale
Total Recurring
Level 3 Fair Value
$m $m $m $m $m
Fair Value as at 1 July 2018 144,080 9,150 157,862 218 311,309
Additions 5,828 893 13,702 10 20,433
Revaluations Recognised in Other Comprehensive Income 2,606 (472) 3,689 ... 5,824
Transfers into Level 3 527 ... 21 ... 548
Transfers out of Level 3 (98) (1) ... ... (99)
Disposals (522) (12) (1,225) (78) (1,837)
Depreciation Expense (2,405) (481) (3,302) ... (6,189)
Other Movements (1,056) 798 (2,955) (71) (3,284)
Fair Value as at 30 June 2019 148,960 9,875 167,792 78 326,705
Land and Buildings
Plant and Equipment
Infrastructure Systems
Assets Held for
Sale
Total Recurring
Level 3 Fair Value
$m $m $m $m $m
Fair Value as at 1 July 2017 122,892 6,537 146,771 83 276,283
Additions 4,644 1,390 9,906 ... 15,940
Revaluations Recognised in Other Comprehensive
Income 15,500 454 8,343 ... 24,296
Transfers into Level 3 5,293 1,348 301 ... 6,941
Transfers out of Level 3 (974) (14) (54) ... (1,041)
Disposals (926) (27) (129) (65) (1,147)
Depreciation Expense(a) (2,329) (444) (3,329) (0) (6,102)
Other Movements(a) (20) (95) (3,947) 200 (3,862)
Fair Value as at 30 June 2018 144,080 9,150 157,862 218 311,308
(a) Refer Note 31 Restatement/Corrections to Prior Year Comparatives, for details of corrections to prior period.
Valuation techniques, inputs and processes
Land and Buildings
Most of the State’s Land and Buildings comprise of specialised assets such as public housing, schools,
TAFE colleges, hospitals, railway stations and rail associated buildings, justice buildings (including court
houses, prisons and juvenile justice centres), the Olympic Stadium and Arena, Sydney Opera House, police
stations, Crown land and land under roads.
Non-specialised Land and Buildings are generally classified as Level 2. Specialised Land and Buildings are
generally classified as Level 3. Market evidence is used where relevant and then adjusted to take account of
factors such as the location, type and constraints around the use of the asset. The valuation approaches for
the main types of assets within Land and Buildings are set out below.
Public Housing
Public Housing (mainly classified as Level 3) is determined by applying a mass appraisal methodology with
an annual rolling benchmark valuation approach whereby a third of benchmark properties are valued by
accredited property valuers with reference to market sales comparisons to calculate a market movement
index. The market movement index is applied to the remaining two-thirds of the benchmark properties. All
benchmark properties are grouped within thirteen geographical reporting regions. The median value increase
in each geographical group is applied to the respective group of properties within the property portfolio of the
group. Adjustments to each property are made for any significant different characteristic from benchmark
properties. The rolling benchmark valuation process is performed annually as at 31 December. An uplift
market movement factor has been provided from a registered valuer for the six months ended 30 June.

Note 13
7 - 58 Total State Sector Accounts
Schools and Education Facilities
School and Education Land and Buildings are mainly classified as Level 3. The valuers use current market
sales evidence to determine the market value of land without restrictions and then apply a discount rate to
these values, to adjust for the restricted use of the land. The valuations use the weighted average market
value per square metre of land. School and TAFE buildings are valued using the depreciated replacement
cost method. Due to the size of the portfolio a mass appraisal technique is used. Replacement cost rates for
the asset components of a building are determined based on the cost of recently built buildings. The
valuation takes account of the weighted average replacement cost per square metre for the building shell,
fit-outs, external services, landscaping and demountables. Adjustments are then made for location and
special need requirements. Useful lives and depreciated rates are based on internal analysis.
Hospitals
Land is valued using a market approach, comparing similar assets and observable inputs. Where the land is
restricted, a discount rate is applied to adjust for the restricted use of the land. The value utilises a market
sales comparison approach taking account of recent sales of comparable properties. Hospital buildings are
mainly classified as Level 3 and are valued using the depreciated replacement cost method. The current
replacement cost per square metre is assessed by reference to external publications with allowances made
for regional locations. Remaining economic life is assessed based on physical deprecation and
obsolescence.
Roads
Land under roads is valued using the Urban Average Rateable Value (ARV) per hectare within each Local
Government Area adjusted by an ‘open space’ ratio. The valuation takes account of Local Government Area
rateable land values and the land area under roads.
Sensitivity of the fair value measurement
Public Housing Higher/(lower) market sales values reflect higher/(lower) valuations
Schools and Education Facilities
The estimated fair value of land would increase/ (decrease) if the value per square metre were higher/ (lower). The estimated fair value of buildings would increase/ (decrease) if the replacement cost per square metre for the asset components were higher/ (lower).
Hospitals The estimated fair value of land would increase/ (decrease) if the value per square metre were higher/ (lower). The estimated fair value of buildings would increase/ (decrease) if the replacement cost per square
metre for the asset components were higher/ (lower).
Land under Roads The estimated fair value would increase/ (decrease) if the weighted current year Urban Average Rateable Value increases/ (decreases).
Crown land
Crown land is generally classified as Level 2 and is valued using the market value approach by utilising
market comparable land. Valuations take account of the sale price of comparable land and adjusted for the
size of the land and the long-term land appreciated rate. The estimated fair value would increase/ (decrease)
if the comparable land values increase/ (decrease).
Plant and Equipment
Plant and Equipment comprises both specialised and non-specialised assets. Non-specialised assets are
generally classified as Level 2. The main specialised assets are rail rolling stock, public buses and ferries,
and museum and library collections. The specialised assets are generally classified as Level 3. Assets
measured using depreciated historical cost as an estimate for fair value do not require fair value hierarchy
disclosures under AASB 13 Fair Value Measurement.

Note 13
Total State Sector Accounts 7 - 59
Rail rolling stock
Rolling stock is valued using a depreciated replacement cost method. Replacement cost rates are based on
domestic and international vehicles adjusted by an optimisation factor to reflect the technical and functional
obsolescence of the fleet sub-types relative to the modern equivalent.
Public buses
Finance leased buses are valued using the Optimised Replacement Cost (ORC) which is the minimum that it
would cost, in the normal course of business, to replace existing asset with a technologically modern
equivalent new asset with the same economic benefits, allowing for any differences in the quantity and
quality of input and in operating costs. The ORC estimates are based on the most recent cost prices for the
buses and current pricing for Rural and Regional Urban and School bus types, as quoted by numerous
chassis and bus providers.
Ferries
Ferries are valued using a depreciated replacement cost method. Replacement cost rates are based on the
quoted cost for replacing the vessels.
Collection assets
Collection assets are classified as either Level 2 or Level 3 based on the level of inputs used in the valuation.
Valuation methods vary depending on the type of collection assets. All assets regarded as highly significant
are individually valued, with other assets valued by category of item using appropriately sized samples. In
most instances, the sampling techniques are performed by professional statisticians. Market values are
based on market evidence with reference to recent sales of items that are similar. Where there is a lack of
market based evidence, re-collection costs are used.
Sensitivity of the fair value measurement
Rolling Stock The estimated fair value would increase/ (decrease) if the replacement cost rates were higher/ (lower).
Buses The estimated fair value would increase/ (decrease) if the market prices for buses increased/ (decreased).
Ferries The estimated fair value would increase/ (decrease) if the replacement cost rates were higher/ (lower).
Collection Assets The estimated fair value would increase/ (decrease) if the market prices increased/ (decreased).
Infrastructure Systems
Infrastructure systems comprise the State’s electricity systems, dams and water system assets, road
infrastructure and railway infrastructure. Most infrastructure assets are classified as Level 3 because they
comprise specialised assets for the delivery of utility and transport services.

Note 13
7 - 60 Total State Sector Accounts
Dams and water system assets
The majority of the State’s dams and water system assets are valued using an income valuation method.
The discounted cash flow model is used to perform the value in use calculation to determine the value of the
assets. The Regulatory Asset Based Value, determined by the Independent Pricing and Regulatory Tribunal
(IPART), is used in conjunction with forecast cash flows and a discount rate.
Road infrastructure
Road infrastructure is valued using the depreciated replacement cost method. Due to the size of the portfolio
a mass appraisal technique is used. Replacement cost rates for each significant asset component are
determined based on the unit prices quoted in the most recent construction tender documents or road cost
index.
Rail infrastructure
Track work and related infrastructure is valued using the depreciated replacement cost method.
Replacement cost rates for each significant asset component are determined based on the replacement cost
of the various asset components.
Sensitivity of the fair value measurement
Electricity Systems The higher the future net cash inflows, the higher the fair value. The higher the discount rate, the lower the fair value.
Dams and Water System Assets
The higher the future net cash inflows, the higher the fair value. The higher the discount rate, the lower the fair value.
Road Infrastructure The estimated fair value would increase/ (decrease) if current replacement cost, road index cost or current unit replacement cost for the component increases/ (decreases).
Railway Infrastructure The estimated fair value would increase/ (decrease) if the replacement cost rates were higher/ (lower).
Non-current Assets Held for Sale
Non-current assets (or disposal groups) held for sale are recognised at the lower of carrying amount and fair
value less costs to sell. Most assets are classified at Level 2 as their value has been determined on market
observable inputs.

Note 14
Total State Sector Accounts 7 - 61
Note 14: Intangibles
Intangible assets are measured initially at cost, in accordance with AASB 138 Intangible Assets (AASB 138).
Where an asset is acquired free of cost or at nominal cost, the cost is its fair value as at the date of
acquisition. The State recognises intangible assets only if it is probable that future economic benefits will flow
to the State and the cost of the asset can be measured reliably. All research costs are expensed.
Development costs are only capitalised when certain criteria are met.
Intangible assets are subsequently measured at fair value where there is an active market. If there is no
active market, the assets are carried at cost less any accumulated amortisation and impairment losses.
Intangible assets with finite lives are amortised under the straight line method and expensed in the
Statement of Comprehensive Income for the period, in accordance with AASB 138. Intangible assets with an
indefinite life are not amortised, but are tested for impairment annually either individually or at the cash
generating unit level.
Intangible assets are tested for impairment where an indicator of impairment exists. If the recoverable
amount is less than the carrying amount, the carrying amount is reduced to the recoverable amount and an
impairment loss is recognised in ‘other economic flows – included in the operating result’.
Easements are treated as having an indefinite life as the access rights are considered to be permanent.
Assumptions
Computer Software Easements Other
Useful lives Finite (2-10 years) Indefinite Finite (4-10 years)
Amortisation method Straight line Not amortised Various
Internally Generated/Acquired Both Acquired Both
Impairment test/Recoverable amount testing
Where an indicator of impairment exists
Annually and where an indicator of impairment exists
Where an indicator of impairment exists

Note 14
7 - 62 Total State Sector Accounts
General Government Sector
Computer
Software Easements(a) Other Total $m $m $m $m
At 1 July 2018
Cost (Gross Carrying Amount) 5,608 333 0 5,941
Accumulated Amortisation and Impairment (2,250) ... ... (2,250)
Net Carrying Amount 3,358 333 0 3,691
At 30 June 2019
Cost (Gross Carrying Amount) 5,930 349 (0) 6,279
Accumulated Amortisation and Impairment (2,577) (8) 0 (2,585)
Net Carrying Amount 3,352 342 0 3,694
Reconciliation:
Year ended 30 June 2019 Net Carrying Amount at Start of Year 3,358 333 0 3,691
Additions 601 0 140 741
Disposals (14) (0) (20) (34)
Reclassification (to) / from Property, Plant and Equipment 43 (0) (121) (78)
Impairment (26) ... ... (26)
Amortisation (609) ... 0 (608)
Other Movements (1) 9 0 8
Net carrying amount at end of year 3,352 342 0 3,694
(a) Includes easements over land, and water rights.
Computer
Software Easements(a) Other Total $m $m $m $m
At 1 July 2017
Cost (Gross Carrying Amount) 5,129 330 2 5,461
Accumulated Amortisation and Impairment (2,013) ... ... (2,013)
Net Carrying Amount 3,116 330 2 3,448
At 30 June 2018
Cost (Gross Carrying Amount) 5,608 333 0 5,941
Accumulated Amortisation and Impairment (2,250) ... ... (2,250)
Net Carrying Amount 3,358 333 0 3,691
Reconciliation:
Year ended 30 June 2018
Net Carrying Amount at Start of Year 3,116 330 2 3,448
Additions 830 1 0 831
Disposals (88) (0) (0) (88)
Reclassification (to) / from Property, Plant and Equipment ... ... ... ...
Impairment (67) ... ... (67)
Amortisation (440) ... ... (440)
Other Movements 8 2 (2) 8
Net carrying amount at end of year 3,358 333 0 3,691
(a) Includes easements over land, and water rights.
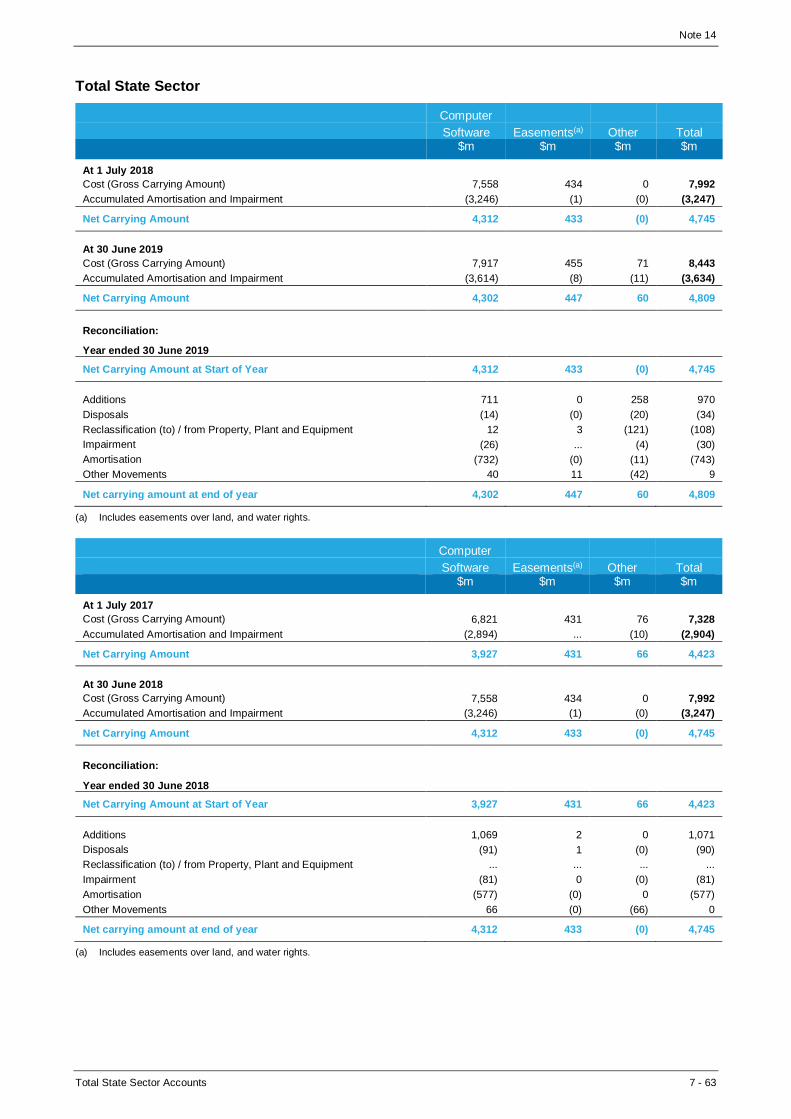
Note 14
Total State Sector Accounts 7 - 63
Total State Sector
Computer
Software Easements(a) Other Total $m $m $m $m
At 1 July 2018
Cost (Gross Carrying Amount) 7,558 434 0 7,992
Accumulated Amortisation and Impairment (3,246) (1) (0) (3,247)
Net Carrying Amount 4,312 433 (0) 4,745
At 30 June 2019
Cost (Gross Carrying Amount) 7,917 455 71 8,443
Accumulated Amortisation and Impairment (3,614) (8) (11) (3,634)
Net Carrying Amount 4,302 447 60 4,809
Reconciliation:
Year ended 30 June 2019
Net Carrying Amount at Start of Year 4,312 433 (0) 4,745
Additions 711 0 258 970
Disposals (14) (0) (20) (34)
Reclassification (to) / from Property, Plant and Equipment 12 3 (121) (108)
Impairment (26) ... (4) (30)
Amortisation (732) (0) (11) (743)
Other Movements 40 11 (42) 9
Net carrying amount at end of year 4,302 447 60 4,809
(a) Includes easements over land, and water rights.
Computer
Software Easements(a) Other Total $m $m $m $m
At 1 July 2017
Cost (Gross Carrying Amount) 6,821 431 76 7,328
Accumulated Amortisation and Impairment (2,894) ... (10) (2,904)
Net Carrying Amount 3,927 431 66 4,423
At 30 June 2018
Cost (Gross Carrying Amount) 7,558 434 0 7,992
Accumulated Amortisation and Impairment (3,246) (1) (0) (3,247)
Net Carrying Amount 4,312 433 (0) 4,745
Reconciliation:
Year ended 30 June 2018
Net Carrying Amount at Start of Year 3,927 431 66 4,423
Additions 1,069 2 0 1,071
Disposals (91) 1 (0) (90)
Reclassification (to) / from Property, Plant and Equipment ... ... ... ...
Impairment (81) 0 (0) (81)
Amortisation (577) (0) 0 (577)
Other Movements 66 (0) (66) 0
Net carrying amount at end of year 4,312 433 (0) 4,745
(a) Includes easements over land, and water rights.

Note 15
7 - 64 Total State Sector Accounts
Note 15: Other Non-Financial Assets
Privately Financed Projects and Service Concession Arrangements
In a privately financed project (PFP), a public-sector entity (the grantor) arranges for the private sector
(the operator) to design, finance and build infrastructure and provide associated operational or management
services for an agreed period (the service period).
Many PFPs include a service concession arrangement (SCA) as described in Interpretation 129 Service
Concession Arrangements: Disclosures. An SCA is an agreement under which the public sector (the grantor)
grants a concession to the private sector (the operator) to provide services that give the public access to
major economic and social facilities. In effect, the SCA operator (rather than the grantor) is the primary
provider of the services with the infrastructure and provides the services to the public.
PFPs are accounted for in three different ways in accordance with TPP 06-8 Accounting for Privately
Financed Projects, depending on the extent of the grantor’s control of the underlying infrastructure, i.e.
whether the infrastructure is:
• grantor-controlled from the beginning of the service period
• purchased under a deferred payment arrangement or acquired under a finance lease and is grantor-
controlled from the beginning of the service period. This is recognised as property, plant and equipment
and depreciated over its useful life or the term of the lease in accordance with AASB 116 Property, Plant
and Equipment or AASB 117 Leases, or
• operator-controlled during the service period and grantor-controlled thereafter.
A right to receive the infrastructure for a nominal sum (including zero) at the end of the service period is
recognised as revenue and an asset whose value emerges during that period. The accumulated value of the
right at the end of the service period equates to the written down replacement cost of the infrastructure at
that time. The value is allocated during the service period as if it were the compound value of an annuity
discounted at the NSW government bond rate applicable to the purchaser at the commencement of the
service period. Any increase or decrease in the fair value of the right to receive the infrastructure that occurs
during the service period is recognised as an asset revaluation, similarly to a revaluation of property plant
and equipment.
An up-front contribution by the operator (or grantor) that is substantively part of the PFP is recognised
progressively over the period of the concession period, reducing the net cost.
Emerging rights to receive SCA infrastructure are classified as ‘other assets’ and ‘other revenue’. Up-front
contributions are classified as ‘other liabilities’ (if received from the operator) or ‘prepayments’ (if paid to the
operator).
A land lease in connection with a PFP is accounted for in accordance with AASB 117 Leases.
General
Government Sector Total State Sector
2019 2018 2019 2018
$m $m $m $m
Current 633 538 725 668
Non-current 6,074 6,888 5,724 5,926
6,707 7,426 6,449 6,594
Other Non-Financial Assets comprise: Right to Receive Privately Financed Infrastructure 2,933 2,615 2,607 2,292
Prepayments(a) 3,727 4,723 3,788 4,168
Emission Rights ... ... ... 1
Other(a) 47 88 54 133
6,707 7,426 6,449 6,594
(a) ‘Prepayments’ include $2,777 million reclassified from ‘Other’ in 2017-18.

Note 15
Total State Sector Accounts 7 - 65
Total State Sector
2019 2018 $m $m
Right to Receive Infrastructure and Prepaid Assets comprise: WestConnex - Stage 1 417 645
WestConnex - Stage 3 692 ...
ANZ Stadium and Qudos Bank Arena 514 471
NorthConnex 820 677
M7 Motorway - Westlink 646 576
Sydney Light Rail 1,057 640
Sydney Metro Northwest(a) ... 2,137
Other 2,249 1,314
6,395 6,460
(a) Transport for NSW entered into a PPP with Northwest Rapid Transit for the construction of the Sydney Metro Northwest. In 2017-18, the costs incurred prior to completion of the construction phase were recognised as a Prepaid Asset in accordance with NSW Treasury Policy TPP 06-8 ‘Accounting for Privately Financed Projections’. Upon completion in 2018-19, the Prepaid Assets of $2,137 million were transferred to property, plant and equipment of Sydney Metro, and form part of the cost base of the overall Metro Northwest assets.
Infrastructure subject to the arrangement
Concession period (duration in years and final year)
Transport
• M5 34 / 2026
• Sydney Harbour Tunnel 30 / 2022
• Parramatta Transport Interchange 23 / 2030
• Airport Line Railway Stations 30 / 2030
• Sydney Light Rail 17 / 2036
• Sydney Metro Northwest, Operations, Trains and Systems (OTS) 15 / 2034
• Cross City Tunnel 30 / 2035
• Waratah Rolling Stock 30 / 2044
• Lane Cove Tunnel 41 / 2048
• M7 43 / 2048
• M2 51 / 2048
• NorthConnex 28 / 2048
• Eastern Distributor 48 / 2048
• WestConnex – Stage 1 43 / 2060
• WestConnex – Stage 2 40 / 2060
• WestConnex – Stage 3 38 / 2060
• Chatswood Transport Interchange 50 / 2064
Health
• Hawkesbury Hospital 26 / 2022
• NSW Health Retrieval Network 10 / 2027
• Newcastle Community Health Centre 20 / 2027
• Newcastle Mater Hospital Redevelopment 25 / 2033
• Long Bay Prison and Forensic Hospital 26 / 2034
• Bathurst, Orange & Associated Health Services 24 / 2035
• Royal North Shore redevelopment 23 / 2037
• Northern Beaches Hospital 20 / 2038
• Chris O’Brien Lifehouse 40 / 2053
• Various hospital Car Parks 24-25 / various
Utilities • Blue Mountain Sewage Transfer Tunnel 35 / 2028
• Macarthur Water Treatment Plant 35 / 2030
• Rosehill Camellia Recycled Water Project 20 / 2031
• Prospect Water Treatment Plant 39 / 2035
• Illawarra/Woronora Water Treatment Plants 40 / 2036
Other • Qudos Bank Arena 32 / 2031
• ANZ Stadium 32 / 2031
• New Schools Project 27 / 2032
• New Schools Project 2 25 / 2035
• New Grafton Correctional Centre 20 / 2040
• Sydney International Convention, Exhibition and Entertainment Precinct 25 / 2041
• Opera House Car Park 50 / 2043

Note 15, Note 16 and Note 17
7 - 66 Total State Sector Accounts
Some arrangements with private sector operators that are not designed, financed and built by the private
sector are not in the scope of TPP 06-8 Accounting for Privately Financed Projects. Some of these
arrangements, for example where the private sector operates an existing asset of the grantor, are in
substance service concession arrangements. These service concession arrangements are accounted for as
follows:
• Any up-front contributions are classified as other liabilities (if received from the operator) or prepayments
(if paid to the operator) and amortised progressively over the concession period as revenue or expenses
respectively.
• The existing assets of the grantor provided to the operator as service concession assets are recognised
where the grantor controls those assets in accordance with the recognition requirements of the
applicable Australian Accounting Standards.
Note 16: Income Tax Equivalents
Commercial PNFCs and PFCs, excluding NSW Treasury Corporation (TCorp), are part of a National Tax
Equivalent Regime (NTER). TCorp is part of a Tax Equivalent Regime (TER). Although exempt from income
tax obligations to the Commonwealth, members of the NTER/ TER accrue and pay income tax equivalents to
the State and adopt tax effect accounting to maintain competitive neutrality for commercial government
entities. The General Government Sector recognises accrued receivables and payables which equate to the
amounts accrued by PNFCs and PFCs for income tax equivalents. These amounts are eliminated on
consolidation of the Total State Sector.
General
Government Sector Total State Sector
2019 2018 2019 2018 $m $m $m $m
Tax Equivalents Receivable 32 128 ... ...
Deferred Tax Equivalents Receivable 2,245 2,192 ... ...
Receivable from the PNFC/PFC Sectors 2,277 2,320 ... ...
Tax Equivalents Payable 3 3 ... ...
Deferred Tax Equivalents Provision 108 112 ... ...
Payable to the PNFC/PFC Sectors 111 115 ... ...
Note 17: Deposits Held
Deposits held represent liabilities for deposits and security deposits held on behalf of entities and individuals
external to the State.
Deposits held by Public Financial Corporations are monies deposited with TCorp on an unsecured basis
either at call or for fixed terms of one year or less, with interest payable at maturity. Deposits held by Public
Financial Corporations are designated at FVTPL at initial recognition as they are managed on a fair value
basis in accordance with a documented risk management strategy.
Other deposits held represent liabilities for customer and contractors’ security deposits for utilities such as
electricity and water. Customer and contractor deposits can be refunded at any time. Other deposits held are
financial liabilities at amortised cost, initially measured at fair value, net of directly attributable transaction
costs. Deposits are recognised at no less than the amount payable on demand. Other deposits held are
subsequently measured at amortised cost using the effective interest method.

Note 17 and Note 18
Total State Sector Accounts 7 - 67
The effects of initially applying AASB 9 and further information regarding fair value measurement, liquidity
risk, including a maturity analysis of the above deposits held, and market risk are disclosed in Note 25:
Financial Instruments.
General
Government Sector Total State Sector
2019 2018 2019 2018 $m $m $m $m
Current 67 130 293 385
Non-current ... ... ... ...
67 130 293 385
Deposits are Held for the Purposes of: Held by Public Financial Corporations ... ... 156 164
Other 67 130 137 221
67 130 293 385
Note 18: Payables
Payables represent liabilities for goods and services provided to the State. Short-term payables with no
stated interest rate are measured at the original invoice amount where the effect of discounting is immaterial.
Payables are initially measured at fair value, net of directly attributable transaction costs. Payables are
subsequently measured at amortised cost using the effective interest method.
The effects of initially applying AASB 9 and further information regarding liquidity risk, including a maturity
analysis of the below payables are disclosed in Note 25: Financial Instruments.
General
Government Sector Total State Sector
2019 2018 2019 2018 $m $m $m $m
Current 6,966 7,119 8,244 8,674
Non-current 113 131 113 159
7,079 7,251 8,357 8,833
Payables comprise: Payables of a Capital Nature 1,222 1,321 1,454 1,601
Accrued Employee Benefits 657 630 734 671
Interest on Borrowings & Advances 308 289 3 17
Creditors & Other Accruals 4,892 5,011 6,166 6,544
7,079 7,251 8,357 8,833
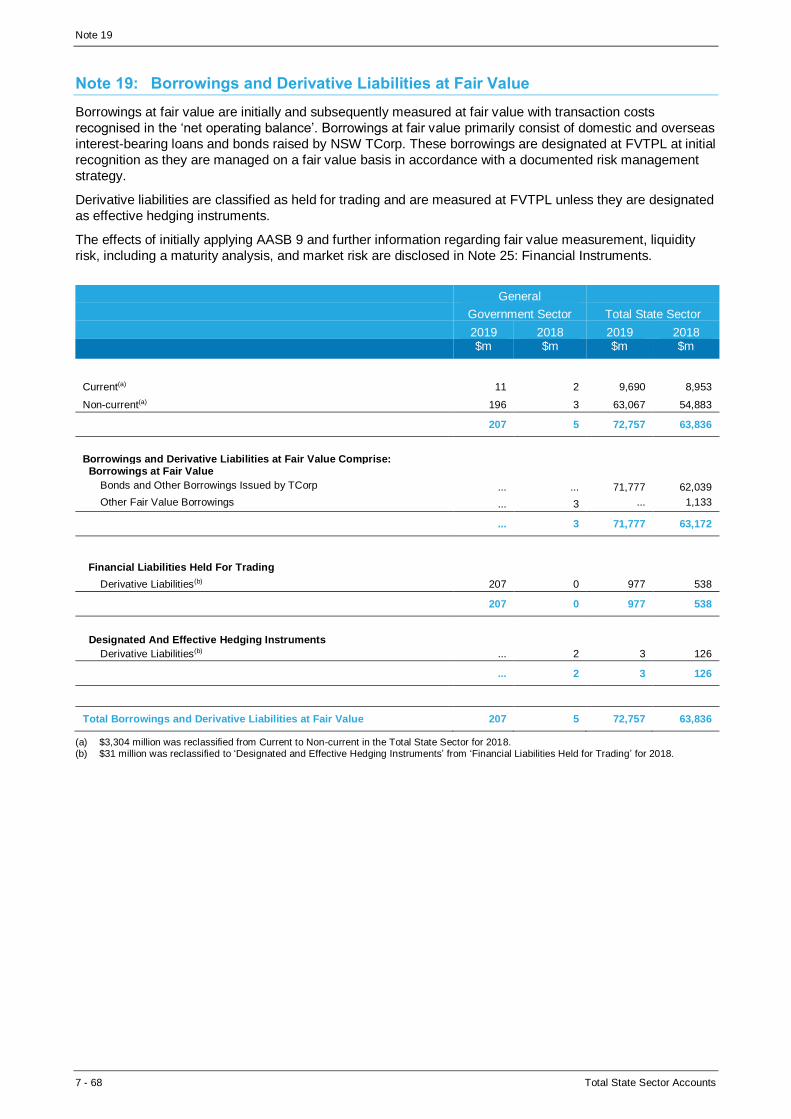
Note 19
7 - 68 Total State Sector Accounts
Note 19: Borrowings and Derivative Liabilities at Fair Value
Borrowings at fair value are initially and subsequently measured at fair value with transaction costs
recognised in the ‘net operating balance’. Borrowings at fair value primarily consist of domestic and overseas
interest-bearing loans and bonds raised by NSW TCorp. These borrowings are designated at FVTPL at initial
recognition as they are managed on a fair value basis in accordance with a documented risk management
strategy.
Derivative liabilities are classified as held for trading and are measured at FVTPL unless they are designated
as effective hedging instruments.
The effects of initially applying AASB 9 and further information regarding fair value measurement, liquidity
risk, including a maturity analysis, and market risk are disclosed in Note 25: Financial Instruments.
General
Government Sector Total State Sector
2019 2018 2019 2018 $m $m $m $m
Current(a) 11 2 9,690 8,953
Non-current(a) 196 3 63,067 54,883
207 5 72,757 63,836
Borrowings and Derivative Liabilities at Fair Value Comprise: Borrowings at Fair Value Bonds and Other Borrowings Issued by TCorp ... ... 71,777 62,039
Other Fair Value Borrowings ... 3 ... 1,133
... 3 71,777 63,172
Financial Liabilities Held For Trading
Derivative Liabilities(b) 207 0 977 538
207 0 977 538
Designated And Effective Hedging Instruments Derivative Liabilities(b) ... 2 3 126
... 2 3 126
Total Borrowings and Derivative Liabilities at Fair Value 207 5 72,757 63,836
(a) $3,304 million was reclassified from Current to Non-current in the Total State Sector for 2018. (b) $31 million was reclassified to ‘Designated and Effective Hedging Instruments’ from ‘Financial Liabilities Held for Trading’ for 2018.

Note 20 and Note 21
Total State Sector Accounts 7 - 69
Note 20: Borrowings at Amortised Cost
Borrowings at amortised cost comprise of interest-bearing liabilities including General Government Sector borrowings with TCorp, finance lease liabilities and other interest-bearing arrangements.
Borrowings classified as financial liabilities at amortised cost are initially recognised at fair value net of directly attributable transaction costs and subsequently measured at amortised cost using the effective interest method.
Finance lease liabilities are determined in accordance with AASB 117 Leases. Refer to Note 27: Finance and Operating Leases for further information on finance leases.
The effects of initially applying AASB 9 and further information regarding fair value measurement, liquidity risk, including a maturity analysis, and market risk of borrowings at amortised cost are disclosed in Note 25: Financial Instruments.
General
Government Sector Total State Sector
2019 2018 2019 2018 $m $m $m $m
Current 897 1,314 326 250
Non-current 36,759 31,127 6,825 7,207
37,656 32,441 7,151 7,457
Borrowings at Amortised Cost Comprise: Other Borrowings at Amortised Cost 33,233 29,457 31 2,155
Finance Leases 2,590 2,984 5,287 5,302
Financial Liability arising from Public Private Partnership (PPP)(a) 1,834 ... 1,834 0
37,656 32,441 7,151 7,457
(a) This also includes a future commitment, to be financed by the private sector, recognised under a PPP for future capital payments on assets constructed by the private sector in accordance with NSW Treasury Policy TPP 06-8 ‘Accounting for Privately Financed Projects’.
Note 21: Employee Provisions
Wages and Salaries, Annual Leave and Sick Leave
Liabilities for salaries and wages (including non-monetary benefits) and paid sick leave that are expected to be settled wholly within 12 months after the end of the period in which the employees render the service are recognised and measured at the undiscounted amounts expected to be paid when the liabilities are settled.
Annual leave is not expected to be settled wholly before 12 months after the end of the annual reporting period in which the employees render the related service. As such, it is required to be measured at present value in accordance with AASB 119 Employee Benefits (AASB 119) (although short-cut methods are permitted).
Unused sick leave does not give rise to a liability. It is not considered probable that sick leave taken will be greater than the benefits accrued in the future.
Consequential costs to employment such as payroll tax, worker’s compensation insurance premiums and fringe benefits tax are recognised as liabilities and expenses when the employee benefits they relate to are recognised.
Long Service Leave
A liability for long service leave is measured at the present value of future payments anticipated at the reporting date, using the projected unit credit method. An actuary calculates this using:
• expected future wage and salary levels
• experience of employee departures, and
• periods of service.

Note 21 and Note 22
7 - 70 Total State Sector Accounts
Estimated future cash outflows are discounted using a discount rate based on the market yield on Commonwealth government bonds as published by the Reserve Bank of Australia, with terms to maturity that match, as closely as possible, the estimated future cash outflow.
A short-hand measurement technique is used as allowed by AASB 119 for leave relating to employees with five and more years of services, where it is not materially different from the present value, as confirmed periodically by an actuary.
Self-Funded Worker’s Compensation
Worker’s compensation insurance is provided by the employer, State Regulatory Insurance Authority or by the State’s self-insurance scheme, known as the Treasury Managed Fund.
These liabilities are actuarially calculated and measured on a discounted cash flow basis.
General
Government Sector Total State Sector
2019 2018 2019 2018 $m $m $m $m
Current 15,000 12,980 15,978 13,922
Non current 5,802 5,035 5,991 5,184
20,802 18,015 21,969 19,106
These comprise: Long Service Leave 10,962 9,261 11,677 9,900
Annual and Other Leave Entitlements 3,849 3,566 4,130 3,839
Self Funded Worker's Compensation 5,270 4,616 5,372 4,718
Other 721 572 790 649
Total Employee Provisions 20,802 18,015 21,969 19,106
Self-funded workers’ compensation includes liabilities of the Treasury Managed Fund that have been actuarially calculated on a discounted cash flows basis using a ‘central’ estimate assuming a liability discount rate of 0.7 to 0.9 per cent (2018: 1.8 to 1.9 per cent) and a future inflation rate of 1.6 to 2.5 per cent (2018: 2.2 to 2.7 per cent) and a superimposed inflation rate of 0.1 to 0.7 per cent (2018: 0.0 to 0.6 per cent).
Note 22: Superannuation Provisions
An unfunded superannuation liability is recognised in respect of the State’s defined benefit schemes, in accordance with AASB 119 Employee Benefits. The liability is measured as the excess of the present value of members’ accrued benefits at reporting date over the fair value of the schemes’ assets at that date. A surplus is only recognised if it is recoverable through reduced future contributions or potential future refunds from a scheme.
The State appoints actuaries to value the unfunded superannuation liability. The liability is assessed annually using the latest triennial review actuarial economic and demographic assumptions and subsequent economic and market forecasts, except for the discount rate. The discount rate is based on the 10-year Commonwealth government bond rate as at 30 June.
The present value of accrued benefits estimates future payments arising from service of current and past scheme members up to the reporting date. It is calculated having regard to:
• expected future wage and salary levels
• expected future inflation levels as per the growth rate in the Consumer Price Index
• superannuation contribution tax, and
• the experience of employee departures and their periods of service.
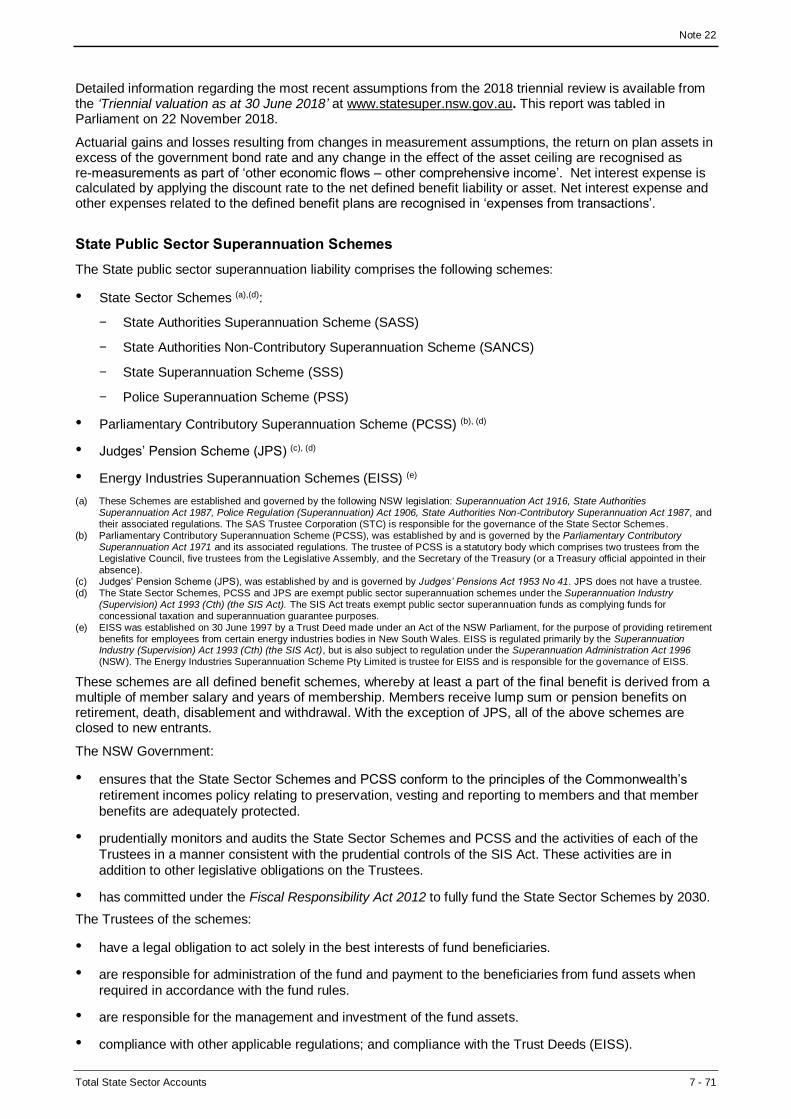
Note 22
Total State Sector Accounts 7 - 71
Detailed information regarding the most recent assumptions from the 2018 triennial review is available from the ‘Triennial valuation as at 30 June 2018’ at www.statesuper.nsw.gov.au. This report was tabled in Parliament on 22 November 2018.
Actuarial gains and losses resulting from changes in measurement assumptions, the return on plan assets in excess of the government bond rate and any change in the effect of the asset ceiling are recognised as re-measurements as part of ‘other economic flows – other comprehensive income’. Net interest expense is calculated by applying the discount rate to the net defined benefit liability or asset. Net interest expense and other expenses related to the defined benefit plans are recognised in ‘expenses from transactions’.
State Public Sector Superannuation Schemes
The State public sector superannuation liability comprises the following schemes:
• State Sector Schemes (a),(d):
– State Authorities Superannuation Scheme (SASS)
– State Authorities Non-Contributory Superannuation Scheme (SANCS)
– State Superannuation Scheme (SSS)
– Police Superannuation Scheme (PSS)
• Parliamentary Contributory Superannuation Scheme (PCSS) (b), (d)
• Judges’ Pension Scheme (JPS) (c), (d)
• Energy Industries Superannuation Schemes (EISS) (e)
(a) These Schemes are established and governed by the following NSW legislation: Superannuation Act 1916, State Authorities Superannuation Act 1987, Police Regulation (Superannuation) Act 1906, State Authorities Non-Contributory Superannuation Act 1987, and their associated regulations. The SAS Trustee Corporation (STC) is responsible for the governance of the State Sector Schemes.
(b) Parliamentary Contributory Superannuation Scheme (PCSS), was established by and is governed by the Parliamentary Contributory Superannuation Act 1971 and its associated regulations. The trustee of PCSS is a statutory body which comprises two trustees from the Legislative Council, five trustees from the Legislative Assembly, and the Secretary of the Treasury (or a Treasury official appointed in their absence).
(c) Judges’ Pension Scheme (JPS), was established by and is governed by Judges’ Pensions Act 1953 No 41. JPS does not have a trustee. (d) The State Sector Schemes, PCSS and JPS are exempt public sector superannuation schemes under the Superannuation Industry
(Supervision) Act 1993 (Cth) (the SIS Act). The SIS Act treats exempt public sector superannuation funds as complying funds for concessional taxation and superannuation guarantee purposes.
(e) EISS was established on 30 June 1997 by a Trust Deed made under an Act of the NSW Parliament, for the purpose of providing retirement benefits for employees from certain energy industries bodies in New South Wales. EISS is regulated primarily by the Superannuation Industry (Supervision) Act 1993 (Cth) (the SIS Act), but is also subject to regulation under the Superannuation Administration Act 1996 (NSW). The Energy Industries Superannuation Scheme Pty Limited is trustee for EISS and is responsible for the governance of EISS.
These schemes are all defined benefit schemes, whereby at least a part of the final benefit is derived from a multiple of member salary and years of membership. Members receive lump sum or pension benefits on retirement, death, disablement and withdrawal. With the exception of JPS, all of the above schemes are closed to new entrants.
The NSW Government:
• ensures that the State Sector Schemes and PCSS conform to the principles of the Commonwealth’s
retirement incomes policy relating to preservation, vesting and reporting to members and that member
benefits are adequately protected.
• prudentially monitors and audits the State Sector Schemes and PCSS and the activities of each of the
Trustees in a manner consistent with the prudential controls of the SIS Act. These activities are in
addition to other legislative obligations on the Trustees.
• has committed under the Fiscal Responsibility Act 2012 to fully fund the State Sector Schemes by 2030.
The Trustees of the schemes:
• have a legal obligation to act solely in the best interests of fund beneficiaries.
• are responsible for administration of the fund and payment to the beneficiaries from fund assets when
required in accordance with the fund rules.
• are responsible for the management and investment of the fund assets.
• compliance with other applicable regulations; and compliance with the Trust Deeds (EISS).
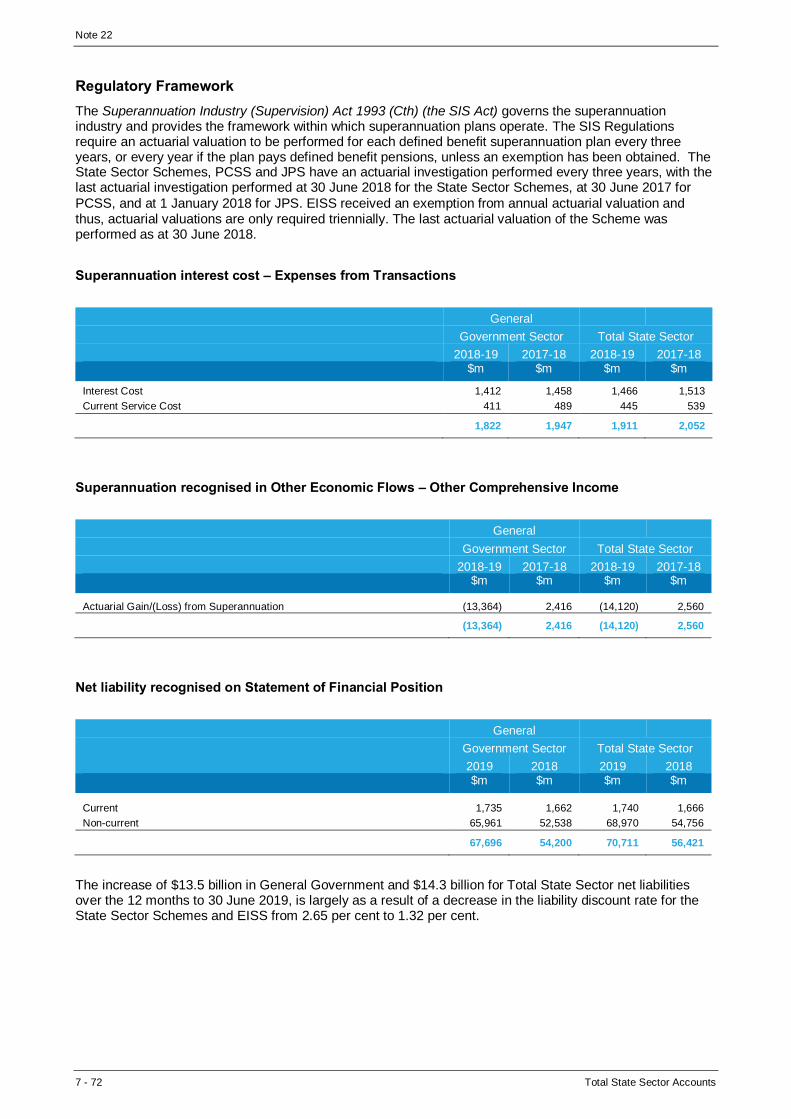
Note 22
7 - 72 Total State Sector Accounts
Regulatory Framework
The Superannuation Industry (Supervision) Act 1993 (Cth) (the SIS Act) governs the superannuation industry and provides the framework within which superannuation plans operate. The SIS Regulations require an actuarial valuation to be performed for each defined benefit superannuation plan every three years, or every year if the plan pays defined benefit pensions, unless an exemption has been obtained. The State Sector Schemes, PCSS and JPS have an actuarial investigation performed every three years, with the last actuarial investigation performed at 30 June 2018 for the State Sector Schemes, at 30 June 2017 for
PCSS, and at 1 January 2018 for JPS. EISS received an exemption from annual actuarial valuation and thus, actuarial valuations are only required triennially. The last actuarial valuation of the Scheme was performed as at 30 June 2018.
Superannuation interest cost – Expenses from Transactions
General
Government Sector Total State Sector
2018-19 2017-18 2018-19 2017-18 $m $m $m $m
Interest Cost 1,412 1,458 1,466 1,513
Current Service Cost 411 489 445 539
1,822 1,947 1,911 2,052
Superannuation recognised in Other Economic Flows – Other Comprehensive Income
General
Government Sector Total State Sector
2018-19 2017-18 2018-19 2017-18 $m $m $m $m
Actuarial Gain/(Loss) from Superannuation (13,364) 2,416 (14,120) 2,560
(13,364) 2,416 (14,120) 2,560
Net liability recognised on Statement of Financial Position
General
Government Sector Total State Sector
2019 2018 2019 2018 $m $m $m $m
Current 1,735 1,662 1,740 1,666
Non-current 65,961 52,538 68,970 54,756
67,696 54,200 70,711 56,421
The increase of $13.5 billion in General Government and $14.3 billion for Total State Sector net liabilities over the 12 months to 30 June 2019, is largely as a result of a decrease in the liability discount rate for the State Sector Schemes and EISS from 2.65 per cent to 1.32 per cent.

Note 22
Total State Sector Accounts 7 - 73
Member Numbers and Superannuation Position for AASB 119
General Government Sector
For the year ended 30 June 2019
Member Numbers ------ NSW Public Sector Superannuation Schemes ------ SASS SANCS SSS PSS PCSS JPS EISS
Contributors 15,158 17,847 1,915 775 14 129 ... Deferred Benefits 9,347 11,016 650 24 2 ... 19 Pensioners 3,483 ... 47,383 6,664 277 233 584 Pensions Fully Commuted ... ... 13,655 ... ... ... ...
Superannuation Position for AASB 119 Purposes Total $m $m $m $m $m $m $m $m
Accrued Liability(a) 15,281 2,434 65,393 20,187 980 1,455 744 106,474
Estimated Reserve Account Balance (10,054) (1,682) (21,125) (5,113) (336) ... (484) (38,795)
Deficit/(Surplus) 5,227 752 44,268 15,074 643 1,455 260 67,679
Future Service Liability(b) 885 398 175 (19) ... ... ... 1,438
Surplus In Excess Of Recovery Available 17 0 0 ... ... ... ... 17
Net (Asset)/Liability to be Recognised in
Statement of Financial Position 5,243 752 44,268 15,074 643 1,455 260 67,696
For the year ended 30 June 2018
Member Numbers ------ NSW Public Sector Superannuation Schemes ------ SASS SANCS SSS PSS PCSS JPS EISS(c)
Contributors 17,004 20,513 2,553 898 21 129 ... Deferred Benefits 9,662 10,593 781 34 2 ... 19 Pensioners 3,454 ... 47,236 6,623 275 233 593 Pensions Fully Commuted ... ... 13,813 ... ... ... ...
Superannuation Position for AASB 119 Purposes Total $m $m $m $m $m $m $m $m
Accrued Liability(a) 14,768 2,384 56,363 16,462 797 1,184 633 92,591
Estimated Reserve Account Balance (10,401) (1,719) (20,630) (4,874) (315) ... (467) (38,406)
Deficit/(Surplus) 4,367 665 35,732 11,589 482 1,184 166 54,184
Future Service Liability(b) 973 404 192 (22) ... ... ... 1,547
Surplus in Excess of Recovery Available 16 0 0 ... ... ... ... 16
Net (Asset)/Liability to be Recognised in Statement of Financial Position 4,382 665 35,732 11,589 482 1,184 166 54,200
(a) The accrued liability includes a contribution tax provision. This is calculated based on grossing up the deficit less the al lowance for past service expenses and insurable death and disability liabilities at a contribution tax rate of 15%. PCSS assets and accrued liability based on 2018 data. JPS accrued liability is projected from 2018 data (2018: from 2014 data). The accrued liability includes a contribution tax provision for PCSS. This is calculated based on grossing up the deficit less the allowance for past service expenses and insurable death and disability liabilities at a contribution tax rate of 15%.
(b) The Future Service Liability (FSL) does not have to be recognised by an employer. It is only used to determine if an asset ceiling limit should be imposed (AASB 119 para 64). Under AASB 119, any prepaid superannuation asset recognised cannot exceed the present value of any economic benefits that may be available in the form of refunds from the plan or reductions in future contributions to the plan. Where the ‘surplus in excess of recovery’ is zero, no asset ceiling limit is imposed. (Note: this also includes a contribution tax provision.)

Note 22
7 - 74 Total State Sector Accounts
Total State Sector
For the year ended 30 June 2019
Member Numbers ------ NSW Public Sector Superannuation Schemes ------ SASS SANCS SSS PSS PCSS JPS EISS
Contributors 17,195 20,006 2,037 775 14 129 336 Deferred Benefits 9,347 11,016 712 24 2 ... 20 Pensioners 4,379 ... 49,646 6,664 277 233 692 Pensions Fully Commuted ... ... 14,646 ... ... ... ...
Superannuation Position for AASB 119 Purposes Total $m $m $m $m $m $m $m $m
Accrued Liability(a) 17,996 2,649 68,503 20,187 980 1,455 1,146 112,915
Estimated Reserve Account Balance (11,572) (1,783) (22,661) (5,113) (336) ... (777) (42,242)
Deficit/(Surplus) 6,424 866 45,841 15,074 643 1,455 369 70,673
Future Service Liability(b) 938 448 192 (19) ... ... 18 1,577
Surplus In Excess of Recovery Available 17 0 19 ... ... ... ... 37
Net (Asset)/Liability to be Recognised in Statement of Financial Position 6,441 866 45,861 15,074 643 1,455 369 70,711
For the year ended 30 June 2018
Member Numbers ------ NSW Public Sector Superannuation Schemes ------ SASS SANCS SSS PSS PCSS JPS EISS(c)
Contributors 19,226 22,776 2,712 898 21 129 367 Deferred Benefits 9,662 10,593 854 34 2 ... 20 Pensioners 4,281 ... 49,494 6,623 275 233 700 Pensions Fully Commuted ... ... 14,809 ... ... ... ...
Superannuation Position for AASB 119 Purposes Total $m $m $m $m $m $m $m $m
Accrued Liability(a) 17,116 2,585 59,013 16,462 797 1,184 996 98,154
Estimated Reserve Account Balance (11,866) (1,830) (22,133) (4,874) (315) ... (754) (41,772)
Deficit/(Surplus) 5,250 755 36,880 11,589 482 1,184 243 56,382
Future Service Liability(b) 1,033 453 209 (22) ... ... 20 1,693
Surplus In Excess of Recovery Available 16 0 22 ... ... ... ... 38
Net (Asset)/Liability to be Recognised in
Statement of Financial Position 5,266 755 36,902 11,589 482 1,184 243 56,421
(a) Refer to footnote in General Government Sector table above. (b) Refer to footnote in General Government Sector table above.

Note 22
Total State Sector Accounts 7 - 75
Reconciliation of the Present Value of the Defined Benefit Obligations
General
Total State Sector Government Sector
2018-19 2017-18 2018-19 2017-18 $m $m $m $m
Present Value of Defined Benefit Obligations at Beginning of
the Period 92,591 93,839 98,154 99,478
Current Service Cost 411 489 445 539
Interest Cost 2,394 2,410 2,533 2,547
Contributions by Participants 165 192 183 212
Actuarial (Gains)/Losses Arising from Changes in Demographic
Assumptions 17 520 19 579
Actuarial (Gains)/Losses Arising from Changes in Financial Assumptions 15,885 (335) 16,819 (351)
Actuarial (Gains)/Losses Arising from Liability Experience (471) (356) (466) (366)
Benefits Paid (4,606) (4,243) (4,866) (4,547)
Taxes, Premiums & Expenses Paid 100 154 110 162
Effects of Transfers In/Out Due to Business Combinations and Disposals (1) (78) 5 (80)
Settlements (9) ... (22) (20)
Present Value of Defined Benefit Obligations at End of
the Period 106,474 92,591 112,915 98,154
Reconciliation of the Fair Value of Fund Assets
General
Total State Sector Government Sector
2018-19 2017-18 2018-19 2017-18 $m $m $m $m
Fair Value of Fund Assets at Beginning of the Period 38,406 37,568 41,772 40,912
Interest Income 982 952 1,068 1,036
Actual Return on Fund Assets Less Interest Income 2,067 2,244 2,252 2,422
Employer Contributions 1,681 1,616 1,734 1,670
Contributions by Participants 165 192 183 212
Benefits Paid (4,606) (4,243) (4,866) (4,547)
Taxes, Premiums & Expenses Paid 100 154 110 162
Effects of Transfers In/Out Due to Business Combinations and Disposals ... (77) ... (77)
Settlements ... ... (11) (17)
Fair Value of Fund Assets at End of the Period 38,795 38,406 42,242 41,772
Reconciliation of the Asset Ceiling
General
Total State Sector Government Sector
2018-19 2017-18 2018-19 2017-18 $m $m $m $m
Adjustment for Effect of Asset Ceiling at Beginning of the Period 16 14 38 34
Interest on the Effect of Asset Ceiling 0 0 1 1
Change in the Effect of Asset Ceiling 1 2 (3) 3
Adjustment for Effect of Asset Ceiling at End of the Period 17 16 37 38

Note 22
7 - 76 Total State Sector Accounts
Reconciliation of the Present Value of the Defined Benefit Liability/ (Asset)
General
Total State Sector Government Sector
2018-19 2017-18 2018-19 2017-18 $m $m $m $m
Net Defined Benefit Liability/(Asset) At Beginning of the Period 54,200 56,285 56,421 58,601
Current Service Cost 411 489 445 539
Net Interest on the Net Defined Benefit Liability 1,412 1,458 1,466 1,513
(Gains)/Losses Arising from Settlements (9) ... (11) (3)
Actual Return on Fund Assets Less Interest Income (2,067) (2,244) (2,252) (2,422)
Actuarial (Gains)/Losses Arising from Changes in Demographic
Assumptions 17 519 19 579
Actuarial (Gains)/Losses Arising from Changes in Financial Assumptions 15,885 (335) 16,819 (351)
Actuarial (Gains)/Losses Arising from Liability Experience (471) (356) (466) (366)
Adjustment For Effect of Asset Ceiling 1 2 (3) 3
Employer Contributions (1,681) (1,616) (1,734) (1,670)
Effects of Transfers In/Out Due to Business Combinations and Disposals (1) (1) 5 (2)
Net Defined Benefit Liability/(Asset) at end of the Period 67,696 54,200 70,711 56,421
Valuation Method
The Trustees’ actuary, Mercer Consulting (Australia) Pty Ltd, calculated the unfunded superannuation liabilities schemes for the years ended 30 June 2019 and 30 June 2018 in accordance with AASB 119 Employee Benefits and AASB 1056 Superannuation Entities.
The Projected Unit Credit (PUC) valuation method was used to determine the present value of the defined benefit obligations and related current service costs. This method sees each period of service as giving rise to an additional unit of benefit entitlement and measures each unit separately to build up the final obligations.
Actuarial calculations for the unfunded superannuation liabilities schemes were based on the latest scheme membership data, demographic assumptions of the 2018 Triennial Valuation and AASB 119 applying to employee benefits as at 30 June 2019.
Significant Actuarial Assumptions
The principal assumptions at the reporting dates are as per the following table.
At 30 June 2019 At 30 June 2018
Significant Actuarial Assumptions State Super
Schemes, JPS, PCSS EISS
State Super Schemes, JPS, PCSS
EISS
Discount Rate 1.32% pa 1.32% pa 2.65% pa 2.65% pa
Salary Increase Rate 3.20% pa 2.50% pa(a) 2.70% pa 1.00% pa
Rate of CPI Increase 1.75% pa(b) 1.75% pa(b) 2.25% pa 2.50% pa
Pensioner Mortality
as part of 30 June 2018 triennial valuation for State Super Schemes, as per 1 January 2018
triennial valuation for JPS, as per 2017 triennial actuarial valuation for PCSS, as per
2018 triennial actuarial valuation for EISS
as part of 30 June 2018 triennial valuation for
State Super Schemes and JPS, as per 2017 triennial actuarial valuation for PCSS, as per
2015 triennial actuarial valuation for EISS
(a) Salary Increase rate (excluding promotional increases) for EISS is for Essential Energy only. (b) Rate of CPI increase for State Super Funds Schemes, PCSS and EISS in forward years are: 1.75% for 2019-20; 2.00% for 2020-21; 2.25%
for 2021-22 and 2022-23; 2.50% pa onwards.

Note 22
Total State Sector Accounts 7 - 77
The economic assumptions adopted from the 2018 triennial actuarial reviews of the State Sector Schemes and EISS for the Aggregate Funding Method were:
At 30 June 2019 At 30 June 2018
Weighted-Average Assumption Pooled Fund
EISS Pooled Fund
EISS
Expected Rate of Return on Assets Backing Current Pension Liabilities 7.40% pa 5.50% pa 7.40% pa 5.50% pa
Expected Rate of Return on Assets Backing Other Liabilities 6.40% pa 5.50% pa 6.40% pa 5.50% pa
Expected salary increase rate 3.20% pa 2.60% pa(a) 2.70% pa 2.30% pa
Expected Rate of CPI Increase 2.20% pa 2.30% pa 2.20% pa 2.30% pa
(a) EISS (for Essential Energy only) salary increase rate until 30 June 2020 is 2.60% pa; 2.80% for 2020-21; then 3.30% pa thereafter.
Funding rates
Funding arrangements are reviewed at least every three years, for JPS, the State makes regular contributions to meet the scheme’s obligations as it holds no assets.
The method used to determine the employer contribution recommendations at last actuarial review was the Aggregate Funding method. The method adopted affects the timing of the costs to the State. Employer contributions rate is determined so that sufficient assets will be available to meet benefit payments to existing members, taking into account the current value of assets, future contributions and the maturity profile of the funds.
Expected contributions Maturity profile Recommended contribution rates 2018-19 2017-18 2018-19
$m $m Years
Pooled Fund SASS 327.6 304.5 12.4 multiple of member contributions
SANCS 68.2 65.7 12.4 % member salary
SSS 1,016.5 970.7 12.4 multiple of member contributions
PSS 331.2 314.7 12.4 % of member salary
PCSS 15.6 18.6 17.0 multiple of member contributions
JPS 50.1 49.9 14.0 % member salary
EISS 4.6 5.1 11.8 Division B - multiple of member contributions
Division C - % member salary
Division D - multiple of member contributions
Description of the Risks and Sensitivity Analysis Arising from the Schemes
There are a number of risks arising from the schemes. The more significant risks are:
Risk Description
Investment risk The risk that investment returns will be lower than assumed and the employer will need to increase
contributions to offset this shortfall.
Longevity risk The risk that pensioners live longer than assumed, increasing future pensions.
Pension indexation risk The risk that pensions will increase at a rate greater than assumed, increasing future pensions.
Salary growth risk The risk that wages or salaries (on which future benefit amounts for active members will be based) will rise more rapidly than assumed, increasing defined benefit amounts and thereby requiring additional
employer contributions.
Legislative risk The risk is that legislative changes could be made which increase the cost of providing the defined
benefits.

Note 22
7 - 78 Total State Sector Accounts
The major potential for volatility arises from movements in the fair value of plan assets and the risk free rate which is used to discount defined benefit obligations.
The future liability value can also be impacted, generally to a lesser degree, by revisions to long term economic and actuarial assumptions including those listed under ‘Valuation Method’ above.
Sensitivity Analysis
The State’s total defined benefit obligation as at 30 June 2019 under several scenarios is presented below. The total defined benefit obligation disclosed is inclusive of the contribution tax provision which is calculated based on the asset level at 30 June 2019.
There are a number of variables that impact on the valuation of the defined benefit superannuation liabilities including discount rate, future salary increases, future increase in the Consumer Price Index (CPI), and future life expectancy. The key variable relates to movement of the discount rate. For the Total State Sector, sensitivity analysis of a discount rate movement of plus 1.0 per cent would reduce accrued liabilities by an estimated $14,229 million, and a discount rate movement of minus 1.0 per cent would increase accrued liabilities by an estimated $17,494 million.
For State Sector Schemes and EISS, Scenarios A to F relate to sensitivity of the total defined benefit obligation to economic assumptions, and scenarios G and H relate to sensitivity to demographic assumptions.
State Sector Schemes
Discount
Rate Rate of CPI
Increase Salary
Inflation Rate Defined Benefit Obligation ($m)
Base Case 1.32% base rate base rate 109,334
Scenario A -1.0% Discount Rate 0.32% base rate base rate 126,290
Scenario B +1.0% Discount Rate 2.32% base rate base rate 95,569
Base Case base rate base rate base rate 109,334
Scenario C +0.5% rate of CPI increase base rate above rates
plus 0.5% pa base rate 116,773
Scenario D -0.5% rate of CPI increase base rate above rates
less 0.5% pa base rate 102,419
Base Case base rate base rate base rate 109,334
Scenario E +0.5% Salary Increase Rate base rate base rate above rates
plus 0.5% pa 109,680
Scenario F -0.5% Salary Increase Rate base rate base rate above rates
less 0.5% pa 108,810
Base Case N/A N/A N/A 109,334
Scenario G Lower Mortality(a) N/A N/A N/A 111,167
Scenario H Higher Mortality(b) N/A N/A N/A 108,009
(a) Assumes the short term pensioner mortality improvement factors for years 2019-2023 also apply for years after 2023. (b) Assumes the long term pensioner mortality improvement factors for years post 2023 also apply for the years 2019 to 2023.

Note 22
Total State Sector Accounts 7 - 79
EISS
Discount
Rate Rate of CPI
Increase Salary
Inflation Rate Defined Benefit Obligation ($m)
Base Case 1.32% pa base rate base rate 1,146
Scenario A -1.0% Discount Rate 0.32% pa base rate base rate 1,291
Scenario B +1.0% Discount Rate 2.32% pa base rate base rate 1,026
Base Case base rate base rate base rate 1,146
Scenario C +0.5% rate of CPI increase base rate above rates plus 0.5% pa
base rate 1,207
Scenario D -0.5% rate of CPI increase base rate above rates less 0.5% pa
base rate 1,090
Base Case base rate base rate base rate 1,146
Scenario E +0.5% Salary Increase Rate base rate base rate above rates plus 0.5% pa
1,157
Scenario F -0.5% Salary Increase Rate base rate base rate above rates less 0.5% pa
1,136
Base Case N/A N/A N/A 1,146
Scenario G Lower pensioner mortality rates(c) N/A N/A N/A 1,161
Scenario H Higher pensioner mortality rates(d) N/A N/A N/A 1,134
(c) Assumes the short term pensioner mortality improvement factors for years 2018-2024 also apply for years after 2024. (d) Assumes the long term pensioner mortality improvement factors for years post 2024 also apply for years 2018 to 2024.
For JPS and PCSS, Scenarios A to D relate to sensitivity of the total defined benefit obligation to economic assumptions, and scenarios E and F relate to sensitivity to demographic assumptions.
JPS
Discount
Rate Rate of CPI
Increase Salary
Inflation Rate Defined Benefit Obligation ($m)
Base Case 1.32% N/A N/A 1,455
Scenario A -1.0% Discount Rate 0.32% N/A N/A 1,646
Scenario B +1.0% Discount Rate 2.32% N/A N/A 1,267
Base Case base rate N/A N/A 1,455
Scenario C +0.5% Salary Increase Rate base rate N/A above rates plus 0.5% pa
1,562
Scenario D -0.5% Salary Increase Rate base rate N/A above rates
less 0.5% pa 1,337
Base Case N/A N/A N/A 1,455
Scenario E +10% pensioner mortality rates N/A N/A N/A 1,381
Scenario F-10% pensioner mortality rates N/A N/A N/A 1,515
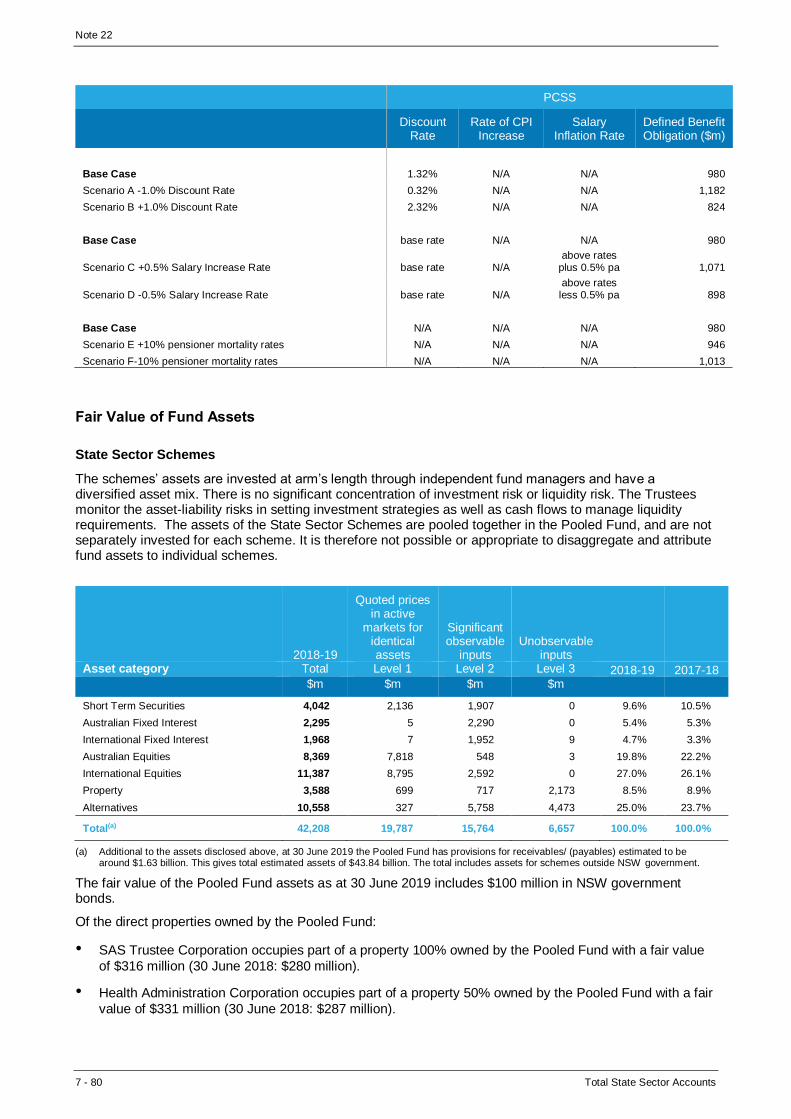
Note 22
7 - 80 Total State Sector Accounts
PCSS
Discount
Rate Rate of CPI
Increase Salary
Inflation Rate Defined Benefit Obligation ($m)
Base Case 1.32% N/A N/A 980
Scenario A -1.0% Discount Rate 0.32% N/A N/A 1,182
Scenario B +1.0% Discount Rate 2.32% N/A N/A 824
Base Case base rate N/A N/A 980
Scenario C +0.5% Salary Increase Rate base rate N/A above rates
plus 0.5% pa 1,071
Scenario D -0.5% Salary Increase Rate base rate N/A above rates less 0.5% pa 898
Base Case N/A N/A N/A 980
Scenario E +10% pensioner mortality rates N/A N/A N/A 946
Scenario F-10% pensioner mortality rates N/A N/A N/A 1,013
Fair Value of Fund Assets
State Sector Schemes
The schemes’ assets are invested at arm’s length through independent fund managers and have a diversified asset mix. There is no significant concentration of investment risk or liquidity risk. The Trustees monitor the asset-liability risks in setting investment strategies as well as cash flows to manage liquidity requirements. The assets of the State Sector Schemes are pooled together in the Pooled Fund, and are not separately invested for each scheme. It is therefore not possible or appropriate to disaggregate and attribute fund assets to individual schemes.
2018-19
Quoted prices in active
markets for identical assets
Significant observable
inputs Unobservable
inputs Asset category Total Level 1 Level 2 Level 3 2018-19 2017-18 $m $m $m $m
Short Term Securities 4,042 2,136 1,907 0 9.6% 10.5%
Australian Fixed Interest 2,295 5 2,290 0 5.4% 5.3%
International Fixed Interest 1,968 7 1,952 9 4.7% 3.3%
Australian Equities 8,369 7,818 548 3 19.8% 22.2%
International Equities 11,387 8,795 2,592 0 27.0% 26.1%
Property 3,588 699 717 2,173 8.5% 8.9%
Alternatives 10,558 327 5,758 4,473 25.0% 23.7%
Total(a) 42,208 19,787 15,764 6,657 100.0% 100.0%
(a) Additional to the assets disclosed above, at 30 June 2019 the Pooled Fund has provisions for receivables/ (payables) estimated to be around $1.63 billion. This gives total estimated assets of $43.84 billion. The total includes assets for schemes outside NSW government.
The fair value of the Pooled Fund assets as at 30 June 2019 includes $100 million in NSW government bonds.
Of the direct properties owned by the Pooled Fund:
• SAS Trustee Corporation occupies part of a property 100% owned by the Pooled Fund with a fair value
of $316 million (30 June 2018: $280 million).
• Health Administration Corporation occupies part of a property 50% owned by the Pooled Fund with a fair
value of $331 million (30 June 2018: $287 million).

Note 22
Total State Sector Accounts 7 - 81
EISS
The fair value of Plan assets includes no amounts relating to any of the entity’s own financial instruments, or any property occupied by, or other assets used by, the entity.
Some assets are invested in accordance with member investment choices. For assets that are not subject to member investment choice, the percentage invested in each asset class at the reporting date is:
Asset category 2018-19
Level 1
Total Level 2 Level 3 2018-19 2017-18 $m $m $m $m
Australian Equities 329 ... 329 ... 16.0% 18.0%
International Equities 515 ... 515 ... 25.0% 28.0%
Property 226 ... 226 ... 11.0% 8.0%
Private Equity 41 ... 41 ... 2.0% 1.0%
Infrastructure 123 ... 123 ... 6.0% 7.0%
Alternatives 82 ... 82 ... 4.0% 5.0%
Fixed Income 638 ... 638 ... 31.0% 28.0%
Cash 103 ... 103 ... 5.0% 5.0%
Total 2,058 ... 2,058 ... 100.0% 100.0%
JPS and PCSS
There are no assets in JPS. The State makes regular contributions to meet the scheme’s obligations. For PCSS the asset categories split was not available at 30 June 2019.
AASB 1056 Valuation
The following is a summary of the 30 June financial position of the fund calculated in accordance with AASB 1056 Superannuation Entities.
General
Total State Sector Government Sector
2018-19 2017-18 2018-19 2017-18
$m $m $m $m
Accrued Benefits 52,019 52,351 55,471 55,779
Net Market Value of Fund assets (38,795) (38,406) (42,242) (41,772)
Net (Surplus)/Deficit 13,225 13,945 13,228 14,007
The primary difference between the net deficit above (per AASB 1056) and the net deficit calculated in accordance with AASB 119 (and brought to account in the TSSA’s Statement of Financial Position) is that the accrued benefits discount rate is based on the more volatile 30 June long term Commonwealth government bond rate for the AASB 119 calculation, whereas the AASB 1056 calculation uses a less volatile long term earnings rate. As the long term earning rate exceeds the Commonwealth government bond rate, liabilities valued under AASB 1056 are lower than liabilities valued under AASB 119.
The NSW Government’s commitment under the Fiscal Responsibility Act 2012 to fully fund the State Sector Schemes by 2030, is measured in accordance with AASB 1056.

Note 23
7 - 82 Total State Sector Accounts
Note 23: Other Provisions
Other Provisions
Other provisions exist when:
• the State has a present legal or constructive obligation as a result of a past event
• it is probable that an outflow of resources will be required to settle the obligation, and
• a reliable estimate can be made of the amount of the obligation.
If the effect of the time value of money is material, provisions are discounted at a pre-tax rate that reflects the current market assessments of the time value of money and the risks specific to the liability. When discounting is used, the unwinding of the discount rate in the current period is recognised as interest expense in ‘Expenses from Transactions’. The impact of any discount rate changes on the provisions at the end of the period, due to the revaluation of future liabilities, are recognised in ‘Other Economic Flows’.
In regard to outstanding claims, the liabilities are measured as the present value of the expected future payments, including claims incurred but not yet reported, and the anticipated fund management fees. Expected future payments are estimated on the basis of the ultimate cost of settling claims.
The amount and timing of the actual outflows in relation to the above provisions have a degree of uncertainty. Actual results may depend on a number of factors specific to the type of claim, for example, future economic and environmental conditions may be different to those assumed.
Actuarial gains and losses resulting from changes in measurement assumptions are recognised as part of ‘other economic flows – included in the operating result’. The other components of the expense are recognised in ‘expenses from transactions’.
General
Government Sector Total State Sector
2019 2018 2019 2018 $m $m $m $m
Current 2,890 2,446 3,295 2,889
Non-current 8,715 7,764 14,890 12,511
11,604 10,210 18,185 15,400
These comprise: Outstanding Claims: Self Insurance Corporation (Excluding Self Funded Worker's Compensation) 4,102 3,692 4,102 3,692
Workers' Compensation (Dust Diseases) 1,949 1,827 1,949 1,827
Lifetime Care And Support Scheme ... ... 6,186 4,747
State Insurance Regulatory Authority 258 144 258 144
Long Service Corporation Schemes 1,458 1,226 1,458 1,226
HIH Loss Compensation 7 16 7 16
Victims Support Fund 135 131 135 131
NSW Share of University Superannuation 1,442 1,279 1,442 1,279
Provision for Land Remediation, Restoration Costs and Other Claims 2,253 1,895 2,647 2,338
Total Other Provisions 11,604 10,210 18,185 15,400
Insurance Recoveries Receivable Include those Accrued by: Self Insurance Corporation - for Reinsurance and Other
Recoveries Receivable 251 222 251 222
Workers' Compensation (Dust Diseases) Authority -
Insurance Levies Accrued 615 584 615 584
866 806 866 806

Note 23
Total State Sector Accounts 7 - 83
• The provision for Self Insurance Corporation (excluding self-funded worker’s compensation) exists to
provide self-insurance coverage for general government agencies and state owned corporations under
the NSW Self Insurance Corporation Act 2004. The liabilities for these outstanding claims are measured
as the present value of the expected future payments. The expected future payments are estimated on
the basis of the ultimate cost of settling claims, which is affected by factors such as normal inflation and
‘superimposed inflation’ (refers to inflation above normal inflation, including factors such as trends in
court awards). This provision is actuarially assessed in consultation with the claims managers of ‘NSW
Self Insurance Corporation’ (SICorp) at each 30 June. The discount rate used is based on
Commonwealth government bond yields. The provision comprises outstanding claims from the:
– NSW Treasury Managed Fund (TMF). This is a self-insurance scheme which protects the insurable
assets and exposures of all public hospitals, all public sector agencies that are financially dependent
on the Consolidated Fund, and various other statutory authorities.
– Pre-Managed Fund Reserve (PMF). This is used to fund claims incurred by the NSW Government,
prior to 1 July 1989, which were previously in the Fire Risks Account, the Fidelity Fund and the
Public Liability Fund.
– Governmental Workers Compensation Account (GWC). This is used to fund outstanding workers
compensation claims liabilities as at 30 June 1989.
– Transport Accidents Compensation Fund (TAC). This is used to fund motor transport accident claims
until 30 June 1987 and TransCover system claims costs from 1 July 1987 to 30 June 1989. This was
replaced as of 1 July 1989 by the Motor Accidents Scheme.
Key actuarial assumptions adopted for the provision for outstanding claims in SICorp (excluding worker’s compensation) are:
TMF GWC TAC
2019 2018 2019 2018 2019 2018
% % % % % %
Not Later Than One Year
Inflation Rate 1.7 - 2.9 2.2 - 2.7 2.3 - 2.6 2.6 2.3 - 2.9 2.2 - 2.7
Discount Rate 0.9 - 1.1 1.8 - 2.0 1.0 2.0 0.9 - 1.1 1.8 - 2.0
Superimposed Inflation(a) 1.5 - 2.5 1.5 - 3.5 0 - 1.8 0 - 1.5 3.5 3.5
Later Than One Year
Inflation Rate 0.3 - 3.5 2.0 - 3.5 0.8 - 3.5 2.2 - 3.6 1.3 - 3.5 2.9 - 3.5
Discount Rate 0.9 - 4.5 1.8 - 2.0 0.9 - 4.5 2.1 - 4.5 0.8 - 4.5 1.8 - 2.0
Superimposed Inflation(a) 1.5 - 2.5 1.5 - 3.5 0 - 1.8 0 - 1.5 3.5 3.5
(a) Dependent on payment type
• The provision for Workers’ Compensation (Dust Diseases) covers claims to workers in New South Wales
who develop a dust disease from occupational exposure to dust. The Workers’ Compensation (Dust
Diseases) Authority provides a no-fault compensation scheme to victims under the Workers’
Compensation (Dust Diseases) Act 1942. As at 30 June 2019, this liability was actuarially assessed by
the agencies’ consulting actuaries.
• The provision for Lifetime Care and Support covers the care and support services for persons
catastrophically injured from motor accidents in New South Wales, regardless of who was at fault in the
accident, as per the Motor Accidents (Lifetime Care and Support) Act 2006. As at 30 June 2019, this
liability was actuarially assessed by the agencies’ consulting actuaries.
• The provision for State Insurance Regulatory Authority (previously WorkCover Authority) covers claims
assumed by the State from some failed insurance companies. The liabilities cover claims incurred but
not yet paid, incurred but not yet reported and the anticipated fund management fees in respect of the
management of those claims. As at 30 June 2019, liabilities for compensation payments and estimated
compensation for future claims was actuarially assessed by the agencies’ consulting actuaries.

Note 23
7 - 84 Total State Sector Accounts
• The provision for Long Service Corporation Schemes include the provisions for long service leave levies
to be paid under the Building and Construction Industry Long Service Payments Act 1986 and the
Contract Cleaning Industry (Portable Long Service Leave Scheme) Act 2010. As at 30 June 2019, this
liability was actuarially assessed by the agencies’ consulting actuaries.
• A provision for loss compensation associated with the former HIH Insurance Limited has been raised by
the State for building warranty insurance and for motor vehicle claims. As at 30 June 2019, these
liabilities were actuarially assessed by the agencies’ consulting actuaries.
• A provision exists for The Victims’ Support Scheme (VSS), which was created on 3 June 2013 through
legislation known as the Victims’ Rights and Support Act 2013. This Act replaced the Victims’
Compensation Scheme (VCS), legislated through the Victims’ Support and Rehabilitation Act 1996, and
was closed to new applications for support on 7 May 2013. The VSS provides victims of violent crime,
upon application after 7 May 2013 and within an eligibility period of 2 to 10 years from the date of the
occurrence of a violent act of crime, support in the form counselling services, financial assistance and
recognition payments. Violent acts can include assault, sexual assault, child sexual assault, domestic
violence, robbery, homicide and other eligible violent acts.
The Department of Justice has obtained actuarial advice from an independent actuary to determine a
liability provision as at 30 June 2019 in respect to Lodged But Unresolved Claims. However, the amount
attributable for Incurred But Not Reported (IBNR) claims are unable to be reliably estimated by the
actuary due to a range of key uncertainties (refer to Note 29 - Contingent Assets and Contingent
Liabilities).
• A provision for universities superannuation has been recognised for the funding of staff from NSW
universities who are members of State Super’s defined benefit schemes (SASS, SANCS and SSS).
As at 30 June 2019, this liability for universities superannuation was actuarially assessed by the
agencies consulting actuaries.
Key actuarial assumptions adopted for other Schemes are as follows:
Scheme Discount Rate % Inflation Rate % 2019 2018 2019 2018
Claims expected to be paid not later than one year Workers' Compensation (Dust Diseases) 1.0 2.0 2.3 2.4
Lifetime Care and Support(a) 1.0 - 1.1 1.8 - 2.0 2.2 - 2.5 2.2 - 2.9
State Insurance Regulatory Authority 0.9 2.1 2.3 2.4
Building and Construction Industry Long Service Payment Scheme 1.4 2.6 3.0 3.0
HIH Loss Compensation 1.0 2.0 1.8 2.4
Claims expected to be paid later than one year Workers' Compensation (Dust Diseases) 1.9 2.9 2.0 2.5
Lifetime Care and Support 0.9 - 3.8 2.0 - 4.2 0.8 - 3.0 3.0 - 3.8
State Insurance Regulatory Authority 0.8 - 5.0 2.3 - 5.5 2.4 - 3.1 2.5 - 3.5
Building and Construction Industry Long Service Payments Scheme 1.4 2.6 3.0 3.0
HIH Loss Compensation 1.0 2.0 2.3 2.4
The discount rate for each scheme reflects current market assessments of the time value of money, and the risks specific to the liability.

Note 23
Total State Sector Accounts 7 - 85
General Government Sector
2018-19 Movement in Other Provisions
Carrying Amount
1 July 2018 Additional Provisions
Amounts Used
Unused Amounts Reversed
Actuarial (Gain)/Loss
Unwinding/ change in
discount rate
Carrying Amount 30 June
2019 $m $m $m $m $m $m $m
Outstanding claims: Self Insurance Corporation (excluding Workers Compensation) 3,692 834 (578) ... 91 64 4,103
Workers' Compensation (Dust Diseases) 1,827 209 (119) ... ... 32 1,949
State Insurance Regulatory Authority 144 64 (12) ... 50 12 258
Long Service Corporation 1,226 148 (94) ... 59 120 1,458
HIH Loss Compensation 16 (2) (3) (4) ... 0 7
Victims Support Fund 131 86 (58) ... (26) 2 135
NSW Share of University
Superannuation 1,279 186 (56) ... ... 33 1,442
Land Remediation, Restorations and
Other Claims 1,895 520 (291) (43) 152 21 2,253
Total Other Provisions 10,210 2,044 (1,211) (47) 325 285 11,604
2017-18 Movement in Other Provisions
Carrying Amount
1 July 2017 Additional Provisions
Amounts Used
Unused Amounts Reversed
Actuarial (Gain)/Loss
Unwinding/ change in
discount rate
Carrying Amount 30 June
2018 $m $m $m $m $m $m $m
Outstanding claims: Self Insurance Corporation (excluding Workers Compensation) 3,474 668 (519) ... 16 53 3,692
Workers' Compensation (Dust Diseases) 1,679 219 (116) ... ... 44 1,827
State Insurance Regulatory Authority 142 14 (16) ... (2) 6 144
Long Service Corporation 1,146 129 (79) ... ... 30 1,226
HIH Loss Compensation 34 ... (12) (6) (0) 0 16
Victims Support Fund 171 77 (72) ... ... (44) 131
NSW Share of University Superannuation 1,304 ... (57) ... (13) 46 1,279
Land Remediation, Restorations and Other Claims 1,502 730 (331) (36) 7 23 1,895
Total Other Provisions 9,453 1,837 (1,203) (43) 7 158 10,210
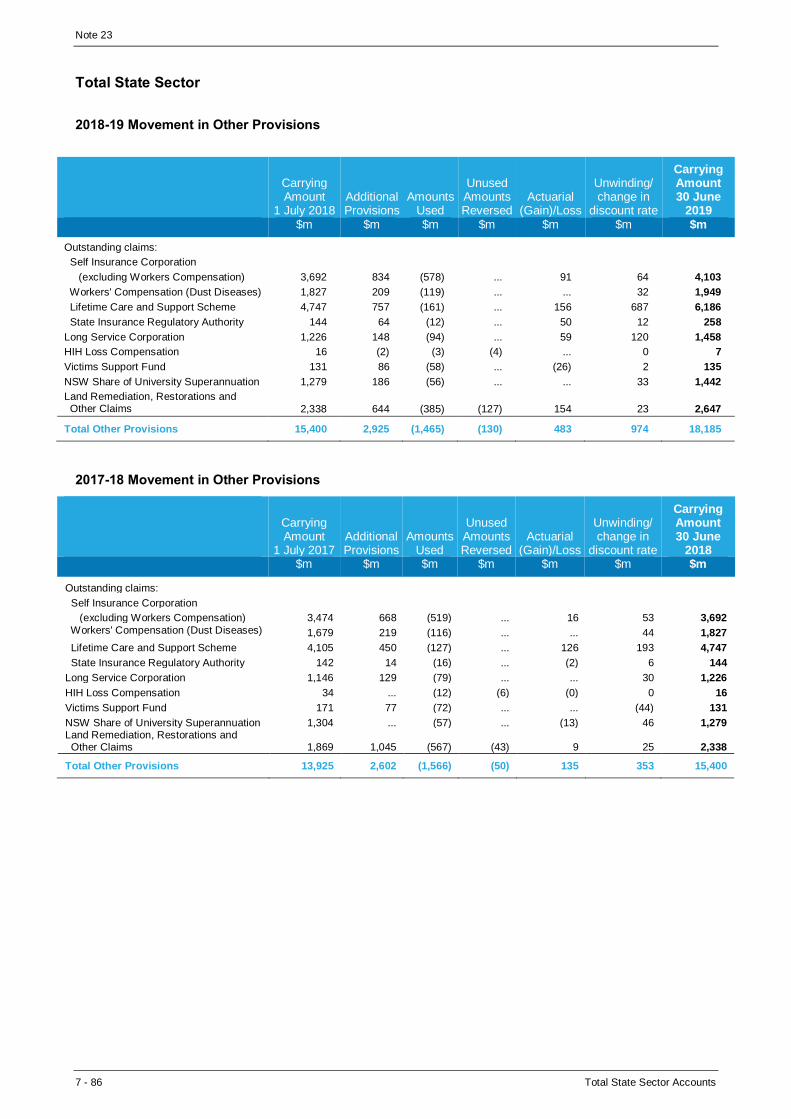
Note 23
7 - 86 Total State Sector Accounts
Total State Sector
2018-19 Movement in Other Provisions
Carrying Amount
1 July 2018 Additional Provisions
Amounts Used
Unused Amounts Reversed
Actuarial (Gain)/Loss
Unwinding/ change in
discount rate
Carrying Amount 30 June
2019 $m $m $m $m $m $m $m
Outstanding claims: Self Insurance Corporation (excluding Workers Compensation) 3,692 834 (578) ... 91 64 4,103
Workers' Compensation (Dust Diseases) 1,827 209 (119) ... ... 32 1,949
Lifetime Care and Support Scheme 4,747 757 (161) ... 156 687 6,186
State Insurance Regulatory Authority 144 64 (12) ... 50 12 258
Long Service Corporation 1,226 148 (94) ... 59 120 1,458
HIH Loss Compensation 16 (2) (3) (4) ... 0 7
Victims Support Fund 131 86 (58) ... (26) 2 135
NSW Share of University Superannuation 1,279 186 (56) ... ... 33 1,442
Land Remediation, Restorations and Other Claims 2,338 644 (385) (127) 154 23 2,647
Total Other Provisions 15,400 2,925 (1,465) (130) 483 974 18,185
2017-18 Movement in Other Provisions
Carrying Amount
1 July 2017 Additional Provisions
Amounts Used
Unused Amounts Reversed
Actuarial (Gain)/Loss
Unwinding/ change in
discount rate
Carrying Amount 30 June
2018 $m $m $m $m $m $m $m
Outstanding claims: Self Insurance Corporation
(excluding Workers Compensation) 3,474 668 (519) ... 16 53 3,692
Workers' Compensation (Dust Diseases) 1,679 219 (116) ... ... 44 1,827
Lifetime Care and Support Scheme 4,105 450 (127) ... 126 193 4,747
State Insurance Regulatory Authority 142 14 (16) ... (2) 6 144
Long Service Corporation 1,146 129 (79) ... ... 30 1,226
HIH Loss Compensation 34 ... (12) (6) (0) 0 16
Victims Support Fund 171 77 (72) ... ... (44) 131
NSW Share of University Superannuation 1,304 ... (57) ... (13) 46 1,279 Land Remediation, Restorations and Other Claims 1,869 1,045 (567) (43) 9 25 2,338
Total Other Provisions 13,925 2,602 (1,566) (50) 135 353 15,400

Note 24
Total State Sector Accounts 7 - 87
Note 24: Other Liabilities
Other Liabilities
Up-front payments received in respect of privately financed projects are deferred and amortised over the term of the arrangement. Refer to Note 15: Other Non-Financial Assets for further details.
Deferred revenues are initially recognised at the fair value of the consideration received and subsequently amortised over the contract term or when the obligation is satisfied.
Other liabilities in the Total State Sector comprise primarily of the interests in TCorpIM Funds of investors that are not controlled by the State such as universities, local government authorities, and the Workers Compensation Nominal Insurer. These interests represent units redeemable at the option of these investors and are classified as financial liabilities. The fair value of redeemable units is measured at the redemption amount that is payable (based on the redemption unit price) at the reporting date if these investors exercised their right to put the units back to the Funds.
General
Government Sector Total State Sector
2019 2018 2019 2018 $m $m $m $m
Current 1,528 1,276 12,639 11,716
Non-current 4,606 4,947 4,711 5,006
6,134 6,223 17,350 16,721
Other Liabilities Comprise: Deferred Revenue on the Private Provision of Infrastructure(a) 512 531 512 531
Other Deferred Revenue(b) 4,801 4,888 5,112 5,090
Other(c) 822 804 11,726 11,101
6,134 6,223 17,350 16,721
(a) Payments received by the State for the reimbursement of development costs under various privately financed Infrastructure projects following the letting of the Lane Cove Tunnel, Cross City Tunnel and the Western M7 Motorway contracts. Payments were also received for the Lane Cove Tunnel and M7 Motorway concession payments and the M2 and Eastern Distributor promissory notes. These up-front payments are amortised over the life of the concession period.
(b) Amounts in 2019 include the upfront contribution of $2,551 million for the 35-year concession with the private sector for the provision of land titling and registry services, developer contributions of $340 million in relation to Central Barangaroo and $661 million rel ates to different licences.
(c) Other liabilities of the Total State Sector include interests in TCorpIM Funds of investors that are not controlled by the State of $10,289 million (2018: $9,661 million).

Note 25
7 - 88 Total State Sector Accounts
Note 25: Financial Instruments
The principal financial instruments of the State are outlined below. These financial instruments arise directly from the State’s operations or are used to finance the State’s operations.
The note reports on the main risks as they affect the State’s financial instruments classified into:
• credit risk, which affects financial assets
• liquidity risk, which affects financial liabilities, and
• market risk, which affects financial assets and liabilities because of changes in market prices.
A reference to ‘financial instruments’ in this note excludes prepayments and statutory receivables/payables in accordance with AASB 7 Financial Instruments: Disclosures.
Risk Management Framework
The Treasury, acting for the Treasurer, has overall responsibility for the establishment and oversight of risk management guidelines for the New South Wales public sector. This includes establishing Treasury Management Policy to strengthen the framework for managing risks associated with public sector agency treasury functions, including borrowings, cash, investments, derivatives, debt and investment management.
As part of this framework, the Treasury administers the Government Sector Finance Act 2018 (2018: Public Authorities (Financial Arrangements) Act 1987) which is the sole source of legal power for government authorities to enter into financial arrangements.
Under this Act, the Treasurer is given responsibility for exercising a central supervisory role in respect of the investment and liability management activities of authorities to ensure that the NSW public sector’s financial risks and exposures are known, properly assessed and prudently managed. This role is affected through the requirement to have borrowing, investment and associated activities of each authority approved by the Treasurer.
NSW Treasury Corporation (TCorp) is the State’s central borrowing and investing authority. TCorp holds a level of investments for liquidity management purposes and, as the State’s central investing authority, manages the majority of the State’s investments. Bondholders include local and overseas individuals and financial institutions. TCorp manages credit risk associated with its financial assets through the selection of counterparties, establishment of minimum credit rating criteria and monitoring of credit utilisation against limits. Government agencies typically set debt / investment strategies which are then delegated to TCorp to execute on their behalf.
The State also holds borrowings that have not been made through TCorp but were made directly by individual State agencies under the authority of the Government Sector Finance Act 2018 (2018: Public Authorities (Financial Arrangements) Act 1987). This includes finance leases.
The NSW Government Asset and Liability Committee (ALCO) has been established to advise the Treasury Secretary and Government regarding State Significant Financial Risks (SSFRs). SSFRs are financial risks which have the potential to materially impact one or more of the following:
• the State’s triple-A credit rating
• the State’s reputation, and
• the financial capacity of the State to carry out its commitments.

Note 25
Total State Sector Accounts 7 - 89
Accounting Classifications and Fair Values
Financial Instrument Categories
The State’s financial instruments are classified at 30 June 2019, under AASB 9 Financial Instruments, as follows:
General
Government Sector Total State Sector
Note 2019 2019 $m $m
Financial Assets Category Cash and Cash Equivalents Amortised Cost 6 1,969 8,979
Receivables(a)
Amortised Cost 7 4,234 4,452
Advances Paid
Amortised Cost 9 1,193 715
Investments, Loans and Placements
Financial Assets at Fair Value
Derivatives (Held for Trading) Mandatorily at FVTPL 8 3 845
Derivatives (Designated Hedging Instrument)
Fair Value - Hedging Instrument 8 21 25
Interest Bearing Securities Mandatorily at FVTPL 8 267 31,891
TCorpIM Funds
Mandatorily at FVTPL 8 42,984 (0)
Managed Funds and Other Investments Mandatorily at FVTPL 8 56 11,798
Other Financial Assets
Term Deposits
Amortised Cost 8 1,462 1,274
Finance Leases Receivable Amortised Cost 8 1,058 1,441
Other
Amortised Cost 8 71 78
Equity Investments in Other Public Sector Entities(b)(c)
Designated at FVOCI 10 98,990 ...
Other Equity Investments Mandatorily at FVTPL 10 8 24,468
Financial Liabilities
Deposits Held
Designated at FVTPL 17 ... 156
Amortised Cost 17 67 137
Payables(d)
Amortised Cost 18 6,867 8,123
Advances
Amortised Cost
756 756
Borrowings
Designated at FVTPL 19 … 71,777
Amortised Cost 20 37,656 7,151
Derivatives (Held for Trading) Mandatorily at FVTPL 19 207 977
Derivatives (Designated Hedging Instrument) Fair Value - Hedging Instrument 19 ... 3
Other Liabilities
Interests in TCorpIM Funds of Investors Not
Controlled by the State Designated at FVTPL 24 ... 10,289
(a) Financial instrument disclosures exclude statutory receivables not within the scope of AASB 7. Statutory receivables include taxation, fines and levies receivable totalling $3,256 million for the General Government Sector and $3,075 million for the Total State Sector.
(b) Changes in the carrying amount of Equity Investments in Other Public Sector Entities are accounted for in a manner consistent with Equity Investments at FVOCI under AASB 9. Whilst this balance is not within the scope of AASB 7, the State has disclosed the 1 July 2018 AASB 9 transition impacts on this balance within Note 25.
(c) Financial instrument discosures exclude Investments in Associates of $12,055 million for the General Government Sector and $12,057 million for the Total State Sector not within the scope of AASB 7.
(d) Financial instrument disclosures exclude statutory payables not within the scope of AASB 7. Statutory payables include fringe benefits tax, goods and services tax payables and insurance fund scheme balances repayable totalling $212 million for the General Government Sector and $234 million for the Total State Sector.

Note 25
7 - 90 Total State Sector Accounts
The State’s financial instruments are classified under AASB 139 Financial Instruments: Recognition and Measurement at 30 June 2018 as follows:
General
Government Sector Total State Sector
Note 2018 2018 $m $m
Financial Assets Category Cash and Cash Equivalents(a) Loans and Receivables
(Amortised Cost) 6 5,417 13,969
Receivables(b)(c)
Loans and Receivables (Amortised Cost)
7 3,934 3,885
Advances Paid
Loans and Receivables (Amortised Cost)
9 1,017 644
Investments, Loans and Placements
Financial Assets at Fair Value
Derivatives (Held for Trading) FVTPL - Held for Trading 8 (0) 551
Derivatives (Designated Hedging
Instrument) Fair Value - Hedging Instrument 8 1 6
Interest Bearing Securities(a) Designated at FVTPL 8 263 29,806
TCorpIM Funds
Designated at FVTPL 8 32,255 ...
Managed Funds and Other Investments Designated at FVTPL 8 58 7,280
Other Financial Assets
Term Deposits
Loans and Receivables (Amortised Cost)
8 4,370 2,840
Finance Leases Receivable Loans and Receivables (Amortised Cost)
8 981 1,411
Other
Loans and Receivables (Amortised Cost)
8 205 205
Equity Investments in Other Public Sector Entities(d)(e)
Available for Sale 10 112,911 ...
Other Equity Investments Available for Sale 10 722 889
Designated at FVTPL 10 ... 19,531
Financial Liabilities
Deposits Held
Designated at FVTPL 17 ... 164
Amortised Cost 17 130 221
Payables(f)(g)
Amortised Cost 18 7,027 8,572
Advances
Amortised Cost
797 797
Borrowings
Designated at FVTPL 19 3 63,172
Amortised Cost 20 32,441 7,457
Derivatives (Held for Trading) FVTPL - Held for Trading 19 0 538
Derivatives (Designated Hedging Instrument) Fair Value - Hedging Instrument 19 2 126
Other Liabilities
Interests in TCorpIM Funds of Investors Not Controlled by the State
Designated at FVTPL 24 ... 9,661
(a) TCorp has reassessed its holdings of Reverse Repurchase Agreements which has resulted in a reclassification of $1,002 million from Interest Bearing Securities, included as part of Note 8: Investments, Loans and Placements, to Note 6: Cash and Cash Equivalents.
(b) Financial instrument disclosures exclude statutory receivables not within the scope of AASB 7. Statutory receivables include taxation, fines and levies receivable totalling $2,787 million for the General Government Sector and $2,662 million for the Total State Sector.
(c) Receivables of $321 million for the General Government Sector and Total State Sector were reclassified from Contractual Receivables to Statutory Receivables for 2017-18.
(d) Changes in the carrying amount of Equity Investments in Other Public Sector Entities were accounted for in a manner consistent with Available for Sale financial assets under AASB 139 for 2017-18. Whilst this balance is not within the scope of AASB 7, the State has disclosed the 1 July 2018 AASB 9 transition impacts on this balance within Note 25.
(e) Financial instrument discosures exclude Investments in Assoicates of $5,987 million for the General Government Sector and $5,988 million for the Total State Sector not within the scope of AASB 7.
(f) Financial instrument disclosures exclude statutory payables not within the scope of AASB 7. Statutory payables include fringe benefits tax, goods and services tax payables and insurance fund scheme balances repayable totalling $224 million for the General Government Sector and $261 million for the Total State Sector.
(g) Payables of $129 million for the General Government Sector and Total State Sector were reclassified from Contractual Payables to Statutory Payables for 2017-18.
The State determines the classification of its financial assets and liabilities after initial recognition and, when allowed and appropriate, re-evaluates this at each financial year end.

Note 25
Total State Sector Accounts 7 - 91
Financial Instruments Net Gains and Losses by Financial Instrument Categories
The following table summarises financial instruments net gains and losses (‘other economic flows’) recognised in the operating result throughout the current reporting period ended 30 June 2019 by AASB 9 financial instrument measurement classifications.
30 June 2019 General Government Sector Total State Sector
$m $m
Non-Derivative Financial Assets
Mandatorily at FVTPL(a) 14,607 15,235
Total 14,607 15,235
Non-Derivative Financial Liabilities
Designated at FVTPL ... (3,128)
Amortised Cost (147) 2
Total (147) (3,126)
Derivative Financial Instruments
FVTPL – Held for Trading (203) (237)
Fair Value - Hedging Instrument 4 4
Total (199) (233)
Net Total(b)(c)(d) 14,261 11,876
(a) This amount includes $13.2 billion in relation to the West Connex Group transaction occurring during the reporting period ended 30 June 2019. Refer to Note 5: Discontinued Operations for further information.
(b) The net total equates to the sum of Fair Value Adjustments to Financial Instruments and Net Gains / Losses on Financial Assets at Fair Value through Profit and Loss amounts reported in Note 4: Other Economic Flows Included in the Operating Result.
(c) Refer to Note 2: Revenue - Other Dividend and Distributions for distributions throughout 2018-19 from Managed Funds mandatorily measured at FVTPL.
(d) Refer to Other Economic Flows – Other Comprehensive Income in the Consolidated Statement of Comprehensive Income for gains and losses deferred to equity in the Hedging Reserve for Fair Value – Hedging Financial Instruments (‘Net Gain/(Loss) on Financial Instruments at Fair Value’) and in the Financial Assets at Fair Value through Other Comprehensive Income Reserve for Equity Investments designated at FVOCI (‘Net Gain/(Loss) on Equity Instruments at Fair Value through Other Comprehensive Income’).
.

Note 25
7 - 92 Total State Sector Accounts
The following table summarises financial instruments net gains and losses (‘other economic flows’) recognised in the operating result throughout the comparative reporting period ended 30 June 2018 by AASB 139 financial instrument measurement classifications.
30 June 2018 General Government Sector Total State Sector
$m $m
Non-Derivative Financial Assets
Designated at FVTPL 528 761
Total 528 761
Non-Derivative Financial Liabilities
Designated at FVTPL ... 399
Amortised Cost (304) 1
Total (304) 400
Derivative Financial Instruments
FVTPL – Held for Trading 60 17
Fair Value - Hedging Instrument (1) 0
Total 59 17
Net Total(a)(b)(c) 283 1,178
(a) The net total equates to the sum of Fair Value Adjustments to Financial Instruments amounts reported in Note 4: Other Economic Flows Included in the Operating Result.
(b) Refer to Note 2: Revenue - Other Dividend and Distributions for distributions received throughout 2017-18 from Managed Funds designated at FVTPL.
(c) Refer to Other Economic Flows – Other Comprehensive Income in the Consolidated Statement of Comprehensive Income for gains and losses deferred to equity in the Hedging Reserve for Fair Value – Hedging Financial Instruments (‘Net Gain/(Loss) on Financial Instruments at Fair Value’) and in the Available for Sale Reserve for Available for Sale Equity Investments (‘Net Gain/(Loss) on Equity Instruments in Other Sectors’).
.

Note 25
Total State Sector Accounts 7 - 93
Interest Revenue and Interest Expense by Financial Instrument Category
The following table summarises interest revenue and expense recognised throughout the current reporting period ended 30 June 2019 by AASB 9 financial instrument measurement classifications.
30 June 2019 General Government Sector Total State Sector
$m $m
Interest Revenue From: Financial Assets at Amortised Cost 484 464
Financial Assets at FVTPL 7 338
Total(a) 491 801
Interest Expense From: Financial Liabilities at Amortised Cost 1,544 616
Financial Liabilities at FVTPL ... 2,161
Total(b) 1,544 2,777
(a) Interest revenue of $491 million for the General Government Sector and $801 million for the Total State Sector equates to total interest revenue reported in Note 2: Revenue – Interest.
(b) Interest expense of $1,544 million for the General Government Sector equates to the sum of Interest on Borrowings of $1,331 million and Interest on Finance Leases of $213 million reported in Note 3: Expenses – Interest Expense. Interest expense of $2,777 million for the Total State Sector equates to the sum of Interest on Borrowings of $2,299 million and Interest on Finance Leases of $478 million reported in Note 3: Expenses – Interest Expense.
The following table summarises interest revenue and expense recognised throughout the comparative reporting period ended 30 June 2018 by AASB 139 financial instrument measurement classifications.
30 June 2018 General Government Sector Total State Sector
$m $m
Interest Revenue From: Financial Assets at Amortised Cost 548 743
Financial Assets at FVTPL 9 329
Total(a) 558 1,072
Interest Expense From: Financial Liabilities at Amortised Cost 1,537 814
Financial Liabilities at FVTPL ... 2,178
Total(b) 1,537 2,992
(a) Interest revenue of $558 million for the General Government Sector and $1,072 million for the Total State Sector equates to total interest revenue reported in Note 2: Revenue – Interest.
(b) Interest expense of $1,537 million for the General Government Sector equates to the sum of Interest on Borrowings of $1,297 million and Interest on Finance Leases of $240 million reported in Note 3: Expenses – Interest Expense. Interest expense of $2,992 million for the Total State Sector equates to the sum of Interest on Borrowings of $2,453 million and Interest on Finance Leases of $539 million reported in Note 3: Expenses – Interest Expense.

Note 25
7 - 94 Total State Sector Accounts
Valuation of Financial Instruments
Except where specified below, the amortised cost of financial instruments recognised in the Statement of Financial Position approximates the fair value, because of the short-term nature of many of the financial instruments.
Fair Value Hierarchy of Financial Assets and Liabilities
The following tables set out the State’s financial assets and liabilities measured at fair value according to the fair value hierarchy at reporting date.
General Government Sector
30 June 2019 Note Level 1 Level 2 Level 3 Total $m $m $m $m
Financial Assets Investments, Loans and Placements
Derivatives
Held for Trading 8 3 0 ... 3
Designated and Effective Hedging Instruments 8 ... 20 1 21
Financial Assets at Fair Value
Interest Bearing Securities 8 8 259 ... 267
TCorpIM Funds 8 ... 42,984 ... 42,984
Managed Funds and Other Investments 8 56 ... ... 56
Other Equity Investments 10 ... 0 8 8
Total 67 43,263 9 43,339
Financial Liabilities
Derivatives
Held for Trading 19 11 196 ... 207
Total 11 196 ... 207
Net Total 56 43,067 9 43,132
30 June 2018 Note Level 1 Level 2 Level 3 Total $m $m $m $m
Financial Assets Investments, Loans and Placements
Derivatives
Held for Trading 8 0 0 ... 0
Designated and Effective Hedging Instruments 8 ... 2 ... 2
Financial Assets at Fair Value
Interest Bearing Securities(a) 8 18 245 ... 263
TCorpIM Funds 8 ... 32,255 ... 32,255
Managed Funds and Other Investments(b) 8 58 ... ... 58
Other Equity Investments 10 (0) 42 680 722
Total 76 32,544 680 33,300
Financial Liabilities
Derivatives
Held for Trading 19 ... 0 ... 0
Designated and Effective Hedging Instruments 19 ... 2 ... 2
Borrowings at Fair Value
Other Fair Value Borrowings 19 ... 3 ... 3
Total ... 5 ... 5
Net Total 76 32,539 680 33,295
(a) $6 million of Interest Bearing Securities have been reclassified from level 2 to level 1 of the fair value hierarchy after subsequent issue of the 2017-18 Total State Sector Accounts.
(b) $58 million of Managed Funds and Other Investments have been reclassified from level 2 to level 1 of the fair value hierarchy after subsequent issue of the 2017-18 Total State Sector Accounts.

Note 25
Total State Sector Accounts 7 - 95
Total State Sector
30 June 2019 Note Level 1 Level 2 Level 3 Total $m $m $m $m
Financial Assets Investments, Loans and Placements
Derivatives
Held for Trading 8 30 815 ... 845
Designated and Effective Hedging Instruments 8 2 22 1 25
Financial Assets at Fair Value
Interest Bearing Securities 8 7,232 24,524 135 31,891
Managed Funds and Other Investments 8 806 7,792 3,200 11,798
Other Equity Investments 10 24,328 0 140 24,468
Total 32,398 33,153 3,476 69,027
Financial Liabilities Deposits Held Held by Public Financial Corporations 17 156 ... ... 156
Derivatives
Held for Trading 19 12 965 ... 977
Designated and Effective Hedging Instruments 19 2 1 ... 3
Borrowings at Fair Value
Bonds and Other Borrowings Issued by TCorp 19 61,678 9,372 727 71,777
Other Liabilities
Interests in TCorpIM Funds of Investors Not Controlled by the
State 24
... 10,289 ... 10,289
Total 61,848 20,627 727 83,202
Net Total (29,450) 12,526 2,749 (14,175)
30 June 2018 Note Level 1 Level 2 Level 3 Total $m $m $m $m
Financial Assets Investments, Loans and Placements
Derivatives
Held for Trading 8 10 541 ... 551
Designated and Effective Hedging Instruments 8 1 5 ... 6
Financial Assets at Fair Value
Interest Bearing Securities(a)(b) 8 3,477 26,211 118 29,806
Managed Funds and Other Investments(c) 8 303 4,049 2,928 7,280
Other Equity Investments 10 19,574 43 803 20,420
Total 23,366 30,849 3,849 58,064
Financial Liabilities Deposits Held Held by Public Financial Corporations 17 164 ... ... 164
Derivatives
Held for Trading 19 28 511 ... 538
Designated and Effective Hedging Instruments 19 1 125 ... 126
Borrowings at Fair Value
Bonds and Other Borrowings Issued by TCorp(d) 19 55,348 6,054 636 62,039
Other Fair Value Borrowings 19 ... 1,133 ... 1,133
Other Liabilities
Interests in TCorpIM Funds of Investors Not Controlled by the State
24 ... 9,661 ... 9,661
Total 55,541 17,484 636 73,662
Net Total (32,176) 13,366 3,213 (15,599)
(a) TCorp has reassessed it holdings of Reverse Repurchase Agreements which has resulted in a reclassification of $1,002 million from Interest Bearing Securities, included as part of Note 8: Investments, Loans and Placements, to Note 6: Cash and Cash Equivalents. This adjustment has resulted in a reduction of Interest Bearing Securities included in the fair value hierarchy at level 2 by $1,002 million.
(b) $434 million of Interest Bearing Securities have been reclassified from level 2 to level 1 of the fair value hierarchy after subsequent issue of the 2017-18 Total State Sector Accounts.
(c) $196 million of Managed Funds and Other Investments have been reclassified from level 2 to level 1 after the subsequent issue of the 2017-18 Total State Sector Accounts.
(d) $323 million of Bonds and Other Borrowings Issued by TCorp have been reclassified from level 1 to level 2 after the subsequent issue of the 2017-18 Total State Sector Accounts.

Note 25
7 - 96 Total State Sector Accounts
Annual Movement Reconciliation of Level 3 Fair Value Measurements
The following tables set out the State’s change in exposure throughout the reporting period to financial instruments categorised as Level 3 in the fair value measurement hierarchy.
General Government Sector
Derivative Assets - Held for Trading
Derivative Assets - Designated and Effective Hedging
Instruments Other Equity Instruments
Total Recurring Level 3 Fair Value
Note 8 8 10
2019 2018 2019 2018 2019 2018 2019 2018 $m $m $m $m $m $m $m $m
Financial Assets Opening Balance ... 41 ... ... 680 659 680 700 Gains or Loss Recognised in Other
Economic Flows Included in the Operating Result ... ... ... ... ... 21 ... 21 Included in Other Comprehensive Income ... ... ... ... (680) ... (680) ...
Sales / Settlements ... (41) ... ... ... ... ... (41) Transfers into Level 3 ... ... 1 ... 8 ... 9 ...
Closing Balance ... ... 1 ... 8 680 9 680
Net Total ... ... 1 ... 8 680 9 680
Total State Sector
Derivative Assets - Held
for Trading
Derivative Assets -
Designated and Effective
Hedging
Instruments
Interest Bearing
Securities
Managed Funds and
Other
Investments
Other Equity
Instruments
Bonds and Other
Borrowings Issued by
TCorp
Total Recurring
Level 3 Fair
Value
Note 8 8 8 8 10 19 2019 2018 2019 2018 2019 2018 2019 2018 2019 2018 2019 2018 2019 2018
$m $m $m $m $m $m $m $m $m $m $m $m $m $m
Financial Assets Opening Balance ... 41 ... ... 118 ... 2,929 2,246 803 779 ... ... 3,849 3,066
Gains or Loss Recognised in Other Economic Flows Included in the Operating Result ... ... ... ... 4 1 140 163 9 24 ... ... 154 188
Included in Other Comprehensive Income ... ... ... ... ... ... ... ... (680) ... ... ... (680) ...
Purchases ... ... ... ... 4 117 226 550 ... ... ... ... 230 668
Sales / Settlements ... (41) ... ... (0) ... (95) (31) (0) ... ... ... (96) (73)
Transfers into Level 3 ... ... 1 ... 9 ... ... ... 8 0 ... ... 18 0
Closing Balance ... ... 1 ... 135 118 3,200 2,928 140 803 ... ... 3,476 3,849
Financial Liabilities Opening Balance ... ... ... ... ... ... ... ... ... ... 636 622 636 622
Gains or Loss Recognised in Other Economic Flows Included in the Operating Result ... ... ... ... ... ... ... ... ... ... 103 28 103 28
Sales / Settlements ... ... ... ... ... ... ... ... ... ... (13) (14) (13) (14)
Closing Balance ... ... ... ... ... ... ... ... ... ... 727 636 727 636
Net Total ... ... 1 ... 135 118 3,200 2,928 140 803 (727) (636) 2,749 3,213
Transfers between levels of the fair value hierarchy are recognised at the end of the reporting period during which the transfer has occurred. Transfers into level 3 of the fair value hierarchy for the year ended 30 June 2019 totalled $9 million for the General Government Sector and $18 million for the Total State Sector (2018: Nil).
Valuation policies and procedures of the State are developed, reviewed and enforced by management of the respective agencies.

Note 25
Total State Sector Accounts 7 - 97
Measurement of Fair Values
Financial Instruments Measured at Fair Value – Level 2
Financial instruments measured at fair value that are classified at level 2 of the fair value hierarchy comprise derivatives, interest bearing securities, TCorpIM Funds, managed funds and other investments, borrowings measured at fair value, and other equity investments. The valuation techniques and inputs for these financial instruments are as follows:
Derivatives (Held for Trading and Effective Hedging Instruments) - The fair values are based on market quoted prices of similar instruments or discounted cash flow analysis depending on whether the derivatives are traded in an active market. Primary valuation inputs include spot FX rates, swap rates and basis curves.
Interest Bearing Securities – The fair value is based on market comparisons of quoted prices of comparable securities or discounting of expected future cash flows to their present value using benchmark market yields and margins appropriate to the securities.
TCorpIM Funds – The value of the TCorpIM Funds is based on the State’s share of the value of the underlying assets of the fund, based on the market value. All of the TCorpIM Funds are valued using ‘redemption’ pricing.
Managed Funds and Other Investments – The fair value of unlisted managed fund investments is based on the State’s share of the unit values using ‘redemption’ pricing provided by external fund managers.
Borrowings Measured at Fair Value (Bonds and Other Borrowings Issued by TCorp) – The fair value is based on discounting of expected future cash flows to their present value using benchmark market yields and margins appropriate to the borrowings.

Note 25
7 - 98 Total State Sector Accounts
Financial Instruments Measured at Fair Value – Level 3
The valuation techniques and inputs for financial instruments classified at level 3 of the fair value hierarchy are summarised in the following table:
Type Valuation technique Significant unobservable
inputs Relationship between inputs
and fair value
Managed Funds and
Other Investments
(Note 8)
Unlisted managed investment
funds and unit trusts held in
TCorpIM Fund Trusts, that are
classified at Level 3, are
infrequently traded. These
investments directly hold assets
such as unlisted property or
unlisted infrastructure which
require significant valuation
estimation and judgement by the
fund manager and their valuer.
The Fund's investment in unlisted
managed investment funds is
carried at fair value based on
redemption value per unit
reported by the manager of the
funds. The unobservable inputs
are published redemption prices.
There were no significant inter-
relationships between
unobservable inputs that
materially affect fair value.
Other Equity
Investments (Note
10) and Interest-
Bearing Securities
(Note 8)
Unlisted equity securities and loan
notes held in TCorpIM Fund
Trusts, that are classified at Level
3, are infrequently traded. As
observable prices are not
available for these investments,
valuation techniques are used to
derive fair value. The valuation
technique employed in most
cases is discounted cashflows
(the income approach).
The significant unobservable
inputs for these investments are
the inflation rate, discount rate
and terminal growth rates used in
the discounted cashflows
valuation.
There were no significant inter-
relationships between
unobservable inputs that
materially affect fair value.
Borrowings
Measured at Fair
Value - Bonds and
Other Borrowings
Issued by TCorp
(Note 19)
Euro Medium Term Notes held by
TCorp are classified at Level 3 in
the fair value hierarchy. These
instruments are foreign currency
denominated fixed interest
borrowings. The fair value of
these borrowings is derived from
quoted market prices of the
underlying securities adjusted by
unobservable inputs for risk.
The quoted prices obtained for
these securities are subject to a
buy/sell spread (also known as a
risk adjustment) in recognition of
the limited trading activity of these
bonds. This ‘spread’ is
unobservable.
There were no significant
inter-relationships between
unobservable inputs that
materially affect fair value.

Note 25
Total State Sector Accounts 7 - 99
Financial Instruments Not Measured at Fair Value
The State has financial assets and liabilities which are not measured at fair value in the Statement of Financial Position but for which the fair value is disclosed in this note.
The amortised cost of cash and cash equivalents, receivables, advances paid, finance leases receivable, term deposits, payables, deposits held, and advances held are assumed to approximate fair value.
The following table details the financial instruments where the fair value differs from the carrying amount.
30 June 2019 General
Government Sector Total State Sector
Note Carrying Amount Fair Value
Carrying Amount Fair Value
$m $m $m $m
Financial Assets Investments, Loans and Placements Other Financial Assets Other 8 71 144 78 151
Total 71 144 78 151
Financial Liabilities Borrowings at Amortised Cost Other Borrowings at Amortised Cost 20 33,233 37,392 31 31
Finance Leases 20 2,590 2,590 5,287 5,440
Financial Liability arising from Public Private Partnership (PPP) 20 1,834 1,834 1,834 1,834
Total 37,656 41,816 7,151 7,304
30 June 2018 General
Government Sector Total State Sector
Note Carrying Amount Fair Value
Carrying Amount
Fair Value
$m $m $m $m
Financial Assets Investments, Loans and Placements Other Financial Assets Other 8 205 261 205 262
Total 205 261 205 262
Financial Liabilities Borrowings at Amortised Cost Other Borrowings at Amortised Cost(a) 20 29,457 31,521 2,155 2,155
Finance Leases 20 2,984 2,984 5,302 5,421
Total(a) 32,441 34,505 7,457 7,576
(a) The 2017-18 reported fair value of $34.49 billion for Other Borrowings at Amortised Cost has been revised and increased by $12 million to $34.51 billion after subsequent issue of the 2017-18 Total State Sector Accounts.
Other borrowings at amortised cost held by the General Government Sector is the only financial instrument category where fair value significantly differs from the carrying amount. The fair value is based on the State’s share of the value of the underlying assets of the facility, based on the market value. Other borrowings at amortised cost are included in the fair value hierarchy at level 2.

Note 25
7 - 100 Total State Sector Accounts
Offsetting Financial Instruments
Financial instruments are offset, and the net amount is reported in the Statement of Financial Position if the State currently has a legally enforceable right to set off the recognised amounts, and intends either to settle on a net basis, or to realise the asset and settle the liability simultaneously.
The State also enters into various derivative transactions under International Swaps and Derivatives Association (ISDA) master netting agreements. Under these agreements, the amounts owed by each counterparty in respect of all transactions outstanding are aggregated into a single net amount that is payable by one party to the other. In certain circumstances, such as when a credit event such as a default occurs, all outstanding transactions under the agreement are terminated, the termination value is assessed and only a single net amount is payable in settlement of all transactions. The ISDA agreements do not meet the criteria for offsetting in the Statement of Financial Position. This is because the State does not have any currently legally enforceable right to offset recognised amounts, because the right to offset is enforceable only on the occurrence of future events.
The following tables set out the carrying amounts of recognised financial instruments for the Total State Sector that are offset in the Statement of Financial Position and those that are not offset but are subject to master netting agreements. The General Government Sector has not offset any material financial instrument balances in the Statement of Financial Position or entered into any significant master netting arrangements as at 30 June 2019 (2018: Nil).
Total State Sector
30 June 2019
Effects of Offsetting on the Balance Sheet Related Amounts Not Offset
Gross
Amounts
Gross Amounts Offset in the Statement of
Financial Position
Net Amounts Presented in the
Statement of
Financial Position
Amounts Subject to Master Netting
Arrangements
Financial Instrument
Collateral
Net
Amount Note $m $m $m $m $m $m
Financial Assets Cash and Cash Equivalents 6 8,979 ... 8,979 ... (1,096) 7,883
Investments, Loans and Placements
Financial Assets at Fair Value
Derivatives - Held for Trading 8 848 (3) 845 (632) (158) 56
Receivables
Other(a) 7 2,786 ... 2,786 ... (15) 2,771
Total 12,614 (3) 12,611 (632) (1,270) 10,709
Financial Liabilities
Borrowings and Derivatives at Fair Value
Bonds and Borrowings Issued by TCorp 19 (71,777) ... (71,777) ... 586 (71,191)
Derivatives - Held for Trading 19 (980) 3 (977) 632 246 (99)
Total (72,757) 3 (72,754) 632 832 (71,290)
(a) Amounts offset as part of Receivables – Other relate to margin account amounts receivable.
30 June 2018
Effects of Offsetting on the Balance Sheet Related Amounts Not Offset
Gross
Amounts
Gross Amounts Offset in the Statement of
Financial Position
Net Amounts Presented in the
Statement of Financial Position
Amounts Subject to Master Netting
Arrangements
Financial Instrument Collateral
Net Amount
Note $m $m $m $m $m $m
Financial Assets Cash and Cash Equivalents 6 13,969 ... 13,969 ... (1,002) 12,967
Investments, Loans and Placements
Financial Assets at Fair Value
Derivatives - Held for Trading 8 551 ... 551 (316) (128) 107
Receivables
Other(a) 7 2,494 ... 2,494 ... (31) 2,463
Total 17,014 ... 17,014 (316) (1,161) 15,537
Financial Liabilities Borrowings and Derivatives at Fair Value
Bonds and Borrowings Issued by TCorp 19 (62,039) ... (62,039) ... ... (62,039)
Derivatives - Held for Trading 19 (538) ... (538) 316 122 (100)
Total (62,577) ... (62,577) 316 122 (62,139)
(a) Amounts offset as part of Receivables – Other relate to margin account amounts receivable.

Note 25
Total State Sector Accounts 7 - 101
Credit Risk of Financial Assets
Credit risk arises when there is the possibility of the State’s counterparties defaulting on their contractual obligations, resulting in a financial loss to the State. Credit risk arises from cash and cash equivalents, contractual cash flows of interest-bearing securities and other financial assets at amortised cost, term deposits with banks and financial institutions, derivative financial assets, as well as credit exposures to commercial entities and individuals, including outstanding receivables and finance leases receivable.
The carrying amount of financial assets represents the State’s maximum credit exposure (net of any allowance for credit losses or allowance for impairment) at the end of the reporting period.
Credit risk associated with the State’s financial assets, other than receivables, is managed through the selection and monitoring of counterparties and establishment of minimum credit rating standards.
All financial assets, except for those measured at FVTPL, are subject to an annual review for impairment.
The State controls the borrowing and investing powers of its authorities through the Government Sector Finance Act 2018 (2018: Public Authorities (Financial Arrangement) Act 1987). The provision for the Treasurer to schedule authorities under this Act restricts the ability and amount that public authorities can borrow and invest, and directs most authorities to finance through TCorp. Agencies with approved investing powers outside of TCorp are restricted to invest in classes of investments in accordance with the Government Sector Finance Act 2018 (2018: Public Authorities (Financial Arrangement) Act 1987).
The State holds various security deposits in the General Government Sector to the value of $67 million (2018: $130 million) and in the Total State Sector to the value of $293 million (2018: $385 million).
The State may obtain, or provide, collateral to support amounts due under derivative transactions with certain counterparties. The collateral may include cash or eligible securities obtained, or provided, when agreed market value thresholds are exceeded. There was $308.7 million of collateral received under these arrangements at the reporting date (2018: $256.7 million). The State paid $239.7 million of collateral under these arrangements throughout the year (2018: $92.5 million).
Cash and Cash Equivalents
Cash and cash equivalents (Note 6) comprises cash on hand, cash invested in the TCorpIM Funds, and cash and deposits held at financial institutions. Interest is earned on daily bank balances at agreed rates. The TCorpIM Cash Fund is discussed in market risk below. The credit ratings of other institutions holding non TCorpIM cash is within acceptable credit risk parameters.
Receivables and Finance Leases Receivable
Receivables (Note 7) exist for the settlement of services that the State provides across the range of its public services. All debtors are recognised as amounts receivable at reporting date. Sales are made on terms appropriate to the sector providing the public service. Collectability of debtors is reviewed on an ongoing basis. Established procedures are followed to recover outstanding debt amounts, including letters of demand.
In addition, amounts due from lessees to the State under finance leasing arrangements are recorded as finance leases receivable (Note 8). The State has issued finance leases over infrastructure, and land property, plant and equipment.

Note 25
7 - 102 Total State Sector Accounts
Impairment under AASB 9 (from 1 July 2018)
The annual movement in the contractual receivables allowance for expected credit losses for the current reporting period ended 30 June 2019 is summarised below.
30 June 2019 General
Government Sector Total State Sector 2019 2019 $m $m
Closing Balance at 30 June 2018 under AASB 139 161 182
Amounts Restated Through Opening Accumulated Funds 7 7
Opening Balance at 1 July 2018 under AASB 9 168 189
Amounts Written Off to the Net Operating Balance During the Year (61) (66)
Amounts Previously Provided for Recovered During the Year (1) (2)
Increase/(Decrease) in Allowance Recognised in Other Economic Flows - Operating Result 71 81
Closing Balance at 30 June 2019(a) 177 202
(a) Excludes impairment on statutory receivables (i.e. not within the scope of AASB 7).
The State has assessed that finance leases receivable are not impaired at 30 June 2019. The State’s investments in these instruments are low risk and are with counterparties with no or very low levels of default.
The State applies the AASB 9 simplified approach to measuring expected credit losses which uses a lifetime expected loss allowance for all contractual receivables, including finance leases receivable.
To measure the expected credit losses, these receivables have been grouped based on shared credit risk characteristics and the days past due.
The State determines the expected credit losses on receivables by using a provision matrix, with the expected loss rates based on historical observed loss rates. The historical loss rates are adjusted to reflect current and forward-looking information on macroeconomic factors affecting the ability of the customers to settle the receivables. The State has identified that economic conditions of the sector that the debtors participate in and the forecast change in these conditions to be the most relevant factors, and accordingly adjusts the historical loss rates based on expected changes in these factors.
The credit risk profile of receivables is analysed based on their past due status. The majority of impaired receivables as at the 30 June 2019 reporting date have been past due for a period greater than six months.
Receivables are written off when there is no reasonable expectation of recovery. Indicators that there is no reasonable expectation of recovery include, amongst others, a failure to make contractual payments for a period of greater than 90 days past due.
The State provides services to a broad spectrum of the NSW economy, for example for water and public housing. Debtors include individual households and commercial businesses with various credit ratings. The State is not materially exposed to concentrations of credit risk to a single trade debtor or group of debtors.

Note 25
Total State Sector Accounts 7 - 103
Impairment under AASB 139 (for comparative period end 30 June 2018)
The annual movement in the contractual receivables allowance for impairment for the comparative period ended 30 June 2018 is detailed in the table below.
30 June 2018 General
Government Sector Total State Sector 2018 2018 $m $m
Closing Balance at 1 July 2017 169 199
Amounts Written Off to the Net Operating Balance During the Year (75) (81)
Amounts Previously Provided for Recovered During the Year (1) (1)
Increase/(Decrease) in Allowance Recognised in Other Economic Flows -
Operating Result 68 65
Closing Balance at 30 June 2018(a)(b) 161 182
(a) Excludes impairment on statutory receivables (i.e. not within the scope of AASB 7). (b) The 2017-18 reported contractual receivable impairment balances of $181 million for the General Government Sector and $202 million for
the Total State Sector have been revised and reduced by $20 million to $161 million for the General Government Sector and $182 million for the Total State Sector after subsequent issue of the 2017-18 Total State Sector Accounts.
The State did not have any finance leases receivable that were impaired at 30 June 2018.The majority of receivables past due or impaired relate to the sale of goods and services. The majority of the receivables impaired at 30 June 2018 have been overdue for a period of over six months.
Investments, Loans and Placements and Advances Paid
The State is also subject to credit risk from interest bearing securities, term deposits, advances paid, and other financial assets at amortised cost.
The credit quality of these investments is managed using Standard and Poor’s ratings categories. Exposure in each grade is monitored to ensure that it is in accordance with mandated parameters. To be eligible for investment, counterparties must satisfy minimum credit worthiness criteria.
The following tables present an analysis of the credit quality of these investments. The tables also detail for the current reporting period ended 30 June 2019 whether investments classified at amortised cost were subject to a 12-month expected credit losses allowance or lifetime expected credit losses allowance and, in the latter case, whether they were credit-impaired.

Note 25
7 - 104 Total State Sector Accounts
General Government Sector
30 June 2019 Credit Rating(a)
Note AAA AA+ AA AA- A+ A Other
Ratings(b) Loss
Allowance Carrying Amount
$m $m $m $m $m $m $m $m $m
Financial Assets at Carrying Amount Financial Assets at Fair Value
Interest Bearing Securities 8 208 ... 40 0 ... ... 18 ... 267
Financial Assets at Amortised Cost with 12-Month ECLs
Other Financial Assets
Term Deposits 8 437 ... ... 940 67 ... 18 ... 1,462
Other 8 ... ... ... ... ... ... 71 ... 71
Financial Assets at Amortised Cost with Lifetime ECLs
Advances Paid 9 ... ... ... ... ... ... 1,197 (4) 1,193
645 ... 40 940 67 ... 1,305 (4) 2,993
30 June 2018 Credit Rating(a)
Note AAA AA+ AA AA- A+ A Other
Ratings(b) Loss
Allowance Carrying Amount
$m $m $m $m $m $m $m $m $m
Financial Assets at Carrying Amount Financial Assets at Fair Value(c)
Interest Bearing Securities 8 213 ... 15 ... 1 1 34 ... 263
Other Financial Assets
Term Deposits 8 2,304 ... ... 1,908 53 ... 105 ... 4,370
Other 8 ... ... ... ... ... ... 205 ... 205
Advances Paid 9 ... ... ... ... ... ... 1,018 (1) 1,017
2,517 ... 15 1,908 54 1 1,362 (1) 5,856
(a) Amounts are assigned to the credit ratings categories based on information provided by individual agencies who use rankings assigned by S&P. ‘AAA’, ‘AA+’, ‘AA’, ‘AA-‘, ‘A+’, ‘A’ displayed in the column headings are ratings categories by S&P that are comparable with ‘Aaa’, ‘Aa1’,’Aa2’, ‘Aa3’, ‘A1’,’A2’ ratings given by Moody's.
(b) Short term ratings of A2 or better, when the counterparty has no long term rating or the long term rating is A- or lower. (c) 2017-18 comparative period credit ratings for Financial Assets at Fair Value have been revised given the reclassification of financial
instrument balances within Note 8: Investments, Loans, and Placements.

Note 25
Total State Sector Accounts 7 - 105
Total State Sector
30 June 2019 Credit Rating(a)
Note AAA AA+ AA AA- A+ A Other
Ratings(b) Loss
Allowance Carrying Amount
$m $m $m $m $m $m $m $m $m
Financial Assets at Carrying Amount Financial Assets at Fair Value
Interest Bearing Securities 8 4,480 2,034 247 10,358 3,010 2,130 9,632 ... 31,891
Financial Assets at Amortised Cost with 12-Month ECLs Other Financial Assets
Term Deposits 8 ... ... ... 1,090 67 ... 117 ... 1,274
Other 8 ... ... ... ... ... ... 78 ... 78
Financial Assets at Amortised Cost with Lifetime ECLs
Advances Paid 9 ... ... ... ... ... ... 719 (4) 715
4,480 2,034 247 11,447 3,077 2,130 10,546 (4) 33,958
30 June 2018 Credit Rating(a)
Note AAA AA+ AA AA- A+ A Other
Ratings(b) Loss
Allowance Carrying Amount
$m $m $m $m $m $m $m $m $m
Financial Assets at Carrying Amount Financial Assets at Fair Value(c)
Interest Bearing Securities 8 4,667 1,151 300 9,596 1,289 863 11,940 ... 29,806
Other Financial Assets
Term Deposits 8 ... ... ... 2,688 53 41 58 ... 2,840
Other 8 ... ... ... ... ... ... 205 ... 205
Advances Paid 9 ... ... ... ... ... ... 645 (1) 644
4,667 1,151 300 12,285 1,342 904 12,848 (1) 33,496
(a) Refer to footnote in General Government Sector table above. (b) Refer to footnote in General Government Sector table above. (c) 2017-18 comparative period credit rating figures for Financial Assets at Fair Value have been re-stated given revised information available
after the release of the 2017-18 Total State Sector Accounts and the reclassification of financial instrument balances within Note 8: Investments, Loans, and Placements (including the $1,002 million reclassification of Reverse Repurchase Agreements from Interest Bearing Securities, included as part of Note 8, to Note 6: Cash and Cash Equivalents).
The State has placed funds on deposit with various financial institutions consisting of money market or bank deposits and can be placed 'at call' or for a fixed term. These term deposits are considered to have low credit risk, and the loss allowance calculated for these investments during the period was therefore limited to 12 months expected credit losses. The State did not recognise any expected credit losses on term deposits for the current reporting period ended 30 June 2019 (2018: Nil impairment under AASB 139).
The State has recognised expected credit losses for advances paid in the General Government Sector and Total State Sector to the value of $4.0 million (2018: $1.0 million under AASB 139). Lifetime expected credit losses has been recognised for advances provided given increases in credit risk since initial recognition. This assessment has been performed based on reviews of actual and expected changes in external market indicators, internal factors and debtor-specific information.
The maximum exposure at the end of the reporting period for interest bearing securities is the fair value carrying amount of the investments.
Derivatives
The majority of derivative financial assets of the State are entered with banking and financial institution counterparties, which are predominately rated AA- to A+, based on Standard and Poor’s ratings categories.
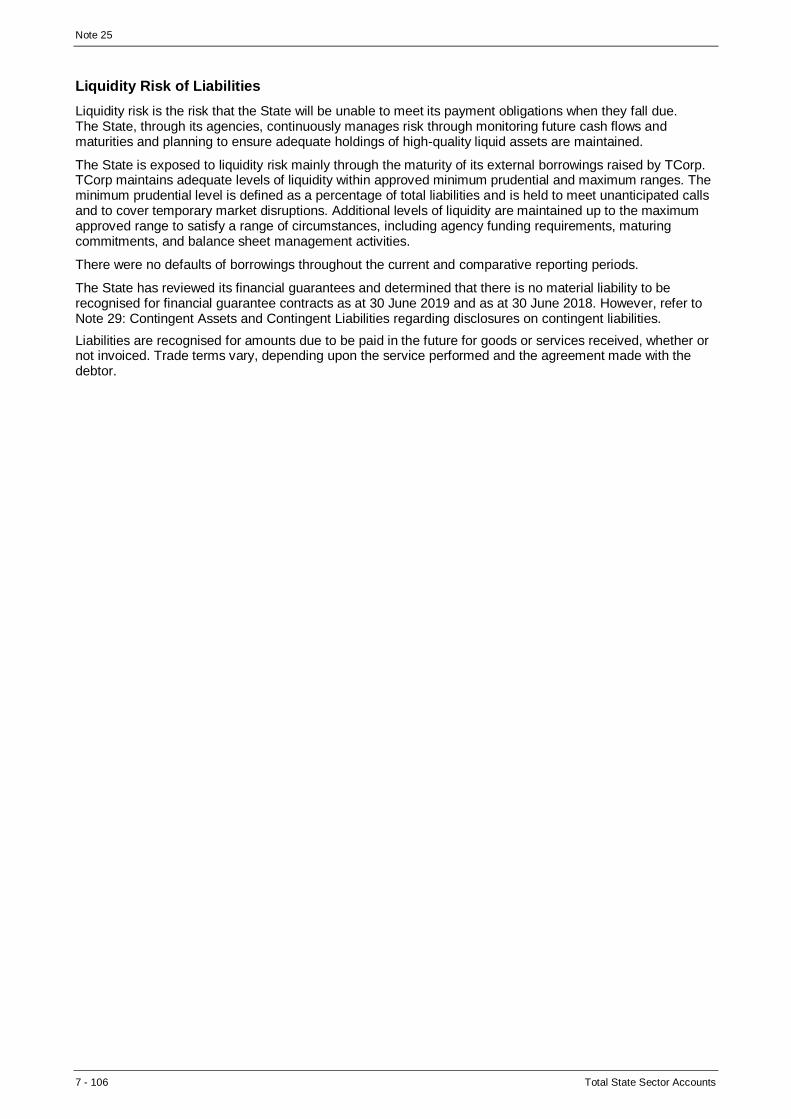
Note 25
7 - 106 Total State Sector Accounts
Liquidity Risk of Liabilities
Liquidity risk is the risk that the State will be unable to meet its payment obligations when they fall due. The State, through its agencies, continuously manages risk through monitoring future cash flows and maturities and planning to ensure adequate holdings of high-quality liquid assets are maintained.
The State is exposed to liquidity risk mainly through the maturity of its external borrowings raised by TCorp. TCorp maintains adequate levels of liquidity within approved minimum prudential and maximum ranges. The minimum prudential level is defined as a percentage of total liabilities and is held to meet unanticipated calls and to cover temporary market disruptions. Additional levels of liquidity are maintained up to the maximum approved range to satisfy a range of circumstances, including agency funding requirements, maturing commitments, and balance sheet management activities.
There were no defaults of borrowings throughout the current and comparative reporting periods.
The State has reviewed its financial guarantees and determined that there is no material liability to be recognised for financial guarantee contracts as at 30 June 2019 and as at 30 June 2018. However, refer to Note 29: Contingent Assets and Contingent Liabilities regarding disclosures on contingent liabilities.
Liabilities are recognised for amounts due to be paid in the future for goods or services received, whether or not invoiced. Trade terms vary, depending upon the service performed and the agreement made with the debtor.

Note 25
Total State Sector Accounts 7 - 107
Maturity Analysis of Financial Liabilities
The table below summarises the maturity profile of the State’s financial liabilities prepared using contractual undiscounted cash flows. This comprises loan commitments which include both borrowings at face value and future interest commitments.
General Government Sector
Contract maturity: Nominal Amount(a)
Carrying Amount 30 June 2019 1 year or less 1 to 5 years Over 5 years
Note 2019 2019 2019 2019 2019 $m $m $m $m $m
Contractual Maturities of Financial Liabilities
Non-Derivatives Deposits Held 17 67 ... ... 67 67
Payables(b) 18 6,867 ... ... 6,867 6,867
Advances Received 110 296 654 1,060 756
Borrowings Other Borrowings at Amortised Cost 20 1,696 12,242 27,751 41,689 33,233
Finance Leases 20 448 1,589 3,020 5,057 2,590
Financial Liability arising from Public Private Partnership (PPP) 20 196 793 2,016 3,005 1,834
Total Non-Derivatives 9,383 14,919 33,441 57,744 45,346
Derivatives Derivative Liabilities(c) Held for Trading 19 17 51 201 269 207
Total Derivatives 17 51 201 269 207
Contract maturity: Nominal Amount(a)
Carrying Amount 30 June 2018 1 year or less 1 to 5 years Over 5 years
2018 2018 2018 2018 2018 $m $m $m $m $m
Contractual Maturities of Financial Liabilities
Non-Derivatives Deposits Held 17 130 ... ... 130 130
Payables(b)(d) 18 7,023 4 ... 7,027 7,027
Advances Received 72 315 737 1,124 797
Borrowings Other Borrowings at Amortised Cost 20 1,656 12,978 23,182 37,815 29,457
Finance Leases 20 933 1,592 3,099 5,624 2,984
Total Non-Derivatives 9,813 14,890 27,017 51,721 40,395
Derivatives Derivative Liabilities(c) Held for Trading 19 ... ... ... ... 0
Designated and Effective Hedging Instruments 19 0 2 ... 2 2
Total Derivatives 0 2 ... 2 2
(a) The amounts disclosed are the contractual undiscounted cash flows of each class of financial liabilities and therefore will not reconcile to the Statement of Financial Position, which is based on fair value or amortised cost. The balances presented here include gross finance lease obligations, contractual amounts to be exchanged in a derivative financial instrument for which gross cash flows are exchanged, and gross loan commitments, i.e. borrowings at face value plus future interest commitments.
(b) Excludes statutory payables (i.e. not within the scope of AASB 7). (c) The contractual maturity analysis and liquidity risk of derivative liabilities is the best approximation derived from reasonable estimates that
were calculated from information sourced from major NSW agencies. These balances include estimated interest payments and exclude the impact of offsetting arrangements.
(d) Payables of $129 million for the General Government Sector were reclassified from Contractual Payables to Statutory Payables for 2017-18. The 2017-18 reported Contractual Payables contractual maturities of $7,155 million have been revised and reduced by $129 million to $7,027 million after subsequent issue of the 2017-18 Total State Sector Report.

Note 25
7 - 108 Total State Sector Accounts
Total State Sector
Contract maturity: Nominal Amount(a)
Carrying Amount 30 June 2019 1 year or less 1 to 5 years Over 5 years
2019 2019 2019 2019 2019 $m $m $m $m $m
Contractual Maturities of Financial Liabilities
Non-Derivatives Deposits Held 17 293 0 0 293 293
Payables(b) 18 8,123 ... ... 8,123 8,123
Advances Received 110 296 654 1,060 756
Borrowings Bonds and Other Borrowings Issued By TCorp 19 11,636 22,677 44,084 78,396 71,777
Other Borrowings at Amortised Cost 20 6 18 8 32 31
Finance Leases 20 736 2,735 8,591 12,063 5,287
Financial Liability arising from Public Private Partnership (PPP) 20 196 793 2,016 3,005 1,834
Other Liabilities
Interests in TCorpIM Funds of Investors Not Controlled by the State 24 10,289 ... ... 10,289 10,289
Total Non-Derivatives 31,388 26,519 55,353 113,261 98,389
Derivatives Derivative Liabilities(c)(d) Held for Trading 19 310 808 807 1,925 977
Designated and Effective Hedging Instruments 19 43 14 ... 58 3
Total Derivatives 353 823 807 1,982 980
Contract maturity: Nominal Amount(a)
Carrying Amount 30 June 2018 1 year or less 1 to 5 years Over 5 years
2018 2018 2018 2018 2018 $m $m $m $m $m
Contractual Maturities of Financial Liabilities
Non-Derivatives Deposits Held 17 385 0 0 385 385
Payables(b)(e) 18 8,540 32 ... 8,572 8,572
Advances Received 72 315 737 1,124 797
Borrowings Bonds and Other Borrowings Issued By TCorp 19 10,821 28,260 32,039 71,120 62,039
Other Borrowings at Amortised Cost and Fair Value 19 & 20 0 2,187 1,758 3,945 3,288
Finance Leases 20 720 2,731 8,964 12,415 5,302
Other Liabilities Interests in TCorpIM Funds of Investors
Not Controlled by the State 24 9,661 ... ... 9,661 9,661
Total Non-Derivatives 30,200 33,526 43,498 107,222 90,043
Derivatives Derivative Liabilities(c)(d) Held for Trading 19 386 807 757 1,950 538
Designated and Effective Hedging Instruments 19 63 106 10 179 126
Total Derivatives 449 913 768 2,130 665
(a) Refer to footnote in General Government Sector table above. (b) Refer to footnote in General Government Sector table above. (c) Refer to footnote in General Government Sector table above. (d) Total State Sector derivative liabilities have corresponding contractual undiscounted cash inflows of $1,921 million (2018: $1,724 million). (e) Payables of $129 million for the Total State Sector were reclassified from Contractual Payables to Statutory Payables for 2017-18. The
2017-18 reported Contractual Payables contractual maturities of $8,701 million have been revised and reduced by $129 million to $8,572 million after subsequent issue of the 2017-18 Total State Sector Report.

Note 25
Total State Sector Accounts 7 - 109
Market Risk
Market risk is the risk that the fair value or future cash flows of a financial instrument will fluctuate because of changes in market prices. The State’s exposures to market risk are primarily through:
• interest rate risk on the State’s borrowings and investments
• price risks associated with the movement in price of TCorpIM Funds, managed fund investments, and
equity instruments; and
• foreign exchange risk that could affect borrowings, investments and the value of overseas purchases.
The State does not have material exposures to commodity price risk.
For market risk, the effect on the ‘operating result’ and ‘net worth’ to a reasonably possible change in a risk variable is outlined in the information below. A reasonably possible change in a risk variable has been determined after taking into account the economic environment in which the State operates and the time frame for the assessment (i.e. until the end of the next annual reporting period). The sensitivity analysis is based on risk exposures in existence at the reporting date.
Interest Rate Risk
Interest rate risk is the risk that the fair value or future cash flows of a financial instrument will fluctuate because of changes in market interest rates. Exposure to interest rate risk arises primarily through the State’s interest-bearing assets and liabilities including interest bearing securities and borrowings.
Total State Sector – TCorp Debt Funding Holdings in Interest Bearing Securities and Borrowings
TCorp manages the debt portfolio for most of the agencies of the State. TCorp measures its exposure to interest rate risk in terms of cash flows or notional cash flows generated from holdings in interest bearing securities (Note 8) and borrowings at fair value (Note 19). The boundaries within which interest rate risk is undertaken and managed are established under approved TCorp policies, management guidelines and client defined mandates. Derivatives are also employed by TCorp to manage interest rate risk for interest bearing assets and liabilities.
TCorp employs a Value at Risk (VaR) model to measure the market risk exposures of TCorp borrowings and investments in the Statement of Financial Position. VaR is calculated daily and represents an estimate of the loss that can be expected over a 10-day period, with a one per cent probability that this amount may be exceeded. Given TCorp’s financial position at 30 June 2019, the maximum potential loss for the Total State Sector expected over a 10-day period is $7.4 million (2018: $6.0 million), with a one per cent probability that this maximum may be exceeded. The average VaR over the year ended 30 June 2019 was $4.9 million (2018: $7.5 million).
Total State Sector – TCorpIM Fund Trust Investments in Interest Bearing Securities
The Total State Sector is exposed to interest rate risk through TCorpIM Fund Trust investments in interest bearing securities (Note 8). Interest rate risk exposures arising from these investments are primarily measured and managed using duration and mandated limits specified in investment agreements.
The Total State Sector’s exposure to interest rate risk arising from these investments is set out in the tables below. A reasonably possible change of +/- 0.3 per cent is used, consistent with current trends in interest rates. The basis will be reviewed annually and amended where there is a structural change in the level of interest rate volatility.
Total State Sector
Total State Sector
2019 2018 -0.3% 0.3% -0.3% 0.3%
$m $m $m $m
Operating Result (132) 132 (86) 86
Net Worth (132) 132 (86) 86
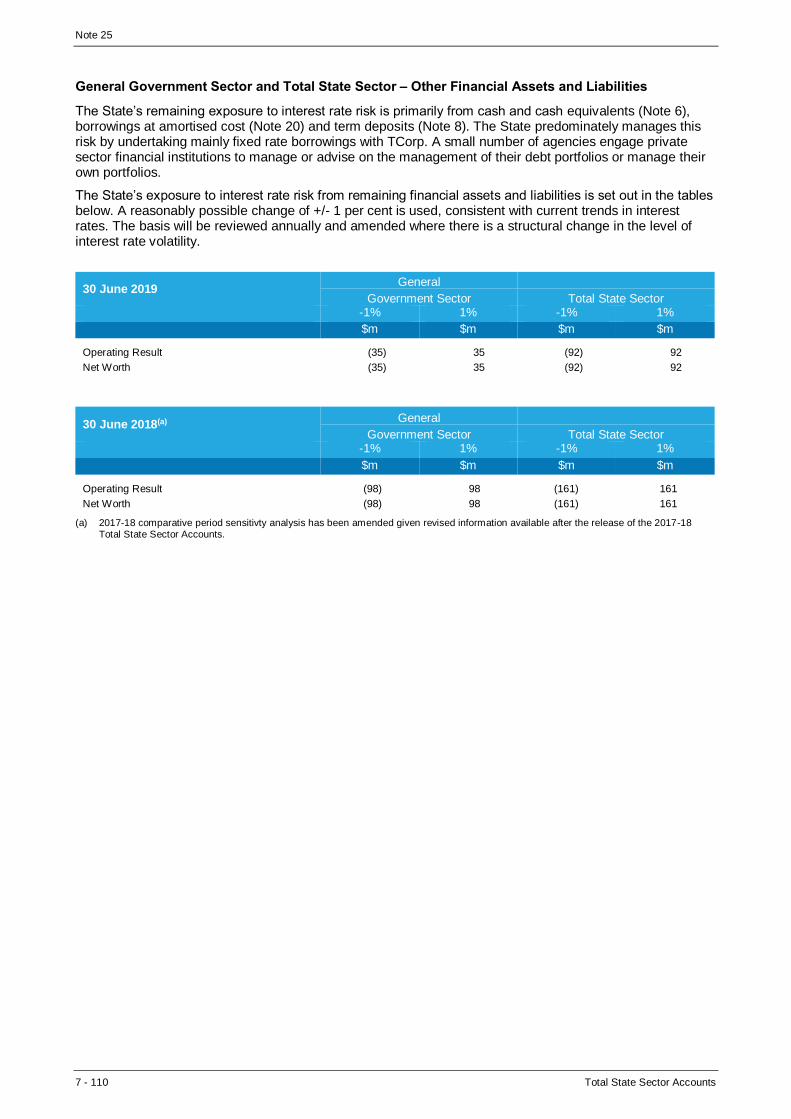
Note 25
7 - 110 Total State Sector Accounts
General Government Sector and Total State Sector – Other Financial Assets and Liabilities
The State’s remaining exposure to interest rate risk is primarily from cash and cash equivalents (Note 6), borrowings at amortised cost (Note 20) and term deposits (Note 8). The State predominately manages this risk by undertaking mainly fixed rate borrowings with TCorp. A small number of agencies engage private sector financial institutions to manage or advise on the management of their debt portfolios or manage their own portfolios.
The State’s exposure to interest rate risk from remaining financial assets and liabilities is set out in the tables below. A reasonably possible change of +/- 1 per cent is used, consistent with current trends in interest rates. The basis will be reviewed annually and amended where there is a structural change in the level of interest rate volatility.
30 June 2019 General
Government Sector Total State Sector -1% 1% -1% 1%
$m $m $m $m
Operating Result (35) 35 (92) 92
Net Worth (35) 35 (92) 92
30 June 2018(a) General
Government Sector Total State Sector -1% 1% -1% 1%
$m $m $m $m
Operating Result (98) 98 (161) 161
Net Worth (98) 98 (161) 161
(a) 2017-18 comparative period sensitivty analysis has been amended given revised information available after the release of the 2017-18 Total State Sector Accounts.
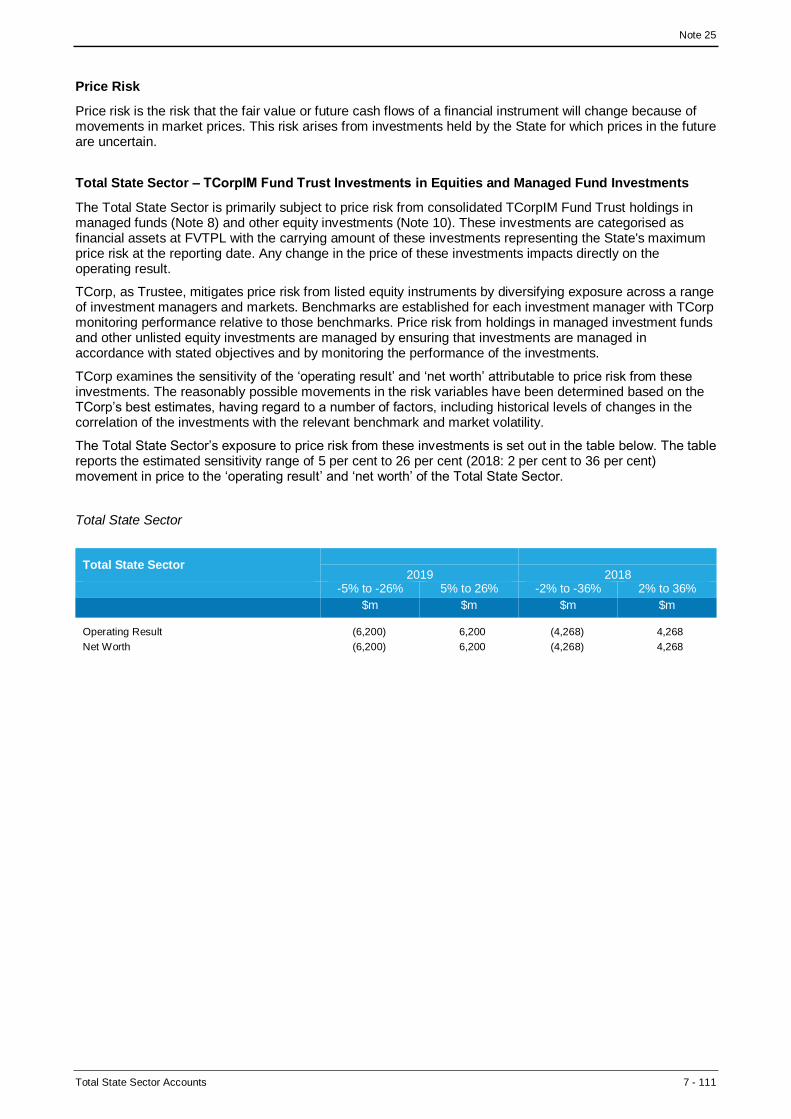
Note 25
Total State Sector Accounts 7 - 111
Price Risk
Price risk is the risk that the fair value or future cash flows of a financial instrument will change because of movements in market prices. This risk arises from investments held by the State for which prices in the future are uncertain.
Total State Sector – TCorpIM Fund Trust Investments in Equities and Managed Fund Investments
The Total State Sector is primarily subject to price risk from consolidated TCorpIM Fund Trust holdings in managed funds (Note 8) and other equity investments (Note 10). These investments are categorised as financial assets at FVTPL with the carrying amount of these investments representing the State's maximum price risk at the reporting date. Any change in the price of these investments impacts directly on the operating result.
TCorp, as Trustee, mitigates price risk from listed equity instruments by diversifying exposure across a range of investment managers and markets. Benchmarks are established for each investment manager with TCorp monitoring performance relative to those benchmarks. Price risk from holdings in managed investment funds and other unlisted equity investments are managed by ensuring that investments are managed in accordance with stated objectives and by monitoring the performance of the investments.
TCorp examines the sensitivity of the ‘operating result’ and ‘net worth’ attributable to price risk from these investments. The reasonably possible movements in the risk variables have been determined based on the TCorp’s best estimates, having regard to a number of factors, including historical levels of changes in the correlation of the investments with the relevant benchmark and market volatility.
The Total State Sector’s exposure to price risk from these investments is set out in the table below. The table reports the estimated sensitivity range of 5 per cent to 26 per cent (2018: 2 per cent to 36 per cent) movement in price to the ‘operating result’ and ‘net worth’ of the Total State Sector.
Total State Sector
Total State Sector
2019 2018 -5% to -26% 5% to 26% -2% to -36% 2% to 36%
$m $m $m $m
Operating Result (6,200) 6,200 (4,268) 4,268
Net Worth (6,200) 6,200 (4,268) 4,268

Note 25
7 - 112 Total State Sector Accounts
General Government Sector – Unit Holdings in TCorpIM Funds
The General Government Sector is primarily exposed to price risk through its unit holdings in TCorpIM Fund Trusts (Note 8). Investments in TCorpIM Funds are held for strategic rather than trading purposes. The funds comprise a series of managed funds which are subject to volatility in their unit prices. Each fund comprises a different underlying type of investment, with associated risks and investment horizons.
TCorpIM Fund investments held by agencies operating in the Total State Sector are eliminated on consolidation of the sector.
The General Government Sector holds units in the following TCorpIM Funds trusts:
General
Government Sector
2019 2018 Trust Investment Sectors Investment Horizon $m $m
Cash Fund Cash, money market instruments Up to 1.5 years 282 437
Short Term Income Fund(a) Cash, money market instruments 1.5 years to 3 years 191 26
Medium Term Growth Fund Cash, money market instruments, Australian and International bonds, listed property,
Australian shares
3 years to 7 years 290 282
Long Term Growth Fund Cash, money market instruments, Australian
and international bonds, listed property, Australian shares
7 years and over 1,116 1,005
Insurers' Guarantee Fund Investment
Trust
Cash, money market instruments, Australian
and international bonds, listed property, Australian shares
7 years and over 206 195
Treasury Managed Fund Investment Portfolio
Cash, money market instruments, Australian bonds, listed and unlisted property,
Australian, international and emerging market shares
Long Term 8,393 7,937
ICNSW Australian Equities Fund Listed Australian equities 5 years and over 113 115
ICNSW International Equities Fund Listed Global (ex Australia) equities 5 years and over 138 140
ICNSW International Equities Hedged Fund
Listed Global (ex Australia) equities, FX contracts
5 years and over 52 47
Emerging Market Shares Fund Emerging market shares 5 years and over 63 58
Unlisted Property Sector Retail, office and industrial property assets 10 years and over 122 135
Unlisted Infrastructure Fund Unlisted Managed Investment Funds 10 years and over 65 62
NSW Infrastructure Future Fund Cash, Australian shares, International shares, emerging market equities, Australian bonds
and investment grade credit
10 years and over 18,277 19,447
Long Service Corporation Investment
Facility Trust
Cash, money market instruments, Australian
bonds, listed bonds, listed property, Australian and International shares
7 years and over 1,513 1,327
Alternatives Risk Premium Fund Listed Australian and Global equities,
Australian and International bonds, currencies, commodities, derivatives
5 years and over 35 35
Social and Affordable Housing Fund Investment Trust
Cash, Australian shares, International shares, emerging market equities, Australian bonds
and investment grade credit
5 years and over 1,217 1,084
Cyclical Growth Australian Share Fund Listed Australian Equities 5 years and over 77 74
Cyclical Growth International Share Fund Listed Global (ex Australia) equities 5 years and over 69 63
Bank Loan Fund Global bank loans 5 years and over 37 36
Emerging Market Debt Fund Emerging market government and corporate
bonds 5 years and over 52 47
NSW Generations (Debt Retirement)
Fund Investment Trust
Cash, Australian shares, International shares,
emerging market equities, Australian bonds and investment grade credit
10 years and over 10,884 ...
Absolute Return Multi Asset Class Fund Cash, money market instruments, Australian
and International bonds, listed property, Australian shares
5 years and over 36 ...
Liquidity Cash Fund Cash, money market instruments and Australian bonds
Up to 1.5 years 20 ...
Small Cap Australian Share Fund Listed Australian equities 5 years and over 14 ...
GGS Total TCorpIM Funds(b) 43,263 32,553
(a) The TCorpIM Short Term Income Fund was previously named the TCorpIM Strategic Cash Fund in the comparative reporting period ended 30 June 2018.
(b) The General Government Sector unit holdings in TCorpIM Funds of $43.3 billion (2018: $32.6 billion) comprises of TCorpIM Cash Funds of $279 million (2018: $298 million) presented in Note 6: Cash and Cash Equivalents and $43.3 billion (2018: $32.3 billion) of TCorpIM Fund investments disclosed as part of Financial Assets at Fair Value included in Note 8: Investments, Loans and Placements.

Note 25
Total State Sector Accounts 7 - 113
TCorpIM investment facilities are mandatorily measured at FVTPL by the General Government Sector (2018: Designated at FVTPL under AASB 139) and therefore any change in unit price impacts directly on the operating result. The unit price of each trust is equal to the total fair value of the net assets held by the trust divided by the number of units on issue for that trust. Unit prices are calculated and published daily.
TCorp as trustee for each of the above facilities is required to act in the best interest of the unit holders and to administer the trusts in accordance with the trust deeds. As trustee, TCorp has appointed external managers to manage the performance and risks of each facility in accordance with a mandate agreed by the parties. TCorp has also leveraged off internal expertise to manage certain fixed income assets for the TCorpIM Funds facilities. A significant portion of the administration of the facilities is outsourced to an external custodian.
Investment in the TCorpIM Funds limits the State’s exposure to risk, as it allows diversification across a pool of funds with different investment horizons and a mix of investments.
The following table provides sensitivity analysis information for each of the TCorpIM investment trusts, using historically based volatility information collected over a 10-year period, quoted at two standard deviations (i.e. 95 per cent probability).
A reasonably possible change is based on the percentage change in unit price (as advised by TCorp) multiplied by the redemption value at 30 June each year for each trust.
Price Risk Sensitivity Analysis of the TCorpIM Funds
Change in Unit Change in Unit General
Price Price Government Sector
Trust 2019 2018(a) 2019 2018 $m $m
Cash Fund +/-1.0% +/-1.0% 3 4
Short Term Income Fund(b) +/-1.0% +/-1.0% 2 0
Medium Term Growth Fund +/-6.0% +/-6.0% 17 17
Long Term Growth Fund +/-14.0% +/-15.0% 156 151
Insurers' Guarantee Fund Investment Trust +/-8.0% +/-8.0% 17 16
Treasury Managed Fund Investment Portfolio +/-15.0% +/-16.0% 1,259 1,270
ICNSW Australian Equities Fund +/-19.0% +/-17.0% 21 20
ICNSW International Equities Fund +/-19.0% +/-16.0% 26 22
ICNSW International Equities Hedged Fund +/-24.0% +/-13.0% 12 6
Emerging Market Shares Fund +/-19.0% +/-18.0% 12 10
Unlisted Property Sector +/-6.0% +/-5.0% 7 7
Unlisted Infrastructure Fund +/-9.0% +/-9.0% 6 6
NSW Infrastructure Future Fund +/-6.0% +/-4.0% 1,097 778
Long Service Corporation Investment Facility Trust +/-13.0% +/-14.0% 197 186
Alternatives Risk Premium Fund +/-7.0% +/-6.0% 2 2
Social and Affordable Housing Fund Investment Trust +/-12.0% +/-7.0% 146 76
Cyclical Growth Australian Share Fund +/-20.0% +/-17.0% 15 13
Cyclical Growth International Share Fund +/-26.0% +/-15.0% 18 9
Bank Loan Fund +/-6.0% +/-2.0% 2 1
Emerging Market Debt Fund +/-15.0% +/-13.0% 8 6
NSW Generations (Debt Retirement) Fund Investment Trust +/-15.0% - 1,633 ...
Absolute Return Multi Asset Class Fund +/-5.0% - 2 ...
Liquidity Cash Fund +/-1.0% - 0 ...
Small Cap Australian Share Fund +/-24.0% - 3 ...
Total 4,662 2,599
(a) Sensitivity percentages for the comparative period ended 30 June 2018 have been revised by the Trustee for selected TCorpIM Funds. (b) The TCorpIM Short Term Income Fund was previously named the TCorpIM Strategic Cash Fund in the comparative reporting peri od ended
30 June 2018.
The table above shows that the General Government Sector’s dollar exposure to TCorpIM Fund price risk can be relatively significant, particularly for its holdings in the Long-Term Growth Fund, Treasury Managed Fund Facilities, NSW Infrastructure Future Fund, NSW Generations Debt Retirement Fund Investment Trust and Long Service Corporation Investment Facility Trust. These funds are underpinned by heavier weightings in share and property growth assets. It should be expected that, while there can be short-term volatility in annual returns, they will return higher long term returns than the Cash or Short Term Income Fund. In particular, the Treasury Managed Fund investments are held beyond the short-term to reflect the longer-term payment horizon for insurance claims, which can extend beyond a few years.

Note 25
7 - 114 Total State Sector Accounts
Foreign Exchange Risk
The State undertakes transactions denominated in foreign currencies which result in exposures to changes in foreign exchange rates. The State, through its consolidated agencies, has policies and procedures in place and utilises foreign exchange derivatives to minimise foreign exchange risk.
Total State Sector - Securities Denominated in Foreign Currencies
The Total State Sector is exposed to foreign exchange risk through monetary securities denominated in foreign currencies held by TCorpIM Fund Trusts. Foreign exchange risk arises as the value of these securities fluctuate when foreign exchange rates change.
TCorp, as trustee, examines the possible effects of movements in exchange rates against the Australian dollar on the financial position as at the reporting date. The most probable changes in the foreign exchange variables have been selected based on estimations, considering historical changes in the correlation of the Fund’s investments with the relevant benchmark and market volatility.
The Total State Sector’s exposure to foreign exchange risk from these financial assets and liabilities is set out in the table below. The table reports the estimated sensitivity range of 8 per cent movement in exchange rates to the ‘operating result’ and ‘net worth’ of the Total State Sector.
Total State Sector
Total State Sector
2019 2018 -8% 8% -8% 8%
$m $m $m $m
Operating Result (26) 26 (24) 24
Net Worth (26) 26 (24) 24
Total State Sector - Borrowings at Fair Value
The Total State Sector is exposed to foreign exchange risk through TCorp borrowings issued in foreign currencies and overseas markets undertaken as part of the funding program of the State’s debt.
Foreign exchange risk is managed by TCorp by entering into Australian dollar cross-currency swaps and forward foreign exchange contracts. Forward foreign exchange contracts with clients are covered by corresponding forward exchange contracts with market counterparties.

Note 25
Total State Sector Accounts 7 - 115
Other Purchase and Sale Commitments
State agencies enter into forward foreign exchange contracts to hedge certain purchase and sale commitments entered in the normal course of business. These contracts cover the purchase of capital equipment and supplies. The following table summarises foreign currency contract cash flows outstanding in Australian dollars for the State at the reporting date.
General
Government Sector Total State Sector
2019 2018(a) 2019 2018(a)
Currency Contract Value
AUD ($m) Contract Value
AUD ($m) Contract Value
AUD ($m) Contract Value
AUD ($m)
Euro 148 26 160 31
Japanese Yen 0 ... 0 ...
British Pounds 0 ... 1 1
US Dollars 9 1 31 20
Indian Rupees 212 0 212 0
Chinese Yuan 90 0 90 0
Total 460 28 495 53
(a) Table values were presented in foreign currency denomination amounts in the 2017-18 Total State Sector Report. The 2017-18 comparative amounts included in the table above have been converted into Australian dollar amounts for the 2018-19 Total State Sector Report.
This foreign currency risk is not considered to be material in terms of a possible impact on the operating result and total net worth and, as such, a sensitivity analysis has not been completed.
1 July 2018 Transition Impacts of Adopting AASB 9 Financial Instruments
The effect of adopting AASB 9 on the Statement of Financial Position (increase/(decrease)) as at 1 July 2018 is set out below:
General Government Sector Total State Sector
Note $m $m
Assets Receivables 7 (7) (7)
Advances Paid 9 (3) (3)
Total Adjustment to Net Assets (10) (10)
Accumulated Funds 14 (1)
FVOCI Reserve 85,573 148
Available for Sale Reserve (85,597) (157)
Total Adjustment to Total Net Worth (10) (10)

Note 25
7 - 116 Total State Sector Accounts
Classification and Measurement of Financial Instruments
On 1 July 2018 (the date of initial application of AASB 9), the State has assessed which business models apply to financial assets held by the State and has classified its financial instruments into the appropriate AASB 9 categories. The main effects resulting from this reclassification on the financial assets of the State are as follows:
General Government Sector
FVTPL(a)
Fair Value - Hedging
Instrument(b)
Equity Instrument - FVOCI(c)
Available For Sale(d)
Amortised Cost (formerly Loans
and Receivable)(e) $m $m $m $m $m
Closing Balance 30 June 2018 - AASB 139 32,577 1 ... 113,633 15,924
Reclassification Adjustments in Relation to
Adopting AASB 9 Other Equity Investments ... ... 722 (722) ...
Investments in Other Public Sector Entities 3,411 ... 109,500 (112,911) ...
Recognition of AASB 9 Expected Credit Losses ... ... ... ... (10)
Opening Balance 1 July 2018 - AASB 9 35,988 1 110,222 0 15,915
(a) Financial Assets at FVTPL category includes Interest Bearing Securities, TCorpIM Funds, Managed Funds and Other Investments, Equity Investments in Other Public Sector Entities, Other Equity Investments and Derivatives Held for Trading.
(b) Fair Value - Hedging Instrument category includes Derivatives Held for Hedging Purposes. (c) Equity Instrument – FVOCI category includes Equity Investments in Other Public Sector Entities and Other Equity Investments. (d) Available for Sale category includes Equity Investments in Other Public Sector Entities and Other Equity Investments. (e) Financial Assets at Amortised Cost category includes Cash and Cash Equivalents, Receivables (excluding Statutory Receivables),
Advances Paid, Term Deposits, Finance Leases Receivable, and Other Financial Assets - Other.
Total State Sector
FVTPL(a)(b)
Fair Value - Hedging
Instrument(c)
Equity Instrument -
FVOCI(d) Available For
Sale(e)
Amortised Cost (formerly
Loans and Receivable)(f)
$m $m $m $m $m
Closing Balance 30 June 2018 - AASB 139 57,167 6 ... 889 22,954
Reclassification Adjustments in Relation to Adopting AASB 9 Other Equity Investments 167 ... 722 (889) ...
Recognition of AASB 9 Expected Credit Losses ... ... ... ... (10)
Opening Balance 1 July 2018 - AASB 9 57,334 6 722 ... 22,944
(a) Financial Assets at FVTPL category includes Interest Bearing Securities, Managed Funds and Other Investments, Other Equity Investments and Derivatives Held for Trading.
(b) TCorp has reassessed its holdings of Reverse Repurchase Agreements which has resulted in a reclassification of $1,002 million from Interest Bearing Securities, included as part of financial assets at fair value in Note 8: Investments, Loans and Placements, to Note 6: Cash and Cash Equivalents at 30 June 2018.
(c) Fair Value - Hedging Instrument category includes Derivatives Held for Hedging Purposes. (d) Equity Instrument – FVOCI category includes Other Equity Investments. (e) Available for Sale category includes Other Equity Investments. (f) Financial Assets at Amortised Cost category includes Cash and Cash Equivalents, Receivables (excluding Statutory Receivables),
Advances Paid, Term Deposits, Finance Leases Receivable, and Other Financial Assets - Other.

Note 25
Total State Sector Accounts 7 - 117
The impact of transition to AASB 9 on equity reserves and accumulated funds is, as follows:
General Government Sector
Effect on Accumulated
Funds Effect on
FVOCI Reserve
Effect on Available for Sale Reserve
Effect on Hedging Reserve
$m $m $m $m
Closing Balance 30 June 2018 - AASB 139 76,243 ... 85,597 (17)
Reclassification Adjustments in Relation to Adopting AASB 9 Other Equity Investments ... 148 (148) ...
Investments in Other Public Sector Entities 24 85,425 (85,449) ...
Remeasurement Impacts In Relation to Adopting AASB 9 ... ... ... ...
Recognition of AASB 9 Expected Credit Losses (10) ... ... ...
Opening Balance 1 July 2018 - AASB 9 76,257 85,573 ... (17)
Total State Sector
Effect on Accumulated
Funds Effect on
FVOCI Reserve
Effect on Available for Sale Reserve
Effect on Hedging Reserve
$m $m $m $m
Closing Balance 30 June 2018 - AASB 139 99,680 ... 157 (135)
Reclassification Adjustments in Relation to Adopting AASB 9 Other Equity Investments 9 148 (157) ...
Remeasurement Impacts In Relation to Adopting AASB 9 ... ... ... ...
Recognition of AASB 9 Expected Credit Losses (10) ... ... ...
Opening Balance 1 July 2018 - AASB 9 99,678 148 ... (135)

Note 25
7 - 118 Total State Sector Accounts
The nature of the above adjustments is described below.
Under AASB 9, subsequent measurement of debt financial assets is based on assessing the contractual cash flow characteristics of the debt instrument and the State’s business model for managing the instrument.
The assessment of the State’s business models was made as of the date of initial application, 1 July 2018. The assessment of whether contractual cash flows on debt instruments comprised of principal and interest was made based on the facts and circumstances as at the initial recognition of the assets.
The classification and measurement requirements of AASB 9 did not have a significant impact to the State. The State continued measuring at fair value, all financial assets previously held at fair value under AASB 139.
The following are the changes in the classification of the State’s financial assets:
• Cash and cash equivalents (Note 6), receivables (Note 7), advances paid (Note 9) and other financial
assets (including term deposits and finance leases receivable disclosed within Note 8) classified as
‘loans and receivables’ under AASB 139 as at 30 June 2018 are held to collect contractual cash flows
and represent solely payments of principal and interest. At 1 July 2018, these instruments are classified
as ‘financial assets at amortised cost’.
• Financial assets at FVTPL (Note 8), excluding derivatives, were managed and their performance
evaluated on a fair value basis and accordingly were designated at FVTPL under AASB 139 as at 30
June 2018. The business model of these instruments is neither to hold to collect contractual cash flows
or sell the financial asset. Hence, these investments are mandatorily required to be measured at FVTPL
under AASB 9. These investments going forward will be mandatorily classified under this category from
1 July 2018 onwards.
• Other equity investments (Note 10) totalling $722 million in the General Government Sector and $889
million in the Total State Sector were classified as available-for-sale financial assets under AASB 139 as
at 30 June 2018. These investments are required at the transition date of 1 July 2018 to be mandatorily
classified at FVTPL under AASB 9. The State has classified $167 million of other equity investments to
FVTPL in the Total State Sector. These investments going forward will be mandatorily classified under
this category from 1 July 2018 onwards. The State has made an irrevocable election at 1 July 2018
under AASB 9 to classify the remaining $722 million of other equity investments, in both the General
Government Sector and Total State Sector, at FVOCI. In accordance with AASB 9, the gains or losses of
these equity investments will continue to be recognised in ‘other economic flows – other comprehensive
income’ but will never be subsequently recycled to the ‘operating result’.
• Other equity investments (Note 10) of $19.53 billion were managed on a fair value basis and were
designated at FVTPL under AASB 139 as at 30 June 2018. These investments are now required at
transition date of 1 July 2018 to be mandatorily classified at FVTPL. These investments going forward
will be mandatorily classified under this category from 1 July 2018 onwards.
Financial liabilities that have been previously designated at FVTPL under AASB 139 have been reviewed and continue to be designated as such. There are no material changes in the classification and measurement for the State’s financial liabilities.
The $112.9 billion carrying amount for equity investments in other public sector entities (Note 10) was accounted for throughout the comparative period ended 30 June 2018 in a manner consistent with available-for-sale financial assets under AASB 139. Gains or losses were recognised in ‘other economic flows – other comprehensive income’ until disposed, at which time the cumulative gain or loss previously recognised in ‘other economic flows – other comprehensive income’ was recognised in ‘other economic flows – included in operating result’.
The State has made an irrevocable election at 1 July 2018 to measure $109.5 billion of equity investments in other public sector entities in a manner consistent with equity investments at FVOCI under AASB 9. These investments are held by the General Government Sector for long-term or policy purposes. Consistent with the requirements of AASB 9, gains or losses of these equity investments will continue to be recognised in ‘other economic flows – other comprehensive income’ but will never be subsequently recycled to the ‘operating result’. The remaining $3.41 billion carrying amount of these investments has been classified at FVTPL under AASB 9. These investments are held for trading purposes by the General Government Sector as at the 1 July 2018 transition date.

Note 25
Total State Sector Accounts 7 - 119
In summary, upon the adoption of AASB 9, the State had the following required or elected reclassifications as at 1 July 2018:
General Government Sector
Original Carrying
Amount under AASB 139
New Carrying Amount under
AASB 9 Difference
Note $m $m $m
Financial Assets AASB 139 Category AASB 9 Category Cash and Cash Equivalents Loans and Receivables
(Amortised Cost) Amortised Cost 6 5,417 5,417 ...
Receivables(a) Loans and Receivables (Amortised Cost)
Amortised Cost 7 3,934 3,926 (7)
Advances Paid Loans and Receivables (Amortised Cost)
Amortised Cost 9 1,017 1,014 (3)
Investments, Loans and Placements Financial Assets at Fair Value
Derivatives (Held for
Trading) FVTPL - Held for Trading Mandatorily at FVTPL 8 (0) (0) ...
Derivatives (Designated
Hedging Instrument)
Fair Value - Hedging
Instrument
Fair Value - Hedging
Instrument 8 1 1 ...
Interest Bearing Securities Designated at FVTPL Mandatorily at FVTPL 8 263 263 ...
TCorpIM Funds Designated at FVTPL Mandatorily at FVTPL 8 32,255 32,255 ...
Managed Funds and
Other Investments Designated at FVTPL Mandatorily at FVTPL 8 58 58 ...
Other Financial Assets
Term Deposits Loans and Receivables
(Amortised Cost) Amortised Cost 8 4,370 4,370 ...
Finance Leases Receivable Loans and Receivables
(Amortised Cost) Amortised Cost 8 981 981 ...
Other Loans and Receivables
(Amortised Cost) Amortised Cost 8 205 205 ...
Equity Investments in Other
Public Sector Entities Available for Sale Designated at FVOCI 10 112,911 109,500 (3,411)
Mandatorily at FVTPL 10 ... 3,411 3,411
Other Equity Investments Available for Sale Designated at FVOCI 10 722 722 ...
Financial Liabilities
Deposits Held Amortised Cost Amortised Cost 17 130 130 ...
Payables(b) Amortised Cost Amortised Cost 18 7,027 7,027 ...
Advances Amortised Cost Amortised Cost
797 797 ...
Borrowings Designated at FVTPL Designated at FVTPL 19 3 3 ... Amortised Cost Amortised Cost 20 32,441 32,441 ...
Derivatives (Held for Trading) FVTPL - Held for Trading Mandatorily at FVTPL 19 0 0 ...
Derivatives (Designated Hedging Instrument)
Fair Value - Hedging Instrument
Fair Value - Hedging Instrument
19 2 2 ...
(a) Financial instrument disclosures exclude statutory receivables not within the scope of AASB 7. (b) Financial instrument disclosures exclude statutory payables not within the scope of AASB 7.

Note 25
7 - 120 Total State Sector Accounts
Total State Sector
Original Carrying
Amount under AASB 139
New Carrying Amount Under
AASB 9 Difference
Note
$m $m $m
Financial Assets
Original AASB 139
Category New AASB 9 Category Cash and Cash Equivalents Loans and Receivables
(Amortised Cost) Amortised Cost 6 13,969 13,969 ...
Receivables(a) Loans and Receivables (Amortised Cost)
Amortised Cost 7 3,885 3,878 (7)
Advances Paid Loans and Receivables (Amortised Cost)
Amortised Cost 9 644 640 (3)
Investments, Loans and Placements Financial Assets at Fair Value
Derivatives (Held for Trading) FVTPL - Held for Trading Mandatorily at FVTPL 8 551 551 ...
Derivatives (Designated
Hedging Instrument)
Fair Value - Hedging
Instrument
Fair Value - Hedging
Instrument 8 6 6 ...
Interest Bearing Securities Designated at FVTPL Mandatorily at FVTPL 8 29,806 29,806 ...
TCorpIM Funds Designated at FVTPL Mandatorily at FVTPL 8 7,280 7,280 ...
Other Financial Assets
Term Deposits Loans and Receivables
(Amortised Cost) Amortised Cost 8 2,840 2,840 ...
Finance Leases Receivable Loans and Receivables
(Amortised Cost) Amortised Cost 8 1,411 1,411 ...
Other Loans and Receivables
(Amortised Cost) Amortised Cost 8 205 205 ...
Other Equity Investments Available for Sale Designated at FVOCI 10 889 722 (167) Designated at FVTPL Mandatorily at FVTPL 10 19,531 19,697 167
Financial Liabilities
Deposits Held Designated at FVTPL Designated at FVTPL 17 164 164 ... Amortised Cost Amortised Cost 17 221 221 ...
Payables(b) Amortised Cost Amortised Cost 18 8,572 8,572 ...
Advances Amortised Cost Amortised Cost
797 797 ...
Borrowings Designated at FVTPL Designated at FVTPL 19 63,172 63,172 ... Amortised Cost Amortised Cost 20 7,457 7,457 ...
Derivatives (Held for Trading) FVTPL - Held for Trading Mandatorily at FVTPL 19 538 538 ...
Derivatives (Designated
Hedging Instrument)
Fair Value - Hedging
Instrument
Fair Value - Hedging
Instrument 19 126 126 ...
Other Liabilities
Interests in TCorpIM Funds of Investors Not Controlled by
the State
Designated at FVTPL Designated at FVTPL 24 9,661 9,661 ...
(a) Financial instrument disclosures exclude statutory receivables not within the scope of AASB 7. (b) Financial instrument disclosures exclude statutory payables not within the scope of AASB 7.
Impairment
The adoption of AASB 9 has changed the State’s accounting for impairment losses for financial assets by replacing AASB 139’s incurred loss approach with a forward-looking expected credit loss (ECL) approach. AASB 9 requires the State to recognise an allowance for ECLs for all debt investments not held at fair value through profit or loss.
Set out below is the reconciliation of the closing impairment allowances under AASB 139 to the opening loss allowances determined under AASB 9.

Note 25
Total State Sector Accounts 7 - 121
General Government Sector
Measurement Category Carrying Amount
AASB 139 AASB 9
Allowance for Impairment under AASB 139 as at 30 June 2018
Re- measurement
ECL under AASB 9 at 1 July 2018
Note $m $m $m
Financial Asset
Receivables(a) 6 Loans and Receivables Amortised Cost (161) (7) (168)
Advances Paid 9 Loans and Receivables Amortised Cost (1) (3) (4)
Total (162) (10) (173)
(a) Financial instrument disclosures exclude impairment on statutory receivables not within the scope of AASB 7.
Total State Sector
Measurement Category Carrying Amount
AASB 139 AASB 9
Allowance for Impairment under AASB
139 as at 30 June 2018
Re- measurement
ECL under AASB 9 at
1 July 2018
Note $m $m $m
Financial Asset
Receivables(a) 6 Loans and Receivables Amortised Cost (182) (7) (189)
Advances Paid 9 Loans and Receivables Amortised Cost (1) (3) (4)
Total (183) (10) (193)
(a) Financial instrument disclosures exclude impairment on statutory receivables not within the scope of AASB 7.

Note 26 and Note 27
7 - 122 Total State Sector Accounts
Note 26: Trusts Under Management
Trusts under management are held on behalf of beneficiaries and are not controlled by the State. Therefore, in principle, these trusts are not recognised as assets or liabilities on the Statement of Financial Position. However, $368 million (2018: $115 million) of these trust funds are invested in TCorpIM Funds.
As the State controls the TCorpIM Funds, the portion of these trusts that are invested in TCorpIM Funds are recognised as assets in the State accounts, while liabilities of the same amounts are also recognised to reflect the interest not controlled by the State, as trusts under management are not attributable, directly or indirectly, to the State.
General
Government Sector Total State Sector
2019 2018 2019 2018 $m $m $m $m
Trust Funds: (a) NSW Trustee and Guardian (b) 2,996 2,955 2,996 2,955
Rental Bond Board 1,623 1,523 1,623 1,523
State Insurance Regulatory Authority 1,305 1,298 1,305 1,298
NSW Treasury Corporation ... ... 969 1,243
Department of Industry 203 189 203 189
Biodiversity Conservation Trust of NSW 122 87 122 87
Department of Planning and Environment 63 67 63 67
Department of Finance, Services and Innovation 64 65 64 65
Other (c) 137 118 137 118
6,513 6,302 7,482 7,545
(a) There have been restatements of the 2018 balances to reflect revised information available after the release of the 2017-18 Total State Sector Accounts.
(b) The Trust balances exclude certain property assets administered by NSW Trustee and Guardian as they cannot be reliably measured. (c) 'Other' includes Ministry of Health, Department of Justice, NSW Police Force and Sydney Metro. Sydney Metro was established on 1 July
2018 and is therefore included for the first time in 2019.
Note 27: Finance and Operating Leases
A distinction is made between finance leases, which effectively transfer from the lessor to the lessee substantially all the risks and benefits incidental to ownership of the leased assets, and operating leases under which the lessor effectively retains substantially all such risks and benefits.
Finance Leases
Finance leases are recognised in the Statement of Financial Position by the lessee as assets and liabilities and measured initially at the fair value, or if lower at the present value, of the minimum lease payments. The leased asset is depreciated on a straight line basis over the shorter of the term of the lease and its useful life or, where it is likely that the entity will obtain ownership of the asset, the useful life of the asset to the entity. The finance lease liability is determined in accordance with AASB 117 Leases. Lease payments are allocated between the principal component of the lease liability and the interest expense.
The lessor in a finance lease initially recognises a lease receivable for an amount equal to the net investment in the lease, and subsequently recognises finance income based on a pattern reflecting a constant periodic rate of return on the net investment in the lease.
Long term leases of land are classified as finance leases receivable. This recognises that substantially all the risks and rewards incidental to ownership of the land are transferred to the lessee.
Operating Leases
Operating lease payments and receipts are recognised in the Statement of Comprehensive Income by the State, respectively as lessee and lessor, and are charged to the operating result on a straight lines basis over the term of the lease. Lease incentives received are recognised as an integral part of the total lease expense, over the term of the lease.
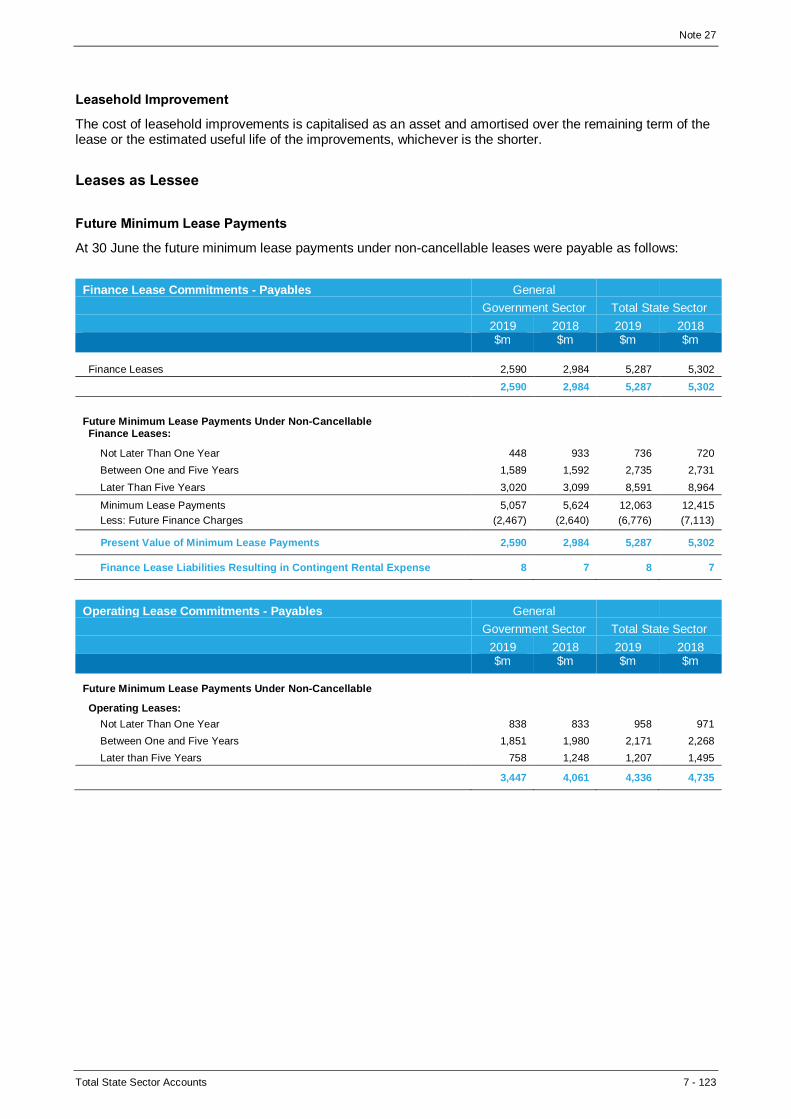
Note 27
Total State Sector Accounts 7 - 123
Leasehold Improvement
The cost of leasehold improvements is capitalised as an asset and amortised over the remaining term of the lease or the estimated useful life of the improvements, whichever is the shorter.
Leases as Lessee
Future Minimum Lease Payments
At 30 June the future minimum lease payments under non-cancellable leases were payable as follows:
Finance Lease Commitments - Payables General
Government Sector Total State Sector
2019 2018 2019 2018 $m $m $m $m
Finance Leases 2,590 2,984 5,287 5,302
2,590 2,984 5,287 5,302
Future Minimum Lease Payments Under Non-Cancellable Finance Leases:
Not Later Than One Year 448 933 736 720
Between One and Five Years 1,589 1,592 2,735 2,731
Later Than Five Years 3,020 3,099 8,591 8,964
Minimum Lease Payments 5,057 5,624 12,063 12,415
Less: Future Finance Charges (2,467) (2,640) (6,776) (7,113)
Present Value of Minimum Lease Payments 2,590 2,984 5,287 5,302
Finance Lease Liabilities Resulting in Contingent Rental Expense 8 7 8 7
Operating Lease Commitments - Payables General
Government Sector Total State Sector
2019 2018 2019 2018 $m $m $m $m
Future Minimum Lease Payments Under Non-Cancellable
Operating Leases: Not Later Than One Year 838 833 958 971
Between One and Five Years 1,851 1,980 2,171 2,268
Later than Five Years 758 1,248 1,207 1,495
3,447 4,061 4,336 4,735

Note 27
7 - 124 Total State Sector Accounts
Leases as Lessor
Future Minimum Lease Payments
At 30 June the future minimum lease payments under non-cancellable leases were receivable as follows:
Finance Lease Commitments - Receivables General
Government Sector Total State Sector
2019 2018 2019 2018 $m $m $m $m
Finance Leases 1,058 981 1,441 1,411
1,058 981 1,441 1,411
Future Minimum Lease Receipts Under Finance Leases are Receivable for each of the Following Periods: Not Later Than One Year 17 32 86 78
Between One and Five Years 566 519 602 602
Later Than Five Years 3,407 4,030 12,195 11,738
Gross Investment in the Lease 3,990 4,581 12,883 12,417
Less: Future Interest Revenues (2,932) (3,600) (11,442) (11,007)
Present Value of Minimum Lease Payments Receivable and Unguaranteed Residual Value
1,058 981 1,441 1,411
Finance Lease Receivables Resulted In:
Present value of the Unguaranteed Residual Values Accruing to Lessors Benefit 426 420 463 440
Contingent Rents Recognised as Income 2 1 2 4
Finance lease receivables includes a residual emerging interest in the port assets amounting to $232 million (2018: $217 million) in the General Government Sector and $329 million (2018: $307 million) in the Total State Sector and in the electricity network assets amounting to $209 million (2018: $115 million) in the General Government Sector and Total State Sector for 2018-19.
Operating Lease - Receivables General
Government Sector Total State Sector
2019 2018 2019 2018 $m $m $m $m
Future Operating Lease Rentals not Recognised in the Financial Statements and Receivable:
Not Later Than One Year 199 141 261 200
Later Than One Year and Not Later Than Five Years 528 397 666 503
Later Than Five Years 909 737 1,365 1,086
1,637 1,274 2,292 1,789

Note 28
Total State Sector Accounts 7 - 125
Note 28: Expenditure Commitments
The following information represents expenditure contracted for at the reporting date, but not recognised in the financial statements.
General
Government Sector Total State Sector
2019 2018 2019 2018 $m $m $m $m
Capital Expenditure (including expenditure for private sector financed infrastructure assets)
Roads and Maritime Services (a) 7,645 3,256 7,610 3,249
Sydney Metro (b) 7,068 ... 7,068 ...
Ministry of Health 2,363 2,137 2,363 2,137
Transport for NSW (c) 1,877 4,657 1,866 4,638
Department of Education (d) 1,593 713 1,593 713
Sydney Water Corporation ... ... 917 812
Infrastructure NSW (e) 802 ... 802 ...
Department of Justice 229 568 229 568
New South Wales Land and Housing Corporation ... ... 165 73
New South Wales Government Telecommunications Authority 114 104 114 104
Water NSW ... ... 112 280
NSW Police Force 100 91 100 91
Hunter Water Corporation ... ... 70 40
TAFE Commission (d) 59 92 59 92
Essential Energy ... ... 53 47
Zoological Parks Board of New South Wales ... ... 35 52
Sydney Opera House Trust ... ... 30 35
Venues NSW ... ... 3 174
West Connex Group ... ... ... 1,938
Department of Industry ... 52 ... 52
Other 118 77 171 137
21,968 11,747 23,360 15,232
Goods and Services Tax (GST) on Commitments (f)
GST input tax credits included in the above Capital Expenditure commitments: 1,997 1,068 2,109 1,385
1,997 1,068 2,109 1,385
Capital Expenditure Commitments:
Not later than one year 10,772 5,936 11,741 8,211
Later than one year and not later than five years 9,579 5,736 9,903 6,932
Later than five years 1,616 75 1,716 89
21,968 11,747 23,360 15,232
(a) Increase in the capital commitments as at 30 June 2019 reflects project activities for Rozelle Interchange and Western Harbour Tunnel during FY19. (b) Sydney Metro (previously in Transport) only began operations on 1 July 2018. The commitments relate to Metro capital projects - City & South West,
Northwest, Metro West and Greater West. This also includes a financial liability $1.834 billion (excluding GST) recognised under a PPP for future capital payments on assets constructed by the private sector in accordance with NSW Treasury Policy TPP 06-8 ‘Accounting for Privately Financed Projections’. Refer to Note 20: Borrowings at Amortised Cost.
(c) Transport for NSW reduction in capital commitments is due to separation of Sydney Metro $3.9 billion offset by increase due to Parramatta light rail Stage 1 project $1.3 billion.
(d) There have been restatements of the 2018 balances for Department of Education and TAFE to reflect revised information available after the release of the 2017-18 Total State Sector Accounts.
(e) Infrastructure NSW will be building a new Allianz stadium. (f) The above expenditure commitments are inclusive of GST except for NSW Land and Housing Corporation (LAHC). For LAHC they relate primarily to
properties used to provide rental accommodation, which are input taxed activity where GST cannot be claimed from the ATO. GST input tax credits (debits) are expected to be recoverable from (payable to) the Australian Taxation Office.

Note 29
7 - 126 Total State Sector Accounts
Note 29: Contingent Assets and Contingent Liabilities
Contingent assets and contingent liabilities are possible future assets or obligations that arise from past events and whose existence will be confirmed only by the occurrence or non-occurrence of one or more uncertain future events not wholly in the control of the State. In this note, contingent assets and liabilities have been classified into quantifiable (where its financial effect is able to be estimated) or non-quantifiable.
Guarantees are provided to facilitate the provision of certain services and the construction of several infrastructure assets may give rise to contingent liabilities.
Contingent Liabilities
Quantifiable Contingent Liabilities
General
Government Sector Total State Sector
2019 2018 2019 2018
$m $m $m $m
Roads Retained Interest Pty Ltd (a) 746 ... 746 ...
(Equity Commitment Deed)
Roads and Maritime Services (b) 789 892 789 892
(Land acquisitions, contractual disputes)
Department of Justice (c) 545 492 545 492
(Victims Support Scheme, Current Litigation)
Other Agencies 46 13 60 24
2,126 1,397 2,140 1,408
(a) The Corporation is a party to the Equity Commitment Deed with the WestConnex Group. There is currently no commitment or obligation to contribute to equity. Depending on the extent of the borrowings, and the future construction profile of the WestConnex Group, a call may be made on the Corporation for an equity contribution.
(b) The majority of this movement relates to outstanding litigation matters regarding large scale property acquisitions as part of various projects. (c) The Victims’ Support Scheme (VSS) was created on 3 June 2013 through legislation known as the Victims’ Rights and Support Act 2013.
The amount attributable under the VSS could reasonably lie within the range of $300 million to $525 million (2018: $282 million to $492 million).
Non-quantifiable Contingent Liabilities
Details are summarised below of the most significant contingent liabilities which are all fully disclosed in the accounts of individual agencies.
Unless otherwise stated, the General Government contingent liabilities are also applicable to the Total State Sector. Included in these are:
• The State has a contingent liability under the Native Title Act 1993 (Cth). The extent of the liability cannot
be quantified. The liability arises because:
– The State has an obligation to pay compensation to native title holders where they commit an action
that extinguishes the native title holder’s rights.
– During the 2018-19 year, 810,564 hectares (2017-18: 837,065 hectares) of operational timber
reserves were subject to claims. The State is not aware of any extinguishment of native title holder’s
rights.
• The assets of the State in the form of reserved Crown land may be reduced in value by operation of the
Aboriginal Land Rights Act 1983 (NSW). Applications may result in land being transferred for no
consideration. The State has approximately 35,855 Aboriginal Land Claims to review (2018: 33,452).
These applications have not been finalised and it is therefore not possible to estimate the financial
impact or result of the claims.
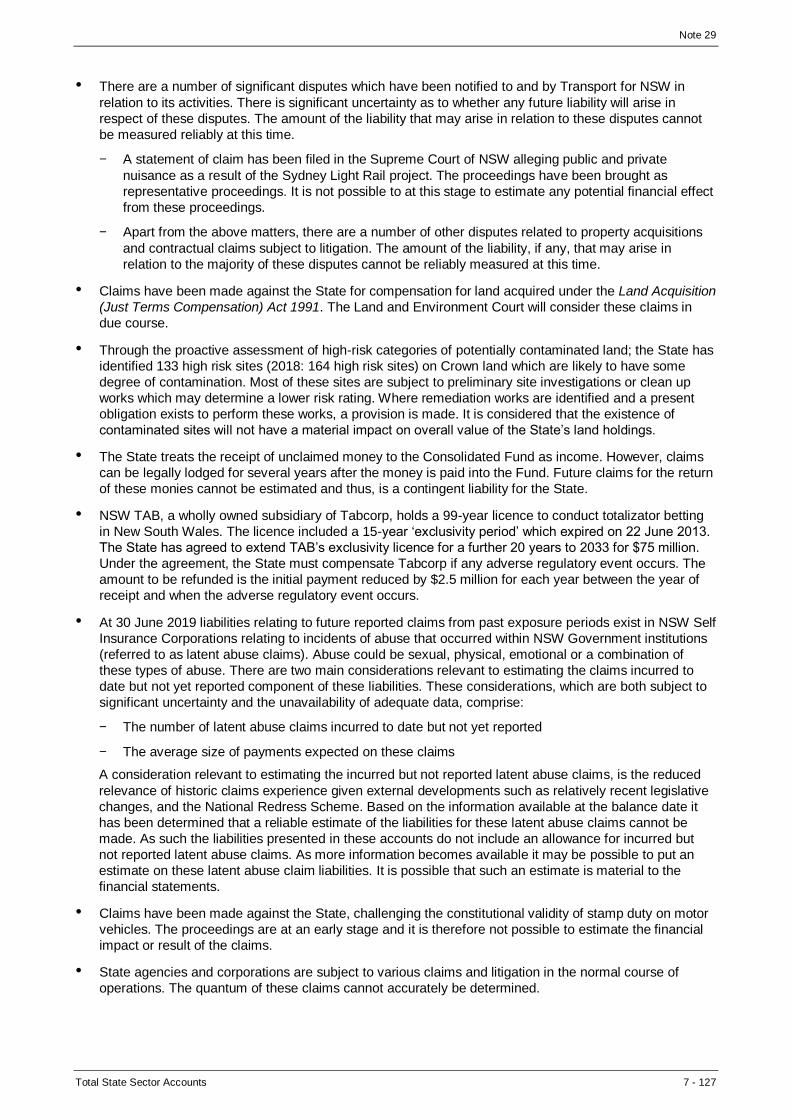
Note 29
Total State Sector Accounts 7 - 127
• There are a number of significant disputes which have been notified to and by Transport for NSW in
relation to its activities. There is significant uncertainty as to whether any future liability will arise in
respect of these disputes. The amount of the liability that may arise in relation to these disputes cannot
be measured reliably at this time.
– A statement of claim has been filed in the Supreme Court of NSW alleging public and private
nuisance as a result of the Sydney Light Rail project. The proceedings have been brought as
representative proceedings. It is not possible to at this stage to estimate any potential financial effect
from these proceedings.
– Apart from the above matters, there are a number of other disputes related to property acquisitions
and contractual claims subject to litigation. The amount of the liability, if any, that may arise in
relation to the majority of these disputes cannot be reliably measured at this time.
• Claims have been made against the State for compensation for land acquired under the Land Acquisition
(Just Terms Compensation) Act 1991. The Land and Environment Court will consider these claims in
due course.
• Through the proactive assessment of high-risk categories of potentially contaminated land; the State has
identified 133 high risk sites (2018: 164 high risk sites) on Crown land which are likely to have some
degree of contamination. Most of these sites are subject to preliminary site investigations or clean up
works which may determine a lower risk rating. Where remediation works are identified and a present
obligation exists to perform these works, a provision is made. It is considered that the existence of
contaminated sites will not have a material impact on overall value of the State’s land holdings.
• The State treats the receipt of unclaimed money to the Consolidated Fund as income. However, claims
can be legally lodged for several years after the money is paid into the Fund. Future claims for the return
of these monies cannot be estimated and thus, is a contingent liability for the State.
• NSW TAB, a wholly owned subsidiary of Tabcorp, holds a 99-year licence to conduct totalizator betting
in New South Wales. The licence included a 15-year ‘exclusivity period’ which expired on 22 June 2013.
The State has agreed to extend TAB’s exclusivity licence for a further 20 years to 2033 for $75 million.
Under the agreement, the State must compensate Tabcorp if any adverse regulatory event occurs. The
amount to be refunded is the initial payment reduced by $2.5 million for each year between the year of
receipt and when the adverse regulatory event occurs.
• At 30 June 2019 liabilities relating to future reported claims from past exposure periods exist in NSW Self
Insurance Corporations relating to incidents of abuse that occurred within NSW Government institutions
(referred to as latent abuse claims). Abuse could be sexual, physical, emotional or a combination of
these types of abuse. There are two main considerations relevant to estimating the claims incurred to
date but not yet reported component of these liabilities. These considerations, which are both subject to
significant uncertainty and the unavailability of adequate data, comprise:
– The number of latent abuse claims incurred to date but not yet reported
– The average size of payments expected on these claims
A consideration relevant to estimating the incurred but not reported latent abuse claims, is the reduced
relevance of historic claims experience given external developments such as relatively recent legislative
changes, and the National Redress Scheme. Based on the information available at the balance date it
has been determined that a reliable estimate of the liabilities for these latent abuse claims cannot be
made. As such the liabilities presented in these accounts do not include an allowance for incurred but
not reported latent abuse claims. As more information becomes available it may be possible to put an
estimate on these latent abuse claim liabilities. It is possible that such an estimate is material to the
financial statements.
• Claims have been made against the State, challenging the constitutional validity of stamp duty on motor
vehicles. The proceedings are at an early stage and it is therefore not possible to estimate the financial
impact or result of the claims.
• State agencies and corporations are subject to various claims and litigation in the normal course of
operations. The quantum of these claims cannot accurately be determined.

Note 29
7 - 128 Total State Sector Accounts
Warranties, Guarantees and Indemnities
Guarantees have been provided to facilitate the provision of certain services and the construction of several infrastructure assets, which may give rise to contingent liabilities. Unless otherwise stated, the General Government guarantees are also applicable to the Total State Sector.
The major guarantees are:
• Issued securities, borrowing and derivative liabilities of the New South Wales Treasury Corporation with
a market value of $74.1 billion (2018: $65.5 billion) have been guaranteed by the NSW Government
under the Public Authorities (Financial Arrangements) Act 1987.
• State guarantees given to various organisations under statute mainly relate to certain co-operative
housing societies. The maximum exposure as at 30 June 2019 is $21 million (2018: $23 million).
• The State made a number of warranties in relation to the sale of Delta Electricity’s Western Assets,
Eraring Energy, Vales Point Power Station, Colongra Power Station, Macquarie Generation and the 99-
year leases of TransGrid, Ausgrid and Endeavour Energy network assets:
Pre-existing contamination liability
– the State retains the costs for remediating pre-existing contamination at the Eraring, Shoalhaven, Mt
Piper, Vales Point, Colongra, Bayswater and Liddell power stations sites to minimum legal
standards. Contamination is determined by reference to base line study or studies within certain time
restrictions.
General warranties
– under the various Sale and Purchase and Lease transactions, the State has potential liabilities under
various warranties, indemnities and guarantees provided to the purchaser and lessees. Warranties
are subject to various caps, carve-outs and time restrictions.
Coal haul road liability
– if existing Aboriginal land right claims affect Crown Land titles over the coal haul road from Newstan
Colliery to the Eraring Power station, compensation will be payable by the State to the native title
holders to negotiate a continued right to use. The State’s obligations end (in respect of each existing
Aboriginal Land Claim): 12 months after the date on which the Minister or Court (as applicable)
determines that Crown Land subject to an existing Aboriginal Land Claim is not claimable land or an
easement or similar for the purposes of the Coal Haul Road is granted to the indemnified party; or
the date on which an existing Aboriginal Land Claim is withdrawn or terminated.
Ash dam liability
– as part of the Eraring Sale, the State will pay half the incremental cost of implementing an alternative
arrangement for ash disposal if the existing proposal (as at 1 August 2013) for further backfilling at
the ash dam cannot be implemented. The State’s liability ceases if the issue is not resolved by 1
August 2023. The State will also retain the costs for remediating ash dam contamination (migration
of contamination in water from ash dams) at Vales Point Power Station.
• In addition to the warranties, the State made the following guarantees and indemnities in relation to the
sale of Vales Point Power Station, Colongra Power Station and Macquarie Generation:
Vales Point Hand Back Deed
– where an option is exercised under the Hand Back Deed, the State will be responsible for the
demolition and remediation of Vales Point and the Site Land.
Land remediation indemnity
– the State has indemnified the purchasers in relation to the cost to remediate land at the various
power station sites, subject to various conditions and time frames.
Barnard River Scheme native title indemnity
– the State has indemnified AGL for costs related to any native title claims affecting a parcel of Crown
land related to the Barnard River Scheme.

Note 29
Total State Sector Accounts 7 - 129
• The State has guaranteed the obligations and performance of various statutory authorities under
contracts with private sector parties. These guarantees are considered unlikely to ever be exercised and,
in some cases, are limited to financial obligations only. The current guarantees in place are:
– Sydney Harbour Tunnel
– Macarthur Water Filtration Plant
– M2 Motorway
– Olympic Multi-Use Arena
– Eastern Distributor
– Illawarra and Woronora Water Treatment
Plant
– Prospect Water Filtration Plant and
Treatment Works
– Cross City Tunnel
– Western Sydney Orbital (Westlink M7
Motorway)
– Eastern Creek Alternative Waste
Treatment Plant (The Crown Entity holds
a guarantee, a contingent asset, which
fully offsets this contingent liability)
– Lane Cove Tunnel
– Mater Hospital
– Long Bay Prison and Forensic Hospital
– Suburban Rolling Stock
– VISY Mill: Tumut Timber Supply
Agreement
– Orange Hospital Redevelopment
– Royal North Shore Hospital
Redevelopment
– Sydney International Convention,
Exhibition and Entertainment Precinct
– North West Rail Link – Operations, Trains
and Systems
– Northern Beaches Hospital
– Sydney Light Rail
– WestConnex
– NorthConnex
– Newcastle Integrated Service Operator
– New Grafton Correctional Centre
– Sydney Growth Trains
– New Intercity Fleet
– Sydney Metro City & Southwest: Tunnel
and Station Excavation Works
– Regional Rail
• NSW Treasury Corporation has undertakings for other government authorities for their performance
under contracts with third parties. At the reporting date they were valued at $74.7 million (2018: $84
million).
• The State bears the risk of the employer’s superannuation guarantee contributions being insufficient to
fund the defined employee benefits (in respect of past and future service liabilities) for certain ex-public
sector employees following the State’s decision to sell the businesses. The State must pay the
contribution shortfall on an annual basis and is obliged to make good any employer reserve shortfall
upon the insolvency of the employer. Indemnities have also been provided to the private sector employer
in respect of loss suffered, for example, from non-payment of an unfunded amount or tax losses suffered
due to payments by the State.
• The State has provided a Deed of Indemnity to the directors and designated senior management of
some state-owned corporations (SOC). This deed indemnifies them against claims and liabilities in
connection with the Energy Industry Reform Transactions (Transaction Process).
The directors and designated senior management covered by this indemnity are the directors and
designated senior management of Essential Energy and the former directors and designated senior
management of Eraring Energy, Ausgrid, Macquarie Generation, Endeavour Energy and Delta
Electricity. To the extent permitted by law, the indemnity covers each indemnified party, in their capacity
as directors or senior management, against:
– civil liability arising in respect of the Transaction Process if such liability is or was not due to conduct
which involved a lack of good faith on the part of the indemnified party, and
– costs in defending proceedings, whether civil or criminal, in which judgement is or was given in
favour of the indemnified party or in which the indemnified party is or was acquitted or where the
proceedings are discontinued or in connection with any application in relation to a proceeding in
which a court grants or granted relief to the indemnified party.

Note 29
7 - 130 Total State Sector Accounts
The indemnified parties have a duty to maintain in force comprehensive directors’ and officers’
insurance policies which cover all of the risks indemnified by the State under the indemnities until:
– the completion of the Transaction Process, and
– for seven years following the completion of the Transaction Process for any acts or omissions of the
Indemnified Party occurring before completion of the Transaction Process.
The indemnity does not apply in respect of a liability which arises out of any act or omission on the part
of the indemnified party that involves, among others as detailed in the Deed of Indemnity, gross
negligence, recklessness and conduct contrary to any written direction or instructions to the indemnified
party made by or on behalf of the State.
It is not possible to estimate the amount of contingent liability exposure at this time. There are no known
claims as at the reporting date.
• In entering the 99-year lease of land and fixtures at Port Kembla, Port Botany and Enfield and 98-year
lease at Port of Newcastle
– the State has indemnified the Port lessees in respect of pre-existing environmental damage or
contamination at relevant sites (no known claims as at the reporting date) and
– the State has guaranteed limited compensation to financiers if the Port Leases are terminated for
any reason.
• State owned electricity distributors provide guarantees to regulatory and statutory authorities to the value
of $22.2 million (2018: $23.8 million).
• The State Government’s motor vehicles are financed by an internal arrangement managed by StateFleet
and funded by TCorp. The facility is funded through a portfolio of debt with a modified duration of around
3 years. There is an interest rate exposure on a principal of $106 million as at 30 June 2019 (2018: $207
million).
• On 18 August 2019, the Barangaroo Delivery Authority settled the sight lines dispute with LendLease
(Millers Point) Pty Limited and Crown Sydney Property Pty Limited and withdrew the appeal
proceedings. The commercial terms of this settlement are bound by confidentiality requirements.
Depending on the outcome of future events, the Barangaroo Delivery Authority may have additional
financial commitments.
• State’s Fire and Rescue has undertaken site assessments at its training centres located in Armidale,
Albion Park, Deniliquin, Alexandria and Greenacre. The assessment results confirmed the presence of
perfluorooctane sulfonate (PFOS), perfluorooctanoic acid (PFOA) and Perfluorohexane Sulfonic Acid
(PFHxS) chemicals. Plans for remediation are now in place. Leased properties will be remediated in
accordance with these plans and subsequent reimbursement of the costs will be sought from the insurer.
The final remediation costs of the impacted properties owned by the State remain uncertain.
• State has a potential exposure to risk from contaminated sites, land, buildings and infrastructure that
may contain hazardous materials and environmental incidents. There is an ongoing program for the
management of contamination and remediation where required. It is not possible to estimate liabilities
reliably, as the need for and the type of management and remediation is dependent on future events that
cannot be determined at this time.
• In October 2018 control of Allianz Stadium was handed over to Infrastructure NSW to commence
demolition for the redevelopment of a new stadium funded by the NSW Government. As such, events
previously hosted at Allianz Stadium have been relocated to either the Sydney Cricket Ground or
another venue within NSW. Any losses incurred by precinct partners as a result of this relocation will be
paid by way of compensation by the State.

Note 29 and Note 30
Total State Sector Accounts 7 - 131
• On 29 March 2019 the Myuna Bay Sport and Recreation Centre was closed due to safety concerns
relating to the nearby Eraring Ash Dam. The Office of Sport has been advised by Origin Energy Limited
that if the dam wall breaks in the event of a major earthquake, there is a significant risk to the Myuna Bay
Sport and Recreation Centre. The Minister has requested an independent review of the Origin Energy
report and until this review is completed, the financial impact on the State cannot be quantified.
Contingent Assets
Contingent assets exist in respect of guarantees received and from pending litigation. These include:
• As a result of the collapse of HIH Insurance Limited, the State assumed liabilities of approximately
$650 million. This was in respect of building warranty and third party motor insurance. An independent
actuary estimated the discounted present value of the outstanding liability to be $7 million as at 30 June
2019 (2018: $15.7 million). The liquidators of HIH Insurance Limited currently intend to distribute various
percentages up to ‘more than 50 per cent’ depending upon the scheme company.
In 2018-19, the State received no payments. (2018: Nil).
• As part of the HACP program, there were 40 properties that the AHO does not have definitive control
over as at 30 June 2019. As a result, they will not be recognised until such time as full control is
established. The estimated value of these properties is $20.3m. (2018 - $28.7m).
Note 30: Events after the Reporting Period
Changes to Reporting Entities
There have been several changes to reporting entities as a result of the Administrative change orders following the 2019 State election.
On 2 April 2019, the Administrative Arrangements (Administrative Changes−Public Service Agencies) Order 2019 was introduced to take effect from 1 July 2019( except for certain clauses which are taken to have commenced on a retrospective date). Following the release, the Administrative Arrangements (Administrative Changes-Public Service Agencies) Order (No. 2) 2019 was introduced on 1 May 2019, repealing the Order of 2 April, to take effect from 1 July 2019.
As part of these revised arrangements these major changes have occurred:
• Department of Finance, Services and Innovation will be abolished, and the Department of Customer
Service established;
• Department of Family and Community Services and Department of Justice will be abolished, Department
of Communities and Justice will be established;
• Department of Industry and Department of Planning and Environment will be abolished, Department of
Planning, Industry and Environment will be established;
• Barangaroo Delivery Authority will be abolished, and functions transferred to Infrastructure NSW;
• Office of Environment and Heritage will be abolished, and functions transferred to the Department of
Premier and Cabinet and the Department of Planning, Industry and Environment;
• Office of Local Government will be abolished, and functions transferred to the Department of Planning,
Industry and Environment;
• UrbanGrowth NSW Development Corporation will be abolished, and functions transferred to
Infrastructure NSW.

Note 30
7 - 132 Total State Sector Accounts
These changes will have consequential financial and annual reporting implications whereby transfers of function from the old agency to the new agency will need to be recognised as at 1 July 2019.
Opal Tower
Opal Tower is located on land formerly known as Site 68 Bennelong Parkway, Sydney which was owned by Sydney Olympic Park Authority (SOPA). On 20 March 2014, SOPA entered into a Project Delivery Agreement with Australia Avenue Developments Pty Ltd (AAD) and Ecove Group Pty Ltd pursuant to which AAD would develop the site, including by designing and constructing Opal Tower as a mixed residential and commercial building. In October 2015, AAD contracted with Icon Co (NSW) Pty Ltd (Icon) to carry out the building works which were completed by August 2018. Contracts for the sale of land occurred after the work was completed. On 24 December 2018 residents reported hearing loud cracking noises within the Opal Tower and visible cracks were identified on Level 10 of the building and subsequently residents were evacuated by emergency services.
On 5 August 2019, SOPA received a Summons from Corrs Chambers Westgarth Lawyers who represent the Opal Tower owners. The Summons commences a Class Action for breach of statutory warranties against SOPA and costs relating to rectification works and relating to diminution in value as well as other costs. Although SOPA was not directly involved in the construction of Opal Tower, they may be deemed a developer under the Home Building Act 1989 and as such have legal exposure arising from statutory warranties under the Act. Given the Developer and Builder are in the process of rectifying the building defects, it is considered that a successful material claim is unlikely for building damage costs. The other claim for damages relates to diminution of value as a result of the defect. The Builder (Icon) and the Developer (Ecove) are likely to be liable for most of any damages awarded.
Given that Icon, the builder, and/or the designer would appear to be primarily responsible, and that Ecove would bear secondary responsibility, it is likely that SOPA’s proportion of liability would be minor unless Icon and the building designer and the developer were to be wound up. In this regard, Icon is a subsidiary of Kajima, a $7 billion listed Japanese company and Ecove is involved in other developments. There are several insurance policies that SOPA may be entitled to claim under however there are issues as to which policy will respond to indemnify Icon. If favourable indemnity positions can be obtained from the contractors’ insurance policies, SOPA may be entitled to pass on the majority of its costs incurred in these proceedings.
Roads and Maritime Services
On 18 July 2019, a Sydney court ordered the NSW government to pay more than $50 million compensation to the former owners of a tip site that it acquired to build the WestConnex interchange at St Peters. Alexandria Landfill Pty Ltd and Boiling Pty Ltd argued for a much greater amount of compensation to be paid. It is likely this decision will be appealed by Alexandria Landfill and Boiling.
Transport for NSW and Rail Corporation New South Wales
Transfer of assets, rights and liabilities relating to the Country Regional Network from Transport for NSW to RailCorp under a ministerial order on 1 July 2019. The fair value of the assets transferred was approximately $4,508 million.
NSW Ports
On 20 August 2019, the State has been joined as a respondent in an action taken by the Australian Competition and Consumer Commission (ACCC) against NSW Ports and in NSW Ports’ cross-claim against Port of Newcastle. Neither the ACCC nor NSW Ports are seeking any relief (compensation or other orders) against the State.
Education
On 13 September 2019, the NSW Industrial Relations Commission (the Commission) held a full-bench hearing about the pay equity package for School Administrative and Support (SAS) Staff. The Commission determined that the package satisfies the equal remuneration principle and agreed to it taking effect from 1 July 2019. The determination provides a one-off pay rise to SAS Staff, amends their employment classifications, recruitment and work practices. The Department has quantified the financial impact on its financial statements for the year ended 30 June 2019 and concludes that the impact will not be material.

Note 30 and Note 31
Total State Sector Accounts 7 - 133
Venues NSW
On 8 August 2019, the State conditionally approved the allocation of up to $810 million to Stadium Australia. The proposed project is a refurbishment/redevelopment that will transform Stadium Australia into a 70,000 seat permanent rectangular stadium. If the conditions for final approval are met and the funding for the refurbishment is approved, this would result in accelerated depreciation and write-offs currently estimated at $123 million. The timing of these expenses are dependent on the commencement of the project.
Note 31: Restatement/Corrections to Prior Years
(a) Earthworks valuation
In previous years, Transport for NSW carried bored and excavated tunnels and earthworks including cuttings and embankments at nil value on the basis that the assets could not be reliably measured. In 2017, Transport for NSW valued these assets using advances in technology, improved asset management systems, equipment and technical asset information. On balance, it appeared it may have been possible to reliably value these assets in a prior year. As a result, Transport for NSW recorded an additional $29.9 million in tunnel boring assets and $4,228.8 million in earthworks to correct the value of infrastructure assets with an adjustment to equity in 2017. The nature of the inputs to the valuation made it impractical to retrospectively restate previously reported balances.
Due to concerns around the completeness and the quality of data relating to the earthworks recognised in 2017, Transport for NSW has carried out an extensive process to ensure it has a complete database for all earthworks to support future valuations. Comparing the results of the data collected to the data used in the 2017 earthworks valuation has revealed significant variations, resulting in a decrement in fair value of $2,145.8 million. Accordingly, the prior year has been restated to recognise the decreased value of the earthworks, and this has been adjusted against equity in line with the 2017 treatment.
The main reason for the prior period adjustment derives from the use of incorrect assumptions in the 2017 valuation, mainly comprising:
• A larger proportion of assets on flatter terrain than originally assumed in 2017
• Lower cutting and embankment heights than assumed in 2017
• Unit rates used in 2017 did not accurately reflect the parameters of the earthworks
• Assumptions on the remaining useful life in 2017 did not accurately reflect the condition of the assets.
Additionally, depreciation in the prior year has been restated to correct the amount of earthworks depreciation in line with the restated fair value (reduction of $61.5 million).
(b) Reclassification of Balances
There has been a restatement of balances to reflect revised information available after the publication of the 2017-18 Total State Sector Accounts. $182 million (General Government Sector) and $309 million (Total State Sector) was reclassified from ‘Interest’ expense to ‘Gain/(Loss) from Liabilities’ for 2017-18.
(c) TCorp Reclassification of Securities
During the year, TCorp reclassified securities purchased under agreements to resell from ‘Due from Financial Institutions’ to ‘Cash and Liquid Assets’ on the balance sheet. This is to better reflect the nature of these liquid holdings. A reclassification of $1,002 million has also been made to prior period comparative information. As the securities are from external institutions, this reclassification is a Total State Sector impact only.

Note 31
7 - 134 Total State Sector Accounts
General Government Sector Total State Sector
2017-18 Actual
Adjustment 2017-18 Restated
2017-18 Actual
Adjustment 2017-18 Restated
FROM CONTINUING OPERATIONS Note $m $m $m $m $m $m
Revenue from Transactions
Total Revenue from Transactions 80,672 ... 80,672 86,697 ... 86,697
Expenses from Transactions Depreciation and Amortisation (a) 4,873 (61) 4,811 7,641 (61) 7,579
Interest (b) 1,994 (182) 1,812 3,647 (309) 3,338
Total Expenses from Transactions 76,491 (243) 76,248 84,246 (370) 83,875
Transactions from Discontinuing Operations ... ... ... ... ... ...
NET RESULT FROM TRANSACTIONS - NET OPERATING BALANCE (BUDGET RESULT FOR THE
GENERAL GOVERNMENT SECTOR)
4,181 243 4,425 2,451 370 2,822
OTHER ECONOMIC FLOWS - INCLUDED IN THE OPERATING RESULT
Loss from Liabilities (b) (231) (182) (413) (379) (309) (688)
Other Economic Flows - included in Operating Result (16) (182) (198) 953 (309) 643
OPERATING RESULT 4,165 61 4,226 3,404 61 3,465
Other Economic Flows - Other Comprehensive Income 26,369 ... 26,369 27,130 ... 27,130
COMPREHENSIVE RESULT - TOTAL CHANGE IN
NET WORTH BEFORE TRANSACTIONS WITH OWNERS AS OWNERS 30,534 61 30,595 30,534 61 30,595
Less: Net Other Economic Flows
(26,353) 182 (26,171) (28,083) 309 (27,773)
NET OPERATING BALANCE 4,181 243 4,425 2,451 370 2,822
Less: Net Acquisition of Non-Financial Assets
Less: Depreciation and Amortisation (a) (4,873) 61 (4,811) (7,641) 61 (7,579)
Equals Total Net Acquisition of Non-Financial Assets 6,943 61 7,005 9,461 61 9,523
EQUALS: NET LENDING/(BORROWING) (2,762) 182 (2,580) (7,010) 309 (6,701)
General Government Sector Total State Sector
1 July 2018
Actual
Adjustment 1 July 2018
Restated
1 July 2018
Actual
Adjustment 1 July 2018
Restated Note $m $m $m $m $m $m
ASSETS Financial Assets Cash and Cash Equivalents (c) 5,417 ... 5,417 12,967 1,002 13,969
Investments, Loans and Placements
...
Financial Assets at Fair Value (c) 32,578 ... 32,578 38,645 (1,002) 37,643
Total Financial Assets
173,228 ... 173,228 89,666 ... 89,666
Non-Financial Assets
Infrastructure Systems (a) 104,232 (2,084) 102,147 160,242 (2,084) 158,158
Total Non-Financial Assets
210,336 (2,084) 208,252 353,469 (2,084) 351,384
TOTAL ASSETS 383,564 (2,084) 381,480 443,135 (2,084) 441,051
TOTAL LIABILITIES 129,385 ... 129,385 188,956 ... 188,956
NET ASSETS 254,179 (2,084) 252,095 254,179 (2,084) 252,095
NET WORTH Accumulated Funds(a)
78,327 (2,084) 76,243 101,764 (2,084) 99,680
TOTAL NET WORTH 254,179 (2,084) 252,095 254,179 (2,084) 252,095
OTHER FISCAL AGGREGATES Net Debt (11,195) ... (11,195) 15,762 ... 15,762
Net Financial Liabilities 69,068 ... 69,068 99,289 ... 99,289

Note 31
Total State Sector Accounts 7 - 135
Total State Sector(a) 2017-18 Actual
Adjustment 2017-18 Restated
Note $m $m $m
CASH FLOWS FROM OPERATING ACTIVITIES Total Receipts 93,263 ... 93,263
Total Payments (76,954) ... (76,954)
NET CASH FLOWS FROM OPERATING ACTIVITIES 16,309 ... 16,309
CASH FLOWS FROM INVESTING ACTIVITIES Net Cash Flows from Investments in Non-Financial Assets (17,931) ... (17,931)
Net Cash Flows from Investments in Financial Assets (Policy Purposes) (7) ... (7)
Financial Assets (Liquidity Purposes)
Purchase of Investments (c) (14,446) 1,002 (13,444)
Net Cash Flows from Investments in Financial Assets (Liquidity Purposes) (c) 263 1,002 1,265
NET CASH FLOWS FROM INVESTING ACTIVITIES (c) (17,675) 1,002 (16,673)
CASH FLOWS FROM FINANCING ACTIVITIES NET CASH FLOWS FROM FINANCING ACTIVITIES 285 ... 285
NET INCREASE IN CASH AND CASH EQUIVALENTS (c) (1,080) 1,002 (78)
...
CLOSING CASH AND CASH EQUIVALENTS (c) 12,967 1,002 13,969
DERIVATION OF CASH RESULT
CASH SURPLUS/(DEFICIT) (1,622) ... (1,622)

Note 32
7 - 136 Total State Sector Accounts
Note 32: Related Party Disclosures
Key management personnel (KMP) are those persons having authority and responsibility for planning, directing and controlling the activities of the State. As New South Wales (NSW) Cabinet is the decision making body for the State, all NSW Cabinet Ministers are considered KMP of the State. Information on KMP of each individual agency can be found in individual agency accounts. Only Cabinet exercises the role of KMP over the whole State.
Key Management Personnel Compensation
KMP compensation is as follows:
Total State Sector Total State Sector 2018-19 2017-18
$000 $000
Short-term Employee Benefits
Salaries 6,339 6,139
Other Monetary Allowances 2,880 2,758
Non-monetary Benefits 2,358 1,897
Other Long-term Employee Benefits ... ...
Post-employment Benefits 673 635
Termination Benefits ... ...
Total KMP Compensation 12,249 11,429
Related Party Transactions
As a KMP of the State, each Cabinet Minister is considered a related party to all NSW government controlled entities. The definition of related parties extends to each Cabinet Minister’s close family members and entities controlled or jointly controlled by the Cabinet Minister and/or close family members.
During the year, there were no material transactions with the Cabinet Ministers, their close family members or entities controlled or jointly controlled thereof.

Note 33
Total State Sector Accounts 7 - 137
Note 33: Budgetary Information on 2018-19 General Government Sector Financial Statements
The budgeted amounts are drawn from the original 2018-19 Budget presented, on 19 June 2018, to Parliament. The budgeted financial statements are presented consistent with AASB 1055 Budgetary Reporting.
The NSW General Government Statement of Comprehensive Income for the Year Ended
30 June 2019
Original Budget Actual
Budget Variance
FROM CONTINUING OPERATIONS $m $m $m
Revenue from Transactions
Taxation 31,146 31,443 297
Grants and Subsidies
Commonwealth General Purpose 18,475 17,907 (568)
Commonwealth Specific Purpose Payments 9,851 10,224 373
Commonwealth National Partnership Payments 3,043 2,737 (306)
Other Grants and Subsidies 742 981 239
Sale of Goods and Services 9,513 8,990 (523)
Interest 323 491 168
Dividend and Income Tax Equivalents from Other Sectors 1,823 1,932 109
Other Dividends and Distributions 1,322 1,934 612
Fines, Regulatory Fees and Other 4,843 5,051 208
Total Revenue from Transactions 81,081 81,690 609
Expenses from Transactions
Employee 31,613 33,158 1,545
Superannuation
Superannuation Interest Cost 1,470 1,412 (58)
Other Superannuation 3,006 3,052 46
Depreciation and Amortisation 4,989 5,192 203
Interest 2,044 1,812 (232)
Other Operating 21,600 21,146 (454)
Grants and Subsidies
Recurrent Grants and Subsidies 13,852 13,595 (257)
Capital Grants 1,082 1,105 23
Total Expenses from Transactions 79,656 80,471 815
TRANSACTIONS FROM DISCONTINUING OPERATIONS ... ... ...
NET RESULT FROM TRANSACTIONS
NET OPERATING BALANCE (BUDGET RESULT
FOR THE GENERAL GOVERNMENT SECTOR) 1,425 1,219 (206)

Note 33
7 - 138 Total State Sector Accounts
The NSW General Government Statement of Comprehensive Income for the Year Ended
30 June 2019 (continued)
Original Budget Actual
Budget Variance
$m $m $m
NET OPERATING BALANCE 1,425 1,219 (206)
OTHER ECONOMIC FLOWS - INCLUDED IN THE OPERATING RESULT Gain/(Loss) from Other Liabilities 175 (2,500) (2,675)
Other Net Gains/(Losses) 493 13,700 13,207
Share of Earnings/(Losses) from Equity Investments (excluding Dividends) (0) (1) (1)
Dividends from Asset Sale Proceeds 81 (0) (81)
Deferred Income Tax from Other Sectors (7) (97) (90)
Other 47 14 (33)
Discontinuing Operations - Other Economic Flows 0 (0) ...
Other Economic Flows - included in Operating Result 789 11,117 10,328
OPERATING RESULT 2,214 12,335 10,121
OTHER ECONOMIC FLOWS - OTHER COMPREHENSIVE INCOME
Items that will not be reclassified to operating result Revaluations 2,794 7,205 4,411
Share of Associate's Other Comprehensive Income/(Loss) that will not be
Reclassified Subsequently to Operating Result ... (10) (10)
Actuarial Gain/(Loss) from Superannuation 4,120 (13,364) (17,484)
Net Gain/(Loss) on Equity Instruments at Fair Value through Other Comprehensive
Income ... (7,888) (7,888)
Deferred Tax Direct to Equity 61 151 90
Items that may be reclassified subsequently to operating result Net Gain/(Loss) on Equity Investments in Other Sectors 71 ... (71)
Net Gain/(Loss) on Financial Instruments at Fair Value ... 19 19
Share of Associate's Other Comprehensive Income/(Loss) that may be
Reclassified Subsequently to Operating Result ... (538) (538)
Other (209) 166 375
Other Economic Flows - Other Comprehensive Income 6,837 (14,259) (21,096)
COMPREHENSIVE RESULT - TOTAL CHANGE IN NET WORTH BEFORE
TRANSACTIONS WITH OWNERS AS OWNERS 9,052 (1,924) (10,976)
KEY FISCAL AGGREGATES
COMPREHENSIVE RESULT - TOTAL CHANGE IN NET WORTH BEFORE
TRANSACTIONS WITH OWNERS AS OWNERS 9,052 (1,924) (10,976)
Less: Net Other Economic Flows (7,626) 3,142 10,768
NET OPERATING BALANCE 1,425 1,219 (206)
Less: Net Acquisition of Non-Financial Assets
Purchases of Non-Financial Assets 15,405 16,464 1,059
Sales of Non-Financial Assets (650) (966) (316)
Less: Depreciation (4,989) (5,192) (203)
Plus: Change in Inventories (42) 38 80
Plus: Other Movements in Non-Financial Assets
Assets Acquired using Finance Leases 1,925 159 (1,766)
Other 40 (4) (44)
Equals Total Net Acquisition of Non-Financial Assets 11,688 10,498 (1,190)
EQUALS: NET LENDING/(BORROWING) (10,263) (9,280) 983
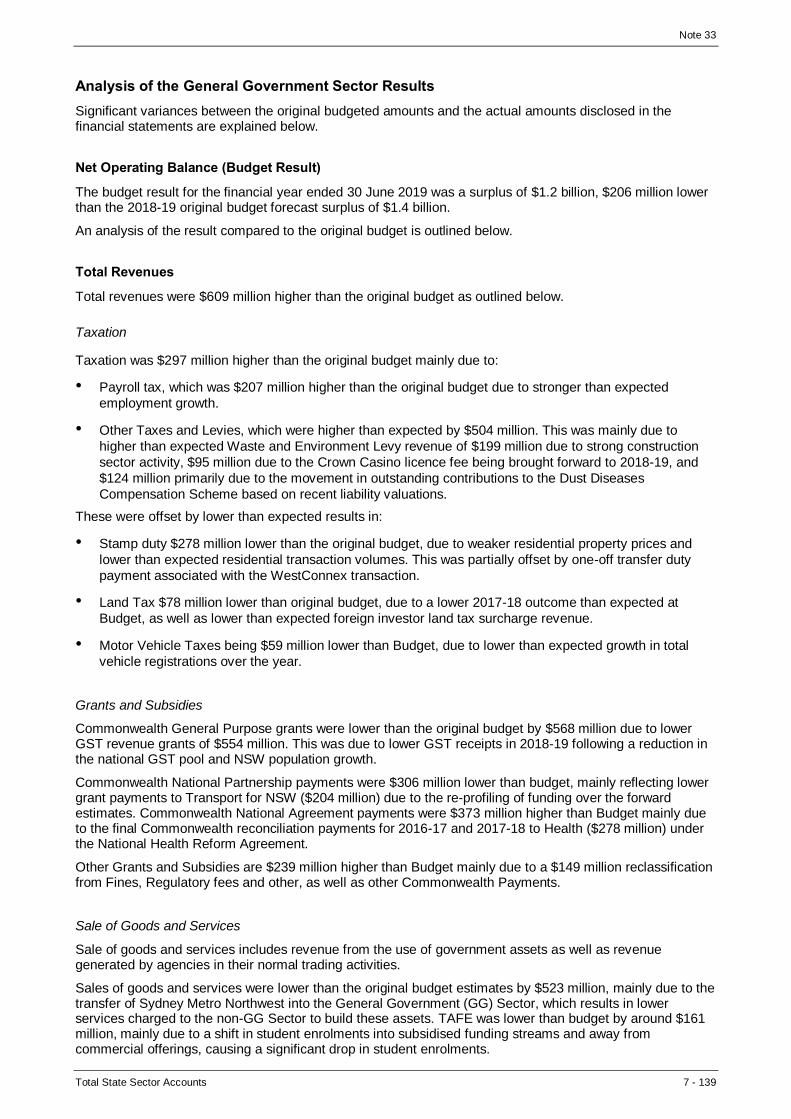
Note 33
Total State Sector Accounts 7 - 139
Analysis of the General Government Sector Results
Significant variances between the original budgeted amounts and the actual amounts disclosed in the financial statements are explained below.
Net Operating Balance (Budget Result)
The budget result for the financial year ended 30 June 2019 was a surplus of $1.2 billion, $206 million lower than the 2018-19 original budget forecast surplus of $1.4 billion.
An analysis of the result compared to the original budget is outlined below.
Total Revenues
Total revenues were $609 million higher than the original budget as outlined below.
Taxation
Taxation was $297 million higher than the original budget mainly due to:
• Payroll tax, which was $207 million higher than the original budget due to stronger than expected
employment growth.
• Other Taxes and Levies, which were higher than expected by $504 million. This was mainly due to
higher than expected Waste and Environment Levy revenue of $199 million due to strong construction
sector activity, $95 million due to the Crown Casino licence fee being brought forward to 2018-19, and
$124 million primarily due to the movement in outstanding contributions to the Dust Diseases
Compensation Scheme based on recent liability valuations.
These were offset by lower than expected results in:
• Stamp duty $278 million lower than the original budget, due to weaker residential property prices and
lower than expected residential transaction volumes. This was partially offset by one-off transfer duty
payment associated with the WestConnex transaction.
• Land Tax $78 million lower than original budget, due to a lower 2017-18 outcome than expected at
Budget, as well as lower than expected foreign investor land tax surcharge revenue.
• Motor Vehicle Taxes being $59 million lower than Budget, due to lower than expected growth in total
vehicle registrations over the year.
Grants and Subsidies
Commonwealth General Purpose grants were lower than the original budget by $568 million due to lower GST revenue grants of $554 million. This was due to lower GST receipts in 2018-19 following a reduction in the national GST pool and NSW population growth.
Commonwealth National Partnership payments were $306 million lower than budget, mainly reflecting lower grant payments to Transport for NSW ($204 million) due to the re-profiling of funding over the forward estimates. Commonwealth National Agreement payments were $373 million higher than Budget mainly due to the final Commonwealth reconciliation payments for 2016-17 and 2017-18 to Health ($278 million) under the National Health Reform Agreement.
Other Grants and Subsidies are $239 million higher than Budget mainly due to a $149 million reclassification from Fines, Regulatory fees and other, as well as other Commonwealth Payments.
Sale of Goods and Services
Sale of goods and services includes revenue from the use of government assets as well as revenue generated by agencies in their normal trading activities.
Sales of goods and services were lower than the original budget estimates by $523 million, mainly due to the transfer of Sydney Metro Northwest into the General Government (GG) Sector, which results in lower services charged to the non-GG Sector to build these assets. TAFE was lower than budget by around $161 million, mainly due to a shift in student enrolments into subsidised funding streams and away from commercial offerings, causing a significant drop in student enrolments.

Note 33
7 - 140 Total State Sector Accounts
These were offset by water management fees recognised from the non-General Government sector not included at budgeted ($95 million), and higher insurance premiums from the non-General Government sector combined with movements in outstanding insurance recoveries ($58 million).
Interest Income
Interest income includes returns on advances to public non-financial corporation enterprises, along with returns on deposits held with NSW Treasury Corporation and other financial institutions.
Interest income was higher than the original budget by $168 million mainly due to higher cash and investments in term deposits ($108 million).
Financial Distributions (Dividends and Income Tax Equivalents)
Dividends and Income Tax Equivalent payments are paid by commercial government businesses to ensure competitive neutrality with the private sector and encourage these businesses to make commercial investment decisions.
Dividends and Taxes were higher than the original budget by $109 million. Dividends were higher by $148 million mainly due to the final dividend received from the Sydney Motorway Corporation at the time of the 51 per cent sale to Sydney Transport Partners. This was offset by lower Income Tax equivalents from the PNFC sector due to reductions in profits during the year ($30 million), and lower Dividends from the PNFC sector ($21 million) mainly due to higher drought-driven costs of Sydney Water (including associated with desalination).
Other Dividends and Distributions
Other dividends and distributions were $612 million above the original budget, mainly driven by higher than expected investment income from:
• NSW Self Insurance Corporation ($256 million) due to improved financial market performance;
• NSW Treasury Corporation products ($229 million)
Fines, Regulatory Fees and Other
Revenue from fines, regulatory fees and other revenues were $208 million higher than the original budget
primarily due to Mining royalties, which were $189 million higher than budget, largely driven by higher
thermal coal prices and a lower than expected exchange rate. General revenue across a number of
Agencies was higher than budget by around $255 million, which was offset by the reclassification of $215
million as Grants and Subsidies.
Expenses
Total expenses were higher than the original budget by $815 million as outlined below.
Employee Expenses (excluding Superannuation)
Employee expenses were $1.5 billion higher than the original budget. This was primarily due to increases across a number of agencies for additional policy measures (including drought relief), partially offset by reclassifications from other operating expenses and grants and subsidies. Individual material changes include:
• NSW Self Insurance Corporation, which was $297 million higher than Budget primarily due to updated
gross movement in outstanding TMF workers compensation claims based on 30 June 2019 liability
valuation.
• Department of Education ($108 million higher than Budget), reflecting a minor increase in daily teaching
costs across all schools and greater utilisation of casual teachers to support permanent staff leave and
school-based initiatives. The Department also reclassified costs between employee related and other
operating expenses to support school-based programs and reforms, recording savings to Budget in
Other Operating expenses of $550 million.
• Ministry of Health ($87 million) driven by increased hospital activity and complexity.

Note 33
Total State Sector Accounts 7 - 141
• Service NSW ($72 million) due to higher than expected service centre volumes driven by Cost of Living
programs.
Superannuation Interest Cost and Other Superannuation Expenses
Superannuation interest cost was $58 million lower than Budget due to updated actuarial valuations and lower discount rate applied in valuing defined benefit plans. Other Superannuation expenses were $46 million higher than Budget due to increases across a number of Agencies.
Depreciation and Amortisation Expenses
Depreciation and amortisation was $203 million higher than budget, driven mainly Roads and Maritime due to higher asset revaluations and associated depreciation of road pavement, traffic signalling and control assets ($50 million). A further $49 million is mainly attributable to work in progress at Department of Education that was previously capitalised, while Department of Finance, Services and Innovation was $38 million higher than budget mainly due to a depreciation policy change for ICT projects.
Interest Expenses
Interest expenses were $232 million lower than budget, mainly due to the reduced unwind of discount of
outstanding claims liabilities resulting from the change to the risk-free discount rate.
Other Operating Expenses
Other Operating Expenses were $454 million lower than Budget, driven by Transport for NSW and Sydney Metro ($633 million), mainly due to the transfer of Sydney Metro Northwest into the General Government (GG) Sector (resulting in lower capital program delivery expenses to the non-GG sector), along with a decrease in private transport operator expenses. Roads and Maritime expenditure was lower by $178 million, driven by reduced maintenance activities due to lower weight tax collections, and reprioritisations to fund land bank pressures. There were also broad underspends across a number of Agencies. These were offset by higher incurred insurance claims resulting from the latest actuarial liability valuation, and higher expenditure in Department of Justice ($102 million) driven by costs in Correctional Centre Management.
Grants and Subsidies Expenses
Recurrent and capital grants, subsidies and other transfers expenses were $234 million lower than budget.
This was mainly due to the reprofiling of Restart infrastructure projects to future years ($528 million), as well as Department of Industry ($143 million) mainly due to delays in land divestment to Local Aboriginal Land Councils and lower payments to external training providers. These were partly offset by the Government’s Emergency drought relief package expenditure of $110 million, Sydney Metro reclassification of $200 million as expenditure rather than capitalised expenditure, and $121 million primarily due to the updated movement in unexpired risk liability provision for the home building compensation fund, based on recent liability valuation.
Operating Result
The Operating Result is the budget result (net operating balance) plus the sum of other economic flows included in the operating result.
The Operating Result for 2018-19 was a surplus of $12.3 billion, $10.1 billion higher than the original budget estimate primarily as a result of the sale of a 51 per cent stake in WestConnex in September 2018.
Comprehensive Result
The comprehensive result is the operating result plus the sum of other economic flows - other comprehensive income.
The comprehensive result for 2018-19 was a deficit of $1.9 billion, around $11.0 billion lower than the budget estimate. This result captures a negative variation to budget of $17.5 billion mainly attributable to actuarial adjustments to Superannuation.

Note 33
7 - 142 Total State Sector Accounts
Net Lending
The net lending result is the budget result (net operating balance) adjusted for the net acquisition and sale of non-financial assets.
Net Lending was lower than Budget by around $983 million, mainly due to lower capital expenditure of $707 million during the year, offset by minor changes in inventories.
The NSW General Government Sector Statement of Financial Position as at
30 June 2019
Original Budget Actual
Budget Variance
$m $m $m
ASSETS
Financial Assets Cash and Cash Equivalent Assets 1,593 1,969 376
Receivables 6,738 7,491 753
Tax Equivalents Receivable 116 32 (84)
Investments, Loans and Placements Financial Assets at Fair Value 28,374 43,333 14,959
Other Financial Assets 1,330 2,591 1,261
Advances Paid 1,280 1,193 (87)
Deferred Tax Equivalents 2,328 2,245 (83)
Equity Investments in Other Public Sector Entities 114,545 98,990 (15,555)
Investments in Associates 5,870 12,055 6,185
Other 746 8 (738)
Total Financial Assets 162,920 169,907 6,987
Non-Financial Assets Inventories 270 399 129
Forestry Stock and Other Biological Assets 10 10 ...
Assets Classified as Held for Sale 295 222 (73)
Property, Plant and Equipment Land and Buildings 88,640 89,963 1,323
Plant and Equipment 11,203 12,088 885
Infrastructure Systems 117,140 119,291 2,151
Intangibles 3,898 3,694 (204)
Other 5,273 6,707 1,434
Total Non-financial Assets 226,728 232,375 5,647
TOTAL ASSETS 389,648 402,282 12,634
LIABILITIES Deposits Held 79 67 (12)
Payables 6,412 7,079 667
Tax Equivalents Payable ... 3 3
Borrowings and Derivatives at Fair Value 3 207 204
Borrowings at Amortised Cost 34,376 37,656 3,280
Advances Received 678 756 78
Employee Provisions 17,047 20,802 3,755
Superannuation Provision 45,553 67,696 22,143
Deferred Tax Equivalent Provision 85 108 23
Other Provisions 9,019 11,604 2,585
Other 6,269 6,134 (135)
TOTAL LIABILITIES 119,521 152,110 32,589
NET ASSETS 270,127 250,172 (19,955)

Note 33
Total State Sector Accounts 7 - 143
The NSW General Government Sector Statement of Financial Position as at
30 June 2019 (continued)
Original Budget Actual
Budget Variance
$m $m $m
NET WORTH Accumulated Funds 91,311 75,367 (15,944)
Reserves 178,816 174,804 (4,012)
TOTAL NET WORTH 270,127 250,172 (19,955)
OTHER FISCAL AGGREGATES Net Debt 2,559 (10,401) (12,959)
Net Financial Liabilities 71,146 81,194 10,048
Analysis of the General Government Sector Statement of Financial Position
Net Debt
Net debt was negative $10.4 billion at 30 June 2019. This is a $13 billion improvement on the original budget primarily due to proceeds from the sale of 51 per cent stake in WestConnex in September 2018.
Net Financial Liabilities
Net financial liabilities were $81.2 billion at 30 June 2019. This is a $10 billion increase over the budget estimate of $71.1 billion. This change is primarily driven by an increase in the unfunded Superannuation Liability due to changes in the discount rate applied.
Net Worth
Net worth was $250.2 billion at 30 June 2019. This is $20 billion lower than the budget estimate of $270.1 billion.
The decrease in net worth was mainly due to the increase in higher employee related, superannuation and other provisions ($28.5 billion) mainly resulting from lower than budgeted discount rates used. This was offset in part by strong investment returns, and higher asset revaluations.

Note 33
7 - 144 Total State Sector Accounts
The NSW General Government Sector Statement of Cash Flows for the Year Ended
30 June 2019
Original Budget Actual
Budget Variance
$m $m $m
CASH FLOWS FROM OPERATING ACTIVITIES
Receipts
Taxation 31,176 31,020 (156)
Sale of Goods and Services 10,014 9,360 (654)
Grants and Subsidies 32,105 31,810 (295)
Interest 342 518 176
Dividends and Income Tax Equivalents from Other Sectors 1,733 1,897 164
Other 9,389 12,226 2,837
Total Receipts 84,760 86,830 2,070
Payments Employee Related (31,155) (31,896) (741)
Superannuation (4,479) (4,325) 154
Payments for Goods and Services (22,568) (20,874) 1,694
Grants and Subsidies (13,239) (13,739) (500)
Interest (1,467) (1,455) 12
Other (5,583) (7,213) (1,630)
Total Payments (78,493) (79,502) (1,009)
NET CASH FLOWS FROM OPERATING ACTIVITIES 6,267 7,328 1,061
CASH FLOWS FROM INVESTING ACTIVITIES
Non-financial Assets Proceeds from Sale of Non-Financial Assets 733 452 (281)
Purchases (15,531) (18,087) (2,556)
Net Cash Flows from Investments in Non-Financial Assets (14,799) (17,635) (2,836)
Financial Assets (Policy Purposes) Receipts 296 18,026 17,730
Payments (3,118) (2,341) 777
Net Cash Flows from Investments in Financial Assets (Policy Purposes) (2,822) 15,685 18,507
Financial Assets (Liquidity Purposes) Proceeds from Sale of Investments 12,619 10,029 (2,590)
Purchase of Investments (4,377) (23,904) (19,527)
Net Cash Flows from Investments in Financial Assets (Liquidity Purposes) 8,242 (13,875) (22,117)
NET CASH FLOWS FROM INVESTING ACTIVITIES (9,379) (15,825) (6,446)

Note 33
Total State Sector Accounts 7 - 145
The NSW General Government Sector Statement of Cash Flows for the Year Ended
30 June 2019 (continued)
Original Budget Actual
Budget Variance
$m $m $m
CASH FLOWS FROM FINANCING ACTIVITIES Advances Received 15 56 41
Advances Repaid (98) (125) (27)
Proceeds from Borrowings 204 5,561 5,357
Repayments of Borrowings (609) (612) (3)
Deposits Received (Net) (14) 19 33
Other (Net) 58 151 93
NET CASH FLOWS FROM FINANCING ACTIVITIES (443) 5,050 5,493
NET DECREASE IN CASH AND CASH EQUIVALENTS (3,555) (3,448) 107
Opening Cash and Cash Equivalents 5,140 5,417 277
Reclassification of Cash Equivalents 8 (1) (9)
CLOSING CASH BALANCE 1,593 1,969 376
DERIVATION OF CASH RESULT Net Cash Flows from Operating Activities 6,267 7,328 1,061
Net Cash Flows from Investments in Non-Financial Assets (14,799) (17,635) (2,836)
CASH SURPLUS/(DEFICIT) (8,532) (10,307) (1,775)
Analysis of the General Government Sector Statement of Cash Flows
Cash Result
The cash deficit was $10.3 billion at 30 June 2019, $1.8 billion lower than the estimated budget cash deficit of $8.5 billion at 2018-19 Budget. The decrease in the cash result reflects a higher net purchases of non-financial assets due to the commitment for expenditure on key infrastructure investment.

Note 34
7 - 146 Total State Sector Accounts
Note 34: Disaggregated Financial Statements
Disaggregated Sector Information
Disaggregated primary financial statements are provided for the General Government Sector and PNFC and PFC sectors as a note to the TSSA. These financial statements are prepared consistent with the accounting policies adopted in the TSSA. This sector information is determined before consolidation eliminations, and includes GFS type fiscal aggregates and reconciliations.
The Total State Sector comprises a consolidation of three sectors:
• General Government (GGS)
• Public Non-Financial Corporations (PNFC), also referred to as the PTE sector, and
• Public Financial Corporations (PFC), also referred to as the PFE sector.
The broad sectors have been determined in accordance with the GFS of the ABS.
The General Government Sector comprises all government agencies that are controlled and mainly financed by taxation that:
• undertake policy and regulatory functions
• redistribute income and wealth
• provide or distribute goods and services on a non-market basis to individuals and the community, and/or
• provide services to General Government agencies.
PNFCs are government controlled entities that are either commercial or non-commercial in nature and largely self-funded from user charges. However, they may also receive funding from the General Government Sector for social programs (non-commercial activities).
PFCs are government controlled entities that perform central bank functions, or accept demand, time or savings deposits, or have the authority to incur liabilities and acquire financial assets in the market on their own account. This sector includes NSW Treasury Corporation. This note presents statements of:
• comprehensive income
• financial position
• cash flows, and
• changes in equity
for each sector, including the Total State Sector.
For the purpose of this disclosure, transactions and balances between sectors have not been eliminated, but those between entities within each sector have been eliminated.
Pursuant to National Competition Policy, the State has implemented a National Tax Equivalents Regime (NTER) for Public Corporations and some General Government agencies.
Tax effect accounting principles have therefore been adopted by all agencies that are part of the NTER. On consolidation, all NTER related income tax entries are eliminated for the Total State Sector.
The comparative year columns in the following tables have been restated for any corrections of errors and changes in accounting policies, for consistency with the 2017-18 presentation.
In addition, this note also presents information on total expenses and total assets by function for the General Government and Total State Sectors. ‘Functions’ are broad policy areas, which the ABS refers to as Classifications of the Functions of Government (COFOG).

Note 34
Total State Sector Accounts 7 - 147
This page left blank intentionally

Note 34
7 - 148 Total State Sector Accounts
The NSW Total State Sector Accounts Statement of Comprehensive Income by Sector for
the Year Ended 30 June
General Government Public Non-financial Corporations
2018-19 2017-18 Restated(a)
2018-19 2017-18
FROM CONTINUING OPERATIONS $m $m $m $m
Revenue from Transactions
Taxation 31,443 31,326 ... ...
Grants and Subsidies Commonwealth General Purpose 17,907 17,955 ... ...
Commonwealth Specific Purpose Payments 10,224 9,844 ... ...
Commonwealth National Partnership Payments 2,737 3,129 ... ...
Other Grants and Subsidies 981 931 3,022 3,176
Sale of Goods and Services 8,990 8,508 8,229 9,024
Interest 491 558 76 109
Dividend and Income Tax Equivalents from Other Sectors 1,932 1,578 ... ...
Other Dividends and Distributions 1,934 2,114 15 ...
Fines, Regulatory Fees and Other 5,051 4,730 749 811
Total Revenue from Transactions 81,690 80,672 12,092 13,120
Expenses from Transactions
Employee 33,158 31,644 2,754 2,802
Superannuation Superannuation Interest Cost 1,412 1,458 55 54
Other Superannuation 3,052 3,009 187 202
Depreciation and Amortisation(a) 5,192 4,811 2,815 2,758
Interest(a) 1,812 1,812 1,042 1,285
Income Tax Equivalents ... ... 309 438
Other Property ... ... ... ...
Other Operating Expense 21,146 19,652 5,852 5,974
Grants and Subsidies Recurrent Grants and Subsidies 13,595 12,908 68 134
Capital Grants 1,105 955 12 76
Total Expenses from Transactions 80,471 76,248 13,094 13,725
TRANSACTIONS FROM DISCONTINUING OPERATIONS ... ... 40 ...
NET RESULT FROM TRANSACTIONS -
NET OPERATING BALANCE (BUDGET RESULT
FOR THE GENERAL GOVERNMENT SECTOR) 1,219 4,425 (962) (605)
(a) Refer Note 31 Restatement/Corrections to Prior Year Comparatives, for details of corrections to prior period.

Note 34
Total State Sector Accounts 7 - 149
Public Financial Corporations Eliminations Total State Sector 2018-19 2017-18
Restated(a) 2018-19 2017-18
Restated(a) 2018-19 2017-18
Restated(a) $m $m $m $m $m $m
... (0) (502) (484) 30,940 30,841
... ... ... ... 17,907 17,955
... ... ... ... 10,224 9,844
... ... ... ... 2,737 3,129
... ... (3,102) (3,110) 900 998
1,230 1,266 (3,630) (3,584) 14,819 15,214
2,263 740 (2,030) (336) 801 1,072
... ... (1,932) (1,578) ... ...
1,715 1,708 (1,639) (1,675) 2,025 2,147
41 39 (102) (82) 5,739 5,497
5,249 3,753 (12,937) (10,848) 86,093 86,697
159 194 (527) (573) 35,544 34,067
... ... ... ... 1,466 1,513
12 12 ... ... 3,250 3,222
9 10 ... 0 8,016 7,579
2,299 2,251 (2,016) (2,010) 3,137 3,338
37 27 (346) (465) ... ...
... ... ... ... ... ...
3,097 1,105 (5,289) (3,454) 24,805 23,277
16 15 (2,759) (2,754) 10,921 10,304
... ... (376) (455) 741 576
5,629 3,614 (11,313) (9,711) 87,881 83,875
122 ... (154) ... 8 ...
(258) 139 (1,779) (1,137) (1,780) 2,822
(a) Refer Note 31 Restatement/Corrections to Prior Year Comparatives, for details of corrections to prior period.

Note 34
7 - 150 Total State Sector Accounts
The NSW Total State Sector Accounts Statement of Comprehensive Income by Sector for
the Year Ended 30 June (continued)
General Government Public Non-financial Corporations
2018-19 2017-18
Restated(a) 2018-19 2017-18
$m $m $m $m
NET OPERATING BALANCE 1,219 4,425 (962) (605)
OTHER ECONOMIC FLOWS - INCLUDED IN THE OPERATING RESULT
Gain/(Loss) from Liabilities(a) (2,500) (413) (33) 5
Other Net Gains/(Losses) 13,700 71 (3,146) 201
Share of Earnings/(Losses) from Equity Investments (excl. Dividends) (1) 160 ... ...
Dividends from Asset Sale Proceeds (0) 0 ... ...
Deferred Income Tax from Other Sectors (97) (17) (42) 35
Other 14 0 (5) (0)
Discontinuing Operations - Other Economic Flows (0) ... ... ...
Other Economic Flows - included in Operating Result 11,117 (198) (3,226) 240
OPERATING RESULT 12,335 4,226 (4,188) (365)
OTHER ECONOMIC FLOWS - OTHER COMPREHENSIVE INCOME
Items that will not be reclassified to operating result
Revaluations 7,205 17,588 26 6,744
Share of Associate's Other Comprehensive Income/(Loss)
that will not be Reclassified Subsequently to Operating Result (10) (42) ... ...
Actuarial Gain/(Loss) from Superannuation (13,364) 2,416 (756) 144
Net Gain/(Loss) on Equity Instruments at Fair Value through
Other Comprehensive Income (7,888) ... (0) ...
Deferred Tax Direct to Equity 151 96 (151) (96)
Items that may be reclassified subsequently to operating result Net Gain/(Loss) on Equity Investments in Other Sectors ... 6,296 ... (0)
Net Gain/(Loss) on Financial Instruments at Fair Value 19 2 (3) (8)
Share of Associate's Other Comprehensive Income/(Loss)
that may be Reclassified Subsequently to Operating Result (538) ... ... ...
Other 166 15 6 295
Other Economic Flows - Other Comprehensive
Income (14,259) 26,369 (879) 7,079
COMPREHENSIVE RESULT - TOTAL CHANGE IN NET WORTH BEFORE TRANSACTIONS WITH OWNERS
AS OWNERS(b) (1,924) 30,595 (5,066) 6,714
Dividends Distributed ... ... (1,475) (1,113)
Net Equity Injections/(Transfers) ... ... (3,240) 209
Total Change in Net Worth (1,924) 30,595 (9,781) 5,811
KEY FISCAL AGGREGATES
COMPREHENSIVE RESULT - TOTAL CHANGE IN NET WORTH BEFORE TRANSACTIONS WITH OWNERS
AS OWNERS (1,924) 30,595 (5,066) 6,714
Less: Net Other Economic Flows 3,142 (26,171) 4,105 (7,319)
NET OPERATING BALANCE 1,219 4,425 (962) (605)
Less: Net Acquisition of Non-Financial Assets Purchases of Non-Financial Assets 16,464 11,969 5,202 5,759
Sales of Non-Financial Assets (966) (437) (368) (703)
Less: Depreciation(a) (5,192) (4,811) (2,815) (2,758)
Plus: Change in inventories 38 6 (72) (16)
Plus: Other Movements in Non-Financial Assets
- assets acquired using finance leases 159 152 ... 3
- other (4) 126 402 258
Equals Total Net Acquisition of Non-Financial Assets 10,498 7,005 2,350 2,542
EQUALS: NET LENDING/(BORROWING) (9,280) (2,580) (3,312) (3,147)
(a) Refer Note 31 Restatement/Corrections to Prior Year Comparatives, for details of corrections to prior period. (b) Additional disclosure for the 2018-19 Total State Sector Accounts to disclose transactions with owners in their capacity as owners.

Note 34
Total State Sector Accounts 7 - 151
Public Financial Corporations Eliminations Total State Sector 2018-19 2017-18
Restated(a) 2018-19 2017-18
Restated(a) 2018-19 2017-18
Restated(a) $m $m $m $m $m $m
(258) 139 (1,779) (1,137) (1,780) 2,822
(684) (277) ... (3) (3,218) (688)
10,867 899 (10,090) ... 11,332 1,171
(0) (0) ... ... (1) 160
... ... 0 (0) ... ...
... ... 139 (18) ... ...
... ... ... ... 10 0
... ... 0 ... (0) ...
10,182 621 (9,950) (21) 8,123 643
9,924 761 (11,729) (1,157) 6,343 3,465
(0) 1 223 206 7,454 24,538
... ... ... ... (10) (42)
(1) 0 ... ... (14,120) 2,560
... ... 7,270 ... (618) ...
... ... 0 (0) ... ...
... ... ... (6,275) ... 21
... ... ... ... 16 (6)
... ... ... ... (538) ...
(0) ... (621) (250) (450) 60
(1) 1 6,872 (6,319) (8,267) 27,130
9,923 762 (4,857) (7,476) (1,924) 30,595
(266) ... 1,740 1,113 ... ...
(16,612) 72 19,852 (281) ... ...
(6,955) 834 16,735 (6,644) (1,924) 30,595
9,923 762 (4,857) (7,476) (1,924) 30,595
(10,181) (623) 3,078 6,340 144 (27,773)
(258) 139 (1,779) (1,137) (1,780) 2,822
2 25 ... ... 21,668 17,753
... (0) 16 1 (1,317) (1,140)
(9) (10) ... ... (8,016) (7,579)
... ... ... ... (34) (10)
... ... ... ... 159 155
... ... (42) (40) 357 344
(7) 15 (26) (39) 12,816 9,523
(251) 125 (1,753) (1,098) (14,595) (6,701)
(a) Refer Note 31 Restatement/Corrections to Prior Year Comparatives, for details of corrections to prior period. (b) Additional disclosure for the 2018-19 Total State Sector Accounts to disclose transactions with owners in their capacity as owners.

Note 34
7 - 152 Total State Sector Accounts
The NSW Total State Sector Accounts Statement of Financial Position by Sector as at 30 June
General Government Public Non-financial Corporations
2019 2018 Restated(a)
2019 2018
$m $m $m $m
ASSETS
Financial Assets Cash and Cash Equivalent Assets(a) 1,969 5,417 2,548 3,808
Receivables 7,491 6,721 1,211 1,253
Investments, Loans and Placements
Financial Assets at Fair Value(a) 43,333 32,578 240 236
Other Financial Assets 2,591 5,556 656 1,463
Advances paid 1,193 1,017 0 1
Tax Equivalents Receivable 32 128 9 3
Deferred Tax Equivalents 2,245 2,192 109 112
Equity
Investments in Other Public Sector Entities 98,990 112,911 ... ...
Investments in Associates 12,055 5,987 ... ...
Other 8 722 189 167
Total Financial Assets 169,907 173,228 4,963 7,041
Non-Financial Assets Inventories 399 327 474 499
Forestry Stock and Other Biological Assets 10 9 1,171 984
Assets Classified as Held for Sale 222 320 61 110
Investment Properties ... ... 648 644
Property, Plant and Equipment
Land and Buildings 89,963 83,390 75,775 77,641
Plant and Equipment 12,088 10,941 5,968 6,397
Infrastructure Systems(a) 119,291 102,147 48,645 55,330
Intangibles 3,694 3,691 1,108 1,050
Other 6,707 7,426 170 226
Total Non-financial Assets 232,375 208,252 134,020 142,880
TOTAL ASSETS 402,282 381,480 138,983 149,921
LIABILITIES Deposits Held 67 130 70 91
Payables 7,079 7,251 2,136 2,516
Borrowings and Derivatives at Fair Value 207 5 3 1,254
Borrowings at Amortised Cost 37,656 32,441 24,558 24,855
Advances Received 756 797 478 374
Employee Provisions 20,802 18,015 1,150 1,060
Superannuation Provision 67,696 54,200 3,010 2,218
Tax Equivalents Payable 3 3 32 119
Deferred Tax Equivalent Provision 108 112 2,246 2,192
Other Provisions 11,604 10,210 1,410 1,609
Other 6,134 6,223 322 287
TOTAL LIABILITIES 152,110 129,385 35,415 36,574
NET WORTH 250,172 252,095 103,567 113,348
OTHER FISCAL AGGREGATES
Net Debt (10,401) (11,195) 21,664 21,066
Net Financial Liabilities 81,194 69,068 30,453 29,533
(a) Refer Note 31 Restatement/Corrections to Prior Year Comparatives, for details of corrections to prior period.

Note 34
Total State Sector Accounts 7 - 153
Public Financial Corporations Eliminations Total State Sector 2019 2018
Restated(a) 2019 2018
Restated(a) 2019 2018
Restated(a) $m $m $m $m $m $m
4,701 4,905 (239) (161) 8,979 13,969
1,154 924 (2,330) (2,350) 7,527 6,547
56,288 54,273 (55,301) (49,444) 44,560 37,643
7 211 (461) (2,773) 2,793 4,456
... ... (478) (374) 715 644
... ... (41) (131) ... ...
... ... (2,354) (2,304) ... ...
... 2,832 (98,990) (115,743) ... ...
2 2 ... ... 12,057 5,988
24,272 19,531 ... ... 24,468 20,420
86,424 82,676 (160,195) (173,279) 101,099 89,666
... ... ... ... 873 826
... ... ... ... 1,181 993
... ... ... ... 283 430
... ... ... ... 648 644
14 17 594 580 166,346 161,627
18 29 ... ... 18,075 17,367
... ... 0 681 167,936 158,158
7 4 ... ... 4,809 4,745
36 65 (464) (1,122) 6,449 6,594
75 114 131 138 366,601 351,384
86,499 82,791 (160,064) (173,141) 467,699 441,051
857 2,695 (700) (2,531) 293 385
337 255 (1,195) (1,188) 8,357 8,833
72,783 62,578 (236) (1) 72,757 63,836
6 7 (55,069) (49,846) 7,151 7,457
... ... (478) (374) 756 797
35 42 (18) (11) 21,969 19,106
5 4 ... ... 70,711 56,421
7 9 (41) (130) ... ...
... ... (2,354) (2,304) ... ...
6,306 4,750 (1,136) (1,168) 18,185 15,400
10,898 10,231 (4) (19) 17,350 16,721
91,233 80,570 (61,232) (57,573) 217,528 188,956
(4,734) 2,220 (98,833) (115,568) 250,172 252,095
12,650 5,892 (3) (1) 23,909 15,762
4,809 726 (27) (37) 116,429 99,289
(a) Refer Note 31 Restatement/Corrections to Prior Year Comparatives, for details of corrections to prior period.

Note 34
7 - 154 Total State Sector Accounts
The NSW Total State Sector Accounts Statement of Cash Flows by Sector for the Year
Ended 30 June
General Government Public Non-financial Corporations(a)
2018-19 2017-18 2018-19 2017-18
$m $m $m $m
CASH FLOWS FROM OPERATING ACTIVITIES
Receipts
Taxation 31,020 31,218 ... ...
Sale of Goods and Services 9,360 9,334 8,826 9,502
Grants and Subsidies 31,810 31,852 3,017 3,172
Interest 518 457 70 99
Dividends and Income Tax Equivalents from Other Sectors 1,897 1,031 ... ...
Other 12,226 12,113 1,670 1,184
Total Receipts 86,830 86,006 13,583 13,957
Payments Employee Related (31,896) (30,693) (2,323) (2,922)
Superannuation (4,325) (4,262) (205) (206)
Payments for Goods and Services (20,874) (20,027) (6,199) (5,439)
Grants and Subsidies (13,739) (13,221) (78) (68)
Interest (1,455) (1,508) (922) (1,123)
Distributions Paid ... ... (423) ...
Other (7,213) (5,588) (1,329) (1,178)
Total Payments (79,502) (75,300) (11,479) (10,936)
NET CASH FLOWS FROM OPERATING ACTIVITIES 7,328 10,706 2,104 3,021
CASH FLOWS FROM INVESTING ACTIVITIES
Non-financial Assets Proceeds from Sale of Non-financial Assets 452 521 371 709
Purchases (18,087) (13,323) (5,325) (5,649)
Net Cash Flows from Investments in Non-financial Assets (17,635) (12,802) (4,955) (4,940)
Financial Assets (Policy Purposes) Receipts 18,026 808 0 12
Payments (2,341) (1,382) (810) 53
Net Cash Flows from Investments in Financial Assets (Policy Purposes) 15,685 (574) (810) 65
Financial Assets (Liquidity Purposes)
Proceeds from Sale of Investments 10,029 9,471 228 166
Purchase of Investments(b) (23,904) (8,988) (22) (338)
Net Cash Flows from Investments in Financial Assets
(Liquidity Purposes)(b) (13,875) 482 206 (173)
NET CASH FLOWS FROM INVESTING ACTIVITIES(b) (15,825) (12,894) (5,559) (5,048)
CASH FLOWS FROM FINANCING ACTIVITIES Advances Received 56 30 2,025 1,211
Advances Repaid (125) (70) (31) (742)
Proceeds from Borrowings 5,561 957 2,067 3,897
Repayments of Borrowings (612) (1,773) (211) (267)
Dividends Paid ... ... (1,611) (684)
Deposits Received (Net) 19 24 (21) 58
Other (Net) 151 94 21 (374)
NET CASH FLOWS FROM FINANCING ACTIVITIES 5,050 (738) 2,238 3,100
n
NET INCREASE/(DECREASE) IN CASH HELD(b) (3,448) (2,925) (1,216) 1,073
(a) The Statement of Cash Flows is presented to include both continuing and discontinued operations; amounts related to discontinued operations are disclosed in Note 5 Discontinued Operations.
(b) Refer Note 31 Restatement/Corrections to Prior Year Comparatives, for details of corrections to prior period.

Note 34
Total State Sector Accounts 7 - 155
Public Financial Corporations(a) Eliminations Total State Sector(a) 2018-19 2017-18 2018-19 2017-18 2018-19 2017-18
Restated(b) $m $m $m $m $m $m
6 (8) (490) (470) 30,536 30,740
1,242 1,264 (3,875) (4,198) 15,553 15,902
... ... (3,104) (3,115) 31,723 31,909
2,118 891 (1,844) (159) 862 1,288
154 ... (2,051) (1,031) ... ...
1,719 1,845 (1,735) (1,719) 13,880 13,423
5,239 3,992 (13,098) (10,692) 92,554 93,263
(175) (189) 158 670 (34,235) (33,134)
(13) (8) ... ... (4,542) (4,476)
(2,344) (873) 5,669 4,095 (23,747) (22,244)
(8) (8) 3,124 3,135 (10,701) (10,162)
(2,358) (2,515) 1,838 1,918 (2,897) (3,228)
(39) ... 462 ... ... ...
492 2,999 137 58 (7,914) (3,709)
(4,445) (596) 11,389 9,878 (84,037) (76,954)
794 3,397 (1,710) (815) 8,517 16,309
... 0 (16) (1) 807 1,229
(2) (25) 116 (163) (23,298) (19,160)
(2) (24) 100 (165) (22,492) (17,931)
... ... (31) (742) 17,995 78
(553) ... 2,025 1,244 (1,679) (85)
(553) ... 1,994 502 16,316 (7)
6,237 8,421 (3,876) (3,349) 12,618 14,709
(11,417) (11,519) 7,217 7,401 (28,126) (13,444)
(5,179) (3,098) 3,341 4,054 (15,508) 1,265
(5,734) (3,123) 5,435 4,392 (21,684) (16,673)
... 86 (2,025) (1,297) 56 30
... ... 31 742 (125) (70)
62,561 68,779 (6,098) (6,002) 64,090 67,631
(57,677) (66,932) 2,615 1,639 (55,885) (67,333)
(148) (80) 1,759 764 ... ...
... ... ... ... (2) 82
... (28) (142) 253 30 (55)
4,736 1,825 (3,859) (3,902) 8,164 285
(204) 2,099 (134) (325) (5,003) (78)
(a) The Statement of Cash Flows is presented to include both continuing and discontinued operations; amounts related to discontinued operations are disclosed in Note 5 Discontinued Operations.
(b) Refer Note 31 Restatement/Corrections to Prior Year Comparatives, for details of corrections to prior period.

Note 34
7 - 156 Total State Sector Accounts
The NSW Total State Sector Accounts Statement of Cash Flows by Sector for the Year
Ended 30 June (continued)
General Government Public Non-financial Corporations(a)
2018-19 2017-18 2018-19 2017-18
$m $m $m $m
Opening Cash and Cash Equivalents 5,417 8,731 3,808 2,773
Reclassification of Cash Equivalents (1) (388) (43) (38)
CLOSING CASH BALANCE(b) 1,969 5,417 2,548 3,808
DERIVATION OF CASH RESULT Net Cash Flows from Operating Activities 7,328 10,706 2,104 3,021
Net Cash Flows from Investments in Non-Financial Assets (17,635) (12,802) (4,955) (4,940)
Dividend Distributions ... ... (1,611) (684)
CASH SURPLUS/(DEFICIT) (10,307) (2,096) (4,462) (2,603)
(a) The Statement of Cash Flows is presented to include both continuing and discontinued operations; amounts related to discontinued operations are disclosed in Note 5 Discontinued Operations.
(b) Refer Note 31 Restatement/Corrections to Prior Year Comparatives, for details of corrections to prior period.

Note 34
Total State Sector Accounts 7 - 157
Public Financial Corporations(a) Eliminations Total State Sector(a) 2018-19 2017-18 2018-19 2017-18 2018-19 2017-18
$m $m $m $m $m $m
4,905 2,371 (161) (20) 13,969 13,855
... 435 56 183 12 192
4,701 4,905 (239) (161) 8,979 13,969
794 3,397 (1,710) (815) 8,517 16,309
(2) (24) 100 (165) (22,492) (17,931)
(148) (80) 1,759 764 ... ...
644 3,293 150 (216) (13,975) (1,622)
(a) The Statement of Cash Flows is presented to include both continuing and discontinued operations; amounts related to discontinued operations are disclosed in Note 5 Discontinued Operations.
(b) Refer Note 31 Restatement/Corrections to Prior Year Comparatives, for details of corrections to prior period.

Note 34
7 - 158 Total State Sector Accounts
The NSW Total State Sector Accounts Statement of Changes in Equity for the Whole of
Government by Sector for the Year Ended 30 June 2019
Equity at
1 July 2018
Correction to Prior Period(a)
Equity at
1 July 2018
Restated(a)
AASB 9 Transition
adjustment(b) Comprehensive
Result(b)
Transfers between
equity classes
Transactions with owners as owners
Equity at 30 June 2019
$m $m $m $m $m $m $m $m
General Government Sector Accumulated Funds 78,327 (2,084) 76,243 14 (701) (187) ... 75,368
Reserves Asset Revaluation Surplus 90,248 ... 90,248 ... 7,205 (250) ... 97,202
Equity Investment Revaluation Surplus/Hedge Reserve in Associate 25 ... 25 ... (548) (33) ... (556)
Hedging Reserve (17) ... (17) ... 19 (0) ... 1
Available for Sale Reserve 85,597 ... 85,597 (85,597) ... ... ... ...
Financial Assets at Fair Value through Other Comprehensive Income ... ... ... 85,573 (7,888) 470 ... 78,155
Other ... ... ... ... ... 0 ... 0
254,179 (2,084) 252,095 (10) (1,914) ... ... 250,172
Public Non-Financial Corporation Sector Accumulated Funds 51,296 ... 51,296 8 (5,089) 1,151 (4,714) 42,652
Reserves ... Asset Revaluation Surplus 62,050 ... 62,050 ... 26 (1,207) ... 60,869
Equity Investment Revaluation Surplus/Hedge Reserve in Associate ... ... ... ... ... ... ...
Hedging Reserve (118) ... (118) ... (3) 118 ... (3)
Available for Sale Reserve 8 8 (8) ... ... ... ...
Financial Assets at Fair Value through Other Comprehensive Income ... ... ... ... ... ... ...
Other 112 ... 112 ... ... (62) ... 50
113,348 ... 113,348 ... (5,066) ... (4,714) 103,567
Public Financial Corporation Sector Accumulated Funds 2,220 ... 2,220 ... 9,925 ... (16,878) (4,733)
Reserves Asset Revaluation Surplus 1 ... 1 ... (0) ... ... 0
Equity Investment Revaluation Surplus/Hedge Reserve in Associate ... ... ... ... ... ... ... ...
Hedging Reserve ... ... ... ... ... ... ... ...
Financial Assets at Fair Value through Other Comprehensive Income (0) ... (0) ... ... ... ... (0)
Other ... ... ... ... ... ... ... ...
2,219 ... 2,219 ... 9,924 ... (16,878) (4,734)
Eliminations (115,567) ... (115,567) ... (4,858) ... 21,592 (98,833)
Total State Sector 254,179 (2,084) 252,095 (10) (1,914) ... ... 250,172
(a) Refer Note 31 Restatement/Corrections to Prior Year Comparatives, for details of corrections to prior period. (b) The Statement of Comprehensive Income includes the AASB9 transition adjustments in the ‘Other Comprehensive Income’.
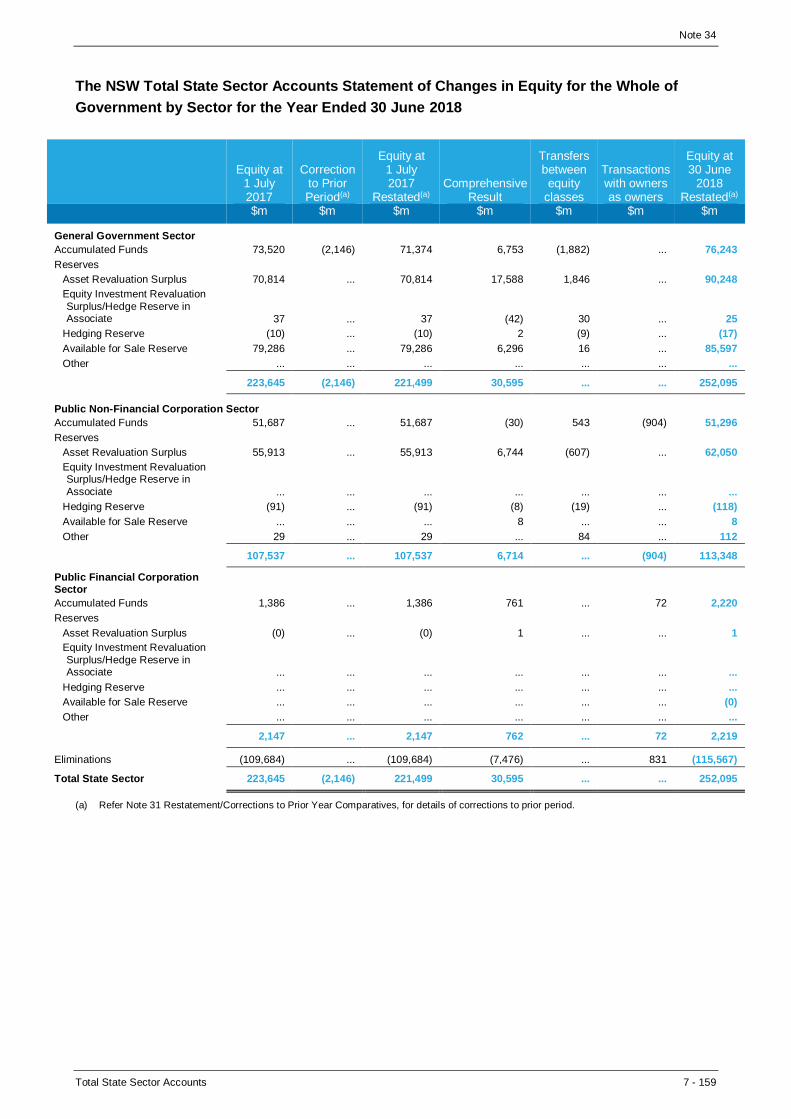
Note 34
Total State Sector Accounts 7 - 159
The NSW Total State Sector Accounts Statement of Changes in Equity for the Whole of
Government by Sector for the Year Ended 30 June 2018
Equity at 1 July 2017
Correction to Prior Period(a)
Equity at 1 July 2017
Restated(a) Comprehensive
Result
Transfers between equity
classes
Transactions with owners as owners
Equity at 30 June
2018 Restated(a)
$m $m $m $m $m $m $m
General Government Sector Accumulated Funds 73,520 (2,146) 71,374 6,753 (1,882) ... 76,243
Reserves Asset Revaluation Surplus 70,814 ... 70,814 17,588 1,846 ... 90,248
Equity Investment Revaluation
Surplus/Hedge Reserve in Associate 37 ... 37 (42) 30 ... 25
Hedging Reserve (10) ... (10) 2 (9) ... (17)
Available for Sale Reserve 79,286 ... 79,286 6,296 16 ... 85,597
Other ... ... ... ... ... ... ...
223,645 (2,146) 221,499 30,595 ... ... 252,095
Public Non-Financial Corporation Sector Accumulated Funds 51,687 ... 51,687 (30) 543 (904) 51,296
Reserves Asset Revaluation Surplus 55,913 ... 55,913 6,744 (607) ... 62,050
Equity Investment Revaluation Surplus/Hedge Reserve in
Associate ... ... ... ... ... ... ...
Hedging Reserve (91) ... (91) (8) (19) ... (118)
Available for Sale Reserve ... ... ... 8 ... ... 8
Other 29 ... 29 ... 84 ... 112
107,537 ... 107,537 6,714 ... (904) 113,348
Public Financial Corporation Sector Accumulated Funds 1,386 ... 1,386 761 ... 72 2,220
Reserves Asset Revaluation Surplus (0) ... (0) 1 ... ... 1
Equity Investment Revaluation
Surplus/Hedge Reserve in Associate ... ... ... ... ... ... ...
Hedging Reserve ... ... ... ... ... ... ...
Available for Sale Reserve ... ... ... ... ... ... (0)
Other ... ... ... ... ... ... ...
2,147 ... 2,147 762 ... 72 2,219
Eliminations (109,684) ... (109,684) (7,476) ... 831 (115,567)
Total State Sector 223,645 (2,146) 221,499 30,595 ... ... 252,095
(a) Refer Note 31 Restatement/Corrections to Prior Year Comparatives, for details of corrections to prior period.

Note 34
7 - 160 Total State Sector Accounts
Information on Expenses and Assets by Function(a)
General
Government Sector Total State Sector
2018-19 2017-18 2018-19 2017-18 $m $m $m $m
Total Expenses by Function (Policy Area)
General Public Services 8,310 8,404 6,979 6,967
Defence ... ... ... ...
Public Order and Safety 8,232 7,470 8,246 6,937
Economic Affairs 2,442 2,432 4,341 4,685
Environmental Protection 1,144 1,015 1,139 985
Housing and Community Amenities 1,143 886 3,070 3,136
Health 22,683 21,496 22,671 20,607
Recreation, Culture and Religion 1,249 1,206 1,913 1,737
Education 17,705 16,660 17,596 15,554
Social Protection 7,419 7,601 9,022 8,488
Transport 10,142 9,079 12,906 14,779
Total Expenses(b) 80,471 76,248 87,881 83,875
Total Assets by Function (Policy Area)(c)
General Public Services 143,915 155,599 90,063 84,247
Defence ... ... ... ...
Public Order and Safety 10,053 9,173 10,051 9,173
Economic Affairs 19,332 18,545 23,990 22,885
Environmental Protection 763 738 846 824
Housing and Community Amenities 3,197 3,175 15,401 16,048
Health 23,510 20,371 23,510 20,371
Recreation, Culture and Religion 17,233 15,708 23,890 22,343
Education 37,402 36,776 37,402 36,776
Social Protection 6,256 6,328 66,917 66,447
Transport 140,621 115,067 175,628 161,937
Total Assets 402,282 381,480 467,699 441,051
(a) Refer Note 31 Restatement/Corrections to Prior Year Comparatives, for details of corrections to prior period. (b) The aggregate expenses and assets for the General Government Sector can be greater than the Total State Sector aggregates due to the
elimination of inter sector expenses and asset balances from the Total State aggregates. (c) General Public Services for the General Government Sector includes the State’s equity investment in the PNFC/PFC sectors which is
eliminated in Total State Sector assets.
The aggregate amount of the comprehensive result attributable to the General Government Sector from the PNFC and PFC sector entities in 2018-19 is $4,857 million net surplus (2018: $7,476 million net surplus). It comprises the sum of General Government Sector inter-sector expenses (grants, interest on borrowings, and purchases) less the sum of General Government Sector revenues (dividends, income and other tax revenues, revenues from sale of goods and services, interest from inter-sector loans, and gains on the equity investment in the PNFC/PFC sectors).

Note 35
Total State Sector Accounts 7 - 161
Note 35: Key Fiscal Aggregates and Reconciliations to Government Finance Statistics
Footnote
General Government
Sector
Public Non-financial
Corporations
Public Financial
Corporations Total State
Sector
2018-19 2018-19 2018-19 2018-19 $m $m $m $m
Reconciliation to GFS Net Operating Balance
Net Result from Transactions - Net Operating Balance 1,219 (962) (258) (1,780)
Convergence Differences
Low Interest Loans a 1 15 ... 16
PNFC/PFC Dividends Accrued b ... (1,475) (266) ...
Total Convergence Differences 1 (1,459) (266) 16
GFS Net Operating Balance 1,219 (2,421) (524) (1,764)
Reconciliation to GFS Net Lending/(Borrowing)
Net Lending/(Borrowing) (9,280) (3,312) (251) (14,595)
Convergence Differences Relating to Net Operating Balance as Shown Above 1 (1,459) (266) 16
Total Convergence Differences 1 (1,459) (266) 16
GFS Net Lending/(Borrowing) (9,279) (4,771) (517) (14,580)
Reconciliation to GFS Total Change In Net Worth
Comprehensive Result - Total Change In Net Worth (1,924) (9,781) (6,955) (1,924)
Convergence Differences In AASB 1049 Comprehensive Result, but Not In GFS Change In Net Worth Low Interest Loans a (12) 15 ... 3
Allowance for Doubtful Debts c 5 1 ... 9
Prepaid Licence Income d (93) ... ... (93)
Other Settlement Provisions and Obligation Payments e 167 (56) 0 111
Measurement Relating to Assets Held for Sale f (4) (0) ... (6)
Deferred Tax Assets/Liabilities g (57) 56 ... (0)
Equity Investment in the PFNC/PFC Sectors for Net Assets Not Recognised Under GFS h 18 ... ... ...
In GFS Change in Net Worth, but Not In AASB 1049 Comprehensive Result Transactions With Owners as Owners i ... (0) (0) ...
Classification of GFS PNFC/PFC Net Worth as a Liability j ... 9,764 6,954 ...
Total Convergence Differences k
25 9,781 6,955 23
GFS Total Change In Net Worth (1,899) ... ... (1,899)

Note 35
7 - 162 Total State Sector Accounts
Footnote
General Government
Sector
Public Non-financial
Corporations
Public Financial
Corporations Total State
Sector
2019 2019 2019 2019 $m $m $m $m
Reconciliation to GFS Net Worth
Net Worth 250,172 103,567 (4,734) 250,172
Convergence Differences In AASB 1049 Net Worth, but Not In GFS Low Interest Loans a (19) (238) ... (258)
Allowance for Doubtful Debts c 485 26 ... 510
Prepaid Licence Income d 2,774 ... ... 2,774
Other Settlement Provisions and Obligation Payments e 1,577 224 2 1,804
Measurement Relating To Assets Held For Sale f 2 1 ... 2
Deferred Tax Assets/Liabilities g (2,137) 2,136 ... (0)
Equity Investment in the PFNC/PFC Sectors for
Net Assets h 2,152 ... ... ...
In GFS Net Worth, but Not In AASB 1049 Classification of GFS PNFC/PFC Net Worth as a Liability j ... (105,717) 4,732 ...
Total Convergence Differences k
4,834 (103,567) 4,734 4,834
GFS Net Worth 255,006 ... ... 255,006

Note 35
Total State Sector Accounts 7 - 163
Footnote
General Government
Sector
Public Non-Financial
Corporations
Public Financial
Corporations Total State
Sector
2017-18 Restated(l)
2017-18 2017-18 Restated(l)
2017-18 Restated(l)
$m $m $m $m
Reconciliation to GFS Net Operating Balance
Net Result from Transactions - Net Operating Balance 4,425 (605) 139 2,822
Convergence Differences
Low Interest Loans a (6) 15 ... 9
PNFC/PFC Dividends Accrued b ... (1,113) ... ...
Total Convergence Differences (6) (1,098) ... 9
GFS Net Operating Balance 4,419 (1,703) 139 2,831
Reconciliation to GFS Net Lending/(Borrowing)
Net Lending/(Borrowing) (2,580) (3,147) 125 (6,701)
Convergence Differences Relating to Net Operating Balance as Shown Above (6) (1,098) ... 9
Total Convergence Differences (6) (1,098) ... 9
GFS Net Lending/(Borrowing) (2,586) (4,245) 125 (6,692)
Reconciliation to GFS Total Change in Net Worth
Comprehensive Result - Total Change in Net Worth 30,595 5,811 834 30,595
Convergence Differences In AASB 1049 Comprehensive Result, but not in GFS Change in Net Worth Low Interest Loans a (6) 15 ... 9
Allowance for Doubtful Debts c 8 (6) ... (1)
Prepaid Licence Income d (93) ... ... (93)
Other Settlement Provisions and Obligation Payments e 182 281 2 465
Measurement Relating to Assets Held for Sale f (8) 1 ... (8)
Deferred Tax Assets/Liabilities g (90) 90 ... (0)
Equity Investment in the PFNC/PFC Sectors for Net Assets Not Recognised Under GFS h 381 ... ... ...
In GFS Change in Net Worth, but Not In AASB 1049 Comprehensive Result Transactions with Owners as Owners i ... (0) (762) ...
Classification of GFS PNFC/PFC Net Worth as a Liability j ... (6,192) (74) ...
Total Convergence Differences k
374 (5,811) (834) 374
GFS Total Change in Net Worth 30,969 ... ... 30,969

Note 35
7 - 164 Total State Sector Accounts
Footnote
General Government
Sector
Public Non-Financial
Corporations
Public Financial
Corporations Total State
Sector
2018
Restated(l)
2018 2018 2018 Restated(l)
$m $m $m $m
Reconciliation to GFS Net Worth
Net Worth 252,095 113,348 2,220 252,095
Convergence Differences In AASB 1049 Net Worth, but Not in GFS Low Interest Loans a (7) (254) ... (261)
Allowance for Doubtful Debts c 480 25 ... 501
Prepaid Licence Income d 2,867 ... ... 2,867
Other Settlement Provisions and Obligation Payments e 1,410 281 2 1,693
Deferred Tax Assets/Liabilities g (2,080) 2,080 ... (0)
Equity Investment in the PFNC/PFC Sectors for Net Assets h 2,134 ... ... ...
In GFS Net Worth, but Not In AASB 1049 Classification of GFS PNFC/PFC Net Worth as a Liability j ... (115,481) (2,223) ...
Total Convergence Differences k
4,810 (113,348) (2,220) 4,808
GFS Net Worth 256,904 ... ... 256,904
(a) Under GFS, interest free or low interest loans are recognised based on the amount lent, and interest is recognised based on any cash interest paid. In contrast, under AGAAP, loans are recognised initially at fair value and thereafter at amortised cost. Any difference between the original amount lent and the fair value is initially recognised to the operating result and subsequently amortised over the life of the loan. This results in the value of GFS advances/(borrowings) being higher/(lower) than AGAAP advances/(borrowings).
(b) GFS recognises dividends to owners by the PNFC and PFC sectors as a GFS expense, whereas under AGAAP they are treated as a distribution to owners and therefore a direct reduction of accumulated funds. This difference does not flow through to the Total State Sector as dividends are eliminated on consolidation.
(c) GFS does not recognise an allowance for doubtful debts as GFS only recognises bad debts when they are written off. Under AGAAP an allowance for doubtful debts is recognised in the Statement of Financial Position and doubtful debts are recognised in the Statement of Comprehensive Income as ‘Other Economic Flows’.
(d) AGAAP recognises the prepaid income liability for unamortised prepaid licences in the Statement of Financial Position. This liability is excluded from the GFS Statement of Financial Position as the prepaid income is treated as an upfront sale of a non-produced intangible asset for GFS purposes. The change in net worth for prepaid licence income is normally a negative balance due to amortisation of the prepaid licence income.
(e) GFS does not recognise provisions and obligation payments when there is no present counterparty to the transaction. The balance for provisions and other liabilities is therefore lower under GFS as a result of the exclusion.
(f) Measurement difference between AGAAP and GFS for the valuation of Assets Held for Sale. AASB 5 Non-current Assets Held for Sale and Discontinued Operations requires valuation at fair value less costs to sell, whereas GFS valuation is at market value which does not include costs to sell.
(g) AGAAP adopts tax effect accounting whereby timing differences between accounting profit and tax profit are deferred as future income tax benefit assets or provisions for deferred tax liabilities. GFS does not recognise deferred tax. This convergence difference also flows through to the GGS, as the GGS is the counterparty to the tax effect accounting entries recognised by the PNFC/PFC entities. However, this difference does not flow through to the Total State Sector as income tax equivalents are eliminated on consolidation. Revaluations of infrastructure within the PNFC sector impacts the provisions for deferred tax liabilities and may result in significant differences between the GFS and the AASB 1049 sector aggregates.
(h) The basis for the valuation of the PNFC/PFC sector is net assets in the absence of a market value for both accounting and GFS purposes. The measurement of net assets differs for GFS in that, for example, allowance for impairment of receivables, onerous contract provisions and deferred income tax balances are not recognised in net worth under GFS. In addition, the negative net worth of the indivi dual public sector entities is included in the GGS valuation of those entities.
(i) Transactions with owners as owners are excluded for the comprehensive result, however are included in the movement in GFS net worth. These type of transactions result in a convergence difference as the total change in net worth under AGAAP is disclosed before transactions with owners as owners, while under GFS, transactions with owners as owners is included in the movement in GFS net worth.
(j) The PFNC/PFC sectors report zero net worth for GFS purposes as GFS treats the ownership interest (contributed equity) as a liability.
(k) The convergence differences related to total change in net worth will be either positive or negative in a particular year due to the movement of the balances in the statement of financial position.
(l) Refer Note 31 Restatement/Corrections to Prior Year Comparatives, for details of corrections to prior period.

Note 35
Total State Sector Accounts 7 - 165
Reclassifications
The following classification differences exist between lines presented in this AASB 1049 Whole of Government and General Government Sector Financial Reporting report and GFS line presentations. While these classification differences do not affect the net operating results nor net worth aggregates, they result in different line presentations between GFS and AASB 1049 (i.e. AGAAP) reports.
2018-19
Footnote
General Government
Sector
Public Non-Financial
Corporations
Public Financial
Corporations Total State
Sector $m $m $m $m
Items Grossed Up in GFS Operating Statements - Not In AGAAP
Statements of Comprehensive Income
Transfer Payments a 4,845 ... ... 4,845
Environmental Levies b 8 ... ... 8
Transport and Energy Subsidies c ... ... ... 166
Insurance Tax Receipts to GGS d ... ... ... ...
Items Grossed Up In AGAAP Statements of Comprehensive Income - Not In GFS
GG Employees Providing Services to PNFCs e 659 11 ... ...
Other Reclassifications on the Statements of Comprehensive Income Dividends Accrued in GFS Results, but a Direct Movement in AGAAP f ... 1,475 266 ...
Discontinuing Operations - Income Tax Equivalents Return of Capital in GFS, Deferred Income Tax
Equivalent in AGAAP g ... ... ... ...
Statements of Financial Position Deferred Income - Payables in GFS, Other Liabilities in AGAAP h 5,313 315 ... 5,624
Prepaid Expenses - Receivables in GFS, Other Non-Financial Assets in AGAAP h 3,727 76 35 3,788
Rental Bond Assets and Liabilities in GFS, but Off Balance Sheet (Trust Funds) in AGAAP i 1,758 ... ... 1,758
Salaries Accrued & Employee on Costs are Provision Liabilities in GFS, but Payables for AGAAP j 657 75 6 734

Note 35
7 - 166 Total State Sector Accounts
2017-18
Footnote
General Government
Sector
Public Non-Financial
Corporations
Public Financial
Corporations Total State
Sector $m $m $m $m
Items Grossed Up in GFS Operating Statements - Not In AGAAP
Statements of Comprehensive Income
Transfer Payments a 4,557 ... ... 4,557
Environmental Levies b 6 ... ... 6
Transport and Energy Subsidies c ... ... ... 160
Insurance Tax Receipts to GGS d ... ... ... ...
Items Grossed Up in AGAAP Statements of Comprehensive Income - Not In GFS
GG Employees Providing Services to PNFCs e 705 10 ... ...
Other Reclassifications on the Statements of Comprehensive Income Dividends Accrued in GFS Results, but a Direct Movement in AGAAP f ... 1,113 ... ...
Discontinuing Operations - Income Tax Equivalents Return of Capital in GFS, Deferred Income Tax Equivalent in AGAAP g ... ... ... ...
Statements of Financial Position Deferred Income - Payables in GFS, Other Liabilities in AGAAP h 5,419 213 5 5,621
Prepaid Expenses - Receivables in GFS, Other Non- Financial Assets in AGAAP h 1,946 96 64 1,391
Rental Bond Assets and Liabilities in GFS, but Off Balance Sheet (Trust Funds) in AGAAP i 1,546 ... ... 1,546
Salaries Accrued & Employee on Costs are Provision Liabilities in GFS, but Payables for AGAAP j 630 42 11 671
(a) New South Wales receives certain transfer payments from the Commonwealth which are required to be on-passed to recipients as determined by the Australian Government. Most of these transfer payments relate to grants from the Australian Government for specific non-government schools or for local government authorities. As New South Wales has no control over the transfer payments, they are not recognised as State revenues and expenses. However, the ABS has determined that for GFS purposes the transfer payments be recognised as GFS revenues and expenses of the States and Territories. New South Wales publishes information on these excluded transfer payments as a footnote to the grants revenue and expense notes to assist users understand the full value of the amounts on-passed. Refer Table 7 of the Outcomes report.
(b) GFS requires that certain environmental levies reported by PNFCs be also recognised and grossed up in the GG sector as tax revenue and as an equivalent subsidy expense paid back to the PNFC sector, for GFS purposes only.
(c) For Total State reporting purposes only, transport and energy subsidies paid from GGs to PNFCs for students and pensioners are eliminated from AGAAP statements. However, GFS treats the payment by the State as a gross expense, relating to a benefit paid to the household sector, and as gross revenue from the household sector for electricity sales and travel fares.
(d) A GGS/PFC classification difference arises in respect of the treatment of tax income. Under GFS, a tax or fine can only be imposed by a unit in the general government sector (GGS). As this income is collected by a PFC due to administrative requirements, it is reclassified as a tax receipt in the GGS and an equivalent subsidy is paid back to the PFC sector for GFS purposes only.
(e) Certain staff employed in the GG sector provide services to PNFCs. Under GFS, the employee expense related to these personnel is recognised in the PNFC sector where the services were provided. However, under AGAAP, the employee expense and the revenue recoverable from the PNFC sector is reported in the GG sector.
(f) Dividends accrued are a direct adjustment to equity i.e. they are treated as an equity distribution under AGAAP. Dividends accrued are reported as an expense for the PNFC and PFC sectors for GFS purposes.
(g) The component of income tax equivalents related to the disposal of discontinuing operations is reported as a return of capital, rather than as a transaction under GFS. This is reported as an Other economic flow, similar to deferred taxes under AGAAP. This reclassification difference impacts both GGS and PNFC entities, as the GGS sector is the counterparty to the entries recognised in the PNFC sector.
(h) GFS requires that deferred income and deferred expenses be classified as payables and receivables. However, they are reported as other assets and other liabilities under AASB 1049 and not as receivables/payables, as there is no present obligation to repay the deferred items.
(i) New South Wales excludes rental bond assets and an equal value of deposit liabilities from the AGAAP statements of financial position as they are considered to be trust monies. However, the Australian Bureau of Statistics has advised that rental bond monies are to be recognised on Statement of Financial Position for GFS purposes, and not treated off Balance Sheet as trust monies. This difference does not impact key fiscal aggregates, however it results in the GFS total assets and total liabilities being grossed up compared to the AGAAP aggregates.
(j) Salaries accruals and certain employee on-costs reported as payables under AGAAP are required to be classified as provision liabilities for GFS reporting purposes.

Note 36
Total State Sector Accounts 7 - 167
Note 36: Details of Consolidated Entities
The Total State Sector comprises the entities listed below.
Four controlled entities have a reporting date other than 30 June. The reporting date for the National Art School, Technical Education Trust Fund and the Border Fence Maintenance Board is 31 December. The reporting date for the Sydney Cricket and Sports Ground Trust is 28 February as it is aligned to the sporting year associated with its primary activities.
It is considered not material to the results and financial position of the TSSA to attempt to align the reporting period of these reporting entities to 30 June. Accordingly the annual financial results of these reporting entities as at the last reported year (ending December or February) have been consolidated into the 30 June TSSA.
Entities displayed in italics have been abolished.
Changes to Reporting Entities
There have been a number of changes to reporting entities since the last TSSA that affect reporting in this financial year. These changes are as a result of legislative amendments and Administrative Changes Orders which are outlined below:
• Regional Growth NSW Development Corporation was established under the Growth Centres
(Development Corporations) Amendment (Regional Growth NSW Development Corporation) Order 2019
effective 28 June 2019.
• Sydney Metro was created as a NSW Government agency under the Transport Administration
Amendment (Sydney Metro) Act 2018 effective 1 July 2018.
• Western City and Aerotropolis Authority was established as a NSW Government agency under the
Western City and Aerotropolis Authority Act 2018 No 53 effective 9 November 2018.
• Western City and Aerotropolis Authority Staff Agency was established as a Public Service executive
agency related to the Department of Premier and Cabinet under Administrative Arrangements
(Administrative Changes—Western City and Aerotropolis Authority) Order 2018 (2018-624) effective
9 November 2018.
• Hunter Development Corporation was renamed to Hunter and Central Coast Development Corporation
under the Growth Centres (Development Corporations) Amendment (Hunter and Central Coast
Development Corporation) Order 2018 effective 1 November 2018.
• Various reserve trusts were renamed under the Crown Lands Management Act (2016) effective 1 July
2018. The reserve trusts for reserved or dedicated Crown Land that have been reconstituted as a
statutory land manager had their name to be the former name of the reserve trust (excluding the word
‘Trust’ if it forms part of its name) and ending with the words ‘Land Manager’.
Various changes to consolidated entities under the Administrative Arrangements (Administrative Changes—Public Service Agencies) Order 2019, Administrative Arrangements (Administrative Changes—Public Service Agencies) Amendment Order 2019 and Administrative Arrangements (Administrative Changes—Miscellaneous) Order 2019 effective 1 July 2019 are disclosed in Note 30 – Events After the Reporting Period.

Note 36
7 - 168 Total State Sector Accounts
General Government Sector Agencies
Aboriginal Housing Office
Dunghutti Aboriginal Elders Tribal Council Trust
Alpha Distribution Ministerial Holding Corporation
Art Gallery of New South Wales Trust
The Australian Institute of Asian Culture and Visual Arts Limited (VisAsia)
Art Gallery of New South Wales Trust Staff Agency
Art Gallery of NSW Foundation(*)
Australian Museum Trust
Australian Museum Trust Staff Agency
Barangaroo Delivery Authority
Barangaroo Delivery Authority Staff Agency
Belgenny Farm Agricultural Heritage Centre Trust(*)
Biamanga National Park Board of Management(a)(*)
Biodiversity Conservation Trust of New South Wales
Border Fence Maintenance Board (*)
Building Insurers’ Guarantee Corporation
C.B. Alexander Foundation(*)
Cemeteries and Crematoria NSW (*)
Centennial Park and Moore Park Trust
Central Coast Regional Development Corporation(b)(*)
Chief Investigator of the Office of Transport Safety Investigations
Combat Sports Authority of New South Wales (*)
Corporation Sole ‘Minister Administering Environmental Planning and Assessment Act, 1979’
Corporation Sole ‘Minister Administering the Heritage Act,
1977’(*)
Crown Entity, including the Consolidated Fund and Crown Finance Entity
Crown Solicitor’s Office
Dams Safety Committee(*)
Department of Education
Advocate for Children and Young People
Department of Family and Community Services
John Williams Memorial Charitable Trust
Department of Finance, Services and Innovation
Safe Work NSW
Department of Justice
Department of Planning and Environment
Coal Innovation Fund
Independent Planning Commission
Planning Ministerial Corporation
Department of Premier and Cabinet
Department of Industry
Aboriginal Fishing Trust Fund
Agricultural Scientific Collections Trust
Aquaculture Trust Fund
Charter Fishing Trust Fund
Commercial Fishing Trust Fund
Crown Reserves Improvement Fund
Fish Conservation Trust Fund
Game and Pest Management Trust Fund
Greyhound Welfare and Integrity Commission
Jobs for NSW Fund
Natural Resources Access Regulator
NSW Skills Board
Recreational Fishing (Fresh) Trust Fund
Recreational Fishing (Salt) Trust Fund
Responsible Gambling Fund
Department of Transport
Transport for NSW
Transport Service of New South Wales
Roads and Maritime Services
Destination NSW
Destination NSW Staff Agency
Electricity Assets Ministerial Holding Corporation
Electricity Retained Interest Corporation (ERIC-A)
Electricity Retained Interest Corporation (ERIC-E)
Electricity Transmission Ministerial Holding
Corporation
Environment Protection Authority
Environment Protection Authority Staff Agency
Environmental Trust
Epsilon Distribution Ministerial Holding Corporation
Financial Counselling Trust Fund(*)
Fire and Rescue NSW
Gaagal Wanggaan (South Beach) National Park Board of
Management(a)(*)
Generator Property Management Pty Ltd(*)
Greater Sydney Commission
Gulaga National Park Board of Management (a)(*)
Health Care Complaints Commission
Health Care Complaints Commission Staff Agency
Historic Houses Trust of New South Wales
Foundation for the Historic Houses Trust of New South Wales
Foundation for the Historic Houses Trust of New South Wales Limited
Hamilton Rouse Hill Trust
Rouse Hill Hamilton Collection Pty Limited
Home Purchase Assistance Fund
Hunter and Central Coast Development Corporation(c)
Independent Commission Against Corruption
Independent Liquor and Gaming Authority
Independent Pricing and Regulatory Tribunal
Independent Pricing and Regulatory Tribunal Staff
Agency
Information and Privacy Commission
Infrastructure NSW
Infrastructure NSW Staff Agency
Judicial Commission of New South Wales
Lands Administration Ministerial Corporation(d)
Legal Aid Commission of New South Wales
Legal Aid Commission Staff Agency
Liability Management Ministerial Corporation
Library Council of New South Wales
Library Council of New South Wales Staff Agency
State Library of New South Wales Foundation
Local Land Services
Local Land Services Staff Agency
Long Service Corporation
Lord Howe Island Board(*)
Luna Park Reserve Trust
Mental Health Commission of New South Wales
Mental Health Commission Staff Agency
Mine Subsidence Board (trading as
Subsidence Advisory NSW(e)(*)
Ministerial Holding Corporation (*)
Hunter Valley Training Pty Ltd
Ministry of Health(f)
Agency for Clinical Innovation
Albury Base Hospital
Albury Wodonga Health Employment Division
Bureau of Health Information
Cancer Institute (NSW)
Central Coast Local Health District
Clinical Excellence Commission
Far West Local Health District
Graythwaite Trust

Note 36
Total State Sector Accounts 7 - 169
Health Administration Corporation
Health Education and Training Institute
Hunter New England Local Health District
Illawarra Shoalhaven Local Health District
Justice Health and Forensic Mental Health Network
Mid North Coast Local Health District
Murrumbidgee Local Health District
Nepean Blue Mountains Local Health District
Northern NSW Local Health District
Northern Sydney Local Health District
South Eastern Sydney Local Health District
South Western Sydney Local Health District
Southern NSW Local Health District
Sydney Local Health District
The Sydney Children’s Hospitals Network (Randwick and Westmead) (incorporating The Royal Alexandra Hospital for Children)
Western NSW Local Health District
Western Sydney Local Health District
Mt Grenfell Historic Site Board of Management(a)(*)
Multicultural NSW
Multicultural NSW Staff Agency
Mutawintji Board of Management(a)(*)
National Art School(*)
Natural Resources Commission
Natural Resources Commission Staff Agency
New South Wales Crime Commission
New South Wales Crime Commission Staff Agency
New South Wales Electoral Commission
New South Wales Electoral Commission Staff Agency
New South Wales Government Telecommunications
Authority
New South Wales Institute of Sport(*)
Institute of Sport Staff Agency
New South Wales Rural Assistance Authority
NSW Ovine Johne's Disease Transaction Based Contribution Scheme
NSW Crown Holiday Parks Trust(*)
NSW Education Standards Authority
NSW Education Standards Authority Staff Agency
NSW Food Authority
NSW Health Foundation(*)
NSW Police Force
NSW Self Insurance Corporation
New South Wales Technical and Further Education Commission
TAFE Commission (Senior Executives) Staff Agency
NSW Trustee and Guardian
Office of Environment and Heritage
Office of the Law Enforcement Conduct Commission
Office of Local Government
Office of the Children’s Guardian
Office of the Director of Public Prosecutions
Office of the NSW Rural Fire Service
Office of the NSW State Emergency Services
Office of the Inspector of the Law Enforcement Conduct Commission
Office of Sport
Ombudsman’s Office
Parliamentary Counsel’s Office
Parramatta Park Trust(*)
Ports Assets Ministerial Holding Corporation
Port of Newcastle Lessor Pty Limited
Port Botany Lessor Pty Limited
Port Kembla Lessor Pty Limited
Property NSW
Public Service Commission
Regional Growth NSW Development Corporation(g)
Rental Bond Board
Roads Retained Interest Pty Ltd(h)
Royal Botanic Gardens and Domain Trust
Service NSW
Sporting Injuries Compensation Authority(*)
State Insurance Regulatory Authority
State Rail Authority Residual Holding Corporation(*)
State Archives and Records Authority of New South Wales
State Rescue Board of New South Wales(*)
Statutory Land Managers (numerous Trust Boards managing Crown Land Reserves)(i)(*)
Sydney Metro(j)
The Audit Office of New South Wales
Sydney Olympic Park Authority
Technical Education Trust Fund(*)
The Legislature
The Sesquicentenary of Responsible Government Trust
Fund(*)
The Treasury
Trustees of the Anzac Memorial Building(*)
Trustees of the Museum of Applied Arts and Sciences
Trustees of the Museum of Applied Arts and Sciences Staff Agency
UrbanGrowth NSW Development Corporation
UrbanGrowth NSW Development Corporation Staff Agency
Australian Technology Park Sydney Limited
Water Administration Ministerial Corporation
Water Investment Trust Fund
Western City and Aerotropolis Authority(k)
Western City and Aerotropolis Authority Staff Agency(l)
Western Sydney Parklands Trust
Worimi Board of Management(a)(*)
Workers’ Compensation (Dust Diseases) Authority
Workers Compensation Commission of New South Wales

Note 36
7 - 170 Total State Sector Accounts
Public Non-Financial Corporations
Catholic Metropolitan Cemeteries Land Manager(i)(*)
Cobar Water Board(*)
Essential Energy
NorthPower Energy Services Pty Limited
Forestry Corporation of New South Wales
Hunter Water Corporation
Hunter Water Australia
Jenolan Caves Reserves Trust(*)
Landcom (trading as UrbanGrowth NSW)
New South Wales Land and Housing Corporation
Rental Housing Assistance Fund
Newcastle Port Corporation
Northern Metropolitan Cemeteries Land Manager(i)(*)
Place Management NSW
Rail Corporation New South Wales
NSW Trains
Sydney Trains
Rookwood General Cemeteries Reserve Land Manager(i)(*)
Rookwood Necropolis Land Manager(i)(*)
Southern Metropolitan Cemeteries Land Manager(i)(*)
State Sporting Venues Authority
State Transit Authority of New South Wales
Sydney Cricket and Sports Ground Trust
Sydney Cricket and Sports Ground Trust Staff Agency
Sydney Ferries
Sydney Opera House Trust
Sydney Opera House Trust Staff Agency
Sydney Water Corporation
Teacher Housing Authority of New South Wales
Venues NSW
Newcastle International Sports Centre Club
Waste Assets Management Corporation
Water NSW
WaterNSW Infrastructure Pty Ltd(m)
WCX M4 Corporation Pty Ltd(n)
WCX M4-M5 Link Corporation Pty Ltd(n)
WCX M5 Corporation Pty Ltd(n)
Wentworth Park Sporting Complex Trust (*)
Zoological Parks Board of New South Wales
Public Financial Corporations
First Australian Mortgage Acceptance Corporation (FANMAC) Trusts
ICNSW Australian Equities Fund
ICNSW International Equities Fund
ICNSW International Equities Hedged Fund
Insurance and Care NSW
Insurers Guarantee Fund Investment Trust
Lifetime Care and Support Authority of New South Wales
Motor Accident Injuries Treatment and Care Benefits Fund
Long Service Corporation Investment Fund
NSW Generations (Debt Retirement) Fund
NSW Infrastructure Future Fund
NSW Treasury Corporation
NSW Trustee and Guardian Growth Portfolio
SAS Trustee Corporation(*)
SAS Trustee Corporation Staff Agency(*)
Social and Affordable Housing NSW Fund Investment
Trust
Superannuation Administration Corporation
Sydney Motorway Corporation(n)
TCorpIM Absolute Return Multi-Asset Class Fund
TCorpIM Alternative Risk Premia Fund
TCorpIM Australian Bond Fund
TCorpIM Australian Inflation Linked Bond Fund
TCorpIM Australian Share Fund
TCorpIM Bank Loan Fund
TCorpIM Cash Fund
TCorpIM Cyclical Growth Australian Share Fund
TCorpIM Cyclical Growth International Share Fund
TCorpIM Direct Infrastructure Fund A
TCorpIM Direct Investment Fund B
TCorpIM Direct Investment Fund C
TCorpIM Direct Investment Fund D
TCorpIM Direct Investment Fund E
TCorpIM Downside Protection Australian Share Fund
TCorpIM Downside Protection International Share Fund
TCorpIM Emerging Market Debt Fund
TCorpIM Emerging Market Share Fund
TCorpIM Global Credit Fund
TCorpIM High Yield Fund
TCorpIM Indexed Australian Share Fund
TCorpIM Indexed International Share (Unhedged) Fund
TCorpIM International Share (Hedged) Fund
TCorpIM International Share (Unhedged) Fund
TCorpIM Liquidity Cash Fund
TCorpIM Listed Property Fund
TCorpIM Long Term Growth Fund
TCorpIM Medium Term Growth Fund
TCorpIM Multi-Asset Class Fund
TCorpIM Short Term Income Fund
TCorpIM Small Cap Australian Share Fund
TCorpIM Specialist Emerging Market Share Fund
TCorpIM Unlisted Infrastructure Fund
TCorpIM Unlisted Property Fund
Treasury Managed Fund Investment Portfolio
(a) National Park Boards of Management as per the National Parks and Wildlife Act 1974. (b) Agency was abolished on 1 November 2018 under the Growth Centres (Development Corporations) Amendment (Hunter and Central Coast
Development Corporation) Order 2018 and its assets, rights and liabilities were transferred to the Hunter and Central Coast Development Corporation under the Growth Centres (Development Corporation) Savings and Transitional Amendment Regulation 2018.
(c) Agency was renamed from Hunter Development Corporation to Hunter and Central Coast Development Corporation under Growth Centres (Development Corporations) Amendment (Hunter and Central Coast Development Corporation) Order on 1 November 2018.
(d) Including Crown Land reserves under the agency’s management.
(e) Agency was abolished on 1 July 2018 under the Administrative Arrangements (Administrative Changes – NSW State Archives and Subsidence Advisory NSW) Order 2018.
(f) The special purpose service entities of the local health districts have not been listed. (g) Agency was established on 28 June 2019 under the Growth Centres (Development Corporations) Amendment (Regional Growth NSW
Development Corporation) Order 2019.
(h) Agency was incorporated on 1 June 2018.
(i) Various reserve trusts were renamed under the Crown Lands Management Act (2016) effective 1 July 2018. The reserve trusts for reserved or dedicated Crown Land that have been reconstituted as a statutory land manager had their name to be the former name of the reserve trust (excluding the word ‘Trust’ if it forms part of its name) and ending with the words ‘Land Manager’.

Note 36
Total State Sector Accounts 7 - 171
(j) Agency was established on 1 July 2018 under the Transport Administration Amendment (Sydney Metro) Act 2018.
(k) Agency was established on 9 November 2018 under the Western City and Aerotropolis Authority Act 2018 No53.
(l) Agency was established on 9 November 2018 under the Administrative Arrangements (Administrative Changes—Western City and Aerotropolis Authority) Order 2018.
(m) Agency was incorporated on 5 November 2018. (n) The state control interest was disposed to Sydney Transport Partners effective on 27 September 2018. (*) These agencies are not considered material for the whole-of-government reporting but are controlled by the NSW Government.

Note 37
7 - 172 Total State Sector Accounts
Note 37: Key Technical Terms used in the Financial Statements
ABS GFS Manual: The Australian Bureau of Statistics (ABS) publication Australian System of Government Finance Statistics: Concepts, Sources and Methods as updated from time to time.
advances: loans acquired or made for policy purposes rather than liquidity management purposes.
capital expenditure: this is expenditure relating to the acquisition or enhancement of property, plant and equipment (including land and buildings, plant and equipment and infrastructure systems) and intangibles (including computer software and easements).
cash surplus/(deficit): net cash flows from operating activities plus net cash flows from acquisition and disposal of non-financial assets (less distributions paid for the public non-financial corporation (PNFC) and public financial corporation (PFC) sectors).
comprehensive result (total change in net worth before transactions with owners as owners): net result of all items of income and expense recognised for the period. It is the aggregate of the operating result and other movements in equity, other than transactions with owners as owners.
convergence difference: the difference between the amounts recognised in the financial statements compared with the amounts determined for GFS purposes as a result of differences in definition, recognition, measurement, classification and consolidation principles and rules.
defined contribution superannuation plans: are post-employment benefit plans under which an entity pays fixed contributions into a separate entity (a fund) and will have no legal or constructive obligation to pay further contributions if the fund does not hold sufficient assets to pay all employee benefits relating to employee service in the current and prior periods.
defined benefit superannuation plans: are post-employment benefit plans other than defined contribution plans.
fair value: the price that would be received to sell an asset or paid to transfer a liability in an orderly transaction between market participants at the measurement date.
• fair value through other comprehensive income: financial assets are classified and measured at fair value through other comprehensive income if they are held in a business model whose objective is achieved by both collecting contractual cash flows and selling financial assets.
• fair value through profit or loss: any financial assets that are not held in one of the two business models mentioned are measured at fair value through profit or loss.
fair value hierarchy: categorises into three levels the inputs to valuation techniques used to measure fair value.
level 1 inputs: quoted prices (unadjusted) in active markets for identical assets or liabilities that the entity can access at the measurement date.
level 2 inputs: inputs other than quoted prices included within Level 1 that are observable for the asset or liability, either directly or indirectly.
level 3 inputs: unobservable inputs for the asset or liability.
financial asset is any asset that is:
(a) cash
(b) an equity instrument of another entity
(c) a contractual right:
(i) to receive cash or another financial asset from another entity, or
(ii) to exchange financial assets or financial liabilities with another entity under conditions that are
potentially favourable to the entity, or

Note 37
Total State Sector Accounts 7 - 173
(d) a contract that will or may be settled in the entity’s own equity instruments and is:
(i) a non-derivative for which the entity is or may be obliged to receive a variable number of the
entity’s own equity instruments, or
(ii) a derivative that will or may be settled other than by the exchange of a fixed amount of cash or
another financial asset for a fixed number of the entity’s own equity instruments. For this purpose
the entity’s own equity instruments do not include instruments that are themselves contracts for the
future receipt or delivery of the entity’s own equity instruments.
General Government Sector (GGS): this is an ABS classification of agencies that provide public services (such as health, education and police), carry out policy or perform regulatory functions. General government agencies are funded in the main by taxation (directly or indirectly).
Government Finance Statistics (GFS): a system of financial reporting developed by the International Monetary Fund and used by the Australian Bureau of Statistics to classify the financial transactions of governments and measure their impact on the rest of the economy.
interest expense: costs incurred in connection with the borrowing of funds. It includes interest on advances, loans, overdrafts, bonds and bills, deposits, interest components of finance lease repayments, and amortisation of discounts or premiums in relation to borrowings. Where discounting is used, the carrying amount of a liability increases in each period to reflect the passage of time. This increase is also recognised as an interest expense.
key fiscal aggregates: balances useful for macro-economic analysis purposes, including assessing the impact of a government and its sectors on the economy. AASB 1049 Whole of Government and General Government Sector Financial Reporting prescribes: net worth, net operating balance, net lending/(borrowing), total change in net worth, and cash surplus/(deficit).
National Partnership Payments (NPP): an Australian Government grant to States and Territories to support the delivery of specified outputs or projects, to facilitate reforms or to reward the delivery of nationally significant reforms. Each NPP is supported by a National Partnership Agreement which defines mutually agreed objectives, outputs and performance benchmarks.
National Specific Purpose Payments (SPP): an Australian Government grant made to the States and Territories under the associated National Agreement. These grants must be spent in the key service delivery sector (Health, Education, Skills and Workforce, Disability and Indigenous) for which it is provided. States are free to allocate the funds within that sector to achieve the mutually agreed objectives specified in the associated National Agreement.
net acquisition of non-financial assets: This is purchases (or acquisitions) of non-financial assets less sales (or disposals) of non-financial assets less depreciation plus changes in inventories and other movements in non-financial assets. Purchases and sales (or net acquisitions) of non-financial assets generally include accrued expenses and payables for capital items. Other movement in non-financial assets include non-cash capital grant revenue/expenses such as developer contribution assets.
net cash flows from investments in financial assets (liquidity management purposes): cash receipts from liquidation or repayment of investments in financial assets for liquidity management purposes less cash payments for such investments. Investment for liquidity management purposes means making funds available to others with no policy intent and with the aim of earning a commercial rate of return.
net cash flows from investments in financial assets (policy purposes): cash receipts from the repayment and liquidation of investments in financial assets for policy purposes less cash payments for acquiring financial assets for policy purposes. Acquisition of financial assets for policy purposes is distinguished from investments in financial assets (liquidity management purposes) by the underlying government motivation for acquiring the assets. Acquisition of financial assets for policy purposes is motivated by government policies such as encouraging the development of certain industries or assisting citizens affected by natural disaster.
net debt: equals the sum of financial liabilities (deposits held, borrowings and derivatives and advances received) less the sum of the following financial assets (cash and deposits, advances paid and investments, loans and placements).

Note 37
7 - 174 Total State Sector Accounts
net defined benefit superannuation liability (asset): the deficit or surplus, adjusted for any effect of limiting a net defined benefit asset to the asset ceiling.
net financial liabilities: calculated as total liabilities, less financial assets, other than equity in PNFCs and PFCs. This measure is broader than net debt as it includes significant liabilities, other than borrowings (for example, accrued employee liabilities such as superannuation and long service leave entitlements).
net interest on the net defined benefit liability/asset: this is the change during the period to the net defined superannuation liability/asset that arises from the passage of time.
net gain on equity investments in other sectors: comprises the net gains relating to the equity held by the GGS in other sector entities. It arises from a change in the carrying amount of net assets of the subsidiaries. The net gains are measured (in the absence of market values) based on the carrying amount of net assets/(liabilities) before elimination of intersector balances.
net lending/(borrowing): the financing requirement of government, calculated as the net operating balance less the net acquisition of non-financial assets. A positive result reflects a net lending position and a negative result reflects a net borrowing position.
net operating balance (net result from transactions): calculated as revenue from transactions minus expenses from transactions. It excludes gains and losses resulting from changes in price levels and other changes in the volume of assets.
net worth: an economic measure of wealth and is equal to total assets less total liabilities.
operating result: a measure of financial performance of the operations for the period. It is the net result of items of revenue, gains and expenses (including losses) recognised for the period, excluding those that are classified as ‘other comprehensive income’.
other economic flows: changes in the volume or value of an asset or liability that do not result from transactions (that is, revaluations and other changes in the volume of assets).
other superannuation expense: it includes all superannuation expenses from transactions except superannuation interest cost. Superannuation actuarial gains/losses are excluded as they are disclosed under ‘other economic flows’.
Public Financial Corporations (PFC) sector: an ABS classification of government controlled agencies that have one or more of the following functions:
• that of a central bank
• the acceptance of demand, time or savings deposits, or
• the authority to incur liabilities (such as insurance) and acquire financial assets in the market on their
own account.
The sector is also commonly referred to as the Public Financial Enterprise (PFE) sector.
Public Non-Financial Corporations (PNFC) sector: an ABS classification, for GFS purposes, of agencies where user charges represent a significant proportion of revenue and the agencies operate within a broadly commercial orientation. The sector is also commonly referred to as the Public Trading Enterprise (PTE) sector.
superannuation interest cost: this expense is the net interest on the net defined benefit liability/asset which shall be determined by multiplying the net defined liability/asset by the discount rate (government bond rate).
TCorpIM Funds: are managed investment schemes available to NSW public sector entities, NSW Wales universities and some foundations and charities. They are structured as units trusts and are managed by the New South Wales Treasury Corporation (TCorp).
Total State Sector (TSS): represents all agencies and corporations owned and controlled by the NSW Government. It comprises the general government, public non-financial corporations and public financial corporations.
transactions: interactions between two institutional units by mutual agreement or actions within a unit that it is analytically useful to treat as transactions, such as depreciation expense. Unlike revaluations, transactions generally reflect economic events that impact the economy.
End of Audited Financial Statements

Outcomes Report 8 - 1
Uniform Presentation Framework:
Outcomes Report
2018 - 2019

8 - 2 Outcomes Report
UNIFORM PRESENTATION FRAMEWORK: OUTCOMES REPORT
Purpose
The Outcomes Report presents financial aggregates according to the Uniform Presentation Framework
(UPF) agreed by the Council on Federal Financial Relations (CFFR) in February 2019.
The UPF is an agreed framework between the Australian, State and Territory governments for the
presentation of government financial information on a basis broadly consistent with the Australian Accounting
Standard AASB 1049 Whole of Government and General Government Sector Financial Reporting. This
framework sets out the minimum information to be reported by governments.
The UPF financial aggregates serve a number of purposes including:
• allowing comparisons between the financial position of Australian governments on a consistent basis
• facilitating time series comparisons since they are relatively unaffected by changes in public sector
administrative structures, and
• permitting an assessment of the impact of NSW public sector transactions on the economy by providing
data classified by economic type.
Relationship with other reporting
Information in the Outcomes Report is not audited, however it has been prepared consistent with the audited
Total State Sector Accounts.
Several tables in the Outcomes Report are similar with those reported in the Total State Sector Accounts and
are repeated here for completeness.
The Outcomes Report compares the published NSW Budget for 2018-19 with the outcome for the year.
Financial aggregates are published for the following:
• general government (GGS) sector
• public non-financial corporation (PNFC) sector
• non-financial public (NFPS) sector
• public financial corporation (PFC) sector.
Budget estimates are not prepared for the NSW Public Financial Corporations Sector. In addition to the
reporting requirements, a consolidated NSW Total State Sector Statement of Financial Position by sector
(Table 1) has been included. This assists in analysis of the Statement of Financial Position for the Total State
Sector.
Changes to reporting requirements
Revised Uniform Presentation Framework (UPF)
The revisions to the UPF in 2019 largely reflect the 2015 update to the Australian System of Government
Financial Statistics (GFS) framework. The update of the Australian GFS aims to better align with the
International Monetary Fund’s GFS 2014 framework and the System of National Accounts 2008.

Uniform Presentation Framework: Outcomes Report
Outcomes Report 8 - 3
Table 1: NSW Public Sector Statement of Financial Position at 30 June 2019(a)
General
Government
Sector
Public Non-
financial
Corporations
Non-financial Public
Sector
Public Financial
Corporations
Total State
Sector
$m $m $m $m $m
Assets
Financial Assets Cash and Cash Equivalents 1,969 2,548 4,517 4,701 8,979
Receivables 7,491 1,211 6,975 1,154 7,527
Tax Equivalents Receivable 32 9 7 ... (0)
Investments, Loans and Placements
Financial Assets at Fair Value 43,333 240 43,573 56,288 44,560
Other Financial Assets 2,591 656 3,247 7 2,793
Advances Paid 1,193 0 715 ... 715
Deferred Tax Equivalent Assets 2,245 109 0 ... 0
Equity
Investments in Other Public Sector Entities 98,990 ... (4,734) ... 0
Investments in Associates 12,055 ... 12,055 2 12,057
Other Equity Investments 8 189 196 24,272 24,468
Equity Investments Held for Sale ... ... ... ... ...
Total Financial Assets 169,907 4,963 66,552 86,424 101,099
Non-Financial Assets
Inventories 399 474 873 ... 873
Forestry Stock and Other Biological Assets 10 1,171 1,181 ... 1,181
Assets Classified as Held for Sale 222 61 283 ... 283
Investment Properties ... 648 648 ... 648
Property, Plant and Equipment
Land and Buildings 89,963 75,775 166,333 14 166,346
Plant and Equipment 12,088 5,968 18,056 18 18,075
Infrastructure Systems 119,291 48,645 167,936 ... 167,936
Intangibles 3,694 1,108 4,802 7 4,809
Other Non-Financial Assets 6,707 170 6,416 36 6,449
Total Non-Financial Assets 232,375 134,020 366,528 75 366,601
Total Assets 402,282 138,983 433,080 86,499 467,699
Liabilities
Deposits Held 67 70 137 857 293
Payables 7,079 2,136 8,504 337 8,357
Tax Equivalents Payable 3 32 ... 7 ...
Borrowings and Derivatives at Fair Value 207 3 210 72,783 72,757
Borrowings at Amortised Cost 37,656 24,558 62,213 6 7,151
Advances Received 756 478 756 ... 756
Employee Provisions 20,802 1,150 21,934 35 21,969
Superannuation Provision(b) 67,696 3,010 70,706 5 70,711
Deferred Tax Equivalent Provision 108 2,246 ... ... ...
Other Provisions 11,604 1,410 11,996 6,306 18,185
Other Liabilities 6,134 322 6,453 10,898 17,350
Total Liabilities 152,110 35,415 182,908 91,233 217,528
NET ASSETS 250,172 103,567 250,172 (4,734) 250,172

Uniform Presentation Framework: Outcomes Report
8 - 4 Outcomes Report
Table 1: NSW Public Sector Statement of Financial Position at 30 June 2019 (cont)
General
Government
Sector
Public Non-
financial
Corporations
Non-financial Public
Sector
Public Financial
Corporations
Total State
Sector
$m $m $m $m $m
NET WORTH
Accumulated Funds 74,341 31,754 109,127 (4,735) 80,460
Reserves 174,804 60,916 129,121 1 157,788
TOTAL NET WORTH 250,172 103,567 250,172 (4,734) 250,172
OTHER FISCAL AGGREGATES
Net Debt(c) (10,401) 21,664 11,263 12,650 23,909
Net Financial Liabilities(d) 81,194 30,453 111,622 4,809 116,429
Net Financial Worth(e) 17,797 (30,453) (116,357) (4,809) (116,429)
(a) This table has been presented on a liquidity basis as per AASB 1049. Amounts may not add across due to inter sector eliminations.
(b) Superannuation liabilities are reported net of the fair value of fund assets.
(c) Net debt equals the sum of deposits held, advances received and borrowings, minus the sum of cash and cash equivalents, advances paid and investments, loans and placements.
(d) Net financial liabilities equals total liabilities less financial assets excluding equity investments in other public sector entities.
(e) Net financial worth equals total financial assets minus total liabilities.

Uniform Presentation Framework: Outcomes Report
Outcomes Report 8 - 5
Table 2: NSW General Government Sector Statement of Comprehensive Income
2018-19 2018-19
Budget Actual
$m $m
Revenue from Transactions Taxation 31,146 31,443
Grants and Subsidies - Commonwealth General Purpose 18,475 17,907
- Commonwealth Specific Purpose Payments 9,851 10,224
- Commonwealth National Partnership Payments 3,043 2,737
- Other Commonwealth Payments 362 414
- Other Grants and Subsidies 379 567
Sale of Goods and Services 9,513 8,990
Interest 323 491
Dividend and Income Tax Equivalents from Other Sectors 1,823 1,932
Other Dividends and Distributions 1,322 1,934
Fines, Regulatory Fees and Other 4,843 5,051
Total Revenue from Transactions 81,081 81,690
Expenses from Transactions Employee 31,613 33,158
Superannuation - Superannuation Interest Cost 1,470 1,412
- Other Superannuation 3,006 3,052
Depreciation and Amortisation 4,989 5,192
Interest 2,044 1,812
Other Operating 21,600 21,146
Grants, Subsidies and Other Transfer Expenses 14,934 14,700 Total Expenses from Transactions 79,656 80,471
Transactions from Discontinuing Operations ... 0
BUDGET RESULT - SURPLUS/(DEFICIT) [Net Operating Balance] 1,425 1,219
Other Economic Flows - Included in the Operating Result
Gain/(Loss) from Other Liabilities 175 (2,500)
Other Net Gains/(Losses) 493 13,700
Share of Earnings from Associates (excluding Dividends) (0) (1)
Dividends from Asset Sale Proceeds 81 (0)
Allowance for Impairment of Receivables (38) (69)
Deferred Income Tax from Other Sectors (7) (97)
Other 84 84
Discontinuing Operations - Other Economic Flows ... (0)
Other Economic Flows - included in Operating Result 789 11,117
Operating Result 2,214 12,335
Other Economic Flows - Other Comprehensive Income
Items that will not be Reclassified to Operating Result 6,975 (13,906)
Revaluations 2,794 7,205 Share of Associate's Other Comprehensive Income/(Loss) that will not be Reclassified Subsequently to Operating Result ... (10)
Superannuation Actuarial Gain/(Loss) 4,120 (13,364)
Net Gain/(Loss) on Financial Assets at Fair Value through Other Comprehensive Income ... (7,888)
Deferred Tax Adjustment through Equity 61 151
Items that may be Reclassified Subsequently to Operating Result (138) (353)
Net Gain/(Loss) on Equity Investments in Other Sectors (Available for Sale Financial Assets) 71 ...
Net Gain/(Loss) on Financial Instruments at Fair Value ... 19 Share of Associate's Other Comprehensive Income/(Loss) that may be Reclassified Subsequently
to Operating Result ... (538)
Other (209) 166
Other Economic Flows - Other Comprehensive Income 6,837 (14,259)
Comprehensive Result - Total Change in Net Worth 9,052 (1,924)

Uniform Presentation Framework: Outcomes Report
8 - 6 Outcomes Report
Table 2: NSW General Government Sector Statement of Comprehensive Income (cont)
2018-19 2018-19
Budget Actual $m $m
Key Fiscal Aggregates
Comprehensive Result - Total Change in Net Worth 9,052 (1,924)
Less: Net Other Economic Flows (7,626) 3,142
Equals: Budget Result - Net Operating Balance 1,425 1,219
Less: Net Acquisition of Non-Financials Assets Purchases of Non-Financials Assets 15,405 16,464
Sales of Non-Financial Assets (650) (966)
Less: Depreciation (4,989) (5,192)
Plus: Change in Inventories (42) 38
Plus: Other Movements in Non-Financials Assets - Assets Acquired Using Finance Leases 1,925 159
- Other 40 (4)
Equals: Total Net Acquisition of Non-Financial Assets 11,688 10,498
Equals: Net Lending/(Borrowing) [Fiscal Balance] (10,263) (9,280)
OTHER FISCAL AGGREGATES
Capital Expenditure(a) 17,329 16,623
(a) Capital expenditure comprises purchases of non-financial assets plus assets acquired using finance leases.

Uniform Presentation Framework: Outcomes Report
Outcomes Report 8 - 7
Table 3: NSW General Government Sector Statement of Financial Position at 30 June(a)
2019 2019
Budget Actual $m $m
Assets
Financial Assets Cash and Cash Equivalents 1,593 1,969
Receivables 6,738 7,491
Tax Equivalents Receivable 116 32
Investments, Loans and Placements Financial Assets at Fair Value 28,374 43,333
Other Financial Assets 1,330 2,591
Advances Paid 1,280 1,193
Deferred Tax Equivalent Assets 2,328 2,245
Equity Investments in Other Public Sector Entities 114,545 98,990
Investments in Associates 5,870 12,055
Other Equity Investments 746 8
Total Financial Assets 162,920 169,907
Non-Financial Assets
Inventories 270 399
Forestry Stock and Other Biological Assets 10 10
Assets Classified as Held for Sale 295 222
Property, Plant and Equipment Land and Buildings 88,640 89,963
Plant and Equipment 11,203 12,088
Infrastructure Systems 117,140 119,291
Intangibles 3,898 3,694
Other Non-Financial Assets 5,273 6,707
Total Non-Financial Assets 226,728 232,375
Total Assets 389,648 402,282
Liabilities
Deposits Held 79 67
Payables 6,412 7,079
Tax Equivalents Payable ... 3
Borrowings and Derivatives at Fair Value 3 207
Borrowings at Amortised Cost 34,376 37,656
Advances Received 678 756
Employee Provisions 17,047 20,802
Superannuation Provision(b) 45,553 67,696
Deferred Tax Equivalent Provision 85 108
Other Provisions 9,019 11,604
Other Liabilities 6,269 6,134
Total Liabilities 119,521 152,110
NET ASSETS 270,127 250,172

Uniform Presentation Framework: Outcomes Report
8 - 8 Outcomes Report
Table 3: NSW General Government Sector Statement of Financial Position at 30 June (cont)
2019 2019
Budget Actual $m $m
NET WORTH
Accumulated Funds 91,311 74,341
Reserves 178,816 174,804
TOTAL NET WORTH 270,127 250,172
OTHER FISCAL AGGREGATES
Net Debt(c) 2,559 (10,401)
Net Financial Liabilities(d) 71,146 81,194
Net Financial Worth(e) 43,399 17,797
(a) This table has been presented on a liquidity basis as per AASB 1049.
(b) Superannuation liabilities are reported net of the fair value of fund assets.
(c) Net Debt equals the sum of deposits held, advances received and borrowings, minus the sum of cash and cash equivalents, advances paid and investments, loans and placements.
(d) Net financial liabilities equals net financial worth excluding equity investments in other public sector entities.
(e) Net financial worth equals total financial assets minus total liabilities.

Uniform Presentation Framework: Outcomes Report
Outcomes Report 8 - 9
Table 4: NSW General Government Sector Statement of Cash Flows
2018-19 2018-19
Budget Actual $m $m
Cash Receipts from Operating Activities Taxes Received 31,176 31,020
Receipts from Sales of Goods and Services 10,014 9,360
Grant and Subsidies Received 32,105 31,810
Interest Receipts 342 518
Dividends and Income Tax Equivalents 1,733 1,897
Other Receipts 9,389 12,226
Total Cash Receipts from Operating Activities 84,760 86,830
Cash Payments from Operating Activities Payments for Employees (31,155) (31,896)
Payments for Superannuation (4,479) (4,325)
Payments for Goods and Services (22,568) (20,874)
Grants and Subsidies Paid (13,239) (13,739)
Interest Paid (1,467) (1,455)
Distributions Paid 0 (3)
Other Payments (5,583) (7,210)
Total Cash Payments from Operating Activities (78,493) (79,502)
Net Cash Flows from Operating Activities 6,267 7,328
Cash Flows from Investments in Non-Financial Assets Sales of Non-Financial Assets 733 452
Purchases of Non-Financial Assets (15,531) (18,087)
Net Cash Flows from Investments in Non-Financial Assets (14,799) (17,635)
Cash Flows from Investments in Financial Assets for Policy Purposes Receipts 296 18,026
Payments (3,118) (2,341)
Net Cash Flows from Investments in Financial Assets for Policy Purposes (2,822) 15,685
Cash Flows from Investments in Financial Assets for Liquidity Purposes Receipts from Sale/Maturity of Investments 12,619 10,029
Payments for the Purchase of Investments (4,377) (23,904)
Net Cash Flows from Investments in Financial Assets for Liquidity Purposes 8,242 (13,875)
Net Cash Flows from Investing Activities (9,379) (15,825)
Cash Flows from Financing Activities Advances Received 15 56
Advances Repaid (98) (125)
Proceeds from Borrowings 204 5,561
Repayment of Borrowings (609) (612)
Deposits Received - Net (14) 19
Other Financing Receipts/(Payments) 58 151
Net Cash Flows from Financing Activities (443) 5,050
Net Increase/(Decrease) in Cash Held (3,555) (3,448)
Opening Cash and Cash Equivalents 5,140 5,417
Reclassification of Cash Equivalents and Other Adjustments 8 (1)
CLOSING CASH AND CASH EQUIVALENTS 1,600 1,969
Derivation of Cash Result Net Cash Flows From Operating Activities 6,267 7,328
Net Cash Flows from Investments in Non-Financial Assets (14,799) (17,635)
Cash Surplus/(Deficit) (8,532) (10,307)

Uniform Presentation Framework: Outcomes Report
8 - 10 Outcomes Report
Table 5: NSW General Government Sector Taxes
2018-19 2018-19
Budget Actual
$m $m
Taxes on Employers’ Payroll and Labour Force 9,307 9,546
Taxes on Property Land Taxes 4,293 4,216
Other 307 121
Total Taxes on Property 4,600 4,336
Taxes on the Provision of Goods and Services Excises and Levies ... ...
Taxes on Gambling 2,447 2,634
Taxes on Insurance 2,489 2,787
Stamp Duties on Financial and Capital Transactions 8,006 7,732
Total Taxes on the Provision of Goods and Services 12,942 13,153
Taxes on Use of Goods and Performance of Activities Motor Vehicle Taxes 3,680 3,491
Franchise Taxes 18 24
Other 598 892
Total Taxes on Use of Goods and Performance of Activities 4,296 4,407
Total Taxation Revenue 31,146 31,443

Uniform Presentation Framework: Outcomes Report
Outcomes Report 8 - 11
Table 6: NSW General Government Sector Dividend and Income Tax Equivalent Income
2018-19 2018-19
Budget Actual $m $m
Dividend and Income Tax Revenue from the PNFC Sector 1,680 1,629
Dividend and Income Tax Revenue from the PFC Sector 143 303
Other Dividend Income 1,322 1,934
Total Dividend and Income Tax Equivalent Income 3,145 3,866
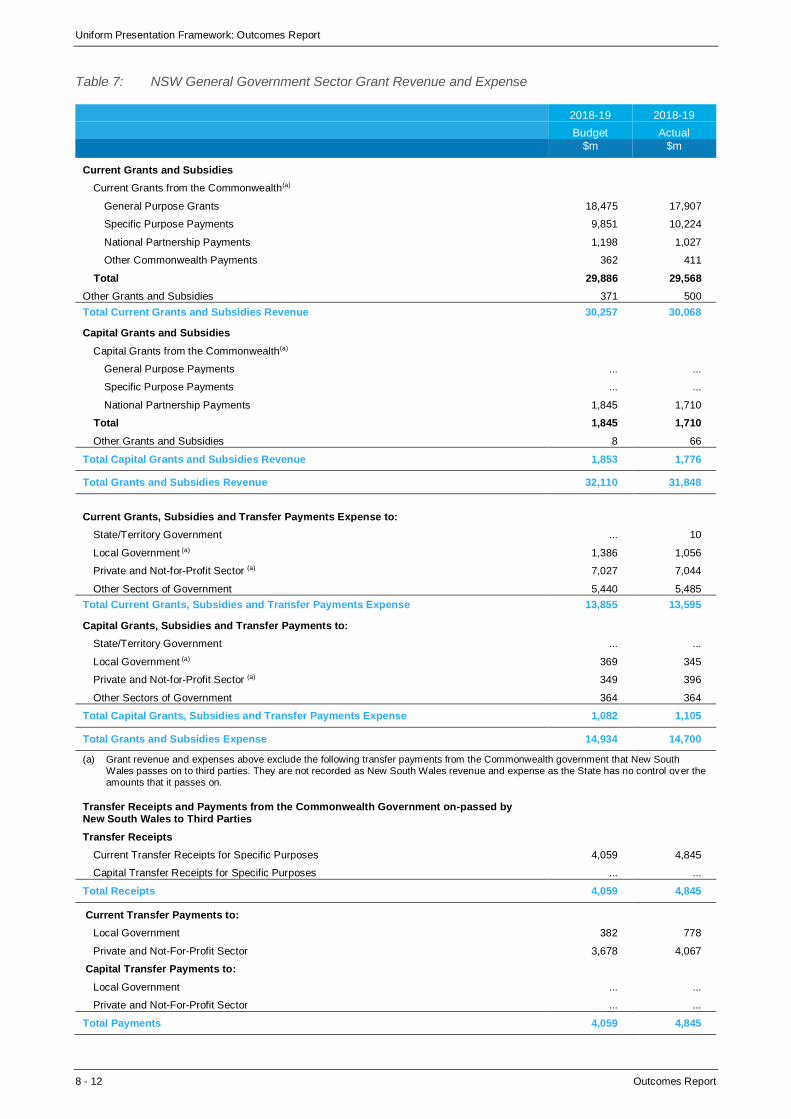
Uniform Presentation Framework: Outcomes Report
8 - 12 Outcomes Report
Table 7: NSW General Government Sector Grant Revenue and Expense
2018-19 2018-19
Budget Actual $m $m
Current Grants and Subsidies
Current Grants from the Commonwealth(a)
General Purpose Grants 18,475 17,907
Specific Purpose Payments 9,851 10,224
National Partnership Payments 1,198 1,027
Other Commonwealth Payments 362 411
Total 29,886 29,568
Other Grants and Subsidies 371 500
Total Current Grants and Subsidies Revenue 30,257 30,068
Capital Grants and Subsidies
Capital Grants from the Commonwealth(a)
General Purpose Payments ... ...
Specific Purpose Payments ... ...
National Partnership Payments 1,845 1,710
Total 1,845 1,710
Other Grants and Subsidies 8 66
Total Capital Grants and Subsidies Revenue 1,853 1,776
Total Grants and Subsidies Revenue 32,110 31,848
Current Grants, Subsidies and Transfer Payments Expense to:
State/Territory Government ... 10
Local Government (a) 1,386 1,056
Private and Not-for-Profit Sector (a) 7,027 7,044
Other Sectors of Government 5,440 5,485
Total Current Grants, Subsidies and Transfer Payments Expense 13,855 13,595
Capital Grants, Subsidies and Transfer Payments to:
State/Territory Government ... ...
Local Government (a) 369 345
Private and Not-for-Profit Sector (a) 349 396
Other Sectors of Government 364 364
Total Capital Grants, Subsidies and Transfer Payments Expense 1,082 1,105
Total Grants and Subsidies Expense 14,934 14,700
(a) Grant revenue and expenses above exclude the following transfer payments from the Commonwealth government that New South Wales passes on to third parties. They are not recorded as New South Wales revenue and expense as the State has no control over the amounts that it passes on.
Transfer Receipts and Payments from the Commonwealth Government on-passed by New South Wales to Third Parties
Transfer Receipts
Current Transfer Receipts for Specific Purposes 4,059 4,845
Capital Transfer Receipts for Specific Purposes ... ...
Total Receipts 4,059 4,845
Current Transfer Payments to:
Local Government 382 778
Private and Not-For-Profit Sector 3,678 4,067
Capital Transfer Payments to:
Local Government ... ...
Private and Not-For-Profit Sector ... ...
Total Payments 4,059 4,845

Uniform Presentation Framework: Outcomes Report
Outcomes Report 8 - 13
Table 8: NSW General Government Sector Expenses by Function(a)
2018-19 2018-19
Budget Actual $m $m
General Public Services
Executive and legislative organs, financial and fiscal affairs, external affairs 1,955 1,738
General Services 583 1,776
Public debt transactions 3,593 3,209
Transfers of a general character between different levels of government 122 88
General public services n.e.c. 156 1,498
Total General Public Services 6,408 8,310
Defence ... ...
Total Defence ... ...
Public Order and Safety
Police services 3,529 3,559
Civil and Fire protection services 1,082 1,233
Law courts 1,382 1,488
Prisons 1,880 1,838
Public order and safety n.e.c. 137 116
Total Public Order and Safety 8,010 8,232
Economic Affairs
General economic, commercial and labour affairs 847 804
Agriculture, forestry, fishing and hunting 498 628
Fuel and energy 112 119
Mining, manufacturing and construction 125 297
Communication 79 61
Other industries 586 519
Economic affairs n.e.c. 80 15
Total Economic Affairs 2,327 2,442
Environmental Protection
Waste management ... ...
Waste water management ... ...
Pollution abatement ... ...
Protection of biodiversity and landscape 835 814
Environmental protection n.e.c. 455 330
Total Environmental Protection 1,291 1,144
Housing and Community Amenities
Housing development 87 86
Community development 797 562
Water supply 297 210
Street lighting ... ...
Housing and community amenities n.e.c. ... 285
Total Housing and Community Amenities 1,180 1,143

Uniform Presentation Framework: Outcomes Report
8 - 14 Outcomes Report
Table 8: NSW General Government Sector Expenses by Function(a) (cont)
2018-19 2018-19
Budget Actual $m $m
Health Medical products, appliances and equipment 548 586
Outpatient services 3,238 3,298
Hospital services 14,832 14,586
Mental health institutions 276 263
Community health services 2,530 2,524
Public health services 541 580
Research & Development Health 294 301
Health n.e.c. 533 544
Total Health 22,792 22,683
Recreation, Culture and Religion Recreational and sporting services 818 727
Cultural services 476 499
Broadcasting and publishing services ... ...
Religious and other community services ... ...
Recreation, Culture and Religion n.e.c. 21 24
Total Recreation, culture and religion 1,315 1,249
Education Pre-primary and primary education 6,605 6,585
Secondary education 5,994 5,625
Tertiary education 1,710 1,762
Education not definable by level 398 361
Subsidiary services to education 1,329 1,177
Education n.e.c. 2,114 2,195
Total Education 18,149 17,705
Social Protection Sickness and disability 3,017 3,031
Old age 185 185
Survivors ... ...
Family and children 2,020 2,242
Unemployment ... ...
Housing 802 733
Social exclusion n.e.c. 480 488
Social protection n.e.c. 943 740
Total Social Protection 7,447 7,419

Uniform Presentation Framework: Outcomes Report
Outcomes Report 8 - 15
Table 8: NSW General Government Sector Expenses by Function(a) (cont)
2018-19 2018-19
Budget Actual $m $m
Transport Road transport 900 3,542
Bus transport 389 386
Water transport 59 189
Railway transport 4,348 4,197
Air transport ... 1
Multi-mode urban transport 2,226 1,579
Pipeline and other transport ... ...
Transport n.e.c. 2,815 248
Total Transport 10,737 10,142
Total Expenses 79,656 80,471
Notes:
n.e.c. not elsewhere classified.
(a) The original budget included $100 million Advance to the Treasurer which was allocated across functions as the funds were spent in the actual year.

Uniform Presentation Framework: Outcomes Report
8 - 16 Outcomes Report
Table 9: NSW General Government Sector Capital Expenditure by Function (a)(b)
2018-19 2018-19
Budget Actual $m $m
General public services 928 237
Defence ... ...
Public order and safety 1,384 1,219
Economic affairs 316 197
Environmental protection 18 10
Housing and community amenities 456 131
Health 2,164 2,224
Recreation, culture and religion 294 197
Education 1,793 1,780
Social protection 184 207
Transport 9,793 10,421
Total Purchases of Non-Financial Assets 17,331 16,623
(a) This table comprises purchases of non-financial assets, including assets acquired under finance lease, and reconciles to the general government sector capital expenditure program.
(b) The original budget included $20 million Advance to the Treasurer which was allocated across functions as the funds were spent in the actual year.

Uniform Presentation Framework: Outcomes Report
Outcomes Report 8 - 17
Table 10: NSW Public Non-Financial Corporation Sector Statement of Comprehensive Income
2018-19 2018-19
Budget Actual $m $m
Revenue from Transactions Grants and Subsidies
- Other Grants and Subsidies 2,994 3,022
Sale of Goods and Services 8,049 8,229
Interest 61 76
Other Dividends and Distributions ... 15
Fines, Regulatory Fees and Other 790 749
Total Revenue from Transactions 11,894 12,092
Expenses from Transactions Employee 2,958 2,754
Superannuation - Superannuation Interest Cost 54 55
- Other Superannuation 198 187
Depreciation and Amortisation 2,899 2,815
Interest 1,255 1,042
Income Tax Expense 339 309
Other Operating 5,795 5,852
Grants, Subsidies and Other Transfer Expenses 323 80
Total Expenses from Transactions 13,822 13,094
Transactions from Discontinuing Operation ... 40
NET OPERATING BALANCE - SURPLUS AFTER TAX (1,927) (962)
Other Economic Flows - Included in the Operating Result
Gain/(Loss) from Other Liabilities ... (33)
Other Net Gains/(Losses) 327 (3,146)
Allowance for Impairment of Receivables (2) (5)
Deferred Income Tax 8 (42)
Discontinuing Operations - Other Economic Flows ... ...
Other Economic Flows - included in Operating Result 333 (3,226)
Operating Result (1,594) (4,188)
Other Economic Flows - Other Comprehensive Income
Items that will not be Reclassified to Operating Result 2,241 (881)
Revaluations 1,997 26
Superannuation Actuarial Gain/(Loss) 305 (756)
Deferred Tax Adjustment through Equity (61) (151)
Items that may be Reclassified Subsequently to Operating Result 652 4
Net Gain/(Loss) on Financial Instruments at Fair Value ... (3)
Other 652 6
Other Economic Flows - Other Comprehensive Income 2,893 (879)
Comprehensive Result - Before Transactions with Owners in their capacity as Owners 2,741 (5,066)
Dividends Distributed (1,441) (1,475)
Net Equity Injections ... (3,240)
Comprehensive Result - Total Change in Net Worth 1,299 (9,781)

Uniform Presentation Framework: Outcomes Report
8 - 18 Outcomes Report
Table 10: NSW Public Non-Financial Corporation Sector Statement of Comprehensive Income (cont)
2018-19 2018-19
Budget Actual $m $m
Key Fiscal Aggregates
Comprehensive Result - Before Transactions with Owners in their capacity as Owners 1,299 (5,066)
Less: Net Other Economic Flows (3,226) 4,105
Equals: Net Operating Balance (1,927) (962)
Less: Net Acquisition of Non-Financials Assets Purchases of Non-Financials Assets 7,142 5,202
Sales of Non-Financial Assets (485) (368)
Less: Depreciation (2,899) (2,815)
Plus: Change in Inventories 120 (72)
Plus: Other Movements in Non-Financials Assets - Assets Acquired Using Finance Leases ... ...
- Other 87 402
Equals: Total Net Acquisition of Non-Financial Assets 3,965 2,350
Equals: Net Lending/(Borrowing) [Fiscal Balance] (5,892) (3,312)
OTHER FISCAL AGGREGATES
Capital Expenditure(a) 7,142 5,202
Dividends Accrued 747 727
(a) Capital expenditure comprises purchases of non-financial assets plus assets acquired using finance leases.

Uniform Presentation Framework: Outcomes Report
Outcomes Report 8 - 19
Table 11: NSW Public Non-Financial Corporation Sector Statement of Financial Position at 30 June
2019 2019
Budget Actual $m $m
Assets
Financial Assets
Cash and Cash Equivalents 2,797 2,548
Receivables 1,099 1,211
Tax Equivalents Receivable 0 9
Investments, Loans and Placements
Financial Assets at Fair Value 415 240
Other Financial Assets 373 656
Advances Paid 1 0
Deferred Tax Equivalent Assets 85 109
Equity
Other Equity Investments ... 189
Total Financial Assets 4,770 4,963
Non-Financial Assets
Inventories 521 474
Forestry Stock and Other Biological Assets 968 1,171
Assets Classified as Held for Sale 48 61
Investment Properties 615 648
Property, Plant and Equipment
Land and Buildings 75,377 75,775
Plant and Equipment 7,774 5,968
Infrastructure Systems 60,364 48,645
Intangibles 1,192 1,108
Other Non-Financial Assets 243 170
Total Non-Financial Assets 147,102 134,020
Total Assets 151,873 138,983
Liabilities
Deposits Held 33 70
Payables 2,161 2,136
Tax Equivalents Payable 110 32
Borrowings and Derivatives at Fair Value 3,086 3
Borrowings at Amortised Cost 26,541 24,558
Advanced Received 478 478
Employee Provisions 1,061 1,150
Superannuation Provision(a) 1,776 3,010
Deferred Tax Equivalent Provision 2,328 2,246
Other Provisions 1,347 1,410
Other Liabilities 228 322
Total Liabilities 39,149 35,415
NET ASSETS 112,723 103,567

Uniform Presentation Framework: Outcomes Report
8 - 20 Outcomes Report
Table 11: NSW Public Non-Financial Corporation Sector Statement of Financial Position at 30 June (cont)
2019 2019
Budget Actual $m $m
NET WORTH
Accumulated Funds 35,622 31,754
Reserves 77,101 71,813
TOTAL NET WORTH 112,723 103,567
OTHER FISCAL AGGREGATES
Net Debt(b) 26,552 21,664
Net Financial Liabilities(c) 34,379 30,453
Net Financial Worth(d) (34,379) (30,453)
(a) Superannuation liabilities are reported net of the fair value of fund assets.
(b) Net debt equals the sum of deposits held, advances received and borrowings, minus the sum of cash and cash equivalents, advances paid and investments, loans and placements.
(c) Net financial liabilities equals total liabilities minus total financial assets excluding equity investments in other public sector entities.
(d) Net financial worth equals total financial assets minus total liabilities.

Uniform Presentation Framework: Outcomes Report
Outcomes Report 8 - 21
Table 12: NSW Public Non-Financial Corporation Statement of Cash Flows
2018-19 2018-19
Budget Actual
$m $m
Cash Receipts from Operating Activities
Receipts from Sales of Goods and Services 8,476 8,826
Grant and Subsidies Received 2,990 3,017
Interest Receipts 55 70
Other Receipts 1,041 1,670
Total Cash Receipts from Operating Activities 12,563 13,583
Cash Payments from Operating Activities
Payments for Employees (3,061) (2,323)
Payments for Superannuation (208) (205)
Payments for Goods and Services (5,487) (6,199)
Grants and Subsidies Paid (66) (78)
Interest Paid (1,120) (922)
Income Tax Equivalents Paid (0) (423)
Other Payments (627) (1,329)
Total Cash Payments from Operating Activities (10,570) (11,479)
Net Cash Flows from Operating Activities 1,993 2,104
Cash Flows from Investments in Non-Financial Assets
Sales of Non-Financial Assets 485 371
Purchases of Non-Financial Assets (7,566) (5,325)
Net Cash Flows from Investments in Non-Financial Assets (7,082) (4,955)
Cash Flows from Investments in Financial Assets for Policy Purposes
Receipts 248 0
Payments ... (810)
Net Cash Flows from Investments in Financial Assets for Policy Purposes 248 (810) Cash Flows from Investments in Financial Assets for Liquidity Purposes
Receipts from Sale/Maturity of Investments 244 228
Payments for Purchase of Investments (40) (22)
Net Cash Flows from Investments in Financial Assets for Liquidity Purposes 203 206
Net Cash Flows from Investing Activities (6,630) (5,559) Cash Flows from Financing Activities
Advances Received 2,627 2,025
Advances Repaid (112) (31)
Proceeds from Borrowings 3,395 2,067
Repayment of Borrowings (234) (211)
Dividends Paid (1,557) (1,611)
Deposits Received (net) (0) (21)
Other Financing Receipts/(Payments) (311) 21
Net Cash Flows from Financing Activities 3,807 2,238
Net Increase/(Decrease) in Cash Held (830) (1,216)
Opening Cash and Cash Equivalents 3,627 3,808
Reclassification of Cash Equivalents and Other Adjustments ... (43)
CLOSING CASH AND CASH EQUIVALENTS 2,797 2,548
Derivation of Cash Result
Net Cash Flows from Operating Activities 1,993 2,104
Net Cash Flows from Investments in Non-Financial Assets (7,082) (4,955)
Dividends Paid (1,557) (1,611)
Cash Surplus/(Deficit) (6,645) (4,462)

Uniform Presentation Framework: Outcomes Report
8 - 22 Outcomes Report
Table 13: NSW Non-Financial Public Sector Statement of Comprehensive Income
2018-19 2018-19
Budget Actual
$m $m
Revenue from Transactions Taxation 30,676 30,950
Grants and Subsidies - Commonwealth General Purpose 18,475 17,907
- Commonwealth Specific Purpose Payments 9,851 10,224
- Commonwealth National Partnership Payments 3,043 2,737
- Other Commonwealth Payments 366 418
- Other Grants and Subsidies 279 483
Sale of Goods and Services 13,514 13,795
Interest 313 503
Dividend and Income Tax Equivalents from Other Sectors 143 303
Other Dividends and Distributions 1,322 1,949
Fines, Regulatory Fees and Other 5,602 5,701
Total Revenue from Transactions 83,584 84,969
Expenses from Transactions
Employee 34,071 35,386
Superannuation - Superannuation Interest Cost 1,524 1,466
- Other Superannuation 3,203 3,238
Depreciation and Amortisation 7,888 8,008
Interest 3,228 2,789
Other Operating 23,368 23,571
Grants, Subsidies and Other Transfer Expenses 12,142 11,654
Total Expenses from Transactions 85,424 86,111
Transactions from Discontinuing Operations ... 41
NET OPERATING BALANCE - SURPLUS/(DEFICIT) (1,840) (1,102)
Other Economic Flows - Included in the Operating Result Gain/(Loss) from Other Liabilities 175 (2,533)
Other Net Gains/(Losses) 820 10,554
Share of Earnings from Associates (excluding Dividends) ... (1)
Allowance for Impairment of Receivables (40) (74)
Others 84 84
Discontinuing Operations - Other Economic Flows ... (0)
Other Economic Flows - included in Operating Result 1,040 8,030
Operating Result (801) 6,928
Other Economic Flows - Other Comprehensive Income
Items that will not be Reclassified to Operating Result 9,211 (6,678)
Revaluations 4,786 7,454 Share of Associate's Other Comprehensive Income/(Loss) that will not be Reclassified
Subsequently to Operating Result ... (10)
Superannuation Actuarial Gain/(Loss) 4,425 (14,119)
Net Gain/(Loss) on Financial Assets at Fair Value through Other Comprehensive Income (0) ...
Deferred Tax Adjustment through Equity 0 (2)
Items that may be Reclassified Subsequently to Operating Result 860 (694)
Net Gain/(Loss) on Equity Investments in Other Sectors (Available for Sale Financial Assets) 948 ...
Net Gain/(Loss) on Financial Instruments at Fair Value 0 16
Share of Associate's Other Comprehensive Income/(Loss) that may be Reclassified Subsequently to Operating Result ... (538)
Other (88) (172)
Other Economic Flows - Other Comprehensive Income 10,071 (7,372)
Comprehensive Result - Before Transactions with Owners in their capacity as Owners 8,422 (444)
Dividends Distributed (100) (154)
Net Equity Injections 948 (4,161)
Comprehensive Result - Total Change in Net Worth 9,270 (4,759)

Uniform Presentation Framework: Outcomes Report
Outcomes Report 8 - 23
Table 13: NSW Non-Financial Public Sector Statement of Comprehensive Income (cont)
2018-19 2018-19
Budget Actual $m $m
Key Fiscal Aggregates
Comprehensive Result - Before Transactions with Owners in their capacity as Owners 8,422 (444)
Less: Net Other Economic Flows (11,111) (658)
Equals: Net Operating Balance (1,840) (1,102)
Less: Net Acquisition of Non-Financials Assets Purchases of Non-Financials Assets 22,547 21,667
Sales of Non-Financial Assets (1,135) (1,317)
Less: Depreciation (7,888) (8,008)
Plus: Change in Inventories 78 (34)
Plus: Other Movements in Non-Financials Assets - Assets Acquired Using Finance Leases 1,925 159
- Other 120 357
Equals: Total Net Acquisition of Non-Financial Assets 15,646 12,823
Equals: Net Lending/(Borrowing) [Fiscal Balance] (17,486) (13,924)
OTHER FISCAL AGGREGATES Capital Expenditure(a) 24,471 21,825
Dividends Accrued 100 154
(a) Capital expenditure comprises purchases of non-financial assets plus assets acquired using finance leases.

Uniform Presentation Framework: Outcomes Report
8 - 24 Outcomes Report
Table 14: NSW Non-Financial Public Sector Statement of Financial Position at 30 June
2019 2019
Budget Actual $m $m
Assets
Financial Assets
Cash and Cash Equivalents 4,390 4,517
Receivables 6,229 6,975
Tax Equivalents Receivable 6 7
Investments, Loans and Placements
Financial Assets at Fair Value 28,790 43,573
Other Financial Assets 1,702 3,247
Advances Paid 802 715
Deferred Tax Equivalent Assets 0 0
Equity
Investments in Other Public Sector Entities 5,121 (4,734)
Investments in Associates 5,870 12,055
Other Equity Investments 746 196
Equity Investments Held for Sale ... ...
Total Financial Assets 53,657 66,552
Non-Financial Assets Inventories 791 873
Forestry Stock and Other Biological Assets 977 1,181
Assets Classified as Held for Sale 343 283
Investment Properties 615 648
Property, Plant and Equipment Land and Buildings 164,616 166,333
Plant and Equipment 18,977 18,056
Infrastructure Systems 177,997 167,936
Intangibles 5,090 4,802
Other Non-Financial Assets 4,548 6,416
Total Non-Financial Assets 373,955 366,528
Total Assets 427,612 433,080
Liabilities
Deposits Held 112 137
Payables 8,048 8,504
Liabilities Directly Associated with Assets Held for Sale ... ...
Borrowings and Derivatives at Fair Value 3,090 210
Borrowings at Amortised Cost 60,917 62,213
Advanced Received 678 756
Employee Provisions 18,088 21,934
Superannuation Provision(a) 47,329 70,706
Deferred Tax Equivalent Provision ... ...
Other Provisions 9,280 11,996
Other Liabilities 6,476 6,453
Total Liabilities 154,018 182,908
NET ASSETS 273,594 250,172

Uniform Presentation Framework: Outcomes Report
Outcomes Report 8 - 25
Table 14: NSW Non-Financial Public Sector Statement of Financial Position at 30 June (cont)
2019 2019
Budget Actual $m $m
NET WORTH
Accumulated Funds 126,937 109,127
Reserves 146,657 129,121
TOTAL NET WORTH 273,594 250,172
OTHER FISCAL AGGREGATES
Net Debt(b) 29,111 11,263
Net Financial Liabilities(c) 105,482 111,622
Net Financial Worth(d) (100,361) (116,357)
(a) Superannuation liabilities are reported net of the fair value of fund assets.
(b) Net debt equals the sum of deposits held, advances received and borrowings, minus the sum of cash and cash equivalents, advances paid and investments, loans and placements.
(c) Net financial liabilities equals total liabilities less total financial assets excluding equity investments in other public sector entities
(d) Net financial worth equals total financial assets minus total liabilities.
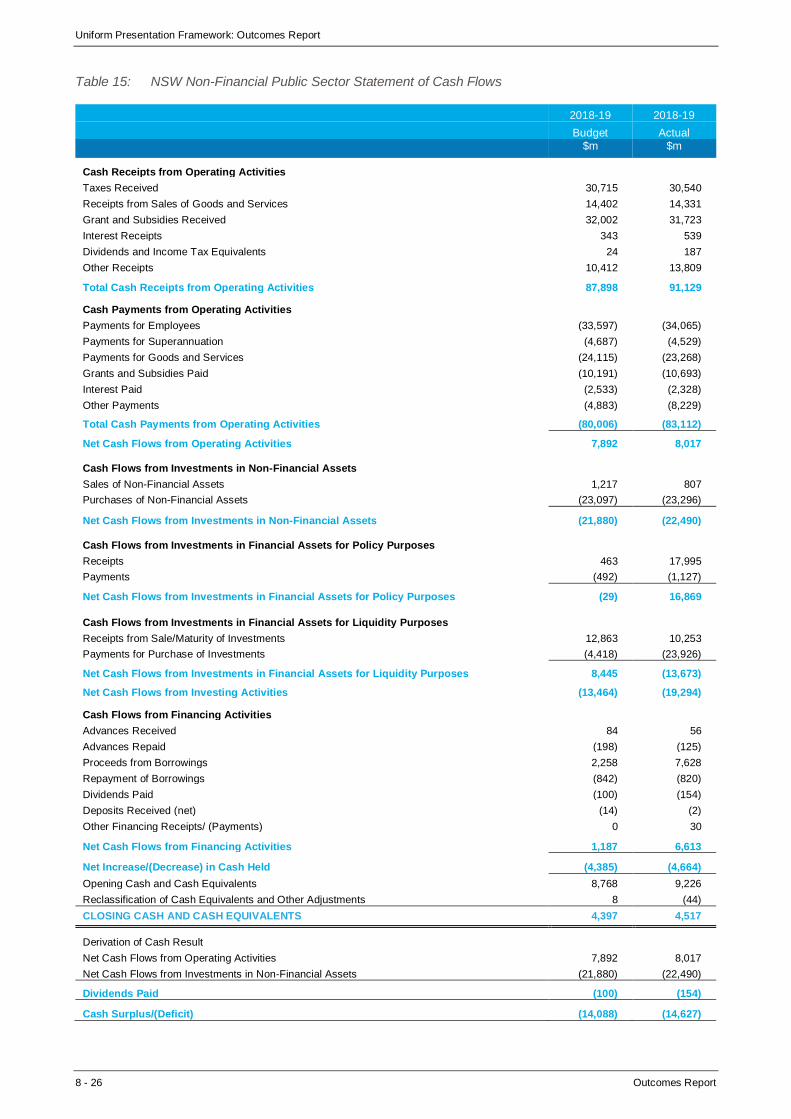
Uniform Presentation Framework: Outcomes Report
8 - 26 Outcomes Report
Table 15: NSW Non-Financial Public Sector Statement of Cash Flows
2018-19 2018-19
Budget Actual $m $m
Cash Receipts from Operating Activities Taxes Received 30,715 30,540
Receipts from Sales of Goods and Services 14,402 14,331
Grant and Subsidies Received 32,002 31,723
Interest Receipts 343 539
Dividends and Income Tax Equivalents 24 187
Other Receipts 10,412 13,809
Total Cash Receipts from Operating Activities 87,898 91,129
Cash Payments from Operating Activities Payments for Employees (33,597) (34,065)
Payments for Superannuation (4,687) (4,529)
Payments for Goods and Services (24,115) (23,268)
Grants and Subsidies Paid (10,191) (10,693)
Interest Paid (2,533) (2,328)
Other Payments (4,883) (8,229)
Total Cash Payments from Operating Activities (80,006) (83,112)
Net Cash Flows from Operating Activities 7,892 8,017
Cash Flows from Investments in Non-Financial Assets
Sales of Non-Financial Assets 1,217 807
Purchases of Non-Financial Assets (23,097) (23,296)
Net Cash Flows from Investments in Non-Financial Assets (21,880) (22,490)
Cash Flows from Investments in Financial Assets for Policy Purposes
Receipts 463 17,995
Payments (492) (1,127)
Net Cash Flows from Investments in Financial Assets for Policy Purposes (29) 16,869
Cash Flows from Investments in Financial Assets for Liquidity Purposes Receipts from Sale/Maturity of Investments 12,863 10,253
Payments for Purchase of Investments (4,418) (23,926)
Net Cash Flows from Investments in Financial Assets for Liquidity Purposes 8,445 (13,673)
Net Cash Flows from Investing Activities (13,464) (19,294)
Cash Flows from Financing Activities Advances Received 84 56
Advances Repaid (198) (125)
Proceeds from Borrowings 2,258 7,628
Repayment of Borrowings (842) (820)
Dividends Paid (100) (154)
Deposits Received (net) (14) (2)
Other Financing Receipts/ (Payments) 0 30
Net Cash Flows from Financing Activities 1,187 6,613
Net Increase/(Decrease) in Cash Held (4,385) (4,664)
Opening Cash and Cash Equivalents 8,768 9,226
Reclassification of Cash Equivalents and Other Adjustments 8 (44)
CLOSING CASH AND CASH EQUIVALENTS 4,397 4,517
Derivation of Cash Result
Net Cash Flows from Operating Activities 7,892 8,017
Net Cash Flows from Investments in Non-Financial Assets (21,880) (22,490)
Dividends Paid (100) (154)
Cash Surplus/(Deficit) (14,088) (14,627)

Uniform Presentation Framework: Outcomes Report
Outcomes Report 8 - 27
Table 16: NSW Public Financial Corporations Statement of Comprehensive Income(a)
2018-19
Actual
$m
Revenue from Transactions
Sale of Goods and Services 1,230
Interest 2,263
Other Dividends and Distributions 1,715
Fines, Regulatory Fees and Other 41
Total Revenue from Transactions 5,249
Expenses from Transactions
Employee 159
Superannuation
- Superannuation Interest Cost ...
- Other Superannuation 12
Depreciation and Amortisation 9
Interest 2,299
Income Tax Expense 37
Other Operating 3,097
Grants, Subsidies and Other Transfer Expenses 16
Total Expenses from Transactions 5,629
Transactions from Discontinuing Operations 122
NET OPERATING BALANCE - SURPLUS AFTER TAX (258)
Other Economic Flows - Included in the Operating Result
Gain/(Loss) from Other Liabilities (684)
Other Net Gains/(Losses) 10,867
Other Economic Flows - included in Operating Result 10,182
Operating Result 9,924
Other Economic Flows - Other Comprehensive Income
Items that will not be Reclassified to Operating Result (1)
Revaluations (0)
Superannuation Actuarial Gain/(Loss) (1)
Net Gain/(Loss) on Financial Assets at Fair Value through Other Comprehensive Income ...
Deferred Tax Adjustment through Equity ...
Items that may be Reclassified Subsequently to Operating Result ...
Other (0)
Other Economic Flows - Other Comprehensive Income (1)
Comprehensive Result - Before Transactions with Owners in their capacity as Owners(a) 9,923
Dividends Distributed (266)
Net Equity Injections (16,612)
Comprehensive Result - Total Change in Net Worth (6,955)

Uniform Presentation Framework: Outcomes Report
8 - 28 Outcomes Report
Table 16: NSW Public Financial Corporations Statement of Comprehensive Income (cont)
2018-19
Actual
$m
Key Fiscal Aggregates
Comprehensive Result - Before Transactions with Owners in their capacity as Owners(a) 9,923
Less: Net Other Economic Flows (10,181)
Equals: Net Operating Balance (258)
Less: Net Acquisition of Non-Financials Assets
Purchases of Non-Financials Assets 2
Sales of Non-Financial Assets ...
Less: Depreciation (9)
Plus: Change in Inventories ...
Plus: Other Movements in Non-Financials Assets
- Assets Acquired Using Finance Leases ...
- Other ...
Equals: Total Net Acquisition of Non-Financial Assets (7)
Equals: Net Lending/(Borrowing) [Fiscal Balance] (251)
OTHER FISCAL AGGREGATES Capital Expenditure(b) 2
Dividends Accrued 118
(a) The current Uniform Presentation Framework does not require the publishing of the results of the Public Financial Corporation Sector at budget time and mid-year, therefore a Budget column is not available.
(b) Capital expenditure comprises purchases of non-financial assets plus assets acquired using finance leases.

Uniform Presentation Framework: Outcomes Report
Outcomes Report 8 - 29
Table 17: NSW Public Financial Corporations Sector Statement of Financial Position at 30 June(a)
2019
Actual
$m
Assets
Financial Assets
Cash and Cash Equivalents 4,701
Receivables 1,154
Investments, Loans and Placements
Financial Assets at Fair Value 56,288
Other Financial Assets 7
Equity
Investments in Associates 2
Other Equity Investments 24,272
Total Financial Assets 86,424
Non-Financial Assets
Property, Plant and Equipment
Land and Buildings 14
Plant and Equipment 18
Intangibles 7
Other Non-Financial Assets 36
Total Non-Financial Assets 75
Total Assets 86,499
Liabilities
Deposits Held 857
Payables 337
Tax Equivalents Payable 7
Borrowings and Derivatives at Fair Value 72,783
Borrowings at Amortised Cost 6
Employee Provisions 35
Superannuation Provision(b) 5
Other Provisions 6,306
Other Liabilities 10,898
Total Liabilities 91,233
NET ASSETS (4,734)

Uniform Presentation Framework: Outcomes Report
8 - 30 Outcomes Report
Table 17: NSW Public Financial Corporations Sector Statement of Financial Position at 30 June (cont)
2019
Actual
$m
NET WORTH
Accumulated Funds (4,735)
Reserves 1
TOTAL NET WORTH (4,734)
OTHER FISCAL AGGREGATES
Net Debt(c) 12,650
Net Financial Liabilities(d) 4,809
Net Financial Worth(e) (4,809)
(a) The current Uniform Presentation Framework does not require the publishing of the results of the Public Financial Corporation Sector at budget time and mid-year, therefore a Budget column is not available.
(b) Superannuation liabilities are reported net of the fair value of fund assets.
(c) Net debt equals the sum of deposits held, advances received and borrowings, minus the sum of cash and cash equivalents, advances paid and investments, loans and placements.
(d) Net financial liabilities equals total liabilities minus financial assets.
(e) Net financial worth equals total financial assets minus total liabilities.

Uniform Presentation Framework: Outcomes Report
Outcomes Report 8 - 31
Table 18: NSW Public Financial Corporations Sector Statement of Cash Flows(a)
2018-19
Actual
$m
Cash Receipts from Operating Activities Receipts from Sales of Goods and Services 1,242
Grant and Subsidies Received ...
Interest Receipts 2,118
Dividends and Income Tax Equivalents 154
Other Receipts 1,726
Total Cash Receipts from Operating Activities 5,239
Cash Payments from Operating Activities Payments for Employees (175)
Payments for Superannuation (13)
Payments for Goods and Services (2,344)
Grants and Subsidies Paid (8)
Interest Paid (2,358)
Distributions Paid (39)
Other Payments 492
Total Cash Payments from Operating Activities (4,445)
Net Cash Flows from Operating Activities 794
Cash Flows from Investments in Non-Financial Assets Sales of Non-Financial Assets ...
Purchases of Non-Financial Assets (2)
Net Cash Flows from Investments in Non-Financial Assets (2)
Cash Flows from Investments in Financial Assets for Policy Purposes
Receipts ...
Payments (553)
Net Cash Flows from Investments in Financial Assets for Policy Purposes (553)
Cash Flows from Investments in Financial Assets for Liquidity Purposes Receipts from Sale/Maturity of Investments 6,237
Payments for Purchase of Investments (11,417)
Net Cash Flows from Investments in Financial Assets for Liquidity Purposes (5,179)
Net Cash Flows from Investing Activities (5,734)
Cash Flows from Financing Activities Proceeds from Borrowings 62,561
Repayment of Borrowings (57,677)
Dividends Paid (148)
Deposits Received (net) ...
Other Financing Receipts/(Payments) ...
Net Cash Flows from Financing Activities 4,736
Net Increase/(Decrease) in Cash Held (204)
Opening Cash and Cash Equivalents 4,905
Reclassification of Cash Equivalents and Other Adjustments ...
CLOSING CASH AND CASH EQUIVALENTS 4,701
Net Cash Flows from Operating Activities 794
Net Cash Flows from Investments in Non-Financial Assets (2)
Dividends Paid (148)
Cash Surplus/(Deficit) 644
(a) The current Uniform Presentation Framework does not require the publishing of the Public Financial Corporation Sector at budget time and mid-year, therefore the Budget column is not presented.