2017/18 Quarter to September Chief Executive's Office ...
44
2017/18 Quarter to September Chief Executive's Office Performance Report - Performance Indicators Committee Cat Code & Name Target 2015/16 2016/17 2017/18 Q2 2016/17 Q3 2016/17 Q4 2016/17 Q1 2017/18 Q2 2017/18 Latest Note Status Value Value Value Value Value Value Value Value Local CE069 Cost of outsourced Print Room work as a % of Print Room expenditure 20% 40% 23.57% 17.11% N/A N/A N/A 24.4% 13.7% The amount spent in quarter 2 on outsourced printing was £8,881.79, which represented 13.7% of the total print room expenditure for the quarter. For the year to date the percentage expenditure on outsourced Print Room work is below the 20% target. Nat(b) CE070 Complaints received per 1,000 population N/A 4.61 4.38 2.14 1.32 0.9 1.05 1.13 1.01 97 complaints received in quarter 2, with a mid-year population of 96,070, gives a figure of 1.01 complaints per 1,000 population. Nat(b) CE072 The number of complaints upheld / partially upheld at each stage as a percentage of complaints closed in full at each stage N/A 42% 46% 46% 47% 44% 44% 48% 43% 42 complaints upheld or part-upheld (27 upheld and 15 part upheld) out of the 98 complaints closed in quarter 2 2017/18 Local CE059 Percentage of community consultations facilitated by the Community Support Unit achieving a rating of 'good' or above from the participants N/A 100% 100% N/A 100% N/A N/A N/A N/A There were no consultations during this period. Local CE068 Complaints - Customer Satisfaction Index 52.8% 52.8% 56.3% N/A Measured annually Measured annually A customer satisfaction survey is issued monthly and the replies are collated for reporting within the Annual Complaints Report. The satisfaction rate for 2016/17 has shown an improvement over the rate for the past 2 years
Transcript of 2017/18 Quarter to September Chief Executive's Office ...
2017/18 Quarter to September Chief Executive's Office
Performance Report - Performance Indicators
Committee
Cat Code & Name Target 2015/16 2016/17 2017/18
Q2
2016/17
Q3
2016/17
Q4
2016/17
Q1
2017/18
Q2
2017/18 Latest Note Status
Value Value Value Value Value Value Value Value
Local
CE069 Cost of outsourced Print
Room work as a % of Print
Room expenditure
20% 40% 23.57% 17.11% N/A N/A N/A 24.4% 13.7%
The amount spent in quarter 2 on outsourced
printing was £8,881.79, which represented 13.7% of the total print room expenditure for the quarter. For
the year to date the percentage expenditure on
outsourced Print Room work is below the 20%
target.
Nat(b) CE070 Complaints received per
1,000 population N/A 4.61 4.38 2.14 1.32 0.9 1.05 1.13 1.01
97 complaints received in quarter 2, with a mid-year
population of 96,070, gives a figure of 1.01 complaints per 1,000 population.
Nat(b)
CE072 The number of
complaints upheld / partially
upheld at each stage as a
percentage of complaints
closed in full at each stage
N/A 42% 46% 46% 47% 44% 44% 48% 43%
42 complaints upheld or part-upheld (27 upheld and
15 part upheld) out of the 98 complaints closed in
quarter 2 2017/18
Local
CE059 Percentage of
community consultations
facilitated by the Community
Support Unit achieving a rating
of 'good' or above from the
participants
N/A 100% 100% N/A 100% N/A N/A N/A N/A There were no consultations during this period.
Local CE068 Complaints - Customer
Satisfaction Index 52.8% 52.8% 56.3% N/A Measured annually Measured annually
A customer satisfaction survey is issued monthly and
the replies are collated for reporting within the
Annual Complaints Report. The satisfaction rate for
2016/17 has shown an improvement over the rate
for the past 2 years
2017/18 Quarter Year to September Corporate Services
Performance Report - Performance Indicators
Corporate Services - Audit
Cat Code & Name Target 2015/16 2016/17 2017/18
Q2
2016/17
Q3
2016/17
Q4
2016/17
Q1
2017/18
Q2
2017/18 Latest Note Status
Value Value Value Value Value Value Value Value
Local
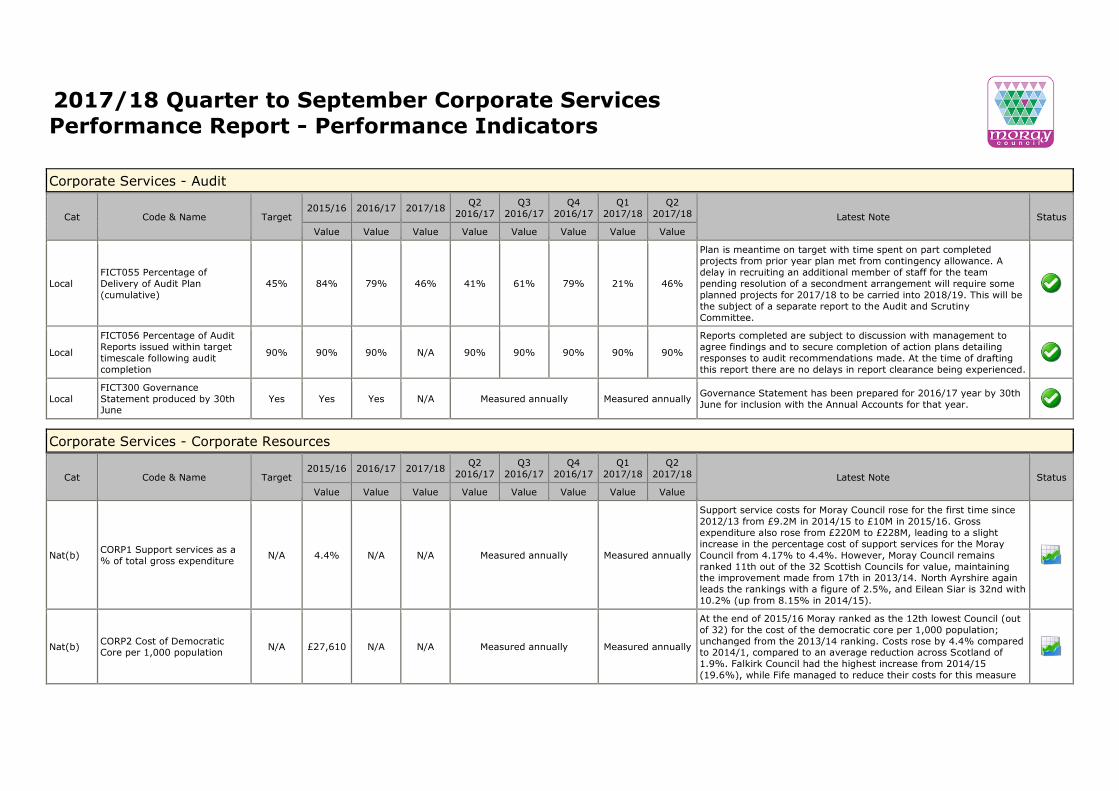
FICT055 Percentage of
Delivery of Audit Plan
(cumulative)
45% 84% 79% 46% 41% 61% 79% 21% 46%
Plan is meantime on target with time spent on part completed
projects from prior year plan met from contingency allowance. A
delay in recruiting an additional member of staff for the team
pending resolution of a secondment arrangement will require some
planned projects for 2017/18 to be carried into 2018/19. This will be
the subject of a separate report to the Audit and Scrutiny Committee.
Local
FICT056 Percentage of Audit
Reports issued within target
timescale following audit
completion
90% 90% 90% N/A 90% 90% 90% 90% 90%
Reports completed are subject to discussion with management to
agree findings and to secure completion of action plans detailing
responses to audit recommendations made. At the time of drafting
this report there are no delays in report clearance being experienced.
Local FICT300 Governance
Statement produced by 30th
June
Yes Yes Yes N/A Measured annually Measured annually Governance Statement has been prepared for 2016/17 year by 30th
June for inclusion with the Annual Accounts for that year.
Corporate Services - Corporate Resources
Cat Code & Name Target 2015/16 2016/17 2017/18
Q2
2016/17
Q3
2016/17
Q4
2016/17
Q1
2017/18
Q2
2017/18 Latest Note Status
Value Value Value Value Value Value Value Value
Nat(b) CORP1 Support services as a
% of total gross expenditure N/A 4.4% N/A N/A Measured annually Measured annually
Support service costs for Moray Council rose for the first time since
2012/13 from £9.2M in 2014/15 to £10M in 2015/16. Gross expenditure also rose from £220M to £228M, leading to a slight
increase in the percentage cost of support services for the Moray
Council from 4.17% to 4.4%. However, Moray Council remains
ranked 11th out of the 32 Scottish Councils for value, maintaining
the improvement made from 17th in 2013/14. North Ayrshire again
leads the rankings with a figure of 2.5%, and Eilean Siar is 32nd with
10.2% (up from 8.15% in 2014/15).
Nat(b) CORP2 Cost of Democratic
Core per 1,000 population N/A £27,610 N/A N/A Measured annually Measured annually
At the end of 2015/16 Moray ranked as the 12th lowest Council (out
of 32) for the cost of the democratic core per 1,000 population;
unchanged from the 2013/14 ranking. Costs rose by 4.4% compared
to 2014/1, compared to an average reduction across Scotland of
Cat Code & Name Target 2015/16 2016/17 2017/18
Q2
2016/17
Q3
2016/17
Q4
2016/17
Q1
2017/18
Q2
2017/18 Latest Note Status
Value Value Value Value Value Value Value Value
1.9%. Falkirk Council had the highest increase from 2014/15
(19.6%), while Fife managed to reduce their costs for this measure
by 25.1%. To put Moray Council's costs in context, the lowest ranked
council, North Lanarkshire, costs £12,490 per 1,000 population,
(down from £14,839 the previous year) while the highest ranked Council was Orkney with costs of £152,699 per 1,000 population ( a
rise of almost 7% from the 2014/15 costs of £142,844 per 1,000
population).
Financial Services - Accountancy
Cat Code & Name Target 2015/16 2016/17 2017/18
Q2
2016/17
Q3
2016/17
Q4
2016/17
Q1
2017/18
Q2
2017/18 Latest Note Status
Value Value Value Value Value Value Value Value
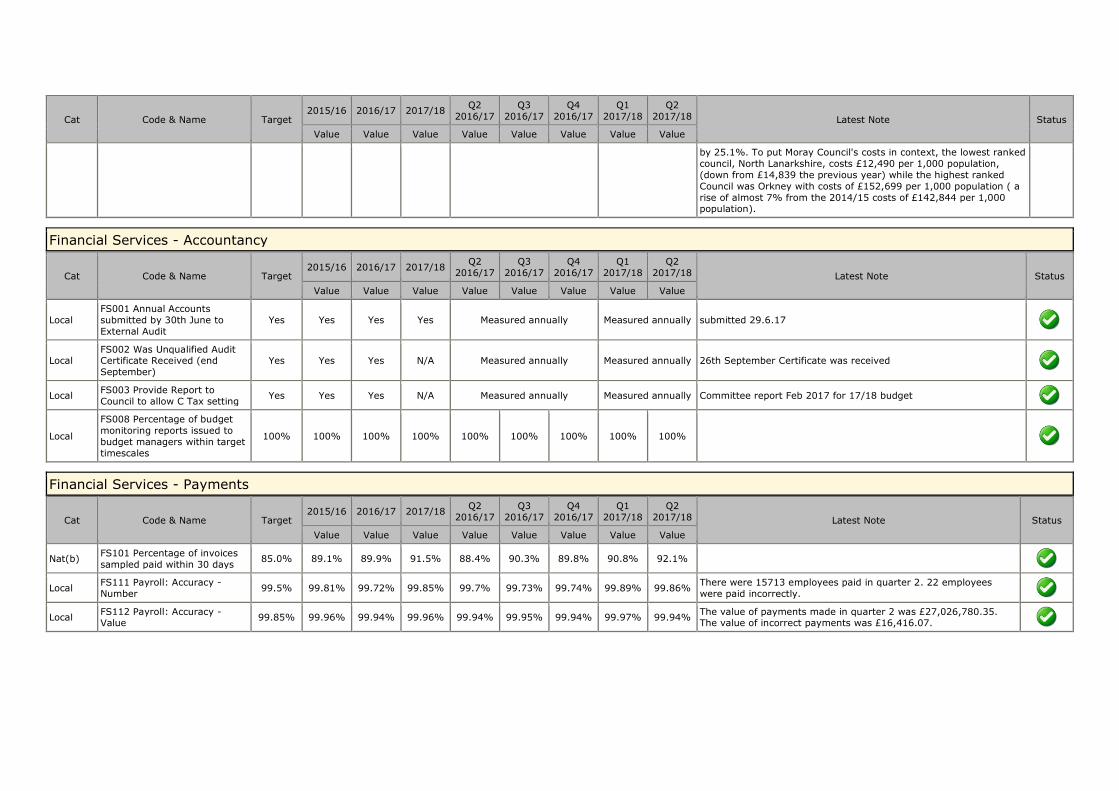
Local
FS001 Annual Accounts
submitted by 30th June to
External Audit
Yes Yes Yes Yes Measured annually Measured annually submitted 29.6.17
Local FS002 Was Unqualified Audit
Certificate Received (end
September)
Yes Yes Yes N/A Measured annually Measured annually 26th September Certificate was received
Local FS003 Provide Report to
Council to allow C Tax setting Yes Yes Yes N/A Measured annually Measured annually Committee report Feb 2017 for 17/18 budget
Local
FS008 Percentage of budget
monitoring reports issued to
budget managers within target
timescales
100% 100% 100% 100% 100% 100% 100% 100% 100%
Financial Services - Payments
Cat Code & Name Target 2015/16 2016/17 2017/18
Q2
2016/17
Q3
2016/17
Q4
2016/17
Q1
2017/18
Q2
2017/18 Latest Note Status
Value Value Value Value Value Value Value Value
Nat(b) FS101 Percentage of invoices
sampled paid within 30 days 85.0% 89.1% 89.9% 91.5% 88.4% 90.3% 89.8% 90.8% 92.1%
Local FS111 Payroll: Accuracy -
Number 99.5% 99.81% 99.72% 99.85% 99.7% 99.73% 99.74% 99.89% 99.86%
There were 15713 employees paid in quarter 2. 22 employees
were paid incorrectly.
Local FS112 Payroll: Accuracy -
Value 99.85% 99.96% 99.94% 99.96% 99.94% 99.95% 99.94% 99.97% 99.94%
The value of payments made in quarter 2 was £27,026,780.35.
The value of incorrect payments was £16,416.07.
Financial Services - Revenues
Cat Code & Name Target 2015/16 2016/17 2017/18
Q2
2016/17
Q3
2016/17
Q4
2016/17
Q1
2017/18
Q2
2017/18 Latest Note Status
Value Value Value Value Value Value Value Value
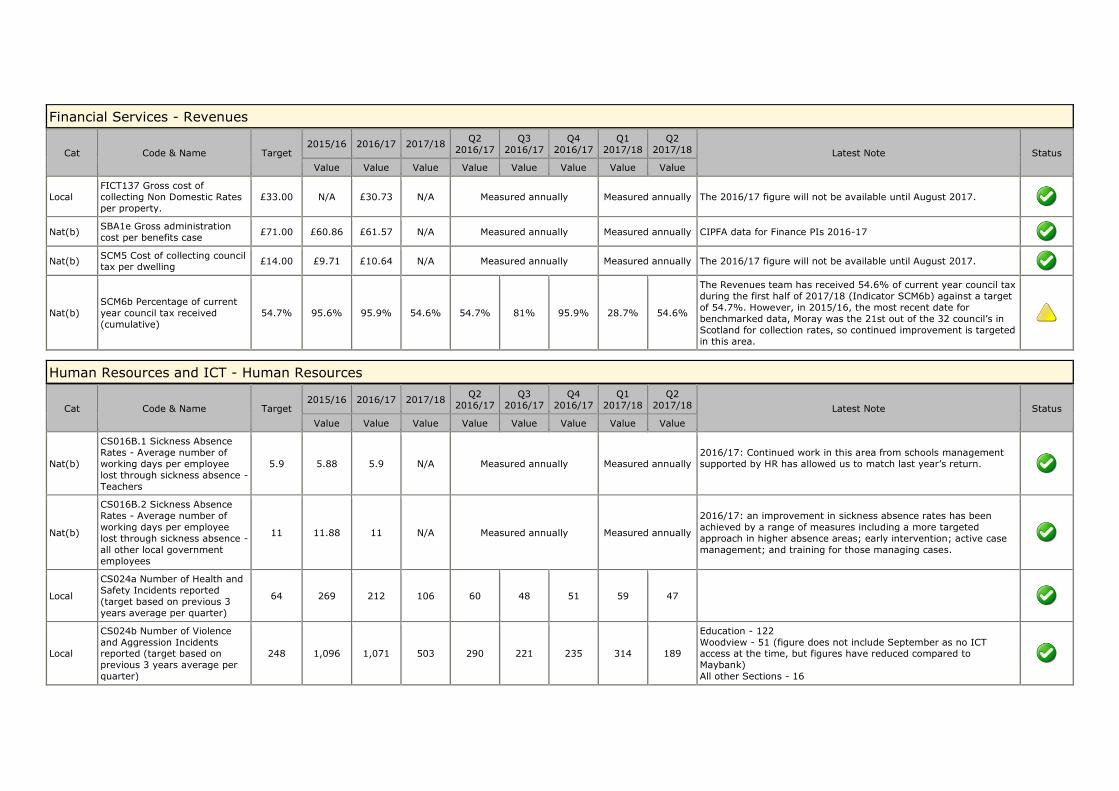
Local
FICT137 Gross cost of
collecting Non Domestic Rates
per property.
£33.00 N/A £30.73 N/A Measured annually Measured annually The 2016/17 figure will not be available until August 2017.
Nat(b) SBA1e Gross administration
cost per benefits case £71.00 £60.86 £61.57 N/A Measured annually Measured annually CIPFA data for Finance PIs 2016-17
Nat(b) SCM5 Cost of collecting council tax per dwelling
£14.00 £9.71 £10.64 N/A Measured annually Measured annually The 2016/17 figure will not be available until August 2017.
Nat(b) SCM6b Percentage of current
year council tax received
(cumulative)
54.7% 95.6% 95.9% 54.6% 54.7% 81% 95.9% 28.7% 54.6%
The Revenues team has received 54.6% of current year council tax
during the first half of 2017/18 (Indicator SCM6b) against a target
of 54.7%. However, in 2015/16, the most recent date for
benchmarked data, Moray was the 21st out of the 32 council’s in
Scotland for collection rates, so continued improvement is targeted
in this area.
Human Resources and ICT - Human Resources
Cat Code & Name Target 2015/16 2016/17 2017/18
Q2
2016/17
Q3
2016/17
Q4
2016/17
Q1
2017/18
Q2
2017/18 Latest Note Status
Value Value Value Value Value Value Value Value
Nat(b)
CS016B.1 Sickness Absence
Rates - Average number of
working days per employee
lost through sickness absence -
Teachers
5.9 5.88 5.9 N/A Measured annually Measured annually
2016/17: Continued work in this area from schools management
supported by HR has allowed us to match last year’s return.
Nat(b)
CS016B.2 Sickness Absence
Rates - Average number of
working days per employee
lost through sickness absence -
all other local government
employees
11 11.88 11 N/A Measured annually Measured annually
2016/17: an improvement in sickness absence rates has been
achieved by a range of measures including a more targeted
approach in higher absence areas; early intervention; active case
management; and training for those managing cases.
Local
CS024a Number of Health and
Safety Incidents reported
(target based on previous 3
years average per quarter)
64 269 212 106 60 48 51 59 47
Local
CS024b Number of Violence
and Aggression Incidents reported (target based on
previous 3 years average per
quarter)
248 1,096 1,071 503 290 221 235 314 189
Education - 122
Woodview - 51 (figure does not include September as no ICT access at the time, but figures have reduced compared to
Maybank)
All other Sections - 16
Cat Code & Name Target 2015/16 2016/17 2017/18
Q2
2016/17
Q3
2016/17
Q4
2016/17
Q1
2017/18
Q2
2017/18 Latest Note Status
Value Value Value Value Value Value Value Value
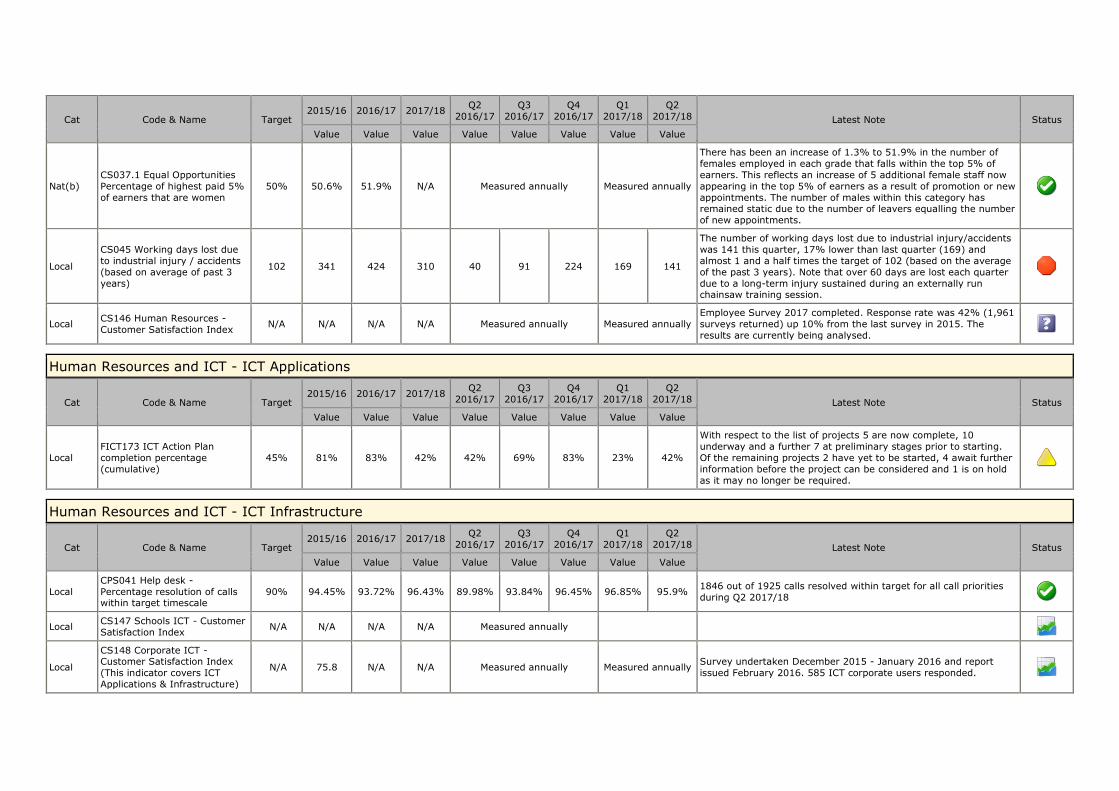
Nat(b) CS037.1 Equal Opportunities
Percentage of highest paid 5%
of earners that are women
50% 50.6% 51.9% N/A Measured annually Measured annually
There has been an increase of 1.3% to 51.9% in the number of
females employed in each grade that falls within the top 5% of
earners. This reflects an increase of 5 additional female staff now
appearing in the top 5% of earners as a result of promotion or new
appointments. The number of males within this category has remained static due to the number of leavers equalling the number
of new appointments.
Local
CS045 Working days lost due
to industrial injury / accidents
(based on average of past 3
years)
102 341 424 310 40 91 224 169 141
The number of working days lost due to industrial injury/accidents
was 141 this quarter, 17% lower than last quarter (169) and
almost 1 and a half times the target of 102 (based on the average
of the past 3 years). Note that over 60 days are lost each quarter
due to a long-term injury sustained during an externally run chainsaw training session.
Local CS146 Human Resources -
Customer Satisfaction Index N/A N/A N/A N/A Measured annually Measured annually
Employee Survey 2017 completed. Response rate was 42% (1,961
surveys returned) up 10% from the last survey in 2015. The
results are currently being analysed.
Human Resources and ICT - ICT Applications
Cat Code & Name Target 2015/16 2016/17 2017/18
Q2
2016/17
Q3
2016/17
Q4
2016/17
Q1
2017/18
Q2
2017/18 Latest Note Status
Value Value Value Value Value Value Value Value
Local
FICT173 ICT Action Plan
completion percentage
(cumulative)
45% 81% 83% 42% 42% 69% 83% 23% 42%
With respect to the list of projects 5 are now complete, 10
underway and a further 7 at preliminary stages prior to starting.
Of the remaining projects 2 have yet to be started, 4 await further
information before the project can be considered and 1 is on hold
as it may no longer be required.
Human Resources and ICT - ICT Infrastructure
Cat Code & Name Target 2015/16 2016/17 2017/18
Q2
2016/17
Q3
2016/17
Q4
2016/17
Q1
2017/18
Q2
2017/18 Latest Note Status
Value Value Value Value Value Value Value Value
Local
CPS041 Help desk -
Percentage resolution of calls within target timescale
90% 94.45% 93.72% 96.43% 89.98% 93.84% 96.45% 96.85% 95.9% 1846 out of 1925 calls resolved within target for all call priorities
during Q2 2017/18
Local CS147 Schools ICT - Customer
Satisfaction Index N/A N/A N/A N/A Measured annually
Local
CS148 Corporate ICT - Customer Satisfaction Index
(This indicator covers ICT
Applications & Infrastructure)
N/A 75.8 N/A N/A Measured annually Measured annually Survey undertaken December 2015 - January 2016 and report
issued February 2016. 585 ICT corporate users responded.

Cat Code & Name Target 2015/16 2016/17 2017/18
Q2
2016/17
Q3
2016/17
Q4
2016/17
Q1
2017/18
Q2
2017/18 Latest Note Status
Value Value Value Value Value Value Value Value
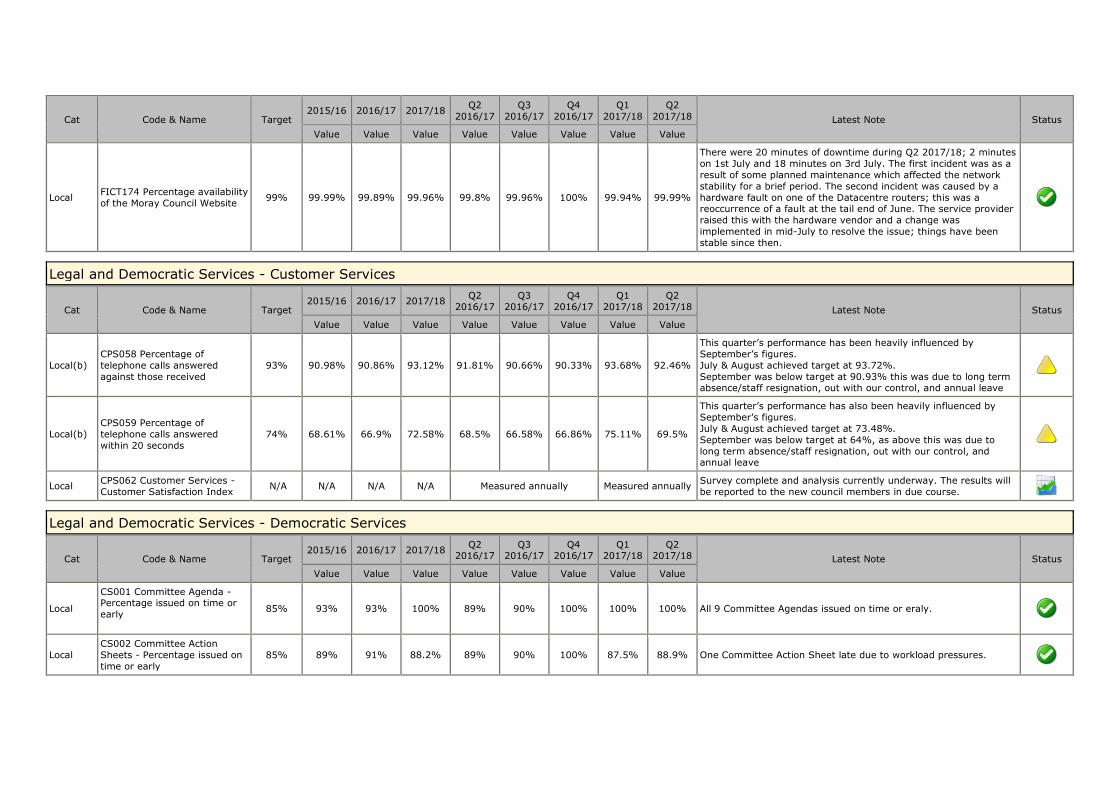
Local FICT174 Percentage availability
of the Moray Council Website 99% 99.99% 99.89% 99.96% 99.8% 99.96% 100% 99.94% 99.99%
There were 20 minutes of downtime during Q2 2017/18; 2 minutes
on 1st July and 18 minutes on 3rd July. The first incident was as a
result of some planned maintenance which affected the network
stability for a brief period. The second incident was caused by a
hardware fault on one of the Datacentre routers; this was a reoccurrence of a fault at the tail end of June. The service provider
raised this with the hardware vendor and a change was
implemented in mid-July to resolve the issue; things have been
stable since then.
Legal and Democratic Services - Customer Services
Cat Code & Name Target 2015/16 2016/17 2017/18
Q2
2016/17
Q3
2016/17
Q4
2016/17
Q1
2017/18
Q2
2017/18 Latest Note Status
Value Value Value Value Value Value Value Value
Local(b)
CPS058 Percentage of
telephone calls answered
against those received
93% 90.98% 90.86% 93.12% 91.81% 90.66% 90.33% 93.68% 92.46%
This quarter’s performance has been heavily influenced by
September’s figures.
July & August achieved target at 93.72%.
September was below target at 90.93% this was due to long term absence/staff resignation, out with our control, and annual leave
Local(b) CPS059 Percentage of
telephone calls answered
within 20 seconds
74% 68.61% 66.9% 72.58% 68.5% 66.58% 66.86% 75.11% 69.5%
This quarter’s performance has also been heavily influenced by
September’s figures.
July & August achieved target at 73.48%.
September was below target at 64%, as above this was due to
long term absence/staff resignation, out with our control, and annual leave
Local CPS062 Customer Services -
Customer Satisfaction Index N/A N/A N/A N/A Measured annually Measured annually
Survey complete and analysis currently underway. The results will
be reported to the new council members in due course.
Legal and Democratic Services - Democratic Services
Cat Code & Name Target 2015/16 2016/17 2017/18
Q2 2016/17
Q3 2016/17
Q4 2016/17
Q1 2017/18
Q2 2017/18 Latest Note Status
Value Value Value Value Value Value Value Value
Local
CS001 Committee Agenda - Percentage issued on time or
early
85% 93% 93% 100% 89% 90% 100% 100% 100% All 9 Committee Agendas issued on time or eraly.
Local CS002 Committee Action
Sheets - Percentage issued on
time or early
85% 89% 91% 88.2% 89% 90% 100% 87.5% 88.9% One Committee Action Sheet late due to workload pressures.
Cat Code & Name Target 2015/16 2016/17 2017/18
Q2
2016/17
Q3
2016/17
Q4
2016/17
Q1
2017/18
Q2
2017/18 Latest Note Status
Value Value Value Value Value Value Value Value
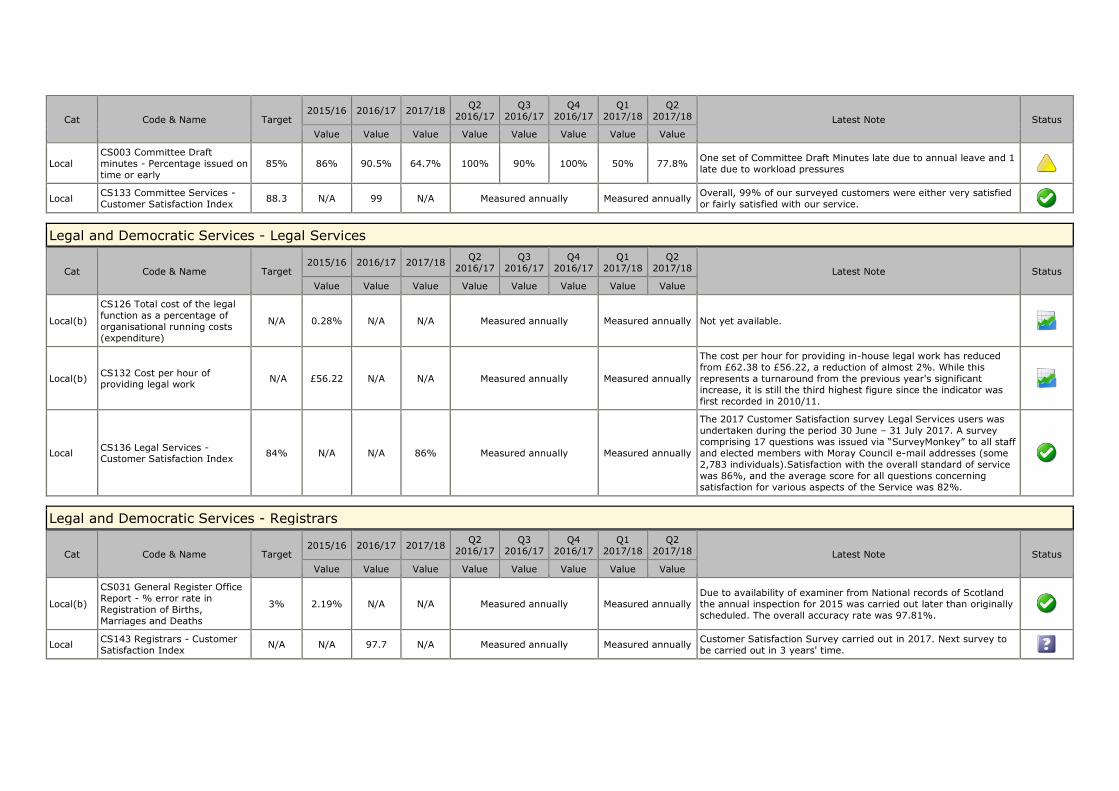
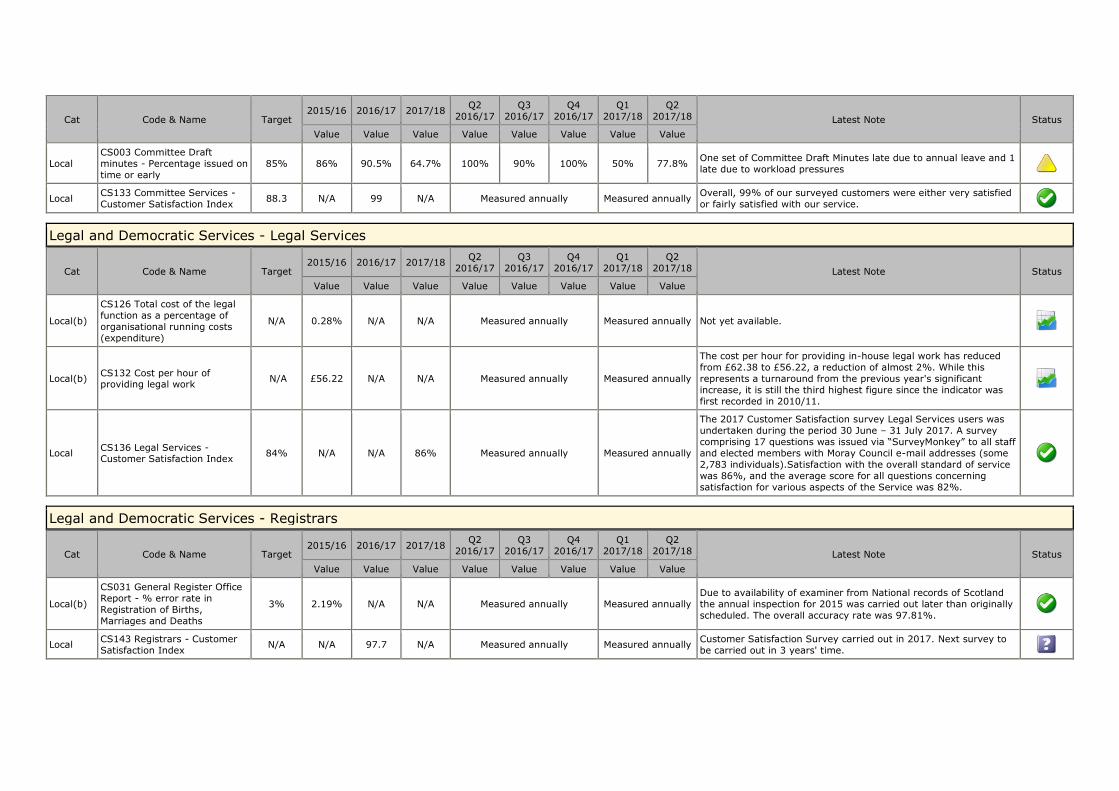
Local CS003 Committee Draft
minutes - Percentage issued on
time or early
85% 86% 90.5% 64.7% 100% 90% 100% 50% 77.8% One set of Committee Draft Minutes late due to annual leave and 1
late due to workload pressures
Local CS133 Committee Services -
Customer Satisfaction Index 88.3 N/A 99 N/A Measured annually Measured annually
Overall, 99% of our surveyed customers were either very satisfied
or fairly satisfied with our service.
Legal and Democratic Services - Legal Services
Cat Code & Name Target 2015/16 2016/17 2017/18
Q2
2016/17
Q3
2016/17
Q4
2016/17
Q1
2017/18
Q2
2017/18 Latest Note Status
Value Value Value Value Value Value Value Value
Local(b)
CS126 Total cost of the legal
function as a percentage of
organisational running costs
(expenditure)
N/A 0.28% N/A N/A Measured annually Measured annually Not yet available.
Local(b) CS132 Cost per hour of providing legal work
N/A £56.22 N/A N/A Measured annually Measured annually
The cost per hour for providing in-house legal work has reduced
from £62.38 to £56.22, a reduction of almost 2%. While this
represents a turnaround from the previous year's significant
increase, it is still the third highest figure since the indicator was
first recorded in 2010/11.
Local CS136 Legal Services - Customer Satisfaction Index
84% N/A N/A 86% Measured annually Measured annually
The 2017 Customer Satisfaction survey Legal Services users was
undertaken during the period 30 June – 31 July 2017. A survey
comprising 17 questions was issued via “SurveyMonkey” to all staff
and elected members with Moray Council e-mail addresses (some
2,783 individuals).Satisfaction with the overall standard of service
was 86%, and the average score for all questions concerning
satisfaction for various aspects of the Service was 82%.
Legal and Democratic Services - Registrars
Cat Code & Name Target 2015/16 2016/17 2017/18
Q2
2016/17
Q3
2016/17
Q4
2016/17
Q1
2017/18
Q2
2017/18 Latest Note Status
Value Value Value Value Value Value Value Value
Local(b)
CS031 General Register Office
Report - % error rate in
Registration of Births,
Marriages and Deaths
3% 2.19% N/A N/A Measured annually Measured annually
Due to availability of examiner from National records of Scotland
the annual inspection for 2015 was carried out later than originally
scheduled. The overall accuracy rate was 97.81%.
Local CS143 Registrars - Customer
Satisfaction Index N/A N/A 97.7 N/A Measured annually Measured annually
Customer Satisfaction Survey carried out in 2017. Next survey to
be carried out in 3 years' time.
2017/18 Quarter to September Corporate Services
Performance Report - Performance Indicators
Corporate Services - Audit
Cat Code & Name Target 2015/16 2016/17 2017/18
Q2
2016/17
Q3
2016/17
Q4
2016/17
Q1
2017/18
Q2
2017/18 Latest Note Status
Value Value Value Value Value Value Value Value
Local
FICT055 Percentage of
Delivery of Audit Plan
(cumulative)
45% 84% 79% 46% 41% 61% 79% 21% 46%
Plan is meantime on target with time spent on part completed
projects from prior year plan met from contingency allowance. A
delay in recruiting an additional member of staff for the team
pending resolution of a secondment arrangement will require some
planned projects for 2017/18 to be carried into 2018/19. This will be
the subject of a separate report to the Audit and Scrutiny
Committee.
Local
FICT056 Percentage of Audit
Reports issued within target
timescale following audit
completion
90% 90% 90% N/A 90% 90% 90% 90% 90%
Reports completed are subject to discussion with management to
agree findings and to secure completion of action plans detailing
responses to audit recommendations made. At the time of drafting
this report there are no delays in report clearance being experienced.
Local FICT300 Governance
Statement produced by 30th June
Yes Yes Yes N/A Measured annually Measured annually Governance Statement has been prepared for 2016/17 year by 30th
June for inclusion with the Annual Accounts for that year.
Corporate Services - Corporate Resources
Cat Code & Name Target 2015/16 2016/17 2017/18
Q2
2016/17
Q3
2016/17
Q4
2016/17
Q1
2017/18
Q2
2017/18 Latest Note Status
Value Value Value Value Value Value Value Value
Nat(b) CORP1 Support services as a
% of total gross expenditure N/A 4.4% N/A N/A Measured annually Measured annually
Support service costs for Moray Council rose for the first time since
2012/13 from £9.2M in 2014/15 to £10M in 2015/16. Gross
expenditure also rose from £220M to £228M, leading to a slight
increase in the percentage cost of support services for the Moray
Council from 4.17% to 4.4%. However, Moray Council remains
ranked 11th out of the 32 Scottish Councils for value, maintaining the improvement made from 17th in 2013/14. North Ayrshire again
leads the rankings with a figure of 2.5%, and Eilean Siar is 32nd with
10.2% (up from 8.15% in 2014/15).
Nat(b) CORP2 Cost of Democratic Core per 1,000 population
N/A £27,610 N/A N/A Measured annually Measured annually
At the end of 2015/16 Moray ranked as the 12th lowest Council (out
of 32) for the cost of the democratic core per 1,000 population;
unchanged from the 2013/14 ranking. Costs rose by 4.4% compared to 2014/1, compared to an average reduction across Scotland of
1.9%. Falkirk Council had the highest increase from 2014/15
(19.6%), while Fife managed to reduce their costs for this measure
Cat Code & Name Target 2015/16 2016/17 2017/18
Q2
2016/17
Q3
2016/17
Q4
2016/17
Q1
2017/18
Q2
2017/18 Latest Note Status
Value Value Value Value Value Value Value Value
by 25.1%. To put Moray Council's costs in context, the lowest ranked
council, North Lanarkshire, costs £12,490 per 1,000 population,
(down from £14,839 the previous year) while the highest ranked
Council was Orkney with costs of £152,699 per 1,000 population ( a
rise of almost 7% from the 2014/15 costs of £142,844 per 1,000 population).
Financial Services - Accountancy
Cat Code & Name Target 2015/16 2016/17 2017/18
Q2
2016/17
Q3
2016/17
Q4
2016/17
Q1
2017/18
Q2
2017/18 Latest Note Status
Value Value Value Value Value Value Value Value
Local
FS001 Annual Accounts
submitted by 30th June to
External Audit
Yes Yes Yes Yes Measured annually Measured annually submitted 29.6.17
Local FS002 Was Unqualified Audit Certificate Received (end
September)
Yes Yes Yes N/A Measured annually Measured annually 26th September Certificate was received
Local FS003 Provide Report to
Council to allow C Tax setting Yes Yes Yes N/A Measured annually Measured annually Committee report Feb 2017 for 17/18 budget
Local
FS008 Percentage of budget
monitoring reports issued to
budget managers within target
timescales
100% 100% 100% 100% 100% 100% 100% 100% 100%
Financial Services - Payments
Cat Code & Name Target 2015/16 2016/17 2017/18
Q2
2016/17
Q3
2016/17
Q4
2016/17
Q1
2017/18
Q2
2017/18 Latest Note Status
Value Value Value Value Value Value Value Value
Nat(b) FS101 Percentage of invoices
sampled paid within 30 days 85.0% 89.1% 89.9% 91.5% 88.4% 90.3% 89.8% 90.8% 92.1%
Local FS111 Payroll: Accuracy -
Number 99.5% 99.81% 99.72% 99.85% 99.7% 99.73% 99.74% 99.89% 99.86%
There were 15713 employees paid in quarter 2. 22 employees
were paid incorrectly.
Local FS112 Payroll: Accuracy - Value
99.85% 99.96% 99.94% 99.96% 99.94% 99.95% 99.94% 99.97% 99.94% The value of payments made in quarter 2 was £27,026,780.35. The value of incorrect payments was £16,416.07.
Financial Services - Revenues
Cat Code & Name Target 2015/16 2016/17 2017/18
Q2
2016/17
Q3
2016/17
Q4
2016/17
Q1
2017/18
Q2
2017/18 Latest Note Status
Value Value Value Value Value Value Value Value
Local
FICT137 Gross cost of
collecting Non Domestic Rates
per property.
£33.00 N/A £30.73 N/A Measured annually Measured annually The 2016/17 figure will not be available until August 2017.
Nat(b) SBA1e Gross administration
cost per benefits case £71.00 £60.86 £61.57 N/A Measured annually Measured annually CIPFA data for Finance PIs 2016-17
Nat(b) SCM5 Cost of collecting council tax per dwelling
£14.00 £9.71 £10.64 N/A Measured annually Measured annually The 2016/17 figure will not be available until August 2017.
Nat(b) SCM6b Percentage of current
year council tax received
(cumulative)
54.7% 95.6% 95.9% 54.6% 54.7% 81% 95.9% 28.7% 54.6%
The Revenues team has received 54.6% of current year council tax
during the first half of 2017/18 (Indicator SCM6b) against a target
of 54.7%. However, in 2015/16, the most recent date for
benchmarked data, Moray was the 21st out of the 32 council’s in
Scotland for collection rates, so continued improvement is targeted
in this area.
Human Resources and ICT - Human Resources
Cat Code & Name Target 2015/16 2016/17 2017/18
Q2
2016/17
Q3
2016/17
Q4
2016/17
Q1
2017/18
Q2
2017/18 Latest Note Status
Value Value Value Value Value Value Value Value
Nat(b)
CS016B.1 Sickness Absence
Rates - Average number of
working days per employee
lost through sickness absence -
Teachers
5.9 5.88 5.9 N/A Measured annually Measured annually
2016/17: Continued work in this area from schools management
supported by HR has allowed us to match last year’s return.
Nat(b)
CS016B.2 Sickness Absence
Rates - Average number of
working days per employee
lost through sickness absence -
all other local government
employees
11 11.88 11 N/A Measured annually Measured annually
2016/17: an improvement in sickness absence rates has been
achieved by a range of measures including a more targeted
approach in higher absence areas; early intervention; active case
management; and training for those managing cases.
Local
CS024a Number of Health and
Safety Incidents reported
(target based on previous 3
years average per quarter)
64 269 212 106 60 48 51 59 47
Local
CS024b Number of Violence
and Aggression Incidents reported (target based on
previous 3 years average per
quarter)
248 1,096 1,071 503 290 221 235 314 189
Education - 122
Woodview - 51 (figure does not include September as no ICT access at the time, but figures have reduced compared to
Maybank)
All other Sections - 16

Cat Code & Name Target 2015/16 2016/17 2017/18
Q2
2016/17
Q3
2016/17
Q4
2016/17
Q1
2017/18
Q2
2017/18 Latest Note Status
Value Value Value Value Value Value Value Value
Nat(b) CS037.1 Equal Opportunities
Percentage of highest paid 5%
of earners that are women
50% 50.6% 51.9% N/A Measured annually Measured annually
There has been an increase of 1.3% to 51.9% in the number of
females employed in each grade that falls within the top 5% of
earners. This reflects an increase of 5 additional female staff now
appearing in the top 5% of earners as a result of promotion or new
appointments. The number of males within this category has remained static due to the number of leavers equalling the number
of new appointments.
Local
CS045 Working days lost due
to industrial injury / accidents
(based on average of past 3
years)
102 341 424 310 40 91 224 169 141
The number of working days lost due to industrial injury/accidents
was 141 this quarter, 17% lower than last quarter (169) and
almost 1 and a half times the target of 102 (based on the average
of the past 3 years). Note that over 60 days are lost each quarter
due to a long-term injury sustained during an externally run chainsaw training session.
Local CS146 Human Resources -
Customer Satisfaction Index N/A N/A N/A N/A Measured annually Measured annually
Employee Survey 2017 completed. Response rate was 42% (1,961
surveys returned) up 10% from the last survey in 2015. The
results are currently being analysed.
Human Resources and ICT - ICT Applications
Cat Code & Name Target 2015/16 2016/17 2017/18
Q2
2016/17
Q3
2016/17
Q4
2016/17
Q1
2017/18
Q2
2017/18 Latest Note Status
Value Value Value Value Value Value Value Value
Local
FICT173 ICT Action Plan
completion percentage
(cumulative)
45% 81% 83% 42% 42% 69% 83% 23% 42%
With respect to the list of projects 5 are now complete, 10
underway and a further 7 at preliminary stages prior to starting.
Of the remaining projects 2 have yet to be started, 4 await further
information before the project can be considered and 1 is on hold
as it may no longer be required.
Human Resources and ICT - ICT Infrastructure
Cat Code & Name Target 2015/16 2016/17 2017/18
Q2
2016/17
Q3
2016/17
Q4
2016/17
Q1
2017/18
Q2
2017/18 Latest Note Status
Value Value Value Value Value Value Value Value
Local
CPS041 Help desk -
Percentage resolution of calls within target timescale
90% 94.45% 93.72% 96.43% 89.98% 93.84% 96.45% 96.85% 95.9% 1846 out of 1925 calls resolved within target for all call priorities
during Q2 2017/18
Local CS147 Schools ICT - Customer
Satisfaction Index N/A N/A N/A N/A Measured annually
Local
CS148 Corporate ICT - Customer Satisfaction Index
(This indicator covers ICT
Applications & Infrastructure)
N/A 75.8 N/A N/A Measured annually Measured annually Survey undertaken December 2015 - January 2016 and report
issued February 2016. 585 ICT corporate users responded.
Cat Code & Name Target 2015/16 2016/17 2017/18
Q2
2016/17
Q3
2016/17
Q4
2016/17
Q1
2017/18
Q2
2017/18 Latest Note Status
Value Value Value Value Value Value Value Value
Local FICT174 Percentage availability
of the Moray Council Website 99% 99.99% 99.89% 99.96% 99.8% 99.96% 100% 99.94% 99.99%
There were 20 minutes of downtime during Q2 2017/18; 2 minutes
on 1st July and 18 minutes on 3rd July. The first incident was as a
result of some planned maintenance which affected the network
stability for a brief period. The second incident was caused by a
hardware fault on one of the Datacentre routers; this was a reoccurrence of a fault at the tail end of June. The service provider
raised this with the hardware vendor and a change was
implemented in mid-July to resolve the issue; things have been
stable since then.
Legal and Democratic Services - Customer Services
Cat Code & Name Target 2015/16 2016/17 2017/18
Q2
2016/17
Q3
2016/17
Q4
2016/17
Q1
2017/18
Q2
2017/18 Latest Note Status
Value Value Value Value Value Value Value Value
Local(b)
CPS058 Percentage of
telephone calls answered
against those received
93% 90.98% 90.86% 93.12% 91.81% 90.66% 90.33% 93.68% 92.46%
This quarter’s performance has been heavily influenced by
September’s figures.
July & August achieved target at 93.72%.
September was below target at 90.93% this was due to long term absence/staff resignation, out with our control, and annual leave
Local(b) CPS059 Percentage of
telephone calls answered
within 20 seconds
74% 68.61% 66.9% 72.58% 68.5% 66.58% 66.86% 75.11% 69.5%
This quarter’s performance has also been heavily influenced by
September’s figures.
July & August achieved target at 73.48%.
September was below target at 64%, as above this was due to
long term absence/staff resignation, out with our control, and annual leave
Local CPS062 Customer Services -
Customer Satisfaction Index N/A N/A N/A N/A Measured annually Measured annually
Survey complete and analysis currently underway. The results will
be reported to the new council members in due course.
Legal and Democratic Services - Democratic Services
Cat Code & Name Target 2015/16 2016/17 2017/18
Q2 2016/17
Q3 2016/17
Q4 2016/17
Q1 2017/18
Q2 2017/18 Latest Note Status
Value Value Value Value Value Value Value Value
Local
CS001 Committee Agenda - Percentage issued on time or
early
85% 93% 93% 100% 89% 90% 100% 100% 100% All 9 Committee Agendas issued on time or eraly.
Local CS002 Committee Action
Sheets - Percentage issued on
time or early
85% 89% 91% 88.2% 89% 90% 100% 87.5% 88.9% One Committee Action Sheet late due to workload pressures.
Cat Code & Name Target 2015/16 2016/17 2017/18
Q2
2016/17
Q3
2016/17
Q4
2016/17
Q1
2017/18
Q2
2017/18 Latest Note Status
Value Value Value Value Value Value Value Value
Local CS003 Committee Draft
minutes - Percentage issued on
time or early
85% 86% 90.5% 64.7% 100% 90% 100% 50% 77.8% One set of Committee Draft Minutes late due to annual leave and 1
late due to workload pressures
Local CS133 Committee Services -
Customer Satisfaction Index 88.3 N/A 99 N/A Measured annually Measured annually
Overall, 99% of our surveyed customers were either very satisfied
or fairly satisfied with our service.
Legal and Democratic Services - Legal Services
Cat Code & Name Target 2015/16 2016/17 2017/18
Q2
2016/17
Q3
2016/17
Q4
2016/17
Q1
2017/18
Q2
2017/18 Latest Note Status
Value Value Value Value Value Value Value Value
Local(b)
CS126 Total cost of the legal
function as a percentage of
organisational running costs
(expenditure)
N/A 0.28% N/A N/A Measured annually Measured annually Not yet available.
Local(b) CS132 Cost per hour of providing legal work
N/A £56.22 N/A N/A Measured annually Measured annually
The cost per hour for providing in-house legal work has reduced
from £62.38 to £56.22, a reduction of almost 2%. While this
represents a turnaround from the previous year's significant
increase, it is still the third highest figure since the indicator was
first recorded in 2010/11.
Local CS136 Legal Services - Customer Satisfaction Index
84% N/A N/A 86% Measured annually Measured annually
The 2017 Customer Satisfaction survey Legal Services users was
undertaken during the period 30 June – 31 July 2017. A survey
comprising 17 questions was issued via “SurveyMonkey” to all staff
and elected members with Moray Council e-mail addresses (some
2,783 individuals).Satisfaction with the overall standard of service
was 86%, and the average score for all questions concerning
satisfaction for various aspects of the Service was 82%.
Legal and Democratic Services - Registrars
Cat Code & Name Target 2015/16 2016/17 2017/18
Q2
2016/17
Q3
2016/17
Q4
2016/17
Q1
2017/18
Q2
2017/18 Latest Note Status
Value Value Value Value Value Value Value Value
Local(b)
CS031 General Register Office
Report - % error rate in
Registration of Births,
Marriages and Deaths
3% 2.19% N/A N/A Measured annually Measured annually
Due to availability of examiner from National records of Scotland
the annual inspection for 2015 was carried out later than originally
scheduled. The overall accuracy rate was 97.81%.
Local CS143 Registrars - Customer
Satisfaction Index N/A N/A 97.7 N/A Measured annually Measured annually
Customer Satisfaction Survey carried out in 2017. Next survey to
be carried out in 3 years' time.
14
2017/18 Quarter to September Development Services
Performance Report - Performance Indicators
Building Standards
Code PI Code Short Name Current Target
2015/16
2016/17
2017/18
Q2 2016/
17
Q3 2016/
17
Q4 2016/
17
Q1 2017/
18
Q2 2017/18
Latest Note Traffic Light Icon
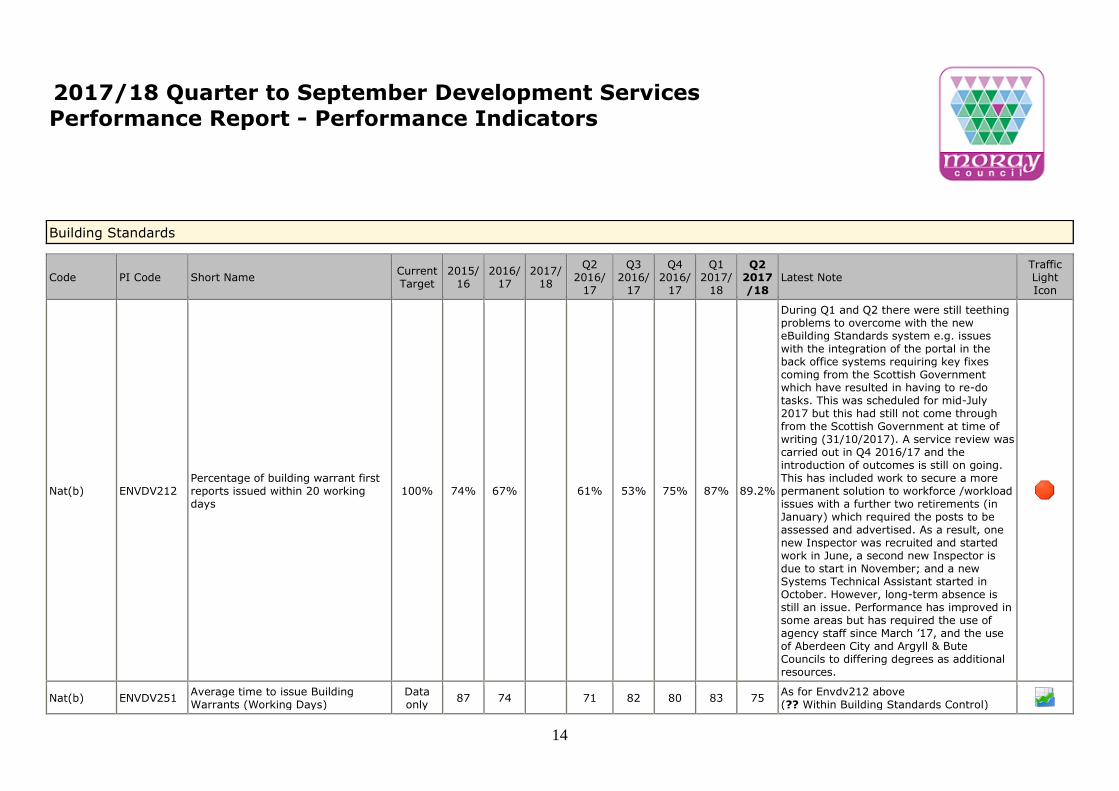
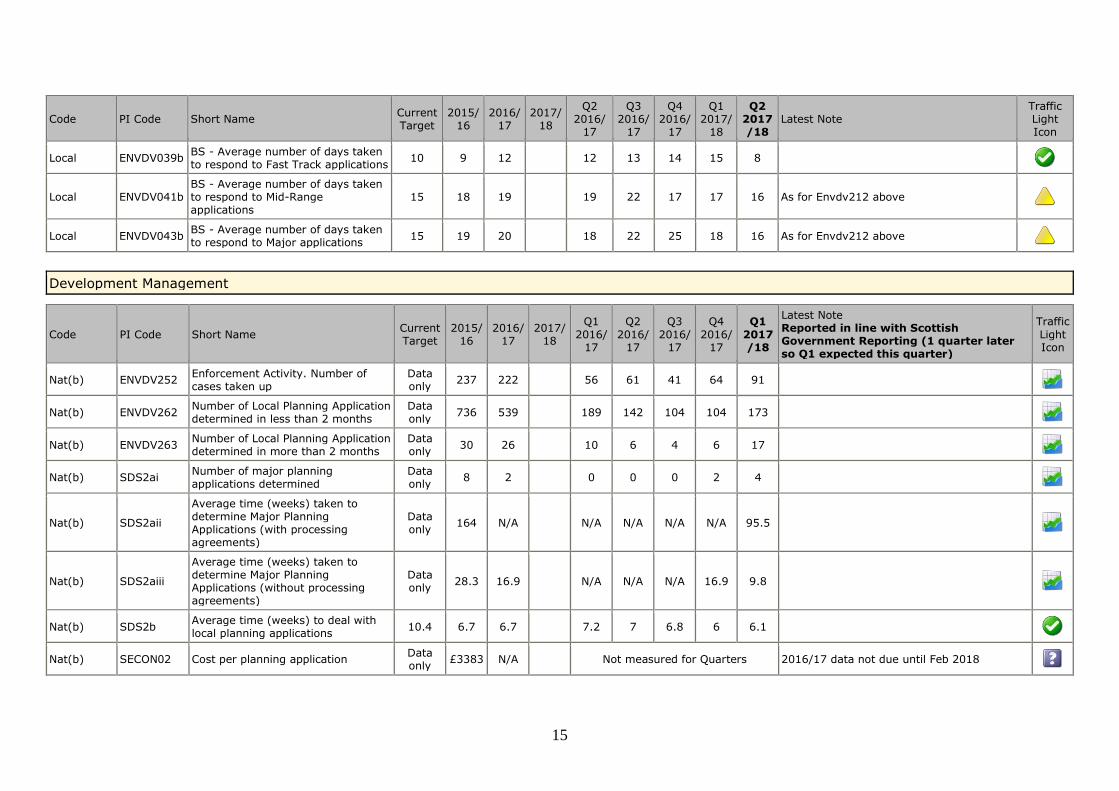
Nat(b) ENVDV212 Percentage of building warrant first reports issued within 20 working days
100% 74% 67% 61% 53% 75% 87% 89.2%
During Q1 and Q2 there were still teething problems to overcome with the new eBuilding Standards system e.g. issues with the integration of the portal in the back office systems requiring key fixes coming from the Scottish Government which have resulted in having to re-do tasks. This was scheduled for mid-July 2017 but this had still not come through from the Scottish Government at time of writing (31/10/2017). A service review was carried out in Q4 2016/17 and the introduction of outcomes is still on going. This has included work to secure a more permanent solution to workforce /workload issues with a further two retirements (in January) which required the posts to be assessed and advertised. As a result, one new Inspector was recruited and started work in June, a second new Inspector is due to start in November; and a new Systems Technical Assistant started in October. However, long-term absence is still an issue. Performance has improved in some areas but has required the use of agency staff since March ’17, and the use of Aberdeen City and Argyll & Bute Councils to differing degrees as additional resources.
Nat(b) ENVDV251 Average time to issue Building Warrants (Working Days)
Data only
87 74 71 82 80 83 75 As for Envdv212 above (?? Within Building Standards Control)
15
Code PI Code Short Name Current Target
2015/16
2016/17
2017/18
Q2 2016/
17
Q3 2016/
17
Q4 2016/
17
Q1 2017/
18
Q2 2017/18
Latest Note Traffic Light Icon
Local ENVDV039b BS - Average number of days taken to respond to Fast Track applications
10 9 12 12 13 14 15 8
Local ENVDV041b BS - Average number of days taken to respond to Mid-Range applications
15 18 19 19 22 17 17 16 As for Envdv212 above
Local ENVDV043b BS - Average number of days taken to respond to Major applications
15 19 20 18 22 25 18 16 As for Envdv212 above
Development Management
Code PI Code Short Name Current Target
2015/16
2016/17
2017/18
Q1
2016/17
Q2
2016/17
Q3
2016/17
Q4
2016/17
Q1
2017/18
Latest Note Reported in line with Scottish Government Reporting (1 quarter later so Q1 expected this quarter)
Traffic
Light Icon
Nat(b) ENVDV252 Enforcement Activity. Number of cases taken up
Data only
237 222 56 61 41 64 91
Nat(b) ENVDV262 Number of Local Planning Application determined in less than 2 months
Data only
736 539 189 142 104 104 173
Nat(b) ENVDV263 Number of Local Planning Application determined in more than 2 months
Data only
30 26 10 6 4 6 17
Nat(b) SDS2ai Number of major planning applications determined
Data only
8 2 0 0 0 2 4
Nat(b) SDS2aii
Average time (weeks) taken to determine Major Planning Applications (with processing agreements)
Data only
164 N/A N/A N/A N/A N/A 95.5
Nat(b) SDS2aiii
Average time (weeks) taken to determine Major Planning Applications (without processing agreements)
Data only
28.3 16.9 N/A N/A N/A 16.9 9.8
Nat(b) SDS2b Average time (weeks) to deal with local planning applications
10.4 6.7 6.7 7.2 7 6.8 6 6.1
Nat(b) SECON02 Cost per planning application Data only
£3383 N/A Not measured for Quarters 2016/17 data not due until Feb 2018
16
Code PI Code Short Name Current Target
2015/16
2016/17
2017/18
Q1 2016/
17
Q2 2016/
17
Q3 2016/
17
Q4 2016/
17
Q1 2017/18
Latest Note Reported in line with Scottish Government Reporting (1 quarter later so Q1 expected this quarter)
Traffic Light Icon
Nat(b) SECON03 Average Time Per Commercial Planning Application
Data only
7.69 N/A Not measured for Quarters 2016/17 data not due until Feb 2018
Economic Development
Code PI Code Short Name Current Target
2015/16
2016/17
2017/18
Q2 2016/
17
Q3 2016/
17
Q4 2016/
17
Q1 2017/
18
Q2 2017/18
Latest Note Traffic Light Icon
Local ENVDV266 Number of new Business start-ups through the Business Gateway
Data only
128 132 70 33 31 20 36 34 A total of 98 FTE jobs have been either retained or created at the end of Q2 by start-up businesses and business purchasers.
Local ENVDV267 Business Gateway 3 year survival rate (based on 100% sampling)
Data only
80% 84% Not measured for Quarters
Local ENVDV268 External funding leverage (against every pound from Council)
Data only
£2.47 £4.69 Not measured for Quarters SLAED comparator information for 16/17 should be available in December ‘17
Nat(b) SECON05 No of business gateway start-ups per 10,000 population
16.91 14.34 N/A Not measured for Quarters 2016/17 data not due until Feb 2018
17
Environmental Health
Code PI Code Short Name Current Target
2015/16
2016/17
2017/18
Q2 2016/
17
Q3 2016/
17
Q4 2016/
17
Q1 2017/
18
Q2 2017/18
Latest Note Traffic Light Icon
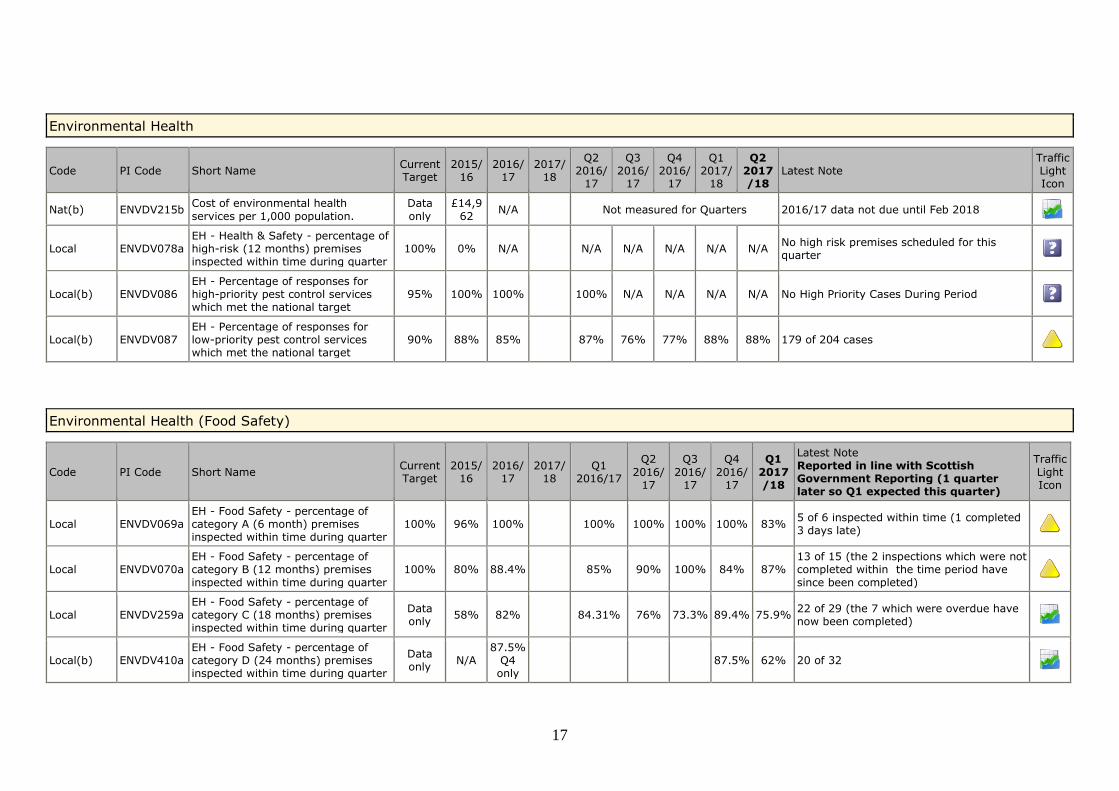
Nat(b) ENVDV215b Cost of environmental health
services per 1,000 population.
Data
only
£14,9
62 N/A Not measured for Quarters 2016/17 data not due until Feb 2018
Local ENVDV078a EH - Health & Safety - percentage of high-risk (12 months) premises inspected within time during quarter
100% 0% N/A N/A N/A N/A N/A N/A No high risk premises scheduled for this quarter
Local(b) ENVDV086 EH - Percentage of responses for high-priority pest control services which met the national target
95% 100% 100% 100% N/A N/A N/A N/A No High Priority Cases During Period
Local(b) ENVDV087 EH - Percentage of responses for low-priority pest control services which met the national target
90% 88% 85% 87% 76% 77% 88% 88% 179 of 204 cases
Environmental Health (Food Safety)
Code PI Code Short Name Current Target
2015/16
2016/17
2017/18
Q1 2016/17
Q2
2016/17
Q3
2016/17
Q4
2016/17
Q1
2017/18
Latest Note Reported in line with Scottish Government Reporting (1 quarter later so Q1 expected this quarter)
Traffic
Light Icon
Local ENVDV069a EH - Food Safety - percentage of category A (6 month) premises inspected within time during quarter
100% 96% 100% 100% 100% 100% 100% 83% 5 of 6 inspected within time (1 completed 3 days late)
Local ENVDV070a EH - Food Safety - percentage of category B (12 months) premises
inspected within time during quarter
100% 80% 88.4% 85% 90% 100% 84% 87% 13 of 15 (the 2 inspections which were not completed within the time period have
since been completed)
Local ENVDV259a EH - Food Safety - percentage of category C (18 months) premises inspected within time during quarter
Data only
58% 82% 84.31% 76% 73.3% 89.4% 75.9% 22 of 29 (the 7 which were overdue have now been completed)
Local(b) ENVDV410a EH - Food Safety - percentage of category D (24 months) premises inspected within time during quarter
Data only
N/A 87.5%
Q4 only
87.5% 62% 20 of 32
18
Code PI Code Short Name Current Target
2015/16
2016/17
2017/18
Q1 2016/17
Q2 2016/
17
Q3 2016/
17
Q4 2016/
17
Q1 2017/18
Latest Note Reported in line with Scottish Government Reporting (1 quarter later so Q1 expected this quarter)
Traffic Light Icon
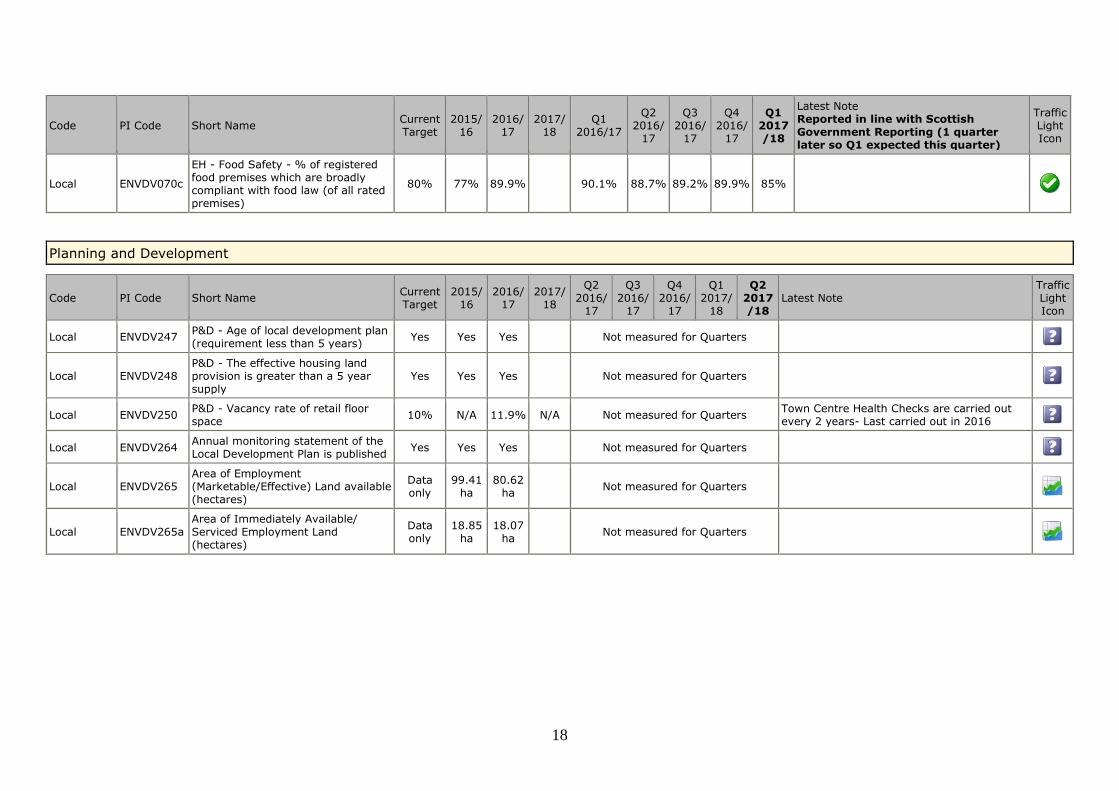
Local ENVDV070c
EH - Food Safety - % of registered food premises which are broadly compliant with food law (of all rated premises)
80% 77% 89.9% 90.1% 88.7% 89.2% 89.9% 85%
Planning and Development
Code PI Code Short Name Current Target
2015/16
2016/17
2017/18
Q2 2016/
17
Q3 2016/
17
Q4 2016/
17
Q1 2017/
18
Q2 2017/18
Latest Note Traffic Light Icon
Local ENVDV247 P&D - Age of local development plan (requirement less than 5 years)
Yes Yes Yes Not measured for Quarters
Local ENVDV248 P&D - The effective housing land provision is greater than a 5 year supply
Yes Yes Yes Not measured for Quarters
Local ENVDV250 P&D - Vacancy rate of retail floor space
10% N/A 11.9% N/A Not measured for Quarters Town Centre Health Checks are carried out every 2 years- Last carried out in 2016
Local ENVDV264 Annual monitoring statement of the Local Development Plan is published
Yes Yes Yes Not measured for Quarters
Local ENVDV265 Area of Employment (Marketable/Effective) Land available (hectares)
Data only
99.41 ha
80.62 ha
Not measured for Quarters
Local ENVDV265a Area of Immediately Available/ Serviced Employment Land (hectares)
Data only
18.85 ha
18.07 ha
Not measured for Quarters
19
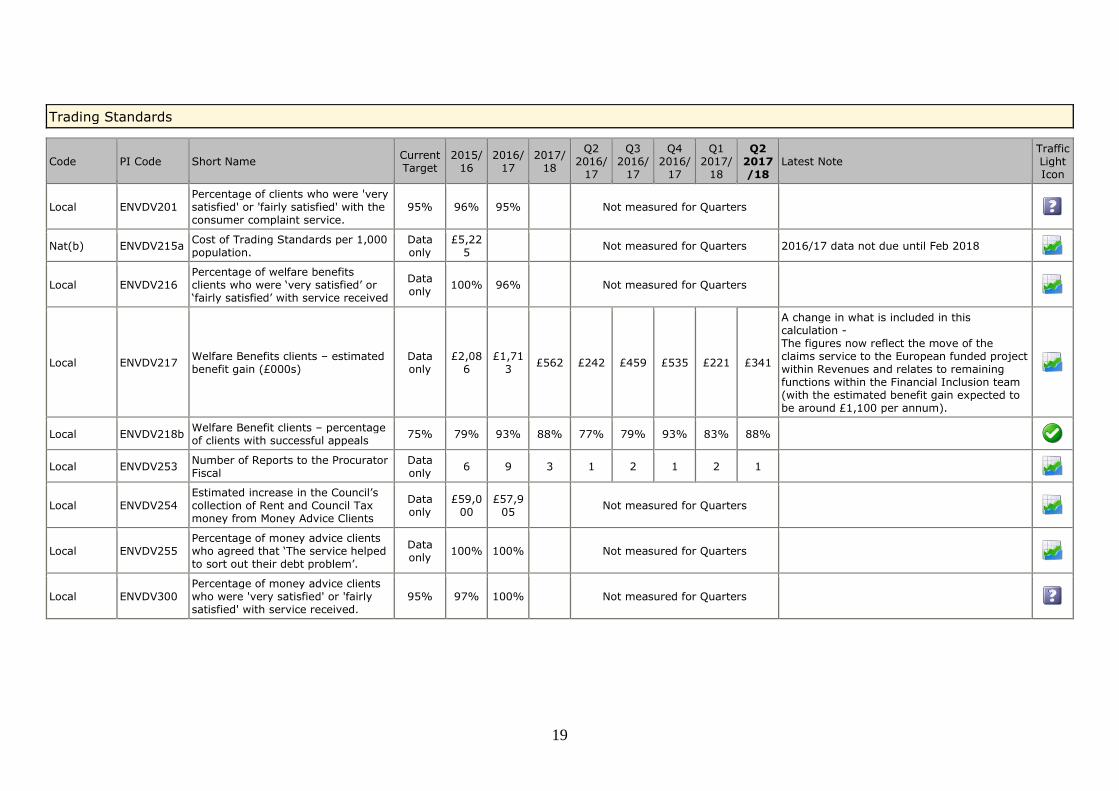
Trading Standards
Code PI Code Short Name Current Target
2015/16
2016/17
2017/18
Q2 2016/
17
Q3 2016/
17
Q4 2016/
17
Q1 2017/
18
Q2 2017/18
Latest Note Traffic Light Icon
Local ENVDV201 Percentage of clients who were 'very satisfied' or 'fairly satisfied' with the consumer complaint service.
95% 96% 95% Not measured for Quarters
Nat(b) ENVDV215a Cost of Trading Standards per 1,000 population.
Data only
£5,225
Not measured for Quarters 2016/17 data not due until Feb 2018
Local ENVDV216 Percentage of welfare benefits clients who were ‘very satisfied’ or ‘fairly satisfied’ with service received
Data only
100% 96% Not measured for Quarters
Local ENVDV217 Welfare Benefits clients – estimated benefit gain (£000s)
Data only
£2,086
£1,713
£562 £242 £459 £535 £221 £341
A change in what is included in this calculation - The figures now reflect the move of the claims service to the European funded project within Revenues and relates to remaining functions within the Financial Inclusion team (with the estimated benefit gain expected to be around £1,100 per annum).
Local ENVDV218b Welfare Benefit clients – percentage of clients with successful appeals
75% 79% 93% 88% 77% 79% 93% 83% 88%
Local ENVDV253 Number of Reports to the Procurator Fiscal
Data only
6 9 3 1 2 1 2 1
Local ENVDV254 Estimated increase in the Council’s collection of Rent and Council Tax money from Money Advice Clients
Data only
£59,000
£57,905
Not measured for Quarters
Local ENVDV255 Percentage of money advice clients who agreed that ‘The service helped to sort out their debt problem’.
Data only
100% 100% Not measured for Quarters
Local ENVDV300 Percentage of money advice clients who were 'very satisfied' or 'fairly satisfied' with service received.
95% 97% 100% Not measured for Quarters
20
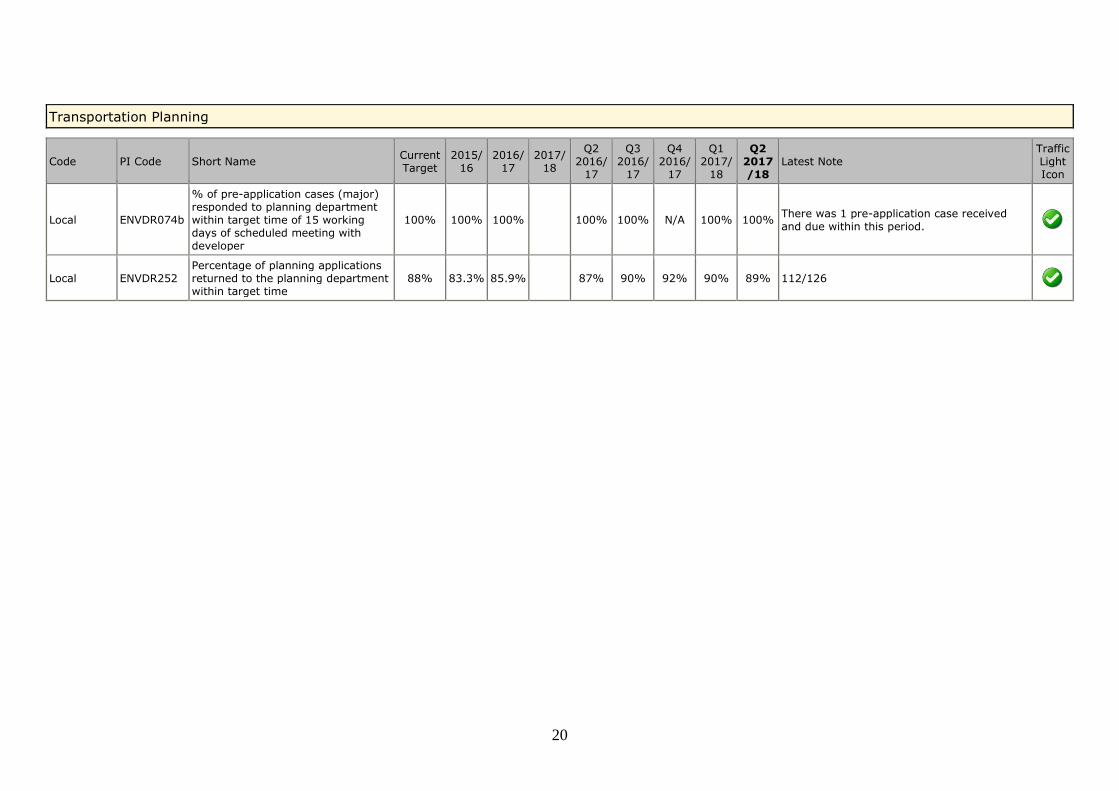
Transportation Planning
Code PI Code Short Name Current Target
2015/16
2016/17
2017/18
Q2 2016/
17
Q3 2016/
17
Q4 2016/
17
Q1 2017/
18
Q2 2017/18
Latest Note Traffic Light Icon
Local ENVDR074b
% of pre-application cases (major) responded to planning department within target time of 15 working days of scheduled meeting with developer
100% 100% 100% 100% 100% N/A 100% 100% There was 1 pre-application case received and due within this period.
Local ENVDR252 Percentage of planning applications returned to the planning department within target time
88% 83.3% 85.9% 87% 90% 92% 90% 89% 112/126
21
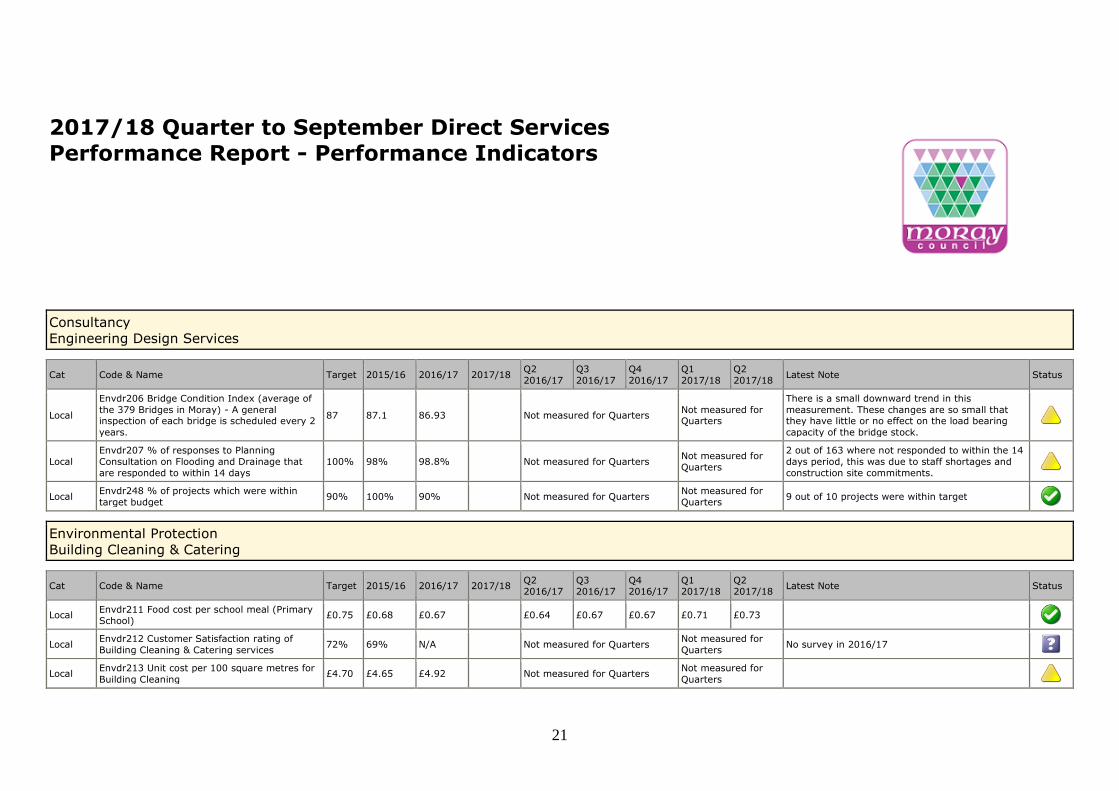
2017/18 Quarter to September Direct Services
Performance Report - Performance Indicators
Consultancy Engineering Design Services
Cat Code & Name Target 2015/16 2016/17 2017/18 Q2
2016/17
Q3
2016/17
Q4
2016/17
Q1
2017/18
Q2
2017/18 Latest Note Status
Local
Envdr206 Bridge Condition Index (average of
the 379 Bridges in Moray) - A general inspection of each bridge is scheduled every 2
years.
87 87.1 86.93 Not measured for Quarters Not measured for Quarters
There is a small downward trend in this
measurement. These changes are so small that they have little or no effect on the load bearing
capacity of the bridge stock.
Local Envdr207 % of responses to Planning
Consultation on Flooding and Drainage that
are responded to within 14 days
100% 98% 98.8% Not measured for Quarters Not measured for
Quarters
2 out of 163 where not responded to within the 14
days period, this was due to staff shortages and
construction site commitments.
Local Envdr248 % of projects which were within
target budget 90% 100% 90% Not measured for Quarters
Not measured for
Quarters 9 out of 10 projects were within target
Environmental Protection Building Cleaning & Catering
Cat Code & Name Target 2015/16 2016/17 2017/18 Q2 2016/17
Q3 2016/17
Q4 2016/17
Q1 2017/18
Q2 2017/18
Latest Note Status
Local Envdr211 Food cost per school meal (Primary
School) £0.75 £0.68 £0.67 £0.64 £0.67 £0.67 £0.71 £0.73
Local Envdr212 Customer Satisfaction rating of
Building Cleaning & Catering services 72% 69% N/A Not measured for Quarters
Not measured for
Quarters No survey in 2016/17
Local Envdr213 Unit cost per 100 square metres for
Building Cleaning £4.70 £4.65 £4.92 Not measured for Quarters
Not measured for
Quarters
22
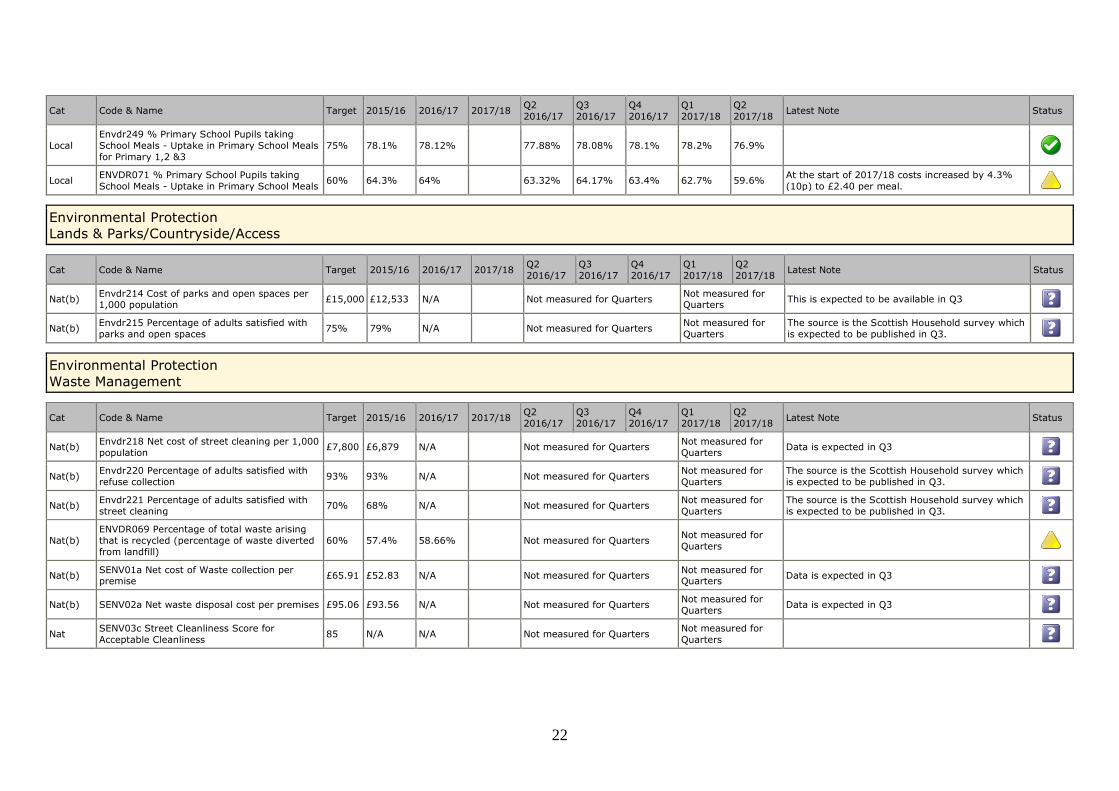
Cat Code & Name Target 2015/16 2016/17 2017/18 Q2
2016/17
Q3
2016/17
Q4
2016/17
Q1
2017/18
Q2
2017/18 Latest Note Status
Local Envdr249 % Primary School Pupils taking
School Meals - Uptake in Primary School Meals
for Primary 1,2 &3
75% 78.1% 78.12% 77.88% 78.08% 78.1% 78.2% 76.9%
Local ENVDR071 % Primary School Pupils taking
School Meals - Uptake in Primary School Meals 60% 64.3% 64% 63.32% 64.17% 63.4% 62.7% 59.6%
At the start of 2017/18 costs increased by 4.3%
(10p) to £2.40 per meal.
Environmental Protection Lands & Parks/Countryside/Access
Cat Code & Name Target 2015/16 2016/17 2017/18 Q2
2016/17
Q3
2016/17
Q4
2016/17
Q1
2017/18
Q2
2017/18 Latest Note Status
Nat(b) Envdr214 Cost of parks and open spaces per 1,000 population
£15,000 £12,533 N/A Not measured for Quarters Not measured for Quarters
This is expected to be available in Q3
Nat(b) Envdr215 Percentage of adults satisfied with
parks and open spaces 75% 79% N/A Not measured for Quarters
Not measured for
Quarters
The source is the Scottish Household survey which
is expected to be published in Q3.
Environmental Protection Waste Management
Cat Code & Name Target 2015/16 2016/17 2017/18 Q2
2016/17
Q3
2016/17
Q4
2016/17
Q1
2017/18
Q2
2017/18 Latest Note Status
Nat(b) Envdr218 Net cost of street cleaning per 1,000
population £7,800 £6,879 N/A Not measured for Quarters
Not measured for
Quarters Data is expected in Q3
Nat(b) Envdr220 Percentage of adults satisfied with
refuse collection 93% 93% N/A Not measured for Quarters
Not measured for
Quarters
The source is the Scottish Household survey which
is expected to be published in Q3.
Nat(b) Envdr221 Percentage of adults satisfied with
street cleaning 70% 68% N/A Not measured for Quarters
Not measured for
Quarters
The source is the Scottish Household survey which
is expected to be published in Q3.
Nat(b) ENVDR069 Percentage of total waste arising
that is recycled (percentage of waste diverted
from landfill)
60% 57.4% 58.66% Not measured for Quarters Not measured for
Quarters
Nat(b) SENV01a Net cost of Waste collection per premise
£65.91 £52.83 N/A Not measured for Quarters Not measured for Quarters
Data is expected in Q3
Nat(b) SENV02a Net waste disposal cost per premises £95.06 £93.56 N/A Not measured for Quarters Not measured for
Quarters Data is expected in Q3
Nat SENV03c Street Cleanliness Score for
Acceptable Cleanliness 85 N/A N/A Not measured for Quarters
Not measured for
Quarters
23
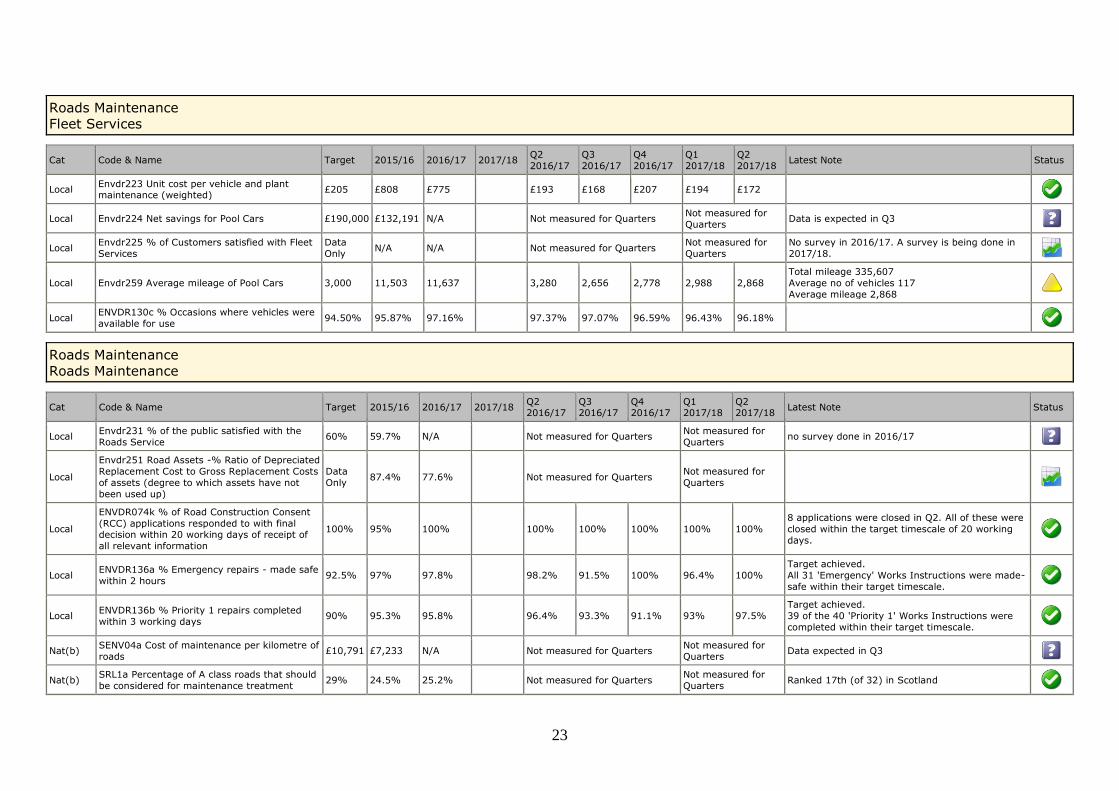
Roads Maintenance Fleet Services
Cat Code & Name Target 2015/16 2016/17 2017/18 Q2
2016/17
Q3
2016/17
Q4
2016/17
Q1
2017/18
Q2
2017/18 Latest Note Status
Local Envdr223 Unit cost per vehicle and plant maintenance (weighted)
£205 £808 £775 £193 £168 £207 £194 £172
Local Envdr224 Net savings for Pool Cars £190,000 £132,191 N/A Not measured for Quarters Not measured for
Quarters Data is expected in Q3
Local Envdr225 % of Customers satisfied with Fleet
Services
Data
Only N/A N/A Not measured for Quarters
Not measured for
Quarters
No survey in 2016/17. A survey is being done in
2017/18.
Local Envdr259 Average mileage of Pool Cars 3,000 11,503 11,637 3,280 2,656 2,778 2,988 2,868
Total mileage 335,607
Average no of vehicles 117
Average mileage 2,868
Local ENVDR130c % Occasions where vehicles were
available for use 94.50% 95.87% 97.16% 97.37% 97.07% 96.59% 96.43% 96.18%
Roads Maintenance Roads Maintenance
Cat Code & Name Target 2015/16 2016/17 2017/18 Q2 2016/17
Q3 2016/17
Q4 2016/17
Q1 2017/18
Q2 2017/18
Latest Note Status
Local Envdr231 % of the public satisfied with the
Roads Service 60% 59.7% N/A Not measured for Quarters
Not measured for
Quarters no survey done in 2016/17
Local
Envdr251 Road Assets -% Ratio of Depreciated
Replacement Cost to Gross Replacement Costs
of assets (degree to which assets have not
been used up)
Data
Only 87.4% 77.6% Not measured for Quarters
Not measured for
Quarters
Local
ENVDR074k % of Road Construction Consent
(RCC) applications responded to with final decision within 20 working days of receipt of
all relevant information
100% 95% 100% 100% 100% 100% 100% 100%
8 applications were closed in Q2. All of these were
closed within the target timescale of 20 working
days.
Local ENVDR136a % Emergency repairs - made safe
within 2 hours 92.5% 97% 97.8% 98.2% 91.5% 100% 96.4% 100%
Target achieved.
All 31 'Emergency' Works Instructions were made-
safe within their target timescale.
Local ENVDR136b % Priority 1 repairs completed
within 3 working days 90% 95.3% 95.8% 96.4% 93.3% 91.1% 93% 97.5%
Target achieved.
39 of the 40 'Priority 1' Works Instructions were
completed within their target timescale.
Nat(b) SENV04a Cost of maintenance per kilometre of
roads £10,791 £7,233 N/A Not measured for Quarters
Not measured for
Quarters Data expected in Q3
Nat(b) SRL1a Percentage of A class roads that should
be considered for maintenance treatment 29% 24.5% 25.2% Not measured for Quarters
Not measured for
Quarters Ranked 17th (of 32) in Scotland
24
Cat Code & Name Target 2015/16 2016/17 2017/18 Q2
2016/17
Q3
2016/17
Q4
2016/17
Q1
2017/18
Q2
2017/18 Latest Note Status
Nat(b) SRL1b Percentage of B class roads that should
be considered for maintenance treatment 34.8% 22.5% 22.8% Not measured for Quarters
Not measured for
Quarters Ranked 8th (of 32) in Scotland
Nat(b) SRL1c Percentage of C class roads that should
be considered for maintenance treatment 34.7% 23.9% 21.9% Not measured for Quarters
Not measured for
Quarters Ranked 5th (of 32) in Scotland
Nat(b) SRL1d Percentage of unclassified roads that
should be considered for maintenance
treatment
40.1% 32.7% 31.4% Not measured for Quarters Not measured for
Quarters Ranked 5th (of 32) in Scotland
Nat(b) SRL1e Overall percentage of road network that
should be considered for maintenance
treatment
36.7% 27.9% 26.9% Not measured for Quarters Not measured for
Quarters Ranked 4th (of 32) in Scotland
Transportation Car Parks
Cat Code & Name Target 2015/16 2016/17 2017/18 Q2
2016/17
Q3
2016/17
Q4
2016/17
Q1
2017/18
Q2
2017/18 Latest Note Status
Local Envdr232 Average occupancy of all paid car
parks in Elgin 51.5% 51% 51% 50% 55% 52% 53% 53%
Monitoring survey undertaken 21 August - 2
September 2017
17,291/32,384
Local Envdr233 Net income from Elgin Pay & Display
car parks after maintenance expenses
Data
Only £582,734 £564,000 Not measured for Quarters
Not measured for
Quarters
Annual income of £690k (after transfer to Lossie
Green Trust) less maintenance of £126k
Figures taken from FMS 18/4/17
Local Envdr234 % of customers satisfied with the
car parks 85% 84% N/A Not measured for Quarters
Not measured for
Quarters No data from citizen panel available
Local ENVDR097e % representing the number of
short term (2 hours or less) stays in Pay &
Display car parks to the total number of stays
85% 85% 85% 85% 85% 84% 85% 84%
Of the 137,839 tickets, processed through car park machines for up to 10 hours, this quarter 116,115
were for the 2 hour tariff.
The figures exclude Lossie Green & Lossie Wynd
car parks
Transportation Harbours Services (including dredger)
Cat Code & Name Target 2015/16 2016/17 2017/18 Q2 2016/17
Q3 2016/17
Q4 2016/17
Q1 2017/18
Q2 2017/18
Latest Note Status
Local
Envdr235 Net cost per berthing (recreational)
– taking account of capital, revenue and
income
Data
Only -£130 £2,409 Not measured for Quarters
Not measured for
Quarters
At the end of Quarter 4 Expenditure (Capital
£628,893 & Revenue £105,794) - Less Income of
£84,202 - divided by 270 berths = £2,409. These
figures exclude depreciation in the revenue costs
25
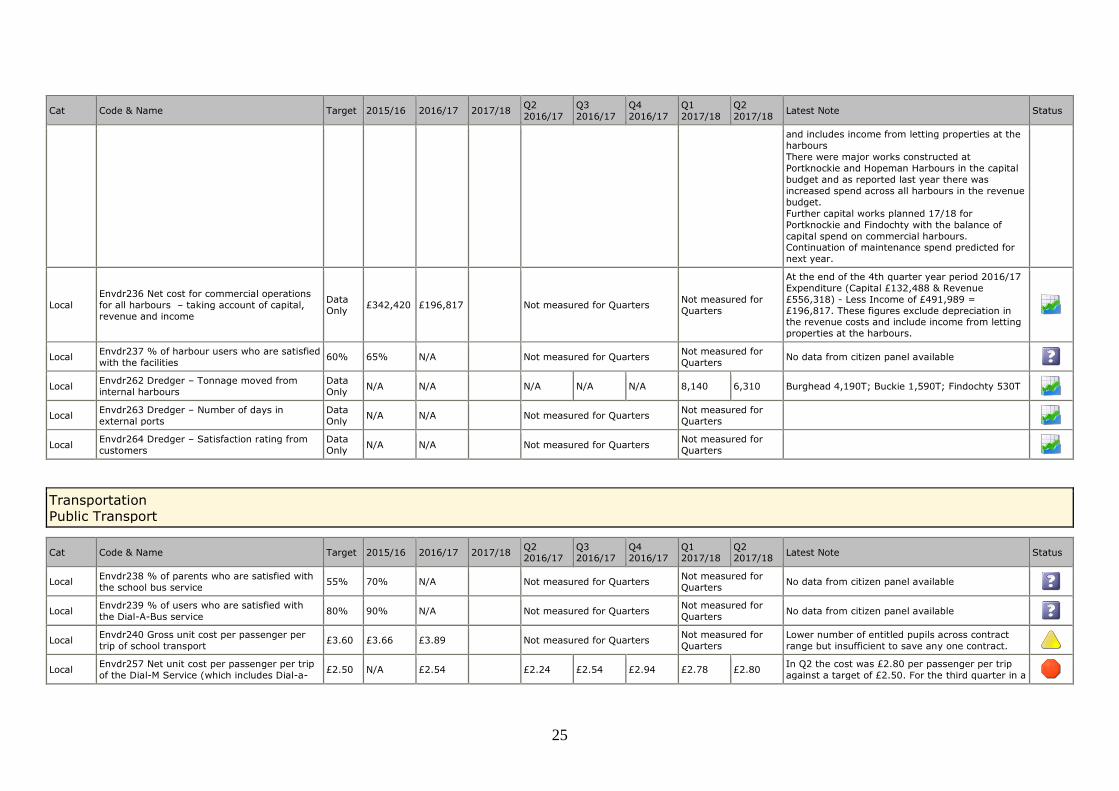
Cat Code & Name Target 2015/16 2016/17 2017/18 Q2
2016/17
Q3
2016/17
Q4
2016/17
Q1
2017/18
Q2
2017/18 Latest Note Status
and includes income from letting properties at the
harbours
There were major works constructed at
Portknockie and Hopeman Harbours in the capital
budget and as reported last year there was
increased spend across all harbours in the revenue
budget.
Further capital works planned 17/18 for
Portknockie and Findochty with the balance of
capital spend on commercial harbours. Continuation of maintenance spend predicted for
next year.
Local Envdr236 Net cost for commercial operations
for all harbours – taking account of capital,
revenue and income
Data
Only £342,420 £196,817 Not measured for Quarters
Not measured for
Quarters
At the end of the 4th quarter year period 2016/17
Expenditure (Capital £132,488 & Revenue
£556,318) - Less Income of £491,989 =
£196,817. These figures exclude depreciation in the revenue costs and include income from letting
properties at the harbours.
Local Envdr237 % of harbour users who are satisfied
with the facilities 60% 65% N/A Not measured for Quarters
Not measured for
Quarters No data from citizen panel available
Local Envdr262 Dredger – Tonnage moved from
internal harbours
Data
Only N/A N/A N/A N/A N/A 8,140 6,310 Burghead 4,190T; Buckie 1,590T; Findochty 530T
Local Envdr263 Dredger – Number of days in
external ports
Data
Only N/A N/A Not measured for Quarters
Not measured for
Quarters
Local Envdr264 Dredger – Satisfaction rating from
customers
Data
Only N/A N/A Not measured for Quarters
Not measured for
Quarters
Transportation Public Transport
Cat Code & Name Target 2015/16 2016/17 2017/18 Q2 2016/17
Q3 2016/17
Q4 2016/17
Q1 2017/18
Q2 2017/18
Latest Note Status
Local Envdr238 % of parents who are satisfied with
the school bus service 55% 70% N/A Not measured for Quarters
Not measured for
Quarters No data from citizen panel available
Local Envdr239 % of users who are satisfied with
the Dial-A-Bus service 80% 90% N/A Not measured for Quarters
Not measured for
Quarters No data from citizen panel available
Local Envdr240 Gross unit cost per passenger per
trip of school transport £3.60 £3.66 £3.89 Not measured for Quarters
Not measured for
Quarters
Lower number of entitled pupils across contract
range but insufficient to save any one contract.
Local Envdr257 Net unit cost per passenger per trip
of the Dial-M Service (which includes Dial-a-£2.50 N/A £2.54 £2.24 £2.54 £2.94 £2.78 £2.80
In Q2 the cost was £2.80 per passenger per trip
against a target of £2.50. For the third quarter in a
26
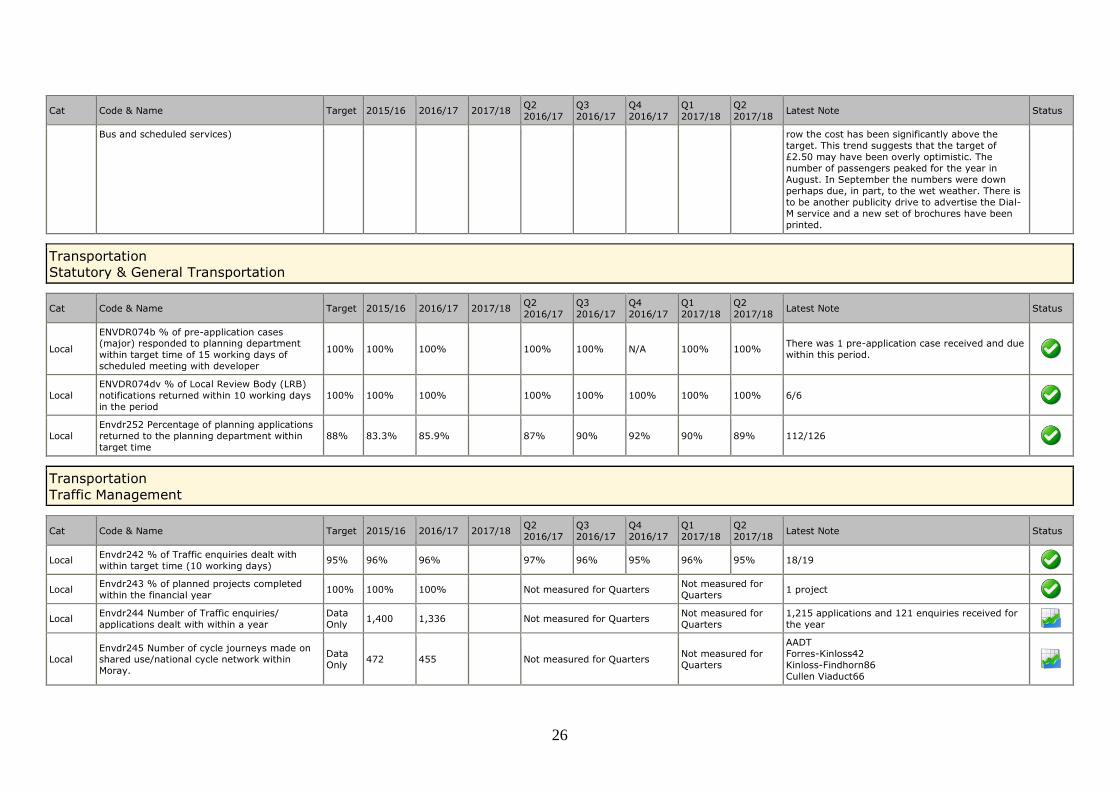
Cat Code & Name Target 2015/16 2016/17 2017/18 Q2
2016/17
Q3
2016/17
Q4
2016/17
Q1
2017/18
Q2
2017/18 Latest Note Status
Bus and scheduled services) row the cost has been significantly above the
target. This trend suggests that the target of
£2.50 may have been overly optimistic. The
number of passengers peaked for the year in
August. In September the numbers were down
perhaps due, in part, to the wet weather. There is
to be another publicity drive to advertise the Dial-
M service and a new set of brochures have been
printed.
Transportation Statutory & General Transportation
Cat Code & Name Target 2015/16 2016/17 2017/18 Q2
2016/17
Q3
2016/17
Q4
2016/17
Q1
2017/18
Q2
2017/18 Latest Note Status
Local
ENVDR074b % of pre-application cases (major) responded to planning department
within target time of 15 working days of
scheduled meeting with developer
100% 100% 100% 100% 100% N/A 100% 100% There was 1 pre-application case received and due
within this period.
Local ENVDR074dv % of Local Review Body (LRB)
notifications returned within 10 working days
in the period
100% 100% 100% 100% 100% 100% 100% 100% 6/6
Local Envdr252 Percentage of planning applications
returned to the planning department within
target time
88% 83.3% 85.9% 87% 90% 92% 90% 89% 112/126
Transportation Traffic Management
Cat Code & Name Target 2015/16 2016/17 2017/18 Q2
2016/17
Q3
2016/17
Q4
2016/17
Q1
2017/18
Q2
2017/18 Latest Note Status
Local Envdr242 % of Traffic enquiries dealt with
within target time (10 working days) 95% 96% 96% 97% 96% 95% 96% 95% 18/19
Local Envdr243 % of planned projects completed
within the financial year 100% 100% 100% Not measured for Quarters
Not measured for
Quarters 1 project
Local Envdr244 Number of Traffic enquiries/
applications dealt with within a year
Data
Only 1,400 1,336 Not measured for Quarters
Not measured for
Quarters
1,215 applications and 121 enquiries received for
the year
Local Envdr245 Number of cycle journeys made on shared use/national cycle network within
Moray.
Data
Only 472 455 Not measured for Quarters
Not measured for
Quarters
AADT
Forres-Kinloss42
Kinloss-Findhorn86
Cullen Viaduct66
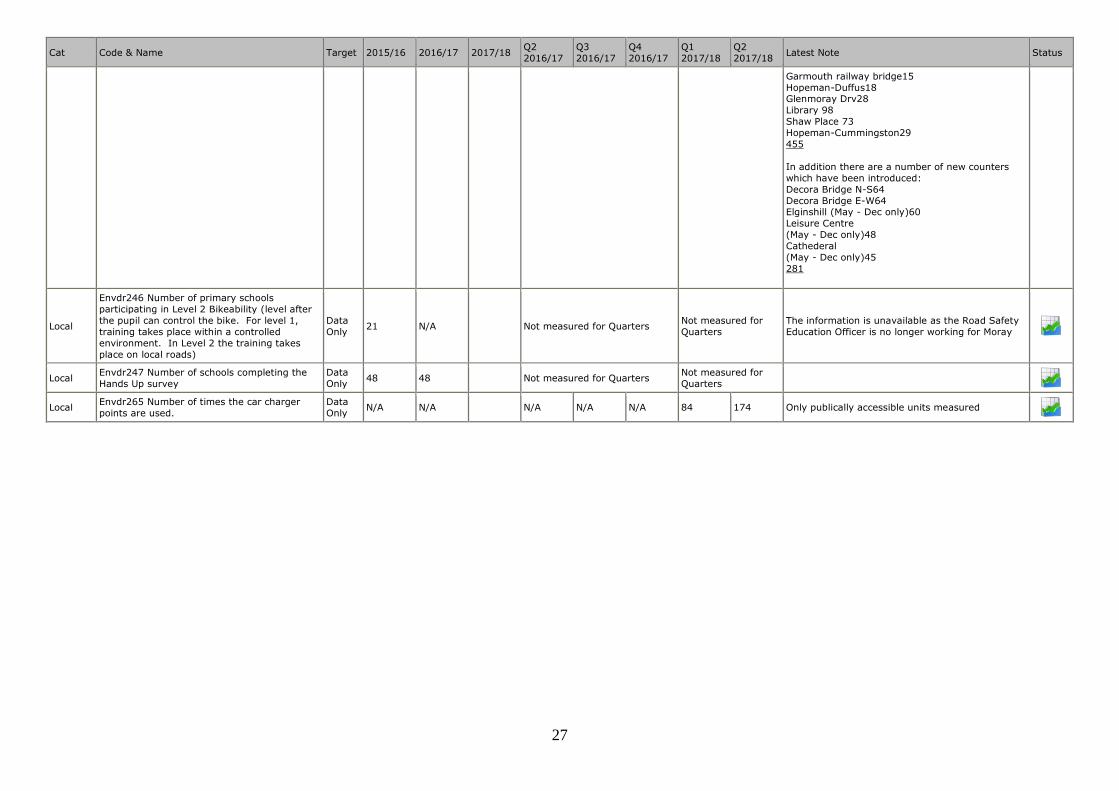
27
Cat Code & Name Target 2015/16 2016/17 2017/18 Q2
2016/17
Q3
2016/17
Q4
2016/17
Q1
2017/18
Q2
2017/18 Latest Note Status
Garmouth railway bridge15
Hopeman-Duffus18 Glenmoray Drv28
Library 98
Shaw Place 73
Hopeman-Cummingston29
455
In addition there are a number of new counters
which have been introduced:
Decora Bridge N-S64
Decora Bridge E-W64 Elginshill (May - Dec only)60
Leisure Centre
(May - Dec only)48
Cathederal
(May - Dec only)45
281
Local
Envdr246 Number of primary schools
participating in Level 2 Bikeability (level after
the pupil can control the bike. For level 1,
training takes place within a controlled
environment. In Level 2 the training takes
place on local roads)
Data
Only 21 N/A Not measured for Quarters
Not measured for
Quarters
The information is unavailable as the Road Safety
Education Officer is no longer working for Moray
Local Envdr247 Number of schools completing the
Hands Up survey
Data
Only 48 48 Not measured for Quarters
Not measured for
Quarters
Local Envdr265 Number of times the car charger
points are used.
Data
Only N/A N/A N/A N/A N/A 84 174 Only publically accessible units measured
28
2017/18 Quarter to September Education & Social Care
Performance Report – Performance Indicators
Integrated Children's Services Additional Support Needs
Cat Code & Name Current
Target 2015/16 2016/17 2017/18
Q2
2016/17
Q3
2016/17
Q4
2016/17
Q1
2017/18
Q2
2017/18 Latest Note Status
Local EdS603.01 % pupils with Additional Support Needs Data
Only 25% 27.8% 33.2% Annual Annual
Primary (ASG)
Buckie – 28.7%
Elgin Academy – 25.1%
Elgin High - 40.5% Forres - 37.1%
Keith – 47.7%
Lossiemouth – 32.2%
Milne's – 32.4%
Speyside – 24.9%
MORAY - 33%
Secondary
Buckie – 31.3%
Elgin Acad. – 35.7%
Elgin High – 42.6% Forres – 23.1%
Keith – 40.9%
Lossiemouth – 33.2%
Milne's – 37.5%
Speyside – 28.3%
MORAY – 33.5%
Local EdS603.04 % pupils with ASN entering a positive
destination
Data
Only 87.1% N/A Annual
Annual –
2016-17 data due
February 2018
Of the 1,008 school leavers in 2015/16, 278 had an ASN. 87.1% of leavers with an ASN entered a
positive destination. This compares with a national
average of 88.6%
Integrated Children's Services Children's Wellbeing & Continuing Support
Cat Code & Name Current
Target 2015/16 2016/17 2017/18
Q2
2016/17
Q3
2016/17
Q4
2016/17
Q1
2017/18
Q2
2017/18 Latest Note Status
Local EdS005.30 Number of referrals made to Intake &
Assessment - Triage service
Data
Only N/A 4,657 1,215 1,066 1,147 825 1,014
Figures relate solely to cases referred to Intake &
Assessment – I&A, Triage & CP
Local EdS005.31 Number of children referred to Intake &
Assessment - Triage Service
Data
Only N/A 1,988 687 697 755 559 620
Figures relate solely to cases referred to Intake &
Assessment – I&A, Triage & CP
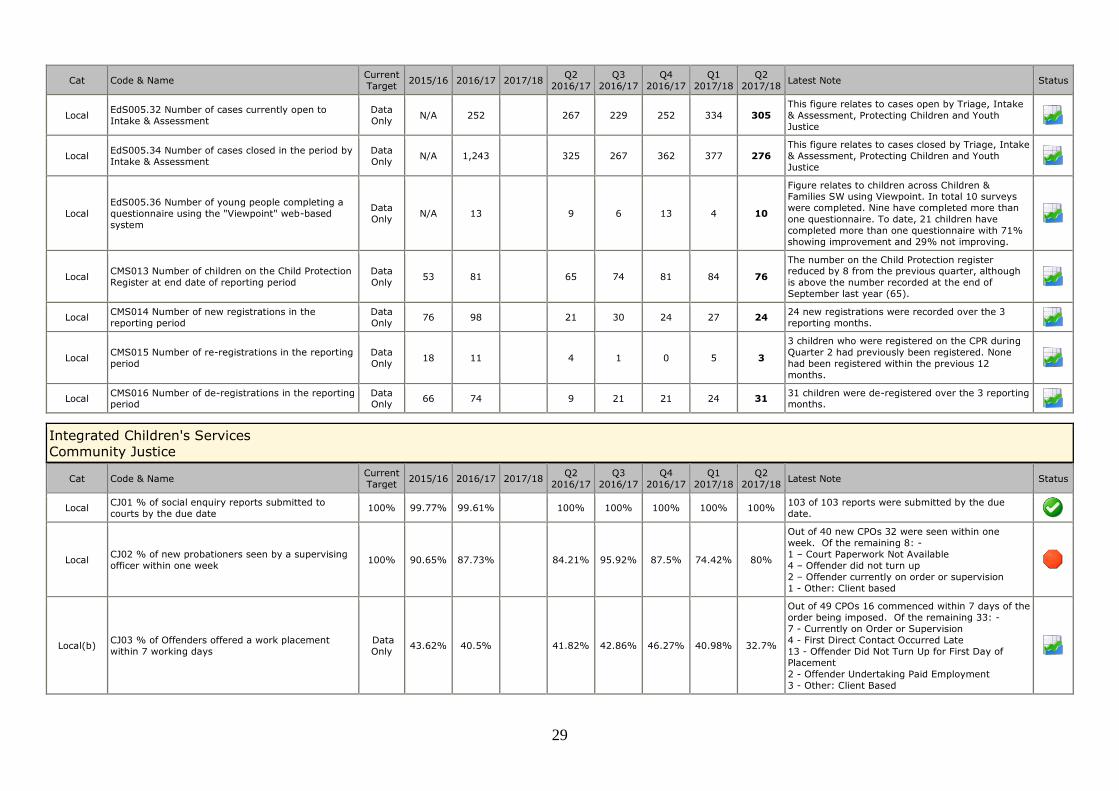
29
Cat Code & Name Current
Target 2015/16 2016/17 2017/18
Q2
2016/17
Q3
2016/17
Q4
2016/17
Q1
2017/18
Q2
2017/18 Latest Note Status
Local EdS005.32 Number of cases currently open to
Intake & Assessment
Data
Only N/A 252 267 229 252 334 305
This figure relates to cases open by Triage, Intake
& Assessment, Protecting Children and Youth
Justice
Local EdS005.34 Number of cases closed in the period by
Intake & Assessment
Data
Only N/A 1,243 325 267 362 377 276
This figure relates to cases closed by Triage, Intake
& Assessment, Protecting Children and Youth
Justice
Local EdS005.36 Number of young people completing a
questionnaire using the "Viewpoint" web-based
system
Data
Only N/A 13 9 6 13 4 10
Figure relates to children across Children & Families SW using Viewpoint. In total 10 surveys
were completed. Nine have completed more than
one questionnaire. To date, 21 children have
completed more than one questionnaire with 71%
showing improvement and 29% not improving.
Local CMS013 Number of children on the Child Protection
Register at end date of reporting period
Data
Only 53 81 65 74 81 84 76
The number on the Child Protection register reduced by 8 from the previous quarter, although
is above the number recorded at the end of
September last year (65).
Local CMS014 Number of new registrations in the
reporting period
Data
Only 76 98 21 30 24 27 24
24 new registrations were recorded over the 3
reporting months.
Local CMS015 Number of re-registrations in the reporting
period
Data
Only 18 11 4 1 0 5 3
3 children who were registered on the CPR during
Quarter 2 had previously been registered. None
had been registered within the previous 12
months.
Local CMS016 Number of de-registrations in the reporting period
Data Only
66 74 9 21 21 24 31 31 children were de-registered over the 3 reporting months.
Integrated Children's Services Community Justice
Cat Code & Name Current
Target 2015/16 2016/17 2017/18
Q2
2016/17
Q3
2016/17
Q4
2016/17
Q1
2017/18
Q2
2017/18 Latest Note Status
Local CJ01 % of social enquiry reports submitted to
courts by the due date 100% 99.77% 99.61% 100% 100% 100% 100% 100%
103 of 103 reports were submitted by the due
date.
Local CJ02 % of new probationers seen by a supervising
officer within one week 100% 90.65% 87.73% 84.21% 95.92% 87.5% 74.42% 80%
Out of 40 new CPOs 32 were seen within one
week. Of the remaining 8: -
1 – Court Paperwork Not Available
4 – Offender did not turn up
2 – Offender currently on order or supervision
1 - Other: Client based
Local(b) CJ03 % of Offenders offered a work placement
within 7 working days
Data
Only 43.62% 40.5% 41.82% 42.86% 46.27% 40.98% 32.7%
Out of 49 CPOs 16 commenced within 7 days of the
order being imposed. Of the remaining 33: -
7 - Currently on Order or Supervision
4 - First Direct Contact Occurred Late
13 - Offender Did Not Turn Up for First Day of
Placement
2 - Offender Undertaking Paid Employment
3 - Other: Client Based
30
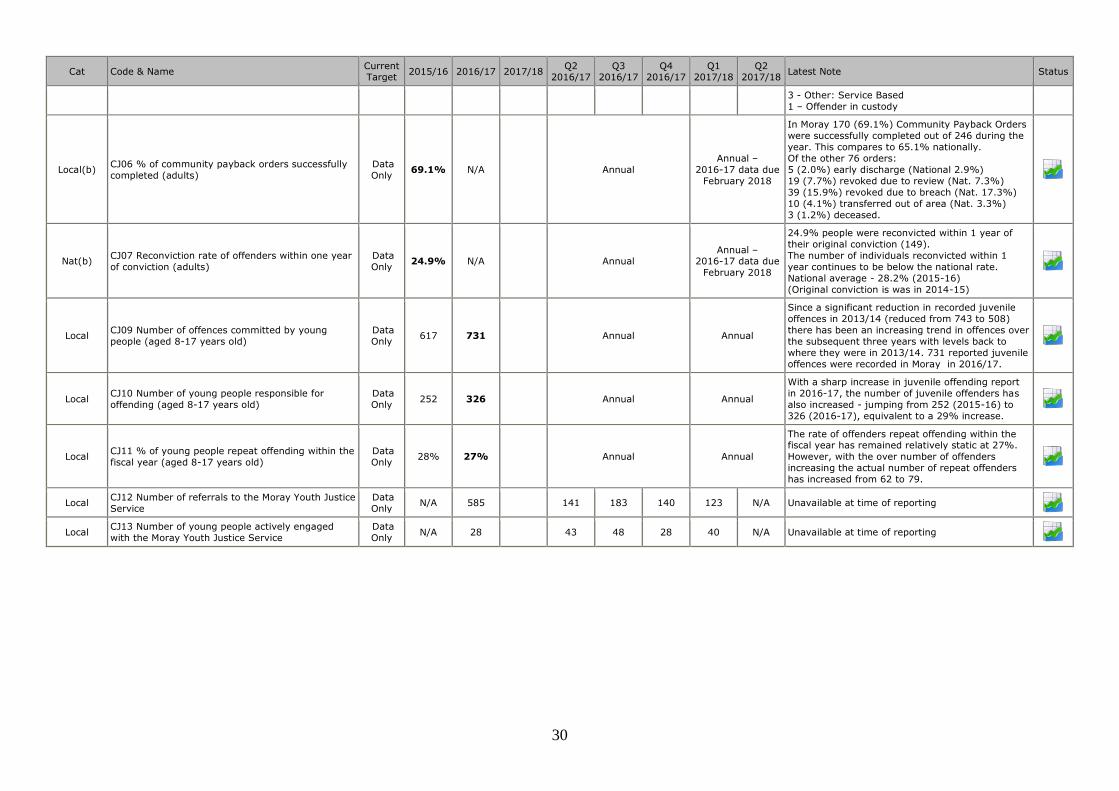
Cat Code & Name Current Target
2015/16 2016/17 2017/18 Q2
2016/17 Q3
2016/17 Q4
2016/17 Q1
2017/18 Q2
2017/18 Latest Note Status
3 - Other: Service Based
1 – Offender in custody
Local(b) CJ06 % of community payback orders successfully
completed (adults)
Data
Only 69.1% N/A Annual
Annual –
2016-17 data due
February 2018
In Moray 170 (69.1%) Community Payback Orders
were successfully completed out of 246 during the
year. This compares to 65.1% nationally.
Of the other 76 orders:
5 (2.0%) early discharge (National 2.9%)
19 (7.7%) revoked due to review (Nat. 7.3%)
39 (15.9%) revoked due to breach (Nat. 17.3%)
10 (4.1%) transferred out of area (Nat. 3.3%)
3 (1.2%) deceased.
Nat(b) CJ07 Reconviction rate of offenders within one year
of conviction (adults)
Data
Only 24.9% N/A Annual
Annual – 2016-17 data due
February 2018
24.9% people were reconvicted within 1 year of
their original conviction (149).
The number of individuals reconvicted within 1
year continues to be below the national rate.
National average - 28.2% (2015-16)
(Original conviction is was in 2014-15)
Local CJ09 Number of offences committed by young
people (aged 8-17 years old)
Data
Only 617 731 Annual Annual
Since a significant reduction in recorded juvenile
offences in 2013/14 (reduced from 743 to 508)
there has been an increasing trend in offences over
the subsequent three years with levels back to
where they were in 2013/14. 731 reported juvenile
offences were recorded in Moray in 2016/17.
Local CJ10 Number of young people responsible for
offending (aged 8-17 years old)
Data
Only 252 326 Annual Annual
With a sharp increase in juvenile offending report
in 2016-17, the number of juvenile offenders has
also increased - jumping from 252 (2015-16) to
326 (2016-17), equivalent to a 29% increase.
Local CJ11 % of young people repeat offending within the
fiscal year (aged 8-17 years old)
Data
Only 28% 27% Annual Annual
The rate of offenders repeat offending within the fiscal year has remained relatively static at 27%.
However, with the over number of offenders
increasing the actual number of repeat offenders
has increased from 62 to 79.
Local CJ12 Number of referrals to the Moray Youth Justice
Service
Data
Only N/A 585 141 183 140 123 N/A Unavailable at time of reporting
Local CJ13 Number of young people actively engaged
with the Moray Youth Justice Service
Data
Only N/A 28 43 48 28 40 N/A Unavailable at time of reporting
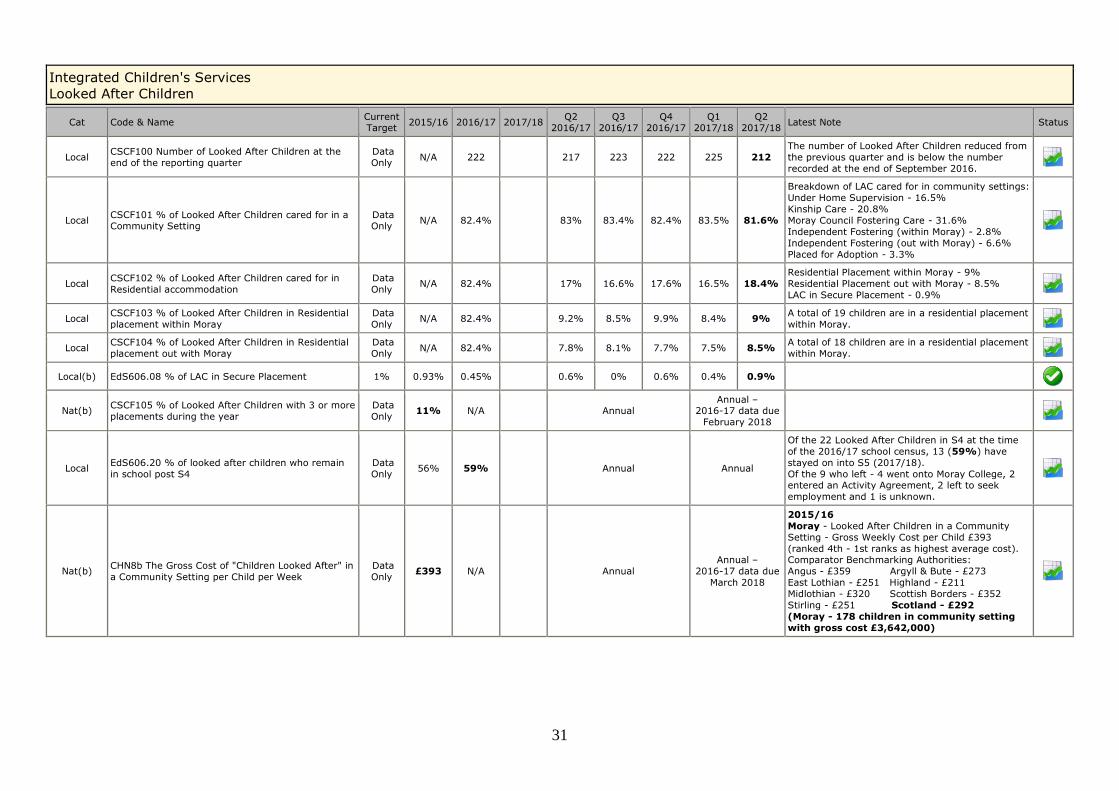
31
Integrated Children's Services Looked After Children
Cat Code & Name Current Target
2015/16 2016/17 2017/18 Q2
2016/17 Q3
2016/17 Q4
2016/17 Q1
2017/18 Q2
2017/18 Latest Note Status
Local CSCF100 Number of Looked After Children at the
end of the reporting quarter
Data
Only N/A 222 217 223 222 225 212
The number of Looked After Children reduced from
the previous quarter and is below the number
recorded at the end of September 2016.
Local CSCF101 % of Looked After Children cared for in a Community Setting
Data Only
N/A 82.4% 83% 83.4% 82.4% 83.5% 81.6%
Breakdown of LAC cared for in community settings:
Under Home Supervision - 16.5%
Kinship Care - 20.8%
Moray Council Fostering Care - 31.6%
Independent Fostering (within Moray) - 2.8%
Independent Fostering (out with Moray) - 6.6%
Placed for Adoption - 3.3%
Local CSCF102 % of Looked After Children cared for in
Residential accommodation
Data
Only N/A 82.4% 17% 16.6% 17.6% 16.5% 18.4%
Residential Placement within Moray - 9%
Residential Placement out with Moray - 8.5%
LAC in Secure Placement - 0.9%
Local CSCF103 % of Looked After Children in Residential
placement within Moray
Data
Only N/A 82.4% 9.2% 8.5% 9.9% 8.4% 9%
A total of 19 children are in a residential placement
within Moray.
Local CSCF104 % of Looked After Children in Residential
placement out with Moray
Data
Only N/A 82.4% 7.8% 8.1% 7.7% 7.5% 8.5%
A total of 18 children are in a residential placement
within Moray.
Local(b) EdS606.08 % of LAC in Secure Placement 1% 0.93% 0.45% 0.6% 0% 0.6% 0.4% 0.9%
Nat(b) CSCF105 % of Looked After Children with 3 or more
placements during the year
Data
Only 11% N/A Annual
Annual – 2016-17 data due
February 2018
Local EdS606.20 % of looked after children who remain
in school post S4
Data
Only 56% 59% Annual Annual
Of the 22 Looked After Children in S4 at the time
of the 2016/17 school census, 13 (59%) have
stayed on into S5 (2017/18).
Of the 9 who left - 4 went onto Moray College, 2 entered an Activity Agreement, 2 left to seek
employment and 1 is unknown.
Nat(b) CHN8b The Gross Cost of "Children Looked After" in
a Community Setting per Child per Week
Data
Only £393 N/A Annual
Annual –
2016-17 data due
March 2018
2015/16
Moray - Looked After Children in a Community
Setting - Gross Weekly Cost per Child £393
(ranked 4th - 1st ranks as highest average cost). Comparator Benchmarking Authorities:
Angus - £359 Argyll & Bute - £273
East Lothian - £251 Highland - £211
Midlothian - £320 Scottish Borders - £352
Stirling - £251 Scotland - £292
(Moray - 178 children in community setting
with gross cost £3,642,000)
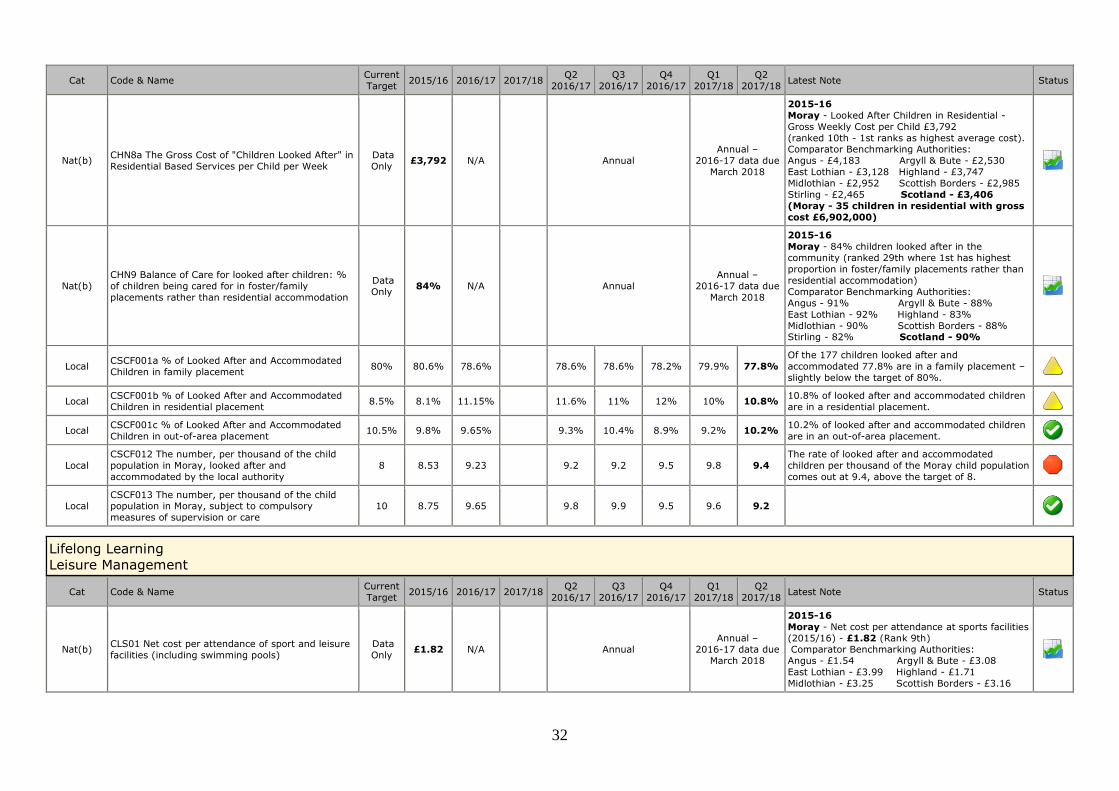
32
Cat Code & Name Current
Target 2015/16 2016/17 2017/18
Q2
2016/17
Q3
2016/17
Q4
2016/17
Q1
2017/18
Q2
2017/18 Latest Note Status
Nat(b) CHN8a The Gross Cost of "Children Looked After" in
Residential Based Services per Child per Week
Data
Only £3,792 N/A Annual
Annual –
2016-17 data due
March 2018
2015-16
Moray - Looked After Children in Residential -
Gross Weekly Cost per Child £3,792
(ranked 10th - 1st ranks as highest average cost). Comparator Benchmarking Authorities:
Angus - £4,183 Argyll & Bute - £2,530
East Lothian - £3,128 Highland - £3,747
Midlothian - £2,952 Scottish Borders - £2,985
Stirling - £2,465 Scotland - £3,406
(Moray - 35 children in residential with gross
cost £6,902,000)
Nat(b) CHN9 Balance of Care for looked after children: %
of children being cared for in foster/family
placements rather than residential accommodation
Data
Only 84% N/A Annual
Annual –
2016-17 data due
March 2018
2015-16
Moray - 84% children looked after in the
community (ranked 29th where 1st has highest
proportion in foster/family placements rather than
residential accommodation)
Comparator Benchmarking Authorities:
Angus - 91% Argyll & Bute - 88%
East Lothian - 92% Highland - 83%
Midlothian - 90% Scottish Borders - 88% Stirling - 82% Scotland - 90%
Local CSCF001a % of Looked After and Accommodated
Children in family placement 80% 80.6% 78.6% 78.6% 78.6% 78.2% 79.9% 77.8%
Of the 177 children looked after and
accommodated 77.8% are in a family placement –
slightly below the target of 80%.
Local CSCF001b % of Looked After and Accommodated
Children in residential placement 8.5% 8.1% 11.15% 11.6% 11% 12% 10% 10.8%
10.8% of looked after and accommodated children
are in a residential placement.
Local CSCF001c % of Looked After and Accommodated
Children in out-of-area placement 10.5% 9.8% 9.65% 9.3% 10.4% 8.9% 9.2% 10.2%
10.2% of looked after and accommodated children
are in an out-of-area placement.
Local CSCF012 The number, per thousand of the child
population in Moray, looked after and
accommodated by the local authority
8 8.53 9.23 9.2 9.2 9.5 9.8 9.4
The rate of looked after and accommodated
children per thousand of the Moray child population
comes out at 9.4, above the target of 8.
Local CSCF013 The number, per thousand of the child population in Moray, subject to compulsory
measures of supervision or care
10 8.75 9.65 9.8 9.9 9.5 9.6 9.2
Lifelong Learning Leisure Management
Cat Code & Name Current
Target 2015/16 2016/17 2017/18
Q2
2016/17
Q3
2016/17
Q4
2016/17
Q1
2017/18
Q2
2017/18 Latest Note Status
Nat(b) CLS01 Net cost per attendance of sport and leisure
facilities (including swimming pools)
Data
Only £1.82 N/A Annual
Annual – 2016-17 data due
March 2018
2015-16
Moray - Net cost per attendance at sports facilities
(2015/16) - £1.82 (Rank 9th) Comparator Benchmarking Authorities:
Angus - £1.54 Argyll & Bute - £3.08
East Lothian - £3.99 Highland - £1.71
Midlothian - £3.25 Scottish Borders - £3.16
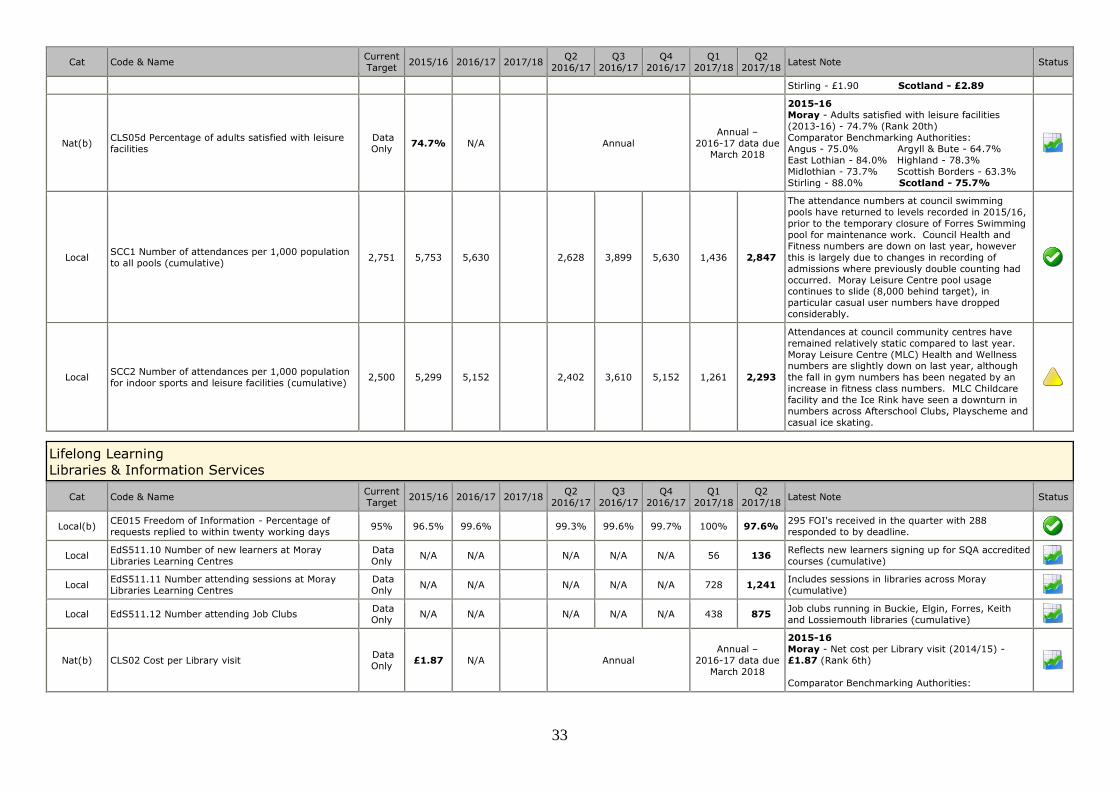
33
Cat Code & Name Current
Target 2015/16 2016/17 2017/18
Q2
2016/17
Q3
2016/17
Q4
2016/17
Q1
2017/18
Q2
2017/18 Latest Note Status
Stirling - £1.90 Scotland - £2.89
Nat(b) CLS05d Percentage of adults satisfied with leisure
facilities
Data
Only 74.7% N/A Annual
Annual –
2016-17 data due March 2018
2015-16
Moray - Adults satisfied with leisure facilities
(2013-16) - 74.7% (Rank 20th)
Comparator Benchmarking Authorities:
Angus - 75.0% Argyll & Bute - 64.7%
East Lothian - 84.0% Highland - 78.3%
Midlothian - 73.7% Scottish Borders - 63.3%
Stirling - 88.0% Scotland - 75.7%
Local SCC1 Number of attendances per 1,000 population
to all pools (cumulative) 2,751 5,753 5,630 2,628 3,899 5,630 1,436 2,847
The attendance numbers at council swimming
pools have returned to levels recorded in 2015/16,
prior to the temporary closure of Forres Swimming
pool for maintenance work. Council Health and
Fitness numbers are down on last year, however
this is largely due to changes in recording of
admissions where previously double counting had
occurred. Moray Leisure Centre pool usage continues to slide (8,000 behind target), in
particular casual user numbers have dropped
considerably.
Local SCC2 Number of attendances per 1,000 population
for indoor sports and leisure facilities (cumulative) 2,500 5,299 5,152 2,402 3,610 5,152 1,261 2,293
Attendances at council community centres have
remained relatively static compared to last year.
Moray Leisure Centre (MLC) Health and Wellness numbers are slightly down on last year, although
the fall in gym numbers has been negated by an
increase in fitness class numbers. MLC Childcare
facility and the Ice Rink have seen a downturn in
numbers across Afterschool Clubs, Playscheme and
casual ice skating.
Lifelong Learning Libraries & Information Services
Cat Code & Name Current
Target 2015/16 2016/17 2017/18
Q2
2016/17
Q3
2016/17
Q4
2016/17
Q1
2017/18
Q2
2017/18 Latest Note Status
Local(b) CE015 Freedom of Information - Percentage of
requests replied to within twenty working days 95% 96.5% 99.6% 99.3% 99.6% 99.7% 100% 97.6%
295 FOI's received in the quarter with 288
responded to by deadline.
Local EdS511.10 Number of new learners at Moray
Libraries Learning Centres
Data
Only N/A N/A N/A N/A N/A 56 136
Reflects new learners signing up for SQA accredited
courses (cumulative)
Local EdS511.11 Number attending sessions at Moray
Libraries Learning Centres
Data
Only N/A N/A N/A N/A N/A 728 1,241
Includes sessions in libraries across Moray
(cumulative)
Local EdS511.12 Number attending Job Clubs Data
Only N/A N/A N/A N/A N/A 438 875
Job clubs running in Buckie, Elgin, Forres, Keith
and Lossiemouth libraries (cumulative)
Nat(b) CLS02 Cost per Library visit Data
Only £1.87 N/A Annual
Annual –
2016-17 data due
March 2018
2015-16
Moray - Net cost per Library visit (2014/15) -
£1.87 (Rank 6th)
Comparator Benchmarking Authorities:
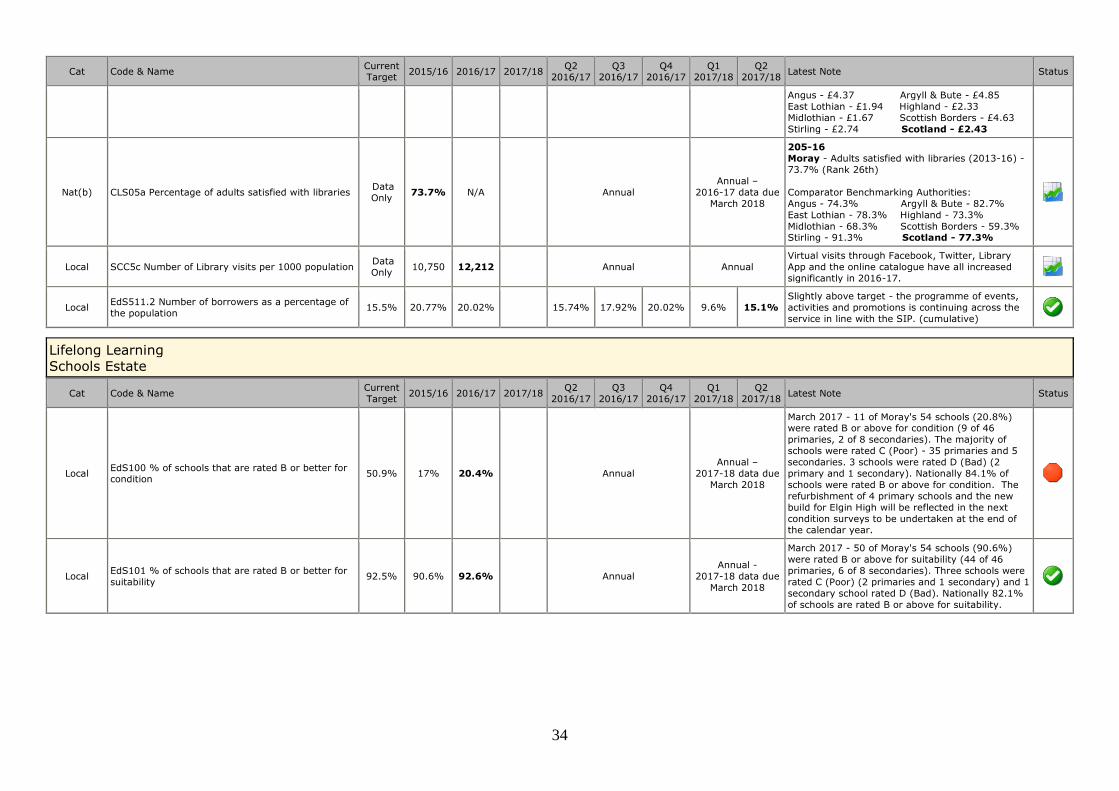
34
Cat Code & Name Current Target
2015/16 2016/17 2017/18 Q2
2016/17 Q3
2016/17 Q4
2016/17 Q1
2017/18 Q2
2017/18 Latest Note Status
Angus - £4.37 Argyll & Bute - £4.85
East Lothian - £1.94 Highland - £2.33
Midlothian - £1.67 Scottish Borders - £4.63
Stirling - £2.74 Scotland - £2.43
Nat(b) CLS05a Percentage of adults satisfied with libraries Data
Only 73.7% N/A Annual
Annual –
2016-17 data due
March 2018
205-16
Moray - Adults satisfied with libraries (2013-16) -
73.7% (Rank 26th)
Comparator Benchmarking Authorities:
Angus - 74.3% Argyll & Bute - 82.7%
East Lothian - 78.3% Highland - 73.3%
Midlothian - 68.3% Scottish Borders - 59.3% Stirling - 91.3% Scotland - 77.3%
Local SCC5c Number of Library visits per 1000 population Data
Only 10,750 12,212 Annual Annual
Virtual visits through Facebook, Twitter, Library
App and the online catalogue have all increased
significantly in 2016-17.
Local EdS511.2 Number of borrowers as a percentage of
the population 15.5% 20.77% 20.02% 15.74% 17.92% 20.02% 9.6% 15.1%
Slightly above target - the programme of events,
activities and promotions is continuing across the
service in line with the SIP. (cumulative)
Lifelong Learning Schools Estate
Cat Code & Name Current
Target 2015/16 2016/17 2017/18
Q2
2016/17
Q3
2016/17
Q4
2016/17
Q1
2017/18
Q2
2017/18 Latest Note Status
Local EdS100 % of schools that are rated B or better for condition
50.9% 17% 20.4% Annual
Annual –
2017-18 data due
March 2018
March 2017 - 11 of Moray's 54 schools (20.8%) were rated B or above for condition (9 of 46
primaries, 2 of 8 secondaries). The majority of
schools were rated C (Poor) - 35 primaries and 5
secondaries. 3 schools were rated D (Bad) (2
primary and 1 secondary). Nationally 84.1% of
schools were rated B or above for condition. The
refurbishment of 4 primary schools and the new
build for Elgin High will be reflected in the next
condition surveys to be undertaken at the end of the calendar year.
Local EdS101 % of schools that are rated B or better for
suitability 92.5% 90.6% 92.6% Annual
Annual -
2017-18 data due
March 2018
March 2017 - 50 of Moray's 54 schools (90.6%)
were rated B or above for suitability (44 of 46
primaries, 6 of 8 secondaries). Three schools were
rated C (Poor) (2 primaries and 1 secondary) and 1
secondary school rated D (Bad). Nationally 82.1%
of schools are rated B or above for suitability.
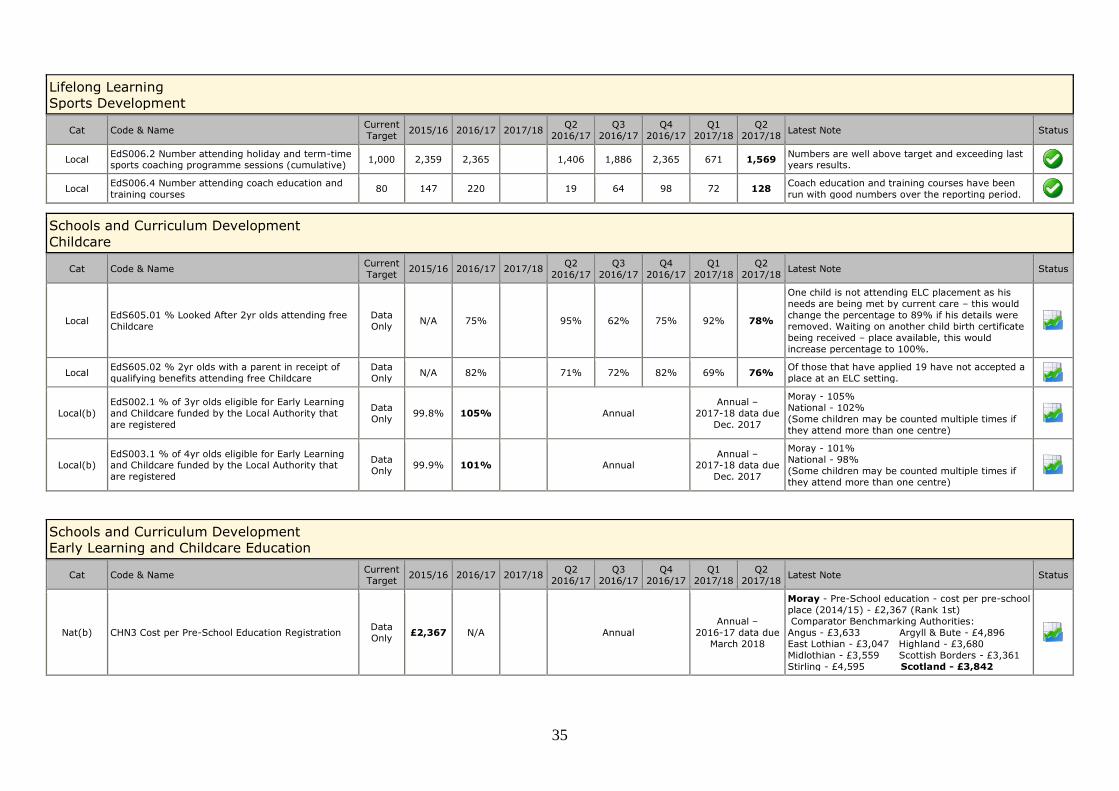
35
Lifelong Learning Sports Development
Cat Code & Name Current
Target 2015/16 2016/17 2017/18
Q2
2016/17
Q3
2016/17
Q4
2016/17
Q1
2017/18
Q2
2017/18 Latest Note Status
Local EdS006.2 Number attending holiday and term-time sports coaching programme sessions (cumulative)
1,000 2,359 2,365 1,406 1,886 2,365 671 1,569 Numbers are well above target and exceeding last years results.
Local EdS006.4 Number attending coach education and
training courses 80 147 220 19 64 98 72 128
Coach education and training courses have been
run with good numbers over the reporting period.
Schools and Curriculum Development Childcare
Cat Code & Name Current
Target 2015/16 2016/17 2017/18
Q2
2016/17
Q3
2016/17
Q4
2016/17
Q1
2017/18
Q2
2017/18 Latest Note Status
Local EdS605.01 % Looked After 2yr olds attending free
Childcare
Data
Only N/A 75% 95% 62% 75% 92% 78%
One child is not attending ELC placement as his
needs are being met by current care – this would
change the percentage to 89% if his details were
removed. Waiting on another child birth certificate
being received – place available, this would
increase percentage to 100%.
Local EdS605.02 % 2yr olds with a parent in receipt of
qualifying benefits attending free Childcare
Data
Only N/A 82% 71% 72% 82% 69% 76%
Of those that have applied 19 have not accepted a
place at an ELC setting.
Local(b) EdS002.1 % of 3yr olds eligible for Early Learning
and Childcare funded by the Local Authority that
are registered
Data
Only 99.8% 105% Annual
Annual –
2017-18 data due
Dec. 2017
Moray - 105%
National - 102%
(Some children may be counted multiple times if
they attend more than one centre)
Local(b) EdS003.1 % of 4yr olds eligible for Early Learning and Childcare funded by the Local Authority that
are registered
Data
Only 99.9% 101% Annual
Annual – 2017-18 data due
Dec. 2017
Moray - 101%
National - 98%
(Some children may be counted multiple times if
they attend more than one centre)
Schools and Curriculum Development Early Learning and Childcare Education
Cat Code & Name Current
Target 2015/16 2016/17 2017/18
Q2
2016/17
Q3
2016/17
Q4
2016/17
Q1
2017/18
Q2
2017/18 Latest Note Status
Nat(b) CHN3 Cost per Pre-School Education Registration Data
Only £2,367 N/A Annual
Annual –
2016-17 data due
March 2018
Moray - Pre-School education - cost per pre-school
place (2014/15) - £2,367 (Rank 1st)
Comparator Benchmarking Authorities:
Angus - £3,633 Argyll & Bute - £4,896
East Lothian - £3,047 Highland - £3,680
Midlothian - £3,559 Scottish Borders - £3,361
Stirling - £4,595 Scotland - £3,842
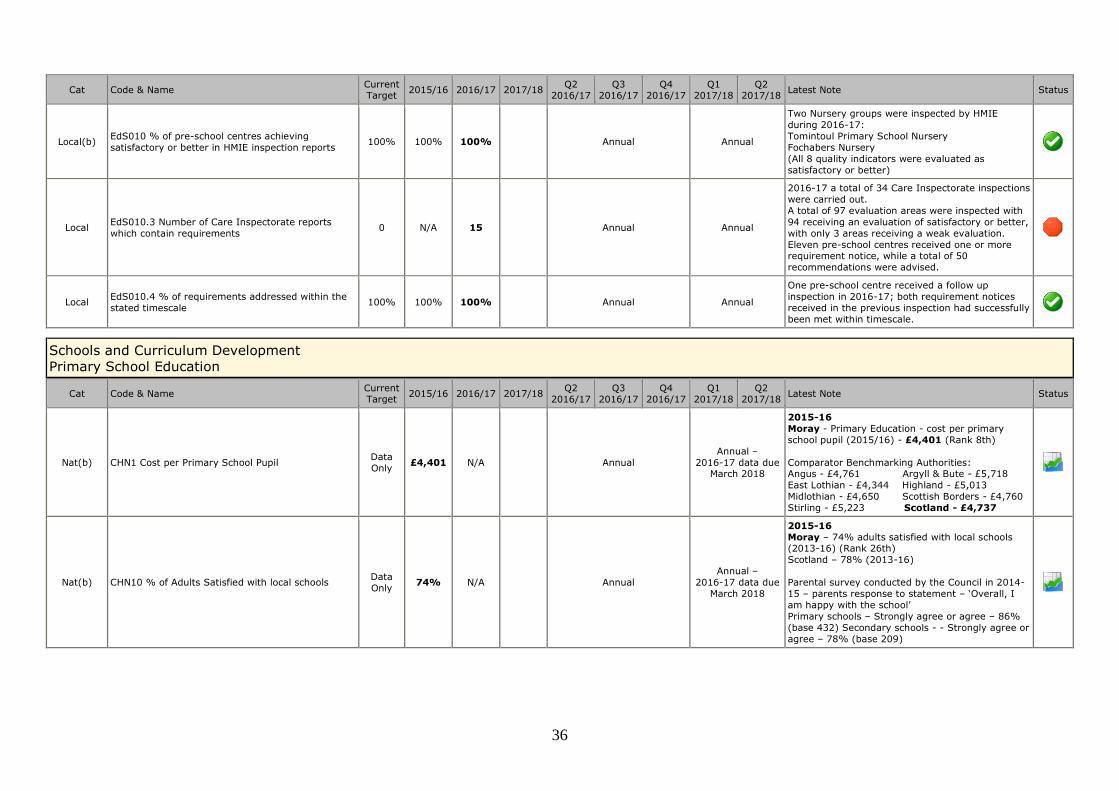
36
Cat Code & Name Current Target
2015/16 2016/17 2017/18 Q2
2016/17 Q3
2016/17 Q4
2016/17 Q1
2017/18 Q2
2017/18 Latest Note Status
Local(b) EdS010 % of pre-school centres achieving
satisfactory or better in HMIE inspection reports 100% 100% 100% Annual Annual
Two Nursery groups were inspected by HMIE
during 2016-17:
Tomintoul Primary School Nursery
Fochabers Nursery
(All 8 quality indicators were evaluated as
satisfactory or better)
Local EdS010.3 Number of Care Inspectorate reports
which contain requirements 0 N/A 15 Annual Annual
2016-17 a total of 34 Care Inspectorate inspections
were carried out.
A total of 97 evaluation areas were inspected with
94 receiving an evaluation of satisfactory or better,
with only 3 areas receiving a weak evaluation.
Eleven pre-school centres received one or more requirement notice, while a total of 50
recommendations were advised.
Local EdS010.4 % of requirements addressed within the
stated timescale 100% 100% 100% Annual Annual
One pre-school centre received a follow up
inspection in 2016-17; both requirement notices
received in the previous inspection had successfully
been met within timescale.
Schools and Curriculum Development Primary School Education
Cat Code & Name Current Target
2015/16 2016/17 2017/18 Q2
2016/17 Q3
2016/17 Q4
2016/17 Q1
2017/18 Q2
2017/18 Latest Note Status
Nat(b) CHN1 Cost per Primary School Pupil Data
Only £4,401 N/A Annual
Annual –
2016-17 data due March 2018
2015-16
Moray - Primary Education - cost per primary
school pupil (2015/16) - £4,401 (Rank 8th)
Comparator Benchmarking Authorities: Angus - £4,761 Argyll & Bute - £5,718
East Lothian - £4,344 Highland - £5,013
Midlothian - £4,650 Scottish Borders - £4,760
Stirling - £5,223 Scotland - £4,737
Nat(b) CHN10 % of Adults Satisfied with local schools Data
Only 74% N/A Annual
Annual –
2016-17 data due
March 2018
2015-16
Moray – 74% adults satisfied with local schools (2013-16) (Rank 26th)
Scotland – 78% (2013-16)
Parental survey conducted by the Council in 2014-
15 – parents response to statement – ‘Overall, I
am happy with the school’
Primary schools – Strongly agree or agree – 86%
(base 432) Secondary schools - - Strongly agree or
agree – 78% (base 209)
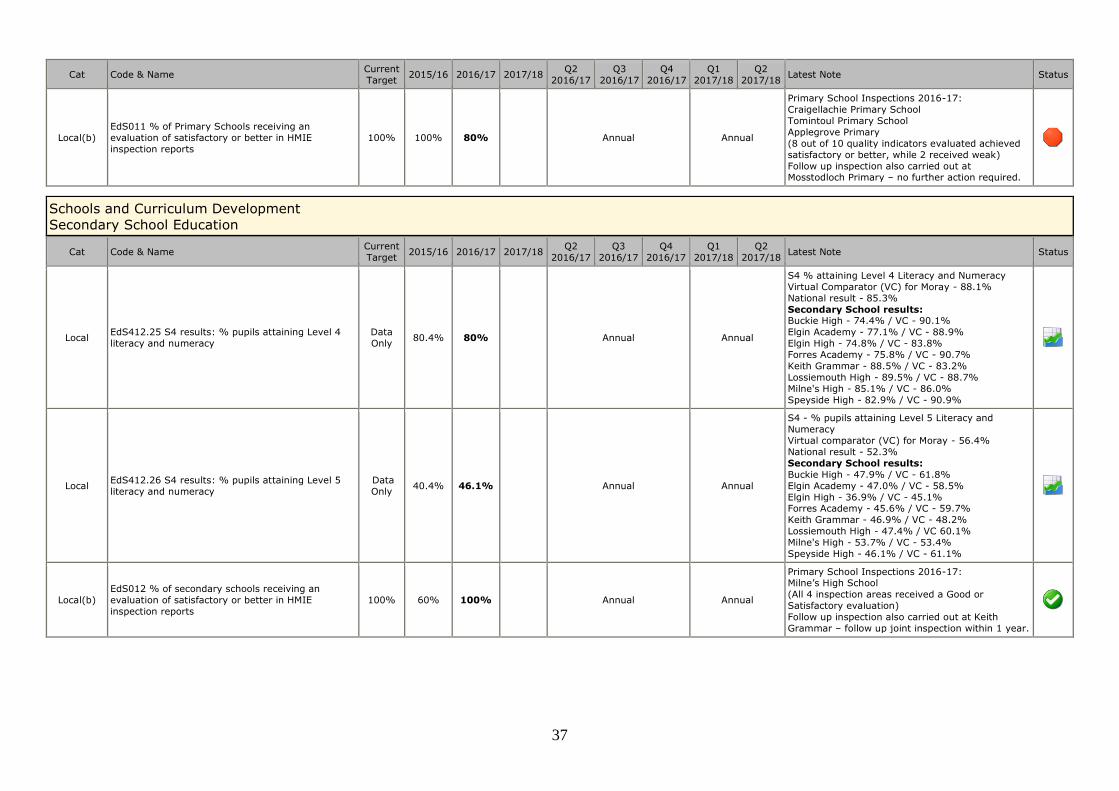
37
Cat Code & Name Current
Target 2015/16 2016/17 2017/18
Q2
2016/17
Q3
2016/17
Q4
2016/17
Q1
2017/18
Q2
2017/18 Latest Note Status
Local(b) EdS011 % of Primary Schools receiving an
evaluation of satisfactory or better in HMIE
inspection reports
100% 100% 80% Annual Annual
Primary School Inspections 2016-17:
Craigellachie Primary School
Tomintoul Primary School
Applegrove Primary
(8 out of 10 quality indicators evaluated achieved
satisfactory or better, while 2 received weak)
Follow up inspection also carried out at Mosstodloch Primary – no further action required.
Schools and Curriculum Development Secondary School Education
Cat Code & Name Current
Target 2015/16 2016/17 2017/18
Q2
2016/17
Q3
2016/17
Q4
2016/17
Q1
2017/18
Q2
2017/18 Latest Note Status
Local EdS412.25 S4 results: % pupils attaining Level 4
literacy and numeracy
Data
Only 80.4% 80% Annual Annual
S4 % attaining Level 4 Literacy and Numeracy
Virtual Comparator (VC) for Moray - 88.1%
National result - 85.3%
Secondary School results: Buckie High - 74.4% / VC - 90.1%
Elgin Academy - 77.1% / VC - 88.9%
Elgin High - 74.8% / VC - 83.8%
Forres Academy - 75.8% / VC - 90.7%
Keith Grammar - 88.5% / VC - 83.2%
Lossiemouth High - 89.5% / VC - 88.7%
Milne's High - 85.1% / VC - 86.0%
Speyside High - 82.9% / VC - 90.9%
Local EdS412.26 S4 results: % pupils attaining Level 5
literacy and numeracy
Data
Only 40.4% 46.1% Annual Annual
S4 - % pupils attaining Level 5 Literacy and
Numeracy
Virtual comparator (VC) for Moray - 56.4%
National result - 52.3%
Secondary School results:
Buckie High - 47.9% / VC - 61.8%
Elgin Academy - 47.0% / VC - 58.5%
Elgin High - 36.9% / VC - 45.1% Forres Academy - 45.6% / VC - 59.7%
Keith Grammar - 46.9% / VC - 48.2%
Lossiemouth High - 47.4% / VC 60.1%
Milne's High - 53.7% / VC - 53.4%
Speyside High - 46.1% / VC - 61.1%
Local(b) EdS012 % of secondary schools receiving an
evaluation of satisfactory or better in HMIE
inspection reports
100% 60% 100% Annual Annual
Primary School Inspections 2016-17: Milne’s High School
(All 4 inspection areas received a Good or
Satisfactory evaluation)
Follow up inspection also carried out at Keith
Grammar – follow up joint inspection within 1 year.
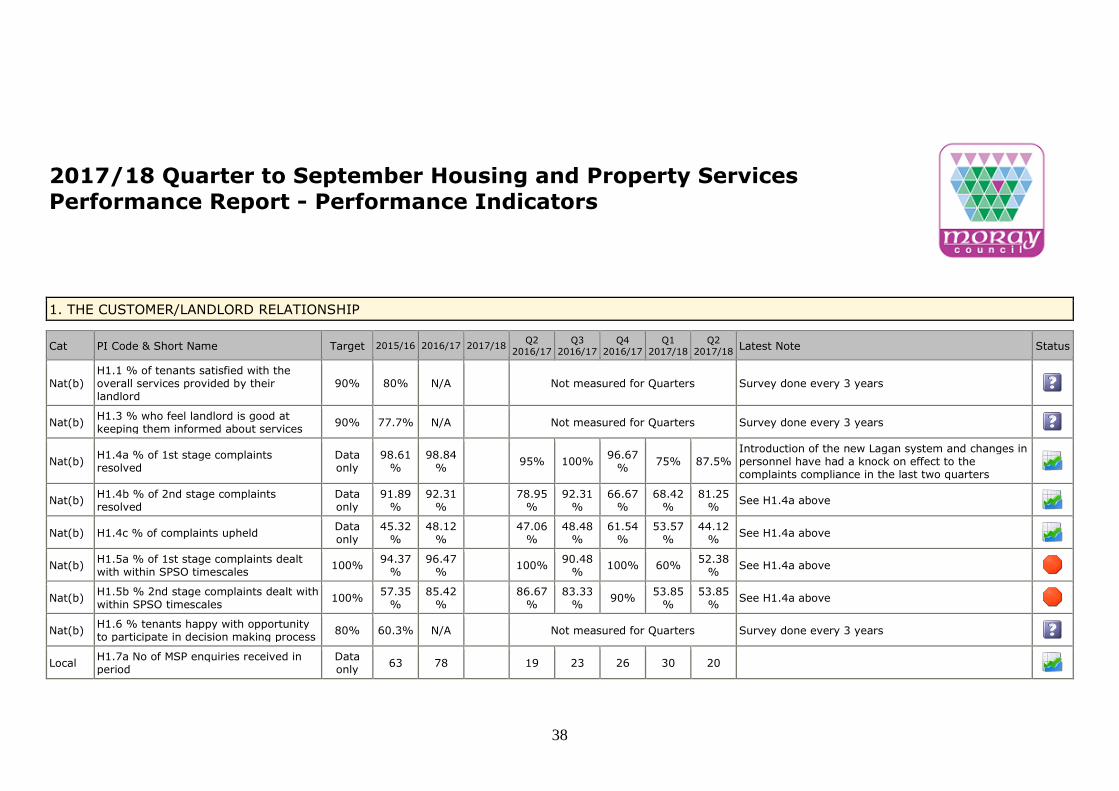
38
2017/18 Quarter to September Housing and Property Services
Performance Report - Performance Indicators
1. THE CUSTOMER/LANDLORD RELATIONSHIP
Cat PI Code & Short Name Target 2015/16 2016/17 2017/18 Q2
2016/17
Q3
2016/17
Q4
2016/17
Q1
2017/18
Q2
2017/18 Latest Note Status
Nat(b) H1.1 % of tenants satisfied with the overall services provided by their landlord
90% 80% N/A Not measured for Quarters Survey done every 3 years
Nat(b) H1.3 % who feel landlord is good at keeping them informed about services
90% 77.7% N/A Not measured for Quarters Survey done every 3 years
Nat(b) H1.4a % of 1st stage complaints resolved
Data only
98.61%
98.84%
95% 100% 96.67
% 75% 87.5%
Introduction of the new Lagan system and changes in personnel have had a knock on effect to the complaints compliance in the last two quarters
Nat(b) H1.4b % of 2nd stage complaints resolved
Data only
91.89%
92.31%
78.95
% 92.31
% 66.67
% 68.42
% 81.25
% See H1.4a above
Nat(b) H1.4c % of complaints upheld Data only
45.32%
48.12%
47.06
% 48.48
% 61.54
% 53.57
% 44.12
% See H1.4a above
Nat(b) H1.5a % of 1st stage complaints dealt with within SPSO timescales
100% 94.37
% 96.47
% 100%
90.48%
100% 60% 52.38
% See H1.4a above
Nat(b) H1.5b % 2nd stage complaints dealt with within SPSO timescales
100% 57.35
% 85.42
%
86.67%
83.33%
90% 53.85
% 53.85
% See H1.4a above
Nat(b) H1.6 % tenants happy with opportunity to participate in decision making process
80% 60.3% N/A Not measured for Quarters Survey done every 3 years
Local H1.7a No of MSP enquiries received in period
Data only
63 78 19 23 26 30 20
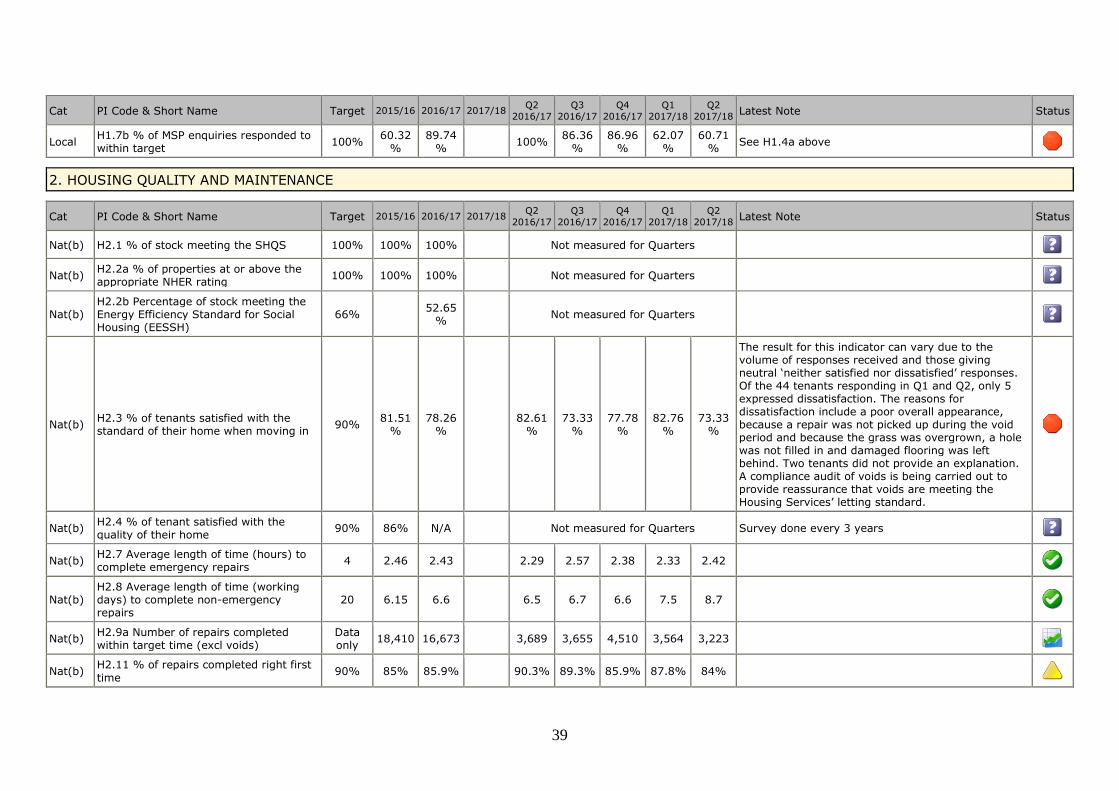
39
Cat PI Code & Short Name Target 2015/16 2016/17 2017/18 Q2
2016/17
Q3
2016/17
Q4
2016/17
Q1
2017/18
Q2
2017/18 Latest Note Status
Local H1.7b % of MSP enquiries responded to within target
100% 60.32
% 89.74
% 100%
86.36%
86.96%
62.07%
60.71%
See H1.4a above
2. HOUSING QUALITY AND MAINTENANCE
Cat PI Code & Short Name Target 2015/16 2016/17 2017/18 Q2
2016/17
Q3
2016/17
Q4
2016/17
Q1
2017/18
Q2
2017/18 Latest Note Status
Nat(b) H2.1 % of stock meeting the SHQS 100% 100% 100% Not measured for Quarters
Nat(b) H2.2a % of properties at or above the appropriate NHER rating
100% 100% 100% Not measured for Quarters
Nat(b) H2.2b Percentage of stock meeting the Energy Efficiency Standard for Social Housing (EESSH)
66% 52.65
% Not measured for Quarters
Nat(b) H2.3 % of tenants satisfied with the standard of their home when moving in
90% 81.51
% 78.26
%
82.61%
73.33%
77.78%
82.76%
73.33%
The result for this indicator can vary due to the volume of responses received and those giving neutral ‘neither satisfied nor dissatisfied’ responses. Of the 44 tenants responding in Q1 and Q2, only 5 expressed dissatisfaction. The reasons for dissatisfaction include a poor overall appearance, because a repair was not picked up during the void period and because the grass was overgrown, a hole was not filled in and damaged flooring was left behind. Two tenants did not provide an explanation. A compliance audit of voids is being carried out to provide reassurance that voids are meeting the Housing Services’ letting standard.
Nat(b) H2.4 % of tenant satisfied with the quality of their home
90% 86% N/A Not measured for Quarters Survey done every 3 years
Nat(b) H2.7 Average length of time (hours) to complete emergency repairs
4 2.46 2.43 2.29 2.57 2.38 2.33 2.42
Nat(b) H2.8 Average length of time (working days) to complete non-emergency repairs
20 6.15 6.6 6.5 6.7 6.6 7.5 8.7
Nat(b) H2.9a Number of repairs completed within target time (excl voids)
Data only
18,410 16,673 3,689 3,655 4,510 3,564 3,223
Nat(b) H2.11 % of repairs completed right first
time 90% 85% 85.9% 90.3% 89.3% 85.9% 87.8% 84%
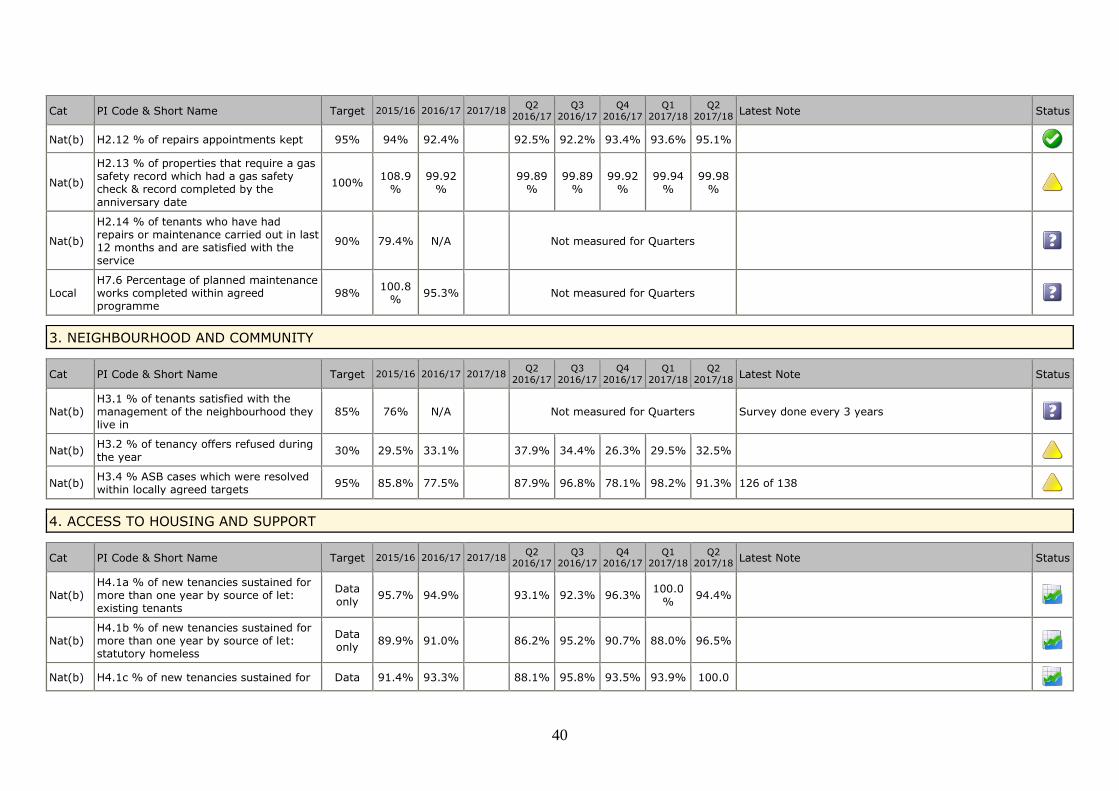
40
Cat PI Code & Short Name Target 2015/16 2016/17 2017/18 Q2
2016/17
Q3
2016/17
Q4
2016/17
Q1
2017/18
Q2
2017/18 Latest Note Status
Nat(b) H2.12 % of repairs appointments kept 95% 94% 92.4% 92.5% 92.2% 93.4% 93.6% 95.1%
Nat(b)
H2.13 % of properties that require a gas safety record which had a gas safety check & record completed by the
anniversary date
100% 108.9
% 99.92
%
99.89%
99.89%
99.92%
99.94%
99.98%
Nat(b)
H2.14 % of tenants who have had repairs or maintenance carried out in last 12 months and are satisfied with the service
90% 79.4% N/A Not measured for Quarters
Local H7.6 Percentage of planned maintenance works completed within agreed programme
98% 100.8
% 95.3% Not measured for Quarters
3. NEIGHBOURHOOD AND COMMUNITY
Cat PI Code & Short Name Target 2015/16 2016/17 2017/18 Q2
2016/17
Q3
2016/17
Q4
2016/17
Q1
2017/18
Q2
2017/18 Latest Note Status
Nat(b) H3.1 % of tenants satisfied with the management of the neighbourhood they live in
85% 76% N/A Not measured for Quarters Survey done every 3 years
Nat(b) H3.2 % of tenancy offers refused during
the year 30% 29.5% 33.1% 37.9% 34.4% 26.3% 29.5% 32.5%
Nat(b) H3.4 % ASB cases which were resolved within locally agreed targets
95% 85.8% 77.5% 87.9% 96.8% 78.1% 98.2% 91.3% 126 of 138
4. ACCESS TO HOUSING AND SUPPORT
Cat PI Code & Short Name Target 2015/16 2016/17 2017/18 Q2
2016/17 Q3
2016/17 Q4
2016/17 Q1
2017/18 Q2
2017/18 Latest Note Status
Nat(b) H4.1a % of new tenancies sustained for more than one year by source of let: existing tenants
Data
only 95.7% 94.9% 93.1% 92.3% 96.3%
100.0
% 94.4%
Nat(b) H4.1b % of new tenancies sustained for more than one year by source of let: statutory homeless
Data only
89.9% 91.0% 86.2% 95.2% 90.7% 88.0% 96.5%
Nat(b) H4.1c % of new tenancies sustained for Data 91.4% 93.3% 88.1% 95.8% 93.5% 93.9% 100.0
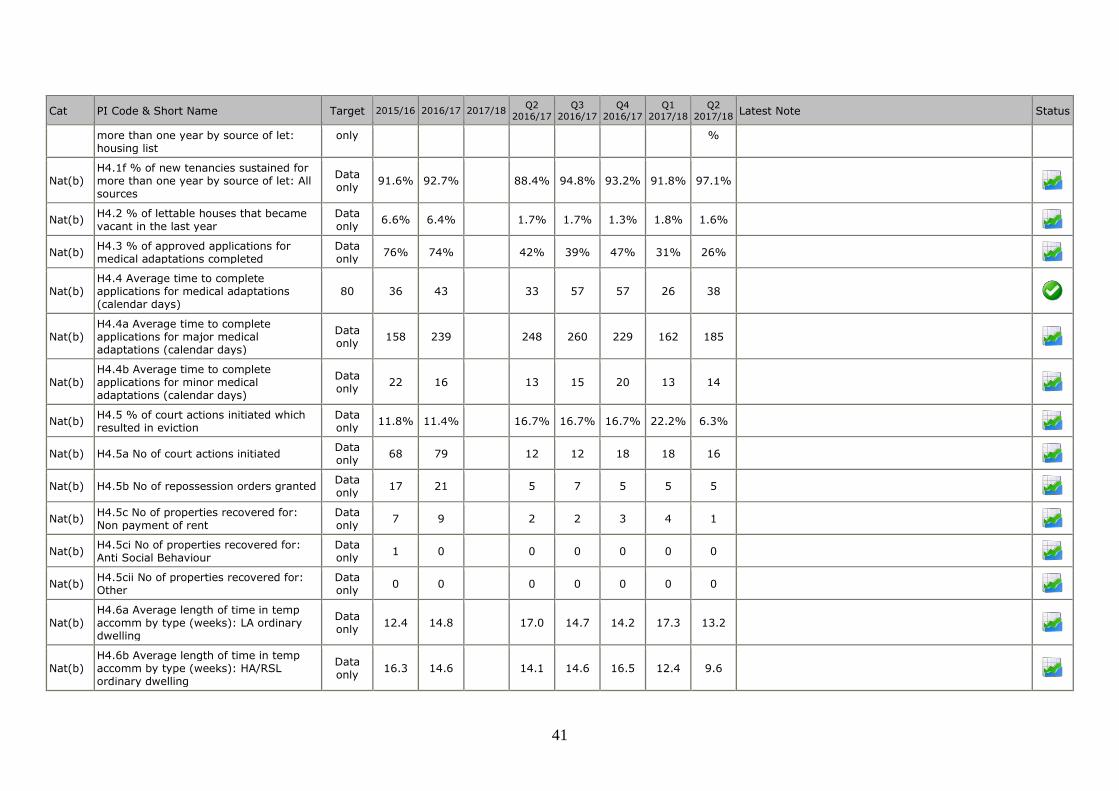
41
Cat PI Code & Short Name Target 2015/16 2016/17 2017/18 Q2
2016/17
Q3
2016/17
Q4
2016/17
Q1
2017/18
Q2
2017/18 Latest Note Status
more than one year by source of let: housing list
only %
Nat(b) H4.1f % of new tenancies sustained for more than one year by source of let: All sources
Data only
91.6% 92.7% 88.4% 94.8% 93.2% 91.8% 97.1%
Nat(b) H4.2 % of lettable houses that became vacant in the last year
Data only
6.6% 6.4% 1.7% 1.7% 1.3% 1.8% 1.6%
Nat(b) H4.3 % of approved applications for medical adaptations completed
Data only
76% 74% 42% 39% 47% 31% 26%
Nat(b) H4.4 Average time to complete applications for medical adaptations (calendar days)
80 36 43 33 57 57 26 38
Nat(b) H4.4a Average time to complete applications for major medical adaptations (calendar days)
Data only
158 239 248 260 229 162 185
Nat(b) H4.4b Average time to complete applications for minor medical adaptations (calendar days)
Data only
22 16 13 15 20 13 14
Nat(b) H4.5 % of court actions initiated which resulted in eviction
Data only
11.8% 11.4% 16.7% 16.7% 16.7% 22.2% 6.3%
Nat(b) H4.5a No of court actions initiated Data only
68 79 12 12 18 18 16
Nat(b) H4.5b No of repossession orders granted Data only
17 21 5 7 5 5 5
Nat(b) H4.5c No of properties recovered for: Non payment of rent
Data only
7 9 2 2 3 4 1
Nat(b) H4.5ci No of properties recovered for: Anti Social Behaviour
Data only
1 0 0 0 0 0 0
Nat(b) H4.5cii No of properties recovered for: Other
Data only
0 0 0 0 0 0 0
Nat(b) H4.6a Average length of time in temp accomm by type (weeks): LA ordinary dwelling
Data only
12.4 14.8 17.0 14.7 14.2 17.3 13.2
Nat(b) H4.6b Average length of time in temp accomm by type (weeks): HA/RSL ordinary dwelling
Data only
16.3 14.6 14.1 14.6 16.5 12.4 9.6
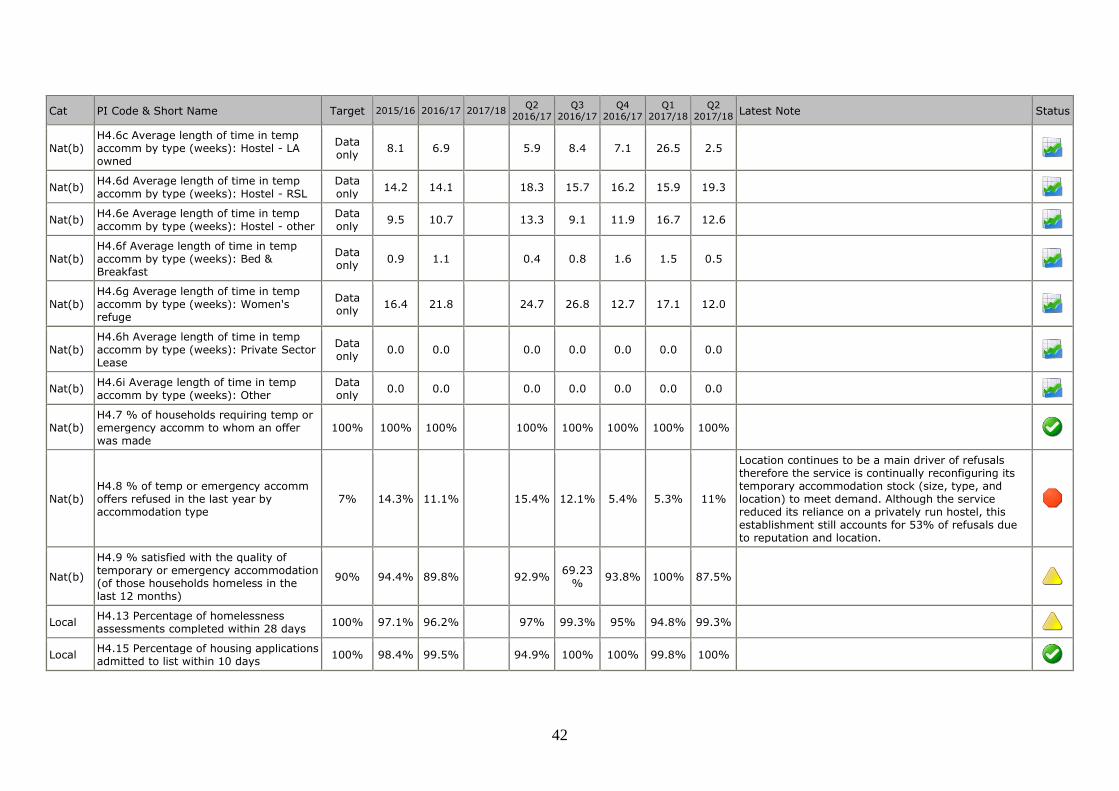
42
Cat PI Code & Short Name Target 2015/16 2016/17 2017/18 Q2
2016/17
Q3
2016/17
Q4
2016/17
Q1
2017/18
Q2
2017/18 Latest Note Status
Nat(b) H4.6c Average length of time in temp accomm by type (weeks): Hostel - LA owned
Data only
8.1 6.9 5.9 8.4 7.1 26.5 2.5
Nat(b) H4.6d Average length of time in temp accomm by type (weeks): Hostel - RSL
Data only
14.2 14.1 18.3 15.7 16.2 15.9 19.3
Nat(b) H4.6e Average length of time in temp accomm by type (weeks): Hostel - other
Data only
9.5 10.7 13.3 9.1 11.9 16.7 12.6
Nat(b) H4.6f Average length of time in temp accomm by type (weeks): Bed & Breakfast
Data only
0.9 1.1 0.4 0.8 1.6 1.5 0.5
Nat(b) H4.6g Average length of time in temp accomm by type (weeks): Women's refuge
Data only
16.4 21.8 24.7 26.8 12.7 17.1 12.0
Nat(b) H4.6h Average length of time in temp accomm by type (weeks): Private Sector Lease
Data only
0.0 0.0 0.0 0.0 0.0 0.0 0.0
Nat(b) H4.6i Average length of time in temp accomm by type (weeks): Other
Data only
0.0 0.0 0.0 0.0 0.0 0.0 0.0
Nat(b) H4.7 % of households requiring temp or emergency accomm to whom an offer was made
100% 100% 100% 100% 100% 100% 100% 100%
Nat(b) H4.8 % of temp or emergency accomm offers refused in the last year by accommodation type
7% 14.3% 11.1% 15.4% 12.1% 5.4% 5.3% 11%
Location continues to be a main driver of refusals therefore the service is continually reconfiguring its temporary accommodation stock (size, type, and location) to meet demand. Although the service reduced its reliance on a privately run hostel, this establishment still accounts for 53% of refusals due to reputation and location.
Nat(b)
H4.9 % satisfied with the quality of temporary or emergency accommodation (of those households homeless in the last 12 months)
90% 94.4% 89.8% 92.9% 69.23
% 93.8% 100% 87.5%
Local H4.13 Percentage of homelessness assessments completed within 28 days
100% 97.1% 96.2% 97% 99.3% 95% 94.8% 99.3%
Local H4.15 Percentage of housing applications admitted to list within 10 days
100% 98.4% 99.5% 94.9% 100% 100% 99.8% 100%
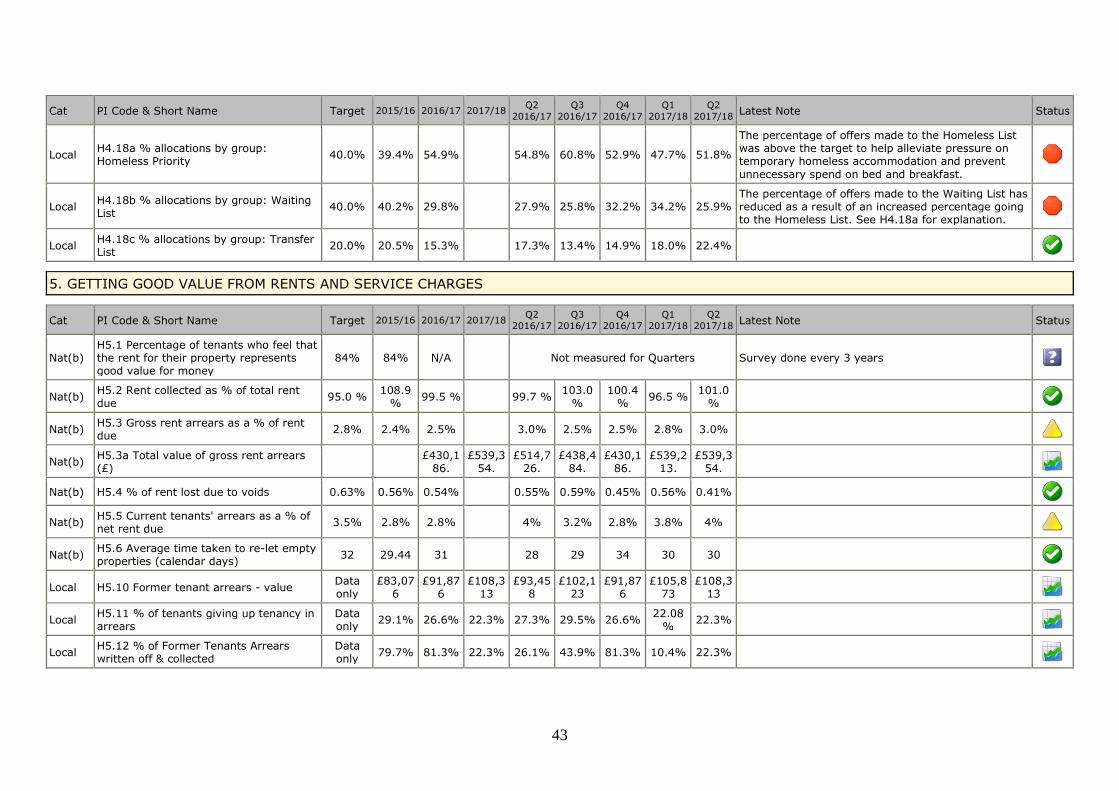
43
Cat PI Code & Short Name Target 2015/16 2016/17 2017/18 Q2
2016/17
Q3
2016/17
Q4
2016/17
Q1
2017/18
Q2
2017/18 Latest Note Status
Local H4.18a % allocations by group: Homeless Priority
40.0% 39.4% 54.9% 54.8% 60.8% 52.9% 47.7% 51.8%
The percentage of offers made to the Homeless List was above the target to help alleviate pressure on temporary homeless accommodation and prevent
unnecessary spend on bed and breakfast.
Local H4.18b % allocations by group: Waiting List
40.0% 40.2% 29.8% 27.9% 25.8% 32.2% 34.2% 25.9% The percentage of offers made to the Waiting List has reduced as a result of an increased percentage going to the Homeless List. See H4.18a for explanation.
Local H4.18c % allocations by group: Transfer List
20.0% 20.5% 15.3% 17.3% 13.4% 14.9% 18.0% 22.4%
5. GETTING GOOD VALUE FROM RENTS AND SERVICE CHARGES
Cat PI Code & Short Name Target 2015/16 2016/17 2017/18 Q2
2016/17
Q3
2016/17
Q4
2016/17
Q1
2017/18
Q2
2017/18 Latest Note Status
Nat(b) H5.1 Percentage of tenants who feel that the rent for their property represents good value for money
84% 84% N/A Not measured for Quarters Survey done every 3 years
Nat(b) H5.2 Rent collected as % of total rent due
95.0 % 108.9
% 99.5 % 99.7 %
103.0 %
100.4 %
96.5 % 101.0
%
Nat(b) H5.3 Gross rent arrears as a % of rent due
2.8% 2.4% 2.5% 3.0% 2.5% 2.5% 2.8% 3.0%
Nat(b) H5.3a Total value of gross rent arrears (£)
£430,1
86. £539,3
54. £514,7
26. £438,4
84. £430,1
86. £539,2
13. £539,3
54.
Nat(b) H5.4 % of rent lost due to voids 0.63% 0.56% 0.54% 0.55% 0.59% 0.45% 0.56% 0.41%
Nat(b) H5.5 Current tenants' arrears as a % of net rent due
3.5% 2.8% 2.8% 4% 3.2% 2.8% 3.8% 4%
Nat(b) H5.6 Average time taken to re-let empty properties (calendar days)
32 29.44 31 28 29 34 30 30
Local H5.10 Former tenant arrears - value Data only
£83,076
£91,876
£108,313
£93,458
£102,123
£91,876
£105,873
£108,313
Local H5.11 % of tenants giving up tenancy in arrears
Data only
29.1% 26.6% 22.3% 27.3% 29.5% 26.6% 22.08
% 22.3%
Local H5.12 % of Former Tenants Arrears written off & collected
Data only
79.7% 81.3% 22.3% 26.1% 43.9% 81.3% 10.4% 22.3%
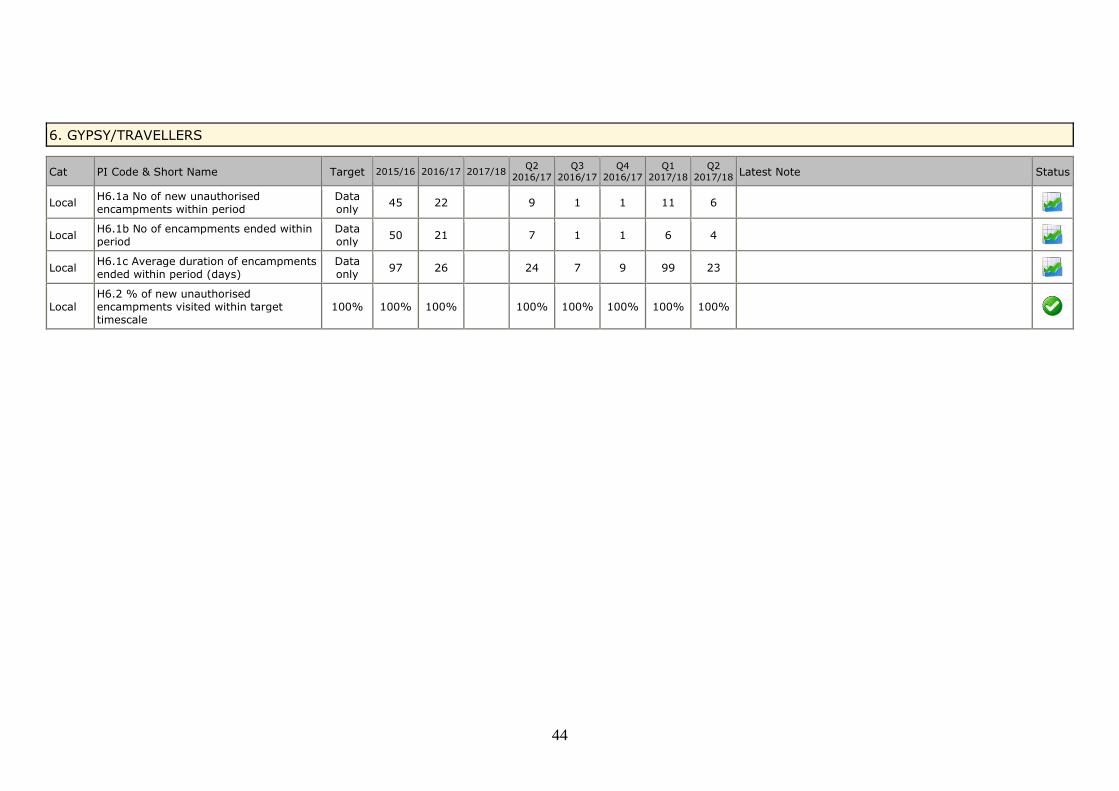
44
6. GYPSY/TRAVELLERS
Cat PI Code & Short Name Target 2015/16 2016/17 2017/18 Q2
2016/17
Q3
2016/17
Q4
2016/17
Q1
2017/18
Q2
2017/18 Latest Note Status
Local H6.1a No of new unauthorised encampments within period
Data only
45 22 9 1 1 11 6
Local H6.1b No of encampments ended within period
Data only
50 21 7 1 1 6 4
Local H6.1c Average duration of encampments ended within period (days)
Data only
97 26 24 7 9 99 23
Local H6.2 % of new unauthorised encampments visited within target timescale
100% 100% 100% 100% 100% 100% 100% 100%