2017 Transurban Annual Report · 2017 ransurban Annual Report 1 Transurban Holdings Limited and...
128
2017 Transurban Annual Report transurban.com
Transcript of 2017 Transurban Annual Report · 2017 ransurban Annual Report 1 Transurban Holdings Limited and...

AustraliaMelbourne Level 23Tower One, Collins Square727 Collins StreetDocklands Victoria 3008
SydneyLevel 9
New South Wales 2000
Brisbane7 Brandl StreetEight Mile PlainsQueensland 4113
Mailing AddressLocked Bag 28 South Melbourne Victoria 3205
Phone +61 3 8656 8900 Fax +61 3 8656 8585
United StatesWashington DC Area
Alexandria VA 22312United States
Phone 571 419 6100
Email [email protected]
TUIR026 Annual Report 2017 cover art02 sp indd 1 25/8/17 13:32
2017 Transurban Annual Report
2017 Transurban Annual Report
transurban.com
TUIR026 Annual Report 2017 cover art02 sp indd 3 25/8/17 13:32

Contents
1
122
Transurban’s 2017 Corporate Governance Statement is located at www.transurban.com/corporate-governance-statement
TUIR026 Annual Report 2017 cover art02 sp indd 4 25/8/17 13:32
E
E
The stapled securities register is maintained by Computershare Investor Services Pty Ltd.
If you have a question about your Transurban securities or distributions please contact:
CYarra Falls 452 Johnston Street Abbotsford, Victoria 3067 Australia
The Registrar Computershare Investor Services Pty Ltd GPO Box 2975 Melbourne, Victoria 3001 Australia
(Australia ) 1300 555 159 (Overseas) +61 3 9415 4062
TUIR026 Annual Report 2017 cover art02 sp indd 6 25/8/17 13:32

12017 Transurban Annual Report
Transurban Holdings Limited and Controlled Entities ABN 86 098 143 429 (Including Transurban International Limited and Transurban Holding Trust)
Annual report
for the year ended 30 June 2017
Transurban Holdings Limited and Controlled Entities ABN 86 098 143 429 (Including Transurban International Limited and Transurban Holding Trust)
Annual report
for the year ended 30 June 2017
TUIR026_Annual_Report_2017_inner_spreads_art02_sp.indd 1 23/8/17 10:30

2017 Transurban Annual Report2
2
Contents
Directors’ report…………………………………………………………………………………………………………….…3
Section A: Group financial statements…………………………………………………………………………………….45
Section B: Notes to the Group financial statements……………………………………………………………………..52
Section C: Transurban Holding Trust (‘THT’) and Transurban International Limited (‘TIL’) financial statements...96
Section D: Notes to the THT and TIL financial statements………………………………………………..…………..101
Section E: Signed reports……………………………………………………………………………………..…………..113
TUIR026_Annual_Report_2017_inner_spreads_art02_sp.indd 2 23/8/17 10:30

32017 Transurban Annual Report
3
Directors’ report The Directors of Transurban Holdings Limited (‘the Company’, ‘the Parent’ or ‘THL’) and its controlled entities (‘Transurban’, ‘Transurban Group’ or ‘the Group’), Transurban International Limited and its controlled entities (‘TIL’), and Transurban Infrastructure Management Limited (‘TIML’), as responsible entity of Transurban Holding Trust and its controlled entities (‘THT’), present their report on the Transurban Group for the financial year ended 30 June 2017 (‘FY17’). The controlled entities of THL include the other members of the stapled group being TIL and THT.
Result Statutory results § Toll revenue increased 11.4 per cent to $2,083 million;
§ Profit from ordinary activities after tax increased 850.0 per cent from $22 million to $209 million;
§ Profit from ordinary activities after tax excluding significant items1 increased 41.2 per cent to $209 million;
§ Earnings before depreciation and amortisation, net finance costs, equity accounted investments and income taxes (‘EBITDA’) increased 22.3 per cent to $1,526 million;
§ EBITDA excluding significant items1 increased 10.7 per cent to $1,526 million;
§ Statutory net profit attributable to security holders of the stapled group increased 141.4 per cent to $239 million; and
§ Statutory net profit attributable to security holders of the stapled group excluding significant items1 increased 34.3 per cent to $239 million.
Proportional results § Toll revenue increased 10.6 per cent to $2,153 million;
§ EBITDA2 increased by 16.5 per cent to $1,629 million;
§ EBITDA2 excluding significant items1 increased by 10.1 per cent to $1,629 million; and
§ Free cash increased 31.7 per cent to $1,220 million.
Distributions
Amount per security
Cents
Franked amount per security
%
Final distribution (declared prior to reporting date) 23.0 – Final dividend (declared prior to reporting date) 3.5 100
26.5 Interim distribution for the current year 21.5 – Interim dividend for the current year 3.5 100
25.0 Final distribution (prior year) 19.5 – Final dividend (prior year) 3.5 100
23.0
Record date for determining entitlements to distribution and dividend 30 June 2017
Date of payment of final distribution and dividend 11 August 2017
1. Significant items are those items where their nature and amount is considered material to the financial statements and not in the ordinary
course of business. Refer to note B6 of the Group financial statements for further information. 2. Refer to Note B4 of the Group financial statements for the definition of proportional EBITDA.
TUIR026_Annual_Report_2017_inner_spreads_art02_sp.indd 3 23/8/17 10:30

2017 Transurban Annual Report4
4
Principal activities The principal activities of the Group during the financial year were the development, operation, maintenance and financing of toll road networks as well as management of the associated customer and client relationships.
Operating and financial review Our business Transurban manages and develops urban toll road networks in Australia and the United States of America.
The Group owns concession assets across four key market segments: Victoria (‘VIC’), New South Wales (‘NSW’), Queensland (‘QLD’) and the Greater Washington Area (‘GWA’).
Transurban is listed on the Australian Securities Exchange (‘ASX’) and has been in business since 1996.
Strategy Transurban’s target markets are the eastern seaboard of Australia and North America.
At the heart of our business strategy is our desire to be a partner of choice for our government clients and an organisation that meets the needs of our customers and the community. To achieve this, we strive to provide effective transportation solutions to support the growth and development of the cities in which we operate.
At Transurban we do this through management of our existing road networks, through our active involvement in the transport policy debate, and by applying our unique skills to the infrastructure challenges in our markets.
In delivering on this objective our business has fostered core capabilities in the following areas:
§ Network planning and forecasting;
§ Community engagement;
§ Development and delivery;
§ Technology; and
§ Operations and customer management.
Value proposition Transurban has an interest in 15 operating assets across four markets. The investment proposition for high quality toll road assets lies in providing investors with access to long dated, predictable, growing cash flows generated over the life of the concession.
Organic growth is derived from traffic growth and toll escalation. It is supported by Transurban’s ability to meet the service expectations of our customers to provide efficient corporate and operational services at scale across its portfolio.
In addition, Transurban continues to invest in the ongoing development of our portfolio and expand our initiatives in customer engagement, sustainability, technology and safety to create value for all our stakeholders.
TUIR026_Annual_Report_2017_inner_spreads_art02_sp.indd 4 23/8/17 10:30

52017 Transurban Annual Report
5
Operating and financial review (continued) Segments
1. Airportlink M7 was acquired on 1 April 2016. 2. Westlink M7 and NorthConnex form the NorthWestern Roads Group. Concession assets timeline Below is a list of the concession asset end dates (calendar year ends).
TUIR026_Annual_Report_2017_inner_spreads_art02_sp.indd 5 23/8/17 10:30

2017 Transurban Annual Report6
6
Operating and financial review (continued) Accounting for assets – changes during the year During the year ended 30 June 2017, there have been no significant changes in the accounting for our assets.
Group financial performance
Financial performance indicators The Transurban Board and management assess the performance of the networks in which we operate based on a measure of proportional earnings before depreciation, amortisation, net finance costs and income taxes (‘Proportional EBITDA’) excluding the impact of significant items (‘Underlying proportional EBITDA’). This reflects the contribution of each network in the Group in the proportion of Transurban's equity ownership.
Significant items are those items where their nature and amount is considered material to the financial statements and not in the ordinary course of business.
To arrive at the proportional result, minority interests in Transurban’s controlled roads are taken out and Transurban’s interests in non-controlled assets are included, in proportion to Transurban’s ownership.
Free cash is the primary measure used to assess Transurban’s cash generation. Free cash is used as the guide to determine distributions to security holders.
Year ended 30 June 2017 highlights Statutory results
FY17 $M
FY16 $M
Toll revenue 2,083 1,870
EBITDA 1,526 1,248
Net profit/(loss) 209 22
EBITDA excluding significant items 1,526 1,379
Net profit after tax excluding significant items 209 148
TUIR026_Annual_Report_2017_inner_spreads_art02_sp.indd 6 23/8/17 10:30

72017 Transurban Annual Report
7
Operating and financial review (continued) Proportional EBITDA Segment information in note B4 to the financial statements presents the proportional result for Transurban Group, including reconciliations to the statutory result. Management considers proportional EBITDA to be the best indicator of asset performance. The table below also provides FY17 results adjusted to exclude certain acquisitions and new assets so as to compare the performance of the existing business to the prior year result.
FY17 $M
FY16 $M % Change
FY17 Adjusted1
$M
FY16 Adjusted1
$M % Change
Toll revenue 2,153 1,946 10.6% 2,083 1,929 8.0% Other revenue 58 60 (3.3%) 58 60 (3.3%) Total costs (582) (526) 10.6% (564) (521) 8.3% EBITDA excluding significant items 1,629 1,480 10.1% 1,577 1,468 7.4% Significant items - (82) (100%) - (7) (100%) EBITDA 1,629 1,398 16.5% 1,577 1,461 7.9%
1. Excludes contributions associated with AirportlinkM7.
Financial position
FY17
M FY16
M
Market capitalisation – 30 June $24,320 $24,406
Securities on issue – 30 June 2,052 2,036
Cash and cash equivalents $988 $834
Transurban’s operating assets are primarily long-life intangible assets (concession assets), representing the provision by Government entities for the right to toll customers for the use of the assets. Concession assets represent 76 per cent of the total assets of the Group. The total duration of the concessions typically range from approximately 30 to 80 years, and for accounting purposes the carrying values are amortised on a straight line basis over the duration of the concession.
Free cash
FY17 FY16 % Change
Free cash $1,220M $926M 31.7%
Weighted average securities eligible for distribution1 2,048M 1,978M 3.5%
Free cash per security (cents) 59.6 46.8 27.4% 1. New securities issued during the year are included only to the extent they were eligible for the interim and/or final distribution. Movements in free cash during the period have been influenced by:
§ $59 million growth in EBITDA from 100% owned assets
§ ($58) million decrease due to higher net finance costs paid due to timing of cash flows on new and refinanced debt
§ $77 million increase in non-100% owned assets distributions received due to higher distributions from M5 ($29 million) associated with the timing of payment of FY16 distributions, Transurban Queensland (excluding AirportlinkM7) ($15 million), Eastern Distributor ($11 million) and NorthWestern Roads Group distributions ($22 million)
§ $38 million increase due to distributions received from AirportlinkM7
§ $174 million increase from the NorthWestern Roads Group capital release
§ $4 million increase due to favourable year-on-year movements in working capital and maintenance expense
The weighted average securities eligible for distribution have increased due to the impact of the equity issued in December 2015 to support the acquisition of AirportlinkM7. These securities issued in December 2015 were eligible for the FY16 2nd half distributions only, but were entitled to both distributions in FY17.
Note B10 to the statutory accounts provides a detailed calculation of free cash.
TUIR026_Annual_Report_2017_inner_spreads_art02_sp.indd 7 23/8/17 10:30
2017 Transurban Annual Report8
8
Operating and financial review (continued) Network performance
Network Highlights
Proportional toll revenue contribution
Traffic growth (average daily
trips)
Toll revenue growth
EBITDA growth2
Sydney § The network continues to perform well with large vehicle growth
§ M2 traffic impacted by NorthConnex construction works
§ Weekend traffic growth of 4.7%
40.5% 3.4% 9.2% 10.2%
Melbourne § Disruption impacts from major CityLink- Tulla Widening (”CTW”) works continued
§ Opened approximately 35% of new capacity associated with CTW
§ Heavy Commercial Vehicle (“HCV”) multiplier moved to 3 times cars on 1 April 2017 as per concession agreement
31.9% (1.0%) 4.1% 5.3%
Brisbane1 § Traffic growth improving with large vehicle growth exceeding cars
§ HCV multipliers increasing to 3 times cars on Clem7 and Go-Between Bridge (“GBB”) as of 1 July 2018 and on Legacy Way 1 July 2020
§ Legacy Way car tolls increasing by 7.8% on 1 July 2020
17.9% 15.0% 22.9% 97.1%
Greater Washington Area3
§ Ramp up continues with traffic and revenue growth
§ Traffic demand drove average dynamic toll price increases of 21% for 495 Express lanes and 19% for 95 Express Lanes compared to FY16
9.7% 12.8% 23.7% 39.2%
1. Excluding Transurban Queensland integration and acquisition costs in FY16, EBITDA increased 22.9% (including AirportlinkM7). 2. Excluding AirportlinkM7, ADT increased 2.3%, toll revenue increased 6.3% and EBITDA increased 4.9%. 3. Toll revenue and EBITDA growth are calculated in USD.
TUIR026_Annual_Report_2017_inner_spreads_art02_sp.indd 8 23/8/17 10:30

92017 Transurban Annual Report
9
Operating and financial review (continued) Sydney
Operations
Operational enhancement
§ Successfully commissioned Eastern Distributor variable speed management system
§ Completed M2 Motorscapes public art and five hectare bush regeneration project
§ Development of new mobile hazard reporting devices
§ Launch of new retail brand Transurban Linkt
Development
NorthConnex
§ Project currently on time and on budget
§ 19 road headers in operation
§ Seven of 21 kilometres of tunnelling completed
§ First spoil delivered to Hornsby Quarry in May 2017
§ Accelerating Hills M2 integration works to minimise impact on Hills M2 customers
§ Westlink M7 large vehicle multipliers reached 3 times cars in January 2017
Melbourne
Operations
CityLink Operations
§ Preparation, safety and development work underway for connected and automated vehicles (CAV) trials. Car manufacturers testing how partial automation technologies interact with motorway infrastructure
Development
CityLink Tulla Widening Western Gate Tunnel Project
§ Total project cost approximately $1.3 billion
§ CityLink upgrade to be completed early 2018
§ Construction proceeding on time and on budget – 80% complete
§ 35% of new capacity already opened
§ Over 80,000 trees planted to date
§ New community grants program and Landcare partnership launched
§ Total project cost approximately $5.5 billion
§ CPB Contractors John Holland Joint Venture selected as preferred tenderer
§ Financial close expected by late 2017 with the Inquiry and Advisory Committee report to be submitted to Minister for Planning by 23 October
TUIR026_Annual_Report_2017_inner_spreads_art02_sp.indd 9 23/8/17 10:30

2017 Transurban Annual Report10
10
Operating and financial review (continued) Brisbane
Operations
Brisbane Operations
§ GLIDe on schedule for implementation by the end of 2017; will enable customer initiatives including digital self-service channels, mobile apps and notice of demand aggregation (subject to State Government approval)
§ Tunnel network operations and maintenance (“O&M”) contract executed and the onboarding of Legacy Way onto this contract is progressing on time
Development
Logan Enhancement Project (“LEP”) Inner City Bypass (“ICB”)
§ Total project cost $512 million
§ Construction underway
§ Logan and Gateway HCV tolls increasing post-LEP (completion expected mid-2019)
§ Design refinements to improve accessibility and reduce environmental footprint at Wembley Road and Gateway Extension interchanges
§ Major construction started in July 2017
§ Transurban to manage delivery and assume operations of the ICB post-upgrade
§ Project funded via HCV multipliers increasing to 3 times cars on Clem7 and GBB on 1 July 2018 and Legacy Way 1 July 2020 and via Legacy Way car tolls increasing by 7.8% on 1 July 2020
§ Construction completion scheduled for mid-2018
Greater Washington Area
Operations
95 Express Lanes and 495 Express Lanes
§ Partnership with Virginia State Police on incident management and safety
§ Delivered first phase of next generation cloud-based back office system
§ Launched start-up challenge on innovative transportation ideas
Development
Southern Extensions to 95 Express Lanes 395 Express Lanes
§ Anticipated early completion in December 2017 on the three km southern extension of 95 Express Lanes
§ Advanced development framework for the 14 kilometre extension south to the Fredericksburg area agreed with the Virginia Department of Transportation in June 2017
§ Preliminary engineering under way
§ Total project cost USD $475 million
§ Early works began in February 2017
§ Financial close reached in July 2017
§ Construction completion expected end of 2019
TUIR026_Annual_Report_2017_inner_spreads_art02_sp.indd 10 23/8/17 10:30

112017 Transurban Annual Report
11
Operating and financial review (continued) Financing activities During the reporting period Transurban executed a number of financing activities including:
July 2016 Westlink M7 issued AUD$500 million of 7 and 10 year Australian Medium Term Notes.
Lane Cove Tunnel drew down AUD$200 million of non-recourse debt. The debt was provided by banks and private placement investors for terms of 5 and 12 years respectively.
NOK 750 million of corporate senior secured 11 year notes were issued via private placement under the Euro Medium Term Note Programme.
September 2016 USD$550 million of corporate senior secured 10.5 year notes were issued in the US 144A bond market.
October 2016 Transurban Queensland issued AUD$200 million of 7 year senior secured Australian Medium Term Notes.
November 2016 Transurban Queensland issued CHF 175 million of 10 year senior secured Swiss bonds under the Euro Medium Term Note Programme.
A 3 year corporate working capital facility for AUD$100 million and an AUD$50 million Letter of Credit facility were established as part of a refinancing of existing facilities.
December 2016 Transurban Queensland issued AUD$774 million of US Private Placement Notes. The notes were issued in four tranches of approximately AUD$204 million, AUD$293 million, AUD$177 million and AUD$100 million with tenors of 10,12,15 and 18 years respectively. Settlement occurred in December with the 18 year tranche settled in January 2017.
A 5 year corporate working capital facility for AUD$125 million was established as part of a refinancing of existing facilities.
Cross City Tunnel non-recourse debt was refinanced with a new non-recourse 3 year term bank debt facility of AUD$278 million.
Transurban Queensland established a new 3 year AUD$820 million bank debt facility and refinanced an existing 3 year AUD$25 million working capital facility.
March 2017 Westlink M7 issued AUD$535 million of 10 and 10.5 year Australian Medium Term Notes.
May 2017 Westlink M7 priced AUD$200 million of US Private Placement Notes. The notes will be issued in two tranches of AUD$100 million each with tenors of 12 and 15 years respectively. Settlement is due to occur in August 2017.
There were no changes to the Transurban Group ratings provided by Standard and Poor’s Financial Services LLC rating service, Moody’s Investors Services Inc. or Fitch Ratings Inc. during the period.
Funding structure The following diagram shows the non-recourse and corporate debt balances of the Group.
TUIR026_Annual_Report_2017_inner_spreads_art02_sp.indd 11 23/8/17 10:30
2017 Transurban Annual Report12
12
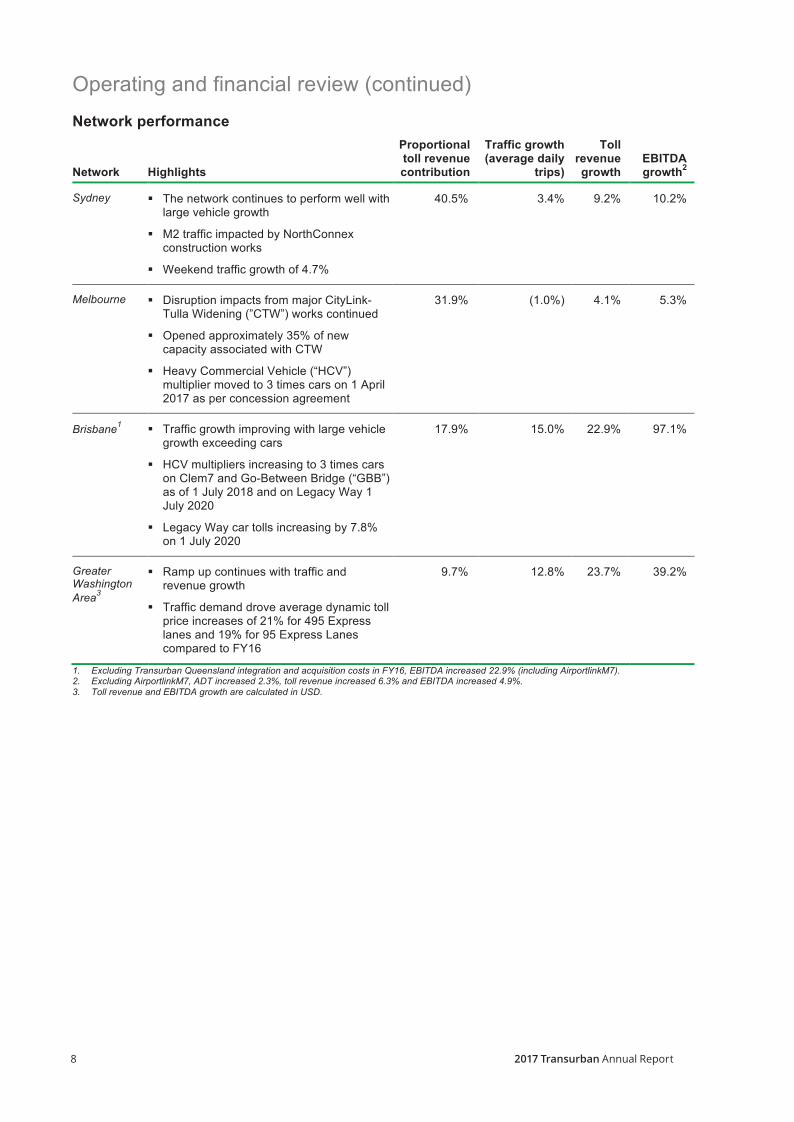
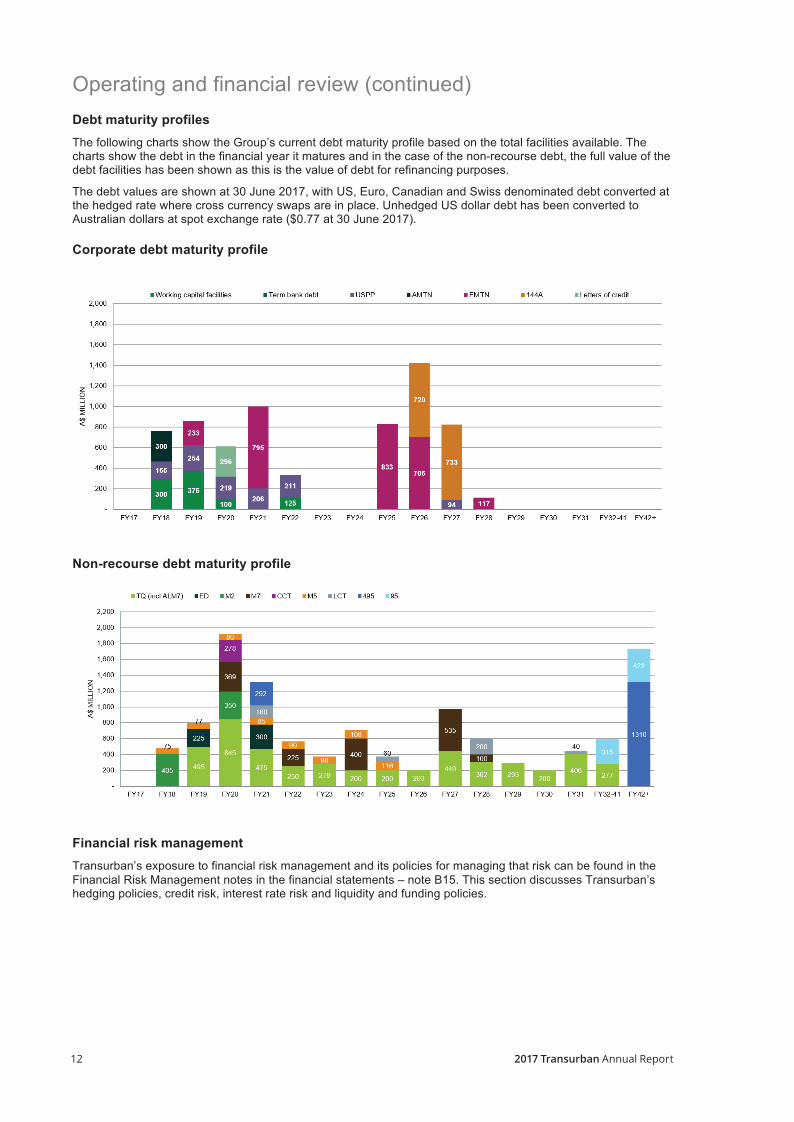
Operating and financial review (continued) Debt maturity profiles The following charts show the Group’s current debt maturity profile based on the total facilities available. The charts show the debt in the financial year it matures and in the case of the non-recourse debt, the full value of the debt facilities has been shown as this is the value of debt for refinancing purposes.
The debt values are shown at 30 June 2017, with US, Euro, Canadian and Swiss denominated debt converted at the hedged rate where cross currency swaps are in place. Unhedged US dollar debt has been converted to Australian dollars at spot exchange rate ($0.77 at 30 June 2017).
Corporate debt maturity profile
Non-recourse debt maturity profile
Financial risk management Transurban’s exposure to financial risk management and its policies for managing that risk can be found in the Financial Risk Management notes in the financial statements – note B15. This section discusses Transurban’s hedging policies, credit risk, interest rate risk and liquidity and funding policies.
TUIR026_Annual_Report_2017_inner_spreads_art02_sp.indd 12 23/8/17 10:30
132017 Transurban Annual Report
13
Operating and financial review (continued) Corporate activities
People At Transurban we aim to create an environment where our people are encouraged to reach their full potential, and are recognised and rewarded for their achievements. We aim to celebrate the different cultures of our employees and believe it is important our workforce reflects the broader population and communities in which we operate.
This year, our internal employee opinion survey (EOS) showed that 80% of employees are proud to work for Transurban and 85% believe in our values of Integrity, Collaboration, Accountability, Ingenuity and Respect.
The EOS survey rated Leadership Effectiveness at 82%, which is significantly higher than the Global norm and in line with the Best in Class norm of top 25% of organisations.
We are dedicated to the ongoing development of our existing and future leaders. Senior leaders attend an annual Senior Leadership Program, while there is a continued focus on building greater leadership capability through other levels of the organisation and attracting the next generation of Transurban leaders and professional / technical experts through our graduate program.
Transurban conducts a bi-annual talent review with the Executive and Senior Leadership teams. This review helps identify high potential individuals who have the ability to move into Senior Leadership or Executive roles, or those who may be able to move laterally outside of their area of technical expertise. In addition, we recognise those individuals with exceptional technical skills that are highly valued by the organisation.
We have developed relationships with key universities enabling the establishment of summer internships for engineering and business graduates and have continued programs including the Monash Industry Team Initiative with 16 students across four teams working on business projects for 12 weeks and our Females Excelling in Engineering and Technology (FEET) program with 47 students completing 35 hours of mentoring across the business in 2017.
We focus on developing a high performance culture through differentiating performance. The Short Term Incentive (‘STI’) program includes formal performance comparisons against peers, which strengthens the link between individual employee performance and Group performance. We offer a range of employee benefits including an employee share scheme and group insurance including salary continuance, death and permanent disablement insurance cover. The EOS survey highlighted an increase in the Performance Excellence index to 73% in 2017.
There is ongoing focus on Diversity and Inclusion, and progressing our key priority areas of gender diversity, cultural diversity and workplace flexibility. In FY2017 we received the Employer of Choice for Gender Equality (EOCGE) award for the third year in a row. We were also recognised through the Equileap Diversity Award as a top 20 company globally for gender equality; received the Best Action for Supporting Diversity in the ITS Workforce Award; and Engineers Australia Most Ambitious Company in Gender Diversity award. We conduct an annual pay equity review with a focus on achieving a zero pay gap.
At Transurban, we believe in a holistic approach to wellbeing. In addition to being healthy; physically and mentally, we encourage employees to be connected with others in the community and recognise achievement at work.
We have a number of awareness and education programs as well as an awards program to recognise employees’ achievements. The Transurban Annual Awards recognise employees’ achievements in customer service, diversity, ingenuity, safety, sustainability and overall business excellence. We recognise both what our employees do and how they go about it through the thanksTU program, which encourages employees to reward a colleague for an achievement which demonstrates our values.
Our employee volunteer program gives employees the opportunity to take one day of paid volunteer leave each year. With strong support demonstrated through feedback and participation rates in this program, it remains a key area of focus for our Wellbeing Program.
TUIR026_Annual_Report_2017_inner_spreads_art02_sp.indd 13 23/8/17 10:30

2017 Transurban Annual Report14
14
Operating and financial review (continued) Sustainability Transurban's vision ‘to strengthen communities through transport’ is closely supported by our sustainability strategy. We are committed to making sure that our roads help make our cities great places to live and work — both now and in the future.
Transurban’s sustainability strategy has three key pillars:
§ Be good neighbours: We will work with communities to create shared value with our business by anticipating, listening and responding to community needs;
§ Use less: We will minimise natural resource use and create resource efficiencies during development, operations and maintenance to reduce the impacts of our operations on the community and environment; and
§ Think long term: We will look for innovative transport solutions that will create efficient, safe transport networks and thriving cities.
During the period Transurban continued with a range of social and environmental sustainability initiatives including:
§ Three major projects awarded an independent Infrastructure Sustainability (IS) Design Rating: a ‘Leading’ rating for NorthConnex and ‘Excellent’ ratings for Gateway Upgrade North and CityLink Tulla Widening;
§ Completion of two roadside regeneration projects in Melbourne and Sydney, including iconic public art and partnering with Landcare Australia to restore native vegetation, improve biodiversity and community amenity;
§ Commitment of land and funding for Transurban’s Heathwood Community Development project, a community facility to be delivered as part of the Logan Enhancement Project;
§ Partnership with Neuroscience Research Australia (NeuRA) to establish the Transurban Road Safety Centre, providing state-of-the-art facilities and equipment to study practical injury prevention strategies;
§ Three new innovation grants awarded to research groups investigating smart road surface materials, LED road safety sensors and lighting, and improved motorcycle safety barriers;
§ Community investment through major local partnerships, grants, employee volunteering and support for a range of community and charitable organisations;
§ Commencing the next stage of Transurban’s reconciliation journey through the release of our ‘Innovate’ Reconciliation Action Plan (RAP);
§ Customer service improvements including Transurban’s new retail brand Linkt, new customer account choices, mobile phone apps and customer engagement initiatives;
§ Continued efforts towards our ‘10-in-10’ commitment to reduce our energy consumption by 10% by 2023;
§ Thought leadership and practical trials on road funding reform through Transurban’s Road Usage Study; and
§ Recognition in independent sustainability benchmarks and awards including the Dow Jones Sustainability Index (DJSI) World Index and Industry Mover Award.
Transurban provides regular progress reports to the Board on our focus areas. The annual Sustainability Report summarises the year’s activities and outlines commitments for the coming years.
The 2017 Sustainability Report will be published in October 2017 and will be available via the Transurban website.
TUIR026_Annual_Report_2017_inner_spreads_art02_sp.indd 14 23/8/17 10:30
152017 Transurban Annual Report
15
Operating and financial review (continued) Health, Safety & Environment Improving the Health, Safety and Environment (HSE) performance at Transurban continues to be a primary focus for our business. During the year ended 30 June 2017, we were committed to managing the key HSE risks and integrating HSE into every part of our business.
Tragically, our contractor on the NorthConnex project suffered an employee fatality during the year. We also had 6 contractor lost time injuries (LTI) across our assets (3) and major projects (3), two employee LTI’s, which resulted in the employee recordable injury rate (RIFR) for the year being 0.95, which is above our zero target. After more than 10 million hours across Transurban assets and major projects, the contractor RIFR was below the 6.38 target at 4.79.
Customer road safety is key to our business. The Road Incident Crash Index (RICI) reduced to 4.85 over the past 12 months, which was above our 4.16 target.
Consistent with our focus on improving HSE performance, we undertook a number of initiatives and supported critical research to enhance the safety of our customers and the community. These included:
§ Partnership with Neuroscience Research Australia (NeuRA) to establish the Transurban Road Safety Centre in Sydney. NeuRA is one of the world’s leading centres of neuroscience research and studies practical injury prevention strategies using facilities and equipment that simulate road accidents.
§ Introduction of an improved Incident Response Model on CityLink to better manage incidents on our network, clear the road quickly and safely and help keep traffic moving.
§ Two major Innovation Grants awarded for road safety research. These included investigating improvements to wire rope barriers for motorcycle safety, and using smart LED sensor lighting embedded into road surfaces to detect and communicate vehicle speed and road safety signals to drivers.
§ A range of awareness and education programs to support the United Nation’s Global Road Safety Week.
§ Strengthening of our Road Safety Strategic Framework and implementing strategic road safety actions that aim to reduce crashes and improve safety on our network. Our strategy and action plans are informed by detailed traffic and incident data from Transurban and public road networks, along with expert advice and research from organisations such as the Australian Road Research Board and Monash University Accident Research Centre.
Business risks and opportunities The following are key opportunities that may impact Transurban’s financial and operating result in future periods:
§ Ability to leverage capabilities to enhance motorway networks;
§ Greater than forecast traffic volumes;
§ Integration of consistent technology and systems to enhance network footprint;
§ Ability to harness knowledge and experience to drive operations and maintenance;
§ Identification of new business opportunities in Transurban’s target markets; and
§ Application of sustainability initiatives to enhance road user and local community experiences.
The following are key risks that may impact Transurban’s financial and operating result in future periods:
§ Reduced traffic volumes or an inability to grow traffic volumes;
§ Change in government policies;
§ Competitor growth or behaviour;
§ Access to suitable financing arrangements;
§ Safety incidents through operations or driver behaviour;
§ Dependency on the services of key contractors and counterparties;
§ Unfavourable changes to market or operating conditions;
§ External cyber-attacks and failure to protect our information ; and
§ Failure of technical infrastructure.
TUIR026_Annual_Report_2017_inner_spreads_art02_sp.indd 15 23/8/17 10:30

2017 Transurban Annual Report16
16
Operating and financial review (continued) Risk management Managing risk is an essential part of our business. Key risks are regularly reviewed by the Board, the Audit and Risk Committee and our Executive Committee.
Transurban has a business-wide risk framework in place to help create a consistent and rigorous approach to identifying, analysing and evaluating risks. This framework has various policies, standards and guidelines attached to it, including the Risk Management Policy which can be found in the Corporate Governance section of our website (transurban.com).
The framework is overseen by the Audit and Risk Committee and is actively managed by the Executive Committee. It is consistent with AS/NZ31000:2009 and is subject to regular review by internal audit. Our Audit and Risk Committee Charter is also available in the Corporate Governance section of our website.
Company secretaries Amanda Street LLB (Hons), BComm
Amanda joined Transurban in September 2008 and was appointed as Company Secretary in February 2011. Before joining Transurban, Amanda was Assistant Company Secretary at AusNet Services, and Senior Corporate Counsel at National Australia Bank. She has over 17 years of legal, company secretariat and other relevant experience. Prior to her in-house work, Amanda was a solicitor specialising in M&A work with Australian law firm King & Wood Mallesons.
Julie Galligan LLB, BA
Julie joined Transurban in November 2008 and was appointed as General Counsel in February 2012. Julie has over 17 years of legal experience in private practice and in-house roles in both Australia and the United Kingdom. Prior to joining Transurban, Julie worked in-house at Associated British Ports and at law firms, SJ Berwin LLP and MinterEllison.
TUIR026_Annual_Report_2017_inner_spreads_art02_sp.indd 16 23/8/17 10:30

172017 Transurban Annual Report
17
Operating and financial review (continued) Meetings of directors The number of meetings of the Boards of Directors of THL, TIML and TIL and each Board Committee held during the year ended 30 June 2017, and the number of meetings attended by each Director are set out in the following tables.
Meetings of the Boards of Directors of THL, TIML and TIL were held jointly.
Board of Directors Audit & Risk Committee1
Remuneration & HR Committee2
Nomination Committee3
Attended Held Attended Held Attended Held Attended Held
Lindsay Maxsted 9 9 6 6 5 * 3 3
Scott Charlton 9 9 6 * 5 * 3 * Neil Chatfield 9 9 6 6 5 5 3 3 Robert Edgar 9 9 6 6 5 5 2 3 Samantha Mostyn 9 9 1 * 5 5 2 3 Christine O'Reilly 9 9 6 6 2 * 3 3 Rodney Slater 9 9 * * 1 * 3 3 Peter Scott 9 9 6 4 1 * 3 3 Jane Wilson4 4 4 2 * 2 1 2 2 * = Not a member of the relevant Committee 1. Scott Charlton, Samantha Mostyn and Jane Wilson were not members of the Audit and Risk Committee but attended meetings as observers
during the year. Peter Scott became a member of the Audit and Risk Committee on 1 September 2016. He attended meetings prior to that date as an observer.
2. Lindsay Maxsted, Scott Charlton, Christine O’Reilly, Rodney Slater and Peter Scott were not members of the Remuneration and Human Resources Committee but attended meetings as observers during the year. Scott Charlton was excluded from discussions involving his remuneration during meetings that he attended. Jane Wilson became a member of the Remuneration and Human Resources Committee on 23 May 2017. She attended meetings prior to that date as an observer.
3. Scott Charlton was not a member of the Nomination Committee but attended meetings as an observer during the year. 4. Jane Wilson was appointed to the Board of Directors on 1 January 2017.
TUIR026_Annual_Report_2017_inner_spreads_art02_sp.indd 17 23/8/17 10:30

2017 Transurban Annual Report18
18
Directors
The following persons were Directors of THL, TIML and TIL during the whole of the financial year and up to the date of this report, unless otherwise stated:
Lindsay Maxsted Dip Bus, FCA, FAICD Chair and independent Non-executive Director Director since 1 March 2008. Chair since 12 August 2010. Chair of the Nomination Committee and a member of the Audit and Risk Committee.
Lindsay is currently Chair and a Non-executive Director of Westpac Banking Corporation, and a Non-executive Director of BHP Billiton Limited and BHP Billiton plc. He is the Managing Director of Align Capital Pty Limited and the Honorary Treasurer of Baker Heart and Diabetes Institute.
Lindsay was formerly a partner of KPMG Australia and was the CEO of that firm from 2001 to 2007. His principal area of practice prior to this was in the corporate recovery field managing a number of Australia’s largest insolvency / workout / turnaround engagements.
As at the date of this report, Lindsay holds interests in 70,258 stapled securities.
Scott Charlton BSci, MBA Chief Executive Officer and Executive Director Director since 16 July 2012. CEO since 16 July 2012.
Scott joined Transurban from Lend Lease, where he was Group COO (from November 2011) and Group Director of Operations (from March 2010). Prior to this, Scott held several senior appointments across a range of infrastructure entities and financial institutions, including as CFO of Leighton Holdings Limited (2007 to 2009) and as Managing Director of Deutsche Bank in Australia and Hong Kong (1995 to 2003).
Scott is currently Deputy Chair of Infrastructure Partnerships Australia and is a member of the Monash Industry Council of Advisors, the Business Council of Australia, and of Roads Australia.
As at the date of this report, Scott holds interests in 1,197,095 stapled securities (held indirectly), 935,843 Performance Awards (LTIs - unlisted) and 100,843 STI Deferred Securities (unvested).
TUIR026_Annual_Report_2017_inner_spreads_art02_sp.indd 18 23/8/17 10:30

192017 Transurban Annual Report
19
Directors (continued)
Neil Chatfield M.Bus, FCPA, FAICD Independent Non-executive Director Director since 18 February 2009. Chair of the Audit and Risk Committee and a member of the Remuneration and HumanResources Committee and the Nomination Committee.
Neil is an established Executive and Non-executive Director with extensive experience across all facets of company management, and with specific expertise in financial management, capital markets, mergers and acquisitions, and risk management.
Neil is currently the Chair and a Non-executive Director of Seek Limited and Costa Group Holdings Limited. Neil is also a Non-executive Director of Iron Mountain Inc and Chair of Launch Housing, a not-for-profit organisation. He was previously a Non-executive Director of Recall Holdings Limited (to May 2016) and Chair and a Non-executive Director of Virgin Australia Holdings Limited (to May 2015).
Neil previously served as Executive Director and the CFO of Toll Holdings (from 1997 to 2008).
As at the date of this report, Neil holds interests in 62,328 stapled securities.
Robert Edgar BEc (Hons), PhD, FAICD
Independent Non-executive Director Director since 21 July 2009. Chair of the Remuneration and Human Resources Committee and a member of the Audit and Risk Committee and the Nomination Committee.
Bob has over 30 years’ experience as a senior executive, with 25 years at ANZ Banking Group in various senior roles, including Deputy CEO, Senior Managing Director, COO, and Chief Economist.
Bob is currently a Non-executive Director of Djerriwarrh Investments Limited and Linfox Armaguard Pty Limited. He is Chair of the Hudson Institute of Medical Research. Bob was previously Chair and a Non-executive Director of Federation Centres (to June 2015), and a Non-executive Director of Asciano Limited (to August 2016).
As at the date of this report, Bob holds interests in 32,009 stapled securities.
TUIR026_Annual_Report_2017_inner_spreads_art02_sp.indd 19 23/8/17 10:30

2017 Transurban Annual Report20
20
Directors (continued)
Samantha Mostyn BA, LLB Independent Non-executive Director Director since 8 December 2010. Member of the Remuneration and Human Resources Committee and the Nomination Committee.
Sam has significant experience in the Australian corporate sector both in Executive and Non-executive capacities, in particular in the areas of human resources, corporate and government affairs, sustainability management and diversity.
Sam is currently Chair and a Non-executive Director of Citigroup Pty Limited and a Non-executive Director of Virgin Australia Holdings Limited, and the Mirvac Group. She is also a Director of the Sydney Swans Football Club, President of the Australian Council for International Development and Chair of Carriageworks. She was previously a Non-executive Director of Cover-More Group Limited (to April 2017).
Sam is currently Deputy Chair of the Diversity Council of Australia, and is a member of the NSW Climate Change Council, the advisory boards of ClimateWorks Australia, the Crawford School of Government and Economics, Australian National University and Commissioner of the Business and Sustainable Development Commission.
As at the date of this report, Sam holds interests in 18,215 stapled securities.
Christine O'Reilly BBus Independent Non-executive Director Director since 12 April 2012. Member of the Audit and Risk Committee and the Nomination Committee.
Christine has over 30 years’ experience in the finance and infrastructure sectors in various roles including as Co-Head of Unlisted Infrastructure at Colonial First State Global Asset Management and as CEO of the GasNet Australia Group.
Christine is currently a Non-executive Director of CSL Limited, Energy Australia Holdings Pty Limited, and Medibank Private Limited. She is also a Non-executive Director of Baker Heart and Diabetes Institute.
As at the date of this report, Christine holds interests in 20,406 stapled securities.
TUIR026_Annual_Report_2017_inner_spreads_art02_sp.indd 20 23/8/17 10:30

212017 Transurban Annual Report
21
Directors (continued)
Rodney Slater J.D., BS Independent Non-executive Director Director since 22 June 2009. Member of the Nomination Committee.
Rodney is a partner in the Government Relations and Lobbying, Transportation, Infrastructure and Local Government, and Construction Project groups of Washington, DC firm Squire Patton Boggs where he has been a leader of its transportation practice since 2001. He previously served as US Secretary of Transportation (from 1997 to 2001) and was the Administrator of the Federal Highway Administration (1993 to 1996).
In the USA, Rodney’s current directorships include Kansas City Southern (Railroads), Verizon Communications Inc. and Southern Development Bancorporation. He was previously a Director of Parsons Brinckerhoff, Delta Airlines, Northwest Airlines, WS Atkins plc and ICx Technologies Inc. Rodney is a Director of the Congressional Awards Foundation and United Way Worldwide.
As at the date of this report, Rodney holds interest in 3,000 stapled securities.
Peter Scott BE (Hons), M.Eng.Sc, Hon FIEAust, MICE Independent Non-executive Director Director since 1 March 2016. Member of the Audit and Risk Committee and the Nomination Committee.
Peter has over 20 years’ senior business experience in publicly listed companies and considerable breadth of expertise in the engineering and finance sectors. He was formally the CEO of MLC and Head of National Australia Bank’s Wealth Management Division, and held a number of senior positions with Lend Lease.
His pro-bono activities include being Chair of Igniting Change Limited, a not-for-profit organisation, a member of the Prime Minister’s Community Business Partnership, and a Fellow of the Senate of the University of Sydney. He was previously Chair and a Non-executive Director of Perpetual Equity Investment Company Limited (to June 2017) and Perpetual Limited (to May 2017) and a Non-executive Director of Stockland Corporation Limited (to August 2016).
As at the date of this report, Peter holds interests in 20,870 stapled securities.
TUIR026_Annual_Report_2017_inner_spreads_art02_sp.indd 21 23/8/17 10:30

2017 Transurban Annual Report22
22
Directors (continued)
Jane Wilson MBBS, MBA, FAICD Independent Non-executive Director Director since 1 January 2017.
Member of the Remuneration and Human Resources Committee and the Nomination Committee.
Jane has over 20 years’ experience as a Director of companies, Government-owned corporations and not-for-profit organisations. She has considerable experience in finance, banking and medicine.
Jane is a Guardian of the Future Fund, Australia’s Sovereign Wealth Fund, and a Non-executive Director of Sonic Healthcare Limited. She is also a Non-executive Director of Opal Aged Care Limited and the General Sir John Monash Foundation. She was previously Deputy Chancellor of the University of Queensland and a Director of the Winston Churchill Memorial Trust.
Jane was awarded the 2016 Australian Institute of Company Directors Queensland Gold Medal Award for contribution to business and the wider community.
As at the date of this report, Jane holds interests in 4,000 stapled securities.
TUIR026_Annual_Report_2017_inner_spreads_art02_sp.indd 22 23/8/17 10:30

232017 Transurban Annual Report
23
2017 Remuneration report (audited)
Introduction The Transurban Board is pleased to present the Remuneration Report (‘Report’) for the Transurban Group (‘Transurban’ or the ‘Group’) for the year ended 30 June 2017 (‘FY17’), prepared in accordance with the Corporations Act 2001 (Cth) and the Corporations Regulations 2001 (Cth). This Report contains detailed information regarding the remuneration arrangements for the Directors and senior executives who were key management personnel (‘KMP’) of the Group during FY17.
Key Management Personnel The following table lists the Group’s KMP during FY17.
Non-executive Directors
Lindsay Maxsted, Chair Neil Chatfield Robert Edgar Samantha Mostyn Christine O'Reilly Peter Scott Rodney Slater Jane Wilson (from 1 January 2017)
Current senior executives
Scott Charlton, Executive Director and Chief Executive Officer (‘CEO’)
Tony Adams, Group General Manager, Project Delivery and Operational Excellence
Jennifer Aument, Group General Manager, North America
Wesley Ballantine, Group General Manager, Queensland
Andrew Head, Group General Manager, New South Wales
Michele Huey, Group General Manager, Strategy
Sue Johnson, Group General Manager, Customer Operations and Human Resources
Lisa Tobin, Group General Manager, Technology
Vin Vassallo, Group General Manager, Victoria
Adam Watson, Chief Financial Officer
Contents
Section Page 1. Remuneration snapshot 24 2. Changes to KMP 24 3. Remuneration governance 25 4. Senior executive remuneration policy and structure 26 5. Group performance, security holder wealth and remuneration 32 6. Senior executive remuneration outcomes for FY17 33 7. Service agreements 36 8. Non-executive Director remuneration 36 9. Statutory tables 38
TUIR026_Annual_Report_2017_inner_spreads_art02_sp.indd 23 23/8/17 10:30

2017 Transurban Annual Report24
24
Remuneration report (continued)
1. Remuneration snapshot The Board is committed to an executive remuneration framework that is focused on driving a performance culture and linking pay to the achievement of the Group’s strategy and business objectives that in turn drive long-term security holder value.
Transurban’s remuneration framework is reviewed annually taking into consideration security holder and other stakeholder feedback, market expectations and regulatory developments.
At the 2016 Annual General meeting (‘AGM’), the remuneration framework received strong support from security holders, with a 97.14% vote in favour of the resolution to adopt the 2016 Remuneration Report (2015: 99.52%).
The Board considers that the current remuneration framework offers a range of mechanisms to balance sensible risk management and motivate executives to deliver outstanding results.
Transurban’s core strategy is to partner with Governments to provide effective and innovative urban road infrastructure. Consistent with this strategy, the Group has significantly expanded its portfolio with acquisitions and development projects in Australia and the USA, leveraging its urban networks and partnering with Governments to develop transport solutions in our core markets of the east coast of Australia and North America. These activities have helped deliver against the Group’s stated objective of growing distributions for security holders.
The remuneration outcomes this year reflect Transurban’s strong financial results and achievements across the Group’s operational and development activities. These results are outlined in more detail in the Operating and Financial Review within the Directors’ Report.
Key measures of the results achieved in FY17 included:
§ 10.1% increase in underlying proportional EBITDA;
§ 27.4% increase in free cash flow per security; and
§ 13.2% increase in distributions paid to security holders.
These results have been achieved during a period of significant development activity for the business, reflected in the substantial development pipeline which includes major enhancement projects across all markets. This contributed to an 11.1% increase in proportional net costs (excluding significant items) to support strategic growth and development projects and underlying business activity.
The Board and the Remuneration and Human Resources Committee believe that the remuneration outcomes reflect alignment between rewarding senior executive efforts in meeting or exceeding key targets and recognising security holder outcomes.
2. Changes to KMP On 1 July 2017, Henry Byrne was appointed to the newly created role of Group General Manager, Corporate Affairs. Henry has been an employee of the Group since September 2007, with his most recent role being General Manager Investor Relations and Corporate Affairs. Henry’s remuneration package will be included in the 2018 Report.
Also effective 1 July 2017 were three temporary changes to the responsibilities of KMP as detailed below. It is expected that these new roles will remain in effect until 30 June 2018. Remuneration packages will be included in the 2018 Report.
Group General Manager, NSW – Development Andrew Head (formerly Group General Manager, NSW) has been seconded to the role of Group General Manager, NSW – Development. This role is focused on potential development opportunities within the New South Wales market.
Group General Manager, NSW Business Operations Michele Huey (formerly Group General Manager, Strategy) has been seconded to the role of Group General Manager, NSW Business Operations to manage the operations within the New South Wales business.
Group General Manager, Queensland and Group Strategy Wes Ballantine (formerly Group General Manager, Queensland) has been seconded to the role of Group General Manager, Queensland and Group Strategy. Wes’ former role has been expanded to incorporate the leadership of the Group’s Strategy function.
TUIR026_Annual_Report_2017_inner_spreads_art02_sp.indd 24 23/8/17 10:30

252017 Transurban Annual Report
25
Remuneration report (continued)
3. Remuneration governance
A. Board and Remuneration and Human Resources Committee responsibilities The Remuneration and Human Resources Committee assists the Board in fulfilling its responsibilities relating to the remuneration of Non-executive Directors, the remuneration of, and incentives for, the CEO and other senior executives, remuneration budgets for all employees and remuneration practices, strategies and disclosures generally.
It is critical that the Remuneration and Human Resources Committee is independent of management when making decisions affecting employee remuneration. Accordingly, the Committee comprises Non-executive Directors, all of whom are independent. Where appropriate, the CEO and the Group General Manager, Customer Operations and Human Resources attend Committee meetings, however they do not participate in formal decision making.
The members of the Committee are Robert Edgar (Chair), Samantha Mostyn, Neil Chatfield, and Jane Wilson (from 23 May 2017). Further details regarding the Committee are set out in the Directors’ Report.
B. Use of remuneration consultants The Remuneration and Human Resources Committee may seek and consider advice from independent remuneration consultants where appropriate. Any advice from consultants is used to guide the Committee and the Board, but does not serve as a substitute for thorough consideration by Non-executive Directors.
The Group has a protocol in place governing the appointment of remuneration consultants and the manner in which any recommendations made by those consultants concerning the remuneration of KMP are to be provided to the Group, and in particular, the circumstances in which management may be given access to those recommendations. The purpose of the protocol is to ensure that any remuneration recommendations provided by consultants are provided without undue influence by KMP.
During FY17, consultants did not provide the Remuneration and Human Resources Committee with remuneration recommendations relating to KMP. Benchmark data only was provided to the Committee.
C. Dealing in securities In accordance with the Group’s Dealing in Securities Policy, employees who have awards under a Group equity plan may not hedge against those awards. In addition, senior executives may not hedge against entitlements that have vested but remain subject to a holding lock. Directors and employees are also prohibited from entering into margin lending arrangements using Transurban stapled securities as security.
D. Minimum security holding The Board has endorsed minimum security holding guidelines for Non-executive Directors, the CEO and other senior executives. The guidelines recommend that all participants build and maintain a minimum security holding of Transurban stapled securities equal in value to their fixed annual remuneration (excluding superannuation). The minimum stapled security holding can be accumulated over a five year period.
TUIR026_Annual_Report_2017_inner_spreads_art02_sp.indd 25 23/8/17 10:30
2017 Transurban Annual Report26
26
45%
15%
15%
25%
Senior executive target remuneration mix
Fixed annual remuneration
Variable STI - cash
Variable STI - deferred
Variable LTI
Remuneration report (continued)
4. Senior executive remuneration policy and structure The Group’s executive remuneration strategy is designed to attract, retain and motivate a highly qualified and experienced management team with the necessary skills and attributes to lead the Group in achieving its business objectives. The strategy also aims to encourage management to strive for superior performance by rewarding the achievement of targets that are challenging, clearly understood, and within the control of individuals to achieve through their own success.
A. Remuneration framework The Group’s remuneration framework provides a combination of incentives intended to drive performance against the Group’s short and longer term objectives. The framework for the CEO and other senior executives comprises three components:
§ Total Employment Cost (‘TEC’): fixed remuneration component comprising salary, superannuation and other prescribed benefits;
§ Short Term Incentive (‘STI’): an ‘at risk’ component, awarded on performance over a 12 month period against pre-determined individual and Group performance measures that comprises both a cash component and a component deferred into equity; and
§ Long Term Incentive (‘LTI'): an ‘at risk’ equity component, awarded on the achievement of pre-determined internal and external performance measures over a three year period.
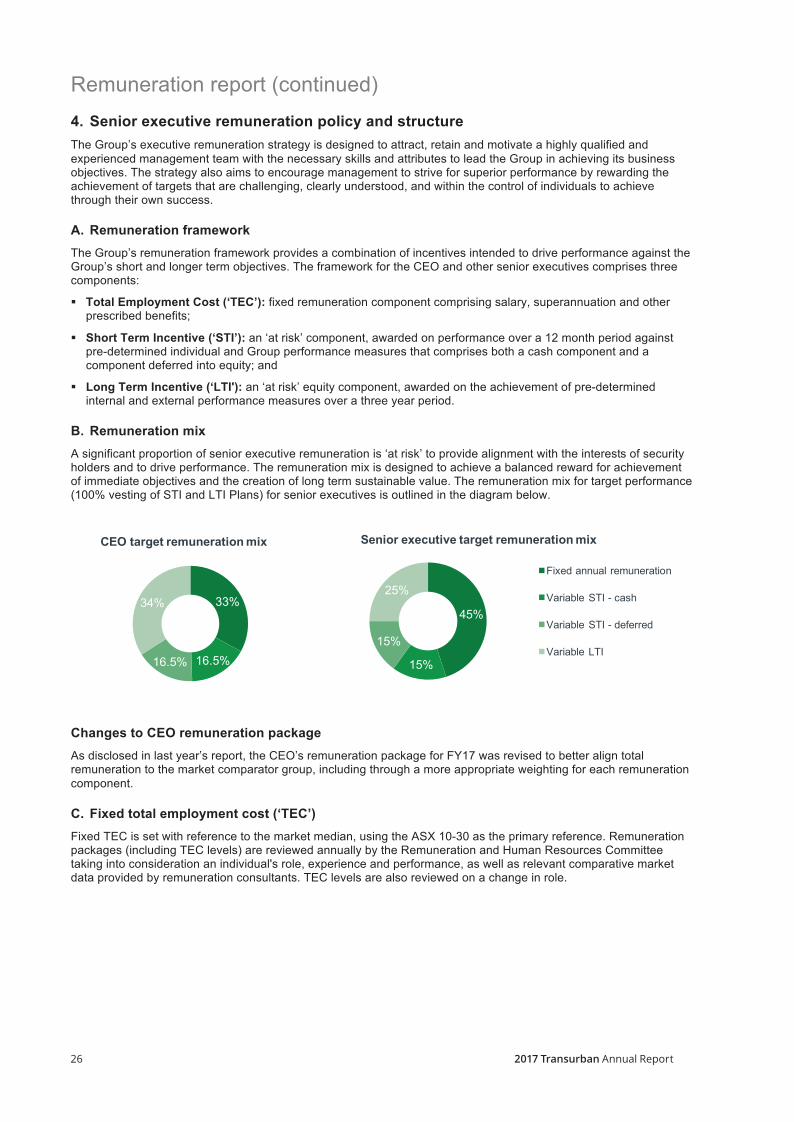
B. Remuneration mix A significant proportion of senior executive remuneration is ‘at risk’ to provide alignment with the interests of security holders and to drive performance. The remuneration mix is designed to achieve a balanced reward for achievement of immediate objectives and the creation of long term sustainable value. The remuneration mix for target performance (100% vesting of STI and LTI Plans) for senior executives is outlined in the diagram below.
Changes to CEO remuneration package As disclosed in last year’s report, the CEO’s remuneration package for FY17 was revised to better align total remuneration to the market comparator group, including through a more appropriate weighting for each remuneration component.
C. Fixed total employment cost (‘TEC’) Fixed TEC is set with reference to the market median, using the ASX 10-30 as the primary reference. Remuneration packages (including TEC levels) are reviewed annually by the Remuneration and Human Resources Committee taking into consideration an individual's role, experience and performance, as well as relevant comparative market data provided by remuneration consultants. TEC levels are also reviewed on a change in role.
33%
16.5%16.5%
34%
CEO target remuneration mix
26
45%
15%
15%
25%
Senior executive target remuneration mix
Fixed annual remuneration
Variable STI - cash
Variable STI - deferred
Variable LTI
Remuneration report (continued)
4. Senior executive remuneration policy and structure The Group’s executive remuneration strategy is designed to attract, retain and motivate a highly qualified and experienced management team with the necessary skills and attributes to lead the Group in achieving its business objectives. The strategy also aims to encourage management to strive for superior performance by rewarding the achievement of targets that are challenging, clearly understood, and within the control of individuals to achieve through their own success.
A. Remuneration framework The Group’s remuneration framework provides a combination of incentives intended to drive performance against the Group’s short and longer term objectives. The framework for the CEO and other senior executives comprises three components:
§ Total Employment Cost (‘TEC’): fixed remuneration component comprising salary, superannuation and other prescribed benefits;
§ Short Term Incentive (‘STI’): an ‘at risk’ component, awarded on performance over a 12 month period against pre-determined individual and Group performance measures that comprises both a cash component and a component deferred into equity; and
§ Long Term Incentive (‘LTI'): an ‘at risk’ equity component, awarded on the achievement of pre-determined internal and external performance measures over a three year period.
B. Remuneration mix A significant proportion of senior executive remuneration is ‘at risk’ to provide alignment with the interests of security holders and to drive performance. The remuneration mix is designed to achieve a balanced reward for achievement of immediate objectives and the creation of long term sustainable value. The remuneration mix for target performance (100% vesting of STI and LTI Plans) for senior executives is outlined in the diagram below.
Changes to CEO remuneration package As disclosed in last year’s report, the CEO’s remuneration package for FY17 was revised to better align total remuneration to the market comparator group, including through a more appropriate weighting for each remuneration component.
C. Fixed total employment cost (‘TEC’) Fixed TEC is set with reference to the market median, using the ASX 10-30 as the primary reference. Remuneration packages (including TEC levels) are reviewed annually by the Remuneration and Human Resources Committee taking into consideration an individual's role, experience and performance, as well as relevant comparative market data provided by remuneration consultants. TEC levels are also reviewed on a change in role.
33%
16.5%16.5%
34%
CEO target remuneration mix
TUIR026_Annual_Report_2017_inner_spreads_art02_sp.indd 26 23/8/17 10:30
272017 Transurban Annual Report
27
Remuneration report (continued)
D. Short term incentive (‘STI’)
Description Eligible permanent Group employees, including the CEO and other senior executives, participate in the annual STI plan, which puts a proportion of remuneration 'at risk' subject to meeting specific pre-determined Group and individual performance measures linked to Group objectives.
Performance Period
The performance period is the financial year preceding the payment date (i.e. 1 July 2016 – 30 June 2017).
Opportunity For ‘at-target’ performance, the CEO has the opportunity to receive 100% of TEC and all other senior executives have the opportunity to receive 67% of TEC. The minimum STI an individual can receive is 0% (if targets are not met) and the maximum is 150% of the STI opportunity, which is only awarded for exceptional performance.
Payment and deferral
The awarded STI for the CEO and other senior executives is settled 50% in cash and 50% is deferred. For Australian employees, the deferred component is Transurban stapled securities, which are held on trust for two years following the performance period and are restricted from trading until vesting. USA employees were awarded deferred cash awards in FY17 and in prior years. Commencing 1 July 2017, STI deferred components awarded to USA employees will also be deferred into Transurban stapled securities with the same trading restrictions as Australian employees. The deferred securities and deferred cash awards participate in dividends and/or distributions paid.
The number of securities or awards is determined by dividing the amount to be deferred by a 20 day Volume Weighted Average Price (VWAP) of securities up to and including the last business day of the performance period.
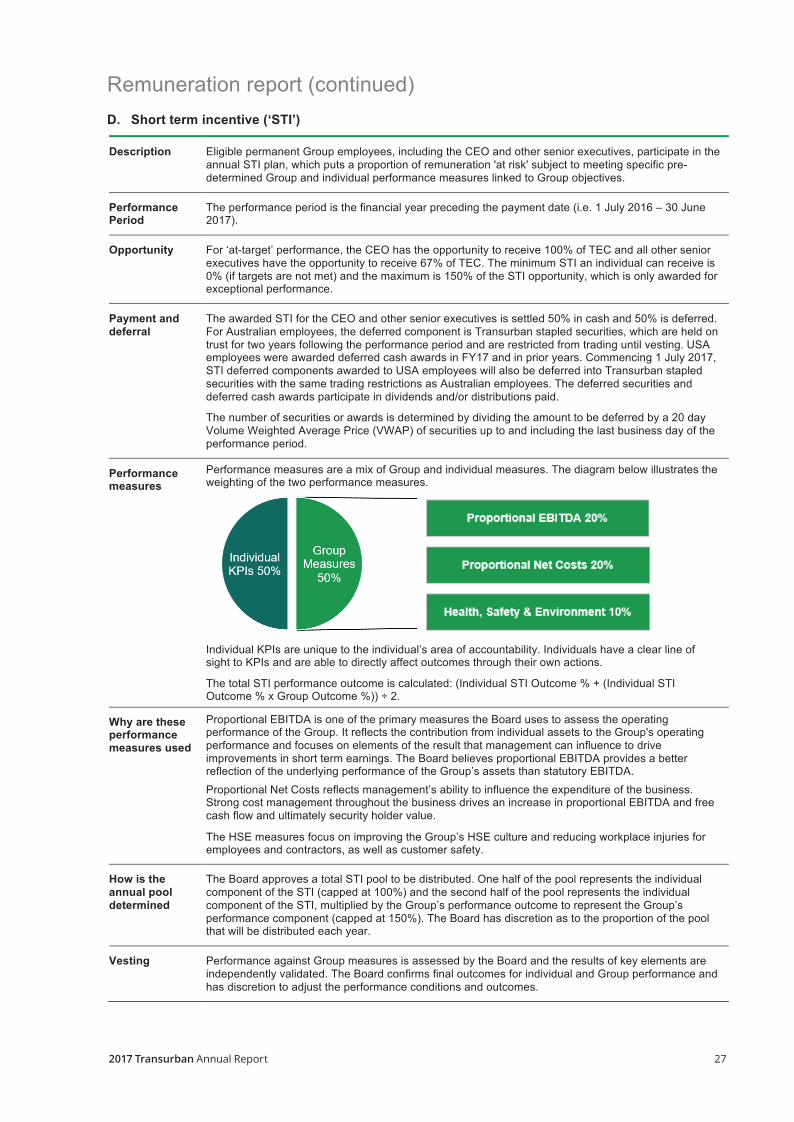
Performance measures
Performance measures are a mix of Group and individual measures. The diagram below illustrates the weighting of the two performance measures.
Individual KPIs are unique to the individual’s area of accountability. Individuals have a clear line of sight to KPIs and are able to directly affect outcomes through their own actions.
The total STI performance outcome is calculated: (Individual STI Outcome % + (Individual STI Outcome % x Group Outcome %)) ÷ 2.
Why are these performance measures used
Proportional EBITDA is one of the primary measures the Board uses to assess the operating performance of the Group. It reflects the contribution from individual assets to the Group's operating performance and focuses on elements of the result that management can influence to drive improvements in short term earnings. The Board believes proportional EBITDA provides a better reflection of the underlying performance of the Group’s assets than statutory EBITDA. Proportional Net Costs reflects management’s ability to influence the expenditure of the business. Strong cost management throughout the business drives an increase in proportional EBITDA and free cash flow and ultimately security holder value.
The HSE measures focus on improving the Group’s HSE culture and reducing workplace injuries for employees and contractors, as well as customer safety.
How is the annual pool determined
The Board approves a total STI pool to be distributed. One half of the pool represents the individual component of the STI (capped at 100%) and the second half of the pool represents the individual component of the STI, multiplied by the Group’s performance outcome to represent the Group’s performance component (capped at 150%). The Board has discretion as to the proportion of the pool that will be distributed each year.
Vesting Performance against Group measures is assessed by the Board and the results of key elements are independently validated. The Board confirms final outcomes for individual and Group performance and has discretion to adjust the performance conditions and outcomes.
TUIR026_Annual_Report_2017_inner_spreads_art02_sp.indd 27 23/8/17 10:30

2017 Transurban Annual Report28
28
Remuneration report (continued)
Payment of STI The payment of the cash component and the allocation of deferred securities will occur in August 2017 following finalisation and approval of the Group’s audited results and the Board’s approval of individual outcomes.
Cessation of employment
If employment ceases before performance is assessed, generally there is no entitlement to receive any STI award. Any unvested deferred securities will lapse, unless the plan rules provide otherwise or the Board otherwise resolves.
Clawback Fraudulent or dishonest behaviour will result in the forfeiture or clawback of any unvested awards. Further, at the discretion of the Board, awards are subject to forfeiture or clawback where there is a financial misstatement circumstance or the allocation of awards was made in error, on the basis of the misrepresentation or an omission, or on the basis of facts or circumstances that were later proven to be untrue or inaccurate.
STI Group performance measures in detail Group Measure
Weighting Description of Measure
Proportional EBITDA (EBITDA: earnings before interest, taxes, depreciation and amortisation)
20%
Targets: the target for 100% vesting for FY17 was $1,605 million with straight line vesting between the minimum target of 50% vesting of $1,573 million and 150% vesting of $1,637 million. To determine the targets for the Proportional EBITDA measure of the STI program, the Board utilises the annual budget as the primary input. The budget incorporates base business growth derived from network-wide traffic performance, price growth and impacts of inflation and adjusts for events such as: construction and project completion and the impact of acquisitions. When approving the budget, the Board ensures that sufficient stretch is incorporated. This is achieved through the analysis of the core assumptions underpinning the budget and also through consideration of the quantifiable risks and opportunities that can influence the Group’s financial performance. The budget incorporates directly controllable initiatives including road safety, lane availability, operational efficiencies and the impact of development activity. Once the budget has been finalised, the Board determines the STI targets. The FY17 STI targets excluded Transurban Queensland integration costs and a budget for discretionary research and development initiatives. The targets use a constant currency for operations within the USA1. Definition: Proportional EBITDA is the aggregation of EBITDA from each asset multiplied by the Group's percentage ownership, as well as any contribution from Group functions. Proportional EBITDA figures used to assess performance are included in note B4 of the audited financial statements.
Proportional Net Costs
20% Targets: the target for 100% vesting for FY17 was $375 million with straight line vesting between the minimum target of 50% vesting of $394 million and 150% vesting of $356 million. To determine the targets for the Proportional Net Cost measure of the STI program, the Board utilises the annual budget as the primary input. When approving the budget, the Board ensures that sufficient stretch is incorporated. This is achieved through the analysis of the core assumptions underpinning the budget and also through consideration of the quantifiable risks and opportunities that can influence the Group’s financial performance. Once the budget has been finalised, the Board determines the STI targets. The FY17 STI targets excluded Transurban Queensland integration costs and a budget for discretionary research and development initiatives. The targets use a constant currency for operations within the USA1. Definition: Proportional Net Costs are calculated as total costs less fee and other revenues. This measure encourages and allows management to incur additional costs where these are justified by increased revenue results.
1. Calculated by translating the monthly budgeted results for the USA business (Greater Washington Area) at the monthly spot rate used to translate the reported monthly results.
TUIR026_Annual_Report_2017_inner_spreads_art02_sp.indd 28 23/8/17 10:30

292017 Transurban Annual Report
29
Remuneration report (continued)
Health, Safety and Environment (‘HSE’)
10% The HSE KPI target was a combination of a lead indicator (leaders recording proactive HSE events) and four lag indicators. The diagram below illustrates the performance measures within the lag indicators. Targets were set with straight line vesting between 0% and 150%.
Targets: the targets for the lag indicators for 100% vesting for FY17 were as follows: § Recordable Injury Frequency Rate – zero for employees and 6.38 for contractors
(10% reduction on FY16 outcome); § Road Injury Crash Index – 4.16 (9% reduction over three years commencing FY14
outcome); § Road Safety Action Plans – All four Regional Road Safety Actions Plans in place and
actions tracking to target; and § Incident close out rate – All incidents with an actual consequence rating of
moderate and above, all near misses with a potential consequence rating of moderate and above and all recordable incidents where Transurban has control. Incidents are to be investigated and investigations closed out within three days of investigation due date. The FY17 target was 75% of incidents closed within three days of investigation due date.
Individual KPIs 50% Individual KPIs related to critical business measures and are not disclosed due to the commercially sensitive nature of these targets.
E. Long term incentive (‘LTI’)
Description Participation in the LTI plan is offered to the CEO and other senior executives, and a very limited number of other employees nominated by the CEO and approved by the Board.
Grants are made in the form of performance awards at no cost to the recipient. Each performance award is an entitlement to receive a Transurban stapled security, or an equivalent cash payment, on terms and conditions determined by the Board, subject to the achievement of vesting conditions.
Performance Period
The three financial years commencing on 1 July in the year the grant is made.
Opportunity The CEO’s opportunity is 103% of TEC and the opportunity for all other senior executives is 56% of TEC. Upon vesting of a LTI plan, the minimum vesting outcome an individual can receive is 0% of the awards due to vest (if the performance measures are not achieved) and the maximum vesting outcome an individual can receive is 100% of the awards due to vest.
Performance measures
Two performance measures are used to determine the number of awards that will vest at the end of the performance period; relative Total Shareholder Return (‘TSR’) against a bespoke comparator group and Free Cash Flow (‘FCF’) (each with a 50% weighting).
Why are these performance measures used
TSR is a relative, external, market-based performance measure against those companies with which the Group competes for capital. It provides a direct link between executive reward and security holder return. TSR measures total return on investment of a security, taking into account both capital appreciation and distributed and/or dividend income which was reinvested on a pre-tax basis.
Growth in FCF per security reflects the Group’s continued focus on the maximisation of free cash. The Group seeks to consistently grow its distributions year on year and to align security holder distributions with FCF per security.
TUIR026_Annual_Report_2017_inner_spreads_art02_sp.indd 29 23/8/17 10:30

2017 Transurban Annual Report30
30
Remuneration report (continued)
Allocation TSR component: An independently determined fair value allocation valuation is applied to this component of the LTI.
FCF component: An independently determined face value allocation valuation (discounted for distributions and/or dividends foregone throughout the performance period) is applied to this component of the LTI.
The Board regularly considers the most appropriate measures for the Group and believes that fair value is the correct measure for the TSR component of the LTI awards as it is a market based measure and the inclusion of market forces within the calculation is appropriate. Whereas the non-market based performance measure of FCF is more suited to a face value valuation when allocating LTI awards.
Vesting TSR component
The Group uses an independent report that sets out the Group's TSR growth and that of each company in the bespoke comparator group. A VWAP of securities for the 20 trading days up to and including the testing date is used to calculate TSR.
The level of TSR growth achieved by the Group is given a percentile ranking having regard to the Group’s performance compared to the performance of other companies in the comparator group (the highest ranking company is ranked at the 100th percentile). This ranking determines the extent to which performance awards, subject to this target, vest.
FCF component
The Group's FCF per security percentage growth rate is calculated based on the FCF per security over the three year performance period.
The Board determines in its absolute discretion whether the performance awards are settled in Transurban stapled securities or a cash payment of equivalent value. In FY17 and prior years, USA employees have received cash payments upon vesting. Commencing 1 July 2017, all LTI plan offers made to USA employees will be under the same conditions as Australian employees in that the Board in its absolute discretion will determine whether awards are settled in Transurban stapled securities or in cash.
Following testing, any awards that do not vest, lapse and any awards that vest are automatically exercised.
Cessation of employment
If employment ceases before the performance measures are tested, generally there is no entitlement to unvested performance awards. Any unvested awards will lapse, unless the plan rules provide otherwise or the Board otherwise resolves.
Clawback Fraudulent or dishonest behaviour will result in the forfeiture or clawback of any unvested awards. Further, at the discretion of the Board, awards are subject to forfeiture or clawback where there is a financial misstatement circumstance or the allocation of awards was made in error, on the basis of the misrepresentation or an omission, or on the basis of facts or circumstances that were later proven to be untrue or inaccurate.
TUIR026_Annual_Report_2017_inner_spreads_art02_sp.indd 30 23/8/17 10:30

312017 Transurban Annual Report
31
Remuneration report (continued)
LTI performance measures in detail
Group Measure Weighting Description of measure
Relative TSR
50% Relative TSR is measured against a bespoke comparator group comprising companies in the transport, utilities, real estate, construction and infrastructure Global industry classification standards (‘GICS’) sectors of the ASX150. The 33 companies in this group for grants made during FY17 were:
Abacus Property Group, AGL Energy Limited, APA Group, Aurizon Holdings Limited, Ausnet Services Limited, Aveo Group, BWP Trust, Charter Hall Group, Charter Hall Retail REIT Unit, Cromwell Property Group, Dexus Property Group, DUET Group, Goodman Group, GPT Group, Growthpoint Properties Australia, Investa Office Fund, Lend Lease Group, Macquarie Atlas Roads Group, Mirvac Group, Qantas Airways Limited, Qube Holdings Limited, Scentre Group, Shopping Centres Australasia Property Group, Spark Infrastructure Group, Spark New Zealand Limited, Stockland, Sydney Airport, Telstra Corporation Limited, TPG Telecom Limited, Transurban Group, Vicinity Centres, Vocus Communications Limited, Westfield Corporation.
The table below shows the differences between the FY17 TSR comparator group and the TSR comparator group for the prior year. Companies new to the group in FY17 Companies excluded in FY17 Vicinity Centres (previously known as Federation Centres), Vocus Communications Limited (previously ranked outside the ASX150).
Asciano (delisted), CIMIC (Board approved exclusion), iiNET Limited (delisted), Federation Centres (now known as Vicinity Centres), M2 Group (delisted).
The TSR component of performance awards granted during FY17, will vest on a straight line basis in accordance with the following table:
The Group’s relative TSR ranking in the comparator group % of performance awards that vest
At or below the 50th percentile Zero Above the 50th percentile but below the 75th percentile Straight line vesting between 50 and 100
At or above the 75th percentile 100
Growth in FCF per security
50% The FCF calculation is included in note B10 of the audited financial statements. The FCF per security component of performance awards granted during FY17 will vest based on the Group’s compound annual growth targets translated into annual FCF per security over the three year performance period, as set out below:
% annual growth in FCF per security (Distribution base of 45.5 cents per security)
% of performance awards that vest Less than 9% Zero Between 9% and 12% Straight line vesting between 50 and 100 12% or more 100
The Group seeks to consistently grow its distributions year on year and to align distributions with FCF per security. The FCF per security may not grow each year in line with distributions. Factors that may cause FCF to fluctuate year on year may include the timing of interest payments, movements in working capital, the impact of major development projects and capital management initiatives. Due to possible fluctuations in FCF, the extent to which distributions are covered by cash may also fluctuate between 90-110% in any given year. This is consistent with the Group’s distribution policy of achieving approximately 100% free cash coverage over time. Due to possible fluctuations in FCF, distributions are considered the best point of alignment with security holder expectations for growth in investor returns. In delivering against this measure, the Board also balances the objective of growing distributions with longer dated investments that generate value for the business but may not contribute to distribution growth in the near term. The Group has a number of major projects in development through this period, including the CityLink-Tulla-Widening in Melbourne, NorthConnex in Sydney, the Logan Enhancement Project in Brisbane as well as other potential developments on each of our networks. The Board takes this into account when setting the range to ensure appropriately challenging measures.
For performance awards granted during FY18, the performance target range for growth in FCF per security is between 8% and 10% per annum. This is calculated using the FY17 distribution of 51.5 cents per security as the base and excludes any impact on FCF per security that arises as a result of funding activity that may arise to support the execution or delivery of potential major developments.
TUIR026_Annual_Report_2017_inner_spreads_art02_sp.indd 31 23/8/17 10:30

2017 Transurban Annual Report32
32
Remuneration report (continued)
5. Group performance, security holder wealth and remuneration
A. Financial highlights for FY17 The Group’s network portfolio delivered strong EBITDA growth, which was mainly caused by increased traffic across our networks and disciplined cost control. The Group recorded proportional EBITDA excluding significant items of $1,629 million for the financial year ended 30 June 2017, an underlying increase of 10.1% on the prior corresponding period.
B. Overview of Group performance The variable (or 'at risk') remuneration of the CEO and other senior executives is linked to the Group’s performance through the use of measures based on the operating performance of the business. The graphs below show the Group’s performance over the past five years including metrics used to determine components of STI and LTI awards.
Financial measures
828 9341,289
1,480 1,629
0
500
1,000
1,500
2,000
2013 2014 2015 2016 2017
Underlying proportional EBITDA ($ millions)
163 183
270
342380
0
100
200
300
400
2013 2014 2015 2016 2017
Proportional net costs excluding significant items ($ millions)
30.133.9
40.246.8
59.6
253035404550556065
2013 2014 2015 2016 2017
Free cash per Security (cents)
31.035.0
40.0
45.5
51.5
20.0
25.0
30.0
35.0
40.0
45.0
50.0
55.0
2013 2014 2015 2016 2017
Distribution Paid per Security (cents)
6.76 7.399.30
11.99 11.85
02468
101214
2013 2014 2015 2016 2017
Security price at year end ($)
25
17
3235
4
0
10
20
30
40
2013 2014 2015 2016 2017
Total shareholder return performance (%)
TUIR026_Annual_Report_2017_inner_spreads_art02_sp.indd 32 23/8/17 10:30

332017 Transurban Annual Report
33
Remuneration report (continued)
6. Senior executive remuneration outcomes for FY17
A. STI Outcomes for FY17 Group performance in respect of the proportional EBITDA, proportional Net Costs and HSE STI performance measures for FY17 was assessed by the Board as 111.2% of the possible STI opportunity.
Measure Performance Outcome
Proportional EBITDA1 $1,643 million 150.0 % Proportional net costs1 $380 million 87.1 % HSE – 82.1 %
Overall Group Performance – 111.2 %
1. For FY17 Transurban Queensland integration costs and a budget for discretionary research and development initiatives were excluded from the Proportional EBITDA and Proportional net costs targets and actual outcomes.
The Group achieved the following HSE outcomes which are linked to the Group’s STI awards.
Measure Score Outcome % STI Outcome % Leadership KPIs 3.1 81.0 48.6 Recordable Injury Frequency Rate (‘RIFR’)1 – employees 0.9 58.3 4.4 Recordable Injury Frequency Rate (‘RIFR’)1 – contractors 4.8 150.0 11.3 Road Injury Crash Index (‘RICI’)2 4.9 – – Road Safety Action Plans3 4 plans 100.0 7.5 Incident close out rate4 76.6 103.2 10.3 Overall HSE Outcome 82.1 1. RIFR: recordable injuries (fatalities, lost time and medical treatment injuries) per million work hours. 2. RICI: serious road injury (requiring medical treatment or where emergency medical care is required, other than first aid) crashes per 100 million
vehicle kilometres travelled. 3. Road Safety Plan actions implemented and actions tracking to target. 4. Percentage of incidents closed within three days of agreed investigation due date.
The individual STI performance outcomes and awards for the CEO and senior executives for FY17 are detailed in the following table:
1. Jennifer Aument is remunerated in USA Dollars. Her awarded STI has been translated to Australian Dollars using the exchange rate at 30 June 2017.
2. The total STI performance outcome is calculated: (Individual STI Outcome % + (Individual STI Outcome % x Group Outcome %)) ÷ 2. The Group’s percentage outcome is 111.2%. No STI was forfeited due to performance, however, due to a contractor fatality on the NorthConnex project during FY17, senior executives have forfeited their STI entitlement associated with the RIFR Contractor outcome, resulting in a reduction to the Group result from 111.2% to 109.0% for senior executives.
3. 50% is paid in cash and 50% is deferred for two years following the performance year.
STI outcome (%) STI awarded3 ($)
Current senior executives Individual KPIs Total2
S Charlton 110.0 115.0 2,530,000 T Adams 104.5 109.2 430,300 J Aument1 100.0 104.5 466,784 W Ballantine 115.0 120.2 478,300 A Head 100.0 104.5 473,200 M Huey 104.5 109.2 397,150 S Johnson 115.0 120.2 469,450 L Tobin 120.0 125.4 491,000 V Vassallo 98.5 102.9 434,500 A Watson 100.0 104.5 505,300
TUIR026_Annual_Report_2017_inner_spreads_art02_sp.indd 33 23/8/17 10:30
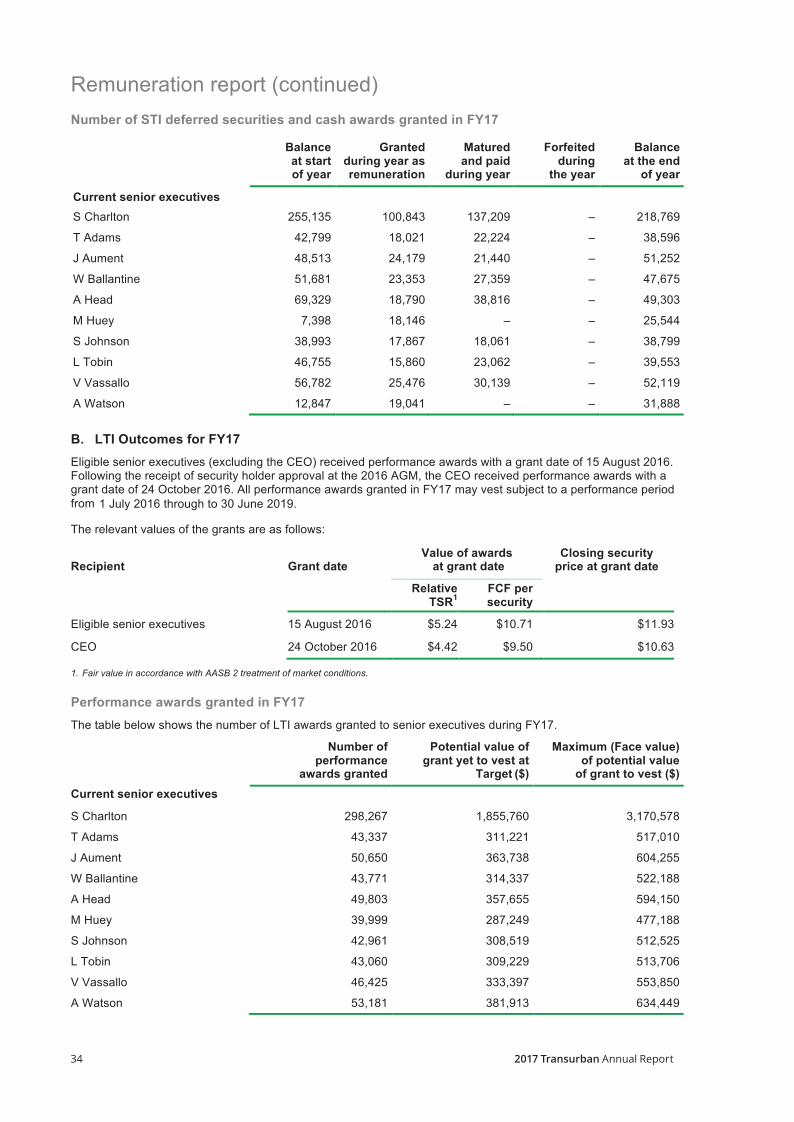
2017 Transurban Annual Report34
34
Remuneration report (continued)
Number of STI deferred securities and cash awards granted in FY17
Balance at start of year
Granted during year as remuneration
Matured and paid
during year
Forfeited during
the year
Balance at the end
of year
Current senior executives S Charlton 255,135 100,843 137,209 – 218,769
T Adams 42,799 18,021 22,224 – 38,596
J Aument 48,513 24,179 21,440 – 51,252
W Ballantine 51,681 23,353 27,359 – 47,675
A Head 69,329 18,790 38,816 – 49,303
M Huey 7,398 18,146 – – 25,544
S Johnson 38,993 17,867 18,061 – 38,799
L Tobin 46,755 15,860 23,062 – 39,553
V Vassallo 56,782 25,476 30,139 – 52,119
A Watson 12,847 19,041 – – 31,888
B. LTI Outcomes for FY17 Eligible senior executives (excluding the CEO) received performance awards with a grant date of 15 August 2016. Following the receipt of security holder approval at the 2016 AGM, the CEO received performance awards with a grant date of 24 October 2016. All performance awards granted in FY17 may vest subject to a performance period from 1 July 2016 through to 30 June 2019.
The relevant values of the grants are as follows:
Recipient Grant date Value of awards
at grant date Closing security
price at grant date
Relative
TSR1 FCF per security
Eligible senior executives 15 August 2016 $5.24 $10.71 $11.93
CEO 24 October 2016 $4.42 $9.50 $10.63
1. Fair value in accordance with AASB 2 treatment of market conditions.
Performance awards granted in FY17 The table below shows the number of LTI awards granted to senior executives during FY17.
Number of
performance awards granted
Potential value of grant yet to vest at
Target ($)
Maximum (Face value) of potential value
of grant to vest ($) ($) Current senior executives
S Charlton 298,267 1,855,760 3,170,578
T Adams 43,337 311,221 517,010
J Aument 50,650 363,738 604,255
W Ballantine 43,771 314,337 522,188
A Head 49,803 357,655 594,150
M Huey 39,999 287,249 477,188
S Johnson 42,961 308,519 512,525
L Tobin 43,060 309,229 513,706
V Vassallo 46,425 333,397 553,850
A Watson 53,181 381,913 634,449
TUIR026_Annual_Report_2017_inner_spreads_art02_sp.indd 34 23/8/17 10:30

352017 Transurban Annual Report
35
Remuneration report (continued)
The target (100%) value of the grant has been estimated based on the award valuations at grant date (a fair value approach for the TSR component and a face value approach discounted for distributions/and or dividends for the FCF component). The fair value for TSR considers the probability that the senior executive may not derive value from the LTI award, along with other factors, including difficulty of achieving performance hurdles and anticipated security price volatility.
The maximum LTI opportunity for each senior executive is the face value of the award (i.e. the value the senior executive would receive if all their performance awards vested, based on Transurban’s security price at the time the award was granted).
The minimum total value of the grant, if the applicable performance measures are not met, is zero.
Value of performance awards vested and lapsed in FY17
The FY14 LTI plan vested on 17 August 2016 (performance period 1 July 2013 to 30 June 2016).
The outcome of the performance tests were as follows:
Test type Result of test % of units vest
TSR Transurban ranked 7th highest out of 35 companies (82.3%) 100%
Free C Free Cash Flow 120.9 cents adjusted to 125.0 cents (Refer to the explanation below) (100% vesting target was 120.2 cents) 100%
Overall vesting 100%
The favourable FCF vesting outcome was influenced by stronger than expected traffic and revenue growth in the GWA region, lower traffic disruption on CityLink from the works associated with the CityLink Tulla Widening project and lower financing costs.
Senior Executive Awards vested Value ($)1
S Charlton 382,292 1,713,466
J Aument2 74,494 334,159
W Ballantine 62,630 280,940
A Head 94,767 425,098
S Johnson 62,630 280,940
L Tobin 79,980 358,768
V Vassallo 79,980 358,768
1. Based on the fair value at date of grant. 2. Jennifer Aument awards are settled in cash.
Free Cash Flow Adjustment
Financial close of the Transurban Queensland (‘TQ’) (formerly, Queensland Motorways) acquisition occurred in July 2015. The associated capital raising (the issue of 404.5 million new securities) occurred in May 2015. The timing of these events (two different financial years) impacted the calculation of the FCF for FY14 and the FCF performance calculation against the FCF targets for the three LTI plans on foot at that time (the FY12, FY13 and FY14 plans).
Consistent with the treatment of the FY12 LTI plan, as disclosed in the FY14 Remuneration Report, the Board exercised its discretion to ensure that participants in the FY14 LTI plan were neither advantaged nor disadvantaged as a result of the TQ acquisition and associated capital raising. The Board exercised its discretion to, in effect; exclude the new securities issued from the number of securities used to calculate the FY14 FCF per security for the purposes of calculating the FCF outcome for the FY14 LTI plan. Interest income on the equity raised prior to financial close was similarly excluded from the calculation. The targets set at the beginning of the performance period (1 July 2012) were not adjusted.
TUIR026_Annual_Report_2017_inner_spreads_art02_sp.indd 35 23/8/17 10:30

2017 Transurban Annual Report36
36
Remuneration report (continued)
Value of performance awards to vest and lapse in FY18 Initial vesting calculations indicate that 100% of awards on issue for the FY15 plan will vest for all remaining participants.
7. Service agreements The remuneration and other terms of employment for the CEO and other senior executives are formalised in service agreements that have no specified term. Under these agreements, the CEO and other senior executives are eligible to participate in STI and LTI plans. Some other key aspects of the agreements in place for FY17 are outlined below:
Period of notice to terminate by the senior executive
Period of notice to terminate by the Group1
CEO 6 months 12 months Other senior executives 3 months 6 months
1. Payment in lieu of the notice period may be provided (based on the executive's fixed remuneration). The Group may also terminate at any time without notice for serious misconduct.
8. Non-executive Director remuneration
A. Remuneration policy The diagram below sets out the key objectives of the Group’s Non-executive Director remuneration policy and how they are achieved through the Group’s remuneration framework:
Securing and retaining talented, qualified Directors
Preserving independence and impartiality
Aligning Director and security holder interests
â â â
Director fee levels are set with regards to: the responsibilities and risks attached to the role, the time commitment and workload expected, the Director’s experience and expertise, and market benchmark data.
Director remuneration consists of base (Director) fees and Committee fees. No element of Director remuneration is 'at risk' (i.e. fees are not based on the performance of the Group or individual Directors from year to year).
Directors are encouraged to hold Transurban securities and the Board has endorsed minimum security holding guidelines for Directors.
B. Remuneration arrangements Maximum aggregate remuneration
The aggregate remuneration that may be paid to Non-executive Directors in any year is capped at a level approved by security holders. At the 2016 AGM security holders approved an increase in the aggregate fee pool to $3,000,000 (inclusive of superannuation contributions), with effect from 13 October 2016. No change to the aggregate fee pool is proposed for FY18.
Non-executive Director fees for FY17
The Remuneration and Human Resources Committee regularly reviews Non-executive Director fees, and such reviews include periodic benchmarking against other publicly listed entities of similar size and complexity to Transurban.
A review of Non-executive Director fees (base Director and Committee fees) was undertaken during FY17. The Remuneration and Human Resources Committee recommended, and the Board subsequently resolved, that Non-executive Director fees remain unchanged for the 2017 calendar year.
TUIR026_Annual_Report_2017_inner_spreads_art02_sp.indd 36 23/8/17 10:30

372017 Transurban Annual Report
37
Remuneration report (continued)
Current Director and Committee fees are set out below:
Board Fees Chair $550,000
Member $185,000
Committee Fees Audit and Risk Committee
Chair $50,000
Member $25,000
Remuneration and Human Resources Committee
Chair $40,000
Member $20,000
Nomination Committee $10,000
The Chair of the Board does not receive any additional fees for Committee responsibilities.
The Chair of each Committee only receives the Chair fee (and not a member fee).
Non-executive Directors are permitted to be paid additional fees for special duties or exertions. No such fees were paid during FY17. Non-executive Directors are also entitled to be reimbursed for all business related expenses, including travel, as may be incurred in the discharge of their duties.
Non-executive Directors are not entitled to any retirement benefits.
C. Non-executive Director related party information All Non-executive Director related party relationships are based on normal commercial terms. None of the Non-executive Directors were, or are, involved in any procurement or other Board decision-making regarding the companies or firms with which they have an association.
The Group is not required to make the following disclosures but for transparency reasons notes the following relationships and transactions:
Director Related party Services provided
R Slater Mr Slater is a partner in the public policy practice group of Squire Patton Boggs (US) LLP (SPB).
Transurban used SPB during FY17 for various lobbying activities in the USA, and incurred US$289,296 for services during FY17.
L Maxsted Mr Maxsted is Chair and a Non-executive Director of Westpac Banking Corporation.
Westpac provides a number of banking products and services to Transurban. Westpac also participated in two financing arrangements conducted by Transurban during FY17 and acted as a Joint Lead Arranger on two others.
N Chatfield Mr Chatfield is Chairman and a Non-executive Director of Seek Limited. Mr Chatfield is a Non-executive Director of Iron Mountain Inc.
Seek provides employment advisory services to Transurban. Iron Mountain provides data protection services to Transurban.
S Mostyn Ms Mostyn is a Non-executive Director of Citigroup Pty Ltd. Ms Mostyn is a Non-executive Director of Virgin Australia Holdings Limited.
Citigroup provides banking products and services to Transurban. Citigroup also acted as a Joint Lead Arranger and Lead Arranger on two financing arrangements conducted by Transurban during FY17. Transurban uses air travel services provided by Virgin Australia.
C O’Reilly Ms O’Reilly is a Non-executive Director of Energy Australia.
Energy Australia is one of Transurban’s electricity providers in New South Wales and Queensland.
TUIR026_Annual_Report_2017_inner_spreads_art02_sp.indd 37 23/8/17 10:30

2017 Transurban Annual Report38
38
Remuneration report (continued)
9. Statutory tables
A. Senior executive remuneration
Short-term employee benefits Deferred
STI4
Post-employment
benefits
Long-term
benefits Share based
benefits5 Total
Cash
salary and fees
Cash STI2
Non-monetary benefits3
Super-annuation
Long service
leave Equity
awards Cash
awards
Current CEO S Charlton 2017 2,180,384 1,265,000 10,575 1,182,642 19,616 52,382 1,893,205 – 6,603,804 2016 2,102,392 1,193,475 13,024 1,120,400 19,308 8,463 1,821,975 – 6,279,037
Current other senior executives T Adams 2017 568,484 215,150 61,218 209,700 19,616 18,876 323,949 – 1,416,993 2016 515,292 213,275 1,983 191,142 19,308 10,052 214,874 – 1,165,926
J Aument1 2017 683,294 233,392 1,371 300,554 14,322 – – 701,351 1,934,284 2016 668,904 286,157 1,459 361,400 14,521 – – 992,155 2,324,596
W Ballantine 2017 574,384 239,150 4,937 264,067 19,616 19,887 325,986 – 1,448,027 2016 530,692 276,375 2,034 228,708 19,308 10,353 313,368 – 1,380,838 A Head 2017 656,235 236,600 7,225 248,383 20,318 14,244 391,578 – 1,574,583 2016 640,042 222,375 4,306 298,267 19,308 12,486 413,050 – 1,609,834 M Huey 2017 523,184 198,575 6,606 167,442 19,616 – 307,629 – 1,223,052 2016 474,142 214,750 1,784 48,550 19,308 – 291,326 – 1,049,860
S Johnson 2017 563,384 234,725 6,559 209,658 19,616 25,182 315,079 – 1,374,203 2016 510,692 211,450 2,869 182,983 19,308 9,963 304,768 – 1,242,033 L Tobin 2017 564,734 245,500 4,169 202,883 19,616 12,284 332,738 – 1,381,924 2016 537,192 187,700 2,012 213,725 19,308 2,168 348,614 – 1,310,719 V Vassallo 2017 582,468 217,250 4,169 288,433 19,616 13,137 353,530 – 1,478,603 2016 529,323 301,500 2,065 250,958 19,308 2,344 360,869 – 1,466,367 A Watson 2017 703,966 252,650 4,169 192,392 19,616 – 398,357 – 1,571,150 2016 648,892 225,350 1,829 84,317 19,308 – 310,998 – 1,290,694 TOTAL 2017 7,600,517 3,337,992 110,998 3,266,154 191,568 155,992 4,642,051 701,351 20,006,623 2016 7,157,563 3,332,407 33,365 2,980,450 188,293 55,829 4,379,842 992,155 19,119,904 1. Jennifer Aument is remunerated in USA Dollars. The amounts shown in the table above have been converted to Australian Dollars using the
average exchange rate over the reporting period. 2. The amount represents the cash STI payment to the senior executive for FY17, which will be paid in August 2017. 3. Non-monetary benefits include Group employee insurance and relocation allowances (where applicable). 4. A component of STI award is deferred into securities. In accordance with accounting standards, the deferred component will be recognised over
the three year service period. The amount recognised in this table is the FY17 accounting charge for unvested grants. 5. In accordance with the requirements of the accounting standards, remuneration includes a proportion of the fair value of equity compensation
granted or outstanding during the year (i.e. performance awards under the LTI plan). The fair value of equity instruments is determined as at the grant date and is progressively allocated over the performance period. The amount included as remuneration may be different to the benefit (if any) that senior executives may ultimately realise should the equity instruments vest. The fair value of performance awards at the date of their grant has been independently determined in accordance with accounting standards. The fair value of the performance awards has been valued applying a Monte Carlo simulation (using a Black-Scholes framework) to model Transurban’s security price and where applicable, the TSR performance against the comparator group performance.
TUIR026_Annual_Report_2017_inner_spreads_art02_sp.indd 38 23/8/17 10:30

392017 Transurban Annual Report
39
Remuneration report (continued)
B. Number of performance awards on issue as at 30 June 2017
Balance at start of year
Granted during year as remuneration
Matured and paid
during year
Lapsed or forfeited during year
Balance at the end of year
Current senior executives S Charlton1 2017 1,019,868 298,267 (382,292) – 935,843 2016 1,254,579 292,441 (527,152) – 1,019,868
T Adams 2017 119,947 43,337 – – 163,284 2016 64,928 55,019 – – 119,947
J Aument 2017 202,384 50,650 (74,494) – 178,540 2016 137,229 65,155 – – 202,384
W Ballantine 2017 182,912 43,771 (62,630) – 164,053 2016 126,309 56,603 – – 182,912
A Head 2017 242,704 49,803 (94,767) – 197,740 2016 287,601 67,857 (112,754) – 242,704
M Huey2 2017 86,778 39,999 (12,894) – 113,883 2016 48,888 50,784 (12,894) – 86,778
S Johnson 2017 178,108 42,961 (62,630) – 158,439 2016 123,563 54,545 – – 178,108
L Tobin 2017 204,841 43,060 (79,980) – 167,921 2016 147,568 57,273 – – 204,841
V Vassallo 2017 211,651 46,425 (79,980) – 178,096 2016 149,902 61,749 – – 211,651
A Watson3 2017 131,004 53,181 (7,594) – 176,591 2016 69,830 68,768 (7,594) – 131,004
1. Scott Charlton’s number of performance awards granted during FY13 included 236,256 performance awards granted in September 2012 as a sign-on award, to vest, subject to his continued employment, in three equal tranches on the first, second and third anniversaries of his commencement with the Group. The first tranche (78,752) awards vested on 16 July 2013, the second tranche (78,752) awards vested on 16 July 2014 and the third and final tranche (78,752) awards vested on 16 July 2015.
2. Michele Huey received a pro-rated grant of performance awards in FY15 due to her commencement date of 19 January 2015. She also received a one-off equity grant of 25,788 awards recognising the equity awards forfeited when she ceased employment with her former employer. The one-off equity grant will vest, subject to continued employment, in two equal tranches on the first and second anniversaries of her commencement with the Group. The first tranche (12,894) awards vested 19 January 2016 and the second tranche (12,894) awards vested 19 January 2017.
3. Adam Watson received a pro-rated grant of performance awards in FY15 due to his commencement date of 1 December 2014. He also received a one-off equity grant of 15,188 awards recognising the equity awards forfeited when he ceased employment with his former employer. The one-off equity grant will vest, subject to continued employment, in two equal tranches on the first and second anniversaries of his commencement with the Group. The first tranche (7,594) awards vested 1 December 2015 and the second tranche (7,594) awards vested 1 December 2016.
TUIR026_Annual_Report_2017_inner_spreads_art02_sp.indd 39 23/8/17 10:30
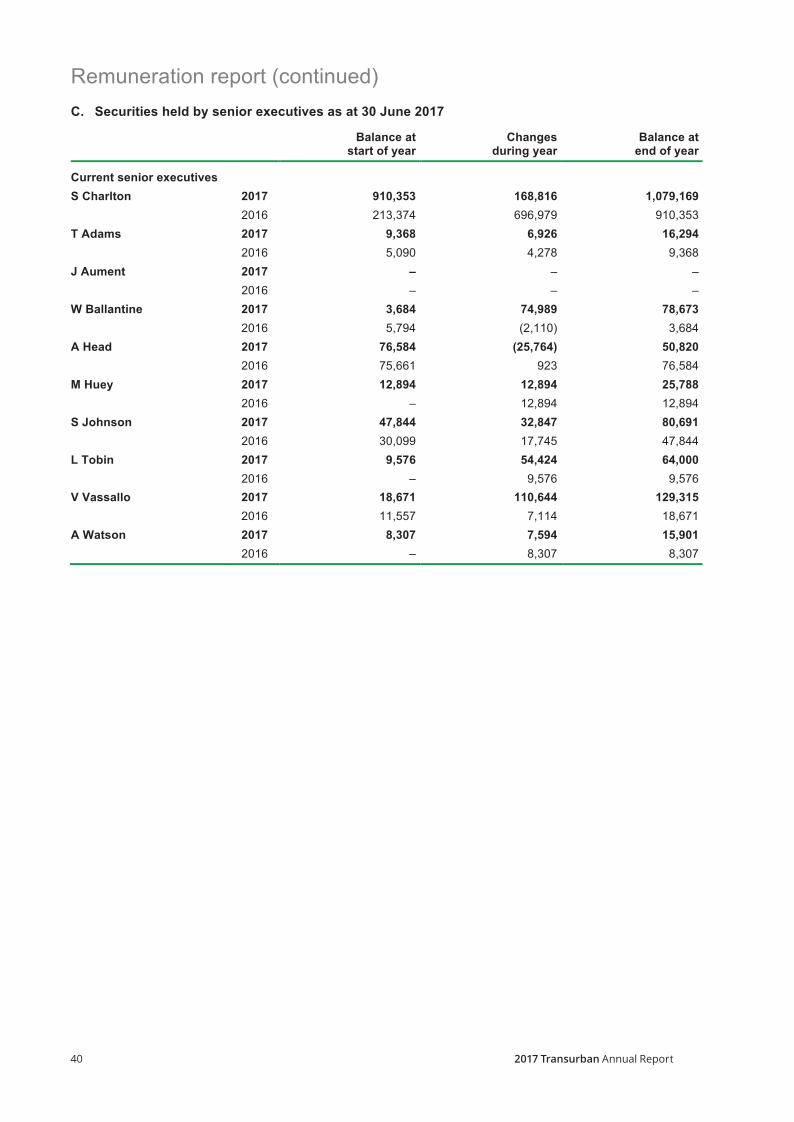
2017 Transurban Annual Report40
40
Remuneration report (continued)
C. Securities held by senior executives as at 30 June 2017 Balance at
start of year Changes
during year Balance at
end of year
Current senior executives S Charlton 2017 910,353 168,816 1,079,169 2016 213,374 696,979 910,353 T Adams 2017 9,368 6,926 16,294 2016 5,090 4,278 9,368 J Aument 2017 – – – 2016 – – – W Ballantine 2017 3,684 74,989 78,673 2016 5,794 (2,110) 3,684 A Head 2017 76,584 (25,764) 50,820 2016 75,661 923 76,584 M Huey 2017 12,894 12,894 25,788 2016 – 12,894 12,894 S Johnson 2017 47,844 32,847 80,691 2016 30,099 17,745 47,844 L Tobin 2017 9,576 54,424 64,000 2016 – 9,576 9,576 V Vassallo 2017 18,671 110,644 129,315 2016 11,557 7,114 18,671 A Watson 2017 8,307 7,594 15,901 2016 – 8,307 8,307
TUIR026_Annual_Report_2017_inner_spreads_art02_sp.indd 40 23/8/17 10:30

412017 Transurban Annual Report
41
Remuneration report (continued)
D. Remuneration paid to Non-executive Directors Short-term benefits Post-employment benefits Total
Fees Superannuation1 Current Non-executive Directors L Maxsted 2017 530,384 19,616 550,000 2016 508,192 19,308 527,500 N Chatfield 2017 245,384 19,616 265,000 2016 237,492 19,308 256,800 R Edgar 2017 240,384 19,616 260,000 2016 230,992 19,308 250,300 S Mostyn 2017 196,347 18,653 215,000 2016 190,028 18,053 208,081 C O'Reilly 2017 200,913 19,087 220,000 2016 194,365 18,465 212,830 P Scott 2017 196,352 18,460 214,812 2016 56,317 5,144 61,461 R Slater2 2017 238,695 – 238,695 2016 246,575 – 246,575 J Wilson 2017 91,027 8,648 99,675 Total 2017 1,939,486 123,696 2,063,182 2016 1,663,961 99,586 1,763,547
1. Superannuation contributions made on behalf of Non-executive Directors to satisfy the Group’s obligations under applicable superannuation guarantee legislation.
2. Rodney Slater is remunerated in USA Dollars. The amounts shown in the table above have been converted to Australian Dollars using the average exchange rate over the reporting period.
E. Securities held by Non-executive Directors as at 30 June 2017
Balance at start of year
Changes during year
Balance at end of year
Current Non-executive Directors L Maxsted 2017 70,258 – 70,258 2016 66,559 3,699 70,258 N Chatfield 2017 59,728 2,600 62,328 2016 55,424 4,304 59,728 R Edgar 2017 32,009 – 32,009 2016 30,324 1,685 32,009 S Mostyn 2017 18,215 – 18,215 2016 17,256 959 18,215 C O’Reilly 2017 20,406 – 20,406 2016 19,332 1,074 20,406 P Scott 2017 20,000 870 20,870 2016 – 20,000 20,000 R Slater 2017 3,000 – 3,000 2016 – 3,000 3,000 J Wilson1 2017 – 4,000 4,000 1. Jane Wilson acquired 4,000 securities prior to her appointment as a Non-executive Director on 1 January 2017.
TUIR026_Annual_Report_2017_inner_spreads_art02_sp.indd 41 23/8/17 10:30
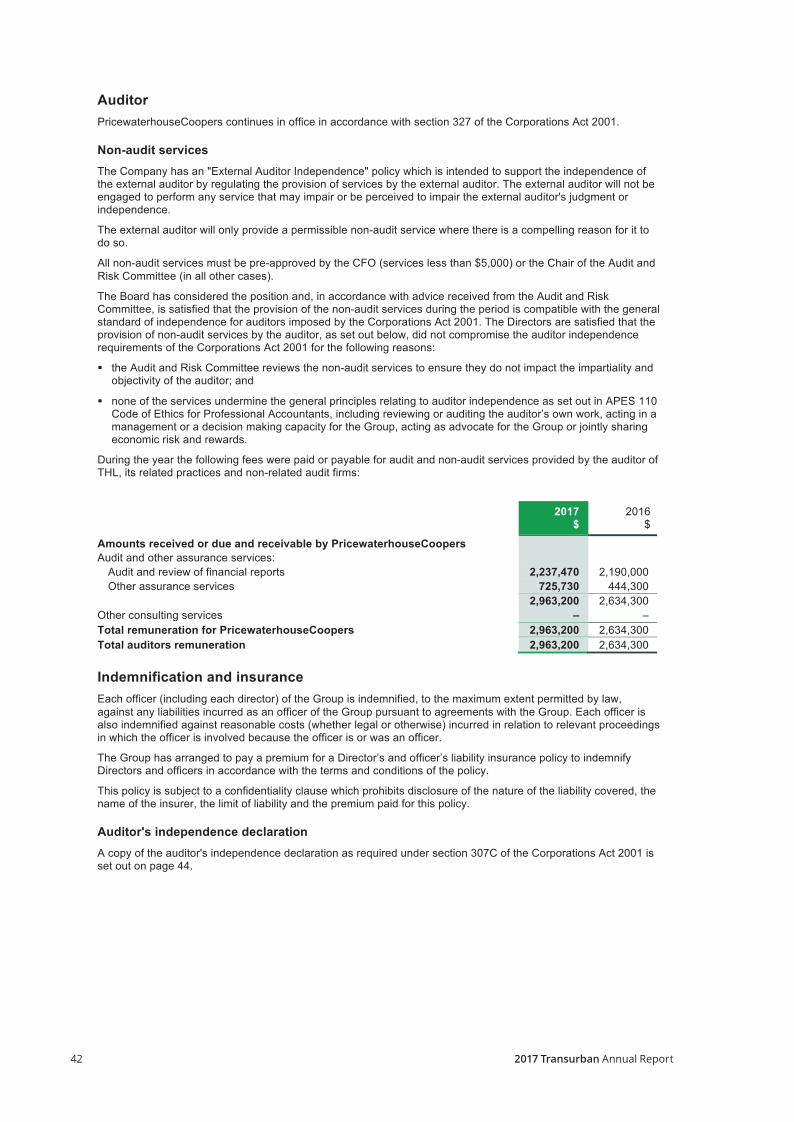
2017 Transurban Annual Report42
42
Auditor
PricewaterhouseCoopers continues in office in accordance with section 327 of the Corporations Act 2001.
Non-audit services The Company has an "External Auditor Independence" policy which is intended to support the independence of the external auditor by regulating the provision of services by the external auditor. The external auditor will not be engaged to perform any service that may impair or be perceived to impair the external auditor's judgment or independence.
The external auditor will only provide a permissible non-audit service where there is a compelling reason for it to do so.
All non-audit services must be pre-approved by the CFO (services less than $5,000) or the Chair of the Audit and Risk Committee (in all other cases).
The Board has considered the position and, in accordance with advice received from the Audit and Risk Committee, is satisfied that the provision of the non-audit services during the period is compatible with the general standard of independence for auditors imposed by the Corporations Act 2001. The Directors are satisfied that the provision of non-audit services by the auditor, as set out below, did not compromise the auditor independence requirements of the Corporations Act 2001 for the following reasons:
§ the Audit and Risk Committee reviews the non-audit services to ensure they do not impact the impartiality and objectivity of the auditor; and
§ none of the services undermine the general principles relating to auditor independence as set out in APES 110 Code of Ethics for Professional Accountants, including reviewing or auditing the auditor’s own work, acting in a management or a decision making capacity for the Group, acting as advocate for the Group or jointly sharing economic risk and rewards.
During the year the following fees were paid or payable for audit and non-audit services provided by the auditor of THL, its related practices and non-related audit firms:
2017 $
2016 $
Amounts received or due and receivable by PricewaterhouseCoopers Audit and other assurance services:
Audit and review of financial reports 2,237,470 2,190,000 Other assurance services 725,730 444,300
2,963,200 2,634,300 Other consulting services – – Total remuneration for PricewaterhouseCoopers 2,963,200 2,634,300 Total auditors remuneration 2,963,200 2,634,300
Indemnification and insurance Each officer (including each director) of the Group is indemnified, to the maximum extent permitted by law, against any liabilities incurred as an officer of the Group pursuant to agreements with the Group. Each officer is also indemnified against reasonable costs (whether legal or otherwise) incurred in relation to relevant proceedings in which the officer is involved because the officer is or was an officer.
The Group has arranged to pay a premium for a Director’s and officer’s liability insurance policy to indemnify Directors and officers in accordance with the terms and conditions of the policy.
This policy is subject to a confidentiality clause which prohibits disclosure of the nature of the liability covered, the name of the insurer, the limit of liability and the premium paid for this policy.
Auditor's independence declaration A copy of the auditor's independence declaration as required under section 307C of the Corporations Act 2001 is set out on page 44.
TUIR026_Annual_Report_2017_inner_spreads_art02_sp.indd 42 23/8/17 10:30

432017 Transurban Annual Report
43
Rounding of amounts The Group is of a kind referred to in Instrument 2016/191, issued by the Australian Securities and Investments Commission, relating to the 'rounding off' of amounts in the Directors' report. Amounts in the Directors' report have been rounded off in accordance with that Instrument to the nearest million, or in certain cases, to the nearest dollar.
This report is made in accordance with a resolution of Directors.
Lindsay Maxsted Director
Scott Charlton Director
Melbourne 8 August 2017
TUIR026_Annual_Report_2017_inner_spreads_art02_sp.indd 43 23/8/17 10:30

2017 Transurban Annual Report44
PricewaterhouseCoopers, ABN 52 780 433 757 2 Riverside Quay, SOUTHBANK VIC 3006, GPO Box 1331, MELBOURNE VIC 3001 T: 61 3 8603 1000, F: 61 3 8603 1999, www.pwc.com.au
Liability limited by a scheme approved under Professional Standards Legislation.
Auditor’s Independence Declaration
As lead auditor for the audit of Transurban Holdings Limited, Transurban Holding Trust and Transurban International Limited for the year ended 30 June 2017, I declare that to the best of my knowledge and belief, there have been:
(a) no contraventions of the auditor independence requirements of the Corporations Act 2001 in relation to the audit; and
(b) no contraventions of any applicable code of professional conduct in relation to the audit.
This declaration is in respect of Transurban Holdings Limited, Transurban Holding Trust and Transurban International Limited and the entities they controlled during the period.
Chris Dodd
Melbourne
Partner PricewaterhouseCoopers
8 August 2017
44
TUIR026_Annual_Report_2017_inner_spreads_art02_sp.indd 44 23/8/17 10:30

452017 Transurban Annual Report
45
Transurban Holdings Limited ABN 86 098 143 429
Contents Section A: Group financial statements Consolidated statement of comprehensive income Consolidated balance sheet Consolidated statement of changes in equity Consolidated statement of cash flows
Section B: Notes to the Group financial statements Basis of preparation and significant changes
B1 Corporate information
B2 Summary of significant changes in the current period
B3 Basis of preparation
Operating performance
B4 Segment information
B5 Revenue
B6 Significant items
B7 Income tax
B8 Working capital
Security holder outcomes
B9 Earnings per stapled security
B10 Dividends/ distributions and free cash
Capital and borrowings
B11 Contributed equity
B12 Reserves
B13 Net finance costs
B14 Borrowings
B15 Derivatives and financial risk management
Network summary B16 Intangible assets
B17 Maintenance provision
B18 Other liabilities – concession and promissory notes
Group structure B19 Principles of consolidation
B20 Material subsidiaries
B21 Business combinations
B22 Equity accounted investments
B23 Non-controlling interests – other
B24 Deed of cross and intragroup guarantees
Items not recognised
B25 Contingencies
B26 Commitments
B27 Subsequent events
Other B28 Related party transactions
B29 Key management personnel compensation
B30 Remuneration of auditors
B31 Parent entity disclosures
Section C: Transurban Holdings Trust (‘THT’) and Transurban International Limited (‘TIL’) financial statements Consolidated statement of comprehensive income Consolidated balance sheet Consolidated statement of changes in equity Consolidated statement of cash flows
Section D: Notes to the THT and TIL financial statements
Section E: Signed reports Directors’ declaration Independent auditor’s report to the stapled security holders
TUIR026_Annual_Report_2017_inner_spreads_art02_sp.indd 45 23/8/17 10:30

2017 Transurban Annual Report46
Transurban Holdings Limited for the year ended 30 June 2017
46
Section A: Group financial statements
TUIR026_Annual_Report_2017_inner_spreads_art02_sp.indd 46 23/8/17 10:30

472017 Transurban Annual Report
Transurban Holdings Limited Consolidated statement of comprehensive income
for the year ended 30 June 2017
Note
2017 $M
2016 $M
Revenue B5 2,732 2,210 Expenses Employee benefits expense (168) (149) Road operating costs (335) (309) Construction costs (592) (282) Transaction and integration costs (5) (131) Corporate and other expenses (106) (91) Total expenses (1,206) (962) Earnings before depreciation, amortisation, net finance costs, equity accounted investments and income taxes 1,526 1,248 Amortisation B16 (561) (527) Depreciation (67) (57) Total depreciation and amortisation (628) (584) Net finance costs B13 (749) (728) Share of net profits of equity accounted investments B22 25 17 Profit/(loss) before income tax 174 (47) Income tax benefit B7 35 69 Profit for the year 209 22 Profit/(loss) attributable to: Ordinary security holders of the stapled group - Attributable to THL 83 44 - Attributable to THT/TIL 156 55 239 99 Non-controlling interests - other B23 (30) (77) 209 22 Other comprehensive income Items that may be reclassified to profit or loss in the future Changes in the fair value of cash flow hedges, net of tax 76 (79) Share of other comprehensive income of equity accounted investments, net of tax 8 (11) Movement in share-based payments reserve 1 – Exchange differences on translation of US operations, net of tax 20 (12) Other comprehensive income/(loss) for the year, net of tax 105 (102) Total comprehensive income/(loss) for the year 314 (80) Total comprehensive income/(loss) for the year is attributable to: Ordinary security holders of the stapled group - Attributable to THL 95 48 - Attributable to THT/TIL 240 (26) Non-controlling interests – other (21) (102) 314 (80) Cents Cents Earnings per security attributable to ordinary security holders of the stapled group: Basic and diluted earnings per stapled security B9 11.7 5.0
The above consolidated statement of comprehensive income should be read in conjunction with the accompanying notes.
TUIR026_Annual_Report_2017_inner_spreads_art02_sp.indd 47 23/8/17 10:30

2017 Transurban Annual Report48
Transurban Holdings Limited Consolidated balance sheet
for the year ended 30 June 2017
48
ASSETS Note
2017 $M
20161 $M
Current assets Cash and cash equivalents B8 988 834 Trade and other receivables B8 138 121 Held-to-maturity investments B8 157 – Total current assets 1,283 955
Non-current assets Equity accounted investments B22 654 971 Held-to-maturity investments B28 586 369 Derivative financial instruments B15 82 121 Property, plant and equipment 327 268 Deferred tax assets B7 1,061 1,097 Intangible assets B16 19,330 19,259 Total non-current assets 22,040 22,085
Total assets 23,323 23,040
LIABILITIES Current liabilities Trade and other payables B8 347 410 Borrowings B14 880 405 Derivative financial instruments B15 5 17 Maintenance provision B17 99 94 Distribution provision B10 594 516 Other provisions 40 31 Other liabilities 174 132 Total current liabilities 2,139 1,605
Non-current liabilities Borrowings B14 12,868 12,468 Deferred tax liabilities B7 931 981 Maintenance provision B17 895 836 Other provisions 93 47 Derivative financial instruments B15 362 393 Other liabilities 228 252 Total non-current liabilities 15,377 14,977
Total liabilities 17,516 16,582
Net assets 5,807 6,458
EQUITY Contributed equity B11 1,450 1,422 Reserves B12 (54) (66) Accumulated losses (3,190) (3,129) Non-controlling interests held by security holders of the stapled group (THT/TIL) 6,289 6,808 Equity attributable to security holders of the stapled group 4,495 5,035 Non-controlling interests – other B23 1,312 1,423 Total equity 5,807 6,458
1. The 30 June 2016 balances have been restated to reflect the final fair value of the purchase price allocation balances of AirportlinkM7, which
was acquired on 1 April 2016. Refer to note B21.
The above consolidated balance sheet should be read in conjunction with the accompanying notes.
TUIR026_Annual_Report_2017_inner_spreads_art02_sp.indd 48 23/8/17 10:30

492017 Transurban Annual Report
Transurban Holdings Limited Consolidated statement of changes in equity
for the year ended 30 June 2017
49
Attributable to security holders of the stapled group
No. of securities
M
Contributed equity
$M Reserves
$M
Accumulated losses
$M
Non-controlling interests– THT & TIL
$M Total
$M
Non-controlling
interests–other $M
Total equity
$M
Balance at 1 July 2016 2,036 1,422 (66) (3,129) 6,808 5,035 1,423 6,458
Comprehensive income
Profit/(loss) for the year – – – 83 156 239 (30) 209 Other comprehensive
income/(loss) – – 12 – 84 96 9 105 Total comprehensive
income/(loss) – – 12 83 240 335 (21) 314 Transactions with
owners in their capacity as owners:
Employee performance awards issued1 1 1 – – 3 4 – 4
Distributions provided for or paid2 – – – (144) (911) (1,055) – (1,055)
Distribution reinvestment plan3 15 27 – – 149 176 – 176
Distributions to non-controlling interests4 – – – – – – (90) (90)
16 28 – (144) (759) (875) (90) (965)
Balance at 30 June 2017 2,052 1,450 (54) (3,190) 6,289 4,495 1,312 5,807
1. From 2012 it is the Group’s policy that a portion of all Short Term Incentives issued to the CEO and other senior executives are deferred for a
period of 2 years. In addition to the Short Term Incentives, Stapled Securities (including units in the Trust) were issued to executives under the Group’s Long Term Incentive share-based payment plans. These securities are held by the executive but will only vest in accordance with the terms of the plans.
2. Refer to note B10 for further details of dividends and distributions provided for or paid. 3. Under the distribution reinvestment plan, holders of stapled securities may elect to have all or part of their distribution entitlements satisfied by
the issue of new stapled securities rather than by cash. 4. Dividends and distributions were paid during the period to the non-controlling interest partners in Airport Motorway Trust (Eastern Distributor),
Transurban Queensland Invest Trust and Transurban Queensland Holdings 1 Pty Ltd (Transurban Queensland).
The above consolidated statement of changes in equity should be read in conjunction with the accompanying notes.
TUIR026_Annual_Report_2017_inner_spreads_art02_sp.indd 49 23/8/17 10:31

2017 Transurban Annual Report50
Transurban Holdings Limited Consolidated statement of changes in equity
for the year ended 30 June 2017
50
Attributable to security holders of the stapled group
No. of securities
M
Contributed equity
$M Reserves
$M
Accumulated losses
$M
Non-controlling interests– THT & TIL
$M Total
$M
Non-controlling
interests–other $M
Total equity
$M
Balance at 1 July 2015 1,914 1,237 (70) (3,034) 6,636 4,769 1,227 5,996
Comprehensive income
Profit/(loss) for the year – – – 44 55 99 (77) 22
Other comprehensive income/(loss) – – 4 – (81) (77) (25) (102)
Total comprehensive income/(loss) – – 4 44 (26) 22 (102) (80)
Transactions with owners in their capacity as owners:
Contributions of equity, net of transaction costs1 107 163 – – 843 1,006 356 1,362
Employee performance awards issued2 1 – – – 2 2 – 2
Distributions provided for or paid3 – – – (139) (762) (901) – (901)
Distribution reinvestment plan4 14 22 – – 115 137 – 137
Distributions to non-controlling interests5 – – – – – – (58) (58)
122 185 – (139) 198 244 298 542
Balance at 30 June 2016 2,036 1,422 (66) (3,129) 6,808 5,035 1,423 6,458
1. During December 2015, the Group successfully completed the fully underwritten institutional and retail components of its renounceable 1 for 18 pro rata entitlement offer. The institutional component raised $726 million and the retail component raised $280 million at an issue price of $9.60 per security. The total proceeds from the entitlement offer (net of equity issue costs) were approximately $1,006 million and were used to fund the Group’s equity contribution for the AirportlinkM7 acquisition which reached financial close in April 2016, with the remainder used for general corporate purposes. In March 2016, the non-controlling partners in Transurban Queensland (Australian Super and Tawreed) contributed $356 million as their equity contribution for the acquisition of AirportlinkM7. The Group’s equity contribution into Transurban Queensland is eliminated upon consolidation.
2. From 2012 it is the Group’s policy that a portion of all Short Term Incentives issued to the CEO and other senior executives are deferred for a period of 2 years. In addition to the Short Term Incentives, Stapled Securities (including units in the Trust) were issued to executives under the Group’s Long Term Incentive share-based payment plans. These securities are held by the executive but will only vest in accordance with the terms of the plans.
3. Refer to note B10 for further details of dividends and distributions provided for or paid. 4. Under the distribution reinvestment plan, holders of stapled securities may elect to have all or part of their distribution entitlements satisfied by
the issue of new stapled securities rather than by cash. 5. Distributions were paid during the period to the non-controlling interest partners in Airport Motorway Trust (Eastern Distributor) and Transurban
Queensland Invest Trust (Transurban Queensland).
The above consolidated statement of changes in equity should be read in conjunction with the accompanying notes.
TUIR026_Annual_Report_2017_inner_spreads_art02_sp.indd 50 23/8/17 10:31

512017 Transurban Annual Report
Transurban Holdings Limited Consolidated statement of cash flows
for the year ended 30 June 2017
51
Note 2017
$M 2016
$M Cash flows from operating activities Receipts from customers 2,266 2,055 Payments to suppliers and employees (679) (624) Payments for maintenance of intangible assets (69) (52) Transaction and integration costs related to acquisitions (113) (23) Other revenue 57 66 Interest received 27 31 Interest paid (652) (543) Net cash inflow from operating activities (a) 837 910 Cash flows from investing activities Payments for held-to-maturity investments (344) (187) Payments for intangible assets (647) (437) Payments for property, plant and equipment (131) (78) Distributions received from equity accounted investments 350 127 Payments for acquisition of subsidiaries, net of cash acquired – (1,869) Net cash outflow from investing activities (772) (2,444) Cash flows from financing activities Proceeds from equity issued to non-controlling interests – 356 Proceeds from issues of stapled securities – 1,006 Proceeds from borrowings (net of costs) 2,703 3,896 Repayment of borrowings (1,718) (3,401) Dividends and distributions paid to the Group's security holders B10 (801) (689) Distributions paid to non-controlling interests B10 (90) (55) Net cash inflow from financing activities 94 1,113 Net increase/(decrease) in cash and cash equivalents 159 (421) Cash and cash equivalents at the beginning of the year
834 1,249
Effects of exchange rate changes on cash and cash equivalents (5) 6 Cash and cash equivalents at end of the year B8 988 834
(a) Reconciliation of profit after income tax to net cash flow from operating activities
2017
$M 2016
$M
Profit for the year 209 22 Depreciation and amortisation 628 584 Non-cash share-based payments expense 5 3 Non-cash net finance costs 81 87 Share of profits of equity accounted investments B22 (25) (17)
Change in operating assets and liabilities:
(Increase) / decrease in trade and other receivables (17) 5 Increase in concession and promissory note liability 11 21 (Decrease) / increase in operating creditors and accruals (95) 158 Increase in other operating provisions 11 25 Movement in deferred and current taxes (35) (69) Increase in maintenance provision 64 91
Net cash inflow from operating activities 837 910
The above consolidated statement of cash flows should be read in conjunction with the accompanying notes.
TUIR026_Annual_Report_2017_inner_spreads_art02_sp.indd 51 23/8/17 10:31

2017 Transurban Annual Report52
Transurban Holdings Limited for the year ended 30 June 2017
52
Section B: Notes to the Group financial statements
TUIR026_Annual_Report_2017_inner_spreads_art02_sp.indd 52 23/8/17 10:31

532017 Transurban Annual Report
Transurban Holdings Limited Notes to the consolidated financial statements
for the year ended 30 June 2017
53
Basis of preparation and significant changes
B1 Corporate Information Transurban Holdings Limited (‘the Company’, ‘the Parent’ or ‘THL’) is a company incorporated in Australia and limited by shares that are publicly traded on the Australian Securities Exchange. These financial statements have been prepared as a consolidation of the financial statements of Transurban Holdings Limited and its controlled entities (‘Transurban’, ‘Transurban Group’ or ‘the Group’). The controlled entities of THL include the other members of the stapled group being Transurban International Limited and its controlled entities (‘TIL’) and Transurban Holding Trust and its controlled entities (‘THT’). The equity securities THL, THT and TIL are stapled and cannot be traded separately. Entities within the Group are domiciled and incorporated in Australia and the United States of America.
The consolidated financial statements of Transurban Group for the year ended 30 June 2017 were authorised for issue in accordance with a resolution of the Directors on 8 August 2017. Directors have the power to amend and reissue the financial report.
B2 Summary of significant changes in the current reporting period During the year ended 30 June 2017, there have been no significant changes in accounting for our assets.
B3 Basis of preparation The Group financial statements are general purpose financial statements which:
§ Have been prepared in accordance with the Corporations Act 2001, Australian accounting standards, and other authoritative pronouncements of the Australian Accounting Standards Board;
§ Have adopted all accounting policies in accordance with Australian accounting standards, and where a standard permits a choice in accounting policy, the policy adopted by the Group has been disclosed in these financial statements;
§ Have applied the option under ASIC Corporations (Stapled Group Reports) Instrument 2015/838 to present the consolidated financial statements in one section (Section A), and all other reporting group members in a separate section (Section C).
§ Do not early adopt any accounting standards or interpretations that have been issued or amended but are not yet effective;
§ Comply with International financial reporting standards (‘IFRS’) as issued by the International Accounting Standards Board (‘IASB’);
§ Have been prepared under the historical cost convention, as modified by the revaluation of other financial assets and liabilities (including derivative financial instruments);
§ Are presented in Australian dollars, which is THL’s functional and presentation currency.
§ Have been rounded to the nearest million dollars, unless otherwise stated, in accordance with ASIC Corporations (Rounding in Financial/Director’s Reports) Instrument 2016/191; and
§ The presentation of comparative amounts has been restated, where applicable, to conform to the current period presentation.
Going concern
THL’s current liabilities exceed its current assets by $856 million as at 30 June 2017. This is primarily driven by borrowing facilities with maturities less than 12 months. The financial report has been prepared on a going concern basis, which assumes the continuity of normal operations. This is based on the following:
§ The Group has generated positive cash inflows from operating activities of $837 million (2016: $910 million), after allowing for payments of $113 million (2016: $23 million) in transaction and integration costs relating to acquisitions;
§ The Group reached financial close on 7 July 2017 for a new $1.1 billion syndicated bank debt facility that refinances an existing working capital facility, which demonstrates our ability to refinance our debt due in the next 12 months;
§ The Group expects to refinance those remaining borrowing facilities with maturities of less than 12 months; and
§ The Group has paid $801 million of dividends and distributions over the past 12 months.
TUIR026_Annual_Report_2017_inner_spreads_art02_sp.indd 53 23/8/17 10:31

2017 Transurban Annual Report54
Transurban Holdings Limited Notes to the consolidated financial statements
for the year ended 30 June 2017
54
B3 Basis of preparation (continued)
Foreign currency translation
Transactions and balances Foreign currency transactions are translated into the functional currency using the exchange rates prevailing at the dates of the transactions. Foreign exchange gains and losses resulting from the settlement of such transactions, and from the translation at year end exchange rates of monetary assets and liabilities denominated in foreign currencies, are recognised in profit or loss, except when they are deferred in equity as qualifying cash flow hedges and qualifying net investment hedges or are attributable to part of the net investment in a foreign operation.
Non-monetary items that are measured at fair value in a foreign currency are translated using the exchange rates at the date when the fair value was determined. Translation differences on assets and liabilities carried at fair value are reported as part of the fair value gain or loss. For example, translation differences on non-monetary assets and liabilities such as equities held at fair value through profit or loss are recognised in profit or loss as part of the fair value gain or loss and translation differences on non-monetary assets such as equities classified as available-for-sale financial assets are recognised in the fair value reserve in equity.
Foreign operations The results and financial position of all of the Group entities that have a functional currency different from the presentation currency are translated into the presentation currency as follows:
§ assets and liabilities are translated at the closing rate at the reporting date;
§ income and expenses are translated at average exchange rates (unless this is not a reasonable approximation of the cumulative effect of the rates prevailing on the transaction dates, in which case income and expenses are translated at the dates of the transactions); and
§ all resulting exchange differences are recognised in other comprehensive income.
On consolidation, exchange differences arising from the translation of any net investment in foreign entities, and of borrowings and other financial instruments designated as hedges of such investments, are taken to other comprehensive income.
New and amended standards The Group has adopted the following new or revised accounting standards which became effective for the annual reporting period commencing 1 July 2016. The Group determined there is no impact on the financial statements from the adoption.
Reference Description
AASB 2015-1 These amendments clarify various Australian accounting standards.
AASB 2015-2 These amendments are designed to further encourage companies to apply professional judgment in determining what information to disclose in the financial statements.
TUIR026_Annual_Report_2017_inner_spreads_art02_sp.indd 54 23/8/17 10:31

552017 Transurban Annual Report
Transurban Holdings Limited Notes to the consolidated financial statements
for the year ended 30 June 2017
55
B3 Basis of preparation (continued)
Accounting standards and interpretations issued but not yet effective Certain new accounting standards and interpretations have been published but are not mandatory for 30 June 2017 reporting periods. The Group's assessment of the impact of these new standards and interpretations is set out below.
Reference Description and Impact on the Group Application of the standard
Application by the Group
AASB 9 Financial instruments
AASB 9 addresses the classification, measurement and derecognition of financial assets and financial liabilities. It also includes an expected loss impairment model and a reformed approach to hedge accounting. The standard will be applicable retrospectively.
There will be no impact on the accounting for the Group’s financial liabilities as the new standard only impacts financial liabilities designated at fair value through profit or loss and the Group does not have any such liabilities. The Group does not have any available for sale financial assets.
The Group has not yet completed its assessment of how its hedging arrangements and the impairment of financial instruments under the expected credit loss model will be affected by the new rules; however, it does not expect the impact to be material.
Increased disclosures may be required in the financial statements. The Group’s assessment of the potential accounting, disclosure and financial impacts on adoption of the standard will continue up to the date of application.
1 January 2018 1 July 2018
AASB 15 Revenue from contracts with customers
AASB 15 establishes principles for reporting useful information to users of financial statements about the nature, amount, timing and uncertainty of revenue and cash flows arising from an entity’s contracts with customers. AASB 15 supersedes a number of current revenue standards.
There will be no material impact on the Group’s accounting policies on the adoption of the standard, however there will be new disclosure requirements.
1 January 2018 1 July 2018
TUIR026_Annual_Report_2017_inner_spreads_art02_sp.indd 55 23/8/17 10:31

2017 Transurban Annual Report56
Transurban Holdings Limited Notes to the consolidated financial statements
for the year ended 30 June 2017
56
B3 Basis of preparation (continued)
Accounting standards and interpretations issued but not yet effective (continued)
Reference Description and Impact on the Group Application of the standard
Application by the Group
AASB 16 Leases
AASB 16 modifies accounting for leases by removing the current distinction between operating and financing leases. The standard requires recognition of an asset and a financial liability for all leases, with exemptions for short term and low value leases. Under the new standard, entities will no longer be required to distinguish between finance leases and operating leases.
The standard will primarily affect the accounting for the Group’s operating leases. As at the reporting date, the Group has non-cancellable operating lease commitments of $42 million (see note B26).
On transition and moving forward, for operating leases for which payments are currently required to be expensed, the Group will recognise right of use assets and corresponding liabilities for the principal amount of lease payments, which will then result in amortisation and interest expenses being recognised in the income statement (replacing operating lease expenses). Further, the principal component of lease payments will be reclassified from operating to financing in the statement of cash flows.
Certain performance metrics and ratios will be impacted as a result of the above changes, including Proportional EBITDA, Proportional Net Costs and Free Cash, which are measures used to assess senior executive performance as part of the Group’s remuneration framework.
The Group is still considering the available options for transition and has not yet forecasted the financial impacts of the new standard, but will do so leading up to application of the standard.
1 January 2019 1 July 2019
AASB 2016-1 Amendment to AASB 112 clarifies the accounting for deferred tax where an asset is measured at fair value and that fair value is below the asset’s tax base. This does not change the underlying principles for the recognition of deferred tax assets.
The Group does not have any temporary taxable or deductible differences on assets that are measured at fair value. Therefore the impact of the application of the new standard is not expected to be material.
1 January 2017 1 July 2017
AASB 2016-2 Amendment to AASB 107 introduces additional disclosures that will enable users of financial statements to evaluate changes in liabilities arising from financing activities.
The impact of the application of the new standard will be additional disclosure in the Group financial statements relating to the financial liabilities held by the Group.
1 January 2017 1 July 2017
TUIR026_Annual_Report_2017_inner_spreads_art02_sp.indd 56 23/8/17 10:31

572017 Transurban Annual Report
Transurban Holdings Limited Notes to the consolidated financial statements
for the year ended 30 June 2017
57
B3 Basis of preparation (continued)
Accounting standards and interpretations issued but not yet effective (continued) Reference Description and Impact on the Group
Application of the standard
Application by the Group
AASB 2016-5 Amendments made to AASB 2 clarify how to account for cash-settled share-based payments with performance conditions, modifications that change a cash-settled arrangement to an equity-settled arrangement, and equity-settled awards that include a ‘net settlement’ feature which requires employers to withhold amounts to settle the employee’s tax obligations.
Management has undertaken an assessment of the impact of this standard and does not believe that the impact will be material.
1 January 2018 1 July 2018
AASB 2017-1 Amendment to AASB 128 clarifies that an entity that is not an investment entity may elect to retain the fair value measurement applied by its associates and joint ventures that are investment entities when applying the equity method.
Management has undertaken an assessment of the impact of this standard and does not believe that the impact will be material.
1 January 2018 1 July 2018
AASB 2017-2 Amendment to AASB 12 clarifies the scope of the standard.
Management has undertaken an assessment of the impact of this standard and does not believe that the impact will be material.
1 January 2017 1 July 2017
Interpretation 22
The interpretation clarifies how to apply the standard on foreign currency transactions, AASB 121, when an entity pays or receives consideration in advance for foreign currency-denominated contracts.
Management has undertaken an assessment of the impact of this standard and does not believe that the impact will be material.
1 January 2018 1 July 2018
Critical accounting estimates and judgements Estimates and judgements are continually evaluated by management and are based on historical experience and other factors, including expectations of future events that may have a financial impact on the Group and that are believed to be reasonable under the circumstances. The estimates and assumptions that have a significant risk of causing a material adjustment to the carrying amounts of assets and liabilities are found in the following notes:
§ Income taxes Note B7
§ Fair value of derivatives and other financial instruments Note B15
§ Estimated impairment of intangible assets and cash generating units Note B16
§ Provision for maintenance expenditure Note B17
§ Valuation of promissory notes and concession notes Note B18
TUIR026_Annual_Report_2017_inner_spreads_art02_sp.indd 57 23/8/17 10:31

2017 Transurban Annual Report58
Transurban Holdings Limited Notes to the consolidated financial statements
for the year ended 30 June 2017
58
Operating performance B4 Segment information
In the segment information provided to the Executive Committee (chief operating decision maker), segments are defined by the geographical networks in which the Group operates being Melbourne, Sydney, Brisbane and the Greater Washington Area. The Group's corporate function is not an operating segment under the requirements of AASB 8 as its revenue generating activities are only incidental to the business.
The Executive Committee assesses the performance of the networks based on a measure of proportional earnings before depreciation, amortisation, net finance costs and income taxes (‘Proportional EBITDA’). This reflects the contribution of each network in the Group in the proportion of Transurban's equity ownership. Interest income and expenses are allocated to the networks where the amounts are related specifically to the assets. Otherwise they are allocated to the Corporate function.
Significant items are those items where their nature and amount is considered material to the financial statements and not in the ordinary course of business. Refer to note B6 for further details.
The diagram below shows the assets included in each geographical network, together with the ownership interests held by the Group for the current financial year:
1. AirportlinkM7 was acquired on 1 April 2016. 2. Westlink M7 and NorthConnex form the NorthWestern Roads Group.
TUIR026_Annual_Report_2017_inner_spreads_art02_sp.indd 58 23/8/17 10:31

592017 Transurban Annual Report
Transurban Holdings Limited Notes to the consolidated financial statements
for the year ended 30 June 2017
59
B4 Segment information (continued)
Segment information – proportional income statement
2017
$M Melbourne Sydney Brisbane GWA Corporate and other Total
Toll revenue 687 872 385 209 – 2,153 Other revenue 22 31 2 – 3 58 Total proportional revenue 709 903 387 209 3 2,211 Underlying proportional EBITDA 594 702 268 116 (51) 1,629 Significant items – – – – – – Proportional EBITDA 594 702 268 116 (51) 1,629
2016 $M Melbourne Sydney Brisbane GWA
Corporate and other Total
Toll revenue 660 799 313 174 – 1,946 Other revenue 21 28 7 – 4 60 Total proportional revenue 681 827 320 174 4 2,006 Underlying proportional EBITDA 564 637 218 86 (25) 1,480 Significant items – – (82) – – (82) Proportional EBITDA 564 637 136 86 (25) 1,398
Reconciliation of segment information to statutory financial information
The proportional results presented above are different from the statutory financial results of the Group due to the proportional presentation of each asset’s contribution to each geographical network.
Segment revenue Revenue from external customers is through toll and service and fee revenues earned on toll roads. There are no inter-segment revenues. Segment revenue reconciles to total statutory revenue as follows:
Note 2017
$M 2016
$M
Total segment revenue (proportional) 2,211 2,006 Add: Revenue attributable to non-controlling interests 271 224 Construction revenue from road development activities 592 282 Less: Proportional revenue of non-100% owned equity accounted assets (342) (302) Total statutory revenue B5 2,732 2,210
Proportional EBITDA Proportional EBITDA reconciles to profit/(loss) before income tax as follows:
2017
$M 2016
$M Proportional EBITDA 1,629 1,398 Add: EBITDA attributable to non-controlling interests 186 106 Less: Proportional EBITDA of non-100% owned equity accounted assets (289) (256) Statutory profit before depreciation, amortisation, net finance costs, equity accounted investments and income taxes
1,526 1,248
Statutory net finance costs (749) (728) Statutory depreciation and amortisation (628) (584) Share of net profit from equity accounted investments 25 17 Profit/(loss) before income tax 174 (47)
TUIR026_Annual_Report_2017_inner_spreads_art02_sp.indd 59 23/8/17 10:31
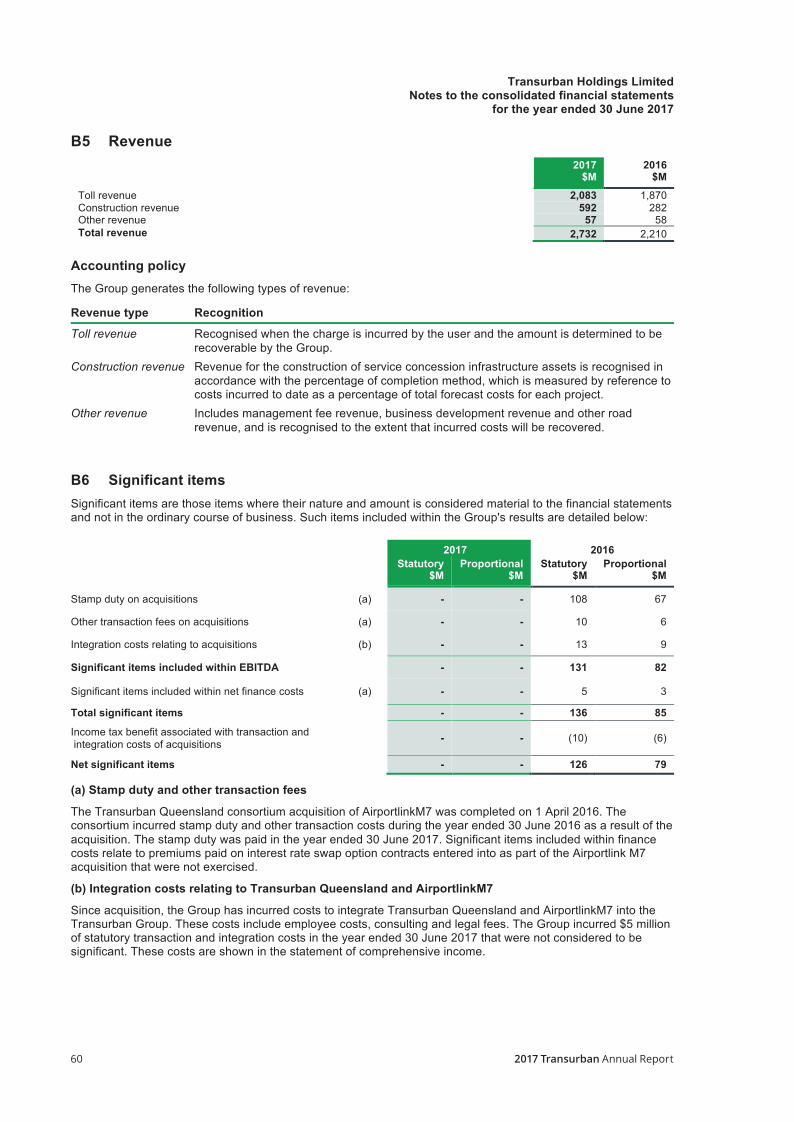
2017 Transurban Annual Report60
Transurban Holdings Limited Notes to the consolidated financial statements
for the year ended 30 June 2017
60
B5 Revenue
2017 $M
2016 $M
Toll revenue 2,083 1,870 Construction revenue 592 282 Other revenue 57 58 Total revenue 2,732 2,210
Accounting policy The Group generates the following types of revenue:
Revenue type Recognition Toll revenue Recognised when the charge is incurred by the user and the amount is determined to be
recoverable by the Group. Construction revenue Revenue for the construction of service concession infrastructure assets is recognised in
accordance with the percentage of completion method, which is measured by reference to costs incurred to date as a percentage of total forecast costs for each project.
Other revenue Includes management fee revenue, business development revenue and other road revenue, and is recognised to the extent that incurred costs will be recovered.
B6 Significant itemsSignificant items are those items where their nature and amount is considered material to the financial statements and not in the ordinary course of business. Such items included within the Group's results are detailed below:
2017 2016 Statutory
$M Proportional
$M Statutory
$M Proportional
$M
Stamp duty on acquisitions (a) - - 108 67
Other transaction fees on acquisitions (a) - - 10 6
Integration costs relating to acquisitions (b) - - 13 9
Significant items included within EBITDA - - 131 82
Significant items included within net finance costs (a) - - 5 3
Total significant items - - 136 85
Income tax benefit associated with transaction and integration costs of acquisitions - - (10) (6)
Net significant items - - 126 79
(a) Stamp duty and other transaction fees
The Transurban Queensland consortium acquisition of AirportlinkM7 was completed on 1 April 2016. The consortium incurred stamp duty and other transaction costs during the year ended 30 June 2016 as a result of the acquisition. The stamp duty was paid in the year ended 30 June 2017. Significant items included within finance costs relate to premiums paid on interest rate swap option contracts entered into as part of the Airportlink M7 acquisition that were not exercised.
(b) Integration costs relating to Transurban Queensland and AirportlinkM7
Since acquisition, the Group has incurred costs to integrate Transurban Queensland and AirportlinkM7 into the Transurban Group. These costs include employee costs, consulting and legal fees. The Group incurred $5 million of statutory transaction and integration costs in the year ended 30 June 2017 that were not considered to be significant. These costs are shown in the statement of comprehensive income.
TUIR026_Annual_Report_2017_inner_spreads_art02_sp.indd 60 23/8/17 10:31

612017 Transurban Annual Report
Transurban Holdings Limited Notes to the consolidated financial statements
for the year ended 30 June 2017
61
B7 Income tax
Income tax expense/(benefit) 2017
$M 2016
$M Current tax (49) (70) Deferred tax 11 (24) Under provision in prior years 3 25 (35) (69) Deferred income tax expense/(benefit) included in income tax expense/(benefit) comprises: (Increase) in deferred tax assets (14) (68) Increase in deferred tax liabilities 25 44 11 (24)
Reconciliation of income tax expense/(benefit) to prima facie tax payable 2017
$M 2016
$M
Profit/(loss) before income tax expense/(benefit) 174 (47) Tax at the Australian tax rate of 30.0% (2016: 30.0%) 52 (14)
Tax effect of amounts which are not deductible/(taxable) in calculating taxable income: Trust income not subject to tax (61) (52) Equity accounted results (7) (5) Tax rate differential (3) (9) Non-deductible interest 13 21 Non-deductible depreciation (12) (15) Prior year tax losses recognised (16) (23) Sundry items (4) 3 Under/(over) provision in prior years 3 25 Income tax benefit (35) (69) Tax expense/(income) relating to items of other comprehensive income Cash flow hedges 18 (56) 18 (56)
Deferred tax assets and liabilities Assets Liabilities 2017
$M 2016
$M 2017
$M 2016
$M The balance comprises temporary differences attributable to: Provisions 361 313 – – Current and prior year losses 882 845 – – Fixed assets/intangibles 587 693 (1,346) (1,426) Concession fees and promissory notes – – (407) (369) Cash flow hedges 135 152 (83) (96) Other 1 4 – – Tax assets/(liabilities) 1,966 2,007 (1,836) (1,891) Set-off of tax (905) (910) 905 910 Net tax assets/(liabilities) 1,061 1,097 (931) (981) Movements: Opening balance at 1 July 2,007 1,881 (1,891) (1,889) Credited to the statement of comprehensive income 14 68 (25) (44) Credited/(charged) to equity (32) 71 14 (15) Acquired – 7 – (3) Foreign exchange movements (21) 8 13 (6) Transfer from deferred tax assets/liabilities (53) (65) 53 65 Other 51 37 – 1 Closing balance at 30 June 1,966 2,007 (1,836) (1,891) Deferred tax assets/(liabilities) to be recovered after more than 12 months 1,966 2,007 (1,836) (1,891)
TUIR026_Annual_Report_2017_inner_spreads_art02_sp.indd 61 23/8/17 10:31
2017 Transurban Annual Report62
Transurban Holdings Limited Notes to the consolidated financial statements
for the year ended 30 June 2017
62
B7 Income tax (continued)
Accounting policy The income tax expense/benefit for the period is the tax payable or benefit on the current period's taxable income based on the applicable income tax rate for each jurisdiction, adjusted by changes in deferred tax assets and liabilities attributable to temporary differences and to unused tax losses.
The current income tax expense is calculated on the basis of the tax laws enacted or substantively enacted at the end of the reporting period in the countries where the Company operates and generates taxable income. Management periodically evaluates positions taken in tax returns with respect to situations in which applicable tax regulation is subject to interpretation. It establishes provisions where appropriate on the basis of amounts expected to be paid to the tax authorities.
The Transurban stapled group comprises two corporate entities (THL and TIL) and a trust (THT). THT operates as a flow-through trust, and is not liable to pay tax itself. Instead, security holders pay tax on the distributions they receive from the trust at their individual marginal tax rates. The Group is structured in this way because the initial heavy capital investment and associated debt funding required for infrastructure investments results in accounting losses being generated in the initial years which would otherwise prevent a company from paying dividends. The trust enables distributions to be made to security holders throughout the life of the asset.
Deferred income tax is provided in full, using the liability method, on temporary differences arising between the tax bases of assets and liabilities and their carrying amounts in the consolidated financial statements. However, deferred income tax is not accounted for if it arises from the initial recognition of an asset or liability in a transaction other than a business combination that at the time of the transaction affects neither accounting nor taxable profit or loss. Deferred income tax is determined using tax rates (and laws) that have been enacted or substantially enacted by the reporting date and are expected to apply when the related deferred income tax asset is realised or the deferred income tax liability is settled.
Deferred tax assets are recognised for deductible temporary differences and unused tax losses only if it is probable that future taxable amounts will be available to utilise those temporary differences and losses.
Deferred tax assets and liabilities are not recognised for temporary differences between the carrying amount and tax bases of investments in foreign operations where the Company is able to control the timing of the reversal of the temporary differences and it is probable that the differences will not reverse in the foreseeable future.
Deferred tax assets and liabilities are offset when there is a legally enforceable right to offset current tax assets and liabilities and when the deferred tax balances relate to the same taxation authority. Current tax assets and tax liabilities are offset where the entity has a legally enforceable right to offset and intends either to settle on a net basis, or to realise the asset and settle the liability simultaneously.
Current and deferred tax is recognised in profit or loss, except to the extent that it relates to items recognised in other comprehensive income or directly in equity.
Investment allowances Companies within the Group may be entitled to claim special tax deductions for investments in qualifying assets (investment allowances). The Group accounts for such allowances as tax credits, which means that the allowance reduces income tax payable and current tax expense. A deferred tax asset is recognised for unclaimed tax credits that are carried forward as tax losses.
Tax consolidation legislation The Transurban Group has adopted the Australian tax consolidation legislation for THL and its wholly-owned Australian entities from 1 July 2005.
All entities within the Australian tax consolidated groups continue to account for their own current and deferred tax amounts. These tax amounts are measured as if each entity in the tax consolidation group is a separate taxpayer within the tax consolidated group.
TUIR026_Annual_Report_2017_inner_spreads_art02_sp.indd 62 23/8/17 10:31

632017 Transurban Annual Report
Transurban Holdings Limited Notes to the consolidated financial statements
for the year ended 30 June 2017
63
B7 Income tax (continued)
Tax consolidation legislation (continued) The tax consolidated groups within the Group are summarised as follows:
1. Entity is classified as a partnership for tax purposes. 2. There are no tax groups under THT.
THL tax consolidated group The entities in the THL tax consolidated group entered into a tax sharing agreement (‘TSA’) effective from 29 April 2009.
The entities in the THL tax consolidated group have also entered into a tax funding agreement (‘TFA’) effective from 1 July 2008. Under the TFA the wholly-owned entities fully compensate THL for any current tax payable assumed and are compensated by THL for any current tax receivable and deferred tax assets relating to tax losses. The funding amounts are determined by reference to the amounts recognised in the wholly-owned entities’ financial statements.
The amount receivable/payable under the TFA is calculated at the end of the financial year for each wholly-owned entity. THL determines and communicates the amount payable/receivable to each wholly-owned entity along with the method of calculation and any other information deemed necessary.
Transurban Queensland tax consolidated group The entities in the Transurban Queensland Holdings 1 Pty Ltd (‘TQH1’) tax consolidated group entered into a TSA effective from 2 July 2014. The entities in the TQH1 tax consolidated group have also entered into a TFA effective from 2 July 2014. APL Hold Co Pty Ltd (‘AirportlinkM7’) and its controlled entities entered the Transurban Queensland tax consolidated group effective from 23 November 2015.
Under the TFA the wholly-owned entities fully compensate TQH1 for any current tax payable assumed and are compensated by TQH1 for any current tax receivable and deferred tax assets relating to tax losses. The funding amounts are determined by reference to the amounts recognised in the wholly-owned entities financial statements.
The amount receivable/payable under the TFA is calculated at the end of the financial year for each wholly-owned entity. TQH1 determines and communicates the amount payable / receivable to each wholly-owned entity along with the method of calculation and any other information deemed necessary.
TUIR026_Annual_Report_2017_inner_spreads_art02_sp.indd 63 23/8/17 10:31

2017 Transurban Annual Report64
Transurban Holdings Limited Notes to the consolidated financial statements
for the year ended 30 June 2017
64
B7 Income tax (continued)
Transurban DRIVe tax consolidated group Transurban DRIVe Holdings LLC (‘TDH’) is the head company of the DRIVe tax consolidated group. The DRIVe tax consolidated group is consolidated for US tax purposes in the sense that the 100% subsidiaries of TDH have elected to be treated as disregarded entities for US tax purposes. This treatment means that those entities are ignored for US tax purposes and that TDH, as head entity, carries any tax liability or benefits arising in the group. The DRIVe tax consolidated group currently owns partnership interests in both 495 Express Lanes and 95 Express Lanes and includes its share of each asset’s profits or losses in its US tax return.
Goods and Services Tax (‘GST’)
Revenues, expenses and assets are recognised net of the amount of associated GST, unless the GST incurred is not recoverable from the taxation authority. In this case it is recognised as part of the cost of acquisition of the asset or as part of the expense.
Receivables and payables are stated inclusive of the amount of GST receivable or payable. The net amount of GST recoverable from, or payable to, the taxation authority is included with other receivables or payables in the balance sheet.
Cash flows are presented on a gross basis. The GST components of cash flows arising from investing or financing activities which are recoverable from, or payable to the taxation authority, are presented as operating cash flows.
Key estimate
The Group is subject to income taxes in Australia and the USA. Significant judgement is required in determining the provision for income taxes. There are many transactions and calculations undertaken during the ordinary course of business for which the ultimate tax determination is uncertain. The Group recognises liabilities for anticipated tax audit issues based on whether additional taxes will be due. Where the final tax outcome of these matters is different from the amounts that were initially recorded, such differences will impact the current and deferred tax assets and liabilities in the period in which such determination is made.
The Group has recognised deferred tax assets relating to carried forward tax losses to the extent there are sufficient taxable temporary differences relating to the same taxation authority against which the unused tax losses can be utilised. However, the utilisation of tax losses also depends on the ability of the Group to satisfy certain tests at the time the losses are recouped. In the USA tax losses generally expire after a 20 year period. Management has reviewed the potential future taxable profits and has recognised deferred tax assets in relation to tax losses.
TUIR026_Annual_Report_2017_inner_spreads_art02_sp.indd 64 23/8/17 10:31

652017 Transurban Annual Report
Transurban Holdings Limited Notes to the consolidated financial statements
for the year ended 30 June 2017
65
B8 Working capital The Group’s working capital balances are summarised as follows:
2017 $M
2016 $M
Current assets Cash and cash equivalents 988 834 Trade receivables 89 75 Other receivables 41 35 Prepayments 8 11 138 121 Held-to-maturity investments 157 - 1,283 955 Current liabilities Trade payables and accruals (347) (302) Stamp duty payable on AirportlinkM7 acquisition - (108) (347) (410) Net working capital 936 545
Cash and cash equivalents For the purpose of presentation in the consolidated statement of cash flows, cash and cash equivalents includes cash on hand, deposits held at call with financial institutions, other short-term, highly liquid investments with original maturities of three months or less that are readily convertible to known amounts of cash and which are subject to an insignificant risk of changes in value, and bank overdrafts. Bank overdrafts are shown within borrowings in current liabilities. All cash balances are interest bearing.
The amount shown in cash and cash equivalents includes $223 million not available for general use at 30 June 2017 (2016: $376 million) of which $132 million (2016: $209 million) belongs to TIL. This comprises amounts required to be held under maintenance and funding reserves and prepaid tolls, which are not available for general use.
Current held to maturity investments as shown in the table above are short term investments in government treasuries that are due to mature within 12 months, which management intends to hold to maturity.
Trade and other receivables Loans and receivables are non-derivative financial assets with fixed or determinable payments that are not quoted in an active market. They are included in current assets, except for those with maturities greater than 12 months after the reporting date which are classified as non-current assets. Trade receivables are recognised initially at fair value and subsequently measured at amortised cost using the effective interest method, less allowance for impairment. Trade receivables are due for settlement no more than 30 days from revenue recognition.
Collectability of trade receivables is reviewed on an ongoing basis. Debts which are known to be unrecoverable are written off by reducing the carrying amount of trade debtors directly. An allowance for impairment is used when there is evidence that the Group will not be able to collect all amounts due according to the original terms of the receivables. The amount of the allowance for impairment is the difference between the carrying amount and the amount expected to be recoverable. The additional amount of the allowance for doubtful debtors is recognised in profit or loss.
As at 30 June 2017, the Group held an allowance for doubtful debtors of $2 million (2016: $2 million), recognised for current trade receivables that were considered potentially unrecoverable. As at 30 June 2017, trade receivables of $26 million (2016: $20 million) were overdue but the Group still believes that these overdue amounts will be received in full. The other classes within trade and other receivables do not contain amounts that are considered to be potentially unrecoverable.
The carrying amount of trade and other receivables approximates their fair value.
TUIR026_Annual_Report_2017_inner_spreads_art02_sp.indd 65 23/8/17 10:31

2017 Transurban Annual Report66
Transurban Holdings Limited Notes to the consolidated financial statements
for the year ended 30 June 2017
66
Security holder outcomes B9 Earnings per stapled security
Reconciliation of earnings used in calculating earnings per security 2017 2016 Profit attributable to ordinary security holders of the stapled group ($M) 239 99
Weighted average number of securities (M) 2,046 1,982 Basic and diluted earnings per security attributable to the ordinary security holders of the stapled group (Cents) 11.7 5.0
B10 Dividends/distributions and free cash
Total $M
Paid in cash
$M
Settled in securities
$M Cents
Date paid/ payable
Dividends/distributions paid by the Group
2016
Declared 15 May 2015 Franked THL 65 56 9 3.5 Unfranked THT 326 269 57 17.0 391 325 66 20.5 14 August 2015 Declared 24 November 20151 Franked THL 69 56 13 3.5 Unfranked THT 366 308 58 19.0 435 364 71 22.5 12 February 2016 Total paid FY16 826 689 137 43.0
2017
Declared 24 May 20161 Franked THL 70 60 10 3.5 Unfranked THT 396 331 65 19.5 466 391 75 23.0 12 August 2016 Declared 5 December 20162 Franked THL 72 55 17 3.5 Unfranked THT 439 355 84 21.5 511 410 101 25.0 10 February 2017 Total paid FY17 977 801 176 48.0
Dividends/distributions payable by the Group
Declared 23 May 20172
Franked THL 72 − − 3.5 Unfranked THT 472 − − 23.0 544 − − 26.5 11 August 2017
1. Total declared FY16 is $901 million. 2. Total declared FY17 is $1,055 million.
TUIR026_Annual_Report_2017_inner_spreads_art02_sp.indd 66 23/8/17 10:31

672017 Transurban Annual Report
Transurban Holdings Limited Notes to the consolidated financial statements
for the year ended 30 June 2017
67
B10 Dividends/distributions and free cash (continued)
Distribution policy and free cash calculation The Group's distribution policy is to align distributions with free cash from operations. The Group calculates free cash as follows:
2017
$M 2016
$M Cash flows from operating activities 837 910 Add back transaction and integration costs related to acquisitions (non 100% owned entities) 113 23 Add back payments for maintenance of intangible assets 69 52 Less cash flow from operating activities from consolidated non 100% owned entities (312) (284) Less allowance for maintenance of intangible assets for 100% owned assets (61) (60) Adjust for distributions and interest received from non 100% owned entities M1 Eastern Distributor distribution 55 44 M5 distribution and term loan note interest 68 39 Transurban Queensland distribution and shareholder loan note interest 161 108 NWRG distribution 290 94 Free cash 1,220 926 Weighted average securities on issue (millions)1 2,048 1,978 Free cash per security (cents) – weighted average securities 59.6 46.8
1. The weighting applied to securities is based on their eligibility for distributions during the year.
Franking credits
2017
$M 2016
$M Franking credits available for subsequent periods based on a tax rate of 30.0% (2016: 30.0%) 158 193
Franking credits available for subsequent periods relate to Airport Motorway Holdings Pty Ltd ($133 million) (2016: $133 million) and Transurban Holdings Limited ($25 million) (2016: $60 million).
Distribution provision A provision for distribution is recognised for any distribution declared and authorised on or before the end of the reporting period, but not distributed by the end of the reporting period. These distributions are provided for once they are approved by the board, are announced to equity holders and are no longer at the discretion of the entity.
Movements in distribution provision Movements in the distribution provision during the financial year are set out below:
Distribution to security holders
$M
Distributions to non-controlling interest – other
$M Total
$M
Balance at 1 July 2015 391 47 438 Additional provision recognised 901 58 959 Amounts paid (689) (55) (744) Amounts reinvested (137) – (137) Balance at 30 June 2016 466 50 516 Additional provision recognised 1,055 90 1,145 Amounts paid (801) (90) (891) Amounts reinvested (176) – (176) Balance at 30 June 2017 544 50 594
TUIR026_Annual_Report_2017_inner_spreads_art02_sp.indd 67 23/8/17 10:31

2017 Transurban Annual Report68
Transurban Holdings Limited Notes to the consolidated financial statements
for the year ended 30 June 2017
68
Capital and borrowings B11 Contributed equity
2017
$M 2016
$M
Fully paid stapled securities 1,450 1,422 1,450 1,422
Stapled securities Stapled securities are classified as equity and entitle the holder to participate in distributions and on winding up of the Group in proportion to the number of securities held. Every holder of a stapled security present at a meeting, in person or by proxy, is entitled to one vote. The issued units of the Group are made up of a parcel of stapled securities, each parcel comprising one share in THL, one unit in THT and one share in TIL. The individual securities comprising a parcel of stapled securities cannot be traded separately.
Other contributed equity attributable to security holders of the Group relating to THT and TIL of $10,974 million is included within non-controlling interests – THT/TIL.
B12 Reserves
Cash flow hedges
$M
Foreign currency
translation $M
Transactions with non-
controlling interests
$M Total
$M Balance 1 July 2015 (94) 23 1 (70) Revaluation – gross 18 (1) – 17 Deferred tax (2) – – (2) Share of other comprehensive income of equity accounted investments, net of tax (11) – – (11) Balance 30 June 2016 (89) 22 1 (66) Revaluation – gross 4 (4) – – Deferred tax – 1 – 1 Transfers to profit – 3 – 3 Share of other comprehensive income of equity accounted investments, net of tax 8 – – 8 Balance 30 June 2017 (77) 22 1 (54)
Nature of reserves Purpose of reserves
Cash flow hedges Used to record gains or losses on cash flow hedging instruments, which are used by the Group to mitigate the risk of movements in exchange rates and interest rates. Amounts are reclassified to profit or loss when the transaction to which the hedge is linked (such as the payment of interest) affects profit or loss.
Foreign currency translation
Exchange differences arising on translation of the US operations of the Group are recognised in this reserve.
Transactions with non-controlling interests
The Group uses the economic entity approach when accounting for transactions with non-controlling interests.
TUIR026_Annual_Report_2017_inner_spreads_art02_sp.indd 68 23/8/17 10:31

692017 Transurban Annual Report
Transurban Holdings Limited Notes to the consolidated financial statements
for the year ended 30 June 2017
69
B13 Net finance costs
2017
$M 2016
$M Finance income Interest income on held-to-maturity investments 42 23 Interest income on bank deposits 21 23 Total finance income 63 46 Finance costs Interest and finance charges paid/payable (749) (698) Unwind of discount on liabilities – promissory and concession notes (8) (19) Unwind of discount on liabilities – other liabilities (15) (11) Unwind of discount on liabilities – maintenance provision (38) (41) Net foreign exchange losses (2) (5) Total finance costs (812) (774) Net finance costs (749) (728)
An additional $13 million (2016: $2 million) of financing costs have been capitalised and included in the carrying value of assets under construction.
B14 Borrowings 2017
$M 2016
$M Current TIFIA 12 – Capital markets debt 300 – U.S. private placement 163 129 Term debt 405 276 Total current borrowings 880 405 Non-current Working capital facilities 30 60 Capital markets debt 6,196 5,308 U.S. private placement 2,619 2,078 Term debt 2,527 3,535 TIFIA 1,176 1,167 Shareholder loan notes 320 320 Total non-current borrowings 12,868 12,468 Total borrowings 13,748 12,873
Accounting policy Borrowings are initially recognised at fair value, net of transaction costs incurred. Borrowings are subsequently measured at amortised cost. Any difference between the proceeds (net of transaction costs) and the redemption amount is recognised in profit or loss over the period of the borrowings using the effective interest method. Fees paid on the establishment of loan facilities are recognised as transaction costs of the loan to the extent that it is probable that some or all of the facility will be drawn down. In this case, the fee is deferred until the draw down occurs. To the extent there is no evidence that it is probable that some or all of the facility will be drawn down, the fee is capitalised as a prepayment for liquidity services and amortised over the period of the facility to which it relates.
Borrowings are removed from the balance sheet when the obligation specified in the contract is discharged, cancelled or expired. The difference between the carrying amount of a financial liability that has been extinguished or transferred to another party and the consideration paid, including any non-cash assets transferred or liabilities assumed, is recognised in profit or loss as finance income or finance costs. Borrowings are classified as current liabilities unless the Group has an unconditional right to defer settlement of the liability for at least 12 months after the reporting period.
Borrowing costs are recognised as expenses in the period in which they are incurred, except to the extent to which they relate to the construction of qualifying assets in which case specifically identifiable borrowing costs are capitalised into the cost of the asset. Borrowing costs include interest on short-term and long-term borrowings.
Costs incurred in connection with the arrangement of borrowings are capitalised and amortised over the effective period of the funding.
TUIR026_Annual_Report_2017_inner_spreads_art02_sp.indd 69 23/8/17 10:31

2017 Transurban Annual Report70
Transurban Holdings Limited Notes to the consolidated financial statements
for the year ended 30 June 2017
70
B14 Borrowings (continued)
Financing arrangements and credit facilities Credit facilities are provided as part of the overall debt funding structure of the Group. The drawn component of each facility is shown below:
Maturity Carrying value
2017
$M 2016
$M Corporate debt Working capital facilities drawn AUD 100m facility Jun 2018 - 62 AUD 100m facility Jun 2019 33 - Net capitalised borrowing costs (3) (2) Capital markets debt Domestic wrapped bond AUD 300m Nov 2017 300 300 EMTN CAD 250m Mar 2019 250 260 EMTN EUR 500m Oct 2020 743 746 EMTN EUR 600m Sep 2024 892 896 EMTN EUR 500m Aug 2025 743 746 US 144A USD 550m Feb 2026 715 741 US 144A USD 550m Mar 2027 715 - EMTN NOK 750m Jul 2027 117 - Net capitalised borrowing costs (35) (27) U.S. private placement Nov 2006 – Tranche A USD 43m (plus accreted interest)1 Nov 2016 - 77 Dec 2004 – Tranche B USD 39m1 Dec 2016 - 52 Aug 2005 – Tranche B USD 126m Aug 2017 163 169 Nov 2006 – Tranche B USD 136m (plus accreted interest) Nov 2018 236 244 Dec 2004 – Tranche C USD 109m Dec 2019 141 146 Dec 2004 – Tranche D AUD 72m Dec 2019 72 72 Aug 2005 – Tranche C USD 157m Aug 2020 203 211 Nov 2006 – Tranche C USD 121m (plus accreted interest) Nov 2021 211 218 Nov 2006 – Tranche D USD 50m (plus accreted interest) Nov 2026 88 91 Net capitalised borrowing costs (1) (1) Total corporate debt, net of capitalised borrowing costs 5,583 5,001 1. These facilities were repaid during FY17.
TUIR026_Annual_Report_2017_inner_spreads_art02_sp.indd 70 23/8/17 10:31

712017 Transurban Annual Report
Transurban Holdings Limited Notes to the consolidated financial statements
for the year ended 30 June 2017
71
B14 Borrowings (continued)
Financing arrangements and credit facilities (continued) Maturity Carrying value
2017
$M 2016
$M
Non-recourse debt Capital markets debt Airport Motorway Trust – Domestic bond AUD 300m Dec 2020 300 300 Transurban Queensland Finance – Domestic bond AUD 250m Dec 2021 250 250 Transurban Queensland Finance – EMTN CHF 200m Jun 2023 272 275 Transurban Queensland Finance – Domestic bond AUD 200m Oct 2023 200 - Transurban Queensland Finance – Domestic bond AUD 200m Dec 2024 200 200 Transurban Queensland Finance – EMTN CHF 175m Nov 2026 238 - 95 Express Lanes – Private activity bonds USD 72m Jul 20343 93 97 95 Express Lanes – Private activity bonds USD 170m Jan 20403 221 229 495 Express Lanes – Private activity bonds USD 225m Dec 2047 292 303 Net capitalised borrowing costs (10) (9) U.S. private placement Transurban Queensland Finance – Sep 2015 – Tranche A USD 155m Sep 2025 202 209 Transurban Queensland Finance – Dec 2016 – Tranche A USD 130m Dec 2026 169 - Transurban Queensland Finance – Dec 2016 – Tranche D AUD 35m Dec 2026 35 - Transurban Queensland Finance – Sep 2015 – Tranche B USD 230m Sep 2027 299 310 Transurban Queensland Finance – Dec 2016 – Tranche B USD 225m Dec 2028 293 - Transurban Queensland Finance – Sep 2015 – Tranche C USD 256m Sep 2030 333 345 Transurban Queensland Finance – Sep 2015 – Tranche D AUD 70m Sep 2030 70 70 Transurban Queensland Finance – Dec 2016 – Tranche C USD 78m Dec 2031 101 - Transurban Queensland Finance – Dec 2016 – Tranche E AUD 75m Dec 2031 75 - Transurban Queensland Finance – Dec 2016 – Tranche F AUD 100m Jan 2035 100 - Net capitalised borrowing costs (8) (5) Term debt Cross City Tunnel Trust – Term debt AUD 277m1 Jun 2017 - 277 Transurban Queensland Finance – Term debt AUD 420m2 Jul 2017 - 420 Hills Motorway Trust – Term debt AUD 405m Mar 2018 405 405 Airport Motorway Trust – Term debt AUD 225m Jul 2018 225 225 TQ APL Finance – Term debt AUD 475m Apr 2019 475 475 Transurban Queensland Finance – Term debt AUD 750m2 Jul 2019 - 750 Cross City Tunnel Trust – Term debt AUD 278m Dec 2019 278 - Transurban Queensland Finance – Capex facility AUD 820m Dec 2019 77 - Hills Motorway Trust – Term debt AUD 350m Mar 2020 350 350 TQ APL Finance – Term debt AUD 475m Apr 2021 475 475 Lane Cove Tunnel Trust – Term debt AUD 160m May 2021 160 120 Lane Cove Tunnel Trust – Term debt AUD 60m May 2025 60 60 Lane Cove Tunnel Trust – Term debt AUD 40m May 2028 40 40 Lane Cove Tunnel Trust – Term debt AUD 160m May 2028 160 - Transurban Queensland Finance – Term debt AUD 200m Apr 2030 200 200 Lane Cove Tunnel Trust – Term debt AUD 40m May 2031 40 40 Net capitalised borrowing costs (13) (26) TIFIA loans 495 Express Lanes – Facility limit USD 589m (plus accreted interest) Oct 20473,4 863 843 95 Express Lanes – Facility limit USD 300m (plus accreted interest) Jan 20483,4 325 324 Shareholder loan notes Loan from Transurban Queensland consortium partners – AUD 281m Dec 2048 281 281 Loan from Transurban Queensland consortium partners – AUD 39m Jul 2053 39 39 Total non-recourse debt, net of capitalised borrowing costs 8,165 7,872 Total debt 13,748 12,873 1. This facility was refinanced during FY17. 2. These facilities were repaid during FY17. 3. This represents the final maturity. 4. These facilities require principal repayments throughout their life, with the first such payment due at the completion of the interest capitalisation
period.
TUIR026_Annual_Report_2017_inner_spreads_art02_sp.indd 71 23/8/17 10:31

2017 Transurban Annual Report72
Transurban Holdings Limited Notes to the consolidated financial statements
for the year ended 30 June 2017
72
B14 Borrowings (continued)
Working capital facilities § The corporate facilities are secured by first ranking charges granted by Transurban Finance Company Pty Ltd,
Transurban Finance Trust, Transurban Holdings Limited, Transurban Holding Trust, Transurban International Limited and Transurban Limited;
§ The Transurban Queensland Finance facility is secured against the respective rights of Transurban Queensland Holdings 1 Pty Limited, Transurban Queensland Holdings 2 Pty Limited, Transurban Queensland Invest Trust and their assets. At 30 June 2017 the facility was undrawn; and
§ The AirportlinkM7 facility is secured against the respective rights of APL Hold Co Pty Limited, APL Co Pty Limited, TQ APL Hold Trust, TQ APL Asset Trust and their assets. At 30 June 2017 the facility was undrawn.
Capital markets debt § The corporate domestic bonds are secured by first ranking charges granted by Transurban Finance Company
Pty Ltd, Transurban Finance Trust, Transurban Holdings Limited, Transurban Holding Trust, Transurban International Limited and Transurban Limited;
§ A corporate secured EMTN program was established in October 2011 with a program limit of USD$2 billion, which increased to USD $5 billion in May 2015. Under the program the Group may from time to time issue notes denominated in any currency. These facilities are secured by first ranking charges granted by Transurban Finance Company Pty Ltd, Transurban Finance Trust, Transurban Holdings Limited, Transurban Holding Trust, Transurban International Limited and Transurban Limited;
§ The corporate US 144A notes are secured by first ranking charges granted by Transurban Finance Company Pty Ltd, Transurban Finance Trust, Transurban Holdings Limited, Transurban Holding Trust, Transurban International Limited and Transurban Limited;
§ The Airport Motorway Trust domestic bond is secured against the respective rights of Airport Motorway Limited and Airport Motorway Trust and their assets;
§ The Transurban Queensland Finance domestic bonds are secured against the respective rights of Transurban Queensland Holdings 1 Pty Limited, Transurban Queensland Holdings 2 Pty Limited, Transurban Queensland Invest Trust and their assets;
§ A Transurban Queensland Finance EMTN program was established in March 2016 with a program limit of USD$2 billion. Under the program, Transurban Queensland Finance may from time to time issue notes denominated in any currency. These notes are secured against the respective rights of Transurban Queensland Holdings 1 Pty Limited, Transurban Queensland Holdings 2 Pty Limited, Transurban Queensland Invest Trust and their assets;
§ The 95 Express Lanes Private Activity Bonds (‘PABs’) are secured against the rights of 95 Express Lanes LLC and its assets; and
§ The 495 Express Lanes PABs are secured against the rights of Capital Beltway Express LLC and its assets.
U.S. private placement § Corporate U.S. private placement facilities are secured by first ranking charges granted by Transurban Finance
Company Pty Ltd, Transurban Finance Trust, Transurban Holdings Limited, Transurban Holding Trust, Transurban International Limited and Transurban Limited; and
§ The Transurban Queensland Finance U.S private placement facilities are secured against the respective rights of Transurban Queensland Holdings 1 Pty Limited, Transurban Queensland Holdings 2 Pty Limited, Transurban Queensland Invest Trust and their assets.
TUIR026_Annual_Report_2017_inner_spreads_art02_sp.indd 72 23/8/17 10:31
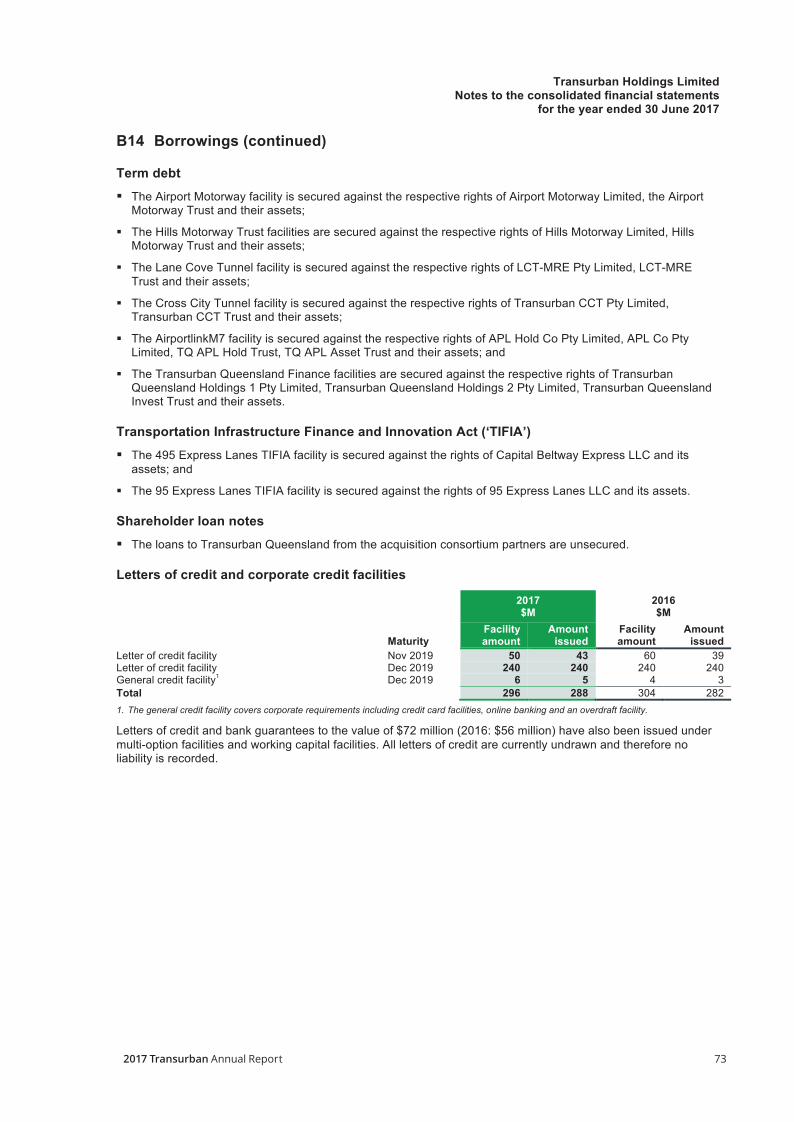
732017 Transurban Annual Report
Transurban Holdings Limited Notes to the consolidated financial statements
for the year ended 30 June 2017
73
B14 Borrowings (continued)
Term debt § The Airport Motorway facility is secured against the respective rights of Airport Motorway Limited, the Airport
Motorway Trust and their assets; § The Hills Motorway Trust facilities are secured against the respective rights of Hills Motorway Limited, Hills
Motorway Trust and their assets;
§ The Lane Cove Tunnel facility is secured against the respective rights of LCT-MRE Pty Limited, LCT-MRE Trust and their assets;
§ The Cross City Tunnel facility is secured against the respective rights of Transurban CCT Pty Limited, Transurban CCT Trust and their assets;
§ The AirportlinkM7 facility is secured against the respective rights of APL Hold Co Pty Limited, APL Co Pty Limited, TQ APL Hold Trust, TQ APL Asset Trust and their assets; and
§ The Transurban Queensland Finance facilities are secured against the respective rights of Transurban Queensland Holdings 1 Pty Limited, Transurban Queensland Holdings 2 Pty Limited, Transurban Queensland Invest Trust and their assets.
Transportation Infrastructure Finance and Innovation Act (‘TIFIA’) § The 495 Express Lanes TIFIA facility is secured against the rights of Capital Beltway Express LLC and its
assets; and § The 95 Express Lanes TIFIA facility is secured against the rights of 95 Express Lanes LLC and its assets.
Shareholder loan notes § The loans to Transurban Queensland from the acquisition consortium partners are unsecured.
Letters of credit and corporate credit facilities 2017
$M 2016 $M
Maturity
Facility amount
Amount issued
Facility amount
Amount issued
Letter of credit facility Nov 2019 50 43 60 39 Letter of credit facility Dec 2019 240 240 240 240 General credit facility1 Dec 2019 6 5 4 3 Total 296 288 304 282 1. The general credit facility covers corporate requirements including credit card facilities, online banking and an overdraft facility.
Letters of credit and bank guarantees to the value of $72 million (2016: $56 million) have also been issued under multi-option facilities and working capital facilities. All letters of credit are currently undrawn and therefore no liability is recorded.
TUIR026_Annual_Report_2017_inner_spreads_art02_sp.indd 73 23/8/17 10:31

2017 Transurban Annual Report74
Transurban Holdings Limited Notes to the consolidated financial statements
for the year ended 30 June 2017
74
B14 Borrowings (continued)
Covenants A number of the Group's consolidated borrowings include financial covenants, which are listed below. There have been no breaches of any of these covenants during the year.
Corporate Debt
Covenant Threshold Senior interest coverage ratio Greater than 1.25 times Group Market Capitalisation Gearing must not exceed 60%1 CityLink Interest Coverage Ratio Greater than 1.1 times
Non-Recourse Debt
Covenant Threshold Airport Motorway Trust Interest Coverage Ratio Greater than 1.15 times Hills Motorway Trust Interest Coverage Ratio Greater than 1.15 times Lane Cove Tunnel Trust Interest Coverage Ratio Greater than 1.15 times Cross City Tunnel Trust Interest Coverage Ratio Greater than 1.15 times Transurban Queensland Finance Interest Coverage Ratio Greater than 1.20 times AirportlinkM7 Finance Interest Coverage Ratio Greater than 1.20 times 495 Express Lanes Senior Debt Service Coverage Ratio Greater than 1.15 times 95 Express Lanes Senior Debt Service Coverage Ratio2 Greater than 1.30 times 1. Based on the balance sheet as at 30 June 2017, the Group’s average closing security price over 20 consecutive business days would need to
be below $4.22 (2016: $4.26) per security to trigger this clause. 2. The first relevant calculation date is in December 2017, three years from project substantial completion.
B15 Derivatives and financial risk management
Derivatives 2017
$M 2016 $M
Current Non-current Current Non-current Assets Interest rate swap contracts – cash flow hedges – 8 – – Cross-currency interest rate swap contracts – cash flow hedges – 74 – 121 Total derivative financial instrument assets – 82 – 121 Liabilities Interest rate swap contracts – cash flow hedges 2 128 12 279 Forward exchange contracts – cash flow hedges 1 – 2 – Cross-currency interest rate swap contracts – cash flow hedges 2 234 3 114 Total derivative financial instrument liabilities 5 362 17 393
TUIR026_Annual_Report_2017_inner_spreads_art02_sp.indd 74 23/8/17 10:31

752017 Transurban Annual Report
Transurban Holdings Limited Notes to the consolidated financial statements
for the year ended 30 June 2017
75
B15 Derivatives and financial risk management (continued)
Accounting policy Derivatives are initially recognised at fair value on the date a derivative contract is entered into and are subsequently remeasured to their fair value at the end of each reporting period. The accounting for subsequent changes in fair value depends on whether the derivative is designated as a hedging instrument, and if so, the nature of the item being hedged. The Group designates certain derivatives as either:
§ hedges of the fair value of recognised assets or liabilities or a firm commitment (fair value hedges);
§ hedges of a particular risk associated with the cash flows of recognised assets and liabilities and highly probable forecast transactions (cash flow hedges); or
§ hedges of a net investment in a foreign operation (net investment hedges).
At the inception of the hedging transaction the Group documents the relationship between hedging instruments and hedged items, as well as its risk management objective and strategy for undertaking various hedge transactions. The Group also documents its assessment, both at hedge inception and on an ongoing basis, of whether the derivatives that are used in hedging transactions have been and will continue to be highly effective in offsetting changes in fair values or cash flows of hedged items.
The fair values of various derivative financial instruments used for hedging purposes are disclosed in this note. Movements in the cash flow hedging reserve in shareholders' equity are shown in note B12. The full fair value of a hedging derivative is classified as a non-current asset or liability when the remaining maturity of the hedged item is more than 12 months.
Fair value hedges
Changes in the fair value of derivatives that are designated and qualify as fair value hedges are recorded in profit or loss, together with any changes in the fair value of the hedged asset or liability that are attributable to the hedged risk. The gain or loss relating to the effective portion of interest rate swaps and cross currency swaps hedging fixed rate borrowings is recognised in profit or loss within finance costs, together with changes in the fair value of the hedged fixed rate borrowings attributable to interest rate risk. The gain or loss relating to the ineffective portion is recognised in profit or loss.
If the hedge no longer meets the criteria for hedge accounting, the adjustment to the carrying amount of a hedged item for which the effective interest method is used is amortised to profit or loss over the period to maturity using a recalculated effective interest rate.
Cash flow hedges
The effective portion of changes in the fair value of derivatives that are designated and qualify as cash flow hedges is recognised in other comprehensive income and accumulated in reserves in equity. The gain or loss relating to the ineffective portion is recognised immediately in profit or loss.
Amounts accumulated in equity are reclassified to profit or loss in the periods when the hedged item affects profit or loss.
When a hedging instrument expires or is sold or terminated, or when a hedge no longer meets the criteria for hedge accounting, any cumulative gain or loss existing in equity at that time remains in equity and is recognised when the forecast transaction is ultimately recognised in profit or loss. When a forecast transaction is no longer expected to occur, the cumulative gain or loss that was reported in equity is immediately transferred to profit or loss.
Net investment hedges
Hedges of net investments in foreign operations are accounted for similarly to cash flow hedges.
Any gain or loss on the hedging instrument relating to the effective portion of the hedge is recognised in other comprehensive income and accumulated in reserves in equity. The gain or loss relating to the ineffective portion is recognised immediately in profit or loss.
Gains and losses accumulated in equity are included in profit or loss when the foreign operation is partially disposed of or sold.
Derivatives that do not qualify for hedge accounting
Certain derivative instruments do not qualify for hedge accounting. Changes in the fair value of any derivative instrument that does not qualify for hedge accounting are recognised immediately in profit or loss.
TUIR026_Annual_Report_2017_inner_spreads_art02_sp.indd 75 23/8/17 10:31

2017 Transurban Annual Report76
Transurban Holdings Limited Notes to the consolidated financial statements
for the year ended 30 June 2017
76
B15 Derivatives and financial risk management (continued)
Hedging strategy and instruments used by the Group The Group uses derivative financial instruments in the normal course of business in order to hedge exposures to fluctuations in interest rates and foreign exchange rates in accordance with the Group’s financial risk management policies. The Group’s policies allow derivative transactions to be undertaken for the purpose of reducing risk and do not permit speculative trading. The instruments used by the Group are as follows:
Interest rate swap contracts – cash flow hedges
The Group uses interest rate swap contracts to manage the Group’s exposure to variable interest rates related to borrowings. Interest rate swap contracts currently in place cover 98% (2016: 100%) of the variable debt held by the Group (excluding working capital facilities).
Forward exchange contracts – cash flow hedges
The Group currently uses forward exchange contracts to protect against exchange rate movements between the AUD and foreign currencies. The Group has hedged a portion of its USD interest commitments and its capital expenditure commitments.
Cross-currency interest rate contracts – cash flow hedges
The Group has entered into cross-currency interest rate swap contracts to remove the risk of unfavourable exchange rate movements on borrowings held in foreign currencies. Under these contracts, the Group receives foreign currency at fixed rates and pays AUD at either fixed or floating rates. The Group then uses the interest rate swap contracts to hedge the floating interest rate commitments back to fixed interest rates.
Offsetting financial assets and financial liabilities
Currently there is no right or basis to present any financial assets or financial liabilities on a net basis, and as such no financial assets or financial liabilities have been presented on a net basis in the Group's balance sheet at the end of the financial year.
Hedge of net investment in foreign entity
Transurban's investment in its US based assets (495 Express Lanes and 95 Express Lanes) acts as a natural hedge against the exposure to foreign currency movements for a portion of the Group’s USD denominated borrowings. Exchange differences arising on the revaluation of these USD denominated borrowings are recognised in profit or loss in the separate financial statements of Transurban Finance Company Pty Limited. In the Group financial statements these exchange differences are recognised in the foreign currency translation reserve in equity and will be transferred to profit or loss when the Group disposes its interest in the US based assets. As at 30 June 2017, the Group has deferred $43 million in losses (2016: $94 million losses).
Financial risk management The Group’s activities expose it to a variety of financial risks: market risk (including currency risk and interest rate risk), credit risk and liquidity risk. The financial risk management function is carried out centrally under the policies approved by the Board. The Group reviews operations actively to identify and monitor all financial risks and to mitigate these risks through the use of hedging instruments where appropriate. The Board is informed on a regular basis of any material exposures to financial risks.
The Group continuously monitors risk exposures over time through review of cash flows, price movements, market analysis and ongoing communication within the Group. When measuring financial risk, the Group considers positive and negative exposures, existing hedges and the ability to offset exposures where possible.
TUIR026_Annual_Report_2017_inner_spreads_art02_sp.indd 76 23/8/17 10:31

772017 Transurban Annual Report
Transurban Holdings Limited Notes to the consolidated financial statements
for the year ended 30 June 2017
77
B15 Derivatives and financial risk management (continued) Market risk Foreign exchange risk
The Group operates internationally and is exposed to foreign exchange risk when future transactions and recognised assets and liabilities are denominated in a currency that is not the entity’s functional currency.
Foreign currency exposures are viewed as either investment exposures or operating exposures. Exposures from investments in foreign assets are generally managed using foreign currency debt. All known material operating exposures out to 12 months are hedged, either using hedging instruments, or are offset by drawing on foreign currency funds.
Exposure to foreign currency risk at the reporting date, denominated in the currency in which the risk arises, was as follows:
2017 Local $M
2016 Local $M
USD EUR CAD CHF NOK USD EUR CAD CHF NOK Net investment in foreign operation 1,253 – – – – 1,192 – – – –
Borrowings (3,001) (1,600) (250) (375) (750) (2,094) (1,600) (250) (200) – Cross-currency interest rate swaps 2,009 1,600 250 375 750 1,122 1,600 250 200 –
Net exposure 261 – – – – 220 – – – –
Sensitivity
Sensitivity to exchange rate movements based on the translation of financial instruments held at the end of the period is as follows:
2017 $M
2016 $M
Movement in post-tax profit
Increase / (decrease) in
equity Movement in
post-tax profit Increase /
(decrease) in equity
AUD/USD + 10 cents – (75) – (68) - 10 cents – 104 – 93 AUD/EUR + 5 cents – (36) – (45) - 5 cents – 46 – 58 AUD/CAD + 10 cents – (1) – (2) - 10 cents – 1 – 3 AUD/CHF + 10 cents – (15) – (10) - 10 cents – 27 – 17 AUD/NOK + 50 cents – (2) – – - 50 cents – 2 – –
The Group revalues its foreign currency denominated borrowings each period using market spot rates and, where these borrowings have been appropriately hedged, defers these movements in the cash flow hedge reserve in equity. The volatility in the cash flow hedge reserve is caused mainly by fair value movements of the cross currency interest rate swaps, which are affected by changes in forward Australian dollar/foreign currency exchange rates.
TUIR026_Annual_Report_2017_inner_spreads_art02_sp.indd 77 23/8/17 10:31

2017 Transurban Annual Report78
Transurban Holdings Limited Notes to the consolidated financial statements
for the year ended 30 June 2017
78
B15 Derivatives and financial risk management (continued) Interest rate risk
The Group’s main exposure to interest rate risk arises from cash and cash equivalents, and long-term borrowings. The Group manages interest rate risk by entering into fixed rate debt facilities or by using interest rate swaps to convert floating rate debt to fixed interest rates. Generally, the Group raises long term borrowings at floating interest rates and swaps them into fixed interest rates that are lower than those available if the Group borrowed at fixed rates directly. The Group’s policy is to hedge interest rate exposure at a minimum in compliance with the covenant requirements of funding facilities and up to 100%. Covenant requirements vary by debt facility, and require a minimum of between 50% and 80% of the interest rate exposure to be hedged. At 30 June 2017, 97% (2016: 99%) of the Group’s interest rate exposure on variable rate borrowings was hedged.
As at the reporting date, the Group had the following cash balances, variable rate borrowings and interest rate swap contracts outstanding:
2017
$M 2016
$M Cash and cash equivalents 988 834 Floating rate borrowings (3,761) (4,693) Interest rate swaps (notional principal amount) 3,652 4,631 Net exposure to interest rate risk 879 772
Sensitivity
Sensitivity to interest rate movements based on variable rate obligations is as follows:
Movement in post-tax profit
2017 $M
2016 $M
Interest rates +100bps 9 8 Interest rates –100bps (9) (8)
Credit risk The Group has no significant concentrations of credit risk from operating activities, and has policies in place to ensure that transactions are made with commercial customers with an appropriate credit history. However, as an operator of large infrastructure assets, the Group is exposed to credit risk with its financial counterparties through entering into financial transactions through the ordinary course of business. These include funds held on deposit, cash investments and the market value of derivative transactions.
The Group assesses the credit strength of potential financial counterparties using objective ratings provided by multiple independent rating agencies. The Board approved policies ensure that higher limits are granted to higher rated counterparties. The Group also seeks to mitigate its total credit exposure to counterparties by only dealing with credit worthy counterparties, limiting the exposure to any one counterparty, minimising the size of the exposure where possible through netting offsetting exposures, diversifying exposures across counterparties, closely monitoring changes in total credit exposures and changes in credit status, and taking mitigating action when necessary.
Liquidity riskThe Group maintains sufficient cash and undrawn facilities to maintain short term flexibility and enable the Group to meet financial commitments in a timely manner. The Group assesses liquidity over the short term (up to 12 months) and medium term (one to five years) by maintaining accurate forecasts of operating expenses, committed capital expenditure and payments to security holders. Long term liquidity requirements are reviewed as part of the annual strategic planning process.
Short term liquidity is managed by maintaining a strategic liquidity reserve. This reserve is based on the Group’s forecast annual operating costs and certain risk exposure scenarios as maintained by the Group’s strategic risk register, and is maintained as cash and undrawn facilities. The reserve is maintained on a rolling 12 month basis. Medium term liquidity forecasting is maintained on a rolling five year horizon.
TUIR026_Annual_Report_2017_inner_spreads_art02_sp.indd 78 23/8/17 10:31

792017 Transurban Annual Report
Transurban Holdings Limited Notes to the consolidated financial statements
for the year ended 30 June 2017
79
B15 Derivatives and financial risk management (continued) Financing arrangements
The Group had access to the following undrawn borrowing facilities at the end of the reporting period:
2017 $M
2016 $M
Floating rate Expiring within one year 407 349 Expiring beyond one year 434 527 841 876
As at 30 June 2017, the Group has letter of credit facilities and general credit facilities in place with undrawn capacity of $8 million (2016: $22 million). The facilities are committed for the term of the facility and cannot be withdrawn by the lenders without notice.
Contractual maturities of financial liabilities
The amounts disclosed in the table are the contractual undiscounted cash flows of the Group’s financial liabilities. For interest rate swaps, the cash flows have been estimated using forward interest rates applicable at the end of the reporting period.
2017 $M
1 year or less
Over 1 to 2 years
Over 2 to 3 years
Over 3 to 4 years
Over 4 to 5 years
Over 5 years
Total contractual cash flows
Carrying amount
Trade payables 347 – – – – – 347 347 Borrowings 1,158 1,677 1,353 2,377 812 12,567 19,944 13,748 Interest rate swaps 51 33 22 8 7 24 145 122 Cross-currency swaps 121 115 116 99 96 (440) 107 163 Concession and promissory notes – – – – – 493 493 78 Other liabilities 45 155 – – – – 200 186 Total 1,722 1,980 1,491 2,484 915 12,644 21,236 14,644
2016 $M
1 year or less
Over 1 to 2 years
Over 2 to 3 years
Over 3 to 4 years
Over 4 to 5 years
Over 5 years
Total contractual cash flows
Carrying amount
Trade payables 410 – – – – – 410 410 Borrowings 652 1,738 1,615 1,677 2,293 11,249 19,224 12,873 Interest rate swaps 81 69 55 33 18 78 334 291 Cross-currency swaps 93 80 54 74 51 (419) (67) (2) Concession and promissory notes – – – – – 466 466 67 Other liabilities – 45 155 – – – 200 177 Total 1,236 1,932 1,879 1,784 2,362 11,374 20,567 13,816
Capital risk management The Group is subject to a gearing ratio covenant imposed by senior secured lenders and monitors capital on the basis of the gearing ratio to ensure compliance with the covenant. There have been no breaches of the covenant during the current financial year. For further information refer to the Borrowings note B14.
The Group's objectives when managing capital is to safeguard its ability to continue as a going concern and to maintain an optimal capital structure to reduce the cost of capital, so that it can continue to provide returns to security holders and benefits for other stakeholders.
TUIR026_Annual_Report_2017_inner_spreads_art02_sp.indd 79 23/8/17 10:31
2017 Transurban Annual Report80
Transurban Holdings Limited Notes to the consolidated financial statements
for the year ended 30 June 2017
80
B15 Derivatives and financial risk management (continued) Fair value measurements The carrying value of the Group’s financial assets and liabilities approximate fair value. This is also generally the case with borrowings since either the interest payable on those borrowings is close to current market rates or the borrowings are of a short-term nature. The fair values of non-current borrowings are determined based on discounted cash flows using a current borrowing rate. They are classified as level 2 fair values in the fair value hierarchy due to the use of observable inputs.
Fair value is categorised within the fair value hierarchy based on the lowest level of input that is significant to the fair value measurement as a whole:
§ Level 1 – quoted prices (unadjusted) in active markets for identical assets or liabilities
§ Level 2 – inputs other than quoted prices included within level 1 that are observable for the asset or liability, either directly (as prices) or indirectly (derived from prices)
§ Level 3 – inputs for the asset or liability that are not based on observable market data (unobservable inputs).
All of the Group’s financial instruments measured, recognised and disclosed at fair value were valued using market observable inputs (Level 2). There were no transfers between levels during the period and there has been no change in the valuation techniques applied.
Key estimate The fair value of financial instruments that are not traded in an active market (for example, over-the-counter derivatives) is determined using valuation techniques. The Group uses its judgement to select a variety of methods and makes assumptions that are mainly based on market conditions existing at each reporting date. The fair value of both cross-currency interest rate swaps and interest rate swaps is calculated as the present value of the estimated future cash flows. The fair value of forward exchange contracts is determined using forward exchange market rates at the end of the reporting period.
TUIR026_Annual_Report_2017_inner_spreads_art02_sp.indd 80 23/8/17 10:31

812017 Transurban Annual Report
Transurban Holdings Limited Notes to the consolidated financial statements
for the year ended 30 June 2017
81
Network summary The table below summarises the key balance sheet items of the Group’s concession assets by network:
2017 $M
Equity accounted
investment carrying amount
Concession assets
Assets under construction Goodwill
Maintenance provision
Non-recourse
borrowings
Melbourne – 2,364 855 1 (134) – Sydney 654 5,005 73 260 (169) (2,011) Brisbane – 7,935 85 205 (624) (4,360) GWA – 2,489 58 – (67) (1,794) Net book amount 654 17,793 1,071 466 (994) (8,165)
2016 $M
Equity accounted
investment carrying amount
Concession assets
Assets under construction Goodwill
Maintenance provision
Non-recourse
borrowings
Melbourne – 2,498 340 1 (128) – Sydney 971 5,176 34 260 (158) (1,810) Brisbane – 8,112 13 205 (599) (4,269) GWA – 2,613 7 – (45) (1,793) Net book amount 971 18,399 394 466 (930) (7,872)
B16 Intangible assets
2017 $M
Concession assets
Assets under construction Goodwill Total
Cost 22,639 1,071 466 24,176 Accumulated amortisation (4,846) – – (4,846) Net book amount 17,793 1,071 466 19,330
2016 $M
Concession assets
Assets under construction Goodwill Total
Cost 22,684 394 466 23,544 Accumulated amortisation (4,285) – – (4,285) Net book amount 18,399 394 466 19,259
TUIR026_Annual_Report_2017_inner_spreads_art02_sp.indd 81 23/8/17 10:31

2017 Transurban Annual Report82
Transurban Holdings Limited Notes to the consolidated financial statements
for the year ended 30 June 2017
82
B16 Intangible assets (continued)
Movement in intangible assets Concession
assets $M
Assets under construction
$M Goodwill
$M Total
$M Opening balance 1 July 2015 16,716 138 466 17,320 Additions 165 332 – 497 Acquisition of subsidiary 1,891 – – 1,891 Currency and other adjustments 78 – – 78 Transfers 76 (76) – – Amortisation charge (527) – – (527) Net book amount 30 June 2016 18,399 394 466 19,259 Additions – 679 – 679 Acquisition of subsidiary – – – – Currency and other adjustments (45) (2) – (47) Transfers – – – – Amortisation charge (561) – – (561) Net book amount 30 June 2017 17,793 1,071 466 19,330
Concession assets Concession assets represent the Group's rights to operate roads under Service Concession Arrangements. All concession assets are classified as intangible assets and are amortised on a straight line basis over the term of the right to operate the asset.
Transurban has the right to toll the concession assets for the concession period. Extensions to the concession period have been granted during the period for a number of individual concessions as a result of road development projects and improvements. At the end of the concession period, all concession assets are returned to the respective Government. The remaining terms of the right to operate are reflected below:
2017 Years
2016 Years
Melbourne – Victorian State Government 18 19 Sydney – New South Wales State Government 19 – 31 20 – 32 Brisbane – Queensland State Government and Brisbane City Council 34 – 48 35 – 49 GWA – Virginia State Government 70 71
Assets under construction Assets under construction include upgrade works as part of the CityLink-Tulla Widening project in Melbourne, Hills M2 – NorthConnex Integration works in Sydney, the Logan Enhancement Project and the Inner City Bypass Project in Brisbane, and 95 Express Lanes Southern Extension in GWA. Construction costs relating to completed works are transferred to the concession asset upon final completion of the projects.
Goodwill Goodwill primarily relates to the Group's Sydney Network and Brisbane Network and has arisen from the acquisition of Hills Motorway Group, Tollaust Pty Limited and the Sydney Roads Group in Sydney and the Queensland Motorways Group in Brisbane.
TUIR026_Annual_Report_2017_inner_spreads_art02_sp.indd 82 23/8/17 10:31

832017 Transurban Annual Report
Transurban Holdings Limited Notes to the consolidated financial statements
for the year ended 30 June 2017
83
B16 Intangible assets (continued) Impairment testing of goodwill and other intangible assets
At each reporting date, the Group assesses whether there is any indication that an asset may be impaired. Where an indicator of impairment exists, the Group makes an estimate of the recoverable amount. Goodwill is tested for impairment on an annual basis, regardless of whether an indicator of impairment exists.
Recoverable amount is the greater of fair value less costs to sell and value in use. For the purpose of assessing impairment, assets are grouped at the lowest levels for which there are separately identifiable cash inflows which are largely independent of the cash inflows from other assets or groups of assets (cash-generating units).
Where the carrying amount of an intangible asset exceeds its recoverable amount, the asset is considered impaired and is written down to its recoverable amount through profit or loss. The decrement in the carrying amount is recognized as an expense in profit or loss in the reporting period in which the impairment occurs.
The recoverable amount of the Group’s cash generating units have been determined based on value-in-use calculations.
The following table sets out the key assumptions on which management has based its cash flow projections. The calculations use 3 year cash flow projections based on financial budgets reviewed by the Board. Cash flows beyond this period are modelled using a consistent set of long-term assumptions up to the end of the applicable concession period:
Melbourne Sydney Brisbane GWA 2017 2016 2017 2016 2017 2016 2017 2016
Long term CPI (% annual growth) 2.5% 2.5% 2.5% 2.5% 2.7% 2.7% 2.5% 2.5% Long term average weekly earnings (% annual growth) 3.5% 4.0% 3.5% 4.0% 3.5% 4.0% 3.0% 3.0%
Pre-tax discount rate (%) 8.2% 8.2% 8.2% 8.2% 8.2% 8.2% 8.2% 8.2%
Management has determined the values assigned to each of the above key assumptions as follows:
Assumption Approach used to determine values
Traffic volume Based on historical trends and the Group’s long term traffic forecasting models
Long term CPI (% annual growth) Based on independent external forecasts
Long term average weekly earnings (% annual growth)
Based on independent external forecasts
Pre-tax discount rate Discount rates consider specific risks relating to the CGU. In performing the value-in-use calculations for each CGU, the Group has applied post-tax discount rates to discount the forecast future attributable post tax cash flows. The equivalent pre-tax discount rates are disclosed in the table above.
Key estimate
The Group makes certain assumptions in calculating the recoverable amount of its goodwill and other intangible assets. These include assumptions around expected traffic flows and forecast operational costs. In performing the value-in-use calculation, the Group has applied the assumptions noted in the above table. Management does not consider that any reasonable possible change in the assumptions will result in the carrying value of a CGU exceeding its recoverable amount.
TUIR026_Annual_Report_2017_inner_spreads_art02_sp.indd 83 23/8/17 10:31

2017 Transurban Annual Report84
Transurban Holdings Limited Notes to the consolidated financial statements
for the year ended 30 June 2017
84
B17 Maintenance provision
Movement in maintenance provision Current
$M Non-current
$M Carrying value at 1 July 2015 82 733 Additional provision recognised 97 – Acquisition of subsidiary 4 20 Amounts paid/utilised (50) – Unwinding of discount – 41 Transfer (42) 42 Movement in foreign exchange 3 – Carrying value at 30 June 2016 94 836 Additional provision recognised 103 – Amounts paid/utilised (78) – Unwinding of discount – 38 Transfer (21) 21 Movement in foreign exchange 1 – Carrying value at 30 June 2017 99 895
Key estimate As part of its obligations under the service concession arrangements, the Group assumes responsibility for the maintenance and repair of installations of the publicly owned roads it operates. The Group records a provision for its present obligation to maintain the motorways held under concession deeds. The provision is included in the financial statements at the present value of expected future payments. The calculations to discount these amounts to their present value are based on the estimated timing and profile of expenditure occurring on the roads.
B18 Other liabilities – concession and promissory notes 2017
$M 2016
$M M1 Eastern Distributor concession note 40 33 M2 Motorway promissory note 38 34 Total 78 67
Key estimate
The Group has non-interest bearing long term debt, represented by promissory notes and concession notes payable to the Government, measured at the present value of expected future payments. The calculations to discount these notes to their present value are based on the estimated timing and profile of the repayments. Assumptions are made in determining the timing and profile, based on expected available equity cash flows of the Group's cash generating units. A discount rate is used to value the promissory notes and concession notes to their present value, which is determined through reference to other facilities in the market with similar characteristics. A discount rate of 12% (2016: 12%) has been used, which recognises the subordinated nature of these notes.
TUIR026_Annual_Report_2017_inner_spreads_art02_sp.indd 84 23/8/17 10:31

852017 Transurban Annual Report
Transurban Holdings Limited Notes to the consolidated financial statements
for the year ended 30 June 2017
85
B18 Other liabilities – concession and promissory notes (continued)
M1 Eastern Distributor The Eastern Distributor project deed between Airport Motorway Limited, Airport Motorway Trust and the New South Wales Roads and Maritime Services (‘RMS’) provides for annual concession fees of $15 million during the construction phase and for the first 24 years after completion of construction of the M1 Eastern Distributor. Until a certain threshold return is achieved, payments of concession fees due under the Project Deed will be satisfied by means of the issue of non-interest bearing concession notes.
The face value of concession notes on issue at 30 June 2017 is $300 million (2016: $285 million).
M2 Motorway The Hills Motorway Trust has entered into leases with the RMS. Annual lease liabilities under these leases total $12 million (2016: $11 million), indexed annually to the consumer price index over the estimated period that the M2 Motorway will be used. Until such time as a threshold return is achieved, payments under these leases can be made at any time at the discretion of the trustee of the Hills Motorway, by means of the issue of non-interest bearing promissory notes to the RMS.
The face value of promissory notes on issue at 30 June 2017 is $193 million (2016: $181 million).
TUIR026_Annual_Report_2017_inner_spreads_art02_sp.indd 85 23/8/17 10:31
2017 Transurban Annual Report86
Transurban Holdings Limited Notes to the consolidated financial statements
for the year ended 30 June 2017
86
Group structure
B19 Principles of consolidation
Subsidiaries Subsidiaries are fully consolidated from the date the Group gains control of the subsidiary and are de-consolidated from the date that control ceases.
In preparing the consolidated financial statements of the Group, all inter-entity transactions and balances have been eliminated. The accounting policies adopted by the individual entities comprising the Group are consistent with the parent company.
Non-controlling interests consist of two components: § Non-controlling interest – other: external non-controlling interests relating to Transurban Queensland and
Eastern Distributor in the results and equity of subsidiaries are shown separately in the Group financial statements.
§ Non-controlling interests that relate to THT and TIL are presented separately, but relate to equity holders of the stapled group.
Associates and joint ventures Associates are all entities over which the Group has significant influence but not control and relate to the Group’s investments in Interlink M5 and the NorthWestern Roads Group (which holds the Westlink M7 and NorthConnex assets).
The Group's share of the post-acquisition profits or losses in associates is recognised in profit or loss and its share of post-acquisition movements in reserves is recognised in other comprehensive income. These post-acquisition movements are adjusted against the carrying amount of the investment. When the Group’s cumulative share of losses in an associate exceeds its investment in the asset, the Group does not recognise any further losses from this point. Dividends received from the assets listed above reduce the carrying amount of the investment.
Changes in ownership interest The Group treats transactions with non-controlling interests that do not result in a loss of control, as transactions with equity owners of the Group. A change in ownership interest results in an adjustment between the carrying amounts of the controlling and non-controlling interests to reflect their relative interests in the subsidiary. Any difference between the amount of the adjustment to non-controlling interests and any consideration paid or received is recognised in a separate reserve within equity.
TUIR026_Annual_Report_2017_inner_spreads_art02_sp.indd 86 23/8/17 10:31

872017 Transurban Annual Report
Transurban Holdings Limited Notes to the consolidated financial statements
for the year ended 30 June 2017
87
B20 Material subsidiaries The Group’s material subsidiaries are outlined in the Group structure diagram below.
1. Acquisition of AirportlinkM7 occurred on 1 April 2016.
B21 Business combinations
Accounting policy
Business combinations are accounted for using the acquisition method. The consideration transferred for the acquisition of a subsidiary comprises the fair values of the assets transferred, the liabilities incurred and the equity interests issued by the Group. The consideration transferred also includes the fair value of any contingent consideration arrangement and the fair value of any pre-existing equity interest in the subsidiary. Acquisition-related costs are expensed as incurred. Identifiable assets acquired and liabilities and contingent liabilities assumed in a business combination are, with limited exceptions, measured initially at their fair values at the acquisition date. On an acquisition-by-acquisition basis, the Group recognises any non-controlling interest in the acquiree either at fair value or at the non-controlling interest's proportionate share of the acquiree's net identifiable assets.
The excess of the consideration transferred, the amount of any non-controlling interest in the acquiree and the acquisition-date fair value of any previous equity interest in the acquiree over the fair value of the Group's share of the net identifiable assets acquired is recorded as goodwill. If those amounts are less than the fair value of the net identifiable assets of the subsidiary acquired and the measurement of all amounts has been reviewed, the difference is recognised directly in profit or loss as a bargain purchase.
Where settlement of any part of cash consideration is deferred, the amounts payable in the future are discounted to their present value as at the date of exchange. The discount rate used is the entity's incremental borrowing rate, being the rate at which a similar borrowing could be obtained from an independent financier under comparable terms and conditions.
Contingent consideration is classified either as equity or a financial liability. Amounts classified as a financial liability are subsequently remeasured to fair value with changes in fair value recognised in profit or loss.
TUIR026_Annual_Report_2017_inner_spreads_art02_sp.indd 87 23/8/17 10:31
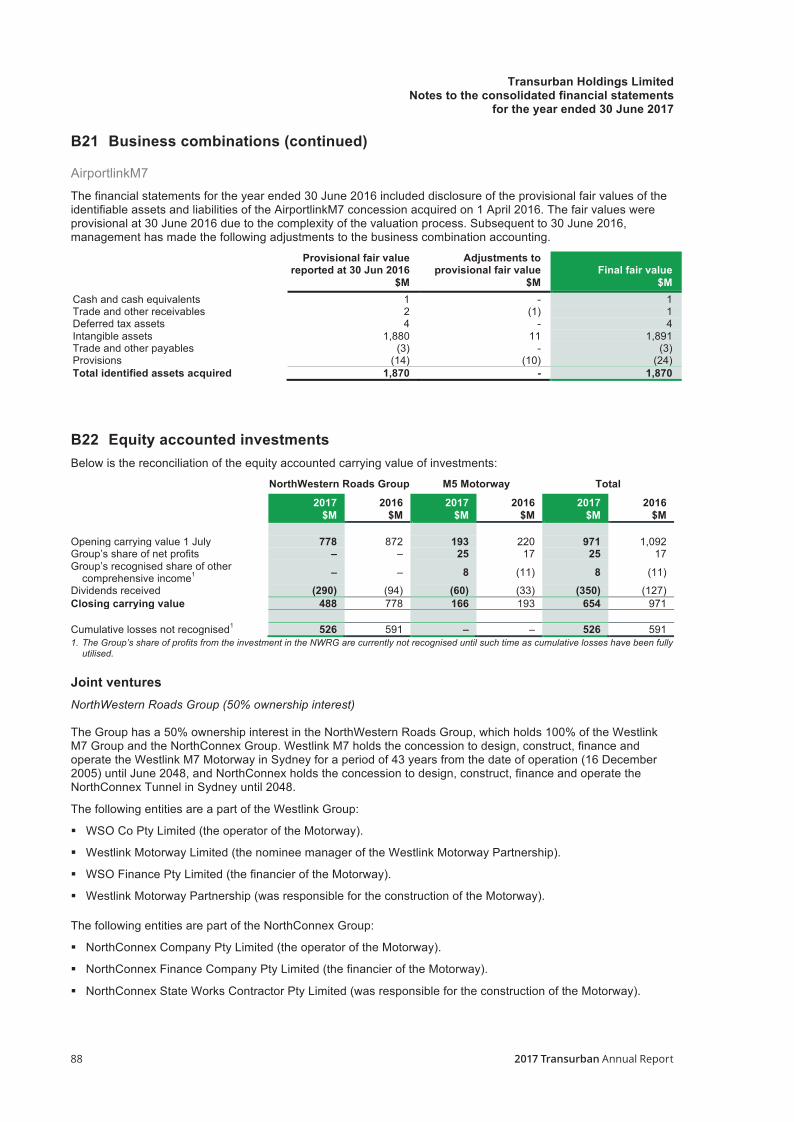
2017 Transurban Annual Report88
Transurban Holdings Limited Notes to the consolidated financial statements
for the year ended 30 June 2017
88
B21 Business combinations (continued)
AirportlinkM7
The financial statements for the year ended 30 June 2016 included disclosure of the provisional fair values of the identifiable assets and liabilities of the AirportlinkM7 concession acquired on 1 April 2016. The fair values were provisional at 30 June 2016 due to the complexity of the valuation process. Subsequent to 30 June 2016, management has made the following adjustments to the business combination accounting.
Provisional fair value reported at 30 Jun 2016
$M
Adjustments to provisional fair value
$M Final fair value
$M Cash and cash equivalents 1 - 1 Trade and other receivables 2 (1) 1 Deferred tax assets 4 - 4 Intangible assets 1,880 11 1,891 Trade and other payables (3) - (3) Provisions (14) (10) (24) Total identified assets acquired 1,870 - 1,870
B22 Equity accounted investments Below is the reconciliation of the equity accounted carrying value of investments:
NorthWestern Roads Group M5 Motorway Total 2017
$M 2016
$M 2017
$M 2016
$M 2017
$M 2016
$M Opening carrying value 1 July 778 872 193 220 971 1,092 Group’s share of net profits – – 25 17 25 17 Group’s recognised share of other
comprehensive income1 – – 8 (11) 8 (11)
Dividends received (290) (94) (60) (33) (350) (127) Closing carrying value 488 778 166 193 654 971 Cumulative losses not recognised1 526 591 – – 526 591 1. The Group’s share of profits from the investment in the NWRG are currently not recognised until such time as cumulative losses have been fully
utilised.
Joint ventures NorthWestern Roads Group (50% ownership interest)
The Group has a 50% ownership interest in the NorthWestern Roads Group, which holds 100% of the Westlink M7 Group and the NorthConnex Group. Westlink M7 holds the concession to design, construct, finance and operate the Westlink M7 Motorway in Sydney for a period of 43 years from the date of operation (16 December 2005) until June 2048, and NorthConnex holds the concession to design, construct, finance and operate the NorthConnex Tunnel in Sydney until 2048.
The following entities are a part of the Westlink Group:
§ WSO Co Pty Limited (the operator of the Motorway).
§ Westlink Motorway Limited (the nominee manager of the Westlink Motorway Partnership).
§ WSO Finance Pty Limited (the financier of the Motorway).
§ Westlink Motorway Partnership (was responsible for the construction of the Motorway).
The following entities are part of the NorthConnex Group:
§ NorthConnex Company Pty Limited (the operator of the Motorway).
§ NorthConnex Finance Company Pty Limited (the financier of the Motorway).
§ NorthConnex State Works Contractor Pty Limited (was responsible for the construction of the Motorway).
TUIR026_Annual_Report_2017_inner_spreads_art02_sp.indd 88 23/8/17 10:31

892017 Transurban Annual Report
Transurban Holdings Limited Notes to the consolidated financial statements
for the year ended 30 June 2017
89
B22 Equity accounted investments (continued)
M5 Motorway (50% ownership interest)
Tolls are collected on the M5 in both directions, with four toll collection points. The concession for the M5 Motorway was extended to December 2026 following completion of the M5 widening. At the end of the concession, all concession assets will be returned to the NSW State Government.
Summarised financial information of equity accounted investments Set out below is the summarised financial information for those investments accounted for using the equity method. The summarised financial information presented below is on a 100 per cent basis for each equity accounted investment.
NorthWestern Roads Group M5 Motorway Total 2017
$M 2016
$M 2017
$M 2016
$M 2017
$M 2016
$M Summarised balance sheet – 100% Cash and cash equivalents 123 84 136 111 259 195 Other current assets 127 50 20 19 147 69 Non-current assets 3,156 3,086 378 419 3,534 3,505 Current liabilities (498) (325) (87) (84) (585) (409) Non-current liabilities (3,094) (2,668) (927) (946) (4,021) (3,614) Net (liabilities)/assets (186) 227 (480) (481) (666) (254) Summarised statement of comprehensive income – 100%
Revenue 401 343 282 261 683 604 Construction revenue 135 135 – – 135 135 Depreciation and amortisation (81) (81) (43) (43) (124) (124) Other expenses (65) (54) (39) (39) (104) (93) Construction expenses (135) (135) – – (135) (135) Interest expense (196) (145) (45) (48) (241) (193) Income tax benefit/(expense) 6 (12) (50) (43) (44) (55) Profit/(loss) 65 51 105 88 170 139 Other comprehensive income 58 11 16 (23) 74 (12) Total comprehensive income 123 62 121 65 244 127 The following table reconciles the above summarised financial information presented on a 100 per cent basis to the proportional amounts recognised by the Group Ownership interest 50% 50% 50% 50% 50% 50% Proportional total comprehensive income 61 31 60 33 121 64
Amortisation of fair value uplift – – (27) (27) (27) (27) Group's share of comprehensive income 61 31 33 6 94 37
Profits not recognised (61) (31) – – (61) (31) Group's recognised share of total comprehensive income – – 33 6 33 6
Group's share of dividends/distributions received 290 94 60 33 350 127
TUIR026_Annual_Report_2017_inner_spreads_art02_sp.indd 89 23/8/17 10:31

2017 Transurban Annual Report90
Transurban Holdings Limited Notes to the consolidated financial statements
for the year ended 30 June 2017
90
B23 Non-controlling interests – other Set out below is summarised financial information for each material subsidiary (see note B20) that has non-controlling interests (NCI) that are material and external to the stapled Group and the total external non-controlling interest. The amounts disclosed are before inter-company eliminations.
Transurban Queensland 37.5%
Airport Motorway 24.9%
Total non-controlling interests
2017 $M
2016 $M
2017 $M
2016 $M
2017 $M
2016 $M
Summarised balance sheet Current assets 132 244 8 10 140 254 Non-current assets 8,933 9,069 1,701 1,740 10,634 10,809 Current liabilities (195) (283) (215) (211) (410) (494) Non-current liabilities (5,662) (5,549) (1,093) (1,099) (6,755) (6,648) Net assets 3,208 3,481 401 440 3,609 3,921 Carrying amount of NCI 1,204 1,305 100 110 1,312 1,423 Summarised statement of comprehensive income
Revenue 619 512 136 127 755 639 Expenses (718) (731) (107) (107) (825) (838) (Loss)/profit for the year (99) (219) 29 20 (70) (199) Other comprehensive income (OCI) 20 (70) 7 4 27 (66) Total comprehensive income (79) (289) 36 24 (43) (265) (Loss)/profit allocated to NCI (37) (82) 7 5 (30) (77) OCI allocated to NCI 7 (26) 2 1 9 (25) Summarised cash flows Cash flows from operating activities 33 118 71 60 104 178 Cash flows from investing activities (74) (2,006) – – (74) (2,006) Cash flows from financing activities (81) 2,027 (73) (59) (154) 1,968 Net (decreases)/increases in cash and cash equivalents (122) 139
1
140 (2) (124)
B24 Deed of cross and intra-group guarantees
Deed of cross guarantee
Transurban Holdings Limited, Transurban Limited, Tollaust Pty Limited, Roam Tolling Pty Limited, Sydney Roads Limited, Sydney Roads Management Limited, Statewide Roads Limited, M4 Holdings No. 1 Pty Limited, M5 Holdings Pty Limited and Devome Pty Limited are party to a deed of cross guarantee under which each company guarantees the debts of the others. By entering into the deed, the wholly-owned entities have been relieved from the requirement to prepare a financial report and Directors’ report under Instrument 2016/785 issued by the Australian Securities and Investments Commission. The companies represent a 'closed group' for the purposes of the Instrument, and as there are no other parties to the deed of cross guarantee that are controlled by THL, they also represent the 'extended closed group’.
Set out on the next page is the summary financial information of the closed group:
TUIR026_Annual_Report_2017_inner_spreads_art02_sp.indd 90 23/8/17 10:31

912017 Transurban Annual Report
Transurban Holdings Limited Notes to the consolidated financial statements
for the year ended 30 June 2017
91
B24 Deed of cross and intra-group guarantees (continued)
2017
$M 2016
$M Summarised statement of comprehensive income Revenue 425 578 Operating costs (245) (208) Depreciation and amortisation expense (58) (47) Net finance costs (101) (22) Profit before income tax 21 301 Income tax benefit 69 59 Profit for the year 90 360 Total comprehensive income for the year 90 360 Summarised movements in retained earnings Accumulated losses at the beginning of the year (403) (624) Profit for the year 90 360 Dividends provided for or paid (144) (139) Retained earnings at the end of the year (457) (403) Summarised balance sheet
Current assets Cash and cash equivalents 374 63 Trade and other receivables 2,941 2,225 Total current assets 3,315 2,288 Non-current assets Other financial assets 2,187 2,384 Property, plant and equipment 296 248 Intangible assets 81 – Deferred tax assets 454 496 Total non-current assets 3,018 3,128 Total assets 6,333 5,416 Current liabilities Trade and other payables 4,918 4,249 Provisions 103 95 Total current liabilities 5,021 4,344 Non-current liabilities Payables 299 17 Deferred tax liabilities 11 22 Provisions 8 13 Total non-current liabilities 318 52 Total liabilities 5,339 4,396 Net assets 994 1,020 Equity Contributed equity 1,450 1,422 Other reserves 1 1 Retained earnings (457) (403) Total equity 994 1,020
Intra–group guarantees As at 30 June 2017, the Transurban Group comprises Transurban Holdings Limited, Transurban Holding Trust and Transurban International Limited, traded and quoted on the ASX as one triple stapled security. Under the stapling arrangement, each entity is able to provide direct and/or indirect support to each other entity and its controlled entities within the Group on a continual basis.
TUIR026_Annual_Report_2017_inner_spreads_art02_sp.indd 91 23/8/17 10:31

2017 Transurban Annual Report92
Transurban Holdings Limited Notes to the consolidated financial statements
for the year ended 30 June 2017
92
Items not recognised B25 Contingencies Contingent liabilities Contingent consideration
As a result of the acquisition of the concession assets noted below, the Group may be required to make further payments to the respective vendors in the event that the traffic and toll revenue performance of the relevant asset exceeds certain criteria. The contingent consideration is recorded at the end of each reporting period at its fair value based upon the same traffic and revenue assumptions as outlined in note B16. The following table details the current carrying value of the contingent consideration recognised within ‘Other provisions’ in the consolidated balance sheet, the maximum nominal value that could be paid under each contract and the date at which the contingent consideration is assessed and becomes payable:
Carrying
value $M
Maximum consideration
payable $M
Assessment / payment
date
Cross City Tunnel – 28 Dec 2017 Legacy Way Tunnel 89 Unlimited1 Jun 2020 Go-Between Bridge 1 Unlimited1 Jun 2018
1. The maximum consideration payable will reflect a portion of the cumulative outperformance of the concession asset as compared against an internal rate of return agreed between Transurban Queensland and the Brisbane City Council.
Other contingent liabilities
As part of the Inner City Bypass (ICB) project an increase to the truck toll multiplier is scheduled to be applied to the Brisbane City Council (BCC) Assets. This requires approval from the Queensland State Government before the change to the multiplier can take effect. This could result in a payment being made by Transurban to the BCC of up to $15 million.
As at 30 June 2017, approval of the multiplier increase has not been received or denied from the State, and as such no payment amount has been recorded.
Parent entity
The parent entity does not have any contingent liabilities at reporting date (2016: nil).
Equity accounted investments
The equity accounted investments of the Group do not have any contingent liabilities at reporting date (2016: nil).
B26 Commitments Operating
commitments Capital
commitments Operating lease commitments
2017
$M 2016
$M 2017
$M 2016
$M 2017
$M 2016
$M Within one year 166 121 514 499 6 5 Later than one year but not later than five years 322 312 168 200 22 22
Later than five years 139 207 – – 14 20 627 640 682 699 42 47
Share of commitments for equity accounted investments NorthWestern Roads Group
50% M5 Motorway
50% Total
2017
$M 2016
$M 2017
$M 2016
$M 2017
$M 2016
$M Capital commitments 859 1,078 1 – 860 1,078 Operating commitments 331 419 2 2 333 421 1,190 1,497 3 2 1,193 1,499
TUIR026_Annual_Report_2017_inner_spreads_art02_sp.indd 92 23/8/17 10:31

932017 Transurban Annual Report
Transurban Holdings Limited Notes to the consolidated financial statements
for the year ended 30 June 2017
93
B27 Subsequent events The following events have occurred subsequent to year end:
§ On 4 July 2017, Transurban Finance Company reached contractual close on a new $1,100 million corporate Syndicated Bank Debt Facility, broken down into three tranches of $360 million, $375 million and $365 million. In addition, $225 million of corporate bilateral letter of credit facilities also closed on this date. Financial close was reached on 7 July 2017. These facilities replaced the existing $900 million bilateral working capital facilities and will provide extra liquidity headroom.
§ On 26 July 2017, the Group reached financial close on the US$475 million 395 Express Lanes project. Financing for the project includes approximately US$233 million in private activity bonds (par amount), which settled in July, and a US$45 million loan from the Virginia Transportation Infrastructure Bank. Construction of the project commenced in July 2017 and is expected to be complete in late 2019.
Other than what is noted above and as disclosed elsewhere in this report, there has not arisen in the interval between the end of the financial year and the date of this report any matter or circumstance that has significantly affected, or may significantly affect, the Group’s operations, the results of those operations, or Group’s state of affairs, in future financial years.
TUIR026_Annual_Report_2017_inner_spreads_art02_sp.indd 93 23/8/17 10:31

2017 Transurban Annual Report94
Transurban Holdings Limited Notes to the consolidated financial statements
for the year ended 30 June 2017
94
OtherB28 Related party transactions Joint ventures 2017
$’000 2016
$’000 Transactions with related parties Revenue from services 17,501 14,657 Interest income 42,490 23,283 Outstanding balances with related parties Held-to-maturity investments M5 debt notes 70,000 70,000 NorthConnex shareholder loan notes 516,069 298,964 586,069 368,964
No provision for doubtful debts has been raised in relation to any outstanding balances, and no expense has been recognised in respect of bad or doubtful debts from related parties.
Transactions with related parties
Revenue for services
Revenue relates to tolling services provided to related parties.
Interest income
Interest income relates to interest earned on held to maturity investments as noted below.
Held to maturity investments
M5 debt notes
The M5 debt notes are Transurban’s debt funding contribution to the M5 West Widening Project. The fixed maturity date of the notes is 10 years after financial close of the Project. The interest rate charged on these notes is currently fixed at 5.0%.
NorthConnex shareholder loan notes
The Shareholder loan notes (‘SLNs’) earn interest at a fixed rate of 9.0% until the final day of the NorthConnex concession period. Any unpaid interest is capitalised and deemed to subscribe for further loan notes with an aggregate principal amount equal to that unpaid interest.
The SLNs are classified as a held-to-maturity receivable. They are not classified as an investment for equity accounting purposes, and therefore has not been affected by equity accounting losses from the associate. All SLNs are denominated in Australian currency.
B29 Key management personnel compensation The remuneration amounts below represent the entire amounts paid by the Group.
2017
$ 2016
$ Short-term employee benefits 12,988,993 12,204,487 Post-employment benefits 315,264 289,149 Long-term benefits 155,992 55,829 Share-based payments 5,343,402 5,371,997 Deferred short term incentives 3,266,154 2,980,450 22,069,805 20,901,912
Detailed remuneration disclosures including the key management personnel are made in the remuneration report in the Directors' report.
TUIR026_Annual_Report_2017_inner_spreads_art02_sp.indd 94 23/8/17 10:31
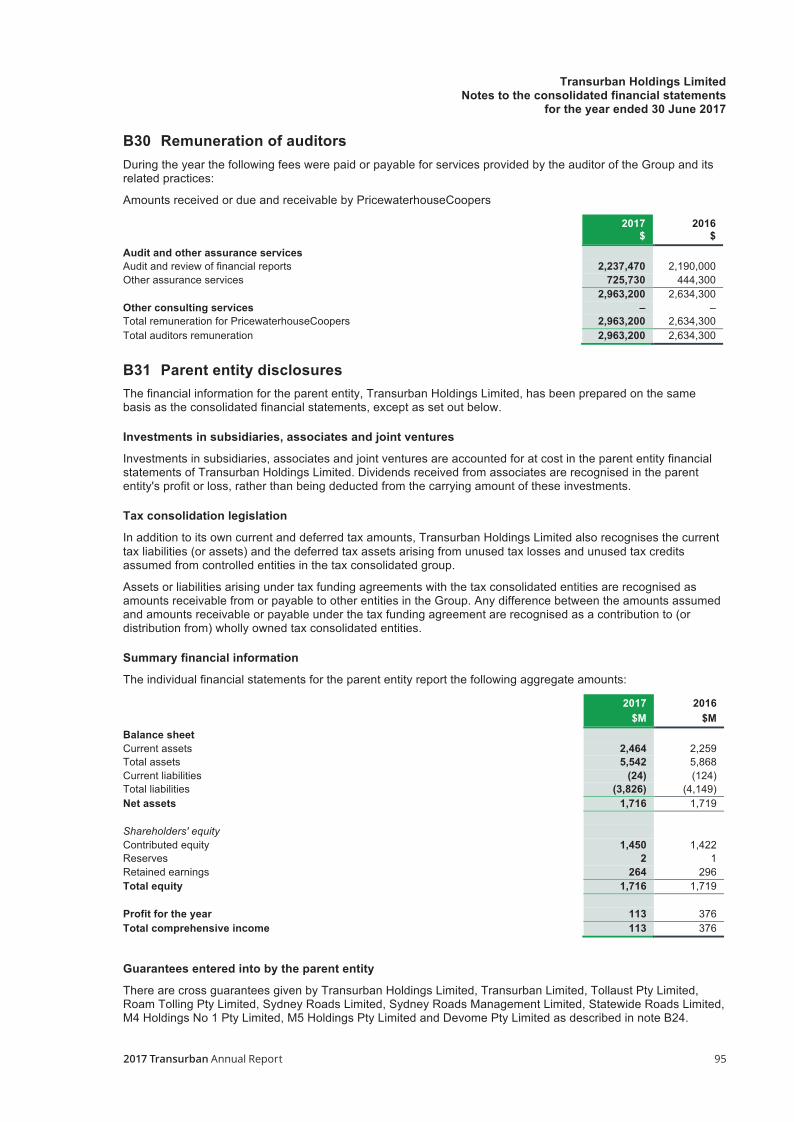
952017 Transurban Annual Report
Transurban Holdings Limited Notes to the consolidated financial statements
for the year ended 30 June 2017
95
B30 Remuneration of auditors During the year the following fees were paid or payable for services provided by the auditor of the Group and its related practices:
Amounts received or due and receivable by PricewaterhouseCoopers
2017 $
2016 $
Audit and other assurance services Audit and review of financial reports 2,237,470 2,190,000 Other assurance services 725,730 444,300 2,963,200 2,634,300 Other consulting services – – Total remuneration for PricewaterhouseCoopers 2,963,200 2,634,300 Total auditors remuneration 2,963,200 2,634,300
B31 Parent entity disclosures The financial information for the parent entity, Transurban Holdings Limited, has been prepared on the same basis as the consolidated financial statements, except as set out below.
Investments in subsidiaries, associates and joint ventures
Investments in subsidiaries, associates and joint ventures are accounted for at cost in the parent entity financial statements of Transurban Holdings Limited. Dividends received from associates are recognised in the parent entity's profit or loss, rather than being deducted from the carrying amount of these investments.
Tax consolidation legislation
In addition to its own current and deferred tax amounts, Transurban Holdings Limited also recognises the current tax liabilities (or assets) and the deferred tax assets arising from unused tax losses and unused tax credits assumed from controlled entities in the tax consolidated group.
Assets or liabilities arising under tax funding agreements with the tax consolidated entities are recognised as amounts receivable from or payable to other entities in the Group. Any difference between the amounts assumed and amounts receivable or payable under the tax funding agreement are recognised as a contribution to (or distribution from) wholly owned tax consolidated entities.
Summary financial information
The individual financial statements for the parent entity report the following aggregate amounts:
2017 $M
2016 $M
Balance sheet Current assets 2,464 2,259 Total assets 5,542 5,868 Current liabilities (24) (124) Total liabilities (3,826) (4,149) Net assets 1,716 1,719 Shareholders' equity Contributed equity 1,450 1,422 Reserves 2 1 Retained earnings 264 296 Total equity 1,716 1,719 Profit for the year 113 376 Total comprehensive income 113 376
Guarantees entered into by the parent entity
There are cross guarantees given by Transurban Holdings Limited, Transurban Limited, Tollaust Pty Limited, Roam Tolling Pty Limited, Sydney Roads Limited, Sydney Roads Management Limited, Statewide Roads Limited, M4 Holdings No 1 Pty Limited, M5 Holdings Pty Limited and Devome Pty Limited as described in note B24.
TUIR026_Annual_Report_2017_inner_spreads_art02_sp.indd 95 23/8/17 10:31

2017 Transurban Annual Report96
Transurban Holding Trust and Transurban International Limited for the year ended 30 June 2017
96
Section C: Transurban Holding Trust (‘THT’) and Transurban International Limited (‘TIL’) financial statements Consolidated statement of comprehensive income Consolidated balance sheet Consolidated statement of changes in equity Consolidated statement of cash flows
Section D: Notes to the THT and TIL financial statements Basis of preparation and significant changes
D1 Introduction
D2 Trust formation and termination
Operating performance
D3 Segment information
D4 Revenue
D5 Income tax
Security holder outcomes
D6 Distributions
D7 Earnings per stapled security
Capital and borrowings
D8 Reserves
D9 Net finance costs
D10 Borrowings
D11 Derivatives and financial risk management
Network summary D12 Intangible assets
D13 Other liabilities – concession and promissory notes
Group structure D14 Equity accounted investments
D15 Non-controlling interests
Other D16 Related party transactions
D17 Parent entity financial information
TUIR026_Annual_Report_2017_inner_spreads_art02_sp.indd 96 23/8/17 10:31

972017 Transurban Annual Report
Transurban Holding Trust and Transurban International Limited Consolidated statement of comprehensive income
for the year ended 30 June 2017
97
Transurban Holding Trust
Transurban International Limited
Note
2017 $M
2016 $M
2017 $M
2016 $M
Revenue D4 764 641 233 174 Employee benefits expense – – (20) (16) Road operating costs (2) (4) (63) (60) Construction costs (87) (35) (24) – Transaction and integration costs – (98) – – Corporate and other expenses (2) (1) (14) (12) Total expenses (91) (138) (121) (88) Earnings before depreciation and amortisation, net finance costs, equity accounted investments and income tax
673 503 112 86
Depreciation and amortisation expense (310) (276) (40) (37) Net finance costs D9 (161) (53) (164) (234) Profit/(loss) before income tax 202 174 (92) (185) Income tax benefit/(expense) – (1) 41 31 Profit/(loss) for the year 202 173 (51) (154) Profit/(loss) is attributable to: Ordinary security holders of TIL – – (51) (154) Ordinary unit holders of THT 207 209 – – Non–controlling interests D15 (5) (36) – – 202 173 (51) (154) Other comprehensive income Items that may be reclassified to profit or loss Changes in the fair value of cash flow hedges, net of tax 56 (75) 16 (20)
Exchange differences on translation of foreign operations, net of tax – – 20 (11)
Movement in share-based payments reserve 1 – – – Other comprehensive income for the year, net of tax 57 (75) 36 (31)
Total comprehensive income for the year 259 98 (15) (185) Total comprehensive income for the year is attributable to:
Ordinary security holders of TIL – – (15) (185) Ordinary unit holders of THT 255 159 – – Non-controlling interests 4 (61) – – 259 98 (15) (185) Cents Cents Cents Cents Earnings per security attributable to ordinary security holders of the group:
Basic and diluted earnings/(loss) per security D7 10.1 10.5 (2.5) (7.8)
The above consolidated statements of comprehensive income should be read in conjunction with the accompanying notes.
TUIR026_Annual_Report_2017_inner_spreads_art02_sp.indd 97 23/8/17 10:31

2017 Transurban Annual Report98
Transurban Holding Trust and Transurban International Limited Consolidated balance sheet
for the year ended 30 June 2017
98
Transurban Holding Trust
Transurban International Limited
Note
2017 $M
2016 $M
2017 $M
2016 $M
ASSETS Current assets Cash and cash equivalents 102 229 167 245 Loans to related parties 1,923 2,377 – 8 Trade and other receivables 2 2 20 16 Held-to-maturity investments – – 157 – Total current assets 2,027 2,608 344 269 Non-current assets
Equity accounted investments D14 478 768 – – Derivative financial instruments D11 8 – – – Related party receivables 7,452 5,966 – – Concession notes 946 961 – – Property, plant and equipment – – 12 4 Deferred tax assets D5 34 41 363 352 Intangible assets D12 9,700 9,920 2,547 2,620 Total non-current assets 18,618 17,656 2,922 2,976 Total assets 20,645 20,264 3,266 3,245
LIABILITIES
Current liabilities Related party payables 640 266 1,591 1,560 Trade and other payables 55 142 48 29 Borrowings D10 405 276 12 – Maintenance provision – – 1 3 Distribution payable D6 522 446 – – Derivative financial instruments D11 1 11 – – Other liabilities 67 44 6 5 Total current liabilities 1,690 1,185 1,658 1,597 Non–current liabilities
Maintenance provision – – 66 42 Deferred tax liabilities D5 – – 266 282 Related party payables 5,162 4,835 – – Borrowings D10 5,648 5,483 1,780 1,793 Derivative financial instruments D11 132 148 59 87 Other liabilities 81 89 1 – Total non–current liabilities 11,023 10,555 2,172 2,204 Total liabilities 12,713 11,740 3,830 3,801 Net assets/(liabilities) 7,932 8,524 (564) (556) EQUITY
Contributed equity – – 309 302 Issued units 10,665 10,520 – – Reserves D8 (44) (92) (140) (176) Accumulated losses (3,836) (3,132) (733) (682) Non-controlling interests D15 1,147 1,228 – – Total equity 7,932 8,524 (564) (556)
The above consolidated balance sheets should be read in conjunction with the accompanying notes.
TUIR026_Annual_Report_2017_inner_spreads_art02_sp.indd 98 23/8/17 10:31
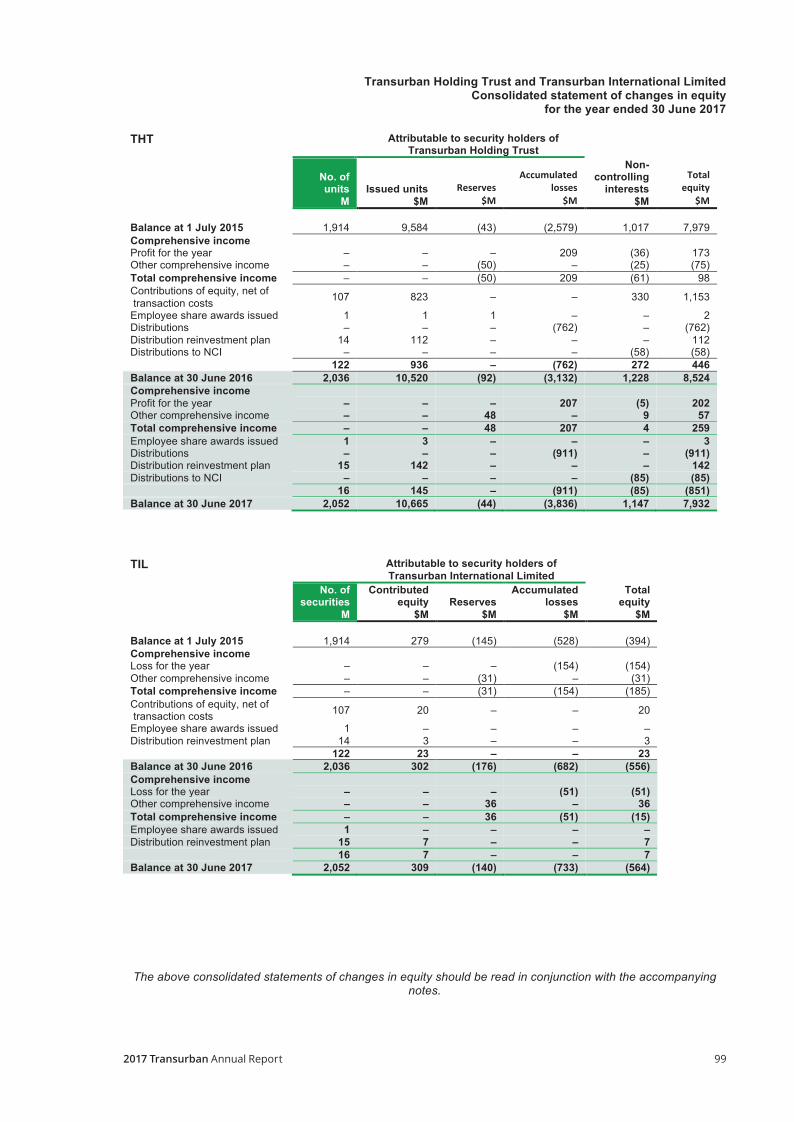
992017 Transurban Annual Report
Transurban Holding Trust and Transurban International Limited Consolidated statement of changes in equity
for the year ended 30 June 2017
99
THT Attributable to security holders of Transurban Holding Trust
No. of securities
M
No. of units
M Issued units
$M Reserves
$M
Accumulatedlosses
$M
Non-controlling
interests $M
Totalequity
$M
Balance at 1 July 2015
1,914 9,584 (43) (2,579) 1,017 7,979 Comprehensive income Profit for the year – – – 209 (36) 173 Other comprehensive income – – (50) – (25) (75) Total comprehensive income – – (50) 209 (61) 98 Contributions of equity, net of transaction costs 107 823 – – 330 1,153
Employee share awards issued 1 1 1 – – 2 Distributions – – – (762) – (762) Distribution reinvestment plan 14 112 – – – 112 Distributions to NCI – – – – (58) (58) 122 936 – (762) 272 446 Balance at 30 June 2016 2,036 10,520 (92) (3,132) 1,228 8,524 Comprehensive income Profit for the year – – – 207 (5) 202 Other comprehensive income – – 48 – 9 57 Total comprehensive income – – 48 207 4 259 Employee share awards issued 1 3 – – – 3 Distributions – – – (911) – (911) Distribution reinvestment plan 15 142 – – – 142 Distributions to NCI – – – – (85) (85) 16 145 – (911) (85) (851) Balance at 30 June 2017 2,052 10,665 (44) (3,836) 1,147 7,932
TIL Attributable to security holders of Transurban International Limited
No. of securities
M
No. of securities
M
Contributed equity
$M Reserves
$M
Accumulated losses
$M
Total equity
$M
Balance at 1 July 2015
1,914 279 (145) (528) (394) Comprehensive income Loss for the year – – – (154) (154) Other comprehensive income – – (31) – (31) Total comprehensive income – – (31) (154) (185) Contributions of equity, net of transaction costs 107 20 – – 20
Employee share awards issued 1 – – – – Distribution reinvestment plan 14 3 – – 3 122 23 – – 23 Balance at 30 June 2016 2,036 302 (176) (682) (556) Comprehensive income Loss for the year – – – (51) (51) Other comprehensive income – – 36 – 36 Total comprehensive income – – 36 (51) (15) Employee share awards issued 1 – – – – Distribution reinvestment plan 15 7 – – 7 16 7 – – 7 Balance at 30 June 2017 2,052 309 (140) (733) (564)
The above consolidated statements of changes in equity should be read in conjunction with the accompanying notes.
TUIR026_Annual_Report_2017_inner_spreads_art02_sp.indd 99 23/8/17 10:31

2017 Transurban Annual Report100
Transurban Holding Trust and Transurban International Limited Consolidated statement of cash flows
for the year ended 30 June 2017
100
Transurban Holding Trust
Transurban International Limited
Note 2017
$M 2016
$M 2017
$M 2016
$M Cash flows from operating activities Receipts from customers 652 574 207 167 Payments to suppliers (5) (2) (70) (70) Payments for maintenance of intangibles – – (1) (1) Transaction costs related to acquisitions (95) – – – Interest received 246 220 1 – Interest paid (599) (495) (33) (28) Net cash inflow from operating activities (a) 199 297 104 68 Cash flows from investing activities Payments for acquisition of subsidiary – (1,710) – – Payments for property, plant and equipment – – (9) (1) Payments for intangible assets (81) (23) (31) (19) Payments for held-to-maturity investments, net of fees – – (162) – Distributions received from equity accounted investments 290 94 – – Net cash inflow from investing activities 209 (1,639) (202) (20) Cash flows from financing activities Loans (to)/from related parties (1,858) (278) 38 18 Repayment of loans from/(to) related parties 1,796 (160) (11) (26) Proceeds from issue of securities – 821 – 20 Proceeds from borrowings (net of costs) 1,759 2,541 – – Repayment of borrowings (1,454) (1,205) (2) – Distributions paid to Transurban Group's security holders (694) (579) – –
Distributions paid to non-controlling interests in subsidiaries (84) (55) – –
Proceeds from equity issued to non-controlling interests – 330 – – Net cash outflow from financing activities (535) 1,415 25 12 Net (decrease)/increase in cash and cash equivalents (127) 73 (73) 60
Cash and cash equivalents at the beginning of the year 229 156 245 179 Effects of exchange rate changes on cash and cash equivalents – – (5) 6
Cash and cash equivalents at end of year 102 229 167 245 (a) Reconciliation of profit after income tax to net cash inflow from operating activities
THT TIL
2017
$M 2016
$M 2017
$M 2016
$M Profit/(loss) for the year 202 173 (51) (154) Depreciation and amortisation 310 276 40 37 Non-cash net finance costs 23 36 63 82 Change in operating assets and liabilities: (Increase)/decrease in trade and other receivables – (1) – (4) (Increase)/decrease in concession notes 15 (95) – – (Decrease)/increase in related party operating loans (276) (208) 67 115 (Decrease)/Increase in trade creditors and accruals (87) 112 2 2 Increase/(decrease) in other operating provisions – – 2 – Increase/(decrease) in provision for income taxes payable – 1 (41) (31)
Increase/(decrease) in maintenance provision – – 22 21 Increase/(decrease) in other liabilities 12 3 – – Net cash outflow from operating activities 199 297 104 68
The above consolidated statements of cash flows should be read in conjunction with the accompanying notes.
TUIR026_Annual_Report_2017_inner_spreads_art02_sp.indd 100 23/8/17 10:31

1012017 Transurban Annual Report
Transurban Holding Trust and Transurban International Limited Notes to the THT and TIL financial statements
for the year ended 30 June 2017
101
Basis of preparation and significant changes
D1 Introduction The Transurban Holding Trust Group consists of Transurban Holding Trust (‘THT’) and the entities it controls (‘THT Group’) and the Transurban International Limited Group consists of Transurban International Limited (‘TIL’) and the entities it controls (‘TIL Group’). THT and TIL form part of the stapled Transurban Group.
THT is registered as a managed investment scheme under Chapter 5C of the Corporations Act 2001, and as a result requires a responsible entity. The responsible entity of the THT is Transurban Infrastructure Management Limited (‘TIML’). TIML is the responsible entity of the Trust and is responsible for performing all functions that are required under the Corporations Act 2001 of a responsible entity.
THT is a Trust registered and domiciled in Australia.
TIL is a public company limited by shares and incorporated in Australia.
Going concern TIL’s current liabilities exceed its current assets by $1,314 million as at 30 June 2017. This is primarily attributable to a $1,591 million loan payable to another entity within the Transurban Group. Excluding this loan, the TIL Group has net current assets of $277 million.
Under the stapling arrangement, each entity is able to provide direct and/or indirect support to each other entity and its controlled entities within the Transurban Group.
The financial reports have been prepared on a going concern basis, which assumes the continuity of normal operations.
D2 Trust formation and termination The Transurban Holding Trust was established on 15 November 2001 and has no termination date. The Trust was registered as a managed investment scheme by the Australian Securities and Investments Commission on 28 November 2001.
TUIR026_Annual_Report_2017_inner_spreads_art02_sp.indd 101 23/8/17 10:31

2017 Transurban Annual Report102
Transurban Holding Trust and Transurban International Limited Notes to the THT and TIL financial statements
for the year ended 30 June 2017
102
Operating performance D3 Segment information Refer to note B4 for further information around the structure of the segments for the Transurban Group.
THT operating segments Management has determined that THT has one operating segment.
THT operations involve the leasing of assets and the provision of funding to the Transurban Group or associates of the Transurban Group. All revenues and expenses are directly attributable to these activities. The management structure and internal reporting of the Trust are based on this one operating segment.
TIL operating segments Management has determined that TIL has one operating segment.
TIL operations involve the development, operation and maintenance of toll roads in the Greater Washington Area. All revenues and expenses are directly attributable to these activities. The management structure and internal reporting of TIL are based on this one operating segment.
Reconciliation of segment information to statutory financial information
Segment information for TIL as disclosed in the Transurban Group segment note at B4 is reconciled to the TIL statutory financial information below.
Segment revenue
Revenue from external customers is through toll and service and fee revenues earned on toll roads. There are no inter-segment revenues. Segment revenue reconciles to total statutory revenue as follows:
TIL 2017
$M 2016
$M Total segment revenue (proportional) 209 174 Add: Construction revenue from road development activities 24 – Total revenue 233 174
Reconciliation of proportional EBITDA to statutory profit for the year
Proportional EBITDA reconciles to statutory net profit as follows: TIL
2017 $M
2016 $M
Proportional EBITDA 116 86 Add: EBITDA attributable to TIL corporate activities (disclosed in corporate and other) (4) – Statutory earnings before depreciation and amortisation, net finance costs, equity accounted investments and tax 112 86
Statutory net finance costs (164) (234) Statutory depreciation and amortisation (40) (37) Loss before tax for the year from continuing operations (92) (185) .
TUIR026_Annual_Report_2017_inner_spreads_art02_sp.indd 102 23/8/17 10:31
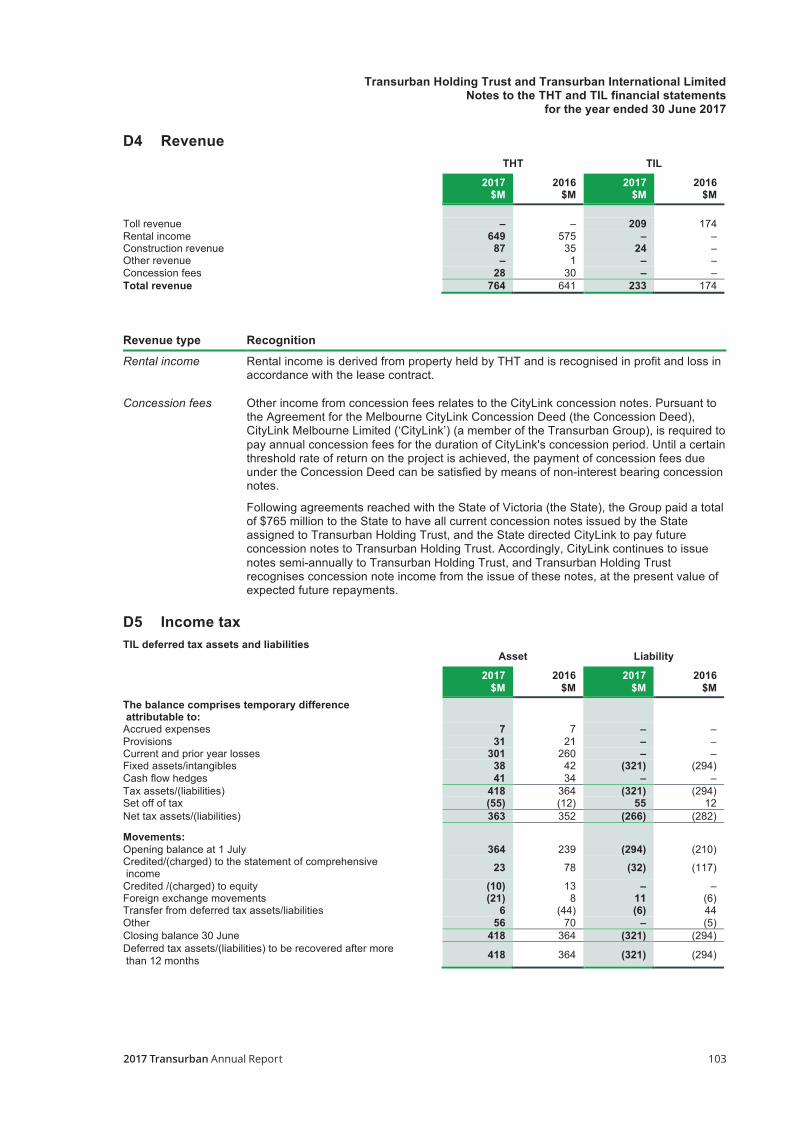
1032017 Transurban Annual Report
Transurban Holding Trust and Transurban International Limited Notes to the THT and TIL financial statements
for the year ended 30 June 2017
103
D4 Revenue THT TIL
2017 $M
2016 $M
2017 $M
2016 $M
Toll revenue – – 209 174 Rental income 649 575 – – Construction revenue 87 35 24 – Other revenue – 1 – – Concession fees 28 30 – – Total revenue 764 641 233 174
Revenue type Recognition Rental income Rental income is derived from property held by THT and is recognised in profit and loss in
accordance with the lease contract.
Concession fees Other income from concession fees relates to the CityLink concession notes. Pursuant to the Agreement for the Melbourne CityLink Concession Deed (the Concession Deed), CityLink Melbourne Limited (‘CityLink’) (a member of the Transurban Group), is required to pay annual concession fees for the duration of CityLink's concession period. Until a certain threshold rate of return on the project is achieved, the payment of concession fees due under the Concession Deed can be satisfied by means of non-interest bearing concession notes.
Following agreements reached with the State of Victoria (the State), the Group paid a total of $765 million to the State to have all current concession notes issued by the State assigned to Transurban Holding Trust, and the State directed CityLink to pay future concession notes to Transurban Holding Trust. Accordingly, CityLink continues to issue notes semi-annually to Transurban Holding Trust, and Transurban Holding Trust recognises concession note income from the issue of these notes, at the present value of expected future repayments.
D5 Income tax TIL deferred tax assets and liabilities Asset Liability
2017
$M 2016
$M 2017
$M 2016
$M The balance comprises temporary difference attributable to:
Accrued expenses 7 7 – – Provisions 31 21 – – Current and prior year losses 301 260 – – Fixed assets/intangibles 38 42 (321) (294) Cash flow hedges 41 34 – – Tax assets/(liabilities) 418 364 (321) (294) Set off of tax (55) (12) 55 12 Net tax assets/(liabilities) 363 352 (266) (282)
Movements: Opening balance at 1 July 364 239 (294) (210) Credited/(charged) to the statement of comprehensive income 23 78 (32) (117)
Credited /(charged) to equity (10) 13 – – Foreign exchange movements (21) 8 11 (6) Transfer from deferred tax assets/liabilities 6 (44) (6) 44 Other 56 70 – (5) Closing balance 30 June 418 364 (321) (294) Deferred tax assets/(liabilities) to be recovered after more than 12 months 418 364 (321) (294)
TUIR026_Annual_Report_2017_inner_spreads_art02_sp.indd 103 23/8/17 10:31

2017 Transurban Annual Report104
Transurban Holding Trust and Transurban International Limited Notes to the THT and TIL financial statements
for the year ended 30 June 2017
104
Security holder outcomes D6 Distributions Refer to note B10 of the THL financial statements for the dividends/distributions paid and payable by the Group.
Movements in distribution provision – THT
Distribution to security holders
$M
Distributions to non-controlling
interest in subsidiaries
$M
Total
$M Balance at 1 July 2015 326 46 372 Additional provision recognised 762 58 820 Amounts paid (579) (55) (634) Amounts reinvested (112) – (112) Balance at 30 June 2016 397 49 446 Additional provision recognised 911 85 996 Amounts paid (694) (84) (778) Amounts reinvested (142) – (142) Balance at 30 June 2017 472 50 522
D7 Earnings per stapled security THT TIL
2017 2016 2017 2016
Profit/(loss) attributable to ordinary security holders ($M) 207 209 (51) (154) Weighted average number of securities (M) 2,046 1,982 2,046 1,982 Basic and diluted earnings per security attributable to the ordinary security holders (Cents) 10.1 10.5 (2.5) (7.8)
TUIR026_Annual_Report_2017_inner_spreads_art02_sp.indd 104 23/8/17 10:31

1052017 Transurban Annual Report
Transurban Holding Trust and Transurban International Limited Notes to the THT and TIL financial statements
for the year ended 30 June 2017
105
Capital and borrowings
D8 Reserves Refer to note B12 for a description of the nature and purpose of each reserve.
THT
Cash flow hedges
$M
Share-based payments
$M Total
$M Balance 1 July 2015 (48) 5 (43) Revaluation, net of tax (50) 1 (49) Balance 30 June 2016 (98) 6 (92) Revaluation, net of tax 47 1 48 Balance 30 June 2017 (51) 7 (44)
TIL
Cash flow hedges
$M
Foreign currency
translation $M
Transactions with non-
controlling interests
$M Total
$M
Balance 1 July 2015 4 (91) (58) (145) Revaluation, net of tax (20) – – (20) Currency translation differences – (11) – (11) Balance 30 June 2016 (16) (102) (58) (176) Revaluation, net of tax 16 – – 16 Currency translation differences – 20 – 20 Balance 30 June 2017 – (82) (58) (140)
D9 Net finance costs THT TIL
2017
$M 2016
$M 2017
$M 2016
$M Finance income Interest income from related parties 520 477 – – Other interest income 2 8 – – Net foreign exchange gains – 2 3 – Re-measurement of concession notes receivable – 63 – – Total finance income 522 550 3 – Finance costs Interest and finance charges paid/payable (635) (587) (167) (230) Unwind of discount on liabilities – other liabilities (3) (3) – – Unwind of discount on liabilities – promissory note (2) (13) – – Net foreign exchange losses (2) – – (4) Re-measurement of concession notes receivable (41) – – – Total finance costs (683) (603) (167) (234) Net finance costs (161) (53) (164) (234)
Re-measurement of concession notes Re-measurement of concession notes represents the discount unwinding over the passage of time on these notes and the change in the payment profile of the concession notes.
TUIR026_Annual_Report_2017_inner_spreads_art02_sp.indd 105 23/8/17 10:31

2017 Transurban Annual Report106
Transurban Holding Trust and Transurban International Limited Notes to the THT and TIL financial statements
for the year ended 30 June 2017
106
D10 Borrowings Refer to note B14 for a description of each facility type. THT TIL
2017
$M 2016
$M 2017
$M 2016
$M Current TIFIA – – 12 – Term debt 405 276 – – 405 276 12 – Non-current Capital markets debt 1,452 1,018 604 626 U.S. private placement 1,669 929 – – Term debt 2,527 3,536 – – TIFIA – – 1,176 1,167 5,648 5,483 1,780 1,793 Total borrowings 6,053 5,759 1,792 1,793
D11 Derivative and financial risk management The instruments used by the Group are described in note B15.
2017 $M
2016 $M
Current Non-current Current Non-current THT TIL THT TIL THT TIL THT TIL Assets Interest rate swap contracts – cash flow hedges – – 8 – – – – –
Liabilities Interest rate swap contracts – cash flow hedges 1 – 25 59 11 – 118 87
Cross currency interest rate swap contracts – cash flow hedges – – 107 – – – 30 –
1 – 132 59 11 – 148 87
Market risk Foreign exchange risk Exposure to foreign currency risk at the reporting date, denominated in the currency in which the risk arises, was as follows:
THT TIL
2017 USD
$M
2016 USD
$M
2017 CHF
$M
2016 CHF
$M
2017 AUD
$M
2016 AUD
$M
Receivables 1,216 1,121 – – 1 1 Payables (1,165) (1,084) – – (6) (9) Borrowings (1,074) (641) (375) (200) – – Cross-currency interest rate swaps 1,074 641 375 200 – – Net exposure 51 37 – – (5) (8)
Sensitivity THT Movement in
post-tax profit Increase / (decrease) in
equity 2017
$M 2016
$M 2017
$M 2016
$M AUD/USD + 10 cents (8) (6) (28) (30) - 10 cents 10 8 40 42 AUD/CHF + 10 cents – – (15) (10) - 10 cents – – 27 17
TIL’s profit and equity are not materially impacted by movements in foreign exchange.
TUIR026_Annual_Report_2017_inner_spreads_art02_sp.indd 106 23/8/17 10:31
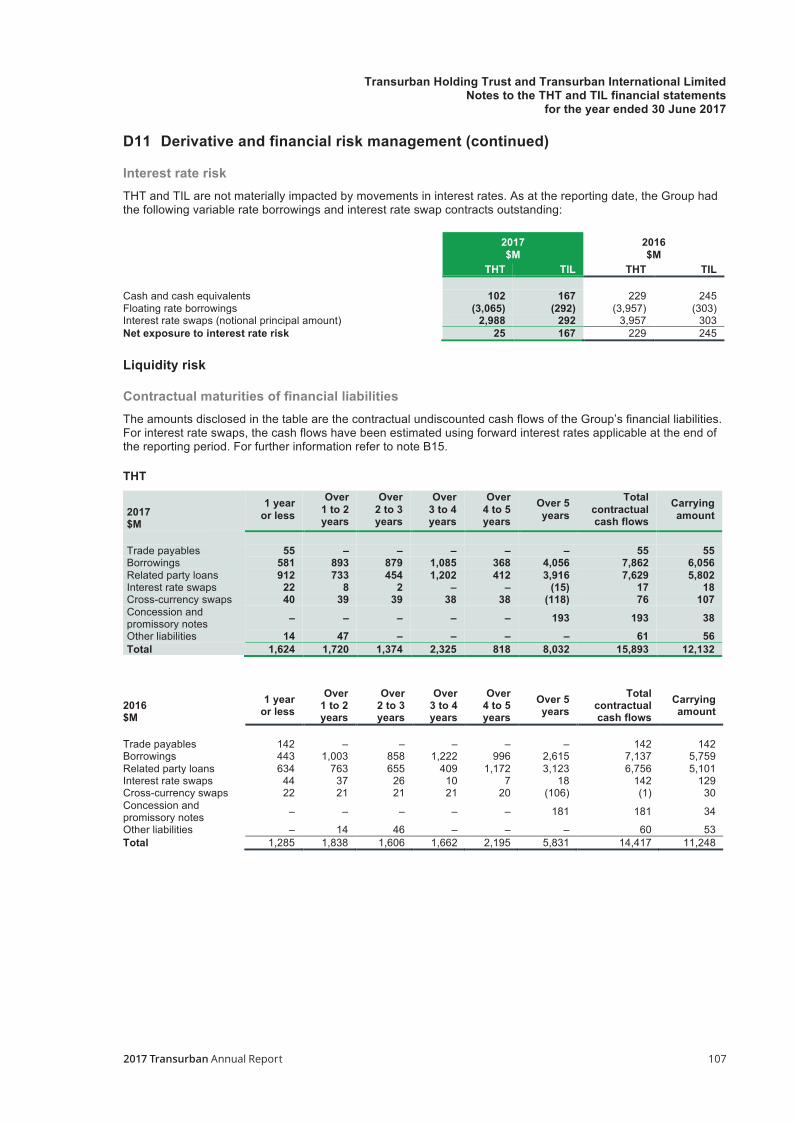
1072017 Transurban Annual Report
Transurban Holding Trust and Transurban International Limited Notes to the THT and TIL financial statements
for the year ended 30 June 2017
107
D11 Derivative and financial risk management (continued)
Interest rate risk THT and TIL are not materially impacted by movements in interest rates. As at the reporting date, the Group had the following variable rate borrowings and interest rate swap contracts outstanding:
2017 $M
2016 $M
THT TIL THT TIL Cash and cash equivalents 102 167 229 245 Floating rate borrowings (3,065) (292) (3,957) (303) Interest rate swaps (notional principal amount) 2,988 292 3,957 303 Net exposure to interest rate risk 25 167 229 245
Liquidity risk
Contractual maturities of financial liabilities The amounts disclosed in the table are the contractual undiscounted cash flows of the Group’s financial liabilities. For interest rate swaps, the cash flows have been estimated using forward interest rates applicable at the end of the reporting period. For further information refer to note B15.
THT
2017 $M
1 year or less
Over 1 to 2 years
Over 2 to 3 years
Over 3 to 4 years
Over 4 to 5 years
Over 5 years
Total contractual cash flows
Carrying amount
Trade payables 55 – – – – – 55 55 Borrowings 581 893 879 1,085 368 4,056 7,862 6,056 Related party loans 912 733 454 1,202 412 3,916 7,629 5,802 Interest rate swaps 22 8 2 – – (15) 17 18 Cross-currency swaps 40 39 39 38 38 (118) 76 107 Concession and promissory notes – – – – – 193 193 38 Other liabilities 14 47 – – – – 61 56 Total 1,624 1,720 1,374 2,325 818 8,032 15,893 12,132
2016 $M
1 year or less
Over 1 to 2 years
Over 2 to 3 years
Over 3 to 4 years
Over 4 to 5 years
Over 5 years
Total contractual cash flows
Carrying amount
Trade payables 142 – – – – – 142 142 Borrowings 443 1,003 858 1,222 996 2,615 7,137 5,759 Related party loans 634 763 655 409 1,172 3,123 6,756 5,101 Interest rate swaps 44 37 26 10 7 18 142 129 Cross-currency swaps 22 21 21 21 20 (106) (1) 30 Concession and promissory notes – – – – – 181 181 34
Other liabilities – 14 46 – – – 60 53 Total 1,285 1,838 1,606 1,662 2,195 5,831 14,417 11,248
TUIR026_Annual_Report_2017_inner_spreads_art02_sp.indd 107 23/8/17 10:31

2017 Transurban Annual Report108
Transurban Holding Trust and Transurban International Limited Notes to the THT and TIL financial statements
for the year ended 30 June 2017
108
D11 Derivative and financial risk management (continued) TIL
2017 $M
1 year or less
Over 1 to 2 years
Over 2 to 3 years
Over 3 to 4 years
Over 4 to 5 years
Over 5 years
Total contractual cash flows
Carrying amount
Trade payables 48 – – – – – 48 48 Borrowings 43 69 89 94 95 3,333 3,723 1,792 Related party loans 1,657 – – – – – 1,657 1,591 Interest rate swaps 9 8 8 7 7 39 78 59 Total 1,757 77 97 101 102 3,372 5,506 3,490
2016 $M
1 year or less
Over 1 to 2 years
Over 2 to 3 years
Over 3 to 4 years
Over 4 to 5 years
Over 5 years
Total contractual cash flows
Carrying amount
Trade payables 29 – – – – – 29 29 Borrowings 10 19 69 83 83 4,274 4,538 1,793 Related party loans 1,651 – – – – – 1,651 1,559 Interest rate swaps 11 11 10 10 9 60 111 87 Total 1,701 30 79 93 92 4,334 6,329 3,468
TUIR026_Annual_Report_2017_inner_spreads_art02_sp.indd 108 23/8/17 10:31

1092017 Transurban Annual Report
Transurban Holding Trust and Transurban International Limited Notes to the THT and TIL financial statements
for the year ended 30 June 2017
109
Network summary Refer to the Network summary section of the Group financial statements for the intangible assets, concession note and promissory note accounting policies.
D12 Intangible assets 2017 $M Concession assets Assets under construction Total
THT TIL THT TIL THT TIL Cost 11,505 2,590 121 58 11,626 2,648 Accumulated amortisation (1,926) (101) – – (1,926) (101) Net book amount 9,579 2,489 121 58 9,700 2,547
2016 $M Concession assets Assets under construction Total
THT TIL THT TIL THT TIL Cost 11,505 2,681 31 7 11,536 2,688 Accumulated amortisation (1,616) (68) – – (1,616) (68) Net book amount 9,889 2,613 31 7 9,920 2,620
Movement in intangible assets Concession assets Assets under construction Total $M $M $M THT TIL THT TIL THT TIL Opening balance 1 July 2015 8,331 2,562 83 – 8,414 2,562 Additions 50 – 22 7 72 7 Acquisition of subsidiary 1,710 – – – 1,710 – Currency and other adjustments – 88 – – – 88 Transfer 74 – (74) – – – Amortisation charge (276) (37) – – (276) (37) Net book amount 30 June 2016 9,889 2,613 31 7 9,920 2,620 Additions – – 90 53 90 53 Currency and other adjustments – (90) – (2) – (92) Transfer – – – – – – Amortisation charge (310) (34) – – (310) (34) Net book amount 30 June 2017 9,579 2,489 121 58 9,700 2,547
D13 Other liabilities – concession and promissory notes M2 Motorway
The face value of promissory notes on issue at 30 June 2017 is $193 million (2016: $181 million). The net present value at 30 June 2017 of the redemption payments relating to these promissory notes is $38 million (2016: $34 million).
TUIR026_Annual_Report_2017_inner_spreads_art02_sp.indd 109 23/8/17 10:31

2017 Transurban Annual Report110
Transurban Holding Trust and Transurban International Limited Notes to the THT and TIL financial statements
for the year ended 30 June 2017
110
Group structure D14 Equity accounted investments Set out below is the summarised financial information for the THT Group’s investments accounted for using the equity method. The summarised financial information presented below is on a 100 per cent basis. Refer to note B22 for the details of the NorthWestern Roads Group.
THT NorthWestern Roads Group
2017
$M 2016
$M Summarised balance sheet – 100% Current assets 47 4 Non-current assets 2,436 2,498 Current liabilities (37) (11) Non-current liabilities (1,639) (1,341) Net assets 807 1,150 Summarised statement of comprehensive income – 100% Revenue 131 130 Depreciation and amortisation (34) (34) Other expenses (4) (2) Interest income 37 50 Income tax expense (5) (3) Profit for the year 125 141 Other comprehensive income 58 – Total comprehensive income 183 141 The following table reconciles the above summarised financial information presented on a 100 per cent basis to the proportional amounts recognised by the Group Ownership interest 50% 50% Proportional total comprehensive income 91 70 Profits not recognised 91 70 Group's share of comprehensive income – –
Reconciliation of summarised financial information Reconciliation of the summarised financial information presented to the carrying amount of the Group’s interest in associates
THT NorthWestern Roads Group
50%
2017
$M 2016
$M
Opening carrying value 1 July 768 862 Group’s recognised share of total comprehensive income – – Distributions received (290) (94) Closing carrying value 478 768 Cumulative losses not recognised 53 178
TUIR026_Annual_Report_2017_inner_spreads_art02_sp.indd 110 23/8/17 10:31

1112017 Transurban Annual Report
Transurban Holding Trust and Transurban International Limited Notes to the THT and TIL financial statements
for the year ended 30 June 2017
111
D15 Non-controlling interests Set out below is summarised financial information for each material subsidiary that has non-controlling interests that are material to THT. The amounts disclosed for each subsidiary are before inter-company eliminations.
THT
Transurban Queensland
37.5%
Airport Motorway Trust 24.9%
Total
2017 $M
2016 $M
2017 $M
2016 $M
2017 $M
2016 $M
Summarised balance sheet Current assets 196 265 21 21 217 286 Non-current assets 6,967 7,106 885 881 7,852 7,987 Current liabilities (60) (145) (201) (198) (261) (343) Non-current liabilities (4,163) (4,064) (530) (536) (4,693) (4,600) Net assets 2,940 3,162 175 168 3,115 3,330 Carrying amount of NCI 1,103 1,186 44 42 1,147 1,228 Summarised statement of comprehensive income Revenue 326 259 109 106 435 365 (Loss)/profit for the year (63) (144) 76 72 13 (72) Other comprehensive income/(loss) 20 (70) 7 4 27 (66) Total comprehensive income/(loss) (43) (214) 83 76 40 (138) (Loss)/profit allocated to NCI (24) (54) 19 18 (5) (36) OCI allocated to NCI 7 (26) 2 1 9 (25) Summarised cash flows Cash flows from operating activities (13) 104 73 59 60 163 Cash flows from investing activities (50) (1,710) – – (50) (1,710) Cash flows from financing activities (65) 1,630 (73) (59) (138) 1,571 Net (decreases)/increases in cash and cash equivalents (128) 24 – – (128) 24
TUIR026_Annual_Report_2017_inner_spreads_art02_sp.indd 111 23/8/17 10:31

2017 Transurban Annual Report112
Transurban Holding Trust and Transurban International Limited Notes to the THT and TIL financial statements
for the year ended 30 June 2017
112
Other D16 Related party transactions THT THL1 2017
$’000 2016
$’000 Transactions with related parties Rental income 648,915 574,993 Interest income 519,605 477,387 Interest expense 304,823 311,519 Other expenses 4,353 4,263 Outstanding balances with related parties Current receivables 1,922,516 2,376,501 Non-current receivables 7,452,217 5,966,590 Concession notes 946,490 959,850 Current liabilities 639,861 266,201 Non-current liabilities 5,162,354 4,835,193
TIL THL1 2017
$’000 2016
$’000 Transactions with related parties Interest expense 65,871 127,373 Other expenses 9,167 7,470 Outstanding balances with related parties Loan to related parties – 7,786 Loan from related parties 1,590,698 1,559,664 1. Transactions and outstanding balances between THT/TIL and THL.
D17 Parent entity financial information
Summary financial information The individual financial statements for the parent entities (THT and TIL) show the following aggregate amounts:
THT TIL
2017
$M 2016
$M 2017
$M 2016
$M Balance sheet Current assets 2,132 2,828 342 351 Total assets 14,836 14,238 365 372 Current liabilities 717 687 – – Total liabilities 5,517 4,897 – – Net assets 9,319 9,341 365 372 Issued units/contributed equity 10,665 10,520 309 302 Reserves 7 6 55 69 (Accumulated losses)/Retained earnings (1,353) (1,185) 1 1 Shareholders’ equity 9,319 9,341 365 372 Profit for the year 743 393 – 3 Exchange differences on translation of USD balances, net of tax – – (13) 11
Total comprehensive income/(loss) 743 393 (13) 14
TUIR026_Annual_Report_2017_inner_spreads_art02_sp.indd 112 23/8/17 10:31

1132017 Transurban Annual Report
Transurban Holdings Limited, Transurban Holding Trust and Transurban International Limited Directors’ declaration
for the year ended 30 June 2017
113
Section E: Signed reports In the opinion of the Directors of Transurban Holdings Limited, Transurban Infrastructure Management Limited (as the responsible entity of Transurban Holding Trust) and Transurban International Limited (collectively referred to as ‘the Directors’):
(a) the financial statements and notes of Transurban Holdings Limited and its controlled entities, including Transurban Holding Trust and its controlled entities and Transurban International Limited and its controlled entities set out on pages 45 to 112 are in accordance with the Corporations Act 2001, including:
(i) complying with Accounting Standards, the Corporations Regulations 2001 and other mandatory professional reporting requirements, and
(ii) giving a true and fair view of the Transurban Holdings Limited Group's, Transurban Holding Trust Group’s and Transurban International Limited Group’s financial position as at 30 June 2017 and of its performance for the year ended on that date, and
(b) there are reasonable grounds to believe that the Transurban Holdings Limited Group, Transurban Holding Trust Group and Transurban International Limited Group will be able to pay their debts as and when they become due and payable, and
(c) at the date of this declaration, there are reasonable grounds to believe that the members of the Extended Closed Group identified in note B24 will be able to meet any obligations or liabilities to which they are, or may become liable, subject by virtue of the deed of cross guarantee described in note B24.
Note B3 confirms that the financial statements also comply with International Financial Reporting Standards as issued by the International Accounting Standards Board.
The Directors have been given the declarations by the Chief Executive Officer and Chief Financial Officer required by section 295A of the Corporations Act 2001.
Lindsay Maxsted Director
Scott Charlton Director
Melbourne 8 August 2017
TUIR026_Annual_Report_2017_inner_spreads_art02_sp.indd 113 23/8/17 10:31

2017 Transurban Annual Report114
PricewaterhouseCoopers, ABN 52 780 433 757 2 Riverside Quay, SOUTHBANK VIC 3006, GPO Box 1331 MELBOURNE VIC 3001 T: +61 3 8603 1000, F: +61 3 8603 1999, www.pwc.com.au Liability limited by a scheme approved under Professional Standards Legislation.
Independent auditor’s report To the stapled security holders of Transurban Holdings Limited, Transurban Holding Trust and Transurban International Limited Report on the audit of the financial report Our opinion In our opinion:
The accompanying financial reports of Transurban Holdings Limited (THL or the Company) and its controlled entities (together the Transurban Group or the Group), Transurban Holding Trust (the Trust) and its controlled entities (together THT) and Transurban International Limited (the International Company) and its controlled entities (together TIL) are in accordance with the Corporations Act 2001, including:
a) giving a true and fair view of the financial positions of the Transurban Group, THT and TIL as at 30 June 2017 and of their financial performance for the year then ended
b) complying with Australian Accounting Standards and the Corporations Regulations 2001.
What we have audited The financial reports of the Transurban Group, THT and TIL (the financial report) comprise:
• the consolidated balance sheets as at 30 June 2017
• the consolidated statements of comprehensive income for the year then ended
• the consolidated statements of changes in equity for the year then ended
• the consolidated statements of cash flows for the year then ended
• the notes to the consolidated financial statements, which include a summary of significant accounting policies
• the directors’ declaration
Basis for opinion We conducted our audit in accordance with Australian Auditing Standards. Our responsibilities under those standards are further described in the later sections of our report.
We believe that the audit evidence we have obtained is sufficient and appropriate to provide a basis for our opinion.
Independence
We are independent of the Transurban Group, THT and TIL in accordance with the auditor independence requirements of the Corporations Act 2001 and the ethical requirements of the Accounting Professional and Ethical Standards Board’s APES 110 Code of Ethics for Professional Accountants (the Code) that are relevant to our audit of the financial report. We have also fulfilled our other ethical responsibilities in accordance with the Code.
114
TUIR026_Annual_Report_2017_inner_spreads_art02_sp.indd 114 23/8/17 10:31

1152017 Transurban Annual Report
115
Our audit approach An audit is designed to provide reasonable assurance about whether the financial report is free from material misstatement. Misstatements may arise due to fraud or error. They are considered material if individually or in aggregate, they could reasonably be expected to influence the economic decisions of users taken on the basis of the financial report.
We tailored the scope of our audit to ensure that we performed enough work to give an opinion on the financial report as a whole, taking into account the geographic and management structure of the Transurban Group, THT and TIL, their accounting processes and controls and the industry in which they operate.
Materiality
• For the purpose of our audit of the Group we used overall group materiality of $38 million, which represents approximately 2.5% of the earnings before interest, tax, depreciation and amortisation expenses (EBITDA) of the Group.
• We applied this threshold, together with qualitative considerations, to determine the scope of our audit and the nature, timing and extent of our audit procedures and to evaluate the effect of misstatements on the financial report as a whole.
• We chose EBITDA as the benchmark because, in our view, it is the metric against which the performance of the Transurban Group is most commonly measured and is a generally accepted benchmark in the infrastructure industry. We chose 2.5% based on our professional judgement, noting that it is within the common range relative to EBITDA benchmarks.
Audit scope
• Our audit focused on where the Group made subjective judgements; for example, significant accounting estimates involving assumptions and inherently uncertain future events.
• We conducted an audit of the financial report for each of the Transurban Group, THT and TIL, including substantive audit procedures in respect of the operation of each of the toll road concessions and equity accounted investments. Specific audit procedures were also performed for interest, tax, depreciation and amortisation expenses.
Key audit matters Key audit matters are those matters that, in our professional judgement, were of most significance in our audit of the financial report for the current period and were determined separately for the Group, THT and TIL. Relevant amounts listed for each part of the stapled group represent balances as they are presented in the financial report and should not be aggregated. The key audit matters were addressed in the context of our audit of the financial report as a whole, and in forming our opinion thereon, and we do not provide a separate opinion on these matters. We communicated the key audit matters to the Audit and Risk Committee.
TUIR026_Annual_Report_2017_inner_spreads_art02_sp.indd 115 23/8/17 10:31

2017 Transurban Annual Report116
116
Recording of toll revenue Group - Note B5
Toll revenue: $2,083m
THT
KAM not applicable – no toll revenue
TIL – Note D4
Toll Revenue: $209m
Key audit matter How our audit addressed the key audit matter
The Transurban Group operates toll roads in 4 geographic segments: Melbourne, Sydney and Brisbane in Australia and the Greater Washington Area in the United States. Each toll road records and recognises revenue through the use of technology, specifically, road side equipment supported by tolling and billing systems.
Tolling equipment and systems are highly customised complex systems that are built with the purpose of correctly identifying vehicle type, calculating correct fare and linking the vehicle to the customer’s account for billing purposes or obtaining information from local transport authorities for vehicles that have not made a valid billing arrangement.
Every toll road operates under a different concession deed which governs the means by which customers are charged.
This was a key audit matter for the Group and TIL due to the large volume of transactions that were processed in the year, the unique nature of each toll road and the reliance on bespoke information technology systems and controls.
This is the first financial year in which Airportlink M7 revenue is included for the full 12 month period.
Our procedures included, amongst others:
• Testing a selection of Information Technology General Controls (ITGCs) supporting the integrity of the tolling systems’ operation, including access, operations and change management controls.
• Performing tests of the design and operation of relevant controls over revenue adjustments, write offs, image processing and exception reporting.
• Performing testing of the review and approval of a selection of toll price increases for each toll road during the year.
• Performing data analysis of manual journals and adjustments to revenue to test a sample of material postings to revenue and checking that they were generated by the tolling systems.
• Comparing the revenue profile for each toll road to the prior year, taking into account observed increases in traffic and approved toll price increases to the prior year and budget.
• Testing a selection of cash collected by the US toll roads.
TUIR026_Annual_Report_2017_inner_spreads_art02_sp.indd 116 23/8/17 10:31

1172017 Transurban Annual Report
117
Borrowings Group - Note B14
Current Borrowings: $880m Non-Current Borrowings: $12,868m
THT - Note D10
Current Borrowings: $405m Non-Current Borrowings: $5,648m
TIL – Note D10
Current Borrowings: $12m Non-Current Borrowings: $1,780m
Key audit matter How our audit addressed the key audit matter
Borrowings are an integral part of the Transurban Group’s business model as it is the key source of funds used by the business to fund new projects and upgrades to existing concession assets. Borrowings represent the largest liability on the balance sheets.
During the year the Transurban Group refinanced over $2 billion of borrowings through bonds issuances and new bank facilities. Each of the borrowing agreements has its own set of terms and conditions and therefore audit work was required to assess the treatment of the agreements and their impact on the financial statements.
Given the size of the borrowings balance, the number of borrowing agreements in place and the importance of the funding structure for continued growth, the accounting for borrowings was considered a key audit matter for the Group, THT and TIL.
Our procedures included, amongst others:
• Obtaining confirmations from banks to confirm a selection of borrowings, including amounts, tenure and conditions.
• Reading the most up-to-date borrowing agreements with the financiers to develop an understanding of the terms associated with the facilities and the amount of facility available for drawdown.
• Where debt is regarded as non-current, considering whether there is an unconditional right to defer payment such that there were no repayments required within 12 months from the balance date.
• Assessing accounting treatment of the capitalised borrowing costs arising from new arrangements and borrowing costs related to terminated facilities.
• Evaluating the debt maturity profile and funding plan in light of our understanding of the debt agreements in place.
• Performing tests of the design and operation of relevant controls over treasury function including funding plan and board review and approval of debt agreements and financial institutions used.
TUIR026_Annual_Report_2017_inner_spreads_art02_sp.indd 117 23/8/17 10:31

2017 Transurban Annual Report118
118
Service concession arrangements Group - Notes B16 - B18, B25
Concession assets: $17,793m Maintenance provision: $994m Other liabilities: $78m Other provisions: $90m
THT – Notes D12, D13
Concession assets: $9,579m Concession notes receivable: $946m Other liabilities: $38m
TIL – Note D12
Concession assets: $2,489m Maintenance provision: $67m
Key audit matter How our audit addressed the key audit matter
Each of the concession assets in the Transurban Group’s portfolio represents a contractual right under a concessional agreement to toll a road in return for the capital and expertise needed to build, maintain and operate the road. Every concession asset is governed by its own concession agreement between the Group and the concession grantor (typically government or a local transport authority of the region in which concession is granted). As a result, the Transurban Group is subject to a number of contractual obligations, some of which have a direct impact on financial statements. Whenever the Group undertakes a new project to construct, acquire or upgrade the asset, its contractual arrangements with concession grantors are altered either through a new concession agreement or an amendment of the existing concessional agreement. The right to receive future economic benefits is recognised on the balance sheet as a concession asset. The asset is recognised at cost of construction or price paid at acquisition. The Group monitors performance of the assets for indicators of impairment at the end of each reporting period. Where indicators are identified during the period, the Group compares the carrying amount to its estimate of the recoverable amount of the asset. The concession agreements also contain clauses that require the Transurban Group to make cash outflows in the future, resulting in the recognition of concession liabilities such as maintenance liabilities, concession note liabilities and contingent consideration liabilities. The concession asset recoverable amount and concession liabilities recognised are calculated by estimating the net present value of future cash flows of the concession agreements using discounted cash flow models (the models). This area requires significant judgement by the Group due to a number of uncertain assumptions that impact the timing and quantum of future cash flows generated by the toll road, specifically assumptions such as future traffic expectations, operating costs, maintenance cash outflows and finance cost forecasts. We considered this to be a key audit matter for the Group, THT and TIL due to the accounting complexity of the arrangements and judgement required to interpret the accounting requirements and calculate their impact on the financial statements. During the year and up to the date of this report the Group reached financial close on the Inner City Bypass upgrade project, Logan Enhancement Project and 395 Express Lanes Project. Each of these projects resulted in changes to the contractual obligations of the Group. In addition to that, as projects such as the CityLink Tulla Widening progress further and conditions of the agreements are satisfied, audit work was required to assess the impact on financial statements.
We evaluated the concession agreements for each toll road to develop an understanding of the nature of the agreements with the concession grantors and assess the accounting implications of the contractual arrangements.
Our other procedures included, amongst others:
• Performing tests of the design and operation of controls over a selection of the forecast and modelling processes impacting the models.
• Considering the relevant obligations in the concession agreements having regard to the calculations in the models and corresponding balance sheet line items.
• Involving valuation specialists to assess the calculation methodology and reasonableness of the assumptions used within the models.
• Evaluating the impairment indicator assessment.
• Assessing the mathematical accuracy of the models and agreeing key data to the latest approved budgets and forecasts.
• Assessing the adequacy of the disclosures in the financial report in respect of contractual arrangements having regard to the requirements of Australian Accounting Standards.
TUIR026_Annual_Report_2017_inner_spreads_art02_sp.indd 118 23/8/17 10:31
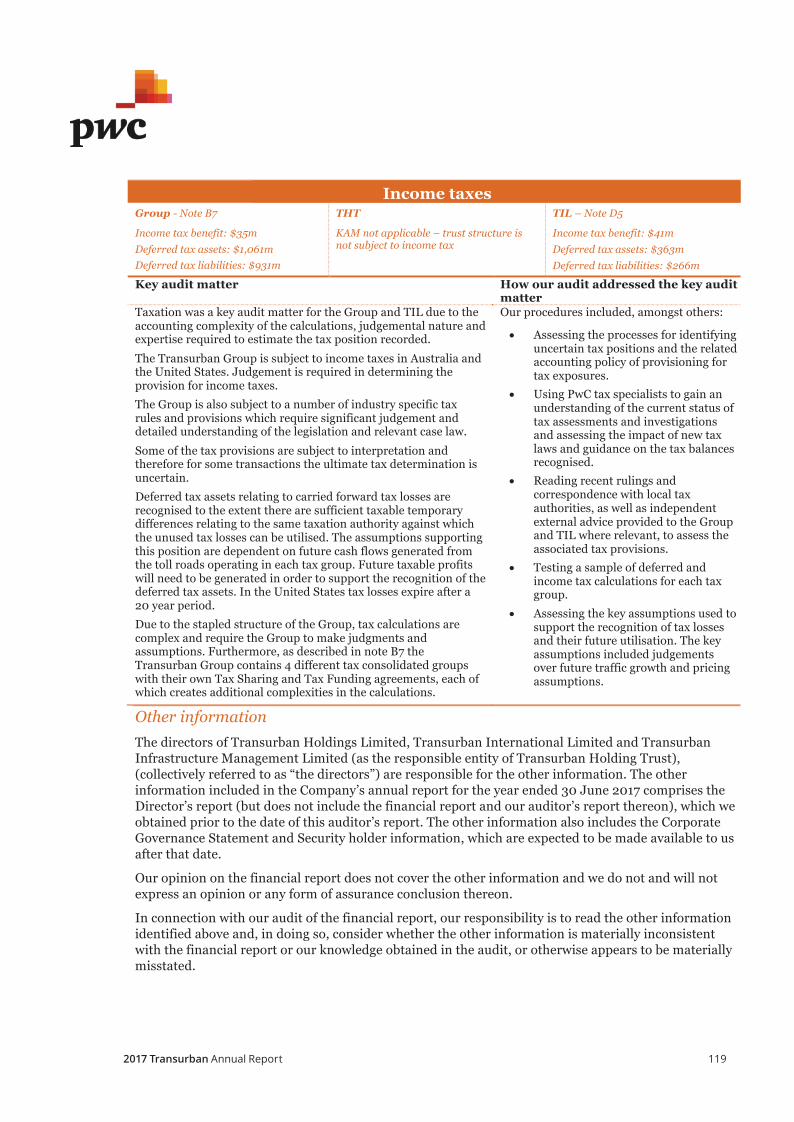
1192017 Transurban Annual Report
119
Income taxes Group - Note B7
Income tax benefit: $35m Deferred tax assets: $1,061m Deferred tax liabilities: $931m
THT
KAM not applicable – trust structure is not subject to income tax
TIL – Note D5
Income tax benefit: $41m Deferred tax assets: $363m Deferred tax liabilities: $266m
Key audit matter How our audit addressed the key audit matter
Taxation was a key audit matter for the Group and TIL due to the accounting complexity of the calculations, judgemental nature and expertise required to estimate the tax position recorded. The Transurban Group is subject to income taxes in Australia and the United States. Judgement is required in determining the provision for income taxes. The Group is also subject to a number of industry specific tax rules and provisions which require significant judgement and detailed understanding of the legislation and relevant case law. Some of the tax provisions are subject to interpretation and therefore for some transactions the ultimate tax determination is uncertain. Deferred tax assets relating to carried forward tax losses are recognised to the extent there are sufficient taxable temporary differences relating to the same taxation authority against which the unused tax losses can be utilised. The assumptions supporting this position are dependent on future cash flows generated from the toll roads operating in each tax group. Future taxable profits will need to be generated in order to support the recognition of the deferred tax assets. In the United States tax losses expire after a 20 year period. Due to the stapled structure of the Group, tax calculations are complex and require the Group to make judgments and assumptions. Furthermore, as described in note B7 the Transurban Group contains 4 different tax consolidated groups with their own Tax Sharing and Tax Funding agreements, each of which creates additional complexities in the calculations.
Our procedures included, amongst others:
• Assessing the processes for identifying uncertain tax positions and the related accounting policy of provisioning for tax exposures.
• Using PwC tax specialists to gain an understanding of the current status of tax assessments and investigations and assessing the impact of new tax laws and guidance on the tax balances recognised.
• Reading recent rulings and correspondence with local tax authorities, as well as independent external advice provided to the Group and TIL where relevant, to assess the associated tax provisions.
• Testing a sample of deferred and income tax calculations for each tax group.
• Assessing the key assumptions used to support the recognition of tax losses and their future utilisation. The key assumptions included judgements over future traffic growth and pricing assumptions.
Other information The directors of Transurban Holdings Limited, Transurban International Limited and Transurban Infrastructure Management Limited (as the responsible entity of Transurban Holding Trust), (collectively referred to as “the directors”) are responsible for the other information. The other information included in the Company’s annual report for the year ended 30 June 2017 comprises the Director’s report (but does not include the financial report and our auditor’s report thereon), which we obtained prior to the date of this auditor’s report. The other information also includes the Corporate Governance Statement and Security holder information, which are expected to be made available to us after that date.
Our opinion on the financial report does not cover the other information and we do not and will not express an opinion or any form of assurance conclusion thereon.
In connection with our audit of the financial report, our responsibility is to read the other information identified above and, in doing so, consider whether the other information is materially inconsistent with the financial report or our knowledge obtained in the audit, or otherwise appears to be materially misstated.
TUIR026_Annual_Report_2017_inner_spreads_art02_sp.indd 119 23/8/17 10:31

2017 Transurban Annual Report120
120
If, based on the work we have performed on the other information that we obtained prior to the date of this auditor’s report, we conclude that there is a material misstatement of this other information, we are required to report that fact. We have nothing to report in this regard.
When we read the other information not yet received as identified above, if we conclude that there is a material misstatement therein, we are required to communicate the matter to the directors and use our professional judgement to determine the appropriate action to take.
Responsibilities of the directors for the financial report The directors are responsible for the preparation of the financial report that gives a true and fair view in accordance with Australian Accounting Standards and the Corporations Act 2001 and for such internal control as the directors determine is necessary to enable the preparation of the financial report that gives a true and fair view and is free from material misstatement, whether due to fraud or error.
In preparing the financial report, the directors are responsible for assessing the ability of the Transurban Group, THT and TIL to continue as a going concern, disclosing, as applicable, matters related to going concern and using the going concern basis of accounting unless the directors either intend to liquidate the Transurban Group, THT or TIL or to cease operations, or have no realistic alternative but to do so.
Auditor’s responsibilities for the audit of the financial report Our objectives are to obtain reasonable assurance about whether the financial report as a whole is free from material misstatement, whether due to fraud or error, and to issue an auditor’s report that includes our opinion. Reasonable assurance is a high level of assurance, but is not a guarantee that an audit conducted in accordance with the Australian Auditing Standards will always detect a material misstatement when it exists. Misstatements can arise from fraud or error and are considered material if, individually or in the aggregate, they could reasonably be expected to influence the economic decisions of users taken on the basis of the financial report.
A further description of our responsibilities for the audit of the financial report is located at the Auditing and Assurance Standards Board website at: http://www.auasb.gov.au/auditors_responsibilities/ar1.pdf. This description forms part of our auditor's report.
TUIR026_Annual_Report_2017_inner_spreads_art02_sp.indd 120 23/8/17 10:31

1212017 Transurban Annual Report
121
Report on the remuneration report Our opinion on the remuneration report We have audited the remuneration report included in pages 23 to 41 of the directors’ report for the year ended 30 June 2017.
In our opinion, the remuneration report of Transurban Holdings Limited for the year ended 30 June 2017 complies with section 300A of the Corporations Act 2001.
Responsibilities The directors are responsible for the preparation and presentation of the remuneration report in accordance with section 300A of the Corporations Act 2001. Our responsibility is to express an opinion on the remuneration report, based on our audit conducted in accordance with Australian Auditing Standards.
PricewaterhouseCoopers
Chris Dodd
Melbourne
Partner 8 August 2017
TUIR026_Annual_Report_2017_inner_spreads_art02_sp.indd 121 23/8/17 10:31

2017 Transurban Annual Report122
Security holder information The security holder information set out below was applicable as at 14 August 2017.
Distribution of stapled securities The number of holders of stapled securities, which comprise one share in Transurban Holdings Limited, one share in Transurban International Limited and one unit in Transurban Holding Trust, was 104,588.
The voting rights are one vote per stapled security.
The percentage of total holdings held by or on behalf of the 20 largest holders of these securities was 77.76 per cent.
The distribution of holders was as follows:
Security grouping Total holders Stapled securities % of issued stapled
securities 1 - 1,000 38,006 17,533,057 0.85 1,001 - 5,000 48,360 118,780,638 5.78 5,001 - 10,000 11,125 78,627,399 3.83 10,001 - 100,000 6,810 145,839,220 7.10 100,001 - 999,999,999 287 1,693,315,598 82.44
Total 104,588 2,054,095,912 100.00
There were 2,989 holders of less than a marketable parcel of stapled securities.
There were 2,054,095,912 stapled securities on issue.
20 largest holders of stapled securities
Name Number of stapled
securities held % of issued
stapled securities HSBC CUSTODY NOMINEES (AUSTRALIA) LIMITED 703,693,138 34.26 BNP PARIBAS NOMINEES PTY LTD 307,406,422 14.97 J P MORGAN NOMINEES AUSTRALIA LIMITED 257,680,211 12.54 CITICORP NOMINEES PTY LIMITED 122,256,767 5.95 NATIONAL NOMINEES LIMITED 83,156,339 4.05 CITICORP NOMINEES PTY LIMITED 31,333,557 1.53 BNP PARIBAS NOMS PTY LTD 25,430,054 1.24 AUSTRALIAN FOUNDATION INVESTMENT COMPANY LIMITED 18,335,264 0.89 HSBC CUSTODY NOMINEES (AUSTRALIA) LIMITED 8,245,807 0.40 ARGO INVESTMENTS LIMITED 5,802,689 0.28 AMP LIFE LIMITED 5,390,572 0.26 AUSTRALIAN UNITED INVESTMENT COMPANY LIMITED 4,000,000 0.19 CUSTODIAL SERVICES LIMITED 3,721,004 0.18 MILTON CORPORATION LIMITED 3,512,975 0.17 HSBC CUSTODY NOMINEES (AUSTRALIA) LIMITED 3,190,711 0.16 BOND STREET CUSTODIANS LIMITED 3,097,984 0.15 DIVERSIFIED UNITED INVESTMENT LTD 3,000,000 0.15 NATIONAL NOMINEES LIMITED 2,879,678 0.14 BKI INVESTMENT COMPANY LIMITED 2,593,205 0.13 NAVIGATOR AUSTRALIA LTD 2,587,379 0.13
Total 1,597,313,756 77.76
Substantial holders Substantial security holders as at 14 August 2017 were as follows:
Name Number of stapled
securities held % of issued stapled
securities UNISUPER 278,743,444 13.65 COMMONWEALTH BANK OF AUSTRALIA 110,939,481 5.41 BLACKROCK GROUP 102,336,832 5.01
TUIR026_Annual_Report_2017_inner_spreads_art02_sp.indd 122 23/8/17 10:31

1232017 Transurban Annual Report
This page intentionally left blank.
TUIR026_Annual_Report_2017_inner_spreads_art02_sp.indd 123 23/8/17 10:31

2017 Transurban Annual Report124
This page intentionally left blank.
TUIR026_Annual_Report_2017_inner_spreads_art02_sp.indd 124 23/8/17 10:31

Contents
1
122
Transurban’s 2017 Corporate Governance Statement is located at www.transurban.com/corporate-governance-statement
TUIR026 Annual Report 2017 cover art02 sp indd 4 25/8/17 13:32
E
E
The stapled securities register is maintained by Computershare Investor Services Pty Ltd.
If you have a question about your Transurban securities or distributions please contact:
CYarra Falls 452 Johnston Street Abbotsford, Victoria 3067 Australia
The Registrar Computershare Investor Services Pty Ltd GPO Box 2975 Melbourne, Victoria 3001 Australia
(Australia ) 1300 555 159 (Overseas) +61 3 9415 4062
TUIR026 Annual Report 2017 cover art02 sp indd 6 25/8/17 13:32

AustraliaMelbourne Level 23Tower One, Collins Square727 Collins StreetDocklands Victoria 3008
SydneyLevel 9
New South Wales 2000
Brisbane7 Brandl StreetEight Mile PlainsQueensland 4113
Mailing AddressLocked Bag 28 South Melbourne Victoria 3205
Phone +61 3 8656 8900 Fax +61 3 8656 8585
United StatesWashington DC Area
Alexandria VA 22312United States
Phone 571 419 6100
Email [email protected]
TUIR026 Annual Report 2017 cover art02 sp indd 1 25/8/17 13:32
2017 Transurban Annual Report
2017 Transurban Annual Report
transurban.com
TUIR026 Annual Report 2017 cover art02 sp indd 3 25/8/17 13:32