2017 Survey of Nurse Practitioners (NPs) and Certified ... · 2017 Survey of Nurse Practitioners...
23
2017 Survey of Nurse Practitioners (NPs) and Certified Nurse-Midwives (CNMs) Joanne Spetz, PhD Lisel Blash, MA Lela Chu, BS Matthew Jura, MPH, MS Preliminary Findings - November 2017
Transcript of 2017 Survey of Nurse Practitioners (NPs) and Certified ... · 2017 Survey of Nurse Practitioners...

2017 Survey of Nurse Practitioners (NPs) and Certified Nurse-Midwives (CNMs)
Joanne Spetz, PhD
Lisel Blash, MA
Lela Chu, BS
Matthew Jura, MPH, MS
Preliminary Findings - November 2017

Background
▪ Last BRN NP-CNM survey conducted 2010
▪Small numbers of NPs and CNMs in Biennial RN Surveys
▪What changes have occurred over the past 7 years?

NP/CNM Survey
▪ 12-page survey for NPs & CNMs
• Education
• Employment, clinical practice & patient population
• Barriers to practice
▪ 2,500 surveys mailed
▪ 66% response rate (1,664 completions)
▪ 1,616 valid responses
• 1,269 NPs
• 177 CNMs
• 170 dual-certified
3

How many NPs & CNMs live & work in California?
NPs CNMs Both
NP & CNM
# living in California 17,287 511 505
# working as NPs/CNMs 14,145 364 437
% working as NPs/CNMs 81.8% 71.2% 86.5%
4
83% 85%
68%
14%15%
27%
4% 0% 5%
NP CNM Both
0%
10%
20%
30%
40%
50%
60%
70%
80%
90%
100%
Has 3+ NP/NM jobs
Has 2 NP/NM jobs
Has 1 NP/NM job

How old are employed NPs and CNMs?
5
0%
10%
20%
30%
40%
50%
60%
70%
80%
90%
100%
2010 2017 2010 2017 2010 2017
NP CNM NP+CNM
<35 35-44 45-54 55-64 65+

Diversity of employed NPs & CNMs
6
0%
10%
20%
30%
40%
50%
60%
70%
80%
90%
100%
2010 2017 2010 2017 2010 2017
NP CNM NP+CNM
Mixed
Native American
Pacific Islander
Other Asian
Asian Indian
Filipino
Hispanic
Black
White

Gender diversity of employed NPs & CNMs
7
7.5%11.7%
0.8% 1.2% 0.8% 2.1%0%
10%
20%
30%
40%
50%
60%
70%
80%
90%
100%
2010 2017 2010 2017 2010 2017
NP CNM NP+CNM
Male

Highest education of employed NPs & CNMs
72.1% 73.3%
58.1%
69.8%
8.5%10.8%
7.4%
6.8%
18.0% 9.1%
34.2%20.5%
1.4%6.3%
0.2% 1.8%
0%
10%
20%
30%
40%
50%
60%
70%
80%
90%
100%
2010 NPs 2017 NPs 2010 CNMs 2017 CNMs
Other
Doctoral
Certificate Program
Post-master's certificate
Master's Degree (MSN,non-ELM)
8

Initial RN education of NPs & CNMsInitial APRN education NPs CNM NP+CNM
Diploma 7% 10.7% 10.4%
AT + 30-unit 27.8% 14.2% 25.4%
BSN 57.5% 73.4% 57.1%
MSN + ELM 6.9% 1.7% 7.2%
Doctoral 0.8% 0% 0%
9
63.5%41.0%
66.1%
29.9%55.3%
30.6%
0%
20%
40%
60%
80%
100%
NP CNM NP+CNM
Internationally educated
Educated in other state
Educated in CA

Employment rate by age group, 2017
0%
10%
20%
30%
40%
50%
60%
70%
80%
90%
100%
<35 yrs 35-44 45-54 55-64 65+
Dual NP & CNM
NPs
CNMs
10

Work settingsNPs NMs NP+NM
Hospital setting 25.8% 43.6% 50.8%
Clinic setting 60.2% 48.9% 43.0%
Hospital acute 10.2% 1.3% 1.1%
Hospital outpatient clinic 10.5% 0.7% 3.5%
Community Health Center 11.3% 11% 11.7%
Private MD/DO Practice 16.0% 8.7% 13.0%
Private primary care group 23.3% 12.4% 13.4%
HMO/Managed Care 1.1% 6.1% 1.7%
Veterans Administration 5.9% 2.8% 5.8%
Academic education 1.9% 0 % 1.4%
11

Job titles of NPs & CNMs employed in these roles
NPs CNMs NP+CNM
Nurse Practitioner 94.8% 0.0% 19.8%
Certified Nurse Midwife 0.0% 97.1% 74.9%
Middle management position 0.4% 1.8% 0.0%
12

Estimated shares of patients with types of payment (% reporting share in principal position)
10.5% 10.5%
28.7%
50.8%
24.3%14.7%
37.0% 40.0%
36.3%
32.6%
55.8%
45.4%
28.5% 21.0%
18.1%
4.9% 11.8%
25.9%
11.9%11.6%
8.0% 1.9%2.7% 3.6%
8.6% 12.3%7.2%
1.1%1.3% 5.8%
3.7% 4.5%1.6%
8.7% 4.1% 4.5%
0%
10%
20%
30%
40%
50%
60%
70%
80%
90%
100%
Medicare Medicaid PrivateInsurance
Work comp. Other govt. Uninsured
0% 1-25% 26%-50% 51-75% 76-99% 100%
13

Types of patient currently accepted by practices in which NPs & CNMs work
NPs CNMs NP+CNM
Medicare 80.0% 49.5% 63.7%
Medicaid 69.8% 71.1% 61.5%
Private Ins 76.9% 77.2% 86.9%
Work comp
Other gov
Uninsured
25.6%
38.5%
54.1%
8.6%
28.3%
38.5%
5.6%
34.4%
46.0%
14
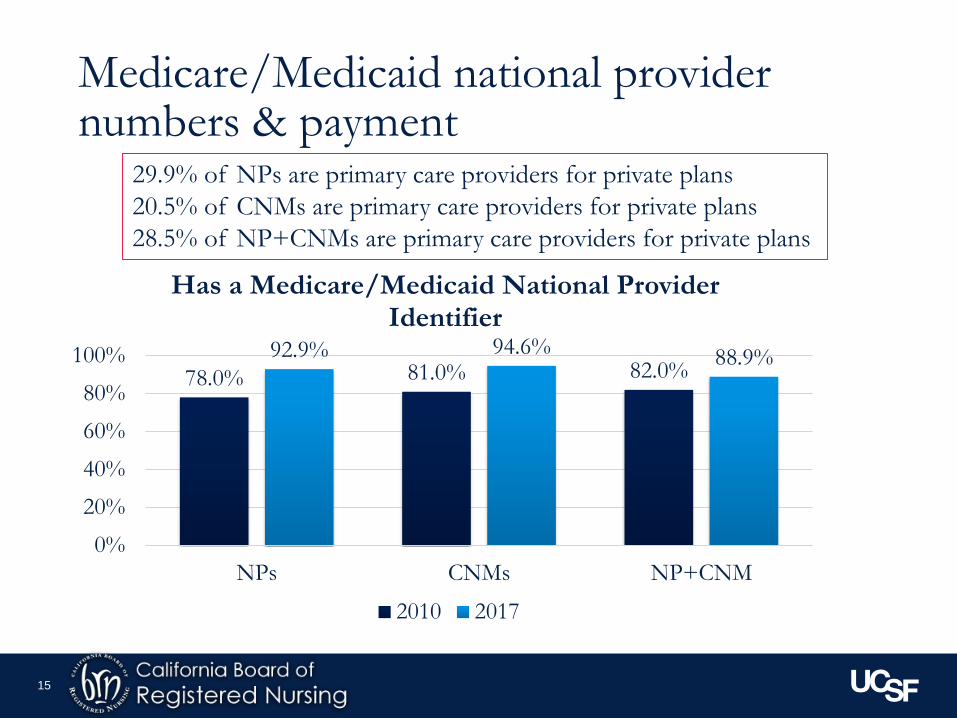
Medicare/Medicaid national provider numbers & payment
15
29.9% of NPs are primary care providers for private plans
20.5% of CNMs are primary care providers for private plans
28.5% of NP+CNMs are primary care providers for private plans
78.0% 81.0% 82.0%92.9% 94.6% 88.9%
0%
20%
40%
60%
80%
100%
NPs CNMs NP+CNM
Has a Medicare/Medicaid National Provider Identifier
2010 2017

Medicare/Medi-Cal billing
NPs CNMs NP+CNM
Medicare billing 2010 2017 2010 2017 2010 2017
Bill directly 20.8% 25.1% 27.9% 10.9% 24.6% 18.5%
Incident to physician 29.9% 18.8% 13.6% 7.4% 24.7% 11.8%
Don’t know 49.2% 41.8% 58.6% 60.9% 50.7% 53.3%
Medi-Cal billing
Bill directly 22.9% 24.9% 34.4% 18.2% 30.9% 28.6%
Incident to physician 25.2% 18.1% 15.8% 9.9% 24.5% 11.7%
Don’t know 51.9% 40.2% 49.8% 60.7% 44.6% 49.3%
16

What share of NPs & CNMs provide primary care?
NPs CNMs NP+CNM
2010 2017 2010 2017 2010 2017
First APRN job 66.1% 59% 68.9% 47.5% 68.3% 50.1%
Second APRN job 60.1% 50.2% 43.9% 42.9% 49.5% 41.1%
17
66.1% 68.9% 68.3%59.0%
47.5% 50.1%
0%10%20%30%40%50%60%70%80%
NPs CNMs NP+CNM
First APRN job
2010
60.1%
43.9%49.5%50.2%
42.9% 41.1%
0%
10%
20%
30%
40%
50%
60%
70%
NPs CNMs NP+CNM
Second APRN job
2010

Scope of practice
18
To a
AlwaysAlmost
always
consider-
able
Occasion-
allySeldom Never
degree
Using your NP/CNM
skills fully?58.5% 23.8% 12.6% 2.2% 1.7% 1.1%
Allowed to practice the
fullest extent of the 57.7% 21.4% 15.6% 3.3% 1.6% 0.5%
legal scope of practice.

Barriers to providing high-quality care reported by NPs and CNMs
19
Not a Minor Major
Inadequate time with patients
problem
29.6%problem
43.2%problem
25.1%
Denial of coverage/care decisions by insurance companies 27.2% 39.4% 22.7%
Too little involvement in decisions in your organization 42.8% 33.9% 17.7%Patients’ inability to receive needed care because of
inability to pay
Lack of administrative support
33.1%
45.2%
41.5%
34.2%
16.9%
16.8%
Quality issues outside of your control 32.5% 46.6% 15.5%
Lack of qualified specialists in your area 51.7% 29.0% 15.3%
Lack of ancillary clinical support (such as MAs) 49.1% 32.3% 14.6%
Lack of access/support for educational advancement 53.9% 28.2% 13.7%Not getting timely reports from other providers and
facilities38.5% 44.1% 12.2%

Percent of NPs/CNMs working in non-NP/CNM RN jobs
20
28.0%
23.0%
15.5%16.0%
5.0%
12.0%
0%
5%
10%
15%
20%
25%
30%
NP CNM NP+CNM
2010
All Employed as NP/CNM
20.0%18.2%
5.9%
11.6%
7.7%
3.5%
0%
5%
10%
15%
20%
25%
NP CNM NP+CNM
2017
All Employed as NP/CNM

Reasons for not working as NP/CNM (% saying “very important”)
21
Not at all
important
Somewhat
important
Very Important
important
Lack of NP/CNM jobs/practice opportunities in 16.8% 5.5% 14.5% 31.4%desired location
Childcare/family responsibilities 14.4% 9.0% 6.4% 31.2%Lack of NP/CNM jobs in desired type of facility 17.3% 7.6% 10.6% 30.4%Lack of NP/CNM jobs in desired specialty 15.8% 7.0% 19.0% 25.9%Retired 12.2% 5.6% 4.3% 22.2%
Dissatisfied with benefits/salary 15.8% 9.7% 12.4% 21.3%Lack of good management/ leadership 16.2% 10.2% 14.5% 21.3%
Overall lack of NP/CNM jobs 18.8% 10.7% 14.8% 21.2%Inconvenient schedules 18.4% 13.3% 9.9% 19.2%

Overall satisfaction with NP/CNM practice
22
NP CNM NP+CNM
Very dissatisifed 6.9% 3.7% 3.2%Dissatisfied 3.7% 6.4% 5.0%Neither satisfied nor dissatisfied 8.1% 0.4% 0.2%Satisfied 43.6% 57.2% 42.4%Very satisfied 37.7% 32.2% 49.1%
0%
10%
20%
30%
40%
50%
60%
70%
80%
90%
100%
NP CNM NP+CNM
Very satisified
Satisfied
Neither satisified nor dissatisfied
Dissatisfied
Very dissatisifed