2017 Quarter 1 Financial Results For the - Travelodge UK - 2017... · 2017 Quarter 1 Financial...
17
2017 Quarter 1 Financial Results For the quarter ended 29 March 2017 Release: 25 May 2017
Transcript of 2017 Quarter 1 Financial Results For the - Travelodge UK - 2017... · 2017 Quarter 1 Financial...

2017 Quarter 1 Financial Results
For the quarter ended 29 March 2017
Release: 25 May 2017
2
Additional
Colours
Chart 7
Chart 8, Map
Chart 9
Chart 10
Colour 11
Colour 12
Colour 13
Colour 14
Colour 15
Colour 16
230-230-230
Body Text in Arial
Background
Headings, Heading Lines, Bullet Points
Table Rows
Text Boxes, Table Rows
Table Highlight
Lines and Axis
Chart 1
Chart 2
Chart 3
Chart 4
Chart 5
Chart 6
149-179-215
127-127-127
30-62-123
255-255-255
0-0-0
107-148-52
209-4-61
128-100-162
204-206-215
30-62-123
79-129-189
234-240-247
230-224-236
95-95-95
179-162-199
22-46-92
50-87-132
226-239-209
254-197-213
195-235-255
Main Colours
198-213-241
149-179-215
2
Disclaimer You must read the following before continuing
This presentation has been prepared by Thame and London Limited, TVL Finance plc and Travelodge Hotels Limited (collectively, “the “Company”) solely for informational purposes. For the purposes of this
disclaimer, the presentation that follows shall mean and include the slides that follow, the oral presentation of the slides by the Company or any person on their behalf, any question and answer session that
follows the oral presentation, hard copies of this document and any materials distributed in connection with the presentation. By attending the meeting at which the presentation is made, dialling into the
teleconference during which the presentation is made or reading the presentation, you will be deemed to have agreed to all of the restrictions that apply with regard to the presentation and acknowledged that
you understand the legal and regulatory sanctions attached to the misuse, disclosure or improper circulation of the presentation. The Company does not make any representation or warranty or other
assurance, express or implied, that this document or the information contained herein or the assumptions on which they are based are accurate, complete, adequate, fair, reasonable or up to date and they
should not be relied upon as such. The Company does not accept any liability for any direct, indirect or consequential loss or damage suffered by any person as a result of relying on all or any part of this
document and any liability is expressly disclaimed.
The Company has included non-IFRS financial measures in this presentation. These measurements may not be comparable to those of other companies. Reference to these non-IFRS financial measures
should be considered in addition to IFRS financial measures, but should not be considered a substitute for results that are presented in accordance with IFRS.
The information contained in this presentation has not been subject to any independent audit or review. A significant portion of the information contained in this document, including all market data and trend
information, is based on estimates or expectations of the Company, and there can be no assurance that these estimates or expectations are or will prove to be accurate. Our internal estimates have not been
verified by an external expert, and we cannot guarantee that a third party using different methods to assemble, analyse or compute market information and data would obtain or generate the same results. We
have not verified the accuracy of such information, data or predictions contained in this report that were taken or derived from industry publications, public documents of our competitors or other external
sources. Further, our competitors may define our and their markets differently than we do. In addition, past performance of the Company is not indicative of future performance. The future performance of the
Company will depend on numerous factors which are subject to uncertainty.
Certain statements contained in this document that are not statements of historical fact, including, without limitation, any statements preceded by, followed by or including the words “will,” “targets,” “believes,”
“expects,” “aims,” “intends,” “may,” “anticipates,” “would,” “could” or similar expressions or the negative thereof, constitute forward-looking statements, notwithstanding that such statements are not specifically
identified. In addition, certain statements may be contained in press releases, and in oral and written statements made by or with the approval of the Company that are not statements of historical
fact and constitute forward-looking statements. Examples of forward-looking statements include, but are not limited to: (i) statements about future financial and operating results; (ii) statements of strategic
objectives, business prospects, future financial condition, budgets, potential synergies to be derived from acquisitions, projected levels of production, projected costs and projected levels of revenues and
profits of the Company or its management or board of directors; (iii) statements of future economic performance; and (iv) statements of assumptions underlying such statements.
Forward-looking statements are not guarantees of future performance and involve certain risks, uncertainties and assumptions which are difficult to predict and outside of the control of the management of the
Company. Therefore, actual outcomes and results may differ materially from what is expressed or forecasted in such forward-looking statements. We have based these assumptions on information currently
available to us, if any one or more of these assumptions turn out to be incorrect, actual market results may differ from those predicted. While we do not know what impact any such differences may have on our
business, if there are such differences, our future results of operations and financial condition, and the market price of the notes, could be materially adversely affected. You should not place undue reliance on
these forward-looking statements. All subsequent written and oral forward-looking statements attributable to the Company or any person acting on its behalf are expressly qualified in their entirety by the
cautionary statements referenced above. Forward-looking statements speak only as of the date on which such statements are made. The Company expressly disclaims any obligation or undertaking to
disseminate any updates or revisions to any forward-looking statement to reflect events or circumstances after the date on which such statement is made, or to reflect the occurrence of unanticipated events.
We have included other operating information in this presentation, some of which we refer to as “key performance indicators.” We believe that it is useful to include this operating information as we use it for
internal performance analysis, and the presentation by our business divisions of these measures facilitates comparability with other companies in our industry, although our measures may not be comparable
with similar measurements presented by other companies. Such operating information should not be considered in isolation or construed as a substitute for measures prepared in accordance with IFRS.
The presentation does not constitute or form part of, and should not be construed as, an offer to sell or issue, or the solicitation of an offer to purchase, subscribe to or acquire the Company or the Company’s
securities, or an inducement to enter into investment activity in any jurisdiction in which such offer, solicitation, inducement or sale would be unlawful prior to registration, exemption from registration or
qualification under the securities laws of such jurisdiction. No part of this presentation, nor the fact of its distribution, should form the basis of, or be relied on in connection with, any contract or commitment or
investment decision whatsoever. This presentation is not for publication, release or distribution in any jurisdiction where to do so would constitute a violation of the relevant laws of such jurisdiction nor should it
be taken or transmitted into such jurisdiction.

3
Additional
Colours
Chart 7
Chart 8, Map
Chart 9
Chart 10
Colour 11
Colour 12
Colour 13
Colour 14
Colour 15
Colour 16
230-230-230
Body Text in Arial
Background
Headings, Heading Lines, Bullet Points
Table Rows
Text Boxes, Table Rows
Table Highlight
Lines and Axis
Chart 1
Chart 2
Chart 3
Chart 4
Chart 5
Chart 6
149-179-215
127-127-127
30-62-123
255-255-255
0-0-0
107-148-52
209-4-61
128-100-162
204-206-215
30-62-123
79-129-189
234-240-247
230-224-236
95-95-95
179-162-199
22-46-92
50-87-132
226-239-209
254-197-213
195-235-255
Main Colours
198-213-241
149-179-215
3
Continued Good Growth
2017 Quarter 1 Headlines
Revenue up 7.0% to £127.9m (2016: £119.5m)
LFL RevPAR(1) up 2.0% to £32.77 (2016: £32.14)
RevPAR growth 0.5pts below competitive segment (unadjusted) (2)
On track for 15 openings in 2017 with two opened in Q1/Q2 to date
EBITDA up £3.3m to £6.4m (2016: £3.1m)
Cash of £107.3m at the quarter end
£165m refinancing completed in April 2017
Initial Q2 trading results show similar trends to Q1
Remain cautious on immediate outlook but continue to be well positioned
1. RevPAR is computed as the product of the Average Daily Rate for a specified period multiplied by the Occupancy for that period.
Like-for-like (“LFL”) RevPAR compares the RevPAR in Q1-2017 vs. Q1-2016 on the basis of RevPAR generated by hotels that were opened before 1 January 2016.
2. RevPAR growth in line with the competitive segment after adjusting for impact of closed hotel and rooms closed as part of refit programme

4
Additional
Colours
Chart 7
Chart 8, Map
Chart 9
Chart 10
Colour 11
Colour 12
Colour 13
Colour 14
Colour 15
Colour 16
230-230-230
Body Text in Arial
Background
Headings, Heading Lines, Bullet Points
Table Rows
Text Boxes, Table Rows
Table Highlight
Lines and Axis
Chart 1
Chart 2
Chart 3
Chart 4
Chart 5
Chart 6
149-179-215
127-127-127
30-62-123
255-255-255
0-0-0
107-148-52
209-4-61
128-100-162
204-206-215
30-62-123
79-129-189
234-240-247
230-224-236
95-95-95
179-162-199
22-46-92
50-87-132
226-239-209
254-197-213
195-235-255
Main Colours
198-213-241
149-179-215
Quarter 1 Results

5
Additional
Colours
Chart 7
Chart 8, Map
Chart 9
Chart 10
Colour 11
Colour 12
Colour 13
Colour 14
Colour 15
Colour 16
230-230-230
Body Text in Arial
Background
Headings, Heading Lines, Bullet Points
Table Rows
Text Boxes, Table Rows
Table Highlight
Lines and Axis
Chart 1
Chart 2
Chart 3
Chart 4
Chart 5
Chart 6
149-179-215
127-127-127
30-62-123
255-255-255
0-0-0
107-148-52
209-4-61
128-100-162
204-206-215
30-62-123
79-129-189
234-240-247
230-224-236
95-95-95
179-162-199
22-46-92
50-87-132
226-239-209
254-197-213
195-235-255
Main Colours
198-213-241
149-179-215
5
Quarter 1 Highlights
Hotel re-fit cycle underway,
commencing with 219 room
London Farringdon hotel
‘SuperRooms’ trial successfully
completed and on-track to launch
from second quarter
Good growth in new business
accounts
Leveraging eCRM capability
across digital and business
platforms
Continued gains in revenue
management including ancillary
products
Good momentum in development
pipeline
Continued Progress on Our Strategic Objectives
Development:
Extend UK Network
250 potential locations identified
Maintain leasehold growth in London and Regions
Principally new-build hotels opened under lease
Distinctive Brand:
Raise Quality
Image
Best for Business:
Win Share in a
Growing Market
Win the Web: Grow
Direct Digital Sales
Price is Right:
Optimise Rate and
Occupancy
Moments of Truth:
Drive Consistency
New customer feedback report drives action
Standardised work practices
Targeted training
Ongoing hotel re-fit cycle
Launch new ‘SuperRooms’
National advertising presence
Focus on ‘businesses on a budget’
Leverage business website
Implement enhanced CRM activity
Continue to enhance web customer experience
Leverage CRM capability
Strong paid and unpaid search presence
Airline style yield management system (IDeaS)
Central pricing team
Analytics-driven pricing strategy

6
Additional
Colours
Chart 7
Chart 8, Map
Chart 9
Chart 10
Colour 11
Colour 12
Colour 13
Colour 14
Colour 15
Colour 16
230-230-230
Body Text in Arial
Background
Headings, Heading Lines, Bullet Points
Table Rows
Text Boxes, Table Rows
Table Highlight
Lines and Axis
Chart 1
Chart 2
Chart 3
Chart 4
Chart 5
Chart 6
149-179-215
127-127-127
30-62-123
255-255-255
0-0-0
107-148-52
209-4-61
128-100-162
204-206-215
30-62-123
79-129-189
234-240-247
230-224-236
95-95-95
179-162-199
22-46-92
50-87-132
226-239-209
254-197-213
195-235-255
Main Colours
198-213-241
149-179-215
6
London Farringdon Re-Fit Completed
• 219 room Central
London hotel
• Major refurbishment
throughout
• New classic room look
and feel
• Introduced 55 new
‘SuperRooms’
• New look bar café
• Encouraging early
trading
7
Additional
Colours
Chart 7
Chart 8, Map
Chart 9
Chart 10
Colour 11
Colour 12
Colour 13
Colour 14
Colour 15
Colour 16
230-230-230
Body Text in Arial
Background
Headings, Heading Lines, Bullet Points
Table Rows
Text Boxes, Table Rows
Table Highlight
Lines and Axis
Chart 1
Chart 2
Chart 3
Chart 4
Chart 5
Chart 6
149-179-215
127-127-127
30-62-123
255-255-255
0-0-0
107-148-52
209-4-61
128-100-162
204-206-215
30-62-123
79-129-189
234-240-247
230-224-236
95-95-95
179-162-199
22-46-92
50-87-132
226-239-209
254-197-213
195-235-255
Main Colours
198-213-241
149-179-215
7
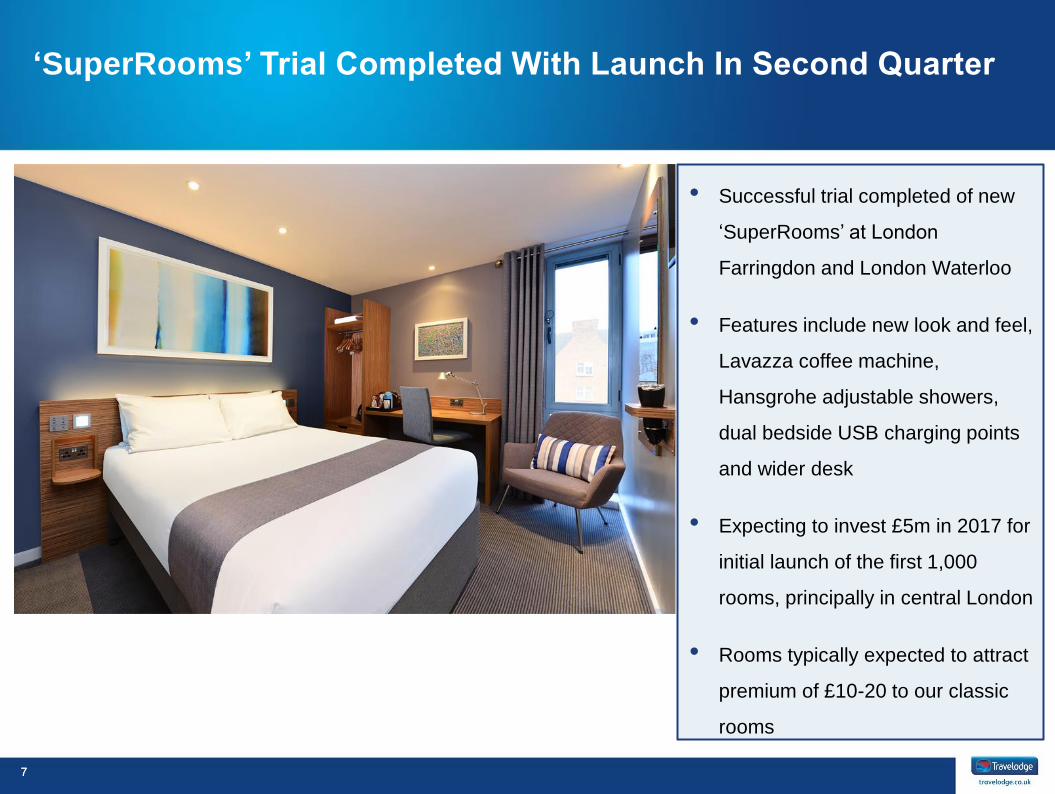
‘SuperRooms’ Trial Completed With Launch In Second Quarter
• Successful trial completed of new
‘SuperRooms’ at London
Farringdon and London Waterloo
• Features include new look and feel,
Lavazza coffee machine,
Hansgrohe adjustable showers,
dual bedside USB charging points
and wider desk
• Expecting to invest £5m in 2017 for
initial launch of the first 1,000
rooms, principally in central London
• Rooms typically expected to attract
premium of £10-20 to our classic
rooms

8
Additional
Colours
Chart 7
Chart 8, Map
Chart 9
Chart 10
Colour 11
Colour 12
Colour 13
Colour 14
Colour 15
Colour 16
230-230-230
Body Text in Arial
Background
Headings, Heading Lines, Bullet Points
Table Rows
Text Boxes, Table Rows
Table Highlight
Lines and Axis
Chart 1
Chart 2
Chart 3
Chart 4
Chart 5
Chart 6
149-179-215
127-127-127
30-62-123
255-255-255
0-0-0
107-148-52
209-4-61
128-100-162
204-206-215
30-62-123
79-129-189
234-240-247
230-224-236
95-95-95
179-162-199
22-46-92
50-87-132
226-239-209
254-197-213
195-235-255
Main Colours
198-213-241
149-179-215
8
2.4%
2.0%
STR MS&E Travelodge
Good 2017 Operating Metrics Continued RevPAR growth
LFL1 RevPAR (£)2
LFL1 Occupancy (%)2 LFL1 ADR (£)2
Strong RevPAR Growth Driven by ADR Increase and Steady Occupancy
1. RevPAR is computed as the product of the Average Daily Rate for a specified period multiplied by the Occupancy for that period. Like-for-like (LFL) RevPAR compares the RevPAR in
Q1-2017 vs. Q1-2016 on the basis of RevPAR generated by hotels that were opened before 1 January 2016.
2. Occupancy, ADR and RevPAR for UK leased estate only.
3. RevPAR growth in line with the competitive segment after adjusting for impact of closed hotel and rooms closed as part of refit programme
Q1 2017 vs. Q1 2016
RevPAR: like-for-like UK RevPAR
growth of 2.0%
RevPAR vs. Market:
underperformance to MS&E
segment principally owing to room
closures in major refit hotels in
London
Occupancy: occupancy remained
stable at c.69%
ADR: continued improvement
increasing by 2.8% vs. 2016
Q1-17 RevPAR Growth Slightly Below Market 3
32.1
32.8
Q1-2016 Q1-2017
70.0 69.4
Q1-2016 Q1-2017
60bps
45.9 47.2
Q1-2016 Q1-2017

9
Additional
Colours
Chart 7
Chart 8, Map
Chart 9
Chart 10
Colour 11
Colour 12
Colour 13
Colour 14
Colour 15
Colour 16
230-230-230
Body Text in Arial
Background
Headings, Heading Lines, Bullet Points
Table Rows
Text Boxes, Table Rows
Table Highlight
Lines and Axis
Chart 1
Chart 2
Chart 3
Chart 4
Chart 5
Chart 6
149-179-215
127-127-127
30-62-123
255-255-255
0-0-0
107-148-52
209-4-61
128-100-162
204-206-215
30-62-123
79-129-189
234-240-247
230-224-236
95-95-95
179-162-199
22-46-92
50-87-132
226-239-209
254-197-213
195-235-255
Main Colours
198-213-241
149-179-215
9
Good Overall Q1 Financial Performance Strong total sales growth with EBITDA improvement
Revenue (£m) EBITDA (£m)
Financial Performance Has Remained Strong
Q1-2017 vs. Q1-2016
Revenue increase of 7.0%/£8.4m was primarily due to:
o Like-for-like UK RevPAR growth of 2.0%
o Annualisation and maturity of the 19 new hotels added in 2016
o International growth 40%/£0.7m
EBITDA was driven by:
o Continued sales growth and positive drop through
o Impact of national living wage
o Changes to marketing strategy in favour of lower cost digital and CRM
119.5
127.9
Q1-2016 Q1-2017
3.1
6.4
Q1-2016 Q1-2017

10
Additional
Colours
Chart 7
Chart 8, Map
Chart 9
Chart 10
Colour 11
Colour 12
Colour 13
Colour 14
Colour 15
Colour 16
230-230-230
Body Text in Arial
Background
Headings, Heading Lines, Bullet Points
Table Rows
Text Boxes, Table Rows
Table Highlight
Lines and Axis
Chart 1
Chart 2
Chart 3
Chart 4
Chart 5
Chart 6
149-179-215
127-127-127
30-62-123
255-255-255
0-0-0
107-148-52
209-4-61
128-100-162
204-206-215
30-62-123
79-129-189
234-240-247
230-224-236
95-95-95
179-162-199
22-46-92
50-87-132
226-239-209
254-197-213
195-235-255
Main Colours
198-213-241
149-179-215
Continued Good Free Cash Flow Good cash conversion with working capital benefit from quarter end timing
Comment
Q1-2017 vs. Q1-2016
Working Capital inflow of £42.2m in
Q1-2017 vs £25.2m in Q1-2016
primarily due to:
o Timing of the quarter ends and
payments around the quarter ends.
Net Cash from Operating Activities
increased by £20.3m, primarily due
to:
o Working capital impact noted
above.
Capital Expenditure increased by
£4.1m, primarily due to:
o Commencement of our standard
refit program.
Bank and Bond Interest Paid
decreased by £14.1m, primarily due
to:
o Timing of payment of external bank
interest in 2016.
Provisions and Exceptional Items
mainly in relation to spend on
provisions.
Refinancing consists of:
the flare facility repayment of
£12.9m in Q1 2016
2017 refinancing not until Q2.
£m Q1 2017 Q1 2016 Diff.
EBITDA before Exceptional Items and IFRS Rent Charge 6.4 3.1 3.3
Working Capital 42.2 25.2 17.0
Net Cash Flows from Operating activities before Exceptionals 48.6 28.3 20.3
Capital Expenditure (11.1) (7.0) (4.1)
Free Cash Flow Generated 37.5 21.3 16.2
Interest Costs - Bank Interest Paid (16.4) 16.4
- Bond Interest Paid (2.3) - (2.3)
- Finance Fees Paid - (0.1) 0.1
Interest Income 0.1 - 0.1
Interest Element of Finance Lease Rental Payments (0.9) (1.1) 0.2
Cash Spend on Provisions and Exceptional Items (1.0) (2.0) 1.0
Non-Trading Cash Flow (4.1) (19.6) 15.5
Cash Generated 33.4 1.7 31.7
Refinancing and Repayment of Investor Loan (12.9) 12.9
Movement in Cash 33.4 (11.2) 44.6
Opening Cash 73.9 76.9 (3.0)
Closing Cash 107.3 65.7 41.6

11
Additional
Colours
Chart 7
Chart 8, Map
Chart 9
Chart 10
Colour 11
Colour 12
Colour 13
Colour 14
Colour 15
Colour 16
230-230-230
Body Text in Arial
Background
Headings, Heading Lines, Bullet Points
Table Rows
Text Boxes, Table Rows
Table Highlight
Lines and Axis
Chart 1
Chart 2
Chart 3
Chart 4
Chart 5
Chart 6
149-179-215
127-127-127
30-62-123
255-255-255
0-0-0
107-148-52
209-4-61
128-100-162
204-206-215
30-62-123
79-129-189
234-240-247
230-224-236
95-95-95
179-162-199
22-46-92
50-87-132
226-239-209
254-197-213
195-235-255
Main Colours
198-213-241
149-179-215
11
1. As adjusted for the April 2017 Refinancing.
2. EBITDA based on Q2-Q4 2016 audited EBITDA plus Q1 2017 unaudited EBITDA. Net debt is net of cash and cash equivalents.
Net Debt and Leverage – Quarter 1 2017
Debt (£m) Refinancing
Refinancing completed April 2017
£165m senior secured FRNs at L+4.875%, par
Maturity - May 2023, Call profile - NC1, par
c. £1.7m annual interest saving
Liquidity / Financial Ratios
Cash on Balance Sheet: £104m (pro forma)
Revolving Credit Facility: £50m (unutilised)
Letter of Credit Facility: £30m (£15m utilised)
Pro Forma Net Senior Secured Debt / EBITDA(2) = 2.8x
Pro Forma Net Third Party Debt / EBITDA(2) = 3.1x
£m Q1 2017 Pro
Forma(1)
Cash and Cash Equivalents 107.3 103.5
SSNs @ 8.5% 290.0 261.0
FRNs @ L+7.5% 100.0 -
FRNs @ L+4.875% - 165.0
Finance leases 32.1 32.1
Total Third Party Indebtedness 422.1 458.1

12
Additional
Colours
Chart 7
Chart 8, Map
Chart 9
Chart 10
Colour 11
Colour 12
Colour 13
Colour 14
Colour 15
Colour 16
230-230-230
Body Text in Arial
Background
Headings, Heading Lines, Bullet Points
Table Rows
Text Boxes, Table Rows
Table Highlight
Lines and Axis
Chart 1
Chart 2
Chart 3
Chart 4
Chart 5
Chart 6
149-179-215
127-127-127
30-62-123
255-255-255
0-0-0
107-148-52
209-4-61
128-100-162
204-206-215
30-62-123
79-129-189
234-240-247
230-224-236
95-95-95
179-162-199
22-46-92
50-87-132
226-239-209
254-197-213
195-235-255
Main Colours
198-213-241
149-179-215
12
Summary and Outlook Good quarter 1 results, cautious on macro outlook but remain well positioned
Cautious on immediate outlook given general election and Brexit
Cost pressures from National Living Wage, business rates and apprenticeship levy
Remain well positioned – strong development pipeline (on-track for 15 new
openings)
Good Q1 revenue and EBITDA growth
RevPAR up 2.0%
Strong cash conversion
Good progress on strategic initiatives, 2 hotels opened in Q1/Q2 to date

13
Additional
Colours
Chart 7
Chart 8, Map
Chart 9
Chart 10
Colour 11
Colour 12
Colour 13
Colour 14
Colour 15
Colour 16
230-230-230
Body Text in Arial
Background
Headings, Heading Lines, Bullet Points
Table Rows
Text Boxes, Table Rows
Table Highlight
Lines and Axis
Chart 1
Chart 2
Chart 3
Chart 4
Chart 5
Chart 6
149-179-215
127-127-127
30-62-123
255-255-255
0-0-0
107-148-52
209-4-61
128-100-162
204-206-215
30-62-123
79-129-189
234-240-247
230-224-236
95-95-95
179-162-199
22-46-92
50-87-132
226-239-209
254-197-213
195-235-255
Main Colours
198-213-241
149-179-215
13
Q&A

14
Additional
Colours
Chart 7
Chart 8, Map
Chart 9
Chart 10
Colour 11
Colour 12
Colour 13
Colour 14
Colour 15
Colour 16
230-230-230
Body Text in Arial
Background
Headings, Heading Lines, Bullet Points
Table Rows
Text Boxes, Table Rows
Table Highlight
Lines and Axis
Chart 1
Chart 2
Chart 3
Chart 4
Chart 5
Chart 6
149-179-215
127-127-127
30-62-123
255-255-255
0-0-0
107-148-52
209-4-61
128-100-162
204-206-215
30-62-123
79-129-189
234-240-247
230-224-236
95-95-95
179-162-199
22-46-92
50-87-132
226-239-209
254-197-213
195-235-255
Main Colours
198-213-241
149-179-215
14
Appendices

15
Additional
Colours
Chart 7
Chart 8, Map
Chart 9
Chart 10
Colour 11
Colour 12
Colour 13
Colour 14
Colour 15
Colour 16
230-230-230
Body Text in Arial
Background
Headings, Heading Lines, Bullet Points
Table Rows
Text Boxes, Table Rows
Table Highlight
Lines and Axis
Chart 1
Chart 2
Chart 3
Chart 4
Chart 5
Chart 6
149-179-215
127-127-127
30-62-123
255-255-255
0-0-0
107-148-52
209-4-61
128-100-162
204-206-215
30-62-123
79-129-189
234-240-247
230-224-236
95-95-95
179-162-199
22-46-92
50-87-132
226-239-209
254-197-213
195-235-255
Main Colours
198-213-241
149-179-215
Company Background

16
Additional
Colours
Chart 7
Chart 8, Map
Chart 9
Chart 10
Colour 11
Colour 12
Colour 13
Colour 14
Colour 15
Colour 16
230-230-230
Body Text in Arial
Background
Headings, Heading Lines, Bullet Points
Table Rows
Text Boxes, Table Rows
Table Highlight
Lines and Axis
Chart 1
Chart 2
Chart 3
Chart 4
Chart 5
Chart 6
149-179-215
127-127-127
30-62-123
255-255-255
0-0-0
107-148-52
209-4-61
128-100-162
204-206-215
30-62-123
79-129-189
234-240-247
230-224-236
95-95-95
179-162-199
22-46-92
50-87-132
226-239-209
254-197-213
195-235-255
Main Colours
198-213-241
149-179-215
16
Company Overview FY 2016
Who We Are
UK’s second largest hotel brand based on number of hotels and rooms
Positioned in the attractive value segment with 543 hotels and serving
18m business and leisure customers
Well invested modernised hotel portfolio
Well balanced approximately even business / leisure customer split
Almost 90% booking direct, with 79% through own websites
Low upfront capex leasehold model
EBITDAR with or
without IFRS rent
charges?
EBITDAR + Rent
Cover + EBITDAR
Margin increase
1. Occupancy, ADR and RevPAR for Travelodge UK leased Hotels only.
2. Represents the ratio of EBITDAR to net external rent payable.
3. Includes 12 hotels operated under management contracts.
4. Operations in Ireland under a master franchise.
Key Statistics (FY2016)
Hotels 543
Rooms 40,847
Occupancy¹ 76.1%
ADR¹ £51.7
RevPAR¹ £39.3
Revenue £597.8m
EBITDAR £281.8m
EBITDA £110.1m
Rent Cover2 1.6x
Where We Are
United Kingdom International
London
Regions3
Spain
Ireland4
66 Hotels
8,628 Rooms
21% of total
Rooms
460 Hotels
30,699 Rooms
75% of total
Rooms
5 Hotels
621 Rooms
2% of total
Rooms
12 Hotels
899 Rooms
2% of total
Rooms

17
Additional
Colours
Chart 7
Chart 8, Map
Chart 9
Chart 10
Colour 11
Colour 12
Colour 13
Colour 14
Colour 15
Colour 16
230-230-230
Body Text in Arial
Background
Headings, Heading Lines, Bullet Points
Table Rows
Text Boxes, Table Rows
Table Highlight
Lines and Axis
Chart 1
Chart 2
Chart 3
Chart 4
Chart 5
Chart 6
149-179-215
127-127-127
30-62-123
255-255-255
0-0-0
107-148-52
209-4-61
128-100-162
204-206-215
30-62-123
79-129-189
234-240-247
230-224-236
95-95-95
179-162-199
22-46-92
50-87-132
226-239-209
254-197-213
195-235-255
Main Colours
198-213-241
149-179-215
17
Operational Improvements and Powerful Direct Distribution Model Drive Good Financial
Performance in 2016
Key Credit Highlights
1
2
3
4
5
Good Market Dynamics for Growth in Value Hotel Sector
Strong Market Position with High Brand Recognition, Scale and Extensive, Diversified
Network of Hotels
Well-invested Portfolio with Good Quality Levels
Growing and High Quality Rooms Pipeline
Tight Cost Control and Low Upfront Capex Leasehold Model Drive Good Profitability and
Cashflows in 2016
7
6
Experienced Management Team with a Track Record of Delivering Operational and
Financial Improvements