2017 Purchase Price Allocation Study - PPAnalyser · We are proud to present the sixth edition of...
15
Purchase Price Allocation Study December 2017
Transcript of 2017 Purchase Price Allocation Study - PPAnalyser · We are proud to present the sixth edition of...

Purchase Price Allocation StudyDecember 2017
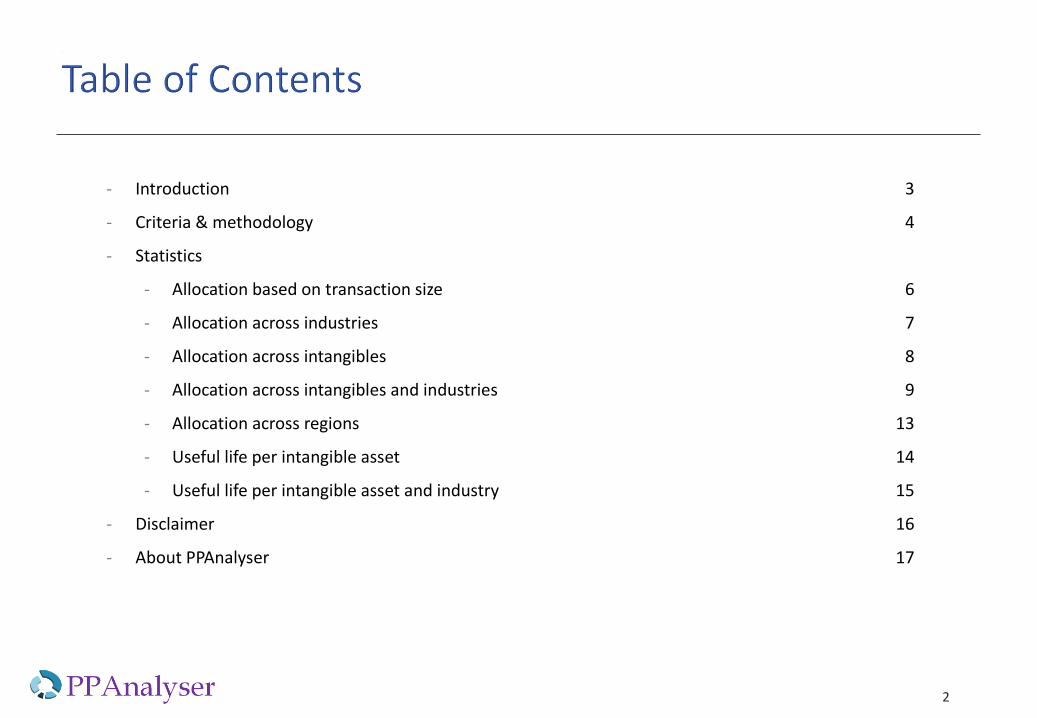
- Introduction 3
- Criteria & methodology 4
- Statistics
- Allocation based on transaction size 6
- Allocation across industries 7
- Allocation across intangibles 8
- Allocation across intangibles and industries 9
- Allocation across regions 13
- Useful life per intangible asset 14
- Useful life per intangible asset and industry 15
- Disclaimer 16
- About PPAnalyser 17
2

We are proud to present the sixth edition of our Purchase Price Allocation Study. In this study you will find statistics on publically disclosed
purchase price allocation studies and economic useful lives of 2015 and 2016. The source for our analysis is the PPAnalyser database.
PPAnalyser is a subscription database that includes financial details of publically disclosed purchase price allocations, discount rates and
impairments. Besides purchase price allocation data, PPAnalyser also provides economic useful life data used in PPA analyses. For more
information visit www.ppanalyser.com.
In this sixth edition you will find a selection of statistics. These include statistics per type of industry, type of intangible and per region. In
addition you will find statistics on economic useful lives.
Should you have any questions or comments, please don’t hesitate to contact us on [email protected].
3

4
- The source we used for this study was the PPAnalyser database. PPAnalyser includes purchase price allocation data that was
identified by searching for purchase price allocations disclosed in annual and quarterly reports.
- For the purpose of this study a selection of PPAs included in the database was made based on the following criteria:
- Year: 2015 and 2016.
- Financial information disclosed: only those PPAs were included that disclosed both the purchase price as well as the
allocation of intangibles.
- Intangibles identified in the PPAs and discount rates were assigned to one of the following intangible categories:
1. Marketing related intangible assets 5. Technology related intangible assets
2. Customer related intangible assets 6. Research & Development related intangible assets
3. Artistic related intangible assets
4. Contract related intangible assets
- All amounts were converted to USD using a single exchange rate for 2015 and 2016.
- When analyzing the proportion of tangible assets, intangible assets and goodwill compared to total assets, total assets is
determined by the purchase price net of liabilities.

5
- We classified the PPAs and impairments into the following
industry categories:
- Agriculture, Forestry, Fishing
- Construction
- Finance, Insurance, Real Estate
- Manufacturing
- Mining
- Public Administration
- Retail Trade
- Services
- Transportation & Public Utilities
- Wholesale Trade
- We segmented the allocation results across seven size
categories (in USD x Millions):
- > 1,000
- 500 - 1,000
- 250 - 500
- 100 - 250
- 50 - 100
- 25 - 50
- < 25
- Consolidated statistics were determined based on the percentages of the individual PPA’s (i.e. not weighted).
- For categories with less then 10 observations the results are regarded as not significant and are not discussed in this analysis.
- For economic useful life a distinction is made between intangibles with definite and indefinite lifetime. Both are disclosed and
analysed separately.

- The median purchase price in the year 2016 increased by 16% compared to the year 2015, from 57.5 million USD to 66.6 million USD. The number
of transactions decreased in 2016, however it should be noted that transactions that took place in 2016 are typically not all disclosed in the annual
reports of 2016, therefore a reporting delay exists.
- Although an increase in the overall median purchase price can be observed, the purchase price of transactions between 500 and 1,000 million
declined with 14%. The median purchase price for transactions above 1 billion increased with 7%. Next to that, a large increase also is observed in
transactions between 100 and 250 million with a 13% higher purchase price in 2016.
- The majority of the purchase price allocations included in this study are published in US annual reports. For 2016, the proportion of US related
PPA’s increased to 88%, compared to 87% in the year before. The proportion of Canadian PPA’s remained stable over the last two years. The
proportion of European PPA´s showed a minor decrease from 4% in 2015 to 3% in 2016.
6
2016 2015 2016 2015 % change
PP > 1,000 48 69 2,461,768 2,297,000 7.2%
500 < PP < 1,000 23 50 596,074 696,605 -14.4%
250 < PP < 500 38 56 351,900 330,250 6.6%
100 < PP < 250 72 104 154,613 136,372 13.4%
50 < PP < 100 47 85 73,063 73,941 -1.2%
25 < PP< 50 35 95 39,183 36,000 8.8%
PP < 25 165 231 9,000 8,912 1.0%
Total 428 690 66,630 57,540 15.80%
Transactions Median PP (x1000)
Comparison # % of total # % of total
United States 376 88% 599 87%
Canada 13 3% 20 3%
Europe 13 3% 29 4%
Other 26 6% 42 6%
Total 428 100% 690 100%
2016 2015
Number of transactions

Purchase price
- The median purchase price of all transactions increased in 2016 to approximately USD 66.6 million (+16%).
- Most transactions are observed in the manufacturing sector, with 42% of the total amount of transactions in 2016. The second largest sector is the
services sector with 30% of the total amount of transactions.
- When looking at the median purchase consideration, the most significant increases can be observed in the Retail Trade industry (+60%). The most
significant decrease is observed in the Wholesale Trade industry (-82%).
7
Number of transactions Median purchase consideration
2016% of PPA's
20162015
% of PPA's
20152016 2015 % change
All industries 428 100% 690 100% 66,630 57,540 16%
Agriculture, Forestry, Fishing 0 0% 1 0% 5,571 21,300 -74%
Construction 3 1% 4 1% 34,052 61,031 -44%
Finance, Insurance, Real Estate 59 14% 69 10% 51,189 66,558 -23%
Manufacturing 179 42% 265 38% 94,294 79,650 18%
Mining 6 1% 7 1% 244,595 66,239 269%
Public Administration 2 0% 1 0% 89,650 157,500 -43%
Retail Trade 15 4% 27 4% 48,088 30,057 60%
Services 128 30% 211 31% 31,123 36,912 -16%
Transportation & Public Utilities 22 5% 74 11% 61,499 104,048 -41%
Wholesale Trade 14 3% 31 4% 14,465 81,928 -82%

- Overall, the proportion of intangible assets (incl. goodwill) in relation to total assets increased slightly across all asset class sizes (0.9% on
average). A significant decrease can be observed for transaction with asset values between 25 and 50 million (-4.5%) while a significant increase
can be observed for transactions with asset values between 500 million and 1 billion (+5.4%) as well as for transactions with asset values lower
than 25 million.
- The proportion of intangible assets (excl. goodwill) in relation to total assets increased slightly for all transactions (0.3% on average).
- The proportion of goodwill in relation to total assets increased with 0.6% on average.
8
2016 2015 % change 2016 2015 % change 2016 2015 % change
Total assets > 1,000 34% 33% 0.6% 35% 35% -0.6% 69% 68% 0.0%
500 < Total assets < 1,000 37% 36% 1.5% 42% 38% 3.9% 79% 74% 5.4%
250 < Total assets < 500 29% 32% -2.8% 41% 40% 1.1% 70% 72% -1.7%
100 < Total assets < 250 32% 36% -4.2% 41% 36% 4.7% 72% 72% 0.5%
50 < Total assets < 100 37% 35% 1.6% 39% 38% 0.5% 76% 74% 2.1%
25 < Total assets < 50 39% 38% 0.7% 39% 44% -5.2% 78% 83% -4.5%
Total assets < 25 43% 38% 4.6% 39% 39% 0.0% 82% 77% 4.6%
Average 0.3% 0.6% 0.9%
Int. asset % of total assets Goodwill as % of total assets Total Int. as % of total assets

9
‐ The following 3 slides discuss the proportion of tangibles,
intangibles and goodwill compared to total assets across
industries
‐ The industries with the highest proportion of intangibles
assets compared to total assets are Manufacturing, Services
and Transportation & Public Utilities
‐ For Manufacturing, a more than 40% allocation to intangible
assets can be observed
‐ The Services industry has the highest share of goodwill
among all industries (46%)

10
‐ Mining, Retail Trade and Wholesale Trade have the
highest proportion of tangible assets compared to total
assets among all industries
‐ The highest proportion of tangible assets among total
assets is identified in the Mining industry (50%)
‐ Mining and Retail Trade both have the lowest percentage
of intangible assets (23% and 27% respectively)

- The most frequently identified intangibles are: marketing-, customer-, and technology related intangibles. Contract-, R&D-, and
Artistic related intangibles are observed less frequently(1).
- The proportion of marketing related intangibles to Total Assets is highest in Retail Trade and Wholesale Trade industries.
- The proportion of contract related intangibles is highest in Transportation & Public Utilities and the Retail Trade industries.
- The proportion of technology related intangibles is highest in Retail Trade and Transportation & Public Utilities industries.
11(1) For Artistic related intangibles, the amount of observations is too low to arrive at representable statistics
2016
Comparison Mark Cust Art Contr Tech R&D Mark Cust Art Contr Tech R&D
Count Intangible as a % of Total Assets
Construction 2 3 - - 1 - 3% 22% - - 15% -
Finance, Insurance, Real Estate 30 36 - 16 14 - 6% 22% - 17% 13% -
Manufacturing 110 137 - 23 93 40 8% 18% - 19% 20% 27%
Mining 5 5 - - 5 - 4% 13% - - 8% -
Public Administration 2 2 - - 2 - 1% 21% - - 8% -
Retail Trade 5 5 - 9 3 - 12% 13% - 27% 24% -
Services 68 99 2 12 87 1 7% 21% 3% 15% 21% 1%
Transportation & Public Utilities 11 18 - 6 4 - 5% 29% - 47% 22% -
Wholesale Trade 6 11 - 2 8 - 9% 14% - 11% 16% -
Total 239 316 2 68 209 41
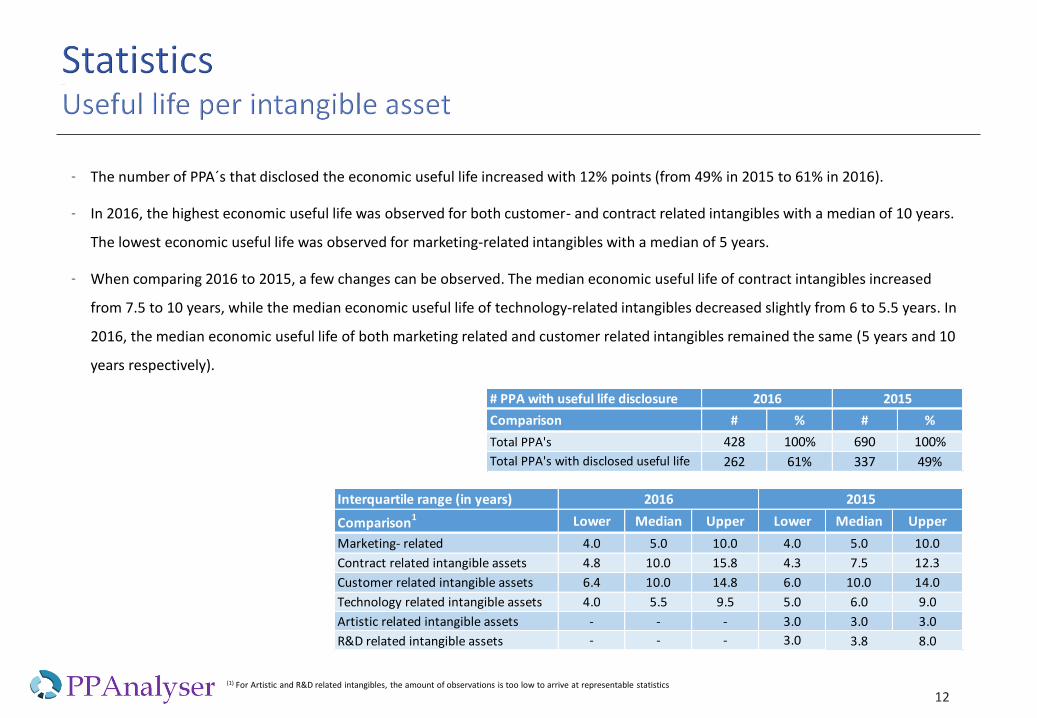
- The number of PPA´s that disclosed the economic useful life increased with 12% points (from 49% in 2015 to 61% in 2016).
- In 2016, the highest economic useful life was observed for both customer- and contract related intangibles with a median of 10 years.
The lowest economic useful life was observed for marketing-related intangibles with a median of 5 years.
- When comparing 2016 to 2015, a few changes can be observed. The median economic useful life of contract intangibles increased
from 7.5 to 10 years, while the median economic useful life of technology-related intangibles decreased slightly from 6 to 5.5 years. In
2016, the median economic useful life of both marketing related and customer related intangibles remained the same (5 years and 10
years respectively).
12(1) For Artistic and R&D related intangibles, the amount of observations is too low to arrive at representable statistics
Interquartile range (in years)
Comparison1 Lower Median Upper Lower Median Upper
Marketing- related 4.0 5.0 10.0 4.0 5.0 10.0
Contract related intangible assets 4.8 10.0 15.8 4.3 7.5 12.3
Customer related intangible assets 6.4 10.0 14.8 6.0 10.0 14.0
Technology related intangible assets 4.0 5.5 9.5 5.0 6.0 9.0
Artistic related intangible assets - - - 3.0 3.0 3.0
R&D related intangible assets - - - 3.0 3.8 8.0
2016 2015
# PPA with useful life disclosure
Comparison # % # %
Total PPA's 428 100% 690 100%
Total PPA's with disclosed useful life 262 61% 337 49%
2016 2015
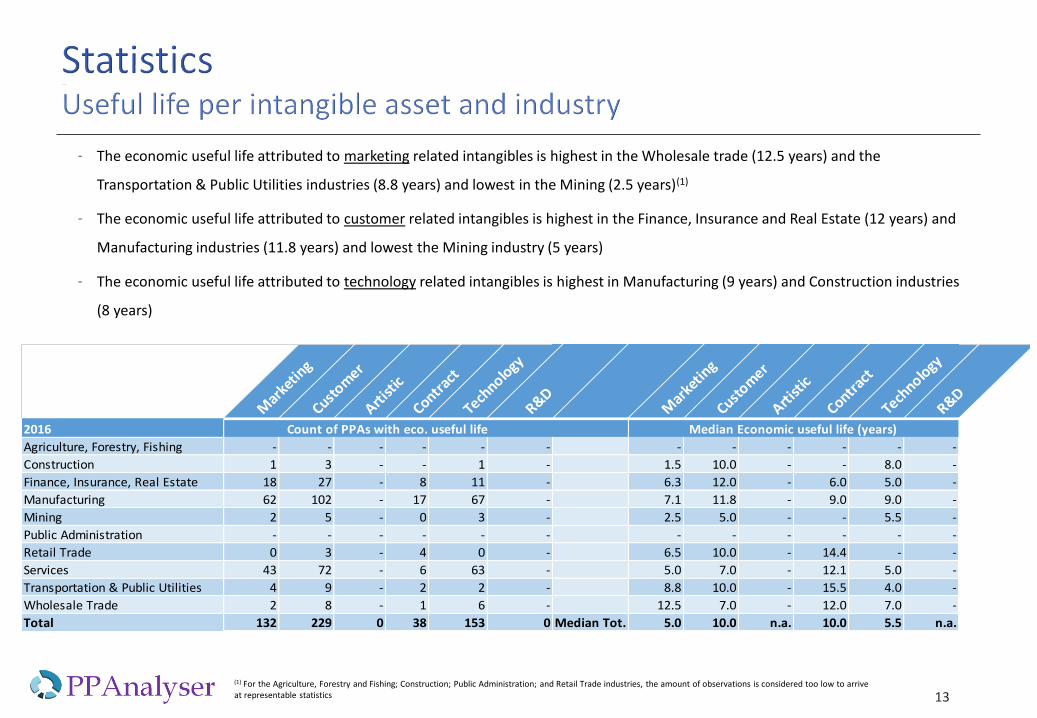
- The economic useful life attributed to marketing related intangibles is highest in the Wholesale trade (12.5 years) and the
Transportation & Public Utilities industries (8.8 years) and lowest in the Mining (2.5 years)(1)
- The economic useful life attributed to customer related intangibles is highest in the Finance, Insurance and Real Estate (12 years) and
Manufacturing industries (11.8 years) and lowest the Mining industry (5 years)
- The economic useful life attributed to technology related intangibles is highest in Manufacturing (9 years) and Construction industries
(8 years)
13(1) For the Agriculture, Forestry and Fishing; Construction; Public Administration; and Retail Trade industries, the amount of observations is considered too low to arrive at representable statistics
Mar
ketin
g
Custom
er
Artist
ic
Contrac
t
Tech
nology
R&DM
arke
ting
Custom
er
Artist
ic
Contrac
t
Tech
nology
R&D
2016
Agriculture, Forestry, Fishing - - - - - - - - - - - -
Construction 1 3 - - 1 - 1.5 10.0 - - 8.0 -
Finance, Insurance, Real Estate 18 27 - 8 11 - 6.3 12.0 - 6.0 5.0 -
Manufacturing 62 102 - 17 67 - 7.1 11.8 - 9.0 9.0 -
Mining 2 5 - 0 3 - 2.5 5.0 - - 5.5 -
Public Administration - - - - - - - - - - - -
Retail Trade 0 3 - 4 0 - 6.5 10.0 - 14.4 - -
Services 43 72 - 6 63 - 5.0 7.0 - 12.1 5.0 -
Transportation & Public Utilities 4 9 - 2 2 - 8.8 10.0 - 15.5 4.0 -
Wholesale Trade 2 8 - 1 6 - 12.5 7.0 - 12.0 7.0 -
Total 132 229 0 38 153 0 Median Tot. 5.0 10.0 n.a. 10.0 5.5 n.a.
Median Economic useful life (years)Count of PPAs with eco. useful life

- This material may not be reproduced in any format by any means or redistributed without the prior written consent of Bridgeton
Software B.V. (hereafter “Bridgeton Software”).
- PPAnalyser is a trade name used by Bridgeton Software.
- Bridgeton Software gathers its data from third party sources. Although it uses its experience to assess as far as is reasonably possible
the reliability and suitability of such third party data, it cannot guarantee its accuracy.
- The data presented in this presentation reflects information known to the authors at the time this presentation was written, and this
information is subject to change.
- Bridgeton Software makes no representations or warranties, expressed or implied, regarding the accuracy of this material.
- This presentation does not constitute advice or a recommendation of any kind. The information and material presented herein is
provided for informational purposes only and is not intended to constitute accounting, tax or legal advice or as a substitute for
obtaining accounting, tax or legal advice.
14

About PPAnalyser
PPAnalyser in an online subscription database developed and owned by Bridgeton Software B.V., a
limited liability company based in Amsterdam, the Netherlands. Bridgeton Software develops, markets
and distributes financial software. It’s main product is PPAnalyser, an online subscription database
that includes data of over 7,000 purchase price allocation studies disclosed between 2007 and 2017.
For more information visit www.ppanalyser.com.