2017 Profile of International Residential Real Estate ... · 2017 Profile of International...
39
2017 Profile of International Residential Real Estate Activity in Florida Conducted for Florida REALTORS ® by the National Association of REALTORS ® October 2017
-
Upload
hoanghuong -
Category
Documents
-
view
215 -
download
0
Transcript of 2017 Profile of International Residential Real Estate ... · 2017 Profile of International...

2017 Profile of International Residential Real Estate Activity in Florida
Conducted for Florida REALTORS® by the National Association of REALTORS® October 2017
October 2017
Florida REALTORS®
2017 Profile of International Residential Real Estate Activity in Florida
Conducted by the National Association of REALTORS®
Research Group
1
TABLE OF CONTENTS ABOUT THE SURVEY .......................................................................................................................... 2
SUMMARY ........................................................................................................................................ 3
I. MACROECONOMIC ENVIRONMENT ...................................................................................................... 5
II. SIZE OF INTERNATIONAL TRANSACTIONS .................................................................................. 7
III. FOREIGN BUYERS: ORIGINS AND PREFERENCES ......................................................................... 9
Origin of Foreign Buyers ........................................................................................................................ 9
Destination of Foreign Buyers ............................................................................................................. 12
Major Buyers of Top Florida Destinations ........................................................................................... 14
Major Destinations of Florida’s Major Buyers ..................................................................................... 18
Prices and Financing ............................................................................................................................ 20
Intended Use of Property .................................................................................................................... 23
Type of Property.................................................................................................................................. 24
Location Preference ............................................................................................................................ 25
Factors Affecting Decision to Purchase Property in Florida ................................................................ 26
IV. FLORIDA RESIDENTS SEEKING TO PURCHASE PROPERTY ABROAD ............................................ 28
V. REALTOR® INTERACTION WITH INTERNATIONAL CLIENTS ........................................................ 30
Source of Referrals or Leads.................................................................................................... 30
Language and Cultural Factors ............................................................................................................ 31
VI. CONCLUDING COMMENTS ...................................................................................................... 34
APPENDIX 1. COMPUTATION OF DOLLAR VOLUME OF FOREIGN BUYER PURCHASES ....................... 35
APPENDIX 2. NOTES ON SURVEY AND ESTIMATION METHOD .......................................................... 36

2
ABOUT THE SURVEY
Since 2005, the National Association of REALTORS® Research Group has conducted an annual survey for Florida REALTORS® to gather information about the interaction of its members with international clients, the challenges and opportunities they face in serving foreign clients, and the characteristics of foreign buyers purchasing property in Florida.
The 2017 Profile of International Residential Real Estate Activity in Florida presents information regarding residential transactions with international clients of Florida REALTORS®
during the 12-month period of August 2016–July 2017. The 2017 report also presents information on U.S. clients seeking to purchase property abroad. In this report, the year 2017 refers to the 12-month period August 2016–July 2017, and the year 2016 refers to the period August 2015–July 2016.
Florida REALTORS® issued the invitation to its nearly 164,000 members to participate in the online survey. Over the survey period, August 7–September 9, 2017, 6,551 members responded to the survey.
The term international or foreign client refers to two types of clients:
o Non-resident foreigners (Type A): Non-U.S. citizens with permanent residences outside the United States. These clients typically purchase property as an investment and/or for vacation or visits of less than six months to the United States.
o Resident foreigners (Type B): Non-U.S. citizens who are recent immigrants (in the country less than two years at the time of the transaction) or visa holders residing for more than six months in the United States for professional, educational, or other reasons.
We thank our Florida REALTORS® counterpart team for their cooperation: Brad O’Connor, Ph.D., Chief Economist; Cecilia Chirinos, Economic Analyst; and Erica Plemmons, Research Analyst, who deployed the survey to the members, ensured survey participation, and provided data on Florida home sales. National Association of REALTORS® Research Group Lawrence Yun, Ph.D., Senior Vice President & Chief Economist George Ratiu, Managing Director, Housing and Commercial Research Gay Cororaton, Research Economist October 2017
3
SUMMARY
The economic environment created a mix of opportunities and challenges for Florida’s foreign buyers in 2016 and 2017. Latin American countries faced political and economic difficulties and weaker currencies in the wake of the collapse in oil prices. Meanwhile, economic growth strengthened in Canada and the Canadian dollar stabilized against the U.S. dollar. In the United Kingdom, the economy stayed on course, despite a weaker pound following the U.K.’s decision to leave the European Union (“Brexit”). In China, capital controls were more tightly regulated. House prices rose in the United States, including in Florida, but the appreciation was modest compared to the home price appreciation in Canada. Amid these challenges and opportunities, overall foreign buyer purchases of Florida residential property increased, with a decline in the share of buyers from Latin America and Europe, while the share of buyers from Canada increased and the share of buyers from Asia and Africa remained unchanged.
Residential Properties Purchased by Foreign Buyers
• Foreign buyer purchases of Florida residential properties increased to $24.2 billion ($19.4 billion in 2016). This accounted for 21 percent of Florida’s residential dollar volume of sales (19 percent in 2016). Nationally, foreign buyers comprised 10 percent of the dollar volume of existing home sales.
• Foreign buyers purchased 61,300 residential properties (47,000 in 2016), which made up 15 percent of Florida’s residential market (12 percent in 2016). Nationally, foreign buyer residential purchases accounted for five percent of existing-home sales.
• The median purchase price among foreign buyers increased to $259,400 ($252,500 in 2016), in line with the overall increase in the median price of Florida’s existing home sales of $220,100 ($211,500 in 2016). The median price among foreign buyers was 18 percent higher than the median price of Florida’s existing home sales.
• Latin American and Caribbean buyers accounted for the largest fraction of Florida foreign buyers at 34 percent, although they comprised a smaller share compared to the previous year’s share (39 percent). On the other hand, the share of buyers from Canada increased to 22 percent (19 percent in 2016). The share of buyers from Europe was unchanged, at 23 percent, as well as the share of buyers from Asia, at 10 percent, and the share of buyers from Africa, at one percent.
• While foreign buyers purchased property across the state, most foreign buyers were concentrated in five metropolitan areas:
o Miami-Fort Lauderdale-West Palm Beach MSA (53 percent) o Orlando-Kissimmee-Sanford MSA (11 percent) o Tampa-St. Petersburg-Clearwater MSA (nine percent) o Cape Coral-Fort Myers (six percent) o North Point-Sarasota-Bradenton (five percent).

4
• Most foreign buyers—72 percent—made an all-cash purchase (72 percent in 2016).
• A smaller fraction of foreign buyers—68 percent—purchased residential property for vacation, residential rental, or for both uses (72 percent in 2016). Nationally, 39 percent of all foreign buyers purchased for these purposes.
• A smaller fraction of foreign buyers— 49 percent—bought a townhouse or condominium (52 percent in 2016). Nationally, only 29 percent of foreign buyers purchased these types of properties.
• Fewer foreign buyers purchased in a central city/urban area, with the share at 35 percent (40 percent in 2016). Meanwhile, 15 percent purchased in a resort area (14 percent in 2016).
• Most foreign buyers—93 percent—visited Florida at least once before purchasing a property (92 percent in 2016).
Florida Domestic Clients Searching for Properties Abroad
• A higher fraction than last year—17 percent—reported that they had a client seeking to purchase property abroad (14 percent in 2016).
• Colombia, Costa Rica, Spain, Canada, and the Dominican Republic were the top countries of interest in 2016 and 2017.
• Most clients—75 percent—were interested in residential property (79 percent in 2016).
• Most clients—75 percent— intended to use the property for vacation, residential rental, or both uses (84 percent in 2016).
Interaction with International Clients
• A lower fraction of Florida REALTORS®’ respondents—44 percent—worked with an international client in 2017 (48 percent in 2016). Nationally, 29 percent of REALTORS® worked with a foreign client.
• Most Florida REALTORS®—61 percent—reported they did not have cultural and language problems when working with international clients (65 percent in 2016).
• Over a third of Florida REALTORS®—37 percent—spoke a language other than English (39 percent in 2016).
• Personal contacts, previous clients, and business contacts accounted for 72 percent of referrals or leads. The agent’s firm or franchise’s website or social media was the primary source of online leads, followed by other aggregator websites, and Realtor.com.
• Respondents were evenly split about the outlook in the next 12 months: 43 percent expected the same or an increase in international clients, 42 percent expected a decrease, and 15 percent had no opinion (don’t know).
• Slightly more than half—56 percent—expected foreign retirees to be potential clients.
5
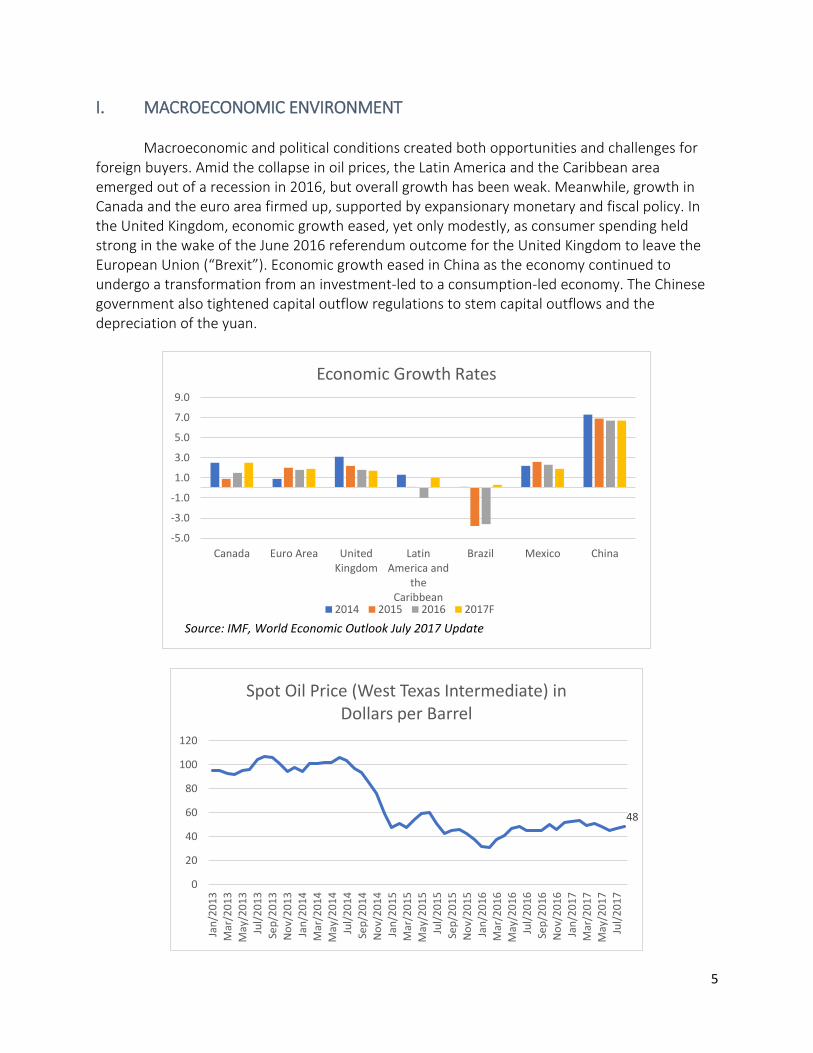
I. MACROECONOMIC ENVIRONMENT Macroeconomic and political conditions created both opportunities and challenges for
foreign buyers. Amid the collapse in oil prices, the Latin America and the Caribbean area emerged out of a recession in 2016, but overall growth has been weak. Meanwhile, growth in Canada and the euro area firmed up, supported by expansionary monetary and fiscal policy. In the United Kingdom, economic growth eased, yet only modestly, as consumer spending held strong in the wake of the June 2016 referendum outcome for the United Kingdom to leave the European Union (“Brexit”). Economic growth eased in China as the economy continued to undergo a transformation from an investment-led to a consumption-led economy. The Chinese government also tightened capital outflow regulations to stem capital outflows and the depreciation of the yuan.
-5.0
-3.0
-1.0
1.0
3.0
5.0
7.0
9.0
Canada Euro Area UnitedKingdom
LatinAmerica and
theCaribbean
Brazil Mexico China
Economic Growth Rates
2014 2015 2016 2017F
Source: IMF, World Economic Outlook July 2017 Update
48
0
20
40
60
80
100
120
Jan
/20
13
Mar
/20
13
May
/20
13
Jul/
20
13
Sep
/20
13
No
v/2
01
3
Jan
/20
14
Mar
/20
14
May
/20
14
Jul/
20
14
Sep
/20
14
No
v/2
01
4
Jan
/20
15
Mar
/20
15
May
/20
15
Jul/
20
15
Sep
/20
15
No
v/2
01
5
Jan
/20
16
Mar
/20
16
May
/20
16
Jul/
20
16
Sep
/20
16
No
v/2
01
6
Jan
/20
17
Mar
/20
17
May
/20
17
Jul/
20
17
Spot Oil Price (West Texas Intermediate) in Dollars per Barrel

6
The dollar strengthened against the Venezuelan bolivar, the British pound, the new Mexican peso, and the Chinese yuan. It also slightly strengthened against the euro. Low oil prices and the ensuing economic and political turmoil in Venezuela caused the dollar to appreciate against the Venezuelan bolivar and the new Mexican peso, and it strengthened against the British pound in the wake of Brexit. The stronger dollar made U.S. property purchases less affordable for citizens earning in these currencies. The Canadian dollar, on the other hand, actually stabilized against the U.S. dollar after weakening in 2013 through the middle of 2016.
With tight supply, U.S. home prices rose by four percent, adjusted for inflation, in the second quarter of 2017. The pace of growth was modest compared with Canada, where home prices rose by 11 percent, adjusted for inflation. However, U.S. home prices rose at a faster pace than other countries such as Mexico, the United Kingdom, and several European countries.
35%
15%10%
5%2%
0% -1%
-13%
Average Monthly Change of the Value of the U.S.Dollar Against Local Currencies from August
2016–July 2017
-20.0
-15.0
-10.0
-5.0
0.0
5.0
10.0
15.0
20.0
Real House Price Growth in 2017Q1
Source: IMF Housing Watch

7
II. SIZE OF INTERNATIONAL TRANSACTIONS
In the 12-month period ending in July 2017, foreign buyers purchased $24.2 billion of Florida residential real estate ($19.4 billion in 2016).1 The dollar volume of foreign buyer purchases accounted for 21 percent of Florida’s existing home sales (19 percent in 2016), higher than the 10 percent share of all U.S. foreign buyers.
Foreign buyers purchased 61,300 residential properties in Florida during 2017 (47,000 in 2016). The number of foreign buyer purchases accounted for 15 percent of Florida’s existing home sales (12 percent in 2016), higher than the five percent share of all U.S. foreign buyers.2
1 The 2017 Florida REALTORS® survey covered the period August 2016–July 2017. In past Florida REALTORS® surveys, the 12-month period generally covered July of the previous year to June of the current year. No survey was held in 2006. The 2005, 2007, and 2008 surveys covered only non-resident foreign buyers (Type A). Starting in 2010, the estimates were benchmarked to the national survey. Starting in 2015, the purchase price was top-coded at $5 million from $1.3 million in previous surveys. From 2005–2015, estimates included some purchases for commercial properties. See Appendix 1 for the calculations and Appendix 2 for notes on the survey and estimation methods. 2 Source: NAR’s 2017 Profile of International Activity in the U.S. Residential Real Estate. The reference period in estimating the national level of foreign buyer purchases of residential property is April 2016—March 2017.
$15.2 $17.1 $17.3 $17.4
$14.5 $15.7
$23.7
$19.4
$24.2
2009 2010 2011 2012 2013 2014 2015 2016 2017
Dollar Volume of International Sales in Billion Dollars

8
Most foreign buyers—70 percent—were buyers who primarily resided abroad (Type A), about the same as in 2016 (69 percent in 2016). Nationally, only 48 percent of all U.S. foreign buyers were non-resident buyers.
46.0
66.1 65.3
53.6
44.3
52.3
44.047.0
61.3
2009 2010 2011 2012 2013 2014 2015 2016 2017
Number of International Sales in Thousand Units
21%27%
23%
17%14% 15% 12% 12% 15%
52%57%
51%
43%
28%
19%24%
19%21%
2009 2010 2011 2012 2013 2014 2015 2016 2017
International Sales as a Share of Dollar Volume and Number of Existing Home Sales
As Percent of Florida's Home Sales As Percent of Dollar Volume

9
III. FOREIGN BUYERS: ORIGINS AND PREFERENCES
Origin of Foreign Buyers
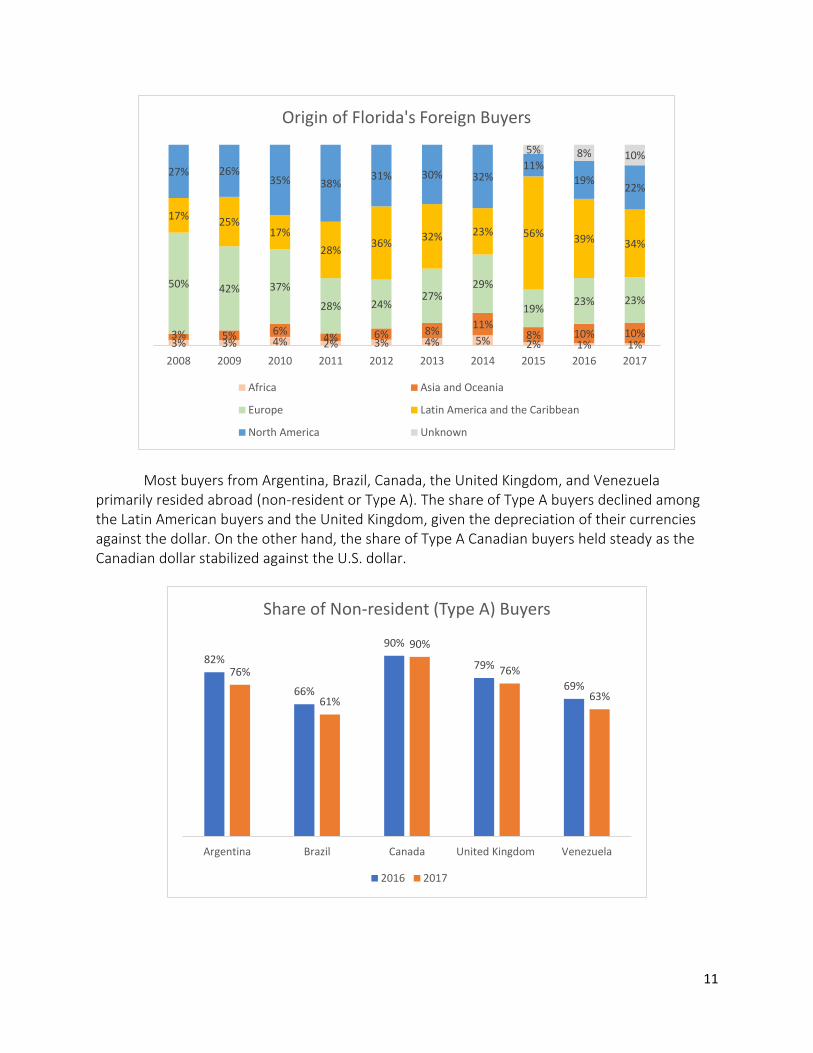
Florida’s foreign buyers came from many countries.
Buyers from Latin America and the Caribbean accounted for the largest fraction at 34
percent, although they comprised a smaller share than in 2016 (39 percent) as the share of purchases from Argentina, Brazil, Colombia, Mexico, and Venezuela decreased compared to a year ago. Weaker economic conditions in the region and the stronger value of the dollar likely accounted for the lower share of Latin American and Caribbean purchases in 2017.
On the other hand, the share of buyers from North America, all of which came from Canada, increased to 22 percent (19 percent in 2016). Stability in the value of the Canadian dollar compared to the U.S. dollar in 2016–2017 after weakening in 2014–2015 and the modest price appreciation in the United States compared to Canada made a U.S. home purchase more affordable for Canadians. The equity gained from the strong price growth in Canada’s home prices may also have provided a source of cash for homeowners who sold their Canadian property.
The share of buyers from Europe was unchanged at 23 percent. Although the British pound depreciated against the dollar, the share of U.K. purchases was unchanged at six percent, as economic growth was sustained by supportive monetary policies. Concerns about the uncertain outcome of the Brexit decision on the British economy and on the value of the pound relative to the dollar may also have boosted U.S. property purchases. Meanwhile, there was an increase in the share of buyers from Germany and France.
69%
31%
70%
30%
Non-resident (Type A) Resident (Type B)
Non-resident (Type A) Buyer as a Percent of Florida's Foreign Buyers
2016 2017

10
Buyers from Asia and Oceania accounted for ten percent (10 percent in 2016). The fraction of Asian buyers has been trending up. However, the share of Chinese buyers declined to three percent in 2017 (nearly four percent in 2016), perhaps in part due to tighter regulations on the outflow of foreign capital which the Chinese government undertook in 2016 to stem the outflow of capital and the depreciation of the yuan.
African buyers were one percent of foreign buyers (one percent in 2016). The top five buyers were Canada (22 percent), Brazil (seven percent), the United
Kingdom (six percent), Venezuela (six percent), and Argentina (five percent).
Canada BrazilUnited
KingdomVenezuela Argentina Colombia Germany France China Mexico
2008 26.6% 2.4% 21.2% 4.7% 1.7% 1.7% 6.7% 4.2% 0.5% 2.4%
2009 25.9% 1.9% 15.1% 5.4% 4.6% 1.6% 6.8% 4.6% 0.5% 2.4%
2010 35.1% 3.0% 15.1% 4.1% 1.5% 1.7% 5.0% 2.8% 1.9% 1.1%
2011 39.1% 7.8% 7.0% 6.8% 3.3% 2.6% 4.6% 4.1% 0.8% 1.7%
2012 30.7% 9.3% 4.6% 7.5% 5.2% 3.9% 3.7% 4.5% 2.2% 1.3%
2013 29.6% 6.5% 5.8% 7.6% 5.5% 3.2% 5.3% 3.2% 3.9% 0.5%
2014 31.6% 5.7% 7.0% 3.4% 2.9% 3.5% 5.4% 3.2% 5.7% 2.0%
2015 11.1% 9.4% 5.1% 18.4% 6.7% 7.0% 2.3% 2.6% 3.8% 2.3%
2016 18.9% 8.7% 6.2% 7.8% 6.0% 5.2% 3.3% 2.3% 3.5% 2.0%
2017 22.0% 6.6% 6.2% 6.1% 4.6% 4.5% 3.7% 3.4% 3.1% 2.1%
0%
5%
10%
15%
20%
25%
30%
35%
40%
45%
Florida's Major Foreign Buyers
11
Most buyers from Argentina, Brazil, Canada, the United Kingdom, and Venezuela primarily resided abroad (non-resident or Type A). The share of Type A buyers declined among the Latin American buyers and the United Kingdom, given the depreciation of their currencies against the dollar. On the other hand, the share of Type A Canadian buyers held steady as the Canadian dollar stabilized against the U.S. dollar.
3% 3% 4% 2% 3% 4% 5% 2% 1% 1%3% 5% 6%
4% 6% 8%11%
8% 10% 10%
50% 42% 37%
28% 24%27%
29%
19%23% 23%
17%25%
17%
28%36%
32% 23% 56% 39% 34%
27% 26%35% 38%
31% 30% 32%11%
19%22%
5% 8% 10%
2008 2009 2010 2011 2012 2013 2014 2015 2016 2017
Origin of Florida's Foreign Buyers
Africa Asia and Oceania
Europe Latin America and the Caribbean
North America Unknown
82%
66%
90%
79%
69%76%
61%
90%
76%
63%
Argentina Brazil Canada United Kingdom Venezuela
Share of Non-resident (Type A) Buyers
2016 2017

12
Destination of Foreign Buyers
Foreign buyers purchased property across Florida, but foreign buyers were concentrated in Miami-Fort Lauderdale-West Palm Beach MSA (53 percent), Orlando-Kissimmee-Sanford MSA (11 percent), Tampa-St. Petersburg-Clearwater MSA (nine percent), Cape Coral-Fort Myers (six percent), and North Point-Sarasota-Bradenton (five percent).
52.6%
10.8%
8.5%
5.7%
4.7%
2.6%
2.5%
2.0%
1.8%
1.6%
1.5%
1.0%
0.9%
0.6%
0.6%
0.6%
0.4%
0.3%
0.2%
0.1%
1.0%
52.1%
11.5%
7.7%
3.5%
3.2%
2.5%
3.0%
0.6%
2.5%
1.4%
1.2%
0.6%
0.5%
0.8%
0.5%
0.3%
0.4%
0.2%
0.4%
0.1%
0.3%
0.1%
6.6%
Miami-Fort Lauderdale-West Palm Beach MSA
Orlando-Kissimmee-Sanford MSA
Tampa-St.Petersburg-Clearwater MSA
Cape Coral-Fort Myers MSA
North Port-Sarasota-Bradenton MSA
Jacksonville MSA
Naples-Immokalee-Marco Island MSA
Lakeland-Winter Haven MSA
Port St. Lucie MSA
Deltona-Daytona Beach-Ormond Beach MSA
Palm Bay-Melbourne-Titusville MSA
Punta Gorda MSA
Crestview-Fort Walton Beach-Destin MSA
Sebastian-Vero Beach MSA
Ocala MSA
Panama City MSA
Gainesville MSA
Homosassa Springs MSA
Tallahassee MSA
The Villages MSA
Pensacola-Ferry Pass-Brent MSA
Sebring MSA
Other FL County
Destination of Florida's Foreign Buyers
2017 2016

13
Another way of looking at the preferred destination of foreign buyers is to compare the percentage distribution of Florida’s sales of single-family homes, townhomes, and condominiums across metropolitan statistical areas to the percentage distribution of foreign buyers in these metropolitan areas3. This comparison shows that Miami-Fort Lauderdale-West Palm Beach MSA accounted for 24 percent of closed sales, but it accounted for 53 percent of foreign buyers.
3 Source: Florida REALTORS®. Florida’s closed sales are those reported on the Multiple Listing Services (MLSs) and do not include for-sale-by-owners (FSBOs). However, the number of Florida’s foreign buyers, which are benchmarked to total U.S. foreign buyers and existing home sales, counts FSBOs.
52.6%
10.8%
8.5%
5.7%
4.7%
2.6%
2.5%
2.0%
1.8%
1.6%
1.5%
1.0%
0.9%
0.6%
0.6%
0.6%
0.4%
0.3%
0.2%
0.1%
23.6%
11.2%
17.0%
4.9%
5.3%
7.2%
2.6%
2.8%
2.7%
3.8%
3.2%
1.5%
2.2%
1.0%
1.7%
1.3%
1.0%
0.8%
1.3%
0.3%
2.4%
0.5%
Miami-Fort Lauderdale-West Palm Beach MSA
Orlando-Kissimmee-Sanford MSA
Tampa-St.Petersburg-Clearwater MSA
Cape Coral-Fort Myers MSA
North Port-Sarasota-Bradenton MSA
Jacksonville MSA
Naples-Immokalee-Marco Island MSA
Lakeland-Winter Haven MSA
Port St. Lucie MSA
Deltona-Daytona Beach-Ormond Beach MSA
Palm Bay-Melbourne-Titusville MSA
Punta Gorda MSA
Crestview-Fort Walton Beach-Destin MSA
Sebastian-Vero Beach MSA
Ocala MSA
Panama City MSA
Gainesville MSA
Homosassa Springs MSA
Tallahassee MSA
The Villages MSA
Pensacola-Ferry Pass-Brent MSA
Sebring MSA
Distribution of Foreign Buyer Purchases Compared to Distribution of Florida's Closed Sales
Percent Distrbution of Foreign Buyer Residential Purchases
Percent Distribution of Florida's Closed Sales (SF/TH/Condo)

14
Major Buyers of Top Florida Destinations
Foreign buyers tended to concentrate in an area for several reasons, such as geographic proximity, cultural similarities, investment opportunities, and the presence of family or friends.
Miami-Fort Lauderdale-West Palm Beach MSA buyers were predominantly Latin American and Caribbean (46 percent), as well as Canadian (19 percent) and European (18 percent).
Orlando- Kissimmee-Sanford MSA buyers were mainly Latin American and Caribbean (37 percent), European (22 percent), and Asian (15 percent).
Tampa-St. Petersburg-Clearwater MSA had a more even mix of buyers from Canada (32 percent), Europe (23 percent), Latin America and the Caribbean (17 percent), and Asia (17 percent).
Cape Coral-Fort Myers MSA buyers attracted mostly Canadians (42 percent) and Europeans (40 percent).
North Point-Sarasota-Bradenton MSA buyers also attracted mostly Europeans (37 percent) and Canadians (36 percent).
Jacksonville MSA buyers were predominantly from Asia (30 percent) and Latin American and the Caribbean (26 percent).
18%
22%
23%
40%
37%
21%
35%
48%
20%
28%
46%
37%
17%
7%
7%
26%
3%
15%
30%
20%
9%
15%
17%
10%
30%
12%
10%
6%
19%
12%
32%
42%
36%
9%
51%
18%
23%
23%
1%
1%
1%
1%
3%
3%
3%
7%
13%
10%
9%
10%
14%
8%
3%
17%
20%
Miami-Fort Lauderdale-West Palm Beach MSA
Orlando-Kissimmee-Sanford MSA
Tampa-St.Petersburg-Clearwater MSA
Cape Coral-Fort Myers MSA
North Port-Sarasota-Bradenton MSA
Jacksonville MSA
Naples-Immokalee-Marco Island MSA
Lakeland-Winter Haven MSA
Deltona-Daytona Beach-Ormond Beach MSA
Other areas
Origin of Foreign Buyers in Florida's Metro Areas
Europe Latin America and the Caribbean Asia and Oceania North America (Canada) Africa Unknown

15
Naples-Immokalee-Marco Island MSA buyers were mostly from Canada (51 percent) and Europe (35 percent).
Lakeland-Winter Haven MSA buyers were predominantly from Europe (48 percent).
Deltona-Daytona Beach-Ormond Beach attracted an even mix of buyers from Europe (20 percent), Canada (30 percent), Asia (10 percent), Canada (23 percent), and other buyers whose origins were reported as Unknown by the respondent (17 percent).
Other counties in Florida also attracted a mix of buyers from Europe (28 percent), Canada (23 percent), Latin America and the Caribbean (20 percent), Asia (six percent), Africa (three percent) and other buyers whose origins were reported as Unknown by the respondent (20 percent).
The next charts show the countries of origin for some metropolitan areas.4
4 These selected metropolitan statistical areas had a sample size of at least 30 observations.
19%9%
8%8%
7%4%
3%3%
2%2%
2%2%2%2%2%
27%
CanadaBrazil
ArgentinaVenezuelaColombia
FranceUnited Kingdom
ChinaMexico
EcuadorTurkey
GermanyIsraelPeru
RussiaOther
Major Foreign Buyers in Miami-Fort Lauderdale-West Palm Beach MSA

16
13%12%
10%10%
7%4%
3%2%2%
2%2%2%2%2%2%
28%
BrazilCanada
United KingdomVenezuela
ChinaColombia
ItalyHaiti
MexicoArgentinaGermany
IndiaIsraelPeru
United Arab EmiratesOther
Major Foreign Buyers in Orlando-Kissimmee-Sanford MSA
32%
9%
6%
6%
4%
3%
2%
2%
36%
Canada
United Kingdom
Venezuela
India
Germany
Russia
France
Turkey
Other
Major Foreign Buyers in Tampa-St. Petersburg-Clearwater MSA
42%
20%
10%
3%
2%
2%
2%
18%
Canada
Germany
United Kingdom
Norway
Brazil
France
Spain
Other
Major Foreign Buyers in Cape Coral-Fort Myers MSA

17
51%
14%
8%
5%
22%
Canada
Germany
France
United Kingdom
Other
Major Foreign Buyers in Naples-Immokalee-Marco Island MSA
9%
9%
7%
7%
5%
5%
5%
53%
Canada
China
Brazil
United Kingdom
Argentina
Germany
Iraq
Other
Major Foreign Buyers in Jacksonville MSA
51%
14%
8%
5%
22%
Canada
Germany
France
United Kingdom
Other
Major Foreign Buyers in Naples-Immokalee-Marco Island MSA

18
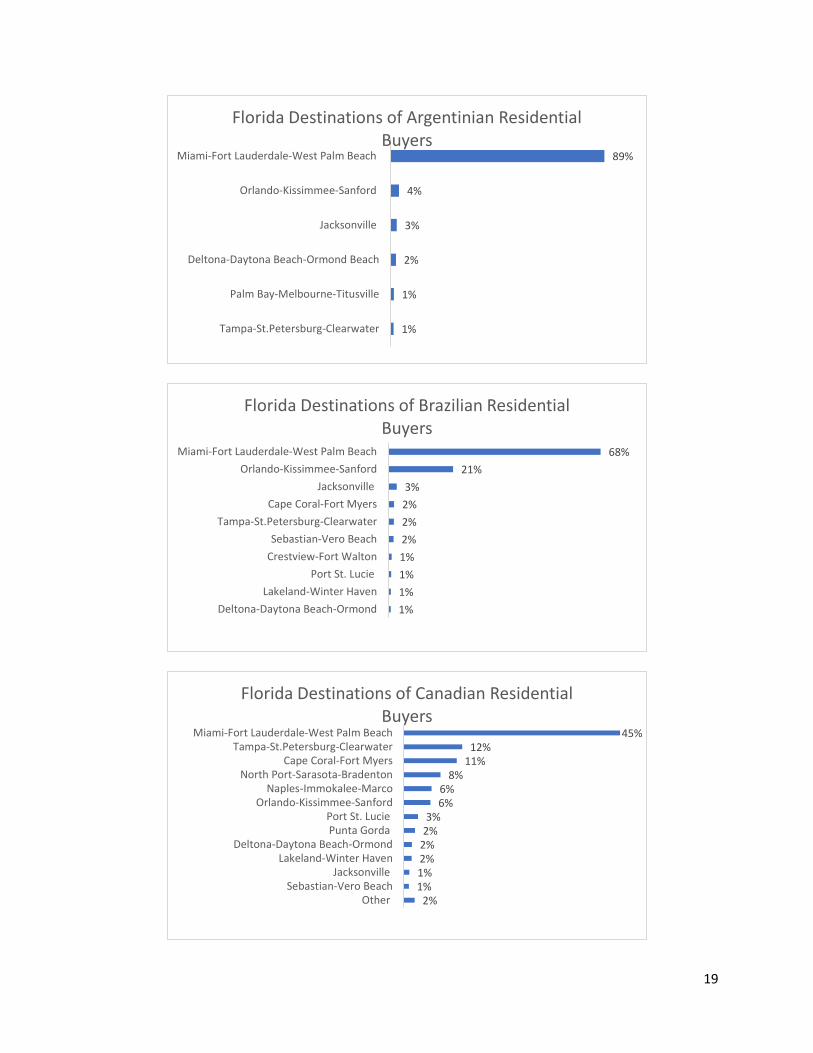
Major Destinations of Florida’s Major Buyers
The next charts show the destination of the top five buyers: Argentina, Brazil, Canada, the United Kingdom, and Venezuela. Miami-Fort Lauderdale-West Palm Beach, Orlando-Kissimmee-Sanford, and Tampa-St. Petersburg-Clearwater were the top destinations among the major foreign buyers.
36%
18%
6%
39%
United Kingdom
Canada
Ireland
Other
Major Foreign Buyers in Lakeland-Winter Haven MSA
23%
7%
7%
7%
57%
Canada
Argentina
Dominican Republic
United Kingdom
Other
Major Foreign Buyers in Deltona-Daytona Beach-Ormond Beach MSA
19
89%
4%
3%
2%
1%
1%
Miami-Fort Lauderdale-West Palm Beach
Orlando-Kissimmee-Sanford
Jacksonville
Deltona-Daytona Beach-Ormond Beach
Palm Bay-Melbourne-Titusville
Tampa-St.Petersburg-Clearwater
Florida Destinations of Argentinian Residential Buyers
68%
21%
3%
2%
2%
2%
1%
1%
1%
1%
Miami-Fort Lauderdale-West Palm Beach
Orlando-Kissimmee-Sanford
Jacksonville
Cape Coral-Fort Myers
Tampa-St.Petersburg-Clearwater
Sebastian-Vero Beach
Crestview-Fort Walton
Port St. Lucie
Lakeland-Winter Haven
Deltona-Daytona Beach-Ormond
Florida Destinations of Brazilian Residential Buyers
45%12%
11%8%
6%6%
3%2%
2%2%1%1%
2%
Miami-Fort Lauderdale-West Palm BeachTampa-St.Petersburg-Clearwater
Cape Coral-Fort MyersNorth Port-Sarasota-Bradenton
Naples-Immokalee-MarcoOrlando-Kissimmee-Sanford
Port St. LuciePunta Gorda
Deltona-Daytona Beach-OrmondLakeland-Winter Haven
JacksonvilleSebastian-Vero Beach
Other
Florida Destinations of Canadian Residential Buyers

20
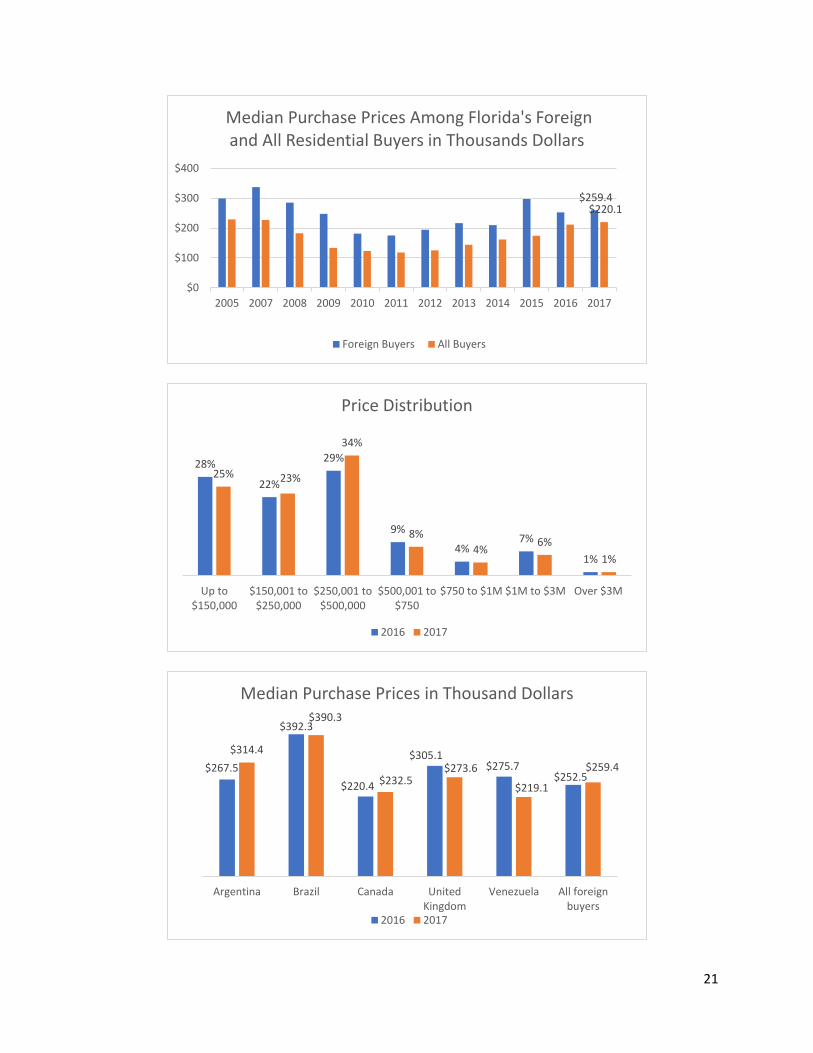
Prices and Financing
The median purchase price among foreign buyers increased to $259,400 ($252,500 in 2016). The foreign buyer median price was 18 percent higher than the median price of Florida’s existing home sales of $220,100.
Eighty-one percent of foreign buyers purchased properties of $500,000 or less, slightly lower than in 2016 (79 percent).
Among the major buyers, buyers from Brazil and Argentina typically purchased more expensive properties compared to other buyers. Amid the depreciation of the Venezuelan bolivar and British pound, buyers from Venezuela and the United Kingdom purchased less expensive properties compared to one year ago.
23%18%
12%12%
9%8%
3%3%3%
2%2%2%
1%1%
Miami-Fort Lauderdale-West Palm BeachOrlando-Kissimmee-Sanford
Tampa-St.Petersburg-ClearwaterLakeland-Winter HavenCape Coral-Fort Myers
North Port-Sarasota-BradentonPunta Gorda
Palm Bay-Melbourne-TitusvilleJacksonville
Naples-Immokalee-MarcoOcala
Deltona-Daytona Beach-OrmondPort St. Lucie
Other
Florida Destinations of U.K. Residential Buyers
68%
17%
9%
1%
1%
1%
1%
1%
Miami-Fort Lauderdale-West Palm Beach
Orlando-Kissimmee-Sanford
Tampa-St.Petersburg-Clearwater
Cape Coral-Fort Myers
Gainesville
Port St. Lucie
North Port-Sarasota-Bradenton
Lakeland-Winter Haven
Florida Destinations of Venezuelan Residential Buyers
21
$259.4 $220.1
$0
$100
$200
$300
$400
2005 2007 2008 2009 2010 2011 2012 2013 2014 2015 2016 2017
Median Purchase Prices Among Florida's Foreign and All Residential Buyers in Thousands Dollars
Foreign Buyers All Buyers
28%
22%
29%
9%
4%7%
1%
25% 23%
34%
8%
4%6%
1%
Up to$150,000
$150,001 to$250,000
$250,001 to$500,000
$500,001 to$750
$750 to $1M $1M to $3M Over $3M
Price Distribution
2016 2017
$267.5
$392.3
$220.4
$305.1$275.7
$252.5
$314.4
$390.3
$232.5$273.6
$219.1
$259.4
Argentina Brazil Canada UnitedKingdom
Venezuela All foreignbuyers
Median Purchase Prices in Thousand Dollars
2016 2017

22
Seventy-two percent of foreign buyers made an all-cash purchase, the same share as in the past year (72 percent in 2016). The majority of Florida’s foreign buyers were non-resident buyers (Type A), and these buyers tend to make an all-cash purchase compared to resident foreign buyers (Type B).
Among the major foreign buyers, Argentinian buyers were the most likely to make an all-cash purchase.
72%
23%
2% 2% 1%
72%
21%
2% 2% 2%
All Cash MortgageFinancing - U.S.
Sources
MortgageFinancing -
Buyer's HomeCountry
Investors/Other Don’t Know
Financing Among Foreign Buyers
2016 2017
85%67%
86%77% 72%
14%30%
9% 20% 23%
Argentina Brazil Canada United Kingdom Venezuela
Type of Financing Among Florida's Major Foreign Buyers
All Cash Mortgage Loan from U.S. Sources
Mortgage Loan from Home Country Other/Don't Know

23
Intended Use of Property
Most foreign buyers—68 percent—purchased residential property for vacation, residential rental, or for both uses, although the fraction decreased compared to the share in 2016 (72 percent in 2016).
Compared with overall U.S. foreign buyers, Florida’s foreign buyers were more likely to purchase property for vacation, residential rental, or both uses (39 percent).
Buyers from Canada and the United Kingdom were more likely to purchase a vacation property. Buyers from Argentina and Venezuela tended to purchase a property for residential investment. Buyers from Brazil had a more even mixed use of the purchased properties for vacation, residential rental, or primary residence.
30%27%
15%
20%
1%3% 3%
28% 26%
15%
23%
1%4% 3%
Vacationhome for
family andfriends
Residentialrental
property forinvestment
Both of theabove
Primaryresidence
Property foruse by
student(s)studying in
U.S.educationalinstitutions
Other Don't know
Intended Use of Residential Property
2016 2017

24
Type of Property
Nearly half (49 percent) of foreign buyers bought a townhouse or condominium, a slight decrease from the share in 2016 (52 percent). Nationally, only 29 percent of foreign buyers purchased these types of properties.
24% 27%
55%44%
3%
43%
16%
18%
17%
39%
13%
15%
14%
19%
16%
16%
30%
9%17%
28%
6% 4%
4% 2% 1%9%
Argentina Brazil Canada United Kingdom Venezuela
Intended Use of Florida Property Purchased by Major Foreign Buyers
Vacation Home Residential Investment
Both Vacation and Residential Investment Primary Residence
Property for Use by Student Other
Don’t Know
44%
13%
39%
2% 3%
46%
11%
38%
1% 2%
Detached Single-Family
Townhouse Condominium Residential Land Other
Type of Residential Property
2016 2017

25
Buyers from Brazil and the United Kingdom tended to purchase single-family homes. Buyers from Argentina, Canada, and Venezuela, who tended to purchase properties for vacation and/or residential investment were most likely to purchase condominiums and townhomes.
Location Preference
Fewer foreign buyers purchased in a central city/urban area, with the share at 35 percent (40 percent in 2016). Meanwhile, 15 percent purchased in a resort area, a decline from the 33 percent share in 2008; this is consistent with the declining share of Canadian and U.K. buyers, from 50 percent in 2008 to less than 30 percent in 2017.
26%
59%
37%56%
35%
8%
9%
12%
13%
66%
26%
52%27%
49%
2% 3% 4%
Argentina Brazil Canada UnitedKingdom
Venezuela
Residential Property Purchases of Florida's Major Foreign Buyers
Detached single-family Townhouse/row house/duplex
Condominium or Cooperative Other (please specify)
25% 29% 26%35% 39%
30% 26%
47%40% 35%
33%32% 37%
27%30%
35% 39%
30%36% 37%
9% 8% 7% 5%6% 8% 10%
4% 10% 11%33% 31% 30% 32%
25% 27% 25% 19% 14% 15%
2008 2009 2010 2011 2012 2013 2014 2015 2016 2017
Location Preference of Florida's Foreign Buyers
Central city/urban area Suburban area Small town/rural area Resort area
26
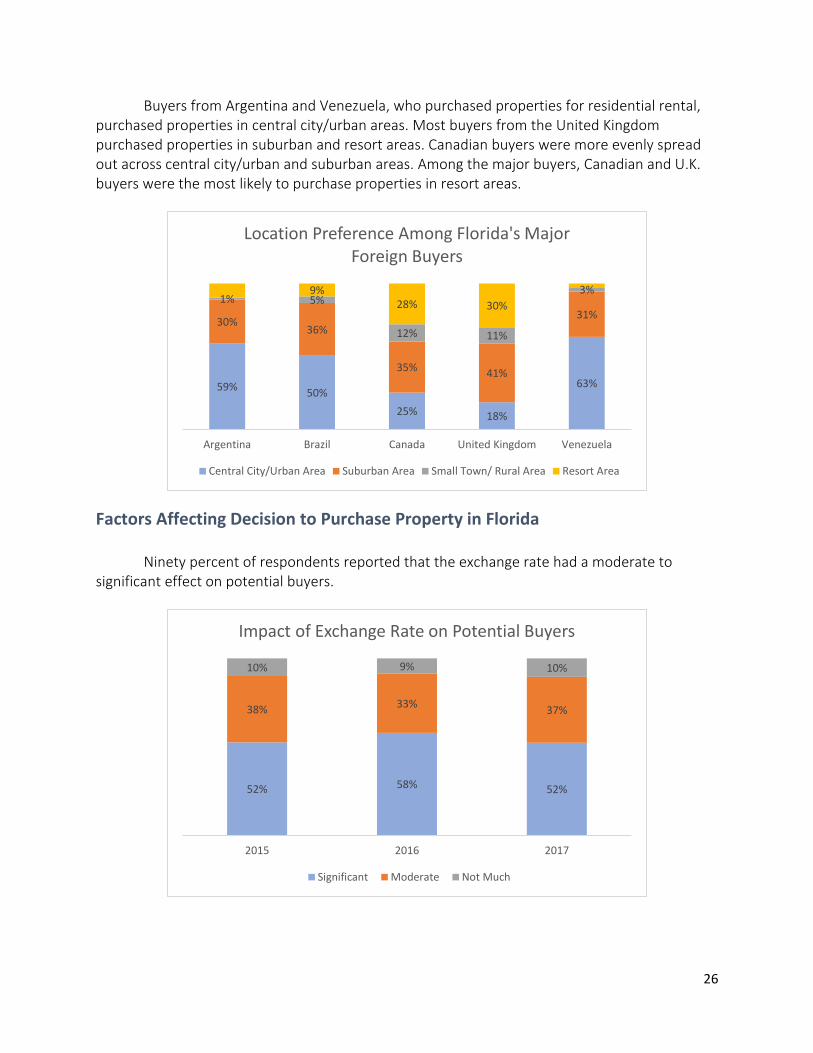
Buyers from Argentina and Venezuela, who purchased properties for residential rental, purchased properties in central city/urban areas. Most buyers from the United Kingdom purchased properties in suburban and resort areas. Canadian buyers were more evenly spread out across central city/urban and suburban areas. Among the major buyers, Canadian and U.K. buyers were the most likely to purchase properties in resort areas.
Factors Affecting Decision to Purchase Property in Florida
Ninety percent of respondents reported that the exchange rate had a moderate to significant effect on potential buyers.
59%50%
25% 18%
63%
30%36%
35% 41%
31%
1% 5%
12% 11%
3%9%28% 30%
Argentina Brazil Canada United Kingdom Venezuela
Location Preference Among Florida's Major Foreign Buyers
Central City/Urban Area Suburban Area Small Town/ Rural Area Resort Area
52% 58% 52%
38% 33%37%
10% 9% 10%
2015 2016 2017
Impact of Exchange Rate on Potential Buyers
Significant Moderate Not Much

27
The major reasons respondents cited why their clients did not purchase property were “Could not find a property”, price-related reasons (e.g., exchange rate, condominium fees, obtaining financing, moving/transferring money), and immigration laws.
Similarly to U.S. buyers, foreign buyers consider a residential property acquisition as a significant investment. Consequently, most buyers—93 percent—visited Florida before making a purchase (92 percent in 2016).
12%
1%
4%
5%
5%
7%
7%
8%
10%
12%
14%
Don't know/Other
Loss of home country benefits
Insurance costs
Exposure to U.S. tax laws
Property taxes
Can not move money
Immigration laws
Could not obtain financing
Condo/maintenance fees
Exchange rate
Could not find a property to purchase
Reasons Client Did Not Purchase Property
2017
8%
21%
26%
19%
8%10%
5%4%
7%
21%
29%
17%
6%
10%
6%3%
0 1 2 3 4 5 to 7 8 to 10 More than10
Number of Times International Client Visited Florida Before Purchasing a Property
2016 2017
28
IV. FLORIDA RESIDENTS SEEKING TO PURCHASE PROPERTY ABROAD
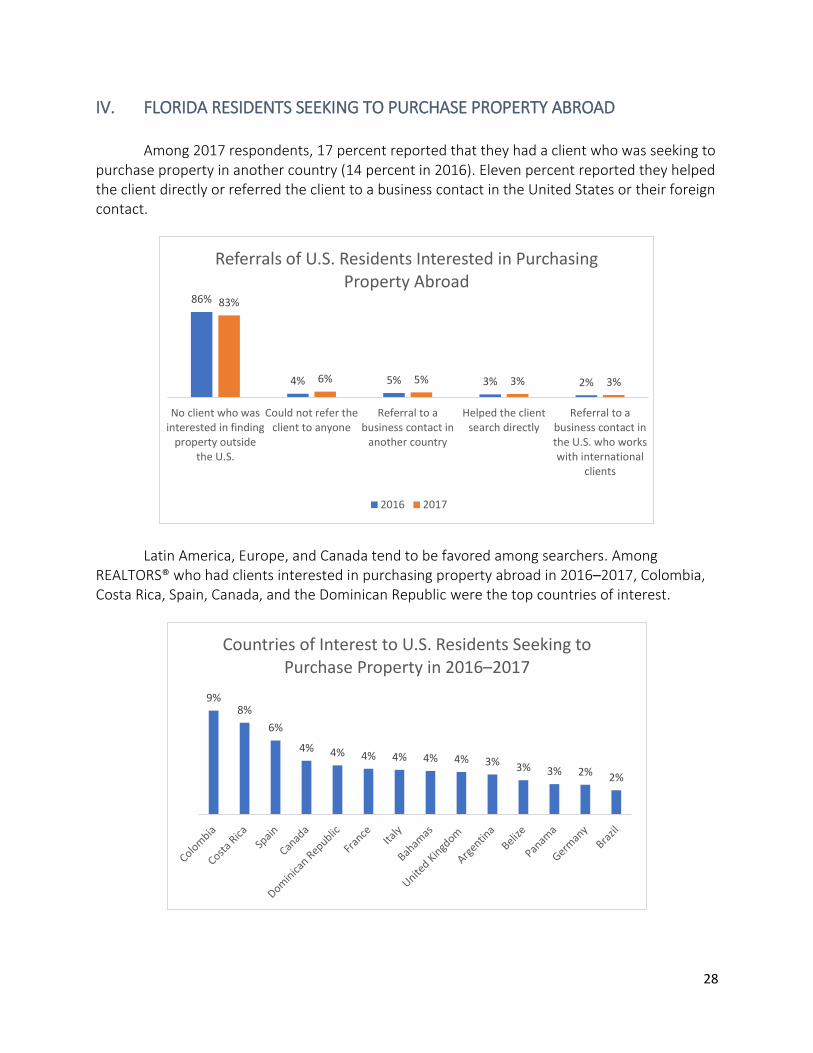
Among 2017 respondents, 17 percent reported that they had a client who was seeking to purchase property in another country (14 percent in 2016). Eleven percent reported they helped the client directly or referred the client to a business contact in the United States or their foreign contact.
Latin America, Europe, and Canada tend to be favored among searchers. Among REALTORS® who had clients interested in purchasing property abroad in 2016–2017, Colombia, Costa Rica, Spain, Canada, and the Dominican Republic were the top countries of interest.
86%
4% 5% 3% 2%
83%
6% 5% 3% 3%
No client who wasinterested in finding
property outsidethe U.S.
Could not refer theclient to anyone
Referral to abusiness contact in
another country
Helped the clientsearch directly
Referral to abusiness contact inthe U.S. who workswith international
clients
Referrals of U.S. Residents Interested in Purchasing Property Abroad
2016 2017
9%8%
6%
4% 4% 4% 4% 4% 4% 3% 3% 3% 2% 2%
Countries of Interest to U.S. Residents Seeking to Purchase Property in 2016–2017

29
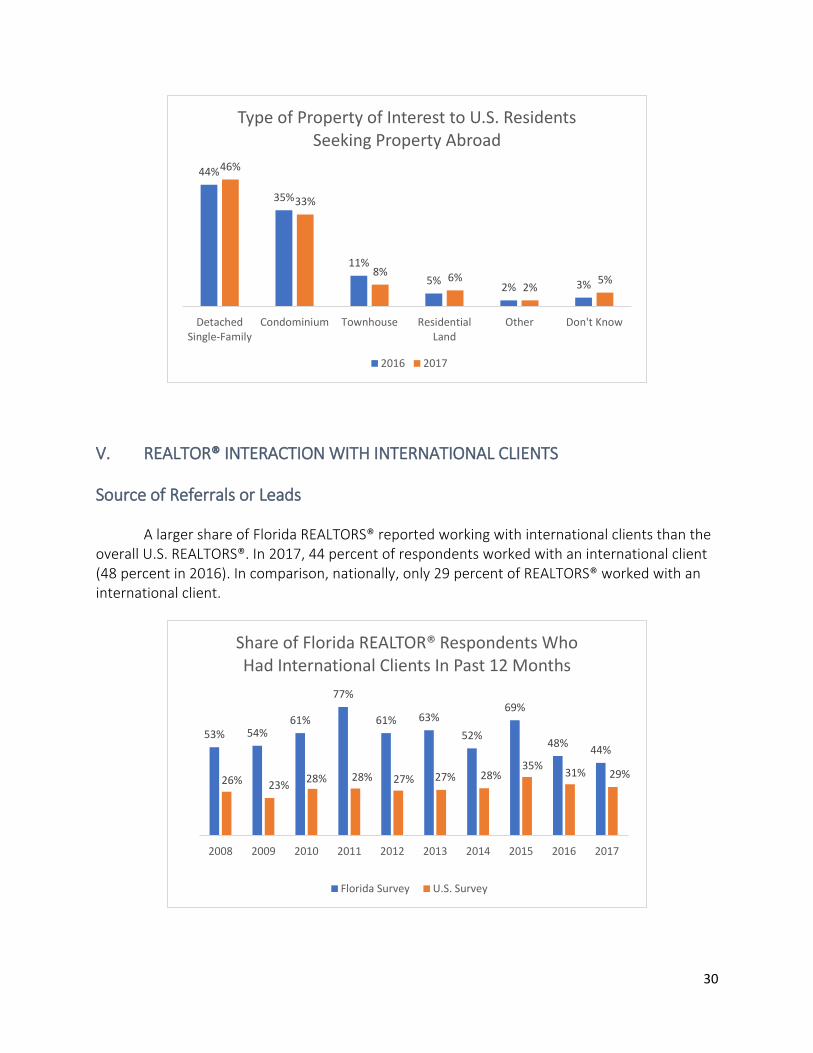
Most clients were interested in residential property, primarily for use as vacation home or residential rental. Detached single-family homes were the most preferred.
79%
7%14%
75%
8%17%
Residential Property Commercial Property Don't Know
Type of Property U.S. Residents Were Interested in Purchasing Abroad
2016 2017
37%
28%
19%
13%
1% 2%
30% 30%
15% 14%
3%7%
Vacation Homefor
Family/Friends
Both VacationHome andResidential
Rental
ResidentialRental
PrimaryResidence
Other Don't Know
Intended Use of Property Among U.S. Residents Seeking Property Abroad
2016 2017
30
V. REALTOR® INTERACTION WITH INTERNATIONAL CLIENTS
Source of Referrals or Leads
A larger share of Florida REALTORS® reported working with international clients than the overall U.S. REALTORS®. In 2017, 44 percent of respondents worked with an international client (48 percent in 2016). In comparison, nationally, only 29 percent of REALTORS® worked with an international client.
44%
35%
11%
5%2% 3%
46%
33%
8% 6%2%
5%
DetachedSingle-Family
Condominium Townhouse ResidentialLand
Other Don't Know
Type of Property of Interest to U.S. Residents Seeking Property Abroad
2016 2017
53% 54%61%
77%
61% 63%
52%
69%
48%44%
26% 23%28% 28% 27% 27% 28%
35%31% 29%
2008 2009 2010 2011 2012 2013 2014 2015 2016 2017
Share of Florida REALTOR® Respondents Who Had International Clients In Past 12 Months
Florida Survey U.S. Survey

31
Personal contacts, previous clients, and business contacts accounted for 72 percent of referrals or leads. The firm’s or franchise’s website or social media was the primary source of online leads, followed by other aggregator websites, and Realtor.com.®
Language and Cultural Factors
Among all respondents, 61 percent reported they did not have cultural or language problems in their interactions (65 percent in 2016). Although 72 percent of the respondents reported they were born in the United States, slightly more than a third spoke a language other than English.
31%
23%
12%
9%
5%
4%
4%
2%
2%
8%
Personal Contacts
Referred by Previous Client
Was a Former Client
Website/Internet Organic Search
Website/Internet (Paid Ad)
Walk-in/Open House/Phone Call
From a Business contact in the U.S.
Sings/Ads on Boards or Yard
From a Business Contact Outside the U.S.
Other
Source of Referrals or Leads on Florida's Foreign Buyers
41%
26%
18%
3%
1%
0%
0%
4%
6%
Own/Firm/Franchise's Website or Social Media
Other Aggregators' Websites
Realtor.com
Local MLS
Other Online Search
Home country real estate internet portal
Commercial Listing
Other Sources
Don’t Know
Source of Online Leads on Florida's Residential Foreign Buyers

32
65%
32%
3%
61%
35%
4%
Have Not Had Problems A Few Problems Significant Problems
Cultural or Language Problems
2016 2017
63% 69% 73% 83%
48%70% 72%
10%10% 8%
6%
14%
9% 9%27% 21% 19% 11%
37%21% 19%
2011 2012 2013 2014 2015 2016 2017
Born in the United States
No, but came to the U.S. at least 18 years old
No, but came to the U.S. before 18 years old
Yes
30%33% 33%
41%39%
33%
24%
36%39%
37%
2008 2009 2010 2011 2012 2013 2014 2015 2016 2017
Percent of Florida REALTOR® Respondents Who are Fluent in a Language Other than English

33
Eighteen percent of respondents reported less than one year of experience as a REALTOR®. Eleven percent reported they had a Certified International Property Specialist (CIPS) designation.
Outlook in the Next 12 Months
Respondents were evenly split about the outlook in the next 12 months: 43 percent expected the same or an increase in international clients, 42 percent expected a decrease, and 15 percent had no opinion (don’t know). Respondents cited several reasons for their cautious outlook, including rising/unaffordable home prices, unfriendly political climate and immigration policies, and the strong dollar, especially against the Canadian dollar and the British pound.
Slightly more than half—56 percent—expected foreign retirees to be potential clients in the near term.
18%
31%
11%
15%
8%
17%
0%
5%
10%
15%
20%
25%
30%
35%
Less than 1year
1 to 5 years 6 to 10 years 11 to 15 years 16 to 20 years 21 years ormore
Number of Years as a REALTOR®
2015 2016 2017
35.6%
16.9%14.7% 13.5% 13.1%
10.8%7.5% 7.4% 7.1%
3.1% 2.7% 2.2%0.1%
42.5%
Designations Held By Respondents

34
VI. CONCLUDING COMMENTS
Notwithstanding the appreciation of the dollar and difficult economic environment in countries where most Florida’s foreign buyers come from, Florida REALTORS®’ international transactions increased as the share of buyers from Canada rose while the share of buyers from Latin America and Europe decreased.
The future growth of international business will be strongly dependent on global economic conditions and the real estate conditions in Florida, mainly prices and availability of supply. Florida’s natural endowments—its warm climate, abundant seashore, natural beauty, and proximity to Latin America, are expected to keep Florida as a top destination for foreign buyers. The increasing entry of new agents is reflective of their positive expectations of Florida’s residential market. However, this also indicates the need to assist Florida REALTORS® members in cultivating and growing their business.
17%
27%
42%
14%14%
29%
42%
15%
Increase Remain the Same Decrease Don't Know
Outlook in Next 12 Months
2016 2017
46% 49% 52% 54% 47% 52% 47% 48% 54% 56%
22% 23% 21% 25%23% 22% 23% 24%
25% 23%
32% 28% 27% 21%30% 27% 30% 28% 21% 21%
2008 2009 2010 2011 2012 2013 2014 2015 2016 2017
Are Foreign Retirees A Potential Pool of Buyers In Your Market?
Yes No Don’t Know

35
APPENDIX 1. COMPUTATION OF DOLLAR VOLUME OF FOREIGN BUYER PURCHASES
Appendix 1
Computation of Residential Purchases of Foreign Buyers in Florida for the 12-Month Period August 2016‒July 2017
Line Florida's Foreign Buyer Residential Purchases
1 Total U.S. Foreign Buyer Residential Purchases 284,455
2 Florida's Share to U.S. Foreign Buyer Residential Purchases (units) 22%
3 Number of Florida Foreign Buyer Residential Purchases 61,300
4 Average Price of Florida Foreign Buyer Residential Purchases $394,035
5 Dollar Volume of Foreign Buyer Residential Purchases in Florida $24,154,332,014
Florida's Residential Market for Existing Homes
6 Florida's Residential Dollar Volume (Single-Family, Condo/Townhomes) $114,797,521,380
7 Florida's Closed Sales (Single-Family, Condo/Townhomes) 398,953
8 Share of Dollar Volume of Foreign Buyer Purchases to Florida's Dollar Volume of Closed Sales 15%
9 Share of Foreign Buyer Purchases to Florida's Closed Sales 21%
Notes:
Line 1 Source: NAR's 2017 Profile of International Activity in U.S. Residential Real Estate
Line 2 Source: NAR's 2017 Profile of International Activity in U.S. Residential Real Estate
Line 3 Mutiply Lines 1 and 2
Line 4 2017 Profile of International Residential Activity in Florida
Line 5 Mutiply Lines 3 and 4 (Sales = # of units x mean price)
Line 6 Dollar volume of closed sales for single-family homes, condominiums, and townhomes. Source of data: Florida Realtors ®
Line 7 Closed sales for single-family homes, condominiums, and townhomes. Source of data: Florida Realtors®
Line 8 Divide Line 5 by Line 6.
Line 9 Divide Line 3 by Line 7.

36
APPENDIX 2. NOTES ON SURVEY AND ESTIMATION METHOD
Several factors need to be considered when comparing the annual results due to changes in data collection and the estimation of sales volume from international (foreign) clients:
• The 2005, 2007, 2008 surveys covered only Type A international clients, those who primarily resided abroad and who were purchasing U.S. property for vacation or investment purposes. From 2009 onwards, the survey asked about clients who were “citizens of another country”, a definition that includes Type A clients and non-U.S. citizens such as immigrants and those residing in the United States on work or student visas (Type B). No survey was held in 2006.
• The 2005, 2007, 2008, 2009 estimates of Florida’s international sales (units, dollar volume, and share to Florida’s closed sales) were estimated using Florida survey data. From 2010 onwards, when NAR started to generate the estimate of international sales in the United States (national estimate), the number of international sales (in units) in Florida were estimated based on Florida’s share of the national estimate. However, the average price and the distribution of Florida’s foreign buyers across metro areas were taken from the Florida surveys.
• During the 2005-2015 surveys, estimates of international sales included some commercial purchases. Beginning in the 2016 survey, the estimates only included foreign buyer purchases of residential property, yielding a better estimate that can be compared to total existing home sales.
• Beginning in the 2016 survey, the reference period covered the 12-month period of August of the previous year to July of the current year. Previous surveys covered transactions from July of the previous year to June of the current year. The impact of this change is likely to be minimal because the seasonal difference between the July‒June period and the August‒July period is not likely significant.
• Beginning in the 2015 survey, the responses were weighted to correct for over- or under-response from a metro area. The weight factor wi is equal to the number of members in area i divided by the number of respondents in area i. Data on Florida REALTORS®
membership is provided by the association. • Beginning in the 2015 survey, the highest purchase price was capped at $5 million, from
$1.3 million in previous surveys. The mean or the average price is used to calculate the total dollar volume of purchases. The mean can be used as a measure of central tendency. It is found by summing the responses and dividing by the number of responses. However, because home values tend to skew to the higher end, the median is often a better reflection of typical market activity. The median is the middle value of the distribution. Half of all purchases fall below this value and half are above this value.
37
The National Association of REALTORS®, “The Voice for Real Estate,” is America’s largest trade association, representing over 1.2 million members, including NAR’s institutes, societies and councils, involved in all aspects of the real estate industry. NAR membership includes brokers, salespeople, property managers, appraisers, counselors and others engaged in both residential and commercial real estate. The term REALTOR® is a registered collective membership mark that identifies a real estate professional who is a member of the National Association of REALTORS® and subscribes to its strict Code of Ethics. Working for America's property owners, the National Association provides a facility for professional development, research and exchange of information among its members and to the public and government for the purpose of preserving the free enterprise system and the right to own real property.
NATIONAL ASSOCIATION OF REALTORS® RESEARCH GROUP
The Mission of the National Association of REALTORS® Research Division is to collect and disseminate timely, accurate and comprehensive real estate data and to conduct economic analysis to inform and engage members, consumers, and policy makers and the media in a professional and accessible manner.
To find out about other products from NAR’s Research Division, visit https://www.nar.realtor/research-and-statistics.
NATIONAL ASSOCIATION OF REALTORS® RESEARCH GROUP 500 New Jersey Avenue, NW Washington, DC 20001 202.383.1000