
2017 - Postbank · Jan. 1 – June 30, 2017 Jan. 1 – June 30, 2016 Consolidated income statement...
101
2017 POSTBANK GROUP INTERIM REPORT AS OF JUNE 30, 2017
Transcript of 2017 - Postbank · Jan. 1 – June 30, 2017 Jan. 1 – June 30, 2016 Consolidated income statement...

2017POSTBANK GROUP
INTERIM REPORT AS OF JUNE 30, 2017

POSTBANK GROUP IN FIGURES
Jan. 1 – June 30, 2017 Jan. 1 – June 30, 2016
Consolidated income statement
Total income €m 1,624 1,697
Administrative expenses €m – 1,338 – 1,418
Profit before tax €m 316 165
Consolidated net profit €m 301 140
Adjusted profit before tax1 €m 368 189
Cost/income ratio % 80.5 86.2
Return on tangible equity
before tax % 12.0 6.4
after tax % 11.4 5.5
Earnings per share 2 € 1.38 0.64
June 30, 2017 Dec. 31, 2016
Consolidated balance sheet
Total assets €m 144,829 147,197
Liabilities due to customers €m 118,051 118,918
Loans and advances to customers €m 103,799 102,003
Allowance for losses on loans and advances €m 922 998
Equity €m 7,369 7,226
Common Equity Tier 1 capital ratio regular phased-in % 13.73 14.24
Common Equity Tier 1 capital ratio fully phased-in % 12.83 12.44
Leverage ratio regular phased-in % 3.93 4.14
Leverage ratiofully phased-in % 3.63 3.44
Headcount (FTEs) 18,114 18,112
Long-term rating
Fitch A – Outlook negative
BBB+ Outlook stable
1 The adjustments are shown in the Group Management Report in the section entitled “Net assets, financial position, and results of operations.“2Based on 218.8 million shares 3By factoring in the interim profit subject to supervisory authority approval4Factoring in profit for fiscal year 2016 as approved by the supervisory authority

33Interim Report as of June 30, 2017
CONTENTS
OUR CUSTOMER BUSINESS
Developments in H1 2017 4
INTERIM MANAGEMENT REPORT
Report on Economic Position 8
Opportunity Report 16
Risk Report 18
Outlook 39
INTERIM FINANCIAL STATEMENTS
Consolidated Statement of Comprehensive Income 42
Consolidated Income Statement – Quarterly Overview 44
Other Comprehensive Income – Quarterly Overview 45
Consolidated Balance Sheet 46
Statement of Changes in Equity 47
Condensed Cash Flow Statement 48
Notes 49
Review Report 75
OTHER INFORMATION
Regulatory Disclosures 76
01
02
03
04

44 Interim Report as of June 30, 2017
DEVELOPMENTS IN H1 2017
Checking accounts continue success storyThe need to reposition our checking accounts model, driven by the low interest rate environment, was generally received with understanding by our customers. As a result, we were able to maintain our book of private checking accounts at just under 5 million as of June 30, 2017. The attractiveness of our checking account product was once again demonstrated by the 170,000 newly opened private checking accounts in the first six months of 2017. Its appeal was also acknowledged by the German financial publica-tion FOCUS MONEY, which named it “best checking account” in its July 2017 edition. This successful repositioning of checking accounts has substantially helped enhance the Bank’s earnings power in a persistently challenging market environment.
While Postbank is extraordinarily positioned with its nation-wide network of branches, it also enjoys a similar digital positioning beyond that thanks to its end-to-end digital process for opening accounts and a multiple award-winning financial assistant app. Our checking account offer spe-cially designed for users who prefer to do their banking business online, “Giro direkt”, was utilized by more than 225,000 customers as of the reporting date. While more than 750,000 customers had selected our “Giro extra plus” check-ing account, the vast majority prefer the “Giro plus” version.
Stable progress in the deposit businessAs of June 30, 2017, Postbank had been entrusted with €99.5 billion in deposits (not including home savings deposits). While deposit volumes changed very little com-pared with the end of the prior year, the trend of declin-ing savings deposits with simultaneously rising demand deposits continued in the first six months of 2017. Volumes attributable to savings products sank by €1.3 billion to €37.3 billion, whereas demand deposits rose by around €2.2 billion or 4.6 % to €49.0 billion due to maintaining a higher level of liquidity in the low interest rate environ-ment. Here the Bank focused on advising customers about investment alternatives given the current low interest rate environment.
Portfolio in consumer credit business expanded despite tough competitionThe consumer credit portfolio grew by €0.3 billion or 3.4 % to reach €7.7 billion without a decline in portfolio quality. This positive trend is worth mentioning particularly given the tougher competitive pressure. In the first six months of 2017, new consumer credit business remained stable at the high level of €1.4 billion as compared to the prior-year period. This outcome was driven primarily by branch sales, which rose by €16.3 million or 4.3 % to €398.9 million.
In the area of digitization, Postbank also made a real push in the reporting period to make essential improvements to its process for automated budget accounting. In the future, the Bank will factor in transaction data from checking accounts as a source of information for credit checks. The goal here is to provide faster, more efficient and more customer-friendly self-reporting data and maintain, or further enhance, portfolio quality.
Once again the financial publication FOCUS MONEY (26/2017 edition), in cooperation with the experts of the Deutsches Finanz-Service Institut (DFSI – German Financial Services Institute), named Postbank overall winner in a test of the most cost-effective consumer credits. It won second place for its payment protection insurance, an area in which Postbank attaches the greatest importance to the transparency of its offer. In addition, Postbank also won first place in a recent study conducted by DISQ, the Deutsches Institut für Service-Qualität (German Institute for Service Quality – TEST, April 2017 edition), on behalf of the German television news agency n-tv. In its publica-tion DISQ highlighted Postbank’s attractive range of loans with cost-effective terms for customers using the online application process, and fully satisfactory customer service. In addition, the Bank’s informative website also received positive recognition.
Strategic measures impact customer business In the first half of 2017, Postbank made progress with efforts to reach an equal balance between customer loans and deposits – thanks in particular to a growing loan portfolio. Our securities campaign was also successful, with the positive new business trend leading assets under management in securities and investment accounts to expand to €15.5 billion.

55Interim Report as of June 30, 2017
01OUR CUSTOMER BUSINESS DEVELOPMENTS IN H1 2017
OU
R C
UST
OM
ER
BU
SIN
ESSMortgage lending trend still positive
New business in private mortgage lending continues to be buoyed by extraordinarily favorable financing terms and conditions as well as dedicated sales activities. New business volumes (including disbursed home savings loans) reached almost €6.2 billion. That figure appreciably sur-passes the good level reached in the first half of 2016 once again by €0.7 billion or just over 13 %. As a result, Post-bank’s new business continued to outperform the market, which featured growth in new business with residential mortgages of 3.0 % for all German banks 1. Sales volumes from the Group’s in-house sales efforts (branches and mobile sales) grew by 7.2 %. We also achieved considerable sales growth of 23.2 % in our brokerage business, which Postbank conducts under the DSL brand.
The private mortgage lending portfolio (excluding home savings loans) experienced slight growth of €0.7 billion compared with the end of 2016 to reach €69.7 billion. The pace of portfolio growth, which was slow despite the rise in new business, can be attributed primarily to two factors: first, to a large proportion of loan commitments that are still in the preparatory phase; and second to our customers’ continued heightened willingness to use contractual early loan repayment rights.
In a mortgage lending test conducted by the financial consulting company Finanzberatung Max Herbst (FMH) in cooperation with the German television news agency n-tv, Postbank and DSL Bank received the 2017 FMH Award for achieving first place as the “best mortgage lender” nationwide for loans with fixed interest rates of 15 years. The good advisory services for mortgage lending offered by Postbank Finanzberatung received positive recognition from the rating website WhoFinance in collaboration with the daily newspaper WELT. In a special publication on June 30, 2017, WELT ranked Postbank Finanzberatung as number one among the best mortgage lending service providers.
The home savings business under the BHW brand is closely linked with the mortgage lending business of Postbank – whether that is through advance savings to fulfill future financing intentions or the integration of home savings products into immediate financing for long-term interest rate hedging. Total home savings written brokered through Postbank sales channels reached volumes of €4.4 billion in the first half of 2017. In the low interest rate environment, our customers continued to use home sav-ings contracts to secure for themselves relatively modest interest rates in the future during the loan phase. As a result, the ratio of tariffs with low deposit and loan interest rates to total revenue also increased. Here, the incentive, in contrast to tariffs with high deposit and loan interest, is based on favorable loan interest instead of credit interest.
1 Source: Deutsche Bundesbank. This figure is determined by comparing new business from January to May of 2016 with business from the same period in 2017.
In the latest rate comparison conducted by FOCUS-MONEY (3/2017 edition), BHW Bausparkasse was named “the best home savings bank of its kind” and its “BHW FörderBau-sparen Flex”, Postbank's government-supported home savings offer (“Wohn-Riester”), was ranked number one. Securities and retirement provisions business profit from new advisory approachAt the end of 2016 Postbank launched a new securities strategy aimed at enabling the Bank, even in a low interest rate environment, to provide its customers good advisory services on capital market-oriented products with greater opportunities of returns. Thanks to the new advisory ap-proach in personal channels, new business with funds grew by 39.8 % in 2017’s first half to €1.4 billion. New business with investment funds is supported by increasing investments in exchange traded funds (ETFs), which Postbank began offering in its range of securities products for the first time at the start of 2017. By expanding its offer to include ETF savings plans since mid-year, Postbank has been able to offer additional attractive savings and investment products in a low interest environment. Assets under management in nearly 600,000 securities and investment accounts expanded by €0.5 billion or 3.3 % compared with the end of last year to €15.5 billion. Fund volumes in securities accounts rose by €0.4 billion or 5.5 % to €7.5 billion. The gain here was bolstered primarily by strong trends in new business in the first half of 2017 during which branch sales grew by 41.5 % and online channel sales by 25.9 % year-on-year.
The Bank’s retirement provision business for 2017 has been restructured with a new product concept and modified sales processes. Owing to the need for concentration on other product fields, the optimizations we implemented are now beginning to slowly have an effect. Accompany-ing measures will be used to shore up this business area further in the second half of 2017.
Modernization and digitization of product range for business customersOver the past months the introduction of diverse product innovations has comprehensively modernized and digitized our entire product range for business customers. New com-ponents and additional digital services have been specially tailored toward the needs of the target group. The new product offers, processes and systemic improvements take into account business customer requirements in the digital world.

66 Interim Report as of June 30, 2017
The launch of a market-leading and innovative “Business Assistant” app makes Postbank especially attractive for skilled craftsman with small businesses. The “Business Assis-tant” connects simple, secure online-banking with project management and correspondence functions. In addition, this exclusive app facilitates administrative and banking business tasks for our business customers. Following the successful “Family & Friends” phase, the app became avail-able in the app store at the end of April 2017.
Thanks to the introduction of an online loan application process for retail customers as of March 2017, prepara-tions for new features in the online application process for business customer loans were successfully concluded in the further course of the first half year. They included a function for uploading documents and a video legitima-tion process for verifying identities. The new, simple and convenient product version will be launched in the second half of 2017. Other digitization measures for all target groups are currently being implemented.
As part of the comprehensive project “Zukunft Konto GK” (the business customer account of the future), three new business customer checking account models were developed. They feature select innovations and differentiations oriented on the different usage patterns of typical customer groups. The product was successfully launched in May 2017.
Corporate customer loan portfolio continues positive trendThe corporate banking business was enlivened by the long-term strategic orientation of our corporate banking busi-ness on German small and medium-sized enterprises (SMEs) in connection with a risk conscious lending policy. New lending business for corporate customers in the reporting period expanded by 8 % year-on-year to reach €1.6 billion. The portfolio of loans to corporate customers grew €1.3 billion or 8 % compared with the end of 2016 to over €17.5 billion. In addition, the Bank has been able to reduce its deposit business by 3 % to €8.5 billion since the end of last year. Portfolio growth alongside a simultaneous reduction of the deposit surplus made an essential contribution to-ward achieving an equal balance between customer loans and deposits.
The primary driver of the growing corporate customer loan portfolio was among other things commercial real estate finance. Here, Postbank continues to adhere to a conservative lending policy that focuses on financing existing properties for professional real estate investors. Income in this area grew by a very satisfying 26 % compared with the first half of 2016. The loan portfolio expanded by 6 %, from €7.7 billion at the end of 2016 to more than €8.1 billion. New business is currently focused on risk-averse financing.
PB Factoring GmbH defended its leading market position with portfolio volumes of just under €3.0 billion.
Financial Markets secures customer business margins The Financial Markets business division conducts the Post-bank Group’s money market and capital market activities. Its primary responsibilities include hedging net interest margin contributions from the customer business by man-aging interest rate risk and market risk. One special challenge in the first half of 2017 arose from efforts to secure margins of the forward loans portfolio, which has grown considerably.
Financial Markets also manages the liquidity position and, on the path toward reaching an equal balance between customer loans and deposits, places a particular focus on the disposal of short-term money market investments in a negative interest rate environment.
In the first half of 2017, the Bank was able to reduce its money market assets by another €1.2 billion. Postbank also experienced remarkable success with additional efforts to reduce investment securities thanks to the favorable market environment. This volume of investment securi-ties sank by €2.3 billion to €24.5 billion. The reduction of investment securities is aimed primarily at improving the leverage ratio.

77Interim Report as of June 30, 2017
01OUR CUSTOMER BUSINESS DEVELOPMENTS IN H1 2017
OU
R C
UST
OM
ER
BU
SIN
ESSDiscontinuation of the Non-Core Operating Unit as of
August 1, 2017, following successful reduction of positions Since its establishment in 2012, the NCOU has experienced great success, reducing more than €41 billion in assets (87 % of total NCOU assets) and correspondingly €18.7 bil-lion in total capital demand (94 %). As a result, we have now essentially concluded risk reductions of assets not belonging to the core business. The remaining selected investment securities, specific foreign activities, and discontinued products in the customer business have been returned to the operating segments and scaled back even more. This implies no change in the portfolio strategies for the portfolios concerned, which will also be further reduced after the discontinuation of separate reporting. The Non-Core Operating Unit segment is thus formally dissolved as a Group segment of Postbank effective July 31, 2017.

88 Interim Report as of June 30, 2017
INTERIM MANAGEMENT REPORT AS OF JUNE 30, 2017
REPORT ON ECONOMIC POSITION
OVERALL ECONOMIC PARAMETERS
Macroeconomic environmentThe global economy picked up slightly in the first half of the year, although growth remained muted on the whole. Growth in the industrialized countries was nearly constant year-on-year; fluctuations were seen between the individual countries and regions. In the emerging markets, the economic upswing solidified slightly. However, quite a few emerging countries remained well behind their growth potential.
In the United States, the economy softened at the start of the year before signs of recovery began emerging in the second quarter. Growth momentum in private consumption abated somewhat overall in the first half of the year. However, gross capital expendi-tures were up substantially. Exports also demonstrated a clear trend toward improvement. Since imports were also up significantly, foreign trade did not pro-vide any notable momentum. At the same time, the upswing on the labor market continued. Employment figures continued to rise at a similar pace as in the previous year, and the unemployment rate fell to its lowest level in more than 16 years.
In the eurozone, economic growth accelerated in the first half of the year. First-quarter GDP was up 0.6 % compared with the first quarter of 2016. In the second quarter a similar trend was evident. Sustained momen-tum came from private consumption, which benefitted from a decrease in unemployment. At the same time, gross capital expenditures began moving upward again. Exports also experienced a revival. Due to the strong growth in imports, however, the foreign trade balance had a negative impact on GDP growth com-pared with the prior-year period. Inflation was up at the beginning of the year, mainly due to baseline ef-fect ensuing from the trend in oil prices. The inflation rate subsequently fell back, but nonetheless remained well above the level reported in the previous year.
The German economy made strong gains in the first half of the year. The first quarter saw GDP growth of 0.6 % compared with the first quarter of 2016. Similarly robust growth is expected for the second quarter based on the available data. Construction investments provided strong momentum, and investments in ma-chinery and equipment recovered from the prior year’s weak level. Sustained growth was seen in both private consumption and government spending, for which reason domestic demand continued to trend solidly upward. Exports were up markedly amid the slight re-covery in the global economy, and thanks in particular to stronger economies in the other eurozone coun-tries. All of these trends served to put the economic upturn on an even broader base in the first half, which positively impacted the labor market. Unemployment continued to retreat as companies increased hiring.
The positive climate was reflected in corporate senti-ment, with the ifo Business Climate index reaching its highest level since German reunification.
General macroeconomic performance in Germany and the eurozone exceeded the forecasts we made in our 2016 Group Management Report, while the trend in the U.S.A. corresponded more or less with our forecast.
The situation with respect to government bonds issued by European Monetary Union countries became more turbulent in the first half of 2017. The government bond market in the periphery eurozone countries suf-fered from the general political uncertainty in Europe, due in part to the multitude of upcoming parliamen-tary and presidential elections. The yield spreads of Italian, Spanish and Portuguese government bonds over German Bunds all broadened, but to greatly vary-ing degrees. Spanish bonds were the least affected as they were only subject to overall rising unease in Europe. Italy additionally experienced the effects of sustained weak growth as well as its banking sec-tor problems, for which reason yield spreads in Italy widened to a greater extent than in Spain. However it was Portuguese bonds that were the most strongly af-fected, with yield spreads reaching their highest levels since early 2014. The increase in spreads was driven by the sustained high government deficit and ambigu-ity regarding future government economic policies. A clear turnaround in the government bond market was observed in April as prospects of a Macron victory in France became more likely and the general level of political unrest abated markedly. The turnaround in the trend was also supported by a moderate economic upswing in Italy. Portugal even reported a strong surge in growth and an unexpectedly sharp reduction in the government deficit. As a result, yield spreads over German Bunds fell substantially. Yield spreads for Spanish government bonds dropped until mid-year, falling well below their levels at the start of the year, while Italian government bonds were nearly stagnant. By contrast, yield spreads for Portuguese bonds saw an unusually significant decrease based on the meanwhile much more positive outlook for economic growth and public spending.
In April 2017, the ECB reduced the volume of its bond buying program from €80 billion to €60 billion per month, thereby putting its decision of December 2016 into effect. At its meeting in June 2017, the ECB made a limited adjustment to its forward guidance. It now anticipates leaving its key interest rates at the current levels for an extended period of time, whereas the bank had previously made explicit reference to the possibility of further reductions in key interest rates. The ECB kept its main refinancing rate constant at 0.00 %, and the deposit facility rate and the marginal lending rate were also unchanged at – 0.40 % and 0.25 % respectively. The U.S. Federal Reserve pursued a “dov-ish tightening” of monetary policy in the first half of the year. In two steps, it raised its federal funds rate by a total of 0.50 percentage points to a range of 1.00 % to 1.25 %. The Fed also announced that it would begin

02INTERIM MANAGEMENT REPORT REPORT ON ECONOMIC POSITION OVERALL ECONOMIC PARAMETERS
SIGNIFICANT EVENTS AT POSTBANK IN THE FIRST HALF OF 2017
99Interim Report as of June 30, 2017
INT
ER
IM M
AN
AG
EM
EN
T R
EP
OR
T
INT
ER
IM M
AN
AG
EM
EN
T R
EP
OR
T
reducing its total assets in the second half of 2017 by no longer reinvesting all of the proceeds from matur-ing U.S. Treasuries and mortgage backed securities.
Money market rates remained largely stable in the eu-rozone due to the ECB’s policy of holding key interest rates constant. By mid-2017, the three-month Euribor was at –0.33 %, or 0.01 percentage points below the year-end 2016 figure.
Capital market interest rates were subject to sharp fluc-tuation during the first half of the year. Yields moved up and down in quick succession. The fluctuations were initially triggered by alternating forecasts regarding the direction the new U.S. administration would take in its economic policies, which correlated with the chang-ing expectations regarding the pace of future increases in the Fed’s federal funds rate. Political uncertainty in Europe was also a crucial factor. Yields dropped back in the wake of the UK government’s petition to leave the European Union along with rising concerns regarding the outcome of the French presidential election. As the prospects for a Macron victory improved, investors began exercising less caution. Yields went back up, only to fall back again in light of rising expectations of a slow increase in the U.S. federal funds rate. At the end of June, yields experienced another strong boost fueled by eurozone economic data in combination with statements made by the ECB president that were interpreted as preparation for a reversal in monetary policy. At mid-year, yields for ten-year German Bunds were at 0.47 %, or 0.26 percentage points higher than the year-end 2016 level.
We had anticipated that the ECB would leave its mon-etary policy unchanged at the time of our 2016 Annual Report. With respect to long-term yields, we had expected a somewhat slighter increase.
Sector situationThe issues dominating the European banking sector in the first half of 2017 were the European Central Bank’s continuation of its low interest rate policy, regulatory demands, and the solution found to the problem of non-performing loans of Italian banks and one Spanish institution.
Together with BaFin, the Deutsche Bundesbank had subjected some 1,500 small and mid-sized German banks to a stress test by the end of June 2017. The test results will be announced in the second half of 2017 and will be incorporated into the Supervisory Review and Evalua-tion Process (SREP) of the Bundesbank and BaFin.
While the stress tests are being performed, the ECB will carry out a Europe-wide survey of banks’ earnings power. Although this survey is not under the direct con-trol of the ECB, it is of regulatory significance for other reasons. The LSI Profitability Forecast Survey involves the ECB surveying – in addition to banks in other countries – 41 German financial institutions that have likewise been examined by the Deutsche Bundesbank and BaFin.
In mid-May, the German Bundesrat adopted the Zweites Finanzmarktnovellierungsgesetz (2. FiMaNoG – Second
Financial Markets Amendment Act), which transposes MiFID II into national law. It also adopted amendments to the EU Mortgage Credit Directive in a move to allay legal concerns that had arisen in implementing the Directive.
The German banking landscape continues to feature a three-pillar structure consisting of private, public and cooperative banks. So far, no significant transactions have been reported between the individual pillars in 2017. However, mergers between smaller institutions, both in the public and the cooperative sector, contin-ued to occur. Increasing regulatory demands were likely key drivers of this trend.
In analyzing the business performance of German banks, we considered the banks listed in the industry in-dex – Deutsche Börse’s Prime Standard – and Postbank, as we have done in the past. We compared the banks’ results for the period from January through March 2017 with those of the previous year. All five banks generated profits both before and after tax. However, both before-tax and after-tax profits were lower than in the prior-year period for two of the five banks. The continuing low interest rate environment left its mark on the balance sheets of all financial institutions, as can be seen from the changes in the individual line items on their income statements. Four banks reported a decline in net interest income before accounting for the allowance for losses on loans and advances, as did all five banks thereafter. The banks experienced varying degrees of success in dealing with the volatile market in the first quarter. While three institutions were able to improve net trading income, two of the banks saw declines. All five institutions were able to improve net fee and commission income compared with the prior year. The trend in administrative expenses revealed that the majority of financial institutions continue to focus on cost control. Four of the banks reduced their admin-istrative expenses in the period under review. Three banks were able to reduce their cost/income ratio, and four registered an increase in return on equity after taxes.
The DAX was up by 7.4 % in the first half of 2017. The two banks listed in Germany’s blue-chip index reported opposing trends. While share prices of one of the banks were up, the second institution’s stock trended down-wards.
SIGNIFICANT EVENTS AT POSTBANK IN THE FIRST HALF OF 2017
On March 5, 2017, Deutsche Bank released news of a modified strategy. A series of measures will now be undertaken with the intent in the mid-term of merging Postbank with Deutsche Bank’s Private & Commercial Clients business and business with high-net-worth (HNW) customers. The decision is a reversal of an earlier plan for Postbank’s disposal. Deutsche Bank’s new strategic positioning and clear dedication to its home market is aimed at forming a market-leading retail and corporate banking presence in Germany that benefits from greater efficiency through scale.

1010 Interim Report as of June 30, 2017
In a merger agreement dated April 19, 2017, DB Finanz-Holding GmbH transferred its assets and liabilities as a whole with all rights and obligations by dissolution without liquidation to DB Beteiligungs-Holding GmbH. The merger entered into effect upon entry in the com-mercial register on April 27, 2017.
As a result, DB Finanz-Holding GmbH has been dis-solved upon entry of the above-mentioned merger and thus no longer holds interests in the share capital of Deutsche Postbank AG. DB Beteiligungs-Holding GmbH as the legal successor to DB Finanz-Holding GmbH now holds a direct majority stake in the share capital of Deutsche Postbank AG instead of an indirect one.
Executive bodiesRenate Treis stepped down from her position on the Supervisory Board effective as of the end of February 28, 2017, owing to her retirement.
After the Annual General Meeting that resolved on the formal approval of the Supervisory Board’s activities for fiscal year 2016, the terms of office of Tessen von Heydebreck and Christian Sewing as shareholder rep-resentatives on the Supervisory Board came to an end. By resolution of the Annual General Meeting on March 22, 2017, Tessen von Heydebreck was again elected to serve for a period of one year and Christian Sewing was also again elected to serve until the close of the Annual General Meeting that resolves on the formal approval of the Supervisory Board’s activities for fiscal year 2021, with both to act as shareholder representatives.
Jürgen Kummetat stepped down from the Supervisory Board following the completion of his term of office on March 22, 2017. During the election of delegates on March 9, 2017, Anna Lisa Trompa and Frank Fuss were elected to serve as the new employee representatives on the Supervisory Board of Deutsche Postbank AG. Their terms of office began at the end of the Annual General Meeting of Deutsche Postbank AG on March 22, 2017.
On June 1, 2017, Lars Stoy was appointed to the Management Board of Deutsche Postbank AG. The Bank’s retail business which in the past had been distributed across different areas and sales channels was restructured. Susanne Klöss-Braekler, previously responsible for Products on Postbank’s Management Board, will now handle the areas of “Postal Business” and “Banking” (checking accounts, savings, personal loans). Lars Stoy will be responsible for “Real Estate” (retail mortgage lending, home savings, real estate) and “Securities ”. Bundling these four newly established fields of expertise allows for integrated management of the retail banking business. It also enables Postbank to orient itself better on the interests of customers and establish end-to-end processes across sales channels by integrating all areas participating in the value chain. Susanne Klöss-Braekler (Branch Sales and Call Centers) and Lars Stoy (Mobile Sales including real estate agents and mortgage lending specialists in the branches) will also manage the four sales channels in the retail bank-ing business.
Ralf Stemmer stepped down from his position as Board Member responsible for Resources at Deutsche Post-bank AG effective May 31, 2017. His successor is Philip Laucks, who joined the Management Board effective June 1, 2017.
Postbank’s investment focuses in the first half of 2017Investment activities in the first half of 2017 focused on improving Postbank’s future viability.
As part of its digitization strategy, Postbank aims at enhancing its competitiveness by strengthening its earnings power and/or cutting costs. Investments in competitiveness include measures to intensify the linkage of “digitally & personally” supported advisory, sales and services processes both in the areas of over-draft facilities/installment loans and securities advisory services. In the first half of 2017, Postbank was able to fully digitize the process for setting up, increas-ing or reducing an overdraft facility, an achievement that will allow it to offer customers a markedly faster service in the future. At the same time, the Bank sig-nificantly reduced internal processing costs and times. In the area of installment loans, the Bank automated budget accounting as an integral part of its credit standing and solvency check. The digital budget ac-counting process utilizes information from Postbank checking account transactions and in this way provides faster, more efficient and more customer-friendly self-reporting data.
In line with the “digital & personal” strategic orienta-tion, additional investments were made in a modern branch infrastructure with more customer-friendly, au-tomated self-service offerings for Postbank’s customers. At the same time, sales centers were expanded and new branch concepts piloted. Alongside these investments in digitization and infrastructure, the Bank continued to spend on measures to comply with regulatory stand-ards. These efforts included meeting the requirements of IFRS 9, the recently revised EU Markets in Financial Instruments Directive (MiFID II), the Payment Accounts Directive and the Payment Services Directive (PAD/PSD), the Mindestanforderungen an das Risikomanagement (MaRisk – Minimum Requirements for Risk Manage-ment), Basel III/IV, as well as the specifications of the ECB and BaFin.
COURSE OF BUSINESS
The individual income and balance sheet items are explained in detail as follows. Unless otherwise stated, the comments on individual income statement items refer to comparisons of the results with the adjusted figures for the first half of 2016. The adjustments made can be found in Note 2 to the Consolidated Interim Financial Statements. Unless otherwise noted, the com-ments on balance sheet items refer to comparisons with the items as of December 31, 2016.
Net assets, financial position, and results of operationsIn a persistently challenging market environment in the first half of 2017, Postbank managed to improve all financial key performance indicators relevant to management.

02INTERIM MANAGEMENT REPORT SIGNIFICANT EVENTS AT POSTBANK IN THE FIRST HALF OF 2017
COURSE OF BUSINESS RESULTS OF OPERATIONS
1111Interim Report as of June 30, 2017
INT
ER
IM M
AN
AG
EM
EN
T R
EP
OR
T
At €316 million, profit before tax in the first half of 2017 was up by a significant €151 million, or 91.5 %. This positive trend was supported considerably by the strategic measures launched at the end of 2016 which had a particularly positive effect on net fee and com-mission income in the first half of 2017. Thus despite the negative effects on net interest income resulting from the low interest rate environment, Postbank has improved total income slightly – adjusted for the extraordinary income from the sale of the strategic investment in Visa Europe Ltd. (€104 million). Stringent cost discipline in connection with capacity adjustments and the increased efficiency achieved through digitiza-tion initiatives, among other things, have also paid off. A significantly lower allowance for losses on loans and advances, which benefited from an ongoing advanta-geous macroeconomic trend and an adjusting event relating to the assumption of loan collateral, also had a positive impact on profit before tax.
Postbank generated an adjusted profit before tax1 of €368 million. The significant improvement in profit be-fore tax was the driver for the growth of €179 million, or 94.7 %. In the first half of 2017, adjustments for ex-penses for strategic initiatives amounted to €52 million. In comparison, profit before tax in the prior-year period had been adjusted for expenses for strategic initiatives (€72 million) as well as for extraordinary expenses to cover legal risks (€56 million) and the sale of the strategic investment in Visa Europe Ltd. (€–104 million).
Return on tangible equity (RoTE) after tax improved significantly in the first half of 2017 to reach 11.4 % following 5.5 % in the prior-year period.
The cost/income ratio (CIR) improved by 5.7 percentage points to 80.5 % as a result of stringent cost discipline and the measures introduced to improve long-term viability. In particular, the progress achieved on the cost side contributed greatly to the optimization of the cost/income ratio. The cost base was successfully reduced in the first half of 2017, with administrative expenses decreased by €80 million, or 5.6 %, and other expenses significantly down by €75 million, or 83.3 %. The posi-tive development of the CIR is attributable primarily to the reduction in administrative expenses achieved mainly through savings in non-staff operating expenses and lower expenses for strategic initiatives. The decline in extraordinary expenses for legal risks from the prior-year period also benefited the CIR.
As a result of the significantly improved profit before tax, both the Common Equity Tier 1 capital ratio and the fully phased-in leverage ratio, subject to supervisory authority approval for the inclusion of interim profit, rose to 12.8 % (December 31, 2016: 12.4 %2) and 3.6 % (December 31, 2016: 3.4 %2), respectively.
RESULTS OF OPERATIONS
Total incomeTotal income declined by €73 million, or 4.3 %, to €1,624 million. The decrease is due mainly to the extraordinar-
ily high net income from investment securities in the prior-year period, which had benefited in particular from the sale of the strategic investment in Visa Europe Ltd., at €104 million.
Excluding the income generated from the aforemen-tioned sale of the strategic investment in Visa Europe Ltd. in the prior-year period, Postbank would have achieved growth in total income despite the persis-tently challenging market environment. In particular, the implementation of numerous measures aimed at increasing net fee and commission income along with continued strong growth of the customer loan portfo-lio, factors which had a positive impact on total income in the first half of 2017, made a significant contribution to this positive development. In an interest rate environ-ment that is particularly unfavorable for net interest income, Postbank thus managed to hold its own and develop its total income positively on an adjusted basis.
Net interest incomeDue to high volumes in its demand and savings deposits compared to the current lending business, the Bank has a deposit surplus. In times of negative money market interest rates that coincide with a conservative invest-ment strategy, that surplus negatively affects net inter-est income. Due to the currently negative interest rates on the money market and of the ECB and continued de-clining interest income, net interest income decreased moderately by €68 million, or 6.2 %, to €1,027 million. An encouraging trend was apparent in interest expense which declined noticeably due primarily to high-interest liabilities reaching maturity. Yet this effect, along with the continued satisfactory performance of the new lending business and the resulting net increase in the Bank’s portfolio of loans and advances to customers, did not completely offset the continuing pressure on net interest income.
Net fee and commission incomeAs a result of the implementation of numerous strategic measures, net fee and commission income increased by €68 million, or 16.2 %, to €487 million.
Major elements of these strategic measures were the introduction of a new checking account model for retail customers at the end of 2016. The introduction of the new securities strategy based on an improved advi-sory process also proved successful. New business with funds increased significantly in the first half of 2017, by 39.8 %. Assets under management in securities and investment accounts expanded by €0.5 billion, or 3.3 %, to €15.5 billion, thanks to improved sales activities. Additional positive effects on net fee and commission income were already evident from the inclusion of ETF savings plans in the Bank’s range of products.
At €135 million, net fee and commission income gener-ated through business with postal services and payment transaction services remained on a level with the prior- year period.
1 Postbank regularly adjusts its profit before tax for material issues with an impact of greater than €10 million on profit before tax. In addition to effects from the sale and acquisition of companies in connection with initial consolidation and/or deconsolidation, these also include expenses for strategic initiatives (ESI) incurred outside of normal line activities in projects of limited duration and with separate governance structures, and expenses to cover legal risks in connection with consumer protection rulings. In the first half of 2017, expenses were incurred for legal risk in conjunction with consumer protection rulings that were below the materiality threshold of €10 million for each individual case.
2 Factoring in profit for fiscal year 2016 as approved by the supervisory authority

1212 Interim Report as of June 30, 2017
Net trading incomeAt €52 million in the first half of 2017, net trading income was up €43 million, or 477.8 %, year-on-year. In particular, the increase is due to a rise of €24 million in measurement gains relating to the mortgage loan portfolio to which the fair value option is applied.
Net income from investment securitiesAt €58 million, net income from investment securities was down by €116 million, or 66.7 %, as against the pri-or-year period which had benefited from the sale of the strategic investment in Visa Europe Ltd. in the amount of €104 million. Ongoing reductions of a strategic equity investment based on a sales cooperation made a positive impact of €11 million (prior-year period: €22 million) to net income from investment securities. In addition, successful government bond transactions contributed positively to earnings.
Allowance for losses on loans and advancesAfter a historically low level of €76 million in the previous year, the allowance for losses on loans and advances declined by a further €64 million, or 84.2 %, to €12 million in the first half of 2017. This positive trend is mainly attributable to income (€52 million) from the reversal of the allowance for losses on loans and ad-vances in connection with an adjusting event relating to the assumption of loan collateral. The reduced need for an allowance for losses on loans and advances under-scores Postbank’s continued high level of credit quality – measured by its loan-to-value (LtV).
The annualized net additions ratio – the allowance for losses on loans and advances for the customer loan portfolio – fell to a historically low level. At 2 basis points, it was once again significantly below the prior-year period by 13 basis points. In addition to Postbank’s conservative business model, the unchanged positive macroeconomic environment, continued favorable con-ditions on the German labor market, and an adjusting event relating to the assumption of loan collateral that occurred in the first half of 2017 had a positive effect on the net additions ratio.
Administrative expensesPostbank continued to meet the challenges of the low interest rate environment in the first half of 2017 with stringent cost management. By successfully implement-ing the strategic measures and the ongoing capacity adjustments, administrative expenses decreased by €80 million, or 5.6 %, to €1,338 million. In addition to the slight decrease in staff costs by €13 million, or 1.9 %, to €679 million, it was particularly the successful man - agement of other administrative expenses, which fell noticeably by €66 million, or 9.7 %, to €611 million, that contributed significantly to reducing the cost base. In combination with the strategic measures to increase income, this more than offset the ongoing negative effects on net interest income and increased overall profitability.
Postbank continues to invest in measures to increase efficiency, in automation, and in the further digitiza-tion of the business model in order to continue both its progress and its leading role in digitization. Expenses for strategic initiatives attributable to administrative
expenses were significantly down on the previous year, declining by €20 million, or 27.8 %, to €52 million, due in particular to the significantly lower expenses from deconsolidation projects.
Other income and expensesNet other income and expenses amounted to €42 mil-lion, up significantly by €80 million on the negative prior-year figure, which had, however, been weighed down by extraordinary expenses to cover legal risks amounting to €56 million. In the first half of 2017, other income was positively affected by compensation of €15 million for Postbank’s participation in the TLTRO group headed by Deutsche Bank as the lead institution. In contrast, negative effects resulted from provisions for legal risk in connection with consumer protection rul-ings in the upper one-digit million euro range.
Profit before tax and consolidated net profitIn a persistently challenging market environment, Postbank was able to increase profit before tax by €151 million, or 91.5 %, to €316 million. In addition to the positive trend in the allowance for losses on loans and advances, this success is mainly attributable to the strategic measures taken on both the income and cost sides. Among other things, successful reorganization of the account models and establishment of a new advi-sory approach in the securities business had a positive impact on net fee and commission income. Together with disciplined cost management and the growth achieved in the lending business, Postbank succeeded in nearly doubling profit before tax.
After factoring in income taxes of €15 million, consoli-dated net profit increased by €161 million, or 115.0 %, to €301 million.
Earnings per shareEarnings per share were €1.38 and thus more than double that of the prior-year period (€0.64).
SEGMENT REPORTING
Unless otherwise stated, the following comments on the individual segments represent a comparison with the retroactively adjusted figures for the first half of 2016 (see Note 1 to the Consolidated Interim Financial Statements).
Retail BankingProfit before tax in the Retail Banking segment increased by €60 million, or 20.8 %, to €349 million. Here, too, the positive earnings trend is based on stringent cost discipline and the implementation of numerous measures aimed at increasing net fee and commission income.
Total income declined by €70 million, or 4.5 %, to €1,476 million. The decrease is due mainly to the extraordinarily high net income from investment securities in the prior-year period which had benefited significantly from the cash component received from the sale of the strategic investment in Visa Europe Ltd. (€90 million).
Net interest income declined by €68 million, or 6.0 %, to €1,065 million as a result of the ongoing negative effects of the low interest rate environment. Among the steps

02INTERIM MANAGEMENT REPORT RESULTS OF OPERATIONS SEGMENT REPORTING
1313Interim Report as of June 30, 2017
INT
ER
IM M
AN
AG
EM
EN
T R
EP
OR
T
it took to address an interest rate environment particu-larly disadvantageous to net interest income, Postbank implemented numerous measures aimed at increasing net fee and commission income that had an effect in the first half of 2017. Thus Postbank succeeded in in-creasing net fee and commission income by €61 million, or 19.1 %, to €381 million, in particular by reorganizing its checking account models and launching the securi-ties campaign at the end of 2016.
Net trading income amounted to €30 million, an increase of €27 million, or 900.0 %, compared with the prior-year figure. The segment’s net trading income benefited mainly from substantial measurement gains in the mortgage loan portfolio, to which the fair value option is applied, and which were up €24 million on the previous year.
Net income from investment securities amounted to €0 million and was thus €90 million below the prior-year period, which had been positively impacted by the cash component received from the sale of the strategic investment in Visa Europe Ltd.
The allowance for losses on loans and advances increased by €6 million, or 12.2 %, to €55 million in the first half of 2017 due to the continued expansion of the lending business. Despite an increase in the allowance for losses on loans and advances, Postbank continued to benefit overall from a high level of credit quality in the entire retail banking business, the ongoing stable develop-ment of the German labor market, and healthy proceeds from collateral realization.
By adhering to stringent cost discipline, effective ef-ficiency measures, and ongoing capacity adjustments, administrative expenses were successfully reduced by €30 million, or 4.8 %, to €591 million. Net other income and expenses also increased significantly by €53 mil-lion to €8 million. The improvement from operations was somewhat lower, however, as extraordinarily high charges relating to provisions for legal risks of €56 mil-lion had negatively affected the prior-year period.
In addition, the decrease in cost allocations by €53 mil-lion, or 9.8 %, to €– 489 million had a positive effect on earnings.
The cost/income ratio for the segment improved from 79.3 % to 74.2 %. The return on equity before tax increased to 20.7 %, following 16.7 % in the prior-year period due to an improvement in earnings.
Corporate BankingProfit before tax in the Corporate Banking segment in-creased by €67 million, or 64.4 %, to €171 million. In ad-dition to higher net interest income, this improvement in earnings was due in particular to a significantly lower allowance for losses on loans and advances alongside a stable development in costs.
Total income was €243 million compared with €241 mil-lion in the first half of 2016. Given the stabilization of the new lending business at a high level and the growth of loan portfolios, net interest income increased by a satisfactory €7 million, or 4.1 %, to €178 million.
At €66 million, net fee and commission income was 4.8 % above the level of the first half of 2016 (€63 million). The reorganization of the product world for business customers undertaken in the middle of 2017 created an additional opportunity to positively impact net fee and commission income in the second half of the year.
Net trading income was €–1 million, down €8 million, or 114.3 %, year-on-year, while net income from invest-ment securities amounted to €0 million, as in the prior-year period.
The allowance for losses on loans and advances im-proved significantly by €68 million and, at €46 million, contributed to an increased profit before tax. This posi-tive trend is mainly attributable to income (€52 million) generated from the reversal of the allowance for losses on loans and advances in connection with an adjusting event relating to the assumption of loan collateral. This made a substantial contribution to the positive trend in profit before tax in the Corporate Banking segment.
Administrative expenses increased by €3 million, or 6.0 %, to €53 million due to the increase in staff costs related to the ongoing expansion of the sales centers. In contrast, non-staff operating expenses decreased slightly.
Allocated items amounted to €–66 million and were thus €1 million, or 1.5 %, lower than the prior-year level.
Because the trend in the allowance for losses on loans and advances is not factored into the calculation of the cost/income ratio, this changed only slightly from 50.3 % to 50.9 % while the return on equity before tax increased significantly to 46.2 % (39.7 %).
Financial MarketsLoss before tax generated by the Financial Markets segment amounted to €19 million, narrowing by €12 million, or 38.7 %, year-on-year. The main driver of this trend was lower cost allocations, while income and expenses – including other income and expenses – re-mained nearly unchanged.
Total income declined by €1 million to €15 million and thus remained almost on a level with the prior-year period.
Net interest income fell by €22 million to €–54 million as a result of continued negative money market inter-est rates and higher interest expenses due to hedging transactions entered into for the forward portfolio that had grown more rapidly than anticipated. In contrast, the exercise of the first opportunity to terminate a hybrid bond (€11 million) that would have no longer been eligible for inclusion in the Bank’s regulatory capital had a positive impact on net interest income.
At €–12 million, net fee and commission income re-mained on a level with the prior-year period.
Net trading income significantly exceeded the result of the prior-year period by €24 million and amounted to €23 million. The increase in net trading income resulted mainly from interest rate hedging transactions.

1414 Interim Report as of June 30, 2017
Net income from investment securities was sustained primarily by successful government bond transactions and the ongoing reduction of a strategic equity invest-ment based on a sales cooperation. It fell by €3 million, or 4.9 %, to €58 million, moderately below the level of the prior-year period.
Administrative expenses remained stable at €4 million.
Net other income and expenses broke even, as had been the case in the comparable prior-year period.
Cost allocations fell significantly by €13 million, or 30.2 %, to €–30 million.
The return on equity before tax improved from –4.0 % to –2.0 % although it remained in negative territory. The cost/income ratio also exhibited a positive trend falling to 170.4 % (312.2 %).
Non-Core Operating Unit (NCOU)The Non-Core Operating Unit (NCOU) segment per-formed better than in the prior-year period, gaining €26 million, or 12.3 %, to record a loss before tax of €185 million. The positive trend is attributable mainly to im-proved net interest income and lower other expenses.
Net interest income increased noticeably by €19 million, or 10.5 %, to €162 million due to positive effects from the ongoing reduction of high-interest liabilities reach-ing maturity. Interest expense was again significantly higher than the interest income generated by the NCOU segment since the remaining assets not belonging to the core business are contrasted by a significantly larger share of high-interest liabilities.
At €0 million, net fee and commission income and net trading income were unchanged as against the previous year.
While the sale of peripheral eurozone bonds had posi-tively impacted net income from investment securities in the prior-year period, net income from investment securities was €0 million in the first half of 2017 due to the absence of such sales.
The allowance for losses on loans and advances nega-tively impacted the segment’s profit before tax by €3 million following a negative effect of €5 million in the first half of 2016.
Administrative expenses decreased further by €1 million, or 16.7 %, to €5 million.
Significantly lower expenses were recorded in other expenses for negative effects from products that are no longer sold and for compounding interest on provisions. As a result, net other income and expenses improved by €8 million to €3 million.
Both the cost/income ratio and the return on equity before tax remained in negative territory.
Cost CentersThe Cost Centers segment includes the profit/loss of the infrastructure functions of Deutsche Postbank AG, BHW
Bausparkasse AG, BHW Holding AG, PB Firmenkunden AG, Deutsche Postbank AG Luxembourg Branch, Postbank Direkt GmbH, Postbank Filialvertrieb AG, Postbank Fi-nanzberatung AG, and Postbank Immobilien GmbH. The segment also includes the profit/loss of the subsidiaries allocated to the cost centers, i.e., Postbank Systems AG, Postbank Immobilien und Baumanagement GmbH, Postbank Immobilien und Baumanagement GmbH & Co. Objekt Leipzig KG, Deutsche Postbank Finance Center Objekt GmbH, DSL Portfolio GmbH & Co. KG, DSL Port-folio Verwaltungs GmbH, Postbank Service GmbH, BHW Kreditservice GmbH, Betriebs-Center für Banken AG, VÖB-ZVD Processing GmbH, and Postbank Beteiligun-gen GmbH.
Since the share-based purchase price component in the amount of €14 million from the Visa Europe Ltd. transaction had been recognized in the Cost Centers segment in the prior-year period and no non-recurring effects occurred in the first half of 2017, profit before tax fell by €14 million, or 100 %, to €0 million.
Overall, net interest income remained at a low level and amounted to €0 million (prior-year period: €4 million).
Net fee and commission income, which originates mainly from processing payment transaction services in this segment, increased moderately by €4 million, or 8.3 %, to €52 million.
Net trading income was unchanged at €0 million.
Net income from investment securities amounted to €0 million after €14 million in the prior-year period due to the aforementioned non-recurring effect from the rec-ognition of the share-based purchase price component of the Visa Europe Ltd. transaction.
Administrative expenses were successfully reduced by €52 million, or 7.1 %, to €685 million. This was driven primarily by disciplined cost management of cross-divi-sional functions and effective efficiency measures.
Due to the allocation of fully absorbed costs, costs totaling €603 million were allocated to the other seg-ments. Corresponding charges were incurred in those segments, totaling €–603 million.
Net other income and expenses amounted to €30 mil-lion, up €18 million on the prior-year figure. This posi-tive development is primarily attributable to the income of €15 million generated in the first half of 2017 from participation in the TLTRO group.

02INTERIM MANAGEMENT REPORT SEGMENT REPORTING NET ASSETS AND FINANCIAL POSITION
1515Interim Report as of June 30, 2017
INT
ER
IM M
AN
AG
EM
EN
T R
EP
OR
T
NET ASSETS AND FINANCIAL POSITION
Balance sheetAs of June 30, 2017, Postbank’s total assets decreased by €2.4 billion, or 1.6 %, to €144.8 billion compared with December 31, 2016. The ongoing reduction of total assets is attributable mainly to maturities of long-term liabilities which allowed non-customer related business to be reduced on the assets side.
AssetsOn the assets side of the balance sheet, the share of the lending business with retail, business and corporate customers as a proportion of total assets increased. This was supported mainly by the continued growth of loans and advances to customers by €1.8 billion, or 1.8 %, to €103.8 billion, since new lending business continued to grow at a high level. In addition to an increase in private mortgage lending of €0.7 billion and a rise in installment loans of €0.3 billion, the Bank was also able to expand its portfolio of commercial loans by €0.7 bil-lion. With customer deposits nearly unchanged, this al-lowed the Bank to take a further step in the pursuit of an equal balance between customer loans and deposits.
The continued reduction in short-term loans and ad-vances to other banks by €1.2 billion, or 9.3 %, to €11.9 billion is evidence of success in reducing the deposit surplus, since it is primarily invested in the money market in line with a conservative investment strategy. In combination with the noticeable drop in investment securities by €2.3 billion, or 8.5 %, to €24.5 billion, this reduction in the lending business promoted a greater balance sheet orientation toward business with retail, business and corporate customers.
Trading assets decreased by €0.1 billion, or 17.9 %, to €0.4 billion compared with December 31, 2016.
Equity and LiabilitiesOn the liabilities side of the balance sheet, amounts due to customers declined by €0.9 billion, or 0.7 %, to €118.1 billion as of June 30, 2017. Continuing low inter-est rates promote a greater preference of consumers for spending over saving. This is reflected in the trend of savings deposits and home savings deposits from retail customers, which decreased by a total of €1.5 billion since the beginning of the year. In sum, other liabilities remained nearly level at €62.2 billion in the first half of 2017. The individual elements of other liabilities, however, recorded relatively significant developments. Demand deposits increased by €2.2 billion, or 4.6 %, to €49.0 billion, while the liabilities with agreed maturity, some of which are high-interest, fell by €1.5 billion, or 10.3 %, to €13.2 billion due to reaching maturity.
Deposits from other banks, at €12.4 billion, were down €0.8 billion, or 5.8 %, compared with the 2016 year-end.
As of June 30, 2017, the holdings of debt securities in is-sue amounted to €3.3 billion. There were no significant changes compared with the year-end.
Trading liabilities decreased by €0.1 billion to €0.3 bil-lion compared with December 31, 2016.
Subordinated debt fell significantly by €0.6 billion, or 23.5 %, to €2.0 billion mainly due to the termination of a hybrid bond with a volume of €0.5 billion and lower-volume long-term liabilities reaching maturity.
Driven by the positive earnings trend, recognized capital was up slightly against year-end 2016 by €143 million, or 2.0 %, increasing to just under €7.4 billion.
Financial and non-financial key performance indicatorsProfit before tax improved significantly by €151 million, or 91.5 %, to €316 million in the first half 2017. The strategic measures introduced to reduce Postbank’s his-torically strong dependence on net interest income are significant drivers of this increase in profitability. These measures had a particularly positive impact on net fee and commission income, which increased by €68 million, and on administrative expenses, which were successfully reduced by €80 million. The reorganization of checking accounts, the securities campaign, the reduction of the deposit surplus through growth in the lending business, adjusting capacities, and the ambitious management of non-staff operating expenses more than offset the negative impact of low interest rates and – together with a significantly lower allowance for losses on loans and advances – nearly doubled profit before tax.
Primarily due to the growth in profit before tax, the adjusted profit before tax improved significantly year-on-year, increasing by €179 million, or 94.7 %, to €368 million. The prior-year period had been negatively af-fected in particular by the adjustment of the sale of the strategic investment in Visa Europe Ltd. in the amount of €104 million. In contrast, the effect of extraordinary expenses for legal risk (€56 million) incurred in the prior- year period was neutralized. Adjustments of €52 million relating to expenses for strategic initiatives were made in the first half of 2017, while an adjustment of €72 million had been made in the prior-year period.
Return on tangible equity after tax benefited from the improvement in earnings, increasing significantly to 11.4 % (5.5 %).
The cost/income ratio decreased to 80.5 % (86.2 %) as a result of stringent cost discipline. The main driver for this positive trend was the progress achieved in reduc-ing total expenses, which benefited from the reduction in other administrative expenses as much as from the decline in extraordinary expenses for legal risks and lower expenses for strategic initiatives.
The fully phased-in Common Equity Tier 1 capital ratio, subject to supervisory authority approval for the inclu-sion of interim profit, rose once more from 12.4 %1 at the 2016 year-end to 12.8 %. The Common Equity Tier 1 capital ratio was thus above our expectations. Higher profit and the successful reduction of risk-weighted assets were significant drivers of the improved equity.
As of June 30, 2017, the fully phased-in leverage ratio, subject to supervisory authority approval for the inclu-sion of interim profit, increased to 3.6 % and was thus 0.2 percentage points above the 2016 year-end. The calculations were based on the regulatory requirements as laid out in Article 429 of the CRR.
1 Factoring in profit for fiscal year 2016 as approved by the supervisory authority.

1616 Interim Report as of June 30, 2017
In accordance with our plan, Postbank did not conduct a people survey during the year and consequently did not measure employee satisfaction. Customer satis-faction was also not surveyed; thus, we are not in a position to draw any conclusions on the development of the non-financial key performance indicators at the half-year point of 2017.
Overall assessment of business performance in the first half of 2017Through the successful implementation of strategic measures on the earnings and cost sides, Postbank succeeded in more than offsetting the negative effects of low interest rates and in raising overall profitability significantly.
Excluding the extraordinary income from the sale of a strategic investment in the prior-year period, results of operations improved in a challenging market environ-ment. In addition to the reorganization of the account models, this was due primarily to the successful strength en - ing of the securities and lending business with retail customers, and to improved net trading income. In light of the expansion of loans and advances to retail, busi-ness and corporate customers, the lending business takes up a growing share of Postbank’s net assets and financial position.
The successful reduction of administrative expenses also made a significant contribution to the distinct increase in earnings, profitability, and efficiency.
Equity and capital ratiosRecognized capital in the period under review was up €143 million, or 2.0 %, compared to the prior-year figure, to reach €7,369 million.
The fully phased-in Common Equity Tier 1 (CET1) capital ratio, subject to supervisory authority approval for the inclusion of the interim profit for the first half of 2017, increased to 12.8 % as of June 30, 2017, follow-ing 12.4 %1 at year-end. This positive development was mainly driven by the increase in consolidated net profit.
The regular phased-in Common Equity Tier 1 (CET1) capital ratio, subject to supervisory authority approval for the inclusion of interim profit, amounted to 13.7 % as of June 30, 2017. The slight deterioration compared to the prior year-end figure of 14.2 %1 is essentially at-tributable to a regulatory rise in capital deductions.
As of June 30, 2017, the fully phased-in leverage ratio, subject to supervisory authority approval for the inclu-sion of interim profit, increased to 3.6 % (December 31, 2016: 3.4 %1). Due to the regulatory increase in capital deductions, the regular phased-in leverage ratio, sub-ject to supervisory authority approval for the inclusion of interim profit, amounted to 3.9 % and was thus 0.2 percentage points below the prior year-end level1.
The calculations are based on the regulatory require-ments as laid out in Article 429 of the CRR.
OPPORTUNITY REPORT
The current historically low – and in some cases nega-tive – interest rate environment has had an adverse impact on the Bank’s earnings power given the high volumes in Postbank’s book of demand deposits and savings deposits compared with the existing lend-ing business. The deposit surplus resulting from those volumes negatively affects net interest income in times when negative money market interest rates coincide with a conservative investment strategy. Nevertheless the ongoing historically low interest rates have also spurred demand for financing solutions, making it pos-sible for the Bank to shrink its deposit surplus. If the surplus can be reduced at a faster than expected pace Postbank’s profit levels would benefit. Postbank has already gained from these trends in the form of growth in new business with consumer and residential construc-tion loans and been able to reduce the deposit surplus despite slightly higher deposit volumes.
A reversal of European monetary policy, acting as an altered macroeconomic scenario, in addition to rising interest income could contribute to private investors rethinking their positioning in terms of asset allocation going forward. This, in turn, would fuel commission business. Net fee and commission income would benefit if Postbank’s savings customers use their deposits in greater volumes than expected to acquire securities. The commission business could likewise profit more than anticipated from banking customers with a broad-er understanding for the revision of fee models against the backdrop of the low interest rate environment.
Major opportunities for the Bank will arise from disci-plined cost management, which is closely linked with its digitization strategy. The changed demands of today’s banking customers – which have evolved from the desire for personal advisory sessions to a need for multi-channel advisory and other services – have noticeably altered the banking business. The acceptance and use of digital opportunities to approach customers for advi-sory services has proceeded faster than forecast, giving Postbank the opportunity to operate its customer busi-ness more efficiently.
In its own pursuit of the digitization trend, Postbank has positioned itself as a bank available to custom-ers both “digitally & personally,” and has continued systematically to pursue its strategy of digitization. Objectives here include both improving the Bank’s ability to earn additional income and generating cost savings from process optimizations and higher levels of automation – to be achieved, for example, through such means as end-to-end processes that are fully digi-tized. As part of strategic efforts, the Bank was able to fully digitize its process for setting up, increasing and reducing an overdraft facility in the first half of 2017, allowing it to offer customers a digital service that is markedly faster and itself to enjoy significantly lower internal processing times and expenses.
1 Factoring in profit for fiscal year 2016 as approved by the supervisory authority.

02INTERIM MANAGEMENT REPORT NET ASSETS AND FINANCIAL POSITION OPPORTUNITY REPORT
1717Interim Report as of June 30, 2017
INT
ER
IM M
AN
AG
EM
EN
T R
EP
OR
T
If, in addition to that, efficiency heightening measures prove more effective than planned, they could have a positive impact on both profit and regulatory metrics like the leverage ratio and the CET1 (Common Equity Tier 1) capital ratio that would be equal in scope to surprisingly high customer demand and an expanded market share.
Better than anticipated developments in economic condi-tions in Germany, in the interest rate environment and in competitive conditions in the financial services industry could lead to higher income that would only be partially eroded by additional costs. This could improve profit before tax and the cost/income ratio.
The strategy announced by Deutsche Bank – its intent to expedite the merger of Postbank with its Private & Com-mercial Clients business – offers Postbank the opportunity to generate synergy effects.
The short-term opportunities for improved income and expenses at Postbank from these possible developments may be hindered by mid- and long-term risks that could arise in the areas of credit, interest rate and liquidity risk in particular.

1818 Interim Report as of June 30, 2017
RISK REPORT
Summary overview of risk exposureThe focus of Postbank’s risk profile is on lending and deposit business with retail, business and corporate customers. Risk management at Postbank in the first half of 2017 focused on strengthening the regulatory and economic capital base while maintaining our risk profile. This was against the background of the low interest rate policy still being maintained by the European Central Bank (ECB) as well as political uncertainty in Great Brit-ain (Brexit) and France (elections).
Postbank continues to operate in a solid economic envi-ronment. In addition, economic growth accelerated in the eurozone and in Germany, in particular, in the first half of the year. The healthy state of the labor market at present, as documented by falling unemployment coupled with a rise in the number of people in work, and the upward trend in both real estate prices and German industry spawn opportunities for expanding lending to retail and business customers. At the same time, the macroeconomic environment in Germany is having a positive effect on credit risk for our existing business.
Overall bank riskTaking risks in order to generate earnings is a core func-tion of Postbank’s business activities. Risks entered into are regularly identified, measured, monitored, and allo-cated limits using the ICAAP (Internal Capital Adequacy Assessment Process), and are incorporated in the overall management of the Bank via the assessment of the Bank’s risk-bearing capacity. Group limits, in particular the limits for market, credit and operational risks, were consistently complied with throughout the first half of 2017. The Group’s risk-bearing capacity was ensured at all times. No risks that could impair the development of Postbank and its subsidiaries, or that could even jeop-ardize its existence as a going concern, are discernible at present. The key operationally managed risks for the Postbank Group are addressed in the following.
Credit riskIn the first half of 2017, the allowance for losses on loans and advances was well below the prior-year level due to the ongoing positive trend in Postbank’s customer business. This was also attributable to the persistently favorable macroeconomic environment in which the Bank operates, strong proceeds from collateral realiza-tion, and systematic risk management.
For the next two quarters, we are expecting the risk situation to continue on a positive footing with a solid economic environment, supported by a stable trend in economic growth and the labor market.
Market riskPostbank’s market risk is influenced in particular by interest rate and credit spread trends in the European capital market. Money market interest rates were nearly unchanged in negative territory throughout the first half of 2017 and remained at a historically low level. In contrast, interest rates on the capital market increased across all maturities. Operational value at risk (VaR) in the banking book was down slightly on the prior year-end level as of the reporting date following a slight
increase in the open interest rate risk position and a reduction in credit spread risk.
The market risk capital requirement, which is calcu-lated on the basis of a stressed value at risk approach, declined significantly compared with the prior year-end. This was due on the one hand to a reduction in the cred-it spread exposure and to an adjustment in the modeling of the relevant risk parameters on the other. Looking ahead, we expect risk capital requirements to remain at the current level in the second half of 2017. However, the political uncertainty that continues to dominate could also result in a return to increased market volatility and thus to corresponding fluctuations in present value.
Postbank is exposed to market risk solely from banking book positions. As was the case throughout the previous year, there were no trading book activities in the period under review.
Liquidity riskAdequate liquidity buffers were maintained at all times in the first half of 2017 to ensure solvency and compliance with the regulatory liquidity requirements. Postbank’s li-quidity position continues to be solid thanks to its stable refinancing base in the form of customer deposits and its extensive holdings of highly liquid securities.
Based on our liquidity forecasts and planning, we will reduce surplus liquidity and expect the liquidity position to remain adequate in the foreseeable future.
Operational riskPostbank’s operational risk loss profile primarily reflects its strategic focus as a bank for retail, business and cor-porate customers. One consistent focus over recent years has been on high frequency/low impact losses, i.e., loss events that individually are only minor but that occur repeatedly during a year.
In addition, recent years saw an increase in litigation and complaints about investment advice. Most of these re-late to advice provided and transactions entered into in the area of closed-end funds. This trend continued in the first half of 2017, although the distribution of closed-end funds was discontinued in 2012.
Postbank assumes that operational risk losses will gradu-ally decline over the coming years as a result of measures that have been initiated or already implemented.
There has been no major change in the assessment of business risk as against the description given in the 2016 Group Management Report.
Developments in risk managementIn addition to using the Foundation IRB Approach and the IRB Approach to calculate the capital requirements for its retail business, Postbank uses the Advanced IRB Approach (A-IRBA) to calculate the capital requirements for its corporates, banks and domestic and UK com-mercial real estate finance portfolios. The Bank plans to transfer the rating model for its portfolio of overdraft facilities for retail customers to the A-IRBA in the second half of 2017.

02INTERIM MANAGEMENT REPORT RISK REPORT
1919Interim Report as of June 30, 2017
INT
ER
IM M
AN
AG
EM
EN
T R
EP
OR
T
Since the end of 2015, Postbank has continued to calcu-late its regulatory capital requirements for operational risk using the Standardized Approach.
In the first half of 2017, Postbank pushed ahead with the implementation of comprehensive regulatory changes. The particular focus was on measures aimed at improv-ing IT security and ensuring business continuity during IT outages, as well as the further strengthening of the IT infrastructure for the aggregation of risk data and risk reporting.
Postbank also continued its measures for implement-ing the Analytical Credit Dataset (AnaCredit) project launched by the ECB and various new regulatory propos-als submitted by the Basel Committee on Banking Super-vision to complete and reform the Basel III framework and its implementation in European law (CRR II – Capital Requirements Regulation II/CRD V – Capital Require-ments Directive V).
In addition, the first half of 2017 saw comprehensive pre-paratory measures for implementing the new accounting requirements to be met in accordance with IFRS 9 effec-tive from 2018.
Risk management within the Deutsche Bank GroupSubject to the applicable company law and supervisory law requirements, Postbank is integrated into Deutsche Bank AG’s risk management system, the aim being to guarantee uniform, appropriate, and effective risk management at the level of the Deutsche Bank Group. To this end, Postbank is integrated in the processes for identifying, assessing, managing, monitoring, and com-municating risk that permit an end-to-end overview of the risk situation and the institutional protection system as a whole, and that allow the Group to exert a corre-sponding influence. In addition, an established, uniform risk governance structure ensures a common risk culture is put into practice.
Postbank is integrated into the Single Supervisory Mecha-nism (SSM) through the Deutsche Bank Group. Postbank, as part of the Deutsche Bank Group, is therefore directly supervised by the European Central Bank (ECB) and also included in banking supervisory inquiries from the ECB addressed to Deutsche Bank. In addition, Postbank main-tains regular communication with national supervisors.
As the owner of Postbank, Deutsche Bank announced the merger of Postbank with Deutsche Bank’s Private & Commercial Clients business.
Regardless of this, group risk management functions shared with Deutsche Bank will continue to be per-formed in full and in parallel.
Risk typesThe risk types that are tracked within Postbank are de-termined on the basis of a Group-wide risk inventory.
The risk inventory, which is performed at least annu-ally, reviews the materiality of the risk types and the existence of additional, previously untracked risks. When performing the risk inventory, Postbank uses instru-ments that, in the aggregate, cover all material organ-
izational units and risk areas within the Bank. The risk types identified as material in the risk inventory are quantified during the risk-bearing capacity assessment and – with the exception of liquidity risk – are backed by risk capital. They are monitored on a regular basis. For details of the quantification procedure, please see Note 33 to the Consolidated Interim Financial Statements.
Postbank distinguishes between the following risk types:
Market risk, credit risk, liquidity risk, operational risk, and business risk.
For a detailed presentation of the individual risk types, please see the 2016 Group Management Report. There have been no major changes as against the description given therein.
Organization of risk managementPostbank has a risk management organization that serves as the basis for risk- and earnings-oriented management of the Bank as a whole by identify-ing all key risks and risk drivers, and measuring and evaluating these independently. Risks are limited and managed using the ICAAP while strictly reflecting the Bank’s risk-bearing capacity, with the aim of gener-ating a corresponding return and exploiting market opportunities.
Postbank’s risk management focuses have not changed materially as against the description given in the 2016 Group Management Report. The methods, systems, and processes discussed in the 2016 Group Manage-ment Report, and the reporting system that builds on them, are subject to continuous review and enhance-ment in order to meet market, business and regulatory requirements.
Risk capital and risk limitationThe capital from the risk cover amount that is allocated to the various units and risk types is known as risk capital. Risk capital allocation is reviewed on at least a quarterly basis by the Group Management Board and/or the Bank Risk Committee, and adjusted as necessary. The risk committees are responsible for breaking down the risk capital allocated to the individual risk types in greater detail and, where necessary, for adjusting the individual limits for them.
Economic capital is allocated to all the material risk types listed in the section entitled “Risk types” with the exception of liquidity risk and reputational risk. To prevent the risk of illiquidity, Postbank maintains a liquidity buffer consisting of highly liquid and liquid as-sets for a two-month survival period in a stress scenario in accordance with the Mindestanforderungen an das Risikomanagement (MaRisk – Minimum Requirements for Risk Management).
The percentage allocation of Postbank’s “economic creditor protection” risk cover amount by risk type, after factoring in correlation effects, is as follows for the first half of fiscal year 2017 (calculated as of June 30, 2017):

2020 Interim Report as of June 30, 2017
The absolute amount of economic creditor protection risk cover and a breakdown of the absolute amount of risk capital by risk type (as of June 30, 2017, and the prior-year closing date) are given in Note 33 to the Consolidated Interim Financial Statements.
The following graphic shows the development of approved risk capital in relation to the total risk cover amount:
Risk cover utilization (in economic creditor protection), measured in terms of the allocated risk capital after diversification, amounted to 69 % as of the reporting date. Overall, in the first half of 2017, there was a slight decline in the aggregate allocated risk capital com-pared with the 2016 year-end. The risk cover amount decreased as against December 31, 2016, and utiliza-tion therefore increased by 1 % year-on-year. The main reason for the decline in the risk cover amount is a reduction in subordinated debt (in particular due to the termination of a hybrid bond). From a going concern perspective as well, the available risk cover amount pro-vides sufficient cover for the risk potential calculated.
In addition to limiting the risk positions for the indi-vidual risk types on the basis of the allocated risk capital, product , volume and sensitivity limits are used to restrict risk concentrations in individual positions or risk types above and beyond the risk positions themselves.
Market risk is managed by allocating VaR and loss limits both at Group level and for the relevant portfolios. A stressed value at risk (sVaR) concept is used for market risk. Under this concept, capital requirements for market risk are calculated assuming a period of stress. The period used to determine the stressed VaR at the end of the first half of 2017 was the period from August 4, 2011, to July 26, 2012, since this historical period represented a period of significant stress by comparison with the Bank’s positioning as of the reporting date. For loans to banks, corporates, and countries (central and regional governments and local authorities), credit risk is primar-ily managed by allocating limits at portfolio level and by defining a target portfolio. The retail business volume is managed using variance analyses. In the case of operational risk, limits are defined both for the Bank as a whole and for each segment. The other risk types are managed using Group-wide limits.
The following graphic depicts the changes in limit utilization for operationally managed risk types over time. Postbank aims to actively manage its limits so as to effectively control risk.
As of June 30, 2017, utilization of the authorized risk capital for market risk in the narrower sense of the term amounted to 43 %, a significant decline compared with the prior year-end (December 31, 2016: 55 %). This decrease is attributable to the reduction in the credit spread exposure and to the adjusted modeling of the relevant risk inputs. Credit risk limit utilization amount-ed to 78 % as of June 30, 2017 (December 31, 2016: 73 %). Higher business volumes in the strategic business areas
Breakdown of Postbank’s “economic creditor protection“ risk cover amount by risk type (approved risk capital)
26 %, unallocatedrisk cover amount
25 %, businessrisk
25 %, credit risk
19 %, market
risk
5 %, operational
risk
Development of the ratio of approved risk capital to the “economic creditor protection“ risk cover amount
in %
100
90
80
70
60
50
40
30
20
10
June 30, 2015
Dec. 31, 2015
June 30, 2016
Dec. 31, 2016
June 30, 2017
57 % 59 % 59 % 68 % 69 %
Development of the limit utilization for operationally managed risk types
● Market
risk
June 30, 2015
70 %
Dec. 31, 2015
70 %
June 30, 2016
68 %
Dec. 31, 2016
55 %
June 30, 2017
43 %
● Credit risk
79 %
79 %
81 %
73 %
78 %
● Opera- tional risk
66 %
65 %
56 %
58 %
65 %
in %
100
90
80
70
60
50
40
30
20
10

02INTERIM MANAGEMENT REPORT RISK REPORT
2121Interim Report as of June 30, 2017
INT
ER
IM M
AN
AG
EM
EN
T R
EP
OR
T
of the Retail Banking and Corporate Banking segments were offset by rating upgrades. The increase in risk was due to a recalibration of the credit risk model.
Utilization of the authorized risk capital limit for op-erational risk increased noticeably, from 58 % as of the 2016 year-end to 65 % as of June 30, 2017. This is due to a change in the structure of the data on both internal and external losses obtained from the ORX consortium (Operational Riskdata eXchange Association).
Postbank’s risk-bearing capacity was ensured at all times.
Risk concentrationsFor information on the identification, reporting, and monitoring of risk concentrations as well as projects to improve credit portfolio management, please see the 2016 Group Management Report.
Risk concentrations are closely monitored in a timely manner using the segment-specific risk assessment re-ports and the risk circles used in risk management.
At present, based on the economic capital, a risk concen-tration is discernible in particular with respect to sover-eign exposures. Monthly reporting of the economic capi-tal requirement for credit risk and risk concentrations is a key component of Postbank’s credit risk reporting.
In the Non-Core Operating Unit segment, Postbank further reduced concentration risk due to its holdings of investment securities reaching maturity.
A strategy designed to prevent regional specific con-centration risks is being pursued for the commercial mortgage portfolio. The focus is mainly on Germany and Europe.
Monitoring and managing market riskPostbank manages its market risk in the narrower sense of the term using, on the one hand, VaR limits and present value-based loss limits at Group level and for subportfolios. On the other, sensitivity indicators and maturity structures are used as additional management indicators. The changes in value of positions exposed to market risk are derived from daily marking to market. In the case of inactive market segments, a special process has been instituted to regularly review whether the market data available still permits adequate valuations to be made. As a result, specific portfolios are marked to model. The management of market risk exposures from an earnings perspective focuses primarily on the present value. All market risk is measured using value at risk. Risks from potential changes in spreads have been taken into account in risk measurement.
Interest rate risk – a significant component of market risk – is the term used to denote the risk of a decline in the fair value of interest-sensitive financial instruments resulting from a change in the market rate of interest or a deterioration in net interest income for the period due to changes in the general market rate of interest. Interest rate risk analysis is an integral part of daily market risk measurement. The following chart presents the profile of Postbank’s open interest rate positions
as of June 30, 2017, in the form of a basis point value (bpv) graph. Positions with a negative value represent an asset-side interest rate risk, which means that there is a surplus of assets. In the same way, positive values indi-cate a surplus of liabilities. Overall, Postbank continued to have a long interest rate position as of June 30, 2017.
The graphic shows that the long interest rate positions open as of the reporting date of June 30, 2017, are distributed across almost all maturity ranges. Only in the maturity range of less than one year and in the maturity band of eight to nine years are the majority of interest rate risk overhangs on the short side. The total bpv as of June 30, 2017, amounted to €–4.5 million, compared with €–3.6 million as of December 31, 2016. Interest rate sensitivity is primarily the result of positions in euros; interest rate sensitivities in other currencies are immate-rial. Postbank mainly uses interest rate swaps to actively manage interest rate risk. Those elements of capital made available to the Bank indefinitely are excluded when determining interest rate risk.
Monitoring market riskMarket risk is managed using a system of risk limits. The aggregate risk capital for market risk is resolved by the Bank Risk Committee and allocated by the Market Risk Committee to the individual units and portfolios in the form of operating sublimits. In addition to risk limits for total VaR and for the main subtypes of market risk, loss limits are allocated for potential fair value losses in indi - vidual portfolios. Risks are measured and monitored on a daily basis. The limits used are dynamic outcome-based limits; any losses incurred over and above the loss limit reduce the limit, while gains replenish it, at a maximum, to the originally defined level. The VaR limits authorized at Group level were complied with at all times during the reporting period.
In addition to the VaR limits, the Market Risk Commit-tee has defined sensitivity limits that restrict the credit spread and interest rate sensitivities in the different segments, portfolios, and maturities.
The Postbank Group‘s interest rate positions (bpv) as of June 30, 2017
Maturity band
bpv in €m
1.30
0.80
0.30
– 0.20
– 0.70
– 1.20
– 1.70
– 2.20
– 2.70
– 3.20
<=
1 ye
ar
2 ye
ars
3 ye
ars
4 ye
ars
5 ye
ars
6 ye
ars
7 ye
ars
8 ye
ars
9 ye
ars
10 y
ears
>10
yea
rs
0.38
– 1.04
– 1.79
0.74
0.24
– 0.31– 0.71
– 0.51– 0.72
– 0.33 – 0.47

2222 Interim Report as of June 30, 2017
The methods used to compute VaR are regularly vali-dated and tested for reliability. The predictive accuracy of the calculated VaR is tested by comparing it with the hypothetical gains and losses arising from actual changes in fair value for the same portfolio (clean mark-to-market backtesting), among other things. The back-testing results as of June 30, 2017 (one-sided binomial test in accordance with the Basel traffic light approach) produced four outliers at Group level and were thus in the green zone, thereby confirming the general ad-equacy of the market risk model.
For more detailed descriptions of the methods used to measure and limit market risk, please see the “Monitor-ing and managing market risk” section of the Risk Re-port contained in the 2016 Group Management Report.
Stress testingThe greatest risks that emerge from the regularly per-formed internal stress tests for market risk continue to be those in connection with interest rates and spreads due to the Bank’s positioning. Sensitivities to changes in equity prices, currency rates, and volatilities are significantly less pronounced due to the small number of exposures.
In the first half of 2017, the risk capital available for mar-ket risk was sufficient at all times to cover the fair value losses arising in even the most adverse of the historical and hypothetical stress scenarios examined.
Risk indicatorsThe following VaR figures were calculated for the first half of 2017 and the second half of 2016, respectively:
Postbank Group VaR relating to market risk
Group VaR (10 days, 99 %)
VaR at end of half-year
Maximum VaR
Minimum VaR
Average VaR
H1 2017 €m
H2 2016 €m
H1 2017 €m
H2 2016 €m
H1 2017 €m
H2 2016 €m
H1 2017 €m
H2 2016 €m
Interest rate risk 67.4 58.5 82.0 87.8 51.3 45.5 63.5 74.5
Equity/stock index risk 5.5 6.3 6.7 8.1 5.3 6.1 6.1 7.0
Currency risk 5.8 7.2 8.2 8.0 3.6 3.7 5.0 4.7
Other market risk (spread) 56.9 73.2 78.3 99.7 55.4 71.3 68.3 89.8
Diversification effects – 33.0 – 36.9 – 39.1 – 44.5 – 24.6 – 26.5 – 32.0 – 35.3
Total 102.6 108.3 128.1 159.1 92.8 100.4 110.8 140.6
The VaR for market risk (confidence level of 99 %, hold-ing period of 10 days) amounted to a total of €103 mil-lion as of June 30, 2017 (for comparative purposes: €108 million as of December 31, 2016).
The calculation incorporates all material market risk-bearing positions, including pension obligations and the correspond ing plan assets. In line with Postbank’s busi-ness strategy, which has a clear focus on the customer loans and deposits business, the level of market risk is largely determined by the interest rate risk and spread risk. Currency risk is mainly incurred as a result of the business activities of the Luxem bourg branch. It is of relatively minor significance to market risk, since the open foreign currency positions are only immaterial. The present value risks resulting from foreign currency posi-tions are input into the daily market risk measurements and reports. Management focuses on the one hand on present value considerations, and on the other on minimizing potential risk to the income statement as a result of foreign currency positions. Equity risk is minor since Postbank does not invest in shares or share index products as part of its financial markets activities, with the exception of strategic investments.

02INTERIM MANAGEMENT REPORT RISK REPORT
2323Interim Report as of June 30, 2017
INT
ER
IM M
AN
AG
EM
EN
T R
EP
OR
T
The following graphic shows the VaR (confidence level of 99 %, holding period of 10 days) for Postbank for the period under review:
The VaR trend in Postbank’s banking book is driven mainly by the development of two risk factors: interest rate spread and credit spread. Following a significant de-cline in operational VaR figures at the end of the second half of 2016, which was primarily driven by a reduction in the interest rate and credit spread risk positions on the assets side, the VaR stabilized in the first half of 2017 at a level of approximately €100 million to €120 million.
Postbank’s trading book has not contained any active positions since May 2014. There was no trading book business in the period under review and no new business is planned in this area for strategic reasons.
Monitoring and managing credit riskPostbank uses a target portfolio as a reference for the overall composition of its loan portfolio, which focuses on retail banking, corporates including commercial real estate finance, banks, and countries (central and regional governments and local authorities), in addition to related risk concentrations. This target portfolio was constructed in line with the principle of a balanced risk/return profile and is used as the basis for structuring al-locations to rating classes, sectors, and regions. The cur-rent portfolio of receivables is compared quarterly with the target portfolio. In the case of the corporate bank-ing business, an individual profitability analysis is also performed on the basis of the ratio of the risk-adjusted net margin to the regulatory capital tied up. Due to the high degree of risk diversification in the retail business, no proportionate limit is set on this in principle when defining the target portfolio; instead, it is managed us-ing the expected net margin less the expected risk.
Counterparty credit risk is managed and monitored, and hence the credit risk strategy implemented, on the basis of individual risks on the one hand and the entire port-folio on the other. For a detailed presentation, please see the “Monitoring and managing credit risk” section of the 2016 Group Management Report.
The following table provides an overview of material credit risk indicators for the various segments as of June 30, 2017, compared with the end of 2016 (volumes: IFRS carrying amounts).
Credit risk
Volume Expected loss
Economic capital (EC)1
June 30, 2017
€m
Dec. 31, 2016
€m
June 30, 2017
€m
Dec. 31, 2016
€m
June 30, 2017
€m
Dec. 31, 2016
€m
Retail Banking 77,114 76,737 313 318 574 569
Corporate Banking 17,391 16,336 47 56 494 392
Financial Markets 40,024 42,977 5 5 449 379
Non-Core Operating Unit 6,120 6,414 6 6 542 582
Pension funds n/a n/a 1 1 55 49
Total 140,649 142,464 373 386 2,114 1,971
1 The underlying confidence level is 99.93 %.
The economic capital (EC) increased compared with the prior year-end while the expected loss (EL) decreased. Rating upgrades and higher volumes in the strategic busi - ness areas of the Retail Banking and Corporate Banking segments led to a decline in the EL. The increase in EC was attributable to a model recalibration, i.e., the time series for estimating the correlation coefficients relating to the non-retail portfolio have been updated. This resulted in higher correlation coefficients on average and in an increase in EC in the Corporate Banking and Financial Markets segments as well as in the pension funds.
The “Maximum counterparty credit risk” table breaks down the maximum exposure to credit risk in accordance with IFRS 7.36(a) into categories of risk-bearing financial instruments both before and after the allowance for losses on loans and advances, and before and after accounting for credit risk mitigation techniques. The presentation does not contain any information on ratings, in contrast to the economic risk quantification contained in the “Credit risk” table.
Postbank Group VaR (99 %, 10 days) for the period from July 1, 2016, to June 30, 2017
VaR in €m
180 170 160 150 140 130 120 110 100 90 80
June/1
6
July/
16
Aug./16
Sep./1
6
Oct./16
Nov./16
Dec./1
6
Jan./1
7
Feb./1
7
Mar
./17
Apr./17
May
/17
June/1
7

2424 Interim Report as of June 30, 2017
Maximum counterparty credit risk
Risk-bearing financial instruments
Maximum counter-party credit risk
exposure
Allowance for losses on loans and advances
Maximum coun-terparty credit risk
exposure after allow ance for losses
on loans and advances
Collateral
Guarantees/credit derivatives
Maximum counter-party credit risk exposure after
allow ance for losses on loans and ad - vances and after
credit risk mitigation
June 30,
2017 €m
Dec. 31,
2016 €m
June 30,
2017 €m
Dec. 31,
2016 €m
June 30,
2017 €m
Dec. 31,
2016 €m
June 30,
2017 €m
Dec. 31,
2016 €m
June 30,
2017 €m
Dec. 31,
2016 €m
June 30,
2017 €m
Dec. 31,
2016 €m
Trading assets 390 475 – – 390 475 46 51 – – 344 424
Held for trading 390 475 – – 390 475 46 51 – – 344 424
Derivatives 343 422 – – 343 422 – – – – 343 422
Loans 47 53 – – 47 53 46 51 – – 1 2
Hedging derivatives 69 112 – – 69 112 – – – – 69 112
Loans and advances to other banks 11,887 13,108 – – 11,887 13,108 1,716 5,832 – – 10,171 7,276
Loans and receivables 11,887 13,108 – – 11,887 13,108 1,716 5,832 – – 10,171 7,276
Securities repurchase agreements 1,716 5,832 – – 1,716 5,832 1,716 5,832 – – – –
Overnight money 9,009 6,381 – – 9,009 6,381 – – – – 9,009 6,381
Loans 63 92 – – 63 92 – – – – 63 92
Registered bonds 99 300 – – 99 300 – – – – 99 300
Term deposits 1,000 500 – – 1,000 500 – – – – 1,000 500
Other loans and advances – 3 – – – 3 – – – – – 3
Loans and advances to customers 103,799 102,003 922 998 102,877 101,005 75,817 74,808 587 645 26,473 25,552
Loans and receivables 100,596 98,358 922 998 99,674 97,360 72,680 71,256 587 645 26,407 25,459
Private mortgage lending 66,529 65,384 261 292 66,268 65,092 63,134 61,873 – – 3,134 3,219
Home savings loans 2,875 2,992 6 5 2,869 2,987 2,765 2,912 – – 104 75
Commercial loans 14,412 13,677 112 153 14,300 13,524 6,781 6,471 587 645 6,932 6,408
Public-sector receivables 5,039 5,205 3 4 5,036 5,201 – – – – 5,036 5,201
Installment loans 7,688 7,438 388 389 7,300 7,049 – – – – 7,300 7,049
Overdraft facilities 2,413 2,085 152 155 2,261 1,930 – – – – 2,261 1,930
Promissory note loans 1,599 1,537 – – 1,599 1,537 – – – – 1,599 1,537
Other loans and advances 41 40 – – 41 40 – – – – 41 40
Fair value option 3,203 3,645 – – 3,203 3,645 3,137 3,552 – – 66 93
Private mortgage lending 3,203 3,645 – – 3,203 3,645 3,137 3,552 – – 66 93
Investment securities 24,504 26,766 – – 24,504 26,766 – – – – 24,504 26,766
Loans and receivables 9,902 12,196 – – 9,902 12,196 – – – – 9,902 12,196
Bonds and other fixed-income securities 9,902 12,196 – – 9,902 12,196 – – – – 9,902 12,196
Available for sale 14,602 14,570 – – 14,602 14,570 – – – – 14,602 14,570
Bonds and other fixed-income securities 14,301 14,252 – – 14,301 14,252 – – – – 14,301 14,252
Investment fund shares 265 270 – – 265 270 – – – – 265 270
Equity investments 35 43 – – 35 43 – – – – 35 43
Investments in unconsolidated subsidiaries 1 5 – – 1 5 – – – – 1 5
Subtotal 140,649 142,464 922 998 139,727 141,466 77,579 80,691 587 645 61,561 60,130
Contingent liabilities from guarantees 390 379 11 18 379 361 – – 1 0 378 361
Revocable and irrevocable loan commitments 21,222 20,861 19 27 21,203 20,834 – – 50 13 21,153 20,821
Revocable loan commitments1 12,863 13,095 9 13 12,854 13,082 – – – – 12,854 13,082
Irrevocable loan commitments 8,359 7,766 10 14 8,349 7,752 – – 50 13 8,299 7,739
Total 162,261 163,704 952 1,043 161,309 162,661 77,579 80,691 638 658 83,092 81,312
1Item includes irrevocable payment obligations (deposit protection fund and cash collateral relating to bank levy; see Note 28)

02INTERIM MANAGEMENT REPORT RISK REPORT
2525Interim Report as of June 30, 2017
INT
ER
IM M
AN
AG
EM
EN
T R
EP
OR
T
The table contains netting effects relating to trading assets and hedging derivatives (June 30, 2017: €6.3 billion; De cem - ber 31, 2016: €7.1 billion) in the amount disclosed for the maximum counterparty credit risk exposure before collateral.
€3.6 billion of the amount disclosed in the “Investment secu - rities” balance sheet item as of the reporting date relates to covered bonds (December 31, 2016: €4.1 billion).
The following tables show the risk concentrations as gross exposures before the allowance for losses on loans and advances and credit risk mitigation techniques.
Sector structure of the loan portfolioThe following table illustrates the risk concentrations by sector and borrower group, broken down by balance sheet item, holding category, and product group.

2626 Interim Report as of June 30, 2017
Risk concentrations by sector and borrower group
Risk-bearing financialinstruments
Retailcustomers
Banks/ insurers/financial services
Countries
Commercialreal estate
finance
Services/wholesaleand retail
Industry
Other sectors
Total
June 30,
2017 €m
Dec. 31,
2016 €m
June 30,
2017 €m
Dec. 31,
2016 €m
June 30,
2017 €m
Dec. 31,
2016 €m
June 30,
2017 €m
Dec. 31,
2016 €m
June 30,
2017 €m
Dec. 31,
2016 €m
June 30,
2017 €m
Dec. 31,
2016 €m
June 30,
2017 €m
Dec. 31,
2016 €m
June 30,
2017 €m
Dec. 31, 2016
€m
Trading assets 47 53 148 211 0 – 81 97 33 26 24 23 57 65 390 475
Held for trading 47 53 148 211 0 – 81 97 33 26 24 23 57 65 390 475
Derivatives – 0 148 211 0 – 81 97 33 26 24 23 57 65 343 422
Loans 47 53 – – – – – – – – – – – – 47 53
Hedging derivatives – – 69 112 – – – – – – – – – – 69 112
Loans and advancesto other banks – – 11,887 13,078 – – – 30 – – – – – – 11,887 13,108
Loans and receivables – – 11,887 13,078 – – – 30 – – – – – – 11,887 13,108
Securities repurchase agreements – – 1,716 5,832 – – – – – – – – – – 1,716 5,832
Overnight money – – 9,009 6,381 – – – – – – – – – – 9,009 6,381
Loans – – 63 62 – – – 30 – – – – – – 63 92
Registered bonds – – 99 300 – – – – – – – – – – 99 300
Term deposits – – 1,000 500 – – – – – – – – – – 1,000 500
Other loans and advances – – – 3 – – – – – – – – – – – 3
Loans and advances to customers 81,756 80,723 452 342 5,536 5,693 8,128 7,669 4,168 4,030 2,775 2,573 984 973 103,799 102,003
Loans and receivables 78,556 77,081 452 342 5,536 5,693 8,128 7,669 4,167 4,029 2,775 2,573 982 971 100,59 98,358
Private mortgage lending 66,427 65,271 0 0 1 1 – – 17 20 0 0 84 92 66,529 65,384
Home savings loans 2,872 2,988 – – 0 0 – – 0 0 0 0 3 4 2,875 2,992
Commercial loans 459 336 361 299 24 20 8,128 7,669 2,909 2,992 1,982 1,861 549 500 14,412 13,677
Public-sector receivables – – – – 4,974 5,135 – – 1 1 – – 64 69 5,039 5,205
Installment loans 7,688 7,437 – 0 – – – – 0 1 0 0 0 0 7,688 7,438
Overdraft facilities 1,110 1,049 16 12 0 0 – – 802 567 406 329 79 128 2,413 2,085
Promissory note loans – – 51 31 533 533 – – 437 446 387 383 191 144 1,599 1,537
Other loans and advances – – 24 0 4 4 – – 1 2 – – 12 34 41 40
Fair value option 3,200 3,642 – – 0 0 – – 1 1 – – 2 2 3,203 3,645
Private mortgage lending 3,200 3,642 – – 0 0 – – 1 1 – – 2 2 3,203 3,645
Investment securities – – 7,736 8,963 14,248 15,319 – – 1,200 1,284 696 675 624 525 24,504 26,766
Loans and receivables – – 3,242 4,171 5,575 6,860 – – 596 669 280 279 209 217 9,902 12,196
Bonds and other fixed-income securities – – 3,242 4,171 5,575 6,860 – – 596 669 280 279 209 217 9,902 12,196
Available for sale – – 4,494 4,792 8,673 8,459 – – 604 615 416 396 415 308 14,602 14,570
Bonds and other fixed-income securities – – 4,203 4,484 8,673 8,459 – – 604 611 416 396 405 302 14,301 14,252
Investment fund shares – – 265 270 – – – – – – – – – – 265 270
Equity investments – – 26 38 – – – – 0 0 – – 9 5 35 43
Investments in unconsolidated subsidiaries – – – 0 – – – – – 0 4 – – 1 1 1 5
Subtotal 81,803 80,776 20,292 22,706 19,784 21,012 8,209 7,796 5,401 5,340 3,495 3,271 1,665 1,563 140,649 142,464
Contingent liabilities from guarantees 5 6 10 13 – – 11 9 176 199 109 84 79 68 390 379
Revocable and irrevocable loan commitments 18,034 17,778 101 136 140 140 426 233 1,393 1,458 749 766 379 350 21,222 20,861
Revocable loan commitments1 11,649 11,624 51 12 20 20 – – 575 748 347 450 221 241 12,863 13,095
Irrevocable loan commitments 6,385 6,154 50 124 120 120 426 233 818 710 402 316 158 109 8,359 7,766
Total 99,842 98,560 20,403 22,855 19,924 21,152 8,646 8,038 6,970 6,997 4,353 4,121 2,123 1,981 162,261 163,704
1Item includes irrevocable payment obligations (deposit protection fund and cash collateral relating to bank levy; see Note 28)

02INTERIM MANAGEMENT REPORT RISK REPORT
2727Interim Report as of June 30, 2017
INT
ER
IM M
AN
AG
EM
EN
T R
EP
OR
T
Overall, the sector distribution of the instruments subject to credit risk, measured in terms of volume, displays a bal-anced structure except for the concentrations with respect to banks and countries. The Group’s loan portfolio consists mainly of loans to retail customers with a focus on domestic private mortgage lending. It also includes loan exposures in the Corporate Banking division, predominantly in the German business customers segment and in domestic and international commercial real estate finance. The holdings of investment securities consist for the most part of a portfolio of mainly German and European government bonds as well as bonds issued by banks (including covered bonds and Pfandbriefe), insurers, and other financial services providers.
A target portfolio that has been aligned in terms of diversi-fication has been defined as part of the credit risk strategy to manage investments in the non-retail area.
Regional distribution of the loan portfolioThe regional distribution of the credit volume reveals a concentration on the domestic German market in line with Postbank’s strategy, as well as selected exposures in Western Europe.

2828 Interim Report as of June 30, 2017
Risk concentrations by geographic region
Risk-bearing financialinstruments
Germany Western Europe Other regions Total
June 30, 2017
€m
Dec. 31, 2016
€m
June 30, 2017
€m
Dec. 31, 2016
€m
June 30, 2017
€m
Dec. 31, 2016
€m
June 30, 2017
€m
Dec. 31, 2016
€m
Trading assets 342 377 47 95 1 3 390 475
Held for trading 342 377 47 95 1 3 390 475
Derivatives 295 324 47 95 1 3 343 422
Loans 47 53 – – – – 47 53
Hedging derivatives 3 5 49 70 17 37 69 112
Loans and advances to other banks 11,495 12,301 385 779 7 28 11,887 13,108
Loans and receivables 11,495 12,301 385 779 7 28 11,887 13,108
Securities repurchase agreements 1,699 5,832 17 – – – 1,716 5,832
Overnight money 8,733 5,774 269 579 7 28 9,009 6,381
Loans 63 92 0 – – – 63 92
Registered bonds – 100 99 200 – – 99 300
Term deposits 1,000 500 – – – – 1,000 500
Other loans and advances – 3 – – – – – 3
Loans and advances to customers 95,152 93,950 7,692 7,331 955 722 103,799 102,003
Loans and receivables 91,960 90,316 7,683 7,322 953 720 100,596 98,358
Private mortgage lending 63,815 62,546 2,670 2,793 44 45 66,529 65,384
Home savings loans 2,573 2,695 300 296 2 1 2,875 2,992
Commercial loans 9,062 9,016 4,459 3,996 891 665 14,412 13,677
Public-sector receivables 5,032 5,198 7 7 – – 5,039 5,205
Installment loans 7,652 7,409 22 21 14 8 7,688 7,438
Overdraft facilities 2,399 2,077 12 7 2 1 2,413 2,085
Promissory note loans 1,386 1,336 213 201 – – 1,599 1,537
Other loans and advances 41 39 0 1 – – 41 40
Fair value option 3,192 3,634 9 9 2 2 3,203 3,645
Private mortgage lending 3,192 3,634 9 9 2 2 3,203 3,645
Investment securities 8,010 9,312 16,244 16,961 250 493 24,504 26,766
Loans and receivables 4,279 5,170 5,565 6,728 58 298 9,902 12,196
Bonds and other fixed-income securities 4,279 5,170 5,565 6,728 58 298 9,902 12,196
Available for sale 3,731 4,142 10,679 10,233 192 195 14,602 14,570
Bonds and other fixed-income securities 3,447 3,843 10,679 10,229 175 180 14,301 14,252
Investment fund shares 265 270 – – – – 265 270
Equity investments 18 28 0 0 17 15 35 43
Investments in unconsolidated subsidiaries 1 1 0 4 – – 1 5
Subtotal 115,002 115,945 24,417 25,236 1,230 1,283 140,649 142,464
Contingent liabilities from guarantees 349 341 41 38 – – 390 379
Revocable and irrevocable loan commitments 20,903 20,558 297 290 22 13 21,222 20,861
Revocable loan commitments1 12,755 12,983 96 101 12 11 12,863 13,095
Irrevocable loan commitments 8,148 7,575 201 189 10 2 8,359 7,766
Total 136,254 136,844 24,755 25,564 1,252 1,296 162,261 163,704
1Item includes irrevocable payment obligations (deposit protection fund and cash collateral relating to bank levy; see Note 28)

02INTERIM MANAGEMENT REPORT RISK REPORT
2929Interim Report as of June 30, 2017
INT
ER
IM M
AN
AG
EM
EN
T R
EP
OR
T
The following table “Exposures to debtors in selected European countries” comprises exposures to debtors in the “GIIPS” countries (Greece, Ireland, Italy, Portugal, Spain). The amounts disclosed are the IFRS carrying amounts.
Exposures to debtors in selected European countries1
Countries Banks/insurers/ financial services
Retail Corporates2 Other3 Total
June 30, 2017
€m
Dec. 31, 2016
€m
June 30, 2017
€m
Dec. 31, 2016
€m
June 30, 2017
€m
Dec. 31, 2016
€m
June 30, 2017
€m
Dec. 31, 2016
€m
June 30, 2017
€m
Dec. 31, 2016
€m
June 30, 2017
€m
Dec. 31, 2016
€m
Greece 0.0 0.0 0.0 0.0 1.1 1.1 0.0 0.0 0.0 0.0 1.1 1.1
Ireland 576.5 593.9 40.7 29.2 2.2 2.2 56.6 49.4 14.3 15.9 690.2 690.6
Italy 3,212.9 2,795.5 74.8 178.6 1,557.6 1,703.7 373.2 330.9 0.0 0.0 5,218.5 5,008.7
Portugal 0.0 0.0 2.1 0.0 3.1 3.0 14.5 12.9 0.0 0.0 19.8 15.9
Spain 778.3 600.8 263.2 234.4 25.0 25.7 194.6 186.5 0.0 0.0 1,261.1 1,047.4
Total 4,567.6 3,990.2 380.9 442.1 1,589.0 1,735.7 639.0 579.8 14.3 15.9 7,190.8 6,763.7
1 Based on IFRS carrying amounts. For holdings categorized as available for sale this is the fair value.2Including commercial real estate3Including investor securitization positions
As was also the case at the prior year-end, Postbank did not hold any credit default swaps with sovereign borrowers in its portfolio as of the reporting date.
Rating structure of the loan portfolioThe following table shows the credit quality of the risk- bearing financial instruments for Postbank’s non-retail business that were neither past due nor individually impaired as of June 30, 2017 (excluding “contingent liabilities” and “other liabilities”).
In principle, Postbank uses the same rating for risk manage-ment as for capital requirements; this is normally the issuer rating rather than the rating given to a specific issue. Postbank has a large portfolio of Pfandbriefe and similarly collateralized issues that are relatively low-risk in nature. For this reason, the issue ratings are shown in the following table. The distribution of ratings in the Group loan portfolio reflects Postbank’s conservative approach. The good rating categories predominate: 67 % of the rated portfolio is classified as investment grade (rating of “BBB” or better).

3030 Interim Report as of June 30, 2017
Credit quality of financial instruments in the non-retail business that are neither past due nor impaired
Risk-bearing financial instruments
AAA AA A BBB < BBB Not rated Total
June 30,
2017 €m
Dec. 31,
2016 €m
June 30,
2017 €m
Dec. 31,
2016 €m
June 30,
2017 €m
Dec. 31,
2016 €m
June 30,
2017 €m
Dec. 31,
2016 €m
June 30,
2017 €m
Dec. 31,
2016 €m
June 30,
2017 €m
Dec. 31,
2016 €m
June 30,
2017 €m
Dec. 31,
2016 €m
Trading assets – – 5 18 41 74 236 211 24 75 37 44 343 422
Held for trading – – 5 18 41 74 236 211 24 75 37 44 343 422
Derivatives – – 5 18 41 74 236 211 24 75 37 44 343 422
Hedging derivatives – – – – 69 112 – – – – – – 69 112
Held for trading – – – – 69 112 – – – – – – 69 112
Loans and advances to other banks 8,689 5,600 47 44 1,960 4,970 1,131 2,414 14 21 46 59 11,887 13,108
Loans and receivables 8,689 5,600 47 44 1,960 4,970 1,131 2,414 14 21 46 59 11,887 13,108
Securities repurchase agreements – – 17 – 1,699 4,284 – 1,548 – – – – 1,716 5,832
Overnight money 8,573 5,482 30 44 260 685 131 135 11 18 4 17 9,009 6,381
Loans 17 17 – – 1 – – 30 3 3 42 42 63 92
Registered bonds 99 99 – – – – – 201 – – – – 99 300
Term deposits – – – – – – 1,000 500 – – – – 1,000 500
Other loans and advances – 2 – – 0 1 0 0 0 0 0 0 0 3
Available for sale – – – – – – – – – – – – – –
Loans and advances to customers1 4,834 4,666 2,616 2,450 2,201 1,948 7,868 7,301 3,827 4,117 331 445 21,677 20,927
Loans and receivables1 4,834 4,666 2,616 2,450 2,201 1,948 7,866 7,301 3,826 4,117 331 442 21,674 20,924
Private mortgage lending 1 1 – – 5 6 37 29 53 52 4 20 100 108
Home savings loans – – – – – – 2 – 1 – – 4 3 4
Commercial loans 887 818 896 580 2,107 1,874 6,412 5,958 3,140 3,540 249 344 13,691 13,114
Public-sector receivables 3,915 3,815 1,077 1,344 – – – – – – 40 39 5,032 5,198
Installment loans – – – – – – – – – – – – 0 –
Overdraft facilities – – 124 – 6 1 628 500 449 422 1 – 1,208 923
Promissory note loans 31 32 515 522 83 67 787 813 183 103 – – 1,599 1,537
Other loans and advances1 – – 4 4 – – – 1 – – 37 35 41 40
Fair value option – – – – – – 2 – 1 – – 3 3 3
Private mortgage lending – – – – – – 2 – 1 – – 3 3 3
Investment securities 9,552 10,674 7,432 8,308 5,889 6,174 1,542 1,423 71 135 11 45 24,497 26,759
Loans and receivables 3,438 4,109 2,421 3,668 3,208 3,488 788 808 40 116 – – 9,895 12,189
Bonds and other fixed-income securities 3,438 4,109 2,421 3,668 3,208 3,488 788 808 40 116 – – 9,895 12,189
Available for sale 6,114 6,565 5,011 4,640 2,681 2,686 754 615 31 19 11 45 14,602 14,570
Bonds and other fixed-income securities 6,114 6,565 5,011 4,639 2,401 2,416 753 613 18 19 4 – 14,301 14,252
Investment fund shares – – – – 265 270 – – – – – – 265 270
Equity investments – – – 1 15 – – 1 13 – 7 41 35 43
Investments in unconsolidated subsidiaries – – – – – – 1 1 – – – 4 1 5
Total 23,075 20,940 10,100 10,820 10,160 13,278 10,777 11,349 3,936 4,348 425 593 58,473 61,328
1Rating distribution for commercial loans between “A” and “Not Rated” adjusted for 2016

02INTERIM MANAGEMENT REPORT RISK REPORT
3131Interim Report as of June 30, 2017
INT
ER
IM M
AN
AG
EM
EN
T R
EP
OR
T
Similarly, the following table shows the credit quality of the risk-bearing financial instruments for Postbank’s retail banking business that were neither past due nor indivi-dually impaired as of the June 30, 2017, reporting date (excluding “contingent liabilities” and “other liabilities”). Postbank’s retail banking business continued to exhibit a stable rating performance.
Credit quality of financial instruments in the retail business that are neither past due nor impaired
Risk-bearing financialinstruments
AAA
AA
A
BBB
< BBB
Basel IIpool rating/not rated
Total
June 30,
2017 €m
Dec. 31,
2016 €m
June 30,
2017 €m
Dec. 31,
2016 €m
June 30,
2017 €m
Dec. 31,
2016 €m
June 30,
2017 €m
Dec. 31,
2016 €m
June 30,
2017 €m
Dec. 31,
2016 €m
June 30,
2017 €m
Dec. 31,
2016 €m
June 30,
2017 €m
Dec. 31,
2016 €m
Trading assets – – 0 0 4 5 24 27 19 21 – – 47 53
Held for trading – – 0 0 4 5 24 27 19 21 – – 47 53
Loans – – 0 0 4 5 24 27 19 21 – – 47 53
Loans and advances to customers 0 0 284 490 5,094 4,807
33,345
32,662
38,319
37,828 3,072 3,197
80,114
78,984
Loans and receivables 0 0 267 470 4,798 4,469
31,640
30,737
37,181
36,522 3,048 3,168
76,934
75,366
Private mortgage lending 0 0 168 173 3,797 3,775
29,240
28,351
30,235
29,754 2,064 2,196
65,504
64,249
Home savings loans 0 0 69 73 568 597 1,448 1,509 670 688 86 86 2,841 2,953
Commercial loans 0 0 16 214 315 4 70 61 38 31 19 25 458 335
Installment loans 0 – 3 3 60 53 640 593 5,625 5,431 789 787 7,117 6,867
Overdraft facilities 0 0 11 7 58 40 242 223 613 618 90 74 1,014 962
Fair value option 0 0 17 20 296 338 1,705 1,925 1,138 1,306 24 29 3,180 3,618
Private mortgage lending 0 0 17 20 296 338 1,705 1,925 1,138 1,306 24 29 3,180 3,618
Total 0 0 284 490 5,098 4,812 33,369 32,689 38,338 37,849 3,072 3,197 80,161 79,037
The following table shows the disbursed credit exposure for the private mortgage lending portfolio, grouped by loan-to-value (LtV) class.
LtV is calculated as the ratio of the disbursed credit exposure per borrower to the property value of the underlying real estate collateral. The valuation of the respective real estate collateral is based on the current property value, which is determined by a reappraisal of the original market value on the current reporting date.
Disbursed credit exposures relating to loans and advances in the private mortgage lending portfolio are included into the calculation of loan to value if there is real estate collateral. Disbursed credit exposures that are backed by home savings deposits (5.0 % of the portfolio; December 31, 2016: 5.3 %) or secured by substitute collateral and negative pledge agreements (7.9 % of the portfolio; December 31, 2016: 7.9 %) are not included in the LtV calculation.
Private mortgage lending, grouped by loan-to-value class
Loan-to-value class June 30, 2017in %
Dec. 31, 2016 in %
< = 50 % 28.7 % 29.9 %
> 50 %, <= 70 % 25.7 % 27.1 %
> 70 %, <= 90 % 26.3 % 25.5 %
> 90 %, <= 100 % 10.8 % 9.9 %
> 100 %, <= 110 % 6.2 % 5.5 %
> 110 %, <= 130 % 2.0 % 1.7 %
> 130 % 0.3 % 0.4 %
Total 100.0 % 100.0 %

3232 Interim Report as of June 30, 2017
As of June 30, 2017, 54.4 % of the private mortgage lend-ing portfolio had a loan-to-value ratio of less than or equal to 70 % (December 31, 2016: 57.0 %).
8.5 % of total exposures are represented in the LtV classes of greater than 100 % (December 31, 2016: 7.6 %). These are exposures that are backed by real estate collateral and, in addition, regularly secured by highly liquid additional collateral. Loans past due but not impairedThe following table shows those risk-bearing financial instruments that were past due but not impaired as of June 30, 2017:
Time bands for financial instruments past due but not impaired
Risk-bearingfinancial instrumentsand collateral
Financial instruments past due but not impaired Fair value ofcollateral
for financial instruments
past due butnot impaired
Past due ≤ 3 months
Past due > 3 months,≤ 6 months
Past due > 6 months,
≤ 1 year
Past due > 1 year
Total
June 30,
2017 €m
Dec. 31,
2016 €m
June 30,
2017 €m
Dec. 31,
2016 €m
June 30,
2017 €m
Dec. 31,
2016 €m
June 30,
2017 €m
Dec. 31,
2016 €m
June 30,
2017 €m
Dec. 31,
2016 €m
June 30,
2017 €m
Dec. 31,
2016 €m
Loans and advances to customers 162 169 16 17 29 32 115 127 322 345 266 313
Loans and receivables 162 168 14 16 26 28 110 121 312 333 256 302
Private mortgage lending 147 154 11 13 23 23 102 112 283 302 239 276
Home savings loans 4 4 3 3 3 5 7 8 17 20 16 18
Commercial loans 0 0 – – – 0 0 0 0 0 1 8
Public-sector receivables – – – – – – – – – – – –
Installment loans 2 1 0 – 0 0 0 0 2 1 – –
Overdraft facilities 9 9 0 0 0 0 1 1 10 10 – –
Other loans and advances – – – – – – – – – – 0 0
Fair value option 0 1 2 1 3 4 5 6 10 12 10 11
Private mortgage lending 0 1 2 1 3 4 5 6 10 12 10 11
Total 162 169 16 17 29 32 115 127 322 345 266 313
Impaired loansThe following table shows all impaired financial assets as of June 30, 2017, and December 31, 2016, broken down into individually impaired loans and advances to custom-ers, and investment securities for which impairment losses have been recognized; no impairment losses have been recognized for loans and advances to other banks. The carrying amount after recognition of impairment losses is shown in the table as the difference between the carrying amount before impairment and the amount of the impair-ment loss.

02INTERIM MANAGEMENT REPORT RISK REPORT
3333Interim Report as of June 30, 2017
INT
ER
IM M
AN
AG
EM
EN
T R
EP
OR
T
Impaired financial instruments
Impaired risk-bearingfinancial instruments and collateral
Carrying amountbefore impairment
Amountof impairment
loss
Carrying amountafter impairment
Fair value ofcollateral for
impaired instruments
June 30, 2017
€m
Dec. 31, 2016
€m
June 30, 2017
€m
Dec. 31, 2016
€m
June 30, 2017
€m
Dec. 31, 2016
€m
June 30, 2017
€m
Dec. 31, 2016
€m
Loans and advances to customers 1,686 1,747 735 798 951 949 572 702
Loans and receivables 1,676 1,735 735 798 941 937 563 691
Private mortgage lending 642 725 183 209 459 516 431 569
Home savings loans 14 15 6 5 8 10 13 14
Commercial loans 263 228 93 127 170 101 119 108
Public-sector receivables 7 7 3 4 4 3 – –
Installment loans 569 570 313 313 256 257 – –
Overdraft facilities 181 190 137 140 44 50 – –
Promissory note loans – – – – – – – –
Other loans and advances – – – – – – – –
Fair value option 10 12 – – 10 12 9 11
Private mortgage lending 10 12 – – 10 12 9 11
Investment securities 65 70 58 63 7 7 – –
Loans and receivables 65 70 58 63 7 7 – –
Bonds and other fixed-income securities 65 70 58 63 7 7 – –
Total 1,751 1,817 793 861 958 956 572 702
Overall, the moderate decrease in impaired financial instru - ments in the first half of 2017 was due to a noticeable decline in private mortgage lending which was partially offset by a marked increase in commercial loans. Within the loans and advances to customers balance sheet item, the ratio of specific valuation allowances to the carrying amount of impaired financial instruments (coverage ratio) was 44 % as of June 30, 2017 (December 31, 2016: 46 %).

3434 Interim Report as of June 30, 2017
Forborne and non-performing exposuresThe following table shows the performing and non-per-forming loans within the “Loans and advances to customers” balance sheet item, broken down by forborne and non-forborne exposure.
Forborne and non-performing exposures to customers
Financial instruments within the “Loans and advances to customers” balance sheet item
Performing loans
Non-performing loans
Total
Not impaired Impaired Not impaired Total
June 30, 2017
€m
Dec. 31, 2016
€m
June 30, 2017
€m
Dec. 31, 2016
€m
June 30, 2017
€m
Dec. 31, 2016
€m
June 30, 2017
€m
Dec. 31, 2016
€m
June 30, 2017
€m
Dec. 31, 2015
€m
Forborne 390 375 370 401 114 99 484 500 874 875
Loans and receivables 388 373 370 401 112 98 482 499 870 872
Private mortgage lending 65 52 21 23 47 51 68 74 133 126
Home savings loans 0 0 0 0 0 0 0 0 0 0
Commercial loans 29 37 144 159 0 0 144 159 173 196
Public-sector receivables 0 0 7 7 0 0 7 7 7 7
Installment loans 226 218 157 152 50 42 207 194 433 412
Overdraft facilities 63 61 41 60 15 5 56 65 119 126
Promissory note loans 5 5 0 0 0 0 0 0 5 5
Other loans and advances 0 0 0 0 0 0 0 0 0 0
Fair value option 2 2 0 0 2 1 2 1 4 3
Private mortgage lending 2 2 0 0 2 1 2 1 4 3
Non-forborne 100,899 99,044 1,316 1,346 710 738 2,026 2,084 102,925 101,128
Loans and receivables 97,771 95,481 1,306 1,334 650 671 1,956 2,005 99,727 97,486
Private mortgage lending 65,212 63,974 621 702 564 582 1,185 1,284 66,397 65,258
Home savings loans 2,823 2,935 14 15 38 42 52 57 2,875 2,992
Commercial loans 14,092 13,383 119 69 28 29 147 98 14,239 13,481
Public-sector receivables 5,032 5,198 0 0 0 0 0 0 5,032 5,198
Installment loans 6,829 6,595 412 418 14 13 426 431 7,255 7,026
Overdraft facilities 2,148 1,824 140 130 6 5 146 135 2,294 1,959
Promissory note loans 1,594 1,532 0 0 0 0 0 0 1,594 1,532
Other loans and advances 41 40 0 0 0 0 0 0 41 40
Fair value option 3,128 3,563 10 12 60 67 70 79 3,198 3,642
Private mortgage lending 3,128 3,563 10 12 60 67 70 79 3,198 3,642
Total 101,289 99,419 1,686 1,747 824 837 2,510 2,584 103,799 102,003
02INTERIM MANAGEMENT REPORT RISK REPORT
3535Interim Report as of June 30, 2017
INT
ER
IM M
AN
AG
EM
EN
T R
EP
OR
T
Forborne exposures within the “Loans and advances to customers” balance sheet item totaled €874 million as of June 30, 2017 (December 31, 2016: €875 million); the increase in private mortgage lending and installment loans was offset by the decline in commercial loans and overdraft facilities.
Non-performing exposures amounted to €2,510 million as of the reporting date (December 31, 2016: €2,584 million). The decline is primarily the result of a decrease in private mortgage lending and an increase in commercial loans.
In addition to the exposures presented in the table above, as of June 30, 2017, Postbank recorded a non-performing exposure for trading assets in the amount of €2 million, and one of €7 million for investment securities (€7 million of which were forborne exposures).
Non-performing exposures thus accounted for 2.2 % of the total volume of higher-risk loans (NPL ratio) which are defined as loans and advances to customers plus loans and advances to other banks excluding securities lending agreements (December 31, 2016: 2.4 %).
Securitization positionsAsset securitization makes it possible to transfer the under-lying credit risk to third parties. Usually, entire exposure pools consisting of two or more subclasses of risk (tranches) entailing varying degrees of risk are transferred.
As the following originator securitization transactions have been terminated and are now in deferred redemption, they are disregarded for regulatory purposes. The following amounts (class principal amount after distribution) were outstanding as of the reporting date (the amounts in brackets refer to the figures as of the 2016 closing date):
Provide Blue 2005-1 Provide Blue 2005-2 PB Domicilio 2007-1 PB Domicile 2006-1
€7.6 million (€9.0 million) €23.4 million
(€25.6 million) €34.4 million
(€37.8 million) €17.2 million
(€18.4 million)
(BHW Bausparkasse AG)
(BHW Bausparkasse AG)
(BHW Bausparkasse AG)
(Deutsche Postbank AG)
Postbank has limited investments in redeemed residential mortgage-backed securities. The portfolio had a carrying amount of €14 million as of June 30, 2017 (December 31, 2016: €17 million), having fallen due to repayments. The portfolio is valued periodically using arranger quotes or an internal valuation model.
Monitoring and managing liquidity risk As a matter of principle, monitoring and management of liquidity risk is performed centrally in the CRO board department. The primary goal of liquidity risk manage-ment is to ensure Postbank’s solvency at all times, including in certain stress situations. To achieve this, Postbank has laid down the principles for handling liquidity risk, among other things, in its overarching risk strategy. The liquidity risk management process is based on several pillars and is generally performed on a stress basis. The scenarios cover both institution-specific and general market issues and, in the MaRisk scenario, the combination of the two. This per-mits changes in a variety of market factors, panic reactions
by customers, and structural changes in funding resources (e.g., due to a decline in market liquidity) to be reflected. The MaRisk scenario simulates severe outflows of savings, demand and corporate customer deposits, restricted access to the uncollateralized money market, and increased haircuts on central bank-eligible securities. The internally defined survival period is two months, longer than the minimum required under supervisory law. A requirement for all stress scenarios was to maintain customer loans at existing levels at least, even in times of stress. In the event of unexpected cash outflows, cash holdings, central bank balances, and an extensive portfolio of unencumbered, highly liquid, central bank-eligible securities can be used to obtain liquidity rapidly, including on (private) repo markets.
The Liquidity Risk Management unit determines Postbank’s liquidity status under both normal conditions and the stress conditions described above on each business day using funding matrices and cash flow forecasts. This is also managed using a monthly forecast, taking into account the expected product volumes based on the measures adopted. Surplus liquidity, which likewise reflects the MaRisk scenario, is calculated on a monthly basis for each of the coming 12 months. As an early warning indicator, the minimum for a 12-month horizon is limited under the risk strategy and monitored by the Liquidity Risk Management team.
For a longer-term view of liquidity above and beyond this, Postbank has also incorporated the surplus liquidity approach into its annual liquidity and funding planning as part of the Bank-wide planning process. In so doing, Liquidity Risk Management ensures that the liquidity risk appetite defined by the Management Board will be ac-counted for from a planning perspective over the multi-year planning horizon on the basis of specific measures and thus that adequate liquidity buffers can be maintained.
Due to its strategic focus as a bank for retail, business and corporate customers, Postbank enjoys a broad and stable refinancing base from its customer business and is therefore largely independent of the money and capital markets.
Concentration risk during refinancing is taken into account implicitly in the stress tests presented above. We do not see any key concentration risks in respect of individual creditors from a liquidity perspective due to the Bank’s business strategy. To further diversify its refinancing activities, Postbank has a Pfandbrief license allowing it to issue public-sector Pfandbriefe and mortgage Pfandbriefe. While there are still no plans to issue public-sector Pfand-briefe under Register E, it is foreseen to issue mortgage Pfandbriefe under Register D as a long-term refinancing instrument as part of multi-year funding planning.

3636 Interim Report as of June 30, 2017
Data on the stability of the refinancing structure is regularly reviewed and evaluated in internal analyses. The net stable funding ratio (NSFR) is also used to assess this. Since 2016, the NSFR for the Postbank Group has been calculated on a regular basis in accordance with the requirements of the Quantitative Impact Study (QIS) of the Basel Committee on Banking Supervision and made available to the supervisory authority as part of the short term exercise. The NSFR was 130 % as of June 30, 2017.
The following table shows the financial liabilities as of June 30, 2017, and December 31, 2016, broken down into residual maturity bands:
Liabilities by residual maturity
Liabilities Payable on demand
≤ 3 months > 3 monthsand ≤ 1 year
> 1 yearand ≤ 5 years
> 5 years Total
June 30, 2017
€m
Dec. 31, 2016
€m
June 30, 2017
€m
Dec. 31, 2016
€m
June 30, 2017
€m
Dec. 31, 2016
€m
June 30, 2017
€m
Dec. 31, 2016
€m
June 30, 2017
€m
Dec. 31, 2016
€m
June 30, 2017
€m
Dec. 31, 2016
€m
Non-derivativeliabilities 69,561 67,281 42,671 43,753 21,066 21,878 14,209 15,742 12,483 14,033 159,990 162,687
Deposits from other banks 71 369 3,324 3,334 1,201 1,439 4,849 5,325 4,577 4,784 14,022 15,251
Due to customers 47,878 45,672 38,621 39,787 19,408 20,163 6,405 7,019 4,715 5,275 117,027 117,916
Debt securities in issue – – 90 72 84 103 2,540 2,611 1,095 1,094 3,809 3,880
Subordinated debt – – 71 19 373 173 415 787 2,096 2,880 2,955 3,859
Other liabilities – – 565 541 – – – – – – 565 541
Contingent liabilities from guarantees 390 379 – – – – – – – – 390 379
Revocable and irrevocable loan commitments 21,222 20,861 – – – – – – – – 21,222 20,861
Revocable loan commitments 12,863 13,095 – – – – – – – – 12,863 13,095
Irrevocable loan commitments 8,356 7,766 – – – – – – – – 8,359 7,766
Derivative liabilities – – 36 63 100 91 54 113 150 182 340 449
Hedging derivatives – – 4 7 2 – 12 16 13 18 31 41
Trading liabilities – – 32 56 98 91 42 97 137 164 309 408
Total 69,561 67,281 42,707 43,816 21,166 21,969 14,263 15,855 12,633 14,215 160,330 163,136

02INTERIM MANAGEMENT REPORT RISK REPORT
3737Interim Report as of June 30, 2017
INT
ER
IM M
AN
AG
EM
EN
T R
EP
OR
T
The contractual cash flows from on- and off-balance sheet liabilities have been assigned to the respective categories. In conformity with the requirements, the contractual cash flows of the financial liabilities are presented in accordance with the worst-case scenario, meaning that if the financial liabilities involve options or termination rights that could affect their maturity date, the most unfavorable case from a liquidity perspective is assumed. This is particularly relevant for demand deposits and savings deposits that are held at call or that have a short maturity of usually three months but that are available to the Bank for a significantly longer period of time, statistically speaking.
In contrast to the presentation of the contractual cash flows of the financial liabilities, the following overview of Postbank’s liquidity status as of June 30, 2017, presents the expected cash inflows/outflows for the coming twelve months on a cumulative basis under normal conditions, in accordance with the principles of internal liquidity manage ment:
Liquidity status of the Postbank Group as of June 30, 2017
€bn
30.0
25.0
20.0
15.0
10.0
5.0
0.0
1 2 3 6 9 12
Months
The liquidity status includes, among other things, the ex-pected values for changes in liabilities with no fixed capital commitment period, such as savings and checking account deposits, the probability that irrevocable loan commitments will be utilized, as well as loan extensions, which are based in part on estimates from the product functions and in part on observed historical data. These show that Postbank has significant liquidity surpluses across all maturity bands, which serve as liquidity buffers for stress situations and hence underscore its adequate liquidity position.
The results of the daily stress tests in the first half of 2017 also confirm Postbank’s solid liquidity position. Even after the combined stress effects in the MaRisk scenario were taken into account, comfortable surpluses existed in the net liquidity position at all times, both during and beyond the survival period. The surplus liquidity in the MaRisk scenario, which already includes the Bank’s risk appetite, also bears testimony to the comfortable liquidity position. The following graphic shows the lowest levels of surplus liquidity for each month in the period from June 30, 2016, to June 30, 2017. In the first half of 2017, surplus liquidity was always above the €5.9 billion mark.
In the event of a liquidity shock, at the level of the Postbank Group, the Liquidity Crisis Committee has clear responsibi - lity and authority over all portfolio managers at Postbank as well as at its subsidiaries and its foreign branch.
Postbank is integrated with Deutsche Bank’s liquidity risk management process.
1 Figures for June/16 until Dec./16 differ from the presentation in the 2016 Annual Report due to the consideration of an adjusted method to determine the liquidity buffer
Surplus liquidity of the Postbank Group from June 30, 2016, to June 30, 20171
€bn
10
8
6
4
2
0
June/1
6
July/
16
Aug./16
Sep./1
6
Oct./16
Nov./16
Dec./1
6
Jan./1
7
Feb./1
7
Mar
./17
Apr./17
May
/17
June/1
7
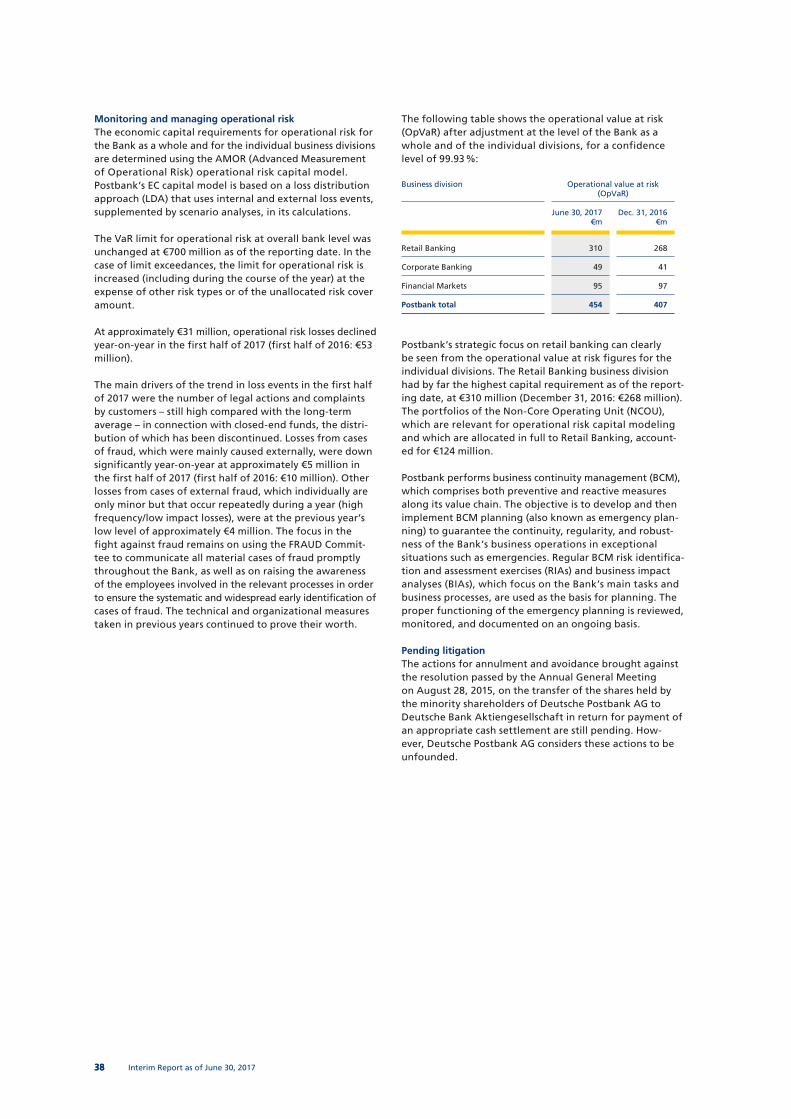
3838 Interim Report as of June 30, 2017
Monitoring and managing operational riskThe economic capital requirements for operational risk for the Bank as a whole and for the individual business divisions are determined using the AMOR (Advanced Measurement of Operational Risk) operational risk capital model. Postbank’s EC capital model is based on a loss distribution approach (LDA) that uses internal and external loss events, supplemented by scenario analyses, in its calculations.
The VaR limit for operational risk at overall bank level was unchanged at €700 million as of the reporting date. In the case of limit exceedances, the limit for operational risk is increased (including during the course of the year) at the expense of other risk types or of the unallocated risk cover amount.
At approximately €31 million, operational risk losses declined year-on-year in the first half of 2017 (first half of 2016: €53 million).
The main drivers of the trend in loss events in the first half of 2017 were the number of legal actions and complaints by customers – still high compared with the long-term average – in connection with closed-end funds, the distri-bution of which has been discontinued. Losses from cases of fraud, which were mainly caused externally, were down significantly year-on-year at approximately €5 million in the first half of 2017 (first half of 2016: €10 million). Other losses from cases of external fraud, which individually are only minor but that occur repeatedly during a year (high frequency/low impact losses), were at the previous year’s low level of approximately €4 million. The focus in the fight against fraud remains on using the FRAUD Commit-tee to communicate all material cases of fraud promptly throughout the Bank, as well as on raising the awareness of the employees involved in the relevant processes in order to ensure the systematic and widespread early identi fication of cases of fraud. The technical and organizational measures taken in previous years continued to prove their worth.
The following table shows the operational value at risk (OpVaR) after adjustment at the level of the Bank as a whole and of the individual divisions, for a confidence level of 99.93 %:
Business division Operational value at risk(OpVaR)
June 30, 2017 €m
Dec. 31, 2016 €m
Retail Banking 310 268
Corporate Banking 49 41
Financial Markets 95 97
Postbank total 454 407
Postbank’s strategic focus on retail banking can clearly be seen from the operational value at risk figures for the individual divisions. The Retail Banking business division had by far the highest capital requirement as of the report-ing date, at €310 million (December 31, 2016: €268 million). The portfolios of the Non-Core Operating Unit (NCOU), which are relevant for operational risk capital modeling and which are allocated in full to Retail Banking, account-ed for €124 million.
Postbank performs business continuity management (BCM), which comprises both preventive and reactive measures along its value chain. The objective is to develop and then implement BCM planning (also known as emergency plan - ning) to guarantee the continuity, regularity, and robust-ness of the Bank’s business operations in exceptional situations such as emergencies. Regular BCM risk identifica-tion and assessment exercises (RIAs) and business impact analyses (BIAs), which focus on the Bank’s main tasks and business processes, are used as the basis for planning. The proper functioning of the emergency planning is reviewed, monitored, and documented on an ongoing basis.
Pending litigationThe actions for annulment and avoidance brought against the resolution passed by the Annual General Meeting on August 28, 2015, on the transfer of the shares held by the minority shareholders of Deutsche Postbank AG to Deutsche Bank Aktiengesellschaft in return for payment of an appropriate cash settlement are still pending. How-ever, Deutsche Postbank AG considers these actions to be unfounded.

02INTERIM MANAGEMENT REPORT RISK REPORT OUTLOOK
3939Interim Report as of June 30, 2017
INT
ER
IM M
AN
AG
EM
EN
T R
EP
OR
T
We anticipate that the ECB will keep all key interest rates constant until the end of 2017. The central bank is also ex-pected to continue its bond buying program in a monthly volume of €60 billion until the end of the year, as an-nounced. However, we believe that the ECB will decide in the second half of the year to reduce its monthly purchase volumes to take effect in January 2018. The U.S. Federal Reserve will likely continue its cautious tightening of mon-etary policy during the remainder of the year. We antici-pate that the Fed will activate its communicated program to gradually reduce its total assets in the fall. Toward the end of the year, we expect to see another increase of 25 basis points in the federal funds rate. Although the Fed is proceeding cautiously, its sustained tightening of U.S. monetary policy in combination with increasing signs that the ECB will finally reverse its monetary policy point to a slight increase in capital market interest rates. With respect to yields on ten-year German Bunds, we anticipate a very minimal rise to 0.6 % by the end of 2017. Based on its current position, the long end of the yield curve is likely to become slightly steeper by the end of the year.
All in all, we are forecasting slightly higher yield levels at the end of 2017 than the levels forecast in our 2016 An-nual Report.
Some of the risk factors that have led to unrest on the European capital markets so far this year are no longer of concern, such as the uncertainty arising from the many parliamentary and presidential elections. The official Brex-it notification has not had a lasting effect either. A num-ber of other uncertainties are still in play, however. For instance, the outcome of the Brexit negotiations, which have meanwhile been initiated, cannot yet be predicted. The risk also remains that the U.S. will exhibit protectionist tendencies. In addition, it is extremely difficult to predict how the markets will react to the ECB announcement we anticipate that it will reduce the volume of its bond buy-ing program. Government bonds will remain fundamen-tally susceptible to setbacks given that in addition to the aforementioned factors, the economic recovery in some eurozone countries does not yet appear particularly sta-ble. Risk premiums for government bonds from the EMU periphery could widen further. On the other hand, the current levels leave very little room for further tightening.
Sector situationThe sustained low level of interest rates in the eurozone will likely continue to make it quite difficult for German banks to improve their operating business. We still do not expect a significant rise in interest rates by the end of 2017. This will make it difficult for most banks to widen their margins, especially since tough competition in the German retail and corporate banking segments continues to push down net interest income and impede increases in net fee and commission income. Low financing costs, how-ever, could have a positive effect on the equity and debt capital markets business issues as well as stimulate the mergers and acquisitions activities (M&A) of companies. This should have a positive effect on investment banking income. Due to the persistently difficult conditions on the income side, many banks are likely to have additional cost optimizations on their agendas in 2017 as well. The fact that banks are required to utilize financial resources for the implementation of new regulatory requirements will also negatively impact their income statements. In
OUTLOOK
Trends in overall economic parametersProspects for growth of the world economy improved slightly during the first half. The International Monetary Fund (IMF) now expects global economic output to grow by 3.5 % and global trade by 4.0 % in 2017 based on continued expectations of a slight increase in the upward trend in the industrialized countries. Growth rates in the emerging markets are also expected to be higher than in the previous year. However, this forecast could be put at risk by high debt levels in a number of emerging economies as well as by sustained high current account imbalances.
The economy in the United States is expected to accelerate in 2017. Private consumption and residential construction are likely to continue growing at a solid pace. Corporate investments are also anticipated to increase significantly. However, no stimulus is expected to come from fiscal policy for the remainder of the year as the tax cuts and infrastructure investments announced by the new U.S. president will at least be delayed. Foreign trade will likely put a slight brake on growth. All in all, we anticipate GDP growth to accelerate to 2.2 % in 2017.
The economic recovery in the eurozone is expected to con-tinue, albeit at a somewhat slower pace in the second half of the year. Private consumption is expected to continue to drive momentum. In addition, a significant increase is anticipated for gross capital expenditures. Growth in exports will likely pick up compared with the previous year. As the increase in imports is projected to be even greater, foreign trade as a whole will likely put a brake on growth. For the year as a whole, we anticipate constant GDP growth of 1.8 % year-on-year.
Economic outlook for GermanyEarly indicators such as the ifo Business Climate Index suggest that the economic upturn in Germany will con-tinue for the rest of the year. Domestic demand is likely to continue generating positive growth momentum. Employment and income will likely rise notably, result-ing in a significant increase in real income despite the higher inflation compared with the previous year. As a result, private consumption is expected to pick up again, albeit with somewhat less momentum. By contrast, gross capital expenditures are expected to accelerate in growth. Construction investments are also expected to provide strong momentum over the year as a whole. Exports and imports are likely to increase to a similar extent, meaning that foreign trade is unlikely to continue to put a brake on economic growth. All in all, we expect a decline in German GDP growth from 1.9 % in 2016 to 1.5 % in 2017. However, the decrease is nearly entirely attributable to the lower number of working days in the current year compared with the previous one. The sustained good economy is expected to result in a decrease in the unemployment rate from 6.1 % to 5.8 %.
We have raised our 2017 growth forecast for Germany slightly and our forecast for the EMU significantly in com-parison with the figures stated in our 2016 Annual Report. The outlook for the U.S.A. has not changed.

4040 Interim Report as of June 30, 2017
Non-financial key performance indicatorsIn light of fundamental changes in the strategic orienta-tion of Deutsche Bank that now foresee a merger of Post-bank with Deutsche Bank’s Private & Commercial Clients business, forecasts regarding employee satisfaction trends can only be made with increased uncertainty. Given the high initial values of the prior year and our previous ex-perience with at least similar conditions, we do not expect another rise in employee satisfaction.
It is still expected – given current estimates – that custom-er satisfaction in the retail customer segment will stabilize at the average level recorded for 2016.
Expected development of the earnings situationIn the remaining months of the current year, Postbank’s business with retail, business and corporate customers will remain the foundation of its earnings performance. Post-bank will continue to give great attention to monitoring costs, reducing the deposit surplus by improving the lend-ing business, and pursuing its digital transformation.
In light of expected business developments at the Post-bank Group in fiscal year 2017, as of June 30, 2017, we continue to expect profit before tax to rise markedly. Such expectations are consistent with those expressed in the Group Management Report of December 31, 2016. We likewise still foresee a moderate improvement in the cost/income ratio.
Compared with fiscal year 2016, we expect adjusted profit before tax to perform better in fiscal year 2017 than was forecast – despite the persistently challenging environ-ment. Instead of a gain in the middle two-digit euro million range we now anticipate an even higher one in the low three-digit millions.
The forecasted growth in profit leads us to anticipate a more positive development for the capital ratios despite the strategic expansion in the lending business and the resultant increase in risk-weighted assets:
For the fully phased-in Common Equity Tier 1 capital ratio we now expect a moderate rise instead of a mild decline. For the fully phased-in leverage ratio, our forecast has increased from a moderate to a noticeable improvement as of the end of 2017.
Return on tangible equity after tax should rise consid-erably above the level it reached in fiscal year 2016, in contrast to our expectations at the start of the year of a steady trend.
The forecast for net interest income has been revised from our previous anticipation of a mild gain to a moderate drop. This development can be attributed first to the per-sistence of a deposit surplus that unexpectedly high cus-tomer deposit volumes did not allow us to reduce at the intended rate as of June 30, 2017; and second to adverse effects from hedging transactions for Postbank’s forward portfolio, which grew more than was expected.
For net trading income, instead of a decrease in the one-digit million euros, we are now anticipating a rise in that same range.
addition, many banks are investing in digitizing numerous processes. While such projects admittedly tie up resources, digitization appears necessary for strengthening customer relationships and responding to new competitors in the digital world.
The decision of the UK to leave the European Union could also have a negative impact on German banks. Heightened uncertainty in conjunction with the many outstanding issues related to the EU exit will increase the risk of a growth slowdown in the UK and for important trade part-ners in continental Europe. This could cause the central banks to continue pursuing their low interest rate policies for an even longer duration. At the same time, a growth slowdown usually also reduces the potential for expanded lending while potentially increasing the risk of loan de-faults. In addition, the increase in volatility associated with the heightened uncertainty on the markets would have a negative impact on the trading business of banks.
We believe that the three-pillar structure of private, public and cooperative banks is unlikely to change in 2017. Mergers and/or acquisitions will likely take place primarily within the respective sectors and for the most part involve smaller institutions.
Legal disputes may also have a negative impact on the reputation and the business performance of German banks.
The ECB is currently analyzing the internal risk assessment models used by the banks it supervises. This targeted review of internal models (TRIM) will help to reduce major differences in internal risk assessment by individual banks in the sector. The process will take several years to com-plete, according to the ECB.
Outlook for the Postbank Group
Postbank’s investment focusesSimilar to the first six months of 2017, Postbank will con-tinue to invest in ways to improve its competitiveness in the second half of the year as well. In addition it will focus on strategic measures to improve its future viability, boost new business transacted over digital channels and enhance digital efficiency in front/back offices and central areas. Measures to expand digitization and optimize digitally supported advisory, sales and service processes will remain geared toward customer needs.
Postbank will also maintain efforts to adapt its capacities to the challenging banking environment. At the same time it will invest in a modern infrastructure with even more self-service options for private and business customers and in expansion to its network of sales centers. The an-nounced merger of Postbank with the Private & Commer-cial Clients business of Deutsche Bank also means that merger-related investments are expected in the second half of 2017, following clarification of strategic considerations.
The financial resources of our investment portfolio will also remain dedicated to preparing an efficient response to the altered regulatory requirements arising for example from the finalization, introduction and/or revision of Basel III/IV, IFRS 9, BCBS consultation document 239, TRIM, ICAAP, and ILAAP.

02INTERIM MANAGEMENT REPORT OUTLOOK
4141Interim Report as of June 30, 2017
INT
ER
IM M
AN
AG
EM
EN
T R
EP
OR
T
We are also revising our previous forecast for the allow-ance for losses on loans and advances from growth in the low two-digit million euro range to a more positive direction. The revision was made because we now assume as of June 30, 2017, that this metric will decline appreci-ably in fiscal 2017. The reasons for this new assumption are the unchanged positive macroeconomic environment and, in particular, a more positive expectation regarding achievable contributions resulting from the reversal of the allowance for losses on loans and advances. In the first half of 2017, the contributions turned out higher than our forecast as a result of an adjusting event relating to assumed loan collateral.
The planned merger of Postbank with Deutsche Bank’s Private & Commercial Clients business and measures to be undertaken for the purpose of generating synergies may cause short and mid-term negative effects that are not reflected in this forecast.

4242 Interim Report as of June 30, 2017
CONSOLIDATED STATEMENT OF COMPREHENSIVE INCOME FOR THE PERIOD JANUARY 1 TO JUNE 30, 2017
Consolidated Income Statement Note Jan. 1– June 30, 2017 €m
Jan. 1– June 30, 20161 €m
Interest income (4) 1,798 1,996
Positive interest on financial liabilities (4) 22 13
Interest expense (4) – 755 – 891
Negative interest on financial assets (4) – 38 – 23
Net interest income (4) 1,027 1,095
Allowance for losses on loans and advances (5) – 12 – 76
Net interest income after allowance for losses on loans and advances 1,015 1,019
Fee and commission income (6) 596 548
Fee and commission expense (6) – 109 – 129
Net fee and commission income (6) 487 419
Net trading income (7) 52 9
Net income from investment securities (8) 58 174
Administrative expenses (9) – 1,338 – 1,418
Other income (10) 57 52
Other expenses (11) – 15 – 90
Profit before tax 316 165
Income tax – 15 – 25
Consolidated net profit 301 140
Jan. 1– June 30, 2017 €m
Jan. 1– June 30, 20162 €m
Basic/diluted earnings per share (€)2 1.38 0.64
1Figures adjusted (see Note 2)2The earnings per share are based on 218.8 million shares in both reporting periods.

03INTERIM FINANCIAL STATEMENTS CONSOLIDATED STATEMENT OF COMPREHENSIVE INCOME
4343Interim Report as of June 30, 2017
INT
ER
IM F
INA
NC
IAL
STA
TE
ME
NT
S
Other comprehensive income Jan. 1 – June 30, 2017 €m
Jan. 1 – June 30, 20161 €m
Profit from ordinary activities after tax 301 140
Other comprehensive income after tax – 81 – 9
Items that will not be reclassified to profit or loss – 16 – 93
Remeasurement gains/losses (–) on defined benefit plans – 16 – 93
Income tax on items not reclassified to profit or loss 1 12
Items that will be/may be reclassified to profit or loss, before tax – 66 72
Change in revaluation reserve – 66 72
Unrealized gains/losses (–) for the period, before tax – 70 152
Gains (–)/losses reclassified to profit or loss, before tax 4 – 80
Total comprehensive income 220 131
1Figures adjusted (see Note 2)

4444 Interim Report as of June 30, 2017
CONSOLIDATED INCOME STATEMENT – QUARTERLY OVERVIEW
2017 20161
Q2 €m
Q1 €m
Q4 €m
Q3 €m
Q2 €m
Q1 €m
Interest income 897 901 975 956 1,004 992
Positive interest on financial liabilities 11 11 8 8 7 6
Interest expense – 369 – 386 – 434 – 408 – 455 – 436
Negative interest on financial assets – 18 – 20 – 16 – 15 – 13 – 10
Net interest income 521 506 533 541 543 552
Allowance for losses on loans and advances 21 – 33 – 63 – 45 – 35 – 41
Net interest income after allowance for losses on loans and advances 542 473 470 496 508 511
Fee and commission income 291 305 288 263 266 282
Fee and commission expense – 53 – 56 – 62 – 65 – 63 – 66
Net fee and commission income 238 249 226 198 203 216
Net trading income 41 11 30 11 0 9
Net income from investment securities 19 39 66 18 130 44
Administrative expenses – 664 – 674 – 751 – 684 – 711 – 707
Other income 30 27 69 20 23 29
Other expenses – 14 – 1 – 15 – 12 – 63 – 27
Profit before tax 192 124 95 47 90 75
Income tax – 9 – 6 44 – 9 – 16 – 9
Consolidated net profit 183 118 139 38 74 66
Basic/undiluted earnings per share (€) 0.84 0.54 0.64 0.17 0.34 0.30
12016 quarters adjusted (see Note 2)

4545Interim Report as of June 30, 2017
03INTERIM FINANCIAL STATEMENTS CONSOLIDATED INCOME STATEMENT – QUARTERLY OVERVIEW
OTHER COMPREHENSIVE INCOME – QUARTERLY OVERVIEW
INT
ER
IM F
INA
NC
IAL
STA
TE
ME
NT
S
OTHER COMPREHENSIVE INCOME – QUARTERLY OVERVIEW
2017 2016
Q2 €m
Q1 €m
Q4 €m
Q3 €m
Q2 €m
Q1 €m
Profit from ordinary activities after tax 183 118 139 38 74 66
Other comprehensive income after tax 40 – 121 – 125 – 24 – 79 70
Items that will not be reclassified to profit or loss 50 – 66 – 39 – 93 – 60 – 33
Remeasurement gains/losses (–) on defined benefit plans 50 – 66 – 39 – 93 – 60 – 33
Income tax on items not reclassified to profit or loss – 3 4 19 4 2 10
Items that will be/may be reclassified to profit or loss, before tax – 7 – 59 – 106 65 – 21 93
Change in revaluation reserve – 7 – 59 – 106 65 – 21 93
Unrealized gains/losses (–) for the period, before tax – 22 – 48 – 121 32 61 91
Gains (–)/losses reclassified to profit or loss, before tax 15 – 11 15 33 – 82 2
Income tax on items that will be/may be reclassified to profit or loss 0 0 1 0 0 0
Total comprehensive income 223 – 3 14 14 – 5 136

4646 Interim Report as of June 30, 2017
Assets Note June 30, 2017 €m
Dec. 31, 2016
€m
Cash reserve 1,604 2,291
Loans and advances to other banks (12) 11,887 13,108
Loans and advances to customers (13) 103,799 102,003
Allowance for losses on loans and advances (14) – 922 – 998
Trading assets (15) 390 475
Hedging derivatives 69 112
Investment securities (16) 24,504 26,767
thereof transferred as collateral (16) 2,580 2,918
Intangible assets (17) 1,984 1,963
Property and equipment (18) 709 699
Current tax assets 110 144
Deferred tax assets 186 198
Other assets (19) 495 388
Assets held for sale (20) 14 47
Total assets 144,829 147,197
Equity and Liabilities Note June 30, 2017 €m
Dec. 31, 2016
€m
Deposits from other banks (21) 12,368 13,133
Due to customers (22) 118,051 118,918
Debt securities in issue (23) 3,289 3,339
Trading liabilities (24) 309 409
Hedging derivatives 31 42
Provisions (25) 800 907
a) Provisions for pensions and other employee benefits 255 254
b) Other provisions 545 653
Current tax liabilities 80 98
Deferred tax liabilities 4 17
Other liabilities (26) 565 541
Subordinated debt (27) 1,963 2,567
Equity 7,369 7,226
a) Issued capital 547 547
b) Share premium 2,191 2,191
c) Retained earnings 4,330 4,171
d) Consolidated net profit 301 317
Total equity and liabilities 144,829 147,197
CONSOLIDATED BALANCE SHEET AS OF JUNE 30, 2017

03INTERIM FINANCIAL STATEMENTS CONSOLIDATED BALANCE SHEET STATEMENT OF CHANGES IN EQUITY
4747Interim Report as of June 30, 2017
INT
ER
IM F
INA
NC
IAL
STA
TE
ME
NT
S
STATEMENT OF CHANGES IN EQUITY
Issuedcapital
€m
Share premium
€m
Retained earnings
€m
Reva-luation reserve
€m
Consoli-dated
net profit
€m
Equity before
non-con-trolling
interests €m
Non-con-trolling
interests
€m
Total
€m
Balance at Jan. 1, 2016 547 2,010 3,664 327 610 7,158 6 7,164
Changes in retained earnings – – 610 – – 610 – – –
Initial consolidation effect – service companies – – – 263 – – – 263 – – 263
Capital increase – 181 – – – 181 – 181
Profit from ordinary activities after tax Jan. 1 – June 30, 2016 – – – – 140 140 – 140
Other comprehensive income – – – 81 72 – – 9 – – 9
Treasury shares – – – – – – – –
Other changes – – – 125 – – – 125 – – 125
Balance at June 30, 2016 547 2,191 3,8051 399 1404 7,082 6 7,0881
Profit from ordinary activities after tax July 1 – Dec. 31, 2016 – – – – 177 177 – 177
Other comprehensive income – – – 109 – 40 – – 149 – – 149
Treasury shares – – – – – – – –
Other changes – – 116 – – 116 – 116
Change in recognition fornon-controlling interests (debt instruments) – – – – – – – 65 – 6
Balance at Dec. 31, 2016 547 2,191 3,812 3592 317 7,226 – 7,226
Changes in retained earnings – – 317 – – 317 – – –
Capital increase – – – – – – – –
Profit from ordinary activities after tax Jan. 1 – June 30, 2017 – – – – 301 301 – 301
Other comprehensive income – – – 15 – 66 – – 81 – – 81
Treasury shares – – – – – – – –
Other changes – – – 77 – – – 77 – – 77
Balance at June 30, 2017 547 2,191 4,037 2933 301 7,369 – 7,369
1Figures adjusted (see consolidated financial statements as of December 31, 2016)2 Of this prior-year figure, €14 million related to an investment held for sale.3 Of this figure, €14 million relates to two investments held for sale (see Note 20).4 Figures adjusted (see Note 2)5 In the previous year, Postbank decided to present non-controlling interests (debt instruments) under other liabilities rather than under equity in accordance with the applicable accounting standards.
The “Other changes” item comprises the effects of the control and profit and loss transfer agreement with DB Finanz-Holding GmbH for 2016 and DB Beteiligungs-Holding GmbH for 2017.

4848 Interim Report as of June 30, 2017
CONDENSED CASH FLOW STATEMENT
Jan. 1 – June 30, 2017€m
Jan. 1 – June 30, 2016€m
Cash and cash equivalents at start of period 2,291 1,357
Net cash used in/from operating activities – 2,078 145
Net cash from investing activities 1,917 441
Net cash used in financing activities – 526 – 824
Cash and cash equivalents at end of period 1,604 1,119
Reported cash and cash equivalents correspond to the cash reserve.

03INTERIM FINANCIAL STATEMENTS CONDENSED CASH FLOW STATEMENT NOTES
4949Interim Report as of June 30, 2017
INT
ER
IM F
INA
NC
IAL
STA
TE
ME
NT
S
NOTES TO THE INTERIM FINANCIAL STATEMENTS
BASIS OF PREPARATION
In a merger agreement dated April 19, 2017, DB Finanz-Holding GmbH transferred its assets and liabilities as a whole with all rights and obligations by dissolution without liquidation to DB Beteiligungs-Holding GmbH. The merger entered into effect upon entry in the commercial register on April 27, 2017.
As a result, DB Finanz-Holding GmbH has been dissolved upon entry of the above-mentioned merger and thus no
longer holds interests in the share capital of Deutsche Postbank AG. DB Beteiligungs-Holding GmbH as the legal successor to DB Finanz-Holding GmbH now holds a direct majority stake in the share capital of Deutsche Postbank AG instead of an indirect one.
The control and profit and loss transfer agreement now exists between Deutsche Postbank AG, as the dependent company, and DB Beteiligungs-Holding GmbH.
Segment reporting by business division
Retail Banking
Corporate Banking Financial Markets
Non-Core Operating Unit
Cost Centers Total
Jan. 1 –June 30,
2017€m
Jan. 1 –June 30,
20161
€m
Jan. 1 –June 30,
2017€m
Jan. 1 –June 30,
20161
€m
Jan. 1 –June 30,
2017€m
Jan. 1 –June 30,
20161
€m
Jan. 1 –June 30,
2017€m
Jan. 1 –June 30,
20161
€m
Jan. 1 –June 30,
2017€m
Jan. 1 –June 30,
20161
€m
Jan. 1 –June 30,
2017€m
Jan. 1 –June 30,
2016€m
Net interest income 1,065 1,133 178 171 – 54 – 32 – 162 – 181 0 4 1,027 1,095
Net trading income 30 3 – 1 7 23 – 1 0 0 0 0 52 9
Net income from invest ment securities 0 90 0 0 58 61 0 9 0 14 58 174
Net fee and commission income 381 320 66 63 – 12 – 12 0 0 52 48 487 419
Total income 1,476 1,546 243 241 15 16 – 162 – 172 52 66 1,624 1,697
Administrative expenses – 591 – 621 – 53 – 50 – 4 – 4 – 5 – 6 – 685 – 737 – 1,338 – 1,418
Allowance for losses on loans and advances – 55 – 49 46 – 22 0 0 – 3 – 5 0 0 – 12 – 76
Other income 18 7 1 1 0 0 0 1 38 43 57 52
Other expenses – 10 – 52 0 – 1 0 0 3 – 6 – 8 – 31 – 15 – 90
Allocations – 489 – 542 – 66 – 65 – 30 – 43 – 18 – 23 603 673 0 0
thereof income 69 83 10 13 11 1 0 0 – 90 – 97 0 0
thereof expenses – 558 – 625 – 76 – 78 – 41 – 44 – 18 – 23 693 770 0 0
Profit/loss before tax 349 289 171 104 – 19 – 31 – 185 – 211 0 14 316 165
Revenues from external customers2 1,476 1,546 243 241 15 16 – 162 – 172 52 66 1,624 1,697
Intersegmental revenues2 0 0 0 0 0 0 0 0 0 0 0 0
Impairment losses – 10 – 9 – 1 – 1 0 0 0 0 – 37 – 39 – 48 – 49
Reversal of impaiment losses 0 0 0 0 0 0 0 0 0 0 0 0
Depreciationand amortization – 10 – 9 – 1 – 1 0 0 0 0 – 37 – 39 – 48 – 49
Cost/income ratio (CIR)3 74.2% 79.3% 50.9% 50.3% 170.4% 312.2% – 12.5% – 20.3% – – 80.5% 86.2%
Return on equity before taxes (RoE) 20.7% 16.7% 46.2% 39.7% – 2.0% – 4.0% – 28.7% – 28.5% – – 8.7% 4.7%
1 Figures adjusted (see explanation in this Note) 2 The “Revenues from external customers” item is the net amount of the external portions of the interest income, interest expense, fee and commission income, fee and commission expense, net income from investment securities and net trading income items. Intersegmental revenues have been eliminated due to a methodological improvement (see the explanations in this Note).
3 For the segments the metric was calculated using exact amounts which come from the management information system. When rounded figures are used for calculation this might lead to minor differences.
(1) Segment reporting

5050 Interim Report as of June 30, 2017
The Postbank Group manages its activities on the basis of a management information system whose core component is management accounting by business division. The busi-ness divisions correspond to the Group’s organizational structure.
Accounting by business division was impacted by the follow-ing changes and special issues in the first half of 2017: • The adjustments made to prior-year figures (see Note 2)
in the reporting period were included in segment report-ing. In Retail Banking this resulted in a decrease of €82 million in net interest income for the first half of 2016. Fee and commission income rose by €21 million, while administrative expenses declined by €66 million. Net interest income decreased by €2 million in the Non-Core Operating Unit (NCOU) segment and by €4 million in the Financial Markets segment.
• In addition, net present value losses from premature loan terminations were allocated to the segments based on cause, in line with the revised method. The prior-year figures were also adjusted to ensure comparability of reporting over time. The change had a positive impact on net interest income in the Financial Markets busi-ness division for the first half of 2016 (€30 million) but a negative impact on the Retail Banking (€28 million) and Corporate Banking (€2 million) segments.
• In addition, the method used to allocate components of earnings to the individual segments was refined:
• Prioritization of functional allocation by board depart-ment over segment allocation as in the past. In particular, costs incurred by the infrastructure functions of sub - sidiaries that, depending on the core business of the company, could previously also be allocated to the Retail Banking, Corporate Banking and Financial Markets segments, are now allocated to the Cost Centers segment together with the other infrastructure functions of the Postbank Group.
• Presentation of the external impact of a transaction in the segment concerned. In the past, this was presented at segment level including the intragroup earnings components and by eliminating these earnings in the Cost Centers segment. This means that intersegmental income is no longer disclosed.
• Overall, the methodological change led to the following adjustments to the segment figures for the prior-year period:
• Net interest income declined by €4 million in the Retail Banking segment and €1 million in the Cost Centers segment. Net interest income rose by €2 million in the Corporate Banking segment, €2 million in the Financial Markets segment, and €1 million in the NCOU segment.
• Net trading income generated by the Financial Markets segment decreased by €2 million and increased by the same amount in the Cost Centers segment.
• Net fee and commission income in the Retail Banking segment declined by €26 million, while the figures for the Financial Markets and Cost Centers segments rose by €1 million and €25 million, respectively.
• Administrative expenses decreased by €85 million in the Retail Banking segment and €11 million in the Financial Markets segment, and increased by €2 million in the Corporate Banking segment and €94 million in the Cost Centers segment.
• Other income improved by €11 million in the Cost Centers segment and declined by the same amount in the Retail Banking segment.
• Other expenses in the Retail Banking and Financial Markets segments decreased by €56 million and €1 million, respectively. This line item rose by €1 million in the Corporate Banking segment and €56 million in the Cost Centers segment.
• Allocations rose by €115 million in the Retail Banking segment and €15 million in the Financial Markets segment, and declined by €15 million in the Corporate Banking segment, €2 million in the Non-Core Operating Unit segment and €113 million in the Cost Centers segment.
• Overall, profit before tax increased by €14 million in the Corporate Banking segment and €3 million in the Non-Core Operating Unit segment. Profit before tax decreased by €15 million in the Retail Banking seg-ment and €2 million in the Financial Markets segment.
In the Retail Banking business division, Postbank offers a broad spectrum of postal, banking and financial services. This encompasses checking and savings products, credit and debit cards, mortgage lending, installment loans, the home savings business, securities and securities accounts, and investment funds. Income from brokerage activities is also reported in this segment.
The segment result comprises the results of business with Deutsche Postbank AG’s retail customers, BHW Bau-sparkasse AG’s domestic retail banking business, as well as the customer business of other subsidiaries, in particular BHW Holding AG, Postbank Filialvertrieb AG, Postbank Finanzberatung AG, Postbank Immobilien GmbH, BHW Gesellschaft für Wohnungswirtschaft GmbH, and Postbank Direkt GmbH. In addition, the result of the projected effects of purchase price allocation from the acquisition of BHW Bausparkasse AG has been allocated to the Retail Banking segment.
Postbank’s Corporate Banking business division provides payment transaction services for business and corporate customers. Commercial finance, especially regarding real estate, constitutes the second important pillar of the corporate banking business in national and international terms. Factoring and leasing is another business area of the division. In addition, the investment banking and other lending business with business and corporate customers is reported in this segment.
The segment result comprises the results of services for business and corporate customers of PB Firmenkunden AG,

03INTERIM FINANCIAL STATEMENTS NOTES
5151Interim Report as of June 30, 2017
INT
ER
IM F
INA
NC
IAL
STA
TE
ME
NT
S
Reversals of impairment losses and impairment losses relate to intangible assets and property and equipment. Both amortization/depreciation and impairments are taken into account.
Equity is allocated to the segments according to their risk capital requirements. Risk capital requirements are derived from Postbank’s risk cover amount and define the extent of the permitted exposures to market risk, credit risk, opera-tional risk, business risk, investment and real estate risk, and collective risk. The average IFRS equity is allocated to the segments according to their respective responsibility for the risk capital positions within the individual risk types.
Company-level disclosuresThe following table contains information about income per product or service:
Jan. 1 – June 30,
2017 €m
Jan. 1 – June 30,
20161 €m
Deposits and loans for Retail and Corporate Banking customers 1,280 1,346
Payment transaction services for Retail and Corporate Banking customers 230 181
Retail and Corporate Banking fee and commission income 169 162
Transaction Banking insourcing 38 39
Other – 93 – 31
Total 1,624 1,697
1Figures adjusted (see explanation in this Note)
The total comprises the Postbank Group’s net interest income, net fee and commission income, net trading income, and net income from investment securities. Net fee and commission income of the subsidiaries attributable to the Corporate Banking segment are reported under the “Deposits and loans for Retail and Corporate Banking cus-tomers” item. The “Other” item includes the Group’s net trading income and net income from investment securities, among other things. The income for the NCOU and Finan-cial Markets segments is reported under the “Other” item.
The results of the geographical areas are calculated using the profit and loss as reported in the income statements of the legal entities and branches attributable to the areas.
The Europe region contains the Luxembourg entities PB International S.A., the Luxembourg branch, Deutsche Postbank Finance Center Objekt GmbH, plus the branches of BHW in Italy and Luxembourg. The Germany region comprises all domestic business including all consolidation adjustments. The U.S.A. region comprises Deutsche Postbank Funding LLC I–IV and Deutsche Postbank Fund-ing Trust I–IV subsidiaries, Wilmington, Delaware.
Postbank Leasing GmbH, PB Factoring GmbH, transactions with Deutsche Postbank AG’s business and corporate customers (excluding selected individual exposures in com-mercial real estate finance), and a portion of the results of the Luxembourg branch.
The results of the Group’s Financial Markets transactions (banking and trading books) and of the subpools of assets of PB Spezial-Investmentaktiengesellschaft have been as-signed to the Financial Markets business division.
The segment result comprises the banking and trading books of Deutsche Postbank AG and BHW Bausparkasse AG, as well as the profit/loss of the PB International S.A. sub sidiary and the Luxembourg branch (excluding the corporate banking business), as well as the profit/loss of the subpools of assets, Deutsche Postbank Funding Trust I, Deutsche Postbank Funding Trust II, Deutsche Postbank Funding Trust III, Deutsche Postbank Funding Trust IV, Deutsche Postbank Funding LLC I, Deutsche Postbank Funding LLC II, Deutsche Postbank Funding LLC III, and Deutsche Postbank Funding LLC IV.
The NCOU business division comprises portfolios and activi-ties that are no longer part of the Bank’s core business in line with the Bank’s current strategy. Besides further increase in transparency, the main goals of the segment are to con-tinue reducing the risks and the risk-weighted assets.
The segment result comprises investment securities from issuers of GIIPS countries, some international commercial real estate finance transactions and selected corporate customer loans, certain foreign retail business transactions, and selected retail products that have been discontinued. In addition, certain secured and unsecured issues are allo-cated to the segment.
The Cost Centers segment includes results of the infra-structure functions of Deutsche Postbank AG, BHW Bau - sparkasse AG, BHW Holding AG, PB Firmenkunden AG, Deutsche Postbank AG’s Luxembourg branch, Postbank Direkt GmbH, Postbank Filialvertrieb AG, Postbank Finanzberatung AG, and Postbank Immobilien GmbH. The segment also includes the profit/loss of the subsidi-aries allocated to cost centers, namely Postbank Systems AG, Postbank Immobilien und Baumanagement GmbH, Postbank Immobilien und Baumanagement GmbH & Co. Objekt Leipzig KG, Deutsche Postbank Finance Center Objekt GmbH, DSL Portfolio GmbH & Co. KG, DSL Portfolio Verwaltungs GmbH, Postbank Service GmbH, BHW Kredit-service GmbH, Betriebs-Center für Banken AG, VÖB-ZVD Processing GmbH, and Postbank Beteiligungen GmbH.
In addition to the profit/loss in the income statement of the business units allocated to the business divisions, imputation procedures are applied to ensure correct allo-cation of the segment profit/loss to their originators. In accordance with IFRS 8.23, we report net interest income (net interest revenue) instead of interest income and interest expense. The allocation of net interest income from customer products to the segments uses the market rate method, under which the customer interest rate is compared with imputed money and capital market rates for matching terms. The administrative expenses and other expenses of the units included in the segment results are primarily based on the results of cost center account-ing. Income taxes are not calculated at segment level.

5252 Interim Report as of June 30, 2017
Income
Profit before tax
Non-currentassets
Jan. 1 – June 30,
2017 €m
Jan. 1 – June 30,
20161 €m
Jan. 1 – June 30,
2017 €m
Jan. 1 – June 30,
20161 €m
June 30, 2017
€m
Dec. 31, 2016
€m
Germany 1,593 1,661 301 148 2,677 2,645
Europe 31 36 15 17 16 17
U.S.A. 0 0 0 0 0 0
Total 1,624 1,697 316 165 2,693 2,662
1Figures adjusted (see explanation in this Note)
Non-current assets comprise intangible assets and property and equipment.
(2) Basis of accountingThe condensed interim financial statements were prepared in accordance with the International Financial Reporting Standards (IFRSs), as adopted by the EU, and the additional requirements of German commercial law under section 315e(1) of the Handelsgesetzbuch (HGB – German Commer-cial Code), insofar as these were applicable at the balance sheet date. In particular, the interim financial statements comply with the International Accounting Standard (IAS) 34 requirements for interim financial reports. In accord-ance with section 37w of the Wertpapierhandelsgesetz (WpHG – German Securities Trading Act), Postbank pre-pares a half-yearly financial report, which also comprises an interim management report in addition to the con-densed financial statements presented here. There were no significant events after the balance sheet date that were not included in the interim financial statements.
All assumptions, estimates, and assessments required for recognition and measurement in accordance with the IFRSs are in conformity with the respective standards, are regu-larly reassessed, and are based on past experience as well as other factors, including expectations as to future events that appear reasonable under the given circumstances. The assumptions and estimates refer primarily to the fair value measurement of certain financial instruments, including the assessment of whether an active or inactive market exists, the recognition and measurement of the allowance for losses on loans and advances, of intangible assets and of provisions, and the ability to realize deferred taxes. When determining the intention to hold financial instruments, business strategy and current market conditions are also taken into account.
Derivatives are entered into primarily as microhedges (fair value hedges) to hedge interest rate risk. Postbank also uses portfolio fair value hedges in accordance with IAS 39 to hedge interest rate risk arising from loans and advances to customers at portfolio level.
If there are no effective microhedges, the changes in value of the derivatives are reported in net trading income, regardless of whether risk management was successful or not from an economic perspective. New swaps are entered into as hedging instruments for microhedges and existing hedges are unwound and settled as part of active man-agement of the fixed-rate position in the overall bank balance sheet. The review of the fixed-rate position and
the decision to enter into or unwind and settle micro-hedges are based on economic factors. The unwinding of microswaps is accounted for in the balance sheet and in net profit or loss for the period in the same way as for inef-fective hedges. Effectiveness tests – and hence measurement in profit or loss – are performed at the end of the month.
The same accounting policies used in preparing the consoli- dated financial statements for the year ended December 31, 2016 were applied in preparing the condensed interim financial statements for the period ended June 30, 2017.
The adjustments made as of December 31, 2016 to the treatment of commissions paid for the brokerage of mort-gages and installment loans and expenses for property value appraisals as well as the amended treatment of com - mitment interest received from mortgage lending (see Note 6 to the consolidated financial statements as of December 31, 2016) have required the retrospective adjust-ment of prior-year comparative figures. The retrospective application resulted in a reduction of €88 million in interest income, of €21 million in fee and commission expense, and of €66 million in administrative expenses for the first half of 2016. Consolidated profit for the period declined by €1 million, while earnings per share remained unchanged.
Changes resulting from material accounting standards applicable as from January 1, 2018
IFRS 9IFRS 9 “Financial Instruments” replaces IAS 39 “Financial Instruments: Recognition and Measurement”; it comprises updated requirements on the classification and measure-ment of financial instruments, impairment, and general hedge accounting (not including macrohedge accounting). In addition, it adds to the disclosures required on financial instruments.
Financial instruments are classified in accordance with the two criteria of “business model” and “solely payments of principal and interest” (SPPI). Under the “business model” criterion, the different financial instruments are allocated at the portfolio level to the company-specific “business models”, “hold” or “hold and sell.” Under the cash flow characteristics (SPPI) criterion, the characteristics of the cash flows of the respective financial instrument are analyzed and measured in accordance with the new rules of IFRS 9. How these two criteria are interpreted determines whether the instruments are initially and sub-sequently accounted for at amortized cost or at fair value (either recognized in profit and loss or directly in equity).
Postbank has determined the existing business models at portfolio level and analyzed the respective contractual cash flow criteria. On the basis of current assumptions, the analysis shows that there will be reclassifications of individual financial instruments between the fair value through profit or loss, fair value through other compre-hensive income, and amortized cost categories. However, the exact impact the initial application of the new IFRS 9 will have, will depend on the business models and charac-teristics of the respective financial assets at the time of initial application.

03INTERIM FINANCIAL STATEMENTS NOTES
5353Interim Report as of June 30, 2017
INT
ER
IM F
INA
NC
IAL
STA
TE
ME
NT
S
published “Clarifications to IFRS 15 – Revenue from Contract with Customers” in April 2016. This document contains clarifications on the identification of performance obligations, principal versus agent relations, licensing agreements, and transitional provisions for modified and completed contracts. Application is likewise mandatory.
At Postbank, IFRS 15 applies in particular to the fees and charges reported under “Fee and commission income” in the Bank’s income statement. The introduction of the standard is not expected to have any significant qualitative effects on the presentation of Postbank’s net assets, finan-cial position, and results of operations. The effects of the new provisions governing the recognition of income are currently in the final stages of review as part of a project to implement IFRS 15. Based on the information gathered so far, the Bank expects the effects to be minor.
IFRS 15 takes effect for fiscal years beginning on or after January 1, 2018. The standard was translated into European law by Commission Regulation 2016/1905 of September 22, 2016. The clarifications to IFRS 15 must be applied together with IFRS 15. However, these have not yet been endorsed by the EU. Postbank has decided to exercise the option for the initial application method, which allows it not to restate comparative periods in accordance with IFRS 15 for the periods prior to initial application.
(3) Basis of consolidation In addition to the parent company Deutsche Postbank AG, 31 (December 31, 2016: 32) subsidiaries that are presented in the following overview are included in the condensed consolidated financial statements as of June 30, 2017.
With regard to impairment, the previous incurred loss impairment model has been replaced by an expected credit loss model, which allows default risk to be accounted for in a more timely manner. These regulations will apply in future to assets carried at amortized cost and assets carried at fair value through other comprehensive income. Ceteris paribus, Postbank is anticipating an increase in the allow-ance for losses on loans and advances, mainly due to the switch to a 12-month or lifetime ECL, as a result of the new rules on impairment.
The new rules of IFRS 9 on general hedge accounting are intended to achieve a stronger correlation between accounting treatment and internal risk management. How-ever, IFRS 9 does offer an accounting option to postpone the application of the IFRS 9 hedge accounting rules and continue to use the rules of IAS 39. Postbank has decided to exercise this accounting option to continue the applica-tion of the rules of IAS 39. The new disclosures on hedge relationships required to be provided in the notes will be taken into account and implemented in this context.
Recognized capital is expected to be negatively impacted by an amount in the mid three-digit million range as a result of the introduction of IFRS 9. This effect is attribut-able firstly to the new classification requirements and the resulting shift between the fair value through profit or loss, fair value through other comprehensive income, and amortized cost categories. Secondly, a large part of the decrease in capital is attributable to the increase in the allowance for losses on loans and advances. Moreover, when applying IFRS 9 for the first time, Postbank will opt retrospectively not to apply the IAS 39 fair value option to the mortgage loan portfolio, and this will also have a negative impact on capital. The expected effect of initial application of IFRS 9 may differ from the current estimate, since material assumptions relating for example to a signi-ficant deterioration in the credit rating have not yet been finalized, the development of the models to calculate the allowance for losses on loans and advances is not yet complete, and changes in business volumes or in macro-economic conditions could have an effect.
IFRS 9 takes effect for fiscal years beginning on or after January 1, 2018. The standard was translated into Euro-pean law by Commission Regulation 2016/2067 of Novem-ber 22, 2016. Postbank has decided to exercise the option for the initial application method, which allows it not to restate comparative periods in accordance with IFRS 9 for the periods prior to initial application.
IFRS 15IFRS 15 is a new standard on revenue recognition, which brings together the numerous requirements previously contained in various standards and interpretations in a single standard and provides a set of uniform principles that are applicable for all sectors and categories of revenue transactions. Under IFRS 15, the amount of the considera-tion to which the entity expects to be entitled, in exchange for transferring goods or services to a customer, must be recognized as revenue. It also expands the notes disclo-sures required on revenue from contracts with customers.
As a general rule, the standard applies to all contracts with customers that agree on the sale of goods and services from the company’s normal business activities. The IASB

5454 Interim Report as of June 30, 2017
Consolidated companies
Name and domicile Equity (%) interest direct
Equity (%) interest indirect
Betriebs-Center für Banken AG, Frankfurt am Main 100.0
BHW Holding AG, Hameln 100.0
BHW Kreditservice GmbH, Hameln 100.0
Deutsche Postbank Funding LLC I, Wilmington, Delaware, U.S.A. 100.0
Deutsche Postbank Funding LLC II, Wilmington, Delaware, U.S.A. 100.0
Deutsche Postbank Funding LLC III, Wilmington, Delaware, U.S.A. 100.0
Deutsche Postbank Funding LLC IV, Wilmington, Delaware, U.S.A. 100.0
Deutsche Postbank Funding Trust I, Wilmington, Delaware, U.S.A. 100.0
Deutsche Postbank Funding Trust II, Wilmington, Delaware, U.S.A. 100.0
Deutsche Postbank Funding Trust III, Wilmington, Delaware, U.S.A. 100.0
Deutsche Postbank Funding Trust IV, Wilmington, Delaware, U.S.A. 100.0
DSL Portfolio GmbH & Co. KG, Bonn 100.0
DSL Portfolio Verwaltungs GmbH, Bonn 100.0
PB Factoring GmbH, Bonn 100.0
PB International S.A., Munsbach, Luxembourg 100.0
PB Spezial-Investmentaktiengesellschaft mit Teilgesellschaftsvermögen, Bonn 100.0
Postbank Beteiligungen GmbH, Bonn 100.0
Postbank Direkt GmbH, Bonn 100.0
Postbank Filialvertrieb AG, Bonn 100.0
Postbank Immobilien und Baumanagement GmbH, Bonn 100.0
Postbank Leasing GmbH, Bonn 100.0
Postbank Service GmbH, Essen 100.0
Postbank Systems AG, Bonn 100.0
BHW Bausparkasse Aktiengesellschaft, Hameln 100.0
BHW - Gesellschaft für Wohnungswirtschaft mbH, Hameln 100.0
Deutsche Postbank Finance Center Objekt GmbH, Munsbach, Luxembourg 100.0
PB Firmenkunden AG, Bonn 100.0
Postbank Immobilien GmbH, Hameln 100.0
Postbank Finanzberatung AG, Hameln 23.3 76.7
Postbank Immobilien und Baumanagement GmbH & Co. Objekt Leipzig KG, Bonn 90.0
VÖB-ZVD Processing GmbH, Frankfurt am Main 75.01
1 25 % of the share capital of VÖB-ZVD Processing GmbH is held in trust by Bundesverband Öffentlicher Banken Deutschlands e.V. (VÖB) on behalf of the Bank.
In accordance with IFRS 10, eight subpools of assets are included in the consolidation basis (December 31, 2016: eight). All of the subpools of assets are structured entities in accordance with IFRS 12.
On March 22, 2017, upon entry in the commercial register, BHW Gesellschaft für Vorsorge GmbH was merged with BHW Gesellschaft für Wohnungswirtschaft mbH, with retroactive effect as of January 1, 2017.
There were no other changes in the basis of consolidation in the reporting period as against December 31, 2016.

03INTERIM FINANCIAL STATEMENTS NOTES
5555Interim Report as of June 30, 2017
INT
ER
IM F
INA
NC
IAL
STA
TE
ME
NT
S
Net gains/losses on hedges are composed of the following items:
Jan. 1 – June 30,
2017€m
Jan. 1 – June 30,
2016€m
Gains/losses on the fair value remeasurement of hedged items – 56 227
Gains/losses on the fair value remeasurement of hedging instruments 48 – 227
Total – 8 0
(5) Allowance for losses on loans and advances
Jan. 1 – June 30,
2017€m
Jan. 1 – June 30,
2016€m
Cost of additions to allowance for losses on loans and advances
Specific valuation allowances 175 183
Portfolio-based valuation allowances 67 87
Cost of additions to provisions for credit risks 8 10
Direct loan write-offs 15 12
Income from reversals of the allowance for losses on loans and advances
Specific valuation allowances 140 97
Portfolio-based valuation allowances 80 88
Income from the reversal of provisionsfor credit risks 21 17
Recoveries on loans previously written off 12 14
Total 12 76
€25 million (previous year: €83 million) of the allowance for losses on loans and advances relates to receivables classified as loans and receivables. The allowance for losses on loans and advances for guarantees, warranties, and irrevocable loan commitments was reduced by €13 million (net) due to reversals (previous year: €7 million).
The cost of additions to and the income from reversals of the allowance for losses on loans and advances to customers can be broken down by product group as follows:
INCOME STATEMENT DISCLOSURES
(4) Net interest income
Jan. 1 – June 30,
2017€m
Jan. 1 – June 30,
20161
€m
Interest and current income
Interest income from:
Lending and money market transactions 1,614 1,746
Fixed-income and book-entry securities 191 246
Net gains/losses on hedges – 8 0
1,797 1,992
Current income from:
Equities and other non-fixed-income securities 0 0
Equity investments 1 4
1 4
1,798 1,996
Positive interest on financial liabilities 22 13
Interest expense on:
Deposits 607 679
Debt securities in issue 27 48
Subordinated debt 61 91
Swaps 60 73
755 891
Negative interest on financial assets 38 23
Total 1,027 1,095
1Figures adjusted (see Note 2)
€1,736 million of the interest income (previous year: €1,905 million) relates to financial instruments classified as loans and receivables and €92 million (previous year: €105 million2) to financial instruments classified as avail-able for sale.
Interest income from the lending business and from money market transactions includes €6 million (previous year: €7 million) of interest income accrued on impaired assets (unwinding in accordance with IAS 39).
2 Prior-year figure adjusted by €4 million due to inclusion of net income from equity investments.

5656 Interim Report as of June 30, 2017
Jan. 1 – June 30,
2017€m
Jan. 1 – June 30,
2016€m
Additions
Private mortgage lending 48 61
Home savings loans 1 1
Commercial loans 20 18
Installment loans 84 77
Overdrafts 22 26
Portfolio-based valuation allowances 67 87
Total 242 270
Jan. 1 – June 30,
2017€m
Jan. 1 – June 30,
2016€m
Reversal
Private mortgage lending 46 53
Home savings loans 1 1
Commercial loans 51 9
Installment loans 28 21
Overdrafts 14 13
Portfolio-based valuation allowances 80 88
Total 220 185
(6) Net fee and commission income
Jan. 1 – June 30,
2017€m
Jan. 1 – June 30,
20161
€m
Checking account business 227 175
Securities business 46 30
Lending and guarantee business 28 25
Branch business 93 98
Other fee and commission income 93 91
Total 487 419
1Figures adjusted (see Note 2)
(7) Net trading income
Jan. 1 – June 30,
2017 €m
Jan. 1 – June 30,
2016 €m
Net income from interest rate products 0 1
Net gains/losses on derivatives carried in the trading portfolio and the banking book 21 3
Net gains/losses from application of the fair value option 25 1
Foreign exchange gain/loss 6 4
Net fee and commission income carried in the trading portfolio 0 0
Total 52 9
(8) Net income from investment securities
Jan. 1 – June 30,
2017 €m
Jan. 1 – June 30,
2016 €m
Net income from loans and receivables investment securities 8 38
thereof net income from sale 8 38
Gains on sale 10 41
Losses on sale 2 3
thereof impairment losses (net) 0 0
Net income from available-for-saleinvestment securities and other equity investments 50 136
thereof net income from sale 51 136
Gains on sale 52 136
Losses on sale 1 0
thereof impairment losses (net) – 1 0
Total 58 174
Jan. 1 – June 30,
2017 €m
Jan. 1 – June 30,
2016 €m
Net income from bonds and promissory note loans 47 48
Net income from equity investments 12 127
Impairment – 1 – 1
Total 58 174
Net income from equity investments primarily includes the income from the reduction of a strategic equity investment based on a sales cooperation (€11 million).
As in the previous year, €1 million of the net impairment loss on investment securities relates to closed-end funds.
(9) Administrative expenses
Jan. 1 – June 30,
2017 €m
Jan. 1 – June 30,
20161 €m
Staff costs 679 692
Other administrative expenses 611 677
Amortization of intangible assets 20 22
Depreciation and writedowns of property and equipment 28 27
Total 1,338 1,418
1Figures adjusted (see Note 2)

03INTERIM FINANCIAL STATEMENTS NOTES
5757Interim Report as of June 30, 2017
INT
ER
IM F
INA
NC
IAL
STA
TE
ME
NT
S
(10) Other income
Jan. 1 – June 30,
2017 €m
Jan. 1 – June 30,
2016 €m
Remuneration for participation in an ECB’s refinancing program 15 –
Interest income in acc. with section 233a of the Abgabenordnung (AO – Fiscal Code) 10 1
Income from property and equipment 7 10
Miscellaneous 25 41
Total 57 52
Income from the remuneration for Postbank’s participation in a refinancing program is another component of the revenue that can now be reliably estimated in accordance with IAS 18.20 since the uncertainties as of December 31, 2016, no longer exist.
(11) Other expenses
Jan. 1 – June 30,
2017 €m
Jan. 1 – June 30,
2016 €m
Expenses for the Federal Posts and Telecommunications Agency (BAnstPT) 5 5
Expenses for other taxes 3 2
Expenses from property and equipment 1 9
Miscellaneous 6 74
Total 15 90
BALANCE SHEET DISCLOSURES
(12) Loans and advances to other banks
June 30, 2017
€m
Dec. 31, 2016
€m
Payable on demand 9,026 6,383
Other loans and advances 2,861 6,725
Total 11,887 13,108
Loans and advances to other banks consist solely of financial instruments classified as loans and receivables.
€1,372 million (December 31, 2016: €2,045 million) of loans and advances to other banks is due after more than 12 months.
The loans and advances to other banks can be broken down by product group as follows:
June 30, 2017
€m
Dec. 31, 2016
€m
Securities repurchase agreements 1,716 5,832
Overnight money 9,009 6,381
Loans 63 92
Registered bonds 99 300
Term deposits 1,000 500
Other loans and advances 0 3
Total 11,887 13,108
Collateral received that can be unconditionally liquidated or unconditionally sold:
Fair value of collateral that can be uncondi-
tionally liquidated or can be unconditionally sold
Fair value of collate - ral that was sold or
repledgedand is subject to an
obligation to return
June 30, 2017
€m
Dec. 31, 2016
€m
June 30, 2017
€m
Dec. 31, 2016
€m
Financial collateral 1,485 5,123 318 1,008
Non-financial collateral – – – –
Total 1,485 5,123 318 1,008
(13) Loans and advances to customers
June 30, 2017
€m
Dec. 31, 2016
€m
Private mortgage lending 69,732 69,029
Home savings loans 2,875 2,992
Commercial loans 14,412 13,677
Public sector 5,039 5,205
Installment loans 7,688 7,438
Overdrafts 2,413 2,085
Promissory note loans 1,599 1,537
Other loans and advances 41 40
Total 103,799 102,003

5858 Interim Report as of June 30, 2017
Loans and advances to customers can be broken down as follows in accordance with the categories of financial instruments defined in IAS 39:
June 30, 2017
€m
Dec. 31, 2016
€m
Loans and receivables 100,596 98,358
Fair value option 3,203 3,645
Total 103,799 102,003
€82,929 million (December 31, 2016: €81,762 million) of loans and advances to customers is due after more than 12 months.
(14) Allowance for losses on loans and advancesThe allowance for losses on loans and advances is composed of the following items:
June 30, 2017
€m
Dec. 31, 2016
€m
Specific valuation allowances 735 798
Portfolio-based valuation allowances 187 200
Allowance for losses on loans and advances carried under assets 922 998
Provisions for credit risks 29 45
Total 951 1,043
Collective specific valuation allowances are reported under the specific valuation allowances.
The allowance for losses on loans and advances reported on the assets side of the balance sheet changed as follows:
Specificvaluation
allowances
Portfolio-based
valuationallowances
Total
2017 €m
2016 €m
2017 €m
2016 €m
2017 €m
2016 €m
Balance at Jan. 1 798 725 200 198 998 923
Reclassification due to IFRS 5 – – – – – –
Additions
Allowance charged to the income statement 175 183 67 87 242 270
Disposals
Utilization 92 39 – – 92 39
Allowance reversed to the income statement 140 97 80 88 220 185
Unwinding 6 7 – – 6 7
Currency translationdifferences – – – – 1 – – 1
Balance at June 30 735 765 187 196 922 961
The allowance for losses on loans and advances to customers can be broken down by product group as follows:
June 30, 2017
€m
Dec. 31, 2016
€m
Specific valuation allowances
Private mortgage lending 183 209
Home savings loans 6 5
Commercial loans 93 127
Public-sector receivables 3 4
Installment loans 313 313
Overdrafts 137 140
Portfolio-based valuation allowances 187 200
Total 922 998
(15) Trading assets
June 30, 2017
€m
Dec. 31, 2016
€m
Building loans held for trading 47 53
Positive fair values of derivatives carried as trading assets 0 1
Positive fair values of banking book derivatives 343 421
Positive fair values from derivatives relating to hedged items accounted for under the fair value option 0 0
Total 390 475
€344 million (December 31, 2016: €409 million) is due after more than 12 months.
(16) Investment securities
June 30, 2017
€m
Dec. 31, 2016
€m
Bonds and other fixed-income securities
Loans and receivables 9,902 12,196
Available for sale 14,301 14,252
24,203 26,448
Equities and othernon-fixed-income securities
Available for sale 265 271
265 271
Equity investments (available for sale) 35 43
Investments in unconsolidated subsidiaries (available for sale) 1 5
Total 24,504 26,767
Holdings of €19,246 (December 31, 2016: €22,266 million) are due after more than 12 months.

03INTERIM FINANCIAL STATEMENTS NOTES
5959Interim Report as of June 30, 2017
INT
ER
IM F
INA
NC
IAL
STA
TE
ME
NT
S
Investment securities were furnished as collateral for the following liabilities:
June 30, 2017
€m
Dec. 31, 2016
€m
Liabilities 6,779 7,625
Contingent liabilities 22 21
Total 6,801 7,646
Investment securities still carried in the balance sheet in the amount of €3,151 million (previous year: €2,956 million) were transferred as collateral. Of this figure, the transferee could resell or pledge investment securities in the amount of €2,580 million (previous year: €2,918 million) on the basis of contractual or customary rights (IAS 39.37(a)).
Collateral taking the form of investment securities in the amount of €2,580 million (previous year: €2,918 million) was transferred for liabilities relating to securities repur-chase transactions amounting to €2,755 million (previous year: €3,147 million).
Investment securities are pledged as collateral in accord-ance with standard market conditions.
In fiscal years 2008 and 2009, Postbank reclassified securi-ties from the “available-for-sale” category to the “loans and receivables” category due to a change in its intention to hold the securities. The fair value of the securities at the respective reclassification date was reported as the new carrying amount.
As of June 30, 2017, the total volume of securities reclassi-fied in accordance with IAS 39.50E had a fair value of €4.4 billion and a carrying amount of €4.3 billion.
Prior to the above-mentioned reclassification dates, the changes in fair value that had been recognized in the revaluation reserve for the reclassified securities amounted to €468 million before tax. Had Postbank not changed its intention to hold the securities, the loss recognized in the revaluation reserve would have decreased by €102 million in the period up to June 30, 2017 (December 31, 2016: €167 million).
Given a nominal weighting of the reclassified securities, the effective interest rate calculated on the basis of their restated cost as of the date of the reclassifications was 4.4 % (range of effective interest rates: 1.8 % to 34.5 %). The estimated cash flows that Postbank expected as of the date of the reclassifications amount to €45.4 billion. Impairments of €621 million (previous year: €621 million) were charged for all reclassified securities in the period up to June 30, 2017; net disposal gains on reclassified securi-ties amounted to €93 million (previous year: €88 million).
Interest income amounting to €49 million (previous year: €65 million) accrued for the reclassified securities in the period up to June 30, 2017.
(17) Intangible assets
June 30, 2017
€m
Dec. 31, 2016
€m
Acquired goodwill 1,581 1,581
Acquired software, concessions, industrial rights 244 253
Internally generated intangible assets and software 51 54
Advance payments on intangible assetsand in-process intangible assets 108 75
Total 1,984 1,963
The “Acquired software, concessions, industrial rights” item includes the capitalized BHW brand in the unchanged amount of €139 million.
The capitalized amounts for customer relationships amounted to €52 million (December 31, 2016: €54 million), while those for beneficial contracts amounted to €7 million (December 31, 2016: €8 million).
(18) Property and equipment
June 30, 2017
€m
Dec. 31, 2016
€m
Land and buildings 479 480
Operating and office equipment 183 176
Advance payments and assets under development 47 43
Total 709 699
(19) Other assets
June 30, 2017
€m
Dec. 31, 2016
€m
Prepaid expenses 127 65
Receivables from subsidiaries 96 55
Trade receivables 180 171
Receivables from tax authorities 7 32
Advances to members of the mobile sales force 9 7
Miscellaneous 76 58
Total 495 388
€83 million (December 31, 2016: €107 million) of other assets has a maturity of more than 12 months.

6060 Interim Report as of June 30, 2017
(20) Assets held for saleIn the fourth quarter of 2016, the Bank resolved to sell an investment with a carrying amount of €13 million. The purchase agreement was signed in January 2017 subject to conditions precedent. The sale was completed in July 2017. The investment is allocated to the available-for-sale meas-urement category and Level 2 of the fair value hierarchy. It is presented in the Cost Centers segment in segment reporting.
In July 2017, Postbank initiated a sales process for the disposal of “Loans and advances to other banks,” “Other assets,” and “Other liabilities.” Loans and advances, other assets, and other liabilities are allocated to the Cost Centers segment. The disposal is expected to be completed in the second half of 2017.
In addition, the Bank had classified parts of another invest-ment in the amount of €1 million as held for sale as of the balance sheet date. This was also sold in July 2017. The investment is allocated to the available-for-sale measure-ment category and Level 2 of the fair value hierarchy. It is presented in the Financial Markets segment in segment reporting.
The property reported under “Assets held for sale” in the 2016 Annual Report was sold at its carrying amount of €20 million in the reporting period.
(21) Deposits from other banks
June 30, 2017
€m
Dec. 31, 2016
€m
Payable on demand 255 508
With an agreed maturity or withdrawal notice 12,113 12,625
Total 12,368 13,133
“Deposits from other banks” only include financial instru-ments classified as liabilities at amortized cost.
€8,114 million (December 31, 2016: €8,425 million) is due after more than 12 months.
(22) Due to customersAmounts due to customers are primarily composed of savings deposits, amounts payable on demand, and term deposits.
June 30, 2017
€m
Dec. 31, 2016
€m
Savings deposits 37,310 38,585
Home savings deposits 18,575 18,809
Other amounts due
Payable on demand 48,993 46,841
With an agreed maturity or withdrawal notice 13,173 14,683
62,166 61,524
Total 118,051 118,918
Amounts “due to customers” only include financial instru-ments classified as liabilities at amortized cost.
€21,161 million (December 31, 2016: €22,424 million) is due after more than 12 months.
(23) Debt securities in issue
June 30, 2017
€m
Dec. 31, 2016
€m
Public-sector Pfandbriefe 56 56
Mortgage Pfandbriefe 2,336 2,405
Other debt instruments 897 878
Total 3,289 3,339
“Debt securities in issue” only include financial instruments classified as liabilities at amortized cost.
€3,160 million (December 31, 2016: €3,195 million) is due after more than 12 months.
(24) Trading liabilities
June 30, 2017
€m
Dec. 31, 2016
€m
Negative fair values of trading derivatives 79 81
Negative fair values of banking book derivatives 210 300
Negative fair values from derivatives relating to hedged items accounted for under the fair value option 20 28
Total 309 409
€179 million (December 31, 2016: €262 million) is due after more than 12 months.
(25) ProvisionsJune 30,
2017 €m
Dec. 31, 2016
€m
Provisions for pensions and other employee benefits 255 254
Staff-related provisions 165 194
Ligitation and customer redress 141 163
Provisions for credit risks 29 45
Miscellaneous 210 251
Total 800 907
€494 million (December 31, 2016: €586 million) of the recognized provisions is due after more than 12 months.

03INTERIM FINANCIAL STATEMENTS NOTES
6161Interim Report as of June 30, 2017
INT
ER
IM F
INA
NC
IAL
STA
TE
ME
NT
S
(26) Other liabilities
June 30, 2017
€m
Dec. 31, 2016
€m
Obligation to DB Beteiligungs-Holding GmbH (formerly: DB Finanz-Holding GmbH) from control and profit and loss transfer agreement 77 9
Trade payables 87 100
Liabilities from expenses for outstanding invoices 112 111
Liabilities from expenses for outstanding vacation entitlements and other compensated absences 43 44
Non-controlling interests (debt instruments) 6 6
Liabilities from other taxes 38 55
Liabilities from expenses for commissions and premiums 39 39
Deferred income 18 21
Liabilities from expenses for management bonuses 35 49
Miscellaneous liabilities 110 107
Total 565 541
€31 million (December 31, 2016: €36 million) is due after more than 12 months.
(27) Subordinated debt
June 30, 2017
€m
Dec. 31, 2016
€m
Hybrid capital instruments 882 1,447
Subordinated liabilities 897 909
Profit participation certificates outstanding 163 189
Contributions by typical silent partners 21 22
Total 1,963 2,567
A total of €985 million of the regular phased-in subordi-nated debt recognized (December 31, 2016: €1,090 million) is eligible as Tier 2 capital for regulatory purposes.
“Subordinated debt” consists solely of financial instru-ments classified as liabilities at amortized cost. One trust preferred securities issue in the amount of €0.5 billion, which is reported under hybrid capital instruments, was paid back in June 2017.
The decline in profit participation certificates is due to certificates reaching maturity.
€1,544 million (December 31, 2016: €2,430 million) is due after more than 12 months.
OTHER DISCLOSURES
(28) Contingencies and other obligations
June 30, 2017
€m
Dec. 31, 2016
€m
Contingent liabilities
on guarantees and warranties 379 362
Other obligations
Irrevocable loan commitments 8,349 7,752
thereof building loans provided 5,913 5,325
Other liabilities
Irrevocable payment obligations – deposit protection fund 22 22
Irrevocable payment obligations – cash collateral for bank levy 16 13
Other liabilities 12,829 13,061
Total 21,595 21,210
Miscellaneous obligations mainly relate to credit lines that can be called in by Postbank at any time.
(29) Fair values of financial instruments
Fair value hierarchyThe following presents the allocation of financial instru-ments measured at fair value to the three-level fair value hierarchy in accordance with IFRS 13.72ff. In line with this, Postbank assigns the assets and liabilities to the respective level:
Level 1:Quoted market prices for the identical asset or the identi-cal liability exist for the instruments classified as Level 1. In other words, Level 1 fair value measurement is based solely on quoted market prices in an active market for an identical financial instrument. Level 1 therefore mainly consists of highly liquid securities and exchange-traded derivatives.
Level 2:Level 2 fair values are measured either with the help of quoted prices in active markets for similar instruments or using techniques whose inputs are based solely on directly or indirectly observable market data. This includes non-exchange-traded derivatives (e. g., swaps, caps, and floors) as well as bonds and promissory note loans that are valued using yield and spread curves and/or volatilities.
Level 3:Level 3 fair values are determined using measurement models whose significant inputs are not observable in the market.

6262 Interim Report as of June 30, 2017
The following tables show the allocation of the individual categories of financial instruments to the corresponding levels in the fair value hierarchy:
Assets measured at fair value
Fair value reported in:
Classes June 30, 2017 €m
Level 1 €m
Level 2 €m
Level 3 €m
Financial assets at fair value through profit or loss (FVtPL)
Trading assets 390 0 390 0
Loans held for trading 47 0 47 0
Derivatives 343 0 343 0
Hedging derivatives 69 0 69 0
Loans and advances to customers 3,203 0 3,203 0
thereof private mortgage lending 3,203 0 3,2031 0
Available-for-sale financial assets
Investment securities 14,602 11,967 2,599 36
Bonds and other fixed-income securities 14,301 11,960 2,327 14
Equities and other non-fixed-income securities 265 0 265 0
Equity investments 36 7 7 22
Other assets 161 0 0 161
Trade receivables 161 0 0 161
Total 18,425 11,967 6,261 197
Liabilities measured at fair value
Fair value reported in:
Classes June 30, 2017 €m
Level 1 €m
Level 2 €m
Level 3 €m
Financial liabilities at fair value through profit or loss (FVtPL)
Trading liabilities 309 0 309 0
Derivatives 309 0 309 0
Hedging derivatives 31 0 31 0
Total 340 0 340 0
1 Due to the trend in interest rates, the discount rate used to measure loans under the fair value option has contained a greater share of inputs not observable in the market since the beginning of 2014. These continue to be allocated to Level 2 given their relatively low expected volatility and their insignificance for the fair value as a whole.

03INTERIM FINANCIAL STATEMENTS NOTES
6363Interim Report as of June 30, 2017
INT
ER
IM F
INA
NC
IAL
STA
TE
ME
NT
S
Assets measured at fair value
Fair value reported in:
Classes Dec. 31, 2016 €m
Level 1 €m
Level 2 €m
Level 3 €m
Financial assets at fair value through profit or loss (FVtPL)
Trading assets 475 0 475 0
Loans held for trading 53 0 53 0
Derivatives 422 0 422 0
Hedging derivatives 112 0 112 0
Loans and advances to customers 3,645 0 3,645 0
thereof private mortgage lending 3,645 0 3,6451 0
Available-for-sale financial assets
Investment securities 14,571 12,078 2,454 39
Bonds and other fixed-income securities14,252 12,064 2,171 17
Equities and other non-fixed-income securities 271 0 271 0
Equity investments 48 14 12 22
Other assets 140 0 0 140
Trade receivables 140 0 0 140
Total 18,943 12,078 6,686 179
Liabilities measured at fair value
Fair value reported in:
Classes Dec. 31, 2016 €m
Level 1 €m
Level 2 €m
Level 3 €m
Financial liabilities at fair value through profit or loss (FVtPL)
Trading liabilities 409 0 409 0
Derivatives 409 0 409 0
Hedging derivatives 42 0 42 0
Total 451 0 451 0
1 Due to the trend in interest rates, the discount rate used to measure loans under the fair value option has contained a greater share of inputs not observable in the market since the beginning of 2014. These continue to be allocated to Level 2 given their relatively low expected volatility and their insignificance for the fair value as a whole.
Postbank uses discounted cash flow models to measure financial instruments allocated to Level 2, if they cannot be measured using transactions in identical financial instru-ments at the measurement date or using transactions in similar financial instruments at the measurement date. Most of the above-mentioned financial instruments (deri-vatives, bonds, promissory note loans) are measured using yield and spread curves (credit spreads, basis spreads) as inputs. In addition, CDS spreads and hazard rates are used to value credit derivatives. Option pricing models also use share prices, index prices, and volatilities as inputs.
The Postbank Group applies the fair value option exclusi-vely to specific loan portfolios in the mortgage lending business. The current swap yield curve and loan-specific risk and cost premiums are used as inputs. The risk pre-miums are calculated on the basis of the estimated loss rates and probabilities of default; these are sourced from the
Bank’s internal rating model, which has been approved by the supervisory authority.
The moderate decline in Level 1 instruments as against the 2016 year-end is mainly due to maturities and disposals, which more than offset additions to Level 1. The additions to Level 1 also comprise shifts from Level 2 to Level 1 in the amount of €73 million. These shifts result from the fact that the underlying prices are directly observable in the market. The decrease in Level 2 instruments compared with December 31, 2016, is primarily attributable to maturities in the private mortgage lending portfolio.
Valuation techniques whose inputs mean they are allo-cable to Level 3 are used for both assets and liabilities. Embedded derivatives (CDSs) from the synthetic structured credit products are allocated to Level 3.

6464 Interim Report as of June 30, 2017
Financial assets allocable to Level 3 changed as follows in the reporting period:
Assets measured at fair value based on Level 3
Assets measured at fair value in Level 3 as of June 30, 2017
Financial assets at FVtPL AfS financial assets Total
Trading assets
€m
Hedging derivatives
€m
Loans and advances to
other banks/ customers
€m
Investment securities
€m
Loans and advances to
other banks/ customers
€m
Other assets
€m €m
Opening balance 0 0 0 39 0 140 179
Total gains or losses 0 0 0 – 1 0 0 – 1
in profit or loss 0 0 0 – 1 0 0 – 1
in revaluation reserve 0 0 0 0 0 0 0
Purchases 0 0 0 0 0 55 55
Disposals 0 0 0 0 0 0 0
Issues 0 0 0 0 0 0 0
Settlements 0 0 0 – 2 0 – 34 – 36
Exchange rate effects 0 0 0 0 0 0 0
Transfers out of Level 3 0 0 0 0 0 0 0
Transfers to Level 3 0 0 0 0 0 0 0
Closing balance 0 0 0 36 0 161 197
Total remeasurement gains/losses for assets held at the end of the reporting period 0 0 0 – 1 0 0 – 1
Level 3 financial assets changed as follows as of Decem - ber 31, 2016:
Assets measured at fair value based on Level 3
Assets measured at fair value in Level 3 as of Dec. 31, 2016
Financial assets at FVtPL AfS financial assets Total
Trading assets
€m
Hedging derivatives
€m
Loans and advances to
other banks/ customers
€m
Investment securities
€m
Loans and advances to
other banks/ customers
€m
Other assets
€m €m
Opening balance 1 0 0 34 0 105 140
Total gains or losses – 1 0 0 1 0 0 0
in profit or loss – 1 0 0 – 1 0 0 – 2
in revaluation reserve 0 0 0 2 0 0 2
Purchases 0 0 0 26 0 96 122
Disposals 0 0 0 – 11 0 0 – 11
Issues 0 0 0 0 0 0 0
Settlements 0 0 0 – 11 0 – 61 – 72
Exchange rate effects 0 0 0 0 0 0 0
Transfers out of Level 3 0 0 0 0 0 0 0
Transfers to Level 3 0 0 0 0 0 0 0
Closing balance 0 0 0 39 0 140 179
Total remeasurement gains/losses for assets held at the end of the reporting period – 1 0 0 1 0 0 0

03INTERIM FINANCIAL STATEMENTS NOTES
6565Interim Report as of June 30, 2017
INT
ER
IM F
INA
NC
IAL
STA
TE
ME
NT
S
The fair value of the structured credit products within investment securities allocated to Level 3 is measured at present using arranger/dealer quotes which are validated by means of an internal valuation technique. The internal valuation technique also takes the illiquidity of the markets for structured products into account in addition to the impact of default on expected cash flows. This is done by adding a premium to the “risk-free” interest rate for the same maturity when discounting the previously calculated cash flows. Assuming a change in arranger/dealer quotes by +/– 100 basis points, the fair value would change by +/– €0.2 million.
The shares in closed-end funds allocated to Level 3 are measured using cash flow models, which take account of the risk-adjusted planning assumptions of the respective funds. If the planning assumptions deviate by +/– 10 % from the assumptions made when calculating the fair value, this would result in a fair value change of +/– €0.4 million.
The preferred shares in Visa Inc. are presented as equity investments under Level 3. When measuring the fair value, assumptions with respect to the conversion rate (common share conversion ratio) and the liquidity of the shares are taken into account. Any change in the assumptions with respect to the conversion rate and the liquidity of the shares of +/– 10 % would lead to a change in the fair value of +/– €1 million.
The trade receivables also allocated to Level 3 relate to fee and commission receivables in connection with insurance brokerage and receivables for services rendered attrib-utable to affiliated companies. The fair values of the acquisition commissions to be paid for insurance broker-age are determined by taking future cancellations/antici-pated premature terminations into account. The reliable determination of the fair values of the above commissions is based on the reporting system of the product provider and contains assumptions as to the cancellation rate/antici-pated premature termination of concluded insurances. Assuming a change in cancellation rates of +/– 5 %, this would lead to a change in the fair value of +/– €8 million which, as a change in cash flows, would be recognized through profit or loss.
The fair value of the receivable from the services rendered in connection with the ECB’s refinancing program is calcu-lated on the basis of the expected term and amount of the refinancing advantage and the related future payments to Postbank. The amount of the receivable rose by €15 million as against December 31, 2016, after uncertainties arising from the refinancing program were eliminated. Due to the high level of uncertainty surrounding the above parameters and the resulting inability to make a reliable estimation in accordance with IAS 18.20, further remuneration in the high two-digit million euro range that may arise in the future was not recognized. This will be recognized in the coming periods once the criteria in IAS 18.20 have been satisfied.
Since the liabilities allocated to Level 3 had a carrying amount and a fair value of €0 million as of June 30, 2017 and as of December 31, 2016, these are not presented in table form.
There were no non-recurring fair value measurements of financial instruments in the reporting period.
Fair value of financial instruments carried at amortized cost or hedge fair valueThe fair values of financial instruments carried at amortized cost or hedge fair value on the balance sheet are compared with their carrying amounts in the following table:

6666 Interim Report as of June 30, 2017
June 30, 2017 Dec. 31, 2016
Carryingamount
€m
Full fair value
€m
Carryingamount
€m
Full fair value
€m
Assets
Cash reserve 1,604 1,604 2,291 2,291
Loans and advances to other banks (loans and receivables) 11,887 11,891 13,108 13,117
Securities repurchase agreements 1,716 1,716 5,832 5,834
Amounts payable on demand 9,009 9,009 6,381 6,381
Loans 63 64 92 94
Registered bonds 99 101 300 306
Term deposits 1,000 1,001 500 499
Other loans and advances 0 0 3 3
Loans and advances to customers (loans and receivables) 100,596 105,486 98,358 102,222
Private mortgage lending 66,529 70,915 65,384 68,890
Home savings loans 2,875 2,875 2,992 2,992
Commercial loans 14,412 14,544 13,677 13,717
Public-sector receivables 5,039 5,102 5,205 5,234
Installment loans 7,688 7,978 7,438 7,704
Overdrafts 2,413 2,413 2,085 2,085
Promissory note loans 1,599 1,618 1,537 1,560
Other loans and advances 41 41 40 40
Allowance for losses on loans and advances (loans and receivables) – 922 – 922 – 998 – 998
Private mortgage lending – 261 – 261 – 292 – 292
Home savings loans – 6 – 6 – 5 – 5
Commercial loans – 113 – 113 – 153 – 153
Public-sector receivables – 3 – 3 – 4 – 4
Installment loans – 388 – 388 – 389 – 389
Overdrafts – 151 – 151 – 155 – 155
Promissory note loans 0 0 0 0
Other loans and advances 0 0 0 0
Investment securities (loans and receivables) 9,902 10,173 12,196 12,573
Bonds and other fixed-income securities 9,902 10,173 12,196 12,573
Other assets (loans and receivables) 156 156 147 147
123,223 128,388 125,102 129,352
Liabilities
Deposits from other banks (liabilities at amortized cost) 12,368 12,729 13,133 13,539
Due to customers (liabilities at amortized cost) 118,051 119,507 118,918 120,616
Savings deposits 37,310 37,310 38,585 38,585
Home savings 18,575 18,575 18,809 18,809
Other liabilities 62,166 63,622 61,524 63,222
Debt securities in issue and subordinated debt 3,289 3,674 3,339 3,767
Public-sector Pfandbriefe 56 61 56 62
Mortgage Pfandbriefe 2,336 2,392 2,405 2,467
Other debt instruments 897 1,221 878 1,238
Subordinated debt (liabilities at amortized cost) 1,963 2,218 2,567 2,598
Hybrid capital instruments 881 1,019 1,447 1,385
Subordinated liabilities 897 1,002 909 989
Profit participation certificates outstanding 163 176 189 202
Contributions by typical silent partners 21 21 22 22
Other liabilities (liabilities at amortized cost) 359 359 318 318
136,030 138,487 138,275 140,838

03INTERIM FINANCIAL STATEMENTS NOTES
6767Interim Report as of June 30, 2017
INT
ER
IM F
INA
NC
IAL
STA
TE
ME
NT
S
In general, fair value is calculated for all financial instru-ments. The only exceptions are items payable on demand and savings deposits with an agreed withdrawal notice of one year or less. For these, the carrying amount is used as the estimated fair value.
(30) Derivatives The Postbank Group uses derivatives to hedge positions as part of its asset/liability management policy. Derivatives are also entered into for trading purposes.
The notional amounts represent the gross volume of all sales and purchases. The notional amount is a reference value for determining reciprocally agreed settlement payments; it does not represent recognizable receivables or liabilities.
The fair values of the individual contracts were calculated using recognized valuation techniques. Postbank utilizes the available netting opportunities when derivative trans-actions are settled via a central counterparty.
Holdings of derivatives are composed of the following items:
Notional amount Positive fair values Negative fair values
June 30, 2017 €m
Dec. 31, 2016 €m
June 30, 2017 €m
Dec. 31, 2016 €m
June 30, 2017 €m
Dec. 31, 2016 €m
Trading derivatives 137,449 138,822 343 421 309 408
Hedging derivatives 23,614 21,785 69 112 31 42
Total 161,063 160,607 412 533 340 450
The following table presents the Postbank Group’s condi-tional and unconditional forward transactions open at the balance sheet date.
Fair Value
Notional amount Positive fair values Negative fair values
June 30, 2017 €m
Dec. 31, 2016 €m
June 30, 2017 €m
Dec. 31, 2016 €m
June 30, 2017 €m
Dec. 31, 2016 €m
Trading derivatives
Foreign currency derivatives 6,577 5,885 38 53 42 49
Interest rate derivatives 130,862 132,924 305 368 267 359
Equity/index derivatives 0 0 – 0 – –
Credit derivatives 10 13 0 0 0 0
Total holdings of trading derivatives 137,449 138,822 343 421 309 408
Hedging derivatives
Fair value hedges 23,614 21,785 69 112 31 42
Total holdings of hedging derivatives 23,614 21,785 69 112 31 42
Total holdings of derivatives 161,063 160,607 412 533 340 450
Risks relating to the financial instruments are presented in the Risk Report contained in the Interim Management Report.

6868 Interim Report as of June 30, 2017
(31) Offsetting of financial assets and financial liabilitiesFinancial assets and financial liabilities that meet the condi-tions for offsetting set out in IAS 32.42ff. are presented on a net basis in the balance sheet.
The following tables contain the disclosures as of June 30, 2017, on the effects of offsetting on the consolidated balance sheet and the financial effects of offsetting in the case of instruments that are covered by a legally enforce-able master netting arrangement or similar agreement.
Financialassets
(gross)
€m
Offset recognized
amounts (gross)
€m
Recog - nized
financial assets (net)
€m
Effects of master
netting ar-rangements
€m
Cash collateral
€m
Collateral taking the
form of financial
instruments €m
Netamount
€m
Assets
Loans and advances to other banks 12,061 – 174 11,887 – – – 1,717 10,170
Trading assets 5,833 – 5,443 390 – 140 – 52 – 198
Hedging derivatives 925 – 856 69 0 – 11 – 58
Total 18,819 – 6,473 12,346 – 140 – 63 – 1,717 10,426
Financialliabilities
(gross)
€m
Offset recognized
amounts (gross)
€m
Recog - nized
financial liabilities
(net) €m
Effects of master
netting ar-rangements
€m
Cash collateral
€m
Collateral taking the
form of financial
instruments €m
Netamount
€m
Equity and Liabilities
Deposits from other banks 2,755 0 2,755 – 0 – 2,606 149
Trading liabilities 6,208 – 5,899 309 – 140 – 118 – 51
Hedging derivatives 604 – 573 31 0 – 12 – 19
Total 9,567 – 6,472 3,095 – 140 – 130 – 2,606 219
The column headed “Offset recognized amounts (gross)” contains the amounts set off in accordance with the provisions of IAS 32.42ff. The column entitled “Effects of master netting arrangements” contains the amounts that are covered by master netting arrangements but that have not been set off because the conditions of IAS 32.42ff. have not been met. The “Cash collateral” and “Collateral taking the form of financial instruments” columns show the fair values concerned. The right to set off collateral taking the form of financial instruments and cash collateral is contingent upon the prior default of the counterparty concerned.

03INTERIM FINANCIAL STATEMENTS NOTES
6969Interim Report as of June 30, 2017
INT
ER
IM F
INA
NC
IAL
STA
TE
ME
NT
S
Offset financial assets and financial liabilities from securi-ties repurchase agreements (reverse repos/repos) are included in the “Loans and advances to other banks (including allowance for losses on loans and advances)” and “Deposits from other banks” items.
Offset derivatives are included in the “Trading assets,” “Trading liabilities” and “Hedging derivatives” line items. The cash collateral received as security for positive fair values of derivatives and pledged for negative fair values of derivatives is reported under the “Deposits from other banks” and “Loans and advances to other banks” line items.
The following tables contain the comparative figures as of December 31, 2016.
Financialassets
(gross)
€m
Offset recognized
amounts (gross)
€m
Recog - nized
financial assets (net)
€m
Effects of master
netting ar-rangements
€m
Cash collateral
€m
Collateral taking the
form of financial
instruments €m
Netamount
€m
Assets
Loans and advances to other banks 17,714 – 4,606 13,108 – – – 5,839 7,269
Trading assets 6,632 – 6,157 475 – 191 – 73 – 211
Hedging derivatives 1,042 – 930 112 – 1 – 19 – 92
Total 25,388 – 11,693 13,695 – 192 – 92 – 5,839 7,572
Financialliabilities
(gross)
€m
Offset recognized
amounts (gross)
€m
Recog - nized
financial liabilities
(net) €m
Effects of master
netting ar-rangements
€m
Cash collateral
€m
Collateral taking the
form of financial
instruments €m
Netamount
€m
Equity and Liabilities
Deposits from other banks 7,167 – 4,020 3,147 – – – 2,881 266
Trading liabilities 7,271 – 6,862 409 – 191 – 289 – – 71
Hedging derivatives 853 – 811 42 – 1 – 30 – 11
Total 15,291 – 11,693 3,598 – 192 – 319 – 2,881 206

7070 Interim Report as of June 30, 2017
The management of capital requirements is integrated in the general capital management process, which comprises a regulatory and an economic view. For further informa-tion on economic capital management, reference should be made to our explanations in Note 49 “Risk-bearing capacity, risk cover amount, and risk capital” of the 2016 Annual Report.
Regulatory capital management focuses on requirements with respect to Common Equity Tier 1 (CET1) capital and additionally takes account of Tier 1 capital and own funds. In this way, the Pillar I requirements are addressed. The capital management system comprises the following three levels:
1. Observance of regulatory minimum ratios in accordance with CRR/CRD IV or those fixed by BaFin/ECB.
2. Monitoring and observation of the internally defined thresholds which, if fallen below, trigger capital manage-ment measures. Thresholds have been defined for the actual capital ratios in each case, the ratios calculated in the forecast, as well as for the results of the stress test.
3. Medium-term target ratio for CET1 redefined each year by the Management Board as part of its risk strategy.
There is no regulatory minimum requirement for the lever-age ratio. However, the Bank has defined thresholds and internal target ratios for internal management purposes as well. These are integrated in general capital management via the risk strategy. The general capital management process contains various monitoring and forecasting pro-cesses for the defined indicators. As part of the multi-year planning process, a preview of expected capital and lever-age ratios is conducted once a year over a period of the following three years on the basis of volume, migration, and profit/loss planning and dedicated assumptions. The planning process also comprises a downside scenario.
The current capital and leverage ratios are calculated on a monthly basis. The current ratios and stress-testing results are submitted to the Management Board and the Super-visory Board on a quarterly basis in the overall bank risk report.
The risk strategy defines the corresponding internal thresh-olds which, if fallen below, trigger countermeasures and recommendations. In addition, a capital ratio forecast with a view to the end of the fiscal year is prepared during the year to review the necessity of any countermeasures.
The Asset and Liability Committee is the central body responsible for monitoring and managing capital ratios as well as the leverage ratio. It develops, evaluates and decides on suggestions for control measures and monitors their effectiveness.
(32) Capital management, risk-weighted assets, and capital ratio
Postbank satisfies the requirements of Basel III, which took effect on January 1, 2014, in the form of the Capital Require - ments Regulation (CRR) and the Capital Requirements Directive IV (CRD IV) as well as related German regulations. Numerous transitional provisions continue to apply in 2017.
Postbank’s processes for calculating and managing capital resources and leverage ratio comply with all legislation, regulations, and European Banking Authority (EBA) standards in the most recently amended versions. Internal calcula-tions are always performed on a regulatory phased-in basis, as well as on a fully phased-in basis. The Bank’s per-formance relating to own funds is monitored and managed in accordance with both views.
Postbank was subject to additional buffer requirements for the first time in 2016. All of these buffers must be covered by Common Equity Tier 1 capital (CET1), which in terms of risk-weighted assets must be held available in addition to the existing minimum requirements. The CRR defines tran-sitional periods during which the buffer requirements are increased step by step between 2016 and 2019. Depending on their type, the buffer requirements are defined either directly in CRD IV and/or in the Kreditwesengesetz (KWG – German Banking Act) or are defined and communicated by the competent supervisory authorities for individual banks and/or countries.
The amount of the capital conservation buffer has already been defined by CRD IV and is equal to 1.25 % of risk-weighted assets in 2017. The maximum capital conserva-tion buffer requirement of 2.5 % will be reached in 2019. At present, BaFin has set the counter-cyclical buffer for Germany to 0 %. Based on the relevant foreign expo-sures, this gives an average-weighted countercyclical capital buffer requirement of 0.007 % of RWA for Postbank. Above and beyond these capital buffer requirements, the respon-sible supervisory authority can, in accordance with the supervisory review and evaluation process (SREP), impose additional capital requirements on banks that exceed the statutory minimum requirements.
In this connection Postbank complies with all minimum capital requirements including capital buffer requirements made of it.
The external regulatory capital requirements constitute an absolute lower limit for Postbank’s strategic management. They are embedded in the risk-appetite framework. The corresponding indicators are identified and managed at the level of the Postbank Group as well as the individual institutions within the Group which fall within the scope of the CRR.

03INTERIM FINANCIAL STATEMENTS NOTES
7171Interim Report as of June 30, 2017
INT
ER
IM F
INA
NC
IAL
STA
TE
ME
NT
S
(33) Risk-bearing capacity, risk cover amount, and risk capital
The following table shows the Postbank Group’s author-ized risk capital, broken down by risk types, before and after factoring in correlation effects, and the risk cover amount. The figures are given as of June 30, 2017, com-pared with December 31, 2016.
Risk capital by risk types
Capital and risk components Allocated risk capital
June 30, 2017
€m
Dec. 31, 2016
€m
Credit risk 2,700 2,700
Market risk 2,120 2,180
Operational risk 700 700
Business risk 2,670 2,670
Total before diversification 8,190 8,250
Diversification effects 1,452 1,460
Total after diversification 6,738 6,790
Unallocated risk cover amount 3,051 3,128
Total risk cover amount 9,789 9,918
Other disclosures relating to capital management can be found in the Risk Report section of the Interim Manage-ment Report.
(34) Related party disclosures
Related party receivablesJune 30,
2017 €m
Dec. 31, 2016
€m
Loans and advances to other banks
Deutsche Bank AG 1,137 2,288
Other related parties 5 4
1,142 2,292
Loans and advances to customers
Other related parties 42 42
42 42
Trading assets
Deutsche Bank AG 109 125
109 125
Investment securities
Deutsche Bank AG 1,020 1,118
1,020 1,118
Other assets
Deutsche Bank AG 87 90
Other related parties 9 5
96 95
The Bank’s regulatory own funds calculated in accordance with the CRR/CRD IV rules (regular phased-in) were as fol-lows:
June 30, 20171
€m
Dec. 31, 20162
€m
Credit and counterparty risk (including CVA) 36,259 36,108
Market risk positions 89 62
Operational risk 5,373 5,827
Total risk-weighted assets 41,721 41,997
Regular phased-in:
Common Equity Tier 1 capital (CET 1) 5,733 5,952
Additional Tier 1 capital (AT 1) 139 228
Tier 1 capital 5,872 6,180
Tier 2 capital 965 1,052
Own funds 6,837 7,232
% %
CET 1 capital ratio 13.7 14.2
Tier 1 capital ratio 14.1 14.7
Total capital ratio 16.4 17.2
Fully phased-in:
CET 1 capital ratio 12.8 12.4
Tier 1 capital ratio 12.8 12.4
Total capital ratio 16.2 15.9
1 By factoring in the interim profit as of June 30, 2017 subject to supervisory authority approval
2 The regular-phased-in CET1 capital ratio as reported on December 31, 2016 was 13.4 % (by factoring in the interim profit as of September 30, 2016).
The key components of Postbank’s Tier 1 capital are the share capital and recognized reserves. Tier 2 capital is composed of long-term subordinated liabilities and profit participation certificates outstanding.

7272 Interim Report as of June 30, 2017
The loans and advances to other banks primarily relate to money market transactions with Deutsche Bank AG. The decline in loans and advances to Deutsche Bank AG is primarily the result of fewer securities repurchase transac-tions being entered into compared with the previous year.
The decrease in trading assets is mainly attributable to measurement effects.
The investment securities relate to Deutsche Bank AG bonds.
Related party payables
June 30, 2017
€m
Dec. 31, 2016
€m
Deposits from other banks
Deutsche Bank AG 2,819 3,004
2,819 3,004
Due to customers
Subsidiaries 3 8
Other related parties 2 5
5 13
Trading liabilities
Deutsche Bank AG 221 237
221 237
Hedging derivatives
Deutsche Bank AG 1 1
1 1
Other liabilities
Deutsche Bank AG 39 35
DB Beteiligungs-Holding GmbH (formerly: DB Finanz-Holding GmbH) 77 9
Other related parties 4 1
120 45
The liabilities to Deutsche Bank AG primarily comprise secu-rities repurchase transactions.
The other liabilities to DB Beteiligungs-Holding GmbH relate to effects of the control and profit and loss transfer agreement that were recognized in retained earnings.
Income and expenses from related parties
Jan. 1 – June 30,
2017€m
Jan. 1 – June 30,
20161
€m
Interest income
Deutsche Bank AG 6 7
Other related parties – 6 – 5
0 2
Interest expense
Deutsche Bank AG 2 2
Other related parties 0 0
2 2
Fee and commission income
Deutsche Bank AG 13 15
Other related parties 11 15
24 30
Fee and commission expense
Deutsche Bank AG 1 1
Other related parties 0 0
1 1
Net trading income
Deutsche Bank AG 12 2
12 2
Net income from investment securities
Other related parties 0 0
0 0
Administrative expenses
Deutsche Bank AG 7 14
Subsidiaries 5 5
Other related parties 7 6
19 25
Other income
Deutsche Bank AG 2 18
Subsidiaries 1 1
Other related parties 5 3
8 22
Other expenses
Other related parties 0 0
0 0
1Figures adjusted (see Note 2)
Interest income attributable to other related parties mainly relates to expenses incurred in connection with loan brokerage, which are included in effective interest. These expenses were previously reported under administrative expenses. Retroactive application of the change in presen-tation reduced interest income and thus administrative expenses by €6 million in the previous-year period.

03INTERIM FINANCIAL STATEMENTS NOTES
7373Interim Report as of June 30, 2017
INT
ER
IM F
INA
NC
IAL
STA
TE
ME
NT
S
(35) Members of executive bodiesManagement Board
The members of the Management Board are:
Frank Strauss, Bad Nauheim (Chairman)
Marc Hess, Bonn
Susanne Klöss-Braekler, Munich
Philip Laucks, Goldbach since June 1, 2017
Ralph Müller, Bonn
Ralf Stemmer, Königswinter until May 31, 2017
Hanns-Peter Storr, Bonn
Lars Stoy, Bonn since June 1, 2017
The members of the Supervisory Board of Deutsche Postbank AG are:
1. Shareholder representatives
Werner Steinmüller (Chairman)Member of the Management Board of Deutsche Bank AG, Dreieich-Buchschlag
Edgar ErnstPresident of the Financial Reporting Enforcement Panel, DPR e.V., Bonn
Stefanie Heberling Regional Manager, Retail Customers, central Ruhr regionDeutsche Bank Privat- und Geschäftskunden AG, Wuppertal
Tessen von HeydebreckChairman of the Board of Trustees of Deutsche Bank Foundation, Berlin
Katja Langenbucher-Adolff Professor for Private Law, Corporate and Financial Law, Goethe University Frankfurt am Main, Frankfurt am Main
Karen Meyer Global HR Business Partner PWCC&AM, Deutsche Bank AG, Frankfurt am Main
Christiana Riley CFO Corporate & Investment Banking, Deutsche Bank AG, Bad Homburg v.d.Höhe
Karl von Rohr Member of the Management Board of Deutsche Bank AG, Oberursel
Christian Sewing Member of the Management Board of Deutsche Bank AG, Osnabrück
Michael Spiegel Global Head of Trade Finance and Cash Management Corporates,Deutsche Bank AG, London
2. Employee representatives
Frank Bsirske (Deputy Chairman)Chairman of the ver.di Trade Union, Berlin
Susanne BleidtMember of Postbank Filialvertrieb AG‘s General Works Council, Bell
Frank Fuss Chairman of the General Works Council of Deutsche Postbank AG, Elsdorf
since March 22, 2017
Timo HeiderChairman of the General Works Council of BHW Bausparkasse Aktiengesellschaft and Postbank Finanzberatung, Emmerthal
Jens Isselmann Executive employee of Deutsche Postbank AG, Bornheim
Hans-Jürgen Kummetat Civil servant, Cologne
until March 22, 2017
Bernd RoseChairman of the General Works Council of Postbank Filialvertrieb AG/Postbank Filial GmbH, Menden (Sauerland)
Martina Scholze Trade union secretary of the ver.di Trade Union, Munich
Eric Stadler Chairman of Betriebs-Center für Banken AG’s Works Council, Markt Schwaben
Gerd Tausendfreund Trade union secretary of the ver.di Trade Union, Nidderau
Renate Treis Deputy Chair of Deutsche Postbank AG‘sGeneral Works Council, Brühl
until February 28, 2017
Anna Lisa Trompa Chair of the representative body for young workers and trainees, Deutsche Postbank AG, Lehrte
since March 22, 2017

Interim Report as of June 30, 2017
RESPONSIBILITY STATEMENT
To the best of our knowledge, and in accordance with the applicable reporting principles for interim financial report-ing, the condensed interim consolidated financial statements give a true and fair view of the assets, liabilities, financial position, and profit or loss of the Group, and the interim management report of the Group includes a fair review of the development and performance of the business and the position of the Group, together with a description of the material opportunities and risks associated with the expected development of the Group for the remaining months of the fiscal year.
Bonn, August 2, 2017
Deutsche Postbank Aktiengesellschaft
The Management Board
Frank Strauss
Marc Hess Susanne Klöss-Braekler
Philip Laucks Ralph Müller
Hanns-Peter Storr Lars Stoy
7474

INT
ER
IM F
INA
NC
IAL
STA
TE
ME
NT
S
Interim Report as of June 30, 2017
REVIEW REPORT
To Deutsche Postbank AG, Bonn
We have reviewed the condensed consolidated interim financial statements - comprising the statement of financial position, statement of comprehensive income, condensed statement of cash flows, statement of changes in equity and selected explanatory notes - and the interim group manage - ment report of Deutsche Postbank AG, Bonn, for the period from January 1 to June 30, 2017 which are part of the half-year financial report pursuant to § (Article) 37w WpHG ("Wertpapierhandelsgesetz": German Securities Trading Act). The preparation of the condensed consolidated interim financial statements in accordance with the IFRS applicable to interim financial reporting as adopted by the EU and of the interim group management report in accordance with the provisions of the German Securities Trading Act applicable to interim group management reports is the responsibility of the parent Company's Board of Managing Directors. Our responsibility is to issue a review report on the condensed consolidated interim financial statements and on the interim group management report based on our review.
We conducted our review of the condensed consolidated interim financial statements and the interim group management report in accordance with German generally accepted standards for the review of financial statements promulgated by the Institut der Wirtschaftsprüfer (Insti-tute of Public Auditors in Germany) (IDW). Those standards require that we plan and perform the review so that we can preclude through critical evaluation, with moderate assurance, that the condensed consolidated interim financial statements have not been prepared, in all material respects, in accordance with the IFRS applicable to interim financial reporting as adopted by the EU and that the interim group management report has not been prepared, in all material respects, in accordance with the provisions of the German Securities Trading Act applicable to interim group manage-ment reports. A review is limited primarily to inquiries of company personnel and analytical procedures and therefore does not provide the assurance attainable in a financial statement audit. Since, in accordance with our engagement, we have not performed a financial statement audit, we cannot express an audit opinion.
Based on our review, no matters have come to our attention that cause us to presume that the condensed concolidated interim financial statements have not been prepared, in all material respects, in accordance with the IFRS applicable to interim financial reporting as adopted by the EU nor that the interim group management report has not been prepared, in all material respects, in accordance with the provisions of the German Securities Trading Act applicable to interim group management reports.
Düsseldorf, August 2, 2017
PricewaterhouseCoopers GmbHWirtschaftsprüfungsgesellschaft
Burkhard Eckes Christian F. RabelingWirtschaftsprüfer Wirtschaftsprüfer(German Public Auditor) (German Public Auditor)
75
03
75
03INTERIM FINANCIAL STATEMENTS NOTES REVIEW REPORT

Interim Report as of June 30, 2017
REGULATORY DISCLOSURES
Regulatory disclosurePostbank has been part of the Deutsche Bank banking group since December 2010 and has published all informa-tion relevant to regulatory disclosures since then within the framework of the Deutsche Bank Group’s Pillar III reports. Since 2014, Article 13 of Regulation (EU) No. 575/2013 on prudential requirements for credit institutions and invest-ment firms (Capital Requirements Regulation – CRR) has required significant subsidiaries of EU parent institutions to also publish regulatory disclosures. All information given
below relates to the Postbank Group (hereinafter referred to as “Postbank”) as a subgroup of the Deutsche Bank banking group.
The following table gives an overview of the information to be provided by Postbank in accordance with Part 8 in con-junction with Article 13 of the CRR and the provisions of the Kreditwesengesetz (KWG – German Banking Act) transpo-sing the Capital Requirements Directive (CRD) into national law, and lists the section of the Interim Report and, in terms of qualitative disclosures, the section of the 2016 Annual Report in which the relevant disclosures are made:
Implementation of regulatory disclosure requirements
Pillar III disclosure topic Relevant section of Interim Report and 2016 Annual Report
Own funds disclosures in accordance with Article 437 of the CRR and on capital requirements in accordance with Article 438 of the CRR
- Other Information, “Regulatory Disclosures”
Disclosures on capital buffers (Article 440 of the CRR) - Other Information, “Regulatory Disclosures”
Credit risk adjustment disclosures in accordance with Article 442 of the CRR and on credit risk mitigation techniques in accordance with Article 453 of the CRR, to the extent that these are not already covered by the qualitative disclosures in the 2016 Group Management Report (see below)
- Other Information, “Regulatory Disclosures”
Legal and organizational structure and principles of the proper conduct of business (section 26a of the Kreditwesengesetz (KWG – German Banking Act))
- 2016 Group Management Report, “Business and Environment“- 2016 Group Risk Report, “Organization of risk management” - Other Information, “Regulatory Disclosures”
Qualitative disclosures on credit risk adjustments in accordance with Article 442a) and b) of the CRR and on credit risk mitigation techniques in accordance with Article 453a) to e) of the CRR
- 2016 Group Risk Report, “Monitoring and managing credit risk“
Disclosures on remuneration policy (Article 450 of the CRR) - 2016 Group Management Report, “Remuneration of the Management Board and the Supervisory Board“
Disclosures on leverage (Article 451 of the CRR) - Other Information, “Regulatory Disclosures”
Information on regulatory approachesAs of the reporting date of June 30, 2017, Postbank calcu-lated the regulatory capital requirements for the follow - ing portfolios – grouped by exposure class in accordance with the CRR – on the basis of the rules set out in the In - ternal Rating Approaches: central governments (countries), institutions (banks), corporates (domestic corporate custom-ers, foreign corporate customers, commercial real estate finance (commercial mortgages)), purchased corporate loans, insurers, retail business (Deutsche Postbank AG mortgage loans, BHW mortgage loans, installment loans, overdraft facilities for self-employed individuals and business cus-tomers, purchased retail loans), equity exposures (unless covered by the exception in section 17 of the Solvabilitäts-verordnung (SolvV – German Solvency Regulation)), secu-ritization positions, and other non-credit obligation assets.
In addition to using the Foundation IRB Approach and the IRB Approach to calculate the capital requirements for its retail business, Postbank calculates the capital requirements for its countries, banks, insurers, corporates and commercial real estate finance (commercial mortgages) portfolios using the Advanced IRB Approach (A-IRBA). The Bank plans to transfer the rating system applied to overdrafts for retail customers to the A-IRB Approach in the second half of 2017. Postbank uses the Credit Risk Standardized Approach (CRSA) for the portfolios not calculated in accordance with the IRB approaches. These primarily relate to the following portfolios: overdrafts and collection activities in the Retail Banking segment, portfolios belonging to the other subsidiaries of Postbank with the exception of BHW mortgage loans and PB Factoring GmbH, business from discontinued operations,
and exposures to public-sector counterparties in the Euro - pean Economic Area.
In the case of securitization positions, the IRB Approach or the CRSA is applied, based on the underlying transactions. Capital backing for securitization positions is generally calculated on the basis of the ratings-based approach using external ratings.
As of the reporting date, the Postbank Group did not hold any originator securitization with regulatory relevance.
Postbank calculates the capital backing for other non-credit obligation assets and equity exposures allocated to the banking book that are not required to be consolidated or deducted from own funds for regulatory purposes using regulatory risk weights. Currently, Postbank does not have any equity exposures for which capital backing has been calculated on the basis of default probabilities and loss rates. Strategic equity exposures held prior to January 1, 2008, have been temporarily excluded from IRBA capital backing and are calculated using the CRSA.
Postbank uses the supervisory Standardized Approach to calculate its capital requirements for market risk. Postbank uses the Standardized Approach to quantify its capital requirements for operational risk.
76

Interim Report as of June 30, 2017
Information on regulatory consolidationThe regulatory scope of consolidation corresponds to the consolidated group for accounting purposes as presented in Note 3 to the 2017 Interim Financial Statements with the exception of the following two companies, which are con-solidated for accounting but not for regulatory purposes:
• Postbank Finanzberatung AG
• Postbank Immobilien GmbH.
Postbank does not have any subsidiaries required to be con - solidated for regulatory but not for accounting purposes.
Overall portfolio disclosures The following tables present the disclosures for the overall portfolio with average amounts per exposure class over the reporting period, broken down by sector, region, and residual maturity in accordance with Article 442 of the CRR. The tables show the lending volume in each case, broken down by the different types of exposure classes, as of the disclosure date. Exposure values (EAD – expected amount
of the exposure at the time of possible default) are reported before factoring in credit risk mitigation/sub stitution effects and after applying credit conversion factors. Derivatives are reported at their positive replacement values plus a regulatory add-on. Exposure classes for which Postbank does not have any exposures are not shown in the tables. These are the “Institutions and corporates with a short-term credit assessment” and “Exposures associated with a particularly high risk” exposure classes. The “Other non- credit obligation assets” exposure class is not reported in the tables below. The total amount of the exposures concerned was €2,280 million as of the reporting date (December 31, 2016: €2,912 million). In addition, the exposure for contributions to the default fund of a central counter-party (CCP) amounted to €88 million as of the reporting date (December 31, 2016: €121 million).
The following table shows the average exposure values during the reporting period before the effects of credit risk mitigation, broken down by the different types of exposure classes:
Total amount of exposure values and average amounts per exposure class
Exposure classes Average amounts Total
July 1, 2016 – June 30, 2017
€m
Jan. 1, 2016 – Dec. 31, 2016
€m
June 30, 2017
€m
Dec. 31, 2016
€m
IRBA governments and central banks 214 171 391 169
IRBA institutions 6,472 7,837 5,443 6,124
IRBA corporates 23,553 22,875 24,292 23,323
IRBA retail exposures 83,180 81,298 85,027 83,097
IRBA equity exposures 34 106 34 38
IRBA securitization positions 182 253 50 55
CRSA governments and central banks 17,446 13,603 20,435 17,890
CRSA regional governments and local authorities 8,518 8,886 7,736 8,612
CRSA other public-sector entities 1,696 1,931 1,492 1,633
CRSA multilateral development banks 738 836 634 794
CRSA international organizations 1,282 1,339 1,182 1,292
CRSA institutions 1,868 1,948 1,483 2,330
CRSA corporates 832 944 807 783
CRSA retail exposures 2,126 2,187 2,191 2,199
CRSA exposures secured by real estate property 1,210 1,464 1,223 1,194
CRSA exposures in default 96 135 82 100
CRSA covered bonds – – – –
CRSA securitization positions – 75 – –
CRSA UCITS – – – –
CRSA equity exposures 230 228 226 233
CRSA other items – – – –
Total 149,677 146,116 152,728 149,866
77
04OTHER INFORMATION REGULATORY DISCLOSURES
OT
HE
R I
NFO
RM
AT
ION

Interim Report as of June 30, 2017
The following table shows the exposure values broken down by the different types of exposure classes and by the sectors and obligor groups of relevance to Postbank:
Total amount of exposure values by sector and obligor group
Exposure classes
Retail customers
Banks/insurers/financial services
providers
Governments
Commercial real estate
finance
Service providers/wholesale and retail
Industry
Other sectors
Total
June 30,
2017€m
Dec. 31,
2016€m
June 30,
2017€m
Dec. 31,
2016€m
June 30,
2017€m
Dec. 31,
2016€m
June 30,
2017€m
Dec. 31,
2016€m
June 30,
2017€m
Dec. 31,
2016€m
June 30,
2017€m
Dec. 31,
2016€m
June 30,
2017€m
Dec. 31,
2016€m
June 30,
2017€m
Dec. 31,
2016€m
IRBA govern-ments and central banks – – – – 391 169 – – – – – – – – 391 169
IRBA institutions – – 5,443 5,968 0 126 – 30 0 0 – – 0 0 5,443 6,124
IRBA corporates 284 288 2,004 2,135 0 0 8,320 7,741 7,170 7,058 4,698 4,443 1,816 1,658 24,292 23,323
IRBA retail exposures 85,027 83,097 – – – – – – – – – – – – 85,027 83,097
IRBA equity exposures – – 28 29 – – – – 1 9 – – 5 0 34 38
IRBA securiti-zation positions – – 50 55 – – – – – – – – – – 50 55
CRSA govern - ments and central banks – – 9,226 6,282 10,791 11,190 – – 418 418 – – – – 20,435 17,890
CRSA regional governments and local authorities – – – – 7,721 8,596 15 16 0 0 – – – – 7,736 8,612
CRSA other public-sector entities – – 1,179 1,317 241 231 – – 42 49 – – 30 36 1,492 1,633
CRSA multilateral development banks – – 634 794 – – – – – – – – – – 634 794
CRSA international organizations – – 681 787 501 505 – – – – – – – – 1,182 1,292
CRSA institutions – – 1,483 2,330 – – – – – – – – – – 1,483 2,330
CRSA corporates 3 3 41 51 – – 195 166 300 321 176 149 92 93 807 783
CRSA retail exposures 2,191 2,199 – – – – – – – – – – – – 2,191 2,199
CRSA exposures secured by real estate property 1,174 1,144 0 0 – – 45 45 2 3 0 0 2 2 1,223 1,194
CRSA exposures in default 49 58 0 0 0 0 7 14 18 19 0 0 8 9 82 100
CRSA covered bonds – – – – – – – – – – – – – – – –
CRSA securiti - zation positions – – – – – – – – – – – – – – – –
CRSA UCITS – – – – – – – – – – – – – – – –
CRSA equity exposures – – 221 223 – – – – 0 5 – – 5 5 226 233
CRSA other items – – – – – – – – – – – – – – – –
Total 88,728 86,789 20,990 19,971 19,645 20,817 8,582 8,012 7,951 7,882 4,874 4,592 1,958 1,803 152,728 149,866
Of the amounts reported, the following exposures relate to loans to small and medium-sized enterprises (SMEs):
78

Interim Report as of June 30, 2017
Total amount of exposure values by sector and obligor group for small and medium-sized enterprises (SMEs)
Exposure classes
Retail customers
Banks/insurers/financial services
providers
Govern-ments
Commercial real estate
finance
Service providers/wholesale and retail
Industry
Other sectors
Total
June 30,
2017€m
Dec. 31,
2016€m
June 30,
2017€m
Dec. 31,
2016€m
June 30,
2017€m
Dec. 31,
2016€m
June 30,
2017€m
Dec. 31,
2016€m
June 30,
2017€m
Dec. 31,
2016€m
June 30,
2017€m
Dec. 31,
2016€m
June 30,
2017€m
Dec. 31,
2016€m
June 30,
2017€m
Dec. 31,
2016€m
IRBA retail exposures 400 342 – – – – – – – – – – – – 400 342
IRBA corporates 0 0 17 22 – – – – 616 610 288 332 73 120 994 1,084
CRSA corporates – – 8 17 – – 4 4 26 24 24 40 20 23 82 108
CRSA retail exposures 50 47 – – – – – – – – – – – – 50 47
CRSA exposures secured by real estate property – – – – – – 6 7 0 0 – – – – 6 7
Total 450 389 25 39 – – 10 11 642 634 312 372 93 143 1,532 1,588
The following table shows the exposure values broken down by the different types of exposure classes and by Postbank’s significant geographic business regions. The expo - sures are allocated on the basis of the obligor’s legal country of domicile.
Total amount of exposure values by geographic region
Exposure classes Germany Western Europe
North America
Other regions
Total
June 30, 2017
€m
Dec. 31, 2016
€m
June 30, 2017
€m
Dec. 31, 2016
€m
June 30, 2017
€m
Dec. 31, 2016
€m
June 30, 2017
€m
Dec. 31, 2016
€m
June 30, 2017
€m
Dec. 31, 2016
€m
IRBA governments and central banks 125 – 236 138 – – 30 31 391 169
IRBA institutions 3,668 3,986 1,713 1,995 57 138 5 5 5,443 6,124
IRBA corporates 15,058 14,857 8,185 7,432 496 537 553 497 24,292 23,323
IRBA retail exposures 83,157 81,090 1,789 1,935 23 22 58 50 85,027 83,097
IRBA equity exposures 34 23 – – – 15 – – 34 38
IRBA securitization positions – – 50 55 – – – – 50 55
CRSA governments and central banks 10,464 7,548 9,857 10,225 – – 114 117 20,435 17,890
CRSA regional governments and local authorities 7,736 8,612 – – – – – – 7,736 8,612
CRSA other public-sector entities 1,425 1,565 67 68 – – – – 1,492 1,633
CRSA multilateral development banks – – 634 794 – – – – 634 794
CRSA international organizations – – 1,182 1,292 – – – – 1,182 1,292
CRSA institutions 376 1,266 1,106 1,062 1 2 – – 1,483 2,330
CRSA corporates 660 678 65 48 0 0 82 57 807 783
CRSA retail exposures 2,117 2,127 71 69 1 1 2 2 2,191 2,199
CRSA exposures secured by real estate property 178 183 1,045 1,010 0 0 0 1 1,223 1,194
CRSA exposures in default 70 85 12 15 0 0 0 0 82 100
CRSA covered bonds – – – – – – – – – –
CRSA securitization positions – – – – – – – – – –
CRSA UCITS – – – – – – – – – –
CRSA equity exposures 226 228 0 5 – – – – 226 233
CRSA other items – – – – – – – – – –
Total 125,294 122,248 26,012 26,143 578 715 844 760 152,728 149,866
79
04OTHER INFORMATION REGULATORY DISCLOSURES
OT
HE
R I
NFO
RM
AT
ION

Interim Report as of June 30, 2017
The following table presents the regulatory exposure values, broken down by the different types of exposure classes and the residual maturities of relevance to Postbank. Checking accounts, other guarantees, and transactions under settle-ment are assigned to the “less than one year” maturity band. The amounts assigned to the “more than five years” maturity band largely comprise longer-term bonds, private mortgage lending, and commercial lending.
Total amount of exposure values by residual maturity
Exposure classes < 1 year 1–5 years > 5 years Total
June 30,
2017€m
Dec. 31,
2016€m
June 30,
2017€m
Dec. 31,
2016€m
June 30,
2017€m
Dec. 31,
2016€m
June 30,
2017€m
Dec. 31,
2016€m
IRBA governments and central banks 27 7 105 83 259 79 391 169
IRBA institutions 1,090 1,458 2,555 2,773 1,798 1,893 5,443 6,124
IRBA corporates 4,990 4,742 7,904 7,637 11,398 10,944 24,292 23,323
IRBA retail exposures 3,663 3,902 6,477 6,620 74,887 72,575 85,027 83,097
IRBA equity exposures – – – – 34 38 34 38
IRBA securitization positions 50 55 – – – – 50 55
CRSA governments and central banks 12,721 8,111 5,155 7,332 2,559 2,447 20,435 17,890
CRSA regional governments and local authorities 1,128 1,438 3,600 3,710 3,008 3,464 7,736 8,612
CRSA other public-sector entities 354 233 829 1,052 309 348 1,492 1,633
CRSA multilateral development banks 38 175 522 544 74 75 634 794
CRSA international organizations 370 219 464 682 348 391 1,182 1,292
CRSA institutions 44 916 – – 1,439 1,414 1,483 2,330
CRSA corporates 135 74 313 324 359 385 807 783
CRSA retail exposures 1,017 978 359 373 815 848 2,191 2,199
CRSA exposures secured by real estate property 501 541 134 169 588 484 1,223 1,194
CRSA exposures in default 82 100 – – – – 82 100
CRSA covered bonds – – – – – – – –
CRSA securitization positions – – – – – – – –
CRSA UCITS – – – – – – – –
CRSA equity exposures – – – – 226 233 226 233
CRSA other items – – – – – – – –
Total 26,210 22,949 28,417 31,299 98,101 95,618 152,728 149,866
80

Interim Report as of June 30, 2017
The following table provides an overview of the exposure values for the specialized lending exposures calculated in accordance with Article 153(5) of the CRR, broken down by risk weight category. The exposures relate to commercial real estate finance, loans to property developers, operator models, real estate leasing, and private mortgage finance for properties with more than ten residential units.
Exposure values for IRBA specialized lending
Dec. 31, 2017
€m
Dec. 31, 2016
€m
Risk weight 1 (strong) 1,020 1,088
Risk weight 2 (good) 371 401
Risk weight 3 (satisfactory) 55 81
Risk weight 4 (weak) 17 37
Risk weight 5 (defaulted) 41 29
Total 1,504 1,636
The following table shows the exposure values for equity exposures calculated using the simple risk weight approach in accordance with Article 155(2) of the CRR. In addition to these equity exposure values, Postbank, as of the reporting date, had further exposures amounting to €226 million (as of December 31, 2016: €233 million) that relate to equity exposures – temporarily excluded from IRBA – held prior to January 1, 2008, that have been assigned a regulatory risk weight of 100 % on the basis of the exception defined in Article 495(1) of the CRR in connection with Article 17 of the SolvV (so-called “grandfathering”).
Exposure values for IRBA equity exposures in accordance with simple risk weight approach
June 30, 2017
€m
Dec. 31, 2016
€m
Private equity exposures in sufficiently diversified portfolios (risk weight 190 %) – –
Exchange-traded equity exposures (risk weight 290 %) – –
Other equity exposures (risk weight 370 %) 34 38
Total 34 38
81
04OTHER INFORMATION REGULATORY DISCLOSURES
OT
HE
R I
NFO
RM
AT
ION
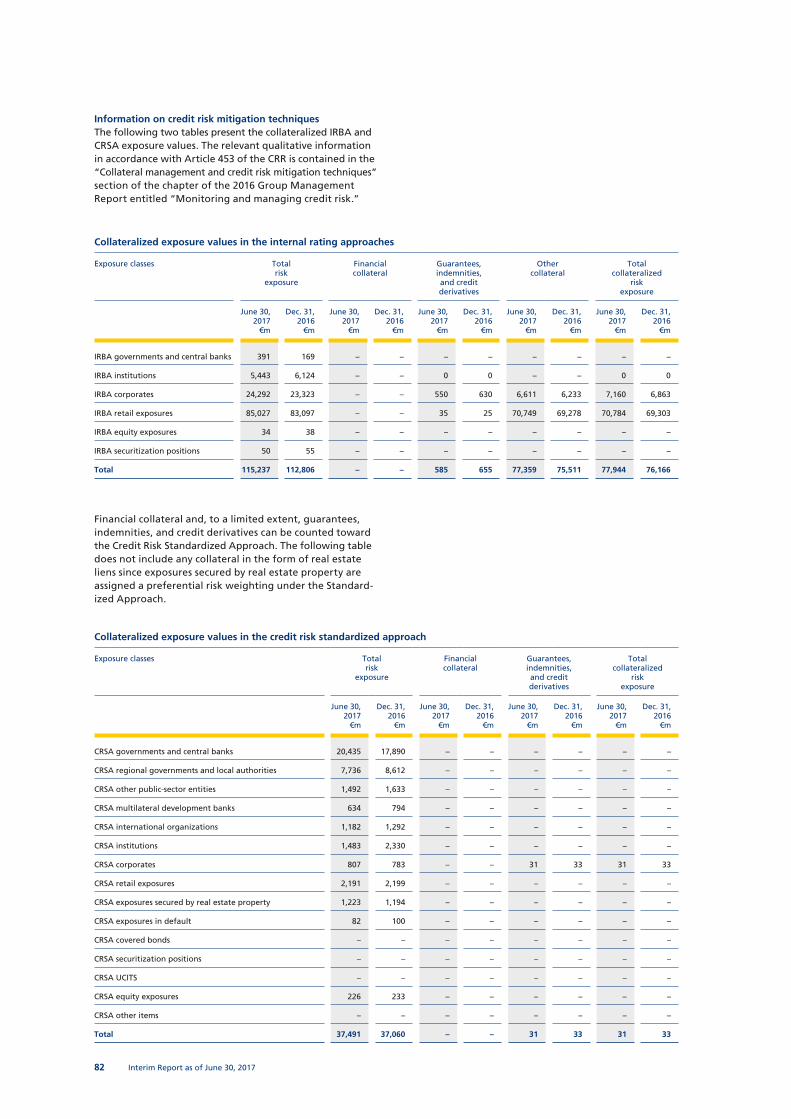
Interim Report as of June 30, 2017
Information on credit risk mitigation techniquesThe following two tables present the collateralized IRBA and CRSA exposure values. The relevant qualitative information in accordance with Article 453 of the CRR is contained in the “Collateral management and credit risk mitigation techniques” section of the chapter of the 2016 Group Management Report entitled “Monitoring and managing credit risk.”
Collateralized exposure values in the internal rating approaches
Exposure classes
Totalrisk
exposure
Financial collateral
Guarantees, indemnities, and credit derivatives
Other collateral
Totalcollateralized
riskexposure
June 30, 2017
€m
Dec. 31, 2016
€m
June 30, 2017
€m
Dec. 31, 2016
€m
June 30, 2017
€m
Dec. 31, 2016
€m
June 30, 2017
€m
Dec. 31, 2016
€m
June 30, 2017
€m
Dec. 31, 2016
€m
IRBA governments and central banks 391 169 – – – – – – – –
IRBA institutions 5,443 6,124 – – 0 0 – – 0 0
IRBA corporates 24,292 23,323 – – 550 630 6,611 6,233 7,160 6,863
IRBA retail exposures 85,027 83,097 – – 35 25 70,749 69,278 70,784 69,303
IRBA equity exposures 34 38 – – – – – – – –
IRBA securitization positions 50 55 – – – – – – – –
Total 115,237 112,806 – – 585 655 77,359 75,511 77,944 76,166
Financial collateral and, to a limited extent, guarantees, indemnities, and credit derivatives can be counted toward the Credit Risk Standardized Approach. The following table does not include any collateral in the form of real estate liens since exposures secured by real estate property are assigned a preferential risk weighting under the Standard-ized Approach.
Collateralized exposure values in the credit risk standardized approach
Exposure classes
Totalrisk
exposure
Financial collateral
Guarantees, indemnities, and credit derivatives
Totalcollateralized
riskexposure
June 30, 2017
€m
Dec. 31, 2016
€m
June 30, 2017
€m
Dec. 31, 2016
€m
June 30, 2017
€m
Dec. 31, 2016
€m
June 30, 2017
€m
Dec. 31, 2016
€m
CRSA governments and central banks 20,435 17,890 – – – – – –
CRSA regional governments and local authorities 7,736 8,612 – – – – – –
CRSA other public-sector entities 1,492 1,633 – – – – – –
CRSA multilateral development banks 634 794 – – – – – –
CRSA international organizations 1,182 1,292 – – – – – –
CRSA institutions 1,483 2,330 – – – – – –
CRSA corporates 807 783 – – 31 33 31 33
CRSA retail exposures 2,191 2,199 – – – – – –
CRSA exposures secured by real estate property 1,223 1,194 – – – – – –
CRSA exposures in default 82 100 – – – – – –
CRSA covered bonds – – – – – – – –
CRSA securitization positions – – – – – – – –
CRSA UCITS – – – – – – – –
CRSA equity exposures 226 233 – – – – – –
CRSA other items – – – – – – – –
Total 37,491 37,060 – – 31 33 31 33
82

Interim Report as of June 30, 2017
Information on the allowance for losses on loans and ad vances The figures for the allowance for losses on loans and advances shown in the following tables relate to the entire Postbank Group portfolio; in other words, they cover the portfolios subject both to the IRB approaches and to the CRSA. The relevant qualitative information in accordance with Article 442(a) and (b) of the CRR is contained in the “Past due and impaired exposures” and “Allowance for losses on loans and advances” sections of the chapter of the 2016 Group Risk Report entitled “Monitoring and managing credit risk.”
The recognized allowance for losses on loans and advances relates to loans and advances to customers and to other banks. Gains and losses on the sale and remeasurement of investment securities, equity interests, and investments in unconsolidated subsidiaries are not reported below but in net income from investment securities (see Note 8 to the 2017 Interim Financial Statements).
The following table shows the exposure values of impaired and past due exposures, the amounts of and changes in specific valuation allowances, portfolio-based valuation allow - ances, and provisions as of June 30, 2017, and the prior-year closing date, including direct writedowns of and recoveries on loans written off, broken down in each case by the sectors of relevance to Postbank. The net amounts recog-nized represent the differences between additions to and reversals of the allowances for losses and provisions. The provisions relate primarily to undrawn commitments and guarantees.
Overall, the presentation of the allowance for losses on loans and advances – broken down by the sectors and obligor groups of relevance to Postbank – reflects Postbank’s focus on the retail business. The exposure values of im-paired exposures also include exposures to customers that have been classified as impaired due to the default of other exposures of that customer.
Allowance for losses on loans and advances, broken down by sector and obligor group
Retail customers
Banks/insurers/financialservices
providers
Governments
Commercial real estate
finance
Service providers/wholesale and retail
Industry
Other sectors
Total
June 30,
2017 €m
Dec. 31,
2016 €m
June 30,
2017 €m
Dec. 31,
2016 €m
June 30,
2017 €m
Dec. 31,
2016 €m
June 30,
2017 €m
Dec. 31,
2016 €m
June 30,
2017 €m
Dec. 31,
2016 €m
June 30,
2017 €m
Dec. 31,
2016 €m
June 30,
2017 €m
Dec. 31,
2016 €m
June 30,
2017 €m
Dec. 31,
2016 €m
Exposures
Impaired exposures 1,688 1,732 49 54 7 7 226 201 80 88 88 90 36 35 2,174 2207
Past due exposures 129 134 0 0 – – 0 4 0 2 0 3 0 0 129 143
Portfolios
Specific valuation allowances 565 593 – – 3 4 46 79 34 35 54 56 32 31 734 798
Portfolio-based valuation allowances 168 174 – – – – 7 11 – – 10 12 3 3 188 200
Provisions 11 14 – – – – 9 15 – – 9 16 – – 29 45
Period expense
Specific valuation allowances 71 162 – – – – – 32 – 5 – 7 – 4 – 2 11 37 175
Portfolio-based valuation allowances – 6 – 5 – – – – – 4 5 – – – 3 2 – – – 13 2
Provisions – 2 – 8 – – – – – 6 9 – – – 5 5 – – – 13 6
83
04OTHER INFORMATION REGULATORY DISCLOSURES
OT
HE
R I
NFO
RM
AT
ION

Interim Report as of June 30, 2017
Similarly, the following overview gives a breakdown of the allowance for losses on loans and advances by the geo - graphic regions/areas of relevance to Postbank. In line with the CRR, no changes in the allowance for losses on loans and advances are shown in this table. The distribution of the allowance for losses on loans and advances corresponds to the distribution of the exposure values in the underlying loan portfolios.
Allowance for losses on loans and advances, broken down by geographic region
Germany Western Europe Other regions Total
June 30, 2017
€m
Dec. 31, 2016
€m
June 30, 2017
€m
Dec. 31, 2016
€m
June 30, 2017
€m
Dec. 31, 2016
€m
June 30, 2017
€m
Dec. 31, 2016
€m
Exposures
Impaired exposures 1,760 1,813 403 382 11 12 2,174 2,207
Past due exposures 122 137 7 6 0 0 129 143
Portfolios
Specific valuation allowances 673 695 61 103 – – 734 798
Portfolio-based valuation allowances 184 196 4 4 – – 188 200
Provisions 29 45 – – – – 29 45
For information on changes in the allowance for losses on loans and advances in the course of the reporting period and the disclosures in accordance with Article 442i) of the CRR, please see Note 5 to the 2017 Interim Financial Statements.
Composition and reconciliation of Postbank’s own fundsPostbank’s own funds are calculated on the basis of its IFRS consolidated financial statements and in accordance with the requirements laid down in the CRR and SolvV. This section deals with the capital adequacy of the banking group as consolidated for the purposes of bank supervisory reporting in accordance with Article 11 ff. of the CRR and with the KWG and serves to disclose the elements of own funds during the transitional period in accordance with Article 492(3) and Article 437(1)d) and e) of the CRR, and to reconcile own funds items with balance sheet items in accordance with Article 437(1)a) of the CRR.
The following table first shows the figures of the IFRS consolidated balance sheet reflecting the accounting basis of consolidation and, second, the figures disclosed in the regulatory balance sheet reflecting the regulatory basis of consolidation. In contrast to the IFRS consolidated balance sheet, the regulatory balance sheet does not include the following subsidiaries: Postbank Finanzberatung AG and Postbank Immobilien GmbH. The delta column shows the difference between the figures in the IFRS consolidated balance sheet and those in the regulatory balance sheet. The references in the last column point to the tables that follow, which present the composition of own funds. These references are explained at the end of this section below the table “Transitional own funds disclosure and balance sheet references” in order to reconcile the balance sheet items, which are relevant for own funds calculation, with regulatory own funds items.
84

Interim Report as of June 30, 2017
Presentation of the balance sheet by financial reporting consolidation and regulatory scope of consolidation
IFRS balance sheet Regulatory balance sheet
Delta Reference
June 30, 2017
€m
Dec. 31, 2016
€m
June 30, 2017
€m
Dec. 31, 2016
€m
June 30, 2017
€m
Dec. 31, 2016
€m
Assets
Cash reserve 1,604 2,291 1,604 2,291 0 0
Loans and advances to other banks 11,887 13,108 11,887 13,108 0 0
Loans and advances to customers 103,799 102,003 103,792 101,996 – 8 – 7
Allowance for losses on loans and advances – 922 – 998 – 922 – 998 – –
Trading assets 390 475 390 475 – –
Hedging derivatives 69 112 69 112 – –
Investment securities 24,504 26,767 24,712 26,975 207 208
Intangible assets 1,984 1,963 1,555 1,534 – 429 – 429 f
Goodwill 1,581 1,581 1,152 1,152 – 429 – 429
Other intangible assets 403 382 403 382 0 0
Property and equipment 709 699 707 698 – 1 – 1
Current tax assets 110 144 110 143 0 – 1
Deferred tax assets 186 198 161 171 – 25 – 27
Other assets 495 388 483 379 – 12 – 9
Assets held for sale 14 47 14 47 – –
Total assets 144,829 147,197 144,562 146,931 – 266 – 266
Equity and liabilities
Deposits from other banks 12,368 13,133 12,368 13,133 – –
Due to customers 118,051 118,918 118,138 119,002 87 84
Debt securities in issue 3,289 3,339 3,289 3,339 – –
Trading liabilities 309 409 309 409 – –
Hedging derivatives 31 42 31 42 – –
Provisions 800 907 752 858 – 48 – 49
Current tax liabilities 80 98 77 97 – 3 – 1
Deferred tax liabilities 4 17 4 17 0 0
Other liabilities 565 541 525 496 – 40 – 45
Subordinated debt 1,963 2,567 1,963 2,567 – – g
Equity 7,369 7,226 7,106 6,971 – 263 – 255
a) Issued capital 547 547 547 547 – – a
b) Share premium 2,191 2,191 2,191 2,191 – – b
c) Other reserves 4,330 4,171 4,075 3,922 – 255 – 249
Retained earnings 4,621 4,381 4,345 4,110 – 276 – 271 c
AOCI – 291 – 210 – 270 – 189 21 21 d
d) Consolidated net profit 301 317 293 311 – 8 – 6 e
Total equity and liabilities 144,829 147,197 144,562 146,931 – 266 – 266
Regulatory capital is broken down into three categories: Common Equity Tier 1 capital, Additional Tier 1 capital, and Tier 2 capital. In accordance with the transitional provisions of the CRR, capital instruments that are no longer permitted to be recognized are gradually phased out and the new prudential adjustments are gradually phased in.
The following table provides information in accordance with Articles 492(3) and 437(1)d) and e) of the CRR about Common Equity Tier 1 capital items, Additional Tier 1 capital items, and Tier 2 capital items, as well as about the prudential filters, deductions, and restrictions. The table is based on the “Transitional own funds disclosure template” contained in Annex VI of Commission Implementing Regulation No. 1423/2013 laying down implementing technical standards with regard to disclosure of own funds requirements for institutions in accordance with the CRR (CRR IR).
The “Amount of own funds position” column contains the amount used as the basis for calculating Postbank’s own funds as of the reporting date and as of the previous year-end. The “CRR reference” column lists the applicable provisions of the CRR. The next column shows the residual amounts resulting from transitional provisions that are deducted from other categories of capital, or not deducted at all, along with amounts that will not contribute toward own funds following full phase-in. The last column contains references to the balance sheet items used to calculate the own funds.
The information provided in the following table as of June 30, 2017, is subject to supervisory authority approval for the inclusion of interim profit; the comparative figures from the disclosure as of December 31, 2016, includes the interim profit as of September 30, 2016.
85
04OTHER INFORMATION REGULATORY DISCLOSURES
OT
HE
R I
NFO
RM
AT
ION

Interim Report as of June 30, 2017
Transitional own funds disclosure and balance sheet references
No.
Own funds position in accordance with CRR Impl. Reg. Annex VI
Amount of own funds position
Amount before CRR/residual
amount1
Refe-rence
CRR reference
June 30, 2017
€m
Dec. 31, 2016
€m
June 30, 2017
€m
Dec. 31, 2016
€m
Common Equity Tier 1 (CET1): instruments and reserves
1 Capital instruments and related share premium accounts 2,738 2,738 a+b 26 (1), 27, 28, 29
thereof: issued capital 547 547 a
thereof: share premium 2,191 2,191 b
2 Retained earnings 4,324 3,980 c 26 (1) (c)
3 Accumulated other comprehensive income (and other reserves, to include unrealized gains and losses under the applicable accounting standards)
– 270 – 71 d 26 (1)
3a Funds for general banking risk – – 26 (1) (f)
4 Amount of qualifying items referred to in Article 484(3) of the CRR and the related share premium accounts subject to phase out from CET1
– – 486 (2)
Public-sector capital injections grandfathered until January 1, 2018 – – – – 483 (2)
5 Minority interests (amount allowed in consolidated CET1) – – 84, 479, 480
5a Independently reviewed interim profits net of any foreseeable charge or dividend 293 174 e 26 (2)
6 Common Equity Tier 1 (CET1) capital before regulatory adjustments 7,085 6,821
Common Equity Tier 1 (CET1): regulatory adjustments
7 Additional value adjustments (negative amount) – 46 – 71 34, 105
8 Intangible assets (net of related tax liability) (negative amount) – 1,194 – 888 – 298 – 592 f 36 (1) (b), 37, 472 (4)
10
Deferred tax assets that rely on future profitability, excluding those arising from temporary differences (net of related tax liability where the conditions in Article 38(3) are met) (negative amount)
– 3 – 18 – 1 – 12 36 (1) (c), 38, 472 (5)
11 Fair value reserves related to gains or losses on cash flow hedges – – 33 (a)
12 Negative amounts resulting from the calculation of expected loss amounts – 161 – 156 – 40 – 104 36 (1) (d), 40, 159, 472 (6)
13 Any increase in equity that results from securitized assets (negative amount) – – 32 (1)
14 Gains or losses on liabilities valued at fair value resulting from changes in own credit standing 2
– 2 – 3 0 – 2 33 (b)
15 Defined benefit pension fund assets (negative amount) – – – – 36 (1) (e), 41, 472 (7)
16 Direct and indirect holdings by an institution of own CET1 instruments (negative amount) – – – – 36 (1) (f), 42, 472 (8)
17
Holdings of the CET1 instruments of financial-sector entities where those entities have a reciprocal cross-holding with the institution that has been designed to inflate artificially the own funds of the institution (negative amount)
– – – – 36 (1) (g), 44, 472 (9)
18
Direct and indirect holdings by the institution of the CET1 instruments of financial-sector entities where the institution does not have a significant investment in those entities (amount above the 10 % threshold and net of eligible short positions) (negative amount)
– – – – 36 (1) (h), 43, 45, 46, 49 (2) (3), 79, 472 (10)
19
Direct, indirect, and synthetic holdings by the institution of the CET1 instruments of financial-sector entities where the institution has a significant investment in those entities (amount above 10 % threshold and net of eligible short positions) (negative amount)
– – – – 36 (1) (i), 43, 45, 47, 48 (1) (b), 49 (1) bis (3), 79, 470, 472 (11)
20a Exposure amount of the following items which qualify for a RW of 1,250 %, where the institution opts for the deduction alternative
– – 36 (1) (k)
20b thereof: qualifying holdings outside the financial sector (negative amount) – – 36 (1) (k) (i), 89 bis 91
20c thereof: securitization positions (negative amount) – – 36 (1) (k) (ii), 243 (1) (b), 244 (1) (b), 258
20d thereof: free deliveries (negative amount) – – 36 (1) (k) (iii), 379 (3)
21
Deferred tax assets that rely on future profitability and arise from temporary differences (amount above 10 % threshold, net of related tax liability, where the conditions in Article 38(3) are met) (negative amount)
– – – – 36 (1) (c), 38, 48 (1) (a), 470, 472 (5)
22 Amount exceeding the 15 % threshold (negative amount) – – – – 48 (1)
23
thereof: direct and indirect holdings by the institution of the CET1 instruments of financial-sector entities where the institution has a significant investment in those entities
– – – – 36 (1) (i), 48 (1) (b), 470, 472 (11)
25 thereof: deferred tax assets that rely on future profitability and arise from temporary differences
– – – – 36 (1) (c), 38, 48 (1) (a), 470, 472 (5)
1 This column is used to report the residual amounts that were deducted from other categories of capital or not deducted at all on the basis of the transitional provision, and amounts that are subject to phase-out.
2 Also includes fair value gains and losses arising from Postbank’s own credit risk related to derivative liabilities in accordance with Article 33c) of the CCR.
86

Interim Report as of June 30, 2017
Transitional own funds disclosure and balance sheet references
No.
Own funds position in accordance with CRR Impl. Reg. Annex VI
Amount of own funds position
Amount before CRR/residual
amount1
Refe-rence
CRR reference
June 30, 2017
€m
Dec. 31, 2016
€m
June 30, 2017
€m
Dec. 31, 2016
€m
Common Equity Tier 1 (CET1): regulatory adjustments
25a Losses for the current fiscal year (negative amount) – – 71 – 47 36 (1) (a), 472 (3)
25b Foreseeable tax charges relating to CET1 items (negative amount) – – 36 (1) (I)
26 Regulatory adjustments applied to Common Equity Tier 1 in respect of amounts subject to pre-CRR treatment
– –
26a Regulatory adjustments relating to unrealized gains and losses pursuant to Articles 467 and 468
54 28
thereof: filter for unrealized gains on exposures to central governments classified in the “available for sale” category pursuant to the International Accounting Standard (IAS) 39 as adopted by the EU
– –
thereof: filter for other unrealized gains on equity and debt instruments – –
thereof: filter for unrealized losses on exposures to central governments classified in the “available for sale” category pursuant to the International Accounting Standard (IAS) 39 as adopted by the EU
– – 467
thereof: filter for other unrealized losses on equity and debt instruments 54 28 468
26b Amount to be deducted from or added to Common Equity Tier 1 capital with regard to additional filters and deductions required pre-CRR
– – 481
27 Qualifying AT1 deductions that exceed the AT1 capital of the institution (negative amount)
– – 36 (1) (j)
28 Total regulatory adjustments to Common Equity Tier 1 (CET1) – 1,352 – 1,179
29 Common Equity Tier 1 (CET1) capital 5,733 5,642
Additional Tier 1 capital (AT1): instruments
30 Capital instruments and related share premium accounts – – 51, 52
31 thereof: classified as equity under applicable accounting standards – –
32 thereof: classified as liabilities under applicable accounting standards – –
33 Amount of qualifying items referred to in Article 484(4) and the related share premium accounts subject to phase out from AT1
457 853 g 486 (3)
Public-sector capital injections grandfathered until January 1, 2018 – – 483 (3)
34 Qualifying Tier 1 capital instruments included in consolidated AT1 capital (including minority interests not included in row 5) issued by subsidiaries and held by third parties
– – 85, 86, 480
35 thereof: instruments issued by subsidiaries subject to phase out – – 486 (3)
36 Additional Tier 1 (AT1) capital before regulatory adjustments 457 853 g
Additional Tier 1 capital (AT1): regulatory adjustments
37 Direct and indirect holdings by an institution of own AT1 instruments (negative amount) – – 52 (1) (b), 56 (a), 57, 475 (2)
38
Holdings of the AT1 instruments of financial-sector entities where those entities have reciprocal cross-holdings with the institution designed to inflate artificially the own funds of the institution (negative amount)
– – 56 (b), 58, 475 (3)
39
Direct and indirect holdings by the institution of the AT1 instruments of financial-sector entities where the institution does not have a significant investment in those entities (amount above the 10 % threshold and net of eligible short positions) (negative amount)
– – 56 (c), 59, 60, 79, 475 (4)
40
Direct and indirect holdings by the institution of the AT1 instruments of financial-sector entities where the institution has a significant investment in those entities (amount above the 10 % threshold net of eligible short positions) (negative amount)
– – 56 (d), 59, 79, 475 (4)
41
Regulatory adjustments applied to Additional Tier 1 capital in respect of amounts subject to pre-CRR treatment and transitional treatments subject to phase out as prescribed in Regulation (EU) No. 575/2013 (i.e., CRR residual amounts)
– 318 – 644
41a
Residual amounts deducted from Additional Tier 1 capital with regard to deduction from Common Equity Tier 1 capital during the transitional period pursuant to Article 472 of Regulation (EU) No. 575/2013
– 318 – 644 472, 472 (3) (a), 472 (4), 472 (6), 472 (8) (a), 472 (9), 472 (10) (a), 472 (11) (a)
thereof: intangible assets – 298 – 592
thereof: negative amounts resulting from the calculation of expected loss amounts – 20 – 52
thereof: own instruments – –
41b
Residual amounts deducted from Additional Tier 1 capital with regard to deduction from Tier 2 capital during the transitional period pursuant to Article 475 of Regulation (EU) No. 575/2013
– – 477, 477 (3), 477 (4) (a)
41c
Amount to be deducted from or added to Additional Tier 1 capital with regard to additional filters and deductions required pre-CRR
– – 467, 468, 481
1 This column is used to report the residual amounts that were deducted from other categories of capital or not deducted at all on the basis of the transitional provision, and amounts that are subject to phase-out.
87
04OTHER INFORMATION REGULATORY DISCLOSURES
OT
HE
R I
NFO
RM
AT
ION

Interim Report as of June 30, 2017
Transitional own funds disclosure and balance sheet references
No.
Own funds position in accordance with CRR Impl. Reg. Annex VI
Amount of own funds position
Amount before CRR/residual
amount1
Refe-rence
CRR reference
June 30, 2017
€m
Dec. 31, 2016
€m
June 30, 2017
€m
Dec. 31, 2016
€m
Additional Tier 1 (AT1) capital: regulatory adjustments
42 Qualifying T2 deductions that exceed the T2 capital of the institution (negative amount) – – 56 (e)
43 Total regulatory adjustments to Additional Tier 1 (AT1) capital – 318 – 644
44 Additional Tier 1 (AT1) capital 139 209
45 Total Tier 1 capital (T1 = CET1 + AT1) 5,872 5,851
Tier 2 (T2) capital: instruments and reserves
46 Capital instruments and the related share premium accounts 499 5632 g 62, 63
47 Amount of qualifying items referred to in Article 484(5) and the related share premium accounts subject to phase out from T2 2 125
g 486 (4)
Public-sector capital injections grandfathered until January 1, 2018 – – 483 (4)
48
Qualifying own funds instruments included in consolidated T2 capital (including minority interests and AT1 instruments not included in row 5 or 34) issued by subsidiaries and held by third parties 484 4022 – 16
g
87, 88, 480
49 thereof: instruments issued by subsidiaries subject to phase out – – 486 (4)
50 Credit risk adjustments – – 62 (c) und (d)
51 Tier 2 capital (T2) before regulatory adjustments 985 1,090 g
Tier 2 (T2) capital: regulatory adjustments
52 Direct and indirect holdings by an institution of own T2 instruments and subordinated loans (negative amount) – –
63 (b) (i), 66 (a), 67, 477 (2)
53 Holdings of the T2 instruments and subordinated loans of financial-sector entities where those entities have reciprocal cross-holdings with the institution designed to inflate artificially the own funds of the institution (negative amount) – –
66 (b), 68, 477 (3)
54
Direct and indirect holdings of the T2 instruments and subordinated loans of financial-sector entities where the institution does not have a significant investment in those entities (amount above 10 % threshold and net of eligible short positions) (negative amount) – –
66 (c), 69, 70, 79, 477 (4)
54a thereof: new holdings not subject to any transitional arrangements – –
54b thereof: holdings existing before January 1, 2013, and subject to transitional
arrangements– –
55
Direct and indirect holdings by the institution of the T2 instruments and subordinated loans of financial-sector entities where the institution has a significant investment in those entities (net of eligible short positions) (negative amount) – –
66 (d), 69, 79, 477 (4)
56 Regulatory adjustments applied to Tier 2 capital in respect of amounts subject to pre-CRR treatment and transitional treatments subject to phase out as prescribed in Regulation (EU) No. 575/2013 (i.e., CRR residual amounts) – 20 – 52
56a Residual amounts deducted from Tier 2 capital with regard to deduction from Common Equity Tier 1 capital during the transitional period pursuant to Article 472 of Regulation (EU) No. 575/2013
– 20 – 52 472, 472 (3) (a), 472 (4), 472 (6), 472 (8) (a), 472 (9), 472 (10) (a), 472 (11) (a)
thereof: negative amounts arising from the calculation of expected loss amounts – 20 – 52
56b
Residual amounts deducted from Tier 2 capital with regard to deduction from Additional Tier 1 capital during the transitional period pursuant to Article 475 of Regulation (EU) No. 575/2013
– – 475, 475 (2) (a), 475 (3), 475 (4) (a)
56c Amount to be deducted from or added to Tier 2 capital with regard to additional filters and deductions required pre-CRR
– – 467, 468, 481
57 Total regulatory adjustments to Tier 2 (T2) capital – 20 – 52
58 Tier 2 (T2) capital 965 1,038
59 Total capital (TC = T1 + T2) 6,837 6,889
Risk-weighted assets
59a
Risk-weighted assets in respect of amounts subject to pre-CRR treatment and transitional treatments subject to phase out as prescribed in Regulation (EU) No. 575/2013 (i.e., CRR residual amounts)
617 616
thereof: deferred tax assets that rely on future profitability, resulting from temporary differences
617 616 472, 472 (5), 472 (8) (b), 472 (10) (b), 472 (11) (b)
thereof: Common Equity Tier 1 instruments of relevant entities where the institution has a significant investment in those entities
0 0 475, 475 (2) (b), 475 (2) (c), 475 (4) (b)
60 Total risk-weighted assets 41,721 41,997
1 This column is used to report the residual amounts that were deducted from other categories of capital or not deducted at all on the basis of the transitional provision, and amounts that are subject to phase-out.
2 Disclosure adjusted. Prior to June 30, 2017, the trust preferred securities of Deutsche Postbank Funding Trusts I-III were included in the Tier 2 capital disclosed in row 46.
88

Interim Report as of June 30, 2017
Transitional own funds disclosure and balance sheet references
No.
Own funds position in accordance with CRR Impl. Reg. Annex VI
Amount of own funds position
Amount before CRR/residual
amount1
Refe-rence
CRR reference
June 30, 2017
€m
Dec. 31, 2016
€m
June 30, 2017
€m
Dec. 31, 2016
€m
Capital ratios and buffers
61 Common Equity Tier 1 capital ratio (as a percentage of total risk exposure amount) 13,74 % 13,43 % 92 (2) (a), 465
62 Tier 1 capital ratio (as a percentage of total risk exposure amount) 14,07 % 13,93 % 92 (2) (b), 465
63 Total capital ratio (as a percentage of total risk exposure amount) 16,39 % 16,40 % 92 (2) (c)
64
Institution-specific buffer requirement (CET1 requirement in accordance with Article 92(1)(a), plus capital conservation and counter-cyclical buffer requirements, plus the systemic risk buffer, plus the systemically important institution buffer (G-SII or O-SII buffer), expressed as a percentage of total risk exposure amount))
8,26 % 5,13 % CRD 128, 129, 130
65 thereof: capital conservation buffer requirement 1,25 % 0,63 %
66 thereof: counter-cyclical buffer requirement 0,01 % 0,00 %
67 thereof: systemic risk buffer requirement – –
67a thereof: Global Systemically Important Institution (G-SII) or Other Systemically Important Institution (O-SII) buffer
– – CRD 131
68 Common Equity Tier 1 available to meet buffers (as a percentage of total risk exposure amount)
5,57 % 7,93 % CRD 128
Deductions from Common Equity Tier 1 capital
72
Direct and indirect holdings by the institution of the capital instruments of financial-sector entities where the institution does not have a significant investment in those entities (amount below 10 % threshold and net of eligible short positions)
33 32 36 (1) (h), 45, 46, 472 (10), 56 (c), 59, 60, 475 (4), 66 (c), 69, 70, 477 (4)
73
Direct and indirect holdings by the institution of the CET1 instruments of financial-sector entities where the institution has a significant investment in those entities (amount below 10 % threshold and net of eligible short positions)
0 0 36 (1) (i), 45, 48, 470, 472 (11)
75
Deferred tax assets that rely on future profitability, arising from temporary differences (amount below 10 % threshold, net of related tax liability, where the conditions in Article 38(3) are met)
247 246 36 (1) (c), 38, 48, 470, 472 (5)
Applicable caps on the inclusion of provisions in Tier 2
76 Credit risk adjustments included in T2 in respect of exposures subject to standardized approach (prior to the application of the cap)
– – 62
77 Cap on inclusion of credit risk adjustments in T2 under standardized approach 41 41 62
78 Credit risk adjustments included in T2 in respect of exposures subject to internal ratings-based approach (prior to the application of the cap)
– – 62
79 Cap for inclusion of credit risk adjustments in T2 under internal ratings-based approach 196 195 62
Capital instruments subject to phase-out arrangements (only applicable from January 1, 2013, to January 1, 2022)
80 Current cap on CET1 instruments subject to phase-out arrangements – – 484 (3), 486 (2) und (5)
81 Amount excluded from CET1 due to cap (excess over cap after redemptions and maturities) – – 484 (3), 486 (2) und (5)
82 Current cap on AT1 instruments subject to phase-out arrangements 457 853 484 (4), 486 (3) und (5)
83 Amount excluded from AT1 due to cap (excess over cap after redemptions and maturities) 10 214 484 (4), 486 (3) und (5)
84 Current cap on T2 instruments subject to phase-out arrangements 2 125 484 (5), 486 (4) und (5)
85 Amount excluded from T2 due to cap (excess over cap after redemptions and maturities) 9 88 484 (5), 486 (4) und (5)
1 This column is used to report the residual amounts that were deducted from other categories of capital or not deducted at all on the basis of the transitional provision, and amounts that are subject to phase-out.
89
04OTHER INFORMATION REGULATORY DISCLOSURES
OT
HE
R I
NFO
RM
AT
ION

Interim Report as of June 30, 2017
Common Equity Tier 1 capital (row 29) consists of issued capital and the related share premium (row 1), retained earnings (row 2), accumulated other comprehensive income (row 3), and consolidated net profit (row 5a) after applying the prudential adjustments listed in rows 7 to 27. Additional Tier 1 capital comprises contributions by typical silent partners and the trust preferred securities of Funding Trusts I–III (row 33). The qualification of these instruments as Additional Tier 1 capital is also subject to the transitional provisions as set out in Article 486(3) of the CRR. Under these provisions, trust preferred securities of Funding Trusts I–III will cease to qualify as Additional Tier 1 capital on Decem - ber 31, 2021. Contributions by typical silent partners will cease to qualify as Additional Tier 1 capital, owing to their maturity, on December 31, 2018. After applying prudential adjustments as listed in rows 37 to 42, Additional Tier 1 capital is disclosed in row 44.
Tier 2 capital (row 58) comprises profit participation rights outstanding and subordinated liabilities (row 46). The qualification of contributions by typical silent partners as Tier 2 capital is subject to transitional provisions as laid down in Article 486(4) of the CRR (row 47). The pro rata share of the trust preferred securities of Funding Trusts I-III, to the extent that these are not included in Additional Tier 1 capital under the transitional provisions until December 31, 2021, and capital instruments issued by Postbank’s subsidiary BHW Bausparkasse AG also qualify as Tier 2 capital (row 48). The prudential adjustments listed in rows 52 to 56c also contribute to Tier 2 capital. In line with the previous year-end, the prudential adjustments as of the reporting date consisted solely of deductions resulting from transitional provisions (row 56).
The following additional explanations relate to the indi-vidual references:
• (a+b) The Common Equity Tier 1 capital instruments and the related share premium in the amount of €2,738 mil-lion (December 31, 2016: €2,738 million) correspond to the issued capital in the amount of €547 million (Decem-ber 31, 2016: €547 million) plus the share premium in the amount of €2,191 million (December 31, 2016: €2,191 million).
• (c) The difference between the retained earnings of €4,324 million (December 31, 2016: €3,980 million) and the retained earnings in the regulatory balance sheet in the amount of €4,345 million (December 31, 2016: €4,110 million) is due to the requirement to deduct the fund for home loans and savings protection, which amounted to €+21 million (December 31, 2016: €+21 million).
• (d) The accumulated other comprehensive income in the amount of €–270 million (December 31, 2016: €–71 million) corresponds to the amount of €–270 million (December 31, 2016: €–189 million) disclosed in the regulatory balance sheet.
• (e) Consolidated net profit of €293 million as of June 30, 2017, was included in the disclosure, subject to supervisory authority approval for the inclusion of interim profit (as of December 31, 2016, the interim profit of €174 million as of September 30, 2016, had been included in the disclo-sure).
• (f) The difference between the amount for intangible assets of €1,492 million (December 31, 2016: €1,480 million) as presented in the overview of own funds and the carry-ing amount of €1,555 million (December 31, 2016: €1,534 million) as disclosed in the regulatory balance sheet is attributable to the inclusion of deferred tax liabilities of €+63 million (December 31, 2016: €+64 million).
• (g) A total of €1,442 million of the €1,963 million (Decem-ber 31, 2016: €2,567 million) of subordinated debt on the balance sheet is eligible for inclusion in own funds, before deductions. Of this amount, €457 million (December 31, 2016: €853 million) counts toward Additional Tier 1 capital and €985 million (December 31, 2016: €1,090 million) toward Tier 2 capital.
The Tier 2 capital in the amount of €985 million (Decem-ber 31, 2016: €1,090 million) that qualifies for regulatory purposes comprises the following items:
• €499 million (December 31, 2016: €563 million) of eligible Tier 2 capital instruments of Deutsche Postbank AG (amor - tization in the last five years of their duration) (see row 46)
• €447million (December 31, 2016: €479 million) of the trust preferred securities of Deutsche Postbank Funding Trusts I–III eligible as Tier 2 capital under the transitional provisions (see rows 47 and 48)
• €2 million (December 31, 2016: €2 million) of the contri-butions by typical silent partners of Deutsche Postbank AG eligible as Tier 2 capital under the transitional provisions (row 47)
• €37 million (December 31, 2016: €47 million) of the instruments issued by BHW Bausparkasse AG allocated to consolidated Tier 2 capital (see row 48).
90

Interim Report as of June 30, 2017
Minimum capital requirements and additional capital bufferSince 2015, the applicable minimum Common Equity Tier 1 capital ratio has been 4.5 % of risk-weighted assets (RWA). The minimum total capital requirement of 8 % can be met with up to 1.5 % Additional Tier 1 capital and up to 2 % Tier 2 capital. In addition to these minimum capital require - ments, institutions must maintain the following capital buffers in the form of Common Equity Tier 1 capital: The capital conservation buffer in accordance with section 10c of the KWG will amount to 2.5 % of risk-weighted assets in 2019. Due to transitional provisions, the capital conservation buffer was set at 1.25 % of risk-weighted assets for the reporting period. The institution-specific countercyclical capital buffer rate in accordance with section 10d of the KWG is calculated as the weighted average of the counter - cyclical capital buffer rates that apply in the jurisdictions where Postbank’s relevant credit exposures are located. This buffer is also subject to a transitional period from 2016 to 2019. The countercyclical capital buffer rate for Postbank as of June 30, 2017, was 0.007 %.
The amount of the institution-specific countercyclical capital buffer can be found in the table below.
Amount of institution-specific countercyclical capital buffer
010 010
June 30, 2017 Dec. 31, 2016
010 Total risk exposure amount € 41,721 million € 41,977 million
020 Institution-specific countercyclical buffer rate 0.01 % 0.00 %
030 Institution-specific counter -cyclical buffer requirement € 3 million € 2 million
The tables below show the geographical distribution of Postbank’s credit exposures relevant for calculating the countercyclical capital buffer as of the reporting date and as of December 31, 2016:
91
04OTHER INFORMATION REGULATORY DISCLOSURES
OT
HE
R I
NFO
RM
AT
ION
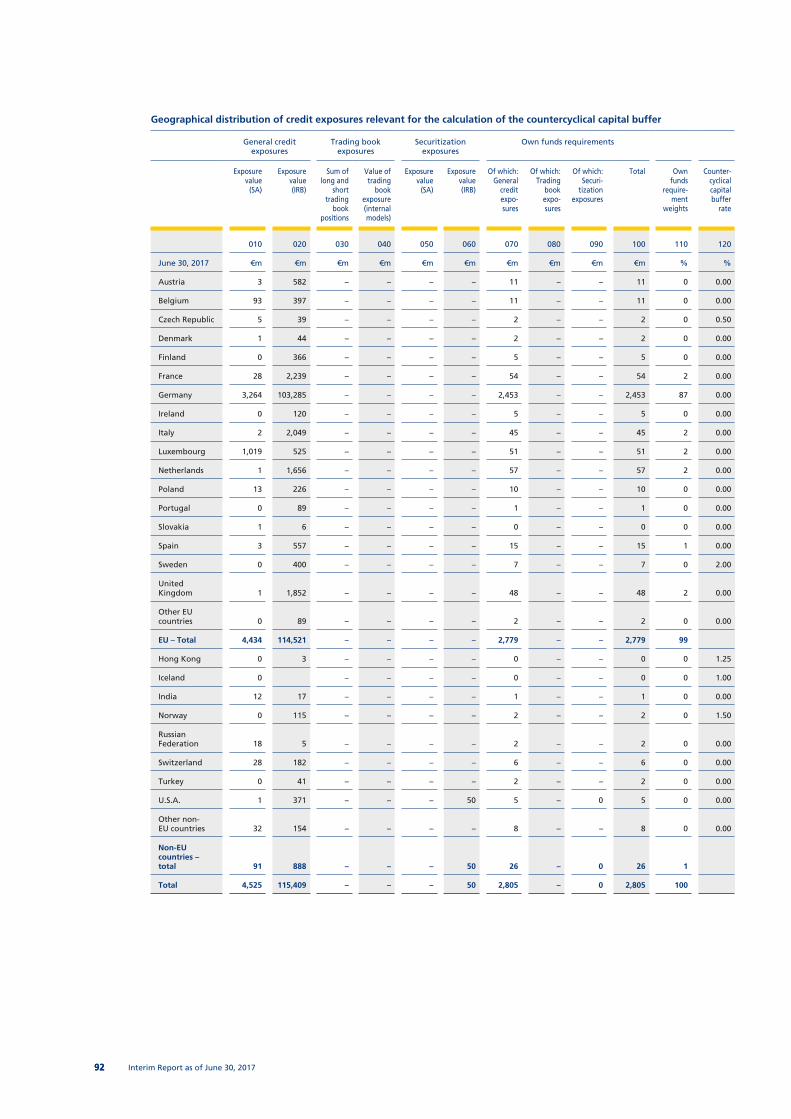
9292 Interim Report as of June 30, 2017
Geographical distribution of credit exposures relevant for the calculation of the countercyclical capital buffer
General credit exposures
Trading book exposures
Securitization exposures
Own funds requirements
Exposure value
(SA)
Exposure value (IRB)
Sum of long and
short trading
book positions
Value of trading
book expo sure (internal models)
Exposure value
(SA)
Exposure value (IRB)
Of which: General
credit expo-sures
Of which: Trading
book expo-sures
Of which: Securi-
tization exposures
Total Own funds
require-ment
weights
Counter-cyclical capital buffer
rate
010 020 030 040 050 060 070 080 090 100 110 120
June 30, 2017 €m €m €m €m €m €m €m €m €m €m % %
Austria 3 582 – – – – 11 – – 11 0 0.00
Belgium 93 397 – – – – 11 – – 11 0 0.00
Czech Republic 5 39 – – – – 2 – – 2 0 0.50
Denmark 1 44 – – – – 2 – – 2 0 0.00
Finland 0 366 – – – – 5 – – 5 0 0.00
France 28 2,239 – – – – 54 – – 54 2 0.00
Germany 3,264 103,285 – – – – 2,453 – – 2,453 87 0.00
Ireland 0 120 – – – – 5 – – 5 0 0.00
Italy 2 2,049 – – – – 45 – – 45 2 0.00
Luxembourg 1,019 525 – – – – 51 – – 51 2 0.00
Netherlands 1 1,656 – – – – 57 – – 57 2 0.00
Poland 13 226 – – – – 10 – – 10 0 0.00
Portugal 0 89 – – – – 1 – – 1 0 0.00
Slovakia 1 6 – – – – 0 – – 0 0 0.00
Spain 3 557 – – – – 15 – – 15 1 0.00
Sweden 0 400 – – – – 7 – – 7 0 2.00
United Kingdom 1 1,852 – – – – 48 – – 48 2 0.00
Other EU countries 0 89 – – – – 2 – – 2 0 0.00
EU – Total 4,434 114,521 – – – – 2,779 – – 2,779 99
Hong Kong 0 3 – – – – 0 – – 0 0 1.25
Iceland 0 – – – – 0 – – 0 0 1.00
India 12 17 – – – – 1 – – 1 0 0.00
Norway 0 115 – – – – 2 – – 2 0 1.50
Russian Federation 18 5 – – – – 2 – – 2 0 0.00
Switzerland 28 182 – – – – 6 – – 6 0 0.00
Turkey 0 41 – – – – 2 – – 2 0 0.00
U.S.A. 1 371 – – – 50 5 – 0 5 0 0.00
Other non- EU countries 32 154 – – – – 8 – – 8 0 0.00
Non-EU countries – total 91 888 – – – 50 26 – 0 26 1
Total 4,525 115,409 – – – 50 2,805 – 0 2,805 100

Interim Report as of June 30, 2017
Geographical distribution of credit exposures relevant for the calculation of the countercyclical capital buffer
General credit exposures
Trading book exposures
Securitization exposures
Own funds requirements
Exposure value
(SA)
Exposure value (IRB)
Sum of long and
short trading
book positions
Value of trading
book expo sure (internal models)
Exposure value
(SA)
Exposure value (IRB)
Of which: General
credit expo-sures
Of which: Trading
book expo-sures
Of which: Securi-
tization exposures
Total Own funds
require-ment
weights
Counter-cyclical capital buffer
rate
010 020 030 040 050 060 070 080 090 100 110 120
Dec. 31, 2016 €m €m €m €m €m €m €m €m €m €m % %
Austria 3 484 – – – – 11 – – 11 0 0.00
Belgium 101 329 – – – – 9 – – 9 0 0.00
Czech Republic 5 34 – – – – 2 – – 2 0 0.00
Denmark 0 132 – – – – 7 – – 7 0 0.00
Finland 0 406 – – – – 8 – – 8 0 0.00
France 10 2,288 – – – – 56 – – 56 2 0.00
Germany 3,301 101,469 – – – – 2,425 – – 2,425 87 0.00
Ireland 0 85 – – – – 4 – – 4 0 0.00
Italy 4 2,153 – – – – 46 – – 46 2 0.00
Luxembourg 982 631 – – – – 56 – – 56 2 0.00
Netherlands 2 1,295 – – – – 42 – – 42 2 0.00
Poland 5 198 – – – – 9 – – 9 0 0.00
Portugal 0 85 – – – – 1 – – 1 0 0.00
Slovakia 0 10 0 – – 0 0 0.00
Spain 5 507 – – – – 14 – – 14 1 0.00
Sweden 0 352 – – – – 6 – – 6 0 1.50
United Kingdom 1 1,903 – – – – 58 – – 58 2 0.00
Other EU countries 1 58 – – – – 1 – – 1 0 0.00
EU – Total 4,420 112,419 – – – – 2,755 – – 2,755 98
Hong Kong 0 3 – – – – 0 – – 0 0 0.63
Norway 0 147 – – – – 2 – – 2 0 1.50
Russian Federation 22 3 – – – – 2 – – 2 0 0.00
Switzerland 25 159 – – – – 8 – – 8 1 0.00
Turkey 0 41 – – – – 2 – – 2 0 0.00
U.S.A. 1 345 – – – 55 10 – 0 10 1 0.00
Other non- EU countries 35 158 – – – – 7 – – 7 0 0.00
Non-EU countries – total 83 856 – – – 55 31 – 0 31 2
Total 4,503 113,275 – – – 55 2,786 – 0 2,786 100
To date, the Bundesanstalt für Finanzdienstleistungsaufsicht (BaFin – German Federal Financial Supervisory Authority) has not set a systemic risk buffer in accordance with section 10e of the KWG. Similarly, Postbank was not classified as a global systemically important institution (section 10f of the KWG) or other systemically important institution (sec-tion 10g of the KWG) and is therefore currently not subject to any other capital buffer requirements. As a result, the
current combined buffer requirement rate for Postbank in accordance with section 10i of the KWG is 1.26 %. Above and beyond these capital buffer requirements, the respon-sible supervisory authority can, in accordance with the supervisory review and evaluation process (SREP), impose additional capital requirements on banks that exceed the statutory minimum requirements. In this context, Postbank meets all minimum capital requirements applicable to it.
93
04OTHER INFORMATION REGULATORY DISCLOSURES
OT
HE
R I
NFO
RM
AT
ION

Interim Report as of June 30, 2017
Capital profiles and agreements and prospectuses for capi-tal instruments issuedIn accordance with Article 437(1) b) and c) of the CRR, insti-tutions required to apply the CRR must disclose a description of the main features and full terms and conditions of the Common Equity Tier 1, Additional Tier 1 and Tier 2 instruments. Postbank complies with this obligation by publishing this information on its website. The information provided is updated every quarter and can be accessed via the following link: https://www.postbank.com/postbank/en/ir_capital_in-struments_prospectuses.html.
Capital requirementsThe following table provides an overview of Postbank’s capital backing, calculated with reference to the regulatory bases of assessment, broken down by the type of risk and approach. The capital backing, taking into account the applicable transitional provisions in the CRR and the SolvV, represents the risk-weighted exposure amounts required to be included, multiplied by 8 % in each case. Total capital backing as of June 30, 2017, amounted to €3,338 million (December 31, 2016: €3,360 million).
Capital backing by type of risk and approach
June 30, 2017 €m
Dec. 31, 2016 €m
Total credit risk exposure, calculated using the Standardized Approach
Governments and central banks – – Regional governments and local authorities 0 0 Public-sector entities 4 4 Multilateral development banks – – International organizations – – Institutions 3 5 Corporates 61 60 Retail exposures 131 131 Exposures secured by real estate property 35 34 Exposures in default 9 10 Covered bonds – – UCITS – – Total Standardized Approach 243 244Total credit risk exposure, calculated on the basis of internal ratings
Foundation IRB Approach
Governments and central banks – – Institutions 21 31 Corporates 296 318 Total Foundation IRB Approach 317 349 Advanced IRB Approach
Governments and central banks 1 1 Institutions 89 81 Corporates 554 543 Retail exposures to SMEs, secured by real estate property 0 0 Retail exposures, other than to SMEs, secured by real estate property 1,076 1,062 Qualifying revolving retail exposures 7 7 Other retail exposures to SMEs 7 7 Other retail exposures, other than to SMEs 401 389 Total Advanced IRB Approach 2,135 2,090 Other non-credit obligation assets 154 145 Total IRB Approaches 2,606 2,584Total risk exposure for securitization positions
Securitization positions (IRBA) 0 0 Securitization positions (Standardized Approach) – – Total risks from securitization positions 0 0Total risk exposure for equity exposures
Equity exposures – retention of existing calculation/grandfathering 18 19 Equity exposures (simple risk weight approach under the IRBA) 10 11 Exchange-traded – – Private equity exposures in sufficiently diversified portfolios – – Other equity exposures 10 11 Equity exposures with regulatory risk weighting in accordance with Article 48 of the CRR 0 0 Total risks from equity exposures 28 30Other total risk exposure amounts
Exchange-traded debt instruments (calculated using the Standardized Approach) – – Foreign exchange positions (calculated using the Standardized Approach) 7 5 Other market risk exposures (calculated using the Standardized Approach) – – Total risk exposure amount for operational risk (calculated using the Standardized Approach) 430 466 Total risk exposure amount due to credit valuation adjustments (CVAs, calculated using the Standardized Approach) 12 20
Exposure amount for contributions to the default fund of a central counterparty (CCP) 12 11 Other total risk exposure amounts – –
Total 3,338 3,360
94

Interim Report as of June 30, 2017
Leverage ratioWith the implementation of Basel III in European law, a new observation ratio was defined in the form of the lever-age ratio. Initial disclosure in accordance with Article 451 of the CRR was required for 2015, with the introduction of a binding minimum ratio as a Pillar 1 requirement expected when the CRR II reform package enters into force. The aim of establishing a leverage ratio is to restrict the build-up of leverage in the banking sector, and to reduce the risk of unscheduled, destabilizing de-leveraging processes during times of economic stress.
The leverage ratio is calculated as an institution’s capital measure divided by that institution’s total exposure measure. The total exposure measure is the sum of the exposure values of all assets and off-balance sheet items. Specific qualification criteria in accordance with Article 429 of the CRR will apply to derivatives, repurchase agreements, and off-balance sheet transactions in particular.
The following information on the leverage ratio reflects the requirements set out in Article 429 of the CRR and the Commission Implementing Regulation (EU) 2016/200 with regard to disclosure of the leverage ratio as of February 15, 2016. In accordance with the disclosure of own funds, the regular phased-in Tier 1 capital is reported.
In the following table, Postbank’s total assets are recon-ciled to the total exposure measure. The provisions of the CRR define how assets qualify for the leverage ratio and the adjustment effects listed in the table:
• Adjustment through consolidation: The same basis of regulatory consolidation used to calculate Postbank’s own funds must be applied when determining the total exposure measure.
• Adjustments for derivative financial instruments: Deriva-tive exposures are calculated on the basis of their current replacement cost, including netting agreements accepted for regulatory purposes. This amount can be reduced by collateral received. An add-on amount is calculated using the mark-to-market method to cover a potential future rise in replacement costs.
• Adjustments for repurchase transactions: If certain criteria are met, netting of cash payables and cash receivables in repurchase transactions is permitted; an add-on must be calculated to cover counterparty credit risk.
• Adjustments for off-balance sheet transactions: The no - tional amounts of off-balance sheet exposures are weighted using the conversion factors of the Credit Risk Standardized Approach. A floor of at least 10 % must be observed, and the capital requirement may not be reduced by any allowance for losses on loans and advances.
• Other adjustments: Assets recognized as deduction items when calculating own funds are excluded from the total exposure measure.
Reconciliation of total assets and the leverage ratio total exposure measure
June 30, 2017
€m
Dec. 31, 2016
€m
1 Total assets as per published financial statements 144,829 147,197
2 Adjustment for entities which are consolidated for accounting purposes but are outside the scope of regulatory consolidation – 266 – 266
3 (Adjustment for fiduciary assets recognized on the balance sheet pursuant to the applicable accounting framework but excluded from the leverage ratio total exposure measure in accordance with Article 429(13) of Regulation (EU) No. 575/2013 – –
4 Adjustment for derivative financial instruments 440 366
5 Adjustment for securities financing transactions (SFTs) 22 300
6 Adjustment for off-balance sheet items (i.e., conversion to credit equivalent amounts of off-balance sheet exposures) 6,039 5,623
EU-6a (Adjustment for intragroup exposures excluded from the leverage ratio total exposure measure in accordance with Article 429(7) of Regulation (EU) No. 575/2013) – –
EU-6b (Adjustment for exposures excluded from the leverage ratio total exposure measure in accordance with Article 429(14) of Regulation (EU) No. 575/2013) – –
7 Other adjustments – 1,579 – 1,090
8 Leverage ratio total exposure measure 149,485 152,130
95
04OTHER INFORMATION REGULATORY DISCLOSURES
OT
HE
R I
NFO
RM
AT
ION

Interim Report as of June 30, 2017
The following table shows subtotals of the total exposure measure for all on- and off-balance sheet exposures, to-gether with possible exceptions in accordance with Article 429 of the CRR, and the regular phased-in Tier 1 capital:
Calculation of the leverage ratio
June 30, 2017
€m
Dec. 31, 2016
€m
On-balance sheet exposures (excluding derivates and SFTs)
1 On-balance sheet items (excluding derivatives, SFTs and fiduciary assets, but including collateral) 142,479 141,105
2 (Asset amounts deducted in determining Tier 1 capital) – 1,624 – 1,629
3 Total on-balance sheet exposures (excluding derivatives, SFTs, and fiduciary assets) (sum of rows 1 and 2) 140,855 139,476
Derivative exposures
4 Replacement cost associated with all derivatives transactions (i.e., net of eligible cash variation margin) 283 332
5 Add-on amounts for PFE associated with all derivatives transactions (mark-to-market method) 569 567
EU-5a Exposure determined under Original Exposure Method – –
6 Gross-up for derivatives collateral provided where deducted from the balance sheet assets pursuant to the applicable accounting framework – –
7 (Deductions of receivables assets for cash variation margin provided in derivatives transactions) – –
8 (Exempted CCP leg of client-cleared trade exposures) – –
9 Adjusted effective notional amount of written credit derivatives – –
10 (Adjusted effective notional offsets and add-on deductions for written credit derivatives) – –
11 Total derivatives exposures (sum of rows 4 to 10) 852 899
Securities financing transaction (SFT) exposures
12 Gross SFT assets (with no recognition of netting), after adjusting for sales accounting transactions 1,716 9,852
13 (Netted amounts of cash payables and cash receivables of gross SFT assets) – – 4,020
14 Counterparty credit risk exposure for SFT assets 22 300
EU-14a Derogation for SFTs: Counterparty credit risk exposure in accordance with Articles 429b(4) and 222 of Regulation (EU) No. 575/2013
– –
15 Agent transaction exposures – –
EU-15a (Exempted CCP leg of client-cleared SFT exposures) – –
16 Total securites financing transaction exposures (sum of rows 12 to 15a) 1,738 6,132
Other off-balance sheet exposures
17 Off-balance sheet exposures at gross notional amount 24,666 24,206
18 (Adjustments for conversion to credit equivalent amounts) – 18,627 – 18,583
19 Other off-balance sheet exposures (sum of rows 17 and 18) 6,039 5,623
Exempted exposures in accordance with Article 429(7) and (14) of Regulation (EU) No. 575/2013 (on- and off-balance sheet)
EU-19a (Intragroup exposures (solo basis) exempted in accordance with Article 429(7) of Regulation (EU) No. 575/2013 (on- and off-balance sheet)) – –
EU-19b (Exposures exempted in accordance with Article 429(14) of Regulation (EU) No. 575/2013 (on- and off-balance sheet)) – –
Capital and total exposure measure
20 Tier 1 capital 5,872 5,851
21 Leverage ratio total exposure measure (sum of rows 3, 11, 16, 19, EU-19a, and EU-19b) 149,485 152,130
Leverage ratio
22 Leverage ratio 3,93 % 3,85 %
Choice of transitional arrangements and amount of derecognized fiduciary items
EU-23 Choice of transitional arrangements for the definition of the capital measure transitional transitional
EU-24 Amount of derecognized fiduciary items in accordance with Article 429(11) of Regulation (EU) No. 575/2013 – –
96

Interim Report as of June 30, 2017
Postbank’s leverage ratio improved during the period under review. The leverage ratio was 3.93 % as of the reporting date, compared with 3.85 % as of December 31, 2016. The main drivers of this development were an increase in Tier 1 capital (see “Composition and reconciliation of Postbank’s own funds”) and the scheduled reduction in total assets.
The total exposure measure was reduced to €149,485 million (as of December 31, 2016: €152,130 million) by optimizing total assets. The €4,394 million decline in securities financing transactions to €1,738 million (as of December 31, 2016: €6,132 million) was offset by a €1,379 million increase in
other on-balance sheet exposures to €140,855 million (as of December 31, 2016: €139,476). Off-balance sheet exposures increased by €416 million to €6,039 million in the reporting period, while the qualifying amount for derivatives declined by €47 million to €852 million.
The table below provides an overview of all on-balance sheet exposures with the exception of derivatives and repur - chase agreements, broken down by regulatory trading book and banking book, and by exposure class for counterparty credit risk:
Breakdown of on-balance sheet exposures (excluding derivatives, securities financing transactions (SFTs), and exempted exposures)
June 30, 2017 €m
Dec. 31,2016 €m
EU-1 Total on-balance sheet exposures (excluding derivatives, SFTs, and exempted exposures), thereof: 142,479 141,105
EU-2 Trading book exposures – –
EU-3 Banking book exposures 142,479 141,105
thereof:
EU-4 covered bonds 3,505 3,910
EU-5 exposures treated as sovereigns 31,897 30,671
EU-6 exposures to regional governments, multilateral development banks, international organizations,
and public-sector entities not treated as sovereigns 232 255
EU-7 institutions 2,123 3,048
EU-8 secured by mortgages of immovable properties 74,395 75,706
EU-9 retail exposures 10,981 10,637
EU-10 corporates 14,643 11,139
EU-11 exposures in default 1,686 1,393
EU-12 other exposures (e.g., equities, securitizations, and other non-credit obligation assets) 3,017 4,346
In the context of Postbank’s internal risk management process, the leverage ratio is an important indicator for determining the risk of excessive leverage, and it is for this reason that the Bank has anchored the management of the leverage ratio firmly in its risk management and risk strategy. Every year, the Reporting and Capital Management unit produces mid-term plans (3-year planning horizon) for the Tier 1 capital and the total exposure measure, as well as forecast and scenario computations and deviation analyses. This approach serves to restrict the volume of the lending and deposit products on the balance sheet, and is also the basis for an early warning system. The leverage ratio (includ-ing in stress scenarios) is an integral part of quarterly inter-nal risk reporting. The findings with regard to the leverage ratio are submitted to Postbank’s Bank Risk Committee, Management Board, and Supervisory Board.
97
04OTHER INFORMATION REGULATORY DISCLOSURES
OT
HE
R I
NFO
RM
AT
ION

Interim Report as of June 30, 2017
Principles of the proper conduct of business (section 26a of the Kreditwesengesetz (KWG – German Banking Act))
Corporate governance practicesTo implement corporate governance practices, Postbank has formulated a company vision and mission as well as corpo-rate values that are meant to serve as guiding principles for determining the long-term orientation of company policy. The Bank’s vision and mission specify a normative frame-work for strategic and operational corporate governance and thus serve as a model in equal measure for the Manage-ment Board, executives, and employees.
Postbank’s values and principles are recorded in the “Postbank Mission Statement” and are meant to guide the business activities of employees throughout the Postbank Group. The statement utilizes vision and mission to put the strategic orientation of Postbank into concrete terms. Six values define the proposed course. The letter and spirit of these values and principles are reflected in the Postbank guidelines and provisions that determine daily work and business life (such as organizational manuals and working instructions). They reflect Postbank’s obligation to act responsibly, ethically, and lawfully. The mission statement is binding for all executive employees of the Postbank Group and is reflected in the Bank’s target agreements. The status of implementation is reviewed as part of the annual people survey.
The following values of the Postbank Group form the corner stones of our corporate culture:
• Customer orientation
• Integrity
• Sustainable performance
• Innovation
• Partnership
• Discipline
All employees of the Postbank Group are subject to the Code of Business Conduct and Ethics for Deutsche Bank Group. In addition, the Code of Ethics contains special obligations applying to the senior financial officers of Deutsche Bank, the Chief Financial Officer of Postbank, the heads of the Finance board department of Postbank, and the Chief Financial Officer of the Postbank subsidiary BHW Bausparkasse AG.
Furthermore, Postbank places a high value on the issue of sustainability. In its policy “Principles of Corporate Respon-sibility for the Postbank Group,” the Bank has defined the targets, roles, requirements and responsibilities of sustain-able business management. These principles are also binding for Postbank’s executive employees.
For Postbank, sustainability involves the responsible use of social, ecologic and economic resources to ensure a lasting worthwhile future for coming generations. As an integral component of the business strategy, the principle of sustain-ability is put actively into practice in our daily work. In addition, our “Supplier Code of Conduct” also requires the Bank’s suppliers to observe these values.
As a company, we are an integral part of the society in which we operate. We are convinced that we can gain long-term competitive advantage by actively managing the direct and indirect impact of our business activities on the environment and society. This approach will allow us to exploit ecologic and social opportunities better, reduce risks in our sphere of influence, and in this way generate sustain-able added value for our stakeholders.
We are particularly committed to providing our employees with attractive and safe working conditions as well as to conserving natural resources.
Company management is focused in particular on the sustained creation of value. These efforts are based on clear values and minimum standards for behavior in day-to-day business as well as the structuring of remuneration for employees, managers, and Management and Supervisory Board members in accordance with the required sustainable company-performance standards.
Operating principles of the Management Board and the Supervisory BoardThe Management Board and the Supervisory Board work closely together for the collective good of the Company. In keeping with its responsibilities outlined in stock corpora-tion law, the Management Board performs corporate management duties. The Supervisory Board fulfills its super-visory, monitoring and advisory duties. The shareholders – that is, the owners of Postbank – exercise their rights prior to or during the Annual General Meeting.
Management BoardThe Management Board heads Deutsche Postbank AG and represents the Bank externally. The Management Board members share joint responsibility for the entirety of corpo - rate management. In addition to their overall responsibility for the Bank, each member of the Management Board assumes individual responsibility for the board department that he or she oversees.
In the collective interest of the Company, the members of the Management Board ensure that uniform objectives are pursued. Coordinating and determining joint plans, goals, and the measures to realize them are a matter of course as are developing and implementing binding Company-wide policies. The Management Board develops the business goals, basic strategic focus, corporate policy, and organizational structure of the Group. It is responsible for the preparation of quarterly and half-yearly reports, and the annual finan-cial statements of Deutsche Postbank AG as well as the consolidated financial statements for the Group, including the management reports. Furthermore, the Management Board ensures that the Company complies with laws and governmental regulations.
98

Interim Report as of June 30, 2017
The Management Board regularly consults with the Super-visory Board about the Company’s strategic direction and business planning as well as informs it about strategy imple-mentation and the progress being made toward achieving these goals.
The Management Board holds regular meetings called by the Board’s Chairman, who coordinates the work of the Management Board. The calling of an unscheduled meeting by the Chairman of the Management Board can be done for urgent reasons or upon the request of two Board members. The majorities required for adopting resolutions within the Management Board, the issues whose discussion is the responsibility of the entire Management Board, and the current assignments of board departments to individual Management Board members are governed by the Bylaws of the Management Board. Adequate human and financial resources are made available to the members of the Man-agement Board for facilitating induction and for advanced training.
To promote efficient decision management, the Manage-ment Board has established committees that have the power to make their own decisions or the authorization to make preparations for decisions. These committees serve as vehicles for exchanging information on significant issues relevant to management as well as for preparing decisions of the Management Board. The composition of these commit-tees and their areas of responsibility are governed by their own bylaws. Changes to these bylaws require the approval of the entire Group Management Board. The committees are required to report to the Group Management Board.
The Operating Committee’s responsibilities comprise cost and resource management as well as the management of envisioned investments and projects.
The work of the Reputation Committee involves developing guidelines and evaluation criteria for products and processes designed to recognize, review, and escalate any potential reputational damage as well as overseeing these guidelines.
The Bank Risk Committee ensures management, planning, and monitoring for all material and immaterial risks in the Postbank Group across the various types of risk. The com - mittee is responsible for strategic overall management of the risk situation and risk profile of the Postbank Group within the context of the framework conditions laid down by the Group Management Board (ICAAP and ILAAP; capital management). In carrying out its responsibilities, the Bank Risk Committee is supported by the Market Risk Committee, the Operational Risk Committee, the Cover Business Committee, the Model and Validation Committee, the Credit Risk Committee, the Data Quality Committee, the BHW Bank Risk Committee, the Regulatory RADAR Committee, the Outsourcing Committee, and the NCOU Committee.
The Consumer Banking Executive Committee assumes an advisory, coordination and decision-preparation role for Postbank’s Management Board. It develops the sales strategy and regularly monitors sales channels and product activities, and offers ideas aimed at improving products and creating new ones.
The Investment Committee is responsible for evaluating capital investments and M&A transactions including the restructuring portfolios in investment management.
The Asset/Liability Committee focuses on the dovetailing of the strategic overall management of the Bank with risk and product management as well as the optimization of the bal-ance sheet and capital structure and liquidity management.
Supervisory BoardThe Supervisory Board appoints, monitors, and advises the Management Board. Its members meet the personal and professional requirements needed to properly carry out their responsibilities. They also devote sufficient time to those responsibilities. Adequate human and financial re-sources are made available for the induction and advanced training of the members of the Supervisory Board. The Supervisory Board is directly involved in decisions of funda-mental importance for the Company, including matters sub-ject to approval by the Supervisory Board in accordance with the Articles of Association or as set out in the Bylaws of the Supervisory Board. The Chairman of the Supervisory Board coordinates the work of the 20-member Supervisory Board. Ten of them are elected by the Annual General Meeting in individual elections or appointed by the courts as replace-ments until the election by the next Annual General Meeting, in accordance with the provisions of the Aktien-gesetz (AktG – German Stock Corporation Act). Ten further members are elected by the employees in accordance with the provisions of the Mitbestimmungsgesetz (MitbestG – Co-Determination Act) of 1976. Seven of these members of the Supervisory Board are employees of the Company, including one executive employee. Three additional members of the Supervisory Board are representatives of unions represented at the Company.
To support it in its duties, the Supervisory Board has estab-lished eight committees that report to it on their work at regular intervals. These are the Executive Committee, Audit Committee, Human Resources Committee, Risk Committee, Compensation Control Committee, Nomination Commit-tee, Mediation Committee, and Digital Transformation Committee.
The Report of the Supervisory Board contains further details on the composition, function, and meeting agendas of the Supervisory Board and its committees.
For the purpose of filling positions on Postbank’s Super-visory Board, objectives were formulated to ensure that its members have the requisite knowledge, skills, and profes-sional experience to supervise and advise the Management Board competently. With regard to individuals proposed for election, particular attention is to be paid to their integrity, personality, motivation, professionalism, and independence. The Supervisory Board shall be composed of at least eleven independent members. It is assumed that the circumstance of employee representation and an employment relationship does not cast doubt on the independence as such of employee representatives. In particular, members of the Supervisory Board shall not perform advisory tasks for or exercise director - ships with important competitors of the Company. Fundamen-tal conflicts of interest, and not only temporary ones, are to be avoided. A standard age limit of 72 years and a standard membership limit of 20 years exist for Supervisory Board members. With regard to the composition of the Supervisory Board, it is also important that members possess interna-tional experience.
99
04OTHER INFORMATION REGULATORY DISCLOSURES
OT
HE
R I
NFO
RM
AT
ION

Interim Report as of June 30, 2017
When examining potential candidates for new election or appointment of replacements for Supervisory Board positions that have become vacant, qualified women are to be in - clud ed in the selection process and given appropriate consideration in election proposals. Since the Supervisory Board elections in 2003, between 15 % and 30 % of the members of our Supervisory Board have been women. During the period under review, six women served on the Supervisory Board, which corresponds to 30 %. With that percentage, the Super visory Board has achieved the target value of 30 %, which was scheduled to be reached by 2017.
The efficacy of the Supervisory Board’s work is reviewed on a regular basis and at minimum annually within the scope of an efficiency audit. In 2016, the evaluation once again addressed the structure, size, composition, and performance of the Management Board and the Supervisory Board and the knowledge, skills, and experience of members of both executive bodies as well as the bodies in their totality.
The current structure, size, composition, and performance of the Management Board and the Supervisory Board including their committees, and the cooperation between the Management Board and the Supervisory Board received positive evaluations. Members of both bodies have the fundamental knowledge, experience, and skills to effectively perform their managerial and supervisory tasks at Postbank. If replacements need to be appointed, the insights into the knowledge, skills, and experience gained from the examina-tion of efficiency are to be taken into consideration.
Interaction between the Management Board and the Supervisory BoardEffective cooperation between the Management Board and the Supervisory Board rests on the sufficient flow of infor-mation about company matters to the Supervisory Board. Ensuring this exchange is the responsibility and common objective of the Management Board and the Supervisory Board.
The cooperation of the executive bodies is governed by the Company’s Articles of Association as resolved by the Annual General Meeting, the Bylaws of the Supervisory Board – including its committees – and of the Management Board, and by the resolutions of the executive bodies in line with the relevant legal provisions. These lay down how the Supervisory Board should perform its supervisory, monitor-ing and advisory duties. The Bylaws of the Supervisory Board contain a list of transactions requiring approval.
The Management Board’s information and reporting duties are laid down in both the Bylaws of the Management Board and those of the Supervisory Board.
To promote good corporate governance and to achieve sustained growth in enterprise value, the Management Board and the Supervisory Board are in regular close com-munication with regard to relevant questions of planning, business development, risk exposure, the internal con-trol system, risk management, compliance, and strategic measures. The Chairmen of the Supervisory Board and the Management Board in particular are in regular contact.
The members of the Management Board and the Super-visory Board are obliged to act in the Company‘s interests and may not pursue any personal interests in their decisions.
Any conflicts of interest are to be disclosed to the Super-visory Board. Material conflicts of interest, and not only temporary ones, in the person of a Supervisory Board member normally lead to a termination of the mandate. The Super-visory Board reports to the Annual General Meeting on any conflicts of interest that have arisen and how they were addressed.
Ancillary activities pursued by the Management Board members have to be approved by the Supervisory Board and/or the Executive Committee.
100

This Interim Report contains forward-looking statements that relate to macroeconomic developments (in particular the development of money and capital market rates), the business and the net assets, financial position and results of operations of the Postbank Group. Forward-looking statements by definition do not depict the past and are in some instances indicated by words such as “believe”, “antici-pate”, “predict”, “plan”, “estimate”, “aim”, “expect”, “assume” and similar expressions. Forward-looking statements are based on the Company’s current plans, estimates, projections, and forecasts and are therefore subject to risks and uncertainties that could cause actual development or the actual results or performance to differ materially from the development, results or performance expressly or implicitly assumed in these forward-looking statements.
Readers of this Interim Report are expressly cautioned not to place undue reliance on these forward-looking statements, which apply only as of the date of this Interim Report. Deutsche Postbank AG does not intend and does not undertake any obligation to revise these forward-looking statements.
The English version of the Interim Report constitutes a translation of the original German version. Only the German version is legally binding.
Concept, design, and layout
EGGERT GROUP, Düsseldorf
Coordination/editing
Postbank
Corporate Controlling/Treasury
Translation
Deutsche Post Corporate Language
Services
Imprint
Published by
Deutsche Postbank AG
Head Office
Corporate Controlling/Treasury
Friedrich-Ebert-Allee 114 –126
53113 Bonn, Germany
Postfach 40 00
53105 Bonn, Germany
Phone: +49 228 920 - 0
Investor Relations
Phone: +49 228 920 -18003
E-Mail: [email protected]
www.postbank.com/ir


![Report on Health Related Quality of Life and Lifestyle of ...€¦ · 1,418 Bangladesh-born people lived in Victoria [5]. In 2009 the Bangladeshi community living in Melbourne was](https://static.fdocuments.in/doc/165x107/5f1b28725a24df05855bb385/report-on-health-related-quality-of-life-and-lifestyle-of-1418-bangladesh-born.jpg)


