2017 PKI GLOBAL TRENDS STUDY - Thales...
32
1 2017 PKI GLOBAL TRENDS STUDY 2017 PKI GLOBAL TRENDS STUDY October 2017
Transcript of 2017 PKI GLOBAL TRENDS STUDY - Thales...

1 2017 PKI GLOBAL TRENDS STUDY
2017 PKI GLOBAL TRENDS STUDY
October 2017

2 2017 PKI GLOBAL TRENDS STUDY
Sponsored by Thales eSecurity INDEPENDENTLY CONDUCTEDBY PONEMON INSTITUTE LLC
PART 1. EXECUTIVE SUMMARY 3 PART 2. KEY FINDINGS 5
Trends in PKI maturity 7
Trends in PKI challenges 11
Global analysis 16
PART 3. METHODS 20
PART 4. LIMITATIONS 22
APPENDIX: DETAILED SURVEY RESULTS 22
TABLE OF CONTENTS

3 2017 PKI GLOBAL TRENDS STUDY
PART 1. EXECUTIVE SUMMARYThe rise of the Internet of Things (IoT) in the enterprise and its impact on how organizations design and build their public key infrastructure (PKI) is a key theme in this year’s study. Specifically, IoT is the fastest trend driving the deployment of applications using PKI.
While external mandates and standards and enterprise applications have declined in companies’ concerns about change and uncertainty, in the past three years the focus on how new applications such as IoT will affect PKI uncertainty has increased significantly.
On average, companies today are using their PKI to support over eight different applications. Yet the findings of this study indicate a general lack of clear ownership of PKIs, as well as a lack of resources and skills to properly support them. Current approaches to PKI are fragmented and do not always incorporate best practices, indicating a need for many organizations to apply increased effort to securing their PKI as an important part of creating a foundation of trust.1
Ponemon Institute is pleased to present the findings of the 2017 PKI Global Trends Study, sponsored by Thales eSecurity. This report summarizes the third annual results of a survey completed by 1,510 IT and IT security practitioners in the following 11 countries: the United States, the United Kingdom, Germany, France, Australia, Japan, Brazil, Russian Federation, India, Mexico and Arabia. The report tabulates the responses to the survey and draws some limited conclusions as to how best practices are reflected in observed practices, and the influence of cloud computing, the Internet of Things, and other important industry trends.
This work is part of a larger study published in April 2017 involving 4,802 respondents in 11 countries.2 The purpose of this research is to better understand the use of PKI in organizations. All participants in this research are either involved in the management of their organizations’ enterprise PKI or in developing and/or managing applications that depend upon credentials controlled by their organizations’ PKI.
Figure 1 shows the primary practices organizations take to secure PKI and Certificate Authorities (CAs). The top two are multifactor authentication for administrators and a secure physical location (59 percent and 47 percent of respondents, respectively).
1 Best practices for designing, fielding and maintaining a PKI can be derived from various public documents, for example the Webtrust standards (http://www.webtrust.org/item64428.aspx) and NIST Publication 800-57 Parts 1-3.
2 See: 2017 Global Encryption Trends Study (sponsored by Thales eSecurity), Ponemon Institute, April 2017.
Multi-factor authenticationfor administrators
Physical secure location
Formal security practices(documented)
Passwords alonewithout a second factor
Of�ine root CAs
Isolated networks
Strict record keeping(e.g., video recording,
independent observers, etc.)
Figure 1. Practices used to secure PKI and Certi�cate Authorities
59%
47%
40%
29%
28%
21%
13%
0% 10% 20% 30% 40% 50% 60%

4 2017 PKI GLOBAL TRENDS STUDY
Other key findings include the following:
PKI changes and uncertainty due to new applications, such as the IoT, increased dramatically since 2015. Respondents who are concerned about the impact of the IoT on PKI increased from 14 percent to 36 percent.
IoT is growing as an important trend driving the deployment of applications using PKI. While the most important trend driving the deployment of applications that make use of PKI continues to be cloud-based services (54 percent of respondents), IoT increased from 21 percent to 40 percent of respondents over the past three years.
In the next two years, an average of 43 percent of IoT devices in use will rely primarily on digital certificates for identification and authentication.
How are private keys for root/policy/issuing CAs managed? Hardware security modules (HSMs) are used by 36% of respondents to manage the private keys for root/policy/issuing CAs.
The challenge of dealing with a lack of visibility of the security capabilities of existing PKI grows. The lack of visibility of the security capabilities of an existing PKI has increased from 19 percent in 2015 to 28 percent of respondents in this year’s research.
The main PKI deployment challenge continues to be the lack of clear ownership of the PKI function. Sixty-nine percent of respondents believe there is no one function responsible for managing PKI, a slight increase from 2015.
FIPS 140 and Common Criteria are the most important security certifications when deploying PKI infrastructure and PKI-based applications. Sixty-five percent say FIPS 140 is most important and this is closely followed by Common Criteria (64 percent of respondents) when deploying PKI.
SSL certificates for public facing websites and services increase the use of PKI credentials significantly. Applications most often using PKI credentials are SSL certificates for public facing websites and services (84 percent of respondents).
“IN THE NEXT TWO YEARS, AN AVERAGE OF 43 PERCENT OF IoT DEVICES IN USE WILL RELY PRIMARILY ON DIGITAL CERTIFICATES FOR IDENTIFICATION AND AUTHENTICATION.”
4

5 2017 PKI GLOBAL TRENDS STUDY
PKI changes and uncertainty due to new applications, such as the IoT, increased dramatically since 2015. According to Figure 2, since 2015 respondents who are concerned about the impact of the IoT on PKI increased from 14 percent to 36 percent. In contrast, external mandates and standards and enterprise applications saw a decrease in concerns about change (from 47 percent and 19 percent in 2015, respectively).
PART 2. KEY FINDINGSIn this section of the report we provide an analysis of the global results. The complete audited findings are presented in the Appendix of this report. The results are grouped into three categories:
• The increasing influence of the IoT in PKI planning
• Trends in PKI maturity
• Trends in PKI challenges
47%
36%26%
14%
26%26%
35%
21%26%
28%
20%
19%22%
30%
17%18%
14%
14%14%15%
1%2%
18%22%
48%56%
0%
FY 2017 FY 2016 FY 2015
Figure 2. Areas expected to experience the most change and uncertaintyConsolidated view; two responses permitted
External Mandates and standards
New applications(e.g., Internet of Things)
PKI technologies
Management expectations
Internal security policies
Enterprise applications
Budget and resources
Vendors (products and services)
Other
0% 10% 20% 30% 40% 50% 60%
The increasing influence of the IoT in PKI planning

6 2017 PKI GLOBAL TRENDS STUDY
54%
41%
40%
23%
19%
8%
6%
5%
2%1%
1%1%
0%
3%
7%9%
7%10%
9%8%
27%26%
7%10%
28%21%
52%
50%
61%
64%
FY 2017 FY 2016 FY 2015
Figure 3. The most important trends driving the deployment of applications using PKI Consolidated view; two responses permitted
Cloud-based services
Consumer mobile
Internet of Things (IoT)
Regulatory environment
Consumer-orientedmobile applications
BYOD and internal mobiledevice management
Cost savings
E-commerce
Risk management
Other
0% 10% 20% 30% 40% 50% 60% 70%
IoT is growing as an important trend driving the deployment of applications using PKI. While the most important trend driving the deployment of applications that make use of PKI continues to be cloud-based services (54 percent of respondents), IoT increased from 21 percent to 40 percent of respondents over the past three years (Figure 3). The regulatory environment also has increased significantly from 7 percent of respondents last year to 23 percent of respondents in this year’s research.
“IoT IS GROWING AS AN IMPORTANT TREND DRIVING THE DEPLOYMENT OF APPLICATIONS USING PKI.”
6

7 2017 PKI GLOBAL TRENDS STUDY
In the next two years, an average of 43 percent of IoT devices in use will rely primarily on digital certificates for identification and authentication. Also, as shown in Figure 4, 43 percent of respondents believe that as the IoT continues to grow, supporting PKI deployments for IoT device credentialing will be a combination of cloud-based and enterprise-based.
Trends in PKI maturityThe use of manual CRLs is decreasing. According to Figure 5, the certificate revocation technique most often deployed continues to be online certificate status protocol (OCSP), according to 54 percent of respondents (a slight increase from 52 percent of respondents in 2016).
Forty-six percent of respondents say their organizations use automated certificate revocation (CRL), an increase from 37 percent in 2015. Along with the increase in automated methods of revocation, the use of of manual certificate revocation continues to decrease (from 33 percent of respondents in 2015 to 20 percent of respondents in this year’s research).
Combination of cloud-based and enterprise-based
Primarily enterprise-based
Primarily cloud-based
43%
32%
25%
0% 10% 20% 30% 40% 50%
Figure 4. How will PKI be deployed for IoT device credentialing as the IoT continues to grow?
54%
46%
33%
20%
19%
19%
2%
2%2%
1%
3%3%
20%
24%33%
37%37%
43%37%
52%46%
FY 2017 FY 2016 FY 2015
Figure 5. The certi�cate revocation techniques used in enterprises Consolidated view; more than one response permitted
Online Certi�cate StatusProtocol (OCSP)
Automated CRL
None
Manual certi�caterevocation list (CRL)
Validation Authority
Others
Unsure
0% 10% 20% 30% 40% 50% 60%

82017 PKI GLOBAL TRENDS STUDY
Hardware security modules (HSMs) are increasingly used to manage the private keys for root/policy/issuing CAs, as shown in Figure 6. Thirty percent of respondents say smart cards are used. Forty-three percent of respondents say they have PKI specialists on staff to manage private keys.
Of the 36 percent of organizations in this study that use HSMs to secure PKI, they are used across the entire architecture of the PKI as shown in Figure 7. As an example of best practice, NIST calls to “Ensure that Cryptographic modules for CAs, Key Recovery Servers, and OCSP responders are hardware modules validated as meeting FIPS 140-2 Level 3 or higher” (NIST Special Publication 800-57 Part 3). Yet only 12 percent of our respondents indicate the presence of HSMs in their OCSP installations. This is a significant gap between best practices and observed practices.
36%
28%
15%10%
25%
25%
32%
30%
FY 2017 FY 2016
Figure 6. How do you manage the private keys for your root/policy/issuing CAs
Hardware Security Modules (HSMs)
Smart cards (for CA/root key protection
Removable media for CA/root keys
Other
0% 10% 20% 30% 40%
50%
43%
38%
30%
22%
19%
12%
7%5%
9%
10%12%
23%
32%27%
37%32%
45%
46%
48%42%
FY 2017 FY 2016 FY 2015
Figure 7. Where HSMs are deployed to secure PKIConsolidated view; more than one response permitted
Of�ine root
Issuing CA
Online root
Policy CA
Registration Authority
OCSP responder
Validation Authority
0% 10% 20% 30% 40% 50% 60%

9 2017 PKI GLOBAL TRENDS STUDY
Figure 8 shows the percentage of respondents who say their organizations deploy an internal certificate authority or an externally hosted private certificate authority by 12 industry sectors.
As can be clearly seen, there are differences across industry sectors. Financial service, health and pharmaceutical and energy/utilities are most likely to deploy an internal corporate certificate authority. In contrast, consumer products, entertainment and media, communication and retail companies are most likely to deploy an externally hosted private CA.
0% 10% 20% 30% 40% 50% 60% 70%
68%
55%
58%
50%
60%
49%
38%44%
55%
58%45%
45%58%
63%
45%48%
40%
35%
26%
36%
39%
31%
32%
26%
Internal corporate certi�cateauthority (CA)
Externally hosted private CA – managed service
Figure 8. Percentage of companies that deploy internal or external certi�cation authorities by industry sector
Financial services
Industrial/manufacturing
Public sector
Technology & software
Healthcare & pharmaceutical
Services
Retailing
Hospitality & leisure
Communications
Consumer products
Energy & utilities
Entertainment & media

102017 PKI GLOBAL TRENDS STUDY
The challenge of dealing with a lack of visibility of the security capabilities of existing PKI grows. As shown in Figure 9, the lack of visibility of the security capabilities of existing PKI has increased from 19 percent in 2015 to 28 percent of respondents in this year’s research. In contrast, it seems respondents are getting better at dealing with PKIs being incapable of supporting new applications (decrease from 63 percent), the inability to change legacy apps (decrease from 58 percent) and no pre-existing PKI (decrease from 45 percent).
54%
52%
43%
41%41%
40%40%
38%
30%30%
29%
30%
30%29%
28%
19%22%
23%22%
21%
16%17%
13%
6%5%
6%
35%37%
45%
39%
42%40%
56%
58%
58%
0%
0%
1%
63%
FY 2017 FY 2016 FY 2015
Figure 9. The challenges to enable applications to use PKI Consolidated view; four responses permitted
Existing PKI is incapable of supporting new application
No ability to change legacy apps
Insufficient skills
Insufficient resources
Too much change or uncertainty
No pre-existing PKI
Lack of clear understanding of requirements
Conflict with other apps using the same PKI
Lack of visibility of the securitycapabilities of existing PKI
Requirements are toofragmented or inconsistent
Specific operational issues (such as revocation and performance) are hard to resolve
Lack of advisory support
Other
0% 10% 20% 30% 40% 50% 60% 70%
11 2017 PKI GLOBAL TRENDS STUDY
Trends in PKI challenges
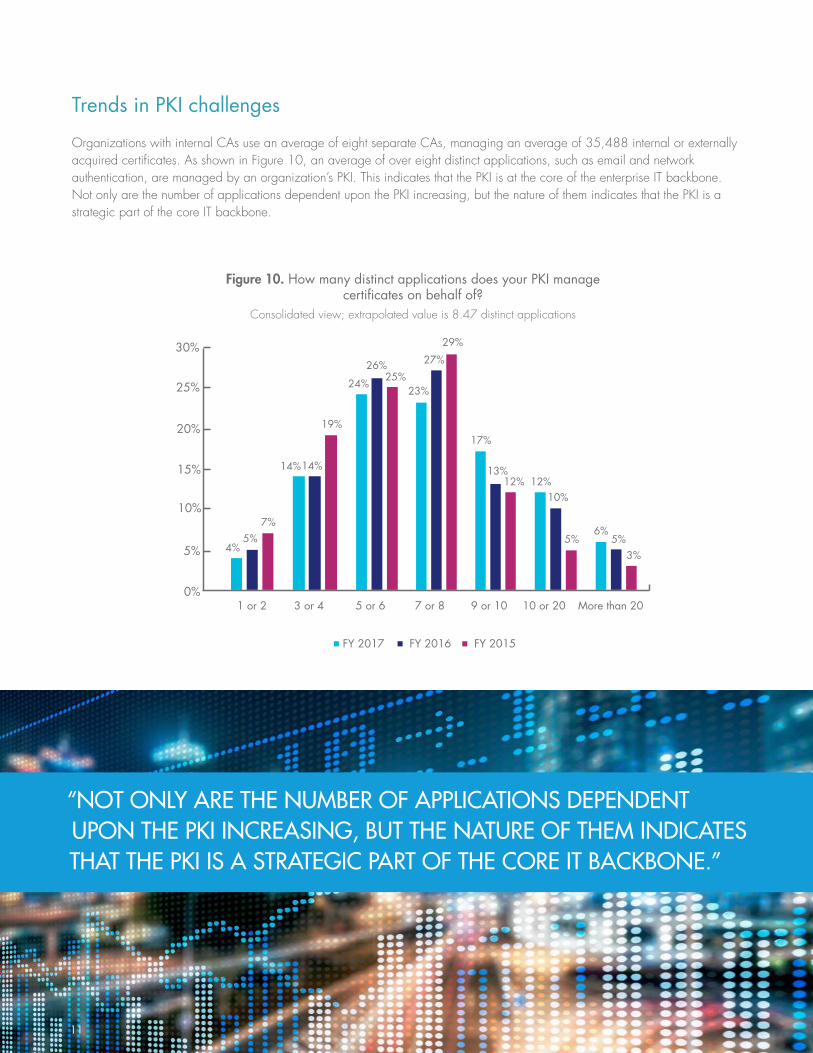
Organizations with internal CAs use an average of eight separate CAs, managing an average of 35,488 internal or externally acquired certificates. As shown in Figure 10, an average of over eight distinct applications, such as email and network authentication, are managed by an organization’s PKI. This indicates that the PKI is at the core of the enterprise IT backbone. Not only are the number of applications dependent upon the PKI increasing, but the nature of them indicates that the PKI is a strategic part of the core IT backbone.
“NOT ONLY ARE THE NUMBER OF APPLICATIONS DEPENDENT UPON THE PKI INCREASING, BUT THE NATURE OF THEM INDICATES THAT THE PKI IS A STRATEGIC PART OF THE CORE IT BACKBONE.”
11
1 or 2 3 or 4 5 or 6 7 or 8 9 or 10 10 or 20 More than 200%
5%
10%
4%5%
7%
14%
19%
24%
26%25%
23%
27%
29%
17%
13%12% 12%
10%
5%6%
5%3%
15%
20%
25%
30%
Figure 10. How many distinct applications does your PKI manage certi�cates on behalf of?
Consolidated view; extrapolated value is 8.47 distinct applications
FY 2017 FY 2016 FY 2015
14%

122017 PKI GLOBAL TRENDS STUDY
The main PKI deployment challenge continues to be the lack of clear ownership of the PKI function. As shown in Figure 11, 69 percent of respondents believe there is no one function responsible for managing PKI, a slight increase from 2015. This is not in line with best practices, which assume as a baseline a sufficient degree of staffing and competency to define and maintain the process and procedures on which a modern PKI depends.
Other deployment problems include: insufficient skills (47 percent of respondents), insufficient resources (42 percent of respondents), too much change or uncertainty (41 percent of respondents) and necessary performance and reliability is hard to achieve (39 percent of respondents).
69%
47%
42%
41%
39%40%
43%
34%32%
31%31%31%32%
26%
22%24%
18%18%
17%
11%
11%10%
7%7%
8%
35%37%
40%
39%39%
43%46%
46%45%
71%
0%
1%1%
68%
FY 2017 FY 2016 FY 2015
Figure 11. The main challenges deploying and managing PKI Consolidated view; four responses permitted
No clear ownership
Insuf�cient skills
Insuf�cient resources
Too much change or uncertainty
Necessary performance andreliability is hard to achieve
Lack of visibility of the applicationsthat will depend on PKI
Lack of clear understandingof the requirements
Commercial solutions are toocomplicated or too expensive
Requirements are toofragmented or inconsistent
No suitable products or technologies available
Too hard to transition fromcurrent approach to a new system
Lack of advisory services and support
Other
0% 10% 20% 30% 40% 50% 60% 70% 80%

13 2017 PKI GLOBAL TRENDS STUDY
Figure 12 shows the percentage of respondents who say their organizations have PKI specialists on staff. As can be seen, there are significant differences across industry sectors. Specifically, companies in financial services, energy/utilities and health and pharmaceutical are most likely to employ PKI specialists as a fully dedicated role. In contrast, hospitality, consumer products, entertainment and media, communication and retail companies are less likely to employ PKI specialists as a fully dedicated role within the company. Following are the abbreviations used in all industry breakout questions.
FIPS 140 and common criteria are the most important security certification when deploying PKI infrastructure and PKI-based applications. According to Figure 13, 65 percent say FIPS 140 is most important and this is closely followed by Common Criteria (64 percent of respondents) when deploying PKI. Twenty-two percent say it is regional standards such as digital signature laws (a decrease from 31 percent in 2015). In the US, FIPS 140 is the standard called out by NIST in its definition of a “cryptographic module” which is mandatory for most US federal government applications and a best practice in all PKI implementations.
65%
36%
45%
53% 53%
42%
36%
24%
46%
29%
55%
31%
FS IM PS TS HP SV RT HL CM CP EU EM
Figure 12. Percentage of companies that have a PKI specialist on staffResponse = Yes; mean = 43%
0%
10%
20%
30%
40%
50%
60%
70%
0% 10% 20% 30% 40% 50% 60% 70%
FS IM PS TS HP SV RT HL CM CP EU EM
65%
64%64%
61%
22%
31%
20%23%24%
12%13%
17%
1%2%
1%
24%
69%67%
FY 2017 FY 2016 FY 2015
Figure 13. Security certi�cations important when deploying PKI infrastructure Consolidated view, more than one response permitted
FIPS 140-2 Level 3
Common Criteria EAL Level 4+
Regional standards such as digital signature laws
Regional certi�cations foruse by government
None of the above (certi�cation is not an important factor)
Other please specify
Industry sectors
Financial services
Industrial/manufacturing
Public sector
Technology & software
Healthcare & pharmaceutical
Services
Retailing
Hospitality & leisure
Communications
Consumer products
Energy & utilities
Entertainment & media
Abbreviated
FS
IM
PS
TS
HP
SV
RT
HL
CM
CP
EU
EM
142017 PKI GLOBAL TRENDS STUDY
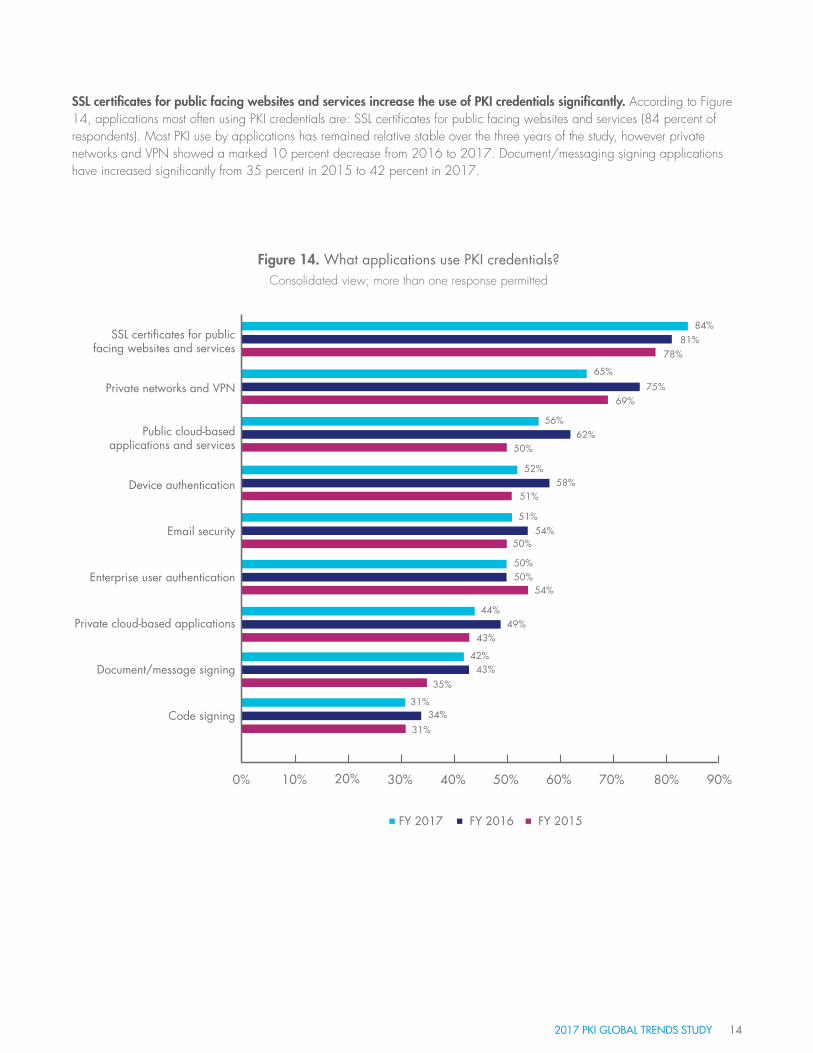
SSL certificates for public facing websites and services increase the use of PKI credentials significantly. According to Figure 14, applications most often using PKI credentials are: SSL certificates for public facing websites and services (84 percent of respondents). Most PKI use by applications has remained relative stable over the three years of the study, however private networks and VPN showed a marked 10 percent decrease from 2016 to 2017. Document/messaging signing applications have increased significantly from 35 percent in 2015 to 42 percent in 2017.
78%
69%
50%
51%58%
50%54%
51%
43%49%
44%
35%
42%43%
31%
31%34%
54%50%50%
52%
62%56%
75%
65%
81%84%
Figure 14. What applications use PKI credentials?Consolidated view; more than one response permitted
SSL certi�cates for publicfacing websites and services
Private networks and VPN
Public cloud-basedapplications and services
Device authentication
Email security
Enterprise user authentication
Private cloud-based applications
Document/message signing
Code signing
0% 10% 20% 30% 40% 50% 60% 70% 80% 90%
FY 2017 FY 2016 FY 2015

15 2017 PKI GLOBAL TRENDS STUDY
54%
38%
34%
23%
14%
16%
11%
2%2%
0%
12%9%
15%
18%9%
29%25%
41%48%
51%44%
FY 2017 FY 2016 FY 2015
Figure 15. How is PKI deployed? Consolidated view; more than one response permitted
Internal corporatecerti�cate authority (CA)
Externally hosted privateCA – managed service
Public CA service
Private CA runningwithin a public cloud
Business partnerprovided service
Governmentprovided service
Other
0% 10% 20% 30% 40% 50% 60%
What are the most popular methods for deploying enterprise PKI? Fifty-four percent of respondents say their organizations favor an internal corporate certificate authority (CA), according to Figure 15.
Externally hosted private CA—managed service has decreased from 48 percent of respondents in 2015 to 38 percent of respondents in this year’s study. Companies using a private CA running within a public cloud has increased significantly from 9 percent of respondents in 2015 to 23 percent of respondents in 2017.
“FIFTY-FOUR PERCENT OF RESPONDENTS SAY THEIR ORGANIZATIONS
FAVOR AN INTERNAL CORPORATE CERTIFICATE AUTHORITY (CA).”

162017 PKI GLOBAL TRENDS STUDY
Global analysis
Figure 16 shows how PKI is deployed within respondents’ organizations. As can be seen, 7 of the 11 countries in the survey are more likely to choose internal corporate certificate authority. In contrast, Brazilian, Mexican, Arabian and Russian Federation respondents are more likely to choose external hosted private certificate authorities as a managed service.
0% 10% 20% 30% 40% 50% 60% 70%
70%
66%
65%
60%
53%
50%
47%52%
47%
44%
34%
43%51%
30%40%
64%
33%
39%
38%
29%
29%
20%
Internal corporate certi�cateauthority (CA)
Externally hosted private CA – managed service
Figure 16. How would you describe how your organization’s enterprise PKI is deployed?
Top 2 choices
Japan
Germany
Australia
United States
India
France
Brazil
Arabia
United Kingdom
Mexico
Russian Federation
Figure 17 shows the percentage of respondents who say their organization does not deploy a certification revocation technique or process. As can be seen, there are marked differences across industry sectors. Specifically, industrial/manufacturing, public sector and financial service companies are most likely to report their organizations deploy a certification revocation technique. In contrast, services, retail and healthcare/pharma companies are most likely to report their organizations do not deploy a certification revocation technique.
40%
29%27%
29%
36% 37%34% 34% 34%
32% 33%
FS IM PS TS HP SV RT HL CM CP EU EM
Figure 17. Percentage of companies by industry thatdo not deploy a certi�cate revocation technique
Response = none; mean value = 33%
27%
0%
10%
20%
30%
40%

17 2017 PKI GLOBAL TRENDS STUDY
Figure 18 shows the number of distinct applications (e.g., email, network authentication, etc.) for which PKI manages certificates. The US at 12.32 distinct applications has the largest number of distinct applications. Mexico (6.19) and Russia Federation (5.40) have the smallest number of distinct applications, respectively.
One should note that even in the lowest figures that the average number of applications is just north of 5. Given previous responses, we can extrapolate that these likely include email, SSL certificates, device identification and logon credentials. These are non-trivial applications, the failure of which could pose existential risks to the host organization.
12.32
10.36
9.04
8.43
8.108.108.10
7.69
6.896.89
6.96
6.746.74
6.406.40
8.318.31
9.569.56
10.8710.87
5.785.78
6.85
6.436.12
5.885.88
6.19
5.105.10
5.40
FY 2017 FY 2016 FY 2015
Figure 18. How many distinct applications doesyour PKI manage certi�cates on behalf of?
Extrapolated value
United States
Germany
India
United Kingdom
Japan
France
Brazil
Australia
Arabia*
Mexico
Russian Federation
0 3.00 6.00 9.00 12.00 15.00
*Arabia was not surveyed in FY 2015
182017 PKI GLOBAL TRENDS STUDY
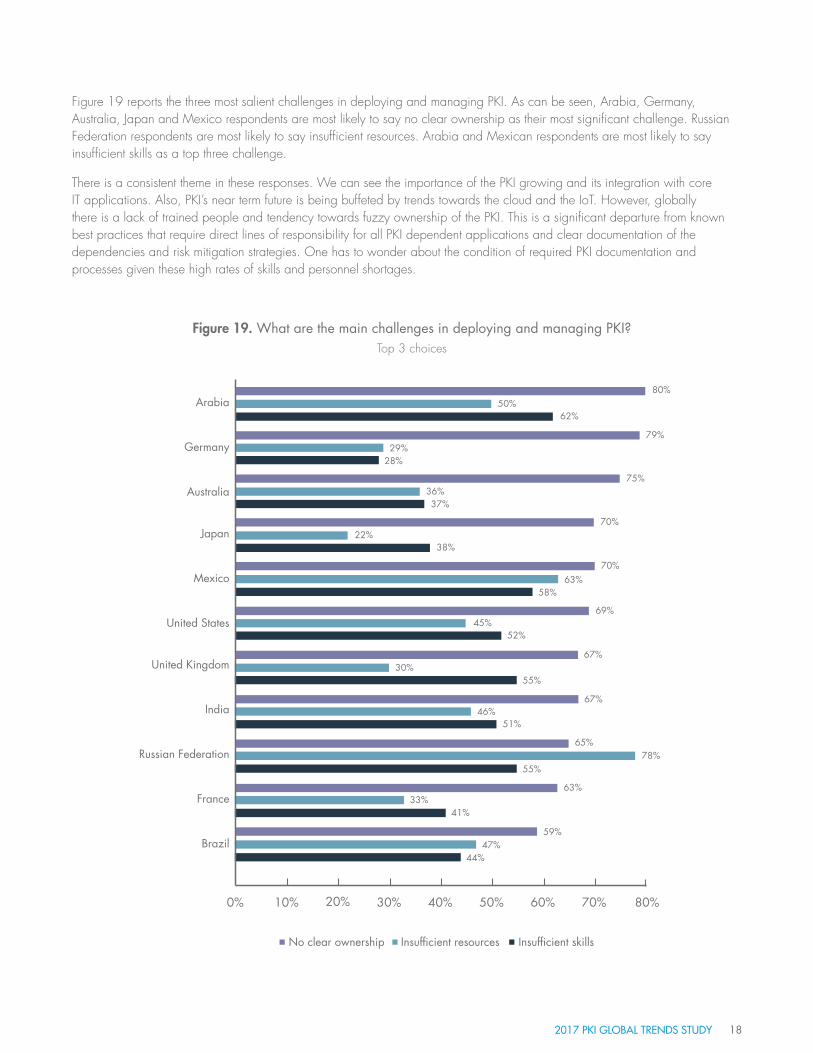
Figure 19 reports the three most salient challenges in deploying and managing PKI. As can be seen, Arabia, Germany, Australia, Japan and Mexico respondents are most likely to say no clear ownership as their most significant challenge. Russian Federation respondents are most likely to say insufficient resources. Arabia and Mexican respondents are most likely to say insufficient skills as a top three challenge.
There is a consistent theme in these responses. We can see the importance of the PKI growing and its integration with core IT applications. Also, PKI’s near term future is being buffeted by trends towards the cloud and the IoT. However, globally there is a lack of trained people and tendency towards fuzzy ownership of the PKI. This is a significant departure from known best practices that require direct lines of responsibility for all PKI dependent applications and clear documentation of the dependencies and risk mitigation strategies. One has to wonder about the condition of required PKI documentation and processes given these high rates of skills and personnel shortages.
80%
79%29%
28%
75%36%
70%22%
38%
70%
69%45%
52%
67%30%
55%
67%46%
51%
65%78%
55%
63%33%
41%
59%47%
44%
63%58%
37%
50%62%
0% 10% 20% 30% 40% 50% 60% 70% 80%
No clear ownership Insuf�cient resources Insuf�cient skills
Figure 19. What are the main challenges in deploying and managing PKI?Top 3 choices
Arabia
Germany
Australia
Japan
Mexico
United States
United Kingdom
India
Russian Federation
France
Brazil

19 2017 PKI GLOBAL TRENDS STUDY
62%
61%43%
39%
59%35%
59%
51%31%
58%
57%39%
34%
56%42%
41%
50%37%
44%
50%
49%32%
50%41%42%
43%47%
42%
49%40%
50%
40%33%
0% 10% 20% 30% 40% 50% 60% 70%
Cloud-based services Consumer mobile Internet of Things (IoT)
Figure 20. What are the most important trends driving thedeployment of applications that make use of PKI?
Top 3 choices
India
Russian Federation
Australia
Mexico
Arabia
Japan
United Kingdom
United States
France
Brazil
Germany
Figure 20 reports what respondents believe are the most important trends that are driving the deployment of applications that make use of PKI. As can be seen, the majority of all respondents, with the exception of German respondents, found that cloud-based services are the most important trend driving application use of PKI technologies. Mexico and Arabia respondents are most likely to see consumer-oriented mobile applications as a driver to PKI adoption. The IoT is beginning to have a significant impact, particularly in the Australia and France.

202017 PKI GLOBAL TRENDS STUDY
Our consolidated sampling frame of practitioners in all countries consisted of 138,530 individuals who have bona fide credentials in IT or security fields. From this sampling frame, we captured 5,397 returns of which 595 were rejected for reliability issues. From our final consolidated 2017 sample of 4,802, we calculated the PKI subsample to be 1,510.
Figure 21 summarizes the approximate position levels of respondents in our study. As can be seen, more than half of respondents (54 percent) are at or above the supervisory level.
As shown in Figure 22, 59 percent of respondents identified IT operations as their functional area within the organization and 18 percent of respondents are functioning within security.
PART 3. METHODSTable 1 reports the consolidated sample response for 11 separate country samples. The sample response for this study conducted over a 49-day period ending in February 2017.
Table 1. Sample response
Sampling FY 2017ame
Total returns
Rejected or screened surveys
Overall sample (encryption trends)
PKI subsample
Ratio subsample to overall sample
Frequency
138,530
5,397
595
4,802
1,510
31.4%
44%
32%
3% 2% 2%
18% Senior Executive
Vice President
Director
Manager/Supervisor
Associate/Staff/Technician
Other
Figure 21. Distribution of respondents according to position levelCountry samples are consolidated
18%
3%
59%
8%
8%3%
IT operations
Security
Lines of business (LOB)
Compliance
Finance
Other
Figure 22. Distribution of respondents according to functional area Country samples are consolidated

21 2017 PKI GLOBAL TRENDS STUDY
Figure 23 reports the respondents’ organizations primary industry segments. As shown, 16 percent of respondents are located in the financial services industry, which includes banking, investment management, insurance, brokerage, payments and credit cards. Eleven percent are located in manufacturing and industrial companies. Another 11 percent are located in service companies.
According to Figure 24, the majority of respondents (65 percent) are located in larger-sized organizations with a global headcount of more than 1,000 employees.
16%
11%
11%
10%9%
8%
8%
7%
4%
3%
3%3%
3%2%
Financial servicesManufacturing & industrialServicesPublic sectorTechnology & softwareHealth & pharmaceuticalRetailEnergy & utilitiesConsumer productsHospitalityEducation & researchTransportationCommunicationsEntertainment & mediaOther
4%
Figure 23. Distribution of respondents according to primary industry classi�cationCountry samples are consolidated
22%22%
14%8%5%
30%
Less than 500
500 to 1,000
1,001 to 5,000
5,001 to 25,000
25,001 to 75,000
More than 75,000
Figure 24. Distribution of respondents according to organizational headcount Country samples are consolidated

222017 PKI GLOBAL TRENDS STUDY
PART 4. LIMITATIONSThere are inherent limitations to survey research that need to be carefully considered before drawing inferences from the presented findings. The following items are specific limitations that are germane to most survey-based research studies.
• Non-response bias: The current findings are based on a sample of survey returns. We sent surveys to a representative sample of IT and IT security practitioners in 11 countries resulting in a large number of usable returned responses. Despite non-response tests, it is always possible that individuals who did not participate are substantially different in terms of underlying beliefs from those who completed the survey.
• Sampling-frame bias: The accuracy of survey results is dependent upon the degree to which our sampling frames are representative of individuals who are IT or IT security practitioners within global companies represented in this study.
• Self-reported results: The quality of survey research is based on the integrity of confidential responses received from respondents. While certain checks and balances were incorporated into our survey evaluation process including sanity checks, there is always the possibility that some respondents did not provide truthful responses.
APPENDIX: DETAILED SURVEY RESULTSThe following tables provide the frequency or percentage frequency of responses to all survey questions contained in this study. All survey responses were captured over a 49-day period ending February 2017.
2017 Consolidated Survey Response
Sampling frame (11 countries)
Total returns
Rejected surveys
Overall sample (encryption trends)
PKI subsample
Ratio subsample to overall sample
PKI subsample weights
Total
138,530
5,397
595
4,802
1,510
31.4%
100%

23 2017 PKI GLOBAL TRENDS STUDY
Public Key Infrastructure (PKI)
Q1. What best describes your role or involvement in your organization’s enterprise PKI?
I am involved in the management my organization’s PKI
I am involved in developing and/or managing applications thatdepend upon credentials controlled by my organization’s PKI
I am not involved in my organization’s PKI or the applications thatdepend on them (Stop)
My organization does not have an PKI (Stop)
Total
FY 2017
58%
42%
0%
0%
100%
Q2. How would you describe how your organization’s enterprise PKIis deployed? Please select all that apply.
Internal corporate certi�cate authority (CA)
Externally hosted private CA – managed service
Public CA service
Private CA running within a public cloud
Business partner provided service
Government provided service
Other (please specify)
None of the above (stop)
Total
FY 2017
54%
38%
34%
23%
14%
11%
2%
0%
176%
Q3. Which certificate revocation technique does your organization deploy? Please select all that apply.
Online Certi�cate Status Protocol (OCSP)
Manual certi�cate revocation list (CRL)
Automated CRL
Validation Authority
Others (please specify)
None
Unsure
Total
FY 2017
54%
20%
46%
19%
2%
33%
1%
175%

242017 PKI GLOBAL TRENDS STUDY
Q4. How many issuing CAs does your PKI support? Those respondents that use an external CA service were removed.
1 or 2
3 or 4
5 or 6
7 or 8
9 or 10
More than 10
Total
Extrapolated value
FY 2017
16%
18%
18%
14%
14%
22%
100%
7.39
Q5. How many certificates does your PKI issue (or have been acquired from an external service)?
Less than 10
10 to100
101 to 1,000
1,001 to 5,000
5,001 to 10,000
10,001 to 50,000
50,001 to 100,000
More than 100,000
Total
Extrapolated value
FY 2017
2%
3%
15%
18%
18%
15%
15%
15%
100%
35,488

25 2017 PKI GLOBAL TRENDS STUDY
Q6. How many distinct applications (e.g., email, network authentication, etc.) does your PKI manage certificates on behalf of?
1 or 2
3 or 4
5 or 6
7 or 8
9 or 10
10 or 20
More than 20
Total
Extrapolated value
FY 2017
4%
14%
24%
23%
17%
12%
6%
100%
8.47
Q7. What security controls and best practices do you use to secure the PKI and CA in particular? Please select all that apply.
Physical secure location
Isolated networks
Strict record keeping (e.g., video recording, independent observers, etc.)
Formal security practices (documented)
Of�ine root CAs
Quorums and dual controls
Multifactor authentication for administrators
Passwords alone without a second factor
No special security measures
Other (please specify)
Total
FY 2017
47%
21%
13%
40%
28%
13%
59%
29%
6%
2%
258%

262017 PKI GLOBAL TRENDS STUDY
Q8b. How do you manage the private keys for your root/policy/issuing CAs?
Hardware security modules (HSMs)
Smart cards (for CA/root key protection)
Removable media for CA/root keys
Other
Total
FY 2017
36%
30%
25%
10%
100%
Q9. If you use HSMs to secure PKI, where are they deployed?Please select all that apply.
Of�ine root
Online root
Issuing CA
Policy CA
Registration Authority
OCSP responder
Validation Authority
Total
FY 2017
50%
38%
43%
30%
22%
12%
9%
203%
Q8a. Do you have PKI specialists on staff?
Yes
No
Rely on consultants
Rely on service provider
Total
FY 2017
43%
27%
15%
14%
100%
27 2017 PKI GLOBAL TRENDS STUDY
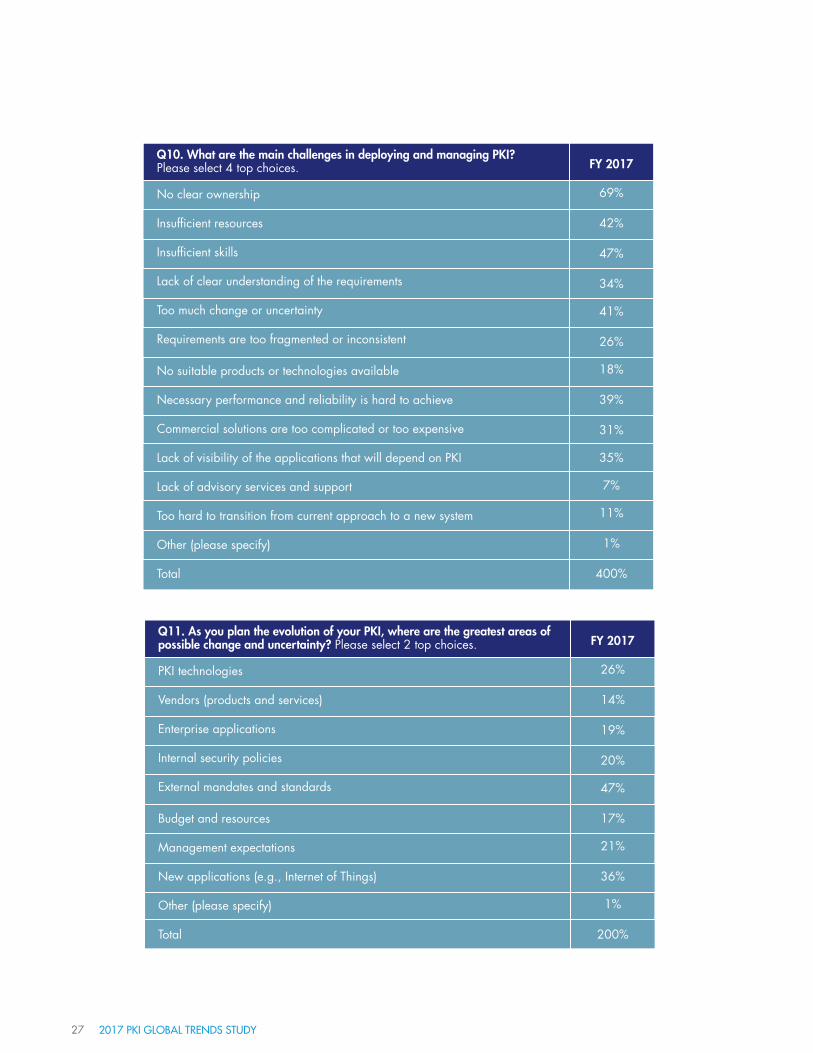
Q10. What are the main challenges in deploying and managing PKI? Please select 4 top choices.
No clear ownership
Insuf�cient resources
Insuf�cient skills
Lack of clear understanding of the requirements
Too much change or uncertainty
Requirements are too fragmented or inconsistent
No suitable products or technologies available
Necessary performance and reliability is hard to achieve
Commercial solutions are too complicated or too expensive
Lack of visibility of the applications that will depend on PKI
Lack of advisory services and support
Too hard to transition from current approach to a new system
Other (please specify)
Total
FY 2017
69%
42%
47%
34%
41%
26%
18%
39%
31%
35%
7%
11%
1%
400%
Q11. As you plan the evolution of your PKI, where are the greatest areas of possible change and uncertainty? Please select 2 top choices.
PKI technologies
Vendors (products and services)
Enterprise applications
Internal security policies
External mandates and standards
Budget and resources
Management expectations
New applications (e.g., Internet of Things)
Other (please specify)
Total
FY 2017
26%
14%
19%
20%
47%
17%
21%
36%
1%
200%

282017 PKI GLOBAL TRENDS STUDY
Q12. In your opinion, which security certifications are important when deploying PKI infrastructure?
Common Criteria EAL Level 4+
FIPS 140-2 Level 3
Regional certi�cations for use by government
Regional standards such as digital signature laws
Other please specify
None of the above (certi�cation is not an important factor)
Total
FY 2017
64%
65%
20%
22%
1%
12%
184%
Q13. What applications use PKI credentials in your organization?
SSL certi�cates for public facing websites and services
Private networks and VPN
Email security
Enterprise user authentication
Device authentication
Document/message signing
Code signing
Public cloud-based applications and services
Private cloud-based applications
Other (please specify)
None of the above
Total
FY 2017
84%
65%
51%
50%
52%
42%
31%
56%
44%
1%
4%
479%

29 2017 PKI GLOBAL TRENDS STUDY
Q14. In your opinion, what are the most important trends that are driving the deployment of applications that make use of PKI? Please select 2 top choices.
Consumer mobile
Cloud-based services
BYOD and internal mobile device management
Internet of Things (IoT)
Regulatory environment
Consumer-oriented mobile applications
E-commerce
Risk management
Cost savings
Other (please specify)
Total
FY 2017
41%
54%
8%
40%
23%
19%
5%
2%
6%
1%
200%
Q15. What are the challenges to enable applications to utilize PKI?Please select 4 top choices.
No pre-existing PKI
Existing PKI is incapable of supporting new applications
Insufficient resources
Insufficient skills
Lack of clear understanding of requirements
Too much change or uncertainty
Requirements are too fragmented or inconsistent
No ability to change legacy apps
Lack of visibility of the security capabilities of existing PKI
Conflict with other apps using the same PKI
Specific operational issues (such as revocation and performance) arehard to resolve
Lack of advisory support
Other (please specify)
Total
FY 2017
35%
54%
41%
43%
30%
40%
23%
52%
28%
30%
16%
6%
0%
400%

302017 PKI GLOBAL TRENDS STUDY
Q16. Do you believe that the Internet of Things continues to grow, that supporting PKI deployments for IoT device credentialing will be:
Primarily cloud-based
Primarily enterprise-based
Combination of cloud-based and enterprise-based
Total
FY 2017
25%
32%
43%
100%
Q17. What percentage of IoT devices that will likely be used by your organization in the next two years do you believe will rely primarily on digital certificates for identification/authentication?
Less than 10%
10% to 25%
26% to 50%
51% to 75%
76% to 100%
Total
Extrapolated value
FY 2017
11%
19%
36%
22%
13%
100%
43%

About Ponemon Institute
The Ponemon Institute© is dedicated to advancing responsible information and privacy management practices in business and government. To achieve this objective, the Institute conducts independent research, educates leaders from the private and public sectors and verifies the privacy and data protection practices of organizations in a variety of industries.
About Thales eSecurity
Thales eSecurity is the leader in advanced data security solutions and services that deliver trust wherever information is created, shared or stored. We ensure that the data belonging to companies and government entities is both secure and trusted in any environment – on-premise, in the cloud, in data centers or big data environments – without sacrificing business agility. Security doesn’t just reduce risk, it’s an enabler of the digital initiatives that now permeate our daily lives – digital money, e-identities, healthcare, connected cars and, with the internet of things (IoT), even household devices. Thales provides everything an organization needs to protect and manage its data, identities and intellectual property, and meet regulatory compliance – through encryption, advanced key management, tokenization, privileged-user control and high-assurance solutions. Security professionals around the globe rely on Thales to confidently accelerate their organization’s digital transformation. Thales eSecurity is part of Thales Group.
About Thales
Thales is a global technology leader for the Aerospace, Transport, Defence and Security markets. With 64,000 employees in 56 countries, Thales reported sales of €14.9 billion in 2016. With over 25,000 engineers and researchers, Thales has a unique capability to design and deploy equipment, systems and services to meet the most complex security requirements. Its exceptional international footprint allows it to work closely with its customer all over the world.

32©2017 Thales